UNITED STATES
SECURITIES AND EXCHANGE COMMISSION
Washington, D.C. 20549
FORM N-CSR
CERTIFIED SHAREHOLDER REPORT OF REGISTERED
MANAGEMENT INVESTMENT COMPANIES
| Investment Company Act file number | 811-21494 |
(Exact name of registrant as specified in charter)
Nuveen Investments
333 West Wacker Drive
Chicago, Illinois 60606
(Address of principal executive offices) (Zip code)
Mark L. Winget
Vice President and Secretary
333 West Wacker Drive
Chicago, Illinois 60606
(Name and address of agent for service)
Registrant’s telephone number, including area code: (800) 257-8787
Date of fiscal year end: July 31
Date of reporting period: July 31, 2025
| Item 1. | Reports to Stockholders. |
 |
Closed‑End Funds |
July 31, 2025 |
Nuveen
Closed‑End Funds
| Nuveen Floating Rate Income Fund |
JFR | |||
| Nuveen Credit Strategies Income Fund |
JQC | |||
| Nuveen Preferred & Income Opportunities Fund |
JPC | |||
| Nuveen Preferred Securities & Income Opportunities Fund |
JPI | |||
| Nuveen Variable Rate Preferred & Income Fund |
NPFD | |||
Annual
Report
Table
of Contents
| 3 | ||||
| 4 | ||||
| 9 | ||||
| 11 | ||||
| 12 | ||||
| 23 | ||||
| 24 | ||||
| 68 | ||||
| 70 | ||||
| 71 | ||||
| 74 | ||||
| 76 | ||||
| 83 | ||||
| 103 | ||||
| 145 | ||||
| 147 | ||||
| 151 | ||||
| 152 | ||||
| 153 | ||||
| 160 | ||||
| 2 |
Important Notices
JFR – Rights offering: On January 8, 2025, the Board of Trustees (the “Board”) approved the terms of the issuance of transferable rights (“Rights”) to the holders of the Fund’s common shares (par value $0.01 per share) (“Common Shares”) as of January 21, 2025 (the “Record Date”). Holders of Common Shares on the Record Date (“Record Date Shareholders”) received one Right for each outstanding Common Share owned on the Record Date. The Rights entitled the holders to purchase one new Common Share for every 5 Rights held (1‑for‑5), for an aggregate of up to an additional 26,911,238 Common Shares.
Holders of Rights were entitled to subscribe for additional Common Shares (the “Offer”) at a discount to the market price of the Common Shares, prior to 5:00 p.m., Eastern time, on February 19, 2025 (the “Expiration Date”). The subscription price per Common Share (the “Subscription Price”) was $8.20 per Common Share, which was equal to 90% of the Fund’s net asset value per Common Share at the close of trading on the NYSE on the Expiration Date. The gross proceeds of the Offer were approximately $220.7 million.
The Offer was over-subscribed; however, the Fund did not exercise the secondary oversubscription privilege. The available primary over-subscription shares were allocated pro‑rata among those fully exercising record date shareholders who over-subscribed based on the number of rights originally issued to them by the Fund. The Common Shares subscribed for were issued on February 25, 2025, after completion of the pro‑rata allocation of Common Shares in respect of the primary oversubscription privilege and receipt of all shareholder payments.
More details about the Fund’s rights offering are available on www.nuveen.com/cef.
JQC – Rights offering: On March 19, 2025, the Board approved the terms of the issuance of transferable rights (“Rights”) to the holders of the Fund’s common shares (par value $0.01 per share) (“Common Shares”) as of March 31, 2025 (the “Record Date”). Holders of Common Shares on the Record Date (“Record Date Shareholders”) received one Right for each outstanding Common Share owned on the Record Date. The Rights entitled the holders to purchase one new Common Share for every 5 Rights held (1‑for‑5), for an aggregate of up to an additional 12.2 million Common Shares.
Holders of Rights were entitled to subscribe for additional Common Shares (the “Offer”) at a discount to the market price of the Common Shares, prior to 5:00 p.m., Eastern time, on April 29, 2025 (the “Expiration Date”). The subscription price per Common Share (the “Subscription Price”) was $5.09 per Common Share, which was equal to 90% of the Fund’s net asset value per Common Share at the close of trading on the NYSE on the Expiration Date. The gross proceeds of the Offer were approximately $62.1 million.
The Common Shares subscribed for were issued on May 5, 2025, after completion and receipt of all shareholder payments. The final Subscription Price was lower than the original estimated Subscription Price.
More details about the Fund’s rights offering are available on www.nuveen.com/cef.
JFR and JQC - Portfolio manager updates: Effective December 30, 2024, Coale Mechlin was added as a portfolio manager of the Funds. Additionally, effective February 11, 2025, James Kim was added as a portfolio manager of JQC. Effective July 1, 2025, Kevin Lorenz retired from Nuveen and is no longer a portfolio manager of the Funds.
JPI – Fund restructuring and tender offer: On July 17, 2024, shareholders of the Fund approved a proposal to amend the Fund’s declaration of trust to eliminate the Fund’s term structure, subject to the completion of a tender offer. The amendment allows shareholders the opportunity to maintain their investment in the Fund and its leveraged exposure to preferred and other income producing securities in lieu of the Fund’s scheduled termination. Additionally, on July 17, 2024, the Fund conducted a tender offer, which allowed shareholders to offer up to 100% of their common shares for repurchase for cash at a per share equal to 100% of the net asset value (NAV) per share determined on the date the tender offer expired.
The tender offer expired on August 14, 2024. In the tender offer 8,672,542 shares were tendered, representing approximately 38% of the Fund’s common shares outstanding. Properly tendered shares were repurchased at $20.0081 per share, which was the NAV of the Fund as of the close of ordinary trading on the New York Stock Exchange on August 14, 2024. As a result of the successful completion of the tender offer, the restructuring of the Fund was completed and on August 19, 2024, the following changes became effective.
• The Fund’s declaration of trust was amended to eliminate the term of the Fund.
• The Fund’s name changed to Nuveen Preferred Securities & Income Opportunities Fund.
• Nuveen Fund Advisors, LLC, the investment adviser to the Fund, will waive 50% of the Fund’s net management fees beginning August 19, 2024, and continuing over the first year following the elimination of the term.
More details about the Fund’s restructuring is available on www.nuveen.com/cef.
JPC and JPI – Fund merger: Effective prior to market open on September 22, 2025, JPI was merged into JPC. Refer to the Notes to Financial Statements within this report for further details on the merger.
JPC, JPI and NPFD – Recent market factors: JPC, JPI and NPFD have substantial allocations to preferred and contingent capital securities issued by U.S. and non‑U.S. banks and other financial institutions. Given the increases in prevailing interest rates and other market factors, these securities continue to be subject to heightened volatility and may, ultimately, detract from Fund performance.
| 3 |
Discussion of Fund Performance
Nuveen Floating Rate Income Fund (JFR)
Nuveen Credit Strategies Income Fund (JQC)
Nuveen Preferred & Income Opportunities Fund (JPC)
Nuveen Preferred Securities & Income Opportunities Fund (JPI)
Nuveen Variable Rate Preferred & Income Fund (NPFD)
These Funds feature portfolio management by Nuveen Asset Management, LLC (NAM), an affiliate of Nuveen Fund Advisors, LLC, the Funds’ investment adviser. The portfolio managers for JFR are Scott Caraher and Coale Mechlin. The portfolio managers for JQC are Himani Trivedi, Scott Caraher, James Kim and Coale Mechlin. The portfolio managers for JPC, JPI and NPFD are Douglas Baker, CFA, and Brenda Langenfeld, CFA.
Below is a discussion of Fund performance and the factors that contributed and detracted during the 12‑month reporting period ended July 31, 2025. For more information on Fund investment objectives and policies, please refer to the Shareholder Update section at the end of the report.
Nuveen Floating Rate Income Fund (JFR)
What factors affected markets during the reporting period?
| • | Uncertainty around tariffs and other potential policy shifts under the new administration, including federal spending reductions, created bouts of volatility |
| • | Interest rate moves and central bank signals affected issuers in the Fund’s market, as elevated borrowing costs weighed on refinancing activity and new issuance. |
| • | Robust collateralized loan obligation (CLO) demand kept loan market technicals robust, even during period of volatility. |
| • | The U.S. economy showed resilience, rebounding quickly after periods of volatility, which supported risk assets. |
What key strategies were used to manage the Fund during the reporting period?
| • | The Fund avoided issuers likely to be negatively impacted by policy changes under the new administration, including potential tariff and spending reductions. |
| • | The Fund avoided most issuers undergoing liability management exercises (LMEs), while selectively targeting post‑LME structures that offered attractive opportunities—when pricing dislocations created attractive entry points and credit agreements have been sufficiently amended to better protect lenders. |
| • | The Fund continued to focus on larger, more liquid issuers, allowing it to act quickly when market technical mispriced fundamental risk, which enabled highly selective, opportunistic credit selection. |
How did the Fund perform and what factors affected relative performance?
For the 12‑month reporting period ended July 31, 2025, JFR returned 6.37%. The Fund underperformed the S&P UBS Leveraged Loan Index, which returned 7.60%.
Top contributors to relative performance
| • | Exposure to single B loans, particularly in lower-tier, B‑rated issuers. |
| • | Security selection within the information technology and communication services sectors. |
| • | A position in bonds issued for CommScope, Inc. |
| • | The Fund’s use of leverage through bank borrowings and the issuance of preferred shares. In addition, the Fund’s use of leverage was accretive to overall common share income. |
Top detractors from relative performance
| • | Out‑of‑benchmark to equities received from reorganizations, including Vistra Vision, Chord Energy Corp and Transocean Ltd. |
| • | Exposure to the financials and energy sectors. |
| • | A position in the loans of City Brewing Company. |
| 4 |
Nuveen Credit Strategies Income Fund (JQC)
What factors affected markets during the reporting period?
| • | Uncertainty around tariffs and other potential policy shifts under the new administration, including federal spending reductions, created bouts of volatility. |
| • | Interest rate moves and central bank signals affected high-yield issuers, as elevated borrowing costs weighed on refinancing activity and new issuance. |
| • | High-yield bonds benefited from positive convexity, which provided greater price gains when yields fell and helped cushion declines when yields rose. |
| • | Robust collateralized loan obligation (CLO) demand kept loan market technicals robust, even during period of volatility. |
| • | The U.S. economy showed resilience, rebounding quickly after periods of volatility, which supported risk assets. |
What key strategies were used to manage the Fund during the reporting period?
| • | The Fund avoided issuers likely to be negatively impacted by policy changes under the new administration, including potential tariffs, spending reductions and other trade-related measures. |
| • | The Fund avoided most issuers undergoing liability management exercises (LMEs), while selectively targeting post‑LME structures that offered attractive risk-adjusted opportunities. |
| • | The Fund continued to focus on larger, more liquid issuers across high-yield bonds and loans, enabling the portfolio to act quickly when market technicals mispriced fundamental risk. |
How did the Fund perform and what factors affected relative performance?
For the 12‑month reporting period ended July 31, 2025, JQC returned 7.06%. The Fund underperformed the JQC Blended Benchmark, which returned 7.84%.
Top contributors to relative performance
| • | The Fund’s use of leverage through bank borrowings, reverse repurchase agreements and the issuance of preferred shares. In addition, the Fund’s use of leverage was accretive to overall common share income. |
| • | Exposure to single B loans, particularly in lower-tier, B‑rated issuers. |
| • | Security selection within the information technology and communication services sectors. |
| • | A position in bonds issued for Level 3 Financing Inc. |
Top detractors from relative performance
| • | A position in the loans of City Brewing Company. |
| • | Out‑of‑benchmark allocation to equity received from the reorganization of Vistra Vision. |
| • | Security selection within the financials sector. |
Nuveen Preferred & Income Opportunities Fund (JPC)
What factors affected markets during the reporting period?
| • | The Federal Reserve (Fed) cut its target federal funds rate by 50 basis points in September, plus two additional 25 basis point cuts before year‑end 2024, bringing the range to 4.25% to 4.50%. Fed policymakers remained on hold with rates throughout the second half of the reporting period to assess the impact of tariffs announced in early April 2025, which were subsequently delayed. |
| • | Uncertainty surrounding Fed monetary policy and U.S. trade policy under the new administration kept volatility elevated in the bond market, but the backdrop of continued positive economic growth and labor market strength supported risk assets, including the preferred securities and contingent capital securities (CoCos) markets. |
| • | Preferred securities and CoCos also benefited from positive news from the global banking sector, the largest issuer in these segments. In the United States, banks reported earnings that generally exceeded expectations, while all 22 banks participating in the Fed’s 2025 annual stress test passed the exam. |
| 5 |
Discussion of Fund Performance (continued)
What key strategies were used to manage the Fund during the reporting period?
| • | The Fund continued to overweight the $1000 par preferred securities segment versus the $25 par preferred securities and CoCos segments, both of which remained underweights relative to the benchmark. |
| • | The underweight to CoCos resulted in an overweight to U.S.-domiciled issuers relative to the benchmark. |
| • | The Fund continued to overweight securities that have coupons with reset features (floating rate, fixed‑to‑floating rate, and fixed‑to‑fixed rate) versus fixed-rate coupon securities. |
| • | The Fund’s leverage-adjusted effective duration, or interest rate sensitivity, was longer than the JPC Blended Benchmark’s duration during the reporting period. |
How did the Fund perform and what factors affected relative performance?
For the 12‑month reporting period ended July 31, 2025, JPC returned 10.29%. The Fund outperformed the JPC Blended Benchmark, which returned 8.44%.
Top contributors to relative performance
| • | The Fund’s use of leverage through bank borrowings, reverse repurchase agreements and the issuance of preferred shares. In addition, the Fund’s use of leverage was accretive to overall common share income. |
| • | Yield curve positioning, particularly an underweight to the longer maturity segments of the curve. |
| • | Underweight to $25 par preferred securities. |
| • | Security selection within the insurance and banking industries. |
Top detractors from relative performance
| • | Underweight to CoCos. |
| • | Longer leverage-adjusted effective duration. |
Nuveen Securities & Income Opportunities Fund (JPI)
What factors affected markets during the reporting period?
| • | The Federal Reserve (Fed) cut its target federal funds rate by 50 basis points in September, plus two additional 25 basis point cuts before year‑end 2024, bringing the range to 4.25% to 4.50%. Fed policymakers remained on hold with rates throughout the second half of the reporting period to assess the impact of tariffs announced in early April 2025, which were subsequently delayed. |
| • | Uncertainty surrounding Fed monetary policy and U.S. trade policy under the new administration kept volatility elevated in the bond market, but the backdrop of continued positive economic growth and labor market strength supported risk assets, including the preferred securities and contingent capital securities (CoCos) markets. |
| • | Preferred securities and CoCos also benefited from positive news from the global banking sector, the largest issuer in these segments. In the United States, banks reported earnings that generally exceeded expectations, while all 22 banks participating in the Fed’s 2025 annual stress test passed the exam. |
What key strategies were used to manage the Fund during the reporting period?
| • | The Fund continued to overweight the $1000 par preferred securities segment versus the $25 par preferred securities and CoCos segments, both of which remained underweights relative to the benchmark. |
| • | The underweight to CoCos resulted in an overweight to U.S.-domiciled issuers relative to the benchmark. |
| • | The Fund continued to overweight securities that have coupons with reset features (floating rate, fixed‑to‑floating rate, and fixed‑to‑fixed rate) versus fixed-rate coupon securities. |
| • | The Fund’s leverage-adjusted effective duration, or interest rate sensitivity, was longer than the JPI Blended Benchmark’s duration during the reporting period. |
6
How did the Fund perform and what factors affected relative performance?
For the 12‑month reporting period ended July 31, 2025, JPI returned 10.34%. The Fund outperformed the JPI Blended Benchmark, which returned 8.44%.
Top contributors to relative performance
| • | The Fund’s use of leverage through bank borrowings and reverse repurchase agreements. In addition, the Fund’s use of leverage was accretive to overall common share income. |
| • | Yield curve positioning, particularly an underweight to the longer maturity segments of the curve. |
| • | Underweight to $25 par preferred securities. |
| • | Security selection within the insurance and banking industries. |
Top detractors from relative performance
| • | Underweight to CoCos. |
| • | Longer leverage-adjusted effective duration. |
Nuveen Variable Rate Preferred & Income Fund (NPFD)
What factors affected markets during the reporting period?
| • | The Federal Reserve (Fed) cut its target federal funds rate by 50 basis points in September, plus two additional 25 basis point cuts before year‑end 2024, bringing the range to 4.25% to 4.50%. Fed policymakers remained on hold with rates throughout the second half of the reporting period to assess the impact of tariffs announced in early April 2025, which were subsequently delayed. |
| • | Uncertainty surrounding Fed monetary policy and U.S. trade policy under the new administration kept volatility elevated in the bond market, but the backdrop of continued positive economic growth and labor market strength supported risk assets, including the preferred securities and contingent capital securities (CoCos) markets. |
| • | Preferred securities and CoCos also benefited from positive news from the global banking sector, the largest issuer in these segments. In the United States, banks reported earnings that generally exceeded expectations, while all 22 banks participating in the Fed’s 2025 annual stress test passed the exam. |
What key strategies were used to manage the Fund during the reporting period?
| • | While the Fund maintained an underweight to the CoCos segment during the reporting period, it was positioned with an overweight to non‑U.S. domiciled issuers relative to the benchmark. |
| • | The insurance industry remained the Fund’s largest industry overweight. |
| • | The Fund continued to overweight fixed‑to‑floating rate coupon and fixed‑to‑fixed rate coupon securities versus floating rate coupon securities. |
| • | The Fund’s leverage-adjusted effective duration, or interest rate sensitivity, was longer than the NPFD Blended Benchmark’s duration during the reporting period. |
How did the Fund perform and what factors affected relative performance?
For the 12‑month reporting period ended July 31, 2025, NPFD returned 10.09%. The Fund outperformed the NPFD Blended Benchmark, which returned 8.68%.
Top contributors to relative performance
| • | The Fund’s use of leverage through bank borrowings, reverse repurchase agreements and the issuance of preferred shares significantly contributed to relative performance over the reporting period. |
| • | Security selection within the banking and insurance industries. |
Top detractors from relative performance
| • | Longer leverage-adjusted effective duration. |
| 7 |
Discussion of Fund Performance (continued)
This material is not intended to be a recommendation or investment advice, does not constitute a solicitation to buy, sell or hold a security or an investment strategy, and is not provided in a fiduciary capacity. The information provided does not take into account the specific objectives or circumstances of any particular investor, or suggest any specific course of action. Investment decisions should be made based on an investor’s objectives and circumstances and in consultation with his or her advisors.
Certain statements in this report are forward-looking statements. Discussions of specific investments are for illustration only and are not intended as recommendations of individual investments. The forward-looking statements and other views expressed herein are those of the portfolio managers as of the date of this report. Actual future results or occurrences may differ significantly from those anticipated in any forward-looking statements, and the views expressed herein are subject to change at any time, due to numerous market and other factors. The Funds disclaim any obligation to update publicly or revise any forward-looking statements or views expressed herein.
For financial reporting purposes, the ratings disclosed are the highest rating given by one of the following national rating agencies: Standard & Poor’s Group (S&P), Moody’s Investors Service, Inc. (Moody’s) or Fitch, Inc. (Fitch). This treatment of split-rated securities may differ from that used for other purposes, such as for Fund investment policies. Credit ratings are subject to change. AAA, AA, A and BBB are investment grade ratings, while BB, B, CCC, CC, C and D are below investment grade ratings. Holdings designated N/R are not rated by these national rating agencies.
Bond insurance guarantees only the payment of principal and interest on the bond when due, and not the value of the bonds themselves, which will fluctuate with the bond market and the financial success of the issuer and the insurer. Insurance relates specifically to the bonds in the portfolio and not to the share prices of a Fund. No representation is made as to the insurers’ ability to meet their commitments.
Refer to the Glossary of Terms Used in this Report for further definition of the terms used within this section.
8
Common Share Information
COMMON SHARE DISTRIBUTION INFORMATION
The following information regarding each Fund’s distributions is current as of July 31, 2025.
Each Fund’s distribution policy, which may be changed by the Board, is to make regular monthly cash distributions to holders of its common shares (stated in terms of a fixed cents per common share dividend distribution rate which may be set from time to time). Each Fund intends to distribute all or substantially all of its net investment income each year through its regular monthly distribution and to distribute realized capital gains at least annually. In addition, in any monthly period, to maintain its declared per common share distribution amount, a Fund may distribute more or less than its net investment income during the period. In the event a Fund distributes more than its net investment income during any yearly period, such distributions may also include realized gains and/or a return of capital. To the extent that a distribution includes a return of capital the NAV per share may erode. The practice
of maintaining a stable distribution level had no material effect on each Fund’s investment strategy during the most recent fiscal period and is not expected to have such an effect in future periods, however, distributions in excess of Fund returns will cause its NAV per share to erode. For additional information, refer to the distribution information section below and in the Notes to Financial Statements herein.
The following table provides the estimated sources of distributions and may include amounts attributed to realized gains and/or returns of capital. A return of capital may occur, for example, when some or all of the money that you invested in a Fund is paid back to you. A return of capital distribution does not necessarily reflect a Fund’s investment performance and should not be confused with “yield” or “income.” The Fund attributes these estimates equally to each regular distribution throughout the year.
The amounts and sources of distributions reported in this notice are for financial reporting purposes and are not being provided for tax reporting purposes. The actual amounts and character of the distributions for tax reporting purposes will be reported to shareholders on Form 1099‑DIV, which will be sent to shareholders shortly after calendar year‑end. Because distribution source
estimates are updated throughout the current fiscal year based on the Fund’s performance, those estimates may differ from both the tax information reported to you in your Fund’s 1099 statement, as well as the ultimate economic sources of distributions over the
life of your investment. The figures in the table below provide the sources of distributions and may include amounts attributed to realized gains and/or returns of capital. More details about the Fund’s distributions are available on www.nuveen.com/en‑us/ closed- end‑funds.
Data as of July 31, 2025
| Fiscal YTD Percentage of the Distribution |
Fiscal YTD Per Share Amounts |
|||||||||||||||||||||||||||||||
| Fund | Latest Declared Distribution |
Net Investment Income |
Realized Gains |
Return of Capital |
Total Distributions | Net Investment Income |
Realized Gains |
Return of Capital |
||||||||||||||||||||||||
| JFR | $0.0850 | 78.37% | 0.00% | 21.63% | $1.0200 | $0.7994 | $0.0000 | $0.2206 | ||||||||||||||||||||||||
| JQC | $0.0540 | 76.18% | 0.00% | 23.82% | $0.6480 | $0.4937 | $0.0000 | $0.1543 | ||||||||||||||||||||||||
| JPC | $0.0665 | 69.36% | 0.00% | 30.64% | $0.7980 | $0.5535 | $0.0000 | $0.2445 | ||||||||||||||||||||||||
| JPI | $0.1660 | 58.00% | 0.00% | 42.00% | $1.9240 | $1.1160 | $0.0000 | $0.8080 | ||||||||||||||||||||||||
| NPFD | $0.1675 | 46.00% | 0.00% | 54.00% | $2.0100 | $0.9245 | $0.0000 | $1.0855 | ||||||||||||||||||||||||
NUVEEN CLOSED‑END FUND DISTRIBUTION AMOUNTS
The Nuveen Closed‑End Funds’ monthly and quarterly periodic distributions to shareholders are posted on www.nuveen.com and can be found on Nuveen’s enhanced closed‑end fund resource page, which is at https://www.nuveen.com/resource-center- closed‑end‑funds, along with other Nuveen closed‑end fund product updates. To ensure timely access to the latest information, shareholders may use a subscribe function, which can be activated at this web page (https://www.nuveen.com/subscriptions).
COMMON SHARE EQUITY SHELF PROGRAMS
During the current reporting period, JPC was authorized by the Securities and Exchange Commission to issue additional common shares through an equity shelf program (Shelf Offering). Under these programs, JPC, subject to market conditions, may raise additional capital from time to time in varying amounts and offering methods at a net price at or above the Fund’s NAV per common share. The maximum aggregate offering under these Shelf Offerings, are as shown in the accompanying table.
| 9 |
Common Share Information (continued)
| JPC | ||
| Maximum aggregate offering | Unlimited |
During the current reporting period, JPC sold common shares through its Shelf Offering at a weighted average premium to its NAV per common share in the accompanying table.
| JPC | ||||
| Common shares sold through shelf offering | 6,853,100 | |||
| Weighted average premium to NAV per common share sold | 0.59% | |||
Refer to Notes to Financial Statements for further details of Shelf Offerings and the Fund’s transactions.
COMMON SHARE REPURCHASES
The Funds’ Board of Trustees reauthorized an open-market share repurchase program, allowing each fund to repurchase and retire an aggregate of up to approximately 10% of its outstanding common shares.
During the current reporting period, the Funds did not repurchase any of their outstanding common shares. As of July 31, 2025, (and since the inception of the Funds’ repurchase programs), each Fund has cumulatively repurchased and retired its outstanding common shares as shown in the accompanying table.
| JFR | JQC | JPC | JPI | NPFD | ||||||||||||||||
| Common shares cumulatively repurchased and retired | 147,593 | 5,473,400 | 2,826,100 | 0 | 0 | |||||||||||||||
| Common shares authorized for repurchase | 16,095,000 | 13,560,000 | 32,175,000 | 1,410,000 | 2,415,000 | |||||||||||||||
10
About the Funds’ Benchmarks
ICE BofA U.S. All Capital Securities Index: An index designed to measure the performance of investment grade and below investment grade fixed rate and fixed‑to‑floating rate, USD‑denominated hybrid corporate and preferred securities publicly issued in the U.S. domestic market. Index returns assume reinvestment of distributions, but do not reflect any applicable sales charges or management fees.
ICE BofA U.S. High Yield Index: An index designed to measure the performance of USD‑denominated below investment grade corporate debt publicly issued in the U.S. domestic market. Index returns assume reinvestment of distributions, but do not reflect any applicable sales charges or management fees.
ICE USD Contingent Capital Index: An index designed to measure the performance of USD denominated contingent capital debt publicly issued in the major domestic and Eurobond markets, including investment grade and below investment grade issues. Index returns assume reinvestment of distributions, but do not reflect any applicable sales charges or management fees.
ICE Variable Rate Preferred & Hybrid Securities Index: An index designed to measure the performance of floating- and variable-rate investment grade and below investment grade USD‑denominated preferred stock and hybrid debt publicly issued by corporations in the U.S. domestic market. Index returns assume reinvestment of distributions, but do not reflect any applicable sales charges or management fees.
S&P UBS Leveraged Loan Index: An index designed to measure the performance of the USD‑denominated leveraged loan market. The index includes issuers from developed countries; issuers from developing countries are excluded.
Index returns assume reinvestment of distributions, but do not reflect any applicable sales charges or management fees.
| 11 |
Fund Performance, Leverage and Holdings Summaries
The Fund Performance, Leverage and Holding Summaries for each Fund are shown below within this section of the report.
Fund Performance
Performance data for each Fund shown below represents past performance and does not predict or guarantee future results. Current performance may be higher or lower than the data shown. Returns do not reflect the deduction of taxes that shareholders may have to pay on Fund distributions or upon the sale of Fund shares. Returns at NAV are net of Fund expenses, and assume reinvestment of distributions. Comparative index return information is provided for the Fund’s shares at NAV only. Indexes are not available for direct investment.
Total returns for a period of less than one year are not annualized (i.e. cumulative returns). Since inception returns are shown for share classes that have less than 10‑years of performance. For performance, current to the most recent month‑end visit Nuveen.com or call (800) 257‑8787.
Impact of Leverage
One important factor impacting the returns of the Funds’ common shares relative to their comparative benchmarks was the Funds’ use of leverage through bank borrowings, Taxable Fund Preferred Shares (TFP) and/or reverse repurchase agreements. The Funds use leverage because our research has shown that, over time, leveraging provides opportunities for additional income. The opportunity arises when short-term rates that a Fund pays on its leveraging instruments are lower than the interest the Fund earns on its portfolio securities that it has bought with the proceeds of that leverage.
However, use of leverage can expose Fund common shares to additional price volatility. When a Fund uses leverage, the Fund’s common shares will experience a greater increase in their net asset value if the securities acquired through the use of leverage increase in value, but will also experience a correspondingly larger decline in their net asset value if the securities acquired through leverage decline in value. All this will make the shares’ total return performance more variable over time.
In addition, common share income in levered funds will typically decrease in comparison to unlevered funds when short-term interest rates increase and increase when short-term interest rates decrease. In recent quarters, fund leverage expenses have generally tracked the overall movement of short-term interest rates. While fund leverage expenses are higher than their prior year lows, leverage nevertheless continues to provide the opportunity for incremental common share income, particularly over longer- term periods.
Leverage Ratios
Each Fund’s Effective Leverage and Regulatory Leverage Ratios are set forth below. “Effective Leverage” is a Fund’s effective economic leverage, and includes both regulatory leverage and the leverage effects of certain derivative and other investments in a Fund’s portfolio that increase the Fund’s investment exposure. “Regulatory Leverage” consists of preferred shares or borrowings of a Fund. Regulatory Leverage is a part of a Fund’s capital structure. Regulatory leverage is subject to asset coverage limits set forth in the Investment Company Act of 1940. A Fund, however, may from time to time borrow for temporary purposes, typically on a transient basis in connection with its day‑to‑day operations, primarily in connection with the need to settle portfolio trades. Such temporary borrowings are excluded from the calculation of a Fund’s Effective Leverage and Regulatory Leverage ratios.
Holding Summaries
The Holdings Summaries data relates to the securities held in each Fund’s portfolio of investments as of the end of this reporting period. It should not be construed as a measure of performance for the Fund itself. Holdings are subject to change. Refer to the Fund’s Portfolio of Investments for individual security information.
For financial reporting purposes, the ratings disclosed are the highest rating given by one of the following national rating agencies: Standard & Poor’s, Moody’s Investors Service, Inc. or Fitch, Inc. This treatment of split-rated securities may differ from that used for other purposes, such as for Fund investment policies. Credit ratings are subject to change. AAA, AA, A and BBB are investment grade ratings; BB, B, CCC, CC, C and D are below investment grade ratings. Holdings designated N/R are not rated by these national rating agencies.
| 12 |
| JFR | Nuveen Floating Rate Income Fund | |
| Fund Performance, Leverage and Holdings Summaries July 31, 2025 | ||
| Performance* |
| Total Returns as of July 31, 2025 | ||||||||||||||
| Average Annual | ||||||||||||||
| Inception Date |
1-Year | 5-Year | 10-Year | |||||||||||
| JFR at Common Share NAV | 3/25/04 | 6.37% | 8.02% | 4.85% | ||||||||||
| JFR at Common Share Price | 3/25/04 | 8.66% | 11.50% | 6.42% | ||||||||||
| S&P UBS Leveraged Loan Index | — | 7.60% | 7.17% | 5.22% | ||||||||||
*For purposes of Fund performance, relative results are measured against the S&P UBS Leveraged Loan Index.
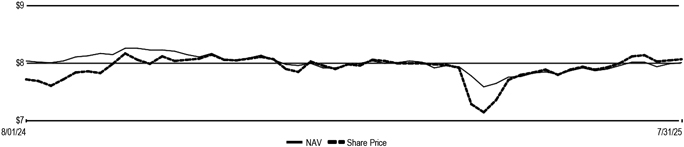
Daily Common Share NAV and Share Price
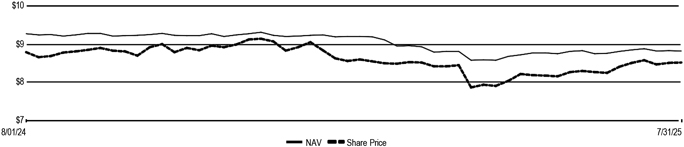
| Common Share NAV |
Common Share Price |
Premium/(Discount) to NAV |
Average Premium/(Discount) to NAV | |||||||||
| $8.82 | $8.52 | (3.40)% | (4.82)% |
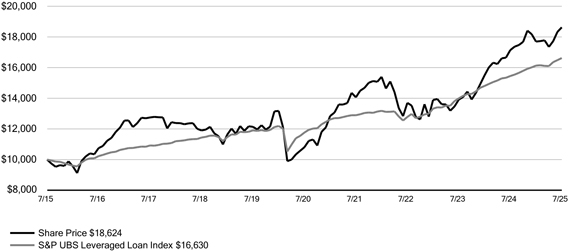
Growth of an Assumed $10,000 Investment as of July 31, 2025 - Common Share Price
| 13 |
Performance Overview and Holdings Summaries as of July 31, 2025 (continued)
Leverage and Holdings
| Leverage | ||
| Effective Leverage | 36.09% | |
| Regulatory Leverage | 36.09% |
| Fund Allocation (% of net assets) |
||
| Variable Rate Senior Loan Interests | 139.3% | |
| Corporate Bonds | 17.5% | |
| Common Stocks | 1.5% | |
| Asset-Backed Securities | 0.5% | |
| Preferred Stock | 0.0% | |
| Warrants | 0.0% | |
| Short-Term Investment Companies | 2.0% | |
| Other Assets & Liabilities, Net | (4.4)% | |
| Borrowings | (36.4)% | |
| TFP Shares, Net | (20.0)% | |
| Net Assets |
100% |
| Portfolio Composition1 (% of total investments) |
||
| Software & Services | 17.2% | |
| Health Care Equipment & Services | 10.3% | |
| Consumer Services | 10.3% | |
| Telecommunication Services | 9.0% | |
| Insurance | 6.9% | |
| Capital Goods | 6.7% | |
| Media & Entertainment | 5.7% | |
| Commercial & Professional Services | 5.4% | |
| Materials | 4.1% | |
| Technology Hardware & Equipment | 3.8% | |
| Consumer Discretionary Distribution & Retail | 3.4% | |
| Energy | 2.5% | |
| Consumer Durables & Apparel | 2.3% | |
| Transportation | 1.8% | |
| Utilities | 1.7% | |
| Other | 8.9% | |
| Total Investments |
100% |
| Portfolio Credit Quality (% of total investments) |
||
| A | 0.2% | |
| BBB | 8.0% | |
| BB or Lower | 86.4% | |
| N/R (not rated) | 3.2% | |
| N/A (not applicable) | 2.2% | |
| Total |
100% |
| 1 | See the Portfolio of Investments for the remaining industries/sectors comprising “Other” and not listed in the table above. |
| 14 |
| JQC | Nuveen Credit Strategies Income Fund | |
| Fund Performance, Leverage and Holdings Summaries July 31, 2025 | ||
| Performance* |
| Total Returns as of July 31, 2025 | ||||||||||||||
| Average Annual | ||||||||||||||
| Inception Date |
1-Year | 5-Year | 10-Year | |||||||||||
| JQC at Common Share NAV | 6/25/03 | 7.06% | 6.45% | 4.04% | ||||||||||
| JQC at Common Share Price | 6/25/03 | 8.35% | 10.35% | 6.29% | ||||||||||
| S&P UBS Leveraged Loan Index | — | 7.60% | 7.17% | 5.22% | ||||||||||
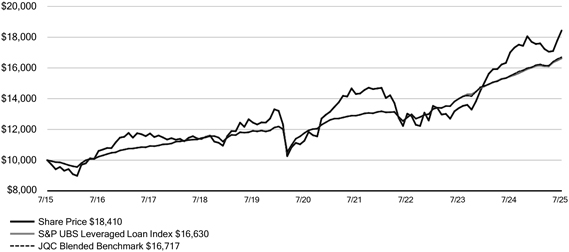
| JQC Blended Benchmark | — | 7.84% | 7.28% | 5.27% | ||||||||||
*For purposes of Fund performance, relative results are measured against the JQC Blended Benchmark. As of August 7, 2023, the Fund’s Blended Benchmark consists of: 1) 75% S&P UBS Leveraged Loan Index and 2) 25% ICE BofA U.S. High Yield Index. Prior to August 7, 2023, relative results were measured against the S&P UBS Leveraged Loan Index.
Daily Common Share NAV and Share Price
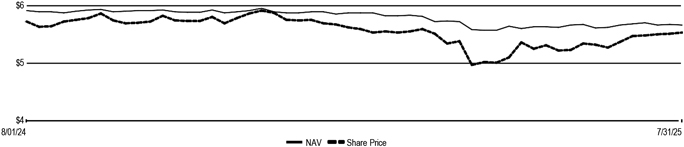
| Common Share NAV |
Common Share Price |
Premium/(Discount) to NAV |
Average Premium/(Discount) to NAV | |||||||||
| $5.66 | $5.53 | (2.30)% | (4.22)% |
Growth of an Assumed $10,000 Investment as of July 31, 2025 - Common Share Price
| 15 |
Performance Overview and Holdings Summaries as of July 31, 2025 (continued)
Leverage and Holdings
| Leverage | ||
| Effective Leverage | 37.09% | |
| Regulatory Leverage | 29.57% | |
| Fund Allocation (% of net assets) |
||
| Variable Rate Senior Loan Interests |
117.1% | |
| Corporate Bonds |
31.8% | |
| Asset-Backed Securities |
7.9% | |
| Common Stocks |
0.9% | |
| Warrants |
0.0% | |
| Short-Term Investment Companies |
7.0% | |
| Other Assets & Liabilities, Net |
(5.8)% | |
| Reverse Repurchase Agreements, including accrued interest | (17.0)% | |
| Borrowings |
(25.3)% | |
| TFP Shares, Net |
(16.6)% | |
| Net Assets | 100% | |
| Portfolio Composition1 (% of total investments) |
||
| Software & Services |
14.9% | |
| Health Care Equipment & Services |
10.4% | |
| Consumer Services |
8.9% | |
| Telecommunication Services |
7.9% | |
| Insurance |
7.5% | |
| Capital Goods |
6.8% | |
| Asset-Backed Securities |
4.8% | |
| Media & Entertainment |
4.6% | |
| Commercial & Professional Services |
4.4% | |
| Materials |
4.2% | |
| Investment Companies |
4.3% | |
| Consumer Discretionary Distribution & Retail | 3.4% | |
| Utilities |
2.5% | |
| Technology Hardware & Equipment |
2.4% | |
| Consumer Durables & Apparel |
2.3% | |
| Other |
10.7% | |
| Total Investments | 100% |
| Portfolio Credit Quality (% of total investments) |
||
| A | 0.0% | |
| BBB | 9.8% | |
| BB or Lower | 82.8% | |
| N/R (not rated) | 2.6% | |
| N/A (not applicable) | 4.8% | |
| Total | 100% |
| 1 | See the Portfolio of Investments for the remaining industries/sectors comprising “Other” and not listed in the table above. |
| 16 |
| JPC | Nuveen Preferred & Income Opportunities Fund | |
| Fund Performance, Leverage and Holdings Summaries July 31, 2025 | ||
| Performance* |
| Total Returns as of July 31, 2025 | ||||||||||||||
| Average Annual | ||||||||||||||
| Inception Date |
1-Year | 5-Year | 10-Year | |||||||||||
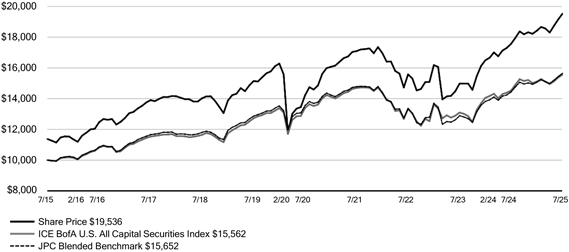
| JPC at Common Share NAV |
3/26/03 | 10.29% | 5.96% | 5.08% | ||||||||||
| JPC at Common Share Price |
3/26/03 | 16.10% | 6.60% | 6.93% | ||||||||||
| ICE BofA U.S. All Capital Securities Index |
— | 7.10% | 3.04% | 4.52% | ||||||||||
| JPC Blended Benchmark |
— | 8.44% | 2.92% | 4.58% | ||||||||||
*For purposes of Fund performance, relative results are measured against the JPC Blended Benchmark. The Fund’s Blended Benchmark consists of:
1) 60% ICE BofA U.S. All Capital Securities Index and 2) 40% ICE USD Contingent Capital Index.
Daily Common Share NAV and Share Price
| Common Share NAV |
Common Share Price |
Premium/(Discount) to NAV |
Average Premium/(Discount) to NAV | |||||||||
| $8.01 | $8.07 | 0.75% | (0.91)% |
Growth of an Assumed $10,000 Investment as of July 31, 2025 - Common Share Price
| 17 |
Performance Overview and Holdings Summaries as of July 31, 2025 (continued)
Leverage and Holdings
| Leverage | ||
| Effective Leverage | 37.04% | |
| Regulatory Leverage | 29.01% |
| Fund Allocation (% of net assets) |
||
| Corporate Bonds | 140.8% | |
| Preferred Stock | 13.1% | |
| U.S. Government and Agency Obligations | 2.3% | |
| Convertible Preferred Securities | 0.8% | |
| Common Stocks | 0.0% | |
| Repurchase Agreements | 0.8% | |
| Other Assets & Liabilities, Net | 1.0% | |
| Reverse Repurchase Agreements, including accrued interest | (18.0)% | |
| Borrowings | (24.8)% | |
| TFP Shares, Net | (16.0)% | |
| Net Assets |
100% |
| Portfolio Composition1 (% of total investments) |
||
| Banks | 54.3% | |
| Financial Services | 16.2% | |
| Insurance | 10.1% | |
| Utilities | 6.2% | |
| Energy | 4.3% | |
| Food, Beverage & Tobacco | 2.5% | |
| Other | 5.9% | |
| Repurchase Agreements | 0.5% | |
| Total |
100% |
| Portfolio Credit Quality (% of total investments) |
||
| AA | 1.6% | |
| A | 0.5% | |
| BBB | 77.0% | |
| BB or Lower | 18.9% | |
| N/R (not rated) | 1.5% | |
| N/A (not applicable) | 0.5% | |
| Total |
100% |
| Country Allocation2 (% of total investments) |
||
| United States | 53.8% | |
| United Kingdom | 12.7% | |
| Canada | 8.9% | |
| France | 8.7% | |
| Spain | 4.3% | |
| Switzerland | 3.6% | |
| Netherlands | 1.7% | |
| Germany | 1.2% | |
| Mexico | 1.1% | |
| Ireland | 1.0% | |
| Australia | 0.9% | |
| Other | 2.1% | |
| Total |
100% |
| 1 | See the Portfolio of Investments for the remaining industries/sectors comprising “Other” and not listed in the table above. |
| 2 | Includes 1.5% (as a percentage of total investments) in emerging market countries. |
| 18 |
| JPI | Nuveen Preferred Securities & Income Opportunities Fund | |
| Fund Performance, Leverage and Holdings Summaries July 31, 2025 | ||
| Performance* |
| Total Returns as of July 31, 2025 | ||||||||||||||
| Average Annual | ||||||||||||||
| Inception Date |
1-Year | 5-Year | 10-Year | |||||||||||
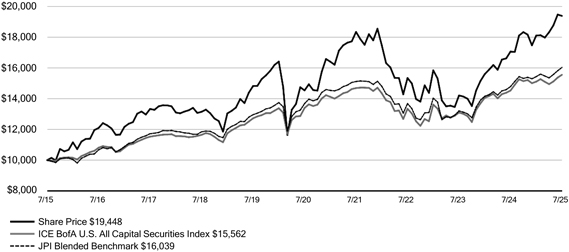
| JPI at Common Share NAV |
7/26/12 | 10.34% | 5.02% | 5.20% | ||||||||||
| JPI at Common Share Price |
7/26/12 | 13.79% | 5.97% | 6.88% | ||||||||||
| ICE BofA U.S. All Capital Securities Index |
— | 7.10% | 3.04% | 4.52% | ||||||||||
| JPI Blended Benchmark |
— | 8.44% | 3.23% | 4.84% | ||||||||||
*For purposes of Fund performance, relative results are measured against the JPI Blended Benchmark. The Fund’s Blended Benchmark consists of: 1) 60% ICE BofA U.S. All Capital Securities Index and 2) 40% ICE USD Contingent Capital Index.
Daily Common Share NAV and Share Price
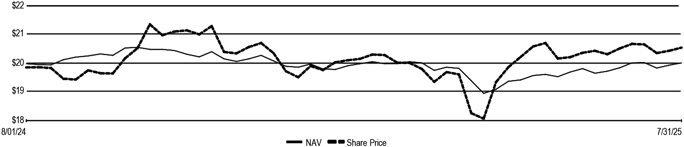
| Common Share NAV |
Common Share Price |
Premium/(Discount) to NAV |
Average Premium/(Discount) to NAV | |||||||||
| $20.01 | $20.54 | 2.65% | 1.02% |
Growth of an Assumed $10,000 Investment as of July 31, 2025 - Common Share Price
| 19 |
Performance Overview and Holdings Summaries as of July 31, 2025 (continued)
Leverage and Holdings
| Leverage | ||
| Effective Leverage | 36.01% | |
| Regulatory Leverage | 29.46% |
| Fund Allocation (% of net assets) |
||
| Corporate Bonds | 136.8% | |
| Preferred Stock | 16.0% | |
| U.S. Government and Agency Obligations | 2.3% | |
| Repurchase Agreements | 0.8% | |
| Other Assets & Liabilities, Net | 0.6% | |
| Reverse Repurchase Agreements, including accrued interest | (14.7)% | |
| Borrowings | (41.8)% | |
| Net Assets |
100% |
| Portfolio Composition1 (% of total investments) |
||
| Banks | 52.1% | |
| Financial Services | 17.2% | |
| Insurance | 10.4% | |
| Utilities | 6.0% | |
| Energy | 4.3% | |
| Food, Beverage & Tobacco | 3.1% | |
| Other | 6.4% | |
| Repurchase Agreements | 0.5% | |
| Total |
100% |
| Portfolio Credit Quality (% of total investments) |
||
| AA | 1.5% | |
| A | 0.5% | |
| BBB | 73.9% | |
| BB or Lower | 21.3% | |
| N/R (not rated) | 2.3% | |
| N/A (not applicable) | 0.5% | |
| Total |
100% |
| Country Allocation2 (% of total investments) |
||
| United States | 53.1% | |
| United Kingdom | 12.7% | |
| France | 8.7% | |
| Canada | 8.6% | |
| Spain | 4.5% | |
| Switzerland | 4.3% | |
| Netherlands | 2.0% | |
| Germany | 1.2% | |
| Mexico | 1.2% | |
| Ireland | 1.0% | |
| Finland | 0.7% | |
| Other | 2.0% | |
| Total |
100% |
| 1 | See the Portfolio of Investments for the remaining industries/sectors comprising “Other” and not listed in the table above. |
| 2 | Includes 1.9% (as a percentage of total investments) in emerging market countries. |
| 20 |
| NPFD | Nuveen Variable Rate Preferred & Income Fund | |
| Fund Performance, Leverage and Holdings Summaries July 31, 2025 | ||
| Performance* |
| Total Returns as of July 31, 2025 | ||||||||||
| Average Annual | ||||||||||
| Inception Date |
1-Year | Since Inception | ||||||||
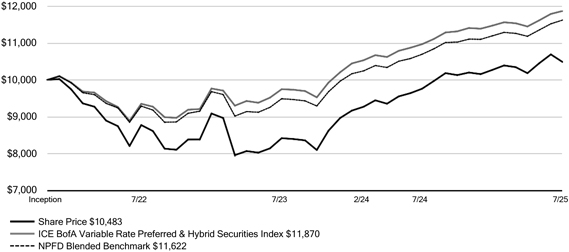
| NPFD at Common Share NAV | 12/15/21 | 10.09% | 1.45% | |||||||
| NPFD at Common Share Price | 12/15/21 | 14.97% | 1.31% | |||||||
| ICE Variable Rate Preferred & Hybrid Securities Index | — | 8.24% | 4.84% | |||||||
| NPFD Blended Benchmark | — | 8.68% | 4.23% | |||||||
*For purposes of Fund performance, relative results are measured against the NPFD Blended Benchmark. The Fund’s Blended Benchmark consists of
1) 80% ICE Variable Rate Preferred & Hybrid Securities Index and 2) 20% ICE USD Contingent Capital Index.
Daily Common Share NAV and Share Price
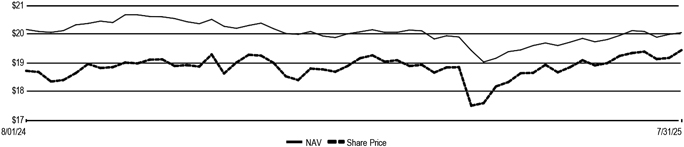
| Common Share NAV |
Common Share Price |
Premium/(Discount) to NAV |
Average Premium/(Discount) to NAV | |||||||||
| $20.06 | $19.45 | (3.04)% | (6.02)% |
Growth of an Assumed $10,000 Investment as of July 31, 2025 - Common Share Price
| 21 |
Performance Overview and Holdings Summaries as of July 31, 2025 (continued)
Leverage and Holdings
| Leverage | ||
| Effective Leverage | 36.10% | |
| Regulatory Leverage | 33.69% |
| Fund Allocation (% of net assets) |
||
| Corporate Bonds | 137.6% | |
| Preferred Stock | 13.6% | |
| U.S. Government and Agency Obligations | 3.5% | |
| Repurchase Agreements | 0.9% | |
| Other Assets & Liabilities, Net | 0.8% | |
| Reverse Repurchase Agreements, including accrued interest | (5.7)% | |
| Borrowings | (33.3)% | |
| TFP Shares, Net | (17.4)% | |
| Net Assets |
100% |
| Portfolio Composition1 (% of total investments) |
||
| Banks | 44.2% | |
| Financial Services | 14.2% | |
| Insurance | 13.6% | |
| Utilities | 9.8% | |
| Energy | 7.3% | |
| Telecommunication Services | 2.7% | |
| Other | 7.6% | |
| Repurchase Agreements | 0.6% | |
| Total |
100% |
| Portfolio Credit Quality (% of total investments) | ||
| AA | 1.9% | |
| A | 0.5% | |
| BBB | 71.8% | |
| BB or Lower | 23.1% | |
| N/R (not rated) | 2.1% | |
| N/A (not applicable) | 0.6% | |
| Total |
100% | |
| Country Allocation2 (% of total investments) | ||
| United States | 65.8% | |
| Canada | 11.9% | |
| United Kingdom | 7.5% | |
| France | 4.5% | |
| Spain | 2.5% | |
| Switzerland | 2.3% | |
| Netherlands | 1.3% | |
| Germany | 1.0% | |
| Mexico | 0.9% | |
| Ireland | 0.9% | |
| Finland | 0.4% | |
| Other | 1.0% | |
| Total |
100% | |
| 1 | See the Portfolio of Investments for the remaining industries/sectors comprising “Other” and not listed in the table above. |
| 2 | Includes 1.3% (as a percentage of total investments) in emerging market countries. |
| 22 |
Report of Independent Registered Public Accounting Firm
To the Board of Trustees and Shareholders of Nuveen Floating Rate Income Fund, Nuveen Credit Strategies Income Fund, Nuveen Preferred & Income Opportunities Fund, Nuveen Preferred Securities & Income Opportunities Fund and Nuveen Variable Rate Preferred & Income Fund
Opinions on the Financial Statements
We have audited the accompanying statements of assets and liabilities, including the portfolios of investments, of Nuveen Floating Rate Income Fund, Nuveen Credit Strategies Income Fund, Nuveen Preferred & Income Opportunities Fund, Nuveen Preferred Securities & Income Opportunities Fund and Nuveen Variable Rate Preferred & Income Fund (hereafter collectively referred to as the “Funds”) as of July 31, 2025, the related statements of operations, of changes in net assets and of cash flows for the year ended July 31, 2025, including the related notes, and the financial highlights for the year ended July 31, 2025 (collectively referred to as the “financial statements”). In our opinion, the financial statements present fairly, in all material respects, the financial position of each of the Funds as of July 31, 2025, the results of each of their operations, the changes in each of their net assets and each of their cash flows for the year ended July 31, 2025, and each of the financial highlights for the year ended July 31, 2025 in conformity with accounting principles generally accepted in the United States of America.
The financial statements of the Funds as of and for the year ended July 31, 2024 and the financial highlights for each of the periods ended on or prior to July 31, 2024 (not presented herein, other than the statement of changes in net assets and the financial highlights) were audited by other auditors whose report dated September 27, 2024 expressed an unqualified opinion on those financial statements and financial highlights.
Basis for Opinions
These financial statements are the responsibility of the Funds’ management. Our responsibility is to express an opinion on the Funds’ financial statements based on our audits. We are a public accounting firm registered with the Public Company Accounting Oversight Board (United States) (PCAOB) and are required to be independent with respect to the Funds in accordance with the U.S. federal securities laws and the applicable rules and regulations of the Securities and Exchange Commission and the PCAOB.
We conducted our audits of these financial statements in accordance with the standards of the PCAOB. Those standards require that we plan and perform the audit to obtain reasonable assurance about whether the financial statements are free of material misstatement, whether due to error or fraud.
Our audits included performing procedures to assess the risks of material misstatement of the financial statements, whether due to error or fraud, and performing procedures that respond to those risks. Such procedures included examining, on a test basis, evidence regarding the amounts and disclosures in the financial statements. Our audits also included evaluating the accounting principles used and significant estimates made by management, as well as evaluating the overall presentation of the financial statements. Our procedures included confirmation of securities owned as of July 31, 2025 by correspondence with the custodian, transfer agent, agent banks and brokers; when replies were not received from transfer agent, agent banks or brokers, we performed other auditing procedures. We believe that our audits provide a reasonable basis for our opinions.
/s/ PricewaterhouseCoopers LLP
Chicago, Illinois
September 26, 2025
We have served as the auditor of one or more investment companies in Nuveen Funds since 2002.
| 23 |
Portfolio of Investments July 31, 2025
JFR
| PRINCIPAL | DESCRIPTION | RATE | MATURITY | VALUE | ||||||||||||||
| |
|
|||||||||||||||||
| LONG-TERM INVESTMENTS - 158.8% (98.7% of Total Investments) | ||||||||||||||||||
| ASSET-BACKED SECURITIES - 0.5% (0.3% of Total Investments) | ||||||||||||||||||
| $ | 750,000 | (a),(b) | Battalion CLO XI Ltd, Series 2017 11A, (TSFR3M + 7.112%) | 8.034% | 04/24/34 | $ | 694,446 | |||||||||||
| 750,000 | (a),(b) | Magnetite XXVII Ltd, Series 2020 27A, (TSFR3M + 6.262%) | 10.587 | 10/20/34 | 754,654 | |||||||||||||
| 2,875,000 | (a),(b) | Neuberger Berman Loan Advisers CLO 48 Ltd, Series 2022 48A, (TSFR3M + 3.200%) | 7.482 | 04/25/36 | 2,898,569 | |||||||||||||
| 2,500,000 | (a),(b) | Rockford Tower CLO 2017‑3 Ltd, Series 2017 3A, (TSFR3M + 6.012%) | 6.813 | 10/20/30 | 2,469,468 | |||||||||||||
| |
|
|||||||||||||||||
| TOTAL ASSET-BACKED SECURITIES (Cost $6,760,286) |
6,817,137 | |||||||||||||||||
| |
||||||||||||||||||
| SHARES | DESCRIPTION | VALUE | ||||||||||||||||
| |
|
|||||||||||||||||
| COMMON STOCKS - 1.5% (0.9% of Total Investments) | ||||||||||||||||||
| CAPITAL GOODS - 0.0% (0.0% of Total Investments) | ||||||||||||||||||
| 4,865 | (c) | TNT Crane & Rigging Inc | 2,637 | |||||||||||||||
| 8,626 | (c) | TNT Crane & Rigging Inc | 86 | |||||||||||||||
| |
|
|||||||||||||||||
| TOTAL CAPITAL GOODS | 2,723 | |||||||||||||||||
| |
||||||||||||||||||
| CONSUMER DISCRETIONARY DISTRIBUTION & RETAIL - 0.0% (0.0% of Total Investments) | |
|||||||||||||||||
| 749 | (c),(d) | Belk Inc | 5,992 | |||||||||||||||
| |
|
|||||||||||||||||
| TOTAL CONSUMER DISCRETIONARY DISTRIBUTION & RETAIL | 5,992 | |||||||||||||||||
| |
||||||||||||||||||
| CONSUMER SERVICES - 0.7% (0.5% of Total Investments) | ||||||||||||||||||
| 1,458,756 | (c) | 24 Hour Fitness Worldwide Inc | 10,211 | |||||||||||||||
| 57,279 | (c) | Cengage Learning Holdings II Inc | 1,346,057 | |||||||||||||||
| 2,513 | (c) | Crown Finance US Inc | 55,992 | |||||||||||||||
| 410,147 | (c) | Crown Finance US Inc | 9,138,485 | |||||||||||||||
| |
|
|||||||||||||||||
| TOTAL CONSUMER SERVICES | 10,550,745 | |||||||||||||||||
| |
||||||||||||||||||
| ENERGY - 0.4% (0.2% of Total Investments) | ||||||||||||||||||
| 42,689 | Chord Energy Corp | 4,709,877 | ||||||||||||||||
| 215,829 | (c) | Transocean Ltd | 630,221 | |||||||||||||||
| |
|
|||||||||||||||||
| TOTAL ENERGY | 5,340,098 | |||||||||||||||||
| |
||||||||||||||||||
| HEALTH CARE EQUIPMENT & SERVICES - 0.0% (0.0% of Total Investments) | ||||||||||||||||||
| 167,590 | (c),(d) | Millennium Health LLC | 15,419 | |||||||||||||||
| 157,320 | (c),(d) | Millennium Health LLC | 1,573 | |||||||||||||||
| 195,344 | (c) | Onex Carestream Finance LP | 122,090 | |||||||||||||||
| |
|
|||||||||||||||||
| TOTAL HEALTH CARE EQUIPMENT & SERVICES | 139,082 | |||||||||||||||||
| |
||||||||||||||||||
| MATERIALS - 0.0% (0.0% of Total Investments) | ||||||||||||||||||
| 80 | LyondellBasell Industries NV, Class A | 4,634 | ||||||||||||||||
| |
|
|||||||||||||||||
| TOTAL MATERIALS | 4,634 | |||||||||||||||||
| |
||||||||||||||||||
| MEDIA & ENTERTAINMENT - 0.1% (0.1% of Total Investments) | ||||||||||||||||||
| 34,846 | (c) | Catalina Marketing Corp | 1,132,495 | |||||||||||||||
| |
|
|||||||||||||||||
| TOTAL MEDIA & ENTERTAINMENT | 1,132,495 | |||||||||||||||||
| |
||||||||||||||||||
| SEMICONDUCTORS & SEMICONDUCTOR EQUIPMENT - 0.0% (0.0% of Total Investments) | ||||||||||||||||||
| 60,637 | (c) | Bright Bidco BV | 14,371 | |||||||||||||||
| 44,390 | (c) | Bright Bidco BV | 10,520 | |||||||||||||||
| |
|
|||||||||||||||||
| TOTAL SEMICONDUCTORS & SEMICONDUCTOR EQUIPMENT | 24,891 | |||||||||||||||||
| |
||||||||||||||||||
| SOFTWARE & SERVICES - 0.1% (0.1% of Total Investments) | ||||||||||||||||||
| 48,404 | (c) | Avaya Inc | 328,228 | |||||||||||||||
| 115,628 | (c) | Avaya Inc | 784,073 | |||||||||||||||
| 573 | (c),(d) | Bloom Parent Inc | 572,645 | |||||||||||||||
| |
|
|||||||||||||||||
| TOTAL SOFTWARE & SERVICES | 1,684,946 | |||||||||||||||||
| |
||||||||||||||||||
| TECHNOLOGY HARDWARE & EQUIPMENT - 0.1% (0.0% of Total Investments) | ||||||||||||||||||
| 8,348 | (c) | MLN US Holdco LLC | 83 | |||||||||||||||
| 45,085 | (c) | Windstream Services PE LLC | 841,602 | |||||||||||||||
| |
|
|||||||||||||||||
| TOTAL TECHNOLOGY HARDWARE & EQUIPMENT | 841,685 | |||||||||||||||||
| |
||||||||||||||||||
| TELECOMMUNICATION SERVICES - 0.1% (0.0% of Total Investments) | ||||||||||||||||||
| 46,534 | (c) | Windstream Services PE LLC | 868,650 | |||||||||||||||
| |
|
|||||||||||||||||
| TOTAL TELECOMMUNICATION SERVICES | 868,650 | |||||||||||||||||
| |
||||||||||||||||||
| 24 | See Notes to Financial Statements |
| SHARES | DESCRIPTION | VALUE | ||||||||||||||||
| |
|
|||||||||||||||||
| TRANSPORTATION - 0.0% (0.0% of Total Investments) | ||||||||||||||||||
| 2,293 | (c) | ACBL HLDG CORP | $ | 106,625 | ||||||||||||||
| |
|
|||||||||||||||||
| TOTAL TRANSPORTATION | 106,625 | |||||||||||||||||
| |
||||||||||||||||||
| TOTAL COMMON STOCKS (Cost $50,648,983) |
20,702,566 | |||||||||||||||||
| |
||||||||||||||||||
| PRINCIPAL | DESCRIPTION | RATE | MATURITY | VALUE | ||||||||||||||
| |
|
|||||||||||||||||
| CORPORATE BONDS - 17.5% (10.9% of Total Investments) | ||||||||||||||||||
| AUTOMOBILES & COMPONENTS - 0.2% (0.1% of Total Investments) | ||||||||||||||||||
| $3,000,000 | (b) | Dornoch Debt Merger Sub Inc | 6.625% | 10/15/29 | 2,367,723 | |||||||||||||
| |
|
|||||||||||||||||
| TOTAL AUTOMOBILES & COMPONENTS | 2,367,723 | |||||||||||||||||
| |
||||||||||||||||||
| CAPITAL GOODS - 0.8% (0.5% of Total Investments) | ||||||||||||||||||
| 7,930,000 | (b) | Camelot Return Merger Sub Inc | 8.750 | 08/01/28 | 7,266,021 | |||||||||||||
| 4,537,000 | TransDigm Inc | 4.625 | 01/15/29 | 4,435,889 | ||||||||||||||
| |
|
|||||||||||||||||
| TOTAL CAPITAL GOODS | 11,701,910 | |||||||||||||||||
| |
||||||||||||||||||
| COMMERCIAL & PROFESSIONAL SERVICES - 0.9% (0.6% of Total Investments) | ||||||||||||||||||
| 3,000,000 | (b) | Boost Newco Borrower LLC | 7.500 | 01/15/31 | 3,171,933 | |||||||||||||
| 762,000 | (b) | Prime Security Services Borrower LLC / Prime Finance Inc | 5.750 | 04/15/26 | 765,130 | |||||||||||||
| 4,650,000 | (b) | Prime Security Services Borrower LLC / Prime Finance Inc | 6.250 | 01/15/28 | 4,649,667 | |||||||||||||
| 4,750,000 | (b) | Prime Security Services Borrower LLC / Prime Finance Inc | 3.375 | 08/31/27 | 4,579,213 | |||||||||||||
| |
|
|||||||||||||||||
| TOTAL COMMERCIAL & PROFESSIONAL SERVICES | 13,165,943 | |||||||||||||||||
| |
||||||||||||||||||
| CONSUMER DISCRETIONARY DISTRIBUTION & RETAIL - 0.6% (0.4% of Total Investments) | |
|||||||||||||||||
| 1,500,000 | (b) | Carvana Co, (cash 11.000%, PIK 13.000%) | 9.000 | 06/01/30 | 1,568,952 | |||||||||||||
| 6,055,000 | (b) | Michaels Cos Inc/The | 7.875 | 05/01/29 | 4,016,119 | |||||||||||||
| 1,812,000 | (b) | PetSmart Inc / PetSmart Finance Corp | 4.750 | 02/15/28 | 1,778,168 | |||||||||||||
| 900,000 | (b) | Wand NewCo 3 Inc | 7.625 | 01/30/32 | 944,974 | |||||||||||||
| |
|
|||||||||||||||||
| TOTAL CONSUMER DISCRETIONARY DISTRIBUTION & RETAIL | 8,308,213 | |||||||||||||||||
| |
||||||||||||||||||
| CONSUMER SERVICES - 1.1% (0.7% of Total Investments) | ||||||||||||||||||
| 10,261,000 | (b) | 1011778 BC ULC / New Red Finance Inc | 4.000 | 10/15/30 | 9,506,942 | |||||||||||||
| 1,807,000 | (b) | 1011778 BC ULC / New Red Finance Inc | 3.500 | 02/15/29 | 1,709,811 | |||||||||||||
| 4,000,000 | (b) | Muvico LLC | 15.000 | 02/19/29 | 4,309,240 | |||||||||||||
| 1,000,000 | (b) | Premier Entertainment Sub LLC / Premier Entertainment Finance Corp | 5.625 | 09/01/29 | 600,000 | |||||||||||||
| |
|
|||||||||||||||||
| TOTAL CONSUMER SERVICES | 16,125,993 | |||||||||||||||||
| |
||||||||||||||||||
| ENERGY - 0.8% (0.5% of Total Investments) | ||||||||||||||||||
| 1,314,000 | (b) | Borr IHC Ltd / Borr Finance LLC | 10.000 | 11/15/28 | 1,256,372 | |||||||||||||
| 1,000,000 | (b) | eG Global Finance PLC | 12.000 | 11/30/28 | 1,104,908 | |||||||||||||
| 1,799,000 | (b) | Hilcorp Energy I LP / Hilcorp Finance Co | 6.250 | 11/01/28 | 1,805,946 | |||||||||||||
| 1,799,000 | (b) | MEG Energy Corp | 5.875 | 02/01/29 | 1,799,232 | |||||||||||||
| 6,000,000 | PBF Holding Co LLC / PBF Finance Corp | 6.000 | 02/15/28 | 5,774,157 | ||||||||||||||
| |
|
|||||||||||||||||
| TOTAL ENERGY | 11,740,615 | |||||||||||||||||
| |
||||||||||||||||||
| EQUITY REAL ESTATE INVESTMENT TRUSTS (REITS) - 1.4% (0.9% of Total Investments) | |
|||||||||||||||||
| 9,750,000 | American Tower Corp | 2.950 | 01/15/51 | 6,133,050 | ||||||||||||||
| 5,920,000 | (b) | Office Properties Income Trust | 9.000 | 03/31/29 | 5,887,496 | |||||||||||||
| 3,500,000 | (b) | Office Properties Income Trust | 9.000 | 09/30/29 | 2,598,750 | |||||||||||||
| 5,000,000 | (b) | Uniti Group LP / Uniti Group Finance 2019 Inc / CSL Capital LLC | 6.500 | 02/15/29 | 4,864,087 | |||||||||||||
| |
|
|||||||||||||||||
| TOTAL EQUITY REAL ESTATE INVESTMENT TRUSTS (REITS) | 19,483,383 | |||||||||||||||||
| |
||||||||||||||||||
| HEALTH CARE EQUIPMENT & SERVICES - 1.9% (1.2% of Total Investments) | ||||||||||||||||||
| 8,500,000 | (b) | CHS/Community Health Systems Inc | 10.875 | 01/15/32 | 8,911,247 | |||||||||||||
| 3,025,000 | (b) | Mozart Debt Merger Sub Inc | 3.875 | 04/01/29 | 2,884,867 | |||||||||||||
| 9,080,561 | (b) | Team Health Holdings Inc, (cash 9.000%, PIK 4.500%) | 9.000 | 06/30/28 | 9,795,655 | |||||||||||||
| 1,930,000 | (b),(e) | Team Health Holdings Inc | 8.375 | 06/30/28 | 1,939,862 | |||||||||||||
| 3,765,000 | Tenet Healthcare Corp | 6.125 | 10/01/28 | 3,765,230 | ||||||||||||||
| |
|
|||||||||||||||||
| TOTAL HEALTH CARE EQUIPMENT & SERVICES | 27,296,861 | |||||||||||||||||
| |
||||||||||||||||||
| HOUSEHOLD & PERSONAL PRODUCTS - 0.1% (0.1% of Total Investments) | ||||||||||||||||||
| 2,000,000 | (b) | Kronos Acquisition Holdings Inc | 8.250 | 06/30/31 | 1,734,898 | |||||||||||||
| |
|
|||||||||||||||||
| TOTAL HOUSEHOLD & PERSONAL PRODUCTS | 1,734,898 | |||||||||||||||||
| |
||||||||||||||||||
| See Notes to Financial Statements | 25 |
Portfolio of Investments July 31, 2025 (continued)
JFR
| PRINCIPAL | DESCRIPTION | RATE | MATURITY | VALUE | ||||||||||||||
| |
|
|||||||||||||||||
| INSURANCE - 0.2% (0.1% of Total Investments) | ||||||||||||||||||
| $935,000 | (b) | Alliant Holdings Intermediate LLC / Alliant Holdings Co-Issuer | 4.250% | 10/15/27 | $ | 915,378 | ||||||||||||
| 1,825,000 | (b) | Alliant Holdings Intermediate LLC / Alliant Holdings Co-Issuer | 6.750 | 04/15/28 | 1,849,683 | |||||||||||||
| |
|
|||||||||||||||||
| TOTAL INSURANCE | 2,765,061 | |||||||||||||||||
| |
||||||||||||||||||
| MATERIALS - 0.1% (0.1% of Total Investments) | ||||||||||||||||||
| 1,000,000 | Ball Corp | 6.000 | 06/15/29 | 1,017,779 | ||||||||||||||
| |
|
|||||||||||||||||
| TOTAL MATERIALS | 1,017,779 | |||||||||||||||||
| |
||||||||||||||||||
| MEDIA & ENTERTAINMENT - 2.0% (1.2% of Total Investments) | ||||||||||||||||||
| 750,000 | (b) | Advantage Sales & Marketing Inc | 6.500 | 11/15/28 | 562,500 | |||||||||||||
| 13,000,000 | Charter Communications Operating LLC / Charter Communications Operating Capital | 3.500 | 03/01/42 | 9,146,366 | ||||||||||||||
| 4,725,000 | (b) | CSC Holdings LLC | 5.500 | 04/15/27 | 4,573,413 | |||||||||||||
| 2,000,000 | (b) | CSC Holdings LLC | 5.375 | 02/01/28 | 1,839,017 | |||||||||||||
| 18,647 | (b) | iHeartCommunications Inc | 9.125 | 05/01/29 | 15,554 | |||||||||||||
| 5,882,000 | (b) | McGraw-Hill Education Inc | 5.750 | 08/01/28 | 5,858,787 | |||||||||||||
| 1,000,000 | (b) | Scripps Escrow II Inc | 3.875 | 01/15/29 | 887,775 | |||||||||||||
| 4,000,000 | (b) | Sinclair Television Group Inc | 8.125 | 02/15/33 | 4,080,038 | |||||||||||||
| 1,199,000 | (b) | VZ Secured Financing BV | 5.000 | 01/15/32 | 1,054,453 | |||||||||||||
| |
|
|||||||||||||||||
| TOTAL MEDIA & ENTERTAINMENT | 28,017,903 | |||||||||||||||||
| |
||||||||||||||||||
| PHARMACEUTICALS, BIOTECHNOLOGY & LIFE SCIENCES - 0.2% (0.1% of Total Investments) | | |||||||||||||||||
| 1,000,000 | (b) | Organon & Co / Organon Foreign Debt Co‑Issuer BV | 7.875 | 05/15/34 | 895,320 | |||||||||||||
| 2,650,000 | (b) | Organon & Co / Organon Foreign Debt Co‑Issuer BV | 5.125 | 04/30/31 | 2,292,557 | |||||||||||||
| |
|
|||||||||||||||||
| TOTAL PHARMACEUTICALS, BIOTECHNOLOGY & LIFE SCIENCES | 3,187,877 | |||||||||||||||||
| |
||||||||||||||||||
| SOFTWARE & SERVICES - 0.6% (0.4% of Total Investments) | ||||||||||||||||||
| 4,000,000 | (b) | Condor Merger Sub Inc | 7.375 | 02/15/30 | 3,708,757 | |||||||||||||
| 1,000,000 | (b) | Open Text Holdings Inc | 4.125 | 12/01/31 | 910,051 | |||||||||||||
| 5,518,515 | (b) | Rackspace Finance LLC | 3.500 | 05/15/28 | 2,607,498 | |||||||||||||
| 1,000,000 | (b) | Rocket Software Inc | 9.000 | 11/28/28 | 1,031,954 | |||||||||||||
| |
|
|||||||||||||||||
| TOTAL SOFTWARE & SERVICES | 8,258,260 | |||||||||||||||||
| |
||||||||||||||||||
| TECHNOLOGY HARDWARE & EQUIPMENT - 0.6% (0.4% of Total Investments) | | |||||||||||||||||
| 2,301,000 | (b) | CommScope LLC | 4.750 | 09/01/29 | 2,234,386 | |||||||||||||
| 4,750,000 | (b) | CommScope Technologies LLC | 5.000 | 03/15/27 | 4,651,385 | |||||||||||||
| 2,500,000 | (b) | Viasat Inc | 7.500 | 05/30/31 | 2,176,770 | |||||||||||||
| |
|
|||||||||||||||||
| TOTAL TECHNOLOGY HARDWARE & EQUIPMENT | 9,062,541 | |||||||||||||||||
| |
||||||||||||||||||
| TELECOMMUNICATION SERVICES - 4.9% (3.0% of Total Investments) | ||||||||||||||||||
| 2,108,000 | EchoStar Corp, (cash 6.750%, PIK 6.750%) | 6.750 | 11/30/30 | 1,997,330 | ||||||||||||||
| 8,622,000 | EchoStar Corp | 10.750 | 11/30/29 | 9,085,432 | ||||||||||||||
| 9,216,000 | (b) | Frontier Communications Holdings LLC | 5.875 | 10/15/27 | 9,217,668 | |||||||||||||
| 2,000,000 | (b) | Frontier Communications Holdings LLC | 5.000 | 05/01/28 | 1,997,483 | |||||||||||||
| 2,250,000 | Frontier Communications Holdings LLC | 5.875 | 11/01/29 | 2,268,774 | ||||||||||||||
| 3,022,000 | (b) | Frontier Communications Holdings LLC | 6.000 | 01/15/30 | 3,057,929 | |||||||||||||
| 10,000,000 | (b) | Level 3 Financing Inc | 4.000 | 04/15/31 | 8,600,000 | |||||||||||||
| 1,000,000 | (b) | Lumen Technologies Inc | 10.000 | 10/15/32 | 1,011,250 | |||||||||||||
| 7,820,000 | (b) | Vmed O2 UK Financing I PLC | 4.250 | 01/31/31 | 7,125,048 | |||||||||||||
| 8,160,000 | (b) | Vmed O2 UK Financing I PLC | 4.750 | 07/15/31 | 7,549,388 | |||||||||||||
| 18,196,000 | (b) | Zayo Group Holdings Inc | 4.000 | 03/01/27 | 17,283,909 | |||||||||||||
| |
|
|||||||||||||||||
| TOTAL TELECOMMUNICATION SERVICES | 69,194,211 | |||||||||||||||||
| |
||||||||||||||||||
| TRANSPORTATION - 0.4% (0.2% of Total Investments) | ||||||||||||||||||
| 3,025,000 | Delta Air Lines Inc | 3.750 | 10/28/29 | 2,895,398 | ||||||||||||||
| 2,377,000 | (b) | United Airlines Inc | 4.625 | 04/15/29 | 2,321,176 | |||||||||||||
| |
|
|||||||||||||||||
| TOTAL TRANSPORTATION | 5,216,574 | |||||||||||||||||
| |
||||||||||||||||||
| UTILITIES - 0.7% (0.4% of Total Investments) | ||||||||||||||||||
| 3,060,000 | Pacific Gas and Electric Co | 4.550 | 07/01/30 | 3,000,696 | ||||||||||||||
| 1 | Pacific Gas and Electric Co | 4.500 | 07/01/40 | 1 | ||||||||||||||
| 6,028,000 | PG&E Corp | 5.000 | 07/01/28 | 5,881,363 | ||||||||||||||
| 950,000 | PG&E Corp | 5.250 | 07/01/30 | 911,245 | ||||||||||||||
| |
|
|||||||||||||||||
| TOTAL UTILITIES | 9,793,305 | |||||||||||||||||
| |
||||||||||||||||||
| TOTAL CORPORATE BONDS (Cost $238,601,296) |
248,439,050 | |||||||||||||||||
| |
||||||||||||||||||
| 26 | See Notes to Financial Statements |
| SHARES | DESCRIPTION | RATE | VALUE | |||||||||||||||
| |
|
|||||||||||||||||
| PREFERRED STOCK - 0.0% (0.0% of Total Investments) | ||||||||||||||||||
| TRANSPORTATION - 0.0% (0.0% of Total Investments) | ||||||||||||||||||
| 9,712 | ACBL HLDG CORP | 0.000% | $ | 539,016 | ||||||||||||||
| |
|
|||||||||||||||||
| TOTAL TRANSPORTATION | 539,016 | |||||||||||||||||
| |
||||||||||||||||||
| TOTAL PREFERRED STOCK (Cost $296,216) |
539,016 | |||||||||||||||||
| |
||||||||||||||||||
| PRINCIPAL | DESCRIPTION | RATE | MATURITY | VALUE | ||||||||||||||
| |
|
|||||||||||||||||
| VARIABLE RATE SENIOR LOAN INTERESTS - 139.3% (86.6% of Total Investments) | |
|||||||||||||||||
| AUTOMOBILES & COMPONENTS - 1.1% (0.7% of Total Investments) | ||||||||||||||||||
| $ | 1,035,243 | (a) | Adient US LLC, Term Loan B2, (TSFR1M + 2.250%) | 6.606 | 01/29/31 | 1,040,176 | ||||||||||||
| 3,295,141 | (a) | Clarios Global LP, Term Loan B, (TSFR1M + 2.500%) | 6.856 | 05/06/30 | 3,300,084 | |||||||||||||
| 4,624,000 | (a) | Clarios Global LP, Term Loan B, (TSFR1M + 2.750%) | 7.106 | 01/28/32 | 4,630,728 | |||||||||||||
| 6,384,790 | (a) | DexKo Global Inc., Term Loan B, (TSFR1M + 3.750%) | 8.221 | 10/04/28 | 6,103,285 | |||||||||||||
| |
|
|||||||||||||||||
| TOTAL AUTOMOBILES & COMPONENTS | 15,074,273 | |||||||||||||||||
| |
||||||||||||||||||
| CAPITAL GOODS - 9.9% (6.2% of Total Investments) | ||||||||||||||||||
| 2,006,801 | (a) | ACProducts, Inc., Term Loan B, (TSFR3M + 4.250%) | 8.807 | 05/17/28 | 1,523,292 | |||||||||||||
| 206,731 | (a),(f) | Air Comm Corporation, LLC, Delayed Draw Term Loan, (N/A + TSFR3M + 1.875%) | 4.029 | 12/11/31 | 207,248 | |||||||||||||
| 2,474,567 | (a) | Air Comm Corporation, LLC, Term Loan, (TSFR3M + 3.000%) | 7.300 | 12/11/31 | 2,480,754 | |||||||||||||
| 5,173,585 | (a) | Archkey Solutions LLC, Term Loan B, (TSFR3M + 4.750%) | 9.046 | 11/03/31 | 5,212,413 | |||||||||||||
| 2,605,312 | (a) | Azorra Soar TLB Finance Ltd, Term Loan B, (TSFR3M + 3.500%) | 7.818 | 10/18/29 | 2,615,903 | |||||||||||||
| 1,806,373 | (a) | Barentz International B.V., Term Loan B, (TSFR3M + 3.250%) | 7.646 | 03/28/31 | 1,801,857 | |||||||||||||
| 3,626,910 | (a) | Barnes Group Inc, Term Loan B, (TSFR1M + 3.000%) | 7.356 | 01/27/32 | 3,635,977 | |||||||||||||
| 3,570,000 | (a) | Centuri Group, Inc, Term Loan B, (TSFR1M + 2.250%) | 6.606 | 07/01/32 | 3,582,834 | |||||||||||||
| 12,659,434 | (a) | Chamberlain Group Inc, Term Loan B, (TSFR1M + 3.250%) | 7.706 | 11/03/28 | 12,680,195 | |||||||||||||
| 835,000 | (a),(e) | Chariot Buyer LLC, (TBD) | TBD | TBD | 835,693 | |||||||||||||
| 2,023,905 | (a) | Chart Industries, Inc., Term Loan B, (TSFR3M + 2.500%) | 6.792 | 03/18/30 | 2,035,289 | |||||||||||||
| 1,203,747 | (a) | Conair Holdings, LLC, Term Loan B, (TSFR1M + 3.750%) | 8.221 | 05/17/28 | 895,287 | |||||||||||||
| 3,961,938 | (a) | Core & Main LP, Term Loan B, (TSFR6M + 2.000%) | 6.270 | 07/27/28 | 3,980,084 | |||||||||||||
| 2,753,677 | (a) | Cornerstone Building Brands, Inc., Term Loan B, (TSFR1M + 3.250%) | 7.692 | 04/12/28 | 2,525,535 | |||||||||||||
| 687,000 | (a) | CP Atlas Buyer, Inc., Term Loan, (TSFR1M + 5.250%) | 9.606 | 07/08/30 | 659,176 | |||||||||||||
| 1,042,000 | (a) | DG Investment Intermediate Holdings 2, Inc., Term Loan, (TSFR1M + 3.750%) | 8.098 | 07/12/32 | 1,046,236 | |||||||||||||
| 3,868,765 | (a) | Gates Global LLC, Term Loan B5, (TSFR1M + 1.750%) | 6.106 | 06/04/31 | 3,867,972 | |||||||||||||
| 1,876,250 | (a) | INNIO Group Holding GmbH, First Lien Term Loan B, (TSFR1M + 2.250%) |
6.590 | 11/06/28 | 1,883,286 | |||||||||||||
| 1,443,966 | (a),(f) | Kaman Corporation, Delayed Draw Term Loan, (N/A + TSFR3M + 1.875%) |
4.039 | 02/26/32 | 1,446,218 | |||||||||||||
| 15,306,034 | (a) | Kaman Corporation, Term Loan B, (TSFR3M + 2.750%) | 7.083 | 02/26/32 | 15,329,912 | |||||||||||||
| 6,239,653 | (a) | Madison IAQ LLC, Term Loan, (TSFR6M + 2.500%) | 6.702 | 06/21/28 | 6,250,666 | |||||||||||||
| 4,267,762 | (a) | Madison Safety & Flow LLC, Term Loan B, (TSFR1M + 2.750%) | 7.108 | 09/26/31 | 4,291,769 | |||||||||||||
| 1,049,375 | (a) | MI Windows and Doors, LLC, Term Loan B2, (TSFR1M + 2.750%) | 7.106 | 03/28/31 | 1,052,130 | |||||||||||||
| 382,000 | (a) | Minimax Viking GmbH, Term Loan B, (TSFR1M + 2.250%) | 6.606 | 03/17/32 | 384,269 | |||||||||||||
| 2,192,617 | (a),(g) | Oregon Tool, Inc., 2nd Lien Term Loan, (TSFR3M + 4.000%) | 8.586 | 10/15/29 | 1,809,599 | |||||||||||||
| 1,124,000 | (a),(g) | Oregon Tool, Inc., First Lien Term Loan, (TSFR3M + 5.350%) | 9.674 | 10/15/29 | 1,148,233 | |||||||||||||
| 6,564,547 | (a) | Quikrete Holdings, Inc., Term Loan B, (TSFR1M + 2.250%) | 6.606 | 01/31/32 | 6,567,009 | |||||||||||||
| 7,853,747 | (a) | Quikrete Holdings, Inc., Term Loan B1, (TSFR1M + 2.250%) | 6.606 | 04/14/31 | 7,857,556 | |||||||||||||
| 1,373,222 | (a) | QXO Inc, Term Loan B, (TSFR3M + 3.000%) | 7.296 | 04/30/32 | 1,386,680 | |||||||||||||
| 5,717,462 | (a) | Titan Acquisition Limited, Term Loan B, (TSFR3M + TSFR6M + 4.500%) | 8.731 | 02/15/29 | 5,725,638 | |||||||||||||
| 13,503,434 | (a) | TK Elevator Midco GmbH, Term Loan B, (TSFR6M + 3.000%) | 7.197 | 04/30/30 | 13,592,894 | |||||||||||||
| 3,069,803 | (a) | TransDigm, Inc., Term Loan, (TSFR3M + 2.500%) | 6.796 | 01/20/32 | 3,082,066 | |||||||||||||
| 11,087,110 | (a) | TransDigm, Inc., Term Loan J, (TSFR3M + 2.500%) | 6.796 | 02/28/31 | 11,132,401 | |||||||||||||
| 4,049,676 | (a) | TransDigm, Inc., Term Loan K, (TSFR3M + 2.750%) | 7.046 | 03/22/30 | 4,068,831 | |||||||||||||
| 4,111,878 | (a) | Victory Buyer LLC, Term Loan, (TSFR1M + 3.750%) | 8.221 | 11/20/28 | 4,121,808 | |||||||||||||
| |
|
|||||||||||||||||
| TOTAL CAPITAL GOODS | 140,716,710 | |||||||||||||||||
| |
||||||||||||||||||
| See Notes to Financial Statements | 27 |
Portfolio of Investments July 31, 2025 (continued)
JFR
| PRINCIPAL | DESCRIPTION | RATE | MATURITY | VALUE | ||||||||||||||
| |
|
|||||||||||||||||
| COMMERCIAL & PROFESSIONAL SERVICES - 7.7% (4.8% of Total Investments) | |
|||||||||||||||||
| $ | 19,038,922 | (a) | Allied Universal Holdco LLC, Incremental Term Loan B, (TSFR1M + 3.750%) | 8.206% | 05/15/28 | $ | 19,101,846 | |||||||||||
| 5,339,588 | (a) | Amentum Government Services Holdings LLC, Term Loan B, (TSFR1M + 2.250%) | 6.606 | 09/29/31 | 5,348,932 | |||||||||||||
| 765,083 | (a) | American Auto Auction Group, LLC, Term Loan, (TSFR3M + 4.500%) | 8.830 | 05/28/32 | 773,211 | |||||||||||||
| 4,567,579 | (a) | Anticimex International AB, Term Loan B1, (SOFR90A + 3.400%) | 7.660 | 11/16/28 | 4,585,918 | |||||||||||||
| 1,857,186 | (a) | Anticimex International AB, Term Loan B6, (SOFR90A + 3.400%) | 7.660 | 11/16/28 | 1,865,701 | |||||||||||||
| 598,448 | (a),(f) | Archkey Solutions LLC, Delayed Draw Term Loan B | 4.750 | 11/03/31 | 602,940 | |||||||||||||
| 1,768,406 | (a) | CHG Healthcare Services Inc., Term Loan B1, (TSFR3M + 3.000%) | 7.333 | 09/29/28 | 1,769,786 | |||||||||||||
| 3,798,720 | (a) | CoreLogic, Inc., Term Loan, (TSFR1M + 3.500%) | 7.971 | 06/02/28 | 3,794,580 | |||||||||||||
| 5,955,728 | (a) | Creative Artists Agency, LLC , First Lien Term Loan B, (TSFR1M + 2.500%) |
6.856 | 10/01/31 | 5,968,771 | |||||||||||||
| 1,432,566 | (a) | Dayforce, Inc., Term Loan B, (TSFR3M + 2.000%) | 6.308 | 03/03/31 | 1,439,729 | |||||||||||||
| 7,388,041 | (a) | Dun & Bradstreet Corporation (The), Term Loan, (TSFR1M + 2.250%) | 6.603 | 01/18/29 | 7,393,323 | |||||||||||||
| 3,007,776 | (a) | Ensemble RCM, LLC, Term Loan B, (TSFR3M + 3.000%) | 7.308 | 08/01/29 | 3,025,116 | |||||||||||||
| 3,714,881 | (a) | First Advantage Holdings, LLC, Term Loan B, (TSFR1M + 2.750%) | 7.108 | 10/31/31 | 3,733,084 | |||||||||||||
| 4,903,750 | (a) | Garda World Security Corporation, Term Loan B, (TSFR1M + 3.000%) | 7.343 | 02/01/29 | 4,910,248 | |||||||||||||
| 3,300,000 | (a) | GFL Environmental Inc., Term Loan B, (TSFR3M + 2.500%) | 6.824 | 03/03/32 | 3,308,250 | |||||||||||||
| 1,684,375 | (a) | Herman Miller, Inc, Term Loan B, (TSFR1M + 2.000%) | 6.471 | 07/19/28 | 1,685,217 | |||||||||||||
| 997,416 | (a) | LABL, Inc., First Lien Term Loan, (TSFR1M + 5.000%) | 9.456 | 10/30/28 | 906,402 | |||||||||||||
| 4,254,416 | (a) | OMNIA Partners LLC, Term Loan B, (TSFR3M + 2.500%) | 6.814 | 07/25/30 | 4,268,476 | |||||||||||||
| 7,261,767 | (a) | Prime Security Services Borrower, LLC, First Lien Term Loan B, (TSFR6M + 2.000%) | 6.129 | 10/15/30 | 7,269,320 | |||||||||||||
| 4,145,265 | (a) | Reworld Holding Corp, Term Loan B, (TSFR1M + 2.250%) | 6.590 | 11/30/28 | 4,155,628 | |||||||||||||
| 320,098 | (a) | Reworld Holding Corp, Term Loan C, (TSFR1M + 2.250%) | 6.590 | 11/30/28 | 320,898 | |||||||||||||
| 3,808,747 | (a),(g) | West Corporation, Term Loan B3, (TSFR3M + 4.000%) | 8.558 | 04/12/27 | 2,062,684 | |||||||||||||
| 1,142,138 | (a) | WIN Waste Innovations Holdings, Inc., Incremental Term Loan, (TSFR1M + 3.750%) | 8.221 | 03/27/28 | 1,151,275 | |||||||||||||
| 17,583,330 | (a) | WIN Waste Innovations Holdings, Inc., Term Loan B, (TSFR1M + 2.750%) |
7.221 | 03/27/28 | 17,601,177 | |||||||||||||
| 2,659,900 | (a) | XPLOR T1 LLC, Term Loan B, (TSFR3M + 3.500%) | 7.796 | 06/24/31 | 2,673,199 | |||||||||||||
| |
|
|||||||||||||||||
| TOTAL COMMERCIAL & PROFESSIONAL SERVICES | 109,715,711 | |||||||||||||||||
| |
||||||||||||||||||
| CONSUMER DISCRETIONARY DISTRIBUTION & RETAIL - 4.8% (3.0% of Total Investments) | |
|||||||||||||||||
| 817,969 | (a) | Academy, Ltd., Term Loan, (TSFR1M + 3.750%) | 8.193 | 11/08/27 | 817,969 | |||||||||||||
| 4,002,753 | (a) | Belron Finance LLC, Term Loan B, (TSFR3M + 2.750%) | 7.049 | 10/16/31 | 4,026,269 | |||||||||||||
| 8,960,983 | (a) | CNT Holdings I Corp, Term Loan, (TSFR3M + 2.250%) | 6.558 | 11/08/32 | 8,987,866 | |||||||||||||
| 1,700,630 | (a) | Gulfside Supply Inc, Term Loan B, (TSFR3M + 3.000%) | 7.296 | 06/17/31 | 1,709,847 | |||||||||||||
| 2,570,575 | (a) | Johnstone Supply LLC, Term Loan B, (TSFR1M + 2.500%) | 6.851 | 06/09/31 | 2,575,163 | |||||||||||||
| 1,145,842 | (a) | Kodiak Building Partners Inc., Term Loan B, (TSFR3M + 3.750%) | 8.041 | 12/04/31 | 1,110,750 | |||||||||||||
| 4,536,319 | (a),(g) | LBM Acquisition LLC, Incremental Term Loan B, (TSFR1M + 3.750%) | 8.190 | 06/06/31 | 4,250,690 | |||||||||||||
| 3,073,671 | (a) | LBM Acquisition LLC, Term Loan B, (TSFR1M + 3.750%) | 8.206 | 12/20/27 | 3,068,431 | |||||||||||||
| 2,424,132 | (a) | Les Schwab Tire Centers, Term Loan B, (TSFR1M + TSFR3M + 2.500%) | 6.844 | 04/23/31 | 2,428,677 | |||||||||||||
| 8,706,538 | (a),(g) | Michaels Companies, Inc., Term Loan B, (TSFR3M + 4.250%) | 8.807 | 04/17/28 | 7,424,674 | |||||||||||||
| 2,428,461 | (a) | Mister Car Wash Holdings, Inc., Term Loan B, (TSFR1M + 2.500%) | 6.856 | 03/27/31 | 2,435,176 | |||||||||||||
| 2,854,000 | (a),(g) | Petco Health and Wellness Company, Inc., Term Loan B, (TSFR3M + 3.250%) | 7.807 | 03/06/28 | 2,674,027 | |||||||||||||
| 14,351,950 | (a) | PetSmart, Inc., Term Loan B, (TSFR1M + 3.750%) | 8.206 | 02/14/28 | 14,342,980 | |||||||||||||
| 4,428,500 | (a) | Restoration Hardware, Inc., Term Loan B, (TSFR1M + 2.500%) | 6.971 | 10/20/28 | 4,291,239 | |||||||||||||
| 6,106,186 | (a) | Wand NewCo 3, Inc., Repriced Term Loan B, (TSFR1M + 2.500%) | 6.856 | 01/30/31 | 6,100,446 | |||||||||||||
| 1,817,865 | (a) | White Cap Buyer LLC, Term Loan B, (TSFR1M + 3.250%) | 7.577 | 10/29/29 | 1,817,511 | |||||||||||||
| |
|
|||||||||||||||||
| TOTAL CONSUMER DISCRETIONARY DISTRIBUTION & RETAIL | 68,061,715 | |||||||||||||||||
| |
||||||||||||||||||
| 28 | See Notes to Financial Statements |
| PRINCIPAL | DESCRIPTION | RATE | MATURITY | VALUE | ||||||||||||||
| |
|
|||||||||||||||||
| CONSUMER DURABLES & APPAREL - 3.7% (2.3% of Total Investments) | ||||||||||||||||||
| $ | 6,358,400 | (a) | ABG Intermediate Holdings 2 LLC, First Lien Term Loan B, (TSFR1M + 2.250%) |
6.606% | 12/21/28 | $ | 6,354,426 | |||||||||||
| 16,845,933 | (a) | AI Aqua Merger Sub, Inc., First Lien Term Loan B, (TSFR1M + 3.000%) | 7.322 | 07/31/28 | 16,856,883 | |||||||||||||
| 1,535,114 | (a) | Hayward Industries, Inc., Term Loan, (TSFR1M + 2.500%) | 6.971 | 05/30/28 | 1,540,870 | |||||||||||||
| 997,494 | (a) | Hunter Douglas Inc., Term Loan B, (TSFR3M + 3.250%) | 7.546 | 01/20/32 | 999,364 | |||||||||||||
| 107,488 | (a) | Serta Simmons Bedding, LLC, New Term Loan, (TSFR3M + 7.500%) | 11.910 | 06/29/28 | 100,502 | |||||||||||||
| 3,147,736 | (a) | Somnigroup International Inc, Term Loan B, (TSFR1M + 2.250%) | 6.550 | 10/24/31 | 3,159,540 | |||||||||||||
| 3,681,383 | (a) | Topgolf Callaway Brands Corp., Term Loan B, (TSFR1M + 3.000%) | 7.356 | 03/18/30 | 3,642,839 | |||||||||||||
| 5,586,000 | (a) | Varsity Brands, Inc., Term Loan, (TSFR3M + 3.250%) | 7.580 | 08/26/31 | 5,607,646 | |||||||||||||
| 260,310 | (a) | Weber-Stephen Products LLC, Incremental Term Loan B, (TSFR1M + 4.250%) | 8.706 | 10/29/27 | 260,472 | |||||||||||||
| 11,079,728 | (a) | Weber-Stephen Products LLC, Term Loan B, (TSFR1M + 3.250%) | 7.721 | 10/29/27 | 11,088,425 | |||||||||||||
| 2,290,000 | (a) | WH Borrower, LLC, Term Loan B, (TSFR3M + 4.750%) | 9.072 | 02/20/32 | 2,293,046 | |||||||||||||
| |
|
|||||||||||||||||
| TOTAL CONSUMER DURABLES & APPAREL | 51,904,013 | |||||||||||||||||
| |
||||||||||||||||||
| CONSUMER SERVICES - 14.7% (9.1% of Total Investments) | ||||||||||||||||||
| 29,826,589 | (a) | 101B.C. Unlimited Liability Company, Term Loan B6, (TSFR1M + 1.750%) | 6.106 | 09/23/30 | 29,796,315 | |||||||||||||
| 1,490,006 | (a) | Allwyn Entertainment Financing US LLC, Term Loan B, (TSFR3M + 2.000%) | 6.329 | 06/11/31 | 1,485,663 | |||||||||||||
| 1,765,996 | (a) | Alterra Mountain Company, Term Loan B8, (TSFR1M + 2.500%) | 6.853 | 05/31/30 | 1,773,361 | |||||||||||||
| 3,463,591 | (a) | Alterra Mountain Company, Term Loan B9, (TSFR1M + 2.500%) | 6.853 | 08/17/28 | 3,480,927 | |||||||||||||
| 9,752,775 | (a) | Caesars Entertainment Inc., Term Loan B, (TSFR1M + 2.250%) | 6.606 | 02/06/30 | 9,759,895 | |||||||||||||
| 3,950,000 | (a) | Caesars Entertainment Inc., Term Loan B1, (TSFR1M + 2.250%) | 6.606 | 02/06/31 | 3,950,494 | |||||||||||||
| 2,385,000 | (a) | Catawba Nation Gaming Authority, Term Loan B, (TSFR3M + 4.750%) | 9.046 | 03/29/32 | 2,435,681 | |||||||||||||
| 6,609,043 | (a) | Churchill Downs Incorporated, Incremental Term Loan B1, (TSFR1M + 1.750%) | 6.106 | 03/17/28 | 6,622,790 | |||||||||||||
| 4,163,108 | (a) | Cinemark USA, Inc., Term Loan B, (TSFR1M + TSFR3M + 2.250%) | 6.576 | 05/24/30 | 4,185,484 | |||||||||||||
| 11,248,475 | (a) | Crown Finance US, Inc., Term Loan B, (TSFR1M + 4.500%) | 8.829 | 12/02/31 | 11,225,022 | |||||||||||||
| 4,176,336 | (a) | Delta 2 (LUX) S.a.r.l., Term Loan B1, (TSFR3M + 2.000%) | 6.296 | 09/19/31 | 4,183,290 | |||||||||||||
| 2,088,164 | (a) | Delta 2 (LUX) S.a.r.l., Term Loan B2, (TSFR3M + 2.000%) | 6.291 | 09/19/31 | 2,091,640 | |||||||||||||
| 2,326,701 | (a) | Element Materials Technology Group US Holdings Inc., Term Loan, (TSFR3M + 3.750%) | 8.046 | 06/25/29 | 2,336,392 | |||||||||||||
| 12,126,270 | (a) | Fertitta Entertainment, LLC, Term Loan B, (TSFR1M + 3.250%) | 7.601 | 01/29/29 | 12,150,219 | |||||||||||||
| 1,885,000 | (a),(g) | Flutter Financing B.V., Term Loan B, (TSFR3M + 2.000%) | 6.296 | 06/04/32 | 1,888,139 | |||||||||||||
| 23,763,125 | (a) | Flutter Financing B.V., Term Loan B, (TSFR3M + 1.750%) | 6.046 | 11/29/30 | 23,721,539 | |||||||||||||
| 2,889,228 | (a) | GBT US III LLC, Term Loan B, (TSFR3M + 2.500%) | 6.814 | 07/28/31 | 2,901,695 | |||||||||||||
| 5,748,483 | (a) | GVC Holdings (Gibraltar) Limited, Term Loan B3, (TSFR6M + 2.750%) | 7.016 | 10/31/29 | 5,765,269 | |||||||||||||
| 1,370,000 | (a) | Herschend Entertainment Company, LLC, Term Loan B, (TSFR1M + 3.250%) | 7.603 | 05/27/32 | 1,383,556 | |||||||||||||
| 10,242,367 | (a) | Hilton Domestic Operating Company, Inc., Term Loan B4, (TSFR1M + 1.750%) | 6.102 | 11/08/30 | 10,277,191 | |||||||||||||
| 2,167,627 | (a) | Hilton Grand Vacations Borrower LLC, Term Loan B, (TSFR1M + 2.000%) | 6.356 | 08/02/28 | 2,169,285 | |||||||||||||
| 18,219,007 | (a) | IRB Holding Corp, First Lien Term Loan B, (TSFR1M + 2.500%) | 6.856 | 12/15/27 | 18,234,584 | |||||||||||||
| 10,736,922 | (a) | Light and Wonder International, Inc., Term Loan B2, (TSFR1M + 2.250%) | 6.593 | 04/16/29 | 10,774,501 | |||||||||||||
| 655,399 | (a) | Motion Finco Sarl, Term Loan B, (TSFR3M + 3.500%) | 7.796 | 11/30/29 | 604,255 | |||||||||||||
| 2,993,256 | (a) | PCI Gaming Authority, Term Loan, (TSFR1M + 2.000%) | 6.356 | 07/21/31 | 2,999,811 | |||||||||||||
| 2,527,335 | (a) | PENN Entertainment, Inc., Term Loan B, (TSFR1M + 2.500%) | 6.856 | 05/03/29 | 2,537,988 | |||||||||||||
| 6,479,875 | (a) | PG Investment Company 59 S.a r.l., Term Loan B, (TSFR3M + 2.750%) | 7.046 | 03/24/31 | 6,509,035 | |||||||||||||
| 7,257,294 | (a) | Scientific Games Holdings LP, Term Loan B, (TSFR3M + 3.000%) | 7.286 | 04/04/29 | 7,262,519 | |||||||||||||
| 4,391,182 | (a) | SeaWorld Parks & Entertainment, Inc., Term Loan B3, (TSFR1M + 2.000%) | 6.356 | 12/04/31 | 4,394,848 | |||||||||||||
| See Notes to Financial Statements | 29 |
Portfolio of Investments July 31, 2025 (continued)
JFR
| PRINCIPAL | DESCRIPTION | RATE | MATURITY | VALUE | ||||||||||||||
| |
|
|||||||||||||||||
| CONSUMER SERVICES (continued) | ||||||||||||||||||
| $ | 2,202,750 | (a) | Six Flags Entertainment Corporation, Term Loan B, (TSFR1M + 2.000%) | 6.356% | 05/01/31 | $ | 2,204,589 | |||||||||||
| 11,096,203 | (a),(g) | Spin Holdco Inc., Term Loan, (TSFR3M + 4.000%) | 8.577 | 03/06/28 | 9,840,945 | |||||||||||||
| |
|
|||||||||||||||||
| TOTAL CONSUMER SERVICES | 208,946,922 | |||||||||||||||||
| |
||||||||||||||||||
| CONSUMER STAPLES DISTRIBUTION & RETAIL - 0.1% (0.0% of Total Investments) | |
|||||||||||||||||
| 1,000,000 | (a),(e) | Boots Group Finco LP, (TBD) | TBD | TBD | 1,000,630 | |||||||||||||
| |
|
|||||||||||||||||
| TOTAL CONSUMER STAPLES DISTRIBUTION & RETAIL | 1,000,630 | |||||||||||||||||
| |
||||||||||||||||||
| ENERGY - 2.8% (1.8% of Total Investments) | ||||||||||||||||||
| 3,522,458 | (a) | BCP Renaissance Parent LLC, Term Loan B3, (TSFR3M + 3.000%) | 7.296 | 10/31/28 | 3,535,351 | |||||||||||||
| 1,972,412 | (a) | EG Group Limited, Term Loan B, (TSFR3M + 4.250%) | 8.560 | 02/07/28 | 1,981,870 | |||||||||||||
| 1,978,021 | (a) | Epic Crude Services, LP, Term Loan B, (TSFR3M + 2.500%) | 6.828 | 10/15/31 | 1,991,264 | |||||||||||||
| 12,592,638 | (a) | Freeport LNG Investments, LLLP, Term Loan A, (TSFR3M + 3.000%) | 7.587 | 11/16/26 | 12,592,638 | |||||||||||||
| 6,005,518 | (a) | Freeport LNG Investments, LLLP, Term Loan B, (TSFR3M + 3.250%) | 7.575 | 12/21/28 | 6,023,054 | |||||||||||||
| 2,058,000 | (a) | New Fortress Energy Inc, Incremental Term Loan B, (TSFR3M + 5.500%) | 9.807 | 10/30/28 | 964,687 | |||||||||||||
| 4,296,647 | (a) | Oryx Midstream Services Permian Basin LLC, Term Loan B, (TSFR1M + 2.250%) | 6.603 | 10/05/28 | 4,308,720 | |||||||||||||
| 3,956,500 | (a) | TransMontaigne Operating Company L.P., Term Loan B, (TSFR1M + 3.250%) | 7.606 | 11/17/28 | 3,975,353 | |||||||||||||
| 4,777,813 | (a) | Traverse Midstream Partners LLC, Term Loan, (TSFR3M + 3.000%) | 7.308 | 02/16/28 | 4,801,702 | |||||||||||||
| 4 | (a) | Whitewater Whistler Holdings, LLC, Refinancing Term Loan, (TSFR3M + 1.750%) | 6.046 | 02/15/30 | 4 | |||||||||||||
| |
|
|||||||||||||||||
| TOTAL ENERGY | 40,174,643 | |||||||||||||||||
| |
||||||||||||||||||
| FINANCIAL SERVICES - 1.7% (1.1% of Total Investments) | ||||||||||||||||||
| 1,190,000 | (a),(e) | AAL Delaware Holdco, Inc., Term Loan, (TBD) | TBD | TBD | 1,193,903 | |||||||||||||
| 1,566,671 | (a) | AqGen Island Holdings, Inc., Term Loan B, (TSFR1M + 3.000%) | 7.356 | 08/02/28 | 1,570,164 | |||||||||||||
| 2,385,300 | (a) | Aragorn Parent Corporation, Repriced Term Loan B, (TSFR1M + 3.500%) |
7.856 | 12/15/28 | 2,406,673 | |||||||||||||
| 2,765,000 | (a),(e) | Beach Acquisition Bidco LLC, (TBD) | TBD | TBD | 2,785,737 | |||||||||||||
| 2,000,000 | (a),(e) | Colossus Acquireco LLC, (TBD) | TBD | TBD | 1,991,790 | |||||||||||||
| 1,995,000 | (a) | Dechra Pharmaceuticals Holdings Ltd, Term Loan B, (TSFR6M + 3.250%) |
7.447 | 01/27/32 | 2,004,227 | |||||||||||||
| 4,526,994 | (a),(d),(h) | Ditech Holding Corporation, Term Loan | 0.000 | 06/30/27 | 453 | |||||||||||||
| 496,256 | (a) | Kestra Advisor Services Holdings A, Inc., Repriced Term Loan, (TSFR1M + 3.000%) | 7.356 | 03/24/31 | 497,239 | |||||||||||||
| 1,333,333 | (a) | NCR Atleos LLC, Term Loan B, (TSFR3M + 3.750%) | 8.058 | 04/16/29 | 1,347,667 | |||||||||||||
| 1,910,736 | (a) | Orion Advisor Solutions, Inc., Term Loan B, (TSFR3M + 3.750%) | 8.069 | 09/09/30 | 1,921,789 | |||||||||||||
| 1,333,000 | (a),(e) | Orion US Finco, (TBD) | TBD | TBD | 1,340,778 | |||||||||||||
| 2,438,000 | (a),(e) | Priority Holdings LLC, (TBD) | TBD | TBD | 2,442,571 | |||||||||||||
| 960,000 | (a) | Shift4 Payments, LLC, Term Loan, (TSFR3M + 2.750%) | 7.078 | 07/06/32 | 967,402 | |||||||||||||
| 3,736,821 | (a) | WEX Inc., Term Loan B2, (TSFR1M + 1.750%) | 6.106 | 04/03/28 | 3,737,344 | |||||||||||||
| |
|
|||||||||||||||||
| TOTAL FINANCIAL SERVICES | 24,207,737 | |||||||||||||||||
| |
||||||||||||||||||
| FOOD, BEVERAGE & TOBACCO - 2.6% (1.6% of Total Investments) | ||||||||||||||||||
| 4,218,322 | (a) | CHG PPC Parent LLC, Term Loan, (TSFR1M + 3.000%) | 7.471 | 12/08/28 | 4,231,526 | |||||||||||||
| 1,257,928 | (a) | City Brewing Company, LLC, First Out New Money Term Loan, (TSFR3M + 6.250%) | 10.506 | 04/05/28 | 345,930 | |||||||||||||
| 3,291,752 | (a) | City Brewing Company, LLC, FLFO Roll Up Term Loan, (TSFR3M + 3.500%) |
8.018 | 04/05/28 | 905,232 | |||||||||||||
| 333,652 | (a) | City Brewing Company, LLC, PIK Super Priority Term Loan, (TSFR3M + 9.000%), (cash 13.585%, PIK 7.500%) | 13.585 | 01/03/26 | 316,969 | |||||||||||||
| 7,063,821 | (a) | Fiesta Purchaser, Inc., First Lien Term Loan B, (TSFR1M + 3.250%) | 7.606 | 02/12/31 | 7,085,895 | |||||||||||||
| 2,168,095 | (a) | Froneri Lux Finco Sarl, Term Loan B4, (TSFR6M + 2.000%) | 6.197 | 09/30/31 | 2,153,862 | |||||||||||||
| 2,316,000 | (a) | Naked Juice LLC, FLFO Term Loan, (TSFR3M + 5.500%) | 9.796 | 01/24/29 | 2,311,658 | |||||||||||||
| 6,279,734 | (a) | Pegasus BidCo BV, Term Loan B, (TSFR3M + 3.250%) | 7.576 | 07/12/29 | 6,308,526 | |||||||||||||
| 129,310 | (a),(f) | Sauer Brands Inc, Delayed Draw Term Loan, (TSFR3M + 1.625%) | 1.625 | 02/19/32 | 130,119 | |||||||||||||
| 1,370,690 | (a) | Sauer Brands Inc, Term Loan B, (TSFR1M + 3.250%) | 7.606 | 02/19/32 | 1,379,256 | |||||||||||||
| 30 | See Notes to Financial Statements |
| PRINCIPAL | DESCRIPTION | RATE | MATURITY | VALUE | ||||||||||||||
| |
|
|||||||||||||||||
| FOOD, BEVERAGE & TOBACCO (continued) | ||||||||||||||||||
| $ | 870,000 | (a) | Sazerac Company, Inc., Term Loan B, (TSFR3M + 2.500%) | 6.825% | 07/09/32 | $ | 874,080 | |||||||||||
| 2,501,125 | (a) | Sycamore Buyer LLC, Term Loan B, (TSFR1M + 2.250%) | 6.602 | 05/21/32 | 2,510,504 | |||||||||||||
| 8,437,351 | (a) | Triton Water Holdings, Inc, Term Loan B, (TSFR3M + 2.250%) | 6.546 | 03/31/28 | 8,466,671 | |||||||||||||
| |
|
|||||||||||||||||
| TOTAL FOOD, BEVERAGE & TOBACCO | 37,020,228 | |||||||||||||||||
| |
||||||||||||||||||
| HEALTH CARE EQUIPMENT & SERVICES - 14.7% (9.1% of Total Investments) | |
|||||||||||||||||
| 3,085,793 | (a) | ADMI Corp., Term Loan B5, (TSFR1M + 5.750%) | 10.106 | 12/23/27 | 2,994,762 | |||||||||||||
| 6,263,195 | (a) | AHP Health Partners, Inc., Term Loan B, (TSFR1M + 2.750%) | 7.106 | 08/24/28 | 6,282,767 | |||||||||||||
| 4,868,000 | (a) | Bausch & Lomb Corporation, Term Loan B, (TSFR1M + 4.250%) | 8.606 | 01/15/31 | 4,894,774 | |||||||||||||
| 1,308,433 | (a) |
Concentra Health Services Inc, Repriced Term Loan B, (TSFR1M + 2.000%) |
6.356 | 07/28/31 | 1,317,023 | |||||||||||||
| 5,779,160 | (a) | EyeCare Partners, LLC, Second Out Term Loan B, (TSFR3M + TSFR6M + 2.305%), (cash 5.227%, PIK 3.610%) | 4.419 | 11/30/28 | 4,590,820 | |||||||||||||
| 8,814,918 | (a) | Gainwell Acquisition Corp., Term Loan B, (TSFR3M + 4.000%) | 8.396 | 10/01/27 | 8,707,509 | |||||||||||||
| 13,857,198 | (a) | Global Medical Response, Inc., PIK Term Loan, (TSFR3M + 2.750%), (cash 9.079%, PIK 0.750%) | 4.914 | 10/02/28 | 13,890,802 | |||||||||||||
| 2,068,454 | (a) | Insulet Corporation, Term Loan, (TSFR1M + 2.000%) | 6.356 | 08/04/31 | 2,081,899 | |||||||||||||
| 9,689,190 | (a) | MedAssets Software Intermediate Holdings, Inc., First Out Term Loan, (TSFR1M + 4.000%) | 8.349 | 12/18/28 | 9,486,347 | |||||||||||||
| 5,216,000 | (a),(g) |
Medical Solutions Holdings, Inc., First Lien Term Loan, (TSFR3M + 3.500%) |
7.908 | 11/01/28 | 2,897,045 | |||||||||||||
| 32,759,820 | (a),(e) | Medline Borrower LP, (TBD) | TBD | TBD | 32,827,528 | |||||||||||||
| 6,920,665 | (a) |
National Mentor Holdings, Inc., Term Loan, (TSFR1M + TSFR3M + 3.750%) |
8.176 | 03/02/28 | 6,761,836 | |||||||||||||
| 154,648 | (a) | National Mentor Holdings, Inc., Term Loan C, (TSFR3M + 3.750%) | 8.146 | 03/02/28 | 151,099 | |||||||||||||
| 2,714,000 | (a),(e) | Onex TSG Intermediate Corp, (TBD) | TBD | TBD | 2,723,038 | |||||||||||||
| 4,728,000 | (a) | Onex TSG Intermediate Corp., Term Loan B, (TSFR3M + 4.750%) | 9.344 | 02/28/28 | 4,743,768 | |||||||||||||
| 1,234,375 | (a) | Pacific Dental Services, LLC, Term Loan B, (TSFR1M + 2.750%) | 7.101 | 03/17/31 | 1,240,744 | |||||||||||||
| 22,987,133 | (a) | Parexel International Corporation, Term Loan B, (TSFR1M + 2.500%) | 6.856 | 11/15/28 | 23,046,095 | |||||||||||||
| 13,584,198 | (a) | Phoenix Guarantor Inc, Term Loan B, (TSFR1M + 2.500%) | 6.856 | 02/21/31 | 13,614,287 | |||||||||||||
| 6,250,000 | (a) | Radiology Partners Inc, Term Loan, (TSFR3M + 4.500%) | 8.798 | 06/30/32 | 6,271,000 | |||||||||||||
| 1,975,075 | (a) | Resonetics, LLC, Term Loan B, (TSFR3M + 3.250%) | 7.569 | 06/18/31 | 1,976,754 | |||||||||||||
| 2,635,174 | (a) | Select Medical Corporation, Term Loan B, (TSFR1M + 2.000%) | 6.356 | 12/03/31 | 2,635,173 | |||||||||||||
| 411,013 | (a) | Sound Inpatient Physicians, Tranche A Term Loan (First Out), (TSFR3M + 3.250%), (cash 10.057%, PIK 1.000%) | 5.529 | 06/28/28 | 429,768 | |||||||||||||
| 7,044,628 | (a) | Sound Inpatient Physicians, Tranche B Term Loan (Second Out), (TSFR3M + 2.500%), (cash 8.057%, PIK 1.500%) | 4.779 | 06/28/28 | 6,623,711 | |||||||||||||
| 2,678,220 | (a) | Star Parent Inc., Term Loan B, (TSFR3M + 4.000%) | 8.296 | 09/30/30 | 2,652,000 | |||||||||||||
| 21,323,247 | (a) | Surgery Center Holdings, Inc., Term Loan B, (TSFR1M + 2.750%) | 7.106 | 12/19/30 | 21,417,709 | |||||||||||||
| 9,625,000 | (a),(e) | Team Health Holdings Inc, (TBD) | TBD | TBD | 9,637,031 | |||||||||||||
| 8,342,687 | (a) | Team Health Holdings, Inc., Term Loan B, (TSFR1M + 5.250%) | 9.606 | 03/02/27 | 8,347,901 | |||||||||||||
| 2,313,176 | (a) | US Radiology Specialists, Inc., Term Loan B, (TSFR3M + 4.750%) | 9.046 | 12/15/27 | 2,323,007 | |||||||||||||
| 3,966,468 | (a) | Viant Medical Holdings, Inc., Term Loan B, (TSFR1M + 4.000%) | 8.356 | 10/29/31 | 3,968,967 | |||||||||||||
| 62,225 | (a),(d) | Vyaire Medical, Inc., PIK Roll Up Term Loan | 0.000 | 06/14/27 | 6 | |||||||||||||
| 1,403,005 | (a),(d),(h) | Vyaire Medical, Inc., Term Loan B | 0.000 | 04/16/25 | 140 | |||||||||||||
| |
|
|||||||||||||||||
| TOTAL HEALTH CARE EQUIPMENT & SERVICES | 208,535,310 | |||||||||||||||||
| |
||||||||||||||||||
| HOUSEHOLD & PERSONAL PRODUCTS - 0.4% (0.2% of Total Investments) | |
|||||||||||||||||
| 3,642,824 | (a),(g) |
Kronos Acquisition Holdings Inc., Term Loan, (TSFR3M + 4.000%) |
8.296 | 07/08/31 | 3,120,680 | |||||||||||||
| 2,593,282 | (a) | VC GB Holdings I Corp., First Lien Term Loan, (TSFR3M + 3.500%) | 8.057 | 05/16/28 | 2,591,181 | |||||||||||||
| |
|
|||||||||||||||||
| TOTAL HOUSEHOLD & PERSONAL PRODUCTS | 5,711,861 | |||||||||||||||||
| |
||||||||||||||||||
| INSURANCE - 10.9% (6.8% of Total Investments) | ||||||||||||||||||
| 13,195,853 | (a) | Acrisure, LLC, First Lien Term Loan B6, (TSFR1M + 3.000%) | 7.356 | 11/06/30 | 13,214,393 | |||||||||||||
| 5,810,000 | (a) | Alera Group, Inc., Term Loan, (TSFR1M + 3.250%) | 7.606 | 05/28/32 | 5,842,333 | |||||||||||||
| 17,392,260 | (a) | Alliant Holdings Intermediate, LLC, Term Loan B6, (TSFR1M + 2.750%) | 7.103 | 09/19/31 | 17,413,131 | |||||||||||||
| 3,059,625 | (a) | AmWINS Group, Inc., Term Loan B, (TSFR1M + 2.250%) | 6.606 | 01/30/32 | 3,065,301 | |||||||||||||
| See Notes to Financial Statements | 31 |
Portfolio of Investments July 31, 2025 (continued)
JFR
| PRINCIPAL | DESCRIPTION | RATE | MATURITY | VALUE | ||||||||||||||
| |
|
|||||||||||||||||
| INSURANCE (continued) | ||||||||||||||||||
| $ | 9,124,612 | (a) | AssuredPartners, Inc., Incremental Term Loan B5, (TSFR1M + 3.500%) | 7.858% | 02/14/31 | $ | 9,153,537 | |||||||||||
| 9,774,000 | (a),(g) | Asurion LLC, 2nd Lien Term Loan B3, (TSFR1M + 5.250%) | 9.721 | 02/03/28 | 9,426,632 | |||||||||||||
| 252,545 | (a) | Asurion LLC, Term Loan B11, (TSFR1M + 4.250%) | 8.706 | 08/21/28 | 250,598 | |||||||||||||
| 8,000,000 | (a) | Asurion LLC, Term Loan B13, (TSFR1M + 4.250%) | 8.606 | 09/19/30 | 7,846,000 | |||||||||||||
| 5,040,173 | (a) | Asurion LLC, Term Loan B9, (TSFR1M + 3.250%) | 7.721 | 07/30/27 | 5,045,112 | |||||||||||||
| 21,859,728 | (a) | Broadstreet Partners, Inc., Term Loan B4, (TSFR1M + 2.750%) | 7.106 | 06/16/31 | 21,900,606 | |||||||||||||
| 3,030,500 | (a) | Evertec Group, LLC, Term Loan B, (TSFR1M + 2.750%) | 7.106 | 10/15/30 | 3,055,138 | |||||||||||||
| 19,626,303 | (a) | HUB International Limited, Term Loan B, (TSFR3M + 2.500%) | 6.825 | 06/20/30 | 19,672,719 | |||||||||||||
| 1,580,184 | (a) | Ryan Specialty Group, LLC, Term Loan B, (TSFR1M + 2.250%) | 6.606 | 09/15/31 | 1,584,135 | |||||||||||||
| 8,649,880 | (a) | Sedgwick Claims Management Services, Inc., Term Loan B, (TSFR1M + 2.500%) | 6.856 | 07/31/31 | 8,670,293 | |||||||||||||
| 1,205,000 | (a) | Trucordia Insurance Holdings LLC, Term Loan B, (TSFR1M + 3.250%) | 7.606 | 06/17/32 | 1,213,664 | |||||||||||||
| 11,954,718 | (a) | Truist Insurance Holdings LLC, Term Loan B, (TSFR3M + 2.750%) | 7.046 | 05/06/31 | 11,982,094 | |||||||||||||
| 5,183,214 | (a) | USI, Inc., Term Loan C, (TSFR3M + 2.250%) | 6.546 | 09/27/30 | 5,181,996 | |||||||||||||
| 10,809,012 | (a) | USI, Inc., Term Loan D, (TSFR3M + 2.250%) | 6.546 | 11/23/29 | 10,813,282 | |||||||||||||
| |
|
|||||||||||||||||
| TOTAL INSURANCE | 155,330,964 | |||||||||||||||||
| |
||||||||||||||||||
| MATERIALS - 6.5% (4.0% of Total Investments) | ||||||||||||||||||
| 2,686,348 | (a) | Arsenal AIC Parent LLC, Term Loan B, (TSFR1M + 2.750%) | 7.106 | 08/19/30 | 2,697,268 | |||||||||||||
| 3,920,779 | (a) | Berlin Packaging LLC, Term Loan B7, (TSFR1M + TSFR3M + 3.500%) | 7.811 | 06/09/31 | 3,934,600 | |||||||||||||
| 3,557,375 | (a) | Charter NEX US, Inc., Term Loan B1, (TSFR1M + 2.750%) | 7.086 | 12/02/30 | 3,569,701 | |||||||||||||
| 222,302 | (a),(f) | Clydesdale Acquisition Holdings Inc, Delayed Draw Term Loan, (N/A + TSFR1M + 2.438%) | 4.616 | 03/29/32 | 222,399 | |||||||||||||
| 12,715,698 | (a) | Clydesdale Acquisition Holdings Inc, Term Loan B, (TSFR1M + 3.250%) | 7.606 | 03/29/32 | 12,721,229 | |||||||||||||
| 7,783,125 | (a) | Clydesdale Acquisition Holdings Inc, Term Loan B, (TSFR1M + 3.175%) | 7.531 | 04/13/29 | 7,788,923 | |||||||||||||
| 4,103,000 | (a) | CPC Acquisition Corp, Term Loan, (TSFR3M + 3.750%) | 8.307 | 12/29/27 | 3,549,095 | |||||||||||||
| 8,507,998 | (a) | Discovery Purchaser Corporation, Term Loan, (TSFR3M + 3.750%) | 8.082 | 10/04/29 | 8,516,251 | |||||||||||||
| 978,701 | (a) | ECO Services Operations Corp, Term Loan B, (TSFR3M + 2.000%) | 6.308 | 06/12/31 | 977,478 | |||||||||||||
| 2,475,000 | (a) | Fortis 333, Inc., Term Loan B, (TSFR3M + 3.500%) | 7.796 | 04/02/32 | 2,460,571 | |||||||||||||
| 194,540 | (a) | Ineos US Finance LLC, First Lien Term Loan B, (TSFR1M + 3.000%) | 7.356 | 02/07/31 | 179,544 | |||||||||||||
| 2,377,071 | (a) | Ineos US Finance LLC, Term Loan B, (TSFR1M + 3.250%) | 7.606 | 02/19/30 | 2,214,384 | |||||||||||||
| 4,307,643 | (a) | Klockner-Pentaplast of America, Inc., Term Loan B, (TSFR6M + 4.725%) | 9.227 | 02/09/26 | 3,965,314 | |||||||||||||
| 279,300 | (a) | Knife River HoldCo, Term Loan, (TSFR3M + 2.000%) | 6.310 | 03/08/32 | 280,696 | |||||||||||||
| 2,484,412 | (a) | Lonza Group AG, Term Loan B, (TSFR3M + 3.925%) | 8.321 | 07/03/28 | 2,227,537 | |||||||||||||
| 7,958,791 | (a) | Nouryon Finance B.V., Term Loan B1, (TSFR3M + 3.250%) | 7.510 | 04/03/28 | 7,971,247 | |||||||||||||
| 640,295 | (a) | Nouryon Finance B.V., Term Loan B2, (TSFR3M + 3.250%) | 7.550 | 04/03/28 | 640,797 | |||||||||||||
| 1,585,000 | (a),(e) | Olympus Water US Holding Corp, (TBD) | TBD | TBD | 1,582,821 | |||||||||||||
| 679,443 | (a) | Plaze, Inc., Incremental Term Loan, (TSFR1M + 3.750%) | 8.221 | 08/03/26 | 652,584 | |||||||||||||
| 5,223,296 | (a) | Proampac PG Borrower LLC, Term Loan, (TSFR3M + 4.000%) | 8.321 | 09/15/28 | 5,246,148 | |||||||||||||
| 3,876,036 | (a) | SupplyOne, Inc, Term Loan B, (TSFR1M + 3.500%) | 7.856 | 04/21/31 | 3,905,455 | |||||||||||||
| 12,863,206 | (a) | TricorBraun Holdings, Inc., Term Loan, (TSFR1M + 3.250%) | 7.721 | 03/03/28 | 12,879,157 | |||||||||||||
| 3,788,654 | (a) | USALCO, LLC, Term Loan B, (TSFR1M + 4.000%) | 8.356 | 09/30/31 | 3,792,215 | |||||||||||||
| |
|
|||||||||||||||||
| TOTAL MATERIALS | 91,975,414 | |||||||||||||||||
| |
||||||||||||||||||
| MEDIA & ENTERTAINMENT - 7.0% (4.4% of Total Investments) | |
|||||||||||||||||
| 980,573 | (a) | Advantage Sales & Marketing, Inc., Term Loan, (TSFR3M + 4.250%) | 8.797 | 10/28/27 | 767,568 | |||||||||||||
| 21,291,136 | (a),(g) | AMC Entertainment Holdings, Inc. , Term Loan, (TSFR1M + 7.000%) | 11.351 | 01/04/29 | 21,474,134 | |||||||||||||
| 2,880,000 | (a) | Cable One, Inc., Term Loan B4, (TSFR1M + 2.000%) | 6.471 | 05/03/28 | 2,784,960 | |||||||||||||
| 3,233,422 | (a) | Cengage Learning, Inc., First Lien Term Loan B, (TSFR1M + TSFR3M + 3.500%) | 7.841 | 03/24/31 | 3,236,364 | |||||||||||||
| 851,421 | (a) | Century De Buyer LLC, Term Loan B, (TSFR3M + 3.500%) | 7.808 | 10/30/30 | 854,244 | |||||||||||||
| 32 | See Notes to Financial Statements |
| PRINCIPAL | DESCRIPTION | RATE | MATURITY | VALUE | ||||||||||||||
| |
|
|||||||||||||||||
| MEDIA & ENTERTAINMENT (continued) | ||||||||||||||||||
| $ | 14,291,052 | (a) | Clear Channel Outdoor Holdings, Inc., Term Loan, (TSFR1M + 4.000%) | 8.471% | 08/23/28 | $ | 14,289,766 | |||||||||||
| 4,103,062 | (a) | CMG Media Corporation, Term Loan, (TSFR3M + 3.500%) | 7.896 | 06/18/29 | 4,016,897 | |||||||||||||
| 19,009,321 | (a) | CSC Holdings, LLC, Term Loan B5, (Prime + 1.500%) | 9.000 | 04/15/27 | 18,751,934 | |||||||||||||
| 12,352,900 | (a),(g) | CSC Holdings, LLC, Term Loan B6, (TSFR1M + 4.500%) | 8.842 | 01/18/28 | 12,337,582 | |||||||||||||
| 1,743,987 | (a) | DirecTV Financing, LLC, Term Loan, (TSFR3M + 5.000%) | 9.570 | 08/02/27 | 1,751,181 | |||||||||||||
| 955,000 | (a) | E.W. Scripps Company (The), Term Loan B2, (TSFR1M + 5.750%) | 10.208 | 06/30/28 | 968,728 | |||||||||||||
| 2,491,000 | (a) | E.W. Scripps Company (The), Term Loan B3, (TSFR1M + 3.350%) | 7.808 | 11/30/29 | 2,424,727 | |||||||||||||
| 2,961,632 | (a) | McGraw-Hill Global Education Holdings, LLC, Term Loan B, (TSFR1M + 3.250%) | 7.606 | 08/06/31 | 2,972,042 | |||||||||||||
| 1,178,880 | (a) | Mission Broadcasting, Inc., Term Loan B, (TSFR1M + 2.500%) | 6.943 | 06/02/28 | 1,182,564 | |||||||||||||
| 2,112,112 | (a) | Planet US Buyer LLC, Term Loan B, (TSFR3M + 3.000%) | 7.330 | 02/10/31 | 2,124,257 | |||||||||||||
| 3,527,000 | (a) | Sinclair Television Group Inc., Term Loan B6, (TSFR3M + 3.300%) | 7.870 | 12/31/29 | 3,294,218 | |||||||||||||
| 2,568,046 | (a) | Sunrise Financing Partnership, Term Loan AAA, (TSFR6M + 2.500%) | 6.691 | 02/17/32 | 2,569,459 | |||||||||||||
| 3,700,000 | (a) | Virgin Media Bristol LLC, Term Loan Q, (TSFR1M + 3.250%) | 7.706 | 01/31/29 | 3,682,980 | |||||||||||||
| 513,000 | (a) | Virgin Media Bristol LLC, Term Loan Y, (TSFR6M + 3.175%) | 7.373 | 03/31/31 | 504,151 | |||||||||||||
| |
|
|||||||||||||||||
| TOTAL MEDIA & ENTERTAINMENT | 99,987,756 | |||||||||||||||||
| |
||||||||||||||||||
| PHARMACEUTICALS, BIOTECHNOLOGY & LIFE SCIENCES - 2.4% (1.5% of Total Investments) | | |||||||||||||||||
| 3,250,000 | (a),(e) | Amneal Pharmaceuticals LLC, (TBD) | TBD | TBD | 3,257,442 | |||||||||||||
| 3,256,585 | (a) | Amneal Pharmaceuticals LLC, Term Loan B, (TSFR1M + 5.500%) | 9.856 | 05/04/28 | 3,321,716 | |||||||||||||
| 1,546,741 | (a) | Elanco Animal Health Incorporated, Term Loan B, (TSFR1M + 1.750%) | 6.179 | 08/02/27 | 1,547,074 | |||||||||||||
| 13,952,710 | (a) | Jazz Financing Lux S.a.r.l., First Lien Term Loan B, (TSFR1M + 2.250%) | 6.606 | 05/05/28 | 14,023,590 | |||||||||||||
| 5,845,000 | (a) | Opal Bidco SAS, Term Loan B, (TSFR3M + 3.250%) | 7.575 | 04/23/32 | 5,877,527 | |||||||||||||
| 4,577,742 | (a) | Organon & Co, Term Loan, (TSFR1M + 2.250%) | 6.599 | 05/19/31 | 4,427,066 | |||||||||||||
| 1,604,761 | (a) | Perrigo Investments, LLC, Term Loan B, (TSFR1M + 2.000%) | 6.356 | 04/20/29 | 1,613,122 | |||||||||||||
| |
|
|||||||||||||||||
| TOTAL PHARMACEUTICALS, BIOTECHNOLOGY & LIFE SCIENCES | 34,067,537 | |||||||||||||||||
| |
||||||||||||||||||
| REAL ESTATE MANAGEMENT & DEVELOPMENT - 1.4% (0.9% of Total Investments) | ||||||||||||||||||
| 4,718,159 | (a) | Cushman & Wakefield U.S. Borrower, LLC, Term Loan B1, (TSFR1M + 2.750%) | 7.106 | 01/31/30 | 4,752,885 | |||||||||||||
| 3,671,563 | (a) | Cushman & Wakefield U.S. Borrower, LLC, Term Loan B3, (TSFR1M + 2.750%) | 7.106 | 01/31/30 | 3,697,576 | |||||||||||||
| 11,898,000 | (a) | Forest City Enterprises, L.P., Term Loan B, (TSFR1M + 3.500%) | 7.971 | 12/08/25 | 11,595,374 | |||||||||||||
| |
|
|||||||||||||||||
| TOTAL REAL ESTATE MANAGEMENT & DEVELOPMENT | 20,045,835 | |||||||||||||||||
| |
||||||||||||||||||
| SEMICONDUCTORS & SEMICONDUCTOR EQUIPMENT - 0.2% (0.1% of Total Investments) | | |||||||||||||||||
| 2,992,500 | (a) | Instructure Holdings, Inc., Term Loan, (TSFR6M + 3.000%) | 7.205 | 11/13/31 | 3,004,186 | |||||||||||||
| |
|
|||||||||||||||||
| TOTAL SEMICONDUCTORS & SEMICONDUCTOR EQUIPMENT | 3,004,186 | |||||||||||||||||
| |
||||||||||||||||||
| SOFTWARE & SERVICES - 26.8% (16.7% of Total Investments) | ||||||||||||||||||
| 3,951,045 | (a) | Ahead DB Holdings, LLC, Term Loan B3, (TSFR3M + 3.000%) | 7.296 | 02/03/31 | 3,959,283 | |||||||||||||
| 1,418,602 | (a) | Apttus Corporation, Term Loan B, (TSFR3M + 3.500%) | 7.808 | 05/08/28 | 1,423,482 | |||||||||||||
| 6,457,000 | (a) | Asurion LLC, Second Lien Term Loan B4, (TSFR1M + 5.250%) | 9.721 | 01/22/29 | 6,087,756 | |||||||||||||
| 4,950,000 | (a) | Avalara, Inc, Term Loan B, (TSFR3M + 3.250%) | 7.546 | 03/29/32 | 4,977,448 | |||||||||||||
| 10,091,255 | (a) | Avaya, Inc., Exit Term Loan, (TSFR1M + 7.500%), (cash 11.856%, PIK 7.500%) | 11.856 | 08/01/28 | 7,939,698 | |||||||||||||
| 3,979,926 | (a) | Axalta Coating Systems U.S. Holdings, Inc., Term Loan B, (TSFR3M + 1.750%) | 6.046 | 12/20/29 | 3,997,537 | |||||||||||||
| 4,114,687 | (a) | BCPE Pequod Buyer Inc, Term Loan B, (TSFR1M + 3.000%) | 7.356 | 11/25/31 | 4,127,546 | |||||||||||||
| 17,574,795 | (a) | Boost Newco Borrower, LLC, Term Loan B, (TSFR3M + 2.000%) | 6.296 | 01/31/31 | 17,624,268 | |||||||||||||
| 20,406,332 | (a) | Boxer Parent Company Inc., Term Loan B, (TSFR3M + 3.000%) | 7.333 | 07/30/31 | 20,430,207 | |||||||||||||
| 5,676,356 | (a) | Camelot U.S. Acquisition LLC, Term Loan B, (TSFR1M + 2.750%) | 7.106 | 01/31/31 | 5,681,323 | |||||||||||||
| 845,636 | (a) | CCC Intelligent Solutions Inc., Term Loan, (TSFR1M + 2.000%) | 6.356 | 01/23/32 | 847,754 | |||||||||||||
| 992,506 | (a) | Cloud Software Group, Inc., Term Loan, (TSFR3M + 3.750%) | 8.046 | 03/24/31 | 997,191 | |||||||||||||
| 3,875,000 | (a) | Cotiviti Corporation, 2nd Amendment Term Loan, (TSFR1M + 2.750%) | 7.079 | 03/29/32 | 3,871,764 | |||||||||||||
| 13,638,517 | (a) | Cotiviti Corporation, Term Loan, (TSFR1M + 2.750%) | 7.079 | 05/01/31 | 13,620,105 | |||||||||||||
| See Notes to Financial Statements | 33 |
Portfolio of Investments July 31, 2025 (continued)
JFR
| PRINCIPAL | DESCRIPTION | RATE | MATURITY | VALUE | ||||||||||||||
| |
|
|||||||||||||||||
| SOFTWARE & SERVICES (continued) | ||||||||||||||||||
| $ | 8,229,375 | (a) | Darktrace PLC, First Lien Term Loan, (TSFR3M + 3.250%) | 7.570% | 10/09/31 | $ | 8,253,364 | |||||||||||
| 1,611,762 | (a) | Drake Software, LLC, Term Loan B, (TSFR3M + 4.250%) | 8.546 | 06/26/31 | 1,612,777 | |||||||||||||
| 2,432,350 | (a) | DTI Holdco, Inc., Term Loan B, (TSFR1M + 4.000%) | 8.356 | 04/26/29 | 2,404,475 | |||||||||||||
| 9,635,404 | (a) | Ellucian Holdings, Inc., First Lien Term Loan B, (TSFR1M + 2.750%) | 7.106 | 10/09/29 | 9,659,493 | |||||||||||||
| 22,494,645 | (a) | Epicor Software Corporation, Term Loan E, (TSFR1M + 2.750%) | 7.106 | 05/30/31 | 22,559,880 | |||||||||||||
| 3,147,217 | (a) | Fortress Intermediate 3, Inc, Term Loan B, (TSFR1M + 3.000%) | 7.322 | 06/27/31 | 3,157,053 | |||||||||||||
| 9,336,250 | (a) | Gen Digital Inc., Term Loan B, (TSFR1M + 1.750%) | 6.106 | 09/12/29 | 9,334,056 | |||||||||||||
| 15,182,705 | (a) | Genesys Cloud Services Holdings II LLC, Term Loan B, (TSFR1M + 2.500%) |
6.856 | 01/30/32 | 15,186,728 | |||||||||||||
| 12,432,375 | (a) | Informatica LLC, Term Loan B, (TSFR1M + 2.250%) | 6.606 | 10/30/28 | 12,517,848 | |||||||||||||
| 3,872,295 | (a) | Javelin Buyer, Inc., First Lien Term Loan, (TSFR3M + 3.000%) | 7.333 | 12/08/31 | 3,870,785 | |||||||||||||
| 6,109,688 | (a) | Kaseya Inc., First Lien Term Loan B, (TSFR1M + 3.250%) | 7.606 | 03/22/32 | 6,133,576 | |||||||||||||
| 3,171,097 | (a) | Marcel LUX IV SARL, Repriced Term Loan, (SOFR30A + 3.000%) | 7.310 | 11/13/30 | 3,198,844 | |||||||||||||
| 14,831,811 | (a) | McAfee, LLC, First Lien Term Loan B, (TSFR1M + 3.000%) | 7.327 | 03/01/29 | 14,374,472 | |||||||||||||
| 1,215,000 | (a) | MedAssets Software Intermediate Holdings, Inc., Second Out Term Loan, (TSFR1M + 4.000%) | 8.463 | 12/18/28 | 1,098,561 | |||||||||||||
| 14,370,922 | (a) | Mitchell International, Inc., First Lien Term Loan, (TSFR1M + 3.250%) | 7.606 | 06/17/31 | 14,405,413 | |||||||||||||
| 8,858,441 | (a) | Open Text Corporation, Term Loan B, (TSFR1M + 1.750%) | 6.106 | 01/31/30 | 8,871,728 | |||||||||||||
| 2,514,600 | (a) | Perforce Software, Inc., Add‑on Term Loan, (TSFR1M + 4.750%) | 9.106 | 03/24/31 | 2,449,774 | |||||||||||||
| 2,313,375 | (a) | PointClickCare Technologies, Inc., Term Loan B, (TSFR6M + 3.250%) | 7.474 | 11/03/31 | 2,318,441 | |||||||||||||
| 3,808,109 | (a) | Polaris Newco LLC, Term Loan B, (TSFR3M + 3.750%) | 8.320 | 06/05/28 | 3,743,142 | |||||||||||||
| 7,608,505 | (a) | Press Ganey Holdings, Inc., Repriced Term Loan B, (TSFR1M + 3.000%) | 7.356 | 04/30/31 | 7,617,255 | |||||||||||||
| 748,116 | (a) | Project Alpha Intermediate Holding, Inc., First Lien Term Loan B, (TSFR3M + 3.250%) | 7.542 | 10/28/30 | 750,828 | |||||||||||||
| 2,084,740 | (a) | Project Ruby Ultimate Parent Corp., Term Loan B, (TSFR1M + 2.750%) | 7.215 | 03/10/28 | 2,089,952 | |||||||||||||
| 9,287,370 | (a) | Proofpoint, Inc., Term Loan, (TSFR1M + 3.000%) | 7.356 | 08/31/28 | 9,313,514 | |||||||||||||
| 5,784,972 | (a) | Rackspace Finance, LLC, First Lien First Out Term Loan, (TSFR1M + 6.250%) | 10.711 | 05/15/28 | 5,860,379 | |||||||||||||
| 12,992,825 | (a) | Rackspace Finance, LLC, First Lien Second Out Term Loan, (TSFR1M + 2.750%) | 7.211 | 05/15/28 | 6,816,621 | |||||||||||||
| 6,872,415 | (a) | Rocket Software, Inc., Term Loan B, (TSFR1M + 3.750%) | 8.106 | 11/28/28 | 6,897,671 | |||||||||||||
| 2,581,020 | (a) | SS&C Technologies Inc., Term Loan B8, (TSFR1M + 2.000%) | 6.356 | 05/09/31 | 2,592,725 | |||||||||||||
| 3,491,250 | (a) | Synechron Inc, Term Loan B, (TSFR3M + 3.750%) | 8.058 | 10/03/31 | 3,495,614 | |||||||||||||
| 2,321,659 | (a) | Syniverse Holdings, Inc., Term Loan, (TSFR3M + 7.000%) | 11.296 | 05/13/27 | 2,156,821 | |||||||||||||
| 4,337,830 | (a) | Tempo Acquisition LLC, Repriced Term Loan B, (TSFR1M + 1.750%) | 6.106 | 08/31/28 | 4,331,388 | |||||||||||||
| 24,837,067 | (a) | UKG Inc., Term Loan B, (TSFR3M + 2.500%) | 6.810 | 02/10/31 | 24,862,649 | |||||||||||||
| 5,642,916 | (a) | Vision Solutions, Inc., Incremental Term Loan, (TSFR3M + 4.000%) | 8.570 | 04/24/28 | 5,479,525 | |||||||||||||
| 2,709,559 | (a) | VS Buyer, LLC, First Lien Term Loan B, (TSFR3M + 2.750%) | 7.075 | 04/14/31 | 2,717,458 | |||||||||||||
| 1,868,221 | (a) | World Wide Technology Holding Co LLC, (CME Term SOFR 1 Month + 2.250%) | 6.599 | 03/01/30 | 1,868,221 | |||||||||||||
| 27,519,973 | (a),(g) | X Corp., Term Loan, (TSFR3M + 6.500%) | 10.958 | 10/29/29 | 26,864,172 | |||||||||||||
| 5,010,000 | X Corp., Term Loan | 9.500 | 10/29/29 | 4,867,716 | ||||||||||||||
| 13,967,200 | (a) | Zelis Payments Buyer, Inc., Term Loan B, (TSFR1M + 2.750%) | 7.106 | 09/28/29 | 13,940,173 | |||||||||||||
| 7,134,086 | (a) | ZoomInfo LLC, Term Loan B, (TSFR1M + 1.750%) | 6.106 | 02/28/30 | 7,121,851 | |||||||||||||
| |
|
|||||||||||||||||
| TOTAL SOFTWARE & SERVICES | 380,380,305 | |||||||||||||||||
| |
||||||||||||||||||
| TECHNOLOGY HARDWARE & EQUIPMENT - 5.5% (3.4% of Total Investments) | ||||||||||||||||||
| 36,260,869 | (a) | CommScope, Inc., Term Loan, (TSFR1M + 5.250%) | 9.606 | 12/17/29 | 36,945,655 | |||||||||||||
| 475,000 | (a) | Delta TopCo, Inc., 2nd Lien Term Loan, (TSFR3M + 5.250%) | 9.574 | 12/02/30 | 476,544 | |||||||||||||
| 15,225,595 | (a) | Delta TopCo, Inc., Term Loan B, (TSFR3M + 2.750%) | 7.071 | 12/03/29 | 15,207,628 | |||||||||||||
| 3,378,789 | (a) | II‑VI Incorporated, First Lien Term Loan B, (TSFR1M + 2.000%) | 6.356 | 07/02/29 | 3,392,305 | |||||||||||||
| 2,522,230 | (a) | Ingram Micro Inc., Term Loan, (TSFR3M + 2.250%) | 6.560 | 09/22/31 | 2,537,465 | |||||||||||||
| 12,176,122 | (a) | Verifone Systems, Inc., Term Loan, (TSFR3M + 5.500%) | 10.070 | 08/21/28 | 11,788,008 | |||||||||||||
| 489,738 | (a) | ViaSat, Inc., Term Loan, (TSFR1M + 4.500%) | 8.971 | 03/05/29 | 484,534 | |||||||||||||
| 7,927,827 | (a) | ViaSat, Inc., Term Loan, (TSFR1M + 4.500%) | 8.954 | 05/30/30 | 7,810,337 | |||||||||||||
| |
|
|||||||||||||||||
| TOTAL TECHNOLOGY HARDWARE & EQUIPMENT | 78,642,476 | |||||||||||||||||
| |
||||||||||||||||||
| 34 | See Notes to Financial Statements |
| PRINCIPAL | DESCRIPTION | RATE | MATURITY | VALUE | ||||||||||||||
| |
|
|||||||||||||||||
| TELECOMMUNICATION SERVICES - 9.6% (6.0% of Total Investments) | ||||||||||||||||||
| $ | 7,446,778 | (a) | Altice France S.A., Term Loan B12, (Prime + 2.688%) | 10.188% | 02/02/26 | $ | 6,790,568 | |||||||||||
| 12,787,649 | (a) | Altice France S.A., Term Loan B13, (Prime + 3.000%) | 10.500 | 08/14/26 | 11,668,730 | |||||||||||||
| 9,429,376 | (a),(g) | Altice France S.A., Term Loan B14, (TSFR3M + 5.500%) | 9.818 | 08/31/28 | 8,791,432 | |||||||||||||
| 7,018,433 | (a) | Cincinnati Bell, Inc., Term Loan B2, (TSFR1M + 2.750%) | 7.106 | 11/24/28 | 7,039,102 | |||||||||||||
| 3,578,939 | (a) | Connect Finco Sarl, Extended Term Loan B, (TSFR1M + 4.500%) | 8.856 | 09/13/29 | 3,519,100 | |||||||||||||
| 876,023 | (a),(d) | Cyxtera DC Holdings, Inc., Term Loan B | 0.000 | 05/01/26 | 4,818 | |||||||||||||
| 8,037,068 | (a) | Digicel International Finance Limited, Term Loan, (TSFR3M + 4.875%), (cash 9.558%, PIK 2.250%) | 7.029 | 05/27/27 | 8,077,253 | |||||||||||||
| 5,689,000 | (a),(e) | Digicel International Finance Ltd, (TBD) | TBD | TBD | 5,689,000 | |||||||||||||
| 7,402,846 | (a) | Frontier Communications Corp., Term Loan B, (TSFR6M + 2.500%) | 6.792 | 07/01/31 | 7,420,206 | |||||||||||||
| 1,832,000 | (a),(e) | LCPR Loan Financing LLC, Term Loan B, (TBD) | TBD | TBD | 1,399,950 | |||||||||||||
| 9,339,000 | (a) | Level 3 Financing Inc., Term Loan B, (TSFR1M + 4.250%) | 8.606 | 03/29/32 | 9,436,032 | |||||||||||||
| 12,696,738 | (a) | Lumen Technologies, Inc., Extended Term Loan B2, (TSFR1M + 2.350%) | 6.821 | 04/15/30 | 12,640,237 | |||||||||||||
| 7,028,681 | (a) | Lumen Technologies, Inc., Term Loan A, (TSFR1M + 6.000%) | 10.356 | 06/01/28 | 7,204,398 | |||||||||||||
| 3,109,557 | (a),(g) | Numericable Group SA, Term Loan B11, (Prime + 1.750%) | 9.250 | 07/31/25 | 2,814,149 | |||||||||||||
| 1,952,000 | (a),(e) | Telesat LLC, (TBD) | TBD | TBD | 1,245,796 | |||||||||||||
| 32,061,000 | (a) | Zayo Group Holdings, Inc., Term Loan, (TSFR1M + 3.000%) | 7.471 | 03/09/27 | 31,037,132 | |||||||||||||
| 12,234,274 | (a) | Ziggo Financing Partnership, Term Loan I, (TSFR1M + 2.500%) | 6.956 | 04/28/28 | 11,838,373 | |||||||||||||
| |
|
|||||||||||||||||
| TOTAL TELECOMMUNICATION SERVICES | 136,616,276 | |||||||||||||||||
| |
||||||||||||||||||
| TRANSPORTATION - 2.7% (1.6% of Total Investments) | ||||||||||||||||||
| 508,563 | (a) | Air Canada, Term Loan B, (TSFR1M + 2.000%) | 6.353 | 03/21/31 | 509,198 | |||||||||||||
| 895,397 | (a) | American Airlines, Inc., First Lien Term Loan, (TSFR6M + 1.750%) | 5.984 | 01/29/27 | 892,356 | |||||||||||||
| 4,297,756 | (a) | American Airlines, Inc., Term Loan, (TSFR3M + 2.250%) | 6.575 | 04/20/28 | 4,285,937 | |||||||||||||
| 3,307,980 | (a) | Brown Group Holding, LLC, Incremental Term Loan B2, (TSFR1M + TSFR3M + 2.500%) | 6.803 | 07/01/31 | 3,317,457 | |||||||||||||
| 6,320,790 | (a) | Brown Group Holding, LLC, Term Loan B, (TSFR1M + 2.500%) | 6.856 | 07/01/31 | 6,337,003 | |||||||||||||
| 221,810 | (a),(g) | Cubic Corp, (CME Term SOFR 3 Month + 1.000%) | 5.320 | 05/01/29 | 163,129 | |||||||||||||
| 1,553,000 | (a),(g) | Cubic Corp, (CME Term SOFR 3 Month + 4.250%) | 8.570 | 05/01/29 | 1,147,861 | |||||||||||||
| 2,374,559 | (a) | First Student Bidco Inc, First Lien Term Loan B, (TSFR3M + 2.500%) | 6.796 | 07/21/28 | 2,380,875 | |||||||||||||
| 728,004 | (a) | First Student Bidco Inc, Term Loan C, (TSFR3M + 2.500%) | 6.796 | 07/21/28 | 729,941 | |||||||||||||
| 3,612,574 | (a) | KKR Apple Bidco, LLC, Term Loan, (TSFR1M + 2.500%) | 6.856 | 09/23/31 | 3,626,736 | |||||||||||||
| 3,702,383 | (a) | PODS, LLC, Term Loan B, (TSFR1M + 3.000%) | 7.471 | 03/31/28 | 3,519,375 | |||||||||||||
| 3,964,972 | (a) | SkyMiles IP Ltd., Skymiles Term Loan B, (TSFR3M + 3.750%) | 8.075 | 10/20/27 | 3,990,011 | |||||||||||||
| 3,750,000 | (a) | Stonepeak Nile Parent LLC, Term Loan B, (TSFR3M + 2.750%) | 7.079 | 04/12/32 | 3,763,125 | |||||||||||||
| 2,918,087 | (a) | United Airlines, Inc., First Lien Term Loan B, (TSFR1M + 2.000%) | 6.351 | 02/24/31 | 2,933,042 | |||||||||||||
| |
|
|||||||||||||||||
| TOTAL TRANSPORTATION | 37,596,046 | |||||||||||||||||
| |
||||||||||||||||||
| UTILITIES - 2.1% (1.3% of Total Investments) | ||||||||||||||||||
| 2,486,227 | (a) | Constellation Renewables, LLC, Term Loan, (TSFR3M + 2.250%) | 6.583 | 12/15/27 | 2,490,665 | |||||||||||||
| 2,485,000 | (a),(e) | Cornerstone Generation LLC, (TBD) | TBD | TBD | 2,505,501 | |||||||||||||
| 1,837,500 | (a) | Invenergy Thermal Operating I LLC, Term Loan B, (TSFR3M + 3.500%) | 7.796 | 05/06/32 | 1,858,631 | |||||||||||||
| 122,500 | (a) | Invenergy Thermal Operating I LLC, Term Loan C, (TSFR3M + 3.500%) | 7.796 | 05/06/32 | 123,909 | |||||||||||||
| 897,750 | (a) | Long Ridge Energy LLC, Term Loan B, (TSFR3M + 4.500%) | 8.796 | 02/19/32 | 888,400 | |||||||||||||
| 2,437,500 | (a),(e) | NRG Energy, Inc., Term Loan, (TBD) | TBD | TBD | 2,441,729 | |||||||||||||
| 9,114,200 | (a) | Talen Energy Supply, LLC, Incremental Term Loan B, (TSFR3M + 2.500%) |
6.808 | 12/15/31 | 9,146,236 | |||||||||||||
| 10,270,795 | (a) | Talen Energy Supply, LLC, Term Loan B, (TSFR3M + 2.500%) | 6.808 | 05/17/30 | 10,307,719 | |||||||||||||
| |
|
|||||||||||||||||
| TOTAL UTILITIES | 29,762,790 | |||||||||||||||||
| |
||||||||||||||||||
| TOTAL VARIABLE RATE SENIOR LOAN INTERESTS (Cost $1,973,191,780) |
1,978,479,338 | |||||||||||||||||
| |
||||||||||||||||||
| See Notes to Financial Statements | 35 |
Portfolio of Investments July 31, 2025 (continued)
JFR
| SHARES | DESCRIPTION | VALUE | ||||||||||||||||
| |
|
|||||||||||||||||
| WARRANTS - 0.0% (0.0% of Total Investments) | ||||||||||||||||||
| TRANSPORTATION - 0.0% (0.0% of Total Investments) | ||||||||||||||||||
| 2,411 | ACBL HLDG CORP | $ | 112,111 | |||||||||||||||
| 6,822 | ACBL HLDG CORP | 378,621 | ||||||||||||||||
| 26,910 | (d) | American Commercial Barge Line LLC | 6,728 | |||||||||||||||
| 54,576 | (d) | American Commercial Barge Line LLC | 19,102 | |||||||||||||||
| |
|
|||||||||||||||||
| TOTAL TRANSPORTATION | 516,562 | |||||||||||||||||
| |
||||||||||||||||||
| TOTAL WARRANTS (Cost $508,799) |
516,562 | |||||||||||||||||
| |
||||||||||||||||||
| TOTAL LONG-TERM INVESTMENTS (Cost $2,270,007,360) |
2,255,493,669 | |||||||||||||||||
| |
||||||||||||||||||
| SHARES | DESCRIPTION | RATE | VALUE | |||||||||||||||
| |
|
|||||||||||||||||
| SHORT-TERM INVESTMENTS - 2.0%(1.3% of Total Investments) | |
|||||||||||||||||
| INVESTMENT COMPANIES - 2.0% (1.3% of Total Investments) | |
|||||||||||||||||
| 28,623,217 | BlackRock Liquidity Funds T-Fund | 4.517(i) | 28,623,217 | |||||||||||||||
| |
|
|||||||||||||||||
| TOTAL INVESTMENT COMPANIES (Cost $28,623,217) |
28,623,217 | |||||||||||||||||
| |
||||||||||||||||||
| TOTAL SHORT-TERM INVESTMENTS (Cost $28,623,217) |
28,623,217 | |||||||||||||||||
| |
||||||||||||||||||
| TOTAL INVESTMENTS - 160.8% (Cost $2,298,630,577) |
2,284,116,886 | |||||||||||||||||
| |
||||||||||||||||||
| BORROWINGS - (36.4)% (j),(k) | (517,200,000) | |||||||||||||||||
| |
||||||||||||||||||
| TFP SHARES, NET - (20.0)%(l) | (283,909,017) | |||||||||||||||||
| |
||||||||||||||||||
| OTHER ASSETS & LIABILITIES, NET - (4.4)% | (62,504,848) | |||||||||||||||||
| |
||||||||||||||||||
| NET ASSETS APPLICABLE TO COMMON SHARES - 100% | $ | 1,420,503,021 | ||||||||||||||||
| |
||||||||||||||||||
All percentages shown in the Portfolio of Investments are based on net assets applicable to common shares unless otherwise noted.
| PIK | Payment‑in‑kind (“PIK”) security. Depending on the terms of the security, income may be received in the form of cash, securities, or a combination of both. The PIK rate shown, where applicable, represents the annualized rate of the last PIK payment made by the issuer as of the end of the reporting period. |
| SOFR30A | 30 Day Average Secured Overnight Financing Rate |
| SOFR90A | 90 Day Average Secured Overnight Financing Rate |
| TBD | Senior loan purchased on a when-issued or delayed-delivery basis. Certain details associated with this purchase are not known prior to the settlement date of the transaction. In addition, senior loans typically trade without accrued interest and therefore a coupon rate is not available prior to settlement. At settlement, if still unknown, the borrower or counterparty will provide the Fund with the final coupon rate and maturity date. |
| TSFR1M | CME Term Secured Overnight Financing Rate 1 Month |
| TSFR3M | CME Term Secured Overnight Financing Rate 3 Month |
| TSFR6M | CME Term Secured Overnight Financing Rate 6 Month |
| (a) | Floating or variable rate security includes the reference rate and spread, unless the variable rate is based on the underlying asset of the security. Coupon rate reflects the rate at period end. |
| (b) | Security is exempt from registration under Rule 144A of the Securities Act of 1933, as amended. These securities are deemed liquid and may be resold in transactions exempt from registration, which are normally those transactions with qualified institutional buyers. As of the end of the reporting period, the aggregate value of these securities is $198,943,477 or 8.7% of Total Investments. |
| (c) | Non‑income producing; issuer has not declared an ex‑dividend date within the past twelve months. |
| (d) | For fair value measurement disclosure purposes, investment classified as Level 3. |
| (e) | When-issued or delayed delivery security. |
| (f) | Investment, or portion of investment, represents an outstanding unfunded senior loan commitment. |
| (g) | Portion of investment purchased on a delayed delivery basis. |
| (h) | Defaulted security. A security whose issuer has failed to fully pay principal and/or interest when due, or is under the protection of bankruptcy. |
| (i) | The rate shown is the annualized seven‑day subsidized yield as of end of the reporting period. |
| (j) | Borrowings as a percentage of Total Investments is 22.6%. |
| (k) | The Fund segregates 100% of its eligible investments (excluding any investments separately pledged as collateral for specific investments in derivatives, when applicable) in the Portfolio of Investments as collateral for borrowings. |
| (l) | TFP Shares, Net as a percentage of Total Investments is 12.4%. |
| 36 | See Notes to Financial Statements |
Portfolio of Investments July 31, 2025
JQC
| PRINCIPAL | DESCRIPTION | RATE | MATURITY | VALUE | ||||||||||||||
| |
|
|||||||||||||||||
| LONG-TERM INVESTMENTS - 157.7% (95.7% of Total Investments) | |
|||||||||||||||||
| ASSET-BACKED SECURITIES - 7.9% (4.8% of Total Investments) | ||||||||||||||||||
| $ | 4,500,000 | (a),(b) | AIMCO CLO 10 Ltd, Series 2019 10A, (TSFR3M + 4.250%) | 8.582% | 07/22/37 | $ | 4,523,265 | |||||||||||
| 1,500,000 | (a),(b) | Allegany Park CLO Ltd, Series 2019 1A, (TSFR3M + 6.400%) | 10.725 | 01/20/35 | 1,506,429 | |||||||||||||
| 1,500,000 | (a),(b) | Allegro CLO XIII Ltd, Series 2021 1A, (TSFR3M + 6.300%) | 10.618 | 07/20/38 | 1,507,708 | |||||||||||||
| 750,000 | (a),(b),(c) | Ares LXIII CLO Ltd, Series 2022 63A, (TSFR3M + 6.000%) | 0.000 | 10/15/38 | 753,854 | |||||||||||||
| 2,250,000 | (a),(b) | Carlyle US CLO 2022-4 Ltd, Series 2022 4A, (TSFR3M + 3.100%) | 7.418 | 07/25/36 | 2,257,011 | |||||||||||||
| 963,000 | (a),(b) | Carlyle US CLO 2022-4 Ltd, Series 2022 4A, (TSFR3M + 6.750%) | 11.376 | 07/25/36 | 975,214 | |||||||||||||
| 1,000,000 | (a),(b) | CIFC Funding 2020-I Ltd, Series 2020 1A, (TSFR3M + 6.512%) | 10.829 | 07/15/36 | 1,009,102 | |||||||||||||
| 2,500,000 | (a),(b) | CIFC Funding 2021-I Ltd, Series 2021 1A, (TSFR3M + 6.000%) | 10.318 | 07/25/37 | 2,526,707 | |||||||||||||
| 1,250,000 | (a),(b) | CIFC Funding 2021-IV Ltd, Series 2021 4A, (TSFR3M + 6.200%) | 10.519 | 07/23/37 | 1,267,190 | |||||||||||||
| 665,000 | (a),(b) | Elmwood CLO 20 Ltd, Series 2022 7A, (TSFR3M + 6.000%) | 10.322 | 01/17/37 | 667,935 | |||||||||||||
| 6,700,000 | (a),(b) | Elmwood CLO 26 Ltd, Series 2024 1A, (TSFR3M + 6.450%) | 10.779 | 04/18/37 | 6,815,146 | |||||||||||||
| 2,000,000 | (a),(b) | Elmwood CLO 26 Ltd, Series 2024 1A, (TSFR3M + 3.600%) | 7.929 | 04/18/37 | 2,014,808 | |||||||||||||
| 1,000,000 | (a),(b) | Invesco US CLO 2023-1 Ltd, Series 2023 1A, (TSFR3M + 6.900%) | 11.232 | 04/22/37 | 1,011,403 | |||||||||||||
| 4,000,000 | (a),(b) | KKR CLO 32 Ltd, Series 2024 32A, (TSFR3M + 5.300%) | 9.618 | 04/15/37 | 4,039,088 | |||||||||||||
| 4,000,000 | (a),(b) | KKR CLO 40 Ltd, Series E 40A, (TSFR3M + 7.250%) | 11.575 | 10/20/34 | 3,953,868 | |||||||||||||
| 5,750,000 | (a),(b) | Magnetite XXXV Ltd, Series 2022 35A, (TSFR3M + 7.250%) | 11.568 | 10/25/36 | 5,813,785 | |||||||||||||
| 3,000,000 | (a),(b) | Neuberger Berman Loan Advisers CLO 24 Ltd, Series 2017 24A, (TSFR3M + 7.000%) | 11.325 | 10/19/38 | 3,084,441 | |||||||||||||
| 4,000,000 | (a),(b) | Neuberger Berman Loan Advisers CLO 55 Ltd, Series 2024 55A, (TSFR3M + 6.500%) | 10.832 | 04/22/38 | 4,065,912 | |||||||||||||
| 1,500,000 | (a),(b) | Neuberger Berman Loan Advisers LaSalle Street Lending CLO II Ltd, Series 2024 2A, (TSFR3M + 7.500%) | 11.825 | 04/20/38 | 1,536,423 | |||||||||||||
| 2,000,000 | (a),(b) | OHA Credit Partners XV Ltd, Series 2017 15A, (TSFR3M + 4.500%) | 8.825 | 04/20/37 | 2,012,964 | |||||||||||||
| 2,500,000 | (a),(b) | RAD CLO 24 Ltd, Series 2024 24A, (TSFR3M + 6.500%) | 10.825 | 07/20/37 | 2,520,763 | |||||||||||||
| 9,250,000 | (a),(b) | Rad CLO 7 Ltd, Series 2020 7A, (TSFR3M + 4.150%) | 8.472 | 04/17/36 | 9,268,158 | |||||||||||||
| 1,300,000 | (a),(b) | REESE PARK CLO LTD, Series 2020 1A, (TSFR3M + 6.000%) | 10.318 | 01/15/38 | 1,307,961 | |||||||||||||
| 1,500,000 | (a),(b) | Sixth Street CLO XXV Ltd, Series 2024 25A, (TSFR3M + 6.000%) | 10.319 | 07/24/37 | 1,520,448 | |||||||||||||
| |
|
|||||||||||||||||
| TOTAL ASSET-BACKED SECURITIES (Cost $65,343,423) |
65,959,583 | |||||||||||||||||
| |
||||||||||||||||||
| SHARES | DESCRIPTION | VALUE | ||||||||||||||||
| |
|
|||||||||||||||||
| COMMON STOCKS - 0.9% (0.5% of Total Investments) | |
|||||||||||||||||
| CONSUMER DISCRETIONARY DISTRIBUTION & RETAIL - 0.0% (0.0% of Total Investments) | |
|||||||||||||||||
| 196 | (d),(e) | Belk Inc | 1,568 | |||||||||||||||
| |
|
|||||||||||||||||
| TOTAL CONSUMER DISCRETIONARY DISTRIBUTION & RETAIL | 1,568 | |||||||||||||||||
| |
||||||||||||||||||
| CONSUMER SERVICES - 0.7% (0.4% of Total Investments) | |
|||||||||||||||||
| 41,905 | (e) | Cengage Learning Holdings II Inc | 984,768 | |||||||||||||||
| 1,225 | (e) | Crown Finance US Inc | 27,294 | |||||||||||||||
| 230,354 | (e) | Crown Finance US Inc | 5,132,517 | |||||||||||||||
| |
|
|||||||||||||||||
| TOTAL CONSUMER SERVICES | 6,144,579 | |||||||||||||||||
| |
||||||||||||||||||
| HEALTH CARE EQUIPMENT & SERVICES - 0.0% (0.0% of Total Investments) | |
|||||||||||||||||
| 211,860 | (d),(e) | Millennium Health LLC | 19,491 | |||||||||||||||
| 198,883 | (d),(e) | Millennium Health LLC | 1,989 | |||||||||||||||
| 242,758 | (e) | Onex Carestream Finance LP | 151,724 | |||||||||||||||
| |
|
|||||||||||||||||
| TOTAL HEALTH CARE EQUIPMENT & SERVICES | 173,204 | |||||||||||||||||
| |
||||||||||||||||||
| MATERIALS - 0.0% (0.0% of Total Investments) | |
|||||||||||||||||
| 89 | LyondellBasell Industries NV, Class A | 5,156 | ||||||||||||||||
| |
|
|||||||||||||||||
| TOTAL MATERIALS | 5,156 | |||||||||||||||||
| |
||||||||||||||||||
| MEDIA & ENTERTAINMENT - 0.1% (0.0% of Total Investments) | |
|||||||||||||||||
| 10,159 | (e) | Catalina Marketing Corp | 330,167 | |||||||||||||||
| |
|
|||||||||||||||||
| TOTAL MEDIA & ENTERTAINMENT | 330,167 | |||||||||||||||||
| |
||||||||||||||||||
| See Notes to Financial Statements | 37 |
Portfolio of Investments July 31, 2025 (continued)
JQC
| SHARES | DESCRIPTION | VALUE | ||||||||||||||||
| |
|
|||||||||||||||||
| SEMICONDUCTORS & SEMICONDUCTOR EQUIPMENT - 0.0% (0.0% of Total Investments) | |
|||||||||||||||||
| 39,129 | (e) | Bright Bidco BV | $ | 9,274 | ||||||||||||||
| 28,645 | (e) | Bright Bidco BV | 6,789 | |||||||||||||||
| |
|
|||||||||||||||||
| TOTAL SEMICONDUCTORS & SEMICONDUCTOR EQUIPMENT | 16,063 | |||||||||||||||||
| |
||||||||||||||||||
| SOFTWARE & SERVICES - 0.1% (0.1% of Total Investments) | |
|||||||||||||||||
| 40,461 | (e) | Avaya Inc | 274,366 | |||||||||||||||
| 96,661 | (e) | Avaya Inc | 655,458 | |||||||||||||||
| |
|
|||||||||||||||||
| TOTAL SOFTWARE & SERVICES | 929,824 | |||||||||||||||||
| |
||||||||||||||||||
| TECHNOLOGY HARDWARE & EQUIPMENT - 0.0% (0.0% of Total Investments) | |
|||||||||||||||||
| 1,069 | (e) | MLN US Holdco LLC | 11 | |||||||||||||||
| |
|
|||||||||||||||||
| TOTAL TECHNOLOGY HARDWARE & EQUIPMENT | 11 | |||||||||||||||||
| |
||||||||||||||||||
| TOTAL COMMON STOCKS (Cost $21,446,916) |
|
7,600,572 | ||||||||||||||||
| |
||||||||||||||||||
| PRINCIPAL | DESCRIPTION | RATE | MATURITY | VALUE | ||||||||||||||
| |
|
|||||||||||||||||
| CORPORATE BONDS - 31.8% (19.3% of Total Investments) | |
|||||||||||||||||
| AUTOMOBILES & COMPONENTS - 0.6% (0.3% of Total Investments) | |
|||||||||||||||||
| $2,000,000 | (b) | Dornoch Debt Merger Sub Inc | 6.625% | 10/15/29 | 1,578,482 | |||||||||||||
| 3,000,000 | (f) | Ford Motor Credit Co LLC | 7.200 | 06/10/30 | 3,156,252 | |||||||||||||
| |
|
|||||||||||||||||
| TOTAL AUTOMOBILES & COMPONENTS | 4,734,734 | |||||||||||||||||
| |
||||||||||||||||||
| CAPITAL GOODS - 2.8% (1.7% of Total Investments) | |
|||||||||||||||||
| 5,175,000 | (b) | Camelot Return Merger Sub Inc | 8.750 | 08/01/28 | 4,741,697 | |||||||||||||
| 2,000,000 | (b) | Chart Industries Inc | 7.500 | 01/01/30 | 2,095,062 | |||||||||||||
| 2,000,000 | (b) | EMRLD Borrower LP / Emerald Co-Issuer Inc | 6.625 | 12/15/30 | 2,039,218 | |||||||||||||
| 3,500,000 | (b),(f) | Husky Injection Molding Systems Ltd / Titan Co-Borrower LLC | 9.000 | 02/15/29 | 3,611,776 | |||||||||||||
| 3,000,000 | (b) | Miter Brands Acquisition Holdco Inc / MIWD Borrower LLC | 6.750 | 04/01/32 | 3,062,955 | |||||||||||||
| 2,963,000 | (f) | TransDigm Inc | 4.625 | 01/15/29 | 2,896,967 | |||||||||||||
| 3,000,000 | (b) | TransDigm Inc | 6.000 | 01/15/33 | 3,014,816 | |||||||||||||
| 2,000,000 | (b),(f) | Windsor Holdings III LLC | 8.500 | 06/15/30 | 2,119,904 | |||||||||||||
| |
|
|||||||||||||||||
| TOTAL CAPITAL GOODS | 23,582,395 | |||||||||||||||||
| |
||||||||||||||||||
| COMMERCIAL & PROFESSIONAL SERVICES - 1.8% (1.1% of Total Investments) | |
|||||||||||||||||
| 3,000,000 | (b),(f) | Allied Universal Holdco LLC | 7.875 | 02/15/31 | 3,145,911 | |||||||||||||
| 1,500,000 | (b) | Allied Universal Holdco LLC/Allied Universal Finance Corp/ Atlas Luxco 4 Sarl | 4.625 | 06/01/28 | 1,459,334 | |||||||||||||
| 4,925,000 | (b),(f) | Boost Newco Borrower LLC | 7.500 | 01/15/31 | 5,207,257 | |||||||||||||
| 2,650,000 | (b),(f) | Prime Security Services Borrower LLC / Prime Finance Inc | 6.250 | 01/15/28 | 2,649,810 | |||||||||||||
| 2,500,000 | (b),(f) | Prime Security Services Borrower LLC / Prime Finance Inc | 3.375 | 08/31/27 | 2,410,112 | |||||||||||||
| |
|
|||||||||||||||||
| TOTAL COMMERCIAL & PROFESSIONAL SERVICES | 14,872,424 | |||||||||||||||||
| |
||||||||||||||||||
| CONSUMER DISCRETIONARY DISTRIBUTION & RETAIL - 1.3% (0.8% of Total Investments) | |
|||||||||||||||||
| 3,900,000 | (b),(f) | Academy Ltd | 6.000 | 11/15/27 | 3,891,753 | |||||||||||||
| 1,500,000 | (b) | Carvana Co, (cash 11.000%, PIK 13.000%) | 9.000 | 06/01/30 | 1,568,952 | |||||||||||||
| 3,945,000 | (b),(f) | Michaels Cos Inc/The | 7.875 | 05/01/29 | 2,616,613 | |||||||||||||
| 1,188,000 | (b),(f) | PetSmart Inc / PetSmart Finance Corp | 4.750 | 02/15/28 | 1,165,819 | |||||||||||||
| 1,850,000 | (b) | Wand NewCo 3 Inc | 7.625 | 01/30/32 | 1,942,446 | |||||||||||||
| |
|
|||||||||||||||||
| TOTAL CONSUMER DISCRETIONARY DISTRIBUTION & RETAIL | 11,185,583 | |||||||||||||||||
| |
||||||||||||||||||
| CONSUMER SERVICES - 1.6% (1.0% of Total Investments) | |
|||||||||||||||||
| 6,617,000 | (b),(f) | 1011778 BC ULC / New Red Finance Inc | 4.000 | 10/15/30 | 6,130,732 | |||||||||||||
| 1,193,000 | (b),(f) | 1011778 BC ULC / New Red Finance Inc | 3.500 | 02/15/29 | 1,128,835 | |||||||||||||
| 3,000,000 | (b),(f) | Caesars Entertainment Inc | 6.500 | 02/15/32 | 3,059,449 | |||||||||||||
| 2,500,000 | (b) | Muvico LLC | 15.000 | 02/19/29 | 2,693,275 | |||||||||||||
| 500,000 | (b) | Premier Entertainment Sub LLC / Premier Entertainment Finance Corp | 5.625 | 09/01/29 | 300,000 | |||||||||||||
| |
|
|||||||||||||||||
| TOTAL CONSUMER SERVICES | 13,312,291 | |||||||||||||||||
| |
||||||||||||||||||
| CONSUMER STAPLES DISTRIBUTION & RETAIL - 0.5% (0.3% of Total Investments) | |
|||||||||||||||||
| 4,000,000 | (b),(f) | Albertsons Cos Inc / Safeway Inc / New Albertsons LP / Albertsons LLC | 4.625 | 01/15/27 | 3,967,583 | |||||||||||||
| |
|
|||||||||||||||||
| TOTAL CONSUMER STAPLES DISTRIBUTION & RETAIL | 3,967,583 | |||||||||||||||||
| |
||||||||||||||||||
| 38 | See Notes to Financial Statements |
| PRINCIPAL | DESCRIPTION | RATE | MATURITY | VALUE | ||||||||||||||
| |
|
|||||||||||||||||
| ENERGY - 1.8% (1.1% of Total Investments) | |
|||||||||||||||||
| $939,207 | (b) | Borr IHC Ltd / Borr Finance LLC | 10.000% | 11/15/28 | $ | 898,017 | ||||||||||||
| 5,000,000 | (b),(f) | DT Midstream Inc | 4.375 | 06/15/31 | 4,759,008 | |||||||||||||
| 1,000,000 | (b) | eG Global Finance PLC | 12.000 | 11/30/28 | 1,104,908 | |||||||||||||
| 2,000,000 | (f) | Expand Energy Corp | 4.750 | 02/01/32 | 1,942,595 | |||||||||||||
| 3,201,000 | (b),(f) | Hilcorp Energy I LP / Hilcorp Finance Co | 6.250 | 11/01/28 | 3,213,359 | |||||||||||||
| 1,201,000 | (b),(f) | MEG Energy Corp | 5.875 | 02/01/29 | 1,201,155 | |||||||||||||
| 2,000,000 | PBF Holding Co LLC / PBF Finance Corp | 6.000 | 02/15/28 | 1,924,719 | ||||||||||||||
| |
|
|||||||||||||||||
| TOTAL ENERGY | 15,043,761 | |||||||||||||||||
| |
||||||||||||||||||
| EQUITY REAL ESTATE INVESTMENT TRUSTS (REITS) - 1.3% (0.8% of Total Investments) | |
|||||||||||||||||
| 5,250,000 | (f) | American Tower Corp | 2.950 | 01/15/51 | 3,302,411 | |||||||||||||
| 2,000,000 | (f) | Crown Castle Inc | 2.250 | 01/15/31 | 1,747,965 | |||||||||||||
| 3,290,000 | (b) | Office Properties Income Trust | 9.000 | 03/31/29 | 3,271,936 | |||||||||||||
| 2,000,000 | (b) | Office Properties Income Trust | 9.000 | 09/30/29 | 1,485,000 | |||||||||||||
| 785,000 | (b) | Uniti Group LP / Uniti Group Finance 2019 Inc / CSL Capital LLC | 10.500 | 02/15/28 | 829,650 | |||||||||||||
| |
|
|||||||||||||||||
| TOTAL EQUITY REAL ESTATE INVESTMENT TRUSTS (REITS) | 10,636,962 | |||||||||||||||||
| |
||||||||||||||||||
| FINANCIAL SERVICES - 0.1% (0.1% of Total Investments) | |
|||||||||||||||||
| 1,000,000 | (b),(f) | LPL Holdings Inc | 4.625 | 11/15/27 | 994,028 | |||||||||||||
| |
|
|||||||||||||||||
| TOTAL FINANCIAL SERVICES | 994,028 | |||||||||||||||||
| |
||||||||||||||||||
| HEALTH CARE EQUIPMENT & SERVICES - 2.2% (1.3% of Total Investments) | |
|||||||||||||||||
| 3,000,000 | (b) | CHS/Community Health Systems Inc | 10.875 | 01/15/32 | 3,145,146 | |||||||||||||
| 1,975,000 | (b),(f) | Mozart Debt Merger Sub Inc | 3.875 | 04/01/29 | 1,883,508 | |||||||||||||
| 5,838,730 | (b) | Team Health Holdings Inc, (cash 9.000%, PIK 4.500%) | 9.000 | 06/30/28 | 6,298,530 | |||||||||||||
| 1,285,000 | (b),(c) | Team Health Holdings Inc | 8.375 | 06/30/28 | 1,291,566 | |||||||||||||
| 5,500,000 | (f) | Tenet Healthcare Corp | 6.125 | 10/01/28 | 5,500,336 | |||||||||||||
| |
|
|||||||||||||||||
| TOTAL HEALTH CARE EQUIPMENT & SERVICES | 18,119,086 | |||||||||||||||||
| |
||||||||||||||||||
| HOUSEHOLD & PERSONAL PRODUCTS - 0.1% (0.1% of Total Investments) | |
|||||||||||||||||
| 1,000,000 | (b) | Kronos Acquisition Holdings Inc | 8.250 | 06/30/31 | 867,449 | |||||||||||||
| |
|
|||||||||||||||||
| TOTAL HOUSEHOLD & PERSONAL PRODUCTS | 867,449 | |||||||||||||||||
| |
||||||||||||||||||
| INSURANCE - 1.4% (0.9% of Total Investments) | |
|||||||||||||||||
| 625,000 | (b),(f) | Alliant Holdings Intermediate LLC / Alliant Holdings Co-Issuer | 4.250 | 10/15/27 | 611,884 | |||||||||||||
| 2,175,000 | (b) | Alliant Holdings Intermediate LLC / Alliant Holdings Co-Issuer | 6.750 | 04/15/28 | 2,204,417 | |||||||||||||
| 6,000,000 | (b),(f) | HUB International Ltd | 7.250 | 06/15/30 | 6,254,616 | |||||||||||||
| 3,000,000 | (b) | Panther Escrow Issuer LLC | 7.125 | 06/01/31 | 3,102,292 | |||||||||||||
| |
|
|||||||||||||||||
| TOTAL INSURANCE | 12,173,209 | |||||||||||||||||
| |
||||||||||||||||||
| MATERIALS - 2.5% (1.5% of Total Investments) | |
|||||||||||||||||
| 3,500,000 | (b),(f) | Ardagh Metal Packaging Finance USA LLC / Ardagh Metal Packaging Finance PLC | 4.000 | 09/01/29 | 3,187,969 | |||||||||||||
| 6,425,000 | (f) | Ball Corp | 6.000 | 06/15/29 | 6,539,230 | |||||||||||||
| 3,000,000 | (b),(f) | Clydesdale Acquisition Holdings Inc | 6.875 | 01/15/30 | 3,067,890 | |||||||||||||
| 4,000,000 | (b),(f) | Herens Holdco Sarl | 4.750 | 05/15/28 | 3,487,202 | |||||||||||||
| 5,000,000 | (b),(f) | Novelis Corp | 4.750 | 01/30/30 | 4,789,529 | |||||||||||||
| |
|
|||||||||||||||||
| TOTAL MATERIALS | 21,071,820 | |||||||||||||||||
| |
||||||||||||||||||
| MEDIA & ENTERTAINMENT - 2.5% (1.5% of Total Investments) | |
|||||||||||||||||
| 1,500,000 | (b) | Advantage Sales & Marketing Inc | 6.500 | 11/15/28 | 1,125,000 | |||||||||||||
| 7,000,000 | (f) | Charter Communications Operating LLC / Charter Communications Operating Capital | 3.500 | 03/01/42 | 4,924,967 | |||||||||||||
| 3,220,000 | (b),(f) | CSC Holdings LLC | 5.500 | 04/15/27 | 3,116,696 | |||||||||||||
| 2,000,000 | (b) | CSC Holdings LLC | 5.375 | 02/01/28 | 1,839,017 | |||||||||||||
| 16,897 | (b) | iHeartCommunications Inc | 9.125 | 05/01/29 | 14,094 | |||||||||||||
| 5,299,000 | (b),(f) | McGraw-Hill Education Inc | 5.750 | 08/01/28 | 5,278,088 | |||||||||||||
| 1,000,000 | (b) | Scripps Escrow II Inc | 3.875 | 01/15/29 | 887,775 | |||||||||||||
| 1,000,000 | (b) | Sinclair Television Group Inc | 8.125 | 02/15/33 | 1,020,010 | |||||||||||||
| 2,000,000 | (b) | Virgin Media Secured Finance PLC | 5.500 | 05/15/29 | 1,955,098 | |||||||||||||
| 801,000 | (b) | VZ Secured Financing BV | 5.000 | 01/15/32 | 704,434 | |||||||||||||
| |
|
|||||||||||||||||
| TOTAL MEDIA & ENTERTAINMENT | 20,865,179 | |||||||||||||||||
| |
||||||||||||||||||
| See Notes to Financial Statements | 39 |
Portfolio of Investments July 31, 2025 (continued)
JQC
| PRINCIPAL | DESCRIPTION | RATE | MATURITY | VALUE | ||||||||||||||
| |
|
|||||||||||||||||
| PHARMACEUTICALS, BIOTECHNOLOGY & LIFE SCIENCES - 0.4% (0.3% of Total Investments) | |
|||||||||||||||||
| $ | 2,000,000 | (f) | Amgen Inc | 3.150% | 02/21/40 | $ | 1,532,774 | |||||||||||
| 1,000,000 | (b) | Organon & Co / Organon Foreign Debt Co‑Issuer BV | 7.875 | 05/15/34 | 895,320 | |||||||||||||
| 1,500,000 | (b),(f) | Organon & Co / Organon Foreign Debt Co‑Issuer BV | 5.125 | 04/30/31 | 1,297,674 | |||||||||||||
| |
|
|||||||||||||||||
| TOTAL PHARMACEUTICALS, BIOTECHNOLOGY & LIFE SCIENCES | 3,725,768 | |||||||||||||||||
| |
||||||||||||||||||
| SOFTWARE & SERVICES - 1.6% (0.9% of Total Investments) | |
|||||||||||||||||
| 2,000,000 | (b) | Condor Merger Sub Inc | 7.375 | 02/15/30 | 1,854,378 | |||||||||||||
| 1,185,000 | (b) | Open Text Holdings Inc | 4.125 | 12/01/31 | 1,078,411 | |||||||||||||
| 3,666,485 | (b) | Rackspace Finance LLC | 3.500 | 05/15/28 | 1,732,414 | |||||||||||||
| 6,750,000 | (b),(f) | Rocket Software Inc | 9.000 | 11/28/28 | 6,965,689 | |||||||||||||
| 1,500,000 | (b),(f) | SS&C Technologies Inc | 5.500 | 09/30/27 | 1,500,327 | |||||||||||||
| |
|
|||||||||||||||||
| TOTAL SOFTWARE & SERVICES | 13,131,219 | |||||||||||||||||
| |
||||||||||||||||||
| TECHNOLOGY HARDWARE & EQUIPMENT - 0.6% (0.4% of Total Investments) | |
|||||||||||||||||
| 1,503,000 | (b),(f) | CommScope LLC | 4.750 | 09/01/29 | 1,459,488 | |||||||||||||
| 2,250,000 | (b) | CommScope Technologies LLC | 5.000 | 03/15/27 | 2,203,288 | |||||||||||||
| 1,750,000 | (b) | Viasat Inc | 7.500 | 05/30/31 | 1,523,738 | |||||||||||||
| |
|
|||||||||||||||||
| TOTAL TECHNOLOGY HARDWARE & EQUIPMENT | 5,186,514 | |||||||||||||||||
| |
||||||||||||||||||
| TELECOMMUNICATION SERVICES - 6.4% (3.9% of Total Investments) | |
|||||||||||||||||
| 1,298,000 | EchoStar Corp, (cash 6.750%, PIK 6.750%) | 6.750 | 11/30/30 | 1,229,855 | ||||||||||||||
| 4,654,000 | EchoStar Corp | 10.750 | 11/30/29 | 4,904,152 | ||||||||||||||
| 6,313,000 | (b),(f) | Frontier Communications Holdings LLC | 5.875 | 10/15/27 | 6,314,143 | |||||||||||||
| 2,000,000 | (f) | Frontier Communications Holdings LLC | 5.875 | 11/01/29 | 2,016,688 | |||||||||||||
| 1,978,000 | (b),(f) | Frontier Communications Holdings LLC | 6.000 | 01/15/30 | 2,001,516 | |||||||||||||
| 1,500,000 | (b) | Frontier Communications Holdings LLC | 8.625 | 03/15/31 | 1,589,097 | |||||||||||||
| 1,500,000 | (b),(f) | Iliad Holding SASU | 7.000 | 10/15/28 | 1,522,493 | |||||||||||||
| 1,000,000 | (b) | Level 3 Financing Inc | 4.875 | 06/15/29 | 937,500 | |||||||||||||
| 3,250,000 | (b) | Level 3 Financing Inc | 4.000 | 04/15/31 | 2,795,000 | |||||||||||||
| 1,000,000 | (b) | Lumen Technologies Inc | 10.000 | 10/15/32 | 1,011,250 | |||||||||||||
| 4,000,000 | (f) | T‑Mobile USA Inc | 3.500 | 04/15/31 | 3,749,781 | |||||||||||||
| 5,180,000 | (b),(f) | Vmed O2 UK Financing I PLC | 4.250 | 01/31/31 | 4,719,661 | |||||||||||||
| 15,089,000 | (b),(f) | Zayo Group Holdings Inc | 4.000 | 03/01/27 | 14,332,650 | |||||||||||||
| 6,995,000 | (b) | Ziggo BV | 4.875 | 01/15/30 | 6,461,778 | |||||||||||||
| |
|
|||||||||||||||||
| TOTAL TELECOMMUNICATION SERVICES | 53,585,564 | |||||||||||||||||
| |
||||||||||||||||||
| TRANSPORTATION - 0.4% (0.2% of Total Investments) | |
|||||||||||||||||
| 1,975,000 | (f) | Delta Air Lines Inc | 3.750 | 10/28/29 | 1,890,383 | |||||||||||||
| 1,623,000 | (b),(f) | United Airlines Inc | 4.625 | 04/15/29 | 1,584,884 | |||||||||||||
| |
|
|||||||||||||||||
| TOTAL TRANSPORTATION | 3,475,267 | |||||||||||||||||
| |
||||||||||||||||||
| UTILITIES - 1.9% (1.1% of Total Investments) | |
|||||||||||||||||
| 1,940,000 | (f) | Pacific Gas and Electric Co | 4.550 | 07/01/30 | 1,902,402 | |||||||||||||
| 2,000,000 | (f) | Pacific Gas and Electric Co | 4.500 | 07/01/40 | 1,689,040 | |||||||||||||
| 6,318,000 | (f) | PG&E Corp | 5.000 | 07/01/28 | 6,164,308 | |||||||||||||
| 3,000,000 | (f) | PG&E Corp | 5.250 | 07/01/30 | 2,877,617 | |||||||||||||
| 3,000,000 | (b) | Talen Energy Supply LLC | 8.625 | 06/01/30 | 3,188,010 | |||||||||||||
| |
|
|||||||||||||||||
| TOTAL UTILITIES | 15,821,377 | |||||||||||||||||
| |
|
|||||||||||||||||
| TOTAL CORPORATE BONDS (Cost $256,641,650) |
266,352,213 | |||||||||||||||||
| |
|
|||||||||||||||||
| PRINCIPAL | DESCRIPTION | RATE | MATURITY | VALUE | ||||||||||||||
| |
|
|||||||||||||||||
| VARIABLE RATE SENIOR LOAN INTERESTS - 117.1% (71.1% of Total Investments) | |
|||||||||||||||||
| AUTOMOBILES & COMPONENTS - 0.9% (0.5% of Total Investments) | |
|||||||||||||||||
| 3,907,608 | (a) | Clarios Global LP, Term Loan B, (TSFR1M + 2.500%) | 6.856 | 05/06/30 | 3,913,470 | |||||||||||||
| 1,875,000 | (a) | Clarios Global LP, Term Loan B, (TSFR1M + 2.750%) | 7.106 | 01/28/32 | 1,877,728 | |||||||||||||
| 1,528,052 | (a) | DexKo Global Inc., Term Loan B, (TSFR1M + 3.750%) | 8.221 | 10/04/28 | 1,460,680 | |||||||||||||
| |
|
|||||||||||||||||
| TOTAL AUTOMOBILES & COMPONENTS | 7,251,878 | |||||||||||||||||
| |
||||||||||||||||||
| CAPITAL GOODS - 8.4% (5.1% of Total Investments) | |
|||||||||||||||||
| 1,279,554 | (a) | ACProducts, Inc., Term Loan B, (TSFR3M + 4.250%) | 8.807 | 05/17/28 | 971,264 | |||||||||||||
| 134,615 | (a),(g) | Air Comm Corporation, LLC, Delayed Draw Term Loan, (N/A + TSFR3M + 1.875%) | 4.029 | 12/11/31 | 134,952 | |||||||||||||
| 1,611,346 | (a) | Air Comm Corporation, LLC, Term Loan, (TSFR3M + 3.000%) | 7.300 | 12/11/31 | 1,615,375 | |||||||||||||
| 1,462,197 | (a) | Archkey Solutions LLC, Term Loan B, (TSFR3M + 4.750%) | 9.046 | 11/03/31 | 1,473,171 | |||||||||||||
| 40 | See Notes to Financial Statements |
| PRINCIPAL | DESCRIPTION | RATE | MATURITY | VALUE | ||||||||||||||
| |
|
|||||||||||||||||
| CAPITAL GOODS (continued) | |
|||||||||||||||||
| $ 992,500 | (a) | Azorra Soar TLB Finance Ltd, Term Loan B, (TSFR3M + 3.500%) | 7.818% | 10/18/29 | $ | 996,535 | ||||||||||||
| 1,662,833 | (a) | Barnes Group Inc, Term Loan B, (TSFR1M + 3.000%) | 7.356 | 01/27/32 | 1,666,990 | |||||||||||||
| 2,240,000 | (a) | Centuri Group, Inc, Term Loan B, (TSFR1M + 2.250%) | 6.606 | 07/01/32 | 2,248,053 | |||||||||||||
| 5,091,587 | (a) | Chamberlain Group Inc, Term Loan B, (TSFR1M + 3.250%) | 7.706 | 11/03/28 | 5,099,938 | |||||||||||||
| 500,000 | (a),(c) | Chariot Buyer LLC, (TBD) | TBD | TBD | 500,415 | |||||||||||||
| 1,182,118 | (a) | Chart Industries, Inc., Term Loan B, (TSFR3M + 2.500%) | 6.792 | 03/18/30 | 1,188,767 | |||||||||||||
| 703,346 | (a) | Conair Holdings, LLC, Term Loan B, (TSFR1M + 3.750%) | 8.221 | 05/17/28 | 523,114 | |||||||||||||
| 7,633,287 | (a) | Core & Main LP, Term Loan B, (TSFR6M + 2.000%) | 6.270 | 07/27/28 | 7,668,247 | |||||||||||||
| 1,538,064 | (a) | Cornerstone Building Brands, Inc., Term Loan B, (TSFR1M + 3.250%) | 7.692 | 04/12/28 | 1,410,636 | |||||||||||||
| 437,000 | (a) | CP Atlas Buyer, Inc., Term Loan, (TSFR1M + 5.250%) | 9.606 | 07/08/30 | 419,302 | |||||||||||||
| 750,000 | (a) | DG Investment Intermediate Holdings 2, Inc., Term Loan, (TSFR1M + 3.750%) | 8.098 | 07/12/32 | 753,049 | |||||||||||||
| 1,945,300 | (a) | Gates Global LLC, Term Loan B5, (TSFR1M + 1.750%) | 6.106 | 06/04/31 | 1,944,901 | |||||||||||||
| 431,034 | (a),(g) | Kaman Corporation, Delayed Draw Term Loan, (N/A + TSFR3M + 1.875%) | 4.039 | 02/26/32 | 431,707 | |||||||||||||
| 4,568,966 | (a) | Kaman Corporation, Term Loan B, (TSFR3M + 2.750%) | 7.083 | 02/26/32 | 4,576,093 | |||||||||||||
| 1,978,197 | (a) | Madison IAQ LLC, Term Loan, (TSFR6M + 2.500%) | 6.702 | 06/21/28 | 1,981,689 | |||||||||||||
| 803,925 | (a) | Madison Safety & Flow LLC, Term Loan B, (TSFR1M + 2.750%) | 7.108 | 09/26/31 | 808,447 | |||||||||||||
| 406,000 | (a) | Minimax Viking GmbH, Term Loan B, (TSFR1M + 2.250%) | 6.606 | 03/17/32 | 408,412 | |||||||||||||
| 1,344,313 | (a),(h) | Oregon Tool, Inc., 2nd Lien Term Loan, (TSFR3M + 4.000%) | 8.586 | 10/15/29 | 1,109,482 | |||||||||||||
| 661,000 | (a),(h) | Oregon Tool, Inc., First Lien Term Loan, (TSFR3M + 5.350%) | 9.674 | 10/15/29 | 675,251 | |||||||||||||
| 2,143,628 | (a) | Quikrete Holdings, Inc., Term Loan B, (TSFR1M + 2.250%) | 6.606 | 01/31/32 | 2,144,431 | |||||||||||||
| 9,036,501 | (a) | Quikrete Holdings, Inc., Term Loan B1, (TSFR1M + 2.250%) | 6.606 | 04/14/31 | 9,040,884 | |||||||||||||
| 1,167,333 | (a) | QXO Inc, Term Loan B, (TSFR3M + 3.000%) | 7.296 | 04/30/32 | 1,178,773 | |||||||||||||
| 1,054,156 | (a) | Titan Acquisition Limited, Term Loan B, (TSFR3M + TSFR6M + 4.500%) | 8.731 | 02/15/29 | 1,055,663 | |||||||||||||
| 7,544,760 | (a) | TK Elevator Midco GmbH, Term Loan B, (TSFR6M + 3.000%) | 7.197 | 04/30/30 | 7,594,744 | |||||||||||||
| 1,227,723 | (a) | TransDigm, Inc., Term Loan, (TSFR3M + 2.500%) | 6.796 | 01/20/32 | 1,232,627 | |||||||||||||
| 7,062,489 | (a) | TransDigm, Inc., Term Loan J, (TSFR3M + 2.500%) | 6.796 | 02/28/31 | 7,091,339 | |||||||||||||
| 1,915,850 | (a) | TransDigm, Inc., Term Loan K, (TSFR3M + 2.750%) | 7.046 | 03/22/30 | 1,924,911 | |||||||||||||
| 620,792 | (a) | Victory Buyer LLC, Term Loan, (TSFR1M + 3.750%) | 8.221 | 11/20/28 | 622,291 | |||||||||||||
| |
|
|||||||||||||||||
| TOTAL CAPITAL GOODS | 70,491,453 | |||||||||||||||||
| |
||||||||||||||||||
| COMMERCIAL & PROFESSIONAL SERVICES - 5.5% (3.3% of Total Investments) | |
|||||||||||||||||
| 5,223,498 | (a) | Allied Universal Holdco LLC, Incremental Term Loan B, (TSFR1M + 3.750%) | 8.206 | 05/15/28 | 5,240,762 | |||||||||||||
| 1,276,762 | (a) | Amentum Government Services Holdings LLC, Term Loan B, (TSFR1M + 2.250%) | 6.606 | 09/29/31 | 1,278,997 | |||||||||||||
| 465,832 | (a) | American Auto Auction Group, LLC, Term Loan, (TSFR3M + 4.500%) | 8.830 | 05/28/32 | 470,782 | |||||||||||||
| 1,602,515 | (a) | Anticimex International AB, Term Loan B1, (SOFR90A + 3.400%) | 7.660 | 11/16/28 | 1,608,949 | |||||||||||||
| 1,367,562 | (a) | Anticimex International AB, Term Loan B6, (SOFR90A + 3.400%) | 7.660 | 11/16/28 | 1,373,832 | |||||||||||||
| 169,138 | (a),(g) | Archkey Solutions LLC, Delayed Draw Term Loan B | 4.750 | 11/03/31 | 170,407 | |||||||||||||
| 619,547 | (a) | CHG Healthcare Services Inc., Term Loan B1, (TSFR3M + 3.000%) | 7.333 | 09/29/28 | 620,030 | |||||||||||||
| 3,335,395 | (a) | Creative Artists Agency, LLC , First Lien Term Loan B, (TSFR1M + 2.500%) | 6.856 | 10/01/31 | 3,342,699 | |||||||||||||
| 1,146,545 | (a) | Dun & Bradstreet Corporation (The), Term Loan, (TSFR1M + 2.250%) | 6.603 | 01/18/29 | 1,147,365 | |||||||||||||
| 2,804,449 | (a) | Ensemble RCM, LLC, Term Loan B, (TSFR3M + 3.000%) | 7.308 | 08/01/29 | 2,820,617 | |||||||||||||
| 1,238,294 | (a) | First Advantage Holdings, LLC, Term Loan B, (TSFR1M + 2.750%) | 7.108 | 10/31/31 | 1,244,361 | |||||||||||||
| 9,113,204 | (a) | Garda World Security Corporation, Term Loan B, (TSFR1M + 3.000%) | 7.343 | 02/01/29 | 9,125,279 | |||||||||||||
| 800,000 | (a) | GFL Environmental Inc., Term Loan B, (TSFR3M + 2.500%) | 6.824 | 03/03/32 | 802,000 | |||||||||||||
| 1,559,280 | (a) | OMNIA Partners LLC, Term Loan B, (TSFR3M + 2.500%) | 6.814 | 07/25/30 | 1,564,433 | |||||||||||||
| 1,493,731 | (a) | Prime Security Services Borrower, LLC, First Lien Term Loan B, (TSFR6M + 2.000%) | 6.129 | 10/15/30 | 1,495,285 | |||||||||||||
| 2,166,049 | (a) | Reworld Holding Corp, Term Loan B, (TSFR1M + 2.250%) | 6.590 | 11/30/28 | 2,171,464 | |||||||||||||
| 167,247 | (a) | Reworld Holding Corp, Term Loan C, (TSFR1M + 2.250%) | 6.590 | 11/30/28 | 167,666 | |||||||||||||
| 1,908,801 | (a),(h) | West Corporation, Term Loan B3, (TSFR3M + 4.000%) | 8.558 | 04/12/27 | 1,033,740 | |||||||||||||
| See Notes to Financial Statements | 41 |
Portfolio of Investments July 31, 2025 (continued)
JQC
| PRINCIPAL | DESCRIPTION | RATE | MATURITY | VALUE | ||||||||||||||
| |
|
|||||||||||||||||
| COMMERCIAL & PROFESSIONAL SERVICES (continued) | |
|||||||||||||||||
| $ | 852,863 | (a) | WIN Waste Innovations Holdings, Inc., Incremental Term Loan, (TSFR1M + 3.750%) | 8.221% | 03/27/28 | $ | 859,685 | |||||||||||
| 7,431,370 | (a) | WIN Waste Innovations Holdings, Inc., Term Loan B, (TSFR1M + 2.750%) | 7.221 | 03/27/28 | 7,438,913 | |||||||||||||
| 1,717,025 | (a) | XPLOR T1 LLC, Term Loan B, (TSFR3M + 3.500%) | 7.796 | 06/24/31 | 1,725,610 | |||||||||||||
| |
|
|||||||||||||||||
| TOTAL COMMERCIAL & PROFESSIONAL SERVICES | 45,702,876 | |||||||||||||||||
| |
||||||||||||||||||
| CONSUMER DISCRETIONARY DISTRIBUTION & RETAIL - 4.2% (2.6% of Total Investments) | |
|||||||||||||||||
| 381,719 | (a) | Academy, Ltd., Term Loan, (TSFR1M + 3.750%) | 8.193 | 11/08/27 | 381,719 | |||||||||||||
| 2,628,140 | (a) | Belron Finance LLC, Term Loan B, (TSFR3M + 2.750%) | 7.049 | 10/16/31 | 2,643,580 | |||||||||||||
| 4,550,141 | (a) | CNT Holdings I Corp, Term Loan, (TSFR3M + 2.250%) | 6.558 | 11/08/32 | 4,563,791 | |||||||||||||
| 717,526 | (a) | Gulfside Supply Inc, Term Loan B, (TSFR3M + 3.000%) | 7.296 | 06/17/31 | 721,415 | |||||||||||||
| 1,121,525 | (a) | Johnstone Supply LLC, Term Loan B, (TSFR1M + 2.500%) | 6.851 | 06/09/31 | 1,123,527 | |||||||||||||
| 687,141 | (a) | Kodiak Building Partners Inc., Term Loan B, (TSFR3M + 3.750%) | 8.041 | 12/04/31 | 666,097 | |||||||||||||
| 1,899,309 | (a),(h) | LBM Acquisition LLC, Incremental Term Loan B, (TSFR1M + 3.750%) | 8.190 | 06/06/31 | 1,779,719 | |||||||||||||
| 2,461,693 | (a) | LBM Acquisition LLC, Term Loan B, (TSFR1M + 3.750%) | 8.206 | 12/20/27 | 2,457,496 | |||||||||||||
| 1,050,425 | (a) | Les Schwab Tire Centers, Term Loan B, (TSFR1M + TSFR3M + 2.500%) | 6.844 | 04/23/31 | 1,052,394 | |||||||||||||
| 5,000,176 | (a),(h) | Michaels Companies, Inc., Term Loan B, (TSFR3M + 4.250%) | 8.807 | 04/17/28 | 4,264,000 | |||||||||||||
| 493,924 | (a) | Mister Car Wash Holdings, Inc., Term Loan B, (TSFR1M + 2.500%) | 6.856 | 03/27/31 | 495,290 | |||||||||||||
| 1,122,000 | (a) | Petco Health and Wellness Company, Inc., Term Loan B, (TSFR3M + 3.250%) | 7.807 | 03/06/28 | 1,051,247 | |||||||||||||
| 7,135,745 | (a),(f) | PetSmart, Inc., Term Loan B, (TSFR1M + 3.750%) | 8.206 | 02/14/28 | 7,131,286 | |||||||||||||
| 2,714,829 | (a) | Restoration Hardware, Inc., Term Loan B, (TSFR1M + 2.500%) | 6.971 | 10/20/28 | 2,630,683 | |||||||||||||
| 3,522,078 | (a) | Wand NewCo 3, Inc., Repriced Term Loan B, (TSFR1M + 2.500%) |
6.856 | 01/30/31 | 3,518,767 | |||||||||||||
| 1,159,175 | (a) | White Cap Buyer LLC, Term Loan B, (TSFR1M + 3.250%) | 7.577 | 10/29/29 | 1,158,949 | |||||||||||||
| |
|
|||||||||||||||||
| TOTAL CONSUMER DISCRETIONARY DISTRIBUTION & RETAIL | |
35,639,960 | ||||||||||||||||
| |
||||||||||||||||||
| CONSUMER DURABLES & APPAREL - 3.8% (2.3% of Total Investments) | |
|||||||||||||||||
| 3,555,987 | (a) | ABG Intermediate Holdings 2 LLC, First Lien Term Loan B, (TSFR1M + 2.250%) | 6.606 | 12/21/28 | 3,553,764 | |||||||||||||
| 7,968,533 | (a) | AI Aqua Merger Sub, Inc., First Lien Term Loan B, (TSFR1M + 3.000%) | 7.322 | 07/31/28 | 7,973,713 | |||||||||||||
| 7,188,198 | (a) | Hayward Industries, Inc., Term Loan, (TSFR1M + 2.500%) | 6.971 | 05/30/28 | 7,215,154 | |||||||||||||
| 6,212 | (a) | Serta Simmons Bedding, LLC, New Term Loan, (TSFR3M + 7.500%) | 11.910 | 06/29/28 | 5,808 | |||||||||||||
| 2,098,491 | (a) | Somnigroup International Inc, Term Loan B, (TSFR1M + 2.250%) | 6.550 | 10/24/31 | 2,106,360 | |||||||||||||
| 2,620,512 | (a) | Topgolf Callaway Brands Corp., Term Loan B, (TSFR1M + 3.000%) | 7.356 | 03/18/30 | 2,593,075 | |||||||||||||
| 1,740,637 | (a) | Varsity Brands, Inc., Term Loan, (TSFR3M + 3.250%) | 7.580 | 08/26/31 | 1,747,383 | |||||||||||||
| 153,414 | (a) | Weber-Stephen Products LLC, Incremental Term Loan B, (TSFR1M + 4.250%) | 8.706 | 10/29/27 | 153,510 | |||||||||||||
| 5,034,993 | (a) | Weber-Stephen Products LLC, Term Loan B, (TSFR1M + 3.250%) | 7.721 | 10/29/27 | 5,038,945 | |||||||||||||
| 1,510,000 | (a) | WH Borrower, LLC, Term Loan B, (TSFR3M + 4.750%) | 9.072 | 02/20/32 | 1,512,008 | |||||||||||||
| |
|
|||||||||||||||||
| TOTAL CONSUMER DURABLES & APPAREL | 31,899,720 | |||||||||||||||||
| |
||||||||||||||||||
| CONSUMER SERVICES - 12.3% (7.5% of Total Investments) | ||||||||||||||||||
| 8,471,777 | (a) | 101B.C. Unlimited Liability Company, Term Loan B6, (TSFR1M + 1.750%) | 6.106 | 09/23/30 | 8,463,178 | |||||||||||||
| 816,781 | (a) | Allwyn Entertainment Financing US LLC, Term Loan B, (TSFR3M + 2.000%) | 6.329 | 06/11/31 | 814,400 | |||||||||||||
| 1,620,069 | (a) | Alterra Mountain Company, Term Loan B8, (TSFR1M + 2.500%) | 6.853 | 05/31/30 | 1,626,824 | |||||||||||||
| 3,472,518 | (a) | Alterra Mountain Company, Term Loan B9, (TSFR1M + 2.500%) | 6.853 | 08/17/28 | 3,489,898 | |||||||||||||
| 3,792,197 | (a) | Caesars Entertainment Inc., Term Loan B, (TSFR1M + 2.250%) | 6.606 | 02/06/30 | 3,794,965 | |||||||||||||
| 1,913,281 | (a) | Caesars Entertainment Inc., Term Loan B1, (TSFR1M + 2.250%) | 6.606 | 02/06/31 | 1,913,520 | |||||||||||||
| 1,445,000 | (a) | Catawba Nation Gaming Authority, Term Loan B, (TSFR3M + 4.750%) | 9.046 | 03/29/32 | 1,475,706 | |||||||||||||
| 3,246,857 | (a) | Churchill Downs Incorporated, Incremental Term Loan B1, (TSFR1M + 1.750%) | 6.106 | 03/17/28 | 3,253,611 | |||||||||||||
| 42 | See Notes to Financial Statements |
| PRINCIPAL | DESCRIPTION | RATE | MATURITY | VALUE | ||||||||||||||
| |
|
|||||||||||||||||
| CONSUMER SERVICES (continued) | ||||||||||||||||||
| $ | 1,955,349 | (a) | Cinemark USA, Inc., Term Loan B, (TSFR1M + TSFR3M + 2.250%) | 6.576% | 05/24/30 | $ | 1,965,859 | |||||||||||
| 4,880,475 | (a) | Crown Finance US, Inc., Term Loan B, (TSFR1M + 4.500%) | 8.829 | 12/02/31 | 4,870,299 | |||||||||||||
| 2,456,668 | (a) | Delta 2 (LUX) S.a.r.l., Term Loan B1, (TSFR3M + 2.000%) | 6.296 | 09/19/31 | 2,460,759 | |||||||||||||
| 1,228,332 | (a) | Delta 2 (LUX) S.a.r.l., Term Loan B2, (TSFR3M + 2.000%) | 6.291 | 09/19/31 | 1,230,377 | |||||||||||||
| 2,798,447 | (a) | Element Materials Technology Group US Holdings Inc., Term Loan, (TSFR3M + 3.750%) | 8.046 | 06/25/29 | 2,810,103 | |||||||||||||
| 10,303,928 | (a) | Fertitta Entertainment, LLC, Term Loan B, (TSFR1M + 3.250%) | 7.601 | 01/29/29 | 10,324,279 | |||||||||||||
| 9,850,000 | (a) | Flutter Financing B.V., Term Loan B, (TSFR3M + 1.750%) | 6.046 | 11/29/30 | 9,832,763 | |||||||||||||
| 1,175,000 | (a),(h) | Flutter Financing B.V., Term Loan B, (TSFR3M + 2.000%) | 6.296 | 06/04/32 | 1,176,956 | |||||||||||||
| 1,610,095 | (a) | GBT US III LLC, Term Loan B, (TSFR3M + 2.500%) | 6.814 | 07/28/31 | 1,617,042 | |||||||||||||
| 3,075,270 | (a) | GVC Holdings (Gibraltar) Limited, Term Loan B3, (TSFR6M + 2.750%) | 7.016 | 10/31/29 | 3,084,250 | |||||||||||||
| 750,000 | (a) | Herschend Entertainment Company, LLC, Term Loan B, (TSFR1M + 3.250%) | 7.603 | 05/27/32 | 757,421 | |||||||||||||
| 3,231,412 | (a) | Hilton Domestic Operating Company, Inc., Term Loan B4, (TSFR1M + 1.750%) | 6.102 | 11/08/30 | 3,242,399 | |||||||||||||
| 1,238,502 | (a) | Hilton Grand Vacations Borrower LLC, Term Loan B, (TSFR1M + 2.000%) | 6.356 | 08/02/28 | 1,239,450 | |||||||||||||
| 10,107,615 | (a) | IRB Holding Corp, First Lien Term Loan B, (TSFR1M + 2.500%) | 6.856 | 12/15/27 | 10,116,257 | |||||||||||||
| 4,632,050 | (a) | Light and Wonder International, Inc., Term Loan B2, (TSFR1M + 2.250%) | 6.593 | 04/16/29 | 4,648,262 | |||||||||||||
| 324,291 | (a) | Motion Finco Sarl, Term Loan B, (TSFR3M + 3.500%) | 7.796 | 11/30/29 | 298,985 | |||||||||||||
| 1,800,563 | (a) | PENN Entertainment, Inc., Term Loan B, (TSFR1M + 2.500%) | 6.856 | 05/03/29 | 1,808,152 | |||||||||||||
| 2,594,930 | (a) | PG Investment Company 59 S.a r.l., Term Loan B, (TSFR3M + 2.750%) | 7.046 | 03/24/31 | 2,606,607 | |||||||||||||
| 6,278,546 | (a) | Scientific Games Holdings LP, Term Loan B, (TSFR3M + 3.000%) | 7.286 | 04/04/29 | 6,283,066 | |||||||||||||
| 2,989,741 | (a) | SeaWorld Parks & Entertainment, Inc., Term Loan B3, (TSFR1M + 2.000%) | 6.356 | 12/04/31 | 2,992,237 | |||||||||||||
| 5,706,262 | (a),(h) | Spin Holdco Inc., Term Loan, (TSFR3M + 4.000%) | 8.577 | 03/06/28 | 5,060,742 | |||||||||||||
| |
|
|||||||||||||||||
| TOTAL CONSUMER SERVICES | 103,258,367 | |||||||||||||||||
| |
||||||||||||||||||
| CONSUMER STAPLES DISTRIBUTION & RETAIL - 0.1% (0.1% of Total Investments) | |
|||||||||||||||||
| 625,000 | (a),(c) | Boots Group Finco LP, (TBD) | TBD | TBD | 625,394 | |||||||||||||
| |
|
|||||||||||||||||
| TOTAL CONSUMER STAPLES DISTRIBUTION & RETAIL | 625,394 | |||||||||||||||||
| |
||||||||||||||||||
| ENERGY - 1.6% (1.0% of Total Investments) | ||||||||||||||||||
| 2,164,910 | (a) | EG Group Limited, Term Loan B, (TSFR3M + 4.250%) | 8.560 | 02/07/28 | 2,175,291 | |||||||||||||
| 930,833 | (a) | Epic Crude Services, LP, Term Loan B, (TSFR3M + 2.500%) | 6.828 | 10/15/31 | 937,065 | |||||||||||||
| 3,640,958 | (a) | Freeport LNG Investments, LLLP, Term Loan A, (TSFR3M + 3.000%) | 7.587 | 11/16/26 | 3,640,958 | |||||||||||||
| 1,245,000 | (a) | New Fortress Energy Inc, Incremental Term Loan B, (TSFR3M + 5.500%) | 9.807 | 10/30/28 | 583,594 | |||||||||||||
| 2,887,619 | (a) | Oryx Midstream Services Permian Basin LLC, Term Loan B, (TSFR1M + 2.250%) | 6.603 | 10/05/28 | 2,895,733 | |||||||||||||
| 2,895,000 | (a) | TransMontaigne Operating Company L.P., Term Loan B, (TSFR1M + 3.250%) | 7.606 | 11/17/28 | 2,908,795 | |||||||||||||
| |
|
|||||||||||||||||
| TOTAL ENERGY | 13,141,436 | |||||||||||||||||
| |
||||||||||||||||||
| FINANCIAL SERVICES - 1.8% (1.1% of Total Investments) | ||||||||||||||||||
| 750,000 | (a),(c) | AAL Delaware Holdco, Inc., Term Loan, (TBD) | TBD | TBD | 752,460 | |||||||||||||
| 676,404 | (a) | AqGen Island Holdings, Inc., Term Loan B, (TSFR1M + 3.000%) | 7.356 | 08/02/28 | 677,912 | |||||||||||||
| 409,557 | (a) | Aragorn Parent Corporation, Repriced Term Loan B, (TSFR1M + 3.500%) | 7.856 | 12/15/28 | 413,226 | |||||||||||||
| 1,810,000 | (a),(c) | Beach Acquisition Bidco LLC, (TBD) | TBD | TBD | 1,823,575 | |||||||||||||
| 3,335,000 | (a),(c) | Colossus Acquireco LLC, (TBD) | TBD | TBD | 3,321,310 | |||||||||||||
| 1,371,562 | (a) | Dechra Pharmaceuticals Holdings Ltd, Term Loan B, (TSFR6M + 3.250%) | 7.447 | 01/27/32 | 1,377,906 | |||||||||||||
| 3,020,507 | (a),(d),(i) | Ditech Holding Corporation, Term Loan | 0.000 | 06/30/27 | 302 | |||||||||||||
| 535,957 | (a) | Kestra Advisor Services Holdings A, Inc., Repriced Term Loan, (TSFR1M + 3.000%) | 7.356 | 03/24/31 | 537,018 | |||||||||||||
| 833,000 | (a),(c) | Orion US Finco, (TBD) | TBD | TBD | 837,861 | |||||||||||||
| 1,500,000 | (a),(c) | Priority Holdings LLC, (TBD) | TBD | TBD | 1,502,812 | |||||||||||||
| 575,000 | (a) | Shift4 Payments, LLC, Term Loan, (TSFR3M + 2.750%) | 7.078 | 07/06/32 | 579,433 | |||||||||||||
| See Notes to Financial Statements | 43 |
Portfolio of Investments July 31, 2025 (continued)
JQC
| PRINCIPAL | DESCRIPTION | RATE | MATURITY | VALUE | ||||||||||||||
| |
|
|||||||||||||||||
| FINANCIAL SERVICES (continued) | ||||||||||||||||||
| $ | 2,892,475 | (a) | Trans Union, LLC, Term Loan B8, (TSFR1M + 1.750%) | 6.106% | 06/24/31 | $ | 2,898,622 | |||||||||||
| |
|
|||||||||||||||||
| TOTAL FINANCIAL SERVICES | 14,722,437 | |||||||||||||||||
| |
||||||||||||||||||
| FOOD, BEVERAGE & TOBACCO - 2.4% (1.4% of Total Investments) | |
|||||||||||||||||
| 1,692,610 | (a) | CHG PPC Parent LLC, Term Loan, (TSFR1M + 3.000%) | 7.471 | 12/08/28 | 1,697,909 | |||||||||||||
| 771,288 | (a) | City Brewing Company, LLC, First Out New Money Term Loan, (TSFR3M + 6.250%) | 10.506 | 04/05/28 | 212,104 | |||||||||||||
| 2,018,309 | (a) | City Brewing Company, LLC, FLFO Roll Up Term Loan, (TSFR3M + 3.500%) | 8.018 | 04/05/28 | 555,035 | |||||||||||||
| 204,595 | (a) | City Brewing Company, LLC, PIK Super Priority Term Loan, (TSFR3M + 9.000%), (cash 13.585%, PIK 7.500%) | 13.585 | 01/03/26 | 194,365 | |||||||||||||
| 1,910,212 | (a) | Froneri Lux Finco Sarl, Term Loan B4, (TSFR6M + 2.000%) | 6.197 | 09/30/31 | 1,897,672 | |||||||||||||
| 2,390,000 | (a),(c) | Froneri US Inc, (TBD) | TBD | TBD | 2,388,064 | |||||||||||||
| 1,422,000 | (a) | Naked Juice LLC, FLFO Term Loan, (TSFR3M + 5.500%) | 9.796 | 01/24/29 | 1,419,334 | |||||||||||||
| 4,754,128 | (a) | Pegasus BidCo BV, Term Loan B, (TSFR3M + 3.250%) | 7.576 | 07/12/29 | 4,775,925 | |||||||||||||
| 64,655 | (a),(g) | Sauer Brands Inc, Delayed Draw Term Loan, (TSFR3M + 1.625%) | 1.625 | 02/19/32 | 65,059 | |||||||||||||
| 685,345 | (a) | Sauer Brands Inc, Term Loan B, (TSFR1M + 3.250%) | 7.606 | 02/19/32 | 689,628 | |||||||||||||
| 1,160,000 | (a) | Sazerac Company, Inc., Term Loan B, (TSFR3M + 2.500%) | 6.825 | 07/09/32 | 1,165,440 | |||||||||||||
| 1,514,700 | (a) | Sycamore Buyer LLC, Term Loan B, (TSFR1M + 2.250%) | 6.602 | 05/21/32 | 1,520,380 | |||||||||||||
| 3,261,177 | (a) | Triton Water Holdings, Inc, Term Loan B, (TSFR3M + 2.250%) | 6.546 | 03/31/28 | 3,272,510 | |||||||||||||
| |
|
|||||||||||||||||
| TOTAL FOOD, BEVERAGE & TOBACCO | 19,853,425 | |||||||||||||||||
| |
||||||||||||||||||
| HEALTH CARE EQUIPMENT & SERVICES - 15.0% (9.1% of Total Investments) | |
|||||||||||||||||
| 702,966 | (a) | ADMI Corp., Term Loan B5, (TSFR1M + 5.750%) | 10.106 | 12/23/27 | 682,228 | |||||||||||||
| 4,319,445 | (a) | AHP Health Partners, Inc., Term Loan B, (TSFR1M + 2.750%) | 7.106 | 08/24/28 | 4,332,943 | |||||||||||||
| 2,947,622 | (a) | Bausch & Lomb Corporation, Term Loan B, (TSFR1M + 4.250%) | 8.606 | 01/15/31 | 2,963,834 | |||||||||||||
| 2,837,927 | (a) | EyeCare Partners, LLC, Second Out Term Loan B, (TSFR3M + TSFR6M + 2.305%), (cash 5.227%, PIK 3.610%) | 4.419 | 11/30/28 | 2,254,378 | |||||||||||||
| 4,874,756 | (a) | Gainwell Acquisition Corp., Term Loan B, (TSFR3M + 4.000%) | 8.396 | 10/01/27 | 4,815,357 | |||||||||||||
| 12,495,465 | (a) | Global Medical Response, Inc., PIK Term Loan, (TSFR3M + 2.750%), (cash 9.079%, PIK 0.750%) | 4.914 | 10/02/28 | 12,525,766 | |||||||||||||
| 1,662,822 | (a) | LifePoint Health, Inc., First Lien Term Loan B, (TSFR3M + 3.750%) | 8.068 | 05/19/31 | 1,662,307 | |||||||||||||
| 3,993,768 | (a) | MedAssets Software Intermediate Holdings, Inc., First Out Term Loan, (TSFR1M + 4.000%) | 8.349 | 12/18/28 | 3,910,158 | |||||||||||||
| 3,135,000 | (a),(h) | Medical Solutions Holdings, Inc., First Lien Term Loan, (TSFR3M + 3.500%) | 7.908 | 11/01/28 | 1,741,226 | |||||||||||||
| 21,349,630 | (a),(c) | Medline Borrower LP, (TBD) | TBD | TBD | 21,393,755 | |||||||||||||
| 4,312,923 | (a) | National Mentor Holdings, Inc., Term Loan, (TSFR1M + TSFR3M + 3.750%) | 8.176 | 03/02/28 | 4,213,941 | |||||||||||||
| 147,516 | (a) | National Mentor Holdings, Inc., Term Loan C, (TSFR3M + 3.750%) | 8.146 | 03/02/28 | 144,131 | |||||||||||||
| 1,714,000 | (a),(c) | Onex TSG Intermediate Corp, (TBD) | TBD | TBD | 1,719,708 | |||||||||||||
| 3,249,600 | (a) | Onex TSG Intermediate Corp., Term Loan B, (TSFR3M + 4.750%) | 9.344 | 02/28/28 | 3,260,437 | |||||||||||||
| 533,250 | (a) | Pacific Dental Services, LLC, Term Loan B, (TSFR1M + 2.750%) | 7.101 | 03/17/31 | 536,002 | |||||||||||||
| 13,893,566 | (a) | Parexel International Corporation, Term Loan B, (TSFR1M + 2.500%) | 6.856 | 11/15/28 | 13,929,203 | |||||||||||||
| 10,381,281 | (a) | Phoenix Guarantor Inc, Term Loan B, (TSFR1M + 2.500%) | 6.856 | 02/21/31 | 10,404,276 | |||||||||||||
| 3,947,000 | (a) | Radiology Partners Inc, Term Loan, (TSFR3M + 4.500%) | 8.798 | 06/30/32 | 3,960,262 | |||||||||||||
| 2,117,273 | (a) | Select Medical Corporation, Term Loan B, (TSFR1M + 2.000%) | 6.356 | 12/03/31 | 2,117,274 | |||||||||||||
| 271,009 | (a) | Sound Inpatient Physicians, Tranche A Term Loan (First Out), (TSFR3M + 3.250%), (cash 10.057%, PIK 1.000%) | 5.529 | 06/28/28 | 283,375 | |||||||||||||
| 3,416,138 | (a) | Sound Inpatient Physicians, Tranche B Term Loan (Second Out), (TSFR3M + 2.500%), (cash 8.057%, PIK 1.500%) | 4.779 | 06/28/28 | 3,212,024 | |||||||||||||
| 1,576,010 | (a) | Star Parent Inc., Term Loan B, (TSFR3M + 4.000%) | 8.296 | 09/30/30 | 1,560,581 | |||||||||||||
| 11,743,188 | (a) | Surgery Center Holdings, Inc., Term Loan B, (TSFR1M + 2.750%) | 7.106 | 12/19/30 | 11,795,210 | |||||||||||||
| 6,050,000 | (a),(c) | Team Health Holdings Inc, (TBD) | TBD | TBD | 6,057,563 | |||||||||||||
| 3,749,193 | (a) | Team Health Holdings, Inc., Term Loan B, (TSFR1M + 5.250%) | 9.606 | 03/02/27 | 3,751,536 | |||||||||||||
| 2,321,932 | (a) | Viant Medical Holdings, Inc., Term Loan B, (TSFR1M + 4.000%) | 8.356 | 10/29/31 | 2,323,395 | |||||||||||||
| |
|
|||||||||||||||||
| TOTAL HEALTH CARE EQUIPMENT & SERVICES | 125,550,870 | |||||||||||||||||
| |
||||||||||||||||||
| 44 | See Notes to Financial Statements |
| PRINCIPAL | DESCRIPTION | RATE | MATURITY | VALUE | ||||||||||||||
| |
|
|||||||||||||||||
| HOUSEHOLD & PERSONAL PRODUCTS - 0.4% (0.2% of Total Investments) | |
|||||||||||||||||
| $ | 2,236,367 | (a),(h) | Kronos Acquisition Holdings Inc., Term Loan, (TSFR3M + 4.000%) | 8.296% | 07/08/31 | $ | 1,915,817 | |||||||||||
| 1,172,961 | (a) | VC GB Holdings I Corp., First Lien Term Loan, (TSFR3M + 3.500%) | 8.057 | 05/16/28 | 1,172,011 | |||||||||||||
| |
|
|||||||||||||||||
| TOTAL HOUSEHOLD & PERSONAL PRODUCTS | 3,087,828 | |||||||||||||||||
| |
||||||||||||||||||
| INSURANCE - 10.8% (6.6% of Total Investments) | ||||||||||||||||||
| 13,238,902 | (a) | Acrisure, LLC, First Lien Term Loan B6, (TSFR1M + 3.000%) | 7.356 | 11/06/30 | 13,257,502 | |||||||||||||
| 3,570,000 | (a) | Alera Group, Inc., Term Loan, (TSFR1M + 3.250%) | 7.606 | 05/28/32 | 3,589,867 | |||||||||||||
| 9,946,508 | (a) | Alliant Holdings Intermediate, LLC, Term Loan B6, (TSFR1M + 2.750%) | 7.103 | 09/19/31 | 9,958,443 | |||||||||||||
| 2,019,850 | (a) | AmWINS Group, Inc., Term Loan B, (TSFR1M + 2.250%) | 6.606 | 01/30/32 | 2,023,597 | |||||||||||||
| 4,147,500 | (a) | AssuredPartners, Inc., Incremental Term Loan B5, (TSFR1M + 3.500%) | 7.858 | 02/14/31 | 4,160,648 | |||||||||||||
| 3,718,000 | (a),(h) | Asurion LLC, 2nd Lien Term Loan B3, (TSFR1M + 5.250%) | 9.721 | 02/03/28 | 3,585,862 | |||||||||||||
| 165,463 | (a) | Asurion LLC, Term Loan B11, (TSFR1M + 4.250%) | 8.706 | 08/21/28 | 164,187 | |||||||||||||
| 5,450,914 | (a) | Asurion LLC, Term Loan B13, (TSFR1M + 4.250%) | 8.606 | 09/19/30 | 5,345,984 | |||||||||||||
| 7,177,064 | (a) | Asurion LLC, Term Loan B9, (TSFR1M + 3.250%) | 7.721 | 07/30/27 | 7,184,098 | |||||||||||||
| 13,559,601 | (a),(h) | Broadstreet Partners, Inc., Term Loan B4, (TSFR1M + 2.750%) | 7.106 | 06/16/31 | 13,584,958 | |||||||||||||
| 7,118,547 | (a) | HUB International Limited, Term Loan B, (TSFR3M + 2.500%) | 6.825 | 06/20/30 | 7,135,382 | |||||||||||||
| 239,422 | (a) | Ryan Specialty Group, LLC, Term Loan B, (TSFR1M + 2.250%) | 6.606 | 09/15/31 | 240,020 | |||||||||||||
| 4,145,740 | (a) | Sedgwick Claims Management Services, Inc., Term Loan B, (TSFR1M + 2.500%) | 6.856 | 07/31/31 | 4,155,524 | |||||||||||||
| 2,750,000 | (a) | Trucordia Insurance Holdings LLC, Term Loan B, (TSFR1M + 3.250%) | 7.606 | 06/17/32 | 2,769,773 | |||||||||||||
| 5,933,669 | (a) | Truist Insurance Holdings LLC, Term Loan B, (TSFR3M + 2.750%) | 7.046 | 05/06/31 | 5,947,257 | |||||||||||||
| 820,471 | (a) | USI, Inc., Term Loan C, (TSFR3M + 2.250%) | 6.546 | 09/27/30 | 820,278 | |||||||||||||
| 6,369,913 | (a) | USI, Inc., Term Loan D, (TSFR3M + 2.250%) | 6.546 | 11/23/29 | 6,372,429 | |||||||||||||
| |
|
|||||||||||||||||
| TOTAL INSURANCE | 90,295,809 | |||||||||||||||||
| |
||||||||||||||||||
| MATERIALS - 4.5% (2.7% of Total Investments) | ||||||||||||||||||
| 781,177 | (a) | Arsenal AIC Parent LLC, Term Loan B, (TSFR1M + 2.750%) | 7.106 | 08/19/30 | 784,352 | |||||||||||||
| 535,957 | (a) | Berlin Packaging LLC, Term Loan B7, (TSFR1M + TSFR3M + 3.500%) | 7.811 | 06/09/31 | 537,846 | |||||||||||||
| 128,866 | (a),(g) | Clydesdale Acquisition Holdings Inc, Delayed Draw Term Loan, (N/A + TSFR1M + 2.438%) | 4.616 | 03/29/32 | 128,922 | |||||||||||||
| 7,371,134 | (a) | Clydesdale Acquisition Holdings Inc, Term Loan B, (TSFR1M + 3.250%) | 7.606 | 03/29/32 | 7,374,340 | |||||||||||||
| 819,155 | (a) | Clydesdale Acquisition Holdings Inc, Term Loan B, (TSFR1M + 3.175%) | 7.531 | 04/13/29 | 819,766 | |||||||||||||
| 1,357,000 | (a) | CPC Acquisition Corp, Term Loan, (TSFR3M + 3.750%) | 8.307 | 12/29/27 | 1,173,805 | |||||||||||||
| 4,600,703 | (a) | Discovery Purchaser Corporation, Term Loan, (TSFR3M + 3.750%) | 8.082 | 10/04/29 | 4,605,166 | |||||||||||||
| 489,351 | (a) | ECO Services Operations Corp, Term Loan B, (TSFR3M + 2.000%) | 6.308 | 06/12/31 | 488,739 | |||||||||||||
| 1,595,000 | (a) | Fortis 333, Inc., Term Loan B, (TSFR3M + 3.500%) | 7.796 | 04/02/32 | 1,585,701 | |||||||||||||
| 184,340 | (a) | Ineos US Finance LLC, First Lien Term Loan B, (TSFR1M + 3.000%) | 7.356 | 02/07/31 | 170,130 | |||||||||||||
| 1,443,434 | (a) | Ineos US Finance LLC, Term Loan B, (TSFR1M + 3.250%) | 7.606 | 02/19/30 | 1,344,646 | |||||||||||||
| 3,201,045 | (a) | Klockner-Pentaplast of America, Inc., Term Loan B, (TSFR6M + 4.725%) | 9.227 | 02/09/26 | 2,946,658 | |||||||||||||
| 297,255 | (a) | Knife River HoldCo, Term Loan, (TSFR3M + 2.000%) | 6.310 | 03/08/32 | 298,741 | |||||||||||||
| 1,013,553 | (a) | Lonza Group AG, Term Loan B, (TSFR3M + 3.925%) | 8.321 | 07/03/28 | 908,757 | |||||||||||||
| 5,173,170 | (a) | Nouryon Finance B.V., Term Loan B1, (TSFR3M + 3.250%) | 7.510 | 04/03/28 | 5,181,266 | |||||||||||||
| 477,758 | (a) | Nouryon Finance B.V., Term Loan B2, (TSFR3M + 3.250%) | 7.550 | 04/03/28 | 478,133 | |||||||||||||
| 955,000 | (a),(c) | Olympus Water US Holding Corp, (TBD) | TBD | TBD | 953,687 | |||||||||||||
| 442,682 | (a) | Plaze, Inc., Incremental Term Loan, (TSFR1M + 3.750%) | 8.221 | 08/03/26 | 425,183 | |||||||||||||
| 533,264 | (a) | SupplyOne, Inc, Term Loan B, (TSFR1M + 3.500%) | 7.856 | 04/21/31 | 537,311 | |||||||||||||
| 5,980,273 | (a) | TricorBraun Holdings, Inc., Term Loan, (TSFR1M + 3.250%) | 7.721 | 03/03/28 | 5,987,688 | |||||||||||||
| 947,163 | (a) | USALCO, LLC, Term Loan B, (TSFR1M + 4.000%) | 8.356 | 09/30/31 | 948,054 | |||||||||||||
| |
|
|||||||||||||||||
| TOTAL MATERIALS | 37,678,891 | |||||||||||||||||
| |
||||||||||||||||||
| See Notes to Financial Statements | 45 |
Portfolio of Investments July 31, 2025 (continued)
JQC
| PRINCIPAL | DESCRIPTION | RATE | MATURITY | VALUE | ||||||||||||||
| |
|
|||||||||||||||||
| MEDIA & ENTERTAINMENT - 5.1% (3.1% of Total Investments) | |
|||||||||||||||||
| $ | 10,449,836 | (a),(h) | AMC Entertainment Holdings, Inc. , Term Loan, (TSFR1M + 7.000%) | 11.351% | 01/04/29 | $ | 10,539,652 | |||||||||||
| 937,903 | (a) | Cable One, Inc., Term Loan B4, (TSFR1M + 2.000%) | 6.471 | 05/03/28 | 906,952 | |||||||||||||
| 2,183,005 | (a) | Cengage Learning, Inc., First Lien Term Loan B, (TSFR1M + TSFR3M + 3.500%) | 7.841 | 03/24/31 | 2,184,992 | |||||||||||||
| 4,345,965 | (a) | Clear Channel Outdoor Holdings, Inc., Term Loan, (TSFR1M + 4.000%) | 8.471 | 08/23/28 | 4,345,574 | |||||||||||||
| 1,382,258 | (a) | CMG Media Corporation, Term Loan, (TSFR3M + 3.500%) | 7.896 | 06/18/29 | 1,353,230 | |||||||||||||
| 8,443,771 | (a) | CSC Holdings, LLC, Term Loan B5, (Prime + 1.500%) | 9.000 | 04/15/27 | 8,329,442 | |||||||||||||
| 6,059,095 | (a),(h) | CSC Holdings, LLC, Term Loan B6, (TSFR1M + 4.500%) | 8.842 | 01/18/28 | 6,051,582 | |||||||||||||
| 960,670 | (a),(f) | DirecTV Financing, LLC, Term Loan, (TSFR3M + 5.000%) | 9.570 | 08/02/27 | 964,633 | |||||||||||||
| 570,000 | (a) | E.W. Scripps Company (The), Term Loan B2, (TSFR1M + 5.750%) | 10.208 | 06/30/28 | 578,194 | |||||||||||||
| 848,832 | (a) | E.W. Scripps Company (The), Term Loan B3, (TSFR1M + 3.350%) | 7.808 | 11/30/29 | 826,249 | |||||||||||||
| 1,992,247 | (a) | McGraw-Hill Global Education Holdings, LLC, Term Loan B, (TSFR1M + 3.250%) | 7.606 | 08/06/31 | 1,999,250 | |||||||||||||
| 398,400 | (a) | Mission Broadcasting, Inc., Term Loan B, (TSFR1M + 2.500%) | 6.943 | 06/02/28 | 399,645 | |||||||||||||
| 1,759,657 | (a) | Planet US Buyer LLC, Term Loan B, (TSFR3M + 3.000%) | 7.330 | 02/10/31 | 1,769,775 | |||||||||||||
| 2,165,000 | (a) | Sinclair Television Group Inc., Term Loan B6, (TSFR3M + 3.300%) | 7.870 | 12/31/29 | 2,022,110 | |||||||||||||
| 217,000 | (a) | Virgin Media Bristol LLC, Term Loan Y, (TSFR6M + 3.175%) | 7.373 | 03/31/31 | 213,257 | |||||||||||||
| |
|
|||||||||||||||||
| TOTAL MEDIA & ENTERTAINMENT | 42,484,537 | |||||||||||||||||
| |
||||||||||||||||||
| PHARMACEUTICALS, BIOTECHNOLOGY & LIFE SCIENCES - 1.7% (1.1% of Total Investments) | |
|||||||||||||||||
| 750,000 | (a),(c) | Amneal Pharmaceuticals LLC, (TBD) | TBD | TBD | 751,717 | |||||||||||||
| 7,116,868 | (a) | Jazz Financing Lux S.a.r.l., First Lien Term Loan B, (TSFR1M + 2.250%) | 6.606 | 05/05/28 | 7,153,022 | |||||||||||||
| 3,860,000 | (a) | Opal Bidco SAS, Term Loan B, (TSFR3M + 3.250%) | 7.575 | 04/23/32 | 3,881,481 | |||||||||||||
| 1,492,742 | (a) | Organon & Co, Term Loan, (TSFR1M + 2.250%) | 6.599 | 05/19/31 | 1,443,608 | |||||||||||||
| 1,142,479 | (a) | Perrigo Investments, LLC, Term Loan B, (TSFR1M + 2.000%) | 6.356 | 04/20/29 | 1,148,431 | |||||||||||||
| |
|
|||||||||||||||||
| TOTAL PHARMACEUTICALS, BIOTECHNOLOGY & LIFE SCIENCES | 14,378,259 | |||||||||||||||||
| |
||||||||||||||||||
| REAL ESTATE MANAGEMENT & DEVELOPMENT - 1.2% (0.7% of Total Investments) | |
|||||||||||||||||
| 2,347,197 | (a) | Cushman & Wakefield U.S. Borrower, LLC, Term Loan B1, (TSFR1M + 2.750%) | 7.106 | 01/31/30 | 2,364,472 | |||||||||||||
| 2,368,750 | (a) | Cushman & Wakefield U.S. Borrower, LLC, Term Loan B3, (TSFR1M + 2.750%) | 7.106 | 01/31/30 | 2,385,532 | |||||||||||||
| 5,283,000 | (a) | Forest City Enterprises, L.P., Term Loan B, (TSFR1M + 3.500%) | 7.971 | 12/08/25 | 5,148,627 | |||||||||||||
| |
|
|||||||||||||||||
| TOTAL REAL ESTATE MANAGEMENT & DEVELOPMENT | 9,898,631 | |||||||||||||||||
| |
||||||||||||||||||
| SEMICONDUCTORS & SEMICONDUCTOR EQUIPMENT - 0.2% (0.1% of Total Investments) | |
|||||||||||||||||
| 1,870,313 | (a) | Instructure Holdings, Inc., Term Loan, (TSFR6M + 3.000%) | 7.205 | 11/13/31 | 1,877,616 | |||||||||||||
| |
|
|||||||||||||||||
| TOTAL SEMICONDUCTORS & SEMICONDUCTOR EQUIPMENT | 1,877,616 | |||||||||||||||||
| |
||||||||||||||||||
| SOFTWARE & SERVICES - 22.8% (13.9% of Total Investments) | |
|||||||||||||||||
| 1,552,512 | (a) | Ahead DB Holdings, LLC, Term Loan B3, (TSFR3M + 3.000%) | 7.296 | 02/03/31 | 1,555,749 | |||||||||||||
| 1,029,112 | (a) | Apttus Corporation, Term Loan B, (TSFR3M + 3.500%) | 7.808 | 05/08/28 | 1,032,653 | |||||||||||||
| 5,250,000 | (a) | Asurion LLC, Second Lien Term Loan B4, (TSFR1M + 5.250%) | 9.721 | 01/22/29 | 4,949,779 | |||||||||||||
| 2,955,000 | (a) | Avalara, Inc, Term Loan B, (TSFR3M + 3.250%) | 7.546 | 03/29/32 | 2,971,385 | |||||||||||||
| 8,435,709 | (a) | Avaya, Inc., Exit Term Loan, (TSFR1M + 7.500%), (cash 11.856%, PIK 7.500%) | 11.856 | 08/01/28 | 6,637,131 | |||||||||||||
| 2,667,397 | (a) | Axalta Coating Systems U.S. Holdings, Inc., Term Loan B, (TSFR3M + 1.750%) | 6.046 | 12/20/29 | 2,679,201 | |||||||||||||
| 2,443,875 | (a) | BCPE Pequod Buyer Inc, Term Loan B, (TSFR1M + 3.000%) | 7.356 | 11/25/31 | 2,451,512 | |||||||||||||
| 9,523,205 | (a),(f) | Boost Newco Borrower, LLC, Term Loan B, (TSFR3M + 2.000%) | 6.296 | 01/31/31 | 9,550,013 | |||||||||||||
| 10,797,037 | (a) | Boxer Parent Company Inc., Term Loan B, (TSFR3M + 3.000%) | 7.333 | 07/30/31 | 10,809,669 | |||||||||||||
| 1,115,860 | (a) | Camelot U.S. Acquisition LLC, Term Loan B, (TSFR1M + 2.750%) | 7.106 | 01/31/31 | 1,116,837 | |||||||||||||
| 979,627 | (a) | CCC Intelligent Solutions Inc., Term Loan, (TSFR1M + 2.000%) | 6.356 | 01/23/32 | 982,081 | |||||||||||||
| 1,667,000 | (a),(c) | Cloud Software Group Inc, (TBD) | TBD | TBD | 1,671,734 | |||||||||||||
| 2,625,000 | (a) | Cotiviti Corporation, 2nd Amendment Term Loan, (TSFR1M + 2.750%) | 7.079 | 03/29/32 | 2,622,808 | |||||||||||||
| 6,224,449 | (a) | Cotiviti Corporation, Term Loan, (TSFR1M + 2.750%) | 7.079 | 05/01/31 | 6,216,046 | |||||||||||||
| 2,394,000 | (a) | Darktrace PLC, First Lien Term Loan, (TSFR3M + 3.250%) | 7.570 | 10/09/31 | 2,400,979 | |||||||||||||
| 46 | See Notes to Financial Statements |
| PRINCIPAL | DESCRIPTION | RATE | MATURITY | VALUE | ||||||||||||||
| |
|
|||||||||||||||||
| SOFTWARE & SERVICES (continued) | ||||||||||||||||||
| $ | 1,113,391 | (a) | DTI Holdco, Inc., Term Loan B, (TSFR1M + 4.000%) | 8.356% | 04/26/29 | $ | 1,100,631 | |||||||||||
| 7,879,735 | (a),(f) | Ellucian Holdings, Inc., First Lien Term Loan B, (TSFR1M + 2.750%) | 7.106 | 10/09/29 | 7,899,434 | |||||||||||||
| 10,360,276 | (a) | Epicor Software Corporation, Term Loan E, (TSFR1M + 2.750%) | 7.106 | 05/30/31 | 10,390,321 | |||||||||||||
| 2,065,392 | (a) | Fortress Intermediate 3, Inc, Term Loan B, (TSFR1M + 3.000%) | 7.322 | 06/27/31 | 2,071,847 | |||||||||||||
| 2,877,995 | (a) | Gen Digital Inc., Term Loan B, (TSFR1M + 1.750%) | 6.106 | 09/12/29 | 2,877,319 | |||||||||||||
| 5,167,035 | (a) | Genesys Cloud Services Holdings II LLC, Term Loan B, (TSFR1M + 2.500%) | 6.856 | 01/30/32 | 5,168,404 | |||||||||||||
| 6,772,500 | (a) | Informatica LLC, Term Loan B, (TSFR1M + 2.250%) | 6.606 | 10/30/28 | 6,819,061 | |||||||||||||
| 1,117,200 | (a) | Javelin Buyer, Inc., First Lien Term Loan, (TSFR3M + 3.000%) | 7.333 | 12/08/31 | 1,116,764 | |||||||||||||
| 4,189,500 | (a) | Kaseya Inc., First Lien Term Loan B, (TSFR1M + 3.250%) | 7.606 | 03/22/32 | 4,205,881 | |||||||||||||
| 6,319,939 | (a) | McAfee, LLC, First Lien Term Loan B, (TSFR1M + 3.000%) | 7.327 | 03/01/29 | 6,125,063 | |||||||||||||
| 746,000 | (a) | MedAssets Software Intermediate Holdings, Inc., Second Out Term Loan, (TSFR1M + 4.000%) | 8.463 | 12/18/28 | 674,507 | |||||||||||||
| 751,323 | (a) | Mitchell International, Inc., First Lien Term Loan, (TSFR1M + 3.250%) | 7.606 | 06/17/31 | 753,126 | |||||||||||||
| 6,754,704 | (a) | Open Text Corporation, Term Loan B, (TSFR1M + 1.750%) | 6.106 | 01/31/30 | 6,764,836 | |||||||||||||
| 1,492,500 | (a) | PointClickCare Technologies, Inc., Term Loan B, (TSFR6M + 3.250%) | 7.474 | 11/03/31 | 1,495,769 | |||||||||||||
| 2,617,202 | (a) | Polaris Newco LLC, Term Loan B, (TSFR3M + 3.750%) | 8.320 | 06/05/28 | 2,572,553 | |||||||||||||
| 4,105,972 | (a) | Press Ganey Holdings, Inc., Repriced Term Loan B, (TSFR1M + 3.000%) | 7.356 | 04/30/31 | 4,110,694 | |||||||||||||
| 459,842 | (a) | Project Alpha Intermediate Holding, Inc., First Lien Term Loan B, (TSFR3M + 3.250%) | 7.542 | 10/28/30 | 461,509 | |||||||||||||
| 720,131 | (a) | Project Ruby Ultimate Parent Corp., Term Loan B, (TSFR1M + 2.750%) | 7.215 | 03/10/28 | 721,932 | |||||||||||||
| 1,143,000 | (a),(c) | PROOFPOINT INC, (TBD) | TBD | TBD | 1,146,218 | |||||||||||||
| 3,282,327 | (a) | Proofpoint, Inc., Term Loan, (TSFR1M + 3.000%) | 7.356 | 08/31/28 | 3,291,567 | |||||||||||||
| 3,484,492 | (a) | Rackspace Finance, LLC, First Lien First Out Term Loan, (TSFR1M + 6.250%) | 10.711 | 05/15/28 | 3,529,912 | |||||||||||||
| 6,548,458 | (a) | Rackspace Finance, LLC, First Lien Second Out Term Loan, (TSFR1M + 2.750%) | 7.211 | 05/15/28 | 3,435,616 | |||||||||||||
| 2,878,031 | (a) | SS&C Technologies Inc., Term Loan B8, (TSFR1M + 2.000%) | 6.356 | 05/09/31 | 2,891,082 | |||||||||||||
| 1,995,000 | (a) | Synechron Inc, Term Loan B, (TSFR3M + 3.750%) | 8.058 | 10/03/31 | 1,997,494 | |||||||||||||
| 1,700,389 | (a) | Syniverse Holdings, Inc., Term Loan, (TSFR3M + 7.000%) | 11.296 | 05/13/27 | 1,579,661 | |||||||||||||
| 5,697,048 | (a) | Tempo Acquisition LLC, Repriced Term Loan B, (TSFR1M + 1.750%) | 6.106 | 08/31/28 | 5,688,588 | |||||||||||||
| 14,936,072 | (a) | UKG Inc., Term Loan B, (TSFR3M + 2.500%) | 6.810 | 02/10/31 | 14,951,456 | |||||||||||||
| 2,718,234 | (a) | Vision Solutions, Inc., Incremental Term Loan, (TSFR3M + 4.000%) | 8.570 | 04/24/28 | 2,639,528 | |||||||||||||
| 535,957 | (a) | VS Buyer, LLC, First Lien Term Loan B, (TSFR3M + 2.750%) | 7.075 | 04/14/31 | 537,519 | |||||||||||||
| 1,318,744 | (a) | World Wide Technology Holding Co LLC, (CME Term SOFR 1 Month + 2.250%) | 6.599 | 03/01/30 | 1,318,744 | |||||||||||||
| 14,716,724 | (a),(h) | X Corp., Term Loan, (TSFR3M + 6.500%) | 10.958 | 10/29/29 | 14,366,024 | |||||||||||||
| 2,954,000 | X Corp., Term Loan | 9.500 | 10/29/29 | 2,870,106 | ||||||||||||||
| 7,998,750 | (a) | Zelis Payments Buyer, Inc., Term Loan B, (TSFR1M + 2.750%) | 7.106 | 09/28/29 | 7,983,272 | |||||||||||||
| |
|
|||||||||||||||||
| TOTAL SOFTWARE & SERVICES | 191,204,015 | |||||||||||||||||
| |
||||||||||||||||||
| TECHNOLOGY HARDWARE & EQUIPMENT - 3.3% (2.0% of Total Investments) | ||||||||||||||||||
| 12,118,097 | (a) | CommScope, Inc., Term Loan, (TSFR1M + 5.250%) | 9.606 | 12/17/29 | 12,346,948 | |||||||||||||
| 1,190,000 | (a) | Delta TopCo, Inc., Term Loan B, (TSFR3M + 2.750%) | 7.071 | 12/03/29 | 1,188,596 | |||||||||||||
| 1,783,250 | (a) | II‑VI Incorporated, First Lien Term Loan B, (TSFR1M + 2.000%) | 6.356 | 07/02/29 | 1,790,383 | |||||||||||||
| 1,298,871 | (a) | Ingram Micro Inc., Term Loan, (TSFR3M + 2.250%) | 6.560 | 09/22/31 | 1,306,717 | |||||||||||||
| 5,228,730 | (a) | Verifone Systems, Inc., Term Loan, (TSFR3M + 5.500%) | 10.070 | 08/21/28 | 5,062,064 | |||||||||||||
| 287,260 | (a) | ViaSat, Inc., Term Loan, (TSFR1M + 4.500%) | 8.971 | 03/05/29 | 284,207 | |||||||||||||
| 5,611,721 | (a) | ViaSat, Inc., Term Loan, (TSFR1M + 4.500%) | 8.954 | 05/30/30 | 5,528,555 | |||||||||||||
| |
|
|||||||||||||||||
| TOTAL TECHNOLOGY HARDWARE & EQUIPMENT | 27,507,470 | |||||||||||||||||
| |
||||||||||||||||||
| TELECOMMUNICATION SERVICES - 6.6% (4.0% of Total Investments) | ||||||||||||||||||
| 639,502 | (a) | Altice France S.A., Term Loan B12, (Prime + 2.688%) | 10.188 | 02/02/26 | 583,149 | |||||||||||||
| 8,472,624 | (a) | Altice France S.A., Term Loan B13, (Prime + 3.000%) | 10.500 | 08/14/26 | 7,731,270 | |||||||||||||
| 5,315,191 | (a) | Altice France S.A., Term Loan B14, (TSFR3M + 5.500%) | 9.818 | 08/31/28 | 4,955,592 | |||||||||||||
| 1,159,267 | (a) | Cincinnati Bell, Inc., Term Loan B2, (TSFR1M + 2.750%) | 7.106 | 11/24/28 | 1,162,681 | |||||||||||||
| 1,698,700 | (a) | Connect Finco Sarl, Extended Term Loan B, (TSFR1M + 4.500%) | 8.856 | 09/13/29 | 1,670,297 | |||||||||||||
| See Notes to Financial Statements | 47 |
Portfolio of Investments July 31, 2025 (continued)
JQC
| PRINCIPAL | DESCRIPTION | RATE | MATURITY | VALUE | ||||||||||||||
| |
|
|||||||||||||||||
| TELECOMMUNICATION SERVICES (continued) | ||||||||||||||||||
| $ | 581,141 | (a),(d) | Cyxtera DC Holdings, Inc., Term Loan B | 0.000% | 05/01/26 | $ | 3,196 | |||||||||||
| 3,963,202 | (a) | Digicel International Finance Limited, Term Loan, (TSFR3M + 4.875%), (cash 9.558%, PIK 2.250%) | 7.029 | 05/27/27 | 3,983,018 | |||||||||||||
| 3,467,000 | (a),(c) | Digicel International Finance Ltd, (TBD) | TBD | TBD | 3,467,000 | |||||||||||||
| 4,208,876 | (a) | Frontier Communications Corp., Term Loan B, (TSFR6M + 2.500%) | 6.792 | 07/01/31 | 4,218,746 | |||||||||||||
| 1,153,000 | (a),(c) | LCPR Loan Financing LLC, Term Loan B, (TBD) | TBD | TBD | 881,082 | |||||||||||||
| 2,078,000 | (a) | Level 3 Financing Inc., Term Loan B, (TSFR1M + 4.250%) | 8.606 | 03/29/32 | 2,099,590 | |||||||||||||
| 3,414,023 | (a) | Lumen Technologies, Inc., Extended Term Loan B2, (TSFR1M + 2.350%) | 6.821 | 04/15/30 | 3,398,831 | |||||||||||||
| 4,634,866 | (a) | Lumen Technologies, Inc., Term Loan A, (TSFR1M + 6.000%) | 10.356 | 06/01/28 | 4,750,738 | |||||||||||||
| 3,244,552 | (a),(h) | Numericable Group SA, Term Loan B11, (Prime + 1.750%) | 9.250 | 07/31/25 | 2,936,319 | |||||||||||||
| 1,170,000 | (a),(c) | Telesat LLC, (TBD) | TBD | TBD | 746,712 | |||||||||||||
| 9,544,000 | (a),(h) | Zayo Group Holdings, Inc., Term Loan, (TSFR1M + 3.000%) | 7.471 | 03/09/27 | 9,239,212 | |||||||||||||
| 3,650,838 | (a) | Ziggo Financing Partnership, Term Loan I, (TSFR1M + 2.500%) | 6.956 | 04/28/28 | 3,532,697 | |||||||||||||
| |
|
|||||||||||||||||
| TOTAL TELECOMMUNICATION SERVICES | 55,360,130 | |||||||||||||||||
| |
||||||||||||||||||
| TRANSPORTATION - 2.2% (1.3% of Total Investments) | ||||||||||||||||||
| 508,563 | (a) | Air Canada, Term Loan B, (TSFR1M + 2.000%) | 6.353 | 03/21/31 | 509,198 | |||||||||||||
| 134,636 | (a) | American Airlines, Inc., First Lien Term Loan, (TSFR6M + 1.750%) | 5.984 | 01/29/27 | 134,179 | |||||||||||||
| 2,525,768 | (a) | American Airlines, Inc., Term Loan, (TSFR3M + 2.250%) | 6.575 | 04/20/28 | 2,518,823 | |||||||||||||
| 3,549,866 | (a),(h) | Brown Group Holding, LLC, Incremental Term Loan B2, (TSFR1M + TSFR3M + 2.500%) | 6.803 | 07/01/31 | 3,560,037 | |||||||||||||
| 2,148,941 | (a) | Brown Group Holding, LLC, Term Loan B, (TSFR1M + 2.500%) | 6.856 | 07/01/31 | 2,154,453 | |||||||||||||
| 134,498 | (a),(h) | Cubic Corp, (CME Term SOFR 3 Month + 1.000%) | 5.320 | 05/01/29 | 98,916 | |||||||||||||
| 939,000 | (a),(h) | Cubic Corp, (CME Term SOFR 3 Month + 4.250%) | 8.570 | 05/01/29 | 694,038 | |||||||||||||
| 2,932,101 | (a) | KKR Apple Bidco, LLC, Term Loan, (TSFR1M + 2.500%) | 6.856 | 09/23/31 | 2,943,595 | |||||||||||||
| 2,797,733 | (a) | PODS, LLC, Term Loan B, (TSFR1M + 3.000%) | 7.471 | 03/31/28 | 2,659,441 | |||||||||||||
| 275,963 | (a) | SkyMiles IP Ltd., Skymiles Term Loan B, (TSFR3M + 3.750%) | 8.075 | 10/20/27 | 277,706 | |||||||||||||
| 1,250,000 | (a) | Stonepeak Nile Parent LLC, Term Loan B, (TSFR3M + 2.750%) | 7.079 | 04/12/32 | 1,254,375 | |||||||||||||
| 1,668,523 | (a) | WestJet Loyalty LP, Term Loan B, (TSFR3M + 3.250%) | 7.546 | 02/14/31 | 1,671,000 | |||||||||||||
| |
|
|||||||||||||||||
| TOTAL TRANSPORTATION | 18,475,761 | |||||||||||||||||
| |
||||||||||||||||||
| UTILITIES - 2.3% (1.4% of Total Investments) | ||||||||||||||||||
| 2,295,000 | (a),(c) | Cornerstone Generation LLC, (TBD) | TBD | TBD | 2,313,934 | |||||||||||||
| 1,228,125 | (a) | Invenergy Thermal Operating I LLC, Term Loan B, (TSFR3M + 3.500%) | 7.796 | 05/06/32 | 1,242,248 | |||||||||||||
| 81,875 | (a) | Invenergy Thermal Operating I LLC, Term Loan C, (TSFR3M + 3.500%) | 7.796 | 05/06/32 | 82,816 | |||||||||||||
| 598,500 | (a) | Long Ridge Energy LLC, Term Loan B, (TSFR3M + 4.500%) | 8.796 | 02/19/32 | 592,267 | |||||||||||||
| 1,500,000 | (a),(c) | NRG Energy, Inc., Term Loan, (TBD) | TBD | TBD | 1,502,602 | |||||||||||||
| 6,462,525 | (a) | Talen Energy Supply, LLC, Incremental Term Loan B, (TSFR3M + 2.500%) |
6.808 | 12/15/31 | 6,485,241 | |||||||||||||
| 7,184,237 | (a) | Talen Energy Supply, LLC, Term Loan B, (TSFR3M + 2.500%) | 6.808 | 05/17/30 | 7,210,065 | |||||||||||||
| 298,628 | (a),(f) | Vistra Operations Company LLC, First Lien Term Loan B3, (TSFR1M + 1.750%) | 6.106 | 12/20/30 | 299,431 | |||||||||||||
| |
|
|||||||||||||||||
| TOTAL UTILITIES | 19,728,604 | |||||||||||||||||
| |
||||||||||||||||||
| TOTAL VARIABLE RATE SENIOR LOAN INTERESTS (Cost $978,368,551) |
980,115,367 | |||||||||||||||||
| |
||||||||||||||||||
| SHARES | DESCRIPTION | VALUE | ||||||||||||||||
| |
|
|||||||||||||||||
| WARRANTS - 0.0% (0.0% of Total Investments) | ||||||||||||||||||
| MEDIA & ENTERTAINMENT - 0.0% (0.0% of Total Investments) | ||||||||||||||||||
| 4,644 | (d) | Tenerity Inc | 47 | |||||||||||||||
| |
|
|||||||||||||||||
| TOTAL MEDIA & ENTERTAINMENT | 47 | |||||||||||||||||
| |
||||||||||||||||||
| TOTAL WARRANTS (Cost $1,087,699) |
47 | |||||||||||||||||
| |
||||||||||||||||||
| TOTAL LONG-TERM INVESTMENTS (Cost $1,322,888,239) |
1,320,027,782 | |||||||||||||||||
| |
||||||||||||||||||
| SHARES | DESCRIPTION | RATE | VALUE | |||||||||||||||
| |
|
|||||||||||||||||
| SHORT-TERM INVESTMENTS - 7.0% (4.3% of Total Investments) | ||||||||||||||||||
| 48 | See Notes to Financial Statements |
| SHARES | DESCRIPTION | RATE | VALUE | |||||||||||||||
| |
|
|||||||||||||||||
| INVESTMENT COMPANIES - 7.0% (4.3% of Total Investments) | ||||||||||||||||||
| 58,662,854 | BlackRock Liquidity Funds T-Fund | 4.517 | (j) | $ | 58,662,854 | |||||||||||||
| |
|
|||||||||||||||||
| TOTAL INVESTMENT COMPANIES (Cost $58,662,854) |
58,662,854 | |||||||||||||||||
| |
||||||||||||||||||
| TOTAL SHORT-TERM INVESTMENTS (Cost $58,662,854) |
58,662,854 | |||||||||||||||||
| |
||||||||||||||||||
| TOTAL INVESTMENTS - 164.7% (Cost $1,381,551,093) |
1,378,690,636 | |||||||||||||||||
| |
||||||||||||||||||
| BORROWINGS - (25.3)% (k),(l) | (211,600,000 | ) | ||||||||||||||||
| |
||||||||||||||||||
| REVERSE REPURCHASE AGREEMENTS, INCLUDING ACCRUED INTEREST - (17.0)%(m) | (142,656,632 | ) | ||||||||||||||||
| |
||||||||||||||||||
| TFP SHARES, NET - (16.6)%(n) | (139,314,490 | ) | ||||||||||||||||
| |
||||||||||||||||||
| OTHER ASSETS & LIABILITIES, NET - (5.8)% | (47,814,289 | ) | ||||||||||||||||
| |
||||||||||||||||||
| NET ASSETS APPLICABLE TO COMMON SHARES - 100% | $ | 837,305,225 | ||||||||||||||||
| |
||||||||||||||||||
All percentages shown in the Portfolio of Investments are based on net assets applicable to common shares unless otherwise noted.
| PIK | Payment‑in‑kind (“PIK”) security. Depending on the terms of the security, income may be received in the form of cash, securities, or a combination of both. The PIK rate shown, where applicable, represents the annualized rate of the last PIK payment made by the issuer as of the end of the reporting period. |
| SOFR90A | 90 Day Average Secured Overnight Financing Rate |
| TBD | Senior loan purchased on a when-issued or delayed-delivery basis. Certain details associated with this purchase are not known prior to the settlement date of the transaction. In addition, senior loans typically trade without accrued interest and therefore a coupon rate is not available prior to settlement. At settlement, if still unknown, the borrower or counterparty will provide the Fund with the final coupon rate and maturity date. |
| TSFR1M | CME Term Secured Overnight Financing Rate 1 Month |
| TSFR3M | CME Term Secured Overnight Financing Rate 3 Month |
| TSFR6M | CME Term Secured Overnight Financing Rate 6 Month |
| (a) | Floating or variable rate security includes the reference rate and spread, unless the variable rate is based on the underlying asset of the security. Coupon rate reflects the rate at period end. |
| (b) | Security is exempt from registration under Rule 144A of the Securities Act of 1933, as amended. These securities are deemed liquid and may be resold in transactions exempt from registration, which are normally those transactions with qualified institutional buyers. As of the end of the reporting period, the aggregate value of these securities is $272,419,354 or 19.8% of Total Investments. |
| (c) | When-issued or delayed delivery security. |
| (d) | For fair value measurement disclosure purposes, investment classified as Level 3. |
| (e) | Non‑income producing; issuer has not declared an ex‑dividend date within the past twelve months. |
| (f) | Investment, or portion of investment, has been pledged to collateralize the net payment obligations for investments in reverse repurchase agreements. As of the end of the reporting period, investments with a value of $198,196,181 have been pledged as collateral for reverse repurchase agreements. |
| (g) | Investment, or portion of investment, represents an outstanding unfunded senior loan commitment. |
| (h) | Portion of investment purchased on a delayed delivery basis. |
| (i) | Defaulted security. A security whose issuer has failed to fully pay principal and/or interest when due, or is under the protection of bankruptcy. |
| (j) | The rate shown is the annualized seven‑day subsidized yield as of end of the reporting period. |
| (k) | Borrowings as a percentage of Total Investments is 15.3%. |
| (l) | The Fund segregates 100% of its eligible investments (excluding any investments separately pledged as collateral for specific investments in derivatives, when applicable) in the Portfolio of Investments as collateral for borrowings. |
| (m) | Reverse Repurchase Agreements, including accrued interest as a percentage of Total investments is 10.3%. |
| (n) | TFP Shares, Net as a percentage of Total Investments is 10.1%. |
| See Notes to Financial Statements | 49 |
Portfolio of Investments July 31, 2025
JPC
| SHARES | DESCRIPTION | VALUE | ||||||||||||||||
| |
|
|||||||||||||||||
| LONG-TERM INVESTMENTS - 157.0% (99.5% of Total Investments) | ||||||||||||||||||
| COMMON STOCKS - 0.0% (0.0% of Total Investments) | ||||||||||||||||||
| MATERIALS - 0.0% (0.0% of Total Investments) | ||||||||||||||||||
| 60 | LyondellBasell Industries NV, Class A | $ | 3,476 | |||||||||||||||
| |
|
|||||||||||||||||
| TOTAL MATERIALS | 3,476 | |||||||||||||||||
| |
||||||||||||||||||
| TOTAL COMMON STOCKS (Cost $0) |
3,476 | |||||||||||||||||
| |
||||||||||||||||||
| SHARES | DESCRIPTION | RATE | VALUE | |||||||||||||||
| |
|
|||||||||||||||||
| CONVERTIBLE PREFERRED SECURITIES - 0.8% (0.5% of Total Investments) | |
|||||||||||||||||
| BANKS - 0.8% (0.5% of Total Investments) | ||||||||||||||||||
| 5,849 | Bank of America Corp | 7.250% | 7,135,780 | |||||||||||||||
| 11,949 | Wells Fargo & Co | 7.500 | 14,154,068 | |||||||||||||||
| |
|
|||||||||||||||||
| TOTAL BANKS | 21,289,848 | |||||||||||||||||
| |
||||||||||||||||||
| TOTAL CONVERTIBLE PREFERRED SECURITIES (Cost $24,885,224) |
21,289,848 | |||||||||||||||||
| |
||||||||||||||||||
| PRINCIPAL | DESCRIPTION | RATE | MATURITY | VALUE | ||||||||||||||
| |
|
|||||||||||||||||
| CORPORATE BONDS - 140.8% (89.2% of Total Investments) (a) | ||||||||||||||||||
| AUTOMOBILES & COMPONENTS - 0.9% (0.5% of Total Investments) | ||||||||||||||||||
| $ | 14,869,000 | (b),(c) | General Motors Financial Co Inc | 5.750 | N/A | 14,520,160 | ||||||||||||
| 8,014,000 | (b),(c) | General Motors Financial Co Inc | 5.700 | N/A | 7,818,317 | |||||||||||||
| |
|
|||||||||||||||||
| TOTAL AUTOMOBILES & COMPONENTS | 22,338,477 | |||||||||||||||||
| |
||||||||||||||||||
| BANKS - 82.5% (52.2% of Total Investments) | ||||||||||||||||||
| 4,825,000 | (b),(d),(e) | Australia & New Zealand Banking Group Ltd/United Kingdom | 6.750 | N/A | 4,893,938 | |||||||||||||
| 17,520,000 | (b),(e),(f) | Banco Bilbao Vizcaya Argentaria SA | 6.125 | N/A | 17,364,324 | |||||||||||||
| 12,400,000 | (b),(e),(f) | Banco Bilbao Vizcaya Argentaria SA | 7.750 | N/A | 12,849,938 | |||||||||||||
| 34,227,000 | (b),(e) | Banco Bilbao Vizcaya Argentaria SA | 9.375 | N/A | 37,973,487 | |||||||||||||
| 5,440,000 | (b),(d),(e) | Banco Mercantil del Norte SA/Grand Cayman | 7.500 | N/A | 5,452,550 | |||||||||||||
| 3,120,000 | (b),(d),(e) | Banco Mercantil del Norte SA/Grand Cayman | 7.625 | N/A | 3,149,902 | |||||||||||||
| 23,940,300 | (b),(d),(e) | Banco Mercantil del Norte SA/Grand Cayman | 8.750 | N/A | 24,506,254 | |||||||||||||
| 44,600,000 | (b),(e) | Banco Santander SA | 9.625 | N/A | 52,675,811 | |||||||||||||
| 9,505,000 | (b),(e) | Banco Santander SA | 4.750 | N/A | 9,296,136 | |||||||||||||
| 43,400,000 | (b),(e) | Banco Santander SA | 8.000 | N/A | 46,700,440 | |||||||||||||
| 39,863,000 | (b),(c) | Bank of America Corp | 6.625 | N/A | 40,821,825 | |||||||||||||
| 45,134,000 | (b),(c) | Bank of America Corp | 6.125 | N/A | 45,525,673 | |||||||||||||
| 20,657,000 | (b),(c) | Bank of America Corp | 6.250 | N/A | 20,585,938 | |||||||||||||
| 10,850,000 | (b),(c) | Bank of America Corp | 4.375 | N/A | 10,589,497 | |||||||||||||
| 4,450,000 | (b),(c) | Bank of America Corp | 6.300 | N/A | 4,467,426 | |||||||||||||
| 8,080,000 | (c) | Bank of Montreal | 7.700 | 05/26/84 | 8,452,924 | |||||||||||||
| 22,100,000 | (c) | Bank of Montreal | 7.300 | 11/26/84 | 22,931,291 | |||||||||||||
| 19,244,000 | (c) | Bank of Montreal | 6.875 | 11/26/85 | 19,282,488 | |||||||||||||
| 9,650,000 | (c),(f) | Bank of Nova Scotia/The | 8.000 | 01/27/84 | 10,287,035 | |||||||||||||
| 10,550,000 | (c),(f) | Bank of Nova Scotia/The | 8.625 | 10/27/82 | 11,205,387 | |||||||||||||
| 74,337,000 | (b),(e),(f) | Barclays PLC | 9.625 | N/A | 83,969,588 | |||||||||||||
| 10,405,000 | (b),(e),(f) | Barclays PLC | 7.625 | N/A | 10,599,237 | |||||||||||||
| 27,554,000 | (b),(e) | Barclays PLC | 8.000 | N/A | 29,202,886 | |||||||||||||
| 10,317,000 | (b),(e) | Barclays PLC | 6.125 | N/A | 10,329,891 | |||||||||||||
| 10,170,000 | (b),(d),(e) | BNP Paribas SA | 7.450 | N/A | 10,360,687 | |||||||||||||
| 10,656,000 | (b),(d),(e) | BNP Paribas SA | 7.375 | N/A | 10,954,762 | |||||||||||||
| 28,795,000 | (b),(d),(e),(f) | BNP Paribas SA | 9.250 | N/A | 30,991,943 | |||||||||||||
| 33,437,000 | (b),(d),(e) | BNP Paribas SA | 8.500 | N/A | 35,653,305 | |||||||||||||
| 50,999,000 | (b),(d),(e) | BNP Paribas SA | 8.000 | N/A | 54,567,400 | |||||||||||||
| 38,066,000 | (b),(d),(e) | BNP Paribas SA | 7.750 | N/A | 40,261,571 | |||||||||||||
| 17,581,000 | (c) | Canadian Imperial Bank of Commerce | 7.000 | 10/28/85 | 17,739,229 | |||||||||||||
| 19,525,000 | (c) | Canadian Imperial Bank of Commerce | 6.950 | 01/28/85 | 19,629,975 | |||||||||||||
| 11,815,000 | (b),(c) | Citigroup Inc | 6.875 | N/A | 11,915,428 | |||||||||||||
| 11,000,000 | (b),(c) | Citigroup Inc | 6.950 | N/A | 11,089,122 | |||||||||||||
| 16,219,000 | (b),(c),(f) | Citigroup Inc | 7.000 | N/A | 16,850,941 | |||||||||||||
| 20,263,000 | (b),(c) | Citigroup Inc | 6.250 | N/A | 20,376,919 | |||||||||||||
| 50 | See Notes to Financial Statements |
| PRINCIPAL | DESCRIPTION | RATE | MATURITY | VALUE | ||||||||||||||
| |
|
|||||||||||||||||
| BANKS (continued) | ||||||||||||||||||
| $ | 9,291,000 | (b),(c) | Citigroup Inc | 7.375% | N/A | $ | 9,652,058 | |||||||||||
| 42,832,000 | (b),(c),(g) | Citigroup Inc | 7.625 | N/A | 44,682,000 | |||||||||||||
| 33,702,000 | (b),(c),(g) | Citigroup Inc | 7.125 | N/A | 34,468,990 | |||||||||||||
| 5,529,000 | (b),(c),(h) | Citizens Financial Group Inc (TSFR3M + 3.419%) | 7.704 | N/A | 5,529,697 | |||||||||||||
| 3,976,000 | (b),(c) | Citizens Financial Group Inc | 5.650 | N/A | 3,965,973 | |||||||||||||
| 7,000,000 | (b),(c),(h) | Citizens Financial Group Inc (TSFR3M + 3.265%) | 7.550 | N/A | 7,001,057 | |||||||||||||
| 14,700,000 | (b),(c),(f) | CoBank ACB | 6.450 | N/A | 14,793,169 | |||||||||||||
| 47,227,000 | (b),(d),(e) | Credit Agricole SA | 6.700 | N/A | 47,244,710 | |||||||||||||
| 45,870,000 | (b),(d),(e),(f) | Credit Agricole SA | 8.125 | N/A | 46,382,368 | |||||||||||||
| 4,466,000 | (b),(e) | Credit Agricole SA, Reg S | 8.125 | N/A | 4,515,885 | |||||||||||||
| 16,256,000 | (b),(c),(h) | Fifth Third Bancorp (TSFR3M + 3.295%) | 7.590 | N/A | 16,233,438 | |||||||||||||
| 1,225,000 | (b),(c) | Fifth Third Bancorp | 4.500 | N/A | 1,220,610 | |||||||||||||
| 18,714,000 | (b),(c),(f),(h) | First Citizens BancShares Inc/NC (TSFR3M + 4.234%) | 8.552 | N/A | 19,410,180 | |||||||||||||
| 33,211,000 | (b),(e) | HSBC Holdings PLC | 8.000 | N/A | 35,115,352 | |||||||||||||
| 62,501,000 | (b),(e),(f),(g) | HSBC Holdings PLC | 6.950 | N/A | 64,122,276 | |||||||||||||
| 10,713,000 | (b),(e) | HSBC Holdings PLC | 6.500 | N/A | 10,908,919 | |||||||||||||
| 12,590,000 | (b),(e),(f) | HSBC Holdings PLC | 6.950 | N/A | 12,870,568 | |||||||||||||
| 20,269,000 | (b),(e) | HSBC Holdings PLC | 6.875 | N/A | 20,890,265 | |||||||||||||
| 20,300,000 | (b),(c) | Huntington Bancshares Inc/OH | 5.625 | N/A | 20,794,670 | |||||||||||||
| 25,000,000 | (b),(c) | Huntington Bancshares Inc/OH | 4.450 | N/A | 24,557,483 | |||||||||||||
| 30,760,000 | (b),(e),(g) | ING Groep NV | 5.750 | N/A | 30,662,383 | |||||||||||||
| 37,748,000 | (b),(e) | ING Groep NV, Reg S | 7.500 | N/A | 39,337,455 | |||||||||||||
| 32,590,000 | (b),(d),(e) | Intesa Sanpaolo SpA | 7.700 | N/A | 32,671,410 | |||||||||||||
| 3,600,000 | (c),(f) | JPMorgan Chase & Co | 8.750 | 09/01/30 | 4,246,668 | |||||||||||||
| 29,237,000 | (b),(c) | JPMorgan Chase & Co | 6.500 | N/A | 29,970,381 | |||||||||||||
| 13,830,000 | (b),(c),(g) | JPMorgan Chase & Co | 3.650 | N/A | 13,600,357 | |||||||||||||
| 59,179,000 | (b),(c),(g) | JPMorgan Chase & Co | 6.875 | N/A | 61,852,293 | |||||||||||||
| 2,800,000 | (b),(c) | KeyCorp | 5.000 | N/A | 2,757,060 | |||||||||||||
| 8,000,000 | (c),(f) | KeyCorp Capital III | 7.750 | 07/15/29 | 8,476,913 | |||||||||||||
| 48,266,000 | (b),(e) | Lloyds Banking Group PLC | 8.000 | N/A | 51,549,343 | |||||||||||||
| 16,921,000 | (b),(e) | Lloyds Banking Group PLC | 6.750 | N/A | 16,815,579 | |||||||||||||
| 8,225,000 | (b),(e) | Lloyds Banking Group PLC | 7.500 | N/A | 8,251,534 | |||||||||||||
| 2,395,000 | (b),(c) | M&T Bank Corp | 5.125 | N/A | 2,368,527 | |||||||||||||
| 5,960,000 | (b),(c) | M&T Bank Corp | 3.500 | N/A | 5,727,945 | |||||||||||||
| 9,005,000 | (b),(d),(e) | Macquarie Bank Ltd/London | 6.125 | N/A | 9,093,816 | |||||||||||||
| 10,450,000 | (b),(e) | NatWest Group PLC | 6.000 | N/A | 10,465,372 | |||||||||||||
| 57,987,000 | (b),(e),(f) | NatWest Group PLC | 8.125 | N/A | 63,530,056 | |||||||||||||
| 19,349,000 | (b),(e) | NatWest Group PLC | 7.300 | N/A | 19,991,987 | |||||||||||||
| 17,000,000 | (b),(d),(e) | Nordea Bank Abp | 6.300 | N/A | 16,858,963 | |||||||||||||
| 12,501,000 | (b),(d),(e) | Nordea Bank Abp | 6.625 | N/A | 12,570,593 | |||||||||||||
| 34,335,000 | (b),(c),(g) | PNC Financial Services Group Inc/The | 6.250 | N/A | 34,725,938 | |||||||||||||
| 9,520,000 | (b),(c) | PNC Financial Services Group Inc/The | 3.400 | N/A | 9,173,200 | |||||||||||||
| 6,605,000 | (b),(c) | PNC Financial Services Group Inc/The | 6.000 | N/A | 6,617,672 | |||||||||||||
| 18,235,000 | (b),(c) | PNC Financial Services Group Inc/The | 6.200 | N/A | 18,432,084 | |||||||||||||
| 19,356,000 | (c) | Royal Bank of Canada | 6.750 | 08/24/85 | 19,568,916 | |||||||||||||
| 29,545,000 | (b),(d),(e) | Societe Generale SA | 9.375 | N/A | 31,621,807 | |||||||||||||
| 8,430,000 | (b),(d),(e) | Societe Generale SA | 8.500 | N/A | 8,933,870 | |||||||||||||
| 33,667,000 | (b),(d),(e) | Societe Generale SA | 10.000 | N/A | 37,113,760 | |||||||||||||
| 24,100,000 | (b),(c),(d) | Standard Chartered PLC | 7.014 | N/A | 24,861,560 | |||||||||||||
| 7,585,000 | (b),(d),(e) | Standard Chartered PLC | 7.750 | N/A | 7,890,031 | |||||||||||||
| 32,700,000 | (c) | Toronto-Dominion Bank/The | 8.125 | 10/31/82 | 34,468,678 | |||||||||||||
| 67,724,000 | (b),(c),(g) | Truist Financial Corp | 6.669 | N/A | 67,680,006 | |||||||||||||
| 6,687,000 | (b),(c),(g) | Truist Financial Corp | 5.100 | N/A | 6,581,892 | |||||||||||||
| 25,832,000 | (b),(c) | Wells Fargo & Co | 7.625 | N/A | 27,496,950 | |||||||||||||
| 24,770,000 | (c),(f) | Wells Fargo & Co | 7.950 | 11/15/29 | 27,530,478 | |||||||||||||
| 31,027,000 | (b),(c),(f) | Wells Fargo & Co | 3.900 | N/A | 30,737,524 | |||||||||||||
| 52,985,000 | (b),(c),(f),(g) | Wells Fargo & Co | 6.850 | N/A | 54,882,976 | |||||||||||||
| |
|
|||||||||||||||||
| TOTAL BANKS | 2,156,980,793 | |||||||||||||||||
| |
||||||||||||||||||
| CAPITAL GOODS - 1.2% (0.8% of Total Investments) | ||||||||||||||||||
| 8,660,000 | (b),(c) | Air Lease Corp | 4.650 | N/A | 8,554,504 | |||||||||||||
| 4,837,000 | (b),(c) | Air Lease Corp | 4.125 | N/A | 4,735,530 | |||||||||||||
| 9,254,000 | (b),(c) | Air Lease Corp | 6.000 | N/A | 9,090,502 | |||||||||||||
| See Notes to Financial Statements | 51 |
Portfolio of Investments July 31, 2025 (continued)
JPC
| PRINCIPAL | DESCRIPTION | RATE | MATURITY | VALUE | ||||||||||||||
| |
|
|||||||||||||||||
| CAPITAL GOODS (continued) | |
|||||||||||||||||
| $ | 1,960,000 | (c),(d) | ILFC E‑Capital Trust I | 6.430% | 12/21/65 | $ | 1,638,963 | |||||||||||
| 8,474,000 | (c),(d) | ILFC E‑Capital Trust I | 6.680 | 12/21/65 | 7,187,584 | |||||||||||||
| |
|
|||||||||||||||||
| TOTAL CAPITAL GOODS | 31,207,083 | |||||||||||||||||
| |
||||||||||||||||||
| ENERGY - 6.7% (4.3% of Total Investments) | |
|||||||||||||||||
| 2,798,000 | (c) | Enbridge Inc | 5.500 | 07/15/77 | 2,770,197 | |||||||||||||
| 22,395,000 | (c) | Enbridge Inc | 5.750 | 07/15/80 | 22,171,021 | |||||||||||||
| 17,110,000 | (c) | Enbridge Inc | 7.625 | 01/15/83 | 18,161,255 | |||||||||||||
| 1,900,000 | (c) | Enbridge Inc | 8.250 | 01/15/84 | 2,020,152 | |||||||||||||
| 38,512,000 | (c) | Enbridge Inc | 8.500 | 01/15/84 | 43,374,718 | |||||||||||||
| 2,550,000 | (b),(c) | Energy Transfer LP | 6.625 | N/A | 2,536,738 | |||||||||||||
| 23,921,000 | (b),(c) | Energy Transfer LP | 7.125 | N/A | 24,491,133 | |||||||||||||
| 4,074,000 | (b),(c) | Energy Transfer LP | 6.500 | N/A | 4,081,773 | |||||||||||||
| 4,990,000 | (c),(f) | Energy Transfer LP | 8.000 | 05/15/54 | 5,315,772 | |||||||||||||
| 7,362,000 | (c),(d),(f) | South Bow Canadian Infrastructure Holdings Ltd | 7.500 | 03/01/55 | 7,648,662 | |||||||||||||
| 3,490,000 | (c),(f) | Transcanada Trust | 5.875 | 08/15/76 | 3,482,739 | |||||||||||||
| 2,468,000 | (c) | Transcanada Trust | 5.500 | 09/15/79 | 2,421,380 | |||||||||||||
| 16,135,000 | (c) | Transcanada Trust | 5.600 | 03/07/82 | 15,690,650 | |||||||||||||
| 22,350,000 | (b),(c),(d) | Venture Global LNG Inc | 9.000 | N/A | 22,355,699 | |||||||||||||
| |
|
|||||||||||||||||
| TOTAL ENERGY | 176,521,889 | |||||||||||||||||
| |
||||||||||||||||||
| EQUITY REAL ESTATE INVESTMENT TRUSTS (REITS) - 0.6% (0.4% of Total Investments) | |
|||||||||||||||||
| 16,100,000 | (c),(d),(f) | Scentre Group Trust 2 | 5.125 | 09/24/80 | 15,831,169 | |||||||||||||
| |
|
|||||||||||||||||
| TOTAL EQUITY REAL ESTATE INVESTMENT TRUSTS (REITS) | 15,831,169 | |||||||||||||||||
| |
||||||||||||||||||
| FINANCIAL SERVICES - 20.9% (13.2% of Total Investments) | |
|||||||||||||||||
| 22,551,000 | (c),(f) | AerCap Ireland Capital DAC / AerCap Global Aviation Trust | 6.950 | 03/10/55 | 23,592,871 | |||||||||||||
| 18,100,000 | (c),(f) | AerCap Ireland Capital DAC / AerCap Global Aviation Trust | 6.500 | 01/31/56 | 18,321,073 | |||||||||||||
| 11,402,000 | (b),(c) | Ally Financial Inc | 4.700 | N/A | 11,068,244 | |||||||||||||
| 14,190,000 | (b),(c),(f) | Ally Financial Inc | 4.700 | N/A | 12,944,046 | |||||||||||||
| 8,050,000 | (b),(c),(d) | American AgCredit Corp | 5.250 | N/A | 7,808,500 | |||||||||||||
| 3,015,000 | (b),(c),(d) | Capital Farm Credit ACA | 5.000 | N/A | 2,984,850 | |||||||||||||
| 17,115,000 | (b),(c),(f) | Capital One Financial Corp | 3.950 | N/A | 16,698,164 | |||||||||||||
| 1,610,000 | (b),(c) | Capital One Financial Corp | 5.500 | N/A | 1,592,068 | |||||||||||||
| 41,640,000 | (b),(c),(g) | Charles Schwab Corp/The | 4.000 | N/A | 41,046,922 | |||||||||||||
| 1,350,000 | (b),(c),(d) | Compeer Financial ACA | 4.875 | N/A | 1,306,125 | |||||||||||||
| 3,989,000 | (c),(f) | Corebridge Financial Inc | 6.875 | 12/15/52 | 4,096,987 | |||||||||||||
| 8,455,000 | (b),(d),(i) | Credit Suisse Group AG | 7.500 | N/A | 993,463 | |||||||||||||
| 13,505,000 | (i) | Credit Suisse Group AG | 7.500 | 06/11/72 | 1,586,838 | |||||||||||||
| 9,090,000 | (i) | Credit Suisse Group AG | 6.380 | 02/21/72 | 1,068,075 | |||||||||||||
| 10,229,000 | (i) | Credit Suisse Group AG | 7.250 | 03/12/72 | 1,201,908 | |||||||||||||
| 18,750,000 | (i) | Credit Suisse Group AG | 0.000 | 01/17/72 | 2,203,125 | |||||||||||||
| 15,815,000 | (b),(e) | Deutsche Bank AG | 6.000 | N/A | 15,752,937 | |||||||||||||
| 32,800,000 | (b),(e) | Deutsche Bank AG, Reg S | 8.130 | N/A | 34,390,800 | |||||||||||||
| 25,062,000 | (b),(c) | Goldman Sachs Group Inc/The | 6.125 | N/A | 24,782,829 | |||||||||||||
| 8,120,000 | (b),(c) | Goldman Sachs Group Inc/The | 5.300 | N/A | 8,097,188 | |||||||||||||
| 23,482,000 | (b),(c),(f) | Goldman Sachs Group Inc/The | 6.850 | N/A | 23,981,217 | |||||||||||||
| 30,394,000 | (b),(c) | Goldman Sachs Group Inc/The | 7.500 | N/A | 31,756,563 | |||||||||||||
| 32,355,000 | (b),(c) | Goldman Sachs Group Inc/The | 7.500 | N/A | 34,175,098 | |||||||||||||
| 27,937,000 | (b),(c) | Goldman Sachs Group Inc/The | 7.379 | N/A | 28,043,161 | |||||||||||||
| 2,000,000 | (b),(e) | Julius Baer Group Ltd, Reg S | 7.500 | N/A | 2,020,000 | |||||||||||||
| 9,110,000 | (b),(e) | Nomura Holdings Inc | 7.000 | N/A | 9,224,367 | |||||||||||||
| 16,795,000 | (b),(c) | State Street Corp | 6.700 | N/A | 17,315,578 | |||||||||||||
| 48,572,000 | (b),(d),(e) | UBS Group AG | 9.250 | N/A | 56,936,244 | |||||||||||||
| 31,385,000 | (b),(d),(e) | UBS Group AG | 9.250 | N/A | 34,446,010 | |||||||||||||
| 37,460,000 | (b),(d),(e) | UBS Group AG | 7.750 | N/A | 39,930,262 | |||||||||||||
| 7,033,000 | (b),(d),(e) | UBS Group AG | 7.000 | N/A | 7,033,000 | |||||||||||||
| 27,956,000 | (b),(c),(g) | Voya Financial Inc | 7.758 | N/A | 29,535,514 | |||||||||||||
| |
|
|||||||||||||||||
| TOTAL FINANCIAL SERVICES | 545,934,027 | |||||||||||||||||
| |
||||||||||||||||||
| FOOD, BEVERAGE & TOBACCO - 2.3% (1.5% of Total Investments) | |
|||||||||||||||||
| 10,855,000 | (b),(c),(d) | Dairy Farmers of America Inc | 7.125 | N/A | 10,312,250 | |||||||||||||
| 30,110,000 | (b),(c),(d) | Land O’ Lakes Inc | 8.000 | N/A | 28,567,766 | |||||||||||||
| 16,840,000 | (b),(c),(d) | Land O’ Lakes Inc | 7.250 | N/A | 14,418,239 | |||||||||||||
| 52 | See Notes to Financial Statements |
| PRINCIPAL | DESCRIPTION | RATE | MATURITY | VALUE | ||||||||||||||
| |
|
|||||||||||||||||
| FOOD, BEVERAGE & TOBACCO (continued) | ||||||||||||||||||
| $ | 9,260,000 | (b),(c),(d) | Land O’ Lakes Inc | 7.000% | N/A | $ | 7,714,506 | |||||||||||
| |
|
|||||||||||||||||
| TOTAL FOOD, BEVERAGE & TOBACCO | 61,012,761 | |||||||||||||||||
| |
||||||||||||||||||
| HEALTH CARE EQUIPMENT & SERVICES - 0.4% (0.3% of Total Investments) | |
|||||||||||||||||
| 6,678,000 | (c),(f) | CVS Health Corp | 6.750 | 12/10/54 | 6,683,530 | |||||||||||||
| 3,792,000 | (c),(f) | CVS Health Corp | 7.000 | 03/10/55 | 3,901,361 | |||||||||||||
| |
|
|||||||||||||||||
| TOTAL HEALTH CARE EQUIPMENT & SERVICES | 10,584,891 | |||||||||||||||||
| |
||||||||||||||||||
| INSURANCE - 12.5% (7.9% of Total Investments) | ||||||||||||||||||
| 1,895,000 | (c) | Aegon Ltd | 5.500 | 04/11/48 | 1,897,841 | |||||||||||||
| 17,894,000 | (c),(f) | Assurant Inc | 7.000 | 03/27/48 | 18,277,248 | |||||||||||||
| 14,909,000 | (c),(d) | Assured Guaranty Municipal Holdings Inc | 6.400 | 12/15/66 | 13,743,267 | |||||||||||||
| 3,725,000 | (c),(f) | AXIS Specialty Finance LLC | 4.900 | 01/15/40 | 3,583,592 | |||||||||||||
| 19,473,000 | (c),(f) | Corebridge Financial Inc | 6.375 | 09/15/54 | 19,441,820 | |||||||||||||
| 14,208,000 | (c),(f) | Enstar Finance LLC | 5.500 | 01/15/42 | 13,966,750 | |||||||||||||
| 8,444,000 | (c),(d) | Enstar Group Ltd | 7.500 | 04/01/45 | 8,720,229 | |||||||||||||
| 2,670,000 | (c),(d) | Fidelis Insurance Holdings Ltd | 6.625 | 04/01/41 | 2,656,275 | |||||||||||||
| 19,860,000 | (c),(d),(f) | Liberty Mutual Group Inc | 7.800 | 03/15/37 | 23,198,755 | |||||||||||||
| 6,150,000 | (c),(d),(f) | Liberty Mutual Insurance Co | 7.697 | 10/15/97 | 6,705,324 | |||||||||||||
| 20,900,000 | (c),(d),(f) | MetLife Inc | 7.875 | 12/15/37 | 22,802,631 | |||||||||||||
| 9,417,000 | (c),(f) | MetLife Inc | 6.350 | 03/15/55 | 9,666,155 | |||||||||||||
| 2,215,000 | (b),(c) | MetLife Inc | 5.875 | N/A | 2,252,622 | |||||||||||||
| 3,000,000 | (c) | MetLife Inc | 10.750 | 08/01/39 | 3,983,910 | |||||||||||||
| 43,519,000 | (c),(d),(f) | MetLife Inc | 9.250 | 04/08/38 | 51,491,072 | |||||||||||||
| 31,538,000 | (c),(f) | Nationwide Financial Services Inc | 6.750 | 05/15/37 | 31,263,329 | |||||||||||||
| 18,531,000 | (d) | Omnis Funding Trust | 6.722 | 05/15/55 | 19,166,231 | |||||||||||||
| 13,185,000 | (c) | PartnerRe Finance B LLC | 4.500 | 10/01/50 | 12,253,680 | |||||||||||||
| 10,126,000 | (b),(e) | Phoenix Group Holdings PLC, Reg S | 8.500 | N/A | 10,679,285 | |||||||||||||
| 8,238,000 | (c) | Provident Financing Trust I | 7.405 | 03/15/38 | 8,777,959 | |||||||||||||
| 7,770,000 | (c),(f) | Prudential Financial Inc | 6.500 | 03/15/54 | 8,069,617 | |||||||||||||
| 2,890,000 | (c) | Prudential Financial Inc | 5.125 | 03/01/52 | 2,799,625 | |||||||||||||
| 3,000,000 | (c) | Prudential Financial Inc | 6.000 | 09/01/52 | 3,043,146 | |||||||||||||
| 5,000,000 | (c) | QBE Insurance Group Ltd, Reg S | 5.875 | 06/17/46 | 5,020,615 | |||||||||||||
| 11,975,000 | (b),(c),(d) | SBL Holdings Inc | 9.508 | N/A | 12,184,562 | |||||||||||||
| 11,535,000 | (b),(c),(d) | SBL Holdings Inc | 6.500 | N/A | 10,732,310 | |||||||||||||
| |
|
|||||||||||||||||
| TOTAL INSURANCE | 326,377,850 | |||||||||||||||||
| |
||||||||||||||||||
| MATERIALS - 0.5% (0.3% of Total Investments) | ||||||||||||||||||
| 13,149,000 | (b),(c),(d) | Cemex SAB de CV | 7.200 | N/A | 13,424,471 | |||||||||||||
| |
|
|||||||||||||||||
| TOTAL MATERIALS | 13,424,471 | |||||||||||||||||
| |
||||||||||||||||||
| MEDIA & ENTERTAINMENT - 0.2% (0.1% of Total Investments) | ||||||||||||||||||
| 4,065,000 | (c) | Paramount Global | 6.375 | 03/30/62 | 4,004,015 | |||||||||||||
| |
|
|||||||||||||||||
| TOTAL MEDIA & ENTERTAINMENT | 4,004,015 | |||||||||||||||||
| |
||||||||||||||||||
| TELECOMMUNICATION SERVICES - 2.5% (1.6% of Total Investments) | ||||||||||||||||||
| 12,777,000 | (c),(f) | Bell Telephone Co of Canada or Bell Canada | 7.000 | 09/15/55 | 12,967,251 | |||||||||||||
| 15,291,000 | (c),(f) | Rogers Communications Inc | 7.125 | 04/15/55 | 15,647,329 | |||||||||||||
| 10,707,000 | (c) | TELUS Corp | 7.000 | 10/15/55 | 10,839,949 | |||||||||||||
| 24,020,000 | (c) | Vodafone Group PLC | 7.000 | 04/04/79 | 25,100,732 | |||||||||||||
| 2,315,000 | (c) | Vodafone Group PLC | 4.125 | 06/04/81 | 2,131,932 | |||||||||||||
| |
|
|||||||||||||||||
| TOTAL TELECOMMUNICATION SERVICES | 66,687,193 | |||||||||||||||||
| |
||||||||||||||||||
| UTILITIES - 9.6% (6.1% of Total Investments) | ||||||||||||||||||
| 4,975,000 | (c),(d),(f) | AES Andes SA | 8.150 | 06/10/55 | 5,208,984 | |||||||||||||
| 9,298,000 | (c),(f) | AES Corp/The | 7.600 | 01/15/55 | 9,391,389 | |||||||||||||
| 13,436,000 | (c) | AES Corp/The | 6.950 | 07/15/55 | 12,945,880 | |||||||||||||
| 6,156,000 | (c),(d),(f) | AltaGas Ltd | 7.200 | 10/15/54 | 6,203,173 | |||||||||||||
| 8,859,000 | (c) | American Electric Power Co Inc | 3.875 | 02/15/62 | 8,542,762 | |||||||||||||
| 14,809,000 | (c),(f) | CMS Energy Corp | 6.500 | 06/01/55 | 14,932,107 | |||||||||||||
| 6,029,000 | (c),(f) | Dominion Energy Inc | 7.000 | 06/01/54 | 6,431,792 | |||||||||||||
| 5,393,000 | (c) | Dominion Energy Inc | 6.625 | 05/15/55 | 5,526,089 | |||||||||||||
| 7,065,000 | (c),(f) | Duke Energy Corp | 6.450 | 09/01/54 | 7,274,260 | |||||||||||||
| 4,117,000 | (c) | Edison International | 7.875 | 06/15/54 | 3,946,160 | |||||||||||||
| 6,470,000 | (c),(f) | Edison International | 8.125 | 06/15/53 | 6,344,324 | |||||||||||||
| 5,684,000 | (b),(c) | Edison International | 5.375 | N/A | 5,404,813 | |||||||||||||
| 4,680,000 | (b),(c) | Edison International | 5.000 | N/A | 4,116,207 | |||||||||||||
| See Notes to Financial Statements | 53 |
Portfolio of Investments July 31, 2025 (continued)
JPC
| PRINCIPAL | DESCRIPTION | RATE | MATURITY | VALUE | ||||||||||||||
| |
|
|||||||||||||||||
| UTILITIES (continued) | |
|||||||||||||||||
| $ | 41,756,000 | (c),(f) | Emera Inc | 6.750% | 06/15/76 | $ | 42,058,105 | |||||||||||
| 16,384,000 | (c),(f) | Entergy Corp | 7.125 | 12/01/54 | 16,961,996 | |||||||||||||
| 10,092,000 | (c),(f) | EUSHI Finance Inc | 7.625 | 12/15/54 | 10,544,394 | |||||||||||||
| 13,706,000 | (c),(f) | NextEra Energy Capital Holdings Inc | 6.750 | 06/15/54 | 14,300,498 | |||||||||||||
| 6,412,000 | (c),(f) | PG&E Corp | 7.375 | 03/15/55 | 6,187,467 | |||||||||||||
| 13,190,000 | (b),(c) | Sempra | 4.875 | N/A | 13,127,760 | |||||||||||||
| 8,976,000 | (c) | Sempra | 4.125 | 04/01/52 | 8,667,863 | |||||||||||||
| 12,480,000 | (c),(f) | Sempra | 6.550 | 04/01/55 | 12,041,820 | |||||||||||||
| 1,745,000 | (b),(c),(d) | Vistra Corp | 7.000 | N/A | 1,762,036 | |||||||||||||
| 12,725,000 | (b),(c),(d) | Vistra Corp | 8.000 | N/A | 12,988,611 | |||||||||||||
| 15,732,000 | (b),(c),(d) | Vistra Corp | 8.875 | N/A | 17,049,996 | |||||||||||||
| |
|
|||||||||||||||||
| TOTAL UTILITIES | 251,958,486 | |||||||||||||||||
| |
||||||||||||||||||
| TOTAL CORPORATE BONDS (Cost $3,612,717,746) |
3,682,863,105 | |||||||||||||||||
| |
||||||||||||||||||
| SHARES | DESCRIPTION | RATE | VALUE | |||||||||||||||
| |
|
|||||||||||||||||
| PREFERRED STOCK - 13.1% (8.3% of Total Investments) | |
|||||||||||||||||
| BANKS - 2.5% (1.6% of Total Investments) | |
|||||||||||||||||
| 304,913 | Fifth Third Bancorp | 8.267 | 7,793,576 | |||||||||||||||
| 825,668 | KeyCorp | 6.125 | 20,608,673 | |||||||||||||||
| 659,461 | KeyCorp | 6.200 | 16,433,768 | |||||||||||||||
| 157,850 | KeyCorp | 5.625 | 3,491,642 | |||||||||||||||
| 145,950 | KeyCorp | 5.650 | 3,226,955 | |||||||||||||||
| 517,064 | Regions Financial Corp | 5.700 | 12,859,382 | |||||||||||||||
| 4,825 | Synovus Financial Corp | 8.397 | 126,560 | |||||||||||||||
| |
|
|||||||||||||||||
| TOTAL BANKS | 64,540,556 | |||||||||||||||||
| |
||||||||||||||||||
| EQUITY REAL ESTATE INVESTMENT TRUSTS (REITS) - 0.2% (0.1% of Total Investments) | |
|||||||||||||||||
| 85,181 | Prologis Inc | 8.540 | 4,663,660 | |||||||||||||||
| |
|
|||||||||||||||||
| TOTAL EQUITY REAL ESTATE INVESTMENT TRUSTS (REITS) | 4,663,660 | |||||||||||||||||
| |
||||||||||||||||||
| FINANCIAL SERVICES - 4.7% (3.0% of Total Investments) | |
|||||||||||||||||
| 582,225 | Bank of New York Mellon Corp/The | 6.150 | 15,033,049 | |||||||||||||||
| 146,670 | Capital One Financial Corp | 5.000 | 2,884,999 | |||||||||||||||
| 381,058 | Equitable Holdings Inc | 5.250 | 7,880,279 | |||||||||||||||
| 102,771 | Equitable Holdings Inc | 4.300 | 1,730,664 | |||||||||||||||
| 116,785 | Morgan Stanley | 6.375 | 2,911,450 | |||||||||||||||
| 631,349 | Morgan Stanley | 7.125 | 16,055,205 | |||||||||||||||
| 842,201 | Morgan Stanley | 5.850 | 20,061,228 | |||||||||||||||
| 774,375 | Morgan Stanley | 6.625 | 19,947,900 | |||||||||||||||
| 79,400 | Morgan Stanley | 6.500 | 2,032,640 | |||||||||||||||
| 746,004 | Morgan Stanley | 6.875 | 18,836,601 | |||||||||||||||
| 144,314 | Synchrony Financial | 5.625 | 2,844,429 | |||||||||||||||
| 494,554 | Voya Financial Inc | 5.350 | 12,190,756 | |||||||||||||||
| |
|
|||||||||||||||||
| TOTAL FINANCIAL SERVICES | 122,409,200 | |||||||||||||||||
| |
||||||||||||||||||
| FOOD, BEVERAGE & TOBACCO - 1.6% (1.0% of Total Investments) | |
|||||||||||||||||
| 117,770 | CHS Inc | 7.875 | 3,145,637 | |||||||||||||||
| 577,198 | CHS Inc | 7.100 | 14,764,725 | |||||||||||||||
| 711,041 | CHS Inc | 6.750 | 17,456,056 | |||||||||||||||
| 56,400 | (d) | Dairy Farmers of America Inc | 7.875 | 5,414,400 | ||||||||||||||
| |
|
|||||||||||||||||
| TOTAL FOOD, BEVERAGE & TOBACCO | 40,780,818 | |||||||||||||||||
| |
||||||||||||||||||
| INSURANCE - 3.5% (2.2% of Total Investments) | |
|||||||||||||||||
| 437,400 | American National Group Inc | 7.375 | 11,066,220 | |||||||||||||||
| 434,249 | American National Group Inc | 6.625 | 10,986,500 | |||||||||||||||
| 124,080 | Aspen Insurance Holdings Ltd | 5.625 | 2,549,844 | |||||||||||||||
| 319,325 | Aspen Insurance Holdings Ltd | 7.125 | 7,887,328 | |||||||||||||||
| 96,786 | Assurant Inc | 5.250 | 1,909,588 | |||||||||||||||
| 206,658 | Athene Holding Ltd | 7.750 | 5,426,839 | |||||||||||||||
| 876,205 | Athene Holding Ltd | 6.350 | 21,808,742 | |||||||||||||||
| 80,000 | Axis Capital Holdings Ltd | 5.500 | 1,645,600 | |||||||||||||||
| 63,400 | Delphi Financial Group Inc | 7.778 | 1,537,450 | |||||||||||||||
| 537,770 | Enstar Group Ltd | 7.000 | 11,992,271 | |||||||||||||||
| 335,932 | Reinsurance Group of America Inc | 5.750 | 8,337,832 | |||||||||||||||
| 54 | See Notes to Financial Statements |
| SHARES | DESCRIPTION | RATE | VALUE | |||||||||||||||
| |
|
|||||||||||||||||
| INSURANCE (continued) | ||||||||||||||||||
| 207,319 | Reinsurance Group of America Inc | 7.125% | $ | 5,373,709 | ||||||||||||||
| 88,536 | Selective Insurance Group Inc | 4.600 | 1,540,526 | |||||||||||||||
| |
|
|||||||||||||||||
| TOTAL INSURANCE | 92,062,449 | |||||||||||||||||
| |
||||||||||||||||||
| TELECOMMUNICATION SERVICES - 0.5% (0.3% of Total Investments) | ||||||||||||||||||
| 686,314 | (f) | AT&T Inc | 4.750 | 13,383,123 | ||||||||||||||
| |
|
|||||||||||||||||
| TOTAL TELECOMMUNICATION SERVICES | 13,383,123 | |||||||||||||||||
| |
||||||||||||||||||
| UTILITIES - 0.1% (0.1% of Total Investments) | ||||||||||||||||||
| 154,489 | NextEra Energy Capital Holdings Inc | 5.650 | 3,477,547 | |||||||||||||||
| |
|
|||||||||||||||||
| TOTAL UTILITIES | 3,477,547 | |||||||||||||||||
| |
||||||||||||||||||
| TOTAL PREFERRED STOCK (Cost $350,423,099) |
341,317,353 | |||||||||||||||||
| |
||||||||||||||||||
| PRINCIPAL | DESCRIPTION | RATE | MATURITY | VALUE | ||||||||||||||
| |
|
|||||||||||||||||
| U.S. GOVERNMENT AND AGENCY OBLIGATIONS - 2.3% (1.5% of Total Investments) | |
|||||||||||||||||
| $ | 15,688,000 | (b) | CoBank ACB | 6.250 | N/A | 15,745,512 | ||||||||||||
| 4,883,000 | (b) | CoBank ACB | 7.250 | N/A | 5,020,281 | |||||||||||||
| 15,425,000 | (b),(f) | CoBank ACB | 7.125 | N/A | 15,924,107 | |||||||||||||
| 6,450,000 | (b),(d),(f) | Farm Credit Bank of Texas | 6.200 | N/A | 6,401,625 | |||||||||||||
| 7,694,000 | (b),(d),(f) | Farm Credit Bank of Texas | 7.750 | N/A | 7,968,360 | |||||||||||||
| 9,543,000 | (b) | Farm Credit Bank of Texas | 7.000 | N/A | 9,686,145 | |||||||||||||
| |
|
|||||||||||||||||
| TOTAL U.S. GOVERNMENT AND AGENCY OBLIGATIONS (Cost $59,858,931) |
60,746,030 | |||||||||||||||||
| |
||||||||||||||||||
| TOTAL LONG-TERM INVESTMENTS (Cost $4,047,885,000) |
4,106,219,812 | |||||||||||||||||
| |
||||||||||||||||||
| PRINCIPAL | DESCRIPTION | RATE | MATURITY | VALUE | ||||||||||||||
| |
|
|||||||||||||||||
| SHORT-TERM INVESTMENTS - 0.8%(0.5% of Total Investments) | ||||||||||||||||||
| REPURCHASE AGREEMENTS - 0.8% (0.5% of Total Investments) | ||||||||||||||||||
| 16,725,000 | (j) | Fixed Income Clearing Corporation | 4.330 | 08/01/25 | 16,725,000 | |||||||||||||
| 5,251,515 | (k) | Fixed Income Clearing Corporation | 1.360 | 08/01/25 | 5,251,515 | |||||||||||||
| |
|
|||||||||||||||||
| TOTAL REPURCHASE AGREEMENTS (Cost $21,976,515) |
21,976,515 | |||||||||||||||||
| |
||||||||||||||||||
| TOTAL SHORT-TERM INVESTMENTS (Cost $21,976,515) |
21,976,515 | |||||||||||||||||
| |
||||||||||||||||||
| TOTAL INVESTMENTS - 157.8% (Cost $4,069,861,515) |
4,128,196,327 | |||||||||||||||||
| |
||||||||||||||||||
| BORROWINGS - (24.8)% (l),(m) | (649,000,000) | |||||||||||||||||
| |
||||||||||||||||||
| REVERSE REPURCHASE AGREEMENTS, INCLUDING ACCRUED INTEREST - (18.0)%(n) | |
(471,894,299) | ||||||||||||||||
| |
||||||||||||||||||
| TFP SHARES, NET - (16.0)%(o) | (418,746,094) | |||||||||||||||||
| |
||||||||||||||||||
| OTHER ASSETS & LIABILITIES, NET - 1.0% | 26,890,135 | |||||||||||||||||
| |
||||||||||||||||||
| NET ASSETS APPLICABLE TO COMMON SHARES - 100% | $ | 2,615,446,069 | ||||||||||||||||
| |
||||||||||||||||||
All percentages shown in the Portfolio of Investments are based on net assets applicable to common shares unless otherwise noted.
| Reg S | Regulation S allows U.S. companies to sell securities to persons or entities located outside of the United States without registering those securities with the Securities and Exchange Commission. Specifically, Regulation S provides a safe harbor from the registration requirements of the Securities Act for the offers and sales of securities by both foreign and domestic issuers that are made outside the United States. | |
| TSFR3M | CME Term Secured Overnight Financing Rate 3 Month | |
| (a) | Contains $1,000 Par Preferred and/or Contingent Capital Securities. | |
| (b) | Perpetual security. Maturity date is not applicable. | |
| (c) | $1,000 Par Institutional Preferred security. As of the end of the period, the percent of $1,000 Par Institutional Preferred securities was 55.1% of Total Investments. | |
| (d) | Security is exempt from registration under Rule 144A of the Securities Act of 1933, as amended. These securities are deemed liquid and may be resold in transactions exempt from registration, which are normally those transactions with qualified institutional buyers. As of the end of the reporting period, the aggregate value of these securities is $1,010,970,804 or 24.5% of Total Investments. | |
| (e) | Contingent Capital Securities (“CoCos”) are debt or preferred securities with loss absorption characteristics built into the terms of the security for the benefit of the issuer, for example an automatic write-down of principal or a mandatory conversion into the issuer’s common stock under certain adverse circumstances, such as the issuer’s capital ratio falling below a specified level. As of the end of the reporting period, the Fund’s total investment in CoCos was 33.5% of Total Investments. | |
| See Notes to Financial Statements | 55 |
Portfolio of Investments July 31, 2025 (continued)
JPC
| (f) | Investment, or portion of investment, has been pledged to collateralize the net payment obligations for investments in reverse repurchase agreements. As of the end of the reporting period, investments with a value of $885,971,036 have been pledged as collateral for reverse repurchase agreements. | |
| (g) | Investment, or portion of investment, is hypothecated. The total value of investments hypothecated as of the end of the reporting period was $370,852,609. | |
| (h) | Floating or variable rate security includes the reference rate and spread, unless the variable rate is based on the underlying asset of the security. Coupon rate reflects the rate at period end. | |
| (i) | For fair value measurement disclosure purposes, investment classified as Level 3. | |
| (j) | Agreement with Fixed Income Clearing Corporation, 4.330% dated 7/31/25 to be repurchased at $16,727,012 on 8/1/25, collateralized by Government Agency Securities, with coupon rate 1.125% and maturity date 8/15/40, valued at $17,059,520. | |
| (k) | Agreement with Fixed Income Clearing Corporation, 1.360% dated 7/31/25 to be repurchased at $5,251,713 on 8/1/25, collateralized by Government Agency Securities, with coupon rate 4.750% and maturity date 5/15/55, valued at $5,356,656. | |
| (l) | Borrowings as a percentage of Total Investments is 15.7%. | |
| (m) | The Fund may pledge up to 100% of its eligible investments (excluding any investments separately pledged as collateral for specific investments in derivatives, when applicable) in the Portfolio of Investments as collateral for borrowings. As of the end of the reporting period, investments with a value of $1,418,716,507 have been pledged as collateral for borrowings. | |
| (n) | Reverse Repurchase Agreements, including accrued interest as a percentage of Total investments is 11.4%. | |
| (o) | TFP Shares, Net as a percentage of Total Investments is 10.1%. |
Investments in Derivatives
| Futures Contracts - Long | ||||||||||||||||||||
| Description | Number of Contracts |
Expiration Date |
Notional Amount |
Value | Unrealized Appreciation (Depreciation) |
|||||||||||||||
| U.S. Treasury 10‑Year Note | 1,530 | 9/25 | $ | 168,026,022 | $ | 169,925,625 | $ | 1,899,603 | ||||||||||||
| U.S. Treasury Ultra Bond | 137 | 9/25 | 15,698,969 | 16,071,813 | 372,844 | |||||||||||||||
| Total | $ | 183,724,991 | $ | 185,997,438 | $ | 2,272,447 | ||||||||||||||
| Interest Rate Swaps - OTC Uncleared | |
|||||||||||||||||||||||||||||||||||||||||||
| Counterparty | Fund Pay/Receive Floating Rate |
Floating Rate Index |
Fixed Rate (Annualized) |
Fixed Rate Payment Frequency |
Effective Date(a) |
Optional Termination Date |
Maturity Date |
Notional Amount |
Value | Unrealized Appreciation (Depreciation) |
||||||||||||||||||||||||||||||||||
| Morgan Stanley Capital Services, LLC | Receive | SOFR | 2.364 | % | Monthly | 7/01/19 | 7/01/26 | 7/01/28 | $ | 138,000,000 | $ | 2,390,002 | $ | 2,390,002 | ||||||||||||||||||||||||||||||
| SOFR | Secured Overnight Financing Rate |
| (a) | Effective date represents the date on which both the Fund and counterparty commence interest payment accruals on each contract. |
| 56 | See Notes to Financial Statements |
Portfolio of Investments July 31, 2025
JPI
| PRINCIPAL | DESCRIPTION | RATE | MATURITY | VALUE | ||||||||||||||
| |
|
|||||||||||||||||
| LONG-TERM INVESTMENTS - 155.1% (99.5% of Total Investments) | ||||||||||||||||||
| CORPORATE BONDS - 136.8% (87.7% of Total Investments) (a) | ||||||||||||||||||
| AUTOMOBILES & COMPONENTS - 0.8% (0.5% of Total Investments) | ||||||||||||||||||
| $1,483,000 | (b),(c) | General Motors Financial Co Inc | 5.750% | N/A | $ | 1,448,208 | ||||||||||||
| 900,000 | (b),(c) | General Motors Financial Co Inc | 5.700 | N/A | 878,024 | |||||||||||||
| |
|
|||||||||||||||||
| TOTAL AUTOMOBILES & COMPONENTS | 2,326,232 | |||||||||||||||||
| |
||||||||||||||||||
| BANKS - 78.4% (50.3% of Total Investments) | ||||||||||||||||||
| 620,000 | (b),(d),(e) | Australia & New Zealand Banking Group Ltd/United Kingdom | 6.750 | N/A | 628,858 | |||||||||||||
| 2,810,000 | (b),(e) | Banco Bilbao Vizcaya Argentaria SA | 6.125 | N/A | 2,785,031 | |||||||||||||
| 1,400,000 | (b),(e),(f) | Banco Bilbao Vizcaya Argentaria SA | 7.750 | N/A | 1,450,799 | |||||||||||||
| 3,642,000 | (b),(e) | Banco Bilbao Vizcaya Argentaria SA | 9.375 | N/A | 4,040,653 | |||||||||||||
| 1,000,000 | (b),(d),(e) | Banco Mercantil del Norte SA/Grand Cayman | 7.500 | N/A | 1,002,307 | |||||||||||||
| 2,579,500 | (b),(d),(e) | Banco Mercantil del Norte SA/Grand Cayman | 8.750 | N/A | 2,640,480 | |||||||||||||
| 5,000,000 | (b),(e),(f) | Banco Santander SA | 9.625 | N/A | 5,905,360 | |||||||||||||
| 1,060,000 | (b),(e) | Banco Santander SA | 4.750 | N/A | 1,036,707 | |||||||||||||
| 4,400,000 | (b),(e) | Banco Santander SA | 8.000 | N/A | 4,734,607 | |||||||||||||
| 4,862,000 | (b),(c) | Bank of America Corp | 6.625 | N/A | 4,978,946 | |||||||||||||
| 2,000,000 | (b),(c) | Bank of America Corp | 6.125 | N/A | 2,017,356 | |||||||||||||
| 2,215,000 | (b),(c) | Bank of America Corp | 6.250 | N/A | 2,207,380 | |||||||||||||
| 570,000 | (b),(c) | Bank of America Corp | 4.375 | N/A | 556,315 | |||||||||||||
| 2,350,000 | (b),(c) | Bank of America Corp | 6.300 | N/A | 2,359,203 | |||||||||||||
| 800,000 | (c) | Bank of Montreal | 7.700 | 05/26/84 | 836,923 | |||||||||||||
| 2,383,000 | (c) | Bank of Montreal | 7.300 | 11/26/84 | 2,472,637 | |||||||||||||
| 2,064,000 | (c) | Bank of Montreal | 6.875 | 11/26/85 | 2,068,128 | |||||||||||||
| 975,000 | (c),(f) | Bank of Nova Scotia/The | 8.000 | 01/27/84 | 1,039,364 | |||||||||||||
| 1,117,000 | (b),(e),(f) | Barclays PLC | 7.625 | N/A | 1,137,852 | |||||||||||||
| 7,914,000 | (b),(e),(g) | Barclays PLC | 9.625 | N/A | 8,939,496 | |||||||||||||
| 2,954,000 | (b),(e),(f) | Barclays PLC | 8.000 | N/A | 3,130,773 | |||||||||||||
| 1,106,000 | (b),(e) | Barclays PLC | 6.125 | N/A | 1,107,382 | |||||||||||||
| 1,116,000 | (b),(d),(e) | BNP Paribas SA | 7.450 | N/A | 1,136,925 | |||||||||||||
| 2,093,000 | (b),(d),(e) | BNP Paribas SA | 7.375 | N/A | 2,151,681 | |||||||||||||
| 1,360,000 | (b),(d),(e) | BNP Paribas SA | 9.250 | N/A | 1,463,763 | |||||||||||||
| 3,890,000 | (b),(d),(e),(f) | BNP Paribas SA | 8.500 | N/A | 4,147,841 | |||||||||||||
| 5,474,000 | (b),(d),(e) | BNP Paribas SA | 8.000 | N/A | 5,857,016 | |||||||||||||
| 4,085,000 | (b),(d),(e) | BNP Paribas SA | 7.750 | N/A | 4,320,615 | |||||||||||||
| 2,105,000 | (c) | Canadian Imperial Bank of Commerce | 6.950 | 01/28/85 | 2,116,317 | |||||||||||||
| 2,004,000 | (c) | Canadian Imperial Bank of Commerce | 7.000 | 10/28/85 | 2,022,036 | |||||||||||||
| 1,269,000 | (b),(c) | Citigroup Inc | 6.875 | N/A | 1,279,786 | |||||||||||||
| 1,170,000 | (b),(c),(f) | Citigroup Inc | 6.250 | N/A | 1,176,578 | |||||||||||||
| 2,315,000 | (b),(c),(f),(g) | Citigroup Inc | 7.375 | N/A | 2,404,963 | |||||||||||||
| 1,785,000 | (b),(c) | Citigroup Inc | 7.625 | N/A | 1,862,098 | |||||||||||||
| 4,555,000 | (b),(c),(g) | Citigroup Inc | 7.125 | N/A | 4,658,663 | |||||||||||||
| 1,853,000 | (b),(c) | Citigroup Inc | 7.000 | N/A | 1,925,198 | |||||||||||||
| 1,700,000 | (b),(c) | Citigroup Inc | 6.950 | N/A | 1,713,773 | |||||||||||||
| 880,000 | (b),(c),(h) | Citizens Financial Group Inc (TSFR3M + 3.419%) | 7.704 | N/A | 880,111 | |||||||||||||
| 5,090,000 | (b),(d),(e) | Credit Agricole SA | 6.700 | N/A | 5,091,909 | |||||||||||||
| 4,644,000 | (b),(d),(e) | Credit Agricole SA | 8.125 | N/A | 4,695,873 | |||||||||||||
| 275,000 | (b),(c),(h) | Fifth Third Bancorp (TSFR3M + 3.295%) | 7.590 | N/A | 274,618 | |||||||||||||
| 1,065,000 | (b),(c) | Fifth Third Bancorp | 4.500 | N/A | 1,061,184 | |||||||||||||
| 1,835,000 | (b),(c),(h) | First Citizens BancShares Inc/NC (TSFR3M + 4.234%) | 8.552 | N/A | 1,903,264 | |||||||||||||
| 1,352,000 | (b),(e),(f) | HSBC Holdings PLC | 6.950 | N/A | 1,382,129 | |||||||||||||
| 1,650,000 | (b),(e) | HSBC Holdings PLC | 6.500 | N/A | 1,680,175 | |||||||||||||
| 4,559,000 | (b),(e),(f),(g) | HSBC Holdings PLC | 8.000 | N/A | 4,820,418 | |||||||||||||
| 2,059,000 | (b),(e) | HSBC Holdings PLC | 6.875 | N/A | 2,122,110 | |||||||||||||
| 5,363,000 | (b),(e),(g) | HSBC Holdings PLC | 6.950 | N/A | 5,502,116 | |||||||||||||
| 3,240,000 | (b),(c) | Huntington Bancshares Inc/OH | 5.625 | N/A | 3,318,952 | |||||||||||||
| 3,035,000 | (b),(e),(g) | ING Groep NV | 5.750 | N/A | 3,025,368 | |||||||||||||
| 4,287,000 | (b),(e) | ING Groep NV, Reg S | 7.500 | N/A | 4,467,513 | |||||||||||||
| 2,529,000 | (b),(d),(e),(f) | Intesa Sanpaolo SpA | 7.700 | N/A | 2,535,317 | |||||||||||||
| 4,063,000 | (b),(c) | JPMorgan Chase & Co | 6.500 | N/A | 4,164,916 | |||||||||||||
| 985,000 | (b),(c) | JPMorgan Chase & Co | 3.650 | N/A | 968,644 | |||||||||||||
| 8,147,000 | (b),(c),(g) | JPMorgan Chase & Co | 6.875 | N/A | 8,515,024 | |||||||||||||
| See Notes to Financial Statements | 57 |
Portfolio of Investments July 31, 2025 (continued)
JPI
| PRINCIPAL | DESCRIPTION | RATE | MATURITY | VALUE | ||||||||||||||
| |
|
|||||||||||||||||
| BANKS (continued) | ||||||||||||||||||
| $874,000 | (b),(e) | Lloyds Banking Group PLC | 7.500% | N/A | $ | 876,820 | ||||||||||||
| 5,195,000 | (b),(e),(f) | Lloyds Banking Group PLC | 8.000 | N/A | 5,548,395 | |||||||||||||
| 1,816,000 | (b),(e) | Lloyds Banking Group PLC | 6.750 | N/A | 1,804,686 | |||||||||||||
| 1,550,000 | (b),(d),(e) | Macquarie Bank Ltd/London | 6.125 | N/A | 1,565,288 | |||||||||||||
| 6,762,000 | (b),(e) | NatWest Group PLC | 8.125 | N/A | 7,408,389 | |||||||||||||
| 2,099,000 | (b),(e) | NatWest Group PLC | 7.300 | N/A | 2,168,752 | |||||||||||||
| 1,125,000 | (b),(e) | NatWest Group PLC | 6.000 | N/A | 1,126,655 | |||||||||||||
| 1,748,000 | (b),(d),(e) | Nordea Bank Abp | 6.300 | N/A | 1,733,498 | |||||||||||||
| 1,285,000 | (b),(d),(e) | Nordea Bank Abp | 6.625 | N/A | 1,292,154 | |||||||||||||
| 5,315,000 | (b),(c),(f) | PNC Financial Services Group Inc/The | 6.250 | N/A | 5,375,517 | |||||||||||||
| 945,000 | (b),(c) | PNC Financial Services Group Inc/The | 6.200 | N/A | 955,214 | |||||||||||||
| 660,000 | (b),(c) | PNC Financial Services Group Inc/The | 6.000 | N/A | 661,266 | |||||||||||||
| 2,092,000 | (c) | Royal Bank of Canada | 6.750 | 08/24/85 | 2,115,012 | |||||||||||||
| 3,480,000 | (b),(d),(e),(g) | Societe Generale SA | 9.375 | N/A | 3,724,620 | |||||||||||||
| 1,420,000 | (b),(d),(e) | Societe Generale SA | 8.500 | N/A | 1,504,875 | |||||||||||||
| 3,981,000 | (b),(d),(e),(f) | Societe Generale SA | 10.000 | N/A | 4,388,567 | |||||||||||||
| 3,140,000 | (b),(d),(e),(g) | Standard Chartered PLC | 7.750 | N/A | 3,266,275 | |||||||||||||
| 1,990,000 | (c) | Toronto-Dominion Bank/The | 8.125 | 10/31/82 | 2,097,635 | |||||||||||||
| 5,609,000 | (b),(c),(g) | Truist Financial Corp | 6.669 | N/A | 5,605,356 | |||||||||||||
| 1,320,000 | (b),(c) | Truist Financial Corp | 5.100 | N/A | 1,299,252 | |||||||||||||
| 1,230,000 | (c),(f) | Wells Fargo & Co | 7.950 | 11/15/29 | 1,367,077 | |||||||||||||
| 2,812,000 | (b),(c),(g) | Wells Fargo & Co | 3.900 | N/A | 2,785,765 | |||||||||||||
| 6,965,000 | (b),(c),(g) | Wells Fargo & Co | 7.625 | N/A | 7,413,915 | |||||||||||||
| 3,684,000 | (b),(c),(f) | Wells Fargo & Co | 6.850 | N/A | 3,815,965 | |||||||||||||
| |
|
|||||||||||||||||
| TOTAL BANKS | 221,624,399 | |||||||||||||||||
| |
||||||||||||||||||
| CAPITAL GOODS - 2.5% (1.6% of Total Investments) | ||||||||||||||||||
| 488,000 | (b),(c) | Air Lease Corp | 4.125 | N/A | 477,763 | |||||||||||||
| 963,000 | (b),(c) | Air Lease Corp | 6.000 | N/A | 945,986 | |||||||||||||
| 6,657,000 | (c),(d) | ILFC E‑ Capital Trust I | 6.680 | 12/21/65 | 5,646,418 | |||||||||||||
| |
|
|||||||||||||||||
| TOTAL CAPITAL GOODS | 7,070,167 | |||||||||||||||||
| |
||||||||||||||||||
| ENERGY - 6.7% (4.3% of Total Investments) | ||||||||||||||||||
| 1,245,000 | (c) | Enbridge Inc | 5.500 | 07/15/77 | 1,232,629 | |||||||||||||
| 1,920,000 | (c) | Enbridge Inc | 5.750 | 07/15/80 | 1,900,798 | |||||||||||||
| 1,905,000 | (c) | Enbridge Inc | 7.625 | 01/15/83 | 2,022,045 | |||||||||||||
| 4,046,000 | (c) | Enbridge Inc | 8.500 | 01/15/84 | 4,556,868 | |||||||||||||
| 436,000 | (b),(c) | Energy Transfer LP | 6.625 | N/A | 433,732 | |||||||||||||
| 2,580,000 | (b),(c) | Energy Transfer LP | 7.125 | N/A | 2,641,492 | |||||||||||||
| 490,000 | (b),(c) | Energy Transfer LP | 6.500 | N/A | 490,935 | |||||||||||||
| 495,000 | (c),(f) | Energy Transfer LP | 8.000 | 05/15/54 | 527,316 | |||||||||||||
| 901,000 | (c),(d),(f) | South Bow Canadian Infrastructure Holdings Ltd | 7.500 | 03/01/55 | 936,083 | |||||||||||||
| 655,000 | (c),(f) | Transcanada Trust | 5.875 | 08/15/76 | 653,637 | |||||||||||||
| 1,650,000 | (c) | Transcanada Trust | 5.600 | 03/07/82 | 1,604,560 | |||||||||||||
| 1,860,000 | (b),(c),(d) | Venture Global LNG Inc | 9.000 | N/A | 1,860,474 | |||||||||||||
| |
|
|||||||||||||||||
| TOTAL ENERGY | 18,860,569 | |||||||||||||||||
| |
||||||||||||||||||
| FINANCIAL SERVICES - 21.6% (13.9% of Total Investments) | ||||||||||||||||||
| 1,266,000 | (c),(f) | AerCap Ireland Capital DAC / AerCap Global Aviation Trust | 6.950 | 03/10/55 | 1,324,490 | |||||||||||||
| 2,800,000 | (c) | AerCap Ireland Capital DAC / AerCap Global Aviation Trust | 6.500 | 01/31/56 | 2,834,199 | |||||||||||||
| 883,000 | (b),(c) | Ally Financial Inc | 4.700 | N/A | 857,153 | |||||||||||||
| 1,549,000 | (b),(c) | Ally Financial Inc | 4.700 | N/A | 1,412,990 | |||||||||||||
| 2,010,000 | (b),(c),(d) | American AgCredit Corp | 5.250 | N/A | 1,949,700 | |||||||||||||
| 2,425,000 | (b),(c),(d),(g) | Capital Farm Credit ACA | 5.000 | N/A | 2,400,750 | |||||||||||||
| 1,755,000 | (b),(c) | Capital One Financial Corp | 3.950 | N/A | 1,712,257 | |||||||||||||
| 800,000 | (b),(c) | Capital One Financial Corp | 5.500 | N/A | 791,089 | |||||||||||||
| 2,135,000 | (b),(c) | Charles Schwab Corp/The | 4.000 | N/A | 2,104,591 | |||||||||||||
| 1,050,000 | (b),(c),(d) | Compeer Financial ACA | 4.875 | N/A | 1,015,875 | |||||||||||||
| 4,285,000 | (b),(d),(i) | Credit Suisse Group AG | 7.500 | N/A | 503,488 | |||||||||||||
| 5,802,000 | (i) | Credit Suisse Group AG | 7.500 | 06/11/72 | 681,735 | |||||||||||||
| 1,955,000 | (i) | Credit Suisse Group AG | 6.380 | 02/21/72 | 229,713 | |||||||||||||
| 9,496,000 | (i) | Credit Suisse Group AG | 7.250 | 03/12/72 | 1,115,780 | |||||||||||||
| 8,520,000 | (i) | Credit Suisse Group AG | 0.000 | 01/17/72 | 1,001,100 | |||||||||||||
| 1,565,000 | (b),(e) | Deutsche Bank AG | 6.000 | N/A | 1,558,858 | |||||||||||||
| 58 | See Notes to Financial Statements |
| PRINCIPAL | DESCRIPTION | RATE | MATURITY | VALUE | ||||||||||||||
| |
|
|||||||||||||||||
| FINANCIAL SERVICES (continued) | ||||||||||||||||||
| $3,600,000 | (b),(e) | Deutsche Bank AG, Reg S | 8.130% | N/A | $ | 3,774,600 | ||||||||||||
| 2,521,000 | (b),(c),(f) | Goldman Sachs Group Inc/The | 6.850 | N/A | 2,574,595 | |||||||||||||
| 827,000 | (b),(c),(f) | Goldman Sachs Group Inc/The | 5.300 | N/A | 824,677 | |||||||||||||
| 2,930,000 | (b),(c) | Goldman Sachs Group Inc/The | 6.125 | N/A | 2,897,362 | |||||||||||||
| 3,582,000 | (b),(c),(g) | Goldman Sachs Group Inc/The | 7.500 | N/A | 3,742,581 | |||||||||||||
| 3,195,000 | (b),(c) | Goldman Sachs Group Inc/The | 7.500 | N/A | 3,374,732 | |||||||||||||
| 2,455,000 | (b),(c),(f) | Goldman Sachs Group Inc/The | 7.379 | N/A | 2,464,329 | |||||||||||||
| 400,000 | (b),(e) | Julius Baer Group Ltd, Reg S | 7.500 | N/A | 404,000 | |||||||||||||
| 1,006,000 | (b),(e) | Nomura Holdings Inc | 7.000 | N/A | 1,018,629 | |||||||||||||
| 1,650,000 | (b),(c) | State Street Corp | 6.700 | N/A | 1,701,143 | |||||||||||||
| 5,195,000 | (b),(d),(e),(f) | UBS Group AG | 9.250 | N/A | 6,089,595 | |||||||||||||
| 3,965,000 | (b),(d),(e),(f) | UBS Group AG | 9.250 | N/A | 4,351,710 | |||||||||||||
| 3,644,000 | (b),(d),(e) | UBS Group AG | 7.750 | N/A | 3,884,300 | |||||||||||||
| 748,000 | (b),(d),(e) | UBS Group AG | 7.000 | N/A | 748,000 | |||||||||||||
| 1,671,000 | (b),(c),(f) | Voya Financial Inc | 7.758 | N/A | 1,765,412 | |||||||||||||
| |
|
|||||||||||||||||
| TOTAL FINANCIAL SERVICES | 61,109,433 | |||||||||||||||||
| |
||||||||||||||||||
| FOOD, BEVERAGE & TOBACCO - 2.4% (1.5% of Total Investments) | ||||||||||||||||||
| 1,750,000 | (b),(c),(d) | Dairy Farmers of America Inc | 7.125 | N/A | 1,662,500 | |||||||||||||
| 6,023,000 | (b),(c),(d),(g) | Land O’ Lakes Inc | 7.000 | N/A | 5,017,761 | |||||||||||||
| |
|
|||||||||||||||||
| TOTAL FOOD, BEVERAGE & TOBACCO | 6,680,261 | |||||||||||||||||
| |
||||||||||||||||||
| HEALTH CARE EQUIPMENT & SERVICES - 0.4% (0.3% of Total Investments) | ||||||||||||||||||
| 719,000 | (c) | CVS Health Corp | 6.750 | 12/10/54 | 719,595 | |||||||||||||
| 408,000 | (c) | CVS Health Corp | 7.000 | 03/10/55 | 419,767 | |||||||||||||
| |
|
|||||||||||||||||
| TOTAL HEALTH CARE EQUIPMENT & SERVICES | 1,139,362 | |||||||||||||||||
| |
||||||||||||||||||
| INSURANCE - 11.0% (7.0% of Total Investments) | ||||||||||||||||||
| 1,505,000 | (c),(f) | Aegon Ltd | 5.500 | 04/11/48 | 1,507,256 | |||||||||||||
| 3,080,000 | (c),(f) | Assurant Inc | 7.000 | 03/27/48 | 3,145,967 | |||||||||||||
| 4,600,000 | (c),(d),(g) | Assured Guaranty Municipal Holdings Inc | 6.400 | 12/15/66 | 4,240,326 | |||||||||||||
| 670,000 | (c),(f) | AXIS Specialty Finance LLC | 4.900 | 01/15/40 | 644,565 | |||||||||||||
| 1,981,000 | (c),(f) | Corebridge Financial Inc | 6.375 | 09/15/54 | 1,977,828 | |||||||||||||
| 540,000 | (c) | Enstar Finance LLC | 5.750 | 09/01/40 | 538,650 | |||||||||||||
| 1,505,000 | (c),(f) | Enstar Finance LLC | 5.500 | 01/15/42 | 1,479,445 | |||||||||||||
| 904,000 | (c),(d),(f) | Enstar Group Ltd | 7.500 | 04/01/45 | 933,573 | |||||||||||||
| 2,740,000 | (c),(d),(f) | MetLife Inc | 9.250 | 04/08/38 | 3,241,930 | |||||||||||||
| 395,000 | (b),(c),(f) | MetLife Inc | 5.875 | N/A | 401,709 | |||||||||||||
| 1,008,000 | (c),(f) | MetLife Inc | 6.350 | 03/15/55 | 1,034,670 | |||||||||||||
| 1,994,000 | (d) | Omnis Funding Trust | 6.722 | 05/15/55 | 2,062,353 | |||||||||||||
| 1,335,000 | (c) | PartnerRe Finance B LLC | 4.500 | 10/01/50 | 1,240,703 | |||||||||||||
| 1,101,000 | (b),(e) | Phoenix Group Holdings PLC, Reg S | 8.500 | N/A | 1,161,159 | |||||||||||||
| 1,405,000 | (c),(f) | Prudential Financial Inc | 5.125 | 03/01/52 | 1,361,063 | |||||||||||||
| 692,000 | (c),(f) | Prudential Financial Inc | 6.500 | 03/15/54 | 718,684 | |||||||||||||
| 4,695,000 | (b),(c),(d),(g) | SBL Holdings Inc | 9.508 | N/A | 4,777,162 | |||||||||||||
| 600,000 | (b),(c),(d) | SBL Holdings Inc | 6.500 | N/A | 558,248 | |||||||||||||
| |
|
|||||||||||||||||
| TOTAL INSURANCE | 31,025,291 | |||||||||||||||||
| |
||||||||||||||||||
| MATERIALS - 0.5% (0.3% of Total Investments) | ||||||||||||||||||
| 1,419,000 | (b),(c),(d) | Cemex SAB de CV | 7.200 | N/A | 1,448,728 | |||||||||||||
| |
|
|||||||||||||||||
| TOTAL MATERIALS | 1,448,728 | |||||||||||||||||
| |
||||||||||||||||||
| MEDIA & ENTERTAINMENT - 0.6% (0.4% of Total Investments) | ||||||||||||||||||
| 1,660,000 | (c) | Paramount Global | 6.375 | 03/30/62 | 1,635,096 | |||||||||||||
| |
|
|||||||||||||||||
| TOTAL MEDIA & ENTERTAINMENT | 1,635,096 | |||||||||||||||||
| |
||||||||||||||||||
| TELECOMMUNICATION SERVICES - 2.6% (1.6% of Total Investments) | ||||||||||||||||||
| 1,369,000 | (c),(f) | Bell Telephone Co of Canada or Bell Canada | 7.000 | 09/15/55 | 1,389,385 | |||||||||||||
| 1,640,000 | (c),(f) | Rogers Communications Inc | 7.125 | 04/15/55 | 1,678,217 | |||||||||||||
| 1,152,000 | (c) | TELUS Corp | 7.000 | 10/15/55 | 1,166,305 | |||||||||||||
| 1,680,000 | (c) | Vodafone Group PLC | 7.000 | 04/04/79 | 1,755,588 | |||||||||||||
| 1,290,000 | (c) | Vodafone Group PLC | 4.125 | 06/04/81 | 1,187,988 | |||||||||||||
| |
|
|||||||||||||||||
| TOTAL TELECOMMUNICATION SERVICES | 7,177,483 | |||||||||||||||||
| |
||||||||||||||||||
| See Notes to Financial Statements | 59 |
Portfolio of Investments July 31, 2025 (continued)
JPI
| PRINCIPAL | DESCRIPTION | RATE | MATURITY | VALUE | ||||||||||||||
| |
|
|||||||||||||||||
| UTILITIES - 9.3% (6.0% of Total Investments) | ||||||||||||||||||
| $1,000,000 | (c),(d),(f) | AES Andes SA | 8.150% | 06/10/55 | $ | 1,047,032 | ||||||||||||
| 933,000 | (c) | AES Corp/The | 7.600 | 01/15/55 | 942,371 | |||||||||||||
| 1,445,000 | (c) | AES Corp/The | 6.950 | 07/15/55 | 1,392,289 | |||||||||||||
| 623,000 | (c),(d),(f) | AltaGas Ltd | 7.200 | 10/15/54 | 627,774 | |||||||||||||
| 868,000 | (c) | American Electric Power Co Inc | 3.875 | 02/15/62 | 837,015 | |||||||||||||
| 945,000 | (c),(f) | CMS Energy Corp | 6.500 | 06/01/55 | 952,856 | |||||||||||||
| 1,029,000 | (c) | Dominion Energy Inc | 7.000 | 06/01/54 | 1,097,746 | |||||||||||||
| 759,000 | (c),(f) | Duke Energy Corp | 6.450 | 09/01/54 | 781,481 | |||||||||||||
| 695,000 | (c),(f) | Edison International | 8.125 | 06/15/53 | 681,500 | |||||||||||||
| 443,000 | (c) | Edison International | 7.875 | 06/15/54 | 424,617 | |||||||||||||
| 611,000 | (b),(c) | Edison International | 5.375 | N/A | 580,989 | |||||||||||||
| 810,000 | (b),(c),(g) | Edison International | 5.000 | N/A | 712,421 | |||||||||||||
| 5,100,000 | (c),(f) | Emera Inc | 6.750 | 06/15/76 | 5,136,899 | |||||||||||||
| 1,557,000 | (c),(f) | Entergy Corp | 7.125 | 12/01/54 | 1,611,928 | |||||||||||||
| 991,000 | (c),(f) | EUSHI Finance Inc | 7.625 | 12/15/54 | 1,035,424 | |||||||||||||
| 1,425,000 | (c),(f) | NextEra Energy Capital Holdings Inc | 6.750 | 06/15/54 | 1,486,809 | |||||||||||||
| 662,000 | (c) | PG&E Corp | 7.375 | 03/15/55 | 638,818 | |||||||||||||
| 1,365,000 | (b),(c) | Sempra | 4.875 | N/A | 1,358,559 | |||||||||||||
| 785,000 | (c) | Sempra | 4.125 | 04/01/52 | 758,052 | |||||||||||||
| 1,338,000 | (c),(f) | Sempra | 6.550 | 04/01/55 | 1,291,022 | |||||||||||||
| 95,000 | (b),(c),(d) | Vistra Corp | 7.000 | N/A | 95,927 | |||||||||||||
| 1,135,000 | (b),(c),(d) | Vistra Corp | 8.000 | N/A | 1,158,513 | |||||||||||||
| 1,599,000 | (b),(c),(d) | Vistra Corp | 8.875 | N/A | 1,732,961 | |||||||||||||
| |
|
|||||||||||||||||
| TOTAL UTILITIES | 26,383,003 | |||||||||||||||||
| |
||||||||||||||||||
| TOTAL CORPORATE BONDS (Cost $399,187,091) |
386,480,024 | |||||||||||||||||
| |
||||||||||||||||||
| SHARES | DESCRIPTION | RATE | VALUE | |||||||||||||||
| |
|
|||||||||||||||||
| PREFERRED STOCK - 16.0% (10.3% of Total Investments) | ||||||||||||||||||
| BANKS - 2.8% (1.8% of Total Investments) | ||||||||||||||||||
| 52,676 | Fifth Third Bancorp | 8.267 | 1,346,399 | |||||||||||||||
| 45,900 | KeyCorp | 6.125 | 1,145,664 | |||||||||||||||
| 135,223 | KeyCorp | 6.200 | 3,369,757 | |||||||||||||||
| 16,925 | KeyCorp | 5.625 | 374,381 | |||||||||||||||
| 15,709 | KeyCorp | 5.650 | 347,326 | |||||||||||||||
| 57,838 | Regions Financial Corp | 5.700 | 1,438,431 | |||||||||||||||
| 514 | Synovus Financial Corp | 8.397 | 13,482 | |||||||||||||||
| |
|
|||||||||||||||||
| TOTAL BANKS | 8,035,440 | |||||||||||||||||
| |
||||||||||||||||||
| FINANCIAL SERVICES - 5.1% (3.3% of Total Investments) | ||||||||||||||||||
| 62,325 | Bank of New York Mellon Corp/The | 6.150 | 1,609,231 | |||||||||||||||
| 15,000 | Capital One Financial Corp | 5.000 | 295,050 | |||||||||||||||
| 37,250 | (f) | Equitable Holdings Inc | 5.250 | 770,330 | ||||||||||||||
| 53,300 | Morgan Stanley | 6.375 | 1,328,769 | |||||||||||||||
| 51,372 | Morgan Stanley | 7.125 | 1,306,390 | |||||||||||||||
| 67,475 | Morgan Stanley | 5.850 | 1,607,255 | |||||||||||||||
| 82,600 | Morgan Stanley | 6.625 | 2,127,776 | |||||||||||||||
| 16,000 | (f) | Morgan Stanley | 6.500 | 409,600 | ||||||||||||||
| 75,976 | Morgan Stanley | 6.875 | 1,918,394 | |||||||||||||||
| 20,750 | Synchrony Financial | 5.625 | 408,982 | |||||||||||||||
| 100,083 | Voya Financial Inc | 5.350 | 2,467,046 | |||||||||||||||
| |
|
|||||||||||||||||
| TOTAL FINANCIAL SERVICES | 14,248,823 | |||||||||||||||||
| |
||||||||||||||||||
| FOOD, BEVERAGE & TOBACCO - 2.5% (1.6% of Total Investments) | ||||||||||||||||||
| 61,800 | CHS Inc | 7.875 | 1,650,678 | |||||||||||||||
| 76,428 | CHS Inc | 7.100 | 1,955,028 | |||||||||||||||
| 59,605 | CHS Inc | 6.750 | 1,463,303 | |||||||||||||||
| 20,500 | (d) | Dairy Farmers of America Inc | 7.875 | 1,968,000 | ||||||||||||||
| |
|
|||||||||||||||||
| TOTAL FOOD, BEVERAGE & TOBACCO | 7,037,009 | |||||||||||||||||
| |
||||||||||||||||||
| INSURANCE - 5.3% (3.4% of Total Investments) | ||||||||||||||||||
| 47,025 | American National Group Inc | 7.375 | 1,189,733 | |||||||||||||||
| 79,578 | American National Group Inc | 6.625 | 2,013,323 | |||||||||||||||
| 62,000 | Aspen Insurance Holdings Ltd | 5.625 | 1,274,100 | |||||||||||||||
| 60 | See Notes to Financial Statements |
| SHARES | DESCRIPTION | RATE | VALUE | |||||||||||||||
| |
|
|||||||||||||||||
| INSURANCE (continued) | ||||||||||||||||||
| 34,350 | Aspen Insurance Holdings Ltd | 7.125% | $ | 848,445 | ||||||||||||||
| 45,000 | (f) | Assurant Inc | 5.250 | 887,850 | ||||||||||||||
| 89,300 | (f) | Athene Holding Ltd | 6.350 | 2,222,677 | ||||||||||||||
| 98,400 | (f) | Enstar Group Ltd | 7.000 | 2,194,320 | ||||||||||||||
| 80,311 | (f) | Reinsurance Group of America Inc | 5.750 | 1,993,319 | ||||||||||||||
| 64,300 | (f) | Reinsurance Group of America Inc | 7.125 | 1,666,656 | ||||||||||||||
| 43,200 | (f) | Selective Insurance Group Inc | 4.600 | 751,680 | ||||||||||||||
| |
|
|||||||||||||||||
| TOTAL INSURANCE | 15,042,103 | |||||||||||||||||
| |
||||||||||||||||||
| TELECOMMUNICATION SERVICES - 0.3% (0.2% of Total Investments) |
||||||||||||||||||
| 49,500 | (f) | AT&T Inc | 4.750 | 965,250 | ||||||||||||||
| |
|
|||||||||||||||||
| TOTAL TELECOMMUNICATION SERVICES | 965,250 | |||||||||||||||||
| |
||||||||||||||||||
| TOTAL PREFERRED STOCK (Cost $46,945,293) |
45,328,625 | |||||||||||||||||
| |
||||||||||||||||||
| PRINCIPAL | DESCRIPTION | RATE | MATURITY | VALUE | ||||||||||||||
| |
|
|||||||||||||||||
| U.S. GOVERNMENT AND AGENCY OBLIGATIONS - 2.3% (1.5% of Total Investments) | |
|||||||||||||||||
| $ | 3,617,000 | (b),(f) | CoBank ACB | 7.250 | N/A | 3,718,689 | ||||||||||||
| 1,653,000 | (b),(f) | CoBank ACB | 7.125 | N/A | 1,706,486 | |||||||||||||
| 1,024,000 | (b) | Farm Credit Bank of Texas | 7.000 | N/A | 1,039,360 | |||||||||||||
| |
|
|||||||||||||||||
| TOTAL U.S. GOVERNMENT AND AGENCY OBLIGATIONS (Cost $6,422,857) |
6,464,535 | |||||||||||||||||
| |
||||||||||||||||||
| TOTAL LONG-TERM INVESTMENTS (Cost $452,555,241) |
438,273,184 | |||||||||||||||||
| |
||||||||||||||||||
| PRINCIPAL | DESCRIPTION | RATE | MATURITY | VALUE | ||||||||||||||
| |
|
|||||||||||||||||
| SHORT-TERM INVESTMENTS - 0.8% (0.5% of Total Investments) | |
|||||||||||||||||
| REPURCHASE AGREEMENTS - 0.8% (0.5% of Total Investments) | |
|||||||||||||||||
| 1,589,396 | (j) | Fixed Income Clearing Corporation | 1.360 | 08/01/25 | 1,589,396 | |||||||||||||
| 700,000 | (k) | Fixed Income Clearing Corporation | 4.330 | 08/01/25 | 700,000 | |||||||||||||
| |
|
|||||||||||||||||
| TOTAL REPURCHASE AGREEMENTS (Cost $2,289,396) |
2,289,396 | |||||||||||||||||
| |
||||||||||||||||||
| TOTAL SHORT-TERM INVESTMENTS (Cost $2,289,396) |
2,289,396 | |||||||||||||||||
| |
||||||||||||||||||
| TOTAL INVESTMENTS - 155.9% (Cost $454,844,637) |
440,562,580 | |||||||||||||||||
| |
||||||||||||||||||
| BORROWINGS - (41.8)% (l),(m) |
(118,000,000) | |||||||||||||||||
| |
||||||||||||||||||
| REVERSE REPURCHASE AGREEMENTS, INCLUDING ACCRUED INTEREST - (14.7)%(n) |
|
(41,647,626) | ||||||||||||||||
| |
||||||||||||||||||
| OTHER ASSETS & LIABILITIES, NET - 0.6% |
1,650,792 | |||||||||||||||||
| |
||||||||||||||||||
| NET ASSETS APPLICABLE TO COMMON SHARES - 100% |
$ | 282,565,746 | ||||||||||||||||
| |
||||||||||||||||||
All percentages shown in the Portfolio of Investments are based on net assets applicable to common shares unless otherwise noted.
| Reg S | Regulation S allows U.S. companies to sell securities to persons or entities located outside of the United States without registering those securities with the Securities and Exchange Commission. Specifically, Regulation S provides a safe harbor from the registration requirements of the Securities Act for the offers and sales of securities by both foreign and domestic issuers that are made outside the United States. |
| TSFR3M | CME Term Secured Overnight Financing Rate 3 Month |
| (a) | Contains $1,000 Par Preferred and/or Contingent Capital Securities. |
| (b) | Perpetual security. Maturity date is not applicable. |
| (c) | $1,000 Par Institutional Preferred security. As of the end of the period, the percent of $1,000 Par Institutional Preferred securities was 51.9% of Total Investments. |
| (d) | Security is exempt from registration under Rule 144A of the Securities Act of 1933, as amended. These securities are deemed liquid and may be resold in transactions exempt from registration, which are normally those transactions with qualified institutional buyers. As of the end of the reporting period, the aggregate value of these securities is $113,107,043 or 25.7% of Total Investments. |
| (e) | Contingent Capital Securities (“CoCos”) are debt or preferred securities with loss absorption characteristics built into the terms of the security for the benefit of the issuer, for example an automatic write-down of principal or a mandatory conversion into the issuer’s common stock under certain adverse circumstances, such as the issuer’s capital ratio falling below a specified level. As of the end of the reporting period, the Fund’s total investment in CoCos was 34.6% of Total Investments. |
| See Notes to Financial Statements | 61 |
Portfolio of Investments July 31, 2025 (continued)
JPI
| (f) | Investment, or portion of investment, has been pledged to collateralize the net payment obligations for investments in reverse repurchase agreements. As of the end of the reporting period, investments with a value of $100,406,428 have been pledged as collateral for reverse repurchase agreements. |
| (g) | Investment, or portion of investment, is hypothecated. The total value of investments hypothecated as of the end of the reporting period was $73,526,366. |
| (h) | Floating or variable rate security includes the reference rate and spread, unless the variable rate is based on the underlying asset of the security. Coupon rate reflects the rate at period end. |
| (i) | For fair value measurement disclosure purposes, investment classified as Level 3. |
| (j) | Agreement with Fixed Income Clearing Corporation, 1.360% dated 7/31/25 to be repurchased at $1,589,456 on 8/1/25, collateralized by Government Agency Securities, with coupon rate 4.750% and maturity date 5/15/55, valued at $1,621,249. |
| (k) | Agreement with Fixed Income Clearing Corporation, 4.330% dated 7/31/25 to be repurchased at $700,084 on 8/1/25, collateralized by Government Agency Securities, with coupon rate 1.875% and maturity date 2/15/41, valued at $714,094. |
| (l) | Borrowings as a percentage of Total Investments is 26.8%. |
| (m) | The Fund may pledge up to 100% of its eligible investments (excluding any investments separately pledged as collateral for specific investments in derivatives, when applicable) in the Portfolio of Investments as collateral for borrowings. As of the end of the reporting period, investments with a value of $256,550,569 have been pledged as collateral for borrowings. |
| (n) | Reverse Repurchase Agreements, including accrued interest as a percentage of Total investments is 9.5%. |
| 62 | See Notes to Financial Statements |
Portfolio of Investments July 31, 2025
NPFD
| PRINCIPAL | DESCRIPTION | RATE | MATURITY | VALUE | ||||||||||||||
| |
|
|||||||||||||||||
| LONG-TERM INVESTMENTS - 154.7% (99.4% of Total Investments) | ||||||||||||||||||
| CORPORATE BONDS - 137.6% (88.4% of Total Investments) (a) | ||||||||||||||||||
| AUTOMOBILES & COMPONENTS - 3.0% (1.9% of Total Investments) | ||||||||||||||||||
| $10,476,000 | (b),(c) | General Motors Financial Co Inc | 5.750% | N/A | $ | 10,230,224 | ||||||||||||
| 4,195,000 | (b),(c) | General Motors Financial Co Inc | 5.700 | N/A | 4,092,568 | |||||||||||||
| |
|
|||||||||||||||||
| TOTAL AUTOMOBILES & COMPONENTS | 14,322,792 | |||||||||||||||||
| |
||||||||||||||||||
| BANKS - 65.2% (41.9% of Total Investments) | |
|||||||||||||||||
| 3,075,000 | (b),(d) | Banco Bilbao Vizcaya Argentaria SA | 9.375 | N/A | 3,411,589 | |||||||||||||
| 2,495,000 | (b),(d) | Banco Bilbao Vizcaya Argentaria SA | 6.125 | N/A | 2,472,830 | |||||||||||||
| 1,400,000 | (b),(d) | Banco Bilbao Vizcaya Argentaria SA | 7.750 | N/A | 1,450,799 | |||||||||||||
| 1,940,000 | (b),(d),(e) | Banco Mercantil del Norte SA/Grand Cayman | 8.750 | N/A | 1,985,862 | |||||||||||||
| 715,000 | (b),(d),(e) | Banco Mercantil del Norte SA/Grand Cayman | 7.500 | N/A | 716,650 | |||||||||||||
| 1,595,000 | (b),(d),(e) | Banco Mercantil del Norte SA/Grand Cayman | 7.625 | N/A | 1,610,286 | |||||||||||||
| 6,800,000 | (b),(d) | Banco Santander SA | 9.625 | N/A | 8,031,290 | |||||||||||||
| 3,200,000 | (b),(d) | Banco Santander SA | 8.000 | N/A | 3,443,350 | |||||||||||||
| 1,775,000 | (b),(c) | Bank of America Corp | 6.300 | N/A | 1,781,951 | |||||||||||||
| 6,425,000 | (b),(c) | Bank of America Corp | 6.250 | N/A | 6,402,898 | |||||||||||||
| 17,981,000 | (b),(c) | Bank of America Corp | 6.625 | N/A | 18,413,497 | |||||||||||||
| 4,783,000 | (c) | Bank of Montreal | 7.300 | 11/26/84 | 4,962,913 | |||||||||||||
| 3,538,000 | (c) | Bank of Montreal | 6.875 | 11/26/85 | 3,545,076 | |||||||||||||
| 1,470,000 | (c) | Bank of Montreal | 7.700 | 05/26/84 | 1,537,846 | |||||||||||||
| 3,090,000 | (c),(f) | Bank of Nova Scotia/The | 8.000 | 01/27/84 | 3,293,983 | |||||||||||||
| 3,510,000 | (b),(d) | Barclays PLC | 8.000 | N/A | 3,720,045 | |||||||||||||
| 3,083,000 | (b),(d) | Barclays PLC | 9.625 | N/A | 3,482,495 | |||||||||||||
| 977,000 | (b),(d) | Barclays PLC | 7.625 | N/A | 995,238 | |||||||||||||
| 1,960,000 | (b),(d) | Barclays PLC | 6.125 | N/A | 1,962,449 | |||||||||||||
| 986,000 | (b),(d),(e) | BNP Paribas SA | 7.450 | N/A | 1,004,487 | |||||||||||||
| 1,997,000 | (b),(d),(e) | BNP Paribas SA | 7.375 | N/A | 2,052,990 | |||||||||||||
| 5,225,000 | (b),(d),(e) | BNP Paribas SA | 8.000 | N/A | 5,590,593 | |||||||||||||
| 2,430,000 | (b),(d),(e) | BNP Paribas SA | 8.500 | N/A | 2,591,068 | |||||||||||||
| 2,150,000 | (b),(d),(e) | BNP Paribas SA | 9.250 | N/A | 2,314,036 | |||||||||||||
| 3,559,000 | (b),(d),(e) | BNP Paribas SA | 7.750 | N/A | 3,764,276 | |||||||||||||
| 3,617,000 | (c) | Canadian Imperial Bank of Commerce | 6.950 | 01/28/85 | 3,636,447 | |||||||||||||
| 3,298,000 | (c) | Canadian Imperial Bank of Commerce | 7.000 | 10/28/85 | 3,327,682 | |||||||||||||
| 2,875,000 | (b),(c) | Citigroup Inc | 6.250 | N/A | 2,891,163 | |||||||||||||
| 1,650,000 | (b),(c) | Citigroup Inc | 7.375 | N/A | 1,714,121 | |||||||||||||
| 13,100,000 | (b),(c) | Citigroup Inc | 7.625 | N/A | 13,665,815 | |||||||||||||
| 5,351,000 | (b),(c) | Citigroup Inc | 7.125 | N/A | 5,472,778 | |||||||||||||
| 3,014,000 | (b),(c) | Citigroup Inc | 7.000 | N/A | 3,131,434 | |||||||||||||
| 4,177,000 | (b),(c) | Citigroup Inc | 6.875 | N/A | 4,212,505 | |||||||||||||
| 6,500,000 | (b),(c),(g) | Citizens Financial Group Inc (TSFR3M + 3.419%) | 7.704 | N/A | 6,500,819 | |||||||||||||
| 4,941,000 | (b),(d),(e) | Credit Agricole SA | 6.700 | N/A | 4,942,853 | |||||||||||||
| 5,240,000 | (b),(d),(e) | Credit Agricole SA | 8.125 | N/A | 5,298,531 | |||||||||||||
| 50,000 | (b),(c),(e) | Farm Credit Bank of Texas | 5.700 | N/A | 50,004 | |||||||||||||
| 2,224,000 | (b),(c),(g) | Fifth Third Bancorp (TSFR3M + 3.295%) | 7.590 | N/A | 2,220,913 | |||||||||||||
| 7,070,000 | (b),(c),(g) | First Citizens BancShares Inc/NC (TSFR3M + 4.234%) | 8.552 | N/A | 7,333,011 | |||||||||||||
| 1,171,000 | (b),(d) | HSBC Holdings PLC | 6.950 | N/A | 1,197,096 | |||||||||||||
| 975,000 | (b),(d) | HSBC Holdings PLC | 6.500 | N/A | 992,831 | |||||||||||||
| 4,560,000 | (b),(d) | HSBC Holdings PLC | 8.000 | N/A | 4,821,475 | |||||||||||||
| 3,763,000 | (b),(d) | HSBC Holdings PLC | 6.875 | N/A | 3,878,340 | |||||||||||||
| 4,539,000 | (b),(d) | HSBC Holdings PLC | 6.950 | N/A | 4,656,742 | |||||||||||||
| 7,400,000 | (b),(c) | Huntington Bancshares Inc/OH | 5.625 | N/A | 7,580,323 | |||||||||||||
| 335,000 | (b),(d) | ING Groep NV | 5.750 | N/A | 333,937 | |||||||||||||
| 6,795,000 | (b),(d) | ING Groep NV, Reg S | 7.500 | N/A | 7,081,117 | |||||||||||||
| 2,013,000 | (b),(d),(e) | Intesa Sanpaolo SpA | 7.700 | N/A | 2,018,028 | |||||||||||||
| 8,663,000 | (b),(c) | JPMorgan Chase & Co | 6.500 | N/A | 8,880,303 | |||||||||||||
| 17,767,000 | (b),(c) | JPMorgan Chase & Co | 6.875 | N/A | 18,569,589 | |||||||||||||
| 1,755,000 | (b),(c) | KeyCorp | 5.000 | N/A | 1,728,086 | |||||||||||||
| 6,996,000 | (b),(d) | Lloyds Banking Group PLC | 8.000 | N/A | 7,471,910 | |||||||||||||
| 6,000,000 | (b),(c) | M&T Bank Corp | 5.125 | N/A | 5,933,679 | |||||||||||||
| 1,500,000 | (b),(d),(e) | Macquarie Bank Ltd/London | 6.125 | N/A | 1,514,795 | |||||||||||||
| 6,242,000 | (b),(d) | NatWest Group PLC | 8.125 | N/A | 6,838,681 | |||||||||||||
| See Notes to Financial Statements | 63 |
Portfolio of Investments July 31, 2025 (continued)
NPFD
| PRINCIPAL | DESCRIPTION | RATE | MATURITY | VALUE | ||||||||||||||
| |
|
|||||||||||||||||
| BANKS (continued) | ||||||||||||||||||
| $1,370,000 | (b),(d) | NatWest Group PLC | 7.300% | N/A | $ | 1,415,526 | ||||||||||||
| 1,589,000 | (b),(d),(e) | Nordea Bank Abp | 6.300 | N/A | 1,575,817 | |||||||||||||
| 1,559,000 | (b),(d),(e) | Nordea Bank Abp | 6.625 | N/A | 1,567,679 | |||||||||||||
| 5,735,000 | (b),(c) | PNC Financial Services Group Inc/The | 6.250 | N/A | 5,800,299 | |||||||||||||
| 2,445,000 | (b),(c) | PNC Financial Services Group Inc/The | 6.000 | N/A | 2,449,691 | |||||||||||||
| 6,990,000 | (b),(c) | PNC Financial Services Group Inc/The | 6.200 | N/A | 7,065,548 | |||||||||||||
| 3,586,000 | (c) | Royal Bank of Canada | 6.750 | 08/24/85 | 3,625,446 | |||||||||||||
| 1,680,000 | (b),(d),(e) | Societe Generale SA | 9.375 | N/A | 1,798,092 | |||||||||||||
| 770,000 | (b),(d),(e) | Societe Generale SA | 8.500 | N/A | 816,024 | |||||||||||||
| 3,631,000 | (b),(d),(e) | Societe Generale SA | 10.000 | N/A | 4,002,735 | |||||||||||||
| 1,700,000 | (b),(d),(e) | Standard Chartered PLC | 7.750 | N/A | 1,768,366 | |||||||||||||
| 3,495,000 | (c) | Toronto-Dominion Bank/The | 8.125 | 10/31/82 | 3,684,038 | |||||||||||||
| 13,209,000 | (b),(c) | Truist Financial Corp | 6.669 | N/A | 13,200,419 | |||||||||||||
| 2,265,000 | (b),(c) | Truist Financial Corp | 5.100 | N/A | 2,229,398 | |||||||||||||
| 12,345,000 | (b),(c) | Wells Fargo & Co | 7.625 | N/A | 13,140,672 | |||||||||||||
| 12,874,000 | (b),(c) | Wells Fargo & Co | 6.850 | N/A | 13,335,160 | |||||||||||||
| |
|
|||||||||||||||||
| TOTAL BANKS | 315,908,415 | |||||||||||||||||
| |
||||||||||||||||||
| CAPITAL GOODS - 2.0% (1.3% of Total Investments) | ||||||||||||||||||
| 2,897,000 | (b),(c) | Air Lease Corp | 4.125 | N/A | 2,836,227 | |||||||||||||
| 4,101,000 | (b),(c) | Air Lease Corp | 6.000 | N/A | 4,028,544 | |||||||||||||
| 3,673,000 | (c),(e) | ILFC E‑Capital Trust I | 6.430 | 12/21/65 | 3,071,383 | |||||||||||||
| |
|
|||||||||||||||||
| TOTAL CAPITAL GOODS | 9,936,154 | |||||||||||||||||
| |
||||||||||||||||||
| ENERGY - 11.4% (7.3% of Total Investments) | ||||||||||||||||||
| 8,546,000 | (c),(f) | Enbridge Inc | 5.500 | 07/15/77 | 8,461,081 | |||||||||||||
| 6,360,000 | (c) | Enbridge Inc | 7.625 | 01/15/83 | 6,750,765 | |||||||||||||
| 8,696,000 | (c) | Enbridge Inc | 8.500 | 01/15/84 | 9,794,000 | |||||||||||||
| 761,000 | (b),(c) | Energy Transfer LP | 6.625 | N/A | 757,042 | |||||||||||||
| 5,167,000 | (b),(c) | Energy Transfer LP | 7.125 | N/A | 5,290,150 | |||||||||||||
| 1,886,000 | (b),(c) | Energy Transfer LP | 6.500 | N/A | 1,889,599 | |||||||||||||
| 4,570,000 | (c) | Energy Transfer LP | 8.000 | 05/15/54 | 4,868,352 | |||||||||||||
| 3,554,000 | (c),(e) | South Bow Canadian Infrastructure Holdings Ltd | 7.500 | 03/01/55 | 3,692,386 | |||||||||||||
| 5,600,000 | (c) | TransCanada PipeLines Ltd | 7.590 | 05/15/67 | 5,147,468 | |||||||||||||
| 1,500,000 | (c) | Transcanada Trust | 5.875 | 08/15/76 | 1,496,879 | |||||||||||||
| 1,460,000 | (c) | Transcanada Trust | 5.500 | 09/15/79 | 1,432,421 | |||||||||||||
| 2,155,000 | (c) | Transcanada Trust | 5.600 | 03/07/82 | 2,095,652 | |||||||||||||
| 3,673,000 | (b),(c),(e) | Venture Global LNG Inc | 9.000 | N/A | 3,673,937 | |||||||||||||
| |
|
|||||||||||||||||
| TOTAL ENERGY | 55,349,732 | |||||||||||||||||
| |
||||||||||||||||||
| FINANCIAL SERVICES - 19.5% (12.5% of Total Investments) | ||||||||||||||||||
| 3,350,000 | (c) | AerCap Ireland Capital DAC / AerCap Global Aviation Trust | 6.950 | 03/10/55 | 3,504,772 | |||||||||||||
| 3,200,000 | (c) | AerCap Ireland Capital DAC / AerCap Global Aviation Trust | 6.500 | 01/31/56 | 3,239,085 | |||||||||||||
| 2,906,000 | (b),(c) | Ally Financial Inc | 4.700 | N/A | 2,650,838 | |||||||||||||
| 3,250,000 | (b),(c),(e) | Capital Farm Credit ACA | 5.000 | N/A | 3,217,500 | |||||||||||||
| 1,845,000 | (b),(c) | Capital One Financial Corp | 3.950 | N/A | 1,800,065 | |||||||||||||
| 3,690,000 | (b),(c) | Capital One Financial Corp | 5.500 | N/A | 3,648,900 | |||||||||||||
| 3,500,000 | (b),(c) | Charles Schwab Corp/The | 4.000 | N/A | 3,450,150 | |||||||||||||
| 350,000 | (b),(c),(e) | Compeer Financial ACA | 4.875 | N/A | 338,625 | |||||||||||||
| 3,325,000 | (h) | Credit Suisse Group AG | 7.500 | 01/17/72 | 390,688 | |||||||||||||
| 2,460,000 | (h) | Credit Suisse Group AG | 7.500 | 06/11/72 | 289,050 | |||||||||||||
| 5,850,000 | (h) | Credit Suisse Group AG | 6.380 | 02/21/72 | 687,375 | |||||||||||||
| 9,004,000 | (h) | Credit Suisse Group AG | 0.000 | 01/17/72 | 1,057,970 | |||||||||||||
| 5,600,000 | (b),(d) | Deutsche Bank AG, Reg S | 8.130 | N/A | 5,871,600 | |||||||||||||
| 1,290,000 | (b),(d) | Deutsche Bank AG | 6.000 | N/A | 1,284,938 | |||||||||||||
| 5,784,000 | (b),(c) | Goldman Sachs Group Inc/The | 6.850 | N/A | 5,906,965 | |||||||||||||
| 5,249,000 | (b),(c) | Goldman Sachs Group Inc/The | 6.125 | N/A | 5,190,530 | |||||||||||||
| 11,071,000 | (b),(c) | Goldman Sachs Group Inc/The | 7.500 | N/A | 11,567,313 | |||||||||||||
| 5,140,000 | (b),(c) | Goldman Sachs Group Inc/The | 7.500 | N/A | 5,429,146 | |||||||||||||
| 9,875,000 | (b),(c) | Goldman Sachs Group Inc/The | 7.379 | N/A | 9,912,525 | |||||||||||||
| 200,000 | (b),(d) | Julius Baer Group Ltd, Reg S | 7.500 | N/A | 202,000 | |||||||||||||
| 1,026,000 | (b),(d) | Nomura Holdings Inc | 7.000 | N/A | 1,038,880 | |||||||||||||
| 4,250,000 | (b),(c) | State Street Corp | 6.700 | N/A | 4,381,733 | |||||||||||||
| 3,853,000 | (b),(d),(e) | UBS Group AG | 9.250 | N/A | 4,516,498 | |||||||||||||
| 64 | See Notes to Financial Statements |
| PRINCIPAL | DESCRIPTION | RATE | MATURITY | VALUE | ||||||||||||||
| |
|
|||||||||||||||||
| FINANCIAL SERVICES (continued) | ||||||||||||||||||
| $4,325,000 | (b),(d),(e) | UBS Group AG | 9.250% | N/A | $ | 4,746,822 | ||||||||||||
| 3,892,000 | (b),(d),(e) | UBS Group AG | 7.750 | N/A | 4,148,654 | |||||||||||||
| 1,280,000 | (b),(d),(e) | UBS Group AG | 7.000 | N/A | 1,280,000 | |||||||||||||
| 4,352,000 | (b),(c) | Voya Financial Inc | 7.758 | N/A | 4,597,888 | |||||||||||||
| |
|
|||||||||||||||||
| TOTAL FINANCIAL SERVICES | 94,350,510 | |||||||||||||||||
| |
||||||||||||||||||
| HEALTH CARE EQUIPMENT & SERVICES - 0.5% (0.4% of Total Investments) | ||||||||||||||||||
| 1,381,000 | (c) | CVS Health Corp | 6.750 | 12/10/54 | 1,382,144 | |||||||||||||
| 1,174,000 | (c) | CVS Health Corp | 7.000 | 03/10/55 | 1,207,858 | |||||||||||||
| |
|
|||||||||||||||||
| TOTAL HEALTH CARE EQUIPMENT & SERVICES | 2,590,002 | |||||||||||||||||
| |
||||||||||||||||||
| INSURANCE - 15.6% (10.0% of Total Investments) | ||||||||||||||||||
| 2,595,000 | (c) | Aegon Ltd | 5.500 | 04/11/48 | 2,598,890 | |||||||||||||
| 8,045,000 | (c),(f) | Assurant Inc | 7.000 | 03/27/48 | 8,217,305 | |||||||||||||
| 3,000,000 | (c),(e) | Assured Guaranty Municipal Holdings Inc | 6.400 | 12/15/66 | 2,765,430 | |||||||||||||
| 3,050,000 | (c),(f) | AXIS Specialty Finance LLC | 4.900 | 01/15/40 | 2,934,216 | |||||||||||||
| 3,982,000 | (c) | Corebridge Financial Inc | 6.375 | 09/15/54 | 3,975,624 | |||||||||||||
| 6,115,000 | (c) | Enstar Finance LLC | 5.500 | 01/15/42 | 6,011,168 | |||||||||||||
| 2,061,000 | (c),(e) | Enstar Group Ltd | 7.500 | 04/01/45 | 2,128,422 | |||||||||||||
| 2,000,000 | (c) | MetLife Inc | 10.750 | 08/01/39 | 2,655,940 | |||||||||||||
| 4,495,000 | (b),(c) | MetLife Inc | 5.875 | N/A | 4,571,348 | |||||||||||||
| 2,518,000 | (c) | MetLife Inc | 6.350 | 03/15/55 | 2,584,621 | |||||||||||||
| 3,396,000 | (e) | Omnis Funding Trust | 6.722 | 05/15/55 | 3,512,413 | |||||||||||||
| 2,755,000 | (b),(d) | Phoenix Group Holdings PLC, Reg S | 8.500 | N/A | 2,905,533 | |||||||||||||
| 3,395,000 | (c) | Prudential Financial Inc | 5.125 | 03/01/52 | 3,288,833 | |||||||||||||
| 3,248,000 | (c),(f) | Prudential Financial Inc | 6.750 | 03/01/53 | 3,402,390 | |||||||||||||
| 6,688,000 | (c) | Prudential Financial Inc | 6.500 | 03/15/54 | 6,945,895 | |||||||||||||
| 13,500,000 | (b),(c),(e) | SBL Holdings Inc | 9.508 | N/A | 13,736,250 | |||||||||||||
| 3,415,000 | (b),(c),(e) | SBL Holdings Inc | 6.500 | N/A | 3,177,359 | |||||||||||||
| |
|
|||||||||||||||||
| TOTAL INSURANCE | 75,411,637 | |||||||||||||||||
| |
||||||||||||||||||
| MATERIALS - 0.5% (0.3% of Total Investments) | ||||||||||||||||||
| 2,434,000 | (b),(c),(e) | Cemex SAB de CV | 7.200 | N/A | 2,484,992 | |||||||||||||
| |
|
|||||||||||||||||
| TOTAL MATERIALS | 2,484,992 | |||||||||||||||||
| |
||||||||||||||||||
| MEDIA & ENTERTAINMENT - 0.5% (0.3% of Total Investments) | ||||||||||||||||||
| 2,375,000 | (c) | Paramount Global | 6.375 | 03/30/62 | 2,339,369 | |||||||||||||
| |
|
|||||||||||||||||
| TOTAL MEDIA & ENTERTAINMENT | 2,339,369 | |||||||||||||||||
| |
||||||||||||||||||
| TELECOMMUNICATION SERVICES - 4.2% (2.7% of Total Investments) | ||||||||||||||||||
| 3,791,000 | (c) | Bell Telephone Co of Canada or Bell Canada | 7.000 | 09/15/55 | 3,847,448 | |||||||||||||
| 3,941,000 | (c) | Rogers Communications Inc | 7.125 | 04/15/55 | 4,032,838 | |||||||||||||
| 1,977,000 | (c) | TELUS Corp | 7.000 | 10/15/55 | 2,001,549 | |||||||||||||
| 10,000,000 | (c) | Vodafone Group PLC | 7.000 | 04/04/79 | 10,449,930 | |||||||||||||
| |
|
|||||||||||||||||
| TOTAL TELECOMMUNICATION SERVICES | 20,331,765 | |||||||||||||||||
| |
||||||||||||||||||
| UTILITIES - 15.2% (9.8% of Total Investments) | ||||||||||||||||||
| 1,300,000 | (c),(e) | AES Andes SA | 8.150 | 06/10/55 | 1,361,142 | |||||||||||||
| 2,456,000 | (c) | AES Corp/The | 7.600 | 01/15/55 | 2,480,668 | |||||||||||||
| 3,817,000 | (c) | AES Corp/The | 6.950 | 07/15/55 | 3,677,763 | |||||||||||||
| 1,302,000 | (c),(e) | AltaGas Ltd | 7.200 | 10/15/54 | 1,311,977 | |||||||||||||
| 3,416,000 | (c) | CMS Energy Corp | 6.500 | 06/01/55 | 3,444,397 | |||||||||||||
| 3,593,000 | (c) | Dominion Energy Inc | 7.000 | 06/01/54 | 3,833,045 | |||||||||||||
| 3,000,000 | (c) | Dominion Energy Inc | 6.625 | 05/15/55 | 3,074,034 | |||||||||||||
| 3,244,000 | (c) | Duke Energy Corp | 6.450 | 09/01/54 | 3,340,085 | |||||||||||||
| 1,529,000 | (c) | Edison International | 7.875 | 06/15/54 | 1,465,552 | |||||||||||||
| 2,404,000 | (c) | Edison International | 8.125 | 06/15/53 | 2,357,303 | |||||||||||||
| 1,445,000 | (b),(c) | Edison International | 5.375 | N/A | 1,374,024 | |||||||||||||
| 3,910,000 | (b),(c) | Edison International | 5.000 | N/A | 3,438,968 | |||||||||||||
| 12,143,000 | (c),(f) | Emera Inc | 6.750 | 06/15/76 | 12,230,855 | |||||||||||||
| 4,322,000 | (c),(f) | Entergy Corp | 7.125 | 12/01/54 | 4,474,472 | |||||||||||||
| 2,713,000 | (c) | EUSHI Finance Inc | 7.625 | 12/15/54 | 2,834,616 | |||||||||||||
| 6,174,000 | (c),(f) | NextEra Energy Capital Holdings Inc | 6.750 | 06/15/54 | 6,441,797 | |||||||||||||
| 1,925,000 | (c) | PG&E Corp | 7.375 | 03/15/55 | 1,857,591 | |||||||||||||
| 6,476,000 | (c) | Sempra | 6.550 | 04/01/55 | 6,248,624 | |||||||||||||
| 2,215,000 | (b),(c),(e) | Vistra Corp | 7.000 | N/A | 2,236,625 | |||||||||||||
| 1,560,000 | (b),(c),(e) | Vistra Corp | 8.000 | N/A | 1,592,317 | |||||||||||||
| See Notes to Financial Statements | 65 |
Portfolio of Investments July 31, 2025 (continued)
NPFD
| PRINCIPAL | DESCRIPTION | RATE | MATURITY | VALUE | ||||||||||||||
| |
|
|||||||||||||||||
| UTILITIES (continued) | ||||||||||||||||||
| $4,398,000 | (b),(c),(e) | Vistra Corp | 8.875% | N/A | $ | 4,766,456 | ||||||||||||
| |
|
|||||||||||||||||
| TOTAL UTILITIES | 73,842,311 | |||||||||||||||||
| |
||||||||||||||||||
| TOTAL CORPORATE BONDS (Cost $675,550,680) |
666,867,679 | |||||||||||||||||
| |
||||||||||||||||||
| SHARES | DESCRIPTION | RATE | VALUE | |||||||||||||||
| |
|
|||||||||||||||||
| PREFERRED STOCK - 13.6% (8.8% of Total Investments) | ||||||||||||||||||
| BANKS - 3.6% (2.3% of Total Investments) | ||||||||||||||||||
| 121,601 | Fifth Third Bancorp | 8.267 | 3,108,122 | |||||||||||||||
| 62,700 | KeyCorp | 6.125 | 1,564,992 | |||||||||||||||
| 297,600 | KeyCorp | 6.200 | 7,416,192 | |||||||||||||||
| 29,150 | KeyCorp | 5.625 | 644,798 | |||||||||||||||
| 26,900 | KeyCorp | 5.650 | 594,759 | |||||||||||||||
| 163,723 | Regions Financial Corp | 5.700 | 4,071,791 | |||||||||||||||
| 900 | Synovus Financial Corp | 8.397 | 23,607 | |||||||||||||||
| |
|
|||||||||||||||||
| TOTAL BANKS | 17,424,261 | |||||||||||||||||
| |
||||||||||||||||||
| FINANCIAL SERVICES - 2.6% (1.7% of Total Investments) | ||||||||||||||||||
| 139,125 | Bank of New York Mellon Corp/The | 6.150 | 3,592,207 | |||||||||||||||
| 143,950 | Morgan Stanley | 6.625 | 3,708,152 | |||||||||||||||
| 211,000 | Voya Financial Inc | 5.350 | 5,201,150 | |||||||||||||||
| |
|
|||||||||||||||||
| TOTAL FINANCIAL SERVICES | 12,501,509 | |||||||||||||||||
| |
||||||||||||||||||
| FOOD, BEVERAGE & TOBACCO - 1.9% (1.2% of Total Investments) | ||||||||||||||||||
| 237,055 | CHS Inc | 7.100 | 6,063,867 | |||||||||||||||
| 115,393 | CHS Inc | 6.750 | 2,832,898 | |||||||||||||||
| 4,400 | (e) | Dairy Farmers of America Inc | 7.875 | 422,400 | ||||||||||||||
| |
|
|||||||||||||||||
| TOTAL FOOD, BEVERAGE & TOBACCO | 9,319,165 | |||||||||||||||||
| |
||||||||||||||||||
| INSURANCE - 5.5% (3.6% of Total Investments) | ||||||||||||||||||
| 185,450 | American National Group Inc | 7.375 | 4,691,885 | |||||||||||||||
| 160,150 | American National Group Inc | 6.625 | 4,051,795 | |||||||||||||||
| 59,425 | Aspen Insurance Holdings Ltd | 7.125 | 1,467,797 | |||||||||||||||
| 194,775 | Athene Holding Ltd | 6.350 | 4,847,950 | |||||||||||||||
| 191,625 | Enstar Group Ltd | 7.000 | 4,273,238 | |||||||||||||||
| 210,800 | Reinsurance Group of America Inc | 5.750 | 5,232,056 | |||||||||||||||
| 93,300 | Reinsurance Group of America Inc | 7.125 | 2,418,336 | |||||||||||||||
| |
|
|||||||||||||||||
| TOTAL INSURANCE | 26,983,057 | |||||||||||||||||
| |
||||||||||||||||||
| TOTAL PREFERRED STOCK (Cost $71,315,384) |
66,227,992 | |||||||||||||||||
| |
||||||||||||||||||
| PRINCIPAL | DESCRIPTION | RATE | MATURITY | VALUE | ||||||||||||||
| |
|
|||||||||||||||||
| U.S. GOVERNMENT AND AGENCY OBLIGATIONS - 3.5% (2.2% of Total Investments) | ||||||||||||||||||
| 6,050,000 | CoBank ACB | 6.450 | 01/01/74 | 6,088,345 | ||||||||||||||
| 2,062,000 | CoBank ACB | 7.250 | 07/01/74 | 2,119,971 | ||||||||||||||
| 3,785,000 | CoBank ACB | 7.125 | 01/01/74 | 3,907,471 | ||||||||||||||
| 50,000 | (e) | Farm Credit Bank of Texas | 6.200 | 09/15/73 | 49,625 | |||||||||||||
| 2,566,000 | (e) | Farm Credit Bank of Texas | 7.750 | 09/15/73 | 2,657,501 | |||||||||||||
| 2,092,000 | Farm Credit Bank of Texas | 7.000 | 09/15/73 | 2,123,380 | ||||||||||||||
| |
|
|||||||||||||||||
| TOTAL U.S. GOVERNMENT AND AGENCY OBLIGATIONS (Cost $16,636,744) |
16,946,293 | |||||||||||||||||
| |
||||||||||||||||||
| TOTAL LONG-TERM INVESTMENTS (Cost $763,502,808) |
750,041,964 | |||||||||||||||||
| |
||||||||||||||||||
| 66 | See Notes to Financial Statements |
| PRINCIPAL | DESCRIPTION | RATE | MATURITY | VALUE | ||||||||||||||
| |
|
|||||||||||||||||
| SHORT-TERM INVESTMENTS - 0.9%(0.6% of Total Investments) | ||||||||||||||||||
| REPURCHASE AGREEMENTS - 0.9% (0.6% of Total Investments) | ||||||||||||||||||
| $ | 2,413,279 | (i) | Fixed Income Clearing Corporation | 1.360% | 08/01/25 | $ | 2,413,279 | |||||||||||
| 1,975,000 | (j) | Fixed Income Clearing Corporation | 4.330 | 08/01/25 | 1,975,000 | |||||||||||||
| |
|
|||||||||||||||||
| TOTAL REPURCHASE AGREEMENTS (Cost $4,388,279) |
4,388,279 | |||||||||||||||||
| |
||||||||||||||||||
| TOTAL SHORT-TERM INVESTMENTS (Cost $4,388,279) |
4,388,279 | |||||||||||||||||
| |
||||||||||||||||||
| TOTAL INVESTMENTS - 155.6% (Cost $767,891,087) |
754,430,243 | |||||||||||||||||
| |
||||||||||||||||||
| BORROWINGS - (33.3)% (k),(l) | (161,314,000) | |||||||||||||||||
| |
||||||||||||||||||
| REVERSE REPURCHASE AGREEMENTS, INCLUDING ACCRUED INTEREST - (5.7)%(m) | (27,809,931) | |||||||||||||||||
| |
||||||||||||||||||
| TFP SHARES, NET - (17.4)%(n) | (84,551,443) | |||||||||||||||||
| |
||||||||||||||||||
| OTHER ASSETS & LIABILITIES, NET - 0.8% | 3,987,795 | |||||||||||||||||
| |
||||||||||||||||||
| NET ASSETS APPLICABLE TO COMMON SHARES - 100% | $ | 484,742,664 | ||||||||||||||||
| |
||||||||||||||||||
All percentages shown in the Portfolio of Investments are based on net assets applicable to common shares unless otherwise noted.
| Reg S | Regulation S allows U.S. companies to sell securities to persons or entities located outside of the United States without registering those securities with the Securities and Exchange Commission. Specifically, Regulation S provides a safe harbor from the registration requirements of the Securities Act for the offers and sales of securities by both foreign and domestic issuers that are made outside the United States. |
| TSFR3M | CME Term Secured Overnight Financing Rate 3 Month |
| (a) | Contains $1,000 Par Preferred and/or Contingent Capital Securities. |
| (b) | Perpetual security. Maturity date is not applicable. |
| (c) | $1,000 Par Institutional Preferred security. As of the end of the period, the percent of $1,000 Par Institutional Preferred securities was 69.0% of Total Investments. |
| (d) | Contingent Capital Securities (“CoCos”) are debt or preferred securities with loss absorption characteristics built into the terms of the security for the benefit of the issuer, for example an automatic write-down of principal or a mandatory conversion into the issuer’s common stock under certain adverse circumstances, such as the issuer’s capital ratio falling below a specified level. As of the end of the reporting period, the Fund’s total investment in CoCos was 18.6% of Total Investments. |
| (e) | Security is exempt from registration under Rule 144A of the Securities Act of 1933, as amended. These securities are deemed liquid and may be resold in transactions exempt from registration, which are normally those transactions with qualified institutional buyers. As of the end of the reporting period, the aggregate value of these securities is $117,871,886 or 15.6% of Total Investments. |
| (f) | Investment, or portion of investment, has been pledged to collateralize the net payment obligations for investments in reverse repurchase agreements. As of the end of the reporting period, investments with a value of $36,491,226 have been pledged as collateral for reverse repurchase agreements. |
| (g) | Floating or variable rate security includes the reference rate and spread, unless the variable rate is based on the underlying asset of the security. Coupon rate reflects the rate at period end. |
| (h) | For fair value measurement disclosure purposes, investment classified as Level 3. |
| (i) | Agreement with Fixed Income Clearing Corporation, 1.360% dated 7/31/25 to be repurchased at $2,413,370 on 8/1/25, collateralized by Government Agency Securities, with coupon rate 4.750% and maturity date 5/15/55, valued at $2,461,639. |
| (j) | Agreement with Fixed Income Clearing Corporation, 4.330% dated 7/31/25 to be repurchased at $1,975,238 on 8/1/25, collateralized by Government Agency Securities, with coupon rate 1.875% and maturity date 2/15/41, valued at $2,014,597. |
| (k) | Borrowings as a percentage of Total Investments is 21.4%. |
| (l) | The Fund may pledge up to 100% of its eligible investments (excluding any investments separately pledged as collateral for specific investments in derivatives, when applicable) in the Portfolio of Investments as collateral for borrowings. As of the end of the reporting period, investments with a value of $336,645,053 have been pledged as collateral for borrowings. |
| (m) | Reverse Repurchase Agreements, including accrued interest as a percentage of Total investments is 3.7%. |
| (n) | TFP Shares, Net as a percentage of Total Investments is 11.2%. |
| See Notes to Financial Statements | 67 |
Statement of Assets and Liabilities
| July 31, 2025 | JFR | JQC | JPC | JPI | NPFD | |||||||||||||||
| ASSETS |
||||||||||||||||||||
| Long-term investments, at value† |
$ | 2,255,493,669 | $ | 1,320,027,782 | $ | 4,106,219,812 | $ | 438,273,184 | $ | 750,041,964 | ||||||||||
| Short-term investments, at value◊ |
28,623,217 | 58,662,854 | 21,976,515 | 2,289,396 | 4,388,279 | |||||||||||||||
| Cash |
4,467,098 | 508,188 | 15,717,343 | 2,209,292 | 139,748 | |||||||||||||||
| Cash denominated in foreign currencies^ |
– | 17 | – | – | – | |||||||||||||||
| Cash collateral at broker for investments in futures contracts(1) |
– | – | 3,574,304 | – | – | |||||||||||||||
| Unrealized appreciation on interest rate swaps contracts |
– | – | 2,390,002 | – | – | |||||||||||||||
| Receivables: |
||||||||||||||||||||
| Dividends |
– | – | 203,749 | 14,695 | – | |||||||||||||||
| Interest |
15,344,829 | 10,550,908 | 55,004,867 | 5,777,267 | 10,121,697 | |||||||||||||||
| Investments sold |
11,000,903 | 6,604,216 | 6,438,149 | 136,518 | 417,857 | |||||||||||||||
| Reclaims |
– | 1,371 | 34,123 | 101 | 115 | |||||||||||||||
| Reimbursement from Adviser |
– | – | – | 160,261 | – | |||||||||||||||
| Shares sold |
– | – | 542,400 | – | – | |||||||||||||||
| Variation margin on futures contracts |
– | – | 164,125 | – | – | |||||||||||||||
| Deferred offering costs |
– | – | 70,732 | – | – | |||||||||||||||
| Other |
475,786 | 260,992 | 730,193 | 52,594 | 84,500 | |||||||||||||||
| Total assets |
2,315,405,502 | 1,396,616,328 | 4,213,066,314 | 448,913,308 | 765,194,160 | |||||||||||||||
| LIABILITIES |
||||||||||||||||||||
| Cash collateral due to broker for investments in swaps(1) |
– | – | 1,938,338 | – | – | |||||||||||||||
| Borrowings |
517,200,000 | 211,600,000 | 649,000,000 | 118,000,000 | 161,314,000 | |||||||||||||||
| Reverse repurchase agreements, including accrued interest |
– | 142,656,632 | 471,894,299 | 41,647,626 | 27,809,931 | |||||||||||||||
| TFP Shares, Net** |
283,909,017 | 139,314,490 | 418,746,094 | – | 84,551,443 | |||||||||||||||
| Payables: |
||||||||||||||||||||
| Management fees |
1,441,810 | 922,167 | 2,632,521 | 320,521 | 578,039 | |||||||||||||||
| Dividends |
13,326,188 | 7,813,101 | 21,229,263 | 2,292,946 | 4,046,823 | |||||||||||||||
| Interest |
158,202 | 1,265,579 | 2,788,887 | 526,346 | 660,133 | |||||||||||||||
| Investments purchased - regular settlement |
1,746,906 | 940,103 | 28,479,458 | 2,872,577 | 1,372,396 | |||||||||||||||
| Investments purchased - when-issued/delayed-delivery settlement |
73,287,570 | 53,309,699 | – | – | – | |||||||||||||||
| Unfunded senior loans |
2,824,844 | 930,963 | – | – | – | |||||||||||||||
| Accrued expenses: |
||||||||||||||||||||
| Custodian fees |
328,966 | 172,502 | 206,564 | 45,605 | 39,670 | |||||||||||||||
| Investor relations fees |
22,911 | 18,531 | 58,264 | 7,178 | 9,974 | |||||||||||||||
| Trustees fees |
189,593 | 151,076 | 369,116 | 43,307 | 20,815 | |||||||||||||||
| Professional fees |
48,001 | 50,338 | 31,592 | 36,344 | 34,657 | |||||||||||||||
| Shareholder reporting expenses |
44,178 | 35,271 | 97,497 | 28,395 | 12,139 | |||||||||||||||
| Shareholder servicing agent fees |
3,261 | 485 | 1,674 | 38 | 44 | |||||||||||||||
| Shelf offering costs |
2,163 | 116,110 | 13,587 | – | – | |||||||||||||||
| Other |
368,871 | 14,056 | 133,091 | 526,679 | 1,432 | |||||||||||||||
| Total liabilities |
894,902,481 | 559,311,103 | 1,597,620,245 | 166,347,562 | 280,451,496 | |||||||||||||||
| Commitments and contingencies(2) |
||||||||||||||||||||
| Net assets applicable to common shares |
$ | 1,420,503,021 | $ | 837,305,225 | $ | 2,615,446,069 | $ | 282,565,746 | $ | 484,742,664 | ||||||||||
| |
147,816,679 | 326,493,745 | 14,119,758 | 24,164,141 | ||||||||||||||||
| Net asset value (“NAV”) per common share outstanding |
$ | 8.82 | $ | 5.66 | $ | 8.01 | $ | 20.01 | $ | 20.06 | ||||||||||
| NET ASSETS APPLICABLE TO COMMON SHARES CONSIST OF: |
||||||||||||||||||||
| Common shares, $0.01 par value per share |
$ | 1,609,674 | $ | 1,478,167 | $ | 3,264,937 | $ | 141,198 | $ | 241,641 | ||||||||||
| Paid‑in capital |
1,850,422,240 | 1,179,326,021 | 3,008,935,342 | 350,810,192 | 571,983,502 | |||||||||||||||
| Total distributable earnings (loss) |
(431,528,893 | ) | (343,498,963 | ) | (396,754,210 | ) | (68,385,644 | ) | (87,482,479 | ) | ||||||||||
| Net assets applicable to common shares |
$ | 1,420,503,021 | $ | 837,305,225 | $ | 2,615,446,069 | $ | 282,565,746 | $ | 484,742,664 | ||||||||||
| Authorized shares: |
||||||||||||||||||||
| Common |
Unlimited | Unlimited | Unlimited | Unlimited | Unlimited | |||||||||||||||
| Preferred |
Unlimited | Unlimited | Unlimited | Unlimited | Unlimited | |||||||||||||||
| † Long-term investments, cost |
$ | 2,270,007,360 | $ | 1,322,888,239 | $ | 4,047,885,000 | $ | 452,555,241 | $ | 763,502,808 | ||||||||||
| ◊ Short-term investments, cost |
$ | 28,623,217 | $ | 58,662,854 | $ | 21,976,515 | $ | 2,289,396 | $ | 4,388,279 | ||||||||||
| ^ Cash denominated in foreign currencies, cost |
$ | – | $ | 17 | $ | – | $ | – | $ | – | ||||||||||
| ** TFP Shares, liquidation preference |
$ | 285,000,000 | $ | 140,000,000 | $ | 420,000,000 | $ | – | $ | 85,000,000 | ||||||||||
See Notes to Financial Statements
68
Statement of Assets and Liabilities (continued)
| (1) | Cash pledged to collateralize the net payment obligations for investments in derivatives is in addition to the Fund’s securities pledged as collateral as noted in the Portfolio of Investments. |
| (2) | As disclosed in Notes to Financial Statements. |
See Notes to Financial Statements
69
Statement of Operations
| Year Ended July 31, 2025 | JFR | JQC | JPC | JPI | NPFD | |||||||||||||||
| INVESTMENT INCOME |
||||||||||||||||||||
| Dividends |
$ | 304,644 | $ | 480 | $ | 26,299,407 | $ | 3,386,893 | $ | 5,365,254 | ||||||||||
| Interest |
173,515,174 | 107,289,805 | 242,102,827 | 25,843,998 | 41,207,770 | |||||||||||||||
| Rehypothecation income |
– | – | 259,737 | 54,813 | – | |||||||||||||||
| Tax withheld |
– | (14,479 | ) | (16,167 | ) | – | – | |||||||||||||
| Total investment income |
173,819,818 | 107,275,806 | 268,645,804 | 29,285,704 | 46,573,024 | |||||||||||||||
| EXPENSES |
||||||||||||||||||||
| Management fees |
15,986,775 | 10,583,117 | 31,141,576 | 3,802,818 | 6,890,250 | |||||||||||||||
| Shareholder servicing agent fees |
3,071 | 3,988 | 8,865 | 427 | 466 | |||||||||||||||
| Interest expense and amortization of offering costs |
42,612,081 | 27,013,405 | 82,856,131 | 8,897,782 | 14,811,560 | |||||||||||||||
| Trustees fees |
79,250 | 48,802 | 155,114 | 16,211 | 28,876 | |||||||||||||||
| Custodian expenses |
437,442 | 291,328 | 329,592 | 84,123 | 72,790 | |||||||||||||||
| Investor relations expenses |
384,369 | 295,442 | 569,635 | 80,053 | 104,155 | |||||||||||||||
| Liquidity fees |
1,492,174 | 1,228,849 | 3,903,403 | – | 789,974 | |||||||||||||||
| Merger expenses |
17,000 | – | – | 700,000 | – | |||||||||||||||
| Professional fees |
188,843 | 138,189 | 257,341 | 98,849 | 143,602 | |||||||||||||||
| Remarketing fees |
172,361 | 141,945 | 425,833 | – | 86,417 | |||||||||||||||
| Shareholder reporting expenses |
133,397 | 105,978 | 276,952 | 47,250 | 205,089 | |||||||||||||||
| Rights offering expense |
1,285,000 | 910,000 | – | – | – | |||||||||||||||
| Stock exchange listing fees |
42,410 | 42,900 | 101,199 | 10,216 | 10,885 | |||||||||||||||
| Other |
39,154 | 49,154 | 7,771 | 11,853 | 61,058 | |||||||||||||||
| Total expenses before expense reimbursement |
62,873,327 | 40,853,097 | 120,033,412 | 13,749,582 | 23,205,122 | |||||||||||||||
| Expense reimbursement |
– | – | – | (1,796,437 | ) | – | ||||||||||||||
| Net expenses |
62,873,327 | 40,853,097 | 120,033,412 | 11,953,145 | 23,205,122 | |||||||||||||||
| Net investment income (loss) |
110,946,491 | 66,422,709 | 148,612,392 | 17,332,559 | 23,367,902 | |||||||||||||||
| REALIZED AND UNREALIZED GAIN (LOSS) |
||||||||||||||||||||
| Realized gain (loss) from: |
||||||||||||||||||||
| Investments |
(25,473,772 | ) | (14,391,769 | ) | 16,006,629 | 1,960,584 | (5,510,088 | ) | ||||||||||||
| Futures contracts |
– | – | 14,007 | – | – | |||||||||||||||
| Swap contracts |
– | – | 26,228,476 | – | – | |||||||||||||||
| Foreign currency transactions |
– | – | (708,987 | ) | 8,450 | (583 | ) | |||||||||||||
| Net realized gain (loss) |
(25,473,772 | ) | (14,391,769 | ) | 41,540,125 | 1,969,034 | (5,510,671 | ) | ||||||||||||
| Change in unrealized appreciation (depreciation) on: |
||||||||||||||||||||
| Investments |
18,510,139 | 11,958,174 | 90,492,148 | 9,045,743 | 28,979,344 | |||||||||||||||
| Futures contracts |
– | – | (4,287,816 | ) | – | – | ||||||||||||||
| Swap contracts |
– | – | (24,034,354 | ) | – | – | ||||||||||||||
| Foreign currency translations |
– | (2,448 | ) | 1,349 | – | – | ||||||||||||||
| Net change in unrealized appreciation (depreciation) |
18,510,139 | 11,955,726 | 62,171,327 | 9,045,743 | 28,979,344 | |||||||||||||||
| Net realized and unrealized gain (loss) |
(6,963,633 | ) | (2,436,043 | ) | 103,711,452 | 11,014,777 | 23,468,673 | |||||||||||||
| Net increase (decrease) in net assets applicable to common shares from operations |
$ | 103,982,858 | $ | 63,986,666 | $ | 252,323,844 | $ | 28,347,336 | $ | 46,836,575 | ||||||||||
See Notes to Financial Statements
70
Statement of Changes in Net Assets
| JFR | JQC | |||||||||||||||||||||||
| Year Ended 7/31/25 |
Year Ended 7/31/24 |
Year Ended 7/31/25 |
Year Ended 7/31/24 |
|||||||||||||||||||||
| OPERATIONS |
||||||||||||||||||||||||
| Net investment income (loss) |
$ | 110,946,491 | $ | 119,060,019 | $ | 66,422,709 | $ | 75,281,341 | ||||||||||||||||
| Net realized gain (loss) |
(25,473,772 | ) | (17,276,337 | ) | (14,391,769 | ) | (18,940,185 | ) | ||||||||||||||||
| Net change in unrealized appreciation (depreciation) |
18,510,139 | 54,424,668 | 11,955,726 | 41,730,015 | ||||||||||||||||||||
| Net increase (decrease) in net assets applicable to common shares from operations |
103,982,858 | 156,208,350 | 63,986,666 | 98,071,171 | ||||||||||||||||||||
| DISTRIBUTIONS TO COMMON SHAREHOLDERS |
||||||||||||||||||||||||
| Dividends |
(115,969,240 | ) | (132,318,523 | ) | (68,447,068 | ) | (77,350,572 | ) | ||||||||||||||||
| Return of Capital |
(32,205,348 | ) | (4,418,789 | ) | (21,405,349 | ) | (9,642,788 | ) | ||||||||||||||||
| Total distributions |
(148,174,588 | ) | (136,737,312 | ) | (89,852,417 | ) | (86,993,360 | ) | ||||||||||||||||
| CAPITAL SHARE TRANSACTIONS |
||||||||||||||||||||||||
| Common shares: |
||||||||||||||||||||||||
| Proceeds from rights offering, net of offering costs |
220,672,151 | – | 62,135,610 | – | ||||||||||||||||||||
| Net increase (decrease) applicable to common shares from capital share transactions |
220,672,151 | – | 62,135,610 | – | ||||||||||||||||||||
| Net increase (decrease) in net assets applicable to common shares |
176,480,421 | 19,471,038 | 36,269,859 | 11,077,811 | ||||||||||||||||||||
| Net assets applicable to common shares at the beginning of period |
1,244,022,600 | 1,224,551,562 | 801,035,366 | 789,957,555 | ||||||||||||||||||||
| Net assets applicable to common shares at the end of period |
$ | 1,420,503,021 | $ | 1,244,022,600 | $ | 837,305,225 | $ | 801,035,366 | ||||||||||||||||
See Notes to Financial Statements
71
Statement of Changes in Net Assets (continued)
| JPC | JPI | |||||||||||||||||||||||
| Year Ended 7/31/25 |
Year Ended 7/31/24 |
Year Ended 7/31/25 |
Year Ended 7/31/24 |
|||||||||||||||||||||
| OPERATIONS |
||||||||||||||||||||||||
| Net investment income (loss) |
$ | 148,612,392 | $ | 106,326,517 | $ | 17,332,559 | $ | 24,546,634 | ||||||||||||||||
| Net realized gain (loss) |
41,540,125 | (35,265,792 | ) | 1,969,034 | (5,862,811 | ) | ||||||||||||||||||
| Net change in unrealized appreciation (depreciation) |
62,171,327 | 310,419,011 | 9,045,743 | 42,581,549 | ||||||||||||||||||||
| Net increase (decrease) in net assets applicable to common shares from operations |
252,323,844 | 381,479,736 | 28,347,336 | 61,265,372 | ||||||||||||||||||||
| DISTRIBUTIONS TO COMMON SHAREHOLDERS |
||||||||||||||||||||||||
| Dividends |
(177,916,653 | ) | (152,486,748 | ) | (15,458,426 | ) | (25,243,405 | ) | ||||||||||||||||
| Return of Capital |
(78,577,161 | ) | – | (11,687,572 | ) | (1,536,960 | ) | |||||||||||||||||
| Total distributions |
(256,493,814 | ) | (152,486,748 | ) | (27,145,998 | ) | (26,780,365 | ) | ||||||||||||||||
| CAPITAL SHARE TRANSACTIONS |
||||||||||||||||||||||||
| Common shares: |
||||||||||||||||||||||||
| Fund Merger |
– | 1,551,871,080 | – | – | ||||||||||||||||||||
| Proceeds from shelf offering, net of offering costs |
54,493,622 | – | – | – | ||||||||||||||||||||
| Reinvestments of distributions |
1,251,009 | – | 397,265 | – | ||||||||||||||||||||
| Cost of shares repurchased and retired through tender offer |
– | – | (173,521,088 | ) | – | |||||||||||||||||||
| Net increase (decrease) applicable to common shares from capital share transactions |
55,744,631 | 1,551,871,080 | (173,123,823 | ) | – | |||||||||||||||||||
| Net increase (decrease) in net assets applicable to common shares |
51,574,661 | 1,780,864,068 | (171,922,485 | ) | 34,485,007 | |||||||||||||||||||
| Net assets applicable to common shares at the beginning of period |
2,563,871,408 | 783,007,340 | 454,488,231 | 420,003,224 | ||||||||||||||||||||
| Net assets applicable to common shares at the end of period |
$ | 2,615,446,069 | $ | 2,563,871,408 | $ | 282,565,746 | $ | 454,488,231 | ||||||||||||||||
See Notes to Financial Statements
72
| NPFD | ||||||||||||
| Year Ended 7/31/25 |
Year Ended 7/31/24 |
|||||||||||
| OPERATIONS |
||||||||||||
| Net investment income (loss) |
$ | 23,367,902 | $ | 18,346,533 | ||||||||
| Net realized gain (loss) |
(5,510,671 | ) | (10,004,771 | ) | ||||||||
| Net change in unrealized appreciation (depreciation) |
28,979,344 | 57,022,131 | ||||||||||
| Net increase (decrease) in net assets applicable to common shares from operations |
46,836,575 | 65,363,893 | ||||||||||
| DISTRIBUTIONS TO COMMON SHAREHOLDERS |
||||||||||||
| Dividends |
(22,339,894 | ) | (27,667,206 | ) | ||||||||
| Return of Capital |
(26,230,031 | ) | (4,857,728 | ) | ||||||||
| Total distributions |
(48,569,925 | ) | (32,524,934 | ) | ||||||||
| Net increase (decrease) in net assets applicable to common shares |
(1,733,350 | ) | 32,838,959 | |||||||||
| Net assets applicable to common shares at the beginning of period |
486,476,014 | 453,637,055 | ||||||||||
| Net assets applicable to common shares at the end of period |
$ | 484,742,664 | $ | 486,476,014 | ||||||||
See Notes to Financial Statements
73
Statement of Cash Flows
| Year Ended July 31, 2025 | JFR | JQC | JPC | JPI | NPFD | |||||||||||||||
| CASH FLOWS FROM OPERATING ACTIVITIES |
||||||||||||||||||||
| Net Increase (Decrease) in Net Assets Applicable to Common Shares from Operations |
$ | 103,982,858 | $ | 63,986,666 | $ | 252,323,844 | $ | 28,347,336 | $ | 46,836,575 | ||||||||||
| Adjustments to reconcile the net increase (decrease) in net assets applicable to common shares from operations to net cash provided by (used in) operating activities: |
||||||||||||||||||||
| Purchases of investments |
(942,997,159 | ) | (468,097,614 | ) | (1,333,387,433 | ) | (173,934,862 | ) | (279,875,698 | ) | ||||||||||
| Proceeds from sale and maturities of investments |
648,888,396 | 424,260,653 | 1,415,283,095 | 208,011,483 | 308,586,927 | |||||||||||||||
| Proceeds from (Purchase of) short-term investments, net |
32,664,328 | (22,030,555 | ) | (14,450,758 | ) | 8,660,604 | (1,188,279 | ) | ||||||||||||
| Proceeds from (Purchase of) closed foreign currency spot transactions |
— | — | (708,982 | ) | 8,450 | (70 | ) | |||||||||||||
| Proceeds from litigation settlement |
8,381 | 35,531 | 22,284 | — | — | |||||||||||||||
| Payment‑in‑kind distributions |
(1,311,078 | ) | (217,649 | ) | — | — | — | |||||||||||||
| Amortization (Accretion) of premiums and discounts, net |
(12,328,058 | ) | (7,854,856 | ) | 8,629,845 | 753,339 | 4,805,519 | |||||||||||||
| Amortization of deferred offering costs |
(136,379 | ) | (133,087 | ) | 893,512 | — | 53,829 | |||||||||||||
| (Increase) Decrease in: |
||||||||||||||||||||
| Receivable for dividends |
107 | — | 70,783 | — | — | |||||||||||||||
| Receivable for interest |
(368,485 | ) | 1,492,820 | (205,411 | ) | 217,653 | (163,365 | ) | ||||||||||||
| Receivable for reclaims |
— | 16,929 | 15,222 | (101 | ) | (115 | ) | |||||||||||||
| Receivable for investments sold |
21,885,315 | 6,565,576 | 6,399,886 | 213,844,124 | (211,006 | ) | ||||||||||||||
| Receivable for reimbursement from Adviser |
— | — | — | (160,261 | ) | — | ||||||||||||||
| Receivable for variation margin on futures contracts |
— | — | 408,125 | — | — | |||||||||||||||
| Other assets |
120,290 | 35,723 | (19,706 | ) | 8,449 | 100,722 | ||||||||||||||
| Increase (Decrease) in: |
||||||||||||||||||||
| Payable for interest |
(100,568 | ) | (172,818 | ) | 140,403 | (161,886 | ) | (61,227 | ) | |||||||||||
| Payable for investments purchased - regular settlement |
(8,053,248 | ) | (1,083,986 | ) | 12,057,458 | 668,177 | (830,904 | ) | ||||||||||||
| Payable for investments purchased - when-issued/delayed-delivery settlement |
35,459,709 | 27,216,212 | — | — | — | |||||||||||||||
| Payable for unfunded senior loans |
2,634,204 | 734,397 | — | — | — | |||||||||||||||
| Payable for management fees |
134,676 | 27,763 | (6,295 | ) | (187,492 | ) | (5,606 | ) | ||||||||||||
| Payable for offering cost |
(21,136 | ) | — | (115,365 | ) | — | (1,000 | ) | ||||||||||||
| Accrued custodian fees |
(89,945 | ) | (34,776 | ) | (73,102 | ) | (9,248 | ) | (5,513 | ) | ||||||||||
| Accrued investor relations fees |
21,728 | 17,607 | 976 | (1,865 | ) | 389 | ||||||||||||||
| Accrued Trustees fees |
(5,085 | ) | (7,635 | ) | (15,005 | ) | (1,722 | ) | 4,347 | |||||||||||
| Accrued professional fees |
(1,171 | ) | (1,290 | ) | 385 | 10,230 | 34,657 | |||||||||||||
| Accrued shareholder reporting expenses |
(12,664 | ) | (10,150 | ) | (20,116 | ) | 672 | 12,139 | ||||||||||||
| Accrued shareholder servicing agent fees |
(2,167 | ) | 218 | 685 | 15 | 20 | ||||||||||||||
| Accrued shelf offering costs |
2,163 | 116,110 | (79,701 | ) | — | — | ||||||||||||||
| Accrued other expenses |
38,877 | 14,056 | (191,031 | ) | 526,679 | (14,568 | ) | |||||||||||||
| Net realized (gain) loss from investments |
25,473,772 | 14,391,769 | (16,006,629 | ) | (1,960,584 | ) | 5,510,088 | |||||||||||||
| Net realized (gain) loss from foreign currency transactions |
— | — | 708,987 | (8,450 | ) | 583 | ||||||||||||||
| Net change in unrealized (appreciation) depreciation of investments |
(18,510,139 | ) | (11,958,174 | ) | (90,492,148 | ) | (9,045,743 | ) | (28,979,344 | ) | ||||||||||
| Net change in unrealized (appreciation) depreciation of swap contracts |
— | — | 24,034,354 | — | — | |||||||||||||||
| Net change in unrealized (appreciation) depreciation on foreign currency translations |
— | 2,448 | (1,349 | ) | — | — | ||||||||||||||
| Net cash provided by (used in) operating activities |
(112,622,478 | ) | 27,311,888 | 265,216,813 | 275,584,997 | 54,609,100 | ||||||||||||||
| CASH FLOWS FROM FINANCING ACTIVITIES |
||||||||||||||||||||
| Proceeds from borrowings |
40,000,000 | — | 50,000,000 | 128,000,000 | 4,000,000 | |||||||||||||||
| (Repayments) of borrowings |
— | — | (90,000,000 | ) | (157,500,000 | ) | (17,000,000 | ) | ||||||||||||
| Proceeds from reverse repurchase agreements |
— | — | 1,659,383,000 | 41,000,000 | 189,144,000 | |||||||||||||||
| (Repayments of) reverse repurchase agreements |
— | — | (1,644,383,000 | ) | (65,000,000 | ) | (182,144,000 | ) | ||||||||||||
| Increase (Decrease) in: |
||||||||||||||||||||
| Cash overdraft |
— | — | — | (19,698,007 | ) | — | ||||||||||||||
| Cash collateral due to broker |
— | — | 1,938,338 | — | — | |||||||||||||||
| Cash collateral due to broker for investments in futures contracts |
— | — | (22,525,185 | ) | — | — | ||||||||||||||
| Cash overdraft denominated in foreign currencies |
— | — | — | — | (32 | ) | ||||||||||||||
| Cash distributions paid to common shareholders |
(145,953,187 | ) | (89,216,829 | ) | (254,880,888 | ) | (26,656,610 | ) | (48,569,756 | ) | ||||||||||
| Proceeds from rights offering |
220,672,151 | 62,135,610 | — | — | — | |||||||||||||||
| Proceeds from shelf offering |
— | — | 54,493,622 | — | — | |||||||||||||||
| Cost of common shares repurchased and retired through tender offer |
— | — | — | (173,521,088 | ) | — | ||||||||||||||
| Net cash provided by (used in) financing activities |
114,718,964 | (27,081,219 | ) | (245,974,113 | ) | (273,375,705 | ) | (54,569,788 | ) | |||||||||||
| Net increase (decrease) in cash, cash denominated in foreign currencies and cash collateral at brokers | 2,096,486 | 230,669 | 19,242,700 | 2,209,292 | 39,312 | |||||||||||||||
See Notes to Financial Statements
74
| Year Ended July 31, 2025 | JFR | JQC | JPC | JPI | NPFD | |||||||||||||||
| Cash and cash denominated in foreign currencies at the beginning of period | 2,370,612 | 277,536 | 48,947 | — | 100,436 | |||||||||||||||
| Cash, cash denominated in foreign currencies and cash collateral at brokers at the end of period | $ | 4,467,098 | $ | 508,205 | $ | 19,291,647 | $ | 2,209,292 | $ | 139,748 | ||||||||||
The following table provides a reconciliation of cash, cash denominated in foreign currencies and cash collateral at brokers to the Statement of Assets and Liabilities:
| JFR | JQC | JPC | JPI | NPFD | ||||||||||||||||
| Cash | $ | 4,467,098 | $ | 508,188 | $ | 15,717,343 | $ | 2,209,292 | $ | 139,748 | ||||||||||
| Cash denominated in foreign currencies | — | 17 | — | — | — | |||||||||||||||
| Cash collateral at broker for investments in futures contracts | — | — | 3,574,304 | — | — | |||||||||||||||
| Total cash, cash denominated in foreign currencies and cash collateral at brokers | $ | 4,467,098 | $ | 508,205 | $ | 19,291,647 | $ | 2,209,292 | $ | 139,748 |
| SUPPLEMENTAL DISCLOSURE OF CASH FLOW INFORMATION | JFR | JQC | JPC | JPI | NPFD | |||||||||||||||
| Cash paid for interest (excluding borrowing and amortization of offering costs) | $ | 41,941,982 | $ | 27,042,943 | $ | 82,125,934 | $ | 8,947,598 | $ | 14,681,095 | ||||||||||
| Non‑cash financing activities not included herein consists of reinvestments of common share distributions | — | — | 1,251,009 | 397,265 | — |
See Notes to Financial Statements
75
Financial Highlights
The following data is for a common share outstanding for each fiscal year end unless otherwise noted:
| Investment Operations | Less Distributions to Common Shareholders |
Common Share | ||||||||||||||||||||||||||||||||||||||||||||
| Common Share Net Asset Value, Beginning of Period |
Net Investment Income (NII) (Loss)(a) |
Net Realized/ Unrealized Gain (Loss) |
Total | From NII |
From Net Realized Gains |
Return of Capital |
Total | Net Asset Value, End of Period |
Share Price, End of Period | |||||||||||||||||||||||||||||||||||||
| JFR | ||||||||||||||||||||||||||||||||||||||||||||||
| 7/31/25 |
$9.28 | $0.76 | $(0.20) | $0.56 | $(0.80) | $— | $(0.22) | $(1.02 | ) | $8.82 | $8.52 | |||||||||||||||||||||||||||||||||||
| 7/31/24 |
9.13 | 0.89 | 0.28 | 1.17 | (0.99 | ) | — | (0.03) | (1.02 | ) | 9.28 | 8.82 | ||||||||||||||||||||||||||||||||||
| 7/31/23 |
9.39 | 0.91 | (0.30) | 0.61 | (0.87 | ) | — | — | (0.87 | ) | 9.13 | 8.08 | ||||||||||||||||||||||||||||||||||
| 7/31/22 |
10.36 | 0.56 | (0.83) | (0.27) | (0.61 | ) | — | (0.09) | (0.70 | ) | 9.39 | 8.84 | ||||||||||||||||||||||||||||||||||
| 7/31/21 | 9.40 | 0.54 | 1.04 | 1.58 | (0.62 | ) | — | — | (0.62 | ) | 10.36 | 9.76 | ||||||||||||||||||||||||||||||||||
| JQC | ||||||||||||||||||||||||||||||||||||||||||||||
| 7/31/25 |
5.91 | 0.48 | (0.08) | 0.40 | (0.50 | ) | — | (0.15) | (0.65 | ) | 5.66 | 5.53 | ||||||||||||||||||||||||||||||||||
| 7/31/24 |
5.83 | 0.56 | 0.16 | 0.72 | (0.57 | ) | — | (0.07) | (0.64 | ) | 5.91 | 5.73 | ||||||||||||||||||||||||||||||||||
| 7/31/23 |
6.10 | 0.52 | (0.24) | 0.28 | (0.53 | ) | — | (0.02) | (0.55 | ) | 5.83 | 5.08 | ||||||||||||||||||||||||||||||||||
| 7/31/22 |
6.91 | 0.35 | (0.68) | (0.33) | (0.35 | ) | — | (0.13) | (0.48 | ) | 6.10 | 5.50 | ||||||||||||||||||||||||||||||||||
| 7/31/21 | 6.88 | 0.32 | 0.56 | 0.88 | (0.30 | ) | — | (0.55) | (0.85 | ) | 6.91 | 6.53 | ||||||||||||||||||||||||||||||||||
| (a) | Based on average shares outstanding. |
| (b) | Total Return Based on Common Share NAV is the combination of changes in common share NAV, reinvested distributions at Common Share NAV, if any. The last distribution declared in the period, which is typically paid on the first business day of the following month, is assumed to be reinvested at the ending NAV. The actual reinvest price for the last distribution declared in the period may often be based on the Fund’s market price (and not its NAV), and therefore may be different from the price used in the calculation. Total returns are not annualized. |
| Total Return Based on Common Share Price is the combination of changes in the market price per share and the effect of reinvested distributions, if any, at the average price paid per share at the time of reinvestment. The last distribution declared in the period, which is typically paid on the first business day of the following month, is assumed to be reinvested at the ending market price. The actual reinvestment for the last distribution declared in the period may take place over several days, and in some instances may not be based on the market price, so the actual reinvestment price may be different from the price used in the calculation. Total returns are not annualized. |
76
| Common Share Supplemental Data/ Ratios Applicable to Common Shares | ||||||||||||||||||||||
| Common Share Total Returns |
Ratios to Average Net Assets |
|||||||||||||||||||||
| Based on Net Asset Value(b) |
Based on Share Price(b) |
Net Assets, End of Period (000) |
Expenses(c) | Net Investment Income (Loss)(c) |
Portfolio Turnover Rate | |||||||||||||||||
| 6.37% | 8.66% | $1,420,503 | 4.78% | 8.43% | 31% | |||||||||||||||||
| 13.46 | 23.15 | 1,244,023 | 5.52 | 9.63 | 38 | |||||||||||||||||
| 6.88 | 1.57 | 1,224,552 | 4.77 | 9.88 | 28 | |||||||||||||||||
| (2.84) | (2.59) | 534,392 | 2.17 | 5.49 | 38 | |||||||||||||||||
| 17.36 | 30.14 | 589,469 | 2.20 | 5.39 | 43 | |||||||||||||||||
| 7.06 | 8.35 | 837,305 | 5.09 | 8.27 | 33 | |||||||||||||||||
| 13.00 | 27.08 | 801,035 | 5.48 | 9.45 | 39 | |||||||||||||||||
| 5.01 | 2.77 | 789,958 | 4.75 | 8.90 | 28 | |||||||||||||||||
| (5.15) | (8.93) | 827,031 | 2.35 | 5.20 | 33 | |||||||||||||||||
| 13.42 | 26.98 | 937,712 | 2.22 | 4.64 | 43 | |||||||||||||||||
| (c) | • Net Investment Income (Loss) ratios reflect income earned and expenses incurred on assets attributable to preferred shares, borrowings, and/or reverse repurchase agreements (as described in Notes to Financial Statements), where applicable. |
| • The expense ratios reflect, among other things, all interest expense and other costs related to preferred shares and/or reverse repurchase agreements (as described in Notes to Financial Statements) where applicable, as follows: |
| Ratios of Interest Expense to Average Net Assets Applicable to Common Shares | ||||||||
| JFR | JQC | |||||||
| 7/31/25 |
3.37% | 3.53% | ||||||
| 7/31/24 |
4.08 | 4.03 | ||||||
| 7/31/23 |
3.28 | 3.30 | ||||||
| 7/31/22 |
0.80 | 0.91 | ||||||
| 7/31/21 |
0.82 | 0.80 | ||||||
See Notes to Financial Statements.
77
Financial Highlights (continued)
The following data is for a common share outstanding for each fiscal year end unless otherwise noted:
| Investment Operations | Less Distributions to Common Shareholders |
Common Share | ||||||||||||||||||||||||||||||||||||||||||||||||||||
| Common Share Net Asset Value, Beginning of Period |
Net Investment Income (NII) (Loss)(a) |
Net Realized/ Unrealized Gain (Loss) |
Total | From NII |
From Net Realized Gains |
Return of Capital |
Total | Shelf Offering Costs |
Premium per Share Sold through Shelf Offering |
Net Asset Value, End of Period |
Share Price, End of Period | |||||||||||||||||||||||||||||||||||||||||||
| JPC | ||||||||||||||||||||||||||||||||||||||||||||||||||||||
| 7/31/25 |
$8.03 | $0.46 | $0.32 | $0.78 | $(0.56 | ) | $— | $(0.24) | $(0.80 | ) | $— | $— | $8.01 | $8.07 | ||||||||||||||||||||||||||||||||||||||||
| 7/31/24 |
7.45 | 0.40 | 0.77 | 1.17 | (0.59 | ) | — | — | (0.59 | ) | — | — | 8.03 | 7.68 | ||||||||||||||||||||||||||||||||||||||||
| 7/31/23 |
8.41 | 0.46 | (0.84) | (0.38) | (0.58 | ) | — | — | (0.58 | ) | — | — | 7.45 | 6.60 | ||||||||||||||||||||||||||||||||||||||||
| 7/31/22 |
9.91 | 0.66 | (1.52) | (0.86) | (0.64 | ) | — | — | (0.64 | ) | — | (e) | — | (e) | 8.41 | 8.20 | ||||||||||||||||||||||||||||||||||||||
| 7/31/21 | 8.83 | 0.67 | 1.05 | 1.72 | (0.64 | ) | — | — | (0.64 | ) | — | (e) | — | (e) | 9.91 | 10.00 | ||||||||||||||||||||||||||||||||||||||
| JPI | ||||||||||||||||||||||||||||||||||||||||||||||||||||||
| 7/31/25 |
19.96 | 1.20 | 0.77 | 1.97 | (1.11 | ) | — | (0.81) | (1.92 | ) | — | — | 20.01 | 20.54 | ||||||||||||||||||||||||||||||||||||||||
| 7/31/24 |
18.44 | 1.08 | 1.62 | 2.70 | (1.11 | ) | — | (0.07) | (1.18 | ) | — | — | 19.96 | 19.87 | ||||||||||||||||||||||||||||||||||||||||
| 7/31/23 |
21.26 | 1.15 | (2.60) | (1.45) | (1.37 | ) | — | — | (1.37 | ) | — | — | 18.44 | 17.63 | ||||||||||||||||||||||||||||||||||||||||
| 7/31/22 |
25.38 | 1.58 | (4.13) | (2.55) | (1.57 | ) | — | — | (1.57 | ) | — | — | 21.26 | 20.51 | ||||||||||||||||||||||||||||||||||||||||
| 7/31/21 | 22.45 | 1.65 | 2.85 | 4.50 | (1.57 | ) | — | — | (1.57 | ) | — | — | 25.38 | 26.26 | ||||||||||||||||||||||||||||||||||||||||
| (a) | Based on average shares outstanding. |
| (b) | Total Return Based on Common Share NAV is the combination of changes in common share NAV, reinvested distributions at Common Share NAV, if any. The last distribution declared in the period, which is typically paid on the first business day of the following month, is assumed to be reinvested at the ending NAV. The actual reinvest price for the last distribution declared in the period may often be based on the Fund’s market price (and not its NAV), and therefore may be different from the price used in the calculation. Total returns are not annualized. |
| Total Return Based on Common Share Price is the combination of changes in the market price per share and the effect of reinvested distributions, if any, at the average price paid per share at the time of reinvestment. The last distribution declared in the period, which is typically paid on the first business day of the following month, is assumed to be reinvested at the ending market price. The actual reinvestment for the last distribution declared in the period may take place over several days, and in some instances may not be based on the market price, so the actual reinvestment price may be different from the price used in the calculation. Total returns are not annualized. |
78
| Common Share Supplemental Data/ Ratios Applicable to Common Shares | ||||||||||||||||||||||
| Common Share Total Returns |
Ratios to Average Net Assets |
|||||||||||||||||||||
| Based on Net Asset Value(b) |
Based on Share Price(b) |
Net Assets, End of Period (000) |
Expenses(c) | Expenses After Reimbursement(c),(d) |
Net Investment Income (Loss)(c) |
Portfolio Turnover Rate | ||||||||||||||||
| 10.29% | 16.10% | $2,615,446 | 4.67% | N/A% | 5.78% | 33% | ||||||||||||||||
| 16.21 | 26.70 | 2,563,871 | 5.20 | N/A | 5.22 | 39 | ||||||||||||||||
| (4.47) | (12.60) | 783,007 | 4.46 | N/A | 5.92 | 15 | ||||||||||||||||
| (9.05) | (11.91) | 884,062 | 2.06 | N/A | 7.10 | 71 | ||||||||||||||||
| 19.93 | 21.55 | 1,028,714 | 1.81 | N/A | 7.02 | 23 | ||||||||||||||||
| 10.34 | 13.79 | 282,566 | 4.74 | 4.12 | 5.98 | 40 | ||||||||||||||||
| 15.10 | 20.11 | 454,488 | 4.97 | N/A | 5.67 | 42 | ||||||||||||||||
| (6.85) | (7.39) | 420,003 | 4.40 | N/A | 6.00 | 14 | ||||||||||||||||
| (10.41) | (16.35) | 484,242 | 2.06 | N/A | 6.75 | 9 | ||||||||||||||||
| 20.54 | 26.22 | 577,883 | 1.76 | N/A | 6.79 | 23 | ||||||||||||||||
| (c) | • Net Investment Income (Loss) ratios reflect income earned and expenses incurred on assets attributable to preferred shares, borrowings, and/or reverse repurchase agreements (as described in Notes to Financial Statements), where applicable. |
| • The expense ratios reflect, among other things, all interest expense and other costs related to preferred shares and/or reverse repurchase agreements (as described in Notes to Financial Statements) where applicable, as follows: |
| Ratios of Interest Expense to Average Net Assets Applicable to Common Shares | ||||||||
| JPC | JPI | |||||||
| 7/31/25 |
3.39% | 3.07% | ||||||
| 7/31/24 |
3.86 | 3.54 | ||||||
| 7/31/23 |
3.07 | 2.96 | ||||||
| 7/31/22 |
0.72 | 0.69 | ||||||
| 7/31/21 |
0.49 | 0.44 | ||||||
| (d) | During the fiscal year ended July 31, 2025, the Adviser voluntarily reimbursed JPI for certain expenses incurred in connection with its restructuring. See Notes to Financial Statements for more information. |
| (e) | Value rounded to zero. |
See Notes to Financial Statements.
79
Financial Highlights (continued)
The following data is for a common share outstanding for each fiscal year end unless otherwise noted:
| Investment Operations | Less Distributions to Common Shareholders |
Common Share | ||||||||||||||||||||||||||||||||||||||||||||
| Common Share Net Asset Value, Beginning of Period |
Net Investment Income (NII) (Loss)(a) |
Net Realized/ Unrealized Gain (Loss) |
Total | From NII |
|
From Net Realized Gains |
Return of Capital |
Total | Net Asset Value, End of Period |
Share Price, End of Period | ||||||||||||||||||||||||||||||||||||
| NPFD | ||||||||||||||||||||||||||||||||||||||||||||||
| 7/31/25 |
$20.13 | $0.97 | $0.97 | $1.94 | $(0.92 | ) | $— | $(1.09) | $(2.01 | ) | $20.06 | $19.45 | ||||||||||||||||||||||||||||||||||
| 7/31/24 |
18.77 | 0.76 | 1.95 | 2.71 | (1.15 | ) | — | (0.20) | (1.35 | ) | 20.13 | 18.80 | ||||||||||||||||||||||||||||||||||
| 7/31/23 |
21.06 | 0.70 | (1.72) | (1.02) | (1.24 | ) | — | (0.03) | (1.27 | ) | 18.77 | 16.39 | ||||||||||||||||||||||||||||||||||
| 7/31/22(d) | 25.00 | 0.61 | (3.72) | (3.11) | (0.83 | ) | — | — | (0.83 | ) | 21.06 | 19.98 | ||||||||||||||||||||||||||||||||||
| (a) | Based on average shares outstanding. |
| (b) | Total Return Based on Common Share NAV is the combination of changes in common share NAV, reinvested distributions at Common Share NAV, if any. The last distribution declared in the period, which is typically paid on the first business day of the following month, is assumed to be reinvested at the ending NAV. The actual reinvest price for the last distribution declared in the period may often be based on the Fund’s market price (and not its NAV), and therefore may be different from the price used in the calculation. Total returns are not annualized. |
| Total Return Based on Common Share Price is the combination of changes in the market price per share and the effect of reinvested distributions, if any, at the average price paid per share at the time of reinvestment. The last distribution declared in the period, which is typically paid on the first business day of the following month, is assumed to be reinvested at the ending market price. The actual reinvestment for the last distribution declared in the period may take place over several days, and in some instances may not be based on the market price, so the actual reinvestment price may be different from the price used in the calculation. Total returns are not annualized. |
80
| Common Share Supplemental Data/ Ratios Applicable to Common Shares | ||||||||||||||||||||||
| Common Share Total Returns |
Ratios to Average Net Assets |
|||||||||||||||||||||
| Based on Net Asset Value(b) |
Based on Share Price(b) |
Net Assets, End of Period (000) |
Expenses(c) | Net Investment Income (Loss)(c) |
Portfolio Turnover Rate | |||||||||||||||||
| 10.09% | 14.97% | $484,743 | 4.79% | 4.82% | 37% | |||||||||||||||||
| 14.87 | 24.03 | 486,476 | 5.21 | 3.93 | 33 | |||||||||||||||||
| (4.82) | (11.68) | 453,637 | 4.43 | 3.64 | 17 | |||||||||||||||||
| (12.48) | (16.77) | 508,829 | 2.13 (e | ) | 4.33 (e | ) | 14 | |||||||||||||||
| (c) | • Net Investment Income (Loss) ratios reflect income earned and expenses incurred on assets attributable to preferred shares, borrowings, and/or reverse repurchase agreements (as described in Notes to Financial Statements), where applicable. |
| • The expense ratios reflect, among other things, all interest expense and other costs related to preferred shares and/or reverse repurchase agreements (as described in Notes to Financial Statements) where applicable, as follows: |
| Ratios of Interest Expense to Average Net Assets Applicable to Common Shares |
||||||
| NPFD | ||||||
| 7/31/25 |
3.24% | |||||
| 7/31/24 |
3.67 | |||||
| 7/31/23 |
2.93 | |||||
| 7/31/22 |
0.74 | |||||
| (d) | For the period December 15, 2021 (commencement of operations) through July 31, 2022. |
| (e) | Annualized. |
See Notes to Financial Statements.
81
Financial Highlights (continued)
The following table sets forth information regarding each Fund’s outstanding senior securities as of the end of each of the Fund’s last five fiscal periods, as applicable.
| Borrowings | TFP Shares | Term Preferred | VRTP Shares | |||||||||||||||||||||||||||||||||
| Aggregate Amount Outstanding (000)(a) |
Asset Coverage Per $1,000(b) |
Aggregate Amount Outstanding (000)(a) |
Asset Coverage Per $1,000(c) |
Aggregate Amount Outstanding (000)(a) |
Asset Coverage Per $1,000(c) |
Aggregate Amount Outstanding (000) |
Asset Coverage Per $100,000(d) |
Asset Coverage Per $1 Liquidation Preference(e) |
||||||||||||||||||||||||||||
| JFR |
||||||||||||||||||||||||||||||||||||
| 7/31/25 |
$517,200 | $4,298 | $285,000 | $2,771 | $— | $— | $— | $— | $2.77 | |||||||||||||||||||||||||||
| 7/31/24 |
477,200 | 4,204 | 285,000 | 2,632 | — | — | — | — | 2.63 | |||||||||||||||||||||||||||
| 7/31/23 |
477,200 | 4,163 | 285,000 | 2,607 | — | — | — | — | 2.61 | |||||||||||||||||||||||||||
| 7/31/22 |
233,400 | 3,718 | 100,000 | 2,603 | — | — | — | — | 2.60 | |||||||||||||||||||||||||||
| 7/31/21 |
238,400 | 3,892 | 100,000 | 2,742 | — | — | — | — | 2.74 | |||||||||||||||||||||||||||
| JQC |
||||||||||||||||||||||||||||||||||||
| 7/31/25 |
211,600 | 5,619 | 140,000 | 3,381 | — | — | — | — | 3.38 | |||||||||||||||||||||||||||
| 7/31/24 |
211,600 | 5,447 | 140,000 | 3,278 | — | — | — | — | 3.28 | |||||||||||||||||||||||||||
| 7/31/23 |
211,600 | 5,395 | 140,000 | 3,247 | — | — | — | — | 3.25 | |||||||||||||||||||||||||||
| 7/31/22 |
246,000 | 4,931 | 140,000 | 3,143 | — | — | — | — | 3.14 | |||||||||||||||||||||||||||
| 7/31/21 |
402,000 | 3,333 | — | — | — | — | — | — | — | |||||||||||||||||||||||||||
| JPC |
||||||||||||||||||||||||||||||||||||
| 7/31/25 |
649,000 | 5,677 | 420,000 | 3,447 | — | — | — | — | 3.45 | |||||||||||||||||||||||||||
| 7/31/24 |
689,000 | 5,331 | 420,000 | 3,312 | — | — | — | — | 3.31 | |||||||||||||||||||||||||||
| 7/31/23 |
219,600 | 5,249 | 150,000 | 3,119 | — | — | — | — | 3.12 | |||||||||||||||||||||||||||
| 7/31/22 |
423,400 | 3,088 | — | — | — | — | — | — | — | |||||||||||||||||||||||||||
| 7/31/21 |
462,700 | 3,223 | — | — | — | — | — | — | — | |||||||||||||||||||||||||||
| JPI |
||||||||||||||||||||||||||||||||||||
| 7/31/25 |
118,000 | 3,395 | — | — | — | — | — | — | — | |||||||||||||||||||||||||||
| 7/31/24 |
147,500 | 4,081 | — | — | — | — | — | — | — | |||||||||||||||||||||||||||
| 7/31/23 |
180,900 | 3,322 | — | — | — | — | — | — | — | |||||||||||||||||||||||||||
| 7/31/22 |
216,000 | 3,242 | — | — | — | — | — | — | — | |||||||||||||||||||||||||||
| 7/31/21 |
234,800 | 3,461 | — | — | — | — | — | — | — | |||||||||||||||||||||||||||
| NPFD |
||||||||||||||||||||||||||||||||||||
| 7/31/25 |
161,314 | 4,532 | 85,000 | 2,968 | — | — | — | — | 2.97 | |||||||||||||||||||||||||||
| 7/31/24 |
174,314 | 4,278 | 85,000 | 2,876 | — | — | — | — | 2.88 | |||||||||||||||||||||||||||
| 7/31/23 |
147,614 | 4,649 | 85,000 | 2,950 | — | — | — | — | 2.95 | |||||||||||||||||||||||||||
| 7/31/22(f) |
188,600 | 3,698 | — | — | — | — | — | — | — | |||||||||||||||||||||||||||
| (a) | Aggregate Amount Outstanding: Aggregate amount outstanding represents the principal amount outstanding or liquidation preference, if applicable, as of the end of the relevant fiscal year. |
| (b) | Asset Coverage Per $1,000: Asset coverage per $1,000 is calculated by subtracting the Fund’s liabilities and indebtedness not represented by senior securities from the Fund’s total assets, dividing the result by the aggregate amount of the Fund’s borrowings (excluding temporary borrowings) then outstanding and multiplying the result by 1,000. For purpose of asset coverage above, senior securities consist of preferred shares or borrowings of a Fund and does not include derivative transactions and other investments that have the economic effect of leverage such as reverse repurchase agreements and tender option bonds. If the leverage effects of such investments were included, the asset coverage amounts presented would be lower. |
| (c) | Asset Coverage Per $1,000: Asset coverage per $1,000 is calculated by subtracting the Fund’s liabilities and indebtedness not represented by senior securities from the Fund’s total assets, dividing the result by the aggregate of the involuntary liquidation preference of the outstanding preferred shares and multiplying the result by 1,000. For purpose of asset coverage above, senior securities consist of preferred shares or borrowings (excluding temporary borrowings) of a Fund and does not include derivative transactions and other investments that have the economic effect of leverage such as reverse repurchase agreements and tender option bonds. If the leverage effects of such investments were included, the asset coverage amounts presented would be lower. |
| (d) | Asset Coverage Per $100,000: Asset coverage per $100,000 is calculated by subtracting the Fund’s liabilities and indebtedness not represented by senior securities from the Fund’s total assets, dividing the result by the aggregate of the involuntary liquidation preference of the outstanding preferred shares and multiplying the result by 100,000. For purpose of asset coverage above, senior securities consist of preferred shares or borrowings (excluding temporary borrowings) of a Fund and does not include derivative transactions and other investments that have the economic effect of leverage such as reverse repurchase agreements and tender option bonds. If the leverage effects of such investments were included, the asset coverage amounts presented would be lower. |
| (e) | Includes all borrowings and preferred shares presented for the Fund. |
| (f) | For the period December 15, 2021 (commencement of operations) through July 31, 2022. |
82
Notes to Financial Statements
| 1. | General Information |
Fund Information: The funds covered in this report and their corresponding New York Stock Exchange (“NYSE”) symbols are as follows (each a “Fund” and collectively, the “Funds”):
| • | Nuveen Floating Rate Income Fund (JFR) |
| • | Nuveen Credit Strategies Income Fund (JQC) |
| • | Nuveen Preferred & Income Opportunities Fund (JPC) |
| • | Nuveen Preferred Securities & Income Opportunities Fund (JPI) |
| • | Nuveen Variable Rate Preferred & Income Fund (NPFD) |
The Funds are registered under the Investment Company Act of 1940 (the “1940 Act”), as amended, as closed‑end management investment companies. JFR, JQC, JPC, JPI and NPFD were each organized as Massachusetts business trusts on January 15, 2004, March 17, 2003, January 27, 2003, April 18, 2012 and June 1, 2021, respectively.
Current Fiscal Period: The end of the reporting period for the Funds is July 31, 2025, and the period covered by these Notes to Financial Statements is the fiscal year ended July 31, 2025 (the “current fiscal period”).
Investment Adviser and Sub‑Adviser: The Funds’ investment adviser is Nuveen Fund Advisors, LLC (the “Adviser”), a subsidiary of Nuveen, LLC (“Nuveen”). Nuveen is the investment management arm of Teachers Insurance and Annuity Association of America (“TIAA”). The Adviser has overall responsibility for management of the Funds, oversees the management of the Funds’ portfolios, manages the Funds’ business affairs and provides certain clerical, bookkeeping and other administrative services, and, if necessary, asset allocation decisions. The Adviser has entered into sub‑ advisory agreements with Nuveen Asset Management, LLC (the “Sub‑Adviser”), a subsidiary of the Adviser, under which the Sub‑Adviser manages the investment portfolio of the Funds. The Adviser is responsible for managing JPC’s and JPI’s investments in swap contracts.
JPI Fund Restructuring and Tender Offer: On July 17, 2024, shareholders of JPI approved a proposal to amend the Fund’s declaration of trust to eliminate the Fund’s term structure, subject to the completion of a tender offer. The amendment allows shareholders the opportunity to maintain their investment in the Fund and its leveraged exposure to preferred and other income producing securities in lieu of the Fund’s scheduled termination. Additionally, on July 17, 2024, the Fund conducted a tender offer, which allowed shareholders to offer up to 100% of their common shares for repurchase for cash at a price per share equal to 100% of the net asset value (“NAV”) per share determined on the date the tender offer expired. The tender offer expired on August 14, 2024. In the tender offer 8,672,542 shares were tendered, representing approximately 38% of the Fund’s common shares outstanding. Properly tendered shares were repurchased at $20.0081 per share, which was the NAV of the Fund as of the close of ordinary trading on the New York Stock Exchange on August 14, 2024. As a result of the successful completion of the tender offer, the restructuring of the Fund was completed and on August 19, 2024, the following changes became effective.
| • | The Fund’s declaration of trust was amended to eliminate the term of the Fund. |
| • | The Fund’s name changed from Nuveen Preferred and Income Term Fund to Nuveen Preferred Securities & Income Opportunities Fund. |
| • | Nuveen Fund Advisors, LLC, the investment adviser to the Fund, will waive 50% of the Fund’s net management fees beginning August 19, 2024, and continuing over the first year following the elimination of the term. |
JPC, JPS and JPT Fund Mergers: Effective prior to opening of business on November 6, 2023, Nuveen Preferred & Income Securities Fund (JPS) and Nuveen Preferred and Income Fund (JPT) (the “Target Funds”) were each merged into JPC (the “Acquiring Fund”) (each a “Merger”). With respect to each Merger of a Target Fund with and into the Acquiring Fund, the separate legal existence of the Target Fund ceased for all purposes and the Acquiring Fund succeeded to all the assets and assumed all the liabilities of the Target Fund. Shares of the Target Fund were converted into newly issued shares of the Acquiring Fund. Holders of common shares of the Target Fund received newly issued common shares of the Acquiring Fund, the aggregate NAV of which was equal to the aggregate NAV of the common shares of the Target Fund held immediately prior to the Merger (including for this purpose fractional Acquiring Fund shares to which shareholders were entitled). For accounting and performance reporting purposes, the Acquiring Fund is the survivor.
JPC and JPI – Fund Merger: On March 19, 2025, the merger of JPI into JPC was approved by the Funds’ Board of Trustees (the “Board”). The merger was approved by shareholders on August 29,2025 (subsequent to the close of the reporting period) and became effective prior to the opening of business on September 22, 2025.
| 2. | Significant Accounting Policies |
The accompanying financial statements were prepared in accordance with accounting principles generally accepted in the United States of America (“U.S. GAAP”), which may require the use of estimates made by management and the evaluation of subsequent events. Actual results may differ from those estimates. The Funds are investment companies and follow accounting guidance in the Financial Accounting Standards Board (“FASB”) Accounting Standards Codification 946, Financial Services — Investment Companies. The NAV for financial reporting purposes may differ from the NAV for processing security and common share transactions. The NAV for financial reporting purposes includes security and common share transactions through the date of the report. Total return is computed based on the NAV used for processing security and common share transactions. The following is a summary of the significant accounting policies consistently followed by the Funds.
83
Notes to Financial Statements (continued)
Compensation: The Funds pay no compensation directly to those of its officers, all of whom receive remuneration for their services to the Funds from the Adviser or its affiliates. The Board has adopted a deferred compensation plan for independent trustees that enables trustees to elect to defer receipt of all or a portion of the annual compensation they are entitled to receive from certain Nuveen-advised funds. Under the plan, deferred amounts are treated as though equal dollar amounts had been invested in shares of select Nuveen-advised funds.
Distributions to Common Shareholders: Distributions to common shareholders are recorded on the ex‑dividend date. The amount, character and timing of distributions are determined in accordance with federal income tax regulations, which may differ from U.S. GAAP.
The Funds’ distribution policy, which may be changed by the Board, is to make regular monthly cash distributions to holders of their common shares (stated in terms of a fixed cents per common share dividend distributions rate which may be set from time to time). Each Fund intends to distribute all or substantially all of its net investment income each year through its regular monthly distribution and to distribute realized capital gains at least annually. In addition, in any monthly period, to maintain its declared per common share distribution amount, a Fund may distribute more or less than its net investment income during the period. In the event a Fund distributes more than its net investment income during any yearly period, such distributions may also include realized gains and/or a return of capital. To the extent that a distribution includes a return of capital the NAV per share may erode.
Foreign Currency Transactions and Translation: To the extent that the Funds invest in securities and/or contracts that are denominated in a currency other than U.S. dollars, the Funds will be subject to currency risk, which is the risk that an increase in the U.S. dollar relative to the foreign currency will reduce returns or portfolio value. Generally, when the U.S. dollar rises in value against a foreign currency, the Funds’ investments denominated in that currency will lose value because their currency is worth fewer U.S. dollars; the opposite effect occurs if the U.S. dollar falls in relative value. Investments and other assets and liabilities denominated in foreign currencies are converted into U.S. dollars on a spot (i.e. cash) basis at the spot rate prevailing in the foreign currency exchange market at the time of valuation. Purchases and sales of investments and income denominated in foreign currencies are translated into U.S. dollars on the respective dates of such transactions.
The books and records of the Funds are maintained in U.S. dollars. Assets, including investments, and liabilities denominated in foreign currencies are translated into U.S. dollars at the end of each day. Purchases and sales of securities, income and expenses are translated into U.S. dollars at the prevailing exchange rate on the respective dates of the transactions.
Net realized foreign currency gains and losses resulting from changes in exchange rates associated with (i) foreign currency, (ii) investments and (iii) derivatives include foreign currency gains and losses between trade date and settlement date of the transactions, foreign currency transactions, and the difference between the amounts of interest and dividends recorded on the books of the Funds and the amounts actually received are recognized as a component of “Net realized gain (loss) from foreign currency transactions” on the Statement of Operations, when applicable.
The unrealized gains and losses resulting from changes in foreign currency exchange rates and changes in foreign exchange rates associated with (i) investments and (ii) other assets and liabilities are recognized as a component of “Change in net unrealized appreciation (depreciation) on foreign currency translations” on the Statement of Operations, when applicable. The unrealized gains and losses resulting from changes in foreign exchange rates associated with investments in derivatives are recognized as a component of the respective derivative’s related “Change in unrealized appreciation (depreciation)” on the Statement of Operations, when applicable.
As of the end of the current fiscal period, the percentage of investments in non‑U.S. securities for JPC, JPI and NPFD are as follows:
| JPC | Value | % of Total Investments |
||||||
| |
||||||||
| Country: | ||||||||
| United Kingdom |
$521,932,668 | 12.7% | ||||||
| Canada |
369,022,505 | 8.9 | ||||||
| France |
358,602,068 | 8.7 | ||||||
| Spain |
176,860,137 | 4.3 | ||||||
| Switzerland |
147,418,924 | 3.6 | ||||||
| Netherlands |
71,897,679 | 1.7 | ||||||
| Germany |
50,143,737 | 1.2 | ||||||
| Mexico |
46,533,178 | 1.1 | ||||||
| Ireland |
41,913,945 | 1.0 | ||||||
| Australia |
34,839,538 | 0.9 | ||||||
| Other |
86,971,489 | 2.1 | ||||||
| |
||||||||
| Total non‑U.S. Securities | $1,906,135,868 | 46.2% | ||||||
| |
||||||||
84
| JPI | Value | % of Total Investments |
||||||
| |
||||||||
| Country: | ||||||||
| United Kingdom |
$56,127,158 | 12.7% | ||||||
| France |
38,483,684 | 8.7 | ||||||
| Canada |
37,673,250 | 8.6 | ||||||
| Spain |
19,953,159 | 4.5 | ||||||
| Switzerland |
19,009,420 | 4.3 | ||||||
| Netherlands |
9,000,137 | 2.0 | ||||||
| Germany |
5,333,459 | 1.2 | ||||||
| Mexico |
5,091,515 | 1.2 | ||||||
| Ireland |
4,158,689 | 1.0 | ||||||
| Finland |
3,025,652 | 0.7 | ||||||
| Other |
8,917,669 | 2.0 | ||||||
| |
||||||||
| Total non‑U.S. Securities | $206,773,792 | 46.9% | ||||||
| |
||||||||
| NPFD | Value | % of Total Investments |
||||||
| |
||||||||
| Country: | ||||||||
| Canada |
$89,908,749 | 11.9% | ||||||
| United Kingdom |
56,556,657 | 7.5 | ||||||
| France |
34,175,685 | 4.5 | ||||||
| Spain |
18,809,859 | 2.5 | ||||||
| Switzerland |
17,319,056 | 2.3 | ||||||
| Netherlands |
10,013,944 | 1.3 | ||||||
| Germany |
7,156,538 | 1.0 | ||||||
| Mexico |
6,797,790 | 0.9 | ||||||
| Ireland |
6,743,857 | 0.9 | ||||||
| Finland |
3,143,496 | 0.4 | ||||||
| Other |
7,400,643 | 1.0 | ||||||
| |
||||||||
| Total non‑U.S. Securities | $258,026,274 | 34.2% | ||||||
| |
||||||||
Foreign Taxes: The Funds may be subject to foreign taxes on income, gains on investments or foreign currency repatriation, a portion of which may be recoverable. The Funds will accrue such taxes and recoveries as applicable, based upon the current interpretation of tax rules and regulations that exist in the markets in which the Funds invest.
Indemnifications: Under the Funds’ organizational documents, their officers and trustees are indemnified against certain liabilities arising out of the performance of their duties to the Funds. In addition, in the normal course of business, the Funds enter into contracts that provide general indemnifications to other parties. The Funds’ maximum exposure under these arrangements is unknown as this would involve future claims that may be made against the Funds that have not yet occurred. However, the Funds have not had prior claims or losses pursuant to these contracts and expects the risk of loss to be remote.
Investments and Investment Income: Securities transactions are accounted for as of the trade date for financial reporting purposes. Trade date for senior and subordinated loans purchased in the “primary market” is considered the date on which the loan allocations are determined. Trade date for senior and subordinated loans purchased in the “secondary market” is the date on which the transaction is entered into. Realized gains and losses on securities transactions are based upon the specific identification method. Dividend income is recorded on the ex‑dividend date or, for certain foreign securities, when information is available. Non‑cash dividends received in the form of stock, if any, are recorded on the ex‑dividend date and recorded at fair value. Interest income, which is recorded on an accrual basis and includes accretion of discounts and amortization of premiums for financial reporting purposes. Interest income also reflects payment‑in‑kind (“PIK”) interest and paydown gains and losses, if any. PIK interest represents income received in the form of securities in lieu of cash. Rehypothecation income is comprised of fees earned in connection with the rehypothecation of pledged collateral as further described later in these Notes to Financial Statements. Fee income consists primarily of amendment fees, when applicable. Amendment fees are earned as compensation for evaluating and accepting changes to an original senior loan agreement and are recognized when received. Fee income and amendment fees, if any, are recognized as “Fees” on the Statement of Operations.
Netting Agreements: In the ordinary course of business, the Funds may enter into transactions subject to enforceable master repurchase agreements, International Swaps and Derivatives Association, Inc. (ISDA) master agreements or other similar arrangements (“netting agreements”). Generally, the right to offset in netting agreements allows each Fund to offset certain securities and derivatives with a specific counterparty, when applicable, as well as any collateral received or delivered to that counterparty based on the terms of the agreements. Generally, each Fund manages its cash collateral and securities collateral on a counterparty basis. With respect to certain counterparties, in accordance with the terms of the netting agreements, collateral posted to the Funds is held in a segregated account by the Funds’ custodian and/or with respect to those amounts which can be sold or repledged, are presented in the Funds’ Portfolio of Investments or Statement of Assets and Liabilities.
The Funds’ investments subject to netting agreements as of the end of the current fiscal period, if any, are further described later in these Notes to Financial Statements.
85
Notes to Financial Statements (continued)
Segment Reporting: In November 2023, the FASB issued Accounting Standard Update (“ASU”) No. 2023‑07, Segment Reporting (Topic 280) Improvements to Reportable Segment Disclosures (“ASU 2023‑07”). The amendments in ASU 2023‑07 improve reportable segment disclosure requirements, primarily through enhanced disclosures about significant segment expenses. ASU 2023‑07 also requires a public entity that has a single reportable segment to provide all the disclosures required by the amendments in ASU 2023‑07 and all existing segment disclosures in Topic 280. The amendments in ASU 2023‑07 are effective for fiscal years beginning after December 15, 2023, and interim periods within fiscal years beginning after December 15, 2024. The Funds adopted ASU 2023‑07 during the current reporting period. Adoption of the new standard impacted financial statement disclosures only and did not affect the Funds’ financial positions or the results of their operations.
Each Fund represents a single operating segment. The officers of the Funds act as the chief operating decision maker (“CODM”). The CODM monitors the operating results of each Fund as a whole and is responsible for each Fund’s long-term strategic asset allocation in accordance with the terms of its prospectus, based on a defined investment strategy which is executed by the Fund’s portfolio managers as a team. The financial information in the form of the Fund’s portfolio composition, total returns, expense ratios and changes in net assets (i.e., changes in net assets resulting from operations, subscriptions and redemptions), which are used by the CODM to assess the segment’s performance versus the Fund’s comparative benchmarks and to make resource allocation decisions for the Fund’s single segment, is consistent with that presented within the Fund’s financial statements. Segment assets are reflected on the Statement of Assets and Liabilities as “total assets” and significant segment revenues and expenses are listed on the Statement of Operations.
New Accounting Pronouncement: In December 2023, the FASB issued ASU No. 2023‑09, Income Taxes (Topic 740) Improvements to Income tax disclosures (“ASU 2023‑09”). The primary purpose of the amendments within ASU 2023‑09 is to enhance the transparency and decision usefulness of income tax disclosures primarily related to the rate reconciliation table and income taxes paid information. The amendments in ASU 2023‑09 are effective for annual periods beginning after December 15, 2024. Management is currently evaluating the implications of these changes on the financial statements.
| 3. | Investment Valuation and Fair Value Measurements |
The Funds’ investments in securities are recorded at their estimated fair value utilizing valuation methods approved by the Adviser, subject to oversight of the Board. Fair value is defined as the price that would be received upon selling an investment or transferring a liability in an orderly transaction to an independent buyer in the principal or most advantageous market for the investment. U.S. GAAP establishes the three-tier hierarchy which is used to maximize the use of observable market data and minimize the use of unobservable inputs and to establish classification of fair value measurements for disclosure purposes. Observable inputs reflect the assumptions market participants would use in pricing the asset or liability. Observable inputs are based on market data obtained from sources independent of the reporting entity. Unobservable inputs reflect management’s assumptions about the assumptions market participants would use in pricing the asset or liability. Unobservable inputs are based on the best information available in the circumstances. The following is a summary of the three-tiered hierarchy of valuation input levels.
Level 1 – Inputs are unadjusted and prices are determined using quoted prices in active markets for identical securities.
Level 2 – Prices are determined using other significant observable inputs (including quoted prices for similar securities, interest rates, credit spreads, etc.).
Level 3 – Prices are determined using significant unobservable inputs (including management’s assumptions in determining the fair value of investments).
A description of the valuation techniques applied to the Funds’ major classifications of assets and liabilities measured at fair value follows:
Equity securities and exchange-traded funds listed or traded on a national market or exchange are valued based on their last reported sales price or official closing price of such market or exchange on the valuation date. Foreign equity securities and registered investment companies that trade on a foreign exchange are valued at the last reported sales price or official closing price on the principal exchange where traded, and converted to U.S. dollars at the prevailing rates of exchange on the valuation date. For events affecting the value of foreign securities between the time when the exchange on which they are traded closes and the time when the Funds’ net assets are calculated, such securities will be valued at fair value in accordance with procedures adopted by the Adviser, subject to the oversight of the Board. To the extent these securities are actively traded and no valuation adjustments are applied, they are generally classified as Level 1. When valuation adjustments are applied to the most recent last sales price or official closing price, these securities are generally classified as Level 2.
Prices of fixed-income securities are generally provided by pricing services approved by the Adviser, which is subject to review by the Adviser and oversight of the Board. Pricing services establish a security’s fair value using methods that may include consideration of the following: yields or prices of investments of comparable quality, type of issue, coupon, maturity and rating, market quotes or indications of value from security dealers, evaluations of anticipated cash flows or collateral, general market conditions and other information and analysis, including the obligor’s credit characteristics considered relevant. In pricing certain securities, particularly less liquid and lower quality securities, pricing services may consider information about a security, its issuer or market activity provided by the Adviser. These securities are generally classified as Level 2.
Investments in investment companies are valued at their respective NAVs or share price on the valuation date and are generally classified as Level 1.
Repurchase agreements are valued at contract amount plus accrued interest, which approximates market value. These securities are generally classified as Level 2.
Futures contracts are valued using the closing settlement price or, in the absence of such a price, the last traded price and are generally classified as Level 1.
Swap contracts are marked‑to‑market daily based upon a price supplied by a pricing service. Swaps are generally classified as Level 2.
86
For any portfolio security or derivative for which market quotations are not readily available or for which the Adviser deems the valuations derived using the valuation procedures described above not to reflect fair value, the Adviser will determine a fair value in good faith using alternative procedures approved by the Adviser, subject to the oversight of the Board. As a general principle, the fair value of a security is the amount that the owner might reasonably expect to receive for it in a current sale. A variety of factors may be considered in determining the fair value of such securities, which may include consideration of the following: yields or prices of investments of comparable quality, type of issue, coupon, maturity and rating, market quotes or indications of value from security dealers, evaluations of anticipated cash flows or collateral, general market conditions and other information and analysis, including the obligor’s credit characteristics considered relevant. To the extent the inputs are observable and timely, the values would be classified as Level 2; otherwise they would be classified as Level 3.
The following table summarizes the market value of the Funds’ investments as of the end of the current fiscal period, based on the inputs used to value them:
| JFR | Level 1 | Level 2 | Level 3 | Total | ||||||||||||
| |
||||||||||||||||
| Long-Term Investments: | ||||||||||||||||
| Asset-Backed Securities |
$ | – | $ | 6,817,137 | $ | – | $ | 6,817,137 | ||||||||
| Common Stocks |
5,344,732 | 14,762,205 | 595,629 | 20,702,566 | ||||||||||||
| Corporate Bonds |
– | 248,439,050 | – | 248,439,050 | ||||||||||||
| Preferred Stock |
– | 539,016 | – | 539,016 | ||||||||||||
| Variable Rate Senior Loan Interests |
– | 1,978,473,921 | 5,417 | 1,978,479,338 | ||||||||||||
| Warrants |
– | 490,732 | 25,830 | 516,562 | ||||||||||||
| Short-Term Investments: | ||||||||||||||||
| Investment Companies |
28,623,217 | – | – | 28,623,217 | ||||||||||||
| |
||||||||||||||||
| Total | $ | 33,967,949 | $ | 2,249,522,061 | $ | 626,876 | $ | 2,284,116,886 | ||||||||
| |
||||||||||||||||
| JQC | Level 1 | Level 2 | Level 3 | Total | ||||||||||||
| |
||||||||||||||||
| Long-Term Investments: | ||||||||||||||||
| Asset-Backed Securities |
$ | – | $ | 65,959,583 | $ | – | $ | 65,959,583 | ||||||||
| Common Stocks |
5,156 | 7,572,368 | 23,048 | 7,600,572 | ||||||||||||
| Corporate Bonds |
– | 266,352,213 | – | 266,352,213 | ||||||||||||
| Variable Rate Senior Loan Interests |
– | 980,111,869 | 3,498 | 980,115,367 | ||||||||||||
| Warrants |
– | – | 47 | 47 | ||||||||||||
| Short-Term Investments: | ||||||||||||||||
| Investment Companies |
58,662,854 | – | – | 58,662,854 | ||||||||||||
| |
||||||||||||||||
| Total | $ | 58,668,010 | $ | 1,319,996,033 | $ | 26,593 | $ | 1,378,690,636 | ||||||||
| |
||||||||||||||||
| JPC | Level 1 | Level 2 | Level 3 | Total | ||||||||||||
| |
||||||||||||||||
| Long-Term Investments: | ||||||||||||||||
| Common Stocks |
$ | 3,476 | $ | – | $ | – | $ | 3,476 | ||||||||
| Convertible Preferred Securities |
21,289,848 | – | – | 21,289,848 | ||||||||||||
| Corporate Bonds |
– | 3,675,809,696 | 7,053,409 | 3,682,863,105 | ||||||||||||
| Preferred Stock |
341,317,353 | – | – | 341,317,353 | ||||||||||||
| U.S. Government and Agency Obligations |
– | 60,746,030 | – | 60,746,030 | ||||||||||||
| Short-Term Investments: | ||||||||||||||||
| Repurchase Agreements |
– | 21,976,515 | – | 21,976,515 | ||||||||||||
| Investments in Derivatives: | ||||||||||||||||
| Futures Contracts* |
2,272,447 | – | – | 2,272,447 | ||||||||||||
| Interest Rate Swaps* |
– | 2,390,002 | – | 2,390,002 | ||||||||||||
| |
||||||||||||||||
| Total | $ | 364,883,124 | $ | 3,760,922,243 | $ | 7,053,409 | $ | 4,132,858,776 | ||||||||
| |
||||||||||||||||
| JPI | Level 1 | Level 2 | Level 3 | Total | ||||||||||||
| |
||||||||||||||||
| Long-Term Investments: | ||||||||||||||||
| Corporate Bonds |
$ | – | $ | 382,948,208 | $ | 3,531,816 | $ | 386,480,024 | ||||||||
| Preferred Stock |
45,328,625 | – | – | 45,328,625 | ||||||||||||
| U.S. Government and Agency Obligations |
– | 6,464,535 | – | 6,464,535 | ||||||||||||
| Short-Term Investments: | ||||||||||||||||
| Repurchase Agreements |
– | 2,289,396 | – | 2,289,396 | ||||||||||||
| |
||||||||||||||||
| Total | $ | 45,328,625 | $ | 391,702,139 | $ | 3,531,816 | $ | 440,562,580 | ||||||||
| |
||||||||||||||||
87
Notes to Financial Statements (continued)
| NPFD | Level 1 | Level 2 | Level 3 | Total | ||||||||||||
| |
||||||||||||||||
| Long-Term Investments: | ||||||||||||||||
| Corporate Bonds |
$ | – | $ | 664,442,596 | $ | 2,425,083 | $ | 666,867,679 | ||||||||
| Preferred Stock |
66,227,992 | – | – | 66,227,992 | ||||||||||||
| U.S. Government and Agency Obligations |
– | 16,946,293 | – | 16,946,293 | ||||||||||||
| Short-Term Investments: | ||||||||||||||||
| Repurchase Agreements |
– | 4,388,279 | – | 4,388,279 | ||||||||||||
| |
||||||||||||||||
| Total | $ | 66,227,992 | $ | 685,777,168 | $ | 2,425,083 | $ | 754,430,243 | ||||||||
| |
||||||||||||||||
| * | Represents net unrealized appreciation (depreciation). |
The Funds hold liabilities in preferred shares, where applicable, which are not reflected in the tables above. The fair values of the Funds’ liabilities for preferred shares approximate their liquidation preference. Preferred shares are generally classified as Level 2 and further described in these Notes to Financial Statements.
The following is a reconciliation of the Funds’ Level 3 investments held at the beginning and end of the measurement period:
| JFR | ||||||||||||
| Level 3 | ||||||||||||
| Common Stocks |
Variable Rate Senior Loan Interests |
Warrants | ||||||||||
| Balance at the beginning of period | $15,680,702 | $963,764 | $16,278 | |||||||||
| Gains (losses): |
||||||||||||
| Net realized gains (losses) |
7,113,686 | (945,949) | – | |||||||||
| Change in net unrealized appreciation (depreciation) |
(8,833,235) | 127,318 | 9,552 | |||||||||
| Purchases at cost |
– | 21,649 | – | |||||||||
| Sales at proceeds |
(13,365,524) | (463,116) | – | |||||||||
| Net discounts (premiums) |
– | 296,480 | – | |||||||||
| Transfers into |
– | 5,271 | – | |||||||||
| Transfers (out of) |
– | – | – | |||||||||
| Balance at the end of period | $595,629 | $5,417 | $25,830 | |||||||||
| Change in net unrealized appreciation (depreciation) during the period of Level 3 securities held as of period end | $(1,341) | $(1,562,052) | $9,552 | |||||||||
| JQC | ||||||||||||
| Level 3 | ||||||||||||
| Common Stocks |
Variable Rate Senior Loan Interests |
Warrants | ||||||||||
| Balance at the beginning of period | $5,603,105 | $– | $46 | |||||||||
| Gains (losses): |
||||||||||||
| Net realized gains (losses) |
2,630,780 | – | – | |||||||||
| Change in net unrealized appreciation (depreciation) |
(3,267,914) | – | 1 | |||||||||
| Purchases at cost |
– | – | – | |||||||||
| Sales at proceeds |
(4,942,923) | – | – | |||||||||
| Net discounts (premiums) |
– | – | – | |||||||||
| Transfers into |
– | 3,498 | – | |||||||||
| Transfers (out of) |
– | – | – | |||||||||
| Balance at the end of period | $23,048 | $3,498 | $47 | |||||||||
| Change in net unrealized appreciation (depreciation) during the period of Level 3 securities held as of period end | $(1,695) | $(94,089) | $1 | |||||||||
88
| JPC | ||||
| Level 3 | ||||
| Corporate Bonds | ||||
| Balance at the beginning of period | $– | |||
| Gains (losses): |
||||
| Net realized gains (losses) |
– | |||
| Change in net unrealized appreciation (depreciation) |
– | |||
| Purchases at cost |
– | |||
| Sales at proceeds |
– | |||
| Net discounts (premiums) |
– | |||
| Transfers into |
7,053,409 | |||
| Transfers (out of) |
– | |||
| Balance at the end of period | $7,053,409 | |||
| Change in net unrealized appreciation (depreciation) during the period of Level 3 securities held as of period end | $450,218 | |||
| JPI | ||||
| Level 3 | ||||
| Corporate Bonds | ||||
| Balance at the beginning of period | $– | |||
| Gains (losses): |
||||
| Net realized gains (losses) |
– | |||
| Change in net unrealized appreciation (depreciation) |
– | |||
| Purchases at cost |
– | |||
| Sales at proceeds |
– | |||
| Net discounts (premiums) |
– | |||
| Transfers into |
3,531,816 | |||
| Transfers (out of) |
– | |||
| Balance at the end of period | $3,531,816 | |||
| Change in net unrealized appreciation (depreciation) during the period of Level 3 securities held as of period end | $225,435 | |||
| NPFD | ||||
| Level 3 | ||||
| Corporate Bonds | ||||
| Balance at the beginning of period | $– | |||
| Gains (losses): |
||||
| Net realized gains (losses) |
– | |||
| Change in net unrealized appreciation (depreciation) |
– | |||
| Purchases at cost |
– | |||
| Sales at proceeds |
– | |||
| Net discounts (premiums) |
– | |||
| Transfers into |
2,425,083 | |||
| Transfers (out of) |
– | |||
| Balance at the end of period | $2,425,083 | |||
| Change in net unrealized appreciation (depreciation) during the period of Level 3 securities held as of period end | $154,793 | |||
The valuation techniques and significant unobservable inputs used in recurring Level 3 fair value measurements of assets as of the end of the current fiscal period, were as follows:
| Fund | Asset Class | Market Value | Techniques | Unobservable Inputs |
Range | Weighted Average | ||||||||||
| JFR | Common Stocks | $22,984 | Expected Recovery | Recovery Proceeds | $0.01‑$8.00 | $2.15 | ||||||||||
| 572,645 | Enterprise Value | Acquisition Cost | $1,000.00 | N/A | ||||||||||||
| Variable Rate Senior Loan Interests |
5,417 | Broker-Dealer Price Quotation(s) |
Litigation Proceeds | $0.55 | N/A | |||||||||||
| Warrants | 25,830 | Expected Recovery | Recovery Proceeds | $0.25-$0.35 | $0.32 | |||||||||||
| Total | $626,876 | |||||||||||||||
| JQC | Common Stocks | $23,094 | Expected Recovery | Recovery Proceeds | $0.01-$8.00 | $0.621 | ||||||||||
| Variable Rate Senior Loan Interests |
3,498 | Broker-Dealer Price Quotation(s) |
Litigation Proceeds | $0.55 | N/A | |||||||||||
89
Notes to Financial Statements (continued)
| Total | $26,592 | |||||||||||||||
| JPC | Corporate Bonds | $7,053,409 | Indicative Trade | Broker Quote | $11.75 | N/A | ||||||||||
| JPI | Corporate Bonds | $3,531,816 | Indicative Trade | Broker Quote | $11.75 | N/A | ||||||||||
| NPFD | Corporate Bonds | $2,425,083 | Indicative Trade | Broker Quote | $11.75 | N/A |
The table below presents the transfers in and out of the three valuation levels for the Funds as of the end of the current fiscal period when compared to the valuation levels at the end of the previous fiscal year. Changes in valuation inputs or methodologies may result in transfers into or out of an assigned level within the fair value hierarchy. Transfers in or out of levels are generally due to the availability of publicly available information and to the significance or extent the Adviser determines that the valuation inputs or methodologies may impact the valuation of those securities.
| Level 1 | Level 2 | Level 3 | ||||||||||||||||||||||||||||||
| JFR | Transfers In | (Transfers Out) | Transfers In | (Transfers Out) | Transfers In | (Transfers Out) | ||||||||||||||||||||||||||
| Variable Rate Senior Loan Interest | $– | $– | $– | $(5,271) | $5,271 | $– | ||||||||||||||||||||||||||
| Level 1 | Level 2 | Level 3 | ||||||||||||||||||||||||||||||
| JQC | Transfers In | (Transfers Out) | Transfers In | (Transfers Out) | Transfers In | (Transfers Out) | ||||||||||||||||||||||||||
| Variable Rate Senior Loan Interest | $– | $– | $– | $(3,498) | $3,498 | $– | ||||||||||||||||||||||||||
| Level 1 | Level 2 | Level 3 | ||||||||||||||||||||||||||||||
| JPC | Transfers In | (Transfers Out) | Transfers In | (Transfers Out) | Transfers In | (Transfers Out) | ||||||||||||||||||||||||||
| Corporate Bonds | $– | $– | $– | $(7,053,409) | $7,053,409 | $– | ||||||||||||||||||||||||||
| Level 1 | Level 2 | Level 3 | ||||||||||||||||||||||||||||||
| JPI | Transfers In | (Transfers Out) | Transfers In | (Transfers Out) | Transfers In | (Transfers Out) | ||||||||||||||||||||||||||
| Corporate Bonds | $– | $– | $– | $(3,531,816) | $3,531,816 | $– | ||||||||||||||||||||||||||
| Level 1 | Level 2 | Level 3 | ||||||||||||||||||||||||||||||
| NPFD | Transfers In | (Transfers Out) | Transfers In | (Transfers Out) | Transfers In | (Transfers Out) | ||||||||||||||||||||||||||
| Corporate Bonds | $– | $– | $– | $(2,425,083) | $2,425,083 | $– | ||||||||||||||||||||||||||
The significant unobservable inputs used in the fair value measurement of the reporting entity’s corporate bonds are estimates of litigation proceeds reflected by way of broker-dealer price quotations or estimated recovery proceeds. Significant increases (decreases) in these estimates, estimates in expected recovery proceeds or changes in value from a recent acquisition cost, could have resulted in significantly higher (lower) fair value measurements of our level 3 investments.
| 4. | Portfolio Securities |
Unfunded Commitments: Pursuant to the terms of certain of the variable rate senior loan agreements, JFR and JQC may have unfunded senior loan commitments. Each Fund will maintain with its custodian, cash, liquid securities and/or liquid senior loans having an aggregate value at least equal to the amount of unfunded senior loan commitments. As of the end of the current fiscal period, JFR and JQC’s outstanding unfunded senior loan commitments were as follows:
| Fund | Outstanding Unfunded Senior Loan Commitments |
|||
| JFR | $2,824,844 | |||
| JQC | 930,963 | |||
Participation Commitments: With respect to the senior loans held in JFR and JQC’s portfolio, the Funds may: 1) invest in assignments; 2) act as a participant in primary lending syndicates; or 3) invest in participations. If a Fund purchases a participation of a senior loan interest, the Funds would typically enter into a contractual agreement with the lender or other third party selling the participation, rather than directly with the borrower. As such, the Funds not only assume the credit risk of the borrower, but also that of the selling participant or other persons interpositioned between the Fund and the borrower. As of the end of the current fiscal period, the Funds had no such outstanding participation commitments.
Repurchase Agreements: In connection with transactions in repurchase agreements, it is each Fund’s policy that its custodian take possession of the underlying collateral securities, the fair value of which exceeds the principal amount of the repurchase transaction, including accrued interest, at all times. If the counterparty defaults, and the fair value of the collateral declines, realization of the collateral may be delayed or limited.
The following table presents the repurchase agreements for the Funds that are subject to netting agreements as of the end of the current fiscal period, and the collateral delivered related to those repurchase agreements.
90
| Fund | Counterparty | Short-term Investments, at Value |
Collateral Pledged (From) Counterparty |
|||||||
| JPC | Fixed Income Clearing Corporation | $21,976,515 | $(22,416,176) | |||||||
| JPI | Fixed Income Clearing Corporation | 2,289,396 | (2,335,343) | |||||||
| NPFD | Fixed Income Clearing Corporation | 4,388,279 | (4,476,236) | |||||||
Zero Coupon Securities: A zero coupon security does not pay a regular interest coupon to its holders during the life of the security. Income to the holder of the security comes from accretion of the difference between the original purchase price of the security at issuance and the par value of the security at maturity and is effectively paid at maturity. The market prices of zero coupon securities generally are more volatile than the market prices of securities that pay interest periodically.
Purchases and Sales: Long-term purchases and sales (excluding in‑kind transactions, where applicable) during the current fiscal period were as follows:
| Fund | Non-U.S. Government Purchases |
Non-U.S. Government Sales and Maturities |
||||||
| JFR | $ | 942,997,159 | $ | 648,888,396 | ||||
| JQC | 468,097,614 | 424,260,653 | ||||||
| JPC | 1,333,387,433 | 1,415,283,095 | ||||||
| JPI | 173,934,862 | 208,011,483 | ||||||
| NPFD | 279,875,698 | 308,586,927 | ||||||
The Funds may purchase securities on a when-issued or delayed-delivery basis. Securities purchased on a when-issued or delayed-delivery basis may have extended settlement periods; interest income is not accrued until settlement date. Any securities so purchased are subject to market fluctuation during this period. If a Fund has outstanding when-issued/delayed-delivery purchases commitments as of the end of the current fiscal period, such amounts are recognized on the Statement of Assets and Liabilities.
| 5. | Derivative Investments |
Each Fund is authorized to invest in certain derivative instruments. As defined by U.S. GAAP, a derivative is a financial instrument whose value is derived from an underlying security price, foreign exchange rate, interest rate, index of prices or rates, or other variables. Investments in derivatives as of the end of and/or during the current fiscal period, if any, are included within the Statement of Assets and Liabilities and the Statement of Operations, respectively.
Futures Contracts: During the current fiscal period, JPC used U.S. Treasury futures as part of an overall portfolio construction strategy to manage portfolio duration and yield curve exposure.
A futures contract is an agreement between two parties to buy and sell a financial instrument for a set price on a future date. Upon execution of a futures contract, the Fund is obligated to deposit cash or eligible securities, also known as “initial margin,” into an account at its clearing broker equal to a specified percentage of the contract amount. Securities deposited for initial margin, if any, are identified in the Portfolio of Investments and cash deposited for initial margin, if any, is reflected on the Statement of Assets and Liabilities.
During the period the futures contract is open, changes in the market value of the contract are recognized as an unrealized gain or loss by “marking- to‑market” on a daily basis. The Fund and the clearing broker are obligated to settle monies on a daily basis representing the changes in the value of the contracts. These daily cash settlements are known as “variation margin” and is recognized on the Statement of Assets and Liabilities as a receivable or payable for variation margin on futures contracts. When the contract is closed or expired, the Fund records a realized gain or loss equal to the difference between the value of the contract on the closing date and value of the contract when originally entered into. The net realized gain or loss and the change in unrealized appreciation (depreciation) on futures contracts held during the period is included on the Statement of Operations.
Risks of investments in futures contracts include the possible adverse movement in the price of the securities or indices underlying the contracts, the possibility that there may not be a liquid secondary market for the contracts and/or that a change in the value of the contract may not correlate with a change in the value of the underlying securities or indices.
The average notional amount of futures contracts outstanding during the current fiscal period was as follows:
91
Notes to Financial Statements (continued)
| Fund | Average Notional Amount of Futures Contracts Outstanding* |
|||
| JPC | $203,238,091 | |||
| * | The average notional amount is calculated based on the absolute aggregate notional amount of contracts outstanding at the beginning of the current fiscal period and at the end of each fiscal quarter within the current fiscal period. |
Interest Rate Swap Contracts: During the current fiscal period, JPC used interest rate swap contracts to partially hedge its interest cost of leverage.
Interest rate swap contracts involve the Fund’s agreement with the counterparty to pay or receive a fixed rate payment in exchange for the counterparty receiving or paying a variable rate payment. Forward interest rate swap contracts involve the Fund’s agreement with a counterparty to pay, in the future, a fixed or variable rate payment in exchange for the counterparty paying the Fund a variable or fixed rate payment, the accruals for which would begin at a specified date in the future (the “effective date”).
Upon entering into an interest rate swap contract (and beginning on the effective date for a forward interest rate swap contract), the Fund accrues the fixed rate payment expected to be paid or received and the variable rate payment expected to be received or paid on the interest rate swap contracts on a daily basis, and recognizes the daily change in the fair value of the Fund’s contractual rights and obligations under the contracts. The amount of the payment obligation for an interest rate swap is based on the notional amount and the termination date of the contract. Interest rate swap contracts do not involve the delivery of securities or other underlying assets or principal. Accordingly, the risk of loss on such transactions is limited to the net amount of interest payments that the Fund is to receive from the counterparty. Payments paid (received) at the beginning of the measurement period are reflected as swap premiums paid (received) on the Statement of Assets and Liabilities, when applicable. Interest rate swaps can be settled either directly with the counterparty (“OTC”) or through a central clearinghouse (“centrally cleared”). For OTC swaps, the daily change in the market value of the swap contract, along with any daily interest fees accrued, are recognized as unrealized appreciation (depreciation) on interest rate swaps contracts on the Statement of Assets and Liabilities.
Upon the execution of a centrally cleared swap, a Fund is obligated to deposit cash or eligible securities, also known as “initial margin,” into an account at its clearing broker equal to a specified percentage of the contract amount. Securities deposited for initial margin, if any, are identified in the Portfolio of Investments and cash deposited for initial margin, if any, is reflected on the Statement of Assets and Liabilities. The Fund and the clearing broker are obligated to settle monies on a daily basis representing the changes in the value of the swap contracts. These daily cash settlements are known as “variation margin” and is recognized on the Statement of Assets and Liabilities as a receivable or payable for variation margin on interest rate swaps contracts.
Changes in the value of the swap contracts during the fiscal period are recognized as net unrealized appreciation (depreciation) of swaps contracts on the Statement of Operations. The net amount of periodic payments settled in cash are recognized as net realized gain (loss) from swap contracts on the Statement of Operations, in addition to the net realized gain or loss recorded upon the termination of the swap contract.
The average notional amount of interest rate swap contracts outstanding during the current fiscal period was as follows:
| Fund | Average Notional Amount of Interest Rate Swap Contracts Outstanding* |
|||
| JPC | $776,800,000 | |||
| * | The average notional amount is calculated based on the absolute aggregate notional amount of contracts outstanding at the beginning of the current fiscal period and at the end of each fiscal quarter within the current fiscal period. |
The following table presents the swap contracts subject to netting agreements and the collateral delivered related to those swap contracts as of the end of the current fiscal period.
| Fund | Counterparty | Gross Unrealized Appreciation Interest Rate Swaps*** |
Gross Unrealized (Depreciation) Interest Rate Swaps*** |
Net Unrealized Appreciation (Depreciation) on Interest Rate Swaps |
Collateral Pledged to (from) Counterparty |
Net Exposure | ||||||||||||||||
| JPC | Morgan Stanley Capital Services LLC | $ | 2,390,002 | $ | - | $ | 2,390,002 | $ | (1,938,338 | ) | $ | 451,664 | ||||||||||
| *** | Represents gross unrealized appreciation (depreciation) for the counterparty as reported in the Fund’s Portfolio of Investments. |
As of the end of the current fiscal period, the Funds have invested in derivative contracts which are reflected in the Statement of Assets and Liabilities as follows:
| Asset Derivatives | Liability Derivatives | |||||||||||||||||
| Derivative Instrument | Risk Exposure | Location | Value | Location | Value | |||||||||||||
| JPC | ||||||||||||||||||
| Futures Contracts | Interest rate | Unrealized appreciation on futures contracts* |
$ | 2,272,447 | - | $– | ||||||||||||
| Interest Rate Swaps | Interest rate | Unrealized appreciation on interest rate swaps contracts |
2,390,002 | - | – | |||||||||||||
92
| * | The fair value presented includes cumulative gain (loss) on open futures contracts; however, the value reflected in the accompanying Statements of Assets and Liabilities is only the receivable or payable for variation margin on open futures contracts. |
During the current fiscal period, the effect of derivative contracts on the Funds’ Statements of Operations was as follows:
| Derivative Instrument | Risk Exposure | Net Realized Gain (Loss) |
Change in Unrealized Appreciation (Depreciation) |
|||||||
| JPC | ||||||||||
| Futures contracts | Interest rate | $14,007 | $(4,287,816 | ) | ||||||
| Swap contracts | Interest rate | 26,228,476 | (24,034,354 | ) | ||||||
Market and Counterparty Credit Risk: In the normal course of business each Fund may invest in financial instruments and enter into financial transactions where risk of potential loss exists due to changes in the market (market risk) or failure of the other party to the transaction to perform (counterparty credit risk). The potential loss could exceed the value of the financial assets recorded on the financial statements. Financial assets, which potentially expose each Fund to counterparty credit risk, consist principally of cash due from counterparties on forward, option and swap transactions, when applicable. The extent of each Fund’s exposure to counterparty credit risk in respect to these financial assets approximates their carrying value as recorded on the Statement of Assets and Liabilities.
Each Fund helps manage counterparty credit risk by entering into agreements only with counterparties the Adviser believes have the financial resources to honor their obligations and by having the Adviser monitor the financial stability of the counterparties. Additionally, counterparties may be required to pledge collateral daily (based on the daily valuation of the financial asset) on behalf of each Fund with a value approximately equal to the amount of any unrealized gain above a pre‑determined threshold. Reciprocally, when each Fund has an unrealized loss, the Funds have instructed the custodian to pledge assets of the Funds as collateral with a value approximately equal to the amount of the unrealized loss above a pre‑determined threshold. Collateral pledges are monitored and subsequently adjusted if and when the valuations fluctuate, either up or down, by at least the pre‑determined threshold amount.
| 6. | Fund Shares |
Common Shares
Tender Offer
The Board authorized JPI to conduct a tender offer pursuant to which the Fund offered to purchase up to 100% of its then outstanding shares for cash on a pro rata basis at a price per share equal 100% of the NAV per share as determined as of the close of regular trading on the NYSE on the expiration date of the tender offer.
On July 17, 2024, Nuveen announced the Fund’s tender offer, which commenced on July 17, 2024 and expired on August 14, 2024. Details of the tender offer from participating shareholders during the current fiscal period were as follows:
| JPI | ||||
| Number of common shares outstanding before tender offer | 22,772,419 | |||
| Number of common shares authorized for tender offer | 8,672,542 | |||
| Percentage of common shares outstanding tendered | 38% | |||
| Purchase price (100% of share NAV on expiration date) | 20.0081 | |||
| Number of common shares outstanding after tender offer | 14,099,877 | |||
JFR – Rights offering: On January 8, 2025, the Board approved the terms of the issuance of transferable rights (“Rights”) to the holders of the Fund’s common shares (par value $0.01 per share) (“Common Shares”) as of January 21, 2025 (the “Record Date”). Holders of Common Shares on the Record Date (“Record Date Shareholders”) received one Right for each outstanding Common Share owned on the Record Date. The Rights entitled the holders to purchase one new Common Share for every 5 Rights held (1‑for‑5), for an aggregate of up to an additional 26,911,238 Common Shares.
Holders of Rights were entitled to subscribe for additional Common Shares (the “Offer”) at a discount to the market price of the Common Shares, prior to 5:00 p.m., Eastern time, on February 19, 2025 (the “Expiration Date”). The subscription price per Common Share (the “Subscription Price”) was $8.20 per Common Share, which was equal to 90% of the Fund’s net asset value per Common Share at the close of trading on the NYSE on the Expiration Date. The gross proceeds of the Offer were approximately $220.7 million (including oversubscription requests and notices of guaranteed delivery).
93
Notes to Financial Statements (continued)
The Offer was over-subscribed; however, the Fund did not exercise the secondary oversubscription privilege. The available primary over-subscription shares were allocated pro‑rata among those fully exercising record date shareholders who over-subscribed based on the number of rights originally issued to them by the Fund. The Fund returned to those investors that submitted over-subscription requests the full amount of their excess payments. The Common Shares subscribed for were issued on February 25, 2025, after completion of the pro‑rata allocation of Common Shares in respect of the primary oversubscription privilege and receipt of all shareholder payments.
JQC – Rights Offering: On March 19, 2025, the Board approved the terms of the issuance of transferable rights (“Rights”) to the holders of the Fund’s common shares (par value $0.01 per share) (“Common Shares”) as of March 31, 2025 (the “Record Date”). Holders of Common Shares on the Record Date (“Record Date Shareholders”) received one Right for each outstanding Common Share owned on the Record Date. The Rights entitled the holders to purchase one new Common Share for every 5 Rights held (1‑for‑5), for an aggregate of up to an additional 12.2 million Common Shares.
Holders of Rights were entitled to subscribe for additional Common Shares (the “Offer”) at a discount to the market price of the Common Shares, prior to 5:00 p.m., Eastern time, on April 29, 2025 (the “Expiration Date”). The subscription price per Common Share (the “Subscription Price”) was $5.09 per Common Share, which was equal to 90% of the Fund’s net asset value per Common Share at the close of trading on the NYSE on the Expiration Date. The gross proceeds of the Offer were approximately $62.1 million.
The Common Shares subscribed for were issued on May 5, 2025, after completion and receipt of all shareholder payments. The final Subscription Price was lower than the original estimated Subscription Price. Accordingly, any excess payments were returned to subscribing rights holders, in accordance with the prospectus supplement filed with the Securities and Exchange Commission on March 20, 2025.
Common Shares Equity Shelf Programs and Offering Costs: JPC has filed a registration statement with the Securities and Exchange Commission (“SEC”) authorizing the Fund to issue additional common shares through one or more equity shelf programs (“Shelf Offering”), which became effective with the SEC during a prior fiscal period.
Under this Shelf Offering, the Fund, subject to market conditions, may raise additional equity capital by issuing additional common shares from time to time in varying amounts and by different offering methods at a net price at or above Fund’s NAV per common share. In the event the Fund’s Shelf Offering registration statement is no longer current, the Fund may not issue additional common shares until a post-effective amendment to the registration statement has been filed with the SEC.
Maximum aggregate offering, common shares sold and offering proceeds, net of offering costs under the Fund’s Shelf Offering during the Fund’s current and prior fiscal period were as follows:
| JPC | ||||||||
| Year Ended 7/31/25 |
Year Ended 7/31/24 |
|||||||
| Maximum aggregate offering | Unlimited | Unlimited | ||||||
| Common shares sold | 6,853,100 | – | ||||||
| Offering proceeds, net of offering costs | $54,493,622 | $– | ||||||
Costs incurred by the Funds in connection with their initial shelf registrations are recorded as a prepaid expense and recognized as “Deferred offering costs” on the Statement of Assets and Liabilities. These costs are amortized pro rata as common shares are sold and are recognized as a component of “Proceeds from shelf offering, net of offering costs” on the Statement of Changes in Net Assets. Any deferred offering costs remaining after the effectiveness of the initial shelf registration will be expensed. Costs incurred by the Funds to keep the shelf registration current are expensed as incurred and recognized as a component of “Other expenses” on the Statement of Operations.
Common Share Transactions: Transactions in common shares for the Funds during the Funds’ current and prior fiscal period, where applicable, were as follows:
| JFR | ||||||
| Year Ended 7/31/25 |
Year Ended 7/31/24 | |||||
| Common Shares: | ||||||
| Sold through rights offering |
26,911,238 | – | ||||
| Total | 26,911,238 | – | ||||
| JQC | ||||||
| Year Ended 7/31/25 |
Year Ended 7/31/24 | |||||
| Common Shares: | ||||||
| Sold through rights offering |
12,207,389 | – | ||||
| Total | 12,207,389 | – | ||||
94
| JPC | ||||||
| Year Ended 7/31/25 |
Year Ended 7/31/24 | |||||
| Common Shares: | ||||||
| Issued in the Merger |
– | 214,414,720 | ||||
| Sold through shelf offering |
6,853,100 | – | ||||
| Issued to shareholders due to reinvestment of distributions |
156,693 | – | ||||
| Total | 7,009,793 | 214,414,720 | ||||
| Weighted average common share: | ||||||
| Premium to NAV per shelf offering common share sold |
0.59% | –% | ||||
| JPI | ||||||
| Year Ended 7/31/25 |
Year Ended 7/31/24 | |||||
| Common Shares: | ||||||
| Issued to shareholders due to reinvestment of distributions |
19,881 | – | ||||
| Repurchased and retired through tender offer |
(8,672,542 | ) | – | |||
| Total | (8,652,661 | ) | – | |||
Preferred Shares
Taxable Fund Preferred Shares: JFR, JQC, JPC and NPFD have issued and have outstanding Taxable Fund Preferred (“TFP”) Shares, with a $1,000 liquidation preference per share. These TFP Shares were issued via private placement and are not publicly available.
The Fund is obligated to redeem its TFP Shares by the date as specified in its offering documents (“Term Redemption Date”), unless earlier redeemed by the Fund. TFP Shares are initially issued in a pre‑specified mode, however, TFP Shares can be subsequently designated as an alternative mode at a later date at the discretion of the Funds. The modes within TFP Shares detail the dividend mechanics and are described as follows. At a subsequent date, the Funds may establish additional mode structures with the TFP Share.
• Variable Rate Mode (“VRM”) – Dividends for TFP Shares designated in this mode are based upon a short-term index plus an additional fixed “spread” amount established at the time of issuance or renewal / conversion of its mode. At the end of the period of the mode, the Fund will be required to either extend the term of the mode, designate an alternative mode or redeem the TFP Shares.
The fair value of TFP Shares while in VRM are expected to approximate their liquidation preference so long as the fixed “spread” on the shares remains roughly in line with the “spread’ being demanded by investors on instruments having similar terms in the current market. During the current fiscal period, the Adviser determined that the fair value of the shares approximated their liquidation preference.
• Variable Rate Demand Mode (“VRDM”) – Dividends for TFP Shares designated in this mode will be established by a remarketing agent; therefore, the market value of the TFP Shares is expected to approximate its liquidation preference. While in this mode, shares will have an unconditional liquidity feature that enable its shareholders to require a liquidity provider, which each Fund has entered into a contractual agreement, to purchase shares in the event that the shares are not able to be successfully remarketed. In the event that shares within this mode are unable to be successfully remarketed and are purchased by the liquidity provider, the dividend rate will be the maximum rate which is designed to escalate according to a specified schedule in order to enhance the remarketing agent’s ability to successfully remarket the shares. Each Fund is required to redeem any shares that are still owned by a liquidity provider after six months of continuous, unsuccessful remarketing.
The Funds will pay a liquidity and remarketing fee on the aggregate principal amount of all TFP Shares while within VRDM. Payments made by the Funds to the liquidity provider and remarketing agent are recognized as “Liquidity fees” and “Remarketing fees”, respectively, on the Statement of Operations.
For financial reporting purposes, the liquidation preference of TFP Shares is recorded as a liability and is recognized as a component of “TFP Shares, net” on the Statement of Assets and Liabilities. Dividends on the TFP shares are treated as interest payments for financial reporting purposes. Unpaid dividends on TFP shares are recognized as a component on “Interest payable” on the Statement of Assets and Liabilities. Dividends accrued on TFP Shares are recognized as a component of “Interest expense and amortization of offering costs” on the Statement of Operations.
Subject to certain conditions, TFP Shares may be redeemed, in whole or in part, at any time at the option of the Funds. Additionally, TFP Shares in VRM mode are subject to a 60‑Day Evergreen tenor. Each Fund may also be required to redeem certain TFP shares if the Fund fails to maintain certain asset coverage requirements and such failures are not cured by the applicable cure date. The redemption price per share in all circumstances is equal to the liquidation preference per share plus any accumulated but unpaid dividends.
Cost incurred by each Fund in connection with its offerings of TFP Shares, which were recorded as a deferred charge and are being amortized over the life of the shares. These offering costs are recognized as a component of “TFP Shares, Net” on the Statement of Assets and Liabilities and “Interest expense and amortization of offering costs” on the Statement of Operations.
As of the end of the current fiscal period, JFR, JQC, JPC, and NPFD had of $283,909,017, $139,314,490, $418,746,094 and $84,551,443 respectively, TFP Shares at liquidation preference, net of deferred offering costs. Further details of the Funds’ TFP Shares outstanding as of the end of the current fiscal period, were as follows:
95
Notes to Financial Statements (continued)
| Fund | Series | Shares Outstanding |
Liquidation Preference |
Term Redemption Date |
Mode | |||||||||||
| JFR | A B |
170,000 115,000 |
$ |
170,000,000 $ 115,000,000 |
|
|
January 1, 2031 December 1, 2030 |
|
|
VRDM VRM |
| |||||
| JQC | A | 140,000 | $ | 140,000,000 | July 1, 2032 | VRDM | ||||||||||
| JPC | A B |
150,000 270,000 |
$ |
150,000,000 270,000,000 |
|
|
August 1, 2037 July 1, 2032 |
|
|
VRDM VRDM |
| |||||
| NPFD | A | 85,000 | $ | 85,000,000 | February 1, 2034 | VRDM | ||||||||||
The average liquidation preference of TFP Shares outstanding and the annualized dividend rate for the Funds during the current fiscal period were as follows:
| JFR | JQC | JPC | NPFD | |||||||||||||
| Average liquidation preference of TFP Shares outstanding | $ | 285,000,000 | $ | 140,000,000 | $ | 420,000,000 | $ | 85,000,000 | ||||||||
| Average dividend rate | 5.17% | 4.73% | 4.72% | 4.72% | ||||||||||||
Preferred Share Transactions: Transactions in preferred shares during the Funds’ current and prior fiscal period, where applicable, are noted in the following tables.
Transactions in TFP Shares for the Funds, where applicable, were as follows:
| Year Ended July 31, 2024 | ||||||||||||
| JFR | Series | Shares | Amount | |||||||||
| TFP Shares Issued | A | 70,000 | $70,000,000 | |||||||||
| TFP Shares Redeemed | C | (70,000) | (70,000,000) | |||||||||
| Year Ended July 31, 2024 | ||||||||||||
| JPC | Series | Shares | Amount | |||||||||
| TFP Shares Issued* | B | 270,000 | $270,000,000 | |||||||||
* Issued in the Merger
| 7. | Income Tax Information |
Each Fund is a separate taxpayer for federal income tax purposes. Each Fund intends to distribute substantially all of its net investment income and net capital gains to shareholders and otherwise comply with the requirements of Subchapter M of the Internal Revenue Code applicable to regulated investment companies. Therefore, no federal income tax provision is required.
Each Fund files income tax returns in U.S. federal and applicable state and local jurisdictions. A Fund’s federal income tax returns are generally subject to examination for a period of three fiscal years after being filed. State and local tax returns may be subject to examination for an additional period of time depending on the jurisdiction. Management has analyzed each Fund’s tax positions taken for all open tax years and has concluded that no provision for income tax is required in the Fund’s financial statements.
Differences between amounts for financial statement and federal income tax purposes are primarily due to timing differences in recognizing gains and losses on investment transactions. Temporary differences do not require reclassification. As of year end, permanent differences that resulted in reclassifications among the components of net assets relate primarily to bond premium amortization adjustments, complex securities character adjustments, foreign currency transactions, investments in partnerships, nondeductible expenses, paydowns, return of capital and long-term capital gain distributions received from portfolio investments, and treatment of notional principal contracts. Temporary and permanent differences have no impact on a Fund’s net assets.
As of year end, the aggregate cost and the net unrealized appreciation/(depreciation) of all investments for federal income tax purposes were as follows:
| Fund | Tax Cost | Gross Unrealized Appreciation |
Gross Unrealized (Depreciation) |
Net Unrealized Appreciation (Depreciation) |
||||||||||||
| JFR | $ | 2,299,628,044 | $ | 40,976,530 | $ | (56,487,688) | $ | (15,511,158) | ||||||||
| JQC | 1,382,449,524 | 25,191,946 | (28,950,835) | (3,758,889) | ||||||||||||
| JPC | 4,067,351,166 | 131,901,307 | (66,393,697) | 65,507,610 | ||||||||||||
| JPI | 450,802,859 | 15,072,493 | (25,312,771) | (10,240,278) | ||||||||||||
| NPFD | 769,148,376 | 15,523,820 | (30,241,953) | (14,718,133) | ||||||||||||
96
For purposes of this disclosure, tax cost generally includes the cost of portfolio investments as well as up‑front fees or premiums exchanged on derivatives and any amounts unrealized for income statement reporting but realized income and/or capital gains for tax reporting, if applicable.
As of year end, the components of accumulated earnings on a tax basis were as follows:
| Fund | Undistributed Ordinary Income |
Undistributed Long-Term Capital Gains |
Unrealized Appreciation (Depreciation) |
Capital Loss Carryforwards |
Late‑Year Loss Deferrals |
Other Book‑to‑Tax Differences |
Total | |||||||||||||||||||||
| JFR | $ | – | $ | – | $ | (15,511,158) | $ | (402,335,504 | ) | $ | – | $ | (13,682,231 | ) | $ | (431,528,893 | ) | |||||||||||
| JQC | – | – | (3,758,889) | (331,757,973 | ) | – | (7,982,101 | ) | (343,498,963 | ) | ||||||||||||||||||
| JPC | – | – | 65,508,399 | (440,291,959 | ) | – | (21,970,650 | ) | (396,754,210 | ) | ||||||||||||||||||
| JPI | – | – | (10,240,278) | (55,801,486 | ) | – | (2,343,880 | ) | (68,385,644 | ) | ||||||||||||||||||
| NPFD | – | – | (14,718,133) | (68,716,852 | ) | – | (4,047,494 | ) | (87,482,479 | ) | ||||||||||||||||||
The tax character of distributions paid was as follows:
| 7/31/25 | 7/31/24 | |||||||||||||||||||||||
| Fund | Ordinary Income |
Long‑Term Capital Gains |
Return of Capital |
Ordinary Income |
Long‑Term Capital Gains |
Return of Capital |
||||||||||||||||||
| JFR | $ | 115,969,240 | $ | – | $ | 32,205,348 | $ | 132,318,523 | $ | – | $ | 4,418,789 | ||||||||||||
| JQC | 68,447,068 | – | 21,405,349 | 77,350,572 | – | 9,642,788 | ||||||||||||||||||
| JPC | 177,916,653 | – | 78,577,161 | 152,486,748 | – | – | ||||||||||||||||||
| JPI | 15,458,426 | – | 11,687,572 | 25,243,405 | – | 1,536,960 | ||||||||||||||||||
| NPFD | 22,339,894 | – | 26,230,031 | 27,667,206 | – | 4,857,728 | ||||||||||||||||||
As of year end, the Funds had capital loss carryforwards, which will not expire:
| Fund | Short-Term | Long-Term | Total | |||||||||
| JFR1 | $ | 43,059,963 | $ | 359,275,541 | $ | 402,335,504 | ||||||
| JQC | 47,573,508 | 284,184,465 | 331,757,973 | |||||||||
| JPC1 | 66,744,870 | 373,547,089 | 440,291,959 | |||||||||
| JPI | 8,931,132 | 46,870,354 | 55,801,486 | |||||||||
| NPFD | 10,524,357 | 58,192,495 | 68,716,852 | |||||||||
| 1 | A portion of JFR’s and JPC’s capital loss carryforwards is subject to an annual limitation under the Internal Revenue Code and related regulations. |
As of year end, the Funds utilized the following capital loss carryforwards:
| Fund | Utilized | |||
| JFR | $ | – | ||
| JQC | – | |||
| JPC | – | |||
| JPI | 2,293,710 | |||
| NPFD | – | |||
| 8. | Management Fees and Other Transactions with Affiliates |
Management Fees: Each Fund’s management fee compensates the Adviser for the overall investment advisory and administrative services and general office facilities. The Sub‑Adviser is compensated for its services to the Funds from the management fees paid to the Adviser.
Each Fund’s management fee consists of two components – a fund-level fee, based only on the amount of assets within each individual Fund, and a complex-level fee, based on the aggregate amount of all eligible fund assets managed by the Adviser. This pricing structure enables each Fund’s shareholders to benefit from growth in the assets within their respective Fund as well as from growth in the amount of complex-wide assets managed by the Adviser.
The annual fund-level fee, payable monthly, for each Fund is calculated according to the following schedule:
97
Notes to Financial Statements (continued)
| Average Daily Managed Assets* | JFR | JQC | JPI | NPFD | ||||||||||||
| For the first $500 million | 0.6500 | % | 0.6800 | % | 0.7000 | % | 0.7500 | % | ||||||||
| For the next $500 million | 0.6250 | 0.6550 | 0.6750 | 0.7250 | ||||||||||||
| For the next $500 million | 0.6000 | 0.6300 | 0.6500 | 0.7000 | ||||||||||||
| For the next $500 million | 0.5750 | 0.6050 | 0.6250 | 0.6750 | ||||||||||||
| For managed assets over $2 billion | 0.5500 | 0.5800 | 0.6000 | 0.6500 | ||||||||||||
| Average Total Daily Managed Assets* | JPC Fund‑Level Fee Rate |
|||
| For the first $500 million | 0.6800 | % | ||
| For the next $500 million | 0.6550 | |||
| For the next $500 million | 0.6300 | |||
| For the next $500 million | 0.6050 | |||
| For the next $750 million | 0.5800 | |||
| For the next $750 million | 0.5550 | |||
| For the next $1.5 billion | 0.5300 | |||
| For managed assets over $5 billion | 0.5050 | |||
The annual complex-level fee, payable monthly, for each Fund is calculated according to the following schedule:
| Complex-Level Asset Breakpoint Level* | Complex‑Level Fee | |||
| For the first $124.3 billion | 0.1600 | % | ||
| For the next $75.7 billion | 0.1350 | |||
| For the next $200 billion | 0.1325 | |||
| For eligible assets over $400 billion | 0.1300 | |||
| * | The complex-level fee is calculated based upon the aggregate daily “eligible assets” of all Nuveen-branded closed‑end funds and Nuveen branded open‑end funds (“Nuveen Mutual Funds”). Except as described below, eligible assets include the assets of all Nuveen-branded closed‑end funds and Nuveen Mutual Funds organized in the United States. Eligible assets do not include the net assets of: Nuveen fund‑of‑funds, Nuveen money market funds, Nuveen index funds, Nuveen Large Cap Responsible Equity Fund or Nuveen Life Large Cap Responsible Equity Fund. In addition, eligible assets include a fixed percentage of the aggregate net assets of the active equity and fixed income Nuveen Mutual Funds advised by the Adviser’s affiliate, Teachers Advisors, LLC (except those identified above). The fixed percentage will increase annually until May 1, 2033, at which time eligible assets will include all of the aggregate net assets of the active equity and fixed income Nuveen Mutual Funds advised by Teachers Advisors, LLC (except those identified above). Eligible assets include closed‑end fund assets managed by the Adviser that are attributable to financial leverage. For these purposes, financial leverage includes the closed‑end funds’ use of preferred stock and borrowings and certain investments in the residual interest certificates (also called inverse floating rate securities) in tender option bond (TOB) trusts, including the portion of assets held by a TOB trust that has been effectively financed by the trust’s issuance of floating rate securities, subject to an agreement by the Adviser as to certain funds to limit the amount of such assets for determining eligible assets in certain circumstances. |
As of the end of the current fiscal period, the complex-level fee rate for each Fund was as follows:
| Fund | Complex‑Level Fee | |||
| JFR | 0.1570 | % | ||
| JQC | 0.1570 | |||
| JPC | 0.1570 | |||
| JPI | 0.1570 | |||
| NPFD | 0.1570 | |||
Beginning August 19, 2024, and for a one‑year period, the Adviser is waiving 50% of JPI’s net management fees.
98
| 9. | Commitments and Contingencies |
In the normal course of business, each Fund enters into a variety of agreements that may expose the Funds to some risk of loss. These could include recourse arrangements for certain agreements related to preferred shares, which are described elsewhere in these Notes to Financial Statements. The risk of future loss arising from such agreements, while not quantifiable, is expected to be remote. As of the end of the current fiscal period, the Funds did not have any unfunded commitments other than those disclosed in the Notes to Financial Statements, when applicable.
From time to time, the Funds may be a party to certain legal proceedings in the ordinary course of business, including proceedings relating to the enforcement of the Funds’ rights under contracts. As of the end of the current fiscal period, management has determined that any legal proceeding(s) the Funds are subject to, including those described within this report, are unlikely to have a material impact to any of the Funds’ financial statements.
| 10. | Borrowings Arrangements and Reverse Repurchase Agreements |
Borrowings: Each Fund entered into a borrowing arrangement (“Borrowings”) as a means of leverage. As of the end of the current fiscal period, each Fund’s maximum commitment amount under these Borrowings is as follows:
| Fund | Maximum Commitment Amount |
|||
| JFR | $ | 660,000,000 | ||
| JQC | 250,000,000 | |||
| JPC | 715,000,000 | |||
| JPI | 135,000,000 | |||
| NPFD | 190,000,000 | |||
As of the end of the current fiscal period, each Fund’s outstanding balance on its Borrowings was as follows:
| Fund | Outstanding Balance on Borrowings |
|||
| JFR | $ | 517,200,000 | ||
| JQC | 211,600,000 | |||
| JPC | 649,000,000 | |||
| JPI | 118,000,000 | |||
| NPFD | 161,314,000 | |||
For JFR, interest is charged at a rate equal to 1‑Month Term SOFR plus 0.95%. JFR accrues 0.15% per annum on the undrawn balance if the undrawn portion of the Borrowings on a particular day is more than the maximum commitment amount. Interest is charged on the Borrowings at a rate per annum equal to the daily SOFR plus 1.10% for JQC and the Fund accrues 1.10% per annum on any positive difference between 90% of the maximum commitment amount and the daily drawn amount
For JPC and JPI funds, interest is charged on these Borrowings at OBFR (“Overnight Bank Funding Rate”) plus 0.85% per annum on the amounts borrowed. For NPFD, interest is charged on these Borrowings at OBFR plus 0.75% per annum on the amounts borrowed and 0.25% per annum on the undrawn balance if the undrawn portion of the Borrowings on a particular day is more than 25% of the maximum commitment amount.
During the current fiscal period, the average daily balance outstanding and average annual interest rate on each Fund’s Borrowings were as follows:
| Fund | Utilization Period (Days Outstanding) |
Average Daily Balance Outstanding |
Average Annual Interest Rate |
|||||||||
| JFR | 365 | $ | 483,336,986 | 5.76% | ||||||||
| JQC | 365 | 211,600,000 | 5.76 | |||||||||
| JPC | 365 | 662,246,575 | 5.76 | |||||||||
| JPI | 352 | 119,782,670 | 5.73 | |||||||||
| NPFD | 365 | 170,034,548 | 5.76 | |||||||||
99
Notes to Financial Statements (continued)
Other Borrowings Information for the Funds: In order to maintain these Borrowings, the Funds must meet certain collateral, asset coverage and other requirements. The Funds’ borrowings outstanding are fully secured by eligible securities held in each Fund’s portfolio of investments. (“Pledged Collateral”) Borrowings outstanding are recognized as “Borrowings” on the Statement of Assets and Liabilities. Interest expense incurred on the borrowed amount and undrawn balance and amendment fees are recognized as a component of “Interest expense and amortization of offering costs” on the Statement of Operations.
Rehypothecation: JPC and JPI have each entered into a Rehypothecation Side Letter (“Side Letter”) with its prime brokerage lender, allowing it to re‑register the Pledged Collateral in its own name or in a name other than the Funds’ to pledge, re‑pledge, hypothecate, rehypothecate, sell, lend or otherwise transfer or use the Pledged Collateral (the “Hypothecated Securities”) with all rights of ownership as described in the Side Letter. Subject to certain conditions, the total value of the outstanding Hypothecated Securities shall not exceed the lesser of (i) 98% of the outstanding balance on the Borrowings to which the Pledged Collateral relates and (ii) 33 1/3 % of the Funds’ total assets. The Funds may designate any Pledged Collateral as ineligible for rehypothecation. The Funds may also recall Hypothecated Securities on demand.
The Funds also have the right to apply and set‑off an amount equal to one‑hundred percent (100%) of the then-current fair market value of such Pledged Collateral against the current Borrowings under the Side Letter in the event that the prime brokerage lender fails to timely return the Pledged Collateral and in certain other circumstances. In such circumstances, however, the Funds may not be able to obtain replacement financing required to purchase replacement securities and, consequently, the Funds’ income generating potential may decrease. Even if a Fund is able to obtain replacement financing, it might not be able to purchase replacement securities at favourable prices.
The Funds will receive a fee in connection with the Hypothecated Securities (“Rehypothecation Fees”) in addition to any principal, interest, dividends and other distributions paid on the Hypothecated Securities.
As of the end of the current fiscal period, JPC and JPI each had Hypothecated Securities as follows:
| JPC | JPI | |||||||
| Hypothecated Securities | $370,852,609 | $73,526,366 | ||||||
JPC and JPI earn Rehypothecation Fees, which are recognized as “Rehypothecation income” on the Statement of Operations. During the current fiscal period, the Rehypothecation Fees earned by each Fund were as follows:
| JPC | JPI | |||||||
| Rehypothecation Fees | $259,737 | $54,813 | ||||||
Reverse Repurchase Agreements: During the current fiscal period, certain funds utilized reverse repurchase agreements as a means of leverage.
Each Fund may enter into a reverse repurchase agreement with brokers, dealers, banks or other financial institutions that have been determined by the Adviser to be creditworthy. In a reverse repurchase agreement, the Fund sells to the counterparty a security that it holds with a contemporaneous agreement to repurchase the same security at an agreed-upon price and date, reflecting the interest rate effective for the term of the agreement. It may also be viewed as the borrowing of money by the Fund. Cash received in exchange for securities delivered, plus accrued interest payments to be made by the Fund to a counterparty, are reflected as a liability on the Statement of Assets and Liabilities. Interest payments made by the Fund to counterparties are recognized as a component of “Interest expense” on the Statement of Operations.
In a reverse repurchase agreement, the Fund retains the risk of loss associated with the sold security. Reverse repurchase agreements also involve the risk that the purchaser fails to return the securities as agreed upon, files for bankruptcy or becomes insolvent. Upon a bankruptcy or insolvency of a counterparty, the Fund is considered to be an unsecured creditor with respect to excess collateral and as such the return of excess collateral may be delayed.
As of the end of the current fiscal period, the Fund’s outstanding balances on its reverse repurchase agreements were as follows:
| Fund | Counterparty | Rate | Principal Amount |
Maturity | Value | Value and Accrued Interest |
||||||||||||||
| JQC | Societe Generale SA | 5.21% | $ | (142,000,000) | 4/01/28 | $ | (142,000,000) | $ | (142,656,632) | |||||||||||
| JPC | BNP Paribas SA | 5.13% | (319,000,000) | T+29 Days | (319,000,000) | (320,409,183) | ||||||||||||||
| JPC | Royal Bank of Canada | 5.03% | (150,853,000) | 8/01/25 | (150,853,000) | (151,485,116) | ||||||||||||||
| Total | $ | (469,853,000) | $ | (469,853,000) | $ | (471,894,299) | ||||||||||||||
| JPI | BNP Paribas SA | 5.13% | (41,000,000) | T+29 Days | (41,000,000) | (41,647,626) | ||||||||||||||
| NPFD | Royal Bank of Canada | 5.07% | (27,592,000) | 9/05/25 | (27,592,000) | (27,809,931) | ||||||||||||||
During the current fiscal period, the average daily balance outstanding and average annual interest rate on the Funds’ reverse repurchase agreements were as follows:
100
| Fund | Utilization Period (Days Outstanding) |
Average Daily Balance Outstanding |
Average Annual Interest Rate |
|||||||||
| JQC | 365 | $ | (142,000,000) | 5.54% | ||||||||
| JPC | 365 | (468,702,315) | 5.56 | |||||||||
| JPI | 352 | (39,258,523) | 5.37 | |||||||||
| NPFD | 365 | (27,063,233) | 5.39 | |||||||||
The following table presents the reverse repurchase agreements subject to netting agreements and the collateral delivered related to those reverse repurchase agreements.
| Fund | Counterparty | Reverse Repurchase Agreements*** |
Collateral Pledged to Counterparty |
|||||||||
| JQC | Societe Generale SA | $ | (142,656,632) | $ | (198,196,181) | |||||||
| JPC | BNP Paribas SA | (320,409,183) | (695,087,910) | |||||||||
| JPC | Royal Bank of Canada | (151,485,116) | (190,883,126) | |||||||||
| Total | $ | (471,894,299) | $ | (885,971,036) | ||||||||
| JPI | BNP Paribas SA | (41,647,626) | (100,406,428) | |||||||||
| NPFD | Royal Bank of Canada | (27,809,931) | (36,491,226) | |||||||||
*** Represents gross value and accrued interest for the counterparty as reported in the preceding table.
| 11. | Inter-Fund Borrowing and Lending |
Inter-Fund Borrowing and Lending: The SEC has granted an exemptive order permitting registered open‑end and closed‑end Nuveen funds to participate in an inter-fund lending facility whereby the Nuveen funds may directly lend to and borrow money from each other for temporary purposes (e.g., to satisfy redemption requests or when a sale of securities “fails,” resulting in an unanticipated cash shortfall) (the “Inter-Fund Program”). The closed‑end Nuveen funds, including the Funds covered by this shareholder report, will participate only as lenders, and not as borrowers, in the Inter-Fund Program because such closed‑end funds rarely, if ever, need to borrow cash to meet redemptions. The Inter-Fund Program is subject to a number of conditions, including, among other things, the requirements that (1) no fund may borrow or lend money through the Inter-Fund Program unless it receives a more favorable interest rate than is typically available from a bank or other financial institution for a comparable transaction; (2) no fund may borrow on an unsecured basis through the Inter-Fund Program unless the fund’s outstanding borrowings from all sources immediately after the inter-fund borrowing total 10% or less of its total assets; provided that if the borrowing fund has a secured borrowing outstanding from any other lender, including but not limited to another fund, the inter-fund loan must be secured on at least an equal priority basis with at least an equivalent percentage of collateral to loan value; (3) if a fund’s total outstanding borrowings immediately after an inter-fund borrowing would be greater than 10% of its total assets, the fund may borrow through the inter-fund loan on a secured basis only; (4) no fund may lend money if the loan would cause its aggregate outstanding loans through the Inter-Fund Program to exceed 15% of its net assets at the time of the loan; (5) a fund’s inter-fund loans to any one fund shall not exceed 5% of the lending fund’s net assets; (6) the duration of inter- fund loans will be limited to the time required to receive payment for securities sold, but in no event more than seven days; and (7) each inter-fund loan may be called on one business day’s notice by a lending fund and may be repaid on any day by a borrowing fund. In addition, a Nuveen fund may participate in the Inter-Fund Program only if and to the extent that such participation is consistent with the fund’s investment objective and investment policies. The Board is responsible for overseeing the Inter-Fund Program.
The limitations detailed above and the other conditions of the SEC exemptive order permitting the Inter-Fund Program are designed to minimize the risks associated with Inter-Fund Program for both the lending fund and the borrowing fund. However, no borrowing or lending activity is without risk. When a fund borrows money from another fund, there is a risk that the loan could be called on one day’s notice or not renewed, in which case the fund may have to borrow from a bank at a higher rate or take other actions to payoff such loan if an inter-fund loan is not available from another fund. Any delay in repayment to a lending fund could result in a lost investment opportunity or additional borrowing costs.
During the current fiscal period, none of the Funds covered by this shareholder report have entered into any inter-fund loan activity.
| 12. | Subsequent Events |
JPC and JPI – Fund Merger: Effective prior to the market open on September 22, 2025, JPI was merged into JPC. With respect to the merger of JPI into JPC, the separate legal existence of JPI ceased for all purposes and JPC succeeded to all the assets and assumed all the liabilities of JPI. Shares of JPI were converted into newly issued shares of JPC. Holders of common shares of JPI received newly issued common shares of JPC, the aggregate NAV of which was equal to the aggregate NAV of the common shares of JPI held immediately prior to the merger (including for this purpose fractional Acquiring Fund shares to which shareholders were entitled). For accounting and performance reporting purposes, JPC is the survivor.
101
Notes to Financial Statements (continued)
Borrowings: Effective September 22, 2025, JPC increased the maximum commitment amount of its Borrowings from $715,000,000 to $850,000,000. All other terms remain unchanged.
102
Shareholder Update
(Unaudited)
CURRENT INVESTMENT OBJECTIVES, INVESTMENT POLICIES AND PRINCIPAL RISKS OF THE FUNDS
NUVEEN FLOATING RATE INCOME FUND (JFR)
Investment Objective
The Fund’s investment objective is to achieve a high level of current income.
Investment Policies
The Fund invests at least 80% of its Assets (as defined below) in secured Senior Loans and unsecured Senior Loans, which unsecured Senior Loans will be, at the time of investment, investment grade quality.
With respect to the Fund’s Senior Loans included in the 80% policy, such instruments will at times have a dollar-weighted average time until the next interest rate adjustment of 90 days or less.
“Assets” mean the net assets of the Fund plus the amount of any borrowings for investment purposes. “Managed Assets” mean the total assets of the Fund, minus the sum of its accrued liabilities (other than Fund liabilities incurred for the express purpose of creating leverage). Total assets for this purpose shall include assets attributable to the Fund’s use of leverage (whether or not those assets are reflected in the Fund’s financial statements for purposes of generally accepted accounting principles), and derivatives will be valued at their market value.
Under normal circumstances:
| • | The Fund invests at least 65% of its Managed Assets in Senior Loans that are secured by specific collateral. |
| • | The Fund may invest its Managed Assets without limit in Senior Loans and other debt instruments that are, at the time of investment, rated below investment grade or unrated but judged to be of comparable quality. Investment grade quality securities are those securities that, at the time of investment, are (i) rated by at least one nationally recognized statistical rating organization (“NRSRO”) within the four highest grades (BBB- or Baa3 or better) by S&P, Moody’s or Fitch, or (ii) unrated but judged to be of comparable quality. However, no more than 30% of the Fund’s Managed Assets may be invested in Senior Loans and other debt securities that are, at the time of investment, rated CCC+ or Caa or below by S&P, Moody’s or Fitch or that are unrated but judged to be of comparable quality. |
| • | The Fund may invest up to 20% of its Managed Assets in (i) other debt securities such as investment and non‑investment grade debt securities, convertible securities and structured notes (other than structured notes that are designed to provide returns and risks that emulate those of Senior Loans, which may be treated as an investment in Senior Loans for purposes of the 80% requirement set forth above), (ii) mortgage-related and other asset-backed securities (including collateralized loan obligations and collateralized debt obligations), and (iii) debt securities and other instruments issued by government, government-related or supranational issuers (commonly referred to as sovereign debt securities). No more than 5% of the Fund’s Managed Assets may be invested in each of convertible securities, mortgage- related and other asset-backed securities, and sovereign debt securities. The debt securities in which the Fund may invest may have short-term, intermediate-term or long-term maturities. The Fund also may receive warrants and equity securities issued by a borrower or its affiliates in connection with the Fund’s other investments in such entities. |
| • | The Fund maintains an average duration of one year or less for its portfolio investments in Senior Loans and other debt instruments. |
| • | The Fund will not invest in inverse floating rate securities. |
| • | The Fund may invest up to 20% of its Managed Assets in securities of non‑U.S. issuers (which includes borrowers) that are U.S. dollar or non-U.S. dollar denominated. The Fund’s Managed Assets to be invested in Senior Loans and other debt instruments of non‑U.S. issuers may include debt securities of issuers located, or conducting their business in, emerging markets countries. |
| • | The Fund may not invest more than 20% of its Managed Assets in securities from an industry which (for purposes of this policy) generally refers to the classification of companies in the same or similar lines of business such as the automotive, textiles and apparel, hotels, media production and consumer retailing industries. The Fund may invest more than 20% of its Managed Assets in sectors which (for purposes of this policy) generally refers to broader classifications of industries, such as the consumer discretionary sector which includes the automotive, textiles and apparel, hotels, media production and consumer retailing industries, provided the Fund’s investment in a particular industry within the sector does not exceed the industry limitation. |
| • | The Fund may invest up to 5% of its Managed Assets in iBoxx Loan Total Return Swaps. An iBoxx Loan Total Return Swap is a specific type of total return swap on an index that is designed to provide exposure to the Senior Loan market. The iBoxx Loan Total Return Swap’s underlying index is the Markit iBoxx USD Liquid Leveraged Loans Total Return Index, which is one of a subset of indices designed to track the broader, rules-based Markit iBoxx USD Liquid Leveraged Loan Index. “iBoxx Loan Total Return Swaps” means total return swaps written on the Markit iBoxx USD Liquid Leveraged Loans Total Return Index. |
The foregoing policies apply only at the time of any new investment.
103
Shareholder Update (continued)
Approving Changes in Investment Policies
The Board of Trustees of the Fund may change the policies described above without a shareholder vote. However, with respect to the Fund’s policy of investing at least 80% of its Assets in secured Senior Loans and unsecured Senior Loans, which unsecured Senior Loans will be, at the time of investment, investment grade quality, such policy may not be changed without 60 days’ prior written notice.
Portfolio Contents
The Fund generally invests in Senior Loans. Senior Loans typically hold the most senior position in the capital structure of a business entity, are typically secured with specific collateral and have a claim on the assets and/or stock of the issuer that is senior to that held by subordinated debt holders and stockholders of the issuer.
Senior Loans generally include: (i) Senior Loans made by banks or other financial institutions to U.S. and non‑U.S. corporations, partnerships and other business entities (each a “Borrower” and, collectively, “Borrowers”), (ii) assignments of such interests in Senior Loans, or (iii) participation interests in Senior Loans. Generally, an assignment is the actual sale of the loan, in whole or in part. A participation, on the other hand, means that the original lender maintains ownership over the loan and the participant has only a contract right against the original lender, not a credit relationship with the Borrower. Senior Loans typically hold the most senior position in the capital structure of a Borrower, are typically secured with specific collateral and have a claim on the assets and/or stock of the Borrower that is senior to that held by subordinated debt holders and stockholders of the Borrower. The capital structure of a Borrower may include Senior Loans, senior and junior subordinated debt, preferred stock and common stock issued by the Borrower, typically in descending order of seniority with respect to claims on the Borrower’s assets. The proceeds of Senior Loans primarily are used by Borrowers to finance leveraged buyouts, recapitalizations, mergers, acquisitions, stock repurchases, refinancings, internal growth and for other corporate purposes.
Loans may have restrictive covenants limiting the ability of a borrower to further encumber its assets. The types of covenants included in loan agreements generally vary depending on market conditions, the creditworthiness of the borrower, the nature of the collateral securing the loan and other factors. Such restrictive covenants normally allow for early intervention and proactive mitigation of credit risk by providing lenders with the ability to (1) intervene and either prevent or restrict actions that may potentially compromise the borrower’s ability to repay the loan and/or (2) obtain concessions from the borrower in exchange for waiving or amending a particular covenant. Loans with fewer or weaker restrictive covenants may limit the Fund’s ability to intervene or obtain additional concessions from borrowers. Certain loans in which the Fund invests may be “covenant-lite.” “Covenant-lite” loans refer generally to loans that do not have a complete set of financial maintenance covenants. Generally, “covenant-lite” loans are incurrence-based, which means they are only tested and can only be breached following an affirmative action of the borrower, rather than by a deterioration in the borrower’s financial condition.
A Senior Loan is typically originated, negotiated and structured by a U.S. or non‑U.S. commercial bank, insurance company, finance company or other financial institution (“Agent”) for a lending syndicate of financial institutions which typically includes the Agent (“Lenders”). The Agent typically administers and enforces the Senior Loan on behalf of the other Lenders in the syndicate. In addition, an institution, typically but not always the Agent, holds any collateral on behalf of the Lenders. The Fund normally will rely primarily on the Agent to collect principal of and interest on a Senior Loan. Also, the Fund usually will rely on the Agent to monitor compliance by the Borrower with the restrictive covenants in a loan agreement.
Senior loans in which the Fund invests generally pay interest at rates that are redetermined either daily, monthly, quarterly or semi-annually by reference to a base lending rate plus a premium or credit spread. The interest rates on senior loans are generally based on a percentage above the Secured Overnight Financing Rate (“SOFR”), a U.S. bank’s prime or base rate, the overnight federal funds rate or another rate. As adjustable rate loans, the frequency of how often a senior loan resets its interest rate will impact how closely such senior loans track current market interest rates. Senior loans typically have a stated term of between one and eight years.
The Fund may purchase participations in Senior Loans. By purchasing a participation interest in a loan, the Fund acquires some or all of the interest of a bank or other financial institution in a loan to a Borrower. Under a participation, the Fund generally will have rights that are more limited than the rights of lenders or of persons who acquire a Senior Loan by assignment. In a participation, the Fund typically has a contractual relationship with the lender selling the participation, but not with the Borrower. As a result, the Fund assumes the credit risk of the lender selling the participation in addition to the credit risk of the Borrower. In the event of insolvency of the lender selling the participation, the Fund may be treated as a general creditor of the lender and may not have a senior claim to the lenders’ interest in the Senior Loan. A lender selling a participation and other persons interpositioned between the lender and the Fund with respect to participations will likely conduct their principal business activities in the banking, finance and financial services industries.
The Fund may invest in corporate debt securities, including corporate bonds. Corporate debt securities are fully taxable debt obligations issued by corporations. These securities fund capital improvements, expansions, debt refinancing or acquisitions that require more capital than would ordinarily be available from a single lender. Investors in corporate debt securities lend money to the issuing corporation in exchange for interest payments and repayment of the principal at a set maturity date. Rates on corporate debt securities are set according to prevailing interest rates at the time of the issue, the credit rating of the issuer, the length of the maturity and other terms of the security, such as a call feature.
The Fund may utilize structured notes and similar instruments for investment purposes and also for hedging purposes. Structured notes are privately negotiated debt obligations where the principal and/or interest is determined by reference to the performance of a benchmark asset, market or interest rate (an “embedded index”), such as selected securities, an index of securities or specified interest rates, or the differential performance of two assets or markets.
The Fund may invest in debtor‑in‑possession financings (commonly called “DIP financings”). DIP financings are arranged when an entity seeks the protections of the bankruptcy court under chapter 11 of the U.S. Bankruptcy Code. These financings allow the entity to continue its business operations while reorganizing under chapter 11. Such financings are senior liens on unencumbered security (i.e., security not subject to other creditors claims).
104
The Fund may acquire equity securities and warrants issued by a Borrower or its affiliates as part of a package of investments in the Borrower or its affiliates issued in connection with a Senior Loan of the Borrower. The Fund also may convert a warrant so acquired into the underlying security. Investments in warrants and equity securities entail certain risks in addition to those associated with investments in Senior Loans. The value of these securities may be affected more rapidly, and to a greater extent, by company-specific developments and general market conditions. These risks may increase fluctuations in the Fund’s net asset value (“NAV”). The Fund may possess material non‑public information about a Borrower as a result of its ownership of a Senior Loan of such Borrower. Because of prohibitions on trading in securities of issuers while in possession of such information the Fund might be unable to enter into a transaction in a security of such a Borrower when it would otherwise be advantageous to do so.
The Fund may invest in convertible securities, which may include convertible debt, convertible preferred stock, synthetic convertible securities and may also include secured and unsecured debt, based upon the judgment of the Fund’s sub‑adviser. Convertible securities may pay interest or dividends that are based on a fixed or floating rate. A convertible security is a preferred stock, warrant or other security that may be converted into or exchanged for a prescribed amount of common stock or other security of the same or a different issuer or into cash within a particular period of time at a specified price or formula.
The Fund may invest in mortgage-related securities, including mortgage-backed securities. Mortgage-related securities are debt instruments that provide periodic payments consisting of interest and/or principal that are derived from or related to payments of interest and/or principal on underlying mortgages. Additional payments on mortgage-related securities may be made out of unscheduled prepayments of principal resulting from the sale of the underlying property, or from refinancing or foreclosure, net of fees or costs that may be incurred. The mortgage-related securities in which the Fund invests will typically pay variable rates of interest, although the Fund may invest in fixed-rate obligations as well.
The Fund may invest in certain asset-backed securities (“ABS”). ABS are payment claims that are securitized in the form of negotiable paper that is issued by a financing company (generally called a Special Purpose Vehicle or “SPV”). These securitized payment claims are, as a rule, corporate financial assets brought into a pool according to specific diversification rules. The SPV is a company founded solely for the purpose of securitizing these claims and its only asset is the risk arising out of this diversified asset pool. On this basis, marketable securities are issued which, due to the diversification of the underlying risk, generally represent a lower level of risk than the original assets. The redemption of the securities issued by the SPV takes place at maturity out of the cash flow generated by the collected claims.
The Fund may invest in collateralized loan obligations (“CLOs”). A CLO is a structured credit security issued by an SPV that was created to reapportion the risk and return characteristics of a pool of assets. The assets, typically Senior Loans, are used as collateral supporting the various debt tranches issued by the SPV. The key feature of the CLO structure is the prioritization of the cash flows from a pool of debt securities among the several classes of CLO holders, thereby creating a series of obligations with varying rates and maturities appealing to a wide range of investors. CLOs generally are secured by an assignment to a trustee under an indenture pursuant to which the bonds are issued of collateral consisting of a pool of debt instruments, usually, non‑investment grade bank loans. Payments with respect to the underlying debt securities generally are made to the trustee under the indenture. CLOs are designed to be retired as the underlying debt instruments are repaid. In the event of sufficient early prepayments on such debt instruments, the class or series of CLO first to mature generally will be retired prior to maturity. Therefore, although in most cases the issuer of CLOs will not supply additional collateral in the event of such prepayments, there will be sufficient collateral to secure their priority with respect to other CLO tranches that remain outstanding. The credit quality of these securities depends primarily upon the quality of the underlying assets, their priority with respect to other CLO tranches and the level of credit support and/or enhancement provided.
The Fund also may invest in collateralized debt obligations (“CDOs”). A CDO is a structured credit security issued by an SPV that was created to reapportion the risk and return characteristics of a pool of assets. The assets, typically non‑investment grade bonds, leveraged loans, and other asset-backed obligations, are used as collateral supporting the various debt and equity tranches issued by the SPV. CDOs operate similarly to CLOs.
The Fund may invest in commercial paper. Commercial paper represents short-term unsecured promissory notes issued in bearer form by corporations such as banks or bank holding companies and finance companies. The rate of return on commercial paper may be linked or indexed to the level of exchange rates between the U.S. dollar and a foreign currency or currencies.
The Fund may invest in U.S. Government securities. U.S. Government securities include (1) U.S. Treasury obligations, which differ in their interest rates, maturities and times of issuance: U.S. Treasury bills (maturities of one year or less), U.S. Treasury notes (maturities of one year to ten years) and U.S. Treasury bonds (generally maturities of greater than ten years) and (2) obligations issued or guaranteed by U.S. Government agencies and instrumentalities that are supported by any of the following: (i) the full faith and credit of the U.S. Treasury, (ii) the right of the issuer to borrow an amount limited to a specific line of credit from the U.S. Treasury, (iii) discretionary authority of the U.S. Government to purchase certain obligations of the U.S. Government agency or instrumentality or (iv) the credit of the agency or instrumentality.
The Fund may invest in securities of non‑U.S. issuers that are U.S. dollar or non‑U.S. dollar denominated. The Fund may invest in any region of the world and invest in companies operating in developed countries such as Canada, Japan, Australia, New Zealand and most Western European countries. An “emerging market” country is any country determined to have an emerging markets economy, considering, among other things, factors such as whether the country has a low‑to‑middle income economy according to the World Bank or its related organizations, the country’s credit rating, its political and economic stability and the development of its financial and capital markets. These countries generally include countries located in Latin America, the Caribbean, Asia, Africa, the Middle East and Eastern and Central Europe. Securities of non‑U.S. issuers include American Depository Receipts (“ADRs”), Global Depositary Receipts (“GDRs”) or other securities representing underlying shares of non- U.S. issuers. Positions in those securities are not necessarily denominated in the same currency as the common stocks into which they may be converted. ADRs are receipts typically issued by an American bank or trust company evidencing ownership of the underlying securities. GDRs are U.S. dollar- denominated receipts evidencing ownership of non‑U.S. securities. Generally, ADRs, in registered form, are designed for the U.S. securities markets and GDRs, in bearer form, are designed for use in non‑U.S. securities markets. The Fund may invest in sponsored or unsponsored ADRs. In the case of an unsponsored ADR, the Fund is likely to bear its proportionate share of the expenses of the depository and it may have greater difficulty in receiving shareholder communications than it would have with a sponsored ADR.
105
Shareholder Update (continued)
The Fund may invest in Eurodollar instruments and Yankee bonds. Yankee bonds are U.S. dollar denominated bonds typically issued in the U.S. by non‑U.S. governments and their agencies and non‑U.S. banks and corporations. These investments involve risks that are different from investments in securities issued by U.S. issuers, including potential unfavorable political and economic developments, non‑U.S. withholding or other taxes, seizure of non‑U.S. deposits, currency controls, interest limitations or other governmental restrictions which might affect payment of principal or interest.
The Fund may invest in sovereign debt securities issued by issuers located, or conducting their business, in emerging markets countries, and a wide variety of bonds and other debt instruments of varying maturities issued by domestic and non‑U.S. corporations, including high yield debt securities.
The Fund may invest in zero coupon bonds. A zero coupon bond is a bond that typically does not pay interest for the entire life of the obligation or for an initial period after the issuance of the obligation.
The Fund may invest in payment‑in‑kind securities (“PIKs”). PIKs pay dividends or interest in the form of additional securities of the issuer, rather than in cash. Each of these instruments is typically issued and traded at a deep discount from its face amount. The amount of the discount varies depending on such factors as the time remaining until maturity of the securities, prevailing interest rates, the liquidity of the security and the perceived credit quality of the issuer.
The Fund may buy and sell securities on a when-issued or delayed delivery basis, making payment or taking delivery at a later date, normally within 15 to 45 days of the trade date.
The Fund may invest in illiquid securities (i.e., securities that are not readily marketable), including, but not limited to, restricted securities (securities the disposition of which is restricted under the federal securities laws), securities that may be resold only pursuant to Rule 144A under the Securities Act of 1933, as amended (the “1933 Act”), and repurchase agreements with maturities in excess of seven days. Illiquid securities may also include securities legally restricted as to resale, such as securities issued pursuant to Section 4(a)(2) of the 1933 Act.
The Fund may enter into certain derivative instruments in pursuit of its investment objective, including to seek to enhance return, to hedge certain risks of its investments in Senior Loans or as a substitute for a position in the underlying asset. Such instruments include total return swaps; interest rate swaps; credit default swaps; interest rate caps; interest rate floors; interest rate collars; swaptions; credit-linked notes; securities indices; other indices or other financial instruments; stock and bond index futures; futures contracts on securities; options on securities; options on futures contracts; options on stock and bond indexes; interest rate futures; exchange-traded and over‑the‑counter options on securities or indices; index linked securities; currency exchange transactions; financial futures; options on financial futures; index futures; index options; index options on futures contracts; interest rate options; interest rate option on futures contracts; short sales; structured notes; options on U.S. Treasury security or U.S. Government Agency securities; U.S. Treasury security or U.S. Government Agency security futures contracts; and options on U.S. Treasury security or U.S. Government Agency security futures contracts.
The Fund may also invest in securities of other open- or closed‑end investment companies (including exchange-traded funds (“ETFs”)) that invest primarily in the types in which the Fund may invest directly, to the extent permitted by the Investment Company Act of 1940, as amended (the “1940 Act”) and the rules and regulations issued thereunder.
Use of Leverage
The Fund uses leverage to pursue its investment objective. The Fund may source leverage through the issuance of “senior securities” as defined under the 1940 Act, which include (1) borrowings, including loans from financial institutions; (2) issuance of debt securities; and (3) issuance of preferred shares of beneficial interest (“Preferred Shares”). Additionally, the Fund may use certain derivatives and other financing investments that have the economic effect of leverage by creating additional investment exposures, such as investments in reverse repurchase agreements. The amount and sources of leverage will vary depending on market conditions.
Temporary Defensive Periods
During temporary defensive periods (e.g., times when, in the Fund’s investment adviser’s and/or the Fund’s sub‑adviser’s opinion, temporary imbalances of supply and demand or other temporary dislocations in the Senior Loan market adversely affect the price at which Senior Loans are available), the Fund may invest up to 100% of its assets in high quality, short-term securities, and in short-, intermediate-, or long-term U.S. Treasury securities. There can be no assurance that such techniques will be successful. Accordingly, during such periods, the Fund may not achieve its investment objective.
106
NUVEEN CREDIT STRATEGIES INCOME FUND (JQC)
Investment Objectives
The Fund’s primary investment objective is to achieve a high level of current income. The Fund’s secondary investment objective is total return.
Investment Policies
The Fund will invest at least 80% of its Assets (as defined below), at time of purchase, in instruments that are senior to its common equity in the issuer’s capital structure, including but not limited to loans, debt securities and preferred securities.
“Assets” mean the net assets of the Fund plus the amount of any borrowings for investment purposes. “Managed Assets” mean the total assets of the Fund, minus the sum of its accrued liabilities (other than Fund liabilities incurred for the express purpose of creating leverage). Total assets for this purpose shall include assets attributable to the Fund’s use of leverage (whether or not those assets are reflected in the Fund’s financial statements for purposes of generally accepted accounting principles), and derivatives will be valued at their market value.
Under normal circumstances:
| • | The Fund may invest without limitation in instruments that are rated below investment grade or are unrated but judged to be of comparable quality. Investment grade quality instruments are those that are (i) rated by at least one nationally recognized statistical rating organization (“NRSRO”) within the four highest grades (BBB- or Baa3 or better by S&P, Moody’s or Fitch), or (ii) unrated but judged to be of comparable quality. However, the Fund may not invest more than 30% of its Managed Assets in instruments that are rated CCC/Caa or lower at the time of investment (or are unrated but judged by the Fund’s sub‑adviser to be of comparable quality). |
| • | The Fund may invest up to 20% of its Managed Assets in instruments of non‑U.S. issuers that are U.S. dollar or non‑U.S. dollar denominated, including instruments of issuers located, or conducting their business in, emerging markets countries. |
| • | The Fund may invest up to 25% of its Managed Assets in collateralized loan obligation (“CLO”) debt securities. |
The foregoing policies apply only at the time of any new investment.
Approving Changes in Investment Policies
The Board of Trustees of the Fund may change the policies described above without a shareholder vote. However, with respect to the Fund’s policy of investing at least 80% of its Assets, at time of purchase, in instruments that are senior to its common equity in the issuer’s capital structure, such policy may not be changed without 60 days’ prior written notice.
Portfolio Contents
The Fund may invest in collateralized loan obligations (“CLOs”). A CLO is a structured credit security issued by an SPV that was created to reapportion the risk and return characteristics of a pool of assets. The assets, typically Senior Loans, are used as collateral supporting the various debt tranches issued by the SPV. The key feature of the CLO structure is the prioritization of the cash flows from a pool of debt securities among the several classes of CLO holders, thereby creating a series of obligations with varying rates and maturities appealing to a wide range of investors. CLOs generally are secured by an assignment to a trustee under an indenture pursuant to which the bonds are issued of collateral consisting of a pool of debt instruments, usually, non‑investment grade bank loans. Payments with respect to the underlying debt securities generally are made to the trustee under the indenture. CLOs are designed to be retired as the underlying debt instruments are repaid. In the event of sufficient early prepayments on such debt instruments, the class or series of CLO first to mature generally will be retired prior to maturity. Therefore, although in most cases the issuer of CLOs will not supply additional collateral in the event of such prepayments, there will be sufficient collateral to secure their priority with respect to other CLO tranches that remain outstanding. The credit quality of these securities depends primarily upon the quality of the underlying assets, their priority with respect to other CLO tranches and the level of credit support and/or enhancement provided.
The Fund also may invest in collateralized debt obligations (“CDOs”). A CDO is a structured credit security issued by an SPV that was created to reapportion the risk and return characteristics of a pool of assets. The assets, typically non‑investment grade bonds, leveraged loans, and other asset-backed obligations, are used as collateral supporting the various debt and equity tranches issued by the SPV. CDOs operate similarly to CLOs.
The Fund may invest in corporate debt instruments. Corporate debt instruments generally are used by corporations to borrow money from investors. The Issuer pays the investor a fixed or variable rate of interest and normally must repay the amount borrowed on or before maturity. Certain debt instruments in which the Fund may invest may be “perpetual” in that they have no maturity date and some may be convertible into equity securities of the Issuer or its affiliates. The Fund may invest in debt instruments of any quality and such debt instruments may be secured or unsecured. In addition, certain debt instruments in which the Fund may invest may be subordinated to the payment of an Issuer’s senior debt.
The Fund may in senior loans. Senior loans typically hold the most senior position in the capital structure of a business entity, are typically secured with specific collateral and have a claim on the assets and/or stock of the issuer that is senior to that held by subordinated debt holders and stockholders of the issuer.
107
Shareholder Update (continued)
Senior loans generally include: (i) senior loans made by banks or other financial institutions to U.S. and non‑U.S. corporations, partnerships and other business entities (each a “Borrower” and, collectively, “Borrowers”), (ii) assignments of such interests in senior loans, or (iii) participation interests in senior loans. Generally, an assignment is the actual sale of the loan, in whole or in part. A participation, on the other hand, means that the original lender maintains ownership over the loan and the participant has only a contract right against the original lender, not a credit relationship with the Borrower. Senior loans typically hold the most senior position in the capital structure of a Borrower, are typically secured with specific collateral and have a claim on the assets and/or stock of the Borrower that is senior to that held by subordinated debt holders and stockholders of the Borrower. The capital structure of a Borrower may include senior loans, senior and junior subordinated debt, preferred stock and common stock issued by the Borrower, typically in descending order of seniority with respect to claims on the Borrower’s assets. The proceeds of senior loans primarily are used by Borrowers to finance leveraged buyouts, recapitalizations, mergers, acquisitions, stock repurchases, refinancings, internal growth and for other corporate purposes.
Loans may have restrictive covenants limiting the ability of a borrower to further encumber its assets. The types of covenants included in loan agreements generally vary depending on market conditions, the creditworthiness of the borrower, the nature of the collateral securing the loan and other factors. Such restrictive covenants normally allow for early intervention and proactive mitigation of credit risk by providing lenders with the ability to (1) intervene and either prevent or restrict actions that may potentially compromise the borrower’s ability to repay the loan and/or (2) obtain concessions from the borrower in exchange for waiving or amending a particular covenant. Loans with fewer or weaker restrictive covenants may limit the Fund’s ability to intervene or obtain additional concessions from borrowers. Certain loans in which the Fund invests may be “covenant-lite.” “Covenant-lite” loans refer generally to loans that do not have a complete set of financial maintenance covenants. Generally, “covenant-lite” loans are incurrence-based, which means they are only tested and can only be breached following an affirmative action of the borrower, rather than by a deterioration in the borrower’s financial condition.
A senior loan is typically originated, negotiated and structured by a U.S. or non‑U.S. commercial bank, insurance company, finance company or other financial institution (“Agent”) for a lending syndicate of financial institutions which typically includes the Agent (“Lenders”). The Agent typically administers and enforces the senior loan on behalf of the other Lenders in the syndicate. In addition, an institution, typically but not always the Agent, holds any collateral on behalf of the Lenders. The Fund normally will rely primarily on the Agent to collect principal of and interest on a senior loan. Also, the Fund usually will rely on the Agent to monitor compliance by the Borrower with the restrictive covenants in a loan agreement.
Senior loans in which the Fund invests generally pay interest at rates that are redetermined either daily, monthly, quarterly or semi-annually by reference to a base lending rate plus a premium or credit spread. The interest rates on senior loans are generally based on a percentage above the Secured Overnight Financing Rate (“SOFR”), a U.S. bank’s prime or base rate, the overnight federal funds rate or another rate. As adjustable rate loans, the frequency of how often a senior loan resets its interest rate will impact how closely such senior loans track current market interest rates. Senior loans typically have a stated term of between one and eight years.
The Fund may invest in adjustable rate subordinated loans. The subordinated loans in which the Fund may invest are typically privately-negotiated investments that rank subordinate in priority of payment to senior debt, such as Senior Loans, and are often unsecured. However, such subordinated loans rank senior to common and preferred equity in a Borrower’s capital structure. Subordinated loans may have elements of both debt and equity instruments, offering fixed or adjustable rates of return in the form of interest payments associated with senior debt, while providing lenders an opportunity to participate in the capital appreciation of a Borrower, if any, through an equity interest. This equity interest may take the form of warrants or direct equity investments which will be in conjunction with the subordinated loans. Due to their higher risk profile and often less restrictive covenants as compared to Senior Loans, subordinated loans generally earn a higher return than secured Senior Loans. The warrants associated with subordinated loans are typically detachable, which allows lenders the opportunity to receive repayment of their principal on an agreed amortization schedule while retaining their equity interest in the Borrower. Subordinated loans also may include a “put” feature, which permits the holder to sell its equity interest back to the Borrower at a price determined through an agreed formula.
The Fund may invest in subordinated loans that are primarily unsecured and that provide for relatively high, adjustable rates of interest, providing the Fund with significant current interest income. The subordinated loans in which the Fund may invest may have interest-only payments in the early years, with amortization of principal deferred to the later years of the subordinated loans. In some cases, the Fund may acquire subordinated loans that, by their terms, convert into equity or additional debt instruments or defer payments of interest for the first few years after issuance. Also, in some cases the subordinated loans in which the Fund may invest will be collateralized by a subordinated lien on some or all of the assets of the Borrower. Typically, subordinated loans in which the Fund may invest will have maturities of four to eight years.
The Fund may invest in common stocks and other equity securities. Common stocks generally represent an ownership interest in an issuer, without preference over any other class of securities, including such issuer’s fixed income securities and senior equity securities. Dividend payments generally are not guaranteed and so may be discontinued by the issuer at its discretion or because of the issuer’s inability to satisfy its liabilities. Further, an issuer’s history of paying dividends does not guarantee that it will continue to pay dividends in the future. In addition to dividends, under certain circumstances the Fund may benefit from capital appreciation of an issuer’s common stock.
The Fund may invest in convertible securities, which may include convertible debt, convertible preferred stock, synthetic convertible securities and may also include secured and unsecured debt, based upon the judgment of the Fund’s sub‑adviser. Convertible securities may pay interest or dividends that are based on a fixed or floating rate. A convertible security is a preferred stock, warrant or other security that may be converted into or exchanged for a prescribed amount of common stock or other security of the same or a different issuer or into cash within a particular period of time at a specified price or formula.
The Fund may utilize structured notes and similar instruments for investment purposes and also for hedging purposes. Structured notes are privately negotiated debt obligations where the principal and/or interest is determined by reference to the performance of a benchmark asset, market or interest rate (an “embedded index”), such as selected securities, an index of securities or specified interest rates, or the differential performance of two assets or markets.
108
For cash management purposes, the Fund may enter into repurchase agreements (a purchase of, and a simultaneous commitment to resell, a financial instrument at an agreed upon price on an agreed upon date) only with member banks of the Federal Reserve System and member firms of the New York Stock Exchange. When participating in repurchase agreements, the Fund buys securities from a vendor, e.g., a bank or brokerage firm, with the agreement that the vendor will repurchase the securities at a higher price at a later date. Such transactions afford an opportunity for the Fund to earn a return on available cash at minimal market risk, although the Fund may be subject to various delays and risks of loss if the vendor is unable to meet its obligation to repurchase.
The Fund may invest in debtor‑in‑possession financings (commonly called “DIP financings”). DIP financings are arranged when an entity seeks the protections of the bankruptcy court under chapter 11 of the U.S. Bankruptcy Code. These financings allow the entity to continue its business operations while reorganizing under chapter 11. Such financings are senior liens on unencumbered security (i.e., security not subject to other creditors claims).
The Fund may acquire equity securities and warrants issued by a Borrower or its affiliates as part of a package of investments in the Borrower or its affiliates issued in connection with a Senior Loan of the Borrower. The Fund also may convert a warrant so acquired into the underlying security. Investments in warrants and equity securities entail certain risks in addition to those associated with investments in Senior Loans. The value of these securities may be affected more rapidly, and to a greater extent, by company-specific developments and general market conditions. These risks may increase fluctuations in the Fund’s net asset value (“NAV”). The Fund may possess material non‑public information about a Borrower as a result of its ownership of a Senior Loan of such Borrower. Because of prohibitions on trading in securities of issuers while in possession of such information the Fund might be unable to enter into a transaction in a security of such a Borrower when it would otherwise be advantageous to do so.
The Fund may invest in mortgage-related securities, including mortgage-backed securities. Mortgage-related securities are debt instruments that provide periodic payments consisting of interest and/or principal that are derived from or related to payments of interest and/or principal on underlying mortgages. Additional payments on mortgage-related securities may be made out of unscheduled prepayments of principal resulting from the sale of the underlying property, or from refinancing or foreclosure, net of fees or costs that may be incurred. The mortgage-related securities in which the Fund invests will typically pay variable rates of interest, although the Fund may invest in fixed-rate obligations as well. The Fund may invest in certain ABS. ABS are payment claims that are securitized in the form of negotiable paper that is issued by a financing company (generally called a SPV). These securitized payment claims are, as a rule, corporate financial assets brought into a pool according to specific diversification rules. The SPV is a company founded solely for the purpose of securitizing these claims and its only asset is the risk arising out of this diversified asset pool. On this basis, marketable securities are issued which, due to the diversification of the underlying risk, generally represent a lower level of risk than the original assets. The redemption of the securities issued by the SPV takes place at maturity out of the cash flow generated by the collected claims.
The Fund may invest in commercial paper. Commercial paper represents short-term unsecured promissory notes issued in bearer form by corporations such as banks or bank holding companies and finance companies. The rate of return on commercial paper may be linked or indexed to the level of exchange rates between the U.S. dollar and a foreign currency or currencies.
The Fund may invest in U.S. Government securities. U.S. Government securities include (1) U.S. Treasury obligations, which differ in their interest rates, maturities and times of issuance: U.S. Treasury bills (maturities of one year or less), U.S. Treasury notes (maturities of one year to ten years) and U.S. Treasury bonds (generally maturities of greater than ten years) and (2) obligations issued or guaranteed by U.S. Government agencies and instrumentalities that are supported by any of the following: (i) the full faith and credit of the U.S. Treasury, (ii) the right of the issuer to borrow an amount limited to a specific line of credit from the U.S. Treasury, (iii) discretionary authority of the U.S. Government to purchase certain obligations of the U.S. Government agency or instrumentality or (iv) the credit of the agency or instrumentality.
The Fund may invest in securities of non‑U.S. Issuers that are U.S. dollar or non‑U.S. dollar denominated, including debt securities of issuers located, or conducting their business, in emerging markets countries. The Fund’s Managed Assets to be invested in Adjustable Rate Loans and other debt instruments of non‑U.S. Issuers may include debt securities of Issuers located, or conducting their business in, emerging markets countries. The Fund may invest in any region of the world and invest in companies operating in developed countries such as Canada, Japan, Australia, New Zealand and most Western European countries. An “emerging market” country is any country determined to have an emerging markets economy, considering, among other things, factors such as whether the country has a low‑to‑middle‑income economy according to the World Bank or its related organizations, the country’s credit rating, its political and economic stability and the development of its financial and capital markets. These countries generally include countries located in Latin America, the Caribbean, Asia, Africa, the Middle East and Eastern and Central Europe.
The Fund may invest in preferred securities. Preferred securities, which generally pay fixed or adjustable rate dividends or interest to investors, have preference over common stock in the payment of dividends or interest and the liquidation of a company’s assets, which means that a company typically must pay dividends or interest on its preferred securities before paying any dividends on its common stock. On the other hand, preferred securities are junior to all forms of the company’s debt, including both senior and subordinated debt. Because of their subordinated position in the capital structure of an issuer, the ability to defer dividend or interest payments for extended periods of time without triggering a default from legal action and certain other features, preferred securities are often treated as equity-like instruments by both issuers and investors, as their quality and value are heavily dependent on the profitability and cash flows of the issuer rather than on any legal claims to specific assets.
The Fund may invest in contingent capital securities (sometimes referred to as “CoCos”). CoCos are hybrid securities, issued primarily by non-U.S. financial institutions, which have loss absorption mechanisms benefitting the issuer built into their terms. CoCos generally provide for mandatory conversion into the common stock of the issuer or a write-down of the principal amount or value of the CoCos upon the occurrence of certain triggers linked to regulatory capital thresholds. In addition, they may provide for mandatory conversion or a principal write-down upon the occurrence of certain events such as regulatory actions calling into question the issuing banking institution’s continued viability as a going-concern. Equity conversion or principal write-down features are tailored to the issuer and its regulatory requirements and, unlike traditional convertible securities, conversions are not voluntary.
109
Shareholder Update (continued)
The Fund may invest in zero coupon bonds. A zero coupon bond is a bond that typically does not pay interest for the entire life of the obligation or for an initial period after the issuance of the obligation.
The Fund may invest in payment‑in‑kind securities (“PIKs”). PIKs pay dividends or interest in the form of additional securities of the issuer, rather than in cash. Each of these instruments is typically issued and traded at a deep discount from its face amount. The amount of the discount varies depending on such factors as the time remaining until maturity of the securities, prevailing interest rates, the liquidity of the security and the perceived credit quality of the issuer.
The Fund may buy and sell securities on a when-issued or delayed delivery basis, making payment or taking delivery at a later date, normally within 15 to 45 days of the trade date.
The Fund may invest in illiquid securities (i.e., securities that are not readily marketable), including, but not limited to, restricted securities (securities the disposition of which is restricted under the federal securities laws), securities that may be resold only pursuant to Rule 144A under the Securities Act of 1933, as amended (the “1933 Act”), and repurchase agreements with maturities in excess of seven days. Illiquid securities may also include securities legally restricted as to resale, such as securities issued pursuant to Section 4(a)(2) of the 1933 Act.
The Fund may enter into certain derivative transactions, primarily but not limited to credit default and interest rate swaps, as a hedging technique to protect against potential adverse changes in the market value of portfolio instruments. The Fund also may use derivatives to attempt to protect the NAV of the Fund, to facilitate the sale of certain portfolio instruments, to manage the Fund’s effective interest rate exposure, and as a temporary substitute for purchasing or selling particular instruments. From time to time, the Fund also may enter into derivative transactions to create investment exposure to the extent such transactions may facilitate implementation of its strategy more efficiently than through outright purchases or sales of portfolio instruments.
The Fund may also invest in securities of other open- or closed‑end investment companies (including exchange-traded funds (“ETFs”)) that invest primarily in the types in which the Fund may invest directly, to the extent permitted by the Investment Company Act of 1940, as amended (the “1940 Act”) and the rules and regulations issued thereunder.
Use of Leverage
The Fund uses leverage to pursue its investment objective. The Fund may source leverage through the issuance of “senior securities” as defined under the 1940 Act, which include (1) borrowings, including loans from financial institutions; (2) issuance of debt securities; and (3) issuance of preferred shares of beneficial interest (“Preferred Shares”). Additionally, the Fund may use certain derivatives and other financing investments that have the economic effect of leverage by creating additional investment exposures, such as investments in inverse floating rate securities and reverse repurchase agreements. The amount and sources of leverage will vary depending on market conditions.
Temporary Defensive Periods
During temporary defensive periods (e.g., times when, in the Fund’s investment adviser’s and/or the Fund’s sub‑adviser’s opinion, temporary imbalances of supply and demand or other temporary dislocations in the Senior Loan market adversely affect the price at which Senior Loans are available), the Fund may invest up to 100% of its assets in high quality, short-term securities, and in short-, intermediate-, or long-term U.S. Treasury securities. There can be no assurance that such techniques will be successful. Accordingly, during such periods, the Fund may not achieve its investment objective.
110
NUVEEN PREFERRED & INCOME OPPORTUNITIES FUND (JPC)
Investment Objectives
The Fund’s primary investment objective is high current income. The Fund’s secondary investment objective is total return.
Investment Policies
The Fund will invest at least 80% of its Assets (as defined below) in preferred securities and other income producing securities, including hybrid securities such as contingent capital securities and up to 20% in other securities, primarily income-oriented securities such as corporate and taxable municipal debt and common equity.
“Assets” mean the net assets of the Fund plus the amount of any borrowings for investment purposes. “Managed Assets” mean the total assets of the Fund, minus the sum of its accrued liabilities (other than Fund liabilities incurred for the express purpose of creating leverage). Total assets for this purpose shall include assets attributable to the Fund’s use of leverage (whether or not those assets are reflected in the Fund’s financial statements for purposes of generally accepted accounting principles), and derivatives will be valued at their market value.
Under normal circumstances:
| • | The Fund will invest at least 50% of its Managed Assets in securities rated investment grade (BBB/Baa and above) at the time of investment. Investment grade quality securities are those securities that, at the time of investment, are (i) rated by at least one nationally recognized statistical rating organization (“NRSRO”) within the four highest grades (Baa or BBB or better by Moody’s Investors Service, Inc. (“Moody’s”), Standard & Poor’s Corporation (“S&P”), or Fitch Ratings (“Fitch”), or are unrated but judged to be of comparable quality. |
| • | The Fund will invest more than 25% of its Managed Assets in the securities of companies principally engaged in financial services. |
| • | The Fund is not limited in the amount of its investments in non‑U.S. issuers. The Fund may invest up to 10% of its Managed Assets in non-U.S. dollar-denominated securities. The Fund may invest up to 5% of its Managed Assets in preferred securities issued by companies located in emerging market countries. |
The foregoing policies apply only at the time of any new investment.
Approving Changes in Investment Policies
The Board of Trustees of the Fund may change the policies described above without a shareholder vote. However, with respect to the Fund’s policy of investing at least 80% of its Assets in preferred securities and other income producing securities, such policy may not be changed without 60 days’ prior written notice.
Portfolio Contents
The Fund invests in preferred securities. The Fund may invest in all types of preferred securities, including both traditional preferred securities and non‑traditional preferred securities. Traditional preferred securities are generally equity securities of the issuer that have priority over the issuer’s common shares as to the payment of dividends (i.e., the issuer cannot pay dividends on its common shares until the dividends on the preferred shares are current) and as to the payout of proceeds of bankruptcy or other liquidation, but are subordinate to an issuer’s senior debt and junior debt as to both types of payments. Additionally, in a bankruptcy or other liquidation, traditional preferred shares are generally subordinate to an issuer’s trade creditors and other general obligations.
Traditional preferred securities pay a dividend, typically contingent both upon declaration by the issuer’s board and at times approval by regulators, and on the existence of current earnings (or retained earnings) in sufficient amount to source the payment. Dividend payments can be either cumulative or non‑cumulative and can be passed or deferred without limitation at the option of the issuer. Traditional preferred securities typically have no ordinary right to vote for the board of directors, except in some cases voting rights may arise if the issuer fails to pay the preferred share dividends. Traditional preferred securities may be perpetual, or have a term and typically have a fixed liquidation (or “par”) value.
While some preferred securities are issued with a final maturity date, others are perpetual in nature. In certain instances, a final maturity date may be extended and/or the final payment of principal may be deferred at the issuer’s option for a specified time without triggering an event of default for the issuer. No redemption can typically take place unless all cumulative payment obligations to preferred security investors have been met, although issuers may be able to engage in open-market repurchases without regard to any cumulative dividends or interest payable. A portion of the portfolio may include investments in non‑cumulative preferred securities, whereby the issuer does not have an obligation to make up any arrearages to holders of such securities. Should an issuer default on its obligations under such a security, the amount of income earned by the Fund may be adversely affected. Non‑traditional preferred securities include hybrid preferred securities, contingent convertible capital securities and other types of preferred securities that do not have the traditional features described above. Hybrid-preferred securities often behave similarly as investments in traditional preferred securities and are regarded by market investors as being part of the preferred securities market. Hybrid-preferred securities possess varying combinations of features of both debt and preferred shares and as such they may constitute senior debt, junior debt or preferred shares in an issuer’s capital structure. As such, hybrid-preferred securities may not be subordinate to a company’s debt securities (as are traditional preferred shares). Given the various debt and equity characteristics of hybrid-preferred securities, whether a hybrid-preferred security is classified as debt or equity for purposes of reporting the Fund’s portfolio holdings may be based on the portfolio managers’ determination as to whether its debt or preferred features are preponderant, or based on the assessment of an independent data provider. Such determinations may be subjective.
111
Shareholder Update (continued)
Hybrid-preferred securities include trust preferred securities. Trust preferred securities are typically issued by corporations, generally in the form of interest-bearing notes with preferred securities characteristics, or by an affiliated business trust of a corporation, generally in the form of beneficial interests in subordinated debentures or similarly structured securities. The trust preferred securities market consists of both fixed and adjustable coupon rate securities that are either perpetual in nature or have stated maturity dates. Trust preferred securities may defer payment of income without triggering an event of default. These securities may have many characteristics of equity due to their subordinated position in an issuer’s capital structure. Trust preferred securities may be issued by trusts or other special purpose entities.
Preferred securities may also include certain forms of debt that have many characteristics of preferred shares, and that are regarded by the investment marketplace to be part of the broader preferred securities market. Among these “preferred securities” are certain exchange-listed debt issues that historically have several attributes, including trading and investment performance characteristics, in common with exchange-listed traditional preferred stock and hybrid-preferred securities. Generally, these types of “preferred securities” are senior debt or junior debt in the capital structure of an issuer.
Preferred securities generally pay fixed or adjustable rate dividends or interest to investors and have preference over common stock in the payment of dividends or interest and generally the liquidation of a company’s assets, which means that a company typically must pay dividends or interest on its preferred securities before paying any dividends on its common stock. As a general matter, dividend or interest payments on preferred securities may be cumulative or non‑cumulative. The dividend or interest rates on preferred securities may be fixed or floating, or convert from fixed to floating at a specified future time; the Fund may invest without limit in such floating-rate and fixed‑to‑floating rate preferred securities. Floating- rate and fixed‑to‑floating rate preferred securities may be traditional preferred or hybrid-preferred securities. Floating-rate preferred securities pay a rate of income that resets periodically based on short- and/or longer-term interest rate benchmarks. If the associated interest rate benchmark rises, the income received from the security may increase and therefore the return offered by the floating-rate security may rise as well, making such securities less price sensitive to rising interest rates (or yields). Similarly, a fixed‑to‑floating rate security may be less price sensitive to rising interest rates (or yields), because the period over which the rate of payment is fixed is shorter than the maturity term of the bond, after which period a floating rate of payment applies. On the other hand, preferred securities are junior to most other forms of the company’s debt, including both senior and subordinated debt. Because of their subordinated position in the capital structure of an issuer, the ability to defer dividend or interest payments for extended periods of time without triggering an event of default for the issuer, and certain other features, preferred securities may have, at times, risks similar to equity instruments. The Fund’s portfolio of preferred securities may consist of fixed rate preferred and adjustable rate preferred securities.
The preferred securities market continues to evolve. New securities may be developed that may be regarded by market investors as being part of the preferred securities market. Where such securities will fall in the capital structure of the issuer will depend on the structure and characteristics of the new security. For purposes of the Fund’s policy of investing at least 80% of its Assets in preferred securities and other income producing securities, the Fund considers all of the foregoing types of securities that are commonly viewed in the marketplace as preferred securities to be preferred securities, regardless of their classification in the capital structure of the issuer.
Preferred securities are typically issued by corporations, generally in the form of interest or dividend bearing instruments, or by an affiliated business trust of a corporation, generally in the form of beneficial interests in subordinated debentures or similarly structured securities. Preferred securities may either trade over‑the‑counter, or trade on an exchange. The preferred securities market is generally divided into the $25 par “retail” and the $1,000 par “institutional” segments. The $25 par segment is typified by securities that are listed on the New York Stock Exchange (“NYSE”), which trade and are quoted with accrued dividend or interest income, and which are often callable. The institutional segment is typified by $1,000 par value securities that are not exchange-listed. The Fund may invest in preferred securities of either segment.
The Fund may invest in contingent capital securities. Contingent capital securities (sometimes referred to as “CoCos”) are securities issued primarily by non‑U.S. financial institutions. Specific CoCo structures vary by country of domicile and by each issue. All CoCos have mechanisms that absorb losses or reduces the value of the CoCo due to deterioration of the issuer’s financial condition and status as a going concern. Loss absorption mechanisms, which may include conversion into common equity and principal write-down, are intended for the benefit of the issuer and when triggered will likely negatively impact the value of the CoCo to the detriment of the CoCo investor. Loss absorption mechanisms can be triggered by capital levels or market value metrics of the issuers dropping below a certain predetermined level or at the discretion of the issuer regulator/ supervisory entity. Unlike traditional convertible securities, the conversion is not voluntary and the equity conversion or principal write-down features are tailored to the issuer and its regulatory requirements. Due to increased regulatory requirements for higher capital levels for financial institutions, the issuance of CoCo instruments has increased in the last several years and is expected to continue.
The Fund may invest in common stock. Common stock generally represents an equity ownership interest in an issuer. Although common stocks have historically generated higher average total returns than fixed-income securities over the long term, common stocks also have experienced significantly more volatility in those returns and may underperform relative to fixed-income securities during certain periods. An adverse event, such as an unfavorable earnings report, may depress the value of a particular common stock held by the Fund. Also, prices of common stocks are sensitive to general movements in the stock market and a drop in the stock market may depress the price of common stocks to which the Fund has exposure. Common stock prices fluctuate for several reasons including changes in investors’ perceptions of the financial condition of an issuer or the general condition of the relevant stock market, or the occurrence of political or economic events which affect the issuer. In addition, common stock prices may be particularly sensitive to rising interest rates, which increases borrowing costs and the costs of capital.
Additional types of equity securities (other than preferred securities) in which the Fund may invest include convertible securities, real estate investment trusts (“REITs”), warrants, rights, depositary receipts (which reference ownership of underlying non‑U.S. securities) and other types of securities with equity characteristics. The Fund’s equity investments also may include securities of other investment companies (including open- end funds, closed‑end funds and exchange-traded funds (“ETFs”)).
112
The Fund will invest in securities of companies primarily engaged in the financial services industry. A financial services company is one that is primarily involved in banking, mortgage finance, consumer finance, specialized finance, investment banking and brokerage, asset management and custody, corporate lending, insurance, financial instruments or real estate, including business development companies (“BDCs”) and REITs.
The Fund may invest in debt securities. The debt securities in which the Fund may invest include corporate debt securities and U.S. government and agency debt securities. Generally, debt securities typically, but not always, possess the following characteristics: a specified maturity or term, at which time the issuer is contractually obligated to pay the associated principal amount of debt to the debtholders; interest payments that are a contractual and enforceable obligation as of the stated payment date, and not contingent either on payment‑by‑payment declaration by the issuer’s board or on the demonstrated existence of company earnings as a source for the payment; and do not entitle the holder to exercise governance of or control over the issuer.
In the capital structure of an issuer, debt securities can be senior debt or junior debt. A senior debt security has priority over any other type of security in a company’s capital structure as to the payment of any promised income (typically denoted as interest) from the issuer, and as to payout of the proceeds of the bankruptcy or other liquidation of the company. At times, the issuer will have pledged specific assets or revenues to secure the rights of the holder of the debt security to payments of interest and principal such that the proceeds of the specific assets or revenues must be used to satisfy these debt obligations prior to being applied to any of the issuer’s other obligations in a bankruptcy or other liquidation. In the event that the assets securing the debt security are not sufficient to fully satisfy such obligations in a bankruptcy or other liquidation, the remainder of such obligations will generally have the same priority as an issuer’s trade creditors and other general obligations, but still have priority of payment relative to the issuer’s preferred shares and common shares. Sometimes referred to as subordinated or mezzanine debt, junior debt stands behind the senior debt as to its rights to receive promised income payments (again, typically denoted as interest) from the issuer, and payouts of the proceeds of bankruptcy or other liquidation, but will have priority of payment relative to the issuer’s preferred shares and common shares.
The Fund may invest in convertible securities. Convertible securities are hybrid securities that combine the investment characteristics of bonds and common stocks. Convertible securities typically consist of debt securities or preferred securities that may be converted within a specified period of time (typically for the entire life of the security) into a certain amount of common stock or other equity security of the same or a different issuer at a predetermined price. They also include debt securities with warrants or common stock attached and derivatives combining features of debt securities and equity securities. Convertible securities entitle the holder to receive interest paid or accrued on debt securities, or dividends paid or accrued on preferred securities, until the securities mature or are redeemed, converted or exchanged.
Before conversion, convertible securities have characteristics similar to nonconvertible income securities in that they ordinarily provide a stable stream of income with generally higher yields than those of common stocks of the same or similar issuers, but lower yields than comparable nonconvertible securities. The value of a convertible security is influenced by changes in interest rates, with investment value generally declining as interest rates increase and increasing as interest rates decline. The credit standing of the issuer and other factors also may have an effect on the convertible security’s investment value. Convertible securities are subordinate in rank to any senior debt obligations of the same issuer and, therefore, an issuer’s convertible securities entail more risk than its debt obligations.
The Fund may invest in REITs. REITs are typically publicly traded corporations or trusts that invest in residential or commercial real estate. REITs generally can be divided into the following three types: (i) equity REITs which invest the majority of their assets directly in real property and derive their income primarily from rents and capital gains or real estate appreciation; (ii) mortgage REITs which invest the majority of their assets in real estate mortgage loans and derive their income primarily from interest payments; and (iii) hybrid REITs which combine the characteristics of equity REITs and mortgage REITs. The Fund can invest in common stock, preferred securities, debt securities and convertible securities issued by REITs.
The Fund may invest in securities of foreign issuers through the direct investment in securities of such companies and through depositary receipts. For purposes of identifying foreign issuers, the Fund will use Bloomberg classifications, which employ the following factors listed in order of importance: (i) the country in which the company’s management is located, (ii) the country in which the company’s securities are primarily listed, (iii) the country from which the company primarily receives revenue and (iv) the company’s reporting currency. The Fund may purchase depositary receipts such as American Depositary Receipts (“ADRs”), European Depositary Receipts (“EDRs”) and Global Depositary Receipts (“GDRs”). ADRs, EDRs and GDRs are certificates evidencing ownership of shares of foreign issuers and are alternatives to purchasing directly the underlying foreign securities in their national markets and currencies.
The Fund may invest in securities of emerging markets issuers. Emerging markets issuers are those (i) whose securities are traded principally on a stock exchange or over‑the‑counter in an emerging market country, (ii) organized under the laws of an emerging market country or (iii) whose principal place of business or principal office(s) is in an emerging market country. Emerging market countries include any country other than Canada, the United States and the countries comprising the MSCI EAFE® Index (currently, Australia, Austria, Belgium, Denmark, Finland, France, Germany, Hong Kong, Ireland, Israel, Italy, Japan, Netherlands, New Zealand, Norway, Portugal, Singapore, Spain, Sweden, Switzerland and the United Kingdom).
The Fund may invest in U.S. government securities, including U.S. Treasury obligations and securities issued or guaranteed by various agencies of the U.S. government, or by various instrumentalities which have been established or sponsored by the U.S. government. U.S. Treasury obligations are backed by the “full faith and credit” of the U.S. government. Securities issued or guaranteed by federal agencies and U.S. government sponsored instrumentalities may or may not be backed by the full faith and credit of the U.S. government.
The Fund may invest in zero coupon bonds. A zero coupon bond is a bond that typically does not pay interest for the entire life of the obligation or for an initial period after the issuance of the obligation.
The Fund may buy and sell securities on a when-issued or delayed delivery basis, making payment or taking delivery at a later date, normally within 15 to 45 days of the trade date.
113
Shareholder Update (continued)
The Fund may invest in illiquid securities (i.e., securities that are not readily marketable), including, but not limited to, restricted securities (securities the disposition of which is restricted under the federal securities laws), securities that may be resold only pursuant to Rule 144A under the Securities Act of 1933, as amended (the “1933 Act”), and repurchase agreements with maturities in excess of seven days. Illiquid securities may also include securities legally restricted as to resale, such as securities issued pursuant to Section 4(a)(2) of the 1933 Act.
The Fund may use derivative instruments to seek to hedge some of the risk of the Fund’s investments or its leverage, to enhance return, to serve as a substitute for a position in an underlying asset, to reduce transaction costs, to manage the Fund’s effective interest rate exposure, to maintain full market exposure, to manage cash flows or to preserve capital. Such instruments may include financial futures contracts, swap contracts (including interest rate and credit default swaps), options on equity securities, options on financial futures or other derivative instruments.
The Fund may also invest in securities of other open- or closed‑end investment companies (including exchange-traded funds (“ETFs”)) that invest primarily in the types in which the Fund may invest directly, to the extent permitted by the Investment Company Act of 1940, as amended (the “1940 Act”) and the rules and regulations issued thereunder.
Use of Leverage
The Fund uses leverage to pursue its investment objective. The Fund may source leverage through the use of the issuance of “senior securities” as defined under the 1940 Act, which include (1) borrowings, including loans from financial institutions; (2) issuance of debt securities; and (3) issuance of preferred shares of beneficial interest (“Preferred Shares”). Additionally, the Fund may use certain derivatives and other financing investments that have the economic effect of leverage by creating additional investment exposures, such as investments in inverse floating rate securities and reverse repurchase agreements. The amount and sources of leverage will vary depending on market conditions.
Temporary Defensive Periods
During temporary defensive periods, the Fund may invest up to 100% of its assets in high quality, short-term securities, and in short-, intermediate-, or long-term U.S. Treasury securities. There can be no assurance that such techniques will be successful. Accordingly, during such periods, the Fund may not achieve its investment objectives.
114
NUVEEN PREFERRED SECURITIES & INCOME OPPORTUNITIES FUND (JPI)
Investment Objective
The Fund’s investment objective is to provide a high level of current income and total return.
Investment Policies
The Fund will invest at least 80% of its Assets (as defined below) in preferred securities and other income producing securities issued by U.S. and non‑U.S. companies, including debt securities, hybrid securities and convertible securities.
“Assets” mean the net assets of the Fund plus the amount of any borrowings for investment purposes. “Managed Assets” mean the total assets of the Fund, minus the sum of its accrued liabilities (other than Fund liabilities incurred for the express purpose of creating leverage). Total assets for this purpose shall include assets attributable to the Fund’s use of leverage (whether or not those assets are reflected in the Fund’s financial statements for purposes of generally accepted accounting principles), and derivatives will be valued at their market value.
Under normal circumstances:
| • | The Fund may invest up to 20% of its Managed Assets in securities issued by federal, state and local governments and U.S. government agencies. |
| • | The Fund invests at least 50% of its Managed Assets in securities rated investment grade (BBB‑/Baa3 or higher) at the time of purchase. A security is considered to have the highest rating assigned to it by a rating agency or, in the case of an unrated security, to have the same rating as rated securities judged by the Fund’s sub‑adviser to be of comparable quality. |
| • | The Fund may invest up to 10% of its Managed Assets in securities rated below B‑/B3 at the time of purchase. |
| • | The Fund may invest up to 10% of its Managed Assets in securities of issuers in emerging market countries. |
| • | The Fund will invest 100% of its Managed Assets in U.S. dollar denominated securities. |
| • | The Fund may invest up to 10% of its total assets in securities of other open- or closed‑end investment companies (including exchange- traded funds (“ETFs”)) that invest primarily in securities of the types in which the Fund may invest directly. |
The foregoing policies apply only at the time of any new investment.
Approving Changes in Investment Policies
The Board of Trustees of the Fund may change the policies described above without a shareholder vote. However, with respect to the Fund’s policy of investing at least 80% of its Assets in preferred securities and other income producing securities, such policy may not be changed without 60 days’ prior written notice.
Portfolio Contents
The Fund invests in preferred securities. The Fund may invest in all types of preferred securities, including both traditional preferred securities and non‑traditional preferred securities. Traditional preferred securities are generally equity securities of the issuer that have priority over the issuer’s common shares as to the payment of dividends (i.e., the issuer cannot pay dividends on its common shares until the dividends on the preferred shares are current) and as to the payout of proceeds of bankruptcy or other liquidation, but are subordinate to an issuer’s senior debt and junior debt as to both types of payments. Additionally, in a bankruptcy or other liquidation, traditional preferred shares are generally subordinate to an issuer’s trade creditors and other general obligations.
Traditional preferred securities pay a dividend, typically contingent both upon declaration by the issuer’s board and at times approval by regulators, and on the existence of current earnings (or retained earnings) in sufficient amount to source the payment. Dividend payments can be either cumulative or non‑cumulative and can be passed or deferred without limitation at the option of the issuer. Traditional preferred securities typically have no ordinary right to vote for the board of directors, except in some cases voting rights may arise if the issuer fails to pay the preferred share dividends. Traditional preferred securities may be perpetual, or have a term and typically have a fixed liquidation (or “par”) value.
While some preferred securities are issued with a final maturity date, others are perpetual in nature. In certain instances, a final maturity date may be extended and/or the final payment of principal may be deferred at the issuer’s option for a specified time without triggering an event of default for the issuer. No redemption can typically take place unless all cumulative payment obligations to preferred security investors have been met, although issuers may be able to engage in open-market repurchases without regard to any cumulative dividends or interest payable. A portion of the portfolio may include investments in non‑cumulative preferred securities, whereby the issuer does not have an obligation to make up any arrearages to holders of such securities. Should an issuer default on its obligations under such a security, the amount of income earned by the Fund may be adversely affected. Non‑traditional preferred securities include hybrid preferred securities, contingent convertible capital securities and other types of preferred securities that do not have the traditional features described above. Hybrid-preferred securities often behave similarly as investments in traditional preferred securities and are regarded by market investors as being part of the preferred securities market. Hybrid-preferred securities possess varying combinations of features of both debt and preferred shares and as such they may constitute senior debt, junior debt or preferred shares in an issuer’s capital structure. As such, hybrid-preferred securities may not be subordinate to a company’s debt securities (as are traditional
115
Shareholder Update (continued)
preferred shares). Given the various debt and equity characteristics of hybrid-preferred securities, whether a hybrid-preferred security is classified as debt or equity for purposes of reporting the Fund’s portfolio holdings may be based on the portfolio managers’ determination as to whether its debt or preferred features are preponderant, or based on the assessment of an independent data provider. Such determinations may be subjective.
Hybrid-preferred securities include trust preferred securities. Trust preferred securities are typically issued by corporations, generally in the form of interest-bearing notes with preferred securities characteristics, or by an affiliated business trust of a corporation, generally in the form of beneficial interests in subordinated debentures or similarly structured securities. The trust preferred securities market consists of both fixed and adjustable coupon rate securities that are either perpetual in nature or have stated maturity dates. Trust preferred securities may defer payment of income without triggering an event of default. These securities may have many characteristics of equity due to their subordinated position in an issuer’s capital structure. Trust preferred securities may be issued by trusts or other special purpose entities.
Preferred securities may also include certain forms of debt that have many characteristics of preferred shares, and that are regarded by the investment marketplace to be part of the broader preferred securities market. Among these “preferred securities” are certain exchange-listed debt issues that historically have several attributes, including trading and investment performance characteristics, in common with exchange-listed traditional preferred stock and hybrid-preferred securities. Generally, these types of “preferred securities” are senior debt or junior debt in the capital structure of an issuer.
Preferred securities generally pay fixed or adjustable rate dividends or interest to investors and have preference over common stock in the payment of dividends or interest and generally the liquidation of a company’s assets, which means that a company typically must pay dividends or interest on its preferred securities before paying any dividends on its common stock. As a general matter, dividend or interest payments on preferred securities may be cumulative or non‑cumulative. The dividend or interest rates on preferred securities may be fixed or floating, or convert from fixed to floating at a specified future time; the Fund may invest without limit in such floating-rate and fixed‑to‑floating rate preferred securities. Floating- rate and fixed‑to‑floating rate preferred securities may be traditional preferred or hybrid-preferred securities. Floating-rate preferred securities pay a rate of income that resets periodically based on short- and/or longer-term interest rate benchmarks. If the associated interest rate benchmark rises, the income received from the security may increase and therefore the return offered by the floating-rate security may rise as well, making such securities less price sensitive to rising interest rates (or yields). Similarly, a fixed‑to‑floating rate security may be less price sensitive to rising interest rates (or yields), because the period over which the rate of payment is fixed is shorter than the maturity term of the bond, after which period a floating rate of payment applies. On the other hand, preferred securities are junior to most other forms of the company’s debt, including both senior and subordinated debt. Because of their subordinated position in the capital structure of an issuer, the ability to defer dividend or interest payments for extended periods of time without triggering an event of default for the issuer, and certain other features, preferred securities may have, at times, risks similar to equity instruments. The Fund’s portfolio of preferred securities may consist of fixed rate preferred and adjustable rate preferred securities.
The preferred securities market continues to evolve. New securities may be developed that may be regarded by market investors as being part of the preferred securities market. Where such securities will fall in the capital structure of the issuer will depend on the structure and characteristics of the new security. For purposes of the Fund’s policy of investing at least 80% of its Assets in preferred securities and other income producing securities, the Fund considers all of the foregoing types of securities that are commonly viewed in the marketplace as preferred securities to be preferred securities, regardless of their classification in the capital structure of the issuer.
Preferred securities are typically issued by corporations, generally in the form of interest or dividend bearing instruments, or by an affiliated business trust of a corporation, generally in the form of beneficial interests in subordinated debentures or similarly structured securities. Preferred securities may either trade over‑the‑counter, or trade on an exchange. The preferred securities market is generally divided into the $25 par “retail” and the $1,000 par “institutional” segments. The $25 par segment is typified by securities that are listed on the NYSE, which trade and are quoted with accrued dividend or interest income, and which are often callable. The institutional segment is typified by $1,000 par value securities that are not exchange-listed. The Fund may invest in preferred securities of either segment.
The Fund may invest in contingent capital securities. Contingent capital securities (sometimes referred to as “CoCos”) are securities issued primarily by non‑U.S. financial institutions. Specific CoCo structures vary by country of domicile and by each issue. All CoCos have mechanisms that absorb losses or reduces the value of the CoCo due to deterioration of the issuer’s financial condition and status as a going concern. Loss absorption mechanisms, which may include conversion into common equity and principal write-down, are intended for the benefit of the issuer and when triggered will likely negatively impact the value of the CoCo to the detriment of the CoCo investor. Loss absorption mechanisms can be triggered by capital levels or market value metrics of the issuers dropping below a certain predetermined level or at the discretion of the issuer regulator/ supervisory entity. Unlike traditional convertible securities, the conversion is not voluntary and the equity conversion or principal write-down features are tailored to the issuer and its regulatory requirements. Due to increased regulatory requirements for higher capital levels for financial institutions, the issuance of CoCo instruments has increased in the last several years and is expected to continue.
The Fund may invest in taxable municipal bonds. States, local governments and municipalities issue municipal bonds to raise money for certain purposes. Municipal bonds issued to finance activities with a broad public purpose are generally exempt from federal income tax. Taxable municipal bonds, however, are issued to finance activities with less significant benefits to the public, such as the construction of sports facilities, and as such the interest paid to holders of such bonds is taxable as ordinary income. Many taxable municipal bonds offer yields comparable to those of other taxable bonds, such as corporate and agency bonds. Taxable municipal bonds may be rated investment-grade or below investment-grade and pay interest based on fixed or floating rate coupons. Maturities may range from long-term to short-term.
The Fund may invest in high yield bonds. Bonds that are rated lower than investment grade are commonly referred to as high yield bonds or junk bonds. These bonds generally provide high income in an effort to compensate investors for their higher risk of default, which is the failure to make required interest or principal payments. High yield bond issuers include small or relatively new companies lacking the history or capital to merit investment-grade status, former blue chip companies downgraded because of financial problems, companies electing to borrow heavily to finance or avoid a takeover or buyout, and firms with heavy debt loads.
116
The Fund may invest in U.S. Government securities. U.S. Government securities include (1) U.S. Treasury obligations, which differ in their interest rates, maturities and times of issuance: U.S. Treasury bills (maturities of one year or less), U.S. Treasury notes (maturities of one year to ten years) and U.S. Treasury bonds (generally maturities of greater than ten years) and (2) obligations issued or guaranteed by U.S. Government agencies and instrumentalities that are supported by any of the following: (i) the full faith and credit of the U.S. Treasury, (ii) the right of the issuer to borrow an amount limited to a specific line of credit from the U.S. Treasury, (iii) discretionary authority of the U.S. Government to purchase certain obligations of the U.S. Government agency or instrumentality or (iv) the credit of the agency or instrumentality.
The Fund will invest in securities of companies primarily engaged in the financial services industry. A financial services company is one that is primarily involved in banking, mortgage finance, consumer finance, specialized finance, investment banking and brokerage, asset management and custody, corporate lending, insurance, financial instruments or real estate, including business development companies (“BDCs”) and real estate investment trusts (“REITs”).
The Fund may invest in other equity securities, including common stock, convertible securities, hybrid securities (which have characteristics of both equity and fixed-income instruments), warrants, rights and depositary receipts (which reference ownership of underlying non‑U.S. securities).
The Fund may invest in corporate debt securities. Corporate debt securities are fully taxable debt obligations issued by corporations. These securities fund capital improvements, expansions, debt refinancing or acquisitions that require more capital than would ordinarily be available from a single lender. Investors in corporate debt securities lend money to the issuing corporation in exchange for interest payments and repayment of the principal at a set maturity date. Rates on corporate debt securities are set according to prevailing interest rates at the time of the issue, the credit rating of the issuer, the length of the maturity and other terms of the security, such as a call feature. Corporate debt securities are subject to the risk of an issuer’s inability to meet principal and interest payments on the obligations and may also be subject to price volatility due to such factors as market interest rates, market perception of the creditworthiness of the issuer and general market liquidity. In addition, corporate restructurings, such as mergers, leveraged buyouts, takeovers or similar corporate transactions are often financed by an increase in a corporate issuer’s indebtedness. As a result of the added debt burden, the credit quality and market value of an issuer’s existing debt securities may decline significantly.
The Fund may invest in convertible securities. Convertible securities are hybrid securities that combine the investment characteristics of bonds and common stocks. Convertible securities typically consist of debt securities or preferred securities that may be converted within a specified period of time (typically for the entire life of the security) into a certain amount of common stock or other equity security of the same or a different issuer at a predetermined price. They also include debt securities with warrants or common stock attached and derivatives combining features of debt securities and equity securities. Convertible securities entitle the holder to receive interest paid or accrued on debt securities, or dividends paid or accrued on preferred securities, until the securities mature or are redeemed, converted or exchanged.
Before conversion, convertible securities have characteristics similar to nonconvertible income securities in that they ordinarily provide a stable stream of income with generally higher yields than those of common stocks of the same or similar issuers, but lower yields than comparable nonconvertible securities. The value of a convertible security is influenced by changes in interest rates, with investment value generally declining as interest rates increase and increasing as interest rates decline. The credit standing of the issuer and other factors also may have an effect on the convertible security’s investment value. Convertible securities are subordinate in rank to any senior debt obligations of the same issuer and, therefore, an issuer’s convertible securities entail more risk than its debt obligations.
The Fund may invest in REITs. REITs are typically publicly traded corporations or trusts that invest in residential or commercial real estate. REITs generally can be divided into the following three types: (i) equity REITs which invest the majority of their assets directly in real property and derive their income primarily from rents and capital gains or real estate appreciation; (ii) mortgage REITs which invest the majority of their assets in real estate mortgage loans and derive their income primarily from interest payments; and (iii) hybrid REITs which combine the characteristics of equity REITs and mortgage REITs. The Fund can invest in common stock, preferred securities, debt securities and convertible securities issued by REITs.
The Fund may invest in securities of foreign issuers through the direct investment in securities of such companies and through depositary receipts. For purposes of identifying foreign issuers, the Fund will use Bloomberg classifications, which employ the following factors listed in order of importance: (i) the country in which the company’s management is located, (ii) the country in which the company’s securities are primarily listed, (iii) the country from which the company primarily receives revenue and (iv) the company’s reporting currency. The Fund may purchase depositary receipts such as American Depositary Receipts (“ADRs”), European Depositary Receipts and Global Depositary Receipts (“GDRs”). ADRs, EDRs and GDRs are certificates evidencing ownership of shares of foreign issuers and are alternatives to purchasing directly the underlying foreign securities in their national markets and currencies.
The Fund may invest in securities of emerging markets issuers. Emerging markets issuers are those (i) whose securities are traded principally on a stock exchange or over‑the‑counter in an emerging market country, (ii) organized under the laws of an emerging market country or (iii) whose principal place of business or principal office(s) is in an emerging market country. Emerging market countries include any country other than Canada, the United States and the countries comprising the MSCI EAFE® Index (currently, Australia, Austria, Belgium, Denmark, Finland, France, Germany, Hong Kong, Ireland, Israel, Italy, Japan, Netherlands, New Zealand, Norway, Portugal, Singapore, Spain, Sweden, Switzerland and the United Kingdom).
The Fund may invest in zero coupon bonds. A zero coupon bond is a bond that typically does not pay interest for the entire life of the obligation or for an initial period after the issuance of the obligation.
The Fund may buy and sell securities on a when-issued or delayed delivery basis, making payment or taking delivery at a later date, normally within 15 to 45 days of the trade date.
117
Shareholder Update (continued)
The Fund may invest in illiquid securities (i.e., securities that are not readily marketable), including, but not limited to, restricted securities (securities the disposition of which is restricted under the federal securities laws), securities that may be resold only pursuant to Rule 144A under the 1933 Act, and repurchase agreements with maturities in excess of seven days. Illiquid securities may also include securities legally restricted as to resale, such as securities issued pursuant to Section 4(a)(2) of the 1933 Act.
The Fund also may invest in certain derivative instruments in pursuit of its investment objective. Such instruments may include financial futures contracts, swap contracts (including interest rate and credit default swaps), options on financial futures, options on swap contracts, or other derivative instruments. The Fund may use derivative instruments to, among other things, seek to enhance return, to hedge some of the risk of the Fund’s investments or as a substitute for a position in the underlying asset.
The Fund may also invest in securities of other open- or closed‑end investment companies (including ETFs) that invest primarily in the types in which the Fund may invest directly, to the extent permitted by the Investment Company Act of 1940, as amended (the “1940 Act”) and the rules and regulations issued thereunder.
Use of Leverage
The Fund uses leverage to pursue its investment objective. The Fund may use leverage to the extent permitted by the 1940 Act. The Fund’s use of leverage will not exceed 38% of Managed Assets. The Fund may source leverage through a number of methods including through borrowings, issuing Preferred Shares and the issuance of debt securities. In addition, the Fund may use derivatives that may have the economic effect of leverage. The amount and sources of leverage will vary depending on market conditions.
Temporary Defensive Periods
During temporary defensive periods, the Fund may invest up to 100% of its assets in high quality, short-term securities, and in short-, intermediate-, or long-term U.S. Treasury securities. There can be no assurance that such techniques will be successful. Accordingly, during such periods, the Fund may not achieve its investment objective.
118
NUVEEN VARIABLE RATE PREFERRED & INCOME FUND (NPFD)
Investment Objective
The Fund’s investment objective is to provide a high level of current income and total return.
Investment Policies
The Fund will invest at least 80% of its Assets (as defined below) in variable rate preferred securities and other variable rate income producing securities. “Assets” mean the net assets of the Fund plus the amount of any borrowings for investment purposes. “Managed Assets” mean the total assets of the Fund, minus the sum of its accrued liabilities (other than Fund liabilities incurred for the express purpose of creating leverage). Total assets for this purpose shall include assets attributable to the Fund’s use of leverage (whether or not those assets are reflected in the Fund’s financial statements for purposes of generally accepted accounting principles), and derivatives will be valued at their market value.
Under normal circumstances:
| • | The Fund will invest at least 50% of its Managed Assets in securities that are rated investment grade or are unrated but judged to be of comparable quality by the Fund’s sub‑adviser. |
| • | The Fund may invest up to 20% of its Managed Assets in contingent capital securities or contingent convertible securities (sometimes referred to as “CoCos”). |
| • | The Fund may invest up to 15% of its Managed Assets in companies located in emerging market countries. |
| • | The Fund will only invest in U.S. dollar denominated securities. |
| • | The Fund will invest more than 25% of its Managed Assets in the securities of companies principally engaged in the financial services sector. |
The foregoing policies apply only at the time of any new investment.
Approving Changes in Investment Policies
The Fund cannot change its fundamental policies without the approval of the holders of a “majority of the outstanding” Common Shares. When used with respect to particular shares of the Fund, a “majority of the outstanding” shares means (i) 67% or more of the shares present at a meeting, if the holders of more than 50% of the shares are present or represented by proxy or (ii) more than 50% of the shares, whichever is less.
Portfolio Contents
The Fund generally invests in variable rate preferred securities and other variable rate income producing securities. The Fund may also invest to a lesser extent in fixed income securities, of any type, including contingent capital securities or contingent convertible securities (sometimes referred to as “CoCos”), convertible securities, corporate debt securities, U.S. government securities (securities issued or guaranteed by the U.S. government or its agencies or instrumentalities), residential and commercial mortgage-backed securities, fixed-rate preferred securities, senior loans and loan participations and assignments, sovereign debt instruments, debt securities issued by supranational agencies, and taxable and tax‑exempt municipal bonds.
The Fund invests in preferred securities. The Fund may invest in all types of preferred securities, including both perpetual preferred securities and hybrid securities. Perpetual preferred securities are generally equity securities of the issuer that have priority over the issuer’s common shares as to the payment of dividends (i.e., the issuer cannot pay dividends on its common shares until the dividends on the preferred shares are current) and as to the payout of proceeds of a bankruptcy or other liquidation, but are subordinate to an issuer’s senior debt and junior debt as to both types of payments. Additionally, in a bankruptcy or other liquidation, perpetual preferred securities are generally subordinate to an issuer’s trade creditors and other general obligations. Perpetual preferred securities typically have a fixed liquidation (or “par”) value.
The term “preferred securities” also includes hybrid securities and other types of preferred securities that do not have the features described above. Preferred securities that are hybrid securities often behave similarly to investments in perpetual preferred securities and are regarded by market investors as being part of the preferred securities market. Such hybrid securities possess varying combinations of features of both debt and perpetual preferred securities and as such they may constitute senior debt, junior debt or preferred shares in an issuer’s capital structure.
The term “preferred securities” also includes certain forms of debt that are regarded by the investment marketplace to be part of the broader preferred securities market. Among these preferred securities are certain exchange-listed debt issues that historically have several attributes, including trading and investment performance characteristics, in common with exchange-listed perpetual preferred securities and hybrid securities. Generally, these types of preferred securities are senior debt in the capital structure of an issuer.
As a general matter, dividend or interest payments on preferred securities may be cumulative or non‑cumulative and may be deferred (in the case of cumulative payments) or skipped (in the case of non‑cumulative payments) at the option of the issuer.
Generally, preferred security holders have no voting rights with respect to the issuing company, except in some cases voting rights may arise if the issuer fails to pay the preferred share dividends or if a declaration of default occurs and is continuing.
119
Shareholder Update (continued)
Preferred securities may either trade over‑the‑counter (“OTC”) or trade on an exchange. Preferred securities can be structured differently for retail and institutional investors, and the Fund may invest in preferred securities of either structure. The retail segment is typified by $25 par value exchange-traded securities, which trade on exchanges such as the NYSE and the institutional segment is typified by $1,000 par value OTC securities. Typically, most $25 par value exchange-traded securities have fixed-rate coupon structures, while the institutional segment of $1,000 par securities are variable-rate securities. Both $25 and $1,000 par value securities are often callable at par value, typically at least five years after their original issuance date (i.e., the issuer has the right to call in or redeem the preferred security at a pre‑set price after a specified date).
The Fund’s investments in preferred securities may include convertible preferred securities, which are hybrid securities that combine the investment characteristics of bonds and common stocks. Convertible preferred securities typically consist of preferred securities that may be converted within a specified period of time (typically for the entire life of the security) into a certain amount of common stock or other equity security of the same or a different issuer. Convertible preferred securities entitle the holder to receive interest or dividends paid or accrued on preferred securities until the securities mature or are redeemed, converted or exchanged.
The Fund may also invest in contingent capital securities or contingent convertible securities (sometimes referred to as “CoCos”). CoCos are hybrid securities created by regulators after the 2007‑08 global financial crisis as a way to reduce the likelihood of government-orchestrated bailouts. CoCos are designed to automatically absorb losses, thereby helping the issuing bank satisfy regulatory capital requirements. CoCos are not preferred securities. CoCos are primarily issued by European financial institutions to help fulfill their capital requirements, while U.S. banks issue preferred stock. Because CoCos and preferred stock play nearly identical roles and rank similarly within an issuer’s capital structure, CoCos are commonly held in strategies that invest in preferred securities.
The “contingent” nature of the security is due to a feature that automatically imposes a loss on the investor should an issuer’s capital fall below a predetermined threshold. When this occurs, depending on the structure, there are three possible outcomes:
| • | The security is converted to common equity; |
| • | The investor is forced to assume a temporary writedown of the security’s value; and |
| • | The investor is forced to assume a permanent writedown of the security’s value. |
Equity conversion or principal write-down features are tailored to the issuer and its regulatory requirements and, unlike traditional convertible securities, conversions are not voluntary and are not intended to benefit the investor.
The Fund may invest in corporate debt securities issued by companies of all kinds, including those with small-, mid‑ and large capitalizations. Corporate debt securities are fixed income securities issued by businesses to finance their operations. Notes, bonds, debentures and commercial paper are the most common types of corporate debt securities, with the primary difference being their maturities and secured or unsecured status. Commercial paper has the shortest term and is usually unsecured. Corporate debt securities may be rated investment-grade or below investment- grade and may carry fixed or floating rates of interest.
The Fund may invest in U.S. dollar-denominated securities of non‑U.S. issuers traded over the counter or listed on an exchange. The Fund will classify an issuer of a security as being a U.S. or non‑U.S. issuer based on the determination of an unaffiliated, recognized financial data provider. Such determinations are based on a number of criteria, such as the issuer’s country of domicile, the primary exchange on which the security trades, the location from which the majority of the issuer’s revenue comes, and the issuer’s reporting currency.
The Fund may invest in common stocks which generally represents an equity ownership interest in an issuer. Additional types of equity securities (other than preferred securities) in which the Fund may invest include convertible securities (discussed below), REITs, warrants, rights and depositary receipts (which reference ownership of underlying non‑U.S. securities). The Fund’s equity investments also may include securities of other investment companies (including open‑end funds, closed‑end funds and exchange-traded funds (“ETFs”)).
The Fund may invest in U.S. government securities, including U.S. Treasury obligations and securities issued or guaranteed by various agencies of the U.S. government, or by various instrumentalities which have been established or sponsored by the U.S. government. U.S. Treasury obligations are backed by the “full faith and credit” of the U.S. government. Securities issued or guaranteed by federal agencies and U.S. government sponsored instrumentalities may or may not be backed by the full faith and credit of the U.S. government.
The Fund may invest in mortgage-backed securities (“MBS”). A MBS (“MBS”) is a type of pass-through security, which is a security representing pooled debt obligations repackaged as interests that pass income through an intermediary to investors. In the case of mortgage-backed securities, the ownership interest is in a pool of mortgage loans. Commercial mortgage-backed securities (“CMBS”) are backed by a pool of mortgages on commercial property.
The Fund may invest in asset-backed securities (“ABS”). ABS are securities that are primarily serviced by the cash flows of a discrete pool of receivables or other financial assets, either fixed or revolving, that by their terms convert into cash within a finite time period. Asset-backed securitization is a financing technique in which financial assets, in many cases themselves less liquid, are pooled and converted into instruments that may be offered and sold in the capital markets. In a basic securitization structure, an entity, often a financial institution, originates or otherwise acquires a pool of financial assets, either directly or through an affiliate. It then sells the financial assets, again either directly or through an affiliate, to a specially created investment vehicle that issues securities “backed” or supported by those financial assets, which securities are ABS. Payment on the ABS depends primarily on the cash flows generated by the assets in the underlying pool and other rights designed to assure timely payment, such as liquidity facilities, guarantees or other features generally known as credit enhancements.
The Fund may invest in loans, including senior secured loans, unsecured and/or subordinated loans, loan participations, unfunded contracts and assignments. These loans are typically made by or issued to corporations primarily to finance acquisitions, refinance existing debt, support organic growth, or pay out dividends, and are typically originated by large banks and are then syndicated out to institutional investors as well as to other
120
banks. The loans that the Fund invests typically bear interest at a floating rate, although some loans may pay a fixed rate. Floating rate loans have interest rates that reset periodically, typically monthly or quarterly. The interest rates on floating rate loans are generally based on a percentage above the Secured Overnight Financing Rate (“SOFR”), a U.S. bank’s prime or base rate, the overnight federal funds rate or another rate. Unfunded commitments are contractual obligations by lenders (such as the Fund) to loan an amount in the future or that is due to be contractually funded in the future. Assignments may be arranged through private negotiations between potential assignees and potential assignors, and the rights and obligations acquired by the purchaser of an assignment may differ from, and be more limited than, those held by the assigning lender.
Loans may have restrictive covenants limiting the ability of a borrower to further encumber its assets. The types of covenants included in loan agreements generally vary depending on market conditions, the creditworthiness of the borrower, the nature of the collateral securing the loan and other factors. Such restrictive covenants normally allow for early intervention and proactive mitigation of credit risk by providing lenders with the ability to (1) intervene and either prevent or restrict actions that may potentially compromise the borrower’s ability to repay the loan and/or (2) obtain concessions from the borrower in exchange for waiving or amending a particular covenant. Loans with fewer or weaker restrictive covenants may limit the Fund’s ability to intervene or obtain additional concessions from borrowers. Certain loans in which the Fund invests may be “covenant-lite.” “Covenant-lite” loans refer generally to loans that do not have a complete set of financial maintenance covenants. Generally, “covenant-lite” loans are incurrence-based, which means they are only tested and can only be breached following an affirmative action of the borrower, rather than by a deterioration in the borrower’s financial condition.
The Fund may invest in sovereign securities. Sovereign securities are issued or guaranteed by foreign sovereign governments or their agencies, authorities, political subdivisions or instrumentalities, and supranational agencies. A supranational agency is a multinational union or association in which member countries cede authority and sovereignty on a limited number of matters to the group, whose decisions are binding upon its members. Quasi-sovereign securities typically are issued by companies or agencies that may receive financial support or backing from a local government or in which the government owns a majority of the issuer’s voting shares.
The ability of a foreign sovereign issuer, especially in an emerging market country, to make timely and ultimate payments on its debt obligations will be strongly influenced by the sovereign issuer’s balance of payments, including export performance, its access to international credits and investments, fluctuations of interest rate and the extent of its foreign reserves. A country whose exports are concentrated in a few commodities or whose economy depends on certain strategic imports could be vulnerable to fluctuations in international prices of these commodities or imports. To the extent that a country receives payment for its export in currencies other than dollars, its ability to make debt payments denominated in dollars could be adversely affected. If a sovereign issuer cannot generate sufficient earnings from foreign trade to service its external debt, it may need to depend on continuing loans and aid from foreign governments, commercial banks and multinational organizations. There may be no bankruptcy proceedings similar to those in the U.S. by which defaulted interest may be collected.
The Fund may invest in taxable and tax‑exempt municipal securities, including municipal bonds, and notes and other securities issued by states, cities and local authorities and certain possessions and territories of the United States (such as Puerto Rico and Guam) to finance or refinance public purpose projects such as roads, schools, and water supply systems. Municipal bonds may also be issued to finance and refinance privately owned facilities or projects deemed to serve a public purpose. Municipal bonds may be issued on a long-term basis to provide long-term financing. The repayment of such debt may be secured generally by a pledge of the full faith and credit taxing power of the issuer, a limited or special tax, or any other revenue source, including project revenue. Municipal bonds may also be issued to finance projects on a short-term interim basis, anticipating repayment with the proceeds of long-term debt.
The Fund’s portfolio may contain restricted and illiquid investments, including, but not limited to, restricted investments (investments the disposition of which is restricted under the federal securities laws), investments that may be resold only pursuant to Rule 144A under the 1933 Act that are deemed to be illiquid, and certain repurchase agreements. Restricted investments may be sold only in privately negotiated transactions or in a public offering with respect to which a registration statement is in effect under the 1933 Act.
The Fund may buy and sell securities on a when-issued or delayed delivery basis, making payment or taking delivery at a later date, normally within 15 to 45 days of the trade date.
The Fund may invest in securities of other open‑end or closed‑end investment companies, including ETFs, that invest primarily in the types of investments in which the Fund may invest directly, to the extent permitted by the Investment Company Act of 1940, as amended (the “1940 Act”) and the rules and regulations issued thereunder.
The Fund may invest without limitation in credit default swaps, and may enter into credit default swaps as either a buyer or a seller.
In addition to credit default swaps, the Fund also may invest in certain derivative instruments in pursuit of its investment objective. Such instruments include financial futures contracts and options thereon, forward contracts, swaps (with varying terms, including interest rate swaps), options on swaps and other derivative instruments. The Fund’s sub‑adviser may use derivative instruments to attempt to hedge some of the risk of the Fund’s investments or as a substitute for a position in the underlying asset.
Use of Leverage
The Fund may source leverage through the issuance of “senior securities” as defined under the 1940 Act, which include (1) borrowings, including loans from financial institutions; (2) issuance of debt securities; and (3) issuance of preferred shares of beneficial interest (“Preferred Shares”). Additionally, the Fund may use certain derivatives and other financing investments that have the economic effect of leverage by creating additional investment exposures, such as investments in inverse floating rate securities and reverse repurchase agreements. The amount and sources of leverage will vary depending on market conditions.
| 121 |
Shareholder Update (continued)
Temporary Defensive Periods
During temporary defensive periods, the period in which the net proceeds of this offering of Common Shares are first being invested (the “invest‑up period”), the “wind‑up” period (the approximately six month period during which the Fund is transitioning its portfolio as the Fund’s Termination Date approaches) or the period in which the Fund’s assets are being liquidated in anticipation of the Fund’s termination, the Fund may deviate from its investment policies and objective. During such periods, the Fund may invest up to 100% of its Managed Assets in cash, short-term investments, including high quality, short-term securities or may invest in short-, intermediate-, or long-term U.S. Treasury securities. During the invest‑up period, the Fund may also purchase securities issued by ETFs that invest primarily in investments of the types in which the Fund may invest directly. Any such investments in ETFs will be in compliance with the limitations imposed by the 1940 Act, the rules promulgated thereunder, or pursuant to any exemptive relief obtained thereunder. There can be no assurance that such techniques will be successful. Accordingly, during such periods, the Fund may not achieve its investment objective.
122
PRINCIPAL RISKS OF THE FUNDS
The factors that are most likely to have a material effect on a particular Fund’s portfolio as a whole are called “principal risks.” Each Fund is subject to the principal risks indicated below, whether through direct investment or derivative positions. Each Fund may be subject to additional risks other than those identified and described below because the types of investments made by a Fund can change over time.
| Risk | JFR | JQC | JPC | JPI | NPFD | |||||
| Portfolio Level Risks | ||||||||||
| Basis Risk | X | X | - | - | - | |||||
| Below Investment Grade Risk | X | X | X | X | X | |||||
| Call Risk | X | X | X | X | X | |||||
| Collateralized Debt Obligation (“CDO”) and Collateralized Loan Obligation (“CLO”) Risk | X | X | - | - | - | |||||
| Common Stock Risk | - | X | X | X | X | |||||
| Concentration and Financial Services Industry Risk | - | - | X | X | X | |||||
| Contingent Capital Securities (“CoCos”) Risk | - | X | X | X | X | |||||
| Convertible Securities Risk | - | X | X | X | X | |||||
| Credit Risk | X | X | X | X | X | |||||
| Credit Spread Risk | X | X | X | X | X | |||||
| Debt Securities Risk | X | X | X | X | X | |||||
| Debtor‑In‑Possession (“DIP”) Financing Risk | X | X | - | - | - | |||||
| Deflation Risk | X | X | X | X | X | |||||
| Depositary Receipts Risk | X | - | X | X | X | |||||
| Derivatives Risk | X | X | X | X | X | |||||
| Duration Risk | X | X | X | X | X | |||||
| Equity Securities Risk | X | X | X | X | X | |||||
| Financial Futures and Options Transactions Risk | X | X | X | X | X | |||||
| Floating-Rate and Fixed‑to‑Floating Rate Securities Risk | X | X | X | X | - | |||||
| Foreign Currency Risk | X | X | X | - | - | |||||
| Foreign/Emerging Markets Issuer Risk | X | X | X | X | X | |||||
| Hedging Risk | X | X | X | X | X | |||||
| Income Risk | X | X | X | X | X | |||||
| Inflation Risk | X | X | X | X | X | |||||
| Inflation Correlation Risk | X | X | X | X | X | |||||
| Interest Rate Risk | X | X | X | X | X | |||||
| Inverse Floating Rate Securities Risk | - | X | - | - | X | |||||
| Loan Participation Risk | X | X | - | - | X | |||||
| Loan Risk | X | X | - | - | X | |||||
| Mortgage-Backed Securities (“MBS”) and Asset-Backed Securities (“ABS”) Risk | X | X | - | - | X | |||||
| Municipal Securities Risk | - | - | X | X | X | |||||
| Municipal Securities Market Liquidity Risk | - | - | X | X | X | |||||
| Municipal Securities Market Risk | - | - | X | X | X | |||||
| Other Investment Companies Risk | X | X | X | X | X | |||||
| Preferred and Hybrid Preferred Securities Risk | - | X | X | X | X | |||||
123
Shareholder Update (continued)
| Risk | JFR | JQC | JPC | JPI | NPFD | |||||
| Portfolio Level Risks | ||||||||||
| Real Estate Investment Trust Risk | - | - | X | X | - | |||||
| Reinvestment Risk | X | X | X | X | X | |||||
| Restricted and Illiquid Investments Risk | X | X | X | X | X | |||||
| Second Lien Loans and Unsecured Loans Risk | X | X | - | - | X | |||||
| Senior Loan Agent Risk | X | X | - | - | X | |||||
| Senior Loan Risk | X | X | - | - | X | |||||
| Structured Products Risk | X | X | - | - | - | |||||
| Sovereign Government and Supranational Debt Risk | X | - | - | - | X | |||||
| Subordinated Loans and Other Subordinated Debt Instruments Risk | X | X | - | - | X | |||||
| Swap Transactions Risk | X | X | X | X | X | |||||
| Unrated Securities Risk | X | X | X | X | X | |||||
| U.S. Government Securities Risk | X | X | X | X | X | |||||
| Valuation Risk | X | X | X | X | X | |||||
| Warrants and Equity Securities Risk | X | X | X | X | X | |||||
| When-Issued and Delayed-Delivery Transactions | X | X | X | X | X | |||||
| Zero Coupon Bonds or Pay‑In‑Kind Securities Risk | X | X | X | X | - | |||||
| Fund Level and Other Risks | JFR | JQC | JPC | JPI | NPFD | |||||
| Anti-Takeover Provisions | X | X | X | X | X | |||||
| Borrowing Risk | X | X | X | X | X | |||||
| Counterparty Risk | X | X | X | X | X | |||||
| Cybersecurity Risk | X | X | X | X | X | |||||
| Fund Tax Risk | X | X | X | X | X | |||||
| Global Economic Risk | X | X | X | X | X | |||||
| Investment and Market Risk | X | X | X | X | X | |||||
| Legislation and Regulatory Risk | X | X | X | X | X | |||||
| Leverage Risk | X | X | X | X | X | |||||
| Limited Term Risk | - | - | - | - | X | |||||
| Market Discount from Net Asset Value | X | X | X | X | X | |||||
| Recent Market Conditions | X | X | X | X | X | |||||
| Reverse Repurchase Agreement Risk | X | X | X | X | X | |||||
Portfolio Level Risks:
Basis Risk. As short-term rates change, interest income from floating rate loans may not increase in concert with increases in the costs of floating rate leverage or other borrowings, introducing basis or imperfect hedging risk.
Below Investment Grade Risk. Investments of below investment grade quality are regarded as having speculative characteristics with respect to the issuer’s capacity to pay dividends or interest and repay principal, and may be subject to higher price volatility and default risk than investment grade investments of comparable terms and duration. Issuers of lower grade investments may be highly leveraged and may not have available to them more traditional methods of financing. The prices of these lower grade investments are typically more sensitive to negative developments, such as a decline in the issuer’s revenues or a general economic downturn. The secondary market for lower rated investments may not be as liquid as the secondary market for more highly rated investments, a factor which may have an adverse effect on the Fund’s ability to dispose of a particular investment. If a below investment grade security goes into default, or its issuer enters bankruptcy, it might be difficult to sell that security in a timely manner at a reasonable price.
If a below investment grade investment goes into default, or its issuer enters bankruptcy, it might be difficult to sell that investment in a timely manner at a reasonable price.
124
Call Risk. The Fund may invest in securities that are subject to call risk. Such securities may be redeemed at the option of the issuer, or “called,” before their stated maturity or redemption date. In general, an issuer will call its instruments if they can be refinanced by issuing new instruments that bear a lower interest rate. The Fund is subject to the possibility that during periods of falling interest rates, an issuer will call its high yielding securities. The Fund would then be forced to invest the unanticipated proceeds at lower interest rates, resulting in a decline in the Fund’s income.
Collateralized Debt Obligation (“CDO”) Risk. The risks of an investment in CDOs, including CLOs, depend largely on the type of the collateral securities and the class of the CDO in which the Fund invests. In addition to the normal risks associated with fixed-income investments, CDOs and CLOs carry additional risks including, but not limited to, the risk that: (1) distributions from collateral assets may not be adequate to make interest or other payments; (2) the quality of the collateral may decline in value or default; (3) the fact that the CDOs or CLOs may be subordinate to other classes; and (4) the complex structure of the investment may not be fully understood at the time of investment and may produce disputes with the issuer or unexpected investment results. CDOs and CLOs may also charge management and other administrative fees, which are in addition to those charged by the Fund.
Common Stock Risk. Common stocks have experienced significantly more volatility in returns and may significantly underperform relative to fixed- income securities during certain periods. An adverse event, such as an unfavorable earnings report, may depress the value of a particular common stock held by the Fund. Also, the prices of common stocks are sensitive to general movements in the stock market, and a drop in the stock market may depress the price of common stocks to which the Fund has exposure. Common stock prices fluctuate for several reasons, including changes in investors’ perceptions of the financial condition of an issuer, the general condition of the relevant stock market or the current and expected future conditions of the broader economy, or when political or economic events affecting the issuer in particular or the stock market in general occur. In addition, common stock prices may be particularly sensitive to rising interest rates, as the cost of capital rises and borrowing costs increase.
Concentration and Financial Services Industry Risk. The preferred securities market is comprised predominantly of securities issued by companies in the financial services industry. Therefore, preferred securities present substantially increased risks at times of financial turmoil, which could affect financial services companies more than companies in other sectors and industries. The Fund’s investment in securities issued by financial services companies makes the Fund more susceptible to adverse economic or regulatory occurrences affecting those companies. Concentration of investments in financial services companies includes the following risks:
| • | financial services companies may suffer a setback if regulators change the rules under which they operate, which may increase costs for or limit the ability to offer new services or products and make it difficult to pass increased costs on to consumers; |
| • | unstable interest rates can have a disproportionate effect on the financial services industry; |
| • | financial services companies whose securities the Fund may purchase may themselves have concentrated portfolios, such as a high level of loans to real estate developers, which makes them vulnerable to economic conditions that affect that industry; and |
| • | financial services companies have been affected by increased competition, which could adversely affect the profitability or viability of such companies. |
The profitability of many types of financial services companies may be adversely affected in certain market cycles, including periods of rising interest rates, which may restrict the availability and increase the cost of capital, and declining economic conditions, which may cause credit losses due to financial difficulties of borrowers. Because many types of financial services companies are especially vulnerable to these economic cycles, the Fund’s investments in these companies may lose significant value during such periods.
Contingent Capital Securities (“CoCos”) Risk. A loss absorption mechanism trigger event for CoCos would likely be the result of, or related to, the deterioration of the issuer’s financial condition (e.g., a decrease in the issuer’s capital ratio) and status as a going concern. In such a case, with respect to CoCos that provide for conversion into common stock upon the occurrence of the trigger event, the market price of the issuer’s common stock received by the Fund will have likely declined, perhaps substantially, and may continue to decline, which may adversely affect the Fund’s NAV. Further, the issuer’s common stock would be subordinate to the issuer’s other classes of securities and therefore would worsen the Fund’s standing in a bankruptcy proceeding. In addition, because the common stock of the issuer may not pay a dividend, investors in these instruments could experience a reduced income rate, potentially to zero. In view of the foregoing, CoCos are often rated below investment grade and are subject to the risks of below investment grade securities.
CoCos may be subject to an automatic write-down (i.e., the automatic write-down of the principal amount or value of the securities, potentially to zero, and the cancellation of the securities) under certain circumstances, which could result in the Fund losing a portion or all of its investment in such securities. In addition, the Fund may not have any rights with respect to repayment of the principal amount of the securities that has not become due or the payment of interest or dividends on such securities for any period from (and including) the interest or dividend payment date falling immediately prior to the occurrence of such automatic write-down. An automatic write-down could also result in a reduced income rate if the dividend or interest payment is based on the security’s par value. Coupon payments on CoCos may be discretionary and may be cancelled by the issuer for any reason or may be subject to approval by the issuer’s regulator and may be suspended in the event there are insufficient distributable reserves.
In certain scenarios, investors in CoCos may suffer a loss of capital ahead of equity holders or when equity holders do not. There is no guarantee that the Fund will receive a return of principal on CoCos. Any indication that an automatic write-down or conversion event may occur can be expected to have a material adverse effect on the market price of CoCos.
The prices of CoCos may be volatile. Additionally, the trading behavior of a given issuer’s CoCo may be strongly impacted by the trading behavior of other issuers’ CoCos, such that negative information from an unrelated CoCo may cause a decline in value of one or more CoCos held by a fund. Accordingly, the trading behavior of CoCos may not follow the trading behavior of other similarly structured securities.
125
Shareholder Update (continued)
CoCos are issued primarily by financial institutions. Therefore, CoCos present substantially increased risks at times of financial turmoil, which could affect financial institutions more than companies in other sectors and industries.
Convertible Securities Risk. Convertible securities have characteristics of both equity and debt securities and, as a result, are exposed to certain additional risks that are typically associated with debt, including but not limited to Interest Rate Risk, Credit Risk, Below Investment Grade Risk and Unrated Securities Risk. The value of a convertible security is influenced by both the yield of non‑convertible securities of comparable issuers and by the value of the underlying common stock. Convertible securities generally offer lower interest or dividend yields than non‑convertible securities of similar credit quality. The market values of convertible securities tend to decline as interest rates increase and, conversely, to increase as interest rates decline. However, the convertible security’s market value tends to reflect the market price of the common stock of the issuing company when that stock price is greater than the convertible security’s “conversion price.” The conversion price is defined as the predetermined price at which the convertible security could be exchanged for the associated common stock. As the market price of the underlying common stock declines, the price of the convertible security tends to be influenced more by the yield of the convertible security. Thus, the convertible security may not decline in price to the same extent as the underlying common stock. Convertible securities fall below debt obligations of the same issuer in order of preference or priority in the event of a liquidation and are typically unrated or rated lower than such debt obligations.
Credit Risk. Issuers of securities in which the Fund may invest may default on their obligations, including to pay principal or interest when due. This non‑payment would result in a reduction of income to the Fund, a reduction in the value of a security experiencing non‑payment and potentially a decrease in the NAV of the Fund. To the extent that the credit rating assigned to a security in the Fund’s portfolio is downgraded, the market price and liquidity of such security may be adversely affected.
Credit Spread Risk. Credit spread risk is the risk that credit spreads (i.e., the difference in yield between securities that is due to differences in their credit quality) may increase when the market believes that securities generally have a greater risk of default. Increasing credit spreads may reduce the market values of the Fund’s securities. Credit spreads often increase more for lower rated and unrated securities than for investment grade securities. In addition, when credit spreads increase, reductions in market value will generally be greater for longer-maturity securities.
Debt Securities Risk. Issuers of debt instruments in which the Fund may invest may default on their obligations to pay principal or interest when due. This non‑payment would result in a reduction of income to the Fund, a reduction in the value of a debt instrument experiencing non‑payment and, potentially, a decrease in the NAV of the Fund. There can be no assurance that liquidation of collateral would satisfy the issuer’s obligation in the event of non‑payment of scheduled interest or principal or that such collateral could be readily liquidated. In the event of bankruptcy of an issuer, the Fund could experience delays or limitations with respect to its ability to realize the benefits of any collateral securing a security. To the extent that the credit rating assigned to a security in the Fund’s portfolio is downgraded, the market price and liquidity of such security may be adversely affected. In addition, decreased market making capacity has the potential to decrease liquidity and increase price volatility in the fixed income markets in which the Fund invests, particularly during periods of economic or market stress. Decreased liquidity may result in the Fund having to accept a lower price to sell a security, sell other securities to raise cash, or give up an investment opportunity, any of which could have a negative effect on performance.
Debtor‑In‑Possession (“DIP”) Financing Risk. The Fund’s participation in DIP financings is subject to risks. DIP financings are arranged when an entity seeks the protections of the bankruptcy court under Chapter 11 of the U.S. Bankruptcy Code and must be approved by the bankruptcy court. These financings allow the entity to continue its business operations while reorganizing under Chapter 11. DIP financings are typically fully secured by a lien on the debtor’s otherwise unencumbered assets or secured by a junior lien on the debtor’s encumbered assets (so long as the loan is fully secured based on the most recent current valuation or appraisal report of the debtor). DIP financings are often required to close with certainty and in a rapid manner in order to satisfy existing creditors and to enable the issuer to emerge from bankruptcy or to avoid a bankruptcy proceeding. There is a risk that the borrower will not emerge from Chapter 11 bankruptcy proceedings and be forced to liquidate its assets under Chapter 7 of the U.S. Bankruptcy Code. In the event of liquidation, the Fund’s only recourse will be against the property securing the DIP financing.
Deflation Risk. Deflation risk is the risk that prices throughout the economy decline over time. Deflation may have an adverse effect on the creditworthiness of issuers and may make issuer default more likely, which may result in a decline in the value of the Fund’s portfolio.
Depositary Receipts Risk. Foreign securities may trade in the form of depositary receipts. In addition to investment risks associated with the underlying issuer, depositary receipts may expose the Fund to additional risks associated with non‑uniform terms that apply to depositary receipt programs, including credit exposure to the depository bank and to the sponsors and other parties with whom the depository bank establishes the programs, currency, political, economic, market risks and the risks of an illiquid market for depositary receipts. Depositary receipts are generally subject to the same risks as the foreign securities that they evidence or into which they may be converted. Depositary receipts may not track the price of the underlying foreign securities on which they are based, may have limited voting rights, and may have a distribution subject to a fee charged by the depository. As a result, equity shares of the underlying issuer may trade at a discount or premium to the market price of the depositary receipts.
Derivatives Risk. The use of derivatives involves additional risks and transaction costs which could leave the Fund in a worse position than if it had not used these instruments. Derivative instruments can be used to acquire or to transfer the risk and returns of a security or other asset without buying or selling the security or asset. These instruments may entail investment exposures that are greater than their cost would suggest. As a result, a small investment in derivatives can result in losses that greatly exceed the original investment. Derivatives can be highly volatile, illiquid and difficult to value. An over‑the‑counter derivative transaction between the Fund and a counterparty that is not cleared through a central counterparty also involves the risk that a loss may be sustained as a result of the failure of the counterparty to the contract to make required payments. The payment obligation for a cleared derivative transaction is guaranteed by a central counterparty, which exposes the Fund to the creditworthiness of the central counterparty. The use of certain derivatives involves leverage, which can cause the Fund’s portfolio to be more volatile than if the portfolio had not been leveraged. Leverage can significantly magnify the effect of price movements of the reference asset, disproportionately increasing the Fund’s losses and reducing the Fund’s opportunities for gains when the reference asset changes in unexpected ways. In some instances, such leverage could result in losses that exceed the original amount invested.
126
It is possible that regulatory or other developments in the derivatives market, including changes in government regulation could adversely impact the Fund’s ability to invest in certain derivatives or successfully use derivative instruments.
Duration Risk. Duration is the sensitivity, expressed in years, of the price of a fixed-income security to changes in the general level of interest rates (or yields). Securities with longer durations tend to be more sensitive to interest rate (or yield) changes, which typically corresponds to increased volatility and risk, than securities with shorter durations. For example, if a security or portfolio has a duration of three years and interest rates increase by 1%, then the security or portfolio would decline in value by approximately 3%. Duration differs from maturity in that it considers potential changes to interest rates, and a security’s coupon payments, yield, price and par value and call features, in addition to the amount of time until the security matures. The duration of a security will be expected to change over time with changes in market factors and time to maturity.
Equity Securities Risk. Equity securities in the Fund’s portfolio may decline significantly in price over short or extended periods of time, and such declines may occur because of declines in the equity market as a whole, or because of declines in only a particular country, company, industry, or sector of the market. Given the Fund’s focus on dividend-paying securities, the Fund may, from time to time, have a greater exposure to higher dividend-yield sectors and industries than the broad equity market which would make the Fund more vulnerable to adverse developments affecting such sectors or industries.
Financial Futures and Options Transactions Risk. The Fund may use certain transactions for hedging the portfolio’s exposure to credit risk and the risk of increases in interest rates, which could result in poorer overall performance for the Fund. There may be an imperfect correlation between price movements of the futures and options and price movements of the portfolio securities being hedged.
If the Fund engages in futures transactions or in the writing of options on futures, it will be required to maintain initial margin and maintenance margin and may be required to make daily variation margin payments in accordance with applicable rules of the exchanges and the Commodity Futures Trading Commission (“CFTC”). If the Fund purchases a financial futures contract or a call option or writes a put option in order to hedge the anticipated purchase of securities, and if the Fund fails to complete the anticipated purchase transaction, the Fund may have a loss or a gain on the futures or options transaction that will not be offset by price movements in the securities that were the subject of the anticipatory hedge. There can be no assurance that a liquid market will exist at a time when the Fund seeks to close out a derivatives or futures or a futures option position, and the Fund would remain obligated to meet margin requirements until the position is closed.
Floating-Rate and Fixed‑to‑Floating‑Rate Securities Risk. The market value of floating-rate securities is a reflection of discounted expected cash flows based on expectations for future interest rate resets. The market value of such securities may fall in a declining interest rate environment and may also fall in a rising interest rate environment if there is a lag between the rise in interest rates and the reset. This risk may also be present with respect to fixed‑to‑floating‑rate securities in which the Fund may invest. A secondary risk associated with declining interest rates is the risk that income earned by the Fund on floating-rate and fixed‑to‑floating‑rate securities will decline due to lower coupon payments on floating rate securities.
Foreign Currency Risk. Because the Fund may invest in securities denominated or quoted in currencies other than the U.S. dollar, changes in foreign currency exchange rates may affect the value of securities held by the Fund and the unrealized appreciation or depreciation of investments.
Currencies of certain countries may be volatile and therefore may affect the value of securities denominated in such currencies, which means that the Fund’s NAV could decline as a result of changes in the exchange rates between foreign currencies and the U.S. dollar. In addition, certain countries, particularly emerging market countries, may impose foreign currency exchange controls or other restrictions on the transferability, repatriation or convertibility of currency.
Foreign/Emerging Markets Issuer Risk. Investments in foreign issuers involve special risks not presented by investments in U.S. issuers, including the following: (i) less publicly available information about foreign issuers or markets due to less rigorous disclosure or accounting standards or regulatory practices; (ii) many foreign markets are smaller, less liquid and more volatile; (iii) potential adverse effects of fluctuations in currency exchange rates or controls on the value of the Fund’s investments; (iv) the economies of foreign countries may grow at slower rates than expected or may experience a downturn or recession; (v) the impact of economic, political, social or diplomatic events; (vi) possible seizure of a company’s assets; (vii) restrictions imposed by foreign countries limiting the ability of foreign issuers to make payments of principal and/or interest due to blockages of foreign currency exchanges or otherwise and (viii) withholding and other foreign taxes may decrease the Fund’s return. These risks are more pronounced to the extent that the Fund invests a significant amount of its assets in issuers located in one foreign country or geographic region. In addition, investing in securities of foreign issuers located in emerging markets involves greater risks, including smaller market capitalization of securities markets, which may suffer periods of relative illiquidity; significant price volatility; restrictions on foreign investment; and possible restrictions on repatriation of investment income and capital.
Hedging Risk. The Fund’s use of derivatives or other transactions to reduce risk involves costs and will be subject to the investment adviser’s and/or the sub‑adviser’s ability to predict correctly changes in the relationships of such hedge instruments to the Fund’s portfolio holdings or other factors. No assurance can be given that the investment adviser’s and/or the sub‑adviser’s judgment in this respect will be correct, and no assurance can be given that the Fund will enter into hedging or other transactions at times or under circumstances in which it may be advisable to do so. Hedging activities may reduce the Fund’s opportunities for gain by offsetting the positive effects of favorable price movements and may result in net losses.
Income Risk. The Fund’s level of current income could decline due to falling market interest rates. This is because, in a falling interest rate environment, the Fund generally will have to invest the proceeds from maturing portfolio securities in lower-yielding securities.
Inflation Risk. Inflation risk is the risk that the value of assets or income from investments will be worth less in the future as inflation decreases the value of money. As inflation increases, the real value of the common shares and distributions can decline. Currently, inflation rates are elevated relative to normal market conditions and could increase.
127
Shareholder Update (continued)
Inflation Correlation Risk. Although the values of certain of the Fund’s loan investments are generally linked or correlated to the rate of inflation, there is no guarantee that such investments will provide any protection against the impact of inflation. In addition, while these investments are expected to be protected from long-term inflationary trends, short-term increases in inflation may lead to a decline in their value. Further, when inflation and expectations of inflation are low or declining, the Fund’s positions in such investments are likely to underperform the overall stock markets.
Interest Rate Risk. Interest rate risk is the risk that debt securities in the Fund’s portfolio will decline in value because of changes in market interest rates. Generally, when market interest rates rise, the market value of such securities will fall, and vice versa. As interest rates decline, issuers of debt securities may prepay principal earlier than scheduled, forcing the Fund to reinvest in lower-yielding securities and potentially reducing the Fund’s income. As interest rates increase, slower than expected principal payments may extend the average life of debt securities, potentially locking in a below-market interest rate and reducing the Fund’s value. In typical market interest rate environments, the prices of longer-term debt securities generally fluctuate more than prices of shorter-term debt securities as interest rates change. If the Fund invests in floating rate securities, the market value of such securities may fall in a declining interest rate environment and may also fall in a rising interest rate environment if there is a lag between the rise in interest rates and the reset. A secondary risk associated with declining interest rates is the risk that income earned by the Fund on floating rate securities may decline due to lower coupon payments on floating-rate securities. If the Fund invests in floating rate securities, the market value of such securities may fall in a declining interest rate environment and may also fall in a rising interest rate environment if there is a lag between the rise in interest rates and the rest. A secondary risk associated with declining interest rates is the risk that income earned by the Fund on floating rate securities may decline due to lower coupon payments on floating- rate securities.
Inverse Floating Rate Securities Risk. In general, income on inverse floating rate securities will decrease when short-term interest rates increase and increase when short-term interest rates decrease. Investments in inverse floating rate securities may subject the Fund to the risks of reduced or eliminated interest payments and losses of principal. In addition, inverse floating rate securities may increase or decrease in value at a greater rate than the underlying interest rate, which effectively leverages the Fund’s investment. As a result, the market value of such securities generally will be more volatile than that of fixed rate securities.
The Fund may invest in inverse floating rate securities issued by special purpose trusts that have recourse to the Fund. In such instances, the Fund may be at risk of loss that exceeds its investment in the inverse floating rate securities.
The Fund may be required to sell its inverse floating rate securities at less than favorable prices, or liquidate other Fund portfolio holdings in certain circumstances, including, but not limited to, the following:
• If the Fund has a need for cash and the securities in a special purpose trust are not actively trading due to adverse market conditions;
• If special purpose trust sponsors (as a collective group or individually) experience financial hardship and consequently seek to terminate their respective outstanding special purpose trusts; and
• If the value of an underlying security declines significantly and if additional collateral has not been posted by the Fund.
Loan Participation Risk. The Fund may purchase a participation interest in a loan and by doing so acquire some or all of the interest of a bank or other lending institution in a loan to a borrower. A participation typically will result in the Fund having a contractual relationship only with the lender, not the borrower. As a result, the Fund assumes the credit risk of the lender selling the participation in addition to the credit risk of the borrower. By purchasing a participation, the Fund will have the right to receive payments of principal, interest and any fees to which it is entitled only from the lender selling the participation and only upon receipt by the lender of the payments from the borrower. In the event of insolvency or bankruptcy
of the lender selling the participation, the Fund may be treated as a general creditor of the lender and may not have a senior claim to the lender’s interest in the loan. If the Fund only acquires a participation in the loan made by a third party, the Fund may not be able to control the exercise of any remedies that the lender would have under the loan. Such third party participation arrangements are designed to give loan investors preferential treatment over high yield investors in the event of a deterioration in the credit quality of the borrower. Even when these arrangements exist, however, there can be no assurance that the principal and interest owed on the loan will be repaid in full.
Loan Risk. The lack of an active trading market for certain loans may impair the ability of the Fund to realize full value in the event of the need to sell a loan and may make it difficult to value such loans. Portfolio transactions in loans may settle in as short as seven days but typically can take up to two or three weeks, and in some cases much longer. As a result of these extended settlement periods, the Fund may incur losses if it is required to sell other investments or temporarily borrow to meet its cash needs. The risks associated with unsecured loans, which are not backed by a security interest in any specific collateral, are higher than those for comparable loans that are secured by specific collateral. For secured loans, there is a risk that the value of any collateral securing a loan in which the Fund has an interest may decline and that the collateral may not be sufficient to cover the amount owed on the loan. Interests in loans made to finance highly leveraged companies or transactions such as corporate acquisitions may be especially vulnerable to adverse changes in economic or market conditions. Loans may have restrictive covenants limiting the ability of a borrower to further encumber its assets. However, in periods of high demand by lenders like the Fund for loan investments, borrowers may limit these covenants and weaken a lender’s ability to access collateral securing the loan; reprice the credit risk associated with the borrower; and mitigate potential loss. The Fund may experience relatively greater realized or unrealized losses or delays and expenses in enforcing its rights with respect to loans with fewer restrictive covenants. Additionally, loans may not be considered “securities” and, as a result, the Fund may not be entitled to rely on the anti- fraud protections of the securities laws. Because junior loans have a lower place in an issuer’s capital structure and may be unsecured, junior loans involve a higher degree of overall risk than senior loans of the issuer.
Mortgage-Backed Securities (“MBS”) and Asset-Backed Securities Risk. These securities generally can be prepaid at any time, and prepayments that occur either more quickly or more slowly than expected can adversely impact the value of such securities. They are also subject to extension risk, which is the risk that rising interest rates could cause mortgages or other obligations underlying the securities to be prepaid more slowly than expected, thereby lengthening the duration of such securities, increasing their sensitivity to interest rate changes and causing their prices to decline. The Fund may invest in MBS and ABS that are subordinate in right of payment and rank junior to other securities that are secured by or represent an ownership interest in the same pool of assets. In addition, many of the transactions in which such securities are issued have structural features that
128
divert payments of interest and/or principal to more senior classes when the delinquency or loss experience of the pool exceeds certain levels. As a result, such securities may be more sensitive to risk of loss, write-downs, the non‑fulfillment of repurchase obligations, over-advancing on a pool of loans and the costs of transferring servicing than senior classes of securities. Further, some of the MBS and ABS in which the Fund invests may be comprised of subprime loans. Subprime loans are those made to borrowers with lower credit ratings and/or shorter credit history, who are more likely to default on their loan obligations as compared to more credit-worthy borrowers. As a result, liquidity risk is even greater for MBS and ABS comprised of subprime loans. MBS, including CMBS and RMBS, may be negatively affected by the quality of the mortgages underlying such security, the credit quality of its issuer or guarantor, and the nature and structure of its credit support. An unexpectedly high rate of defaults on the mortgages held by a mortgage pool will adversely affect the value of MBS and will result in losses to the Fund. Privately issued mortgage-related securities are not subject to the same underwriting requirements for the underlying mortgages that are applicable to those mortgage-related securities that have government or government-sponsored entity guarantee. As a result, the mortgage loans underlying privately issued mortgage-related securities may, and frequently do, have less favorable collateral, credit risk or other underwriting characteristics than government or government-sponsored mortgage-related securities and have wider variances in a number of terms including interest rate, term, size, purpose and borrower characteristics.
Certain non‑agency MBS are only entitled to payments provided for in the underlying agreement when and if funds are generated by the underlying mortgage loan pool. This likelihood of the return of interest and principal may be assessed as a credit matter. However, the holders of such non‑agency MBS may not have the legal status of secured creditors, and therefore may not be able to accelerate a claim for payment on their securities or force a sale of the mortgage loan pool in the event that insufficient funds exist to pay such amounts on any date designated for such payment. The holders of such non‑agency MBS do not typically have any right to remove a servicer solely as a result of a failure of the mortgage pool to perform as expected. In addition, there can be no assurance that originators and servicers of mortgage loans for non‑agency MBS will not experience financial difficulties, which may increase the chances that these entities may default on their warehousing or other credit lines or become insolvent or bankrupt, thus increasing the likelihood that repurchase obligations will not be fulfilled and the potential for loss to holders of such non‑agency MBS. Further, the prices of non‑agency MBS may decline substantially, for reasons that may not be attributable to any of the other risks described herein. In particular, purchasing assets at what may appear to be “undervalued” levels is no guarantee that these assets will not be trading at even more “undervalued” levels at a time of valuation or at the time of sale. It may not be possible to predict, or to protect against, such “spread widening” risk.
Municipal Securities Risk. The values of municipal securities may be adversely affected by local political and economic conditions and developments. Adverse conditions in an industry significant to a local economy could have a correspondingly adverse effect on the financial condition of local issuers. Other factors that could affect municipal securities include a change in the local, state, or national economy, a downgrade of a state’s credit rating or the rating of authorities or political subdivisions of the state, demographic factors, ecological or environmental concerns, inability or perceived inability of a government authority to collect sufficient tax or other revenues, statutory limitations on the issuer’s ability to increase taxes, and other developments generally affecting the revenue of issuers (for example, legislation or court decisions reducing state aid to local governments or mandating additional services). This risk would be heightened to the extent that the Fund invests a substantial portion of the below-investment grade quality portion of its portfolio in the bonds of similar projects (such as those relating to the education, health care, housing, transportation, or utilities industries), in industrial development bonds, or in particular types of municipal securities (such as general obligation bonds, municipal lease obligations, private activity bonds or moral obligation bonds) that are particularly exposed to specific types of adverse economic, business or political events. The value of municipal securities may also be adversely affected by rising health care costs, increasing unfunded pension liabilities, and by the phasing out of federal programs providing financial support. In recent periods, a number of municipal issuers have defaulted on obligations, been downgraded or commenced insolvency proceedings. Financial difficulties of municipal issuers may continue or get worse. In addition, the amount of public information available about municipal bonds is generally less than for certain corporate equities or bonds, meaning that the investment performance of the Fund may be more dependent on the analytical abilities of the Fund’s sub‑adviser than funds that invest in stock or other corporate investments.
To the extent that a fund invests a significant portion of its assets in the securities of issuers located in a given state or U.S. territory, it will be disproportionally affected by political and economic conditions and developments in that state or territory and may involve greater risk than funds that invest in a larger universe of securities. In addition, economic, political or regulatory changes in that state or territory could adversely affect municipal securities issuers in that state or territory and therefore the value of a fund’s investment portfolio.
Municipal Securities Market Liquidity Risk. Inventories of municipal securities held by brokers and dealers have decreased in recent years, lessening their ability to make a market in these securities. This reduction in market making capacity has the potential to decrease the Fund’s ability to buy or sell municipal securities at attractive prices, and increase municipal security price volatility and trading costs, particularly during periods of economic or market stress. In addition, recent federal banking regulations may cause certain dealers to reduce their inventories of municipal securities, which may further decrease the Fund’s ability to buy or sell municipal securities. As a result, the Fund may be forced to accept a lower price to sell a security, to sell other securities to raise cash, or to give up an investment opportunity, any of which could have a negative effect on performance.
If the Fund needed to sell large blocks of municipal securities to raise cash to meet its obligations, those sales could further reduce the municipal securities’ prices and hurt performance.
Municipal Securities Market Risk. The amount of public information available about the municipal securities in the Fund’s portfolio is generally less than that for corporate equities or bonds, and the investment performance of the Fund may therefore be more dependent on the analytical abilities of the sub‑adviser than if the Fund were a stock fund or taxable bond fund. The secondary market for municipal securities, particularly below investment grade municipal securities, also tends to be less well-developed or liquid than many other securities markets, which may adversely affect the Fund’s ability to sell its municipal securities at attractive prices.
Other Investment Companies Risk. Investing in an investment company exposes the Fund to all of the risks of that investment company’s investments. The Fund, as a holder of the securities of other investment companies, will bear its pro rata portion of the other investment companies’ expenses, including advisory fees. These expenses are in addition to the direct expenses of the Fund’s own operations. As a result, the cost of investing in
129
Shareholder Update (continued)
investment company shares may exceed the costs of investing directly in its underlying investments. In addition, securities of other investment companies may be leveraged. As a result, the Fund may be indirectly exposed to leverage through an investment in such securities and therefore magnify the Fund’s leverage risk.
With respect to ETF’s, an ETF that is based on a specific index may not be able to replicate and maintain exactly the composition and relative weighting of securities in the index. The value of an ETF based on a specific index is subject to change as the values of its respective component assets fluctuate according to market volatility. ETFs typically rely on a limited pool of authorized participants to create and redeem shares, and an active trading market for ETF shares may not develop or be maintained. The market value of shares of ETFs and closed‑end funds may differ from their NAV.
Preferred and Hybrid Preferred Securities Risk. Preferred and other subordinated securities rank lower than bonds and other debt instruments in a company’s capital structure and therefore will be subject to greater credit risk than those debt instruments. There are various special risks associated with investing in preferred securities, including:
| • | Limited Voting Rights Risk. Generally, preferred security holders (such as the Fund) have no voting rights with respect to the issuing company unless preferred dividends have been in arrears for a specified number of periods, at which time the preferred security holders may elect a number of directors to the issuer’s board. Generally, once all the arrearages have been paid, the preferred security holders no longer have voting rights. In the case of certain preferred securities issued by trusts or special purpose entities, holders generally have no voting rights except if a declaration of default occurs and is continuing. In such an event, preferred security holders generally would have the right to appoint and authorize a trustee to enforce the trust’s or special purpose entity’s rights as a creditor under the agreement with its operating company. |
| • | Special Redemption Rights Risk. In certain circumstances, an issuer of preferred securities may redeem the securities at par prior to their stated maturity date. For instance, for certain types of preferred securities, a redemption may be triggered by a change in federal income tax or securities laws or regulatory or major corporate action. A redemption by the issuer may negatively impact the return of the security held by the Fund. |
| • | Payment Deferral and Omission Risk. Generally, preferred securities may be subject to provisions that allow an issuer, under certain conditions, to skip (“non‑cumulative” preferred securities) or defer (“cumulative” preferred securities) distributions for a stated period without any adverse consequences to the issuer. Non‑cumulative preferred securities can defer distributions indefinitely. Cumulative preferred securities typically contain provisions that allow an issuer, at its discretion, to defer distribution payments for up to 10 years. If the Fund owns a preferred security that is deferring its distribution, the Fund may be required to report income for tax purposes although it has not yet received such income. In addition, recent changes in bank regulations may increase the likelihood for issuers to defer or omit distributions. |
| • | Credit and Subordination Risk. Credit risk is the risk that a security in the Fund’s portfolio will decline in price or the issuer of the security will fail to make dividend, interest or principal payments when due because the issuer experiences a decline in its financial status. Preferred securities are generally subordinated to bonds and other debt instruments in a company’s capital structure in terms of having priority to corporate income, claims to corporate assets and liquidation payments, and therefore will be subject to greater credit risk than more senior debt instruments. |
| • | Floating Rate and Fixed‑to‑Floating Rate Securities Risk. The market value of floating rate securities is a reflection of discounted expected cash flows based on expectations for future interest rate resets. The market value of such securities may fall in a declining interest rate environment and may also fall in a rising interest rate environment if there is a lag between the rise in interest rates and the reset. This risk may also be present with respect to fixed‑to‑floating rate securities in which the Fund may invest. A secondary risk associated with declining interest rates is the risk that income earned by the Fund on floating rate and fixed‑to‑floating rate securities may decline due to lower coupon payments on floating-rate securities. |
| • | Liquidity Risk. Certain preferred securities may be substantially less liquid than many other securities, such as U.S. Government securities or common stock. Illiquid securities involve the risk that the securities will not be able to be sold at the time desired by the Fund or at prices approximating the value at which the Fund is carrying the securities on its books. |
| • | Regulatory Risk. Issuers of preferred securities may be in industries that are heavily regulated and that may receive government funding. The value of preferred securities issued by these companies may be affected by changes in government policy, such as increased regulation, ownership restrictions, deregulation or reduced government funding. |
| • | New Types of Securities Risk. From time to time, preferred securities, including hybrid-preferred securities, have been, and may in the future be, offered having features other than those described herein. The Fund reserves the right to invest in these securities if the Sub‑Advisers believe that doing so would be consistent with the Fund’s investment objective and policies. Since the market for these instruments would be new, the Fund may have difficulty disposing of them at a suitable price and time. In addition to limited liquidity, these instruments may present other risks, such as high price volatility. |
Real Estate Investment Trust Risk. Share prices of Real Estate Investment Trusts (“REITs”) typically decline because of adverse developments affecting the real estate industry and real property values. In general, real estate values are affected by a variety of factors, including supply and demand for properties, the economic health of the country or of different regions, and the strength of specific industries that rent properties. Qualification as a REIT under the Internal Revenue Code of 1986, as amended in any particular year is a complex analysis that depends on a number of factors. There can be no assurance that an entity in which the Fund invests with the expectation that it will be taxed as a REIT will, in fact, qualify as a REIT.
130
An entity that fails to qualify as a REIT would be taxed as a corporation, and thus, would not be entitled to a deduction for dividends paid to its shareholders and would not pass through to its shareholders the character of income earned by the entity. Dividends paid by REITs may not receive preferential tax treatment afforded other dividends.
Reinvestment Risk. Reinvestment risk is the risk that income from the Fund’s portfolio will decline if and when the Fund invests the proceeds from matured, traded or called securities at market interest rates that are below the portfolio’s current earnings rate. A decline in income could affect the common shares’ market price, NAV and/or a common shareholder’s overall returns.
Restricted and Illiquid Investments Risk. Illiquid investments are investments that are not readily marketable. These investments may include restricted investments, including Rule 144A securities, which cannot be resold to the public without an effective registration statement under the 1933 Act, or, if they are unregistered, may be sold only in a privately negotiated transaction or pursuant to an available exemption from registration. The Fund may not be able to readily dispose of such investments at prices that approximate those at which the Fund could sell such investments if they were more widely traded and, as a result of such illiquidity, the Fund may have to sell other investments or engage in borrowing transactions if necessary to raise cash to meet its obligations. Limited liquidity can also affect the market price of investments, thereby adversely affecting the Fund’s NAV and ability to make dividend distributions. The financial markets in general have in recent years experienced periods of extreme secondary market supply and demand imbalance, resulting in a loss of liquidity during which market prices were suddenly and substantially below traditional measures of intrinsic value. During such periods, some investments could be sold only at arbitrary prices and with substantial losses. Periods of such market dislocation may occur again at any time.
Second Lien Loans and Unsecured Loans Risk. Second lien loans and unsecured loans generally are subject to the same risks associated with investments in senior loans, as discussed below. Because second lien loans and unsecured loans are lower in priority of payment to senior loans, they are subject to the additional risk that the cash flow of the borrower and property securing the loan, if any, may be insufficient to meet scheduled payments after giving effect to the senior secured obligations of the borrower. This risk is generally higher for unsecured loans, which are not backed by a security interest in any specific collateral. Second lien loans and unsecured loans are expected to have greater price volatility than senior loans and may be less liquid. Second lien loans and unsecured loans of below investment grade quality also share the same risks of other below investment grade debt instruments.
Senior Loan Agent Risk. A financial institution’s employment as an agent under a senior loan might be terminated in the event that it fails to observe a requisite standard of care or becomes insolvent. A successor agent would generally be appointed to replace the terminated agent, and assets held by the agent under the loan agreement would likely remain available to holders of such indebtedness. However, if assets held by the terminated agent for the benefit of the Fund were determined to be subject to the claims of the agent’s general creditors, the Fund might incur certain costs and delays in realizing payment on a senior loan or loan participation and could suffer a loss of principal and/or interest. In situations involving other interposed financial institutions (e.g., an insurance company or government agency) similar risks may arise.
Senior Loan Risk. Senior loans typically hold the most senior position in the capital structure of a business entity, are typically secured with specific collateral and have a claim on the assets and/or stock of the issuer that is senior to that held by subordinated debt holders and stockholders of the issuer. Senior loans are usually rated below investment grade, and share the same risks of other below investment grade debt instruments.
Although the Fund may invest in senior loans that are secured by specific collateral, there can be no assurance that the liquidation of such collateral would satisfy an issuer’s obligation to the Fund in the event of issuer default or that such collateral could be readily liquidated under such circumstances. If the terms of a senior loan do not require the issuer to pledge additional collateral in the event of a decline in the value of the already pledged collateral, the Fund will be exposed to the risk that the value of the collateral will not at all times equal or exceed the amount of the issuer’s obligations under the senior loan.
In the event of bankruptcy of an issuer, the Fund could also experience delays or limitations with respect to its ability to realize the benefits of any collateral securing a senior loan. Some senior loans are subject to the risk that a court, pursuant to fraudulent conveyance or other similar laws, could subordinate the senior loans to presently existing or future indebtedness of the issuer or take other action detrimental to lenders, including the Fund. Such court action could under certain circumstances include invalidation of senior loans.
Structured Products Risk. In addition to the general risks associated with investments in debt securities, holders of structured products bear risks of the underlying investments, index or reference obligation (collectively, the “reference instrument”) and are subject to counterparty, valuation and liquidity risks. The Fund may have the right to receive payments to which it is entitled only from the structured product, and generally does not have direct rights against the issuer or the entity that sold assets to the special purpose trust. While certain structured products enable the investor to acquire interests in a pool of securities without the brokerage and other expenses associated with directly holding the same securities, investors in structured products generally pay their share of the structured product’s administrative and other expenses. When investing in structured products, it is impossible to predict whether the reference instrument will rise or fall, but prices of the reference instrument (and, therefore, the prices of structured products) will be influenced by the same types of political and economic events that affect particular issuers of securities and capital markets generally. Structured products may also be less liquid, more volatile and more difficult to price than other types of securities.
Sovereign Government and Supranational Debt Risk. Investments in sovereign debt, including supranational debt, involve special risks. Foreign governmental issuers of debt or the governmental authorities that control the repayment of the debt may be unable or unwilling to repay principal or pay interest when due. In the event of default, there may be limited or no legal recourse in that, generally, remedies for defaults must be pursued in the courts of the defaulting party. Political conditions, especially a sovereign entity’s willingness to meet the terms of its debt obligations, are of considerable significance. The ability of a foreign sovereign issuer, especially an emerging market country, to make timely payments on its debt obligations will also be strongly influenced by the sovereign issuer’s balance of payments, including export performance, its access to international credit facilities and investments, fluctuations of interest rates and the extent of its foreign reserves. A country whose exports are concentrated in a few commodities or whose economy depends on certain strategic imports could be vulnerable to fluctuations in international prices of these commodities or imports. If a sovereign issuer cannot generate sufficient earnings from foreign trade to service its external debt, it may need to
131
Shareholder Update (continued)
depend on continuing loans and aid from foreign governments, commercial banks, and multinational organizations. The cost of servicing external debt will also generally be adversely affected by rising international interest rates, as many external debt obligations bear interest at rates which are adjusted based upon international interest rates. Foreign investment in certain sovereign debt is restricted or controlled to varying degrees, including requiring governmental approval for the repatriation of income, capital or proceeds of sales by foreign investors. There are no bankruptcy proceedings similar to those in the U.S. by which defaulted sovereign debt may be collected.
Subordinated Loans and Other Subordinated Debt Instruments Risk. Issuers of subordinated loans and other subordinated debt instruments in which the Fund may invest usually will have, or may be permitted to incur, other debt that ranks equally with, or senior to, the subordinated loans or other subordinated debt instruments. By their terms, such debt instruments may provide that the holders are entitled to receive payment of interest or principal on or before the dates on which the Fund is entitled to receive payments in respect of subordinated loans or other subordinated debt instruments in which it invests. Also, in the event of insolvency, liquidation, dissolution, reorganization or bankruptcy of an issuer, holders of debt instruments ranking senior to the subordinated loan or other debt instrument in which the Fund invests would typically be entitled to receive payment in full before the Fund receives any distribution in respect of its investment. After repaying such senior creditors, such issuer may not have any remaining assets to use for repaying its obligation to the Fund. In the case of debt ranking equally with subordinated loans or other subordinated debt instruments in which the Fund invests, the Fund would have to share on an equal basis any distributions with other creditors holding such debt in the event of an insolvency, liquidation, dissolution, reorganization or bankruptcy of the relevant issuer. In addition, the Fund will likely not be in a position to control any issuer by investing in its debt instruments. As a result, the Fund will be subject to the risk that an issuer in which it invests may make business decisions with which the Fund disagrees and the management of such issuer, as representatives of the holders of their common equity, may take risks or otherwise act in ways that do not serve the Fund’s interests as a debt investor.
Swap Transactions Risk. Like most derivative instruments, the use of swaps is a highly specialized activity that involves investment techniques and risks different from those associated with ordinary portfolio securities transactions. In addition, the use of swaps requires an understanding by the investment adviser and/or the sub‑adviser of not only the referenced asset, rate or index, but also of the swap itself. If the investment adviser and/ or the sub‑adviser is incorrect in its forecasts of default risks, market spreads or other applicable factors or events, the investment performance of the Fund would diminish compared with what it would have been if these techniques were not used.
Unrated Securities Risk. Unrated securities determined by the Fund’s investment adviser to be of comparable quality to rated investments which the Fund may purchase may pay a higher dividend or interest rate than such rated investments and be subject to a greater risk of illiquidity or price changes. Less public information is typically available about unrated investments or issuers than rated investments or issuers. Some unrated securities may not have an active trading market or may be difficult to value, which means the Fund might have difficulty selling them promptly at an acceptable price. To the extent that the Fund invests in unrated securities, the Fund’s ability to achieve its investment objectives will be more dependent on the investment adviser’s credit analysis than would be the case when the Fund invests in rated securities.
U.S. Government Securities Risk. U.S. government securities are guaranteed only as to the timely payment of interest and the payment of principal when held to maturity. Accordingly, the current market values for these securities will fluctuate with changes in interest rates. Securities issued or guaranteed by U.S. government agencies and instrumentalities are supported by varying degrees of credit but generally are not backed by the full faith and credit of the U.S. government. No assurance can be given that the U.S. government will provide financial support to its agencies and instrumentalities if it is not obligated by law to do so.
Valuation Risk. Certain securities in which the Fund invests typically are valued by a pricing service utilizing a range of market-based inputs and assumptions, including readily available market quotations obtained from broker-dealers making markets in such instruments, cash flows and transactions for comparable instruments. There is no assurance that the Fund will be able to sell a portfolio security at the price established by the pricing service, which could result in a loss to the Fund. Pricing services generally price securities assuming orderly transactions of an institutional “round lot” size, but some trades may occur in smaller, “odd lot” sizes, often at lower prices than institutional round lot trades. Different pricing services may incorporate different assumptions and inputs into their valuation methodologies, potentially resulting in different values for the same securities. As a result, if the Fund were to change pricing services, or if the Fund’s pricing service were to change its valuation methodology, there could be a material impact, either positive or negative, on the Fund’s NAV.
Warrants and Equity Securities Risk. Investments in warrants and equity securities entail certain risks in addition to those associated with investments in adjustable rate instruments or other debt instruments. The value of warrants and equity securities may be affected more rapidly, and to a greater extent, by company-specific developments and general market conditions. These risks may increase fluctuations in the Fund’s NAV. The Fund may possess material non‑public information about an issuer as a result of its ownership of an adjustable rate instrument or other debt instrument of such issuer. Because of prohibitions on trading in securities of issuers while in possession of such information, the Fund might be unable to enter into a transaction in a security of such an issuer when it would otherwise be advantageous to do so.
When-Issued and Delayed-Delivery Transactions Risk. When-issued and delayed-delivery transactions may involve an element of risk because no interest accrues on the securities prior to settlement and, because securities are subject to market fluctuations, the value of the securities at time of delivery may be less (or more) than their cost. A separate account of the Fund will be established with its custodian consisting of cash equivalents or liquid securities having a market value at all times at least equal to the amount of any delayed payment commitment.
Zero Coupon Bonds or Pay‑In‑Kind Securities Risk. Zero coupon and pay‑in‑kind securities may be subject to greater fluctuation in value and less liquidity in the event of adverse market conditions than comparably rated securities paying cash interest at regular interest payment periods. Prices on non‑ cash-paying instruments may be more sensitive to changes in the issuer’s financial condition, fluctuation in interest rates and market demand/supply imbalances than cash-paying securities with similar credit ratings, and thus may be more speculative.
132
Fund Level and Other Risks:
Anti-Takeover Provisions. The Declaration of Trust and the Fund’s by‑laws include provisions that could limit the ability of other entities or persons to acquire control of the Fund or convert the Fund to open‑end status. These provisions could have the effect of depriving the Common Shareholders of opportunities to sell their Common Shares at a premium over the then-current market price of the Common Shares.
Borrowing Risk. In addition to borrowing for leverage, the Fund may borrow for temporary or emergency purposes, to pay dividends, repurchase its shares, or clear portfolio transactions. Borrowing may exaggerate changes in the NAV of the Fund’s shares and may affect the Fund’s net income. When the Fund borrows money, it must pay interest and other fees, which will reduce the Fund’s returns if such costs exceed the returns on the portfolio securities purchased or retained with such borrowings. Any such borrowings are intended to be temporary. However, under certain market circumstances, such borrowings might be outstanding for longer periods of time.
Counterparty Risk. Changes in the credit quality of the companies that serve as the Fund’s counterparties with respect to derivatives or other transactions supported by another party’s credit will affect the value of those instruments. Certain entities that have served as counterparties in the markets for these transactions have incurred or may incur in the future significant financial hardships including bankruptcy and losses as a result of exposure to sub‑prime mortgages and other lower-quality credit investments. As a result, such hardships have reduced these entities’ capital and called into question their continued ability to perform their obligations under such transactions. By using such derivatives or other transactions, the Fund assumes the risk that its counterparties could experience similar financial hardships. In the event of the insolvency of a counterparty, the Fund may sustain losses or be unable to liquidate a derivatives position.
Cybersecurity Risk. The Fund and its service providers are susceptible to operational and information security risk resulting from cyber incidents. Cyber incidents refer to both intentional attacks and unintentional events including: processing errors, human errors, technical errors including computer glitches and system malfunctions, inadequate or failed internal or external processes, market-wide technical-related disruptions, unauthorized access to digital systems (through “hacking” or malicious software coding), computer viruses, and cyber-attacks which shut down, disable, slow or otherwise disrupt operations, business processes or website access or functionality (including denial of service attacks). Cyber incidents could adversely impact the Fund and cause the Fund to incur financial loss and expense, as well as face exposure to regulatory penalties, reputational damage, and additional compliance costs associated with corrective measures. In addition, substantial costs may be incurred in order to prevent any cyber incidents in the future. Furthermore, the Fund cannot control the cybersecurity plans and systems put in place by its service providers or any other third parties whose operations may affect the Fund.
Fund Tax Risk. The Fund has elected to be treated and intends to qualify each year as a Regulated Investment Company (“RIC”) under the Internal Revenue Code of 1986, as amended (the “Code”). As a RIC, the Fund is not expected to be subject to U.S. federal income tax to the extent that it distributes its investment company taxable income and net capital gains. To qualify for the special tax treatment available to a RIC, the Fund must comply with certain investment, distribution, and diversification requirements. Under certain circumstances, the Fund may be forced to sell certain assets when it is not advantageous in order to meet these requirements, which may reduce the Fund’s overall return. If the Fund fails to meet any of these requirements, subject to the opportunity to cure such failures under applicable provisions of the Code, the Fund’s income would be subject to a double level of U.S. federal income tax. The Fund’s income, including its net capital gain, would first be subject to U.S. federal income tax at regular corporate rates, even if such income were distributed to shareholders and, second, all distributions by the Fund from earnings and profits, including distributions of net capital gain (if any), would be taxable to shareholders as dividends.
Global Economic Risk. National and regional economies and financial markets are becoming increasingly interconnected, which increases the possibilities that conditions in one country, region or market might adversely impact issuers in a different country, region or market. Changes in legal, political, regulatory, tax and economic conditions may cause fluctuations in markets and asset prices around the world, which could negatively impact the value of the Fund’s investments. Major economic or political disruptions, particularly in large economies, may have global negative economic and market repercussions. Additionally, instability in various countries, war, natural and environmental disasters, the spread of infectious illnesses or other public health emergencies, terrorist attacks in the United States and around the world, growing social and political discord in the United States, debt crises, the response of the international community—through economic sanctions and otherwise—to international events, further downgrade of U.S. government securities, changes in the U.S. president or political shifts in Congress, trade disputes and other similar events may adversely affect the global economy and the markets and issuers in which the Fund invests. These events could reduce consumer demand or economic output, result in market closure, travel restrictions or quarantines, and generally have a significant impact on the global economy. These events could also impair the information technology and other operational systems upon which the Fund’s service providers, including the Fund’s sub‑adviser, rely, and could otherwise disrupt the ability of employees of the Fund’s service providers to perform essential tasks on behalf of the Fund.
The Fund does not know and cannot predict how long the securities markets may be affected by these events, and the future impact of these and similar events on the global economy and securities markets is uncertain. The Fund may be adversely affected by abrogation of international agreements and national laws which have created the market instruments in which the Fund may invest, failure of the designated national and international authorities to enforce compliance with the same laws and agreements, failure of local, national and international organizations to carry out the duties prescribed to them under the relevant agreements, revisions of these laws and agreements which dilute their effectiveness or conflicting interpretation of provisions of the same laws and agreements.
Governmental and quasi-governmental authorities and regulators throughout the world have in the past responded to major economic disruptions with a variety of significant fiscal and monetary policy changes, including but not limited to, direct capital infusions into companies, new monetary programs and dramatically lower interest rates. An unexpected or quick reversal of these policies, or the ineffectiveness of these policies, could increase volatility in securities markets, which could adversely affect the Fund’s investments.
Investment and Market Risk. An investment in common shares is subject to investment risk, including the possible loss of the entire principal amount that you invest. Common shares frequently trade at a discount to their NAV. An investment in common shares represents an indirect investment in the securities owned by the Fund. Common shares at any point in time may be worth less than your original investment, even after taking into account the reinvestment of Fund dividends and distributions.
133
Shareholder Update (continued)
Legislation and Regulatory Risk. At any time after the date of this report, legislation or additional regulations may be enacted that could negatively affect the assets of the Fund, securities held by the Fund or the issuers of such securities. Fund shareholders may incur increased costs resulting from such legislation or additional regulation. There can be no assurance that future legislation, regulation or deregulation will not have a material adverse effect on the Fund or will not impair the ability of the Fund to achieve its investment objectives.
Leverage Risk. The use of leverage creates special risks for common shareholders, including potential interest rate risks and the likelihood of greater volatility of NAV and market price of, and distributions on, the common shares. The use of leverage in a declining market will likely cause a greater decline in the Fund’s NAV, which may result at a greater decline of the common share price, than if the Fund were not to have used leverage.
Certain types of leverage may result in the Fund being subject to certain covenants, asset coverage or other portfolio composition limits by its lenders, debt or preferred securities purchasers, rating agencies that may rate the debt or preferred securities, or reverse repurchase counterparties. Such limitations may be more stringent than those imposed by the 1940 Act and may impact whether the Fund is able to maintain its desired amount of leverage. In addition, whenever the Fund incurs borrowings and/or preferred shares are outstanding, Common Shareholders will not be entitled to receive any cash distributions from the Fund unless all interest on such borrowings has been paid and all accumulated dividends on preferred shares have been paid, unless asset coverage (as defined in the 1940 Act) with respect to any borrowings would be at least 300% after giving effect to the distributions and asset coverage (as defined in the 1940 Act) with respect to preferred shares would be at least 200% after giving effect to the distributions.
The Fund will pay (and common shareholders will bear) any costs and expenses relating to the Fund’s use of leverage, which will result in a reduction in the Fund’s NAV. The investment adviser may, based on its assessment of market conditions and composition of the Fund’s holdings, increase or decrease the amount of leverage. Such changes may impact the Fund’s distributions and the price of the common shares in the secondary market. There is no assurance that the Fund’s use of leverage will be successful.
The Fund may seek to refinance its leverage over time, in the ordinary course, as current forms of leverage mature or it is otherwise desirable to refinance; however, the form that such leverage will take cannot be predicted at this time. If the Fund is unable to replace existing leverage on comparable terms, its costs of leverage will increase. Accordingly, there is no assurance that the use of leverage may result in a higher yield or return to common shareholders.
The amount of fees paid to the investment adviser and the sub‑advisor for investment advisory services will be higher if the Fund uses leverage because the fees will be calculated based on the Fund’s Managed Assets - this may create an incentive for the investment adviser and the sub‑ advisor to leverage the Fund or increase the Fund’s leverage.
Limited Term Risk. Because the assets of the Fund will be liquidated in connection with its termination, the Fund may be required to sell portfolio securities when it otherwise would not, including at times when market conditions are not favorable, which may cause the Fund to lose money. The Fund’s investment objectives and policies are not designed to return to investors who purchase common shares in this offering their initial investment on the termination date. When terminated, the Fund’s distributions will be based upon the Fund’s NAV at the end of the term and such initial investors and any investors that purchase common shares after the completion of this offering may receive more or less than their original investment upon termination.
Market Discount from Net Asset Value. Shares of closed‑end investment companies like the Fund frequently trade at prices lower than their NAV. This characteristic is a risk separate and distinct from the risk that the Fund’s NAV could decrease as a result of investment activities. Whether investors will realize gains or losses upon the sale of the common shares will depend not upon the Fund’s NAV but entirely upon whether the market price of the common shares at the time of sale is above or below the investor’s purchase price for the common shares. Furthermore, management may have difficulty meeting the Fund’s investment objectives and managing its portfolio when the underlying securities are redeemed or sold during periods of market turmoil and as investors’ perceptions regarding closed‑end funds or their underlying investments change. Because the market price of the common shares will be determined by factors such as relative supply of and demand for the common shares in the market, general market and economic circumstances, and other factors beyond the control of the Fund, the Fund cannot predict whether the common shares will trade at, below or above NAV. The common shares are designed primarily for long-term investors, and you should not view the Fund as a vehicle for short-term trading purposes.
Recent Market Conditions. Periods of unusually high financial market volatility and restrictive credit conditions, at times limited to a particular sector or geographic area, have occurred in the past and may be expected to recur in the future. Some countries, including the United States, have adopted or have signaled protectionist trade measures, including the imposition of tariffs, relaxation of the financial industry regulations that followed the financial crisis, and/or reductions to corporate taxes. The scope of these policy changes is still developing, but the equity and debt markets may react strongly to expectations of change, which could increase volatility, particularly if a resulting policy runs counter to the market’s expectations. The outcome of such changes cannot be foreseen at the present time. In addition, geopolitical and other risks, including environmental and public health risks, may add to instability in the world economy and markets generally. As a result of increasingly interconnected global economies and financial markets, the value and liquidity of the Fund’s investments may be negatively affected by events impacting a country or region, regardless of whether the Fund invests in issuers located in or with significant exposure to such country or region.
Ukraine has experienced ongoing military conflict, most recently in February 2022 when Russia invaded Ukraine; this conflict may expand and military attacks could occur elsewhere in Europe. Europe has also been struggling with mass migration from the Middle East and Africa. The ultimate effects of these events and other socio-political or geographical issues are not known but could profoundly affect global economies and markets.
Additionally, in October 2023 armed conflict broke out between Israel and the militant group Hamas after Hamas infiltrated Israel’s southern border from the Gaza Strip. Israel has since declared war against Hamas and this conflict has escalated into a greater regional conflict. The ultimate effects of these events and other socio-political or geographical issues are not known but could profoundly affect global economies and markets.
134
The ongoing trade war between China and the United States, including the imposition of tariffs by each country on the other country’s products, has created a tense political environment. These actions may trigger a significant reduction in international trade, the oversupply of certain manufactured goods, substantial price reductions of goods and possible failure of individual companies and/or large segments of China’s export industry, which could have a negative impact on the Fund’s performance. U.S. companies that source material and goods from China and those that make large amounts of sales in China would be particularly vulnerable to an escalation of trade tensions. Uncertainty regarding the outcome of the trade tensions and the potential for a trade war could cause the U.S. dollar to decline against safe haven currencies, such as the Japanese yen and the euro. Events such as these and their consequences are difficult to predict and it is unclear whether further tariffs may be imposed or other escalating actions may be taken in the future. Beginning in early 2025, the United States also imposed tariffs on other countries, including Mexico and Canada. The possibility of additional tariffs being imposed or the outbreak of a trade war may adversely impact U.S. and international markets. Additionally, political uncertainty regarding U.S. policy, including the U.S. government’s approach to trade, may also impact the markets and the Fund’s performance.
The U.S. Federal Reserve (the “Fed”) has in the past sharply raised interest rates and has signaled an intention to maintain relatively higher interest rates until current inflation levels re‑align with the Fed’s long-term inflation target. Changing interest rate environments impact the various sectors of the economy in different ways. For example, in March 2023, the Federal Deposit Insurance Corporation (“FDIC”) was appointed receiver for each of Silicon Valley Bank and Signature Bank, the second- and third-largest bank failures in U.S. history, which failures may be attributable, in part, to rising interest rates. Bank failures may have a destabilizing impact on the broader banking industry or markets generally.
The impact of these developments in the near- and long-term is unknown and could have additional adverse effects on economies, financial markets and asset valuations around the world.
Reverse Repurchase Agreement Risk. A reverse repurchase agreement, in economic essence, constitutes a securitized borrowing by the Fund from the security purchaser. The Fund may enter into reverse repurchase agreements for the purpose of creating a leveraged investment exposure and, as such, their usage involves essentially the same risks associated with a leveraging strategy generally since the proceeds from these agreements may be invested in additional portfolio securities. Reverse repurchase agreements tend to be short-term in tenor, and there can be no assurances that the purchaser (lender) will commit to extend or “roll” a given agreement upon its agreed-upon repurchase date or an alternative purchaser can be identified on similar terms. Reverse repurchase agreements also involve the risk that the purchaser fails to return the securities as agreed upon, files for bankruptcy or becomes insolvent. The Fund may be restricted from taking normal portfolio actions during such time, could be subject to loss to the extent that the proceeds of the agreement are less than the value of securities subject to the agreement and may experience adverse tax consequences.
135
Shareholder Update (continued)
EFFECTS OF LEVERAGE
The following table is furnished in response to requirements of the SEC. It is designed to illustrate the effects of leverage through the use of senior securities, as that term is defined under Section 18 of the 1940 Act, as well as certain other forms of leverage, such as reverse repurchase agreements, on common share total return, assuming investment portfolio total returns (consisting of income and changes in the value of investments held in the Fund’s portfolio) of ‑10%, ‑5%, 0%, 5% and 10%. The table below reflects each Fund’s (i) continued use of leverage as of July 31, 2025 as a percentage of Managed Assets (including assets attributable to such leverage), (ii) the estimated annual effective interest expense rate payable by the Funds on such instruments (based on actual leverage costs incurred during the fiscal year ended July 31, 2025) as set forth in the table, and (iii) the annual return that the Fund’s portfolio must experience (net of expenses) in order to cover such costs of leverage based on such estimated annual effective interest expense rate. The information below does not reflect any Fund’s use of certain other forms of economic leverage achieved through the use of certain derivative instruments.
The numbers are merely estimates, used for illustration. The costs of leverage may vary frequently and may be significantly higher or lower than the estimated rate. The assumed investment portfolio returns in the table below are hypothetical figures and are not necessarily indicative of the investment portfolio returns experienced or expected to be experienced by the Funds. Your actual returns may be greater or less than those appearing below.
| JFR | JQC | JPC | JPI | NPFD | ||||||||
| Estimated Leverage as a Percentage of Managed Assets (Including Assets Attributable to Leverage) |
37.08% | 37.05% | 36.01% | 36.10% | ||||||||
| Estimated Annual Effective Leverage Expense Rate Payable by Fund on Leverage |
5.74% | 5.59% | 5.68% | 5.51% | ||||||||
| Annual Return Fund Portfolio Must Experience (net of expenses) to Cover Estimated Annual Effective Interest Expense Rate on Leverage |
2.13% | 2.07% | 2.04% | 1.99% | ||||||||
| Common Share Total Return for (10.00)% Assumed Portfolio Total Return |
( |
(19.28)% | (19.18)% | (18.82)% | (18.77)% | |||||||
| Common Share Total Return for (5.00)% Assumed Portfolio Total Return |
( |
(11.33)% | (11.23)% | (11.01)% | (10.94)% | |||||||
| Common Share Total Return for 0.00% Assumed Portfolio Total Return |
( |
(3.39)% | (3.29)% | (3.19)% | (3.11)% | |||||||
| Common Share Total Return for 5.00% Assumed Portfolio Total Return |
4.56% | 4.65% | 4.62% | 4.71% | ||||||||
| Common Share Total Return for 10.00% Assumed Portfolio Total Return |
12.51% | 12.59% | 12.43% | 12.54% | ||||||||
Common Share total return is composed of two elements — the distributions paid by the Fund to holders of common shares (the amount of which is largely determined by the net investment income of the Fund after paying dividend payments on any preferred shares issued by the Fund and expenses on any forms of leverage outstanding) and gains or losses on the value of the securities and other instruments the Fund owns. As required by SEC rules, the table assumes that the Funds are more likely to suffer capital losses than to enjoy capital appreciation. For example, to assume a total return of 0%, the Fund must assume that the income it receives on its investments is entirely offset by losses in the value of those investments. This table reflects hypothetical performance of the Fund’s portfolio and not the actual performance of the Fund’s common shares, the value of which is determined by market forces and other factors. Should the Fund elect to add additional leverage to its portfolio, any benefits of such additional leverage cannot be fully achieved until the proceeds resulting from the use of such leverage have been received by the Fund and invested in accordance with the Fund’s investment objectives and policies. As noted above, the Fund’s willingness to use additional leverage, and the extent to which leverage is used at any time, will depend on many factors.
136
DIVIDEND REINVESTMENT PLAN
Nuveen Closed‑End Funds Automatic Reinvestment Plan
Your Nuveen Closed‑End Fund allows you to conveniently reinvest distributions in additional Fund shares. By choosing to reinvest, you’ll be able to invest money regularly and automatically, and watch your investment grow through the power of compounding. Just like distributions in cash, there may be times when income or capital gains taxes may be payable on distributions that are reinvested. It is important to note that an automatic reinvestment plan does not ensure a profit, nor does it protect you against loss in a declining market.
Easy and convenient
To make recordkeeping easy and convenient, each quarter you’ll receive a statement showing your total distributions, the date of investment, the shares acquired and the price per share, and the total number of shares you own.
How shares are purchased
The shares you acquire by reinvesting will either be purchased on the open market or newly issued by the Fund. If the shares are trading at or above NAV at the time of valuation, the Fund will issue new shares at the greater of the NAV or 95% of the then-current market price. If the shares are trading at less than NAV, shares for your account will be purchased on the open market. If Computershare Trust Company, N.A. (the “Plan Agent”) begins purchasing Fund shares on the open market while shares are trading below NAV, but the Fund’s shares subsequently trade at or above their NAV before the Plan Agent is able to complete its purchases, the Plan Agent may cease open-market purchases and may invest the uninvested portion of the distribution in newly-issued Fund shares at a price equal to the greater of the shares’ NAV or 95% of the shares’ market value on the last business day immediately prior to the purchase date. Distributions received to purchase shares in the open market will normally be invested shortly after the distribution payment date. No interest will be paid on distributions awaiting reinvestment. Because the market price of the shares may increase before purchases are completed, the average purchase price per share may exceed the market price at the time of valuation, resulting in the acquisition of fewer shares than if the distribution had been paid in shares issued by the Fund. A pro rata portion of any applicable brokerage commissions on open market purchases will be paid by Dividend Reinvestment Plan (the “Plan”) participants. These commissions usually will be lower than those charged on individual transactions.
Flexible
You may change your distribution option or withdraw from the Plan at any time, should your needs or situation change. You can reinvest whether your shares are registered in your name, or in the name of a brokerage firm, bank, or other nominee. Ask your investment advisor if his or her firm will participate on your behalf. Participants whose shares are registered in the name of one firm may not be able to transfer the shares to another firm and continue to participate in the Plan. The Fund reserves the right to amend or terminate the Plan at any time. Although the Fund reserves the right to amend the Plan to include a service charge payable by the participants, there is no direct service charge to participants in the Plan at this time.
Call today to start reinvesting distributions
For more information on the Nuveen Automatic Reinvestment Plan or to enroll in or withdraw from the Plan, speak with your financial professional or call us at (800) 257‑8787.
137
Shareholder Update (continued)
CHANGES OCCURRING DURING THE FISCAL YEAR
The following information in this annual report is a summary of certain changes during the most recent fiscal year. This information may not reflect all of the changes that have occurred since you purchased shares of a Fund.
During the most recent fiscal year, there have been no changes required to be reported in connection with: (i) the Funds’ investment objectives and principal investment policies that have not been approved by shareholders, (ii) the principal risks of the Fund, (iii) the portfolio managers of the Funds; (iv) a Fund’s charter or by‑laws that would delay or prevent a change of control of the Fund that have not been approved by shareholders except as follows:
Portfolio Managers
Nuveen Floating Rate Income Fund (“JFR”) and Nuveen Credit Strategies Income Fund (“JQC”)
Coale Mechlin has been named a portfolio manager of Nuveen Floating Rate Income Fund (JFR) and Nuveen Credit Strategies Income Fund (JQC), effective December 30, 2024.
Coale Mechlin is a portfolio manager on Nuveen’s Leveraged Finance investment team, focusing on the platform’s bank loan strategies. His responsibilities include supporting the day‑to‑day oversight and monitoring of the platform’s bank loan strategies. He joined Nuveen in 2017 as a research analyst covering the Technology sector. Prior to joining Nuveen, he was a high yield/senior loan capital markets associate for J.P. Morgan and an analyst for the UBS Investment Bank. He graduated with a B.A. in Economics from Wesleyan University.
Kevin Lorenz retired from Nuveen effective as of July 1, 2025 and is no longer a portfolio manager of the Nuveen Floating Rate Income Fund (JFR) and Nuveen Credit Strategies Income Fund (JQC).
Principal Risks
The following principal risks are no longer included as stand-alone risks because they were consolidated into other principal risk factors as indicated below:
| Stand-Alone Risk Removed | Consolidated Into the Following Risk | |
| Asset-Backed Securities (“ABS”) Risk Collateralized Mortgage-Backed Securities (“CMBS”) and Mortgage-Backed Securities (“MBS”) Risk |
Mortgage-Backed Securities (“MBS”) and Asset-Backed Securities (“ABS”) Risk | |
| Collateralized Loan Obligation Risk | Collateralized Debt Obligation (“CDO”) and Collateralized Loan Obligation (“CLO”) Risk | |
| Emerging Markets Risk Non‑U.S. Securities Risk |
Foreign/Emerging Markets Issuer Risk | |
138
ADDITIONAL DISCLOSURES FOR CERTAIN FUNDS AS OF THE FISCAL YEAR ENDED JULY 31, 2025
This annual report includes additional disclosures for certain Funds that have, or intend to have, an effective shelf offering registration statement on file with the Securities and Exchange Commission (SEC) at the time this report was prepared. Refer to Note 6, Fund Shares of the Notes to Financial Statements for further details on the shelf offering program.
NUVEEN FLOATING RATE INCOME FUND (JFR)
NUVEEN CREDIT STRATEGIES INCOME FUND (JQC)
NUVEEN PREFERRED & INCOME OPPORTUNITIES FUND (JPC)
SUMMARY OF FUND EXPENSES
The purpose of the tables and the example below are to help you understand all fees and expenses that you, as a common shareholder, would bear directly or indirectly. The tables show the expenses of each Fund as a percentage of the average net assets applicable to Common Shares and not as a percentage of total assets or managed assets.
| Shareholder Transaction Expenses | JFR | JQC | JPC | |||||||||
| Maximum Sales Charge ( |
1.00% | 1.00% | ||||||||||
| Dividend Reinvestment Plan Fees (2) | $ |
$2.50 | $2.50 | |||||||||
| (1) | |
| (2) | |
| Annual Expenses ( |
JFR | JQC | JPC | |||||||||
| Management Fees | 1.32% | 1.21% | ||||||||||
| Interest and Other Related Expenses (2) | 3.53% | 3.39% | ||||||||||
| Other Expenses (3) | 0.24% | 0.07% | ||||||||||
| Acquired Fund Fees and Expenses | 0.00%(4) | 0.00%(4) | ||||||||||
| Total Annual Expenses | 5.09% | 4.67% | ||||||||||
| (1) | |
| (2) | |
| (3) | |
| (4) | |
139
Shareholder Update (continued)
Example
The following example illustrates the expenses, including the applicable transaction fees (referred to as the “Maximum Sales Charge” in the Shareholder Transaction Expenses table above), if any, that a common shareholder would pay on a $1,000 investment that is held for the time periods provided in the table. The example assumes that all dividends and other distributions are reinvested in the Fund and that the Fund’s Annual Expenses, as provided above, remain the same. The example also assumes a 5% annual return. Actual expenses may be greater or less than those assumed. Moreover, the Fund’s actual rate of return may be greater or less than the hypothetical 5% return shown in the example.
Example (At‑the‑Market Transaction)
The following example assumes a transaction fee of 1.00%, as a percentage of the offering price.
| 1 Year | 3 Years | 5 Years | 10 Years | |||||||||||||
| JFR |
$ |
$ |
$ |
$ |
||||||||||||
| JQC |
$60 | $161 | $261 | $512 | ||||||||||||
| JPC |
$56 | $149 | $243 | $480 | ||||||||||||
The example should not be considered a representation of future expenses. Actual expenses may be greater or less than those shown above.
140
TRADING AND NET ASSET VALUE INFORMATION
The following table shows for the periods indicated: (i) the high and low sales prices for the Common Shares reported as of the end of the day on the NYSE, (ii) the corresponding NAV per share; and (iii) the premium/(discount) to NAV per share at which the Common Shares were trading as of such date.
| JFR | ||||||||||||||||||||||||
| Closing Market Price per Common Share |
NAV per Common Share on Date of Market Price |
Premium/(Discount) on Date of Market Price |
||||||||||||||||||||||
| Fiscal Quarter End | High | Low | High | Low | High | Low | ||||||||||||||||||
| July 2025 | $ |
$ |
$ |
$ |
( |
( |
||||||||||||||||||
| April 2025 | $ |
$ |
$ |
$ |
( |
( |
||||||||||||||||||
| January 2025 | $ |
$ |
$ |
$ |
( |
( |
||||||||||||||||||
| October 2024 | $ |
$ |
$ |
$ |
( |
( |
||||||||||||||||||
| July 2024 | $ |
$ |
$ |
$ |
( |
( |
||||||||||||||||||
| April 2024 | $ |
$ |
$ |
$ |
( |
( |
||||||||||||||||||
| January 2024 | $ |
$ |
$ |
$ |
( |
( |
||||||||||||||||||
| October 2023 | $ |
$ |
$ |
$ |
( |
( |
||||||||||||||||||
| JQC | ||||||||||||||||||||||||
| Closing Market Price per Common Share |
NAV per Common Share on Date of Market Price |
Premium/(Discount) on Date of Market Price |
||||||||||||||||||||||
| Fiscal Quarter End | High | Low | High | Low | High | Low | ||||||||||||||||||
| July 2025 | $5.53 | $5.20 | $5.66 | $5.62 | (2.30)% | (7.47)% | ||||||||||||||||||
| April 2025 | $5.59 | $4.83 | $5.87 | $5.53 | (4.77)% | (12.66)% | ||||||||||||||||||
| January 2025 | $5.93 | $5.56 | $5.95 | $5.86 | (0.34)% | (5.12)% | ||||||||||||||||||
| October 2024 | $5.91 | $5.44 | $5.93 | $5.85 | (0.34)% | (7.01)% | ||||||||||||||||||
| July 2024 | $5.73 | $5.53 | $5.91 | $5.88 | (3.05)% | (5.95)% | ||||||||||||||||||
| April 2024 | $5.64 | $5.32 | $5.96 | $5.91 | (5.37)% | (9.98)% | ||||||||||||||||||
| January 2024 | $5.37 | $4.98 | $5.91 | $5.82 | (9.14)% | (14.43)% | ||||||||||||||||||
| October 2023 | $5.14 | $4.83 | $5.85 | $5.74 | (12.14)% | (15.85)% | ||||||||||||||||||
| JPC | ||||||||||||||||||||||||
| Closing Market Price per Common Share |
NAV per Common Share on Date of Market Price |
Premium/(Discount) on Date of Market Price |
||||||||||||||||||||||
| Fiscal Quarter End | High | Low | High | Low | High | Low | ||||||||||||||||||
| July 2025 | $8.17 | $7.77 | $8.03 | $7.81 | 1.74% | (0.51)% | ||||||||||||||||||
| April 2025 | $8.07 | $7.05 | $8.04 | $7.63 | 0.37% | (7.60)% | ||||||||||||||||||
| January 2025 | $8.16 | $7.83 | $8.14 | $7.97 | 0.25% | (1.76)% | ||||||||||||||||||
| October 2024 | $8.23 | $7.46 | $8.25 | $7.94 | (0.24)% | (6.05)% | ||||||||||||||||||
| July 2024 | $7.80 | $7.11 | $8.08 | $7.86 | (3.47)% | (9.54)% | ||||||||||||||||||
| April 2024 | $7.30 | $6.80 | $7.87 | $7.81 | (7.24)% | (12.93)% | ||||||||||||||||||
| January 2024 | $7.29 | $6.16 | $7.90 | $7.26 | (7.72)% | (15.15)% | ||||||||||||||||||
| October 2023 | $6.62 | $5.96 | $7.42 | $7.07 | (10.78)% | (15.70)% | ||||||||||||||||||
141
Shareholder Update (continued)
The following table shows, as of July 31, 2025 each Fund’s: (i) NAV per Common Share, (ii) market price, (iii) percentage of premium/(discount) to NAV per Common Share and, (iv) net assets attributable to Common Shares.
| July 31, 2025 | JFR | JQC | JPC | |||||||||
| NAV per Common Share | $ |
$5.66 | $8.01 | |||||||||
| Market Price | $ |
$5.53 | $8.07 | |||||||||
| Percentage of Premium/(Discount) to NAV per Common Share | ( |
(2.30)% | 0.75% | |||||||||
| Net Assets Attributable to Common Shares | $1,420,503,021 | $837,305,225 | $2,615,446,069 | |||||||||
Shares of closed‑end investment companies, including those of the Funds, may frequently trade at prices lower than NAV, the Funds’ Board of Trustees (Board) has currently determined that, at least annually, it will consider action that might be taken to reduce or eliminate any material discount from NAV in respect of Common Shares, which may include the repurchase of such shares in the open market or in private transactions, the making of a tender offer for such shares at NAV, or the conversion of the Fund to an open‑end investment company. The Funds cannot assure you that their Board will decide to take any of these actions, or that share repurchases or tender offers will actually reduce market discount.
SENIOR SECURITIES
The following table sets forth information regarding each Fund’s outstanding senior securities as of the end of each of the Fund’s last ten fiscal years, as applicable. Each Fund’s senior securities during this time period are comprised of borrowings that constitute “senior securities” as defined in the Investment Company Act of 1940, as amended (1940 Act). The information in this table is derived from the financial statements. The financial statements for the year ended July 31, 2025 have been audited by PricewaterhouseCoopers LLP (“PwC”), independent registered public accounting firm. The financial statements with respect to the fiscal years ended prior to 2025, where applicable, have been audited by other auditors. The Funds’ audited financial statements for the year ended July 31, 2025, including the report of PwC thereon, and accompanying notes thereto, are included in this Annual Report.
JFR
| Borrowings Outstanding at the End of Period |
Taxable Fund Preferred (TFP) Shares at the End of Period |
Term Preferred Shares at the End of Period |
Variable Rate Term Preferred (VRTP) Shares at the End of Period |
|||||||||||||||||||||||||||||||||
| Year Ended 7/31: | Aggregate Amount Outstanding (000) (1) |
Asset Coverage Per $1,000 (2) |
Aggregate Amount Outstanding (000) (1) |
Asset Coverage Per $1,000 (3) |
Aggregate Amount Outstanding (000) (1) |
Asset Coverage Per $1,000 (3) |
Aggregate Amount Outstanding (000) (1) |
Asset Coverage Per $100,000 (4) |
Asset Coverage Per $1 Liquidation Preference (5) |
|||||||||||||||||||||||||||
| 2025 | $ |
$ |
$ |
$ |
$ |
$ |
$ |
$ |
$ |
|||||||||||||||||||||||||||
| 2024 | $ |
$ |
$ |
$ |
$ |
$ |
$ |
$ |
$ |
|||||||||||||||||||||||||||
| 2023 | $ |
$ |
$ |
$ |
$ |
$ |
$ |
$ |
$ |
|||||||||||||||||||||||||||
| 2022 | $ |
$ |
$ |
$ |
$ |
$ |
$ |
$ |
$ |
|||||||||||||||||||||||||||
| 2021 | $ |
$ |
$ |
$ |
$ |
$ |
$ |
$ |
$ |
|||||||||||||||||||||||||||
| 2020 | $ |
$ |
$ |
$ |
$ |
$ |
$ |
$ |
$ |
|||||||||||||||||||||||||||
| 2019 | $ |
$ |
$ |
$ |
$ |
$ |
$ |
$ |
$ |
|||||||||||||||||||||||||||
| 2018 | $ |
$ |
$ |
$ |
$ |
$ |
$ |
$ |
$ |
|||||||||||||||||||||||||||
| 2017 | $ |
$ |
$ |
$ |
$ |
$ |
$ |
$ |
$ |
|||||||||||||||||||||||||||
| 2016 | $ |
$ |
$ |
$ |
$ |
$ |
$ |
$ |
$ |
|||||||||||||||||||||||||||
142
JQC
| Borrowings Outstanding at the End of Period |
Taxable Fund Preferred (TFP) Shares at the End of Period |
|||||||||||||||||||
| Year Ended 7/31: | Aggregate Amount Outstanding (000) (1) |
Asset Coverage Per $1,000 (2) |
Aggregate Amount Outstanding (000) (1) |
Asset Coverage Per $1,000 (3) |
Asset Coverage Per $1 Liquidation Preference (5) |
|||||||||||||||
| 2025 | $211,600 | $5,619 | $140,000 | $3,381 | $3.38 | |||||||||||||||
| 2024 | $211,600 | $5,447 | $140,000 | $3,278 | $3.28 | |||||||||||||||
| 2023 | $211,600 | $5,395 | $140,000 | $3,247 | $3.25 | |||||||||||||||
| 2022 | $246,000 | $4,931 | $140,000 | $3,143 | $3.14 | |||||||||||||||
| 2021 | $402,000 | $3,333 | $0 | $0 | $0 | |||||||||||||||
| 2020 | $402,000 | $3,320 | $0 | $0 | $0 | |||||||||||||||
| 2019 | $480,000 | $3,400 | $0 | $0 | $0 | |||||||||||||||
| 2018 | $561,000 | $3,205 | $0 | $0 | $0 | |||||||||||||||
| 2017 | $561,000 | $3,256 | $0 | $0 | $0 | |||||||||||||||
| 2016 | $561,000 | $3,238 | $0 | $0 | $0 | |||||||||||||||
JPC
| Borrowings Outstanding at the End of Period |
Taxable Fund Preferred (TFP) Shares at the End of Period |
|||||||||||||||||||
| Year Ended 7/31: | Aggregate Amount Outstanding (000) (1) |
Asset Coverage Per $1,000 (2) |
Aggregate Amount Outstanding (000) (1) |
Asset Coverage Per $1,000 (3) |
Asset Coverage Per $1 Liquidation Preference (5) |
|||||||||||||||
| 2025 | $649,000 | $5,677 | $420,000 | $3,447 | $3.45 | |||||||||||||||
| 2024 | $689,000 | $5,331 | $420,000 | $3,312 | $3.31 | |||||||||||||||
| 2023 | $219,600 | $5,249 | $150,000 | $3,119 | $3.12 | |||||||||||||||
| 2022 | $423,400 | $3,088 | $0 | $0 | $0 | |||||||||||||||
| 2021 | $462,700 | $3,223 | $0 | $0 | $0 | |||||||||||||||
| 2020 | $400,000 | $3,280 | $0 | $0 | $0 | |||||||||||||||
| 2019 | $455,000 | $3,303 | $0 | $0 | $0 | |||||||||||||||
| 2018 | $437,000 | $3,403 | $0 | $0 | $0 | |||||||||||||||
| 2017 | $540,000 | $3,079 | $0 | $0 | $0 | |||||||||||||||
| 2016 | $404,100 | $3,526 | $0 | $0 | $0 | |||||||||||||||
| (1) | |
| (2) | |
| (3) | |
| (4) | |
| (5) | |
143
Shareholder Update (continued)
UNRESOLVED STAFF COMMENTS
Each Fund believes that there are no material unresolved written comments, received 180 days or more before July 31, 2025, from the Staff of the Securities and Exchange Commission (SEC) regarding any of its periodic or current reports under the Securities Exchange Act or Investment Company Act of 1940, or its registration statement.
144
Important Tax Information
(Unaudited)
As required by the Internal Revenue Code and Treasury Regulations, certain tax information, as detailed below, must be provided to shareholders. Shareholders are advised to consult their tax advisor with respect to the tax implications of their investment. The amounts listed below may differ from the actual amounts reported on Form 1099‑DIV, which will be sent to shareholders shortly after calendar year end.
Long-Term Capital Gains
As of year end, each Fund designates the following distribution amounts, or maximum amount allowable, as being from net long-term capital gains pursuant to Section 852(b)(3) of the Internal Revenue Code:
| Fund | Net Long‑Term Capital Gains |
|||
| JFR |
$— | |||
| JQC |
— | |||
| JPC |
— | |||
| JPI |
— | |||
| NPFD |
— | |||
Dividends Received Deduction (DRD)
Each Fund listed below had the following percentage, or maximum amount allowable, of ordinary income distributions eligible for the dividends received deduction for corporate shareholders:
| Fund | Percentage | |||
| JFR |
0.9 | % | ||
| JQC |
0.4 | |||
| JPC |
46.8 | |||
| JPI |
70.9 | |||
| NPFD |
65.2 | |||
Qualified Dividend Income (QDI)
Each Fund listed below had the following percentage, or maximum amount allowable, of ordinary income distributions treated as qualified dividend income for individuals pursuant to Section 1(h)(11) of the Internal Revenue Code:
| Fund | Percentage | |||
| JFR |
0.9 | % | ||
| JQC |
0.4 | |||
| JPC |
90.5 | |||
| JPI |
100.0 | |||
| NPFD |
99.5 | |||
Qualified Interest Income (QII)
Each Fund listed below had the following percentage, or maximum amount allowable, of ordinary income distributions treated as qualified interest income and/or short-term capital gain dividends pursuant to Section 871(k) of the Internal Revenue Code:
145
Important Tax Information (continued)
| Fund | Prior Year End to 12/31 Percentage |
1/1 to Current Year End Percentage |
||||||
| JFR |
76.4 | % | 84.0 | % | ||||
| JQC |
37.5 | 100.0 | ||||||
| JPC |
3.5 | 20.1 | ||||||
| JPI |
13.4 | 3.0 | ||||||
| NPFD |
5.7 | 77.4 | ||||||
163(j)
Each Fund listed below had the following percentage, or maximum amount allowable, of ordinary dividends treated as Section 163(j) interest dividends pursuant to Section 163(j) of the Internal Revenue Code:
| Fund | Percentage | |||
| JFR |
99.6 | % | ||
| JQC |
100.0 | |||
| JPC |
11.9 | |||
| JPI |
9.2 | |||
| NPFD |
10.8 | |||
146
Shareholder Meeting Report
(Unaudited)
The annual meeting of shareholders for JFR and JQC was held on April 17, 2025; at this meeting the shareholders were asked to elect Board Members.
The vote totals for JFR and JQC are set forth below:
| JFR | JQC | |||||||||||||||
| Common and Preferred shares voting together as a class |
Preferred shares |
Common and Preferred shares voting together as a class |
Preferred shares |
|||||||||||||
| Approval of the Board Members was reached as follows: |
| |||||||||||||||
| Michael A. Forrester |
||||||||||||||||
| For |
99,705,776 | — | 101,199,956 | — | ||||||||||||
| Withhold |
3,349,300 | — | 4,259,974 | — | ||||||||||||
| Total |
103,055,076 | — | 105,459,930 | — | ||||||||||||
| Thomas J. Kenny |
||||||||||||||||
| For |
99,022,805 | — | 100,006,416 | — | ||||||||||||
| Withhold |
4,032,271 | — | 5,453,514 | — | ||||||||||||
| Total |
103,055,076 | — | 105,459,930 | — | ||||||||||||
| Robert L. Young |
||||||||||||||||
| For |
98,935,774 | — | 99,905,624 | — | ||||||||||||
| Withhold |
4,119,302 | — | 5,554,306 | — | ||||||||||||
| Total |
103,055,076 | — | 105,459,930 | — | ||||||||||||
| Albin F. Moschner |
||||||||||||||||
| For |
— | 285,000 | — | 109,000 | ||||||||||||
| Withhold |
— | — | — | — | ||||||||||||
| Total |
— | 285,000 | — | 109,000 | ||||||||||||
| Margaret L. Wolff |
||||||||||||||||
| For |
— | 285,000 | — | 109,000 | ||||||||||||
| Withhold |
— | — | — | — | ||||||||||||
| Total |
— | 285,000 | — | 109,000 | ||||||||||||
147
Shareholder Meeting Report (continued)
The special meeting of shareholders for JPC was held on July 25, 2025 for shareholders of record on April 16, 2025; at this meeting the shareholders were asked to approve an Agreement and Plan of Merger.
The vote totals for JPC are set forth below:
| JPC | ||||
| Preferred shares |
||||
| To approval an Agreement and Plan of Merger: |
| |||
| For |
370,000 | |||
| Against |
— | |||
| Abstain |
— | |||
| Broker Non‑Votes |
— | |||
| Total |
370,000 | |||
148
The annual meeting of shareholders for JPI was held on July 25, 2025 and subsequently adjourned to August 29, 2025; at this meeting the shareholders were asked to elect Board Members. Additionally, JPI shareholders were asked to approve an Agreement and Plan of Merger.
The vote totals for JPI are set forth below:
| JPI | ||||
| Common shares |
||||
| Approval of the Board Members was reached as follows: |
| |||
| Michael A. Forrester |
||||
| For |
11,494,913 | |||
| Withhold |
404,438 | |||
| Total |
11,899,351 | |||
| Thomas J. Kenny |
||||
| For |
11,479,481 | |||
| Withhold |
419,870 | |||
| Total |
11,899,351 | |||
| Margaret L. Wolff |
||||
| For |
11,499,987 | |||
| Withhold |
399,364 | |||
| Total |
11,899,351 | |||
| Robert L. Young |
||||
| For |
11,488,056 | |||
| Withhold |
411,295 | |||
| Total |
11,899,351 | |||
| To approval an Agreement and Plan of Merger |
| |||
| For |
7,154,437 | |||
| Against |
299,931 | |||
| Abstain |
299,232 | |||
| Broker Non‑Votes |
4,377,837 | |||
| Total |
12,131,437 | |||
149
Shareholder Meeting Report (continued)
The annual meeting of shareholders for NPFD was held on April 17, 2025; at this meeting the shareholders were asked to elect Board Members.
The vote totals for NPFD are set forth below:
| NPFD | ||||||||
| Common and Preferred shares voting together as a class |
Preferred Shares |
|||||||
| Approval of the Board Members was reached as follows: |
| |||||||
| Thomas J. Kenny |
||||||||
| For |
17,178,885 | — | ||||||
| Withhold |
898,561 | — | ||||||
| Total |
18,077,446 | — | ||||||
| Joanne T. Medero |
||||||||
| For |
17,292,549 | — | ||||||
| Withhold |
784,897 | — | ||||||
| Total |
18,077,446 | — | ||||||
| Loren M. Starr |
||||||||
| For |
16,899,631 | — | ||||||
| Withhold |
1,177,815 | — | ||||||
| Total |
18,077,446 | — | ||||||
| Matthew Thornton III |
||||||||
| For |
16,889,294 | — | ||||||
| Withhold |
1,188,152 | — | ||||||
| Total |
18,077,446 | — | ||||||
| Robert L. Young |
||||||||
| For |
16,894,213 | — | ||||||
| Withhold |
1,183,233 | — | ||||||
| Total |
18,077,446 | — | ||||||
| Albin F. Moschner |
||||||||
| For |
— | 85,000 | ||||||
| Withhold |
— | — | ||||||
| Total |
— | 85,000 | ||||||
| Margaret L. Wolff |
||||||||
| For |
— | 85,000 | ||||||
| Withhold |
— | — | ||||||
| Total |
— | 85,000 | ||||||
150
Additional Fund Information
(Unaudited)
| Board of Trustees | ||||||||||||
| Joseph A. Boateng | Michael A. Forrester | Thomas J. Kenny | Amy B.R. Lancellotta | Joanne T. Medero | Albin F. Moschner | John K. Nelson | ||||||
| Loren M. Starr | Matthew Thornton III | Terence J. Toth | Margaret L. Wolff | Robert L. Young |
| Investment Adviser | Custodian | Legal Counsel | Independent Registered | Transfer Agent and | ||||
| Nuveen Fund Advisors, LLC | State Street Bank | Chapman and Cutler | Public Accounting Firm | Shareholder Services | ||||
| 333 West Wacker Drive | & Trust Company | LLP | PricewaterhouseCoopers | Computershare Trust Company, | ||||
| Chicago, IL 60606 | One Congress Street | Chicago, IL 60606 | LLP | N.A. | ||||
| Suite 1 | One North Wacker Drive | 150 Royall Street | ||||||
| Boston, MA 02114-2016 | Chicago, IL 60606 | Canton, MA 02021 | ||||||
| (800) 257-8787 |
Portfolio of Investments Information Each Fund is required to file its complete schedule of portfolio holdings with the Securities and Exchange Commission (SEC) for the first and third quarters of each fiscal year as an exhibit to its report on Form N‑PORT. You may obtain this information on the SEC’s website at http://www.sec.gov.
Active Shelf Offering Statement of Additional Information (SAI) for JPC The SAI for the active shelf offerings for JPC contains additional information about the Fund’s Board of Trustees. You may obtain a copy of the fund’s SAI without charge, upon request, by calling Nuveen at (312) 917‑7700, by writing to the Fund, or on Nuveen’s website at www.nuveen.com. You may also obtain this information on the SEC’s website at http://www.sec.gov.
Nuveen Funds’ Proxy Voting Information You may obtain (i) information regarding how each fund voted proxies relating to portfolio securities held during the most recent twelve-month period ended June 30, without charge, upon request, by calling Nuveen toll-free at (800) 257‑8787 or on Nuveen’s website at www.nuveen.com and (ii) a description of the policies and procedures that each fund used to determine how to vote proxies relating to portfolio securities without charge, upon request, by calling Nuveen toll-free at (800) 257‑8787. You may also obtain this information directly from the SEC. Visit the SEC on‑line at http://www.sec.gov.
CEO Certification Disclosure Each Fund’s Chief Executive Officer (CEO) has submitted to the New York Stock Exchange (NYSE) the annual CEO certification as required by Section 303A.12(a) of the NYSE Listed Company Manual. Each Fund has filed with the SEC the certification of its CEO and Chief Financial Officer required by Section 302 of the Sarbanes-Oxley Act.
Common Share Repurchases Each Fund intends to repurchase, through its open-market share repurchase program, shares of its own common stock at such times and in such amounts as is deemed advisable. During the period covered by this report, each Fund repurchased shares of its common stock as shown in the accompanying table. Any future repurchases will be reported to shareholders in the next annual or semi-annual report.
| JFR | JQC | JPI | JPI | NPFD | ||||||||||||||||
| Common shares repurchased | 0 | 0 | 0 | 0 | 0 | |||||||||||||||
FINRA BrokerCheck: The Financial Industry Regulatory Authority (FINRA) provides information regarding the disciplinary history of FINRA member firms and associated investment professionals. This information as well as an investor brochure describing FINRA BrokerCheck is available to the public by calling the FINRA BrokerCheck Hotline number at (800) 289‑9999 or by visiting www.FINRA.org.
151
Glossary of Terms Used in this Report
(Unaudited)
19(a) Notice: Section 19(a) of the Investment Company Act of 1940 requires that the payment of any distribution which is made from a source other than the fund’s net income be accompanied by a written notice that discloses the estimated sources of such payment.
Average Annual Total Return: This is a commonly used method to express an investment’s performance over a particular, usually multi-year time period. It expresses the return that would have been necessary each year to equal the investment’s actual cumulative performance (including change in NAV or offer price and reinvested dividends and capital gains distributions, if any) over the time period being considered.
Collateralized Loan Obligation (CLO): A security backed by a pool of debt, often low rated corporate loans. Collateralized loan obligations (CLOs) are similar to collateralized mortgage obligations, except for the different type of underlying loan.
Contingent Capital Securities (CoCos): CoCos are debt or capital securities of primarily non‑U.S. issuers with loss absorption contingency mechanisms built into the terms of the security, for example a mandatory conversion into common stock of the issuer, or a principal write-down, which if triggered would likely cause the CoCo investment to lose value. Loss absorption mechanisms would become effective upon the occurrence of a specified contingency event, or at the discretion of a regulatory body. Specified contingency events, as identified in the CoCo’s governing documents, usually reference a decline in the issuer’s capital below a specified threshold level, and/or certain regulatory events. A loss absorption contingency event for CoCos would likely be the result of, or related to, the deterioration of the issuer’s financial condition and/or its status as a going concern. In such a case, with respect to CoCos that provide for conversion into common stock upon the occurrence of the contingency event, the market price of the issuer’s common stock received by the Acquiring Fund will have likely declined, perhaps substantially, and may continue to decline after conversion. CoCos rated below investment grade should be considered high yield securities, or “junk,” but often are issued by entities whose more senior securities are rated investment grade. CoCos are a relatively new type of security; and there is a risk that CoCo security issuers may suffer the sort of future financial distress that could materially increase the likelihood (or the market’s perception of the likelihood) that an automatic write-down or conversion event on those issuers’ CoCoswill occur. Additionally, the trading behavior of a given issuer’s CoCo may be strongly impacted by the trading behavior of other issuers’ CoCos, such that negative information from an unrelated CoCo security may cause a decline in value of one or more CoCos held by the Fund. Accordingly, the trading behavior of CoCos may not follow the trading behavior of other types of debt and preferred securities. Despite these concerns, the prospective reward vs. risk characteristics of at least certain CoCos may be very attractive relative to other fixed-income alternatives.
Duration: Duration is a measure of the expected period over which a bond’s principal and interest will be paid, and consequently is a measure of the sensitivity of a bond’s or bond fund’s value to changes when market interest rates change. Generally, the longer a bond’s or fund’s duration, the more the price of the bond or fund will change as interest rates change.
Effective Leverage: Effective leverage is a fund’s effective economic leverage, and includes both regulatory leverage (see below) and the leverage effects of certain derivative investments in the fund’s portfolio.
Leverage: Leverage is created whenever a fund has investment exposure (both reward and/or risk) equivalent to more than 100% of the investment capital.
Net Asset Value (NAV) Per Share: A fund’s Net Assets is equal to its total assets (securities, cash, accrued earnings and receivables) less its total liabilities. NAV per share is equal to the fund’s Net Assets divided by its number of shares outstanding.
Regulatory Leverage: Regulatory leverage consists of preferred shares issued by or borrowings of a fund. Both of these are part of a fund’s capital structure. Regulatory leverage is subject to asset coverage limits set forth in the Investment Company Act of 1940.
152
Statement Regarding Basis for Approval of Investment Advisory Contract
(Unaudited)
Nuveen Floating Rate Income Fund
Nuveen Credit Strategies Income Fund
Nuveen Preferred & Income Opportunities Fund
Nuveen Preferred Securities & Income Opportunities Fund
Nuveen Variable Rate Preferred & Income Fund
The Approval Process
At meetings held on April 28 and 29, 2025 (the “Meeting”), the Boards of Directors or Trustees (as the case may be) of the group of funds advised by Nuveen Fund Advisors, LLC (“NFAL” or the “Adviser”), including the Funds (as defined below), and the group of funds advised by Teachers Advisors, LLC (“TAL” and all such funds, collectively, the “Nuveen funds” or the “funds”) approved the renewal of the investment management agreements (each, an “Investment Management Agreement”) with NFAL and TAL, respectively. TAL and NFAL are affiliates as NFAL is a subsidiary of Nuveen, LLC, the investment arm of Teachers Insurance and Annuity Association of America (“TIAA”), and TAL is an indirect wholly owned subsidiary of TIAA. The Boards of Trustees of the Funds also approved the renewal of the sub‑advisory agreements (each, a “Sub‑Advisory Agreement”) with Nuveen Asset Management, LLC (the “Sub‑Adviser”). The Sub‑Adviser is also an affiliate of the Adviser.
The Boards of Directors or Trustees of the Nuveen funds are each a “Board” or collectively the “Board” (as the context may dictate) and the directors or trustees (as the case may be) are each a “Board Member.” The Board Members of each Board are not “interested persons” (as defined under the Investment Company Act of 1940 (the “1940 Act”)) and, therefore, each Board is deemed to be comprised of all disinterested Board Members. References to a Board and the Board Members are interchangeable.
In accordance with applicable law, following up to an initial two‑year period, the Board of each Fund considers the renewal of each Investment Management Agreement and Sub‑Advisory Agreement on behalf of the Fund on an annual basis. The Investment Management Agreements and Sub‑Advisory Agreements are collectively referred to as the “Advisory Agreements,” and the Adviser and the Sub‑Adviser are collectively the “Fund Advisers” and each a “Fund Adviser.” Below is a summary of the annual review process the Board undertook related to its most recent renewal of the Advisory Agreements with respect to each Nuveen fund covered by this report (each, a “Fund” and, collectively, the “Funds”).
To reach their determination, the Board Members considered the review of the Advisory Agreements to be an ongoing process. The Board Members employed the accumulated information, knowledge and experience they had gained during their tenure as disinterested Board Members on the respective Board of the Nuveen funds and its committees in overseeing the applicable funds and working with the respective investment advisers and sub‑advisers in their review of the advisory agreements for the fund complex. The Board and/or its committees meet regularly throughout the year and at these meetings, the Board Members received materials and discussed information covering a wide range of topics pertinent to the annual consideration of the renewal of the Advisory Agreements. Such topics include, but are not limited to, the investment performance of the funds over various periods; investment oversight matters; economic, market and regulatory developments; any significant organizational or other developments impacting a Fund Adviser and its strategic plans for its business; product initiatives for various funds; fund expenses; compliance, regulatory and risk management matters; trading practices; the derivatives risk management program; management of distributions; valuation of securities; payments to financial intermediaries; securities lending (as applicable); and closed‑end fund market activity, capital management initiatives, institutional ownership, management of leverage financing, the secondary market trading of the closed‑end funds and any actions taken to address market discounts to net asset value. The Board also seeks to meet at its regular quarterly meetings with members of senior management to discuss various topics, including market conditions, industry developments and any significant developments or strategic plans for the Fund Advisers, if any.
To help with the review of performance, the Board and/or its committees periodically received and discussed presentations from member(s) of investment teams throughout the year, culminating in an annual performance review of the Nuveen funds at the Board’s meeting held on February 25‑26, 2025 (the “February Meeting”). The presentations, discussions and meetings during the year provide a means for the Board Members to evaluate and consider the level, breadth and quality of services provided by the Fund Advisers and any changes to such services over time in light of new or modified regulatory requirements, changes to market conditions or other factors.
In addition to the materials and discussions that occurred at prior meetings, the Board, through its independent legal counsel, requested and received extensive materials and information prepared specifically for its review of the Advisory Agreements. During the year, management worked with an ad hoc committee established by the Board to help enhance and streamline the materials provided in connection with the annual review of the Advisory Agreements. The materials provided at the Meeting and/or prior meetings covered a wide range of matters including, but not limited to, a description of the nature, extent and quality of services provided by the Fund Advisers; a review of the Sub‑Adviser and applicable investment team; an analysis of fund performance with a focus on funds considered to have met certain challenged performance measurements; an analysis of the fees and expense ratios of the Nuveen funds with a focus on funds considered to have certain expense characteristics; a list of management fee and sub‑advisory fee schedules; an analysis of advisory fees compared to fees assessed to other types of clients; a description of portfolio manager compensation; certain profitability and/or financial data; and a description of indirect benefits received by the Fund Advisers as a result of their relationships with the Nuveen funds. The Board also considered information provided by Broadridge Financial Solutions, Inc. (“Broadridge”), an independent provider of investment company data, comparing fee and expense levels of each respective Fund to those of a peer universe.
153
Statement Regarding Basis for Approval of Investment Advisory Contract (continued)
The information prepared specifically for the annual review supplemented the information provided to the Board and its committees and the evaluations of the Nuveen funds by the Board and its committees during the year. The Board’s review of the Advisory Agreements is based on all the information provided to the Board and its committees over time. The performance, fee and expense data and other information provided by a Fund Adviser, Broadridge or other service providers were not independently verified by the Board Members.
As part of their review, the Board Members and independent legal counsel met in executive session on April 9, 2025 to review and discuss materials provided in connection with their annual review of the Advisory Agreements. After reviewing this information, the Board Members requested, directly or through independent legal counsel, additional information, and the Board subsequently reviewed and discussed the responses to these follow‑up questions and requests. The Board Members and independent legal counsel met again in executive session on April 17, 2025 (together with the April 9, 2025 executive session, the “Executive Sessions”) to discuss the responses to the initial supplemental information request and, following their review of the data provided, requested management present certain additional information at the Meeting. In addition to the Executive Sessions, the Board Members met in additional executive sessions prior to and during the Meeting. During the Meeting, the Board Members considered the responses, invited representatives of management to provide additional information and determined that the information provided (whether oral or written) was responsive to their requests.
The Board Members were advised by independent legal counsel during the annual review process as well as throughout the year, including meeting in executive sessions with such counsel at which no representatives of management were present. In connection with their annual review, the Board Members also received a memorandum from independent legal counsel outlining their fiduciary duties and legal standards in reviewing the Advisory Agreements, including guidance from court cases evaluating advisory fees.
After the discussions and with the background and knowledge described above, the Board Members approved the continuation of the Advisory Agreements on behalf of the applicable Funds for an additional one‑year period. The Board did not identify any single factor as all‑important or controlling, but rather each decision reflected the comprehensive consideration of all the information (written or oral) provided to the Board and its committees throughout the year as well as the materials prepared specifically in connection with the annual review process. The contractual arrangements may reflect the results of prior year(s) of review, negotiation and information provided in connection with the Board’s annual review of the Funds’ advisory arrangements and oversight of the Funds. Each Board Member may have attributed different levels of importance to the various factors and information considered in connection with the annual review process and may have placed different emphasis on the relevant information year to year in light of, among other things, changing market and economic conditions. A summary of the principal factors and information, but not all the factors, the Board considered in deciding to renew the Advisory Agreements is set forth below.
A. Nature, Extent and Quality of Services
In evaluating the renewal of the Advisory Agreements, the Board Members received and considered information regarding the nature, extent and quality of the applicable Fund Adviser’s services provided to each respective Fund. With this approach, they considered the roles of the Adviser and the Sub‑Adviser in providing services to the Funds.
The Board considered that the Adviser provides a wide array of management, oversight and other services to manage and operate the Funds. The Board considered the Adviser and its affiliates’ dedication of resources, time, people and capital as well as consistent program of improvement and innovation aimed at keeping the Nuveen fund complex relevant and attractive for existing and new investors and meeting the needs of an increasingly complex regulatory environment. Among the information provided in connection with the review of services at the Meeting and/or prior meetings, the Board considered a description of the organizational changes at the Adviser during the year, the management teams that comprise the various support and investment functions for the funds and the background of certain personnel who support the funds. The Board considered the significant resources, both financial and personnel, the Adviser and its affiliates had committed over the past several years in working to bring the asset management businesses of Nuveen and TIAA under one centralized umbrella and to consolidate their respective fund families to the benefit of the funds through, among other things, enhanced operating efficiencies, centralized investment leadership and a centralized shared resources and support model. To help ensure the continuation of services, the Board considered, among other things, management’s emphasis on succession planning and key person risk evaluation pursuant to which certain management team(s) meet annually to conduct a comprehensive review of successors to key positions, to develop and monitor corporate-wide standards and procedures in seeking to help ensure the firm may continue to operate in the event of business disruptions, and to review staffing and compensation levels to help remain competitive with peers in the industry. The Board considered a description of the application of business continuity plans and the periodic testing and review of such plans. As noted below, the Board also considered certain financial data of the Adviser and TIAA in assessing the financial stability and condition of the Adviser to provide a high level of quality of services to the Funds.
In its review, the Board considered that the Funds operated in a highly regulated industry and the scope and complexity of the services and resources that the Adviser and its affiliates must provide to manage and operate the Funds have expanded over the years due to regulatory, market and other developments. Such services included maintaining and monitoring the Nuveen funds’ compliance programs, risk management programs, liquidity risk management programs, derivatives risk management programs and cybersecurity programs. The Board and/or its Compliance, Risk Management and Regulatory Oversight Committee received reports regarding the funds’ compliance policies and procedures and matters undertaken thereunder as well as other compliance initiatives on a regular basis.
In considering the breadth and quality of services the Adviser and its various teams provide, the Board considered that the Adviser provides investment advisory services. With respect to the Funds, such Funds utilize the Sub‑Adviser to manage the portfolios of the Funds subject to the supervision of the Adviser. Accordingly, the Board considered that the Adviser and its affiliates, among other things, oversee and review the performance of the Sub‑Adviser and its investment team(s); evaluate Fund performance and market conditions; evaluate investment strategies and recommend changes thereto; oversee trade execution and, as applicable, securities lending; evaluate investment risks; and manage valuation matters. As noted below, the Board also considered the Nuveen funds’ performance over various time periods throughout the year.
154
In addition to the portfolio management services provided to the Funds (including indirectly by overseeing the Sub‑Adviser), the Board considered the extensive compliance, regulatory, administrative and other services the Adviser and its various teams or affiliates provide to manage and operate the applicable funds, including but not limited to: distribution management services pursuant to which management seeks to implement distribution policies and set distribution levels consistent with each fund’s product design and positioning; compliance services including establishing and maintaining broad-based compliance policies across the Nuveen fund complex, evaluating the compliance programs of various fund services providers, conducting ongoing risk assessments and testing, monitoring portfolio compliance with investment and regulatory requirements and providing a comprehensive compliance training program; providing regulatory advocacy services, including submitting comments on regulatory proposals and monitoring regulatory developments that may impact the fund(s); providing support to the Board and its committees throughout the year, including providing reports on a wide range of topics relating to the operations and management of the funds, helping to refine the materials provided to the Board and/or its committees and providing educational sessions on various topics; establishing and reviewing the services provided by other fund service providers (such as a fund’s custodian, accountant, and transfer agent); providing legal support services; and evaluating trade allocation and execution.
Such services also include managing leverage; providing capital management and secondary market services (such as implementing common share shelf offerings, capital return programs and common share repurchases); and maintaining a closed‑end fund investor relations program. The Board considered that management actively monitors any discount from net asset value per share at which a fund’s common stock trades and evaluates potential avenues to mitigate the discount, including evaluating the level of distributions that the fund pays.
Aside from the services provided, the Board considered the financial resources of the Adviser and/or its affiliates and their willingness to make investments to support the funds. The Board considered the funds’ access to a seed capital budget provided by the Adviser and/or its affiliates to support new or existing funds and/or facilitate changes for a respective fund. The Board considered the benefits to shareholders of investing in a Fund that is a part of a large fund complex with a variety of investment disciplines, capabilities, and expertise. The Board considered the overall reputation and capabilities of the Adviser and its affiliates and the Adviser’s continuing commitment to provide high quality services.
In its review, the Board also considered the significant risks borne by the Adviser and its affiliates in connection with their services to the Nuveen funds, including entrepreneurial risks in sponsoring and supporting new funds and smaller funds and ongoing risks with managing the Funds, such as investment, operational, reputational, regulatory, compliance and litigation risks.
The Board considered the division of responsibilities between the Adviser and the Sub‑Adviser and considered that the Sub‑Adviser and its investment personnel, as noted, generally are responsible for the management of the respective Fund’s portfolio under the oversight of the Adviser and the Board. The Board considered an analysis of the Sub‑Adviser provided by the Adviser which included, among other things, a summary of changes (if any) in the leadership teams and/or portfolio manager teams; the performance of the funds sub‑advised by the Sub‑Adviser over various periods of time that met certain performance screening measurements; and data reflecting product changes (if any) taken with respect to certain funds. The Board considered that the Adviser recommended the renewal of the Sub‑Advisory Agreements.
Based on its review, the Board determined, in the exercise of its reasonable business judgment, that it was satisfied with the nature, extent and quality of services provided to the respective Funds under each applicable Advisory Agreement.
B. The Investment Performance of the Funds and Fund Advisers
In evaluating the quality of the services provided by the Fund Advisers, the Board also considered a variety of investment performance data of the Funds. In leading up to the annual review, the Board and/or its Investment Committee considered, among other things, Fund performance (based on net asset value net of fees) over the quarter, one‑, three- and five-year periods ending December 31, 2024 (or for such shorter periods to the extent a Fund was not in existence during such periods) on an absolute basis and as compared to the performance of comparable peers (the “Performance Peer Group”) and to a benchmark for the prescribed periods. Prior to the Meeting, the Board also received updated Fund performance over the quarter, one‑, three- and five-year periods ended March 31, 2025 (or for such shorter periods to the extent a Fund was not in existence during such periods) on an absolute basis and in comparison to the Performance Peer Group and a benchmark for the prescribed periods. In its review of relative performance, the Board considered a Fund’s performance relative to its Performance Peer Group, among other things, by evaluating its quartile ranking with the 1st quartile representing the top performing funds within the Performance Peer Group and the 4th quartile representing the lowest performing funds.
The Board took into account the performance data, presentations and discussions (written and oral) that were provided at the Meeting and in prior meetings over time in evaluating fund performance, including particular focus on management’s analysis of the performance of funds that met certain screening measurements as determined pursuant to a methodology approved by the Board or additional measurements as determined by management’s investment analysts. As various Nuveen funds have modified their portfolio teams and/or made significant changes to their portfolio strategies over time, the Board reviewed, among other things, certain tracking performance data over specific periods comparing performance before and after such changes.
In evaluating performance, the Board considered some of the limitations of the performance data. The Board considered, among other things, that performance data reflects performance over a specified period which may differ significantly depending on the ending dates selected, particularly during periods of market volatility. Further, the Board considered that regardless of the performance period reviewed by the Board, shareholders may evaluate performance based on their own respective holding periods which may differ from the performance periods reviewed by the Board and lead to differing results. With respect to comparative performance, the Board considered that differing investment objectives, investment strategies, dates of inception, type and cost of leverage (if any), asset size and other factors between the Performance Peer Group and the respective Fund necessarily lead to differences in performance results. Similarly, differences in the investment objective(s) and strategies of a Fund and its benchmark (particularly an actively managed fund that does not directly follow an index) as well as the costs of operating a Fund would contribute to differences in performance results. To assist the Board in its review of the comparability of the relative performance, management generally has ranked the relevancy of the Performance Peer Groups to the applicable funds (subject to certain exceptions) as low, medium or high.
155
Statement Regarding Basis for Approval of Investment Advisory Contract (continued)
The Board also considered that secondary market trading of shares of the closed‑end funds also continues to be a priority for the Board given its importance to shareholders, and therefore, the Board and/or its Closed‑End Fund Committee reviews certain performance data reflecting, among other things, the premiums and discounts at which the shares of the closed‑end funds have traded as of specified dates at their quarterly meetings with an annual review of the closed‑end fund market for the 2024 calendar year at its February Meeting. In its review, the Board considered, among other things, market conditions for closed‑end funds, changes to investment mandates and guidelines, distribution policies, and leverage management; additional share offerings, share repurchases (if any) and similar capital market actions; and effective communications programs to build greater awareness and deepen understanding of closed‑end funds. As applicable, the Board considered, among other things, the impact of leverage on a closed‑end fund’s common share earnings and total return.
The Board evaluated performance in light of various relevant factors which may include, among other things, general market conditions, issuer- specific information, asset class information, leverage and fund cash flows. The Board considered that long-term performance could be impacted by even one period of significant outperformance or underperformance and that a single investment theme could disproportionately affect performance. Further, the Board considered that market and economic conditions may significantly impact a Fund’s performance, particularly over shorter periods, and such performance may be more reflective of such economic or market events and not necessarily reflective of management skill. Although the Board reviews short-, intermediate- and longer-term performance data, the Board considered that longer periods of performance may reflect full market cycles.
In their review from year to year, the Board Members consider and may place different emphasis on the relevant information in light of changing circumstances in market and economic conditions. In evaluating performance, the Board focused particular attention on funds with less favorable performance records. However, depending on the facts and circumstances, including any differences between the respective fund and its benchmark and/or Performance Peer Group, the Board may be satisfied with a fund’s performance notwithstanding that its performance may be below that of its benchmark and/or peer group for certain periods. With respect to any funds for which the Board has identified performance issues, the Board seeks to monitor such funds more closely until performance improves, discuss with the Adviser the reasons for such results, consider whether any steps are necessary or appropriate to address such issues, discuss and evaluate the potential consequences of such steps and review the results of any steps undertaken.
The performance determinations with respect to each Fund are summarized below:
| • | For Nuveen Floating Rate Income Fund, the Board considered that although the Fund’s performance was below the performance of its benchmark for the three- and five-year periods ended December 31, 2024, the Fund outperformed its benchmark for the one‑year period ended December 31, 2024. In addition, the Fund ranked in the second quartile of its Performance Peer Group for the one- and three-year periods and the third quartile for the five-year period ended December 31, 2024. On the basis of the Board’s ongoing review of investment performance and all relevant factors, including the relative market conditions during certain reporting periods, the Fund’s investment objective(s) and management’s discussion of performance, the Board concluded that the Fund’s performance supported renewal of the Advisory Agreements. |
| • | For Nuveen Credit Strategies Income Fund, the Board considered that although the Fund’s performance was below the performance of its benchmark for the three- and five-year periods ended December 31, 2024, the Fund outperformed its benchmark for the one‑year period ended December 31, 2024. Further, although the Fund ranked in the fourth quartile of its Performance Peer Group for the five- year period ended December 31, 2024, the Fund ranked in the second quartile of its Performance Peer Group for the one‑year period and third quartile for the three-year period ended December 31, 2024. On the basis of the Board’s ongoing review of investment performance and all relevant factors, including the relative market conditions during certain reporting periods, the Fund’s investment objective(s) and management’s discussion of performance, the Board concluded that the Fund’s performance supported renewal of the Advisory Agreements. |
| • | For Nuveen Preferred & Income Opportunities Fund, the Board considered that although the Fund’s performance was below the performance of its benchmark for the five-year period ended December 31, 2024, the Fund outperformed its benchmark for the one‑and three-year periods ended December 31, 2024. Further, although the Fund ranked in the fourth quartile of its Performance Peer Group for the five-year period ended December 31, 2024, the Fund ranked in the second quartile for the one‑year period and third quartile for the three-year period ended December 31, 2024. On the basis of the Board’s ongoing review of investment performance and all relevant factors, including the relative market conditions during certain reporting periods, the Fund’s investment objective(s) and management’s discussion of performance, the Board concluded that the Fund’s performance supported renewal of the Advisory Agreements. |
| • | For Nuveen Preferred Securities & Income Opportunities Fund, the Board considered that although the Fund’s performance was below the performance of its benchmark and ranked in the fourth quartile of its Performance Peer Group for the three- and five-year periods ended December 31, 2024, the Fund outperformed its benchmark and ranked in the third quartile of its Performance Peer Group for the one‑ year period ended December 31, 2024. On the basis of the Board’s ongoing review of investment performance and all relevant factors, including the relative market conditions during certain reporting periods, the Fund’s investment objective(s) and management’s discussion of performance, the Board concluded that the Fund’s performance supported renewal of the Advisory Agreements. |
| • | For Nuveen Variable Rate Preferred & Income Fund, the Board considered that although the Fund’s performance was below the performance of its benchmark and ranked in the fourth quartile of its Performance Peer Group for the three-year period ended December 31, 2024, the Fund outperformed its benchmark and ranked in the second quartile of its Performance Peer Group for the one‑year period ended December 31, 2024. On the basis of the Board’s ongoing review of investment performance and all relevant factors, including the relative market conditions during certain reporting periods, the Fund’s investment objective(s) and management’s discussion of performance, the Board concluded that the Fund’s performance supported renewal of the Advisory Agreements. |
156
C. Fees, Expenses and Profitability
| 1. | Fees and Expenses |
As part of the annual review, the Board Members considered, among other things, the management fee schedules for the respective Fund. In addition to the management fee arrangements, the Board Members considered a Fund’s operating expense ratio as it more directly reflected a shareholder’s total costs in investing in the respective Fund.
In its review, the Board considered that the management fees of the Funds were generally comprised of two components, a fund-level component and a complex-level component, each with its own breakpoint schedule, subject to certain exceptions. The Board considered that in 2024, the Board approved a revised complex-wide breakpoint schedule which simplified and reduced the complex-level fee rates at various thresholds and expanded the eligible funds whose assets would be included in calculating the complex-level fee, effective May 1, 2024. The Board considered that the complex-level component is intended to be an efficient mechanism designed to help share cost efficiencies with shareholders as the complex-wide assets grow.
The Board also considered comparative fee and expense information prepared by an independent third-party provider of fund data. More specifically, the Board Members generally reviewed, among other things, each Fund’s management fee rates and net total expense ratio in relation to similar data for a comparable universe of peers (the “Expense Universe”). In their review, the Board Members considered, in particular, each fund with a net total expense ratio (based on common assets and excluding investment-related costs such as the costs of leverage and taxes) meeting certain expense screening criteria adopted by the Board when compared to its Expense Universe and management’s commentary as to the factors contributing to each such fund’s relative net total expense ratio. The Board also considered, in relevant part, a fund’s management fee in light of its performance history with particular focus on any fund identified as having a higher management fee and/or expense ratio compared to peers coupled with experiencing a period of challenged performance.
In their review, the Board Members considered the methodology Broadridge employed to establish its Expense Universe. The Board further considered that differences between the applicable Fund and its Expense Universe, as well as changes to the composition of the Expense Universe from year to year, may limit some of the value of the comparative data. The Board Members also considered that it can be difficult to compare management fees among funds with peers as there are variations in the services that are included for the fees paid. The Board Members took these limitations and differences into account when reviewing comparative peer data.
In addition, although the Board reviewed net total expense ratio both including and excluding investment-related expenses (e.g., leverage costs), as applicable, the Board considered that leverage expenses will vary across funds and peers because of differences in the forms and terms of leverage employed by the respective fund and therefore generally considered each closed‑end fund’s net total expense ratio and fees excluding investment-related costs and taxes. The Board also considered that the use of leverage may create a conflict of interest for the respective Adviser and Sub‑Adviser given the increase of assets from leverage upon which an advisory or sub‑advisory fee is based but also considered the impact of leverage on the fund’s return. The Board Members considered, however, that the Adviser and Sub‑Adviser would seek to manage the potential conflict by recommending to the Board to leverage the applicable fund or increase such leverage when the respective Fund Adviser has determined that such action would be in the best interests of the respective fund and its common shareholders and by periodically reviewing with the Board the fund’s performance and the impact of the use of leverage on that performance.
With respect to the Sub‑Adviser, the Board also considered, among other things, the sub‑advisory fee schedule paid to the Sub‑Adviser in light of the sub‑advisory services provided to the respective Fund. In its review, the Board considered that the compensation paid to the Sub‑Adviser is the responsibility of the Adviser, not the Funds.
The Board’s considerations regarding the comparative fee data for each Fund are set forth below:
• For Nuveen Floating Rate Income Fund, the Fund’s contractual management fee rate, actual management fee rate and net total expense ratio each were below the Expense Universe median.
• For Nuveen Credit Strategies Income Fund, the Fund’s contractual management fee rate was below, actual management fee rate matched and the net total expense ratio was below the Expense Universe median.
• For Nuveen Preferred & Income Opportunities Fund, the Fund’s contractual management fee rate and net total expense ratio were each below the Expense Universe median, and the Fund’s actual management fee rate was slightly above (within 5 basis points) the Expense Universe median.
• For Nuveen Preferred Securities & Income Opportunities Fund, although the Fund’s actual management fee rate was above the Expense Universe median, the Fund’s contractual management fee rate and net total expense ratio were each slightly above (within 5 basis points) the Expense Universe median.
• For Nuveen Variable Rate Preferred & Income Fund, although the Fund’s actual management fee rate and net total expense ratio were above the Expense Universe median, the Fund’s contractual management fee rate was slightly above (approximately 6 basis points) the Expense Universe median.
Based on its review of the information provided, the Board determined that each Fund’s management fees (as applicable) to a Fund Adviser were reasonable in light of the nature, extent and quality of services provided to the Fund.
157
Statement Regarding Basis for Approval of Investment Advisory Contract (continued)
| 2. | Comparisons with the Fees of Other Clients |
In evaluating the appropriateness of fees, the Board also considered that the Adviser, the Sub‑Adviser and/or their affiliate(s) provide investment management services to other types of clients which may include, among others: separately managed accounts (“SMAs”), retail managed accounts, foreign funds (UCITS), other investment companies (as sub‑advisers), limited partnerships and collective investment trusts. The Board considered certain fee data for these other types of clients managed in a similar manner to certain of the funds compared to the management fee of the applicable fund. The Board considered a description of various factors which contribute to the differences in the management fee rates of the funds compared to those charged to these other types of clients which limited the comparability of the data. In this regard, the Board considered that the differences in, among other things, the breadth of services provided by the Adviser and its affiliates to the funds compared to those provided to other clients; the expenses the Adviser and its affiliates incur in launching, operating and supporting a fund; the support services provided to shareholders; the extensive regulatory, disclosure and governance requirements applicable to funds; the establishment and maintenance of servicing relationships with various service providers for the funds; the manner of managing such assets; investment policies; investor profiles; and account sizes all may contribute to the variations in relative fee rates. Differences in the level of advisory services required for passively managed funds also contribute to differences in the management fee levels of such funds compared to actively managed funds. In addition, differences in the client base; governing bodies, regulatory and legal requirements; distribution; jurisdiction and operational complexities also would contribute to variations in management fees assessed the funds compared to foreign fund clients. Further, differences in the level of advisory and non‑advisory services required and risk incurred when serving as a sub‑adviser to other investment companies compared to serving as the Adviser to a Nuveen fund contribute to differences in the fees assessed. In this regard, the Board further considered the significant entrepreneurial, legal and regulatory risks that the Adviser incurs in sponsoring and managing the Funds. As a general matter, higher fee levels reflect higher levels of service provided by the Adviser, increased investment management complexity, greater product management requirements, and higher levels of business risk or some combination of these factors. The Board further considered that the Sub‑Adviser’s fee is essentially for portfolio management services and therefore more comparable to the fees received for retail wrap accounts and other external sub‑advisory mandates. The Board concluded that the varying levels of fees were reasonable given the foregoing.
| 3. | Profitability of Fund Advisers |
In considering the costs of services to be provided and profits to be realized by the Adviser (which encompassed the Sub‑Adviser) from its relationship with the Funds, the Board Members considered a variety of estimated profitability data from various perspectives including, among other things, (a) historical pre‑distribution and post-distribution margins over specified periods for the Adviser’s services to the applicable funds; (b) certain profitability data on behalf of the Adviser attributable to servicing all applicable funds for 2024 and 2023; (c) certain profitability data of both the Adviser and TAL (as an adviser of certain other Nuveen funds) on a combined basis derived from types of funds in the aggregate (i.e., from closed‑end funds, exchange-traded funds, interval funds and open‑end funds) for 2024 and 2023; and (d) certain profitability data of both the Adviser and TAL on a combined basis by asset grouping of Nuveen funds in the aggregate (i.e., from equity, fund of funds, index, municipal bond and taxable fixed income funds). In addition, the Board considered profitability data at the per fund level for the respective adviser.
In reviewing the profitability data, the Board Members considered the subjective nature of calculating profitability as the information is not audited and is necessarily dependent on cost allocation methodologies to allocate expenses throughout the complex and among the various advisory products. The Board reviewed, among other things, a description of the cost allocation methodology employed to develop the profitability data. However, the Board Members considered that given there is no single universally recognized expense allocation methodology, other reasonable and valid allocation methodologies could be employed and could lead to significantly different profit and loss results and therefore developing profitability data is difficult, particularly on a per fund level.
Further, in considering the comparative margin data with peers, the Board Members considered the limitations of the comparative data given that peer data is not generally public and the calculation of profitability is subjective and affected by numerous factors (such as types of funds a peer manages, its business mix, its cost of capital, the numerous assumptions underlying the methodology used to allocate expenses and other factors) that can have a significant impact on the results. Given that the peer profitability data may reflect the different business mix of the respective peer firm, the Board also considered the pre- and post-distribution margins of Nuveen, LLC for each of the calendar years from 2020 through 2024.
Aside from the foregoing profitability data, the Board also considered, among other things, the audited statutory-basis financial statements of TIAA as of December 31, 2024 and 2023 and the related statutory-basis statements of operations, of changes in capital and contingency reserves and of cash flows for the years ended December 31, 2024, December 31, 2023 and December 31, 2022. The Board considered the benefit of an investment adviser and its parent with significant resources, particularly during periods of market volatility. The Board also considered the investments the Adviser, its parent and/or other affiliates made into their business.
In evaluating the reasonableness of the compensation, the Board Members also considered the indirect benefits the Adviser or Sub‑Adviser received that were directly attributable to the management of the applicable funds as discussed in further detail below. Based on its review, the Board was satisfied that the Adviser’s (together with the Sub‑Adviser) level of profitability from its relationship with the applicable Fund was not unreasonable in light of the nature, extent and quality of services provided.
158
D. Economies of Scale and Whether Fee Levels Reflect These Economies of Scale
The Board considered whether there have been economies of scale with respect to the management of the funds, whether these economies of scale have been appropriately shared with the funds and whether there is potential for realization of further economies of scale. Although the Board considered that economies of scale are difficult to measure with any precision and the rates at which certain expenses are incurred may not decline with a rise in assets, the Board considered that there are a variety of methods that may be employed to help share the benefits of economies of scale, including, among other things, through the use of breakpoints in the management fee schedule, the pricing of funds at scale at inception and investments in the Adviser’s business which can enhance the services provided to the funds for the fees paid. The Board considered such factors applicable to the particular Fund’s advisory fee structure.
As noted above, the Board considered that the management fee of the Adviser for the Funds generally was comprised of a fund-level component and a complex-level component each with its own breakpoint schedule. The Board also approved a revised complex-wide breakpoint schedule in 2024 which reduced the complex-level fee rates at various thresholds and expanded the assets included when calculating the complex-level fee. With this structure, the Board considered that the complex-level breakpoint schedule was designed to deliver the benefits of economies of scale to shareholders when the assets of the eligible participating funds in the complex pass certain thresholds even if the assets of a particular fund are unchanged or have declined, and the fund-level breakpoint schedules were designed to share economies of scale with shareholders if the particular fund grows. The Board reviewed the fund-level and complex-level fee schedules.
Although closed‑end funds may make additional share offerings from time to time, the Board considered that closed‑end funds have a more limited ability to increase their assets to attain additional economies of scale because the growth of their assets will occur primarily from the appreciation of their investment portfolios.
The Board Members also considered the continued reinvestment in Nuveen’s business to enhance its capabilities and services to the benefit of its various clients. The Board considered that many of these investments were not specific to individual Nuveen funds, but rather initiatives from which the family of funds as a whole may benefit. The Board further considered that the scope of the services of the Adviser and its affiliates have expanded over time without raising advisory fees to the funds, and this was also a means of sharing economies of scale with the funds and their shareholders. The Board considered the Adviser’s and/or its affiliates’ ongoing efforts to streamline the product line‑up, among other things, to create more scaled funds which may help improve both expense and trading economies for participating funds.
Based on its review, the Board was satisfied that the current fee arrangements together with the reinvestment in management’s business appropriately shared any economies of scale with shareholders.
E. Indirect Benefits
The Board Members received and considered information regarding various indirect benefits the respective Fund Adviser or its affiliates may receive as a result of their relationship with the funds. These benefits included, among other things, economies of scale to the extent the Adviser or its affiliates share investment resources and/or personnel with other clients of the Adviser. Certain funds may also be used as investment options for other products or businesses offered by the Adviser and/or its affiliates, such as variable products, fund of funds and 529 education savings plans, and the Adviser and/or affiliates of the Adviser may serve as sub‑adviser to various funds in which case all advisory and sub‑advisory fees generated by such funds stay within Nuveen.
Further, the funds may pay the Adviser and/or its affiliates for other services, such as distribution. In this regard, the Board considered that an affiliate of the Adviser received compensation in 2024 for serving as an underwriter on shelf offerings of existing closed‑end funds and reviewed the amounts paid for such services in 2024 and 2023.
In addition, the Board Members considered that the Adviser and Sub‑Adviser (except as noted) may utilize soft dollar brokerage arrangements attributable to the respective fund(s) to obtain research and other services for any or all of their clients, although the Board Members also considered with respect to the Nuveen funds advised by the Adviser, reimbursements of such costs by the Adviser and/or the Sub‑Adviser.
The Adviser and its affiliates may also benefit from the advisory relationships with the Nuveen funds to the extent this relationship results in potential investors viewing the TIAA group of companies as a leading retirement plan provider in the academic and nonprofit market and a single source for all their financial service needs. The Adviser and/or its affiliates may further benefit to the extent that they have pricing or other information regarding vendors the funds utilize in establishing arrangements with such vendors for other products.
Based on its review, the Board concluded that any indirect benefits received by a Fund Adviser as a result of its relationship with the Funds were reasonable in light of the services provided.
F. Other Considerations
The Board Members did not identify any single factor discussed previously as all‑important or controlling. The Board Members concluded that the terms of each Advisory Agreement were reasonable, that the respective Fund Adviser’s fees were reasonable in light of the services provided to each Fund and that the Advisory Agreements be renewed for an additional one‑year period.
159
Board Members & Officers
(Unaudited)
The management of the Funds, including general supervision of the duties performed for the Funds by the Adviser, is the responsibility of the Board of Trustees of the Funds. None of the trustees who are not “interested” persons of the Funds (referred to herein as “independent board members”) has ever been a director or employee of, or consultant to, Nuveen or its affiliates. The names and business addresses of the trustees and officers of the Funds, their principal occupations and other affiliations during the past five years, the number of portfolios each Trustee oversees and other directorships they hold are set forth below.
| Name, Year of Birth & Address |
Position(s) Held with the Funds |
Year First Elected or Appointed and Term(1) |
Principal Occupation(s) Including other Directorships During Past 5 Years |
Number of Portfolios in Fund Complex Overseen By Board Member | ||||
| Independent Trustees: | ||||||||
| Joseph A. Boateng 1963 333 W. Wacker Drive Chicago, IL 60606 |
Board Member | 2019 Class II |
Chief Investment Officer, Casey Family Programs (since 2007); formerly, Director of U.S. Pension Plans, Johnson & Johnson (2002–2006); Board Member, Lumina Foundation (since 2019) and Waterside School (since 2021); Board Member (2012–2019) and Emeritus Board Member (since 2020), Year‑Up Puget Sound; Investment Advisory Committee Member and Former Chair (since 2007), Seattle City Employees’ Retirement System; Investment Committee Member (since 2019), The Seattle Foundation; Trustee (2018–2023), the College Retirement Equities Fund; Manager (2019–2023), TIAA Separate Account VA‑1. | 217 | ||||
| Michael A. Forrester 1967 333 W. Wacker Drive Chicago, IL 60606 |
Board Member | 2007 Class I |
Formerly, Chief Executive Officer (2014–2021) and Chief Operating Officer (2007–2014), Copper Rock Capital Partners, LLC; Director, Aflac Incorporated (since 2025); Trustee, Dexter Southfield School (since 2019); Member (since 2020), Governing Council of the Independent Directors Council (IDC); Trustee, the College Retirement Equities Fund and Manager, TIAA Separate Account VA‑1 (2007–2023). | 217 | ||||
| Thomas J. Kenny 1963 333 W. Wacker Drive Chicago, IL 60606 |
Board Member | 2011 Class I |
Formerly, Advisory Director (2010–2011), Partner (2004–2010), Managing Director (1999–2004) and Co‑Head of Global Cash and Fixed Income Portfolio Management Team (2002–2010), Goldman Sachs Asset Management; Director (since 2015) and Chair of the Finance and Investment Committee (since 2018), Aflac Incorporated; Director (since 2018), ParentSquare; formerly, Director (2021–2022) and Finance Committee Chair (2016–2022), Sansum Clinic; formerly, Advisory Board Member (2017–2019), B’Box; formerly, Member (2011–2012), the University of California at Santa Barbara Arts and Lectures Advisory Council; formerly, Investment Committee Member (2012–2020), Cottage Health System; formerly, Board member (2009–2019) and President of the Board (2014–2018), Crane Country Day School; Trustee (2011– 2023) and Chairman (2017–2023), the College Retirement Equities Fund; Manager (2011–2023) and Chairman (2017–2023), TIAA Separate Account VA‑1. | 218 | ||||
| Amy B. R. Lancellotta 1959 333 W. Wacker Drive Chicago, IL 60606 |
Board Member | 2021 Class II |
Formerly, Managing Director, IDC (supports the fund independent director community and is part of the Investment Company Institute (ICI), which represents regulated investment companies) (2006-2019); formerly, various positions with ICI (1989-2006); President (since 2023) and Member (since 2020) of the Board of Directors, Jewish Coalition Against Domestic Abuse (JCADA). | 218 | ||||
160
| Name, Year of Birth & Address |
Position(s) Held with the Funds |
Year First Elected or Appointed and Term(1) |
Principal Occupation(s) Including other Directorships During Past 5 Years |
Number of Portfolios in Fund Complex Overseen By Board Member | ||||
| Joanne T. Medero 1954 333 W. Wacker Drive Chicago, IL 60606 |
Board Member | 2021 Class III |
Formerly, Managing Director, Government Relations and Public Policy (2009-2020) and Senior Advisor to the Vice Chairman (2018- 2020), BlackRock, Inc. (global investment management firm); formerly, Managing Director, Global Head of Government Relations and Public Policy, Barclays Group (IBIM) (investment banking, investment management and wealth management businesses) (2006-2009); formerly, Managing Director, Global General Counsel and Corporate Secretary, Barclays Global Investors (global investment management firm) (1996-2006); formerly, Partner, Orrick, Herrington & Sutcliffe LLP (law firm) (1993-1995); formerly, General Counsel, Commodity Futures Trading Commission (government agency overseeing U.S. derivatives markets) (1989-1993); formerly, Deputy Associate Director/Associate Director for Legal and Financial Affairs, Office of Presidential Personnel, The White House (1986-1989); Member of the Board of Directors, Baltic-American Freedom Foundation (seeks to provide opportunities for citizens of the Baltic states to gain education and professional development through exchanges in the U.S.) (since 2019). | 218 | ||||
| Albin F. Moschner 1952 333 W. Wacker Drive Chicago, IL 60606 |
Board Member | 2016 Class III |
Founder and Chief Executive Officer, Northcroft Partners, LLC, (management consulting) (since 2012); formerly, Chairman (2019), and Director (2012-2019), USA Technologies, Inc., (provider of solutions and services to facilitate electronic payment transactions); formerly, Director, Wintrust Financial Corporation (1996-2016); previously, held positions at Leap Wireless International, Inc. (consumer wireless services), including Consultant (2011-2012), Chief Operating Officer (2008-2011), and Chief Marketing Officer (2004-2008); formerly, President, Verizon Card Services division of Verizon Communications, Inc. (2000-2003); formerly, President, One Point Services at One Point Communications (telecommunication services) (1999-2000); formerly, Vice Chairman of the Board, Diba, Incorporated (internet technology provider) (1996-1997); formerly, various executive positions (1991-1996) including Chief Executive Officer (1995-1996) of Zenith Electronics Corporation (consumer electronics). | 218 | ||||
| John K. Nelson 1962 333 W. Wacker Drive Chicago, IL 60606 |
Board Member | 2013 Class II |
Formerly, Member of Board of Directors of Core12 LLC (2008– 2023) (private firm which develops branding, marketing and communications strategies for clients); formerly, Member of The President’s Council of Fordham University (2010–2019); formerly, Director of the Curran Center for Catholic American Studies (2009–2018); formerly, senior external advisor to the Financial Services practice of Deloitte Consulting LLP. (2012–2014); formerly, Trustee and Chairman of the Board of Trustees of Marian University (2010–2013); formerly Chief Executive Officer of ABN AMRO Bank N.V., North America, and Global Head of the Financial Markets Division (2007–2008), with various executive leadership roles in ABN AMRO Bank N.V. between 1996 and 2007. | 218 |
161
Board Members & Officers (continued)
| Name, Year of Birth & Address |
Position(s) Held with the Funds |
Year First Elected or Appointed and Term(1) |
Principal Occupation(s) Including other Directorships During Past 5 Years |
Number of Portfolios in Fund Complex Overseen By Board Member | ||||
| Loren M. Starr 1961 333 W. Wacker Drive Chicago, IL 60606 |
Board Member | 2022 Class III |
Independent Consultant/Advisor (since 2021); formerly, Vice Chair, Senior Managing Director (2020–2021), Chief Financial Officer, Senior Managing Director (2005–2020), Invesco Ltd.; Director (since 2023) and Chair of the Board (since 2025), formerly, Chair of the Audit Committee (2024-2025), AMG; formerly, Chair and Member of the Board of Directors (2014–2021), Georgia Leadership Institute for School Improvement (GLISI); formerly, Chair and Member of the Board of Trustees (2014–2018), Georgia Council on Economic Education (GCEE); Trustee, the College Retirement Equities Fund and Manager, TIAA Separate Account VA‑1 (2022–2023). | 217 | ||||
| Matthew Thornton III 1958 333 W. Wacker Drive Chicago, IL 60606 |
Board Member | 2020 Class III |
Formerly, Executive Vice President and Chief Operating Officer (2018-2019), FedEx Freight Corporation, a subsidiary of FedEx Corporation (FedEx) (provider of transportation, e‑commerce and business services through its portfolio of companies); formerly, Senior Vice President, U.S. Operations (2006-2018), Federal Express Corporation, a subsidiary of FedEx; formerly Member of the Board of Directors (2012-2018), Safe Kids Worldwide® (a non‑profit organization dedicated to preventing childhood injuries). Member of the Board of Directors (since 2014), The Sherwin-Williams Company (develops, manufactures, distributes and sells paints, coatings and related products); Director (since 2020), Crown Castle International (provider of communications infrastructure). | 218 | ||||
| Terence J. Toth 1959 333 W. Wacker Drive Chicago, IL 60606 |
Board Member | 2008 Class II |
Formerly, a Co–Founding Partner, Promus Capital (investment advisory firm) (2008–2017); formerly, Director, Quality Control Corporation (manufacturing) (2012–2021); formerly, Chair and Member of the Board of Directors (2021–2024), Kehrein Center for the Arts (philanthropy); Member of the Board of Directors (since 2008), Catalyst Schools of Chicago (philanthropy); Member of the Board of Directors (since 2012), formerly, Investment Committee Chair (2017–2022), Mather Foundation Board (philanthropy); formerly, Member (2005–2016), Chicago Fellowship Board (philanthropy); formerly, Director, Fulcrum IT Services LLC (information technology services firm to government entities) (2010–2019); formerly, Director, LogicMark LLC (health services) (2012–2016); formerly, Director, Legal & General Investment Management America, Inc. (asset management) (2008–2013); formerly, CEO and President, Northern Trust Global Investments (financial services) (2004–2007); Executive Vice President, Quantitative Management & Securities Lending (2000–2004); prior thereto, various positions with Northern Trust Company (financial services) (since 1994); formerly, Member, Northern Trust Mutual Funds Board (2005–2007), Northern Trust Global Investments Board (2004–2007), Northern Trust Japan Board (2004–2007), Northern Trust Securities Inc. Board (2003–2007) and Northern Trust Hong Kong Board (1997–2004). | 218 |
162
| Name, Year of Birth & Address |
Position(s) Held with the Funds |
Year First Elected or Appointed and Term(1) |
Principal Occupation(s) Including other Directorships During Past 5 Years |
Number of Portfolios in Fund Complex Overseen By Board Member | ||||
| Margaret L. Wolff 1955 333 W. Wacker Drive Chicago, IL 60606 |
Board Member | 2016 Class I |
Formerly, member of the Board of Directors (2013-2017) of Travelers Insurance Company of Canada and The Dominion of Canada General Insurance Company (each, a part of Travelers Canada, the Canadian operation of The Travelers Companies, Inc.); formerly, Of Counsel, Skadden, Arps, Slate, Meagher & Flom LLP (Mergers & Acquisitions Group) (legal services) (2005- 2014); Member of the Board of Trustees of New York-Presbyterian Hospital (since 2005); Member of the Board of Trustees (since 2004) formerly, Chair (2015-2022) of The John A. Hartford Foundation (a philanthropy dedicated to improving the care of older adults); formerly, Member (2005-2015) and Vice Chair (2011- 2015) of the Board of Trustees of Mt. Holyoke College. |
218 | ||||
| Robert L. Young 1963 333 W. Wacker Drive Chicago, IL 60606 |
Chair and Board Member | 2017 Class I |
Formerly, Chief Operating Officer and Director, J.P. Morgan Investment Management Inc. (financial services) (2010-2016); formerly, President and Principal Executive Officer (2013-2016), and Senior Vice President and Chief Operating Officer (2005-2010), of J.P. Morgan Funds; formerly, Director and various officer positions for J.P. Morgan Investment Management Inc. (formerly, JPMorgan Funds Management, Inc. and formerly, One Group Administrative Services) and JPMorgan Distribution Services, Inc. (financial services) (formerly, One Group Dealer Services, Inc.) (1999-2017). |
218 |
163
Board Members & Officers (continued)
| Name, Year of Birth & Address |
Position(s) Held with the Funds |
Year First Elected or Appointed(2) |
Principal Occupation(s) Including other Directorships During Past 5 Years | |||
| Officers of the Funds: | ||||||
| David J. Lamb 1963 333 W. Wacker Drive Chicago, IL 60606 |
Chief Administrative Officer (Principal Executive Officer) | 2015 | Senior Managing Director of Nuveen Fund Advisors, LLC, Nuveen Securities, LLC and Nuveen; has previously held various positions with Nuveen. | |||
| Brett E. Black 1972 333 W. Wacker Drive Chicago, IL 60606 |
Vice President and Chief Compliance Officer | 2022 | Managing Director, Chief Compliance Officer of Nuveen; formerly, Vice President (2014-2022), Chief Compliance Officer and Anti-Money Laundering Compliance Officer (2017-2022) of BMO Funds, Inc. | |||
| Marc Cardella 1984 8500 Andrew Carnegie Blvd. Charlotte, NC 28262 |
Vice President and Controller (Principal Financial Officer) | 2024 | Senior Managing Director, Head of Public Investment Finance of Nuveen; Senior Managing Director of Nuveen Fund Advisors, LLC, Nuveen Asset Management, LLC, Teachers Advisors, LLC and TIAA-CREF Investment Management, LLC, Managing Director of Teachers Insurance and Annuity Association of America and TIAA SMA Strategies LLC; Principal Financial Officer, Principal Accounting Officer and Treasurer of TIAA Separate Account VA‑1 and the College Retirement Equities Fund. | |||
| Joseph T. Castro 1964 333 W. Wacker Drive Chicago, IL 60606 |
Vice President | 2025 | Executive Vice President, Chief Risk and Compliance Officer, formerly, Senior Managing Director and Head of Compliance, Nuveen; Executive Vice President, formerly, Senior Managing Director, Nuveen Securities, LLC; Senior Managing Director, Nuveen Fund Advisors, LLC and Nuveen, LLC. | |||
| Mark J. Czarniecki 1979 901 Marquette Avenue Minneapolis, MN 55402 |
Vice President and Assistant Secretary | 2013 | Managing Director and Assistant Secretary of Nuveen Securities, LLC and Nuveen Fund Advisors, LLC; Managing Director and Associate General Counsel of Nuveen; Managing Director, Assistant Secretary and Associate General Counsel of Nuveen Asset Management, LLC; has previously held various positions with Nuveen; Managing Director, Associate General Counsel and Assistant Secretary of Teachers Advisors, LLC and TIAA-CREF Investment Management, LLC. | |||
| Jeremy D. Franklin 1983 8500 Andrew Carnegie Blvd. Charlotte, NC 28262 |
Vice President and Assistant Secretary | 2024 | Managing Director and Assistant Secretary, Nuveen Fund Advisors, LLC; Managing Director, Associate General Counsel and Assistant Secretary, Nuveen Asset Management, LLC, Teachers Advisors, LLC and TIAA-CREF Investment Management, LLC; Vice President and Associate General Counsel, Teachers Insurance and Annuity Association of America; Vice President and Assistant Secretary, TIAA-CREF Funds and TIAA-CREF Life Funds; Vice President, Associate General Counsel, and Assistant Secretary, TIAA Separate Account VA‑1 and College Retirement Equities Fund. | |||
| Diana R. Gonzalez 1978 8500 Andrew Carnegie Blvd. Charlotte, NC 28262 |
Vice President and Assistant Secretary | 2017 | Vice President and Assistant Secretary of Nuveen Fund Advisors, LLC; Vice President, Associate General Counsel and Assistant Secretary of Nuveen Asset Management, LLC, Teachers Advisors, LLC and TIAA-CREF Investment Management, LLC; Vice President and Associate General Counsel of Nuveen. | |||
| Nathaniel T. Jones 1979 333 W. Wacker Drive Chicago, IL 60606 |
Vice President | 2016 | Senior Managing Director, Head of Public Product of Nuveen; President. formerly, Senior Managing Director, of Nuveen Fund Advisors, LLC; has previously held various positions with Nuveen; Chartered Financial Analyst. | |||
| Brian H. Lawrence 1982 8500 Andrew Carnegie Blvd. Charlotte, NC 28262 |
Vice President and Assistant Secretary | 2023 | Vice President and Associate General Counsel of Nuveen; Vice President, Associate General Counsel and Assistant Secretary of Teachers Advisors, LLC and TIAA-CREF Investment Management, LLC; formerly Corporate Counsel of Franklin Templeton (2018-2022). | |||
| Tina M. Lazar 1961 333 W. Wacker Drive Chicago, IL 60606 |
Vice President | 2002 | Managing Director of Nuveen Securities, LLC. | |||
| Brian J. Lockhart 1974 333 W. Wacker Drive Chicago, IL 60606 |
Vice President | 2019 | Senior Managing Director and Head of Investment Oversight of Nuveen; Senior Managing Director of Nuveen Fund Advisors, LLC; has previously held various positions with Nuveen; Chartered Financial Analyst and Certified Financial Risk Manager. | |||
164
| Name, Year of Birth & Address |
Position(s) Held with the Funds |
Year First Elected or Appointed(2) |
Principal Occupation(s) Including other Directorships During Past 5 Years | |||
| John M. McCann 1975 8500 Andrew Carnegie Blvd. Charlotte, NC 28262 |
Vice President and Assistant Secretary | 2022 | Senior Managing Director, Division General Counsel of Nuveen; Senior Managing Director, General Counsel and Secretary of Nuveen Fund Advisors, LLC; Senior Managing Director, Associate General Counsel and Assistant Secretary of Nuveen Asset Management, LLC Teachers Advisors, LLC and TIAA-CREF Investment Management, LLC; Managing Director and Assistant Secretary of TIAA SMA Strategies LLC; Managing Director, Associate General Counsel and Assistant Secretary of College Retirement Equities Fund, TIAA Separate Account VA‑1, TIAA- CREF Funds, TIAA-CREF Life Funds, Teachers Insurance and Annuity Association of America and Nuveen Alternative Advisors LLC; has previously held various positions with Nuveen/TIAA. | |||
| Kevin J. McCarthy 1966 333 W. Wacker Drive Chicago, IL 60606 |
Vice President and Assistant Secretary | 2007 | Executive Vice President, Secretary and General Counsel of Nuveen Investments, Inc.; Executive Vice President and Assistant Secretary of Nuveen Securities, LLC and Nuveen Fund Advisors, LLC; Executive Vice President and Secretary of Nuveen Asset Management, LLC, Teachers Advisors, LLC, TIAA-CREF Investment Management, LLC and Nuveen Alternative Investments, LLC; Executive Vice President, Associate General Counsel and Assistant Secretary of TIAA-CREF Funds and TIAA-CREF Life Funds; has previously held various positions with Nuveen; Vice President and Secretary of Winslow Capital Management, LLC; formerly, Vice President (2007-2021) and Secretary (2016-2021) of NWQ Investment Management Company, LLC and Santa Barbara Asset Management, LLC. | |||
| R. Tanner Page 1985 333 W. Wacker Drive Chicago, IL 60606 |
Vice President and Treasurer | 2025 | Managing Director, formerly, Vice President of Nuveen; has previously held various positions with Nuveen. | |||
| William A. Siffermann 1975 333 W. Wacker Drive Chicago, IL 60606 |
Vice President | 2017 | Senior Managing Director of Nuveen. | |||
| Mark L. Winget 1968 333 W. Wacker Drive Chicago, IL 60606 |
Vice President and Secretary | 2008 | Vice President and Assistant Secretary of Nuveen Securities, LLC and Nuveen Fund Advisors, LLC; Vice President, Associate General Counsel and Assistant Secretary of Teachers Advisors, LLC and TIAA-CREF Investment Management, LLC and Nuveen Asset Management, LLC; Vice President and Associate General Counsel of Nuveen. | |||
| Rachael Zufall 1973 8500 Andrew Carnegie Blvd. Charlotte, NC 28262 |
Vice President and Assistant Secretary | 2022 | Managing Director and Assistant Secretary of Nuveen Fund Advisors, LLC; Managing Director, Associate General Counsel and Assistant Secretary of the College Retirement Equities Fund, TIAA Separate Account VA‑1, TIAA-CREF Funds and TIAA-CREF Life Funds; Managing Director, Associate General Counsel and Assistant Secretary of Teacher Advisors, LLC and TIAA-CREF Investment Management, LLC; Managing Director of Nuveen, LLC and of TIAA. |
| (1) | The Board of Trustees is divided into three classes, Class I, Class II, and Class III, with each being elected to serve until the third succeeding annual shareholders’ meeting subsequent to its election or thereafter in each case when its respective successors are duly elected or appointed, except two board members are elected by the holders of Preferred Shares, when applicable, to serve until the next annual shareholders’ meeting subsequent to its election or thereafter in each case when its respective successors are duly elected or appointed. The year first elected or appointed represents the year in which the board member was first elected or appointed to any fund in the Nuveen complex. |
| (2) | Officers serve indefinite terms until their successor has been duly elected and qualified, their death or their resignation or removal. The year first elected or appointed represents the year in which the Officer was first elected or appointed to any fund in the Nuveen Complex. |
165
[This page intentionally left blank.]
[This page intentionally left blank.]
Nuveen:
Serving Investors for Generations
Since 1898, financial advisors and their clients have relied on Nuveen to provide dependable investment solutions through continued adherence to proven, long-term investing principles. Today, we offer a range of high quality solutions designed to be integral components of a well-diversified core portfolio.
Focused on meeting investor needs.
Nuveen is the investment manager of TIAA. We have grown into one of the world’s premier global asset managers, with specialist knowledge across all major asset classes and particular strength in solutions that provide income for investors and that draw on our expertise in alternatives and responsible investing. Nuveen is driven not only by the independent investment processes across the firm, but also the insights, risk management, analytics and other tools and resources that a truly world-class platform provides. As a global asset manager, our mission is to work in partnership with our clients to create solutions which help them secure their financial future.
Find out how we can help you.
To learn more about how the products and services of Nuveen may be able to help you meet your financial goals, talk to your financial advisor, or call us at (800) 257‑8787. Please read the information provided carefully before you invest. Investors should consider the investment objective and policies, risk considerations, charges and expenses of any investment carefully. Where applicable, be sure to obtain a prospectus, which contains this and other relevant information. To obtain a prospectus, please contact your securities representative or Nuveen, 333 W. Wacker Dr., Chicago, IL 60606.
Please read the prospectus carefully before you invest or send money.
Learn more about Nuveen Funds at: www.nuveen.com/closed‑end‑funds
NOT FDIC INSURED MAY LOSE VALUE NO BANK GUARANTEE
| Nuveen Securities, LLC, member FINRA and SIPC | 333 West Wacker Drive | Chicago, IL 60606 | www.nuveen.com |
EAN‑A‑0725P 4715820 |