MANAGEMENT'S DISCUSSION AND ANALYSIS
FOR THE YEAR ENDED DECEMBER 31, 2020This Management Discussion and Analysis ("MD&A") should be read in conjunction with the consolidated financial statements of Endeavour Silver Corp. ("Endeavour" or "the Company") for the year ended December 31, 2020 and the related notes contained therein, which were prepared in accordance with International Financial Reporting Standards ("IFRS") as issued by the International Accounting Standards Board ("IASB"). The Company uses certain non-IFRS financial measures in this MD&A as described under "Non-IFRS Measures". Additional information relating to the Company, including the most recent Annual Information Form (the "Annual Information Form"), is available on SEDAR at www.sedar.com, and the Company's most recent annual report on Form 40-F has been filed with the U.S. Securities and Exchange Commission (the "SEC"). This MD&A contains "forward-looking statements" that are subject to risk factors set out in a cautionary note contained herein. All dollar ($) amounts are expressed in United States ("$.") dollars and tabular amounts are expressed in thousands of U.S. dollars unless Canadian dollars (CAN$) are indicated otherwise indicated. This MD&A is dated as of February 25, 2021 and all information contained is current as of February 25, 2021 unless otherwise stated.
Cautionary Note to U.S. Investors Regarding Mineral Reserves and Resources
This Management Discussion and Analysis has been prepared in accordance with the requirements of Canadian provincial securities laws, which differ from the requirements of U.S. securities laws. Unless otherwise indicated, all mineral reserve and mineral resource estimates included have been prepared in accordance with Canadian National Instrument 43-101- Standards of Disclosure for Mineral Projects ("NI 43-101") and the Canadian Institute of Mining, Metallurgy and Petroleum (the "CIM") - CIM Definition Standards on Mineral Resources and Mineral Reserves, adopted by the CIM Council, as amended. NI 43-101 is an instrument developed by the Canadian Securities Administrators that establishes standards for all public disclosure an issuer makes of scientific and technical information concerning mineral projects. These definitions differ from the definitions in requirements under United States securities laws adopted by the United States Securities and Exchange Commission.
Under Canadian rules, estimates of inferred mineral resources may not form the basis of feasibility or pre-feasibility studies, except in rare cases. Investors are cautioned not to assume that all or any part of an inferred mineral resource exists or is economically or legally mineable. An "inferred mineral resource" is that part of a mineral resource for which quantity and grade or quality are estimated on the basis of limited geological evidence and sampling. Geological evidence is sufficient to imply but not verify geological and grade or quality continuity. An inferred mineral resource has a lower level of confidence than that applying to an indicated mineral resource and must not be converted to a mineral reserve. It is reasonably expected that the majority of inferred mineral resources could be upgraded to indicated mineral resources with continued exploration.
Investors are cautioned not to assume that all or any part of mineral reserves and mineral resources determined in accordance with NI 43-101 and CIM standards will qualify as, or be identical to, mineral reserves and mineral resources estimated under the standards of the SEC applicable to U.S. companies. The SEC has adopted amendments to its disclosure rules to modernize the mineral property disclosure requirements for issuers whose securities are registered with the SEC. As a foreign private issuer that files its annual report on Form 40-F with the SEC pursuant to the multi-jurisdictional disclosure system, the Company is not required to provide disclosure on its mineral properties under the SEC's new rules and will continue to provide disclosure under NI 43-101 and the CIM standards. If the Company ceases to be a foreign private issuer or lose its eligibility to file its annual report on Form 40-F pursuant to the multi-jurisdictional disclosure system, then the Company will be subject to the SEC's new rules, which differ from the requirements of NI 43-101 and the CIM standards.
Accordingly, information contained in this Management Discussion and Analysis that contain descriptions of the Corporation's mineral deposits may not be comparable to similar information made public by U.S. companies subject to the reporting and disclosure requirements under the United States federal securities laws and the rules and regulations thereunder.
Forward-Looking Statements
This MD&A contains "forward-looking statements" within the meaning of the U.S. Securities Litigation Reform Act of 1995, as amended and "forward-looking information" within the meaning of applicable Canadian securities legislation. Such forward-looking statements and information include, but are not limited to, statements regarding Endeavour's anticipated performance in 2021, including silver and gold production, financial results, timing and expenditures to develop new silver mines and mineralized zones, silver and gold grades and recoveries, cash costs per ounce, capital expenditures and sustaining capital and the impact of the COVID 19 pandemic on operations. Forward-looking statements are frequently characterized by words such as "plan", "expect", "forecast", "project", "intend", "believe", "anticipate", "outlook" and other similar words, or statements that certain events or conditions "may" or "will" occur. Forward- looking statements are based on the opinions and estimates of management at the dates the statements are made, and are subject to a variety of risks and uncertainties and other factors that could cause actual events or results to differ materially from those projected in the forward-looking statements.
The Company does not intend to, and does not assume any obligation to, update such forward-looking statements or information, other than as required by applicable law. Forward-looking statements or information involve known and unknown risks, uncertainties and other factors and are based on assumptions that may cause the actual results, level of activity, performance or achievements of the Company and its operations to be materially different from those expressed or implied by such statements. Such factors and assumptions include, among others: the ultimate impact of the COVID 19 pandemic on operations and results, fluctuations in the prices of silver and gold, fluctuations in the currency markets (particularly the Mexican peso, Chilean peso, Canadian dollar and U.S. dollar); changes in national and local governments, legislation, taxation, controls, regulations and political or economic developments in Canada and Mexico; operating or technical difficulties in mineral exploration, development and mining activities; risks and hazards of mineral exploration, development and mining (including, but not limited to environmental hazards, industrial accidents, unusual or unexpected geological conditions, pressures, cave-ins and flooding); inadequate insurance, or inability to obtain insurance; availability of and costs associated with mining inputs and labour; the speculative nature of mineral exploration and development, diminishing quantities or grades of mineral reserves as properties are mined; the ability to successfully integrate acquisitions; risks in obtaining necessary licenses and permits, and challenges to the Company's title to properties; as well as those factors described under "Risk Factors" in the Company's Annual Information Form. Although the Company has attempted to identify important factors that could cause actual results to differ materially from those contained in forward-looking statements or information, there may be other factors that cause results to be materially different from those anticipated, described, estimated, assessed or intended. There can be no assurance that any forward-looking statements or information will prove to be accurate as actual results and future events could differ materially from those anticipated in such statements or information. Accordingly, readers should not place undue reliance on forward-looking statements or information.
Qualified Person
The scientific and technical information contained in this MD&A relating to the Company's mines and mineral projects has been reviewed and approved by Dale Mah, B.Sc., P.Geo., Vice President Corporate Development of Endeavour, a Qualified Person within the meaning of NI 43-101.
OPERATING HIGHLIGHTS
|
Three Months Ended December 31 |
2020 Highlights |
Year Ended December 31 | ||||
|
2020 |
2019 |
% Change |
2020 |
2019 | % Change | |
| Production | ||||||
|
1,117,289 |
939,511 |
19% |
Silver ounces produced |
3,513,767 |
4,018,735 |
(13%) |
|
12,586 |
9,578 |
31% |
Gold ounces produced |
37,139 |
38,907 |
(5%) |
|
1,108,848 |
923,540 |
20% |
Payable silver ounces produced |
3,482,094 |
3,951,923 |
(12%) |
|
12,314 |
9,397 |
31% |
Payable gold ounces produced |
36,392 |
38,003 |
(4%) |
|
2,124,169 |
1,705,751 |
25% |
Silver equivalent ounces produced(1) |
6,484,887 |
7,131,295 |
(9%) |
|
6.83 |
13.63 |
(50%) |
Cash costs per silver ounce(2)(3) |
5.55 |
12.85 |
(57%) |
|
14.58 |
20.43 |
(29%) |
Total production costs per ounce(2)(4) |
14.01 |
20.73 |
(32%) |
|
18.52 |
23.20 |
(20%) |
All-in sustaining costs per ounce(2)(5) |
17.59 |
21.19 |
(17%) |
|
237,389 |
236,531 |
0% |
Processed tonnes |
757,160 |
954,886 |
(21%) |
|
105.07 |
110.64 |
(5%) |
Direct operating costs per tonne(2)(6) |
101.17 |
107.96 |
(6%) |
|
129.66 |
113.47 |
14% |
Direct costs per tonne(2)(6) |
114.57 |
110.09 |
4% |
|
14.83 |
15.19 |
(2%) |
Silver co-product cash costs(7) |
12.97 |
14.18 |
(9%) |
|
1,129 |
1,312 |
(14%) |
Gold co-product cash costs(7) |
1,109 |
1,238 |
(10%) |
|
Financial |
|
|
|
|||
|
60.7 |
33.5 |
81% |
Revenue(11) ($ millions) |
138.4 |
117.4 |
18% |
|
1,419,037 |
1,050,157 |
35% |
Silver ounces sold |
3,460,638 |
4,054,652 |
(15%) |
|
13,850 |
10,803 |
28% |
Gold ounces sold |
35,519 |
39,151 |
(9%) |
|
24.76 |
17.45 |
42% |
Realized silver price per ounce |
21.60 |
16.29 |
33% |
|
1,885 |
1,507 |
25% |
Realized gold price per ounce |
1,846 |
1,422 |
30% |
|
19.9 |
(17.9) |
211% |
Net earnings (loss) ($ millions) |
1.2 |
(48.1) |
102% |
|
20.8 |
(3.8) |
649% |
Mine operating earnings (loss) ($ millions) |
27.3 |
(17.4) |
257% |
|
30.2 |
4.9 |
519% |
Mine operating cash flow ($ millions)(8) |
56.2 |
14.9 |
277% |
|
21.6 |
(7.9) |
375% |
Operating cash flow before working capital changes(9) |
28.8 |
(8.9) |
424% |
|
24.3 |
(4.8) |
603% |
Earnings before ITDA(10 ) ($ millions) |
29.4 |
(11.1) |
364% |
|
70.4 |
38.4 |
83% |
Working capital ($ millions) |
70.4 |
38.4 |
83% |
|
Shareholders |
|
|
|
|||
|
0.13 |
(0.13) |
199% |
Earnings (loss) per share – basic |
0.01 |
(0.36) |
103% |
|
0.14 |
(0.06) |
250% |
Operating cash flow before working capital changes per share(9) |
0.19 |
(0.07) |
600% |
|
157,536,658 |
140,054,885 |
12% |
Weighted average shares outstanding |
150,901,598 |
135,367,129 |
11% |
(1) Silver equivalents are calculated using an 80:1 (Ag/Au) ratio.
(2) The Company reports non-IFRS measures which include cash costs net of by-product revenue on a payable silver basis, total production costs per ounce, all-in sustaining costs per ounce, direct production costs per tonne, silver co-product cash costs and gold co-product cash costs in order to manage and evaluate operating performance at each of the Company's mines. These measures, some established by the Silver Institute (Production Cost Standards, June 2011), are widely used in the silver mining industry as a benchmark for performance, but do not have a standardized meaning. These measures are reported on a production basis. See Reconciliations to IFRS beginning on page 20.
(3) Cash costs net of by-product revenue per payable silver ounce include mining, processing (including smelting, refining, transportation and selling costs), and direct overhead, net of gold credits. See Reconciliation to IFRS on pages 21 & 23.
(4) Total production costs per ounce include mining, processing (including smelting, refining, transportation and selling costs), direct overhead, amortization, depletion and amortization at the operation sites net of by product revenues. See Reconciliation to IFRS on pages 21 & 22.
(5) All-in sustaining cost per ounce include mining, processing (including smelting, refining, transportation and selling costs), direct overhead, corporate general and administration, on-site exploration, share-based compensation, reclamation and sustaining capital net of gold credits. See Reconciliation to IFRS on pages 23 & 24.
(6) Direct operating costs per tonne include mining, processing (including smelting, refining, transportation and selling costs) and direct overhead at the operation sites. Direct cost per tonne include all direct operating costs, royalties and special mining duty. See Reconciliation to IFRS on pages 21 & 22.
(7) Silver co-product cash cost and gold co-product cash cost include mining, processing (including smelting, refining, transportation and selling costs), and direct overhead allocated on pro-rated basis of realized metal value. See Reconciliation to IFRS on pages 24 and 25.
(8) Mine operating cash flow is calculated by adding back amortization, depletion, inventory write-downs and share-based compensation to mine operating earnings. Mine operating earnings and mine operating cash flow are before taxes. See Reconciliation to IFRS on page 20.
(9) See Reconciliation to IFRS on pages 20 and 21 for the reconciliation of operating cash flow before working capital changes and for the operating cash flow before working capital changes per share.
(10) See Reconciliation of Earnings before interest, taxes, depreciation and amortization on page 21.
(11) The Company changed its presentation of concentrate treatment and refining costs of sales to presenting as a reduction in revenue effective Q1 2020. The prior period revenue has been reclassified.
The above highlights are key measures used by management, however they should not be the sole measures used in determining the performance of the Company's operations.
HISTORY AND STRATEGY
The Company is engaged in silver mining in Mexico and related activities including property acquisition, exploration, development, mineral extraction, processing, refining and reclamation. The Company is also engaged in exploration activities in Chile. Since 2002, the Company's business strategy has been to focus on acquiring advanced-stage silver mining properties in Mexico. Mexico, despite its long and prolific history of metal production, appears to be relatively under-explored using modern exploration techniques and offers promising geological potential for precious metals exploration and production.
The Company's Guanaceví and Bolañitos mines acquired in 2004 and 2007, respectively, demonstrate its business model of acquiring fully built and permitted silver mines that were about to close for lack of ore. By bringing the money and expertise needed to find new silver ore-bodies, the Company successfully re-opened and expanded these mines to develop their full potential. The benefit of acquiring fully built and permitted mining and milling infrastructure is that, if new exploration efforts are successful, the mine development cycle from discovery to production only takes a matter of months instead of the several years normally required in the traditional mining business model.
In addition to operating the Guanaceví and Bolañitos mines, the Company commissioned the El Compas mine in March 2019. The Company is advancing the Terronera development project and several exploration projects in order to achieve its goal to become a premier senior producer in the silver mining sector. In 2012, the Company acquired the El Cubo silver-gold mine located in Guanajuato, Mexico, which operated until November 2019.
The Company has historically funded its acquisition, exploration and development activities through equity financings, debt facilities and convertible debentures. In recent years, the Company has financed most of its acquisition, exploration, development and operating activities from production cash flows, treasury and equity financings. The Company may choose to undertake equity, debt, convertible debt or other financings, on an as-needed basis, in order to facilitate its growth.
On March 31, 2020, the Mexican government declared a national health emergency with extraordinary measures due to the COVID-19 pandemic. Numerous health precautions were decreed, including the suspension of non-essential businesses, with only essential services to remain open. At March 31, 2020, mining did not qualify as an essential service so for the protection of the Company's staff, employees, contractors and communities, the Company suspended its three mining operations in Mexico as of April 1, 2020 as mandated by the Mexican government. The Company retained essential personnel at each mine site during the suspension period to maintain safety protocols, environmental monitoring, security measures and equipment maintenance. Essential personnel followed the Company's strict COVID-19 safety protocols and non-essential employees were sent home to self-isolate and stay healthy, while continuing to receive their base pay. The suspension of activities ceased in May 2020 as mining was declared an essential business.
The Company implemented measures to minimize the risks of the COVID-19 virus, both to employees and to the business. At each site, the Company is following government health protocols and is closely monitoring the pandemic with local health authorities. The Company has posted health advisories to educate employees about the COVID-19 symptoms, best practices to avoid contracting and spreading the virus, and procedures to follow if symptoms are experienced.
As the COVID-19 global pandemic is dynamic and, given that the ultimate duration and severity of the pandemic remains uncertain, the impact on the Company's 2021 production and costs has greater uncertainty. Globally, and in Mexico, positive COVID-19 continues to spread at a significant rate, while the duration of vaccine distributions remain uncertain. A local outbreak, an impediment to supply or market logistics or change in government health orders remains a significant risk.
The Company's long-term business could be significantly adversely affected by the on-going effects the COVID-19 pandemic. The Company cannot accurately predict the impact COVID-19 will have on third parties' ability to meet their obligations with the Company, including due to uncertainties relating to the ultimate geographic spread of the virus, the severity of the disease, the duration of the outbreak, the duration of vaccine distribution and the length of travel and quarantine restrictions imposed by governments of affected countries.
In particular, the continued spread of COVID-19 globally could materially and adversely impact the Company's business including without limitation, employee health, limitations on travel, the availability of industry experts and personnel, on-going restrictions to mining and processing operations and drill programs, and other factors that will depend on future developments beyond the Company's control. In addition, the COVID 19 pandemic could adversely affect the economies and financial markets of many countries (including those in which the Company operates), resulting in an economic downturn that could negatively impact the Company's operating results and ability to raise capital.
As of December 31, 2020, the Company held $61.1 million in cash and $70.4 million in working capital. Management believes there is sufficient working capital to meet the Company's current obligations, however the ultimate duration and severity of the COVID pandemic remains uncertain and could impact the financial liquidity of the Company.
REVIEW OF OPERATING RESULTS
The Company operates the Guanaceví, Bolañitos and El Compas mine, the last of which attained commercial production in March 2019. The Company suspended mining operations at the El Cubo mine on November 30, 2019 due to exhaustion of reserves.
Consolidated Production Results for the Three Months and Years Ended December 31, 2020 and 2019
|
Three Months Ended December 31 |
CONSOLIDATED |
Year Ended December 31 |
||||
|
2020 |
2019 |
% Change |
|
2020 |
2019 |
% Change |
|
237,389 |
236,531 |
0% |
Ore tonnes processed |
757,160 |
954,886 |
(21%) |
|
169 |
140 |
21% |
Average silver grade (gpt) |
167 |
149 |
12% |
|
86.8 |
88.3 |
(2%) |
Silver recovery (%) |
86.5 |
88.0 |
(2%) |
|
1,117,289 |
939,511 |
19% |
Total silver ounces produced |
3,513,767 |
4,018,735 |
(13%) |
|
1,108,848 |
923,540 |
20% |
Payable silver ounces produced |
3,482,094 |
3,951,923 |
(12%) |
|
1.90 |
1.53 |
24% |
Average gold grade (gpt) |
1.78 |
1.50 |
18% |
|
87.0 |
82.2 |
6% |
Gold recovery (%) |
85.9 |
84.7 |
1% |
|
12,586 |
9,578 |
31% |
Total gold ounces produced |
37,139 |
38,907 |
(5%) |
|
12,314 |
9,397 |
31% |
Payable gold ounces produced |
36,392 |
38,003 |
(4%) |
|
2,124,169 |
1,705,751 |
25% |
Silver equivalent ounces produced(1) |
6,484,887 |
7,131,295 |
(9%) |
|
6.83 |
13.63 |
(50%) |
Cash costs per silver ounce(2)(3) |
5.55 |
12.85 |
(57%) |
|
14.58 |
20.43 |
(29%) |
Total production costs per ounce(2)(4) |
14.01 |
20.73 |
(32%) |
|
18.52 |
23.20 |
(20%) |
All in sustaining cost per ounce (2)(5) |
17.59 |
21.19 |
(17%) |
|
105.07 |
110.64 |
(5%) |
Direct operating costs per tonne(2)(6) |
101.17 |
107.96 |
(6%) |
|
129.66 |
113.47 |
14% |
Direct costs per tonne(2)(6) |
114.57 |
110.09 |
4% |
|
14.83 |
15.19 |
(2%) |
Silver co-product cash costs(7) |
12.97 |
14.18 |
(9%) |
|
1,129 |
1,312 |
(14%) |
Gold co-product cash costs(7) |
1,109 |
1,238 |
(10%) |
(1) Silver equivalents are calculated using an 80:1 (Ag/Au) ratio.
(2) The Company reports non-IFRS measures which include cash costs net of by-product revenue on a payable silver basis, total production costs per ounce, all-in sustaining costs per ounce, direct production costs per tonne, silver co-product cash costs and gold co-product cash costs in order to manage and evaluate operating performance at each of the Company's mines. These measures, some established by the Silver Institute (Production Cost Standards, June 2011), are widely used in the silver mining industry as a benchmark for performance, but do not have a standardized meaning. These measures are reported on a production basis. See Reconciliations to IFRS on page 20.
(3) Cash costs net of by-product revenue per payable silver ounce include mining, processing (including smelting, refining, transportation and selling costs), and direct overhead, net of gold credits. See Reconciliation to IFRS on pages 21 & 23.
(4) Total production costs per ounce include mining, processing (including smelting, refining, transportation and selling costs), direct overhead, amortization, depletion and amortization at the operation sites net of by product revenues. See Reconciliation to IFRS on pages 21 & 23.
(5) All-in sustaining costs per ounce include mining, processing (including smelting, refining, transportation and selling costs), direct overhead, corporate general and administration, on-site exploration, share-based compensation, reclamation and sustaining capital net of gold credits. See Reconciliation to IFRS on pages 23 & 24.
(6) Direct operating costs per tonne include mining, processing (including smelting, refining, transportation and selling costs) and direct overhead at the operation sites. Direct cost per tonne include all direct operating costs, royalties and special mining duty. See Reconciliation to IFRS on pages 21 & 22.
(7) Silver co-product cash cost and gold co-product cash cost include mining, processing (including smelting, refining, transportation and selling costs), and direct overhead allocated on pro-rated basis of realized metal value. See Reconciliation to IFRS on pages 24 & 25.
(1) Silver equivalents are calculated using an 80:1 (Ag/Au) ratio.
Consolidated Production
Three months ended December 31, 2020 (compared to the three months ended December 31, 2019)
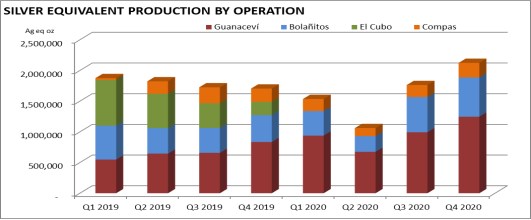
Consolidated silver production during Q4, 2020 was 1,117,289 ounces (oz), an increase of 19% compared to 939,511 oz in Q4, 2019, and gold production was 12,586 oz, an increase of 31% compared to 9,578 oz in Q4, 2019. Plant throughput was 237,389 tonnes at average grades of 169 grams per tonne (gpt) silver and 1.90 gpt gold, with the throughput tonnes similar to 236,531 tonnes grading 140 gpt silver and 1.53 gpt gold in Q4, 2019. Consolidated silver production in Q4, 2020 was significantly higher than Q4, 2019 due to the higher ore grades primarily from the Guanaceví mine, partially offset by lower in silver grade ore at Bolañitos. Mining the new, higher grade orebodies at Guanaceví resulted in higher mine output and higher ore grades.
Excluding El Cubo, which ceased operations in Q4, 2019, Q4, 2020 production increased significantly due to the improved plant throughput and ore grades at Guanaceví and improved throughput at Bolañitos.
Year ended December 31, 2020 (compared to the year ended December 31, 2019)
Consolidated silver production during 2020 was 3,513,767 oz, a decrease of 13% compared to 4,018,735 oz in 2019, and gold production was 37,139 oz, a decrease of 5% compared to 38,907 oz. Plant throughput was 757,160 tonnes at average grades of 167 gpt silver and 1.78 gpt gold, a 21% reduction compared to 954,886 tonnes grading 149 gpt silver and 1.50 gpt gold in 2019. Consolidated silver and gold production were lower than 2019 due to the suspension of mining activities in April and part of May due to the COVID-19 pandemic and the suspension of operations at the El Cubo mine, related to lack of ore, in November 2019.
Excluding El Cubo, 2020 production was higher despite the suspension of activities. Improved performance at Guanaceví and production from El Compas, which declared commercial production in late March 2019, were partially offset by the lower silver production from Bolañitos.
The Company's 2020 full year production met original guidance notwithstanding the government mandated two-month suspension of operations due to the pandemic. The Company withdrew its 2020 production guidance in early April due to the COVID-19 pandemic and the temporary shutdown mandated by the Mexican government and chose not to issue revised guidance when production was resumed at the end of May due to continued uncertainty caused by the ongoing pandemic. Despite the temporary shutdown in Q2, 2020, annual silver production exceeded the high range of original guidance by 1%, gold production missed the low range by 2% and silver equivalent production achieved the mid-point of the original 2020 production guidance.
Consolidated Operating Costs
Three months ended December 31, 2020 (compared to the three months ended December 31, 2019)
Direct production costs per tonne in Q4, 2020 increased 14%, to $129.66 compared with Q4, 2019 despite improved productivity at Guanaceví and Bolañitos. Costs on a per tonne basis increased due to higher royalty and purchased toll ore at the Guanaceví operation offset by lower costs incurred at the Bolanitos and El Compas operations. Direct operating costs per tonne, which excludes royalties and special mining duties was $105.07 per tonne compared to $110.64 in Q4, 2019.
Consolidated cash costs per oz, net of by-product credits (a non-IFRS measure and a standard of the Silver Institute) decreased 50% to $6.83. The cash cost decrease was driven by higher ore grades, a higher proportion of gold production, and rising gold price, which increased 25% compared to the same period ended in 2019. Royalties and special mining duty amounted to $5.27 per consolidated ounce, compared to $0.72 per consolidated ounce in Q4, 2019.
On a co-product cash costs basis silver cost per ounce was relatively flat compared to the Q4, 2019. Silver co-product cash costs fell 2% to $14.83 per ounce, while gold co-product costs fell 14% to $1,129 per ounce. The 2020 productivity improvements and higher ore grades were offset by higher royalty and special mining duty costs primarily at the Guanaceví mine. Gold co-product cash costs decreased to a greater extent as gold ore grades increased 24% and gold recoveries improved 6%.
All-in sustaining costs decreased 20% to $18.52 per oz in Q4, 2020 as a result of lower operating costs offset by higher corporate general and administrative costs and increased capital expenditures to accelerate mine development to improve daily mine output. General and administrative costs increased due to mark to market effects of deferred share units.
A Company-wide review of operations in 2019 identified several deficiencies in the operating performance. As a result, management initiated multiple remedial measures including changes of mine-site management and mining contractors, changes to shift and contractor supervision, renting used mining equipment, leasing new mining equipment and reducing the work force.
The goal of these remedial actions was to improve safety, improve productivity, reduce operating costs and generate free cash flow. Management notes that the remedial actions had a positive impact on mine operating performance with the benefit of these initiatives realized in 2020. The results of these improvements were moderated by increased health protocols and new government restrictions related to the COVID 19 global pandemic. Additionally, the increased precious metal prices increased royalty costs in Q4, 2020, muting the positive impact these initiatives have had on costs. The consolidated royalty expense increased $3.5 million and special mining duty increased $1.7 million compared to Q4, 2019.
Year ended December 31, 2020 (compared to the year ended December 31, 2019)
Direct production costs per tonne in 2020 increased 4%, to $114.57 compared with 2019 due to higher royalties, special mining duties and toll ore purchases offset by improved productivity at the Guanaceví and Bolañitos operation, the depreciation of the Mexican Peso and the exclusion of the El Cubo operation, which suspended activities in Q4, 2019. Direct operating costs per tonne, which excludes royalties and special mining duties was $101.17 per tonne compared to $108.49 in 2019.
Consolidated cash costs per oz, net of by-product credits decreased 57% to $5.55 primarily due to higher ore grades and higher a realized gold price that increased the by-product credit compared to 2019. All-in sustaining cost decreased 17% to $17.59 per oz in 2020 as a result of lower operating costs offset by higher corporate general and administrative costs and increased capital expenditures to accelerate mine development. The cash portion of general and administrative costs increased $3.0 million primarily due to a $3.6 million expense related the mark to market of deferred share units.
On a co-product cash costs basis, both silver and gold cost per ounce improved compared to 2019. Silver co-product cash costs fell 9%, while gold co-product costs fell 10% to $12.97 per ounce and $1,109 per ounce respectively. The improvement was driven by items as described for direct production costs and the higher grade ore.
The Company retained essential personnel at its operations during the suspension period to maintain safety protocols, environmental monitoring, security measures and day-to-day maintenance. Non-essential employees were sent home to self-isolate and continued to receive their base pay. From April 1st until the May re-starts, $2.2 million of costs were incurred related to the suspension of operations and were allocated to care and maintenance expenses and excluded from mine operating costs or the corresponding metrics.
A Company-wide review of operations in 2019 identified several deficiencies in the operating performance. As a result, management initiated multiple remedial measures including changes of mine-site management and mining contractors, changes to shift and contractor supervision, renting used mining equipment, leasing new mining equipment and reducing the work force.
The goal of these remedial actions was to improve safety, improve productivity, reduce operating costs and generate free cash flow. Management notes that the remedial actions had a positive impact on mine operating performance with the benefit of these initiatives realized in 2020. The results of these improvements were moderated by the additional costs and inefficiencies from suspension and the re-start of mining activities in Q2, 2020 as well as increased health protocols and new government restrictions related to the COVID 19 global pandemic. Additionally, the increased precious metal prices increased royalty costs in 2020, muting the positive impact these initiatives have had on cost metrics. At Guanaceví, the royalty costs increased $6.0 million and special mining duty increased $1.6 million compared to 2019.
GUANACEVÍ OPERATIONS
The Guanaceví operation is currently producing from three underground silver-gold mines along a five kilometre length of the prolific Santa Cruz vein. Guanaceví provides steady employment to over 500 people and engages over 400 contractors. Guanaceví mine production operated below plant capacity due to the operational issues in 2019. The development of two new orebodies, Milache and SCS and the acquisition of the Ocampo concession rights have provided sufficient ore and flexibility to increase mine output and to reach designed plant capacity. The Company successfully drilled the projected extensions of the previously mined Porvenir Cuatro and Porvenir ore bodies onto the Ocampo concessions. The Company commenced mining from the Porvenir Cuatro extension (P4E) and the Porvenir extension (PNE) late in 2019 and has steadily increased mine output throughout 2020.
During 2019, the Company acquired a 10 year right to explore and exploit the El Porvenir and El Curso concessions from Ocampo Mining SA de CV ("Ocampo"), a subsidiary of Grupo Frisco. The Company agreed to meet certain minimum production targets from the properties, subject to various terms and conditions and pay Ocampo a $12 fixed per tonne production payment plus a floating net smelter return royalty based on the spot silver price. The Company pays a 4% royalty on sales below $15.00 per ounce, 9% above $15.00 per ounce 13% above $20.00 per silver ounce, and a maximum 16% above $25 per silver ounce, based on then current realized prices.
Production Results for the Three Months and Years Ended December 31, 2020 and 2019
|
Three Months Ended December 31 |
GUANACEVÍ |
Year Ended December 31 |
||||
|
2020 |
2019 |
% Change |
|
2020 |
2019 |
% Change |
|
106,425 |
92,323 |
15% |
Ore tonnes processed |
346,679 |
322,988 |
7% |
|
331 |
252 |
31% |
Average silver grade (g/ t) |
314 |
234 |
34% |
|
87.6 |
90.0 |
(3%) |
Silver recovery (%) |
87.7 |
90.6 |
(3%) |
|
991,697 |
673,559 |
47% |
Total silver ounces produced |
3,071,075 |
2,202,592 |
39% |
|
988,722 |
671,051 |
47% |
Payable silver ounces produced |
3,061,982 |
2,196,475 |
39% |
|
1.01 |
0.75 |
35% |
Average gold grade (g/ t) |
0.96 |
0.65 |
48% |
|
92.5 |
91.0 |
2% |
Gold recovery (%) |
91.7 |
90.2 |
2% |
|
3,198 |
2,025 |
58% |
Total gold ounces produced |
9,814 |
6,087 |
61% |
|
3,188 |
2,027 |
57% |
Payable gold ounces produced |
9,786 |
6,081 |
61% |
|
1,247,537 |
835,559 |
49% |
Silver equivalent ounces produced(1) |
3,856,195 |
2,689,552 |
43% |
|
13.21 |
13.54 |
(2%) |
Cash costs per silver ounce(2)(3) |
10.44 |
15.87 |
(34%) |
|
15.52 |
16.83 |
(8%) |
Total production costs per ounce(2)(4) |
13.36 |
22.15 |
(40%) |
|
19.67 |
19.48 |
1% |
All in sustaining cost per ounce (2)(5) |
17.14 |
22.86 |
(25%) |
|
129.91 |
123.70 |
5% |
Direct operating costs per tonne(2)(6) |
117.38 |
130.78 |
(10%) |
|
179.34 |
131.56 |
36% |
Direct costs per tonne(2)(6) |
143.46 |
135.14 |
6% |
|
15.45 |
14.32 |
8% |
Silver co-product cash costs(7) |
12.72 |
15.97 |
(20%) |
|
1,176 |
1,236 |
(5%) |
Gold co-product cash costs(7) |
1,087 |
1,394 |
(22%) |
(1) Silver equivalents are calculated using an 80:1 (Ag/Au) ratio.
(2) The Company reports non-IFRS measures which include cash costs net of by-product revenue on a payable silver basis, total production costs per ounce, all-in sustaining costs per ounce and direct production costs per tonne, in order to manage and evaluate operating performance at each of the Company's mines. These measures, some established by the Silver Institute (Production Cost Standards, June 2011), are widely used in the silver mining industry as a benchmark for performance, but do not have a standardized meaning. These measures are reported on a production basis. See Reconciliation to IFRS on page 20.
(3) Cash costs net of by-product revenue per payable silver ounce include mining, processing (including smelting, refining, transportation and selling costs), and direct overhead, net of gold credits. See Reconciliation to IFRS on pages 21 & 22.
(4) Total production costs per ounce include mining, processing (including smelting, refining, transportation and selling costs), direct overhead, amortization, depletion and amortization at the operation sites net of by product revenues. See Reconciliation to IFRS on pages 21 & 22.
(5) All-in sustaining cost per ounce include mining, processing (including smelting, refining, transportation and selling costs), direct overhead, corporate general and administration, on-site exploration, share-based compensation, reclamation and sustaining capital net of gold credits. See Reconciliation to IFRS on pages 23 & 25.
(6) Direct operating costs per tonne include mining, processing (including smelting, refining, transportation and selling costs) and direct overhead at the operation sites. Direct cost per tonne include all direct operating costs, royalties and special mining duty. See Reconciliation to IFRS on pages 21 & 22.
(7) Silver co-product cash cost and gold co-product cash cost include mining, processing (including smelting, refining, transportation and selling costs), and direct overhead allocated on pro-rated basis of realized metal value. See Reconciliation to IFRS on pages 21 & 22.
Guanaceví Production Results
Three months ended December 31, 2020 (compared to the three months ended December 31, 2019)
Silver production at the Guanaceví mine during Q4, 2020 was 991,697 oz, an increase of 47% compared to 673,559 oz in Q4, 2019, and gold production was 3,198 oz, an increase of 58% compared to 2,025 oz in Q4, 2019. Plant throughput was 106,425 tonnes at average grades of 331 gpt silver and 1.01 gpt gold, compared to 92,323 tonnes grading 252 gpt silver and 0.75 gpt gold in Q4, 2019, a 15% increase in plant throughput. Mining the new, higher grade El Curso, Milache and SCS orebodies resulted in higher mine output, higher ore grades and ultimately, significantly higher silver and gold production compared to Q4, 2019.
Year ended December 31, 2020 (compared to the year ended December 31, 2019)
Silver production at the Guanaceví mine for year ended December 31, 2020 was 3,071,075 oz, an increase of 39% compared to 2,202,592 oz and gold production was 9,814 oz, an increase of 61% compared to 6,087 oz in 2019, despite the operations being temporarily suspended for April and part of May. Plant throughput was 346,679 tonnes at average grades of 314 gpt silver and 0.96 gpt gold, compared to 322,988 tonnes grading 234 gpt silver and 0.65 gpt gold for 2019. Metal production increased compared to 2019 primarily due to higher ore grades and 7% increase in throughput. Mine output and ore grades increased as a result of operational changes and increased access to the higher grade ores in the Milache, SCS and Porvenir Cuatro Extension (P4E) orebodies. These areas replaced production from the lower grade Porvenir Norte and Santa Cruz orebodies, which are now closed.
Management guided 2020 production at the Guanaceví mine to range from 2.4 to 2.7 million oz silver and 6,000 to 7,000 oz gold prior to the withdrawal of guidance on April 2, 2020. The Company withdrew its 2020 production guidance in early April due to the COVID-19 pandemic and the temporary shutdown mandated by the Mexican government and chose not to issue revised guidance when production was resumed at the end of May due to continued uncertainty caused by the ongoing pandemic. The Guanacevi mine significantly exceeded the withdrawn guidance notwithstanding the government mandated two-month suspension of operations due to the pandemic. Higher grade ores compared to plan in the SCS and P4E orebodies was the primary factor for exceeding original guidance.
Guanaceví Operating Costs
Three months ended December 31, 2020 (compared to the three months ended December 31, 2019)
Direct production costs per tonne for the three months ended December 31, 2020 increased 36% to $179.34 compared with the same period in 2019. Mining, processing and indirect costs improved on per tonne basis compared to prior year, however royalties paid for ore mined from the Porvenir Cuatro extension increased substantially, a higher proportion of third party ore was purchased and improved profitability resulted in special mining duties paid to the government. Increased production from the Porvenir Cuatro extension with rising precious metal prices resulted in $4.2 million of royalty costs, a $3.5 million increase compared to the same period in 2019. The higher price environment has resulted in increased ore available for purchase from toll miners within the district. During Q4, 2020 15% of tonnes processed were purchased from local miners at total cost of $2.0 million. At current prices, the ore purchased is more expensive than ore mined by the Company, however numerous peripheral benefits resulted in the decision to purchase a higher proportion of local ore, with the excess mined ore stockpiled in the quarter. The improved profitability of the operations resulted in $1.1 million Mexico special mining duty during Q4, 2020 compared to nil in Q4, 2019 which are included in cost per tonne and ounce metrics. Direct operating costs per tonne, which excludes royalties and special mining duties was $129.91 per tonne compared to $123.70 in Q4, 2019.
Cash costs per oz, net of by-product credits (a non-IFRS measure and a standard of the Silver Institute) were $13.21, 2% lower due to higher metal grades and a higher gold credit, offset by the higher costs per tonne described above. Similarly, all-in sustaining cost was relatively flat, increasing 1% to $19.67 per oz for the three months ended December 31, 2020. Lower operating costs on a per ounce basis were offset by higher general and administration costs and capital expenditures compared to the same period in 2019. On an absolute basis, capital expenditures increased as new ore bodies continued to be developed, and higher allocation of increased general and administrative costs further offset the operational gains. General and administrative costs increased due to the effect of the mark to market of deferred share units.
Year ended December 31, 2020 (compared to the year ended December 31, 2019)
Direct production costs per tonne for the year ended December 31, 2020 increased 6% compared with 2019. Operating costs improved on per tonne basis compared to prior year, however royalties paid for ore mined from the Porvenir Cuatro extension increased substantially, a higher proportion of third party ore was purchased and improved profitability resulted in special mining duties paid to the government. Increased production from the Porvenir Cuatro extension with rising precious metal prices resulted in $7.4 million of royalty costs, a $6.0 million increase compared to the same period in 2019. The higher price environment has resulted in increased ore available for purchase from toll miners within the district. During 2020 12% of tonnes processed were purchased from local miners compared to 6% in 2019.
At current prices, the ore purchased is more expensive than ore mined by the Company, however numerous peripheral benefits resulted in the decision to purchase a higher proportion of local ore, with the excess mined ore stockpiled. The improved profitability of the operations resulted in $1.6 million Mexico special mining duty during 2020 compared to nil in 2019 which are included in cost per tonne and ounce metrics. Direct operating costs per tonne, which excludes royalties and special mining duties was $117.38 per tonne compared to $130.78 in Q4, 2019.
Cash costs per oz, net of by-product credits were $10.44, 34% lower 2019, despite the higher direct cost per tonne, as significantly higher metal grades and higher gold credit reduced this cost metric. Similarly, all-in sustaining costs fell 25% to $17.14 per oz for 2020. The decrease in cash costs per ounce was the primary driver of the lower all in sustaining costs, which were offset by a larger allocation of increased general and administration expenses compared to the same period in 2019. Consolidated general and administrative costs increased $3.0 million primarily due to a $3.6 million mark to market expense of deferred share units, amounting to a $2.2 million allocation increase to Guanacevi production costs.
The Company retained essential personnel at Guanaceví during the suspension period to maintain safety protocols, environmental monitoring, security measures and day-to-day maintenance. Non-essential employees were sent home to self-isolate and continued to receive their base pay. These costs incurred from April 1st to early May totaled $0.9 million and were allocated to care and maintenance expenses and excluded from mine operating costs and the corresponding metrics.
BOLAÑITOS OPERATIONS
The Bolañitos operation encompasses three underground silver-gold mines and a flotation plant. Bolañitos provides steady employment for over 360 people and engages over 260 contractors.
Production Results for the Three Months and Years Ended December 31, 2020 and 2019
|
Three Months Ended December 31 |
BOLAÑITOS |
Year Ended December 31 |
||||
|
2020 |
2019 |
% Change |
|
2020 |
2019 |
% Change |
|
107,332 |
82,147 |
31% |
Ore tonnes processed |
331,174 |
316,708 |
5% |
|
34 |
51 |
(33%) |
Average silver grade (g/ t) |
40 |
73 |
(45%) |
|
84.7 |
81.6 |
4% |
Silver recovery (%) |
83.0 |
84.1 |
(1%) |
|
99,417 |
109,963 |
(10%) |
Total silver ounces produced |
353,318 |
624,942 |
(43%) |
|
94,526 |
103,348 |
(9%) |
Payable silver ounces produced |
333,293 |
603,903 |
(45%) |
|
2.22 |
1.81 |
23% |
Average gold grade (g/ t) |
2.02 |
1.69 |
20% |
|
88.2 |
85.5 |
3% |
Gold recovery (%) |
88.2 |
85.9 |
3% |
|
6,754 |
4,088 |
65% |
Total gold ounces produced |
18,963 |
14,779 |
28% |
|
6,551 |
4,008 |
63% |
Payable gold ounces produced |
18,429 |
14,380 |
28% |
|
639,737 |
437,003 |
46% |
Silver equivalent ounces produced (1) |
1,870,358 |
1,807,262 |
3% |
|
(44.56) |
4.82 |
(1,025%) |
Cash costs per silver ounce(2)(3) |
(32.11) |
6.72 |
(578%) |
|
(15.50) |
14.44 |
(207%) |
Total production costs per ounce(2)(4) |
(4.76) |
12.78 |
(137%) |
|
16.98 |
38.38 |
(56%) |
All in sustaining cost per ounce (2)(5) |
23.53 |
25.11 |
(6%) |
|
71.88 |
79.89 |
(10%) |
Direct operating costs per tonne(2)(6) |
70.11 |
77.31 |
(9%) |
|
75.82 |
80.66 |
(6%) |
Direct costs per tonne(2)(6) |
71.78 |
77.88 |
(8%) |
|
13.26 |
14.31 |
(7%) |
Silver co-product cash costs(7) |
12.04 |
12.88 |
(7%) |
|
1,010 |
1,236 |
(18%) |
Gold co-product cash costs(7) |
1,029 |
1,124 |
(8%) |
(1) Silver equivalents are calculated using an 80:1 (Ag/Au) ratio.
(2) The Company reports non-IFRS measures which include cash costs net of by-product revenue on a payable silver basis, total production costs per ounce, all-in sustaining costs per ounce and direct production costs per tonne, in order to manage and evaluate operating performance at each of the Company's mines. These measures, some established by the Silver Institute (Production Cost Standards, June 2011), are widely used in the silver mining industry as a benchmark for performance, but do not have a standardized meaning. These measures are reported on a production basis. See Reconciliation to IFRS on page 20.
(3) Cash costs net of by-product revenue per payable silver ounce include mining, processing (including smelting, refining, transportation and selling costs), and direct overhead, net of gold credits. See Reconciliation to IFRS on pages 21 & 22.
(4) Total production costs per ounce include mining, processing (including smelting, refining, transportation and selling costs), direct overhead, amortization, depletion and amortization at the operation sites net of by product revenues. See Reconciliation to IFRS on pages 21 & 22.
(5) All-in sustaining cost per ounce include mining, processing (including smelting, refining, transportation and selling costs), direct overhead, corporate general and administration, on-site exploration, share-based compensation, reclamation and sustaining capital net of gold credits. See Reconciliation to IFRS on pages 23 & 25.
(6) Direct operating costs per tonne include mining, processing (including smelting, refining, transportation and selling costs) and direct overhead at the operation sites. Direct cost per tonne include all direct operating costs, royalties and special mining duty. See Reconciliation to IFRS on pages 21 & 22.
(7) Silver co-product cash cost and gold co-product cash cost include mining, processing (including smelting, refining, transportation and selling costs), and direct overhead allocated on pro-rated basis of realized metal value. See Reconciliation to IFRS on pages 24 & 25.
Bolañitos Production Results
Three months ended December 31, 2020 (compared to the three months ended December 31, 2019)
Silver production at the Bolañitos mine was 99,417 oz in Q4, 2020, a decrease of 10% compared to 109,963 oz in Q4, 2019, and gold production was 6,754 oz in Q4, 2020, an increase of 65% compared to 4,088 oz in Q4, 2019. Plant throughput in Q4, 2020 was 107,332 tonnes at average grades of 34 gpt silver and 2.22 gpt gold, compared to 82,147 tonnes grading 51 gpt silver and 1.81 gpt gold in Q4, 2019. Since 2019, management has focused to increase mine development, replaced its mining fleet and increased workforce training to improve throughput to expected capacity of the operation. These initiatives resulted in the improved throughput compared to Q4, 2019. Normal variations of the ore body have resulted in ore with higher gold grade and lower silver grade compared to Q4, 2019.
Year ended December 31, 2020 (compared to the year ended December 31, 2019)
Silver production at the Bolañitos mine was 353,318 oz for 2020, a decrease of 43% compared to 624,942 oz in 2019, and gold production was 18,963 oz for 2020, an increase of 28% compared to 14,779 oz in 2019. Plant throughput was 331,174 tonnes at average grades of 40 gpt silver and 2.02 gpt gold, compared to 316,708 tonnes grading 73 gpt silver and 1.69 gpt gold for the same period in 2019. Throughput was higher compared to 2019 despite the suspension of mining activities under the Mexican health decree. Since 2019, mine management has focused to increase mine development, replaced its mining fleet and increased workforce training to improve throughput to expected capacity of the operation. These initiatives resulted in a gradual improvement of daily throughput over fiscal 2020 and exceeded plan in Q4, 2020. Ore was mined in areas with lower silver grades compared to historical grades, while gold grades are similar to historical grades and plan. The development of the San Miguel vein, which was behind plan, was expected to provide higher silver grade material during 2020. Production from the San Miguel vein is expected to increase in 2021.
Management guided 2020 production at the Bolañitos mine to range from 0.5 to 0.6 million oz silver and 22,000 to 25,000 oz gold prior to the withdrawal of guidance on April 2, 2020. The Company withdrew its 2020 production guidance in early April due to the COVID-19 pandemic and the temporary shutdown mandated by the Mexican government and chose not to issue revised guidance when production was resumed at the end of May due to continued uncertainty caused by the ongoing pandemic. On a pro-rated basis, the Bolañitos mine throughput was slightly below plan, while gold production would have met the low range of the guided production. Silver production would have missed the low range of the guided production due to the lower silver grades mined than anticipated.
Bolañitos Operating Costs
Three months ended December 31, 2020 (compared to the three months ended December 31, 2019)
Direct production costs per tonne in the three month period ended December 31, 2020 decreased 6% to $75.82 per tonne due to operational improvements, including lower costs gained from new mobile equipment offset by increased special mining duties. The significantly lower silver grades resulted in lower silver production, while cash costs net of by-product credits (which is a non-IFRS measure and a standard of the Silver Institute), were negative $44.56 per oz of payable silver in Q4, 2020 compared to positive $4.82 per oz in Q4, 2019. The higher proportion of gold production, and rising gold price which increased 41% compared to the same period 2019, were the primary drivers in the lower cash cost metric.
On a co-product cash costs basis, both silver and gold cost per ounce improved compared to Q4, 2019. Silver co-product cash costs fell 7%, while gold co-product costs fell 18% to $13.26 per ounce and $1,010 per ounce respectively. The improvement was primarily driven by the lower direct costs per tonne, the variation in ore grades and improved recoveries.
All-in sustaining costs (also a non-IFRS measure) decreased in Q4, 2020 to $16.98 per oz due to the improved operating costs. The improved operating costs were partially offset by higher capital expenditures and higher general and administrative costs in Q4, 2020 compared to Q4, 2019. The Company continues to focus on mine development to improve stope access and provide flexibility for future periods. General and administrative costs increased due to mark to market deferred share units.
Year ended December 31, 2020 (compared to the year ended December 31, 2019)
Direct production costs per tonne for 2020 decreased 8% to $71.78 per tonne due to operational improvements, including lower maintenance costs incurred from new mobile equipment offset by the additional costs required for the re-start of operating activities in May. Silver cash costs net of by-product credits (which is a non-IFRS measure and a standard of the Silver Institute), were negative $32.11 per oz of payable silver in 2020 compared to positive $6.72 per oz in 2019. The higher proportion of gold production, and rising gold price which increased 27% compared to 2019, were the primary drivers in the lower cash cost net of by-product credits metric.
On a co-product cash costs basis, silver cost per ounce improved compared to 2019. Silver co-product cash costs fell 7% to $12.04 as lower direct costs per tonne were offset by lower silver grade ore compared to prior period. Gold co-product costs decreased 8% to $1,029 per ounce primarily due to the lower direct costs per tonne and a 20% increase of ore gold grade.
All-in sustaining costs (also a non-IFRS measure) were $23.53 per oz, a 6% decrease compared to 2019. The lower operating costs were partially offset by increased capital expenditures and higher general and administration cost allocation in 2020 compared to 2019. The Company invested in new mine equipment to improve fleet operating costs and equipment availability and increase mine development in 2020 to improve stope access and provide operating flexibility. Consolidated general and administrative costs increased $3.0 million primarily due to a $3.6 million mark to market expense of deferred share units, amounting to a $1.0 million allocation increase to Bolanitos production costs.
The Company retained essential personnel at Bolañitos during the suspension period to maintain safety protocols, environmental monitoring, security measures and day-to-day maintenance. Non-essential employees were sent home to self-isolate and continued to receive their base pay. These costs incurred from April 1st to late May totaled $0.8 million and were allocated to care and maintenance expenses and not included in operating costs or the corresponding metrics.
EL COMPAS OPERATIONS
The El Compas operation is a small but high grade, permitted gold-silver mine with a small leased flotation plant in the historic silver mining district of Zacatecas, with good exploration potential to expand resources and scale up production. There is also potential for the Company to acquire other properties in the area to consolidate resources and exploration targets in the district. El Compas has a nominal plant capacity of 250 tonnes per day.
El Compas currently employs close to 200 people and engages over 50 contractors and achieved commercial production during Q1, 2019. The current resource is sufficient to support mining until mid-2021, and brownfields exploration has returned encouraging results on the Calicanto property. Management is reviewing alternative mine plans to ensure positive free cash flow in 2021.
Production Results for the Three Months and Years Ended December 31, 2020 and 2019
|
Three Months Ended December 31 |
El Compas |
Year Ended December 31 |
||||
|
2020 |
2019 |
% Change |
|
2020 |
2019 |
% Change |
|
23,632 |
22,855 |
3% |
Ore tonnes processed |
79,307 |
69,772 |
14% |
|
50 |
65 |
(23%) |
Average silver grade (g/ t) |
53 |
75 |
(29%) |
|
68.9 |
70.2 |
(2%) |
Silver recovery (%) |
66.1 |
62.0 |
7% |
|
26,175 |
33,518 |
(22%) |
Total silver ounces produced |
89,374 |
104,377 |
(14%) |
|
25,600 |
31,941 |
(20%) |
Payable silver ounces produced |
86,819 |
100,243 |
(13%) |
|
4.41 |
4.33 |
2% |
Average gold grade (g/ t) |
4.32 |
4.37 |
(1%) |
|
78.6 |
72.2 |
9% |
Gold recovery (%) |
75.9 |
77.3 |
(2%) |
|
2,634 |
2,298 |
15% |
Total gold ounces produced |
8,362 |
7,577 |
10% |
|
2,575 |
2,193 |
17% |
Payable gold ounces produced |
8,177 |
7,342 |
11% |
|
236,895 |
217,358 |
9% |
Silver equivalent ounces produced(1) |
758,334 |
710,537 |
7% |
|
(50.04) |
10.90 |
(559%) |
Cash costs per silver ounce(2)(3) |
(22.51) |
(7.74) |
(191%) |
|
89.45 |
52.82 |
69% |
Total production costs per ounce(2)(4) |
109.10 |
58.70 |
86% |
|
(20.19) |
47.68 |
(142%) |
All in sustaining cost per ounce (2)(5) |
10.98 |
27.49 |
(60%) |
|
143.96 |
154.58 |
(7%) |
Direct operating costs per tonne(2)(6) |
160.04 |
139.53 |
15% |
|
150.52 |
160.01 |
(6%) |
Direct costs per tonne(2)(6) |
166.97 |
143.70 |
16% |
|
15.69 |
15.76 |
(0%) |
Silver co-product cash costs(7) |
16.47 |
13.09 |
26% |
|
1,194 |
1,361 |
(12%) |
Gold co-product cash costs(7) |
1,408 |
1,143 |
23% |
(1) Silver equivalents are calculated using an 80:1 (Ag/Au) ratio.
(2) The Company reports non-IFRS measures which include cash costs net of by-products on a payable silver basis, total production costs per ounce, all-in sustaining costs per ounce and direct production costs per tonne, in order to manage and evaluate operating performance at each of the Company's mines. These measures, some established by the Silver Institute (Production Cost Standards, June 2011), are widely used in the silver mining industry as a benchmark for performance, but do not have a standardized meaning. These measures are reported on a production basis. See Reconciliation to IFRS on page 20.
(3) Cash costs net of by-product revenue per payable silver ounce include mining, processing (including smelting, refining, transportation and selling costs), and direct overhead, net of gold credits. See Reconciliation to IFRS on pages 21 & 22.
(4) Total production costs per ounce include mining, processing (including smelting, refining, transportation and selling costs), direct overhead, amortization, depletion and amortization at the operation sites net of by product revenues. See Reconciliation to IFRS on pages 21 & 22.
(5) All-in sustaining cost per ounce include mining, processing (including smelting, refining, transportation and selling costs), direct overhead, corporate general and administration, on-site exploration, share-based compensation, reclamation and sustaining capital net of gold credits. See Reconciliation to IFRS on pages 23 & 24.
(6) Direct operating costs per tonne include mining, processing (including smelting, refining, transportation and selling costs) and direct overhead at the operation sites. Direct cost per tonne include all direct operating costs, royalties and special mining duty. See Reconciliation to IFRS on pages 21 & 22.
(7) Silver co-product cash cost and gold co-product cash cost include mining, processing (including smelting, refining, transportation and selling costs), and direct overhead allocated on pro-rated basis of realized metal value. See Reconciliation to IFRS on pages 24 & 25.
El Compas Production Results
Three months ended December 31, 2020 (compared to the three months ended December 31, 2019)
Silver production at the El Compas mine was 26,175 oz in Q4, 2020, a decrease of 22% compared to 33,518 oz in Q4, 2019 and gold production was 2,634 oz in Q4, 2020, an increase of 15% compared to 2,298 in Q4, 2019. Plant throughput in Q4, 2020 was 23,632 tonnes at average grades of 50 gpt silver and 4.41 gpt gold compared to 22,855 tonnes at average grades of 65 gpt silver and 4.33 gpt gold. El Compas silver grades were lower than Q4, 2019 due to variations in the ore body.
Year ended December 31, 2020 (compared to the year ended December 31, 2019)
Silver production at the El Compas mine was 89,374 oz and gold production was 8,362 oz in 2020. Plant throughput in 2020 was 79,307 tonnes at average grades of 53 gpt silver and 4.32 gpt gold.
As commercial production was declared March 15, 2019, the 2019 comparative period does not include a full year of production. During the period from March 15, 2019 to December 31, 2019 silver production at the El Compas mine was 104,377 oz and gold production was 7,577 oz with plant throughput of 69,772 tonnes at average grades of 75 gpt silver and 4.37 gpt gold during this period in 2019. Similarly, due to the Mexican health decree 2020 does not include a full year of production. Throughput was lower than planned due to the suspension of mining activities under the Mexican health decree. El Compas production was close to plan prior to the suspension with higher throughput offset by lower grades. Management replaced the mining contractor with new mine employees in March 2020 and adjusted the mining methods to reduce dilution and costs going forward. Management finished replacing the mining contractor with new employees in June 2020, but dilution remains a continuing focus for improvement.
Management guided 2020 production at the El Compas mine to range from 0.1 to 0.2 million oz silver and 10,000 to 12,000 oz gold prior to the withdrawal of guidance on April 2, 2020. The Company withdrew its 2020 production guidance in early April due to the COVID-19 pandemic and the temporary shutdown mandated by the Mexican government and chose not to issue revised guidance when production was resumed at the end of May due to continued uncertainty caused by the ongoing pandemic. On a pro-rated basis, the El Compas mine throughput was slightly above plan, while metal production would have met the low range of the guided production.
El Compas Operating Costs
Three months ended December 31, 2019
Direct production costs were $150.52 per tonne in Q4, 2020, a 6% decrease from Q4, 2019. On re-start of the mine in May, the Company invested in employee training to improve dilution and grade control. Silver cash costs net of by-product credits (which is a non-IFRS measure and a standard of the Silver Institute), were negative $50.04 per oz of payable silver in Q4, 2020 compared to $10.90 per oz in Q4, 2019. The lower costs per tonne and rising gold prices which increased 41% were the primary drivers in the lower cash cost metric offset by lower silver grades compared to 2019.
On a co-product cash costs basis, both silver and gold cost per ounce improved compared to the Q4, 2019. Silver co-product cash costs decreased minimally, while gold co-product costs fell 12% to $15.69 per ounce and $1,194 per ounce respectively. The improved costs were driven by the lower operating costs on a per tonne basis, offset by the lower silver grade ore.
All-in sustaining costs (also a non-IFRS measure) decreased in Q4, 2020 to negative $20.19 per oz due compared to $47.68 per ounce over the same period ended in 2019. The lower all-in sustaining costs is a function of the lower operating costs and lower capital expenditures on mine development compared to 2019.
The Company retained essential personnel at El Compas during the suspension period to maintain safety protocols, environmental monitoring, security measures and day-to-day maintenance.
Non-essential employees were sent home to self-isolate and continued to receive their base pay. These costs incurred from April 1st to late May totalled $0.5 million and were allocated to care and maintenance expenses and excluded from mine operating costs or the corresponding metrics.
Year ended December 31, 2020 (compared to the year ended December 31, 2019)
Direct production costs were $166.97 per tonne in 2020, an increase from 2019 due to inefficiencies during the transition from replacing mine contractors with employees and expensed development expenditures in 2020. Silver cash costs net of by-product credits (which is a non-IFRS measure and a standard of the Silver Institute), were negative $22.51 per oz of payable silver in 2020 compared to negative $7.74 per oz in 2019. The higher operating costs and lower silver grades were offset by a gold credit from the higher realized gold price, which increased by 27% compared to 2019.
Similarly, on a co-product cash costs basis, silver and gold cash cost per ounce increased compared to 2019. Silver co-product cash costs increased 26% due to the higher direct costs per tonne and lower silver grade ore partially offset by improved silver recoveries. Gold co-product cash costs increased 23% primarily due to the higher direct costs per tonne.
All-in sustaining costs (also a non-IFRS measure) decreased in 2020 to $10.98 per oz primarily due to the reduced capital expenditures offset by increased brownfield exploration expenditures to extend mine life and higher general and administrative costs in 2020 compared to 2019. Consolidated general and administrative costs increased $3.0 million primarily due to a $3.6 million mark to market expense of deferred share units, amounting to a $0.4 million allocation increase to El Compas production costs.
EL CUBO OPERATIONS
The El Cubo operation includes two previously operating underground silver-gold mines and a flotation plant. which employed over 350 people and engaged over 200 contractors until the suspension of operations at the end of November 2019 as the mineral reserves had been exhausted. The mine, plant and tailings facilities are on care and maintenance.
Company management and contract personnel continue to maintain the security of the mine, plant and tailings facilities. For the year ended December 31, 2020 the Company incurred $2.4 million in legal, administrative and care and maintenance expenses with an additional $0.4 million in severance costs and $0.2 million in building and office depreciation.
The Company maintains a security team, administrative staff, maintenance group and environmental staff. In Q4, 2020 the Company incurred $0.4 million in costs. During the second half of the year, there was a significant increase of illegal mining activity within the area requiring additional security and legal costs.
On December 15, 2020, the Company signed a binding letter agreement to sell its El Cubo mine and related assets to VanGold Mining Corp. ("VanGold") for $15.0 million in cash and share payments plus additional contingency payments.
VanGold has also agreed to pay the Company up to an additional $3.0 million in contingent payments based on the following events:
Closing of the sale is subject to satisfaction of certain conditions including final due diligence by VanGold, financing and receipt of all requisite third party and regulatory approvals, including the acceptance of the TSXV on or before March 17, 2021, failing which either VanGold or the Company may terminate the agreement. If the tax lien on the assets is not removed on or before closing, VanGold shall be entitled to withhold from the purchase price an amount sufficient to remove the tax lien.
DEVELOPMENT ACTIVITIES
Terronera Project
The Terronera project, located 40 kilometres northeast of Puerto Vallarta in the state of Jalisco, Mexico, features a high-grade silver-gold mineral resource in the Terronera vein, which is now over 1,400 metres long, 400 metres deep, 3 to 16 metres thick, and remains open along strike to the southeast and down dip.
In 2020, the Company engaged an external consultant to update a previous Preliminary Feasibility Study based on updated information gathered in 2019 and 2020. In Q3, 2020 the Company completed an updated summary of the project's economics and published the NI 43-101 Technical Report ("2020 PFS").
The 2020 PFS included significant changes to the operations plan, capital and operating costs compared to the previous study and, as a result, project economics improved with higher certainty on a number of assumptions. The external consultant reviewed all aspects of the previous studies, while further cost-benefit initiatives will continue to be evaluated.
The 2020 PFS base case assumes a two-year trailing average silver price of $15.97 per oz and a gold price of $1,419 per oz. At base case prices, the improved economics estimates a net present value (NPV) of $137 million at a 5% discount rate, internal rate of return (IRR) of 30.0%, and payback period of 2.7 years. Initial capital expenditures are estimated to be $99 million with life of mine capital expenditures estimated to be $60 million. The 10 year life of mine is estimated to produce an average of 3 million silver oz and 32,800 gold ounces per year generating $315 million pre-tax, $217 million after-tax, free cash flow over the life of the project.
Endeavour plans to complete a Feasibility Study in 2021 at an estimated cost of $1.8 million. During the completion of the Feasibility Study, the Company will evaluate a number of opportunities to further enhance the value of the project, including exploration drilling to expand the known resources and to test multiple veins within the district. Additionally, the Company has defined an engineering, procurement and construction strategy and is strategizing commencement of various early work items. An engineering team is being assembled and a $7.3 million budget has been approved for sourcing equipment and machinery and early work items, including camp construction and known earthworks.
In Q4, 2020 the Company expanded the footprint of the project, to 20,128 hectares through the acquisition of two adjacent groups of mineral concessions, La Sanguijuela and Cerro Gordo, covering multiple mineralized vein structures. The mineralized vein structures on these properties are highly prospective and have never been previously drilled.
EXPLORATION RESULTS
In 2020, the Company initially planned to spend $5.4 million drilling 18,500 metres of core on brownfields projects, greenfields exploration and development engineering across its portfolio of mines and properties. At the three operating mines, 10,500 metres of core drilling were planned at a cost of $2.0 million to replace reserves and expand resources. During Q3, 2020 management approved an additional 9,500 drill metres to follow up on positive results at all three operations for an estimated cost of $1.7 million.
On the exploration and development projects, expenditures of $3.4 million were planned to fund 8,000 metres of core drilling, advance engineering studies at Terronera and Parral, and drill the Paloma gold project in Chile, where initial exploration results were positive. During the government suspension of activities, staff continued with mapping, sampling and interpretations across the Company project portfolio, with drill programs re-starting in September. Management approved an additional $1.0 million for 6,500 drill metres to test a prospective target adjacent to the Terronera project. The programs are expected to be completed in Q1, 2021.
At Guanaceví the Company drilled 7,240 metres in 22 holes to test the extension of the Porvenir Cuatro and Milache ore bodies. Drilling confirmed expectations and intersected significant mineralization with similar ore grades and vein widths as the 2019 intersections.
At Bolañitos the Company drilled 10,505 metres in 37 holes to target the Melladito vein and vein splays. The Company intersected significant mineralization with ore grades over mineable widths, located about 300 metres from current and historic mine workings. Management has planned further drilling and commenced the development of a crosscut to the newly discovered zones.
At El Compas the Company drilled 9,415 metres in 40 holes to targeting extensions of the Compas vein system and regional targets. The Company has intersected mineralization west of the current workings and outlined a 600,000 tonne resource on the Calicanto concessions north of the El Compas plant.
At Parral the Company mined 2,000 tonnes for a bulk sample metallurgical testing. Drilling is on hold due to COVID restrictions within the area.
In Chile, the Company commenced drilling on the Paloma properties targeting a bulk tonnage, sulfidation epithermal deposit relate to intrusive domes or the tops of porphyry systems. Assays and interpretation results are pending. Due to COVID restrictions drilling commenced later than planned and the program continued into Q1, 2021.
RESERVES AND RESOURCES
Proven and Probable silver Mineral Reserves increased year on year by 11%, while Proven and Probable gold Mineral Reserves decreased by 1%. Mineral Reserves are estimated to be 48.6 million oz silver and 472,000 oz gold. On a silver equivalent basis, Mineral Reserves total 86.3 million oz using a silver to gold ratio of 80:1. The increased Mineral Reserves are mainly due significant delineation of new reserves and resources at Guanacevi, while the conversion of Mineral Resources at each operation through continued mine development offset 2020 production.
Measured and Indicated Mineral Resources for silver decreased by 11% to 25.9 million oz and Measured and Indicated Mineral Resources for gold decreased by 2% to 222,500 oz gold. Silver equivalent Measured and Indicated Mineral Resources declined 8% to 43.7 million oz due mainly to reserve and resource reductions at Bolañitos and Compas and conversion of resources to reserves through mine development.
2020 Mineral Reserve and Resource Estimate Highlights (Compared to December 31, 2019)
Mineral Reserve and Resource estimates are based on pricing assumptions of $16.51 per ounce of silver and $1,465 per ounce of gold at Guanaceví, Bolañitos and El Compas, $17.00 per ounce of silver and $1,275 per ounce of gold at Terronera and $15.00 per ounce of silver and $1,275 per ounce of gold at Parral.
Note to U.S Investors: Mineral reserve and resources are as defined by Canadian securities laws. See "Cautionary Note to U.S. Investors Regarding Mineral Reserves and Resources".
CONSOLIDATED FINANCIAL RESULTS
Three months ended December 31, 2020 (compared to the three months ended December 31, 2019)
In Q4, 2020, the Company's mine operating earnings was $20.8 million (Q4, 2019: mine operating loss $3.8 million) on net revenue of $60.7 million (Q4, 2019: $33.5 million) with cost of sales of $39.9 million (Q4, 2019: $37.3 million).
In Q4, 2020, the Company had operating earnings of $12.0 million (Q4, 2019: operating loss $14.7 million) after exploration costs of $4.1 million (Q4, 2019: $4.7 million) and general and administrative costs of $3.9 million (Q4, 2019: $2.6 million), care and maintenance expense for the El Cubo operation of $0.4 million and net impairments and impairment reversals of $0.4 million related the estimate value in use of the Guanacevi and El Compas operations. The operating loss for Q4, 2019 included a severance expense of $3.5 million related to the suspension of operations at El Cubo at the end of 2019.
The income before taxes for Q4, 2020 was $14.8 million (Q4, 2019: loss before taxes $13.5 million) after finance costs of $0.3 million (Q4, 2019: $0.2 million), a foreign exchange gain of $1.8 million (Q4, 2019: $0.8 million) and investment and interest income of $1.3 million (Q4, 2019: $0.7 million). The Q4, 2019 income included a write-off of IVA receivable of $0.1 million. The Company realized net income for the period of $20.0 million (Q4, 2019: net loss of $17.9 million) after an income tax recovery of $5.2 million (Q4, 2019: income tax expense of $4.4 million).
Net revenue of $60.7 million in Q4, 2020, net of $0.5 million of smelting and refining costs, increased by 81% compared to $33.5 million, net of $1.1 million of smelting and refining costs. Gross sales of $61.2 million in Q4, 2020 represented a 77% increase over the $34.6 million for the same period in 2019. There was an 35% increase in silver ounces sold and a 41% increase in the realized silver price resulting in a 92% increase to silver sales. There was a 28% increase in gold ounces sold with a 25% increase in realized gold prices resulting in a 61% increase in gold sales. During the period, the Company sold 1,419,037 oz silver and 13,850 oz gold, for realized prices of $24.76 and $1,885 per oz respectively, compared to sales of 1,050,157 oz silver and 10,803 oz gold, for realized prices of $17.45 and $1,507 per oz, respectively, in the same period of 2019. For the three months ended December 31, 2020, the realized prices of silver were relatively similar average London spot prices. During the same period, Silver and gold spot prices averaged $24.41 and $1,877, respectively.
The Company decreased its finished goods silver and gold inventory to 116,484 oz and 1,459 oz, respectively at December 31, 2020 compared to 462,674 oz silver and 2,995 oz gold at September 30, 2020. The cost allocated to these finished goods was $3.6 million at December 31, 2020, compared to $6.0 million at September 30, 2020. At December 31, 2020, the finished goods inventory fair market value was $5.8 million, compared to $15.7 million at September 30, 2020.
Cost of sales for Q4, 2020 was $39.9 million, an increase of 7% over the cost of sales of $37.3 million for the same period of 2019. The slight increase in cost of sales was primarily related to significantly higher royalty costs offset by improved productivity at the Guanaceví and Bolañitos operations. Royalties increased 374% to $4.4 million due to higher realized prices and the increased mining of the high grade El Curso property at the Guanacevi operation which is subject to the significantly higher royalty rates.
Exploration expenses decreased in Q4, 2020 to $4.1 million from $4.7 million for the same period of 2019 based on timing of drill programs. General and administrative expenses increased to $3.9 million in Q4, 2020 compared to $2.6 million for the same period of 2019, primarily due to mark-to-market fluctuations for director's deferred share units which comparatively increased costs by $2.0 million.
The Company incurred a foreign exchange gain of $1.8 million in Q4, 2020 compared to a foreign exchange gain of $0.8 million in Q4, 2019 due to the slight recovery of the Mexican Peso in the quarter, which resulted in higher valuations of peso denominated tax receivables and cash balances. The Company incurred $0.3 million in finance charges primarily related to mobile equipment purchased in 2019 and early 2020 compared to $0.2 million in the same period in 2019. The Company recognized $1.3 million in investment and other income compared to $0.7 in Q4, 2019 with the majority of the other income derived from interest received on IVA collections
There was an income tax recovery of $5.2 million in Q4, 2020 compared to an income tax expense of $4.4 million in Q4, 2019. The $5.2 million tax recovery is comprised of $1.9 million in current income tax expense (Q4, 2019: $1.3 million) and $7.1 million in deferred income tax recovery (Q4, 2019: deferred income tax expense of $3.1 million). The current income tax expense consists of $1.4 million of special mining duty taxes and $0.5 million of income taxes. In 2019, the Company did not pay special mining duty due the losses generated at the operations. The deferred income tax recovery of $7.1 million is primarily due recognition loss carry forwards as the future profitability of the Guanacevi operation has significantly increased with the recent increase in reserve estimates.
Year ended December 31, 2020 (compared to the year ended December 31, 2019)
For the year ended December 31, 2020, the Company's mine operating earnings were $27.3 million (2019: mine operating loss of $17.4 million) on net revenue of $138.4 million (2019: $117.4 million) with cost of sales of $111.1 million (2019: $134.8 million).
The Company had an operating loss of $0.8 million (2019: $44.0 million) after exploration costs of $9.8 million (2019: $12.0 million), general and administrative costs of $12.7 million (2019: $10.0 million) care and maintenance expense for the shutdown of the El Cubo operation of $3.0 million and $2.2 million in care and maintenance costs related to the temporary suspension of the Guanaceví, Bolañitos and El Compas operations due to COVID-19 in Q2, 2020. In 2020, the operating loss included impairments and impairments reversals of non-current assets of $0.4 million related the value in use estimates of the Guanacevi and El Compas operation. The operating loss for 2019 included a severance expense of $4.6 million related to the suspension of operations at El Cubo at the end of 2019.
The loss before taxes was $1.0 million (2019: $44.0 million) after finance costs of $1.3 million (2019: $0.6 million), a foreign exchange loss of $1.5 million (2019: foreign exchange gain of $0.1 million) and investment and other income of $2.6 million (2019: $0.6 million). The loss before taxes for 2019 included a $0.1 million write off of IVA receivable. The Company realized net earnings for the period of $1.2 million (2019: net loss of $48.1 million) after an income tax recovery of $2.2 million (2019: income tax expense of $4.1 million).
Net revenue of $138.4 million in 2020, net of $1.8 million of smelting and refining costs, increased 18% compared to $117.4 million, net of $4.3 million of smelting and refining costs for 2019. Gross sales of $140.2 million for 2020 represented a 15% increase over gross sales of $121.7 million for 2019. There was a 15% decrease in silver ounces sold offset by a 33% increase in the realized silver price resulting in 13% increase silver sales. There was a 9% decrease in gold ounces sold with a 30% increase in realized gold prices resulting in 18% increase in gold sales. During the period, the Company sold 3,460,638 oz silver and 35,519 oz gold, for realized prices of $21.60 and $1,846 per oz respectively, compared to sales of 4,054,652 oz silver and 39,151 oz gold, for realized prices of $16.29 and $1,422 per oz, respectively, in the same period of 2019. The realized prices of silver was 5% above the average silver spot price and the realized prices of gold exceeded the years average spot price by 4%. The higher realized prices compared to average was due to the timing of sales. Silver and gold spot prices averaged $20.53 and $1,771 during 2020, respectively.
The Company increased its finished goods silver and gold inventory to 116,484 oz and 1,459 oz, respectively at December 31, 2020 compared to 95,028 oz silver and 587 oz gold at December 31, 2019. The cost allocated to these finished goods was $3.6 million at December 31, 2020, compared to $2.3 million at December 31, 2019. At December 31, 2020, the finished goods inventory fair market value was $5.8 million, compared to the fair value of $2.6 million at December 31, 2019.
Cost of sales for 2020 was $111.1 million, a decrease of 18% over the cost of sales of $134.8 million for 2019. The 18% decrease in cost of sales was primarily related to the 21% decrease in tonnes processed and the deprecation of the Mexican Peso while cost cutting and efficiency measures implemented during 2019 were offset by inefficiencies of the suspension and re-start of activities due to COVID-19 and higher royalty expense with the rising prices. Royalties increased 301% to $8.2 million due to higher realized prices and the increased mining of the high grade El Curso property at the Guanacevi operation which is subject to the significantly higher royalty rates.
Exploration expenses decreased 18% to $9.8 million from $12.0 million for the same period of 2019 as Mexican health decree resulted in a month and half of suspension of all activities. General and administrative expenses increased 27% to $12.7 million compared to $10.0 million for the same period of 2019 primarily due to recognition of mark-to-market fluctuations for director's deferred share units which comparatively increased costs by $3.5 million.
The Company recorded a foreign exchange loss of $1.5 million in 2020 compared to a foreign exchange gain of $0.1 million in 2019, due to the depreciation of the Mexican Peso which resulted in lower valuations of peso denominated tax receivables and cash balances. The Company incurred $1.3 million in finance charges primarily related to mobile equipment financed late 2019 and early 2020 compared to $0.6 million in 2019. The Company recognized $2.6 million in investment and other income compared to $0.6 million in other expenses in 2019. The other income was primarily generated from cash balances and interest generated from prolonged value added taxes refunds.
There was an income tax recovery of $2.2 million in 2020 compared to an income tax expense of $4.1 million in 2019. The $2.2 million tax recovery is comprised of $3.0 million in current income tax expense (2019: $2.7 million) and $5.2 million in deferred income tax recovery (2019: $1.4 million deferred income tax expense).
The current income tax expense consists of $2.0 million of special mining duty taxes and $1.0 million of income taxes. In 2019, the Company did not pay special mining duty due the losses generated at the operations. The deferred income tax recovery of $5.2 million is primarily due recognition loss carry forwards as the future profitability of the Guanacevi operation has significantly increased with the recent increase in reserve estimates.
The recoverable amounts of the Company's cash-generating units (CGUs), which include mining properties, plant and equipment are determined at the end of each reporting period, if impairment indicators are identified. In previous years, commodity price declines led the Company to determine there were impairment indicators and assessed the recoverable amounts of its CGUs. The recoverable amounts were based on each CGUs future cash flows expected to be derived from the Company's mining properties and represent each CGU's value in use. The cash flows were determined based on the life-of-mine after-tax cash flow forecast which incorporates management's best estimates of future metal prices, production based on current estimates of recoverable reserves and resources, exploration potential, future operating costs and non-expansionary capital expenditures discounted at risk adjusted rates based on the CGUs weighted average cost of capital.
At December 31, 2020, the Company recognized a $2.6 million reversal of a previous impairment of the Guanaceví Mine. The significant increase in the resource estimate and increase in precious metal prices were considered to be indicators of an impairment reversal. The updated Guanaceví mine plan with updated assumptions and estimates resulted in significantly higher cash flows compared with the Company's previous estimates and accordingly reversed the 2013 Guanaceví CGU impairment, limited to the carrying amount had no impairment been recognized in prior periods, net of depletion and amortization which would have been recognized in prior periods.
At December 31, 2020, the significant decrease in the El Compas resource estimate was considered to be an indicator of an impairment and the Company recognized an impairment of the El Compas Mine. The Company recorded an impairment charge related to the El Compas CGU of $3.0 million.
The recoverable amounts of the Guanaceví and El Compas mines were determined based on its value in use, estimated utilizing a discounted cash flow model. The projected cash flows used are significantly affected by changes in assumptions to metal prices, changes in the amount of recoverable reserves and resources, production cost estimates, future capital expenditures and discount rates. The discounted cash flow models are a Level 3 measurement in the fair value hierarchy.
SELECTED ANNUAL INFORMATION
| Expressed in thousands US dollars | Year ended December 31 | ||||||||
| except per share amounts | 2020 | 2019 | 2018 | ||||||
| Net revenue | $ | 138,461 | $ | 117,421 | $ | 145,518 | |||
| Net earnings (loss) | 1,159 | (48,066 | ) | (12,439 | ) | ||||
| Basic earnings (loss) per share | 0.01 | (0.36 | ) | (0.10 | ) | ||||
| Diluted earnings (loss) per share | 0.01 | (0.36 | ) | (0.10 | ) | ||||
| Dividends per share | - | - | - | ||||||
| Total assets | 210,592 | 163,713 | 177,047 | ||||||
| Total long-term liabilities | 16,968 | 16,076 | 8,747 | ||||||
NON-IFRS MEASURES
Mine operating cash flow before taxes is a non-IFRS measure that does not have a standardized meaning prescribed by IFRS and therefore may not be comparable to similar measures presented by other issuers. Mine operating cash flow is calculated as revenue minus direct production costs and royalties. Mine operating cash flow is used by management to assess the performance of the mine operations, excluding corporate and exploration activities and is provided to investors as a measure of the Company's operating performance.
| Expressed in thousands US dollars | Three Months Ended December 31 | Year Ended December 31 | ||||||||||
| 2020 | 2019 | 2020 | 2019 | |||||||||
| Mine operating earnings (loss) | $ | 20,814 | ($3,791 | ) | $ | 27,335 | ($17,361 | ) | ||||
| Share-based compensation | 60 | 37 | 330 | 195 | ||||||||
| Amortization and depletion | 8,919 | 8,055 | 28,136 | 31,495 | ||||||||
| Write down of inventory to net realizable value | 405 | 576 | 405 | 576 | ||||||||
| Mine operating cash flow before taxes | $ | 30,198 | $ | 4,877 | $ | 56,206 | $ | 14,905 | ||||
Operating cash flow before working capital changes per share is a non-IFRS measure that does not have a standardized meaning prescribed by IFRS and therefore may not be comparable to similar measures presented by other issuers. Operating cash flow per share is calculated by dividing cash from operating activities by the weighted average shares outstanding. Operating cash flow per share is used by management to assess operating performance irrespective of working capital changes and is provided to investors as a measure of the Company's operating performance.
| Expressed in thousands US dollars | Three Months Ended December 31 | Year Ended December 31 | ||||||||||
| 2020 | 2019 | 2020 | 2019 | |||||||||
| Cash from (used in) operating activities | $ | 26,650 | $ | 4,657 | $ | 38,964 | ($9,578 | ) | ||||
| Net changes in non-cash working capital | 5,028 | 12,529 | 10,138 | ($684 | ) | |||||||
| Operating cash flow before working capital adjustments | $ | 21,622 | ($7,872 | ) | $ | 28,826 | ($8,894 | ) | ||||
Operating cash flow before working capital changes per share is a non-IFRS measure that does not have a standardized meaning prescribed by IFRS and therefore may not be comparable to similar measures presented by other issuers. Operating cash flow per share is calculated by dividing cash from operating activities by the weighted average shares outstanding. Operating cash flow per share is used by management to assess operating performance irrespective of working capital changes and is provided to investors as a measure of the Company's operating performance.
| Expressed in thousands US dollars | Three Months Ended December 31 | Year Ended December 31 | ||||||||||
| except for share numbers and per share amounts | 2020 | 2019 | 2020 | 2019 | ||||||||
| Operating cash flow before working capital adjustments | $ | 21,622 | ($7,872 | ) | $ | 28,826 | ($8,894 | ) | ||||
| Basic weighted average shares outstanding | 157,536,658 | 140,054,885 | 150,901,598 | 135,367,129 | ||||||||
| Operating cash flow before working capital changes per share | $ | 0.14 | ($0.06 | ) | $ | 0.19 | ($0.07 | ) | ||||
EBITDA is a non-IFRS financial measure, which excludes the following from net earnings:
Adjusted EBITDA excludes the following additional items from EBITDA
Management believes EBITDA is a valuable indicator of the Company's ability to generate liquidity by producing operating cash flow to fund working capital needs, service debt obligations, and fund capital expenditures. Management uses EBITDA for this purpose. EBITDA is also frequently used by investors and analysts for valuation purposes whereby EBITDA is multiplied by a factor or "EBITDA multiple" based on an observed or inferred relationship between EBITDA and market values to determine the approximate total enterprise value of a Company.
EBITDA is intended to provide additional information to investors and analysts. It does not have any standardized definition under IFRS and should not be considered in isolation or as a substitute for measures of operating performance prepared in accordance with IFRS. EBITDA excludes the impact of cash costs of financing activities and taxes, and the effects of changes in operating working capital balances, and therefore is not necessarily indicative of operating profit or cash flow from operations as determined by IFRS. Other companies may calculate EBITDA and Adjusted EBITDA differently.
| Expressed in thousands US dollars | Three Months Ended December 31 | Year Ended December 31 | ||||||||||
| 2020 | 2019 | 20 20 | 2019 | |||||||||
| Net earnings (loss) for the period | $ | 19,923 | ($17,897 | ) | $ | 1,159 | ($48,066 | ) | ||||
| Depreciation and depletion – cost of sales | 8,919 | 8,055 | 28,136 | 31,495 | ||||||||
| Depreciation and depletion – exploration | 28 | 59 | 311 | 238 | ||||||||
| Depreciation and depletion – general & administration | 49 | 80 | 202 | 317 | ||||||||
| Depreciation and depletion – care & maintenance | (31 | ) | - | 214 | - | |||||||
| Depreciation and depletion – inventory write down | 231 | 236 | 231 | 236 | ||||||||
| Finance costs | 332 | 230 | 1,357 | 602 | ||||||||
| Current income tax expense | 1,937 | 1,308 | 2,993 | 2,702 | ||||||||
| Deferred income tax expense (recovery) | (7,112 | ) | 3,100 | (5,206 | ) | 1,360 | ||||||
| EBITDA | $ | 24,276 | ($4,829 | ) | $ | 29,397 | ($11,116 | ) | ||||
| Share based compensation | 617 | 582 | 3,003 | 3,195 | ||||||||
| Impairment of non-current assets, net of tax | 424 | - | 424 | - | ||||||||
| Adjusted EBITDA | $ | 25,317 | ($4,247 | ) | $ | 32,824 | ($7,921 | ) | ||||
Cash costs per silver ounce, total production costs per ounce, direct operating costs per tonne and direct production costs per tonne are measures developed by precious metals companies in an effort to provide a comparable standard; however, there can be no assurance that the Company's reporting of these non-IFRS measures are similar to those reported by other mining companies. Cash costs per ounce, production costs per ounce and direct production costs per tonne are measures used by the Company to manage and evaluate operating performance at each of the Company's operating mining units. They are widely reported in the silver mining industry as a benchmark for performance, but do not have a standardized meaning and are disclosed in addition to IFRS measures. The following tables provide a detailed reconciliation of these measures to the Company's cost of sales, as reported in its consolidated financial statements.
| Expressed in thousands US dollars | Three Months Ended December 31, 2020 | Three Months Ended December 31, 2019 | ||||||||||||||||||||||||||||
| Guanaceví | Bolañitos | El Compas | El Cubo | Total | Guanaceví | Bolañitos | El Compas | El Cubo | Total | |||||||||||||||||||||
| Direct costs per financial statements | $ | 15,635 | $ | 7,420 | $ | 3,060 | $ | - | $ | 26,115 | $ | 12,366 | $ | 6,980 | $ | 4,011 | $ | 5,111 | $ | 28,468 | ||||||||||
| Smelting and refining costs included in net revenue | - | 380 | 111 | - | 491 | - | 968 | 91 | - | 1,059 | ||||||||||||||||||||
| Opening finished goods | (3,318 | ) | (335 | ) | (585 | ) | - | (4,238 | ) | (2,455 | ) | (1,604 | ) | (347 | ) | (458 | ) | (4,864 | ) | |||||||||||
| Finished goods NRV adjustment | - | - | 174 | - | 174 | - | - | (391 | ) | - | (391 | ) | ||||||||||||||||||
| Closing finished goods | 1,509 | 250 | 642 | - | 2,401 | 1,509 | 219 | 169 | - | 1,897 | ||||||||||||||||||||
| Direct operating costs | 13,826 | 7,715 | 3,402 | - | 24,943 | 11,420 | 6,563 | 3,533 | 4,653 | 26,169 | ||||||||||||||||||||
| Royalties | 4,210 | 69 | 155 | - | 4,434 | 726 | 63 | 124 | 22 | 935 | ||||||||||||||||||||
| Special mining duty (1) | 1,050 | 354 | - | - | 1,404 | - | - | - | (265 | ) | (265 | ) | ||||||||||||||||||
| Direct costs | 19,086 | 8,138 | 3,557 | - | 30,781 | 12,146 | 6,626 | 3,657 | 4,410 | 26,839 | ||||||||||||||||||||
| By-product gold sales | (8,998 | ) | (12,327 | ) | (4,784 | ) | - | (26,109 | ) | (3,281 | ) | (7,312 | ) | (3,604 | ) | (2,085 | ) | (16,282 | ) | |||||||||||
| Opening gold inventory fair market value | 3,712 | 723 | 1,229 | - | 5,664 | 658 | 1,428 | 508 | 332 | 2,926 | ||||||||||||||||||||
| Closing gold inventory fair market value | (735 | ) | (746 | ) | (1,283 | ) | - | (2,764 | ) | (437 | ) | (244 | ) | (213 | ) | - | (894 | ) | ||||||||||||
| Cash costs net of by-product | 13,065 | (4,212 | ) | (1,281 | ) | - | 7,572 | 9,086 | 498 | 348 | 2,657 | 12,589 | ||||||||||||||||||
| Amortization and depletion | 2,850 | 2,779 | 3,290 | - | 8,919 | 2,650 | 1,235 | 1,617 | 1,824 | 7,326 | ||||||||||||||||||||
| Share-based compensation | 16 | 22 | 22 | - | 60 | 8 | 10 | 9 | 10 | 37 | ||||||||||||||||||||
| Opening finished goods depletion | (855 | ) | (158 | ) | (776 | ) | - | (1,789 | ) | (699 | ) | (294 | ) | (277 | ) | (103 | ) | (1,373 | ) | |||||||||||
| NRV depreciation cost adjustment | - | - | 231 | - | 231 | - | - | (131 | ) | - | (131 | ) | ||||||||||||||||||
| Closing finished goods depletion | 271 | 104 | 804 | - | 1,179 | 252 | 43 | 121 | - | 416 | ||||||||||||||||||||
| Total production costs | $ | 15,347 | ($1,465 | ) | $ | 2,290 | $ | - | $ | 16,172 | $ | 11,297 | $ | 1,492 | $ | 1,687 | $ | 4,388 | $ | 18,864 | ||||||||||
| Three Months Ended December 31, 2020 | Three Months Ended December 31, 2019 | |||||||||||||||||||||||||||||
| Guanaceví | Bolañitos | El Compas | El Cubo | Total | Guanaceví | Bolañitos | El Compas | El Cubo | Total | |||||||||||||||||||||
| Throughput tonnes | 106,425 | 107,332 | 23,632 | - | 237,389 | 92,323 | 82,147 | 22,855 | 39,206 | 236,531 | ||||||||||||||||||||
| Payable silver ounces | 988,722 | 94,526 | 25,600 | - | 1,108,848 | 671,051 | 103,348 | 31,941 | 117,200 | 923,540 | ||||||||||||||||||||
| Cash costs per silver ounce | $ | 13.21 | ($44.56 | ) | ($50.04 | ) | - | $ | 6.83 | $ | 13.54 | $ | 4.82 | $ | 10.90 | $ | 22.67 | $ | 13.63 | |||||||||||
| Total production costs per oz | $ | 15.52 | ($15.50 | ) | $ | 89.45 | - | $ | 14.58 | $ | 16.83 | $ | 14.44 | $ | 52.82 | $ | 37.44 | $ | 20.43 | |||||||||||
| Direct operating costs per tonne | $ | 129.91 | $ | 71.88 | $ | 143.96 | - | $ | 105.07 | $ | 123.70 | $ | 79.89 | $ | 154.58 | $ | 118.68 | $ | 110.64 | |||||||||||
| Direct costs per tonne | $ | 179.34 | $ | 75.82 | $ | 150.52 | - | $ | 129.66 | $ | 131.56 | $ | 80.66 | $ | 160.01 | $ | 112.48 | $ | 113.47 | |||||||||||
| Expressed in thousands US dollars | Year Ended December 31, 2020 | Year Ended December 31, 2019 | ||||||||||||||||||||||||||||
| Guanaceví | Bolañitos | El Compas | El Cubo | Total | Guanaceví | Bolañitos | El Compas | El Cubo | Total | |||||||||||||||||||||
| Direct costs per financial statements | $ | 40,693 | $ | 21,796 | $ | 11,612 | $ | - | $ | 74,101 | $ | 41,978 | $ | 23,742 | $ | 9,544 | $ | 25,218 | $ | 100,482 | ||||||||||
| Smelting and refining costs included in net revenue | - | 1,393 | 433 | - | 1,826 | - | 1,981 | 413 | 1,909 | 4,303 | ||||||||||||||||||||
| Opening finished goods | (1,509 | ) | (219 | ) | (169 | ) | - | (1,897 | ) | (1,247 | ) | (1,457 | ) | - | (502 | ) | (3,206 | ) | ||||||||||||
| Finished goods NRV adjustment | - | - | 174 | - | 174 | - | - | (391 | ) | - | (391 | ) | ||||||||||||||||||
| Closing finished goods | 1,509 | 250 | 642 | - | 2,401 | 1,509 | 219 | 169 | - | 1,897 | ||||||||||||||||||||
| Direct operating costs | 40,693 | 23,220 | 12,692 | - | 76,605 | 42,240 | 24,485 | 9,735 | 26,625 | 103,085 | ||||||||||||||||||||
| Royalties | 7,407 | 197 | 550 | - | 8,154 | 1,410 | 181 | 291 | 152 | 2,034 | ||||||||||||||||||||
| Special mining duty (1) | 1,635 | 354 | - | - | 1,989 | - | - | - | - | 0 | ||||||||||||||||||||
| Direct costs | 49,735 | 23,771 | 13,242 | - | 86,748 | 43,650 | 24,666 | 10,026 | 26,777 | 105,119 | ||||||||||||||||||||
| By-product gold sales | (17,458 | ) | (33,970 | ) | (14,126 | ) | - | (65,554 | ) | (8,638 | ) | (21,703 | ) | (10,589 | ) | (14,740 | ) | (55,670 | ) | |||||||||||
| Opening gold inventory fair market value | 437 | 244 | 213 | - | 894 | 279 | 1,341 | - | 604 | 2,224 | ||||||||||||||||||||
| Closing gold inventory fair market value | (735 | ) | (746 | ) | (1,283 | ) | - | (2,764 | ) | (437 | ) | (244 | ) | (213 | ) | - | (894 | ) | ||||||||||||
| Cash costs net of by-product | 31,979 | (10,701 | ) | (1,954 | ) | - | 19,324 | 34,854 | 4,060 | (776 | ) | 12,641 | 50,779 | |||||||||||||||||
| Amortization and depletion | 8,785 | 8,947 | 10,404 | - | 28,136 | 14,096 | 3,631 | 6,622 | 7,146 | 31,495 | ||||||||||||||||||||
| Share-based compensation | 114 | 108 | 108 | - | 330 | 49 | 49 | 48 | 49 | 195 | ||||||||||||||||||||
| Opening finished goods depletion | (252 | ) | (43 | ) | (121 | ) | - | (416 | ) | (597 | ) | (64 | ) | - | (186 | ) | (847 | ) | ||||||||||||
| NRV depreciation cost adjustment | - | - | 231 | - | 231 | - | - | (131 | ) | - | (131 | ) | ||||||||||||||||||
| Closing finished goods depletion | 271 | 104 | 804 | - | 1,179 | 252 | 43 | 121 | - | 416 | ||||||||||||||||||||
| Total production costs | $ | 40,897 | ($1,585 | ) | $ | 9,472 | $ | - | $ | 48,784 | $ | 48,654 | $ | 7,719 | $ | 5,884 | $ | 19,650 | $ | 81,907 | ||||||||||
| Year Ended December 31, 2020 | Year Ended December 31, 2019 | |||||||||||||||||||||||||||||
| Guanaceví | Bolañitos | El Compas | El Cubo | Total | Guanaceví | Bolañitos | El Compas | El Cubo | Total | |||||||||||||||||||||
| Throughput tonnes | 346,679 | 331,174 | 79,307 | - | 757,160 | 322,988 | 316,708 | 69,772 | 245,418 | 954,886 | ||||||||||||||||||||
| Payable silver ounces | 3,061,982 | 333,293 | 86,819 | - | 3,482,094 | 2,196,475 | 603,903 | 100,243 | 1,051,302 | 3,951,923 | ||||||||||||||||||||
| Cash costs per silver ounce | $ | 10.44 | ($32.11 | ) | ($22.51 | ) | - | $ | 5.55 | $ | 15.87 | $ | 6.72 | ($7.74 | ) | $ | 12.02 | $ | 12.85 | |||||||||||
| Total production costs per ounce | $ | 13.36 | ($4.76 | ) | $ | 109.10 | - | $ | 14.01 | $ | 22.15 | $ | 12.78 | $ | 58.70 | $ | 18.69 | $ | 20.73 | |||||||||||
| Direct operating costs per tonne | $ | 117.38 | $ | 70.11 | $ | 160.04 | - | $ | 101.17 | $ | 130.78 | $ | 77.31 | $ | 139.53 | $ | 108.49 | $ | 107.96 | |||||||||||
| Direct costs per tonne | $ | 143.46 | $ | 71.78 | $ | 166.97 | - | $ | 114.57 | $ | 135.14 | $ | 77.88 | $ | 143.70 | $ | 109.11 | $ | 110.09 | |||||||||||
| Expressed in thousands US dollars | Year Ended December 31, 2020 | Year Ended December 31, 2019 | ||||||||||||||||||||||||||||
| Guanaceví | Bolañitos | El Compas | El Cubo | Total | Guanaceví | Bolañitos | El Compas | El Cubo | Total | |||||||||||||||||||||
| Closing finished goods | 1,509 | 250 | 642 | - | 2,401 | 1,509 | 219 | 169 | - | 1,897 | ||||||||||||||||||||
| Closing finished goods depletion | 271 | 104 | 804 | - | 1,179 | 252 | 43 | 121 | - | 416 | ||||||||||||||||||||
| Finished goods inventory | $ | 1,780 | $ | 354 | $ | 1,446 | - | $ | 3,580 | $ | 1,761 | $ | 262 | $ | 290 | - | $ | 2,313 | ||||||||||||
(1) Special mining duty is an EBITDA royalty tax presented as a current income tax in accordance with IFRS.
All-in sustaining costs per ounce and all-in costs per ounce are measures developed by the World Gold Council (and used as a standard of the Silver Institute) in an effort to provide a comparable standard within the precious metal industry; however, there can be no assurance that the Company's reporting of these non-IFRS measures are similar to those reported by other mining companies. These measures are used by the Company to manage and evaluate operating performance at each of the Company's operating mining units and consolidated group, and are widely reported in the silver mining industry as a benchmark for performance, but do not have a standardized meaning and are disclosed in addition to IFRS measures. The following tables provide a detailed reconciliation of these measures to the Company's cost of sales, as reported in the Company's consolidated financial statements.
| Expressed in thousands US dollars | Three Months Ended December 31, 2020 | Three Months Ended December 31, 2019 | ||||||||||||||||||||||||||||
| Guanaceví | Bolañitos | El Compas | El Cubo | Total | Guanaceví | Bolañitos | El Compas | El Cubo | Total | |||||||||||||||||||||
| Cash costs net of by-product | $ | 13,065 | ($4,212 | ) | ($1,281 | ) | - | $ | 7,572 | $ | 9,086 | $ | 498 | $ | 348 | $ | 2,657 | $ | 12,589 | |||||||||||
| Operations stock based compensation | 16 | 22 | 22 | - | 60 | 8 | 10 | 9 | 10 | 37 | ||||||||||||||||||||
| Corporate general and administrative | 1,972 | 1,009 | 375 | - | 3,356 | 884 | 476 | 230 | 270 | 1,860 | ||||||||||||||||||||
| Corporate stock based compensation | 274 | 149 | 50 | - | 473 | 237 | 113 | 61 | 28 | 439 | ||||||||||||||||||||
| Reclamation - amortization/ accretion | 10 | 8 | 2 | - | 20 | 13 | 11 | 3 | 25 | 52 | ||||||||||||||||||||
| Mine site expensed exploration | 246 | 199 | 284 | - | 729 | 312 | 240 | 200 | - | 752 | ||||||||||||||||||||
| Intangible payments | 30 | 30 | 31 | - | 91 | - | - | - | - | - | ||||||||||||||||||||
| Equipment loan payments | 315 | 650 | - | - | 965 | - | - | - | - | - | ||||||||||||||||||||
| Capital expenditures sustaining | 3,519 | 3,750 | - | - | 7,269 | 2,533 | 2,619 | 672 | (129 | ) | 5,695 | |||||||||||||||||||
| All In Sustaining Costs | $ | 19,447 | $ | 1,605 | ($517 | ) | $ | - | $ | 20,535 | $ | 13,073 | $ | 3,967 | $ | 1,523 | $ | 2,861 | $ | 21,424 | ||||||||||
| Growth exploration | 3,198 | 4,372 | ||||||||||||||||||||||||||||
| Growth capital expenditures | (678 | ) | 94 | |||||||||||||||||||||||||||
| All In Costs | $ | 23,055 | $ | 25,890 | ||||||||||||||||||||||||||
| Three Months Ended December 31, 2020 | Three Months Ended December 31, 2019 | |||||||||||||||||||||||||||||
| Guanaceví | Bolañitos | El Compas | El Cubo | Total | Guanaceví | Bolañitos | El Compas | El Cubo | Total | |||||||||||||||||||||
| Throughput tonnes | 106,425 | 107,332 | 23,632 | - | 237,389 | 92,323 | 82,147 | 22,855 | 39,206 | 236,531 | ||||||||||||||||||||
| Payable silver ounces | 988,722 | 94,526 | 25,600 | - | 1,108,848 | 671,051 | 103,348 | 31,941 | 117,200 | 923,540 | ||||||||||||||||||||
| Silver equivalent production (ounces) | 1,247,537 | 639,737 | 236,895 | - | 2,124,169 | 835,559 | 437,003 | 217,358 | 215,831 | 1,705,751 | ||||||||||||||||||||
| Sustaining cost per ounce | $ | 19.67 | $ | 16.98 | ($20.19 | ) | - | 18.52 | $ | 19.48 | $ | 38.38 | $ | 4768 | $ | 24.40 | $ | 23.20 | ||||||||||||
| All In costs per ounce | 20.79 | $ | 28.03 | |||||||||||||||||||||||||||
| Expressed in thousands US dollars | Year Ended December 31, 2020 | Year Ended December 31, 2019 | ||||||||||||||||||||||||||||
| Guanaceví | Bolañitos | El Compas | El Cubo | Total | Guanaceví | Bolañitos | El Compas | El Cubo | Total | |||||||||||||||||||||
| Cash costs net of by-product | $ | 31,979 | ($10,701 | ) | ($1,954 | ) | - | $ | 19,324 | $ | 34,854 | $ | 4,060 | ($776 | ) | $ | 12,641 | $ | 50,779 | |||||||||||
| Operations stock based compensation | 114 | 108 | 108 | - | 330 | 49 | 49 | 48 | 49 | 195 | ||||||||||||||||||||
| Corporate general and administrative | 5,961 | 2,891 | 1,172 | - | 10,024 | 2,643 | 1,776 | 698 | 1,890 | 7,007 | ||||||||||||||||||||
| Corporate stock based compensation | 1,480 | 718 | 291 | - | 2,489 | 923 | 620 | 244 | 660 | 2,447 | ||||||||||||||||||||
| Reclamation - amortization/ accretion | 39 | 30 | 9 | - | 78 | 53 | 44 | 10 | 101 | 208 | ||||||||||||||||||||
| Mine site expensed exploration | 839 | 707 | 1,115 | - | 2,661 | 830 | 820 | 394 | 256 | 2,300 | ||||||||||||||||||||
| Intangible payments | 117 | 117 | 117 | - | 351 | - | - | - | - | - | ||||||||||||||||||||
| Equipment loan payments | 839 | 2,039 | - | - | 2,878 | - | - | - | - | - | ||||||||||||||||||||
| Capital expenditures sustaining | 11,103 | 11,933 | 95 | - | 23,131 | 10,864 | 7,798 | 2,138 | 10 | 20,810 | ||||||||||||||||||||
| All In Sustaining Costs | $ | 52,471 | $ | 7,842 | $ | 953 | $ | - | $ | 61,266 | $ | 50,216 | $ | 15,167 | $ | 2,756 | $ | 15,607 | $ | 83,746 | ||||||||||
| Growth exploration | 6,600 | 9,463 | ||||||||||||||||||||||||||||
| Growth capital expenditures | 2,408 | 989 | ||||||||||||||||||||||||||||
| All In Costs | $ | 70,274 | $ | 94,198 | ||||||||||||||||||||||||||
| Year Ended December 31, 2020 | Year Ended December 31, 2019 | |||||||||||||||||||||||||||||
| Guanaceví | Bolañitos | El Compas | El Cubo | Total | Guanaceví | Bolañitos | El Compas | El Cubo | Total | |||||||||||||||||||||
| Throughput tonnes | 346,679 | 331,174 | 79,307 | - | 757,160 | 322,988 | 316,708 | 69,772 | 245,418 | 954,886 | ||||||||||||||||||||
| Payable silver ounces | 3,061,982 | 333,293 | 86,819 | - | 3,482,094 | 2,196,475 | 603,903 | 100,243 | 1,051,302 | 3,951,923 | ||||||||||||||||||||
| Silver equivalent production (ounces) | 3,856,195 | 1,870,358 | 758,334 | - | 6,484,887 | 2,689,552 | 1,807,262 | 710,537 | 1,923,944 | 7,131,295 | ||||||||||||||||||||
| Sustaining cost per ounce | $ | 17.14 | $ | 23.53 | $ | 10.98 | - | $ | 17.59 | $ | 22.86 | $ | 25.11 | $ | 27.49 | $ | 14.85 | $ | 21.19 | |||||||||||
| All In costs per ounce | $ | 20.18 | $ | 23.84 | ||||||||||||||||||||||||||
| Expressed in thousands US dollars | Three Months Ended December 31 | Year Ended December 31 | ||||||||||
| 2020 | 2019 | 2020 | 2019 | |||||||||
| Capital expenditures sustaining | $ | 7,269 | $ | 5,695 | $ | 23,131 | $ | 20,810 | ||||
| Growth capital expenditures | (678 | ) | 94 | 2,408 | 989 | |||||||
| Property, plant and equipment expenditures | $ | 6,591 | $ | 5,789 | $ | 25,539 | $ | 21,799 | ||||
| Expressed in thousands US dollars | Three Months Ended December 31 | Year Ended December 31 | ||||||||||
| 2020 | 2019 | 2020 | 2019 | |||||||||
| Mine site expensed exploration | $ | 729 | $ | 752 | $ | 2,661 | $ | 2,300 | ||||
| Growth exploration | 3,198 | 3,818 | 6,600 | 8,909 | ||||||||
| Exploration expenditures | $ | 3,927 | $ | 4,570 | $ | 9,261 | $ | 11,209 | ||||
| Exploration depreciation and depletion | 28 | 59 | 311 | 238 | ||||||||
| Exploration share-based compensation | 84 | 107 | 184 | 554 | ||||||||
| Exploration expense | $ | 4,039 | $ | 4,736 | $ | 9,756 | $ | 12,001 | ||||
Silver co-product cash costs and gold co-product cash costs are measures used by the Company to manage and evaluate operating performance at each of the Company's operating mining units and consolidated group, but do not have a standardized meaning and are disclosed in addition to IFRS measures. The following tables provide a detailed reconciliation of these measures to the Company's cost of sales, as reported in its consolidated financial statements.
| Expressed in thousands US dollars | Three Months Ended December 31, 2020 | Three Months Ended December 31, 2019 | ||||||||||||||||||||||||||||
| Guanaceví | Bolañitos | El Compas | El Cubo | Total | Guanaceví | Bolañitos | El Compas | El Cubo | Total | |||||||||||||||||||||
| Direct costs per financial statements | $ | 15,635 | $ | 7,420 | $ | 3,060 | $ | - | $ | 26,115 | $ | 12,366 | $ | 6,980 | $ | 4,011 | $ | 5,111 | $ | 28,468 | ||||||||||
| Smelting and refining costs included in net revenue | - | 380 | 111 | - | 491 | - | 968 | 91 | - | 1,059 | ||||||||||||||||||||
| Royalties | 4,210 | 69 | 155 | - | 4,434 | 726 | 63 | 124 | 22 | 935 | ||||||||||||||||||||
| Special mining duty (1) | 1,050 | 354 | - | - | 1,404 | - | - | - | (265 | ) | (265 | ) | ||||||||||||||||||
| Opening finished goods | (3,318 | ) | (335 | ) | (585 | ) | - | (4,238 | ) | (2,455 | ) | (1,604 | ) | (347 | ) | (458 | ) | (4,864 | ) | |||||||||||
| Finished goods NRV adjustment | - | - | 174 | - | 174 | - | - | (391 | ) | - | (391 | ) | ||||||||||||||||||
| Closing finished goods | 1,509 | 250 | 642 | - | 2,401 | 1,509 | 219 | 169 | - | 1,897 | ||||||||||||||||||||
| Direct production costs | 19,086 | 8,138 | 3,557 | $ | - | 30,781 | 12,146 | 6,626 | 3,657 | 4,410 | 26,839 | |||||||||||||||||||
| Three Months Ended December 31, 2020 | Three Months Ended December 31, 2019 | |||||||||||||||||||||||||||||
| Guanaceví | Bolañitos | El Compas | El Cubo | Total | Guanaceví | Bolañitos | El Compas | El Cubo | Total | |||||||||||||||||||||
| Silver production (ounces) | 991,697 | 99,417 | 26,175 | - | 1,117,289 | 673,559 | 109,963 | 33,518 | 122,471 | 939,511 | ||||||||||||||||||||
| Average realized silver price ($) | 24.76 | 24.76 | 24.76 | - | 24.76 | 17.45 | 17.45 | 17.45 | 17.45 | 17.45 | ||||||||||||||||||||
| Silver value ($) | 24,554,418 | 2,461,565 | 648,093 | - | 27,664,076 | 11,753,605 | 1,918,854 | 584,889 | 2,137,119 | 16,394,467 | ||||||||||||||||||||
| Gold production (ounces) | 3,198 | 6,754 | 2,634 | - | 12,586 | 2,025 | 4,088 | 2,298 | 1,167 | 9,578 | ||||||||||||||||||||
| Average realized gold price ($) | 1,885 | 1,885 | 1,885 | - | 1,885 | 1,507 | 1,507 | 1,507 | 1,507 | 1,507 | ||||||||||||||||||||
| Gold value ($) | 6,028,230 | 12,731,290 | 4,965,090 | - | 23,724,610 | 3,051,675 | 6,160,616 | 3,463,086 | 1,758,669 | 14,434,046 | ||||||||||||||||||||
| Total metal value ($) | 30,582,648 | 15,192,855 | 5,613,183 | - | 51,388,686 | 14,805,280 | 8,079,470 | 4,047,975 | 3,895,788 | 30,828,513 | ||||||||||||||||||||
| Pro-rated silver costs (%) | 80% | 16% | 12% | - | 54% | 79% | 24% | 14% | 55% | 53% | ||||||||||||||||||||
| Pro-rated gold costs (%) | 20% | 84% | 88% | - | 46% | 21% | 76% | 86% | 45% | 47% | ||||||||||||||||||||
| Pro-rated silver costs ($) | 15,324 | 1,319 | 411 | - | 16,570 | 9,642 | 1,574 | 528 | 2,419 | 14,273 | ||||||||||||||||||||
| Pro-rated gold costs ($) | 3,762 | 6,819 | 3,146 | - | 14,211 | 2,504 | 5,052 | 3,129 | 1,991 | 12,566 | ||||||||||||||||||||
| Silver co-product cash costs | $ | 15.45 | $ | 13.26 | $ | 15.69 | - | $ | 14.83 | $ | 14.32 | $ | 14.31 | $ | 15.76 | $ | 19.75 | $ | 15.19 | |||||||||||
| Gold co-product cash costs | $ | 1,176 | $ | 1,010 | $ | 1,194 | - | $ | 1,129 | $ | 1,236 | $ | 1,236 | $ | 1,361 | $ | 1,706 | $ | 1,312 | |||||||||||
| Expressed in thousands US dollars | Year Ended December 31, 2020 | Year Ended December 31, 2019 | ||||||||||||||||||||||||||||
| Guanaceví | Bolañitos | El Compas | El Cubo | Total | Guanaceví | Bolañitos | El Compas | El Cubo | Total | |||||||||||||||||||||
| Direct costs per financial statements | $ | 40,693 | $ | 21,796 | $ | 11,612 | $ | - | $ | 74,101 | $ | 41,978 | $ | 23,742 | $ | 9,544 | $ | 25,218 | $ | 100,482 | ||||||||||
| Smelting and refining costs included in net revenue | - | $ | 1,393 | $ | 433 | - | $ | 1,826 | - | 1,981 | 413 | 1,909 | 4,303 | |||||||||||||||||
| Royalties | 7,407 | 197 | 550 | - | 8,154 | 1,410 | 181 | 291 | 152 | 2,034 | ||||||||||||||||||||
| Special mining duty (1) | 1,635 | 354 | - | - | 1,989 | - | - | - | - | - | ||||||||||||||||||||
| Opening finished goods | (1,509 | ) | (219 | ) | (169 | ) | - | (1,897 | ) | (1,247 | ) | (1,457 | ) | - | (502 | ) | (3,206 | ) | ||||||||||||
| Finished goods NRV adjustment | - | - | 174 | - | 174 | - | - | (391 | ) | - | (391 | ) | ||||||||||||||||||
| Closing finished goods | 1,509 | 250 | 642 | - | 2,401 | 1,509 | 219 | 169 | - | 1,897 | ||||||||||||||||||||
| Direct production costs | 49,735 | 23,771 | 13,242 | $ | - | 86,748 | 43,650 | 24,666 | 10,026 | 26,777 | 105,119 | |||||||||||||||||||
| Year Ended December 31, 2020 | Year Ended December 31, 2019 | |||||||||||||||||||||||||||||
| Guanaceví | Bolañitos | El Compas | El Cubo | Total | Guanaceví | Bolañitos | El Compas | El Cubo | Total | |||||||||||||||||||||
| Silver production (ounces) | 3,071,075 | 353,318 | 89,374 | - | 3,513,767 | 2,202,592 | 624,942 | 104,377 | 1,086,824 | 4,018,735 | ||||||||||||||||||||
| Average realized silver price ($) | 21.60 | 21.60 | 21.60 | - | 21.60 | 16.29 | 16.29 | 16.29 | 16.29 | 16.29 | ||||||||||||||||||||
| Silver value ($) | 66,335,220 | 7,631,669 | 1,930,478 | - | 75,897,367 | 35,880,224 | 10,180,305 | 1,700,301 | 17,704,363 | 65,465,193 | ||||||||||||||||||||
| Gold production (ounces) | 9,814 | 18,963 | 8,362 | - | 37,139 | 6,087 | 14,779 | 7,577 | 10,464 | 38,907 | ||||||||||||||||||||
| Average realized gold price ($) | 1,846 | 1,846 | 1,846 | - | 1,846 | 1,422 | 1,422 | 1,422 | 1,422 | 1,422 | ||||||||||||||||||||
| Gold value ($) | 18,116,644 | 35,005,698 | 15,436,252 | - | 68,558,594 | 8,655,714 | 21,015,738 | 10,774,494 | 14,879,808 | 55,325,754 | ||||||||||||||||||||
| Total metal value ($) | 84,451,864 | 42,637,367 | 17,366,730 | - | 144,455,961 | 44,535,938 | 31,196,043 | 12,474,795 | 32,584,171 | 120,790,947 | ||||||||||||||||||||
| Pro-rated silver costs (%) | 79% | 18% | 11% | - | 53% | 81% | 33% | 14% | 54% | 54% | ||||||||||||||||||||
| Pro-rated gold costs (%) | 21% | 82% | 89% | - | 47% | 19% | 67% | 86% | 46% | 46% | ||||||||||||||||||||
| Pro-rated silver costs ($) | 39,066 | 4,255 | 1,472 | - | 45,578 | 35,166 | 8,049 | 1,367 | 14,549 | 56,971 | ||||||||||||||||||||
| Pro-rated gold costs ($) | 10,669 | 19,516 | 11,770 | - | 41,170 | 8,484 | 16,617 | 8,659 | 12,228 | 48,148 | ||||||||||||||||||||
| Silver co-product cash costs | $ | 12.72 | $ | 12.04 | $ | 16.47 | - | $ | 12.97 | $ | 15.97 | $ | 12.88 | $ | 13.09 | $ | 13.39 | $ | 14.18 | |||||||||||
| Gold co-product cash costs | $ | 1,087 | $ | 1,029 | $ | 1,408 | - | $ | 1,109 | $ | 1,394 | $ | 1,124 | $ | 1,143 | $ | 1,169 | $ | 1,238 | |||||||||||
(1) Special mining duty is an EBITDA royalty tax presented as a current income tax in accordance with IFRS.
QUARTERLY RESULTS AND TRENDS
The following table presents selected financial information for each of the most recent eight quarters:
|
Table in thousands of U.S. dollars except for share |
2020 |
2019 |
||||||
|
numbers and per share amounts |
Q4 |
Q3 |
Q2 |
Q1 |
Q4 |
Q3 |
Q2 |
Q1 |
|
|
||||||||
|
Gross Sales |
$61,238 |
$36,148 |
$20,529 |
$22,372 |
$34,610 |
$28,589 |
$29,382 |
$29,143 |
|
Smelting and refining costs included in net revenue |
491 |
562 |
328 |
445 |
1,145 |
947 |
1,089 |
1,122 |
|
Direct costs |
26,115 |
18,682 |
11,962 |
17,342 |
27,653 |
21,329 |
26,215 |
25,285 |
|
Royalties |
4,434 |
2,029 |
834 |
857 |
935 |
446 |
336 |
317 |
|
Mine operating cash flow before taxes |
30,198 |
14,875 |
7,405 |
3,728 |
4,877 |
5,867 |
1,742 |
2,419 |
|
Share-based compensation |
60 |
87 |
92 |
91 |
37 |
50 |
53 |
55 |
|
Amortization and depletion |
8,919 |
8,497 |
4,197 |
6,523 |
8,055 |
7,531 |
7,794 |
8,115 |
|
Write down on inventory |
405 |
- |
- |
|
576 |
- |
- |
- |
|
Mine operating earnings (loss) |
$20,814 |
$6,291 |
$3,116 |
($2,886) |
($3,791) |
($1,714) |
($6,105) |
($5,751) |
|
Basic earnings (loss) per share |
$0.13 |
$0.00 |
($0.02) |
($0.11) |
($0.13) |
($0.05) |
($0.08) |
($0.10) |
|
Diluted earnings (loss) per share |
$0.13 |
$0.00 |
($0.02) |
($0.11) |
($0.13) |
($0.05) |
($0.08) |
($0.10) |
|
Weighted shares outstanding |
157,536,658 |
156,265,280 |
147,862,393 |
141,810,208 |
140,054,885 |
137,739,857 |
132,158,891 |
131,395,790 |
|
Net earnings (loss) |
$19,923 |
$451 |
($3,289) |
($15,926) |
($17,897) |
($6,768) |
($10,123) |
($13,278) |
|
Amortization and depletion |
8,965 |
8,296 |
4,213 |
6,268 |
8,194 |
7,194 |
7,314 |
7,227 |
|
Finance costs |
332 |
359 |
356 |
310 |
230 |
177 |
103 |
92 |
|
Current income tax |
1,937 |
595 |
195 |
266 |
1,308 |
512 |
184 |
698 |
|
Deferred income tax |
(7,112) |
556 |
(514) |
1,864 |
3,100 |
(567) |
(823) |
(350) |
|
NRV cost adjustment |
231 |
375 |
246 |
500 |
236 |
478 |
644 |
999 |
|
EBITDA |
$24,276 |
$10,632 |
$1,207 |
($6,718) |
($4,829) |
$1,026 |
($2,701) |
($4,612) |
*For Q4, 2020 and Q4, 2019 write downs on inventory at period end have been shown as a separate line item in the above reconciliation. For prior periods, it has been included as components of direct costs and amortization and depletion.
The following table presents selected production information for each of the most recent eight quarters:
|
Highlights |
2020 |
2019 |
||||||
|
|
Q4 |
Q3 |
Q2 |
Q1 |
Q4 |
Q3 |
Q2 |
Q1 |
|
Processed tonnes |
237,389 |
206,324 |
114,120 |
199,327 |
236,531 |
234,196 |
237,640 |
246,519 |
|
Guanaceví |
106,425 |
83,816 |
62,231 |
94,207 |
92,323 |
78,517 |
75,591 |
76,557 |
|
Bolañitos |
107,332 |
98,945 |
41,680 |
83,217 |
82,147 |
71,541 |
76,386 |
86,634 |
|
El Compas |
23,632 |
23,563 |
10,209 |
21,903 |
22,855 |
21,885 |
21,242 |
3,790 |
|
El Cubo |
- |
- |
- |
- |
39,206 |
62,253 |
64,421 |
79,538 |
|
Silver ounces |
1,117,289 |
942,274 |
596,545 |
857,659 |
939,511 |
948,547 |
1,059,322 |
1,071,355 |
|
Guanaceví |
991,697 |
806,917 |
527,347 |
745,114 |
673,559 |
533,923 |
536,966 |
458,144 |
|
Bolañitos |
99,417 |
112,094 |
55,682 |
86,125 |
109,963 |
147,078 |
171,891 |
196,010 |
|
El Compas |
26,175 |
23,263 |
13,516 |
26,420 |
33,518 |
43,634 |
24,007 |
3,218 |
|
El Cubo |
- |
- |
- |
- |
122,471 |
223,912 |
326,458 |
413,983 |
|
Silver grade |
169 |
162 |
188 |
155 |
140 |
144 |
157 |
154 |
|
Guanaceví |
331 |
336 |
304 |
280 |
252 |
232 |
242 |
206 |
|
Bolañitos |
34 |
42 |
47 |
40 |
51 |
77 |
78 |
86 |
|
El Compas |
50 |
48 |
60 |
58 |
65 |
90 |
72 |
61 |
|
El Cubo |
- |
- |
- |
- |
106 |
128 |
178 |
183 |
|
Silver recovery |
86.8 |
87.6 |
86.3 |
86.1 |
88.3 |
87.6 |
88.5 |
87.7 |
|
Guanaceví |
87.6 |
89.1 |
86.7 |
87.9 |
90.0 |
91.2 |
91.3 |
90.4 |
|
Bolañitos |
84.7 |
83.9 |
88.4 |
80.5 |
81.6 |
83.0 |
89.7 |
81.8 |
|
El Compas |
68.9 |
64.0 |
68.6 |
64.7 |
70.2 |
68.9 |
48.8 |
43.3 |
|
El Cubo |
- |
- |
- |
- |
91.7 |
87.4 |
88.6 |
88.5 |
|
Gold ounces |
12,586 |
10,260 |
5,817 |
8,476 |
9,578 |
9,716 |
9,558 |
10,055 |
|
Guanaceví |
3,198 |
2,342 |
1,847 |
2,427 |
2,025 |
1,557 |
1,367 |
1,138 |
|
Bolañitos |
6,754 |
5,779 |
2,508 |
3,922 |
4,088 |
3,226 |
3,035 |
4,430 |
|
El Compas |
2,634 |
2,139 |
1,462 |
2,127 |
2,298 |
2,699 |
2,238 |
342 |
|
El Cubo |
- |
- |
- |
- |
1,167 |
2,234 |
2,918 |
4,145 |
|
Gold grade |
1.90 |
1.82 |
1.84 |
1.57 |
1.53 |
1.49 |
1.51 |
1.45 |
|
Guanaceví |
1.01 |
0.95 |
1.05 |
0.87 |
0.75 |
0.67 |
0.62 |
0.52 |
|
Bolañitos |
2.22 |
2.04 |
2.10 |
1.71 |
1.81 |
1.62 |
1.49 |
1.82 |
|
El Compas |
4.41 |
3.98 |
5.55 |
4.02 |
4.33 |
4.56 |
4.35 |
3.66 |
|
El Cubo |
- |
- |
- |
- |
1.16 |
1.29 |
1.63 |
1.84 |
|
Gold recovery |
87.0 |
85.0 |
86.3 |
84.4 |
82.2 |
86.7 |
83.0 |
87.4 |
|
Guanaceví |
92.5 |
91.5 |
87.9 |
92.1 |
91.0 |
92.1 |
90.7 |
88.9 |
|
Bolañitos |
88.2 |
89.1 |
89.1 |
85.7 |
85.5 |
86.6 |
82.9 |
87.4 |
|
El Compas |
78.6 |
70.9 |
80.3 |
75.1 |
72.2 |
84.1 |
75.3 |
76.8 |
|
El Cubo |
- |
- |
- |
- |
79.8 |
86.5 |
86.4 |
88.1 |
|
Cash costs per oz (1) |
$6.83 |
$3.69 |
$2.78 |
$7.85 |
$13.63 |
$11.51 |
$13.67 |
$12.55 |
|
Guanaceví |
$13.21 |
$9.64 |
$8.48 |
$9.01 |
$13.54 |
$12.83 |
$17.37 |
$21.06 |
|
Bolañitos |
($44.56) |
($40.89) |
($30.20) |
($7.32) |
$4.82 |
$8.13 |
$11.56 |
$2.43 |
|
El Compas |
($50.04) |
$0.44 |
($96.83) |
$22.10 |
$10.90 |
($25.37) |
($1.52) |
($5.59) |
|
El Cubo |
- |
- |
- |
- |
$22.67 |
$17.67 |
$9.63 |
$7.72 |
|
AISC per oz (1) |
$18.52 |
$17.48 |
$14.91 |
$18.38 |
$23.20 |
$21.53 |
$20.90 |
$19.37 |
|
Guanaceví |
$19.67 |
$17.76 |
$15.00 |
$14.61 |
$19.48 |
$20.99 |
$24.94 |
$27.56 |
|
Bolañitos |
$16.98 |
$10.51 |
$29.79 |
$44.17 |
$38.38 |
$29.90 |
$22.64 |
$16.36 |
|
El Compas |
($20.19) |
$40.39 |
($48.25) |
$45.98 |
$47.68 |
$3.46 |
$43.62 |
$18.55 |
|
El Cubo |
- |
- |
- |
- |
$24.41 |
$20.77 |
$11.47 |
$11.43 |
|
Direct costs per tonne (1) |
$129.66 |
$112.37 |
$109.74 |
$101.63 |
$113.47 |
$106.76 |
$114.40 |
$105.84 |
|
Guanaceví |
$179.34 |
$146.26 |
$126.13 |
$111.89 |
$131.56 |
$116.20 |
$148.84 |
$145.37 |
|
Bolañitos |
$75.82 |
$67.82 |
$77.02 |
$68.65 |
$80.66 |
$81.03 |
$79.90 |
$70.87 |
|
El Compas |
$150.52 |
$178.92 |
$143.50 |
$182.81 |
$160.01 |
$137.99 |
$138.03 |
$110.03 |
|
El Cubo |
- |
- |
- |
- |
$112.48 |
$113.44 |
$107.09 |
$105.69 |
(1) Cash cost per oz, AISC per oz and Direct costs per tonne are not-IFRS measures.
Key Economic Trends
Precious Metal Price Trends
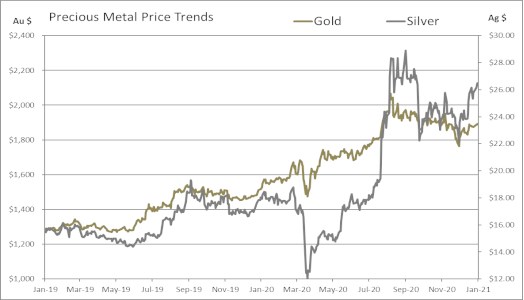
The prices of silver and gold are the largest single factor in determining profitability and cash flow from operations. The financial performance of the Company has been, and is expected to continue to be, closely linked to the prices of silver and gold.
During the year ended December 31, 2020, the average price of silver was $20.53 per ounce, with silver trading between $12.01 and $28.89 per ounce based on the London Fix silver price. This compares to an average of $16.20 per ounce for the year ended December 31, 2019, with a low of $14.37 and a high of $19.31 per ounce. For the year ended December 31, 2020, the Company realized an average price of $21.60 per silver ounce compared with $16.29 for the year ended December 31, 2019.
During the year ended December 31, 2020, the average price of gold was $1,771 per ounce, with gold trading between $1,474 and $2,067 per ounce based on the London Fix PM gold price. This compares to an average of $1,393 per ounce during the year ended December 31, 2019, with a low of $1,270 and a high of $1,546 per ounce. During the year ended December 31, 2020, the Company realized an average price of $1,846 per ounce compared with $1,422 for the year ended December 31, 2019.
Uncertainty surrounding tariff and trade discussions, the results of the US elections, signals of US economic slowdown and rising geopolitical risk renewed interest in precious metals in 2019. The impact of measures to combat the spread of COVID-19 on global economy resulted in significant volatility in the financial markets, including the gold and silver market in March 2020. Gold prices increased on an anticipated global economic recession and government financial stimulus announced to aid the economic recovery. During March 2020, silver prices capitulated on expectations of a global recession with the expectation of reduced industrial demand, then subsequently significantly rebounded as investment demand increased due to the monetary aspects of silver. The on-going risks and uncertainties from the COVID-19 pandemic has led to further government stimulus and ultimately further investment demand for gold and silver.
Currency Fluctuations
The Company's operations are located in Mexico and therefore a significant portion of operating costs and capital expenditures are denominated in Mexican pesos. The Company's corporate activities are based in Vancouver, Canada with the significant portion of these expenditures being denominated in Canadian dollars. Generally, as the U.S. dollar strengthens, these currencies weaken, and as the U.S. dollar weakens, these currencies strengthen.
During the year ended December 31, 2020, the Mexican peso was relatively flat until a significant decrease in oil prices followed by the COVID-19 crisis in March 2020 when the Mexican Peso significantly depreciated against the U.S. dollar, as funds flowed to safe haven markets and assets. Subsequently, the Mexican peso gradually appreciated against the U.S. dollar back to levels slightly lower than pre-crisis levels as investment risk was re-established.
During 2020, the average foreign exchange rate was $21.48 Mexican pesos per U.S. dollar, with the peso trading within a range of $18.53 to $25.00. This compares to a relatively flat 2019, with an average of $19.24 during the corresponding period of 2019, with a range of $18.73 to $20.14 Mexican pesos per U.S. dollar. During the year ended December 31, 2019, the Mexican peso remained relatively stable relative to the U.S. dollar, although volatility occurred throughout the year.
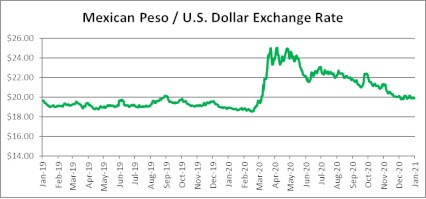
During the year ended December 31, 2020, the Canadian dollar was flat until a significant decrease in oil prices and then the COVID-19 crisis in March 2020 when the Canadian dollar significantly depreciated against the U.S. dollar as funds invested in safe haven markets and assets. Subsequently, the Canadian dollar gradually appreciated against the U.S. dollar back to levels slightly lower than pre-crisis levels as investment risk was re-established. During the period, the average foreign exchange rate was $1.3409 Canadian dollars per U.S. dollar, with the Canadian dollar trading within a range of $1.272 to $1.453. This compares to an average of $1.327 during 2019, with a range of $1.302 to $1.364 Canadian dollars per U.S. dollar during 2019.
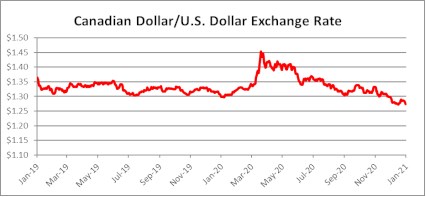
Cost Trends
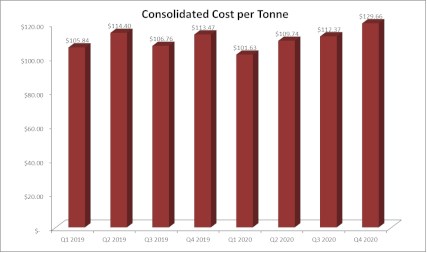
The Company's profitability is subject to industry wide cost pressures on development and operating costs with respect to labour, energy, consumables and capital expenditures. Underground mining is labour intensive and approximately 33% of the Company's production costs are directly tied to labour. In order to mitigate the impact of higher labour and consumable costs, the Company focuses on continuous improvement by promoting more efficient use of materials and supplies and by pursuing more advantageous pricing while increasing performance and without compromising operational integrity. Mining, processing and indirect costs improved on per tonne basis compared to prior year, however royalties paid for ore mined from the Porvenir Cuatro extension increased substantially, a higher proportion of third party ore was purchased and improved profitability resulted in special mining duties paid to the government.
ANNUAL OUTLOOK
The Company has implemented plans to minimize the risks of the COVID-19 virus, both to employees and to the business. The Mexican government declared mining as an essential business, however in Mexico positive COVID-19 cases continue at a significant rate and to date the infection rate has yet to flatten. A local outbreak, an impediment to supply or market logistics or change in government health orders remains a significant risk. The mines are operating under strict safety protocols with the expectations of operating near throughput capacity. At each site, the Company is following government health protocols and is closely monitoring the pandemic with local health authorities. The Company has posted health advisories to educate employees about the COVID-19 symptoms, best practices to avoid contracting and spreading the virus, and procedures to follow if symptoms are experienced.
As the COVID-19 global pandemic is dynamic, the ultimate duration and severity of the pandemic remains uncertain. The pandemic can have a material impact on the Company's 2021 production and cost estimates.
Production
In 2021, silver production is expected to range from 3.6 to 4.3 million oz and gold production is anticipated be in the 31,000 to 35,500 oz range. Silver equivalent production is forecasted to total 6.1-7.1 million oz using an 80:1 silver:gold ratio.
|
Mine |
Ag (M oz) |
Au (K oz) |
Ag Eq (M oz) |
Tonnes/Day (tpd) |
|
Guanaceví |
3.1-3.7 |
8.0-10.0 |
3.7-4.5 |
1,100-1,200 |
|
Bolañitos |
0.4-0.5 |
21.0-23.0 |
2.1-2.3 |
1,100-1,200 |
|
El Compas |
0.1-0.1 |
2.0-2.5 |
0.2-0.2 |
200-250 |
|
Total |
3.6-4.3 |
31.0-35.5 |
6.1-7.1 |
2,400-2,650 |
At Guanaceví, production will range between 1000 tpd to 1200 tpd and average 1100 tpd from the Milache, SCS and P4E orebodies. A significant portion of production will be mined from the Porvenir Cuatro extension on the El Curso concessions. The El Curso concessions were leased from a third party with no upfront costs but with significant royalty payments on production. As a result, the cash cost per ounce will increase in 2021, although direct operating costs per tonne should be similar to 2020.
At Bolañitos, production will range between 1000 tpd to 1200 tpd and average 1,050 tpd from the Plateros-La Luz, Lucero-Karina and Bolañitos-San Miguel vein systems. Ore grades are expected to be similar to 2020 mined grades and the cash cost per oz and direct cost per tonne should be similar to 2020.
At El Compas, production is forecast to continue into Q2, 2021 from the El Compas mine. New resources discovered in the Calicanto and Misie veins on the Calicanto property are currently being evaluated for possible addition to the mine plan.
Sustaining Capital Investments
In 2021, Endeavour plans to invest $32.8 million on capital projects, mainly as sustaining capital at the three operating mines, including $2.0 million in growth capital to maintain the exploration concessions and cover corporate infrastructure. At current metal prices, the sustaining capital investments should be covered by operating cash flow.
At Guanacevi, $16.7 million will be invested on capital projects, the largest of which is the development of 6.8 kilometres (km) of mine access at the Milache, SCS and the P4E orebodies for an estimated $7.2 million. The additional $9.5 million will go to upgrade the mining fleet, support site infrastructure, and expand the tailings dam.
At Bolañitos, $14.1 million will be invested on capital projects, including $7.8 million for 5.3 km of mine development to access reserves and resources in the Plateros-La Luz, Lucero-Karina and Bolañitos-San Miguel vein systems. The additional $5.9 million will go to upgrade the mining fleet, support site infrastructure, raise the tailings dam and commence a new portal for the Belen resources.
At El Compas, management is evaluating new areas for future production on the Calicanto concessions and below the current working areas of the Orito vein.
|
Mine |
Other |
Sustaining |
Growth |
Total |
|
| Mine |
Development |
Capital |
Capital |
Capital |
Capital |
|
Guanaceví |
$7.2 million |
$9.5 million |
$16.7 million |
- |
$16.7 million |
|
Bolañitos |
$8.7 million |
$5.4 million |
$14.1 million |
- |
$14.1 million |
|
Corporate |
- |
- |
- |
$2.0 million |
$ 2.0 million |
|
Total |
$15.9 million |
$14.9 million |
$30.8 million |
$2.0 million |
$32.8 million |
Operating Costs
Cash costs, net of gold by-product credits, are expected to be $7.00-8.00 per oz of silver produced in 2021. Consolidated cash costs on a co-product basis are anticipated to be $13.00-$14.00 per oz silver and $1,000-$1,100 per oz gold.
All-in sustaining costs, net of gold by-product credits, in accordance with the World Gold Council standard, are estimated to be $19.00-$20.00 per oz of silver produced. When non-cash items such as stock-based compensation are excluded, AISC are forecast to be in the $18.00-$19.00 range.
Direct operating costs are estimated to be in the range of $105-$115 per tonne, including royalties and special mining duties, which are both expected to be significantly higher in 2021 compared to 2020.
Management has used a $22 per oz silver price, $1,760 per oz gold price, and 20:1 Mexican peso per US dollar exchange rate for its 2021 cost forecasts.
Development Investment and Expenditures
At Terronera, the feasibility study is currently being prepared which will include the results of additional engineering studies and revised cost estimates at a cost of $1.0 million in 2021. Management has approved a $9.0 million budget to complete the feasibility study, expand the project team, prepare for site-prep and source long lead items required to commence development upon completion of the feasibility study. Following the completion of the feasibility study and board approval, management will release a revised program and budget for the project.
Exploration Expenditures
In 2021, the Company plans to spend $10.2 million drilling 50,000 metres of core on brownfields projects, greenfields exploration and development engineering across its portfolio of mines and properties. At the Guanacevi and Bolanitos operating mines, 11,500 metres of core drilling are planned at a cost of $2.0 million and $1.9 million. respectively to replace reserves and expand resources.
On the exploration and development projects, expenditures of $6.3 million are planned to fund 27,000 metres of core drilling at the Terronera project to test multiple regional targets, the Parral project to continue drilling the San Patricio and Veta Colorado vein systems and the Paloma project in Chile. The Company is currently permitting of the Cerro Marquez and Aida projects and will continue to map and sample to prioritize targets for drilling.
|
Project |
2021 Activity |
Drill Metres |
Expenditures |
|
Guanaceví |
Drilling |
11,500 |
$2.0 million |
|
Bolañitos |
Drilling |
11,500 |
$1.9 million |
|
Parral |
Drilling/Economic Study |
8,000 |
$2.0 million |
|
Chile - Paloma |
Drilling |
3,000 |
$1.2 million |
|
Chile - Other |
Evaluation |
- |
$0.6 million |
|
Terronera |
PFS/Development |
16,000 |
$ 2.5 million |
|
Total |
|
50,000 |
$10.2 million |
LIQUIDITY AND CAPITAL RESOURCES
Cash and cash equivalents increased from $23.4 million at December 31, 2019 to $61.1 million at December 31, 2020. The Company had working capital of $70.4 million at December 31, 2020 (December 31, 2019 - $38.4 million). The $32.0 million increase in working capital is primarily due to net equity raise of $25.3 million, $6.9 million from proceeds of exercised options and cash flow generated by the operations offset by $25.5 million investment in mineral property, plant and equipment and $3.2 million loan repayments.
Operating activities generated $39.0 million during 2020 compared to using $9.6 million in 2019. The significant non-cash adjustments to the net earnings of $1.2 million were amortization and depletion of $28.9 million, share-based compensation of $3.0 million, a deferred income tax recovery of $5.2 million, finance costs of $1.3 million, a write down of inventory to net realizable value of $0.4 million, net impairment of non-current assets of $0.4 million and a change in non-cash working capital of $10.1 million. The change in non-cash working capital was primarily due to a collection of tax refunds, an increase in accounts payable, including $3.6 million mark-to-market fluctuations for director's deferred share units offset by a significant amount of stockpiled ore and reduction of trade receivables.
The Company's Mexican subsidiaries pay IVA, Impuesto al Valor Agregado ("IVA"), on the purchase and sale of goods and services. The net amount paid is recoverable but is subject to review and assessment by the tax authorities. The Company regularly files the required IVA returns and all supporting documentation with the tax authorities, however, the Company has been advised that certain IVA amounts receivable from the tax authorities are being withheld pending completion of the authorities' audit of certain of the Company's third-party suppliers. Under Mexican law the Company has legal rights to those IVA refunds and the results of the third-party audits should have no impact on refunds. A smaller portion of IVA refund requests are from time to time improperly denied based on the alleged lack of compliance of certain formal requirements and information returns by the Company's third-party suppliers. The Company takes necessary legal action on the delayed refunds as well as any improperly denied refunds.
The Company is in regular contact with the tax authorities in respect of its IVA filings and believes that the full amount of its IVA receivables will ultimately be received; however, the timing of recovery of these amounts and the nature and extent of any adjustments to the Company's IVA receivables remains uncertain
Investing activities during the year used $29.8 million compared to $21.8 million in 2019. The investments in 2020 were primarily for sustaining capital at existing operations, while for the comparable period in 2019 capital expenditures pertained to sustaining capital at the existing operations and the construction of the El Compas operation. The Company has accelerated mine development at both Guanaceví and Bolañitos beginning in 2019 and extending into 2020 to provide sufficient access to ore in new ore bodies. The Company made a net investment in marketable securities of $4.5 million during Q4, 2020.
Capital additions totaled $30.1 million in property, plant and equipment for the year ended December 31, 2020, including financed mobile equipment, as follows:
At Guanaceví, the Company invested $13.0 million, with $8.4 million spent on 6.5 kilometres of mine development and acquired $3.0 million of mobile equipment, of which $1.9 million was financed to accelerate mine development. The Company continued to invest on upgrades for the plant and surrounding infrastructure, including $0.9 million on crusher upgrades, mine site improvements and the tailings facility, $0.5 million was spent on office and building infrastructure and $0.2 million on new light vehicles.
At Bolañitos, the Company invested $14.2 million, with $9.1 million spent on 8.2 kilometres of mine development and acquired $4.6 million of mobile equipment, of which $2.1 million was financed to accelerate mine development, $0.2 million on plant, $0.2 million was on light vehicles and $0.1 million office and IT equipment.
Exploration incurred $1.0 million in holding costs and acquisition of concessions, the Terronera development project acquired a ball mill for $2.0 million, El Compas incurred $0.1 million in equipment, while the Bolañitos and El Cubo operations sold used equipment resulting in $0.2 million in proceeds and in a $0.1 million loss in the period.
Financing activities for the 2020 increased cash by $27.5 million, compared to increasing cash by $21.2 million in 2019. During 2020, the Company received gross proceeds through an at-the-market financing of $26.4 million, paid $1.1 million in share issue costs, received $6.9 million on the exercise of employee options and paid $4.6 million in interest and principal repayments on loans and leases. By comparison, during the same period in 2019, the Company raised gross proceeds of $23.6 million, received $0.3 million on the exercise of employee options, paid $0.7 million in share issue costs and paid $1.6 million in interest and principal repayments on loans and lease.
In April 2018, the Company filed a short form base shelf prospectus (the "Base Shelf") to qualify for the distribution of up to CAD$150 million of common shares, warrants or units of the Company comprising any combination of common shares and warrants ("Securities"). The distribution of Securities could be effected from time to time in one or more transactions at a fixed price or prices, which could be changed with market prices prevailing at the time of sale, or at prices related to such prevailing market prices to be negotiated with purchasers and as set forth in an accompanying prospectus supplement, including transactions that are deemed to be at the market distributions. The Base Shelf also provided the Company with the ability to conduct an "At-The-Market" offering through an "At-The-Market" facility ("2018 ATM") equity distribution agreement.
On June 13, 2018, the Company entered into an ATM equity facility with BMO Capital Markets (the lead agent), CIBC Capital Markets, H.C. Wainwright & Co., HSBC and TD Securities (together, the "Agents"). Under the terms of this ATM facility, the Company could, from time to time, sell common stock having an aggregate offering value of up to $35.7 million on the New York Stock Exchange. The Company determined, at its sole discretion, the timing and number of shares to be sold under the ATM facility. From January 1st to April 21st 2020, the Company issued 2,164,119 common shares under the ATM facility at an average price of $1.56 per share for gross proceeds of $3.4 million, less commissions of $76 thousand. The ATM program was completed in April 2020.
In April 2020, the Company filed a short form base shelf prospectus to qualify the distribution of up to CAD$150 million of various securities of the Company, including common shares. The distribution of such securities of the Company may be effected from time to time in one or more transactions at a fixed price or prices, which may vary with market prices prevailing at the time of sale, or at prices related to such prevailing market prices to be negotiated with purchasers and as set forth in an accompanying prospectus supplement, including transactions that are deemed to be at the market distributions. The Base Shelf also provides the Company with the ability to conduct an "At-The-Market" offering through an "At-The-Market" facility ("2020 ATM") equity distribution agreement.
On May 14, 2020, the Company entered into an ATM equity facility (the "May 2020 ATM Facility") with a syndicate of agents. Under the terms of the 2020 ATM Facility, the Company could, from time to time, sell common shares having an aggregate offering value of up to $23 million on the New York Stock Exchange. The Company determined, at its sole discretion, the timing and number of shares to be sold under the May 2020 ATM Facility.
From May 14, 2020 to August 17, 2020, the Company issued 11,640,411 common shares under the 2020 ATM Facility at an average price of $1.97 per share for gross proceeds of $23.0 million less commission of $0.6 million and deferred financing costs of $0.3 million which has been presented net of share capital. The ATM program was completed in August 2020.
In total, during 2020, the Company issued 13,804,530 common shares under the combined ATM facilities at an average price of $1.91 per share for gross proceeds of $26.4 million, less commission and financing fees of $1.2 million which has been presented net of share capital.
The purpose of the 2018 and May 2020 ATM Facilities net proceeds were to advance the exploration and development of the Terronera Project and to add to the Company's working capital.
For the 2018 ATM Facility, completed in April 2020, the net proceeds were used as follows:
| Use of proceeds | |||
| Net proceeds received | $ | 34,405 | |
| Advancement of Terronera Project | (10,380 | ) | |
| Allocated to working capital | $ | 24,025 |
For the May 2020 ATM Facility, completed in August 2020, the net proceeds were used as follows:
| Use of proceeds | |||
| Net proceeds received | $ | 22,399 | |
| Advancement of Terronera Project | (2,563 | ) | |
| Allocated to working capital | $ | 19,836 |
On October 1, 2020, the Company entered into an ATM equity facility (the "October 2020 ATM Facility") with a syndicate of agents. Under the terms of the October 2020 ATM Facility, the Company may, from time to time, sell common shares having an aggregate offering value of up to $60 million on the New York Stock Exchange. The Company determines, at its sole discretion, the timing and number of shares to be sold under the October 2020 ATM Facility during the 20 month sales agreement term. As at December 31, 2020 there have been no shares issued under this facility.
Management of the Company believes that operating cash flow and existing working capital will be sufficient to cover 2021 capital requirements and commitments. The Company is assessing financing alternatives, including equity or debt or a combination of both to fund future growth, including the development of the Terronera project.
As at December 31, 2020, the Company's issued share capital was $517.7 million, representing 157,924,708 common shares, and the Company had options outstanding to purchase 5,978,300 common shares with a weighted average exercise price of CAD$3.29.
Contingencies
Minera Santa Cruz y Garibaldi SA de CV ("MSCG"), a subsidiary of the Company, received a MXN 238 million assessment on October 12, 2010 by Mexican fiscal authorities for failure to provide the appropriate support for certain expense deductions taken in MSCG's 2006 tax return, failure to provide appropriate support for loans made to MSCG from affiliated companies, and deemed an unrecorded distribution of dividends to shareholders, among other individually immaterial items. MSCG immediately initiated a Nullity action and filed an administrative attachment to dispute the assessment.
In June 2015, the Superior Court ruled in favour of MSCG on a number of the matters under appeal; however, the Superior Court ruled against MSCG for failure to provide appropriate support for certain deductions taken in MSCG's 2006 tax return. In June 2016, the Company received a MXN 122.9 million ($6.2 million) tax assessment based on the June 2015 ruling. The 2016 tax assessment comprised of MXN 41.8 million in taxes owed ($2.1 million), MXN 17.7 million ($0.9 million) in inflationary charges, MXN 40.4 million ($2.0 million) in interest and MXN 23.0 million ($1.2 million) in penalties. The 2016 tax assessment was issued for failure to provide the appropriate support for certain expense deductions taken in MSCG's 2006 tax return, failure to provide appropriate support for loans made to MSCG from affiliated companies. If MSCG agrees to pay the tax assessment, or a lesser settled amount, it is eligible to apply for forgiveness of 100% of the penalties and 50% of the interest.
The Company filed an appeal against the June 2016 tax assessment on the basis that certain items rejected by the courts were included in the new tax assessment and a number of deficiencies exist within the assessment. Since issuance of the assessment interest charges of MXN 9.1 million ($0.5 million) and inflationary charges of MXN 13.7 million ($0.7 million) has accumulated.
Included in the Company's consolidated financial statements, are net assets of $595,000, including $42,000 in cash, held by MSCG. Following the Tax Court's rulings, MSCG has been in discussions with the tax authorities with regards to the shortfall of assets within MSCG to settle its estimated tax liability. An alternative settlement option would be to transfer the shares and assets of MSCG to the tax authorities. The Company recognized an allowance for transferring the shares and assets of MSCG amounting to $595,000 in a prior year. The Company is currently assessing MSCG's settlement options based on ongoing court proceedings and discussion with the tax authorities. The Company continues to assess that it is probable its appeal should prevail, and the maximum estimated exposure is the amount of the above allowance.
Compania Minera Del Cubo SA de CV ("Cubo"), a subsidiary of the Company, received an MXN 58.5 million (US $2.9 million) assessment in 2019 by Mexican fiscal authorities for failure to provide the appropriate support for depreciation deductions taken in the Cubo 2016 tax return and denied deductions of certain suppliers. The tax assessment consists of MXN 24.1 million ($1.2 million) for taxes, MXN 21.0 million ($1.1 million) for penalties, 10.4 million ($0.5 million) for interest and MXN 3.0 million ($0.1 million) for inflation. At the time of the tax assessment the Cubo entity had and continues to have sufficient loss carry forwards which would be applied against the assessed difference of taxable income. The Mexican tax authorities did not consider these losses in the assessment.
Due to the denial of certain suppliers for income tax purposes in the Cubo assessment, the invoices from these suppliers have been assessed as ineligible for refunds of IVA paid on the invoices. The assessment includes MXN 14.7 million ($0.7 million) for re-payment of IVA (value added taxes) refunded on these supplier payments. In the Company's judgement the suppliers and invoices meet the necessary requirements to be deductible for income tax purposes and the recovery of IVA.
The Company has filed an administrative appeal related to the 2016 Cubo Tax assessment. Cubo has provided a lien on certain El Cubo mining concessions during the appeal process. Since issuance of the assessment interest charges of MXN 9.9 million ($0.5 million) and inflationary charges of MXN 1.6 million ($0.1 million) has accumulated. The Company continues to assess that it is probable that its appeal will prevail, and no provision is required in respect of the Cubo assessment.
The Company is required to use judgement to determine certain tax treatments in calculating income tax expense and IVA recoverable. A number of these judgements are subject to various uncertainties. From time to time, Mexican authorities may improperly apply, re-interpret legislation or disregard precedents and it is possible that of these uncertainties may be resolved unfavorably for the Company.
Capital Requirements
As of December 31, 2020, the Company held $61.1 million in cash and $70.4 million in working capital. The duration and severity of the global COVID-19 pandemic could have a material impact on the Company's liquidity. The Mexican government declared mining as an essential business, however in Mexico positive COVID-19 cases continue at a significant rate and to date, the infection rate has not declined. A local outbreak, an impediment to supply or market logistics or change in government health orders remains a significant risk. The mines are operating under strict safety protocols with the expectations of operating near throughput capacity.
The Company may be required to raise additional funds through future debt or equity financings in order to carry out its business plans. The Company will continue to monitor capital markets, economic conditions, the COVID-19 global pandemic and assess its short term and long term capital needs.
See Annual Outlook on page 31 for discussion on planned capital and exploration expenditures.
Contractual Obligations
The Company had the following undiscounted contractual obligations at December 31, 2020:
| Payments due by period (in thousands of dollars) | |||||||||||||||
| Contractual Obligations | Total | Less than 1 year |
1 - 3 years | 3 - 5 years | More than 5 years |
||||||||||
| Capital asset purchases | $ | 955 | $ | 955 | $ | - | $ | - | $ | - | |||||
| Loans payable | 10,782 | 4,181 | 6,098 | 503 | - | ||||||||||
| Lease liabilities | 1,316 | 238 | 334 | 320 | 424 | ||||||||||
| Other contracts | 856 | 135 | 219 | 219 | 283 | ||||||||||
| Other Long-Term Liabilities | 10,028 | - | 5,299 | 2,174 | 2,555 | ||||||||||
| Total | $ | 23,937 | $ | 5,509 | $ | 11,950 | $ | 3,216 | $ | 3,262 |
Transactions with Related Parties
The Company shares common administrative services and office space with Aztec Metals Corp., which is considered a related party company by virtue of Bradford Cooke, the Company's Chief Executive Officer, being a common director. From time to time, Endeavour incurs third-party costs on behalf of related parties, which are charged on a full cost recovery basis. The charges for these costs totaled $1,000 and $4,000 for the three and twelve months ended December 31, 2020 respectively (December 31, 2019 - $2,000 and $8,000 respectively). The Company had a $2,000 net receivable related to administration costs outstanding as at December 31, 2020 (December 31, 2019 - $1,000).
The Company was charged $49,000 and $255,000 for legal services for the three and twelve months ended December 31, 2020 respectively by a firm in which the Company's corporate secretary is a partner (December 31, 2019 - $68,000 and $215,000 respectively). The Company has $26,000 payable to the legal firm as at December 31, 2020 (December 31, 2019 - $33,000).
Financial Instruments and fair value measurements
As at December 31, 2020 and 2019, the carrying and fair values of Endeavour's financial instruments by category were as follows:
| As at December 31, 2020 | As at December 31, 2019 | |||||||||||
| Expressed in thousands US dollars | Carrying | Estimated | Carrying | Estimated | ||||||||
| value | Fair value | value | Fair value | |||||||||
| Financial assets: | ||||||||||||
| Cash and cash equivalents | $ | 61,083 | $ | 61,083 | $ | 23,368 | $ | 23,368 | ||||
| Other investments | 4,767 | 4,767 | 69 | 69 | ||||||||
| Trade receivables | 8,755 | 8,755 | 6,722 | 6,722 | ||||||||
| Other receivables | 11,389 | 11,389 | 1,278 | 1,278 | ||||||||
| Total financial assets | $ | 85,994 | $ | 85,994 | $ | 31,437 | $ | 31,437 | ||||
| Financial liabilities: | ||||||||||||
| Accounts payable and accrued liabiities | $ | 27,764 | $ | 27,764 | $ | 19,775 | $ | 19,775 | ||||
| Loans payable | 9,672 | 9,672 | 8,875 | 8,875 | ||||||||
| Total financial liabilities | $ | 37,436 | $ | 37,436 | $ | 28,650 | $ | 28,650 | ||||
Fair value measurements
Fair value hierarchy:
Fair value is the price that would be received to sell an asset or paid to transfer a liability in an orderly transaction between market participants at the measurement date. The fair value hierarchy establishes three levels to classify the inputs to valuation techniques used to measure fair value. Level 1 inputs are quoted prices (unadjusted) in active markets for identical assets or liabilities. Level 2 inputs are quoted prices in markets that are not active, quoted prices for similar assets or liabilities in active markets, inputs other than quoted prices that are observable for the asset or liability (for example, interest rate and yield curves observable at commonly quoted intervals, forward pricing curves used to value currency and commodity contracts and volatility measurements used to value option contracts), or inputs that are derived principally from or corroborated by observable market data or other means. Level 3 inputs are unobservable (supported by no or little market activity). The fair value hierarchy gives the highest priority to Level 1 inputs and the lowest priority to Level 3 inputs.
Assets and liabilities as at December 31, 2020 that measured at fair value on a recurring basis include:
| Expressed in thousands US dollars | Fair value through profit or loss |
Amortized cost |
Carrying value |
Estimated Fair value |
||||||||
| Financial assets: | ||||||||||||
| Cash and cash equivalents | $ | - | $ | 61,083 | $ | 61,083 | $ | 61,083 | ||||
| Other investments | 4,767 | - | 4,767 | 4,767 | ||||||||
| Trade receivables | 8,755 | - | 8,755 | 8,755 | ||||||||
| Other receivables | - | 11,389 | 11,389 | 11,389 | ||||||||
| Total financial assets | $ | 13,522 | $ | 72,472 | $ | 85,994 | $ | 85,994 | ||||
| Financial liabilities: | ||||||||||||
| Accounts payable and accrued liabiities | $ | 6,389 | $ | 21,375 | $ | 27,764 | $ | 27,764 | ||||
| Loans payable | - | 9,672 | 9,672 | 9,672 | ||||||||
| Total financial liabilities | $ | 6,389 | $ | 31,047 | $ | 37,436 | $ | 37,436 |
Other investments
The Company holds marketable securities classified as Level 1 and Level 2 in the fair value hierarchy. The fair values of Level 1 investments are determined based on a market approach reflecting the closing price of each particular security at the reporting date. The closing price is a quoted market price obtained from the stock exchange that is the principal active market for the particular security, being the market with the greatest volume and level of activity for the assets. For Level 2 investments, where there is not yet an active market for the securities as a listing on an exchange is pending, the fair value is determined based on the most recent observable transaction for those securities. Changes in fair value on available for sale marketable securities are recognized in income or loss.
Trade receivables
The trade receivables consist of receivables from provisional silver and gold sales from the Bolañitos, El Cubo and El Compas mines. The fair value of receivables arising from concentrate sales contracts that contain provisional pricing mechanisms is determined using the appropriate quoted closing price on the measurement date from the exchange that is the principal active market for the particular metal. As such, these receivables, which meet the definition of an embedded derivative, are classified within Level 2 of the fair value hierarchy.
Deferred share units
The Company has a Deferred Share Unit ("DSU") plan whereby deferred share units may be granted to independent directors of the Company in lieu of compensation in cash or stock options. The DSUs vest immediately and are redeemable for cash based on the market value of the units at the time of a director's retirement. The DSUs are classified as Level 1 in the fair value hierarchy. The liability is determined based on a market approach reflecting the closing price of the Company's common shares at the reporting date. Changes in fair value are recognized in general and administrative salaries, wages and benefits.
Share appreciation rights
As part of the Company's bonus program, the Company grants share appreciation rights ("SARs") to its employees in Mexico and Chile. The SARs are subject to vesting conditions and, when exercised, constitute a cash bonus based on the value of the appreciation of the Company's common shares between the SARS grant date and the exercise date.
The SARs are classified as Level 2 in the fair value hierarchy. The liability is valued using a Black-Scholes option pricing model. Changes in fair value are recognized in salaries, wages and benefits.
Financial Instrument Risk Exposure and Risk Management
The Company is exposed in varying degrees to a variety of financial instrument related risks. The Board approves and monitors the risk management process. The types of risk exposure and the way in which such exposure is managed is provided as follows:
Credit Risk
The Company is exposed to credit risk on its bank accounts and accounts receivable. Credit risk exposure on bank accounts is limited through maintaining the Company's balances with high-credit quality financial institutions, maintaining investment policies, assessing institutional exposure and continual discussion with external advisors. Value added tax receivables are generated on the purchase of supplies and services to produce silver, which are refundable from the Mexican government. Trade receivables are generated on the sale of concentrate inventory to reputable metal traders.
Liquidity Risk
Liquidity risk is the risk that the Company will not be able to meet its financial obligations as they come due. We manage our liquidity risk by continually monitoring forecasted and actual cash flows. We have in place a planning and budgeting process to help determine the funds required to support our normal operating requirement and development plans. We aim to maintain sufficient liquidity to meet our short term business requirements, taking into account our anticipated cash flows from operations, our holdings of cash and cash equivalents, and our committed and anticipated liabilities.
The Company's Mexican subsidiaries pay value added tax, IVA, on the purchase and sale of goods and services. The net amount paid is recoverable but is subject to review and assessment by the tax authorities. The Company regularly files the required IVA returns and all supporting documentation with the tax authorities, however, the Company has been advised that certain IVA amounts receivable from the tax authorities are being withheld pending completion of the authorities' audit of certain of the Company's third-party suppliers. Under Mexican law the Company has legal rights to those IVA refunds and the results of the third-party audits should have no impact on refunds. A smaller portion of IVA refund requests are from time to time improperly denied based on the alleged lack of compliance of certain formal requirements and information returns by the Company's third-party suppliers. The Company takes necessary legal action on the delayed refunds as well as any improperly denied refunds.
The Company is in regular contact with the tax authorities in respect of its IVA filings and believes that the full amount of its IVA receivables will ultimately be received; however, the timing of recovery of these amounts and the nature and extent of any adjustments to the Company's IVA receivables remains uncertain.
Market Risk
The significant market risk exposures to which the Company is exposed are foreign currency risk, interest rate risk, and commodity price risk.
Foreign Currency Risk - The Company's operations in Mexico and Canada make it subject to foreign currency fluctuations. Certain of the Company's operating expenses are incurred in Mexican pesos and Canadian dollars; therefore, the fluctuation of the U.S. dollar in relation to these currencies will consequently have an impact upon the profitability of the Company and may also affect the value of the Company's assets and the amount of shareholders' equity. The Company has not entered into any agreements or purchased any instruments to hedge possible currency risks.
Interest Rate Risk - In respect of financial assets, the Company's policy is to invest cash at floating rates of interest and cash reserves are to be maintained in cash equivalents in order to maintain liquidity. Fluctuations in interest rates impact the value of cash equivalents. As at December 31, 2020 the Company has $2.0 million in equipment loans with interest rates that are linked to Libor and with other variables unchanged, a 1% increase in the Libor rate would result in an additional interest expense of $0.1 million.
Commodity Price Risk - Gold and silver prices have historically fluctuated significantly and are affected by numerous factors outside of the Company's control, including, but not limited to, industrial and retail demand, central bank lending, forward sales by producers and speculators, levels of worldwide production, short-term changes in supply and demand because of speculative hedging activities and certain other factors. The Company has not engaged in any hedging activities, other than short-term metal derivative transactions less than 90 days, to reduce its exposure to commodity price risk. At December 31, 2020, there are 43,026 oz of silver and 3,179 oz of gold, which do not have a final settlement price and the estimated revenues have been recognized at current market prices. As at December 31, 2020, with other variables unchanged, a 10% decrease in the market value of silver and gold would result in a reduction of revenue of $0.7 million.
Outstanding Share Data
As of February 24, 2021, the Company had the following securities issued and outstanding:
The Company considers the items included in the consolidated statement of shareholders' equity as capital. The Company's objective when managing capital is to safeguard its ability to continue as a going concern so that it can continue to provide returns for shareholders and benefits for other stakeholders. The Company manages the capital structure and makes adjustments to it in light of changes in economic conditions and the risk characteristics of the underlying assets. In order to maintain or adjust the capital structure, the Company may issue new shares through private placements, prospectus offerings, convertible debentures, asset acquisitions or return capital to shareholders. The Company is not subject to externally imposed capital requirements.
CHANGES IN ACCOUNTING POLICIES AND CRITICAL ACCOUNTING ESTIMATES
Accounting standards adopted during the period:
The accounting policies applied in the Company's annual audited consolidated financial statements as at and for the year ended December 31, 2020 are the same as those applied in the Company's annual audited consolidated financial statements as at and for the year ended December 31, 2019 except that the Company has changed its presentation of concentrate treatment and refining costs of sales to presenting as a reduction in revenue. The prior period amounts have also been reclassified.
The following amendment to accounting standards has been issued but not yet adopted in the financial statements:
On May 14, 2020, the IASB published a narrow scope amendment to IAS 16 Property, Plant and Equipment - Proceeds before Intended Use. The amendment prohibits deducting from the cost of property, plant and equipment amounts received from selling items produced while preparing the asset for its intended use. Instead, amounts received will be recognized as sales proceeds and the related costs in profit or loss. The effective date is for annual periods beginning on or after January 1, 2022. The Company is assessing the effect of the narrow scope amendment on its consolidated financial statements.
On August 27, 2020, the IASB published "Interest Rate Benchmark Reform - Phase 2" with amendments that address issues that might affect financial reporting after the reform of an interest rate benchmark, including its replacement with alternative benchmark rates. The amendments are effective for annual periods beginning on or after January 1, 2021, with earlier application permitted. The Company does not anticipate that the adoption will have a material impact on its consolidated financial statements as the Company is not engaged in hedging activities and as at December 31, 2021 only had $2.0 million in equipment loans whose terms will require a replacement with an alternative benchmark rate.
Critical Accounting Estimates
The preparation of financial statements requires the Company to make estimates that affect the reported amounts of assets and liabilities and disclosure of contingent assets and liabilities at the date of the financial statements and the reported amounts of revenues and expenses during the reporting period. Significant areas requiring the use of management judgment relate to the determination of mineralized reserves and resources, plant and equipment lives, estimating the fair values of financial instruments and derivatives, impairment of non-current assets, reclamation and rehabilitation provisions, recognition of deferred tax assets, and assumptions used in determining the fair value of share-based compensation.
Determination of ore reserves and resources
Judgments about the amount of product that can be economically and legally extracted from the Company's properties are made by management using a range of geological, technical and economic factors, history of conversion of mineral deposits to proven and probable reserves as well as data regarding quantities, grades, production techniques, recovery rates, production costs, commodity prices and exchange rates. This process may require complex and difficult geological judgments to interpret the data. The Company uses qualified persons (as defined by the Canadian Securities Administrator's National Instrument 43-101) to compile this data.
Changes in the judgments surrounding reserves and resources may impact the carrying value of mineral properties, plant and equipment, reclamation and rehabilitation provisions, recognition of deferred income tax amounts, and depreciation and depletion.
Estimating the quantity and /or grade of reserves and resources requires the size, shape and depth of ore bodies or fields to be determined by analyzing geological data such as drilling samples. Following this, the quantity of ore that can be extracted in an economical manner is calculated using data regarding the life of mine plans and forecast sales prices (based on current and long-term historical average price trends). Changes in estimates can be the result of estimated future production differing from previous forecasts of future production, expansion of mineable ore through exploration activities, differences between estimated and actual costs of mining and differences in the commodity price used in the estimation of mineable ore.
Review of asset carrying values and assessment of impairment
Management applies significant judgment in assessing each cash-generating unit and assets for the existence of indicators of impairment or impairment reversal at the reporting date. Internal and external factors are considered in assessing whether indicators are present that would necessitate impairment testing. Significant assumptions regarding commodity prices, operating costs, capital expenditures and discount rates are used in determining whether there are any indicators of impairment. These assumptions are reviewed regularly by senior management and compared, when applicable, to relevant market consensus views.
If an indicator of impairment or reversal exists, the asset's recoverable amount is estimated. The recoverable amount is the greater of fair value less costs of disposal and value in use. The determination of fair value less costs of disposal and value in use requires management to make estimates and assumptions about expected production and sales volumes, metal prices, ore tonnage and grades, recoveries, operating costs, future capital expenditures and appropriate discount rate for future cash flows. The estimates and assumptions are subject to risk and uncertainty, and as such there is the possibility that changes in circumstances will alter these projections, which may impact the recoverable amount of the assets. In such circumstances, some or all of the carrying value of the assets may be further impaired or the impairment charge reduced with the impact recorded in profit or loss.
In 2013 and 2015, the Company determined there were several indicators of potential impairment of its producing mineral properties which included the sustained decline in precious metal prices, changes in tax legislation and a reduction in reserves and resources. The recoverable amounts were based on each CGUs future cash flows expected to be derived from the Company's mining properties and represent each CGUs fair value in use. The cash flows were determined based on the life-of-mine after tax cash flow estimate which incorporate management's best estimates of future metal prices, production based on estimates of recoverable reserves and resources, exploration potential, future operating costs and non-expansionary capital expenditures.
At December 31, 2020, the Company recognized a $2,6 million reversal of a previous impairment of the Guanaceví Mine. An increase in the reserve and resource estimate and increase in precious metal prices were considered to be indicators of an impairment reversal. The updated Guanaceví mine plan, with updated assumptions and estimates, resulted in significantly higher cash flows, using a 6.1% discount rate, compared to the Company's previous estimates. Accordingly, the Company reversed the 2013 Guanaceví CGU impairment, limited to the carrying amount had no impairment been recognized in prior periods, net of depletion and amortization which would have been recognized in prior periods.
At December 31, 2020, the Company recognizes an impairment of the El Compas Mine Project. A decrease in the resource estimate as at December 31, 2020 was considered to be an indicator of an impairment. The carrying value related to the El Compas CGU, excluding working capital and reclamation provision, was $6.0 million which was greater than its estimated recoverable amount of $3.0 million, calculated on a discounted cash flow basis using a 6.1% discount rate. The Company considers use of its internal discounted cash flow economic models as a proxy for the calculation of fair value in use. Based on the above assessment, the Company recorded an impairment charge related to the El Compas CGU of $3.0 million.
If an area of interest is abandoned or it is determined that its carrying value cannot be supported by future production or sale, the related costs are charged against operations in the period of abandonment or determination that the carrying value exceeds its fair value. The amounts recorded as mineral properties represent costs incurred to date and do not necessarily reflect present or future values.
Achievement of commercial production
Once a mine reaches the operating levels intended by management, deprecation of capitalized costs begins. Significant judgement is required to determine when certain of the Company's assets reach this level. Management considers several factors including: completion of a reasonable period of commissioning; consistent operating results achieved at a pre-determined level of design capacity and indications exist that his level will continue; mineral recoveries at or near expected levels; and the transfer of operations from development personnel to operational personnel has been completed.
Estimation of the amount and timing of reclamation and rehabilitation costs
Accounting for restoration requires management to make estimates of the future costs the Company will incur to complete the reclamation and rehabilitation work required to comply with existing laws, regulations and agreements in place at each mining operation and any environmental and social principles the Company is in compliance with. The calculation of the present value of these costs also includes assumptions regarding the timing of reclamation and rehabilitation work, applicable risk-free interest rate for discounting those future cash flows, inflation and foreign exchange rates and assumptions relating to probabilities of alternative estimates of future cash flows. Actual costs incurred may differ from those amounts estimated. Also, future changes to environmental laws and regulations could increase the extent of reclamation and rehabilitation work required to be performed by the Company. Increase in future costs could materially impact the amounts charged to operations for reclamation and rehabilitation.
Deferred Income Taxes
The Company follows the asset and liability method of accounting for income taxes. Under this method, future tax assets and liabilities are recognized for the future tax consequences attributable to differences between the financial statement carrying amounts of existing assets and liabilities and their respective tax bases, and losses carried forward. Future tax assets and liabilities are measured using substantively enacted or enacted tax rates expected to apply to taxable income in the years in which those temporary differences are expected to be recovered or settled. The effect on future tax assets and liabilities of a change in tax rates is recognized in income in the period that includes the substantive enactment date. Future tax assets are recognized to the extent that they are considered more likely than not to be realized.
Judgement is required in determining the recognition and measurement of deferred income tax assets and liabilities on the balance sheet. In the normal course of business, the Company is subject to assessment by taxation authorities in various jurisdictions. These authorities may have different interpretations of tax legislation or tax agreements than those applied by the Company in computing current and deferred income taxes. These different interpretations may alter the timing or amounts of taxable income or deductions.
Final taxes payable and receivable are dependent on many factors, including outcomes of tax litigation and resolution of disputes. The resolution of these uncertainties may result in adjustments to the Company's tax assets and liabilities.
Management assesses the likelihood and timing of taxable earnings in future periods in recognizing deferred income tax assets. Estimates of future taxable income is based on forecasted cash flows using life of mine projections and the application of existing tax laws in each jurisdiction.
To the extent that future cash flows and taxable income differ significantly from estimates, the ability of the Company to realize the net deferred income tax assets recorded at the balance sheet date could be impacted. In addition, future changes to tax laws could limit the ability of the Company to obtain tax deductions in future periods from deferred income tax assets.
Inventory
In valuing inventories at the lower of cost and net realizable value, the Company makes estimates in determining the net realizable price and in quantifying the contained metal in finished goods and work in progress.
Share-based Compensation
The Company has a stock option plan and records all share-based compensation for options using the fair value method. The fair value of each option award is estimated on the date of the grant using the Black-Scholes option pricing model, with expected volatility based on historical volatility of the Endeavour common shares. The Company uses historical data to estimate the term of the option and the risk-free rate for the expected term of the option is based on the Government of Canada yield curve in effect at the time of the grant.
As part of the Company's bonus program, the Company may from time to time grant share appreciation rights ("SARs") to its employees in Mexico and Chile. The SARs are subject to vesting conditions and, when vested, constitute a cash bonus based on the value of the appreciation of the Company's common shares between the SARs grant date and vesting. The fair value of each SAR award is estimated on the grant date using the Black-Scholes option pricing model, with expected volatility based on historical volatility of the Endeavour common shares. The Company uses historical data to estimate the term of the option and the risk-free rate for the expected term of the option is based on the Government of Canada yield curve in effect at the time of the grant.
The Company has a Performance Share Unit ("PSU") plan whereby performance share units may be granted to employees of the Company. Under the PSU plan, vested PSUs are redeemable, at the election of the Board of Directors in its discretion, for Common Shares , a cash payment equal to the market value of a Common Share as of the redemption date, or a combination of cash and Common Shares. The PSUs granted are subject to a performance payout multiplier between 0% and 200% based on the Company's total shareholder return at the end of a three-year period, relative to the Company's total shareholder return peer group.
Business Combinations
On the acquisition of a business, the acquisition method of accounting is used, whereby the purchase consideration is allocated to the identifiable assets, liabilities and contingent liabilities (identifiable net assets) on the basis of fair value at the date of acquisition. When the cost of acquisition exceeds the fair values attributable to the Company's share of identifiable net assets, the difference is treated as purchased goodwill, which is not amortized but is reviewed for impairment annually or more frequently where there is an indication of impairment. If the fair value attributable to the Company's share of the identifiable net assets exceeds the cost of acquisition, the difference is immediately recognized in profit or loss. Incremental costs related to acquisitions are expensed as incurred.
Determination of the fair value of assets acquired and liabilities assumed and the resulting goodwill, if any, requires that management make estimates based on the information provided by the acquiree. Changes to the provisional values of assets acquired and liabilities assumed, deferred income taxes and resulting goodwill, if any, will be adjusted when the final measurements are determined (within one year of acquisition date).
When purchase consideration is contingent on future events, the initial cost of the acquisition recorded includes an estimate of the fair value of the contingent amounts expected to be payable in the future. When the fair value of contingent consideration as at the date of acquisition is finalized, before the end of the 12 month measurement period, the adjustment is allocated to the identifiable assets acquired and liabilities assumed. Changes to the estimated fair value of contingent consideration subsequent to the acquisition date are recorded in profit or loss.
RISKS AND UNCERTAINTIES
Besides the risks discussed elsewhere in this MD&A, the following are risks and uncertainties that have affected the Company's financial statements or future performance or that may affect them in the future. See "Risk Factors" in the Company's Annual Information Form for other risks affecting the Company generally.
Impact of COVID-19 Pandemic
The Company's business could be significantly adversely affected by the effects of a widespread global outbreak of contagious disease, including the recent outbreak of respiratory illness caused by COVID-19. The Company cannot accurately predict the impact COVID-19 will have on third parties' ability to meet their obligations with the Company, including due to uncertainties relating to the ultimate geographic spread of the virus, the severity of the disease, the duration of the outbreak, and the length of travel and quarantine restrictions imposed by governments of affected countries. In particular, the continued spread of the COVID-19 globally could materially and adversely impact the Company's business including without limitation, employee health, limitations on travel, the availability of industry experts and personnel, restrictions to planned drill programs, mining and processing operations shutdowns, and other factors that will depend on future developments beyond the Company's control. In addition, a significant outbreak of contagious diseases in the human population could result in a widespread health crisis that could adversely affect the economies and financial markets of many countries (including those in which the Company operates), resulting in an economic downturn that could negatively impact the Company's operating results and ability to raise capital.
Precious and Base Metal Price Fluctuations
The profitability of the precious metals operations in which the Company has an interest is significantly affected by changes in the market prices of precious metals. Prices for precious metals fluctuate on a daily basis, have historically been subject to wide fluctuations and are affected by numerous factors beyond the control of the Company such as the level of interest rates, the rate of inflation, central bank transactions, world supply of the precious metals, foreign currency exchange rates, international investments, monetary systems, speculative activities, international economic conditions and political developments. The exact effect of these factors cannot be accurately predicted, but the combination of these factors may result in the Company not receiving adequate returns on invested capital or the investments retaining their respective values. Declining market prices for these metals could materially adversely affect the Company's operations and profitability.
Fluctuations in the price of consumed commodities
Prices and availability of commodities consumed or used in connection with exploration, development and mining, such as natural gas, diesel, oil, electricity, cyanide and other re-agents fluctuate affecting the costs of production at the Company's operations. These fluctuations can be unpredictable, can occur over short periods of time and may have a materially adverse impact on the Company's operating costs or the timing and costs of various projects. The Company's general policy is not to hedge its exposure to changes in prices of the commodities used in its business.
Foreign Exchange Rate Fluctuations
Operations in Mexico, Chile and Canada are subject to foreign currency exchange fluctuations. The Company raises its funds through equity issuances which are generally priced in Canadian dollars or U.S. dollars, and the majority of the exploration costs of the Company are denominated in U.S. dollars, Chilean pesos and Mexican pesos. The Company may suffer losses due to adverse foreign currency fluctuations.
Operating Hazards and Risks
Mining operations generally involve a high degree of risk, which even a combination of experience, knowledge and careful evaluation may not be able to overcome. Operations in which the Company has a direct or indirect interest will be subject to all the hazards and risks normally incidental to exploration, development and production of precious and base metals, any of which could result in work stoppages, delayed production and resultant losses, increased production costs, asset write downs, damage to or destruction of mines and other producing facilities, damage to life and property, environmental damage and possible legal liability for any or all damages. The Company may become subject to liability for pollution, cave-ins or hazards against which it cannot insure or against which it may elect not to insure. Any compensation for such liabilities may have a material, adverse effect on the Company's financial position. The Company's property, business interruption and liability insurance may not provide sufficient coverage for losses related to these or other hazards. Insurance against certain risks, including certain liabilities for environmental pollution, may not be available to us or to other companies within the industry at reasonable terms or at all. In addition, the Company's insurance coverage may not continue to be available at economically feasible premiums, or at all. Any such event could have a material adverse effect on the Company's business.
Mining Operations
The capital costs required by the Company's projects may be significantly higher than anticipated. Capital and operating costs, production and economic returns, and other estimates contained in the Company's current technical reports, may differ significantly from those provided for in future studies and estimates and from management guidance, and there can be no assurance that the Company's actual capital and operating costs will not be higher than currently anticipated. In addition, delays to construction and exploration schedules may negatively impact the net present value and internal rates of return of the Company's mineral properties as set forth in the applicable technical report. Similarly, there can be no assurance that historical rates of production, grades of ore processed, rates of recoveries or mining cash costs will not experience fluctuations or differ significantly from current levels over the course of the mining operations conducted by the Company. In addition, there can be no assurance that the Company will be able to continue to extend the production from its current operations through exploration and drilling programs.
Infrastructure
Mining, processing, development and exploration activities depend, to one degree or another, on adequate infrastructure. Reliable roads, bridges, power sources and water supply are important determinants, which affect capital and operating costs. The lack of availability on acceptable terms or the delay in the availability of any one or more of these items could prevent or delay exploitation or development of the Company's projects. If adequate infrastructure is not available in a timely manner, there can be no assurance that the exploitation or development of the Company's projects will be commenced or completed on a timely basis, if at all; the resulting operations will achieve the anticipated production volume, or the construction costs and ongoing operating costs associated with the exploitation and/or development of the Company's advanced projects will not be higher than anticipated. In addition, unusual or infrequent weather phenomena, sabotage, government or other interference in the maintenance or provision of such infrastructure could adversely affect the Company's operations and profitability.
Exploration and Development
There is no assurance that the Company's exploration and development programs and properties will result in the discovery, development or production of a commercially viable ore body or yield new reserves to replace or expand current reserves. The economics of developing silver, gold and other mineral properties are affected by many factors, including capital and operating costs, variations of the tonnage and grade of ore mined, fluctuating mineral markets, and such other factors as government regulations, including regulations relating to royalties, allowable production, importing and exporting of minerals and environmental protection. Depending on the prices of silver, gold or other minerals produced, the Company may determine that it is impractical to commence or continue commercial production.
The marketability of any minerals acquired or discovered may be affected by numerous factors which are beyond the Company's control and which cannot be accurately foreseen or predicted, such as market fluctuations, conditions for precious and base metals, the proximity and capacity of milling and smelting facilities, and such other factors as government regulations, including regulations relating to royalties, allowable production, importing and exporting minerals and environmental protection. In order to commence exploitation of certain properties presently held under exploration concessions, it is necessary for the Company to apply for an exploitation concession.
There can be no guarantee that such a concession will be granted. Unsuccessful exploration or development programs could have a material adverse impact on the Company's operations and profitability.
Calculation of Reserves and Resources and Precious Metal Recoveries
There is a degree of uncertainty attributable to the calculation and estimation of reserves and resources and their corresponding metal grades to be mined and recovered. Until reserves or resources are actually mined and processed, the quantities of mineralization and metal grades must be considered as estimates only. Any material change in the quantity of mineral reserves, mineral resources, grades and recoveries may affect the economic viability of the Company's properties.
Replacement of Reserves and Resources
The Guanaceví, Bolañitos and El Compas mines are the Company's current sources of production. Current life-of-mine plans provide for a defined production life for mining at the Company's mines. The mines have expected lives of one to four years based on current proven and probable reserves and production levels. If the Company's mineral reserves and resources are not replaced either by the development or discovery of additional reserves and/or extension of the life-of-mine at its current operating mines or through the acquisition or development of an additional producing mine, this could have an adverse impact on the Company's future cash flows, earnings, financial performance and financial condition, including as a result of requirements to expend funds for reclamation and decommissioning.
Economic Conditions for Mining
A decline in the market price for precious metal commodities was experienced from 2013 until the middle of 2020, when prices began increasing to prices more consistent with early 2013. These macro-economic events negatively affected the mining and minerals sectors in general, and the Company's market capitalization was significantly reduced over this period. Any sudden or rapid destabilization of global economic conditions could impact the Company's ability to obtain equity or debt financing in the future on terms favorable to the Company or at all. In such an event, the Company's operations and financial condition could be adversely impacted.
The Company assesses on a quarterly basis the carrying values of its mineral properties. Should market conditions and commodity prices worsen and persist in a worsened state for a prolonged period of time, an impairment of the Company's mineral properties may be required.
Integration of New Acquisitions
The positive effect on the Company's results arising from past and future acquisitions depends on a variety of factors, including, but not limited to: assimilating the operations of an acquired business or property in a timely and efficient manner including the existing work force, union arrangements and existing contracts; maintaining the Company's financial and strategic focus while integrating the acquired business or property; implementing uniform standards, controls, procedures and policies at the acquired business, as appropriate; and to the extent that the Company makes an acquisition outside of markets in which it has previously operated, conducting and managing operations in a new operating environment and under a new regulatory regime where it has no direct experience.
Past and future business or property acquisitions could place increased pressure on the Company's cash flow if such acquisitions involve cash consideration or the assumption of obligations requiring cash payments. The integration of the Company's existing operations with any acquired business will require significant expenditures of time, attention and funds. Achievement of the benefits expected from consolidation would require the Company to incur significant costs in connection with, among other things, implementing financial and planning systems.
The Company may not be able to integrate the operations of a recently acquired business or restructure the Company's previously existing business operations without encountering difficulties and delays. In addition, this integration may require significant attention from the Company's management team, which may detract attention from the Company's day-to-day operations. Over the short-term, difficulties associated with integration could have a material adverse effect on the Company's business, operating results, financial condition and the price of the Company's common shares. In addition, the acquisition of mineral properties may subject the Company to unforeseen liabilities, including environmental liabilities.
Foreign Operations
The Company's operations are currently conducted through subsidiaries principally in Mexico and secondarily in Chile and, as such, its operations are exposed to various levels of political, economic and other risks and uncertainties which could result in work stoppages, blockades of the Company's mining operations and appropriation of assets. Some of the Company's operations are located in areas where Mexican drug cartels operate. These risks and uncertainties vary from region to region and include, but are not limited to, terrorism; hostage taking; local drug gang activities; military repression; expropriation; extreme fluctuations in currency exchange rates; high rates of inflation; labour unrest; the risks of war or civil unrest; renegotiation or nullification of existing concessions, licenses, permits and contracts; illegal mining; changes in taxation policies; restrictions on foreign exchange and repatriation; and changing political conditions arising from changes in government and otherwise, currency controls and governmental regulations that favour or require the awarding of contracts to local contractors or require foreign contractors to employ citizens of, or purchase supplies from, a particular jurisdiction.
Local opposition to mine development projects could arise in Mexico, and such opposition could be violent. There can be no assurance that such local opposition will not arise with respect to the Company's Mexican operations. If the Company were to experience resistance or unrest in connection with its Mexican operations, it could have a material adverse effect on its operations and profitability. To the extent the Company acquires mineral properties in other jurisdictions; it may be subject to similar and additional risks with respect to its operations in those jurisdictions.
Government Regulation
The Company's operations, exploration and development activities are subject to extensive foreign federal, state and local laws and regulations governing such matters as environmental protection, management and use of toxic substances and explosives, management of natural resources, health, exploration and development of mines, production and post-closure reclamation, safety and labour, mining law reform, price controls import and export laws, taxation, maintenance of claims, tenure, government royalties and expropriation of property. The activities of the Company require licenses and permits from various governmental authorities. The costs associated with compliance with these laws and regulations are substantial and possible future laws and regulations, changes to existing laws and regulations and more stringent enforcement of current laws and regulations by governmental authorities, could cause additional expenses, capital expenditures, restrictions on or suspensions of the Company's operations and delays in the development of its properties. Moreover, these laws and regulations may allow governmental authorities and private parties to bring lawsuits based upon damages to property and injury to persons resulting from the environmental, health and safety practices of the Company's past and current operations, or possibly even those actions of parties from whom the Company acquired its mines or properties, and could lead to the imposition of substantial fines, penalties or other civil or criminal sanctions. The Company retains competent and well trained individuals and consultants in jurisdictions in which it does business, however, even with the application of considerable skill the Company may inadvertently fail to comply with certain laws. Such events can lead to financial restatements, fines, penalties, and other material negative impacts on the Company.
Mexican Tax Assessments
As disclosed under "Contingencies", one subsidiary of the Company in Mexico has received a tax assessment from Mexican fiscal authorities. The Company filed an appeal against the June 2016 tax assessment on the basis certain items rejected by the courts were included in the new tax assessment, while a number of deficiencies exist within the assessment. If the Company is unsuccessful this could negatively impact the Company's financial position and create difficulties for the Company in dealing with Mexican fiscal authorities in the future.
Included in the Company's consolidated financial statements, are net assets of $595,000, including $42,000 in cash, held by MSCG. Following the Tax Court's rulings, MSCG is in discussions with the tax authorities with regards to the shortfall of assets within MSCG to settle its estimated tax liability. An alternative settlement option would be to transfer the shares and assets of MSCG to the tax authorities. The Company recognized an allowance for transferring the shares and assets of MSCG amounting to $595,000. The Company is assessing MSCG's settlement options based on on-going court proceedings and discussion with the tax authorities. The Company continues to assess that it is probable that its appeal should prevail and the maximum estimated exposure is the amount of the above allowance.
Compania Minera Del Cubo SA de CV ("Cubo"), a subsidiary of the Company, received a MXN 58.5 million ($2.9 million) assessment in 2019 by Mexican fiscal authorities for alleged failure to provide the appropriate support for depreciation deductions taken in the Cubo 2016 tax return and denied eligibility of deductions of certain suppliers. The tax assessment consists of MXN 24.1 million ($1.2 million) for taxes, MXN 21.0 million ($1.1 million) for penalties, MXN 10.4 million ($0.5 million) for interest and MXN 3.0 million ($0.1 million) for inflation. At the time of the tax assessment the Cubo entity had and continues to have sufficient loss carry forwards which would be applied against the assessed difference of taxable income. The Mexican tax authorities did not consider these losses in the assessment.
Due to the denial of certain suppliers for income tax purposes in the Cubo assessment, the invoices from these suppliers have been assessed as ineligible for refunds of IVA paid on the invoices. The assessment includes MXN 14.7 million ($0.7 million) for re-payment of IVA (value added taxes) refunded on these supplier payments. In the Company's judgement the suppliers and invoices meet the necessary requirements to be deductible for income tax purposes and the recovery of IVA.
The Company has filed an administrative appeal related to the 2016 Cubo Tax assessment. Cubo has provided a lien on certain El Cubo mining concession during the appeal process. Since issuance of the assessment interest charges of MXN 9.9 million ($500 thousand) and inflationary charges of MXN 1.6 million ($100 thousand) has accumulated. The Company continues to assess that it is probable that its appeal will prevail, and no provision is required in respect of the Cubo assessment.
Obtaining and Renewing of Government Permits
In the ordinary course of business, the Company is required to obtain and renew government permits for the operation and expansion of existing operations or for the development, construction and commencement of new operations. Obtaining or renewing the necessary governmental permits is a complex and time-consuming process involving numerous jurisdictions and possibly involving public hearings and costly undertakings on the Company's part. Any unexpected delays or costs associated with the permitting process could delay the development or impede the operation of a mine, which could adversely impact the Company's operations and profitability.
Environmental Factors
All phases of the Company's operations are subject to environmental regulation in the various jurisdictions in which it operates. Environmental legislation is evolving in a manner which will require stricter standards and enforcement, increased fines and penalties for non-compliance, more stringent environmental assessments of proposed projects and a heightened degree of responsibility for companies and their officers, directors and employees. The costs of compliance with changes in government regulations have the potential to reduce the profitability of future operations. Environmental hazards that may have been caused by previous or existing owners or operators may exist on the Company's mineral properties but are unknown to the Company at present.
Title to Assets
Although the Company obtains title opinions for material properties in which it has a material interest, there is no guarantee that title to such properties will not be challenged or impugned. If title to the Company's properties is disputed, it may result in the Company paying substantial costs to settle the dispute or clear title and could result in the loss of the property, which events may affect the economic viability of the Company.
Employee Recruitment and Retention
Recruiting and retaining qualified personnel is critical to the Company's success. As the Company's business activity grows, the Company will require additional key financial, administrative and mining personnel as well as additional operations staff. The Company could experience increases in recruiting and training costs and decreases in operating efficiency, productivity and profit margins. If the Company is not able to attract, hire and retain qualified personnel, the efficiency of the operations could be impaired, which could have an adverse impact on the Company's future cash flows, earnings, financial performance and financial condition.
Assurance on Financial Statements
The Company prepares the financial reports in accordance with accounting policies and methods prescribed by IFRS. In the preparation of financial reports, management may need to rely upon assumptions, make estimates or use their best judgment in determining the financial condition of the Company. Significant accounting policies and practices are described in more detail in the notes to the annual consolidated financial statements for the year ended December 31, 2020. In order to have a reasonable level of assurance that financial transactions are properly authorized, assets are safeguarded against unauthorized or improper use and transactions are properly recorded and reported, the Company has implemented and continues to analyze the internal control systems for financial reporting.
Changes in Climate Conditions
A number of governments have introduced or are moving to introduce climate change legislation and treaties at the international, national, state/provincial and local levels. Regulation relating to emission levels (such as carbon taxes) and energy efficiency is becoming more stringent. If the current regulatory trend continues, this may result in increased costs at some or all of the Company's operations. In addition, the physical risks of climate change may also have an adverse effect on the Company's operations. Extreme weather events have the potential to disrupt operations at the Company's mines and may require the Company to make additional expenditures to mitigate the impact of such events. Extended disruptions to supply lines could result in interruption to production.
Anti-Corruption and Anti-Bribery Laws
The Company's operations are governed by, and involve interactions with, various levels of government in foreign countries. The Company is required to comply with anti‐corruption and anti‐bribery laws, including the Corruption of Foreign Public Officials Act (Canada) and the Foreign Corrupt Practices Act (US) and similar laws in México. In recent years, there has been a general increase in both the frequency of enforcement and the severity of penalties under such laws, resulting in greater scrutiny and punishment to companies convicted of violating anti‐corruption and anti‐bribery laws. A company may be found liable for violations by not only its employees, but also by its contractors and third-party agents. The Company's internal procedures and programs may not always be effective in ensuring that it, its employees, contractors or third-party agents will comply strictly with all such applicable laws. If the Company becomes subject to an enforcement action or is found to be in violation of such laws, this may have a material adverse effect on the Company's reputation, result in significant penalties or sanctions, and have a material adverse effect on the Company's operations.
Compliance with Canada's Extractive Sector Transparency Measures Act
The Extractive Sector Transparency Measures Act (Canada) ("ESTMA") requires public disclosure of certain payments to governments by companies engaged in the commercial development of minerals which are publicly listed in Canada. Mandatory annual reporting is required for extractive companies with respect to payments made to foreign and domestic governments, including aboriginal groups. ESTMA requires reporting on the payments of any taxes, royalties, fees, production entitlements, bonuses, dividends, infrastructure reporting or structuring payments to avoid reporting. If the Company becomes subject to an enforcement action or is in violation of ESTMA, this may result in significant penalties or sanctions which may also have a material adverse effect on the Company's reputation.
Claims under U.S. Securities Laws
The enforcement by investors of civil liabilities under the federal securities laws of the United States may be affected adversely by the fact that the Company is incorporated under the laws of British Columbia, Canada, that the independent registered chartered professional accountants who have audited the Company's financial statements and some or all of the Company's directors and officers may be residents of Canada or elsewhere, and that all or a substantial portion of the Company's assets and said persons are located outside the United States. As a result, it may be difficult for holders of the Company's common shares to effect service of process within the United States upon people who are not residents of the United States or to realize in the United States upon judgments of courts of the United States predicated upon civil liabilities under the federal securities laws of the United States.
Information Systems and Cyber Security
The Company's operations depend, in part, upon information technology systems. The Company's information technology systems are subject to disruption, damage or failure from a number of sources, including, but not limited to, hacking, computer viruses, security breaches, natural disasters, power loss, vandalism, theft and defects in design. Any of these and other events could result in information technology systems failures, operational delays, production downtimes, destruction or corruption of data, security breaches or other manipulation or improper use of our data, systems and networks, any of which could have adverse effects on the Company's reputation, business, results of operations, financial condition and share price.
The Company's risk and exposure to these matters cannot be fully mitigated because of, among other things, the evolving nature of these threats. As a result, cyber security and the continued development and enhancement of controls, processes and practices designed to protect the Company's systems, computers, software, data and networks from attack, damage or unauthorized access remain a priority. As cyber threats continue to evolve, the Company may be required to expend additional resources to continue to modify or enhance protective measures or to investigate and remediate any security vulnerabilities.
CONTROLS AND PROCEDURES
The Company's officers and management are responsible for establishing and maintaining disclosure controls and procedures for the Company. Disclosure controls and procedures are designed to provide reasonable assurance that material information required to be disclosed by the Company under securities legislation is recorded, processed, summarized and reported within the applicable time periods and to ensure that required information is gathered and communicated to the Company's management, including the Chief Executive Officer (CEO) and Chief Financial Officer (CFO) as is appropriate to permit timely decisions regarding public disclosure. There are inherent limitations to the effectiveness of any system of disclosure controls and procedures. Accordingly, even effective disclosure controls and procedures can only provide reasonable assurance of achieving their control objectives.
At the end of the period covered by this MD&A, management, including the CEO and CFO, conducted an evaluation of the effectiveness of the Company's disclosure controls and procedures pursuant to National Instrument 52-109 "Certification of Disclosure in Issuers Annual and Interim Filings" ("NI 52-109") and Rule 13a -15(b) of the U.S. Securities Exchange Act of 1934, as amended (the "U.S. Exchange Act"). Based upon that evaluation, the Company's CEO and CFO have concluded that, as of the end of the period covered by this MD&A, the Company's disclosure controls and procedures were effective to give reasonable assurance that the information required to be disclosed by the Company in reports that it files or submits is (i) recorded, processed, summarized and reported, within the time periods specified under applicable securities legislation in Canada and in the U.S. Securities and Exchange Commission's rules and forms, and (ii) accumulated and communicated to management, including its principal executive and principal financial officers, or persons performing similar functions, as appropriate to allow timely decisions regarding required disclosure.
Management's Report on Internal Controls over Financial Reporting
Management is responsible for establishing and maintaining adequate internal control over financial reporting (as defined in NI 52-109 and in Rules 13a-15(f) of the U.S. Exchange Act). A company's internal control over financial reporting is a process designed to provide reasonable assurance regarding the reliability of financial reporting and the preparation of financial statements for external purposes in accordance with applicable generally accepted accounting principles.
A company's internal control over financial reporting includes those policies and procedures that (i) pertain to the maintenance of records that, in reasonable detail, accurately and fairly reflect the transactions and dispositions of the assets of the company; (ii) provide reasonable assurance that transactions are recorded as necessary to permit preparation of financial statements in accordance with generally accepted accounting principles, and that receipts and expenditures of the company are being made only in accordance with authorizations of management and directors of the company; and (iii) provide reasonable assurance regarding prevention or timely detection of unauthorized acquisition, use, or disposition of the company's assets that could have a material effect on the financial statements. It should be noted that a control system, no matter how well conceived or operated, can only provide reasonable assurance, not absolute assurance, that the objectives of the control system are met. Also, projections of any evaluation of effectiveness to future periods are subject to the risk that controls may become inadequate because of changes in conditions, or that the degree of compliance with policies and procedures may deteriorate.
Management of the Company, including the CEO and CFO, assessed the effectiveness of the Company's internal control over financial reporting as of December 31, 2020. In making this assessment, management used the criteria set forth in the Internal Control Integrated Framework (2013) issued by the Committee of Sponsoring Organizations of the Treadway Commission (COSO). Based on its assessment, management has concluded that, as of December 31, 2020, the Company's internal control over financial reporting is effective. Also, management determined that there were no material weaknesses in the Company's internal control over financial reporting as at December 31, 2020.
Changes in Internal Control over Financial Reporting
Management, including the CEO and CFO, have evaluated the Company's internal controls over financial reporting to determine whether any changes occurred during the period that have materially affected, or are reasonably likely to materially affect, the Company's internal controls over financial reporting.
There have been no changes in internal control over financial reporting that occurred during the fiscal year ended December 31, 2020 that have materially affected, or are reasonably likely to materially affect, the Company's internal control over financial reporting.