|
MANAGEMENT'S DISCUSSION AND ANALYSIS FOR THE YEAR ENDED DECEMBER 31, 2024 |
This Management Discussion and Analysis ("MD&A") should be read in conjunction with the consolidated financial statements of Endeavour Silver Corp. ("Endeavour" or "the Company") for the year ended December 31, 2024 and the related notes contained therein, which were prepared in accordance with International Financial Reporting Standards ("IFRS") as issued by the International Accounting Standards Board ("IASB"). The Company uses certain non-IFRS financial measures in this MD&A as described under "Non-IFRS Measures". Additional information relating to the Company, including the most recent Annual Information Form (the "Annual Information Form"), is available on SEDAR+ at www.sedarplus.com, and the Company's most recent annual report on Form 40-F has been filed with the U.S. Securities and Exchange Commission (the "SEC") on EDGAR at www.sec.gov. This MD&A contains "forward-looking statements" that are subject to risk factors set out in a cautionary note contained herein. All dollar ($) amounts are expressed in United States ("$") dollars and tabular amounts are expressed in thousands of U.S. dollars unless Canadian dollars (CAN$) or Mexican pesos (MXN) are otherwise indicated. This MD&A is dated as of March 10, 2025 and all information contained is current as of March 10, 2025 unless otherwise stated.
Cautionary Note to U.S. Investors Regarding Mineral Reserves and Resources
This MD&A has been prepared in accordance with the requirements of Canadian provincial securities laws, which differ from the requirements of U.S. securities laws. As a result, the Company reports the mineral reserves and resources of the projects it has an interest in according to Canadian standards. Canadian reporting requirements for disclosure of mineral properties are governed by National Instrument 43-101 - Standards of Disclosure for Mineral Projects ("NI 43-101"). NI 43-101 is a rule developed by the Canadian Securities Administrators that establishes standards for all public disclosure an issuer makes of scientific and technical information concerning mineral projects. These standards differ from the requirements of the SEC that are applicable to domestic United States reporting companies under subpart 1300 of Regulation S-K ("S-K 1300") under the Exchange Act. As an issuer that prepares and files its reports with the SEC pursuant to the Multijurisdictional Disclosure System, the Company is not subject to the requirements of S-K 1300. Any mineral reserves and mineral resources reported by the Company in accordance with NI 43-101 may not qualify as such under or differ from those prepared in accordance with S-K 1300. Accordingly, information included or incorporated by reference in this MD&A concerning descriptions of mineralization and estimates of mineral reserves and resources under Canadian standards may not be comparable to similar information made public by United States companies subject to the reporting and disclosure requirements of S-K 1300.
Forward-Looking Statements
This MD&A contains "forward-looking statements" within the meaning of the U.S. Securities Litigation Reform Act of 1995, as amended and "forward-looking information" within the meaning of applicable Canadian securities legislation. Such forward-looking statements and information include, but are not limited to, statements regarding the construction and development of the Terronera Project (as defined herein), including: anticipated timing of the Terronera Project, estimated Terronera Project economics; Terronera Project's forecasted operations, costs and expenditures, the timing and completion of an economic study for Pitarrilla; Company's future production and cost guidance announcements; mineral resource estimations and life of mine plans; planned exploration and drilling activities; Endeavour's anticipated performance in 2025, including silver and gold production and financial results, silver and gold grades and recoveries, cash costs per ounce (oz), operating costs, capital expenditures and sustaining capital; Company's capital requirement and the timing and results of various activities. Forward-looking statements are frequently characterized by words such as "plan", "expect", "forecast", "project", "intend", "believe", "anticipate", "outlook" and other similar words, or statements that certain events or conditions "may" or "will" occur. Forward- looking statements are based on the opinions and estimates of management at the dates the statements are made, and are subject to a variety of risks and uncertainties and other factors that could cause actual events or results to differ materially from those projected in the forward-looking statements.
The Company does not intend to, and does not assume any obligation to, update such forward-looking statements or information, other than as required by applicable law. Forward-looking statements or information involve known and unknown risks, uncertainties and other factors and are based on assumptions that may cause the actual results, level of activity, performance or achievements of the Company and its operations to be materially different from those expressed or implied by such statements. Such factors and assumptions include, among others: the ongoing effects of inflation and supply chain issues on the Terronera Project economics; fluctuations in the prices of silver and gold; fluctuations in the currency markets (particularly the Mexican peso, Chilean peso, Canadian dollar and U.S. dollar); fluctuations in interest rates, changes in national and local governments, legislation, taxation, controls, regulations and political or economic developments in Canada and Mexico; operating or technical difficulties in mineral exploration, development and mining activities; risks and hazards of mineral exploration, development and mining (including, but not limited to environmental hazards, industrial accidents, unusual or unexpected geological conditions, pressures, cave-ins and flooding); inadequate insurance, or inability to obtain insurance; availability of and costs associated with mining inputs and labour; the speculative nature of mineral exploration and development; diminishing quantities or grades of mineral reserves as properties are mined; risks in obtaining necessary licenses and permits; challenges to the Company's title to properties; as well as those factors described under "Risk Factors" in the Company's Annual Information Form. Although the Company has attempted to identify important factors that could cause actual results to differ materially from those contained in forward-looking statements or information, there may be other factors that cause results to be materially different from those anticipated, described, estimated, assessed or intended. There can be no assurance that any forward-looking statements or information will prove to be accurate as actual results and future events could differ materially from those anticipated in such statements or information. Accordingly, readers should not place undue reliance on forward-looking statements or information.
Certain forward-looking statements and information in this MD&A may be considered "financial outlook" within the meaning of applicable Canadian securities legislation. Financial outlook is presented in this MD&A for the purpose of assisting investors and others in understanding certain key elements of the Company's financial results and business plan, as well as the objectives, strategic priorities and business outlook of the Company, and in obtaining a better understanding of the Company's anticipated operating environment. Readers are cautioned that such financial outlook may not be appropriate for other purposes.
Qualified Person
The scientific and technical information contained in this MD&A relating to the Company's mines and mineral projects has been reviewed and approved by Dale Mah, B.Sc., P.Geo., Vice President Corporate Development of Endeavour, a Qualified Person within the meaning of NI 43-101.
Table of Contents
OVERVIEW OF THE BUSINESS
The Company is engaged in silver mining in Mexico and related activities including property acquisition, exploration, development, mineral extraction, processing, refining and reclamation. The Company is also engaged in exploration activities in Chile and Nevada, USA. The Company's operations are comprised of the Guanaceví and Bolañitos mines located in Durango, Mexico and Guanajuato, Mexico respectively. The Company is developing the Terronera project located in Jalisco State, Mexico (the "Terronera Project"). The Company is advancing several other exploration projects in order to achieve its goal to become a premier senior producer in the silver mining sector.
The Company's common shares are listed on the Toronto Stock Exchange (TSX: EDR) and the New York Stock Exchange (NYSE: EXK).
OPERATING HIGHLIGHTS
| Three Months Ended December 31 | Q4 2024 Highlights | Twelve Months Ended December 31 | ||||
| 2024 | 2023 | % Change | 2024 | 2023 | % Change | |
| Production | ||||||
| 824,529 | 1,406,423 | (41%) | Silver ounces produced | 4,471,824 | 5,672,703 | (21%) |
| 9,075 | 9,608 | (6%) | Gold ounces produced | 39,047 | 37,858 | 3% |
| 817,292 | 1,396,315 | (41%) | Payable silver ounces produced | 4,438,354 | 5,627,379 | (21%) |
| 8,898 | 9,440 | (6%) | Payable gold ounces produced | 38,327 | 37,189 | 3% |
| 1,550,529 | 2,175,063 | (29%) | Silver equivalent ounces produced(1) | 7,595,584 | 8,701,343 | (13%) |
| 13.68 | 12.54 | 9% | Cash costs per silver ounce(2) | 12.99 | 13.49 | (4%) |
| 21.00 | 17.66 | 19% | Total production costs per ounce(2) | 19.70 | 18.55 | 6% |
| 27.33 | 21.48 | 27% | All-in sustaining costs per ounce(2) | 23.88 | 22.93 | 4% |
| 165,591 | 220,464 | (25%) | Processed tonnes | 781,439 | 874,382 | (11%) |
| 152.44 | 132.81 | 15% | Direct operating costs per tonne(2) | 140.98 | 130.17 | 8% |
| 209.49 | 168.71 | 24% | Direct costs per tonne(2) | 192.51 | 171.00 | 13% |
| Financial | ||||||
| 42.2 | 50.5 | (16%) | Revenue ($ millions) | 217.6 | 205.5 | 6% |
| 654,519 | 1,332,648 | (51%) | Silver ounces sold | 4,645,574 | 5,669,760 | (18%) |
| 8,343 | 9,417 | (11%) | Gold ounces sold | 38,522 | 37,186 | 4% |
| 31.56 | 23.78 | 33% | Realized silver price per ounce | 27.39 | 23.76 | 15% |
| 2,647 | 2,051 | 29% | Realized gold price per ounce | 2,397 | 1,968 | 22% |
| 1.0 | 3.0 | (66%) | Net earnings (loss) ($ millions) | (31.5) | 6.1 | (614%) |
| 4.8 | 3.3 | 47% | Adjusted net earnings(2) ($ millions) | 8.0 | 1.7 | 357% |
| 7.7 | 5.4 | 45% | Mine operating earnings ($ millions) | 42.1 | 36.6 | 15% |
| 13.1 | 12.6 | 5% | Mine operating cash flow before taxes ($ millions)(2) | 72.3 | 64.4 | 12% |
| 5.8 | 9.8 | (41%) | Operating cash flow before working capital changes(2) | 27.2 | 37.0 | (26%) |
| 4.4 | 8.3 | (48%) | EBITDA(2) ($ millions) | 10.0 | 47.9 | (79%) |
| 8.5 | 9.3 | (8%) | Adjusted EBITDA(2) ($ millions) | 52.7 | 47.1 | 12% |
| 78.8 | 42.5 | 85% | Working capital (2) ($ millions) | 78.8 | 42.5 | 85% |
| Shareholders | ||||||
| 0.00 | 0.01 | (100)% | Earnings (loss) per share - basic ($) | (0.13) | 0.03 | (533%) |
| 0.02 | 0.02 | 0% | Adjusted earnings (loss) per share - basic ($)(2) | 0.03 | 0.01 | 200% |
| 0.02 | 0.05 | (60%) | Operating cash flow before working capital changes per share(2) | 0.11 | 0.19 | (42%) |
| 252,169,924 | 207,932,318 | 21% | Weighted average shares outstanding | 242,181,449 | 196,018,623 | 24% |
(1) Silver equivalents are calculated using an 80:1 (Ag:Au) ratio.
(2) Non-IFRS measure. For a description of how these measures are calculated and a reconciliation of these measures to the most directly comparable measures specified, defined or determined under IFRS and presented in the Company's financial statements, refer to "Non-IFRS Measures".
The above highlights are key measures used by management, however they should not be the sole measures used in determining the performance of the Company's operations.
REVIEW OF OPERATING RESULTS
The Company operates the Guanaceví and Bolañitos mines.
Consolidated Production Results for the Three Months and Years Ended December 31, 2024 and 2023
|
Three Months Ended December 31 |
CONSOLIDATED |
Twelve Months Ended December 31 |
||||
|
2024 |
2023 |
% Change |
|
2024 |
2023 |
% Change |
|
165,591 |
220,464 |
(25%) |
Ore tonnes processed |
781,439 |
874,382 |
(11%) |
|
179 |
233 |
(23%) |
Average silver grade (gpt) |
201 |
230 |
(13%) |
|
86.3 |
85.1 |
1% |
Silver recovery (%) |
88.5 |
87.7 |
1% |
|
824,529 |
1,406,423 |
(41%) |
Total silver ounces produced |
4,471,824 |
5,672,703 |
(21%) |
|
817,292 |
1,396,315 |
(41%) |
Payable silver ounces produced |
4,438,354 |
5,627,379 |
(21%) |
|
1.80 |
1.53 |
18% |
Average gold grade (gpt) |
1.69 |
1.51 |
12% |
|
94.7 |
88.7 |
7% |
Gold recovery (%) |
91.7 |
89.4 |
3% |
|
9,075 |
9,608 |
(6%) |
Total gold ounces produced |
39,047 |
37,858 |
3% |
|
8,898 |
9,440 |
(6%) |
Payable gold ounces produced |
38,327 |
37,189 |
3% |
|
1,550,529 |
2,175,063 |
(29%) |
Silver equivalent ounces produced(1) |
7,595,584 |
8,701,343 |
(13%) |
|
13.68 |
12.54 |
9% |
Cash costs per silver ounce(2) |
12.99 |
13.49 |
(4%) |
|
21.00 |
17.66 |
19% |
Total production costs per ounce(2) |
19.70 |
18.55 |
6% |
|
27.33 |
21.48 |
27% |
All in sustaining costs per ounce (2) |
23.88 |
22.93 |
4% |
|
152.44 |
132.81 |
15% |
Direct operating costs per tonne(2) |
140.98 |
130.17 |
8% |
|
209.49 |
168.71 |
24% |
Direct costs per tonne(2) |
192.51 |
171.00 |
13% |
(1) Silver equivalents are calculated using an 80:1 (Ag:Au) ratio.
(2) Non-IFRS measure. For a description of how these measures are calculated and a reconciliation of these measures to the most directly comparable measures specified, defined or determined under IFRS and presented in the Company's financial statements, refer to "Non-IFRS Measures".
(1) Silver equivalents are calculated using an 80:1 (Ag/Au) ratio.
Consolidated Production
Three months ended December 31, 2024 (compared to the three months ended December 31, 2023)
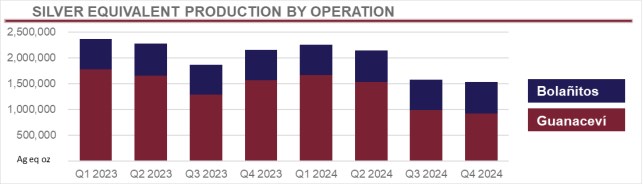
Consolidated silver production during Q4, 2024 was 824,529 oz, a decrease of 41% compared to 1,406,423 oz in Q4, 2023, and gold production was 9,075 oz, a decrease of 6% compared to 9,608 oz in Q4, 2023. Plant throughput was 165,591 tonnes at average grades of 179 grams per tonne (gpt) silver and 1.80 gpt gold, compared to 220,464 tonnes grading 233 gpt silver and 1.53 gpt gold in Q4, 2023. The 41% decrease in consolidated silver production, compared to Q4, 2023, is driven by a 43% decrease in silver production at the Guanaceví mine and a 22% decrease in silver production at the Bolañitos mine. Consolidated gold production decreased by 6% compared to Q4, 2023, due to a 30% decrease in gold production at the Guanaceví mine offset by a 10% increase in gold production at the Bolañitos mine.
The decrease in silver and gold production at the Guanaceví mine was primarily caused by the failure of the trunnion on the primary ball mill at Guanaceví in August. After suspending operations for over a week, temporary modifications were completed within the plant to re-purpose one of the regrind mills as the primary ball mill which allowed the processing of ore to continue at a reduced capacity during Q4 averaging 565 tonnes per day (tpd). After the newly fabricated trunnion was installed, production resumed to full capacity in the second half of December.
Year ended December 31, 2024 (compared to the year ended December 31, 2023)
Consolidated silver production during the year ended December 31, 2024 was 4,471,824 oz, a decrease of 21% compared to 5,672,703 oz in the same period of 2023, and gold production was 39,047 oz, an increase of 3% compared to 37,858 oz in 2023. Plant throughput was 781,439 tonnes at average grades of 201 gpt silver and 1.69 gpt gold, compared to 874,382 tonnes grading 230 gpt silver and 1.51 gpt gold for the year ended December 31, 2023.
The Company revised downwards the preliminary production guidance for the Guanaceví mine. The results at the end of the year reached the top end of this revised guidance range of 7.3 - 7.6 million silver equivalent ounces, achieving 7,595,584 ounces of silver equivalent production.
Consolidated Operating Costs
Three months ended December 31, 2024 (compared to the three months ended December 31, 2023)
Direct operating costs per tonne in Q4, 2024 increased to $152.44, a 15% increase compared with $132.81 in Q4, 2023 predominantly caused by a 35% increase in direct operating costs per tonne in Guanaceví due to the temporarily reduced plant capacity.
Consolidated cash costs per oz, net of by-product credits increased 9% to $13.68 driven by a 41% decrease in silver ounces produced, offset by a 14% increase in by-product gold sales and a 7% decrease in direct costs. All-In-Sustaining Costs (“AISC”) increased by 27% to $27.33 per silver ounce compared to Q4, 2023 due to the 41% lower production of silver ounces, partially offset by a 37% lower cash costs.
Year ended December 31, 2024 (compared to the year ended December 31, 2023)
Direct operating costs per tonne for the year increased to $140.98, an 8% increase compared with $130.17 in 2023 primarily due to the lower throughput, partially offset by lower direct operating cost. Following the trunnion failure at Guanaceví, and due to the significant number of variables, estimates and remaining uncertainties, management withdrew its 2024 full year cost guidance in August. With lower operating plant capacity at Guanaceví for a large period in 2024, operating costs and AISC metrics were higher than originally guided for 2024.
Consolidated cash costs per ounce, net of by-product credits, decreased to $12.99 per ounce in 2024, a 4% decrease compared with $13.49 per ounce in 2023, driven by a 24% lower cash costs and partially offset by 21% lower silver oz produced. Lower cash costs were predominantly caused by 26% increase in by-product gold sales. In 2024, AISC increased by 4% to $23.88 per silver ounce compared to 2023 driven by the 21% of lower production of silver ounces, partially offset by a 24% lower cash costs.
GUANACEVÍ OPERATIONS
The Guanaceví operation is currently producing from three underground silver-gold mines along a five kilometre ("km") length of the prolific Santa Cruz vein. Guanaceví provides steady employment to over 560 people and engages 220 contractors.
In July 2019, the Company acquired a 10 year right to explore and exploit the El Porvenir and El Curso concessions from Ocampo Mining SA de CV ("Ocampo"), a subsidiary of Grupo Frisco. The Company agreed to meet certain minimum production targets from the properties, subject to various terms and conditions, and pay Ocampo a $12 fixed per tonne production payment plus a floating net smelter return royalty based on the silver spot price. The Company pays a 4% royalty on sales below $15.00 per silver oz, 9% above $15.00 per silver oz, 13% above $20.00 per silver oz, and a maximum of 16% above $25 per silver oz.
Production Results for the Three Months and Years Ended December 31, 2024 and 2023
|
Three Months Ended December 31 |
GUANACEVÍ |
Twelve Months Ended December 31 |
||||
|
2024 |
2023 |
% Change |
|
2024 |
2023 |
% Change |
|
58,798 |
110,781 |
(47%) |
Ore tonnes processed |
353,793 |
433,409 |
(18%) |
|
440 |
419 |
5% |
Average silver grade (g/t) |
397 |
417 |
(5%) |
|
86.4 |
85.2 |
1% |
Silver recovery (%) |
89.0 |
88.0 |
1% |
|
718,797 |
1,271,679 |
(43%) |
Total silver ounces produced |
4,019,197 |
5,105,237 |
(21%) |
|
716,641 |
1,267,864 |
(43%) |
Payable silver ounces produced |
4,007,140 |
5,089,921 |
(21%) |
|
1.53 |
1.20 |
27% |
Average gold grade (g/t) |
1.35 |
1.19 |
14% |
|
90.7 |
87.0 |
4% |
Gold recovery (%) |
90.0 |
90.5 |
(1%) |
|
2,622 |
3,721 |
(30%) |
Total gold ounces produced |
13,817 |
14,955 |
(8%) |
|
2,613 |
3,710 |
(30%) |
Payable gold ounces produced |
13,775 |
14,910 |
(8%) |
|
928,557 |
1,569,359 |
(41%) |
Silver equivalent ounces produced(1) |
5,124,557 |
6,301,637 |
(19%) |
|
20.25 |
14.95 |
35% |
Cash costs per silver ounce(2) |
17.78 |
15.20 |
17% |
|
25.50 |
18.04 |
41% |
Total production costs per ounce(2) |
22.62 |
18.36 |
23% |
|
32.40 |
21.50 |
51% |
All in sustaining costs per ounce (2) |
26.29 |
22.23 |
18% |
|
230.50 |
170.33 |
35% |
Direct operating costs per tonne(2) |
188.71 |
165.95 |
14% |
|
365.23 |
239.76 |
52% |
Direct costs per tonne(2) |
293.90 |
246.48 |
19% |
(1) Silver equivalents are calculated using an 80:1 (Ag:Au) ratio.
(2) Non-IFRS measure. For a description of how these measures are calculated and a reconciliation of these measures to the most directly comparable measures specified, defined or determined under IFRS and presented in the Company's financial statements, refer to "Non-IFRS Measures".
Guanaceví Production Results
Three months ended December 31, 2024 (compared to the three months ended December 31, 2023)
Silver production at the Guanaceví mine during Q4, 2024 was 718,797 oz, a decrease of 43% compared to 1,271,679 oz in Q4, 2023, and gold production was 2,622 oz, a decrease of 30% compared to 3,721 oz in Q4, 2023. Plant throughput was 47% lower in Q4, 2024 with 58,798 tonnes at average grades of 440 gpt silver and 1.53 gpt gold, compared to 110,781 tonnes grading 419 gpt silver and 1.20 gpt gold in Q4, 2023. The lower throughput and production were caused by the failure of the trunnion on the primary ball mill at Guanaceví in August 2024; after the newly fabricated trunnion was installed, production resumed to full capacity in the second half of December. During this period, as noted above, temporary modifications allowed the processing of ore to continue; the operations team focused on feeding the highest-grade ore to the mill while stockpiling the remaining ore to optimize production and cash flows.
Year ended December 31, 2024 (compared to the year ended December 31, 2023)
Silver production at the Guanaceví mine during 2024 was 4,019,197 oz, a decrease of 21% compared to 5,105,237 oz in 2023, and gold production was 13,817 oz, a decrease of 8% compared to 14,955 oz in 2023. Due to the failure of the trunnion on the primary ball mill, plant throughput was 18% lower in 2024 with 353,793 tonnes compared to 433,409 tonnes in 2023. Silver production was also impacted by lower silver grades at average grades of 397 gpt silver in 2024 compared to 417 gpt silver in 2023 while gold production benefited from higher gold grades at average 1.35 gpt gold in 2024 compared to 1.19 gpt gold in 2023. The fluctuations of ore grades are from accessing different areas of the mine and due to typical grade variations within the mine plan.
Guanaceví Operating Costs
Three months ended December 31, 2024 (compared to the three months ended December 31, 2023)
Direct operating costs per tonne for the three months ended December 31, 2024 increased 35% to $230.50 compared with the same period in 2023, caused by 47% lower tonnes processed in Q4 2024. The impact of lower throughput was partially offset by 28% lower direct operating costs. Including royalty and special mining duty costs, direct cost per tonne increased 52% to $365.23 in Q4 2024 compared with $239.76 in Q4 2023. The purchase of local purchased material contributed $71.21 per tonne during Q4, 2024 compared to $23.44 per tonne in Q4 2023; the volume of purchased material was 13,842 tonnes compared to 15,117 tonnes in the same period in 2023, purchased at higher prices in the current period. Despite throughput decreasing 47% in the same period, the total royalty expense, which is included in cost per tonne and oz metrics for the period, decreased only 29% from $5.1 million to $3.6 million as a result of a higher royalty rate payable.
Cash costs per oz, net of by-product credits, increased to $20.25 compared to $14.95 for the same period in 2023, driven by the lower silver production, lower by-product gold sales, partially offset by lower direct costs. AISC per oz increased 51% to $32.40 per oz for the three months ended December 31, 2024, due to the lower silver production and higher sustaining capex, partially offset by a decrease in cash costs net of by-product.
Year ended December 31, 2024 (compared to the year ended December 31, 2023)
Direct operating costs per tonne for 2024 increased 14% to $188.71 compared with 2023, primarily resulting from 18% lower throughput, partially offset by a 7% lower direct operating costs. Following the trunnion failure, management implemented certain cost control measures to manage cash flow and reduce costs during the period of lower throughput at the plant. This included the termination of contract mining activities and reduced local third-party material purchases to lessen the impact of lower throughput on direct operating costs and cash flow. However, including royalty and special mining duty costs, direct cost per tonne increased 19% to $293.90 compared with $246.48 in 2023, primarily due to the higher metal price environment which caused a higher royalty rate. Royalty expense for the year, was $20.5 million, compared to $21.9 million in 2023 and is included in cost per tonne and cost per oz metrics.
The purchased material contributed $40.75 per tonne during 2024 compared to $23.31 per tonne in 2023 due to the higher cost per tonne. During the year ended December 31, 2024, the Company purchased 56,604 tonnes of purchased material compared to 61,610 tonnes in 2023, which was a lower volume due to the lower throughput at the plant which did not require as much purchased material to run at capacity.
Cash costs per oz, net of by-product credits, increased to $17.78 compared to $15.20 for the same period in 2023, driven by the lower silver production partially offset by a higher gold credit. AISC per oz increased 18% to $26.29 per oz, due to higher cash costs per oz, and slightly higher general and administrative costs, partially offset by a lower sustaining capital expenditure.
BOLAÑITOS OPERATIONS
The Bolañitos operation encompasses three underground silver-gold mines and a flotation plant. Bolañitos provides steady employment for over 500 people and engages 230 contractors.
Production Results for the Three Months and Years Ended December 31, 2024 and 2023
|
Three Months Ended December 31 |
BOLAÑITOS |
Twelve Months Ended December 31 |
||||
|
2024 |
2023 |
% Change |
|
2024 |
2023 |
% Change |
|
106,793 |
109,683 |
(3%) |
Ore tonnes processed |
427,646 |
440,973 |
(3%) |
|
36 |
45 |
(20%) |
Average silver grade (g/t) |
39 |
47 |
(17%) |
|
85.5 |
84.8 |
1% |
Silver recovery (%) |
84.4 |
85.1 |
(1%) |
|
105,732 |
134,744 |
(22%) |
Total silver ounces produced |
452,627 |
567,466 |
(20%) |
|
100,651 |
128,451 |
(22%) |
Payable silver ounces produced |
431,214 |
537,458 |
(20%) |
|
1.95 |
1.86 |
5% |
Average gold grade (g/t) |
1.98 |
1.82 |
9% |
|
96.4 |
89.8 |
7% |
Gold recovery (%) |
92.7 |
88.8 |
4% |
|
6,453 |
5,887 |
10% |
Total gold ounces produced |
25,230 |
22,903 |
10% |
|
6,285 |
5,730 |
10% |
Payable gold ounces produced |
24,552 |
22,279 |
10% |
|
621,972 |
605,704 |
3% |
Silver equivalent ounces produced(1) |
2,471,027 |
2,399,706 |
3% |
|
(33.11) |
(11.23) |
(195%) |
Cash costs per silver ounce(2) |
(31.47) |
(2.78) |
(1,033%) |
|
(11.03) |
13.88 |
(179%) |
Total production costs per ounce(2) |
(7.43) |
20.41 |
(136%) |
|
(8.78) |
21.26 |
(141%) |
All in sustaining costs per ounce (2) |
1.47 |
29.55 |
(95%) |
|
109.46 |
94.91 |
15% |
Direct operating costs per tonne(2) |
101.49 |
95.00 |
7% |
|
123.73 |
96.94 |
28% |
Direct costs per tonne(2) |
108.63 |
96.82 |
12% |
(1) Silver equivalents are calculated using an 80:1 (Ag:Au) ratio.
(2) Non-IFRS measure. For a description of how these measures are calculated and a reconciliation of these measures to the most directly comparable measures specified, defined or determined under IFRS and presented in the Company's financial statements, refer to "Non-IFRS Measures".
Bolañitos Production Results
Three months ended December 31, 2024 (compared to the three months ended December 31, 2023)
Silver production at the Bolañitos mine was 105,732 oz in Q4, 2024, a decrease of 22% compared to 134,744 oz in Q4, 2023, and gold production was 6,453 oz in Q4, 2024, an increase of 10% compared to 5,887 oz in Q4, 2023. Plant throughput in Q4, 2024 was 106,793 tonnes at average grades of 36 gpt silver and 1.95 gpt gold, compared to 109,683 tonnes at average grades of 45 gpt silver and 1.86 gpt gold in Q4, 2023. At the Bolañitos mine the 22% decrease in silver production was attributable to a 20% lower silver grade and a 3% decrease in throughput, partially offset by a 1% increase in recoveries. The 10% increase in gold production at the Bolañitos mine was attributable to a 5% increase in ore gold grade and the 7% increase in gold recoveries, partially offset by a 3% decrease in throughput. The differences in ore grades are due to mining different zones of the three mines in accordance with the mine plan
Year ended December 31, 2024 (compared to the Year ended December 31, 2023)
Silver production at the Bolañitos mine was 452,627 oz in 2024, a decrease of 20% compared to 567,466 oz in 2023, and gold production was 25,230 oz in 2024, an increase of 10% compared to 22,903 oz in 2023. Plant throughput was 427,646 tonnes at average grades of 39 gpt silver and 1.98 gpt gold, compared to 440,973 tonnes at average grades of 47 gpt silver and 1.82 gpt gold in 2023. The decrease in silver production at the Bolañitos mine was due to a 17% reduction in ore silver grade and a 1% reduction in silver recoveries as well as 3% decrease in ore tonnes processed. The increase in gold production at the Bolañitos mine was due to a 9% increase in ore gold grade, a 4% increase in recoveries partially offset by a 3% decrease in processed tonnes. The differences in ore grades are due to mining different zones of the three mines in accordance with the mine plan.
Bolañitos Operating Costs
Three months ended December 31, 2024 (compared to the three months ended December 31, 2023)
Direct costs per tonne in Q4, 2024 increased 28% to $123.73 per tonne, compared to $96.94 in 2023, primarily due to higher direct costs and a 3% decrease in ore tonnes processed. Cash costs, net of by-product credits, were negative $33.11 per oz of payable silver in Q4, 2024 compared to negative $11.23 per oz in Q4, 2023 due to higher gold production and price. AISC decreased 141% in Q4, 2024 to negative $8.78 per oz from positive $21.26 per oz in Q4, 2023 primarily due to the increased gold production, increased realized gold prices and a decrease in sustaining capital.
Year ended December 31, 2024 (compared to the year ended December 31, 2023)
Direct costs per tonne for the year ended December 31, 2024 increased 12% to $108.63 per tonne compared to $96.82 in 2023, primarily due to an increase in direct costs and a 3% decrease in ore tonnes processed. Cash costs, net of by-product credits, were negative $31.47 per oz of payable silver in 2024 compared to negative $2.78 per oz in 2023 due to the increased gold production and price compared to the prior year partially offset by increased costs and reduced silver production. AISC decreased 95% in the year ended December 31, 2024, to $1.47 per oz primarily due to the decrease in sustaining capital expenditures.
TERRONERA DEVELOPMENT
The Terronera Project, located 40 km northeast of Puerto Vallarta in the state of Jalisco, Mexico, features a high-grade silver-gold mineral resource in the Terronera vein.
Updated Initial Capital Cost
In February 2025, the Company announced a comprehensive review of the remaining Terronera completion costs and forecasts initial capital costs to be $332 million:
| (millions) | 2024 Revised Scenario Initial CAPEX |
2025 Updated Scenario Initial CAPEX |
Variance |
| Mining | $83.80 | $100.20 | $16.40 |
| Mineral Processing Plant | $64.80 | $78.00 | $13.20 |
| Site Infrastructure | $56.20 | $58.40 | $2.20 |
| Total Direct Costs | $204.80 | $236.60 | $31.80 |
| Owner Costs | $33.30 | $50.30 | $17.00 |
| Project Indirect Costs | $24.20 | $45.10 | $20.90 |
| Contingency | $8.70 | - | ($8.70) |
| Total Indirect Costs | $66.20 | $95.40 | $29.20 |
| Total (Direct & Indirect) | $271.00 | $332.00 | $61.00 |
The mining cost increase of approximately $16 million is related to the extended project schedule as well as increased waste rock disposal costs, including hauling, placement at the temporary waste dump and construction of the permanent waste dump.
Mineral process plant costs, which include the lower platform and tailing facility construction, are estimated to be approximately $13 million over budget. These costs include additional work for expediting structural steel fabrication, blasting required for lower platform excavation, offsite materials purchased for tailing facility construction, extra work required for supporting the cut above the lower platform elevation and contractor indirect costs.
The $2.2 million increase for site infrastructure is related to the additional scope for constructing the mill shop, warehouse and assay/met lab and temporary power generation.
Total project indirect costs increased by $29 million, after consideration of an offsetting decrease of $8.7 million contingency. Owner costs increased due to additional engineering, construction management, enlarging the camp capacity and adding several administrative support buildings (e.g., offices and training). Project indirect costs increased due to the extended project schedule and a larger workforce, overlapping project construction and completion activities.
Construction and Development Highlights
As of December 31, 2024, overall project progress reached 89.4% completion and current capital expenditures are $302 million. The Health and Safety Program and Procedures were completed and ready for transition from construction and commissioning into operations with community support and the hiring and training of local employees continued to be a priority. During the fourth quarter, 1,694 metres were developed underground for a project total of 7,239 metres. Of note, the underground explosives magazine storage permit was approved, which will improve development efficiencies.
Much of the upper platform facilities was completed with some areas being handed over to the commissioning and operations teams. The Primary Jaw Crusher commissioning was completed, and the area was transferred to operations. A total of 6,000 tonnes of ore had been crushed. Commissioning of the grinding circuit commenced with successful SAG and ball mill testing for multiple hours at full operating speed to check bearing temperatures, vibrations and lubrication systems under no-load conditions. Flotation equipment, including pumps, tanks, verti-mill, low pressure blowers and instrumentation had been installed. Raw and Process Water Tanks – Installation and hydro-testing are 100% complete. The remaining items for installation included pressure relief valves, hoses, and final piping.
Lower Platform Facilities and Tailing Storage Facility (TSF): Lower Platform area was 42% complete. Swing plates below both tailing filters were installed, and first floor concrete was poured; structural steel installation was advancing for the second floor prior to installing the filter press. Storage tanks had been assembled; hydro testing and anchoring will be completed in Q1 2025. Concrete for the second floor was poured, and the area was ready for installing the concentrate filter. The main embankment reached the 1,185-metres elevation and the TSF facility is ready to receive filtered tailing. The event-pond liner was installed; the feed and overflow channel lining have been completed in Q1 2025. The TSF diversion canal for the south and east perimeters was approximately 90% complete.
Laboratory building construction was completed, and turned over to operations. The plant maintenance building has reached 80% completion and was scheduled for completion in Q1 2025.
At the end of Q4, the Terronera workforce included 297 Endeavour Silver employees and 821 contract workers.
Debt Facility
The Company’s wholly-owned subsidiary, Terronera Precious Metals, S.A. de C.V. holds a credit agreement with Société Générale and ING Bank N.V. for a senior secured debt facility for up to $120 million (the “Debt Facility”). Proceeds from the Debt Facility are used towards construction of the underground mine and mill at the Terronera Project. During 2024, the Company drew down the Debt Facility in full.
The Debt Facility is secured through corporate guarantees from the Company, certain of the Company's subsidiaries and a first
ranking security interest over the Terronera Project. The Debt Facility is subject to certain customary covenants including that at all times the corporate entity must maintain a cash balance in excess of $10,000 and the Reserve Tail Ratio must be in excess of 20%. Then at certain measurement dates, the following must be observed: Loan Life Coverage Ratio must be in excess of 1.3; Project Life Coverage Ratio must be in excess of 1.5; Historical Debt Service Coverage Ratio must be in excess of 1.25; Gross Leverage Ratio must be less than 3.5; and Interest Service Coverage Ratio must be in excess of 2.5. The definitions of capitalized terms used for the financial covenants are in the Debt Facility agreement. The Company was in compliance with the applicable covenants as at December 31, 2024.
The Debt Facility has a term of 8.5 years, including a 2-year grace period during the construction phase, and carries interest rate equal to US Secured Overnight Financing Rate ("SOFR") + 4.50% per annum prior to completion and SOFR + 3.75% per annum from completion of the Terronera Project until the fifth anniversary of the loan, and SOFR + 4.25% from the fifth anniversary onwards. The Debt Facility requires quarterly payments of interest with a nominal weighted-average interest rate of 9.2%.
2025 Outlook and Planning
The Terronera Project is anticipated to begin full system commissioning in early Q2 2025.
For Q1 2025, Upper Platform efforts will focus on installing remaining items, punch list completion, and commissioning. The TSF Main Embankment is anticipated to reach the final 1,198-metre elevation and tailing and concentrate filters will be installed, along with final piping, electrical and instrumentation work. The remaining critical path items are the tailing filter presses, which are expected to be completed by early Q2 2025.
The Company plans to provide operational guidance as construction approaches completion of wet commissioning.
EXPLORATION AND EVALUATION
During 2024, the Company continued exploration efforts across its core projects, focusing on expanding mineral resources and refining geological models. A total of 120 drill holes were completed, covering approximately 28,127 meters of drilling, with total exploration expenditures across all projects of approximately $11.2 million for the full year.
At Guanaceví, the Company drilled 6,084 metres across 35 holes at a total expense of $1.1 million focusing on underground diamond drilling and continued evaluation of the Santa Cruz vein extension and El Curso properties. Drilling results confirmed expectations and intersected significant mineralization with similar grades and vein widths to historical results. The Company will incorporate these drill results into its next resource estimation and life of mine plan.
At Bolañitos, the Company drilled 10,530 metres across 49 holes at a total expense of $1.2 million mainly related to surface drilling programs in both the North (La Luz) and South (Golondrinas) areas. Geological mapping and sampling continued throughout Q4 2024 to refine resource models. The Company intersected significant mineralization with resource average grades over mineable widths. The Company will incorporate these drill results into its next resource estimation and life of mine plan.
At Terronera, geological mapping progressed across multiple zones, supporting long-term mine planning. The Company also advanced permitting efforts, including regulatory submissions for environmental and social initiatives essential for future construction. Exploration expenditures for the year totaled $0.2 million. Management plans to resume drilling activities once the Terronera Project is in operation.
At Pitarrilla, the Company continued to advance the project with significant exploration and development activities throughout 2024. A total of 11,515 metres of drilling across 36 holes was completed in 2024, with total exploration expenditures of $6.0 million for the year. Development work included ramp extension and underground infrastructure improvements. Technical study work commenced in Q4 2024, with additional technical studies underway to support an economic assessment by the end of 2025. The Company remains focused on advancing Pitarrilla as a cornerstone asset, with an estimated $25.7 million budgeted for 2025 to support exploration, technical evaluation and initial infrastructure development.
Exploration activities continued at Parral, with expenditures at the Veta Colorada and infrastructure maintenance totaling $0.4 million for the year. In Chile, work continued at the Aida, Genesis, and Catalina projects, with environmental assessments, geochemical studies, and community engagement progressing with total expenditures of $0.8 million. Minor costs were incurred in the USA. The Company also incurred $1.5 million in holding costs for concessions and properties.
The Company remains focused on advancing its core projects, particularly Pitarrilla, while continuing exploration efforts at Guanaceví and Bolañitos. Planned drilling and studies in 2025 aim to further define resources and optimize development strategies across key assets.
CONSOLIDATED FINANCIAL RESULTS
Three months ended December 31, 2024 (compared to the three months ended December 31, 2023)
In Q4, 2024, the Company's mine operating earnings were $7.7 million (Q4, 2023 - $5.4 million) on revenue of $42.2 million (Q4, 2023 - $50.5 million) with cost of sales of $34.5 million (Q4, 2023 - $45.1 million).
In Q4, 2024, the Company had operating loss of $0.5 million (Q4, 2023 - operating earnings of $0.2 million) after exploration, evaluation and development costs of $6.1 million (Q4, 2023 - $2.4 million), general and administrative expense of $1.9 million (Q4, 2023 -$2.7 million) and write off of mineral properties of $0.2 million (Q4, 2023 - $nil).
The loss before taxes for Q4, 2024 was $1.6 million (Q4, 2023 – earnings of $0.7 million) after finance costs of $0.4 million (Q4, 2023 – $0.3 million), a foreign exchange gain of $0.4 million (Q4, 2023 – $1.4 million), loss on derivative contracts of $1.9 million (Q4, 2023 – $nil) and investment and other income of $0.7 million (Q4, 2023 – investments and other expense of $0.6 million). The Company realized net earnings for the period of $1.0 million (Q4, 2023 – net earnings of $3.0 million) after an income tax recovery of $2.7 million (Q4, 2023 – income tax recovery of $2.3 million). In Q4, 2024 earnings were impacted by a $0.3 million mark-to-market adjustment resulting in an unrealized loss on investments (Q4, 2023 – unrealized gain of $0.5 million).
Adjusted net earnings were $4.8 million or $0.02 basic adjusted earnings per share in Q4 2024, compared to adjusted earnings of $3.3 million, or $0.02 basic adjusted earnings per share in Q4 2023. Adjusted net earnings is a Non-IFRS measure. For a description of how these measures are calculated and a reconciliation of these measures to the most directly comparable measures specified, defined or determined under IFRS and presented in the Company's financial statements, refer to "Non-IFRS Measures". Adjusted net earnings improved for the fourth quarter of 2024 compared to the same period in 2023 as a result of the higher realized metal prices, offset by lower throughput.
Revenue of $42.2 million in Q4, 2024, net of $0.5 million of smelting and refining costs, decreased by 16% compared to $50.5 million, net of $0.5 million of smelting and refining costs, in Q4, 2023. Gross sales of $42.7 million in Q4, 2024 represented a 16% decrease over the gross sales of $51.0 million for the same period in 2023. The 51% decrease in silver ounces sold during the period, offset by a 33% increase in the realized silver price resulted in a 35% decrease in silver sales. The decrease in silver ounces sold is due to the 41% reduction in silver ounces produced and the change in the finished goods inventory during Q4. Gold ounces sold decreased 11% offset by a 29% increase in realized gold prices resulting in a 14% increase in gold sales. Gold ounces sold decreased primarily due to the 6% decrease in gold ounces produced and the change in the finished good inventory during Q4. During the period, the Company sold 654,519 oz silver and 8,343 oz gold, for realized prices of $31.56 and $2,647 per oz, respectively, compared to sales of 1,332,648 oz silver and 9,417 oz gold, for realized prices of $23.78 and $2,051 per oz, respectively, in the same period of 2023. For the three months ended December 31, 2024, the realized prices of silver and gold were within 1% of the London Fix prices. Silver and gold London Fix prices averaged $31.45 and $2,663, respectively, during the three months ended December 31, 2024.
The Company increased its finished goods to 280,693 oz silver and to 1,516 oz gold at December 31, 2024, compared to 117,921 oz silver and 961 oz gold at September 30, 2024. The cost allocated to these finished goods was $7.2 million as at December 31, 2024, compared to $3.1 million at September 30, 2024. At December 31, 2024, the finished goods inventory fair market value was $12.1 million, compared to $6.2 million at September 30, 2024.
Cost of sales for Q4, 2024 was $34.5 million, a decrease of 24% over the cost of sales of $45.1 million for Q4, 2023. The decrease in the cost of sales compared to the prior period was driven by a decrease in volume of silver oz sold and lower operating costs as a result of a lower throughput.
Exploration, evaluation and development expenses were $6.1 million, an increase of 151% compared to $2.4 million incurred in the same period of 2023 primarily due to the additional exploration expenditures in Q4 2024 on advancing the Pitarrilla Project, increased activity at Terronera Project and timing of exploration activities. General and administrative expenses of $1.9 million in Q4 2024 were 30% lower compared to the $2.7 million incurred for the same period of 2023. During Q4 2023 the Company incurred additional costs due to investment in a new ERP.
The Company incurred a foreign exchange gain of $0.4 million in Q4, 2024 compared to a gain of $1.4 million in Q4, 2023. On period end revaluation of the Mexican peso forward contracts and gold forward swap contracts, the Company recognized loss on derivative contracts of $1.9 million (Q4, 2023 – $nil). The Company incurred $0.4 million in finance charges primarily from interest on loans related to mobile equipment and accretion of reclamation and rehabilitation liabilities, compared to $0.3 million in the same period in 2023. The Company recognized $0.7 million in investment and other income compared to investments and other losses of $0.6 million in Q4, 2023 as a result of the change in the fair value of marketable securities.
Income tax recovery was $2.7 million in Q4, 2024 compared to recovery of $2.3 million in Q4, 2023. The $2.7 million tax recovery is comprised of $0.2 million recovery in current income tax (Q4, 2023 – expense of $0.2 million) and a recovery of $2.5 million in deferred income tax (Q4, 2023 – deferred income tax recovery of $2.5 million). The current income tax recovery consists of $1.5 million expense in special mining duty taxes and $1.7 million recovery of current income taxes. The deferred income tax recovery of $2.5 million is derived from changes in temporary timing differences between accounting and tax recognition.
Year ended December 31, 2024 (compared to the year ended December 31, 2023)
For the year ended December 31, 2024, the Company's mine operating earnings were $42.1 million (2023 - $36.6 million) on revenue of $217.6 million (2023 - $205.5 million) with cost of sales of $175.6 million (2023 - $168.9 million).
The Company had operating earnings of $8.3 million (2023 -$8.7 million) after exploration, evaluation and development costs of $19.4 million (2023 - $15.1 million), general and administrative expense of $14.2 million (2023 - $12.3 million) and a write off of mineral properties of $0.2 million (2023 - $0.4 million).
Loss before tax was $22.0 million (2023 - earnings before tax of $18.3 million) after finance costs of $1.5 million (2023 - $1.4 million), loss on derivative contracts of $30.6 million (2023 - $nil), a foreign exchange loss of $5.5 million (2023 - gain of $4.7 million), a gain on asset disposals of $0.1 million (2023 - $7.1 million) and investment and other income of $7.2 million (2023 - investment and other expense of $0.8 million). The Company realized net loss for the year of $31.5 million (2023 -earnings of $6.2 million) after an income tax expense of $9.5 million (2023 - $12.1 million).
Adjusted net earnings were $8.0 million or $0.03 basic adjusted earnings per share, in 2024, compared to adjusted earnings of $1.7 million, or $0.01 adjusted net earnings per share in 2023. Adjusted net earnings is a Non-IFRS measure. For a description of how these measures are calculated and a reconciliation of these measures to the most directly comparable measures specified, defined or determined under IFRS and presented in the Company's financial statements, refer to "Non-IFRS Measures". Adjusted net earnings improved in 2024 compared to 2023 as a result of the higher realized metal prices, offset by lower throughput.
Revenue of $217.6 million for the year ended December 31, 2024, net of $2.0 million of smelting and refining costs, increased by 6% compared to $205.5 million, net of $2.4 million of smelting and refining costs in 2023. Gross sales of $219.6 million in 2024 represented a 6% increase over the gross sales of $207.9 million in 2023. Silver oz sold decreased 18% due to a 21% lower silver production in 2024 compared to 2023. The 18% decrease in ounces sold during the year, partially offset by 15% higher realized silver price resulted in a 6% lower silver revenue. Gold oz sold increased 4% with a 22% increase in realized gold prices resulting in a 26% higher gold revenue. Gold oz sold increased 4% primarily due to 3% increase in gold production and small fluctuations in finished goods inventory. During the year, the Company sold 4,645,574 oz silver and 38,522 oz gold, for average realized prices of $27.39 and $2,397 per oz, respectively, compared to sales of 5,669,760 oz silver and 37,186 oz gold, for average realized prices of $23.76 and $1,968 per oz, respectively, in 2023. For the year ended December 31, 2024, the realized prices of silver and gold were within 3% of the average London Fix prices. Silver and gold London Fix prices averaged $28.24 and $2,385 respectively, during the year ended December 31, 2024.
The Company decreased its finished goods to 280,693 oz silver and slightly increased its finished goods gold inventory to 1,516 oz gold at December 31, 2024, compared to 487,884 oz silver and 1,711 oz gold at December 31, 2023. The cost allocated to these finished goods was $7.2 million as at December 31, 2024, compared to $9.5 million at December 31, 2023. At December 31, 2024, the fair market value of finished goods inventory was $12.1 million, compared to $15.1 million at December 31, 2023.
Cost of sales for 2024 was $175.6 million, an increase of 4% over the cost of sales of $168.9 million in 2023. The increase in cost of sales in the current year compared to the prior year was driven by the higher direct production costs and slightly higher depreciation in the period.
Exploration, evaluation and development expenses were $19.4 million, an increase of 28% compared to $15.1 million incurred in 2023 primarily due to the advancement of the Pitarrilla project and increased activity at the Terronera Project. General and administrative expenses of $14.2 million in 2024 were 15% higher compared to the $12.4 million incurred in 2023. General and administrative expenses include mark-to-market impact of cash-settled director's DSUs, which comparatively increased costs by $3.1 million.
The Company incurred a foreign exchange loss of $5.5 million in 2024 compared to a foreign exchange gain of $4.7 million in 2023 due to a weakening of the Mexican peso during 2024 which decreases the US dollar value of Mexican peso denominated working capital. The Company recognized loss on derivative contracts of $30.6 million ( 2023 - $nil). The Company incurred $1.5 million in finance charges primarily from interest on loans related to mobile equipment and accretion of reclamation and rehabilitation liabilities compared to $1.4 million in 2023. The Company recognized $7.2 million in investment and other income compared to $0.8 million in investment and other expenses in 2023, primarily resulting from $7.5 million of interest income (2023 - $1.5 million), $0.5 million of other various income (2023 - $0.1 million), and a loss on marketable securities of $1.8 million (2023 - $2.5 million). Investment and other income in 2024 further included $1.0 million of previously contingent consideration recognized once contractual conditions were met, regarding deferred consideration from the 2021 divestment of Compania Minera Del Cubo S.A. de C.V. ("Cubo"). During 2024, the Company recognized $0.1 million gain on asset disposal compared to $7.1 million in 2023 which included $7.0 million gain on the sale of the Cozamin royalty.
Income tax expense was $9.5 million in 2024 compared to $12.1 million in 2023. The $9.5 million tax expense is comprised of $12.9 million in current income tax expense (2023 – $11.3 million) and $3.4 million in deferred income tax recovery (2023 – expense of $0.8 million). The current income tax expense consists of $5.0 million in special mining duty taxes and $7.9 million of income taxes, primarily at Guanacevi. The deferred income tax recovery of $3.4 million is derived from changes in temporary timing differences between accounting and tax treatments. During 2024, the changes in deferred taxes were driven primarily by the changes in temporary timing differences between deductions for accounting versus deductions for tax.
SELECTED ANNUAL INFORMATION
| Expressed in thousands US dollars except per share amounts |
Year ended December 31 | |||||||||
| 2024 | 2023 | 2022 | ||||||||
| Revenue | $217,639 | $205,463 | $210,160 | |||||||
| Net earnings (loss) | ($31,476 | ) | $6,123 | $6,201 | ||||||
| Basic earnings (loss) per share | ($0.13 | ) | $0.03 | $0.03 | ||||||
| Diluted earnings (loss) per share | ($0.13 | ) | $0.03 | $0.03 | ||||||
| Dividends per share | - | - | - | |||||||
| Total assets | $719,249 | $474,807 | $399,437 | |||||||
| Total long-term liabilities | $155,946 | $30,222 | $30,794 | |||||||
QUARTERLY RESULTS AND TRENDS
The following table presents selected financial information for each of the most recent eight quarters:
| Table in thousands of US dollars except for share numbers and per share amounts |
2024 | 2023 | ||||||
| Q4 | Q3 | Q2 | Q1 | Q4 | Q3 | Q2 | Q1 | |
| Gross Sales | $42,746 | $53,939 | $58,708 | $64,218 | $51,005 | $49,926 | $50,866 | $56,117 |
| Smelting and refining costs included in revenue |
536 | 495 | 448 | 493 | 506 | 494 | 795 | 656 |
| Total Revenue | 42,210 | 53,444 | 58,260 | 63,725 | 50,499 | 49,432 | 50,071 | 55,461 |
| Direct production costs | 25,404 | 28,705 | 33,703 | 36,705 | 32,817 | 34,020 | 25,478 | 26,516 |
| Royalties | 3,661 | 5,151 | 5,648 | 6,408 | 5,105 | 4,821 | 5,749 | 6,535 |
| Mine operating cash flow before taxes | 13,145 | 19,588 | 18,909 | 20,612 | 12,577 | 10,591 | 18,844 | 22,410 |
| Share-based compensation | 55 | 73 | 74 | 79 | 44 | 44 | (294) | 132 |
| Depreciation | 5,346 | 7,032 | 8,639 | 8,877 | 7,181 | 7,855 | 6,596 | 6,253 |
| Mine operating earnings (loss) | $7,744 | $12,483 | $10,196 | $11,656 | $5,352 | $2,692 | $12,542 | $16,025 |
| Basic earnings (loss) per share | $0.00 | ($0.07) | ($0.06) | ($0.01) | $0.01 | ($0.01) | ($0.01) | $0.03 |
| Diluted earnings (loss) per share | $0.00 | ($0.07) | ($0.06) | ($0.01) | $0.01 | ($0.01) | ($0.01) | $0.03 |
| Weighted shares outstanding | 252,169,924 | 246,000,878 | 242,899,679 | 227,503,581 | 196,018,623 | 194,249,283 | 191,446,597 | 190,274,768 |
| Net earnings (loss) | $1,025 | ($17,300) | ($14,007) | ($1,194) | $3,049 | ($2,328) | ($1,054) | $6,456 |
| Depreciation | 5,706 | 7,352 | 8,933 | 9,135 | 7,458 | 7,771 | 6,967 | 6,593 |
| Finance costs | 294 | 357 | 103 | 135 | 164 | 170 | 229 | 259 |
| Current income tax | (162) | 4,523 | 2,878 | 5,667 | 207 | 2,250 | 4,442 | 4,445 |
| Deferred income tax | (2,507) | (512) | (163) | (233) | (2,544) | 888 | 766 | 1,676 |
| EBITDA | $4,356 | ($5,580) | ($2,256) | $13,510 | $8,334 | $8,751 | $11,350 | $19,429 |
The following table presents selected production information for each of the most recent eight quarters:
|
Highlights |
2024 |
2023 |
||||||
|
|
Q4 |
Q3 |
Q2 |
Q1 |
Q4 |
Q3 |
Q2 |
Q1 |
|
Processed tonnes |
165,591 |
175,065 |
218,989 |
221,794 |
220,464 |
214,270 |
228,575 |
211,073 |
|
Guanaceví |
58,798 |
67,094 |
112,897 |
115,004 |
110,781 |
103,345 |
116,908 |
102,375 |
|
Bolañitos |
106,793 |
107,971 |
106,092 |
106,790 |
109,683 |
110,925 |
111,667 |
108,698 |
|
Silver ounces |
824,529 |
874,717 |
1,312,572 |
1,460,006 |
1,406,423 |
1,148,735 |
1,494,000 |
1,623,545 |
|
Guanaceví |
718,797 |
768,905 |
1,195,753 |
1,335,742 |
1,271,679 |
1,041,211 |
1,352,423 |
1,439,924 |
|
Bolañitos |
105,732 |
105,812 |
116,819 |
124,263 |
134,744 |
107,524 |
141,577 |
183,621 |
|
Silver grade |
179 |
176 |
208 |
229 |
233 |
183 |
226 |
279 |
|
Guanaceví |
440 |
402 |
364 |
402 |
419 |
341 |
398 |
511 |
|
Bolañitos |
36 |
36 |
41 |
42 |
45 |
37 |
45 |
61 |
|
Silver recovery |
86.3 |
88.2 |
89.7 |
89.5 |
85.1 |
90.9 |
90.1 |
85.7 |
|
Guanaceví |
86.4 |
88.7 |
90.4 |
89.9 |
85.2 |
91.9 |
90.4 |
85.6 |
|
Bolañitos |
85.5 |
84.7 |
83.4 |
86.2 |
84.8 |
82.6 |
87.6 |
86.1 |
|
Gold ounces |
9,075 |
9,290 |
10,550 |
10,133 |
9,608 |
9,089 |
9,819 |
9,342 |
|
Guanaceví |
2,622 |
2,828 |
4,243 |
4,124 |
3,721 |
3,161 |
3,885 |
4,188 |
|
Bolañitos |
6,453 |
6,462 |
6,306 |
6,010 |
5,887 |
5,928 |
5,934 |
5,154 |
|
Gold grade |
1.80 |
1.79 |
1.67 |
1.58 |
1.53 |
1.48 |
1.47 |
1.56 |
|
Guanaceví |
1.53 |
1.46 |
1.29 |
1.25 |
1.20 |
1.03 |
1.10 |
1.42 |
|
Bolañitos |
1.95 |
2.00 |
2.06 |
1.94 |
1.86 |
1.89 |
1.85 |
1.70 |
|
Gold recovery |
94.7 |
92.1 |
89.9 |
89.8 |
88.7 |
89.4 |
91.1 |
88.0 |
|
Guanaceví |
90.7 |
89.8 |
90.4 |
89.2 |
87.0 |
92.4 |
94.0 |
89.6 |
|
Bolañitos |
96.4 |
93.1 |
89.6 |
90.2 |
89.8 |
87.9 |
89.3 |
86.8 |
|
Cash costs per oz (1) |
$13.68 |
$11.35 |
$13.43 |
$13.19 |
$12.54 |
$17.94 |
$13.52 |
$11.12 |
|
Guanaceví |
$20.25 |
$19.59 |
$17.17 |
$15.94 |
$14.95 |
$20.47 |
$14.53 |
$12.25 |
|
Bolañitos |
($33.11) |
($51.38) |
($26.67) |
($17.69) |
($11.23) |
($7.68) |
$3.34 |
$1.67 |
|
AISC per oz (1) |
$27.33 |
$25.82 |
$23.13 |
$21.44 |
$21.48 |
$29.64 |
$22.15 |
$20.16 |
|
Guanaceví |
$32.40 |
$30.83 |
$24.53 |
$21.96 |
$21.50 |
$29.06 |
$20.81 |
$19.28 |
|
Bolañitos |
($8.78) |
($12.31) |
$8.15 |
$15.59 |
$21.27 |
$35.54 |
$35.64 |
$27.45 |
|
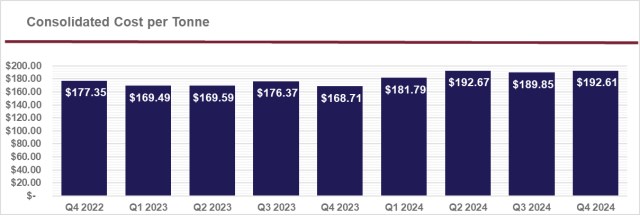
Direct costs per tonne (1) |
$209.49 |
$189.85 |
$192.68 |
$181.77 |
$168.71 |
$176.37 |
$169.59 |
$169.49 |
|
Guanaceví |
$365.23 |
$330.55 |
$269.36 |
$260.13 |
$239.76 |
$264.10 |
$232.58 |
$251.83 |
|
Bolañitos |
$123.73 |
$102.42 |
$111.07 |
$97.39 |
$96.94 |
$94.63 |
$103.64 |
$91.84 |
(1) Cash cost per oz, AISC per oz and direct costs per tonne are non-IFRS measures.
Key Economic Trends
Precious Metal Price Trends
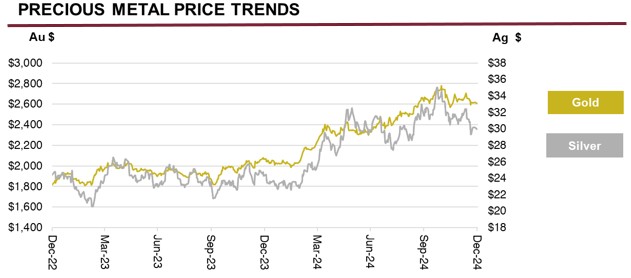
The prices of silver and gold are a critical factor in determining profitability and cash flow from operations. The financial performance of the Company has been, and is expected to continue to be, closely linked to the prices of silver and gold.
During the year ended December 31, 2024, the average price of silver was $28.24 per ounce, with silver trading between $22.09 and $34.51 per oz based on the London Fix silver price. This compares to an average of $23.35 per oz for the year ended December 31, 2023, with a low of $20.09 and a high of $26.03 per oz. For the year ended December 31, 2024, the Company realized an average price of $27.39 per silver oz compared with $23.76 for the year ended December 31, 2023.
During the year ended December 31, 2024, the average price of gold was $2,385 per oz, with gold trading between $1,985 and $2,778 per oz based on the London Fix PM gold price. This compares to an average of $1,941 per oz for the year ended December 31, 2023, with a low of $1,811 and a high of $2,078 per oz. For the year ended December 31, 2024, the Company realized an average price of $2,397 per oz compared with $1,968 for the year ended December 31, 2023.
Several factors drove the largest annual rise in gold price since 2010. Global tensions, including conflicts in Ukraine and the Middle East, expectation of slower economic growth, concerns over U.S. trade policies, and tariffs pushed investors and central banks toward gold to diversify away from the U.S. dollar and fiat currencies. These dynamics propelled gold to record highs, with prices reaching an all-time peak of $2,778 per ounce in October 2024, and in early 2025 above $2,900. Silver has historically followed the price movement in gold and we expect this correlation to continue. Beyond the safe haven characteristic of silver, we’ve seen a growing sense of optimism in the silver market, driven by industrial demand and supply constraints. The global push towards electrification, renewable energy, and electric vehicles (EVs), is expected to increase the demand for silver in industrial applications. Silver plays an indispensable role in solar panels, batteries, and other key technologies, positioning it as a strategic metal in the clean energy transition. Over this same period of industrial demand growth, the silver market has faced supply-demand deficits in recent years, with exploration, new discoveries and new production not keeping pace with mine depreciation. A lack of new major projects coming online, is creating a supply-demand imbalance that has supported the rise of silver price since the beginning of 2023.
Currency Fluctuations
The Company's operations are located in Mexico and therefore a significant portion of operating costs and capital expenditures are denominated in Mexican pesos. The Company's corporate activities are based in Vancouver, Canada with the significant portion of these expenditures being denominated in Canadian dollars.
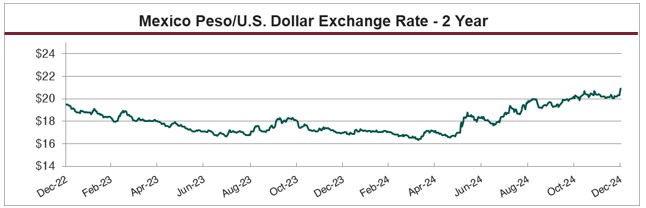
During the year ended December 31, 2024, the Mexican peso weakened against the U.S. dollar. The average foreign exchange rate was $18.09 Mexican pesos per U.S. dollar, with the peso trading within a range of $16.34 to $20.88. This compares to an average of $17.73, with a range of $16.67 to $19.48 Mexican pesos per U.S. dollar during the year ended December 31, 2023.
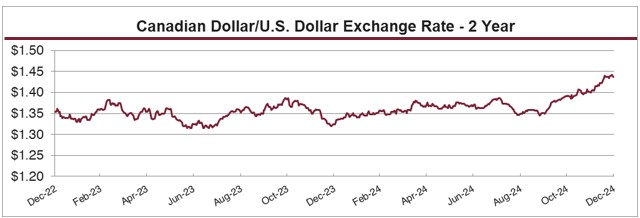
During the year ended December 31, 2024, the Canadian dollar weakened against the U.S. dollar. The average foreign exchange rate was $1.369 Canadian dollars per U.S. dollar, with the Canadian dollar trading within a range of $1.325 to $1.441. This compares to an average of $1.349 with a range of $1.315 to $1.387 Canadian dollars per U.S. dollar for 2023.
Cost Trends
The Company’s profitability is subject to industry-wide cost pressures on development and operating costs with respect to labour, energy, consumables and capital expenditures. Underground mining is labour intensive and approximately 33% of the Company’s production costs are directly tied to labour. In order to mitigate the impact of higher labour and consumable costs, the Company focuses on continuous improvement by promoting more efficient use of materials and supplies and by pursuing more advantageous pricing while increasing performance and without compromising operational integrity. During 2023, mining, processing and indirect costs all increased due to inflationary and industry cost pressures. During Q4, 2023 the cost per tonne was impacted by royalties recognized upon sale of higher than usual finished goods inventory that had been held during Q2 and Q3 of 2023. During the year ended December 31, 2024, costs have continued to be impacted by inflationary and industry costs pressures offset by downward pressure from a weaker Mexican peso. From December 31, 2023 to December 31, 2024, the Mexico peso has depreciated by approximately 19%.
ANNUAL OUTLOOK
2025 Production and Cost Guidance
In 2025, silver production is expected to range from 4.5 to 5.2 million oz and gold production is expected to be between 30,500 to 34,000 oz. bringing total silver equivalent production to between 7.0 and 7.9 million oz using an 80:1 silver:gold ratio.
|
|
|
Guanaceví |
Bolañitos |
Consolidated |
|
Tonnes per day |
Tpd |
1,000 - 1,100 |
1,100 - 1,200 |
2,100 - 2,300 |
|
Silver production |
M oz |
3.9 - 4.4 |
0.6 - 0.8 |
4.5 - 5.2 |
|
Gold production |
k oz |
11.0 - 13.5 |
19.5 - 20.5 |
30.5 - 34.0 |
|
Silver Eq production1 |
M oz |
4.8 - 5.5 |
2.2 - 2.4 |
7.0 - 7.9 |
(1) Silver equivalent production is calculated using an 80:1 silver:gold ratio.
Consolidated cash costs and AISC for Guanaceví and Bolañitos in 2025 are estimated to be $16.00-$17.00 per oz silver and $25.00-26.00 per oz silver, respectively, net of gold by-product credits. Consolidated cash costs (excluding Terronera) on a per ounce basis are expected to be higher in 2025 compared to 2024, primarily due to lower silver production from these mines as they enter their final years of production, and a lower estimated gold price. AISC are expected to be slightly higher in 2025 than realized in 2024 as higher levels of sustaining capital will be required with costs being borne by lower silver production.
|
|
Guanaceví & Bolañitos |
|
|
Cash costs, net of gold by-product credits1 |
$/oz |
$16.00 - $17.00 |
|
AISC, net of gold by-product credits1 |
$/oz |
$25.00 - $26.00 |
|
Sustaining capital1 budget |
$M |
$33.6 |
|
Exploration & Corporate capital budget |
$M |
$2.6 |
(1) Non-IFRS measure. For a description of how these measures are calculated and a reconciliation of these measures to the most directly comparable measures specified, defined or determined under IFRS and presented in the Company's financial statements, refer to "Non-IFRS Measures".
Operating mines
At Guanaceví, 2025 plant throughput is estimated to range from 1,000 tonnes per day (tpd) to 1,100 tpd and average 1,060 tpd with material mined mainly from the Porvenir Cuatro extension on the El Curso concessions. The El Curso concessions were leased from a third party with no upfront costs, but with significant royalty payments on production. Mine grades in 2025 are expected to be slightly lower and recoveries are expected to be similar to 2024. Cash costs per ounce, AISC per ounce and direct costs on a per tonne basis are expected to be slightly higher in 2025 compared to 2024 due to the lower metal production and lower gold by-product credits from the lower gold price estimate.
In 2025, plant throughput at Bolañitos is expected to range from 1,100 tpd to 1,200 tpd and average 1,170 tpd, sourcing material from the Plateros-La Luz, Lucero-Karina and Bolañitos-San Miguel vein systems. Mine grades are expected to be higher for silver and lower for gold and recoveries are expected to be similar to 2024. Cash costs per oz, AISC and direct costs on a per tonne basis are expected to be higher in 2025 compared to 2024 due to lower gold by-product credits driven by the lower gold price estimate.
Consolidated Operating Costs
Direct operating costs per tonne are estimated to be $130-$140. Direct costs, which include royalties and special mining duties, and take account of the impact of the higher Mexico mining taxes enacted at the start of 2025, are estimated to be in the range of $175-$185 per tonne.
Management made the following assumptions in calculating its 2025 cost forecasts: $27.50 per oz silver price, $2,200 per oz gold price, 18:1 Mexican peso per US dollar exchange rate, and a 4% Mexican annual inflation rate.
2025 Planned Capital Expenditures
|
|
Sustaining Mine Development |
Sustaining Other |
Total Sustaining |
Growth |
Total |
|
Guanaceví |
$12.7 million |
$6.6 million |
$19.3 million |
- |
$19.3 million |
|
Bolañitos |
$9.7 million |
$4.6 million |
$14.3 million |
- |
$14.3 million |
|
Pitarrilla |
- |
- |
- |
$9.1 million |
$9.1 million |
|
Exploration |
- |
- |
- |
$2.4 million |
$2.4 million |
|
Corporate |
- |
- |
- |
$0.2 million |
$0.2 million |
|
Total |
$22.4 million |
$11.2 million |
$33.6 million |
$11.7 million |
$45.3 million |
Sustaining Capital Investments
In 2025, Endeavour plans to invest $33.6 million in sustaining capital at its two operating mines. At assumed metal prices, the sustaining capital investments are expected to be paid out of operating cash flow.
At Guanaceví, $19.3 million will be invested in capital projects, the largest of which is 5.3 kilometres of mine development at El Curso and Milache for an estimated $12.7 million. An additional $2.8 million will be invested in mine infrastructure and equipment. A further $1.8 million will be invested in the plant and tailings storage facility, including further work on the tailing facility expansion. The remaining $2.0 million will be spent on various surface infrastructure or equipment.
At Bolañitos, $14.3 million will be invested in capital projects, including $9.7 million for 6.7 kilometres of mine development to access resources in the Plateros-La Luz, Lucero-Karina, and Bolañitos-San Miguel areas. An additional $4.6 million will go to upgrade the mining fleet, plant improvements and to support site infrastructure.
The Company also plans to spend $2.6 million to maintain exploration concessions, acquire mobile exploration equipment and cover corporate infrastructure.
Pitarrilla
The Company plans to advance the Pitarrilla project in 2025, with estimated costs of $25.7 million composed of $16.6 million for feasibility study, development and exploration work, and $9.1 million of capital spending. The capital spending includes $6.0 million of buildings, right of way costs, and surface infrastructure; $2.2 million of mine infrastructure including a ventilation system; and $0.9 million of mobile equipment. The Company plans to complete 14,000 m of drilling and 600 m of ramp development at Pitarrilla in 2025 as it focuses on this project and advances towards construction.
2025 Planned Exploration
|
Project |
Activity |
Drill Metres |
Expenditures |
|
Guanaceví |
Drilling |
6,000 |
$1.0 million |
|
Bolañitos |
Drilling |
8,000 |
$1.4 million |
|
Terronera |
Drilling |
4,000 |
$1.0 million |
|
Chile |
Drilling |
2,500 |
$1.6 million |
|
Parral |
Economic Studies |
- |
$0.8 million |
|
Baxter |
Targeting |
- |
$0.5 million |
|
Other |
Evaluation |
- |
$0.2 million |
|
Total |
|
20,500 |
$6.5 million |
In 2025, the Company plans to spend $6.5 million drilling 20,500 metres across its properties, with the majority of the budget allocated towards additional drilling at the operating sites. At the Guanaceví and Bolañitos mines, 14,000 metres of drilling are planned at a cost of $2.4 million to replace reserves and expand resources. At Terronera, 4,000 meters of drilling are planned at a cost of $1 million, mainly focused on infill drilling at La Luz and Los Cuates veins. In Chile, management intends to spend $1.6 million towards 2,500 drilling meters at the Aida project, focusing on the Mina Vieja and Estrella veins, with some minor surface drilling at Constanza. At the Parral project in Chihuahua state, the Company has allocated $0.8 million towards economic studies and maintenance costs. At the Baxter project in Nevada, USA management plans to invest $0.5 million to map and sample new targets with a small component related to engineering work.
LIQUIDITY AND CAPITAL RESOURCES
The Company has historically funded its acquisition, exploration and development activities through equity financings, debt facilities and convertible debentures. In recent years, the Company has financed most of its acquisition, exploration, development and operating activities from production cash flows, treasury, equity financings and debt. The Company may choose to undertake equity, debt, convertible debt or other financings, on an as-needed basis, in order to facilitate its growth.
Management of the Company believes that operating cash flow and existing working capital will be sufficient to cover 2025 capital requirements and meet its short-term obligations. The Company continues to assess financing alternatives, including equity or debt or a combination of both, to fund future growth, including the development of the Terronera Project.
| Expressed in thousands US dollars | As at December 31, 2024 | As at December 31, 2023 | ||||
| Current assets | $157,647 | $100,773 | ||||
| Current liabilities | 78,866 | 58,244 | ||||
| Working capital | $78,781 | $42,529 |
As at December 31, 2024, the Company had working capital of $78.8 million (December 31, 2023 - $42.5 million). The $36.3 million increase in working capital was caused primarily by a $71.1 million increase in cash and cash equivalents, $8.8 million increase in inventories, offset by $4.1 million decrease in other investments, $3.1 million decrease in tax receivable, $3.9 million decrease in prepaids, $7.4 million increase in accounts payable accrued liabilities and other current liabilities, $1.6 million increase in income taxes payable, and $1.4 million increase in current loans payable.
Cash flow provided by operating activities
During Q4 2024, operating activities used cash flow of $4.9 million compared to the generation of cash flow of $6.7 million in Q4 2023. For the majority of Q4 2024, the Guanaceví plant was operating at approximately 45% capacity, significantly impacting net cash flows. Cash flow provided by operations before working capital was $5.8 million in Q4 2024, compared to $9.8 million in Q4 2023. During Q4 2024 the Company has paid $0.2 million in income taxes compared to $1.4 million paid during Q4 2023, due to the tax payable on disposal of Cozamin Royalty in 2023 and the differences in annual tax payment instalments.
Operating activities provided $19.1 million during the year ended December 31, 2024, compared to $11.8 million in 2023, a 62% increase driven by higher realized silver and gold sales prices, offset by the lower volume of ounces sold and higher operating costs and reduction in non-cash working capital.
Cash flow used by investing activities
During Q4 2024, investing activities used net cash of $43.8 million compared to $40.6 million in Q4 2023. This is driven by the construction spending at the Terronera Project totaling $44.0 million in Q4 2024 compared to $27.0 million in Q4 2023. In Q4 2024, the Company also benefited from cash interest income of $1.8 million on cash balances held, and IVA refunds in Mexico.
During the year ended December 31, 2024, investing activities used net cash of $183.5 million, compared to using net cash of $108.0 million in 2023. Capital investments totaled $195.4 million in property, plant and equipment during the year ended December 31, 2024, net of $13.5 million in changes in working capital items and deposits used for purchases of equipment for Terronera, compared to capital investments totaling $117.8 million in 2023. The capital investments were primarily for sustaining capital at existing operations and for development capital at the Terronera Project. In 2023 the Company received $7.6 million on the disposition of property, plant and equipment, primarily on the disposal of the Cozamin royalty, compared to $0.1 million proceeds on normal course equipment disposals received in 2024. The Company also received $3.3 million on the disposal of marketable security investments in 2024, compared to $2.5 million in 2023.
At Guanaceví, the Company invested $22.9 million, with $14.1 million spent on 3.0 km of mine development and underground infrastructure and $6.7 million on mobile equipment. The Company continued to invest on upgrades for the plant and surrounding infrastructure, including $0.9 million on building and $1.3 million on plant upgrades, mine site improvements and the tailing facility and $0.5 million on office, building infrastructure and light vehicles.
At Bolañitos, the Company invested $7.9 million, with $6.2 million spent on 4.6 km of mine development and $1.4 million on mobile equipment. The Company continued to invest in upgrades for the plant and surrounding infrastructure, including $0.3 million on plant upgrades.
At Terronera, the Company invested $189.9 million, with $96.9 million spent on land payments, surface and mine development and infrastructure, $58.6 million was invested in plant, $9.7 million spent on buildings, $23.3 million was invested in mine equipment and $1.4 million on light vehicles, office and IT infrastructure. An additional $5.4 million was invested in changes in working capital items and deposits used for purchases of equipment not yet delivered, and accounts payable for equipment delivered.
Exploration and general and administrative investments were $1.6 million spent on holding costs, mobile equipment, office, building infrastructure and light vehicles.
Cash flow provided by financing activities
During Q4 2024, financing activities provided $101.2 million compared to $29.7 million in Q4 2023. During Q4, 2024, the Company completed a bought deal equity offering which raised net cash proceeds of $68.6 million, drew down to the final $35 million on the Debt Facility and paid $2.3 million in interest. During Q4 2023, $38.0 million was raised through "At-The-Market" ("ATM") equity offerings, but also $7.5 million in deferred financing fees were incurred, relating to setting up the Debt Facility.
For the year ended December 31, 2024, financing activities provided $236.0 million, compared to providing $48.1 million in 2023. During the year ended December 31, 2024 the Company received $122.4 million from public equity offerings of shares, paid $1.7 million in deferred financing fees related to the Debt Facility, received $4.0 million on the exercise of employee stock options, paid $8.6 million in interest and principal repayments on loans and leases, and received $120 million from the Debt Facility. By comparison, in 2023, the Company received $60.7 million from public equity offerings of shares, paid $7.5 million in deferred financing fees related to the Debt Facility, received $2.5 million on the exercise of employee stock options, paid $7.2 million in interest and principal repayments on loans and leases, received $0.8 million in loan payments and paid $0.3 million in withholding taxes on equity settled performance share units ("PSU's").
Equity financings
On December 18, 2023, the Company entered into an ATM equity facility (the "December 2023 ATM Facility"). Under the terms of the December 2023 ATM Facility, the Company can, from time to time, sell common stock having an aggregate offering value of up to $60.0 million on the New York Stock Exchange. The Company determines, at its sole discretion, the timing and number of shares to be sold under the ATM Facility. During the year ended December 31, 2024, the Company issued 27,540,971 common shares under the December 2023 ATM Facility at an average price of $2.00 per share for gross proceeds of $55.2 million, less commission of $1.1 million and recognized $0.3 million of other transaction costs related to the ATM financing as share issuance costs.
On November 21, 2024, the Company filed a prospectus supplement to the Company’s base Shelf prospectus dated June 2023 for the distribution of 15,825,000 common shares at a price of $4.60 per share (the ”November 2024 Financing”). The shares were issued and sold pursuant to an underwriting agreement between the Company and BMO Nesbitt Burns Inc. (the lead underwriter), CIBC World Markets Inc., TD Securities Inc., Ventum Financial Corp. and H.C. Wainwright & Co., LLC. On November 27, 2024, the Company completed the November 2024 Financing for gross proceeds of $72.8 million, less commission of $3.9 million and recognized $0.4 million of other transaction costs related to the financing as share issuance costs.
For the December 2023 ATM Facility, the net proceeds as at December 31, 2024 were used as follows:
| Use of proceeds (thousands) | |||
| Net proceeds received | $ | 58,263 | |
| Terronera Construction | (56,041 | ) | |
| Pitarrilla exploration | (2,222 | ) | |
| Allocated to working capital | $ | - |
For the November 2024 Financing, the net proceeds as at December 31, 2024 have been used as follows:
| Use of proceeds (thousands) | |||
| Net proceeds received | $ | 68,582 | |
| Advancing Pitarrilla project | 770 | ||
| Allocated to working capital | $ | 67,812 |
The Debt Facility includes certain restrictive covenants with respect to the use of the loan proceeds, including restrictions on transferring funds out of the Terronera entity. These restrictions are not expected to have any impact on the Company's ability to meet its obligations.
Contingencies
Minera Santa Cruz y Garibaldi S.A. de C.V. (“MSCG”), a subsidiary of the Company, received an MXN 238 million assessment on October 12, 2010 by Mexican fiscal authorities for failure to provide the appropriate support for certain expense deductions taken in MSCG’s 2006 tax return, failure to provide appropriate support for loans made to MSCG from affiliated companies, and deemed an unrecorded distribution of dividends to shareholders, among other individually immaterial items. MSCG immediately initiated a Nullity action and filed an administrative attachment to dispute the assessment.
In June 2015, the Superior Court ruled in favour of MSCG on a number of the matters under appeal; however, the Superior Court ruled against MSCG for failure to provide appropriate support for certain deductions taken in MSCG’s 2006 tax return. In June 2016, the Company received an MXN 122.9 million ($6.1 million) tax assessment based on the June 2015 ruling (the “2016 Assessment”). The 2016 Assessment comprised of MXN 41.8 million owed ($2.1 million) in taxes, MXN 17.7 million ($0.9 million) in inflationary charges, MXN 40.4 million ($2.0 million) in interest and MXN 23.0 million ($1.1 million) in penalties. The 2016 Assessment was issued for failure to provide the appropriate support for certain expense deductions taken in MSCG’s 2006 tax return and failure to provide appropriate support for loans made to MSCG from affiliated companies. The 2016 Assessment includes interest and penalties.
The Company filed an appeal against the 2016 Assessment on the basis that certain items rejected by the courts were included in the new tax assessment, and a number of deficiencies exist within the assessment. Since the issuance of the 2016 Assessment, interest charges of MXN 22.1 million ($1.1 million) and inflationary charges of MXN 33.1 million ($1.6 million) have accumulated.
Included in the Company’s consolidated financial statements are net assets of $1.0 million held by MSCG. Following the Tax Court’s rulings, MSCG is in discussions with the tax authorities with regards to the shortfall of assets within MSCG to settle its estimated tax liability. An alternative settlement option would be to transfer the shares and assets of MSCG to the tax authorities. As of December 31, 2024, the Company’s income tax payable includes an allowance for transferring the shares and assets of MSCG amounting to $1.0 million. The Company is currently assessing MSCG’s settlement options based on ongoing court proceedings and discussion with the tax authorities. The Company has been advised that the appeal filed with the Federal Tax Court, against the June 2016 tax assessment has been rejected. The Company continues to assess MSCG’s settlement options.
Cubo, a subsidiary of the Company, received an MXN 58.5 million ($2.9 million) assessment in 2019 by Mexican fiscal authorities (the “Cubo Assessment”) for alleged failure to provide the appropriate support for depreciation deductions taken in the Cubo 2016 tax return and denied eligibility of deductions of certain suppliers. The Cubo Assessment consisted of MXN 24.1 million ($1.2 million) for taxes, MXN 21.0 million ($1.0 million) for penalties, MXN 10.4 million ($0.5 million) for interest and MXN 3.0 million ($0.1 million) for inflation. At the time of the Cubo Assessment the Cubo entity had and continues to have sufficient loss carry forwards which would be applied against the assessed difference of taxable income. The Mexican tax authorities did not consider these losses in the assessment.
Due to the denial of certain suppliers for income tax purposes in the Cubo Assessment, the invoices from these suppliers have been assessed as ineligible for refunds of IVA paid on the invoices. The Cubo Assessment includes MXN 14.7 million ($0.7 million) for re-payment of IVA (value added taxes) refunded on these supplier payments. In the Company’s judgement the suppliers and invoices meet the necessary requirements to be deductible for income tax purposes and the recovery of IVA.
The Company has filed an administrative appeal related to the Cubo Assessment. The Company had previously provided a lien on certain El Cubo mining concessions during the appeal process. To facilitate the sale of the El Cubo mine and related assets, the Company elected to pay the assessed amount of $3.5 million during Q1, 2021. During the appeal process the amount paid has been classified as a non-current income tax receivable. As of December 31, 2024, the amount receivable is $3.6 million. Since the issuance of the Cubo Assessment, interest charges of MXN 9.9 million ($0.5 million) and inflationary charges of MXN 1.6 million ($0.1 million) had accumulated. The Company continues to assess that it is probable that its appeal will prevail, and no provision is recognized in respect of the Cubo Assessment.
The Company is required to use judgement to determine certain tax treatments in calculating income tax expense and IVA recoverable. A number of these judgements are subject to various uncertainties. From time to time, Mexican authorities may apply, re-interpret legislation or disregard precedents and it is possible that these uncertainties may be resolved unfavorably for the Company.
Capital Requirements
As of December 31, 2024, the Company held $106.4 million in cash and $78.8 million in working capital.
The Company may be required to raise additional funds through future debt or equity financings in order to carry out other business plans. As at December 31, 2024, the Company has invested more than $302 million of the total $332 million required to build Terronera. The remaining amount including any cost overrun funding will be funded during 2025 using existing cash on hand. The Company will continue to monitor capital markets, economic conditions and assess its short term and long-term capital needs.
Contractual Obligations
The Company had the following undiscounted contractual obligations at December 31, 2024:
| Payments due by period (in thousands of US dollars) | |||||||||||||||
| Contractual Obligations |
Total | Less than 1 year |
1 - 3 years | 3 - 5 years | More than 5 years |
||||||||||
| Capital asset purchases | $ | 24,753 | $ | 24,753 | $ | - | $ | - | $ | - | |||||
| Loans payable | 167,897 | 16,880 | 71,122 | 72,833 | 7,062 | ||||||||||
| Lease liabilities | 627 | 203 | 328 | 96 | - | ||||||||||
| Other contracts | 439 | 135 | 235 | 69 | - | ||||||||||
| Reclamation obligations | 15,455 | - | 3,199 | 7,093 | 5,163 | ||||||||||
| Total | $ | 209,171 | $ | 41,971 | $ | 74,884 | $ | 80,091 | $ | 12,225 | |||||
TRANSACTIONS WITH RELATED PARTIES
The Company was charged $0.3 million for legal services for the year ended December 31, 2024 by a legal firm in which the Company’s former corporate secretary is a partner (December 31, 2023 - $0.6 million). As of December 31, 2024, the legal firm is no longer a related party of the Company, and the Company has no outstanding related party payable outstanding.
FINANCIAL INSTRUMENTS AND FAIR VALUE MEASUREMENTS
As at December 31, 2024, the carrying and fair values of the Company's financial instruments by category were as follows:
| As at December 31, 2024 | As at December 31, 2023 | |||||||||||
| Expressed in thousands of US dollars | Carrying value | Estimated Fair value | Carrying value | Estimated Fair value | ||||||||
| Financial assets: | ||||||||||||
| Cash and cash equivalents | $ | 106,434 | $ | 106,434 | $ | 35,286 | $ | 35,286 | ||||
| Other investments | 1,070 | 1,070 | 5,135 | 5,135 | ||||||||
| Trade and other receivables | 3,665 | 3,665 | 8,210 | 8,210 | ||||||||
| Loan receivable | 2,556 | 2,556 | 3,324 | 3,324 | ||||||||
| Total financial assets | $ | 113,725 | $ | 113,725 | $ | 51,955 | $ | 51,955 | ||||
| Financial liabilities: | ||||||||||||
| Accounts payable, accrued liabilities and other current liabilities | $ | 53,943 | $ | 53,943 | $ | 46,146 | $ | 46,146 | ||||
| Derivative liabilities | 26,859 | 26,859 | - | - | ||||||||
| Loans payable | 120,236 | 120,236 | 8,519 | 8,519 | ||||||||
| Total financial liabilities | $ | 201,038 | $ | 201,038 | $ | 54,665 | $ | 54,665 | ||||
Fair value hierarchy
Fair value is the price that would be received to sell an asset or paid to transfer a liability in an orderly transaction between market participants at the measurement date. The fair value hierarchy establishes three levels to classify the inputs to valuation techniques used to measure fair value. Level 1 inputs are quoted prices (unadjusted) in active markets for identical assets or liabilities. Level 2 inputs are quoted prices in markets that are not active, quoted prices for similar assets or liabilities in active markets, inputs other than quoted prices that are observable for the asset or liability (for example, interest rate and yield curves observable at commonly quoted intervals, forward pricing curves used to value currency and commodity contracts and volatility measurements used to value option contracts), or inputs that are derived principally from or corroborated by observable market data or other means. Level 3 inputs are unobservable (supported by no or little market activity). The fair value hierarchy gives the highest priority to Level 1 inputs and the lowest priority to Level 3 inputs.
Assets and liabilities as at December 31, 2024 that measured at fair value on a recurring basis include:
| As at December 31, 2024 | ||||||||||||
| Expressed in thousands of US dollars | Total | Level 1 | Level 2 | Level 3 | ||||||||
| Assets: | ||||||||||||
| Other investments | $ | 1,070 | $ | 1,050 | $ | - | $ | 20 | ||||
| Trade receivables | 3,310 | - | 3,310 | - | ||||||||
| Total financial assets | $ | 4,380 | $ | 1,050 | $ | 3,310 | $ | 20 | ||||
| Liabilities: | ||||||||||||
| Cash-settled deferred share units | $ | 3,829 | $ | 3,829 | - | $ | - | |||||
| Share appreciation rights |
23 | - | 23 | - | ||||||||
| Derivative liability | 26,859 | - | 26,859 | - | ||||||||
| Total financial liabilities | $ | 30,711 | $ | 3,829 | $ | 26,882 | $ | - | ||||
Other investments
The Company holds marketable securities classified as Level 1 and Level 3 in the fair value hierarchy. The fair values of Level 1 investments are determined based on a market approach reflecting the closing price of each particular security at the reporting date. The closing price is a quoted market price obtained from the stock exchange that is the principal active market for the particular security, being the market with the greatest volume and level of activity for the assets. For Level 3 investments, which consist of share purchase warrants where inputs are not observable, they have an estimated value determined by using an option pricing model. Changes in fair value on available for sale marketable securities are recognized in earnings or loss.
Trade receivables
The trade receivables consist of receivables from provisional silver and gold sales from the Bolañitos mine. The fair value of receivables arising from concentrate sales contracts that contain provisional pricing mechanisms is determined using the appropriate quoted closing price on the measurement date from the exchange that is the principal active market for the particular metal. As such, these receivables, which meet the definition of an embedded derivative, are classified within Level 2 of the fair value hierarchy.
Deferred share units
The Company has a cash settled DSU plan whereby DSUs may be granted to independent directors of the Company in lieu of compensation in cash or stock options. The DSUs vest immediately and are redeemable for cash based on the market value of the units at the time of a director's retirement. The DSUs are classified as Level 1 in the fair value hierarchy. The liability is determined based on a market approach reflecting the closing price of the Company's common shares at the reporting date. Changes in fair value are recognized in general and administrative expenses.
Share appreciation rights
As part of the Company's bonus program, the Company has granted share appreciation rights ("SARs") to its employees in Mexico. The SARs are subject to vesting conditions and, when exercised, constitute a cash bonus based on the value of the appreciation of the Company's common shares between the SARs grant date and the exercise date. The SARs are classified as Level 2 in the fair value hierarchy. The liability is valued using a Black-Scholes option pricing model. Changes in fair value are recognized in salaries, wages and benefits.
Financial Instrument Risk Exposure and Risk Management
The Company is exposed to a variety of financial instrument related risks. The Board of Directors (the "Board") approves and monitors the risk management process. The types of risk exposure and the way in which such exposure is managed is provided as follows:
Credit Risk
The Company is exposed to credit risk on its bank accounts, accounts receivable and loan receivable. Credit risk exposure on bank accounts is limited through maintaining the Company's balances with high-credit quality financial institutions, maintaining investment policies, assessing institutional exposure and continual discussion with external advisors. Value-added tax receivables are generated on the purchase of supplies and services to produce silver, which are refundable from the Mexican government. Trade receivables are generated on the sale of concentrate inventory to reputable metal traders. The loan receivable is related to the remaining proceeds for the sale of the El Compas mine to Grupo ROSGO. There has been no indication of a change in the creditworthiness of the counterparty to the loan receivable since the initial recognition.
Liquidity Risk
Liquidity risk is the risk that the Company will not be able to meet its financial obligations as they come due. The Company manages its liquidity risk by continually monitoring forecasted and actual cash flows. The Company has in place a planning and budgeting process to help determine the funds required to support its normal operating requirement and development plans. The Company aims to maintain sufficient liquidity to meet its short-term business requirements, taking into account its anticipated cash flows from operations, its holdings of cash and cash equivalents, and its committed and anticipated liabilities.
The Company's Mexican subsidiaries pay IVA on the purchase and sale of goods and services. The net amount paid is recoverable but is subject to review and assessment by the tax authorities. The Company regularly files the required IVA returns and all supporting documentation with the tax authorities, however, the Company has been advised that certain IVA amounts receivable from the tax authorities are being withheld pending completion of the authorities' audit of certain of the Company's third-party suppliers. Under Mexican law, the Company has legal rights to those IVA refunds and the results of the third-party audits should have no impact on refunds. A smaller portion of IVA refund requests are from time to time denied based on the alleged lack of compliance of certain formal requirements and information returns by the Company's third-party suppliers. The Company takes necessary legal action on the delayed refunds as well as any denied refunds. The Company is in regular contact with the tax authorities in respect of its IVA filings and believes that the full amount of its IVA receivables will ultimately be received; however, the timing of recovery of these amounts and the nature and extent of any adjustments to the Company's IVA receivables remains uncertain.
Market Risk
The significant market risk exposures to which the Company is exposed are foreign currency risk, interest rate risk, and commodity price risk.
Foreign Currency Risk – The Company’s operations in Mexico and Canada make it subject to foreign currency fluctuations. Certain of the Company’s operating expenses are incurred in Mexican pesos and Canadian dollars; therefore, the fluctuation of the U.S. dollar in relation to these currencies will consequently have an impact upon the profitability of the Company and may also affect the value of the Company’s assets and the amount of shareholders’ equity. In connection with the Debt Facility the Company was required to hedge a portion of the estimated remaining capital expenditures incurred in Mexican pesos, and hedge a portion of expected operating costs during the first two years of operations. During the year ended December 31, 2024, the Company entered into Mexican peso forward purchase contracts for a total of approximately $94.8 million with an average base price of 18.90 pesos per US dollar.
During the year ended December 31, 2024, the Company executed $45.9 million of Mexican peso forward contracts and realized $3.7 million of losses related to settlement of those contracts.
As at December 31, 2024, of the Mexican peso forward contracts $48.9 million remains outstanding, with an average base price of 20.89 pesos per US dollar. As at December 31, 2024, the Company has revalued remaining outstanding Mexican peso forward contracts to their respective fair values and as a result recorded a loss of $2.2 million. As of December 31, 2024, the Company carries the Mexican peso forward contract current derivative liability of $1.2 million (December 31, 2023 – nil) and non-current derivative liability of $1.1 million (December 31, 2023 – nil).
Interest Rate Risk – The interest rate risk is the risk that the fair value or the future cash flows of a financial instrument will fluctuate because of changes in market interest rates. The interest rate on the Debt Facility is variable and based on the exposure as of December 31, 2024, a 1% change in interest rate would result in an increase or decrease of interest costs in the amount of $1.2 million per year. As of December 31, 2024, all of the Company’s outstanding equipment financing obligations bear interest at fixed rates and are therefore not exposed to changes in future cash flows attributable to changes in market interest rates.
The Company is exposed to interest rate risk on its cash and cash equivalents. The cash and cash equivalent interest earned is based on bank account interest rates which may fluctuate. Based on the exposure as of December 31, 2024, a 1% change in the interest rates would result in an increase or decrease of approximately $1.1 million in interest earned by the Company. The Company has not entered into any derivative contracts to manage the interest rate risk
Commodity Price Risk – Gold and silver prices have historically fluctuated significantly and are affected by numerous factors outside of the Company’s control, including, but not limited to, industrial and retail demand, central bank lending, forward sales by producers and speculators, levels of worldwide production, short-term changes in supply and demand because of speculative hedging activities and certain other factors.
In connection with the Debt Facility, on March 28, 2024, the Company entered into gold forward swap contracts (the “Swap Contracts”) to hedge against the fluctuation in gold prices. The Swap Contracts have been amended during the year to settle between February 2025 and May 2027, for 68,000 ounces of gold at revised forward price for those settlements between the $2,325 and $2,389 per oz. Subsequent to the period end on January 29, 2025, the Company amended the Swap Contracts, with updated settlements from June 2025 to October 2027 and revised forward price for those settlements of $2,329 per oz.
As at December 31, 2024, the Company has revalued the Swap Contracts to their respective fair values and as a result recorded loss of $24.6 million on the Swap Contracts. As of December 31, 2024, the Company carries the Swap Contracts liability of $24,618 (December 31, 2023 – nil) composed of $9,054 (December 31, 2023 – nil) in current derivative liability and $15.6 million (December 31, 2023 – nil) of non-current derivative liability.
At December 31, 2024, there are 15,964 oz of silver and 922 oz of gold, which do not have a final settlement price and the estimated revenues have been recognized at current market prices. As at December 31, 2024, with other variables unchanged, a 10% decrease in the market value of silver and gold would result in a reduction of revenue and the associated receivable of $0.3 million.
OUTSTANDING SHARE DATA
As of March 10, 2025, the Company had the following securities issued, issuable and outstanding:
As at December 31, 2024, the Company's issued share capital was $850.9 million (December 31, 2023 - $722.7 million), representing 262,323,863 common shares (December 31, 2023 - 217,245,492), and the Company had options outstanding to purchase 3,181,491 common shares (December 31, 2023 - 3,488,291) with a weighted average exercise price of CAD$4.13 (December 31, 2023 - CAD$4.24).
The Company considers the items included in the consolidated statement of shareholders' equity as capital. The Company's objective when managing capital is to safeguard its ability to continue as a going concern so that it can continue to provide returns for shareholders and benefits for other stakeholders. The Company manages the capital structure and makes adjustments to it in light of changes in economic conditions and the risk characteristics of the underlying assets. In order to maintain or adjust the capital structure, the Company may issue new shares through private placements, prospectus offerings, convertible debentures, asset acquisitions or return capital to shareholders. The Company is not subject to externally imposed capital requirements.
CHANGES IN ACCOUNTING POLICIES AND CRITICAL ACCOUNTING ESTIMATES
Accounting standards adopted during the period:
The Company has adopted the following new accounting standard and amendments to IFRS:
The Company applied Classification of Liabilities as Current or Non-current and Non-current Liabilities with Covenants – Amendments to IAS 1, issued in 2020 and 2022, for the first time in its 2024 condensed consolidated interim financial statements. The amendments clarify certain requirements for determining whether a liability is classified as current or non-current and require new disclosures in the annual financial statements for non-current liabilities that are subject to covenants within 12 months after the end of the reporting period. The adoption of the amendments did not result in any adjustment to the consolidated financial statements.
Critical Accounting Estimates
The preparation of financial statements requires the Company to make estimates that affect the reported amounts of assets and liabilities and disclosure of contingent assets and liabilities at the date of the financial statements and the reported amounts of revenues and expenses during the reporting period. Significant areas requiring the use of management's judgment relate to the determination of mineralized reserves and resources, plant and equipment lives, estimating the fair values of financial instruments and derivatives, impairment of non-current assets, reclamation and rehabilitation provisions, recognition of deferred tax assets, and assumptions used in determining the fair value of share-based compensation.
Determination of reserves and resources
Judgments about the amount of product that can be economically and legally extracted from the Company's properties are made by management using a range of geological, technical and economic factors, history of conversion of mineral deposits to proven and probable reserves as well as data regarding quantities, grades, production techniques, recovery rates, production costs, commodity prices and exchange rates. This process may require complex and difficult geological judgments to interpret the data. The Company uses qualified persons (as defined by NI 43-101) to compile this data.
Estimating the quantity and /or grade of reserves and resources requires the size, shape and depth of ore bodies or fields to be determined by analyzing geological data such as drilling samples. Following this, the quantity of reserves and resources that can be extracted in an economical manner is calculated using data regarding the life of mine plans and forecast sales prices (based on current and long-term historical average price trends). Changes in estimates can be the result of estimated future production differing from previous forecasts of future production, expansion of reserves and resources through exploration activities, differences between estimated and actual costs of mining and differences in the commodity price used in the estimation of reserves and resources.
The economic assumptions used to estimate mineral reserves may change from period to period and additional geological data is generated during the course of operations, which may change management’s judgments surrounding reserves and resources. Any changes in management’s judgements may impact the carrying value of mineral properties, plant and equipment, reclamation and rehabilitation provisions, recognition of deferred income tax amounts and depreciation.
Review of asset carrying values and assessment of impairment
Management applies significant judgment in assessing each CGU and assets for the existence of indicators of impairment or impairment reversal at the reporting date. Internal and external factors are considered in assessing whether indicators are present that would necessitate impairment testing. Significant assumptions regarding commodity prices, operating costs, capital expenditures and discount rates are used in determining whether there are any indicators of impairment. These assumptions are reviewed regularly by senior management and compared, when applicable, to relevant market consensus views.
If an indicator of impairment or reversal exists, the asset's recoverable amount is estimated. The recoverable amount is the greater of fair value less costs of disposal and value in use. The determination of fair value less costs of disposal and value in use requires management to make estimates and assumptions about expected production and sales volumes, metal prices, ore tonnage and grades, recoveries, operating costs, future capital expenditures and appropriate discount rates for future cash flows. The estimates and assumptions are subject to risk and uncertainty, and as such there is the possibility that changes in circumstances will alter these projections, which may impact the recoverable amount of the assets. In such circumstances, some or all of the carrying value of the assets may be further impaired or the impairment charge reduced with the impact recorded in profit or loss.
If an area of interest is abandoned or it is determined that its carrying value cannot be supported by future production or sale, the related costs are charged against operations in the period of abandonment or determination that the carrying value exceeds its fair value. The amounts recorded as mineral properties represent costs incurred to date and do not necessarily reflect present or future values.
Achievement of commercial production
Once a mine reaches the operating levels intended by management, depreciation of capitalized costs begins. Significant judgement is required to determine when certain of the Company's assets reach this level. Management considers several factors including: completion of a reasonable period of commissioning; consistent operating results achieved at a pre-determined level of design capacity and indications exist that this level will continue; mineral recoveries at or near expected levels; and the transfer of operations from development personnel to operational personnel has been completed.
Estimation of the amount and timing of reclamation and rehabilitation costs
Accounting for restoration requires management to make estimates of the future costs the Company will incur to complete the reclamation and rehabilitation work required to comply with existing laws, regulations and agreements in place at each mining operation and any environmental and social principles the Company is in compliance with. The calculation of the present value of these costs also includes assumptions regarding the timing of reclamation and rehabilitation work, applicable risk-free interest rates for discounting those future cash flows, inflation and foreign exchange rates and assumptions relating to probabilities of alternative estimates of future cash flows. Actual costs incurred may differ from those amounts estimated. Also, future changes to environmental laws and regulations could increase the extent of reclamation and rehabilitation work required to be performed by the Company. Increase in future costs could materially impact the amounts charged to operations for reclamation and rehabilitation.
Deferred Income Taxes
The Company follows the asset and liability method of accounting for income taxes. Under this method, future tax assets and liabilities are recognized for the future tax consequences attributable to differences between the financial statement carrying amounts of existing assets and liabilities and their respective tax bases, and losses carried forward. Future tax assets and liabilities are measured using substantively enacted or enacted tax rates expected to apply to taxable income in the years in which those temporary differences are expected to be recovered or settled. The effect on future tax assets and liabilities of a change in tax rates is recognized in income in the period that includes the substantive enactment date. Future tax assets are recognized to the extent that they are considered more likely than not to be realized.
Judgement is required in determining the recognition and measurement of deferred income tax assets and liabilities on the balance sheet. In the normal course of business, the Company is subject to assessment by taxation authorities in various jurisdictions. These authorities may have different interpretations of tax legislation or tax agreements than those applied by the Company in computing current and deferred income taxes. These different interpretations may alter the timing or amounts of taxable income or deductions.
Final taxes payable and receivable are dependent on many factors, including outcomes of tax litigation and resolution of disputes. The resolution of these uncertainties may result in adjustments to the Company's tax assets and liabilities.
Management assesses the likelihood and timing of taxable earnings in future periods in recognizing deferred income tax assets. Estimates of future taxable income is based on forecasted cash flows using life of mine projections and the application of existing tax laws in each jurisdiction.
To the extent that future cash flows and taxable income differ significantly from estimates, the ability of the Company to realize the net deferred income tax assets recorded at the balance sheet date could be impacted. In addition, future changes to tax laws could limit the ability of the Company to obtain tax deductions in future periods from deferred income tax assets.
Inventory
In valuing inventories at the lower of cost and net realizable value, the Company makes estimates in determining the net realizable price and in quantifying the contained metal in finished goods and work in progress.
Share-based Compensation
The Company has a stock option plan and records all share-based compensation for options using the fair value method. The fair value of each option award is estimated on the date of the grant using the Black-Scholes option pricing model, with expected volatility based on historical volatility of the Endeavour common shares. The Company uses historical data to estimate the term of the option and the risk-free rate for the expected term of the option is based on the Government of Canada yield curve in effect at the time of the grant.
As part of the Company's bonus program, the Company has granted SARs to its employees. The SARs are subject to vesting conditions and, when vested, constitute a cash bonus based on the value of the appreciation of the Company's common shares between the SARs grant date and vesting. The fair value of each SAR award is estimated on the grant date using the Black-Scholes option pricing model, with expected volatility based on historical volatility of the Endeavour common shares.
The Company uses historical data to estimate the term of the option and the risk-free rate for the expected term of the option is based on the Government of Canada yield curve in effect at the time of the grant.
The Company is also able to issue share units under its Share Unit Plan, typically PSUs and DSUs, to its directors, officers, employees to acquire up to 1.5% of the issued and outstanding shares. Any units granted can be settled with cash, shares or a combination of cash and shares at the discretion of the Board.
The PSUs granted are subject to a performance payout multiplier between 0% and 200% based on the Company's total shareholder return at the end of a three-year period, relative to the Company's total shareholder return peer group.
DSUs will be granted to independent directors of the Company in lieu of compensation in cash or share purchase options and are redeemable at the time of a director's retirement.
Business Combinations
On the acquisition of a business, the acquisition method of accounting is used, whereby the purchase consideration is allocated to the identifiable assets, liabilities and contingent liabilities (identifiable net assets) on the basis of fair value at the date of acquisition. When the cost of acquisition exceeds the fair values attributable to the Company's share of identifiable net assets, the difference is treated as purchased goodwill, which is not amortized but is reviewed for impairment annually or more frequently where there is an indication of impairment. If the fair value attributable to the Company's share of the identifiable net assets exceeds the cost of acquisition, the difference is immediately recognized in profit or loss. Incremental costs related to acquisitions are expensed as incurred.
Determination of the fair value of assets acquired and liabilities assumed and the resulting goodwill, if any, requires that management make estimates based on the information provided by the acquiree. Changes to the provisional values of assets acquired and liabilities assumed, deferred income taxes and resulting goodwill, if any, will be adjusted when the final measurements are determined (within one year of acquisition date).
When purchase consideration is contingent on future events, the initial cost of the acquisition recorded includes an estimate of the fair value of the contingent amounts expected to be payable in the future. When the fair value of contingent consideration as at the date of acquisition is finalized, before the end of the 12 months measurement period, the adjustment is allocated to the identifiable assets acquired and liabilities assumed. Changes to the estimated fair value of contingent consideration subsequent to the acquisition date are recorded in profit or loss.
RISKS AND UNCERTAINTIES
Besides the risks discussed elsewhere in this MD&A, the following are risks and uncertainties that have affected the Company's financial statements or future performance or that may affect them in the future. See "Risk Factors" in the Company's Annual Information Form for other risks affecting the Company generally.
Debt Facility
The terms of the Debt Facility require the Company to satisfy various affirmative and negative covenants and financial ratios. These covenants and ratios limit, among other things, the Company's ability to incur further indebtedness, create certain liens on assets, engage in certain types of transactions, or pay dividends. The Company can provide no assurances that in the future, it will not be limited in its ability to respond to changes in its business or competitive activities or be restricted in its ability to engage in mergers, acquisitions, or dispositions or acquisitions of assets. A failure to comply with these covenants and ratios would likely result in an event of default under the Debt Facility and would allow the lenders to prohibit drawdowns which could materially and adversely affect the Terronera Project, the Company's operations and financial condition, as well as the market price of the Company's securities.
Interest Rate Risk
Increases to benchmark interest rates may have an impact on the Company's cost of borrowing under the Debt Facility and any debt financing that the Company may negotiate, resulting in reduced amounts available to fund the Company's exploration, development and production activities and could negatively impact the market price of its common shares and/or the price of gold or silver, which could have a material adverse effect on the Company's operations and financial condition.
Precious Metal Price Fluctuations
The Company's revenue is primarily dependent on the sale of silver and gold and movements in the spot price of silver or gold may have a direct and immediate impact on the Company's income and the value of related financial instruments. The Company's sales are directly dependent on commodity prices. Metal prices have historically fluctuated widely and are affected by numerous factors beyond the Company's control including international economic and political trends, expectations for inflation, currency exchange rate fluctuations, interest rates, global and regional supply and demand, consumption patterns, speculative market activities, worldwide production and inventory levels, and sales programs by central banks. The exact effect of these factors on metal prices cannot be accurately predicted. Declining market prices for these metals could materially adversely affect the Company's operations and profitability and could affect the Company's ability to finance the exploration and development of any of the Company's other mineral properties.
Fluctuations in the price of consumed commodities
Prices and availability of commodities consumed or used in connection with exploration, development and mining, such as natural gas, diesel, oil, electricity, cyanide and other reagents fluctuate affecting the costs of production at the Company's operations. These fluctuations can be unpredictable, can occur over short periods of time and may have a materially adverse impact on the Company's operating costs or the timing and costs of various projects. The Company's general policy is not to hedge its exposure to changes in prices of the commodities used in its business.
Foreign Exchange Rate Fluctuations
Operations in Mexico, Chile and Canada are subject to foreign currency exchange fluctuations. The Company raises its funds through equity issuances which are generally priced in Canadian dollars or U.S. dollars, and the majority of the exploration costs of the Company are denominated in U.S. dollars, Chilean pesos and Mexican pesos. The Company may suffer losses due to adverse foreign currency fluctuations.
Calculation of Reserves and Resources and Precious Metal Recoveries
There is a degree of uncertainty attributable to the calculation and estimation of reserves and resources and their corresponding metal grades to be mined and recovered. Until reserves or resources are actually mined and processed, the quantities of mineralization and metal grades must be considered as estimates only. Any material change in the quantity of mineral reserves, mineral resources, grades and recoveries may affect the economic viability of the Company's properties.
Economic Conditions for Mining
Events in global financial markets, and the volatility of global financial conditions, will continue to have an impact on the global economy. Many industries, including the mining sector, are impacted by market conditions. Some of the key impacts of financial market turmoil include devaluations and high volatility in global equity, commodity, foreign exchange and precious metal markets and a lack of market liquidity. Financial institutions and large corporations may be forced into bankruptcy or need to be rescued by government authorities. Access to financing may also be negatively impacted by future liquidity crises throughout the world. These factors may impact the Company's ability to obtain equity or debt financing and, where available, to obtain such financing on terms favorable to the Company.
Increased levels of volatility and market turmoil could have an adverse impact on the Company's operations and planned growth and the trading price of the securities of the Company may be adversely affected.
The Company assesses on a quarterly basis the carrying values of its mineral properties. Should market conditions and commodity prices worsen and persist in a worsened state for a prolonged period of time, an impairment of the Company's mineral properties may be required.
Mexican Tax Assessments
The Company is required to use judgement to determine certain tax treatments in calculating income tax expense and IVA recoverable. A number of these judgements are subject to various uncertainties. From time to time, Mexican authorities may apply, re-interpret legislation or disregard precedents and it is possible that these uncertainties may be resolved unfavorably for the Company. See "Contingencies" for further details.
Assurance on Financial Statements
The Company prepares the financial reports in accordance with accounting policies and methods prescribed by IFRS. In the preparation of financial reports, management may need to rely upon assumptions, make estimates or use their best judgment in determining the financial condition of the Company. Significant accounting policies and practices are described in more detail in the notes to the annual consolidated financial statements for the year ended December 31, 2024. In order to have a reasonable level of assurance that financial transactions are properly authorized, assets are safeguarded against unauthorized or improper use and transactions are properly recorded and reported, the Company has implemented and continues to analyze the internal control systems for financial reporting.
CONTROLS AND PROCEDURES
Disclosure Controls and Procedures
The Company's officers and management are responsible for establishing and maintaining disclosure controls and procedures for the Company. Disclosure controls and procedures are designed to provide reasonable assurance that material information required to be disclosed by the Company under securities legislation is recorded, processed, summarized and reported within the applicable time periods and to ensure that required information is gathered and communicated to the Company's management, including the Chief Executive Officer (CEO) and Chief Financial Officer (CFO) as is appropriate to permit timely decisions regarding public disclosure. There are inherent limitations to the effectiveness of any system of disclosure controls and procedures. Accordingly, even effective disclosure controls and procedures can only provide reasonable assurance of achieving their control objectives.
At the end of the period covered by this MD&A, management, including the CEO and CFO, conducted an evaluation of the effectiveness of the Company's disclosure controls and procedures pursuant to National Instrument 52-109 "Certification of Disclosure in Issuers Annual and Interim Filings" ("NI 52-109") and Rule 13a -15(b) of the U.S. Securities Exchange Act of 1934, as amended (the "U.S. Exchange Act"). Based upon that evaluation, the Company's CEO and CFO have concluded that, as of the end of the period covered by this MD&A, the Company's disclosure controls and procedures were effective to give reasonable assurance that the information required to be disclosed by the Company in reports that it files or submits is (i) recorded, processed, summarized and reported, within the time periods specified under applicable securities legislation in Canada and in the U.S. Securities and Exchange Commission's rules and forms, and (ii) accumulated and communicated to management, including its principal executive and principal financial officers, or persons performing similar functions, as appropriate to allow timely decisions regarding required disclosure.
Management's Report on Internal Controls over Financial Reporting
Management is responsible for establishing and maintaining adequate internal control over financial reporting (as defined in NI 52-109 and in Rules 13a-15(f) of the U.S. Exchange Act). A Company's internal control over financial reporting is a process designed to provide reasonable assurance regarding the reliability of financial reporting and the preparation of financial statements for external purposes in accordance with applicable generally accepted accounting principles.
A Company's internal control over financial reporting includes those policies and procedures that (i) pertain to the maintenance of records that, in reasonable detail, accurately and fairly reflect the transactions and dispositions of the assets of the Company; (ii) provide reasonable assurance that transactions are recorded as necessary to permit preparation of financial statements in accordance with generally accepted accounting principles, and that receipts and expenditures of the Company are being made only in accordance with authorizations of management and directors of the Company; and (iii) provide reasonable assurance regarding prevention or timely detection of unauthorized acquisition, use, or disposition of the Company's assets that could have a material effect on the financial statements. It should be noted that a control system, no matter how well conceived or operated, can only provide reasonable assurance, not absolute assurance, that the objectives of the control system are met.
Also, projections of any evaluation of effectiveness to future periods are subject to the risk that controls may become inadequate because of changes in conditions, or that the degree of compliance with policies and procedures may deteriorate.
Management of the Company, including the CEO and CFO, assessed the effectiveness of the Company's internal control over financial reporting as of December 31, 2024. In making this assessment, management used the criteria set forth in the Internal Control Integrated Framework (2013) issued by the Committee of Sponsoring Organizations of the Treadway Commission (COSO). Based on its assessment, management has concluded that, as of December 31, 2024, the Company's internal control over financial reporting is effective. Also, management determined that there were no material weaknesses in the Company's internal control over financial reporting as at December 31, 2024.
Changes in Internal Control over Financial Reporting
Management, including the CEO and CFO, has evaluated the Company's internal controls over financial reporting to determine whether any changes occurred during the period that have materially affected, or are reasonably likely to materially affect, the Company's internal controls over financial reporting.
There have been no changes in internal control over financial reporting that occurred during the fiscal year ended December 31, 2024 that have materially affected, or are reasonably likely to materially affect, the Company's internal control over financial reporting.
NON-IFRS MEASURES
Non-IFRS and Other Financial Measures and Ratios
We have included certain non-IFRS financial measures and ratios in this MD&A, as discussed below. We believe that these measures, in addition to conventional measures prepared in accordance with IFRS, provide investors an improved ability to evaluate the underlying performance of the Company. The non-IFRS measures and ratios are intended to provide additional information and should not be considered in isolation or as a substitute for measures of performance prepared in accordance with IFRS. These financial measures and ratios do not have any standardized meaning prescribed under IFRS, and therefore may not be comparable to other issuers.
Non-IFRS financial measures are defined in National Instrument 52-112 - Non-GAAP and Other Financial Measures Disclosure ("NI 52-112") as a financial measure disclosed that (a) depicts the historical or expected future financial performance, financial position or cash flow of an entity, (b) with respect to its composition, excludes an amount that is included in, or includes an amount that is excluded from, the composition of the most directly comparable financial measure disclosed in the primary financial statements of the entity, (c) is not disclosed in the financial statements of the entity, and (d) is not a ratio, fraction, percentage or similar representation.
A non-IFRS ration is defined by 52-112 as a financial measure disclosed that (a) is in the form of a ratio, fraction, percentage or similar representation, (b) has a non-IFRS financial measure as one or more of its components, and (c) is not disclosed in the financial statements.
Working capital is a non-IFRS measure that is a common measure of liquidity but does not have any standardized meaning. The most directly comparable measure prepared in accordance with IFRS is current assets and current liabilities. Working capital is calculated by deducting current liabilities from current assets. Working capital should not be considered in isolation or as a substitute from measures prepared in accordance with IFRS. The measure is intended to assist readers in evaluating our liquidity.
| Expressed in thousands of US dollars | As at December 31, 2024 | As at December 31, 2023 | ||||
| Current assets | $ | 157,647 | $ | 100,773 | ||
| Current liabilities | 78,866 | 58,244 | ||||
| Working capital | $ | 78,781 | $ | 42,529 |
Adjusted earnings and adjusted earnings per share are non-IFRS measures that supplement information to the Company's consolidated financial statements. The Company believes that, in addition to the conventional measures prepared in accordance with IFRS, the Company and certain investors and analysts use this information to evaluate the Company's underlying core operating performance. The presentation of adjusted earnings and adjusted earnings per share is not meant to be a substitute for net income and net income per share presented in accordance with IFRS, but rather should be evaluated in conjunction with such IFRS measures.
The Company defines the adjusted earnings as net income adjusted to include certain non-cash and unusual items, and items that in the Company’s judgement are subject to volatility as a result of factors which are unrelated to the Company’s operation in the period. Certain items that become applicable in a period may be adjusted for, with the Company retroactively presenting comparable periods with an adjustment for such items and, conversely, items no longer applicable may be removed from the calculation. During the current period, the Company has included unrealized foreign exchange (gain) loss, (gain) loss on derivatives, changes in the fair value of its investments in marketable securities, gain on sale of Cozamin royalty and change in fair value of cash settled DSUs and made retroactive adjustments to prior periods for the same.
The following table provides a detailed reconciliation of net income as reported in the Company's financial statement to adjusted earnings and adjusted earnings per share.
| Expressed in thousands of US dollars | Three Months Ended December 31 | Year Ended December 31 | ||||||||||
| (except for share numbers and per share amounts) | 2024 | 2023 | 2024 | 2023 | ||||||||
| Net earnings (loss) for the period per financial statements | $1,025 | $3,049 | ($31,476 | ) | $6,123 | |||||||
| Unrealized foreign exchange (gain) loss | 1,593 | 216 | 5,370 | 1,421 | ||||||||
| (Gain) loss on derivatives | 1,919 | - | 30,551 | - | ||||||||
| Change in fair value of investments | 596 | 525 | 1,773 | 2,522 | ||||||||
| Gain on sale of Cozamin royalty | - | - | - | (6,990 | ) | |||||||
| Change in fair value of cash settled DSUs | (297 | ) | (504 | ) | 1,781 | (1,327 | ) | |||||
| Adjusted net earnings (loss) | $4,836 | $3,286 | $7,999 | $1,749 | ||||||||
| Basic weighted average share outstanding | 252,169,924 | 207,932,318 | 242,181,449 | 196,018,623 | ||||||||
| Adjusted net earnings (loss) per share | $0.02 | $0.02 | $0.03 | $0.01 | ||||||||
Mine operating cash flow before taxes is a non-IFRS measure that does not have a standardized meaning prescribed by IFRS and therefore may not be comparable to similar measures presented by other issuers. Mine operating cash flow is calculated as revenue minus direct production costs and royalties. Mine operating cash flow is used by management to assess the performance of the mine operations, excluding corporate and exploration activities, and is provided to investors as a measure of the Company’s operating performance.
| Expressed in thousands pf US dollars | Three Months Ended December 31 | Year Ended December 31 | ||||||||||
| 2024 | 2023 | 2024 | 2023 | |||||||||
| Mine operating earnings per financial statements | $7,744 | $5,352 | $42,079 | $36,611 | ||||||||
| Share-based compensation | 55 | 44 | 281 | (74 | ) | |||||||
| Depreciation | 5,346 | 7,181 | 29,894 | 27,885 | ||||||||
| Mine operating cash flow before taxes | $13,145 | $12,577 | $72,254 | $64,422 | ||||||||
Operating cash flow before working capital changes per share is a non-IFRS measure that does not have a standardized meaning prescribed by IFRS and therefore may not be comparable to similar measures presented by other issuers. Operating cash flow per share is calculated by dividing cash from operating activities by the weighted average shares outstanding. Operating cash flow per share is used by management to assess operating performance on a per share basis, irrespective of working capital changes and is provided to investors as a measure of the Company's operating performance.
| Expressed in thousands of US dollars | Three Months Ended December 31 |
Year Ended December 31 |
||||||||||
| (except for per share amounts) | 2024 | 2023 | 2024 | 2023 | ||||||||
| Cash from (used in) operating activities per financial statements | ($4,850 | ) | $6,706 | $19,113 | $11,771 | |||||||
| Net changes in non-cash working capital per financial statements | (10,615 | ) | (3,085 | ) | (8,135 | ) | (25,243 | ) | ||||
| Operating cash flow before working capital changes | $5,765 | $9,791 | $27,248 | $37,014 | ||||||||
| Basic weighted average shares outstanding | 252,169,924 | 207,932,318 | 242,181,449 | 196,018,623 | ||||||||
| Operating cash flow before working capital changes per share | $0.02 | $0.05 | $0.11 | $0.19 | ||||||||
EBITDA is a non-IFRS financial measure, which excludes the following from net earnings:
Adjusted EBITDA excludes the following additional items from EBITDA:
Adjusted EBITDA per share is calculated by dividing Adjusted EBITDA by the basic weighted average number of shares outstanding for the period.
Management believes EBITDA is a valuable indicator of the Company's ability to generate liquidity by producing operating cash flow to fund working capital needs, service debt obligations, and fund capital expenditures.
Management uses EBITDA for this purpose. EBITDA is also frequently used by investors and analysts for valuation purposes whereby EBITDA is multiplied by a factor or "EBITDA multiple" based on an observed or inferred relationship between EBITDA and market values to determine the approximate total enterprise value of a Company.
EBITDA is intended to provide additional information to investors and analysts. It does not have any standardized definition under IFRS and should not be considered in isolation or as a substitute for measures of operating performance prepared in accordance with IFRS. EBITDA excludes the impact of cash costs of financing activities and taxes, and the effects of changes in operating working capital balances, and therefore is not necessarily indicative of operating profit or cash flow from operations as determined by IFRS. Other companies may calculate EBITDA and Adjusted EBITDA differently.
Certain items that become applicable in a period may be adjusted for, with the Company retroactively presenting comparable periods with an adjustment for such items and, conversely, items no longer applicable may be removed from the calculation.
| Expressed in thousands of US dollars | Three Months Ended December 31 | Year Ended December 31 | ||||||||||
| 2024 | 2023 | 2024 | 2023 | |||||||||
| Net earnings (loss) for the period per financial statements | $1,025 | $3,049 | $(31,476 | ) | $6,123 | |||||||
| Depreciation - cost of sales | 5,346 | 7,181 | 29,894 | 27,885 | ||||||||
| Depreciation - exploration, evaluation and development | 261 | 80 | 829 | 528 | ||||||||
| Depreciation - general & administration | 99 | 197 | 403 | 376 | ||||||||
| Finance costs | 294 | 164 | 889 | 822 | ||||||||
| Current income tax expense (recovery) | (162 | ) | 207 | 12,906 | 11,344 | |||||||
| Deferred income tax expense (recovery) | (2,507 | ) | (2,544 | ) | (3,415 | ) | 786 | |||||
| EBITDA | $4,356 | $8,334 | $10,030 | $47,864 | ||||||||
| Share based compensation | 346 | 714 | 3,242 | 3,618 | ||||||||
| Gain on sale of Cozamin royalty | - | - | - | (6,990 | ) | |||||||
| Unrealized foreign exchange (Gain) loss | 1,593 | 216 | 5,370 | 1,421 | ||||||||
| (Gain) loss on derivatives | 1,919 | - | 30,551 | - | ||||||||
| Change in fair value of investments | 596 | 525 | 1,773 | 2,522 | ||||||||
| Change in fair value of cash settled DSUs | (297 | ) | (504 | ) | 1,781 | (1,327 | ) | |||||
| Adjusted EBITDA | $8,513 | $9,285 | $52,747 | $47,108 | ||||||||
| Basic weighted average shares outstanding | 252,169,924 | 207,932,318 | 242,181,449 | 196,018,623 | ||||||||
| Adjusted EBITDA per share | $0.03 | $0.04 | $0.22 | $0.24 | ||||||||
Cash costs per silver oz, total production costs per oz, direct operating costs per tonne and direct costs per tonne are measures developed by precious metals companies in an effort to provide a comparable standard; however, there can be no assurance that the Company's reporting of these non-IFRS measures and ratios are similar to those reported by other mining companies. Cash costs per oz, total production costs per oz and direct costs per tonne are measures used by the Company to manage and evaluate operating performance at each of the Company's operating mining units. They are widely reported in the silver mining industry as a benchmark for performance, but do not have a standardized meaning and are disclosed in addition to IFRS measures. Direct operating costs include mining, processing (including smelting, refining, transportation and selling costs) and direct overhead at the operation sites. Direct costs include all direct operating costs plus royalties and special mining duty. Cash costs include all direct costs less by-product gold sales and changes in finished gold inventories.
Total production costs include all cash costs plus depreciation, changes in depreciation in finished goods inventory and site share-based compensation. Cash costs per silver ounce and total production costs per ounce are calculated by dividing cash costs and total production costs by the payable silver ounces produced. Direct operating cost per tonne and direct costs per tonne are calculated by dividing direct operating costs and direct costs by the number of processed tonnes. The following tables provide a detailed reconciliation of these measures to the Company’s direct production costs, as reported in its consolidated financial statements.
| Expressed in thousands of US dollars | Three months ended December 31, 2024 |
Three months ended December 31, 2023 |
||||||||||||||||
| Guanaceví | Bolañitos | Total | Guanaceví | Bolañitos | Total | |||||||||||||
| Direct production costs per financial statements | $14,017 | $11,387 | $25,404 | $22,956 | $9,861 | $32,817 | ||||||||||||
| Purchase of the third-party material | (4,187 | ) | - | (4,187 | ) | (2,597 | ) | - | (2,597 | ) | ||||||||
| Smelting and refining costs included in revenue | - | 536 | 536 | - | 506 | 506 | ||||||||||||
| Opening finished goods | (1,725 | ) | (718 | ) | (2,443 | ) | (8,627 | ) | (656 | ) | (9,283 | ) | ||||||
| Closing finished goods | 5,448 | 485 | 5,933 | 7,137 | 699 | 7,836 | ||||||||||||
| Direct operating costs | 13,553 | 11,690 | 25,243 | 18,869 | 10,410 | 29,279 | ||||||||||||
| Purchase of the third-party material | 4,187 | - | 4,187 | 2,597 | - | 2,597 | ||||||||||||
| Royalties | 3,550 | 111 | 3,661 | 5,033 | 72 | 5,105 | ||||||||||||
| Special mining duty (1) | 185 | 1,413 | 1,598 | 62 | 151 | 213 | ||||||||||||
| Direct costs | 21,475 | 13,214 | 34,689 | 26,561 | 10,633 | 37,194 | ||||||||||||
| By-product gold sales | (4,834 | ) | (17,253 | ) | (22,087 | ) | (7,045 | ) | (12,271 | ) | (19,316 | ) | ||||||
| Opening gold inventory fair market value | 1,059 | 1,478 | 2,537 | 2,345 | 815 | 3,160 | ||||||||||||
| Closing gold inventory fair market value | (3,185 | ) | (772 | ) | (3,957 | ) | (2,909 | ) | (619 | ) | (3,528 | ) | ||||||
| Cash costs net of by-product | 14,515 | (3,333 | ) | 11,182 | 18,952 | (1,442 | ) | 17,510 | ||||||||||
| Depreciation | 3,040 | 2,306 | 5,346 | 3,942 | 3,239 | 7,181 | ||||||||||||
| Share-based compensation | 46 | 9 | 55 | 33 | 11 | 44 | ||||||||||||
| Opening finished goods depreciation | (515 | ) | (184 | ) | (699 | ) | (1,509 | ) | (222 | ) | (1,731 | ) | ||||||
| Closing finished goods depreciation | 1,187 | 92 | 1,279 | 1,459 | 197 | 1,656 | ||||||||||||
| Total production costs | $18,273 | ($1,110 | ) | $17,163 | $22,877 | $1,783 | $24,660 | |||||||||||
| Three months ended December 31, 2024 |
Three months ended December 31, 2023 |
|||||||||||||||||
| Guanaceví | Bolañitos | Total | Guanaceví | Bolañitos | Total | |||||||||||||
| Throughput tonnes | 58,798 | 106,793 | 165,591 | 110,781 | 109,683 | 220,464 | ||||||||||||
| Payable silver ounces | 716,641 | 100,651 | 817,292 | 1,267,864 | 128,451 | 1,396,315 | ||||||||||||
| Cash costs per silver ounce | $20.25 | ($33.11 | ) | $13.68 | $14.95 | ($11.23 | ) | $12.54 | ||||||||||
| Total production costs per ounce | $25.50 | ($11.03 | ) | $21.00 | $18.04 | $13.88 | $17.66 | |||||||||||
| Direct operating costs per tonne | $230.50 | $109.46 | $152.44 | $170.33 | $94.91 | $132.81 | ||||||||||||
| Direct costs per tonne | $365.23 | $123.73 | $209.49 | $239.76 | $96.94 | $168.71 | ||||||||||||
| Expressed in thousands of US dollars | Year Ended December 31, 2024 | Year Ended December 31, 2023 | ||||||||||||||||
| Guanaceví | Bolañitos | Total | Guanaceví | Bolañitos | Total | |||||||||||||
| Direct production costs per financial statements | $82,872 | $41,645 | $124,517 | $79,842 | $38,989 | $118,831 | ||||||||||||
| Purchase of the third-party material | (14,418 | ) | - | (14,418 | ) | (10,102 | ) | - | (10,102 | ) | ||||||||
| Smelting and refining costs included in revenue | - | 1,972 | 1,972 | - | 2,451 | 2,451 | ||||||||||||
| Opening finished goods | (7,137 | ) | (699 | ) | (7,836 | ) | (4,953 | ) | (245 | ) | (5,198 | ) | ||||||
| Closing finished goods | 5,448 | 485 | 5,933 | 7,137 | 699 | 7,836 | ||||||||||||
| Direct operating costs | 66,765 | 43,403 | 110,168 | 71,924 | 41,894 | 113,818 | ||||||||||||
| Purchase of the third-party material | 14,418 | - | 14,418 | 10,102 | - | 10,102 | ||||||||||||
| Royalties | 20,498 | 370 | 20,868 | 21,937 | 273 | 22,210 | ||||||||||||
| Special mining duty (1) | 2,298 | 2,683 | 4,981 | 2,862 | 530 | 3,392 | ||||||||||||
| Direct costs | 103,979 | 46,456 | 150,435 | 106,825 | 42,697 | 149,522 | ||||||||||||
| By-product gold sales | (32,476 | ) | (59,875 | ) | (92,351 | ) | (29,273 | ) | (43,925 | ) | (73,198 | ) | ||||||
| Opening gold inventory fair market value | 2,909 | 619 | 3,528 | 2,740 | 354 | 3,094 | ||||||||||||
| Closing gold inventory fair market value | (3,185 | ) | (772 | ) | (3,957 | ) | (2,909 | ) | (619 | ) | (3,528 | ) | ||||||
| Cash costs net of by-product | 71,227 | (13,572 | ) | 57,655 | 77,383 | (1,493 | ) | 75,890 | ||||||||||
| Depreciation | 19,476 | 10,418 | 29,894 | 15,481 | 12,404 | 27,885 | ||||||||||||
| Share-based compensation | 227 | 54 | 281 | (17 | ) | (57 | ) | (74 | ) | |||||||||
| Opening finished goods depreciation | (1,459 | ) | (197 | ) | (1,656 | ) | (862 | ) | (79 | ) | (941 | ) | ||||||
| Closing finished goods depreciation | 1,187 | 92 | 1,279 | 1,459 | 197 | 1,656 | ||||||||||||
| Total production costs | $90,658 | ($3,205 | ) | $87,453 | $93,444 | $10,972 | $104,416 | |||||||||||
| Year Ended December 31, 2024 | Year Ended December 31, 2023 | |||||||||||||||||
| Guanaceví | Bolañitos | Total | Guanaceví | Bolañitos | Total | |||||||||||||
| Throughput tonnes | 353,793 | 427,646 | 781,439 | 433,409 | 440,973 | 874,382 | ||||||||||||
| Payable silver ounces | 4,007,140 | 431,214 | 4,438,354 | 5,089,921 | 537,458 | 5,627,379 | ||||||||||||
| Cash costs per silver ounce | $17.78 | ($31.47 | ) | $12.99 | $15.20 | ($2.78 | ) | $13.49 | ||||||||||
| Total production costs per ounce | $22.62 | ($7.43 | ) | $19.70 | $18.36 | $20.41 | $18.55 | |||||||||||
| Direct operating costs per tonne | $188.71 | $101.49 | $140.98 | $165.95 | $95.00 | $130.17 | ||||||||||||
| Direct costs per tonne | $293.90 | $108.63 | $192.51 | $246.48 | $96.82 | $171.00 | ||||||||||||
(1) Special mining duty is an EBITDA royalty tax presented as a current income tax in accordance with IFRS.
| Expressed in thousands of US dollars | December 31, 2024 | December 31, 2023 | ||||||||||||||||
| Guanaceví | Bolañitos | Total | Guanaceví | Bolañitos | Total | |||||||||||||
| Closing finished goods | 5,448 | 485 | 5,933 | 7,137 | 699 | 7,836 | ||||||||||||
| Closing finished goods depreciation | 1,187 | 92 | 1,279 | 1,459 | 197 | 1,656 | ||||||||||||
| Finished goods inventory | $6,635 | $577 | $7,212 | $8,596 | $896 | $9,492 | ||||||||||||
AISC per oz and all-in costs per oz are measures developed by the World Gold Council (and used as a standard of the Silver Institute) in an effort to provide a comparable standard within the precious metal industry; however, there can be no assurance that the Company's reporting of these non-IFRS measures are similar to those reported by other mining companies. These measures are used by the Company to manage and evaluate operating performance at each of the Company's operating mining units and consolidated group, and are widely reported in the silver mining industry as a benchmark for performance, but do not have a standardized meaning and are disclosed in addition to IFRS measures. The following tables provide a detailed reconciliation of these measures to the Company's cost of sales, as reported in the Company's consolidated financial statements.
| Expressed in thousands of US dollars | Three Months Ended December 31, 2024 | Three Months Ended December 31, 2023 | ||||||||||||||||
| Guanaceví | Bolañitos | Total | Guanaceví | Bolañitos | Total | |||||||||||||
| Cash costs net of by-product | $14,515 | ($3,333 | ) | $11,182 | $18,952 | ($1,442 | ) | $17,510 | ||||||||||
| Operations share-based compensation | 46 | 9 | 55 | 33 | 11 | 44 | ||||||||||||
| Corporate general and administrative | 895 | 702 | 1,597 | 1,423 | 550 | 1,973 | ||||||||||||
| Corporate share-based compensation | 95 | 120 | 215 | 404 | 156 | 560 | ||||||||||||
| Reclamation - amortization/accretion | 84 | 65 | 149 | 78 | 66 | 144 | ||||||||||||
| Mine site expensed exploration | 365 | 217 | 582 | 286 | 350 | 636 | ||||||||||||
| Equipment loan payments | - | - | - | 140 | 340 | 480 | ||||||||||||
| Capital expenditures sustaining | 7,218 | 1,336 | 8,554 | 5,944 | 2,700 | 8,644 | ||||||||||||
| All-In-Sustaining Costs | $23,218 | ($884 | ) | $22,334 | $27,260 | $2,731 | $29,991 | |||||||||||
| Growth exploration, evaluation and development | 5,204 | 1,609 | ||||||||||||||||
| Growth capital expenditures | 37,338 | 32,826 | ||||||||||||||||
| All-In-Costs | $64,876 | $64,426 | ||||||||||||||||
| Three Months Ended December 31, 2024 | Three Months Ended December 31, 2023 | |||||||||||||||||
| Guanaceví | Bolañitos | Total | Guanaceví | Bolañitos | Total | |||||||||||||
| Throughput tonnes | 58,798 | 106,793 | 165,591 | 110,781 | 109,683 | 220,464 | ||||||||||||
| Payable silver ounces | 716,641 | 100,651 | 817,292 | 1,267,864 | 128,451 | 1,396,315 | ||||||||||||
| Silver equivalent production (ounces) | 928,557 | 621,972 | 1,550,529 | 1,569,359 | 605,704 | 2,175,063 | ||||||||||||
| All-in-Sustaining cost per ounce | $32.40 | ($8.78 | ) | $27.33 | $21.50 | $21.26 | $21.48 | |||||||||||
| Expressed in thousands of US dollars | Year Ended December 31, 2024 | Year Ended December 31, 2023 | ||||||||||||||||
| Guanaceví | Bolañitos | Total | Guanaceví | Bolañitos | Total | |||||||||||||
| Cash costs net of by-product | $71,227 | ($13,572 | ) | $57,655 | $77,383 | ($1,493 | ) | $75,890 | ||||||||||
| Operations share-based compensation | 227 | 54 | 281 | (17 | ) | (57 | ) | (74 | ) | |||||||||
| Corporate general and administrative | 7,396 | 3,567 | 10,963 | 6,354 | 2,419 | 8,773 | ||||||||||||
| Corporate share-based compensation | 1,897 | 914 | 2,811 | 2,328 | 886 | 3,214 | ||||||||||||
| Reclamation - amortization/accretion | 372 | 283 | 655 | 313 | 263 | 576 | ||||||||||||
| Mine site expensed exploration | 1,141 | 1,187 | 2,328 | 1,354 | 1,352 | 2,706 | ||||||||||||
| Equipment loan payments | 206 | 306 | 512 | 819 | 1,805 | 2,624 | ||||||||||||
| Capital expenditures sustaining | 22,875 | 7,893 | 30,768 | 24,631 | 10,708 | 35,339 | ||||||||||||
| All-In-Sustaining Costs | $105,341 | $632 | $105,973 | $113,165 | $15,883 | $129,048 | ||||||||||||
| Growth exploration, evaluation and development | 16,083 | 11,401 | ||||||||||||||||
| Growth capital expenditures | 164,618 | 82,448 | ||||||||||||||||
| All-In-Costs | $286,674 | $222,897 | ||||||||||||||||
| Year Ended December 31, 2024 | Year Ended December 31, 2023 | |||||||||||||||||
| Guanaceví | Bolañitos | Total | Guanaceví | Bolañitos | Total | |||||||||||||
| Throughput tonnes | 353,793 | 427,646 | 781,439 | 433,409 | 440,973 | 874,382 | ||||||||||||
| Payable silver ounces | 4,007,140 | 431,214 | 4,438,354 | 5,089,921 | 537,458 | 5,627,379 | ||||||||||||
| Silver equivalent production (ounces) | 5,124,557 | 2,471,027 | 7,595,584 | 6,301,637 | 2,399,706 | 8,701,343 | ||||||||||||
| All-In-Sustaining cost per ounce | $26.29 | $1.47 | $23.88 | $22.23 | $29.55 | $22.93 | ||||||||||||
| Expressed in thousands of US dollars | Three Months Ended December 31 | Year Ended December 31 | ||||||||||
| 2024 | 2023 | 2024 | 2023 | |||||||||
| Capital expenditures sustaining | $8,554 | $8,644 | $30,768 | $35,339 | ||||||||
| Growth capital expenditures | 37,338 | 32,826 | 164,618 | 82,448 | ||||||||
| Property, plant and equipment expenditures per Consolidated Statement of Cash Flows | $45,892 | $41,470 | $195,386 | $117,787 | ||||||||
| Expressed in thousands of US dollars | Three Months Ended December 31 | Year Ended December 31 | ||||||||||
| 2024 | 2023 | 2024 | 2023 | |||||||||
| Mine site expensed exploration | $582 | $636 | $2,328 | $2,706 | ||||||||
| Growth exploration, evaluation and development | 5,204 | 1,609 | 16,083 | 11,401 | ||||||||
| Total exploration, evaluation and development | 5,786 | 2,245 | 18,411 | 14,107 | ||||||||
| Exploration, evaluation and development depreciation | 261 | 80 | 829 | 528 | ||||||||
| Exploration, evaluation and development share-based compensation | 76 | 110 | 150 | 478 | ||||||||
| Exploration, evaluation and development expense | $6,123 | $2,435 | $19,390 | $15,113 | ||||||||