
Endeavour Silver Corp.
Management’s Discussion & Analysis
For the Three Months and Year Ended December 31, 2025 and 2024
| MANAGEMENT'S DISCUSSION AND ANALYSIS FOR THE PERIOD ENDED DECEMBER 31, 2025 |
This Management Discussion and Analysis ("MD&A") should be read in conjunction with the consolidated financial statements of Endeavour Silver Corp. ("Endeavour" or "the Company") for the period ended December 31, 2025 and the related notes contained therein, which were prepared in accordance with the International Financial Reporting Standards ("IFRS") as issued by the International Accounting Standards Board. The Company uses certain non-IFRS financial measures in this MD&A as described under "Non-IFRS Measures". Additional information relating to the Company, including the most recent Annual Information Form (the "Annual Information Form"), is available on SEDAR+ at www.sedarplus.com, and the Company's most recent annual report on Form 40-F has been filed with the U.S. Securities and Exchange Commission (the "SEC") on EDGAR at www.sec.gov. This MD&A contains "forward-looking statements" that are subject to risk factors set out in a cautionary note contained herein. All dollar ($) amounts are expressed in United States ("$") dollars and tabular amounts are expressed in millions of U.S. dollars unless Canadian dollars (CAN$) or Mexican pesos (MXN) are otherwise indicated. This MD&A is dated as of February 27, 2026, and all information contained is current as of February 27, 2026, unless otherwise stated.
Cautionary Note to U.S. Investors Regarding Mineral Reserves and Resources
This MD&A has been prepared in accordance with the requirements of Canadian provincial securities laws, which differ from the requirements of U.S. securities laws. As a result, the Company reports the mineral reserves and resources of the projects it has an interest in according to Canadian standards. Canadian reporting requirements for disclosure of mineral properties are governed by National Instrument 43-101 - Standards of Disclosure for Mineral Projects ("NI 43-101"). NI 43-101 is a rule developed by the Canadian Securities Administrators that establishes standards for all public disclosure an issuer makes of scientific and technical information concerning mineral projects. These standards differ from the requirements of the SEC that are applicable to domestic United States reporting companies under subpart 1300 of Regulation S-K ("S-K 1300") under the Exchange Act. As an issuer that prepares and files its reports with the SEC pursuant to the Multijurisdictional Disclosure System, the Company is not subject to the requirements of S-K 1300. Any mineral reserves and mineral resources reported by the Company in accordance with NI 43-101 may not qualify as such under or differ from those prepared in accordance with S-K 1300. Accordingly, information included or incorporated by reference in this MD&A concerning descriptions of mineralization and estimates of mineral reserves and resources under Canadian standards may not be comparable to similar information made public by United States companies subject to the reporting and disclosure requirements of S-K 1300.
Forward-Looking Statements
This MD&A contains "forward-looking statements" within the meaning of the U.S. Securities Litigation Reform Act of 1995, as amended and "forward-looking information" within the meaning of applicable Canadian securities legislation. Such forward-looking statements and information include, but are not limited to, the reliability of mineral resource estimates; the continuation of exploration and mining operations; the Company's future production and cost guidance announcements; mineral resource estimations and life of mine plans; planned expansions, exploration and drilling activities, and the Company's areas of focus for each; plans to develop a current mineral resource estimate for Kolpa and related timing; the Company's plans for drilling and technical work; Endeavour's annual outlook including anticipated performance in 2026, including production and cost guidance and financial results, silver and gold grades and recoveries, cash costs per ounce ("oz"), anticipated operating costs, planned capital expenditures and sustaining capital, the price of gold and silver; planned capital allocation; working capital; the Company's capital requirements and the adequacy of the operating cash flow and existing working capital to meet capital requirements and the timing and results of various activities. Forward-looking statements are frequently characterized by words such as "plan", "expect", "forecast", "project", "intend", "believe", "anticipate", "outlook" and other similar words, or statements that certain events or conditions "may" or "will" occur. Forward-looking statements are based on the opinions and estimates of management at the dates the statements are made, and are subject to a variety of risks and uncertainties and other factors that could cause actual events or results to differ materially from those projected in the forward-looking statements.
The Company does not intend to, and does not assume any obligation to, update such forward-looking statements or information, other than as required by applicable law. Forward-looking statements or information involve known and unknown risks, uncertainties and other factors and are based on assumptions that may cause the actual results, level of activity, performance or achievements of the Company and its operations and related timeframes to be materially different from those expressed or implied by such statements. Such factors and assumptions include, among others: the ongoing effects of inflation and supply chain issues on project economics; fluctuations in the prices of silver and gold; fluctuations in the currency markets (particularly the Mexican peso, Chilean peso, Canadian dollar, Peruvian sol, and U.S. dollar); fluctuations in interest rates; effects of inflation changes in national and local governments, legislation, taxation, controls, regulations and political or economic developments in Canada, Peru and Mexico; operating or technical difficulties in mineral exploration, development and mining activities; risks and hazards of mineral exploration, development and mining (including, but not limited to environmental hazards, industrial accidents, unusual or unexpected geological conditions, pressures, cave-ins and flooding); inadequate insurance, or inability to obtain insurance; availability of and costs associated with mining inputs and labour; the speculative nature of mineral exploration and development; diminishing quantities or grades of mineral reserves as properties are mined; risks in obtaining necessary licenses and permits; challenges to the Company's title to properties; as well as those factors described under "Risk Factors" in the Company's most recent Annual Information Form and in the Company's prospectus dated July 10, 2025. Although the Company has attempted to identify important factors that could cause actual results to differ materially from those contained in forward-looking statements or information, there may be other factors that cause results to be materially different from those anticipated, described, estimated, assessed or intended. There can be no assurance that any forward-looking statements or information will prove to be accurate as actual results and future events could differ materially from those anticipated in such statements or information. Accordingly, readers should not place undue reliance on forward-looking statements or information
Certain forward-looking statements and information in this MD&A may be considered "financial outlook" within the meaning of applicable Canadian securities legislation. Financial outlook is presented in this MD&A for the purpose of assisting investors and others in understanding certain key elements of the Company's financial results and business plan, as well as the objectives, strategic priorities and business outlook of the Company, and in obtaining a better understanding of the Company's anticipated operating environment. Readers are cautioned that such financial outlook may not be appropriate for other purposes.
Qualified Person
The scientific and technical information contained in this MD&A relating to the Company's mines and mineral projects has been reviewed and approved by Dale Mah, B.Sc., P.Geo., Vice President Corporate Development of Endeavour, a Qualified Person within the meaning of NI 43-101.
Table of Contents
OVERVIEW OF THE BUSINESS
The Company is engaged in silver mining in Mexico and Peru and related activities including property acquisition, exploration, development, mineral extraction, processing, refining and reclamation. The Company is also engaged in exploration activities in Chile and Nevada, USA. The Company’s operations are comprised of the Guanaceví mine (“Guanaceví) located in Durango, Mexico, the Terronera mine (“Terronera”) in Jalisco, Mexico, and the Kolpa mine (“Kolpa”) in Huancavelica, Peru. On January 15, 2026, the Company completed the sale of Mina Bolanitos (“Bolañitos”). During 2025, the Company finished construction of the Terronera mine located in Jalisco State, Mexico and announced commercial production on October 1, 2025, as the operation met the defined criteria set forth by management, including sustained throughput and recovery rates. The Company is advancing several other exploration projects in order to achieve its goal of becoming a premier senior producer in the silver mining sector.
On May 1, 2025, the Company completed the acquisition of all outstanding shares of Compañia Minera Kolpa S.A. ("Minera Kolpa" or "Kolpa"), a privately held silver-focused polymetallic mining company located in Huancavelica, Peru. The total consideration was approximately $134.3 million, comprising $78.0 million in cash, $48.4 million in Endeavour common shares, and up to $10.0 million in contingent payments based on mineral resource expansion targets (the "Transaction"), valued at $7.9 million at the date of the acquisition. As part of the Transaction, Endeavour also assumed $25.8 million in debt.
The Company's common shares are listed on the Toronto Stock Exchange (TSX: EDR) and the New York Stock Exchange (NYSE: EXK).
OPERATING HIGHLIGHTS
|
Three Months Ended December 31 |
Q4 2025 Highlights |
Twelve Months Ended December 31 | |||||||
|
2025 |
2024 |
% Change |
|
2025 |
2024 |
% Change |
|||
|
|
|
|
Production |
|
|
|
|||
|
2,030,206 |
824,529 |
146% |
Silver ounces produced |
6,486,661 |
4,471,824 |
45% |
|||
|
13,785 |
9,075 |
52% |
Gold ounces produced |
37,164 |
39,047 |
(5%) |
|||
|
5,750 |
- |
- |
Lead tonnes produced |
14,917 |
- |
- |
|||
|
3,034 |
- |
- |
Zinc tonnes produced |
9,016 |
- |
- |
|||
|
3,767,713 |
1,550,529 |
143% |
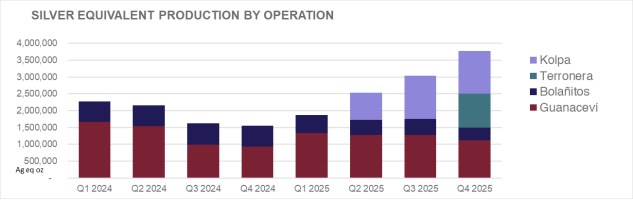
Silver equivalent ounces produced(1) |
11,206,378 |
7,595,584 |
48% |
|||
|
19.05 |
13.68 |
39% |
Cash costs per silver ounce(2) |
17.34 |
12.99 |
34% |
|||
|
32.05 |
21.00 |
53% |
Total production costs per ounce(2) |
28.17 |
19.70 |
43% |
|||
|
41.19 |
27.33 |
51% |
All-in sustaining costs per ounce (2) |
31.52 |
23.88 |
32% |
|||
|
551,010 |
165,591 |
233% |
Processed tonnes |
1,464,590 |
781,439 |
87% |
|||
|
164.21 |
152.44 |
8% |
Direct operating costs per tonne(2) |
152.79 |
140.98 |
8% |
|||
|
207.91 |
209.49 |
(1%) |
Direct costs per tonne(2) |
202.30 |
192.51 |
5% |
|||
|
|
|
|
Financial |
|
|
|
|||
|
172.6 |
42.2 |
309% |
Revenue from operations ($ millions) |
432.8 |
217.6 |
99% |
|||
|
1,879,936 |
654,519 |
187% |
Silver ounces sold |
6,321,785 |
4,645,574 |
36% |
|||
|
12,614 |
8,343 |
51% |
Gold ounces sold |
36,336 |
38,522 |
(6%) |
|||
|
54.83 |
31.56 |
74% |
Realized silver price per ounce |
40.73 |
27.39 |
49% |
|||
|
4,283 |
2,647 |
62% |
Realized gold price per ounce |
3,591 |
2,397 |
50% |
|||
|
- |
- |
- |
Pre-operating production revenue ($ millions) |
34.8 |
- |
- |
|||
|
- |
- |
- |
Pre-operating production silver equivalent ounces sold(1) |
807,841 |
- |
- |
|||
|
(23.8) |
1.0 |
(2,421%) |
Net earnings (loss) ($ millions) |
(119.1) |
(31.5) |
(278%) |
|||
|
4.8 |
4.8 |
(1%) |
Adjusted net earnings (loss) ($ millions)(2) |
(6.7) |
8.0 |
(184%) |
|||
|
46.6 |
7.7 |
505% |
Mine operating earnings ($ millions) |
82.8 |
42.1 |
97% |
|||
|
71.7 |
13.1 |
447% |
Mine operating cash flow before taxes ($ millions)(2) |
156.3 |
72.3 |
116% |
|||
|
15.1 |
5.8 |
162% |
Operating cash flow before working capital changes(2) |
51.5 |
27.2 |
89% |
|||
|
11.7 |
4.4 |
166% |
EBITDA ($ millions)(2) |
(17.7) |
10.0 |
(276%) |
|||
|
41.1 |
8.6 |
377% |
Adjusted EBITDA ($ millions)(2) |
95.1 |
52.7 |
80% |
|||
|
146.4 |
78.8 |
86% |
Working capital ($ millions) (2) |
146.4 |
78.8 |
86% |
|||
|
|
|
|
Shareholders |
|
|
|
|||
|
(0.08) |
0.00 |
(100%) |
Earnings (loss) per share - basic ($) |
(0.42) |
(0.13) |
(223%) |
|||
|
0.02 |
0.02 |
0% |
Adjusted earnings (loss) per share - basic ($)(2) |
(0.02) |
0.03 |
(167%) |
|||
|
0.05 |
0.02 |
150% |
Operating cash flow before working capital changes per share(2) |
0.18 |
0.11 |
64% |
|||
|
294,635,507 |
252,169,924 |
17% |
Weighted average shares outstanding |
283,078,337 |
242,181,449 |
17% |
|||
(1) Silver equivalents are calculated using an 80:1 Ag:Au ratio, 60:1 Ag:Pb ratio, 85:1 Ag:Zn ratio and 300:1 Ag:Cu ratio.
(2) Non-IFRS measure. For a description of how these measures are calculated and a reconciliation of these measures to the most directly comparable measures specified, defined or determined under IFRS and presented in the Company's financial statements, refer to "Non-IFRS Measures".
The above highlights are key measures used by management, however they should not be the sole measures used in determining the performance of the Company's operations.
REVIEW OF OPERATING RESULTS
Consolidated Production Results from Operations for the Three Months and Years Ended December 31, 2025 and 2024
|
Three Months Ended December 31 |
CONSOLIDATED |
Twelve Months Ended December 31 |
||||
|
2025 |
2024 |
% Change |
|
2025 |
2024 |
% Change |
|
551,010 |
165,591 |
233% |
Ore tonnes processed |
1,464,590 |
781,439 |
87% |
|
2,030,206 |
824,529 |
146% |
Total silver ounces produced |
6,486,661 |
4,471,824 |
45% |
|
13,785 |
9,075 |
52% |
Total gold ounces produced |
37,164 |
39,047 |
(5%) |
|
5,750 |
- |
- |
Total lead tonnes produced |
14,917 |
- |
- |
|
3,034 |
- |
- |
Total zinc tonnes produced |
9,016 |
- |
- |
|
106 |
- |
- |
Total copper tonnes produced |
284 |
- |
- |
|
3,767,713 |
1,550,529 |
143% |
Silver equivalent ounces produced(1) |
11,206,378 |
7,595,584 |
48% |
|
19.05 |
13.68 |
39% |
Cash costs per silver ounce(2) |
17.34 |
12.99 |
34% |
|
32.05 |
21.00 |
53% |
Total production costs per ounce(2) |
28.17 |
19.70 |
43% |
|
41.19 |
27.33 |
51% |
All in sustaining costs per ounce (2) |
31.52 |
23.88 |
32% |
|
164.21 |
152.44 |
8% |
Direct operating costs per tonne(2) |
152.79 |
140.98 |
8% |
|
207.91 |
209.49 |
(1%) |
Direct costs per tonne(2) |
202.30 |
192.51 |
5% |
(1) Silver equivalents are calculated using an 80:1 Ag:Au ratio, 60:1 Ag:Pb ratio, 85:1 Ag:Zn ratio and 300:1 Ag:Cu ratio
(2) Non-IFRS measure. For a description of how these measures are calculated and a reconciliation of these measures to the most directly comparable measures specified, defined or determined under IFRS and presented in the Company's financial statements, refer to "Non-IFRS Measures".
(1) Silver equivalents are calculated using an 80:1 Ag:Au ratio, 60:1 Ag:Pb ratio, 85:1 Ag:Zn ratio and 300:1 Ag:Cu ratio
Consolidated Production
Three months ended December 31, 2025 (compared to the three months ended December 31, 2024)
Consolidated plant throughput for the quarter was 551,010 tonnes, 385,419 tonnes more than 165,591 tonnes in Q4 2024. Plant throughput has primarily increased due to the addition of Kolpa which contributed 198,830 tonnes; the commissioning of Terronera which contributed 154,180 tonnes; and 45,582 tonnes more from Guanaceví which had lower throughput in the comparative period following a trunnion failure in early August 2024. Offsetting these increases, throughput at Bolañitos of 93,620 tonnes was 12% lower than Q4 2024.
Consolidated silver production during Q4 2025 was 2,030,206 oz, 146% higher than 824,529 oz in Q4 2024. The higher silver production was primarily due to the same reasons as discussed for plant throughput, with Kolpa contributing 631,867 oz, Terronera, contributing 352,002 oz; and Guanaceví contributing 158,757 oz more than the same period in 2024 due to the trunnion failure. Despite the lower throughput, Bolañitos also contributed 63,051 oz more than the same period in 2024 due to 82% higher silver grade in the current period.
Kolpa also added new base metal outputs, including 5,750 tonnes of lead, 3,034 tonnes of zinc, and 106 tonnes of copper, none of which were present in the comparative period.
Gold production totaled 13,785 oz, 4,710 oz more than the same period in 2024. This increase was driven by the 8,148 oz produced by Terronera and 380 oz more gold production at Guanaceví, offset by 3,817 oz lower at Bolañitos as a result of lower throughput, gold grades and recoveries.
Year ended December 31, 2025 (compared to the year ended December 31, 2024)
Consolidated silver production for the year ended December 31, 2025, was 6,486,661 ounces, 2,014,837 higher than 4,471,824 ounces produced in the same period of 2024, predominantly due to the 1,611,194 ounces produced from Kolpa and 352,002 ounces produced from Terronera. Gold production totaled 37,164 ounces, 1,883 lower than the same period in 2024 predominantly due to the 10,542 lower production from Bolañitos driven by lower throughput, gold grades and gold recoveries and partially offset by 8,148 ounces produced from Terronera. Plant throughput reached 1,464,590 tonnes, 683,151 higher than the 781,439 tonnes processed in the year ended December 31, 2024, predominantly due to the 513,478 tonnes from Kolpa and 154,180 from Terronera.
Consolidated Operating Costs
Three months ended December 31, 2025 (compared to the three months ended December 31, 2024)
Direct operating costs per tonne in Q4 2025 were $164.21, 8% higher than $152.44 in Q4 2024. Increase in costs was partially driven by the appreciation of the Mexican Peso in comparison to the US dollar at the existing Mexican operations, and partially by the addition of Terronera which at $222.57 experienced higher than the group's consolidated average direct operating cost per tonne. These higher direct production costs were partially offset by the addition of Kolpa during 2025, which at $121.50 per tonne lowers the consolidated average direct operating cost per tonne.
Consolidated cash costs per silver ounce, net of by-product credits, were $19.05 in Q4 2025, 39% higher than $13.68 in Q4 2024, driven by the higher underlying cash costs. The increase was driven by a substantial change in the production profile. In Q4 2024, following the trunnion failure, Guanaceví had a lower influence in the overall average consolidated cash costs, which was in turn substantially impacted by the negative cash cost per oz at Bolañitos, lowering the consolidated cash cost per ounce. A higher contribution from Guanaceví in Q4 2025, which has a higher cash cost per oz at $31.18, in combination with the shift at Bolañitos toward higher silver to by-product gold production, have increased the cash cost per ounce. Offsetting this, the contribution of Kolpa's cash cost per oz at $11.42 and Terronera's cash cost per oz at $4.76 had a positive impact on the weighted average of consolidated cash costs.
Higher cash costs per silver ounce at Guanaceví were driven by lower grades, higher costs sensitive to metal prices: the cost per tonne of third party purchased material and royalties, appreciation of the Mexican peso relative to the US dollar and higher direct operating costs per tonne due to the ventilation challenges.
Consolidated all-In Sustaining Costs (AISC) per silver ounce in Q4 2025 were $41.19, 51% higher than $27.33 in Q4 2024. This increase was driven by the addition of Terronera which at $65.70 per oz incurred substantially higher AISC than the consolidated average predominantly due to higher sustaining capital expenditures during the first quarter of operations, as well as higher corporate general and administrative expenses caused by the revaluation of the deferred share unit allocated to the operations caused by the share price increase during the period.
Year ended December 31, 2025 (compared to the year ended December 31, 2024)
Consolidated direct operating costs per tonne for the year ended December 31, 2025, were $152.79, 8% higher than $140.98 in the same period of 2024. Consolidated direct costs per tonne were negatively impacted by the addition of Terronera. During its first quarter of commercial production with direct operating cost of $222.57, Terronera substantially exceeded the average consolidated direct costs per tonne due to anticipated higher costs per tonne driven by higher total costs and lower throughput during the first quarter of operations. This was partially offset by the addition of Kolpa which at $133.74 has direct operating costs below the consolidated average. Direct operating costs per tonne at Guanaceví remained consistent, and costs at Bolañitos increased 12% in line with lower throughput.
Consolidated cash costs per silver ounce, net of by-product credits, were $17.34 for the year ended December 31, 2025, 34% higher than $12.99 in the same period of 2024. The increase was driven by Guanaceví where the larger volume and higher price of third party purchased material, higher royalties and higher special mining duties, as well as higher costs net of by-product sales at Bolañitos were driven by higher silver and lower gold production. This was partially offset by the addition of Kolpa and Terronera which at $13.38 per ounce and $4.76 per ounce respectively helped decrease the consolidated average cash cost.
Consolidated AISC was $31.52 per ounce for the year ended December 31, 2025, 32% higher than the same period of 2024, driven by the higher cash costs at Bolañitos and Guanaceví due to the factors discussed above, and the addition of Kolpa at $27.99 and Terronera at $65.70 per ounce which had higher AISC compared to the Company's consolidated average AISC.
GUANACEVÍ OPERATIONS
The Guanaceví operation is currently producing from two underground silver-gold mines along a five kilometre ("km") length of the prolific Santa Cruz vein. Guanaceví provides steady employment to 590 employees and engages over 260 contractors. Guanaceví purchases mill feed from small scale local miners.
In July 2019, the Company acquired a 10 year right to explore and exploit the El Porvenir and El Curso concessions from Ocampo Mining SA de CV ("Ocampo"), a subsidiary of Grupo Frisco. The Company agreed to meet certain minimum production targets from the properties, subject to various terms and conditions, and pay Ocampo a $12 fixed per tonne production payment plus a floating net smelter return royalty based on the silver spot price. The Company pays a 4% royalty on sales below $15.00 per silver oz, 9% above $15.00 per silver oz, 13% above $20.00 per silver oz, and a maximum of 16% above $25 per silver oz.
Production Results for the Three Months and Years Ended December 31, 2025 and 2024
|
Three Months Ended December 31 |
GUANACEVÍ |
Twelve Months Ended December 31 |
||||
|
2025 |
2024 |
% Change |
|
2025 |
2024 |
% Change |
|
104,380 |
58,798 |
78% |
Ore tonnes processed |
402,992 |
353,793 |
14% |
|
291 |
440 |
(34%) |
Average silver grade (g/t) |
334 |
397 |
(16%) |
|
89.7 |
86.4 |
4% |
Silver recovery (%) |
90.3 |
89.0 |
1% |
|
877,554 |
718,797 |
22% |
Total silver ounces produced |
3,915,077 |
4,019,197 |
(3%) |
|
874,921 |
716,641 |
22% |
Payable silver ounces produced |
3,903,332 |
4,007,140 |
(3%) |
|
0.99 |
1.53 |
(35%) |
Average gold grade (g/t) |
1.16 |
1.35 |
(14%) |
|
90.1 |
90.7 |
(1%) |
Gold recovery (%) |
91.5 |
90.0 |
2% |
|
3,002 |
2,622 |
14% |
Total gold ounces produced |
13,747 |
13,817 |
(1%) |
|
2,993 |
2,613 |
15% |
Payable gold ounces produced |
13,706 |
13,775 |
(1%) |
|
1,117,703 |
928,557 |
20% |
Silver equivalent ounces produced(1) |
5,014,826 |
5,124,557 |
(2%) |
|
31.18 |
20.25 |
54% |
Cash costs per silver ounce(2) |
23.19 |
17.78 |
30% |
|
40.19 |
25.50 |
58% |
Total production costs per ounce(2) |
30.80 |
22.62 |
36% |
|
42.31 |
32.40 |
31% |
All in sustaining costs per ounce (2) |
31.37 |
26.29 |
19% |
|
196.45 |
230.50 |
(15%) |
Direct operating costs per tonne(2) |
186.16 |
188.71 |
(1%) |
|
383.98 |
365.23 |
5% |
Direct costs per tonne(2) |
342.81 |
293.90 |
17% |
(1) Silver equivalents are calculated using an 80:1 Ag:Au ratio.
(2) Non-IFRS measure. For a description of how these measures are calculated and a reconciliation of these measures to the most directly comparable measures specified, defined or determined under IFRS and presented in the Company's financial statements, refer to "Non-IFRS Measures".
Guanaceví Production Results
Three months ended December 31, 2025 (compared to the three months ended December 31, 2024)
During the three months ended December 31, 2025, the Guanacevíprocessed 104,380 tonnes of ore, 78% higher than 58,798 tonnes in the same period of 2024, due to a trunnion failure in August 2024 that negatively impacted Q4 2024 production. The average silver grade was 291 grams per tonne ("g/t") in Q4 2025, down from 440 g/t in Q4 2024. Silver recovery was 89.7%, up from 86.4% in Q4 2024, with Q4 2024 being negatively impacted by plant operational changes following the August 2024 trunnion failure. The higher quantity of milled tonnes was partially offset by lower silver grades, resulting in a 22% increase in total silver production to 877,554 ounces, compared to 718,797 ounces in Q4 2024. Gold production totaled 3,002 ounces, 14% higher than 2,622 ounces in Q4 2024. Higher gold production is result of higher throughput, partially offset by 35% lower average gold grades (0.99 g/t vs. 1.53 g/t). Changes in grade and recovery reflect typical variations between planned and actual grades, and from accessing different areas in the mine. Ore grades were expected to decrease from previous year and were slightly lower than planned.
Year ended December 31, 2025 (compared to the year ended December 31, 2024)
During the year ended December 31, 2025, the Guanaceví processed 402,992 tonnes of ore, 14% higher than 353,793 tonnes processed in the same period of 2024 as a result of the lower throughput in the comparative period following the trunnion failure in August 2024 which was repaired at the end of December 2024. The average silver grade was 334 g/t in 2025, lower than 397 g/t in 2024 due to expected variations in different areas of the mine. Despite the higher throughput and recoveries, the lower grades drove lower total silver production to 3,915,077 ounces, 3% lower than 4,019,197 ounces in 2024.
Gold production for the year ended December 31, 2025, was 13,747 ounces, 1% lower than 13,817 ounces produced in the same period of 2024. The lower gold production was primarily due to lower average grades, offset by higher throughput.
At Guanaceví, 2025 plant throughput was estimated to range from 1,000 tonnes per day (tpd) to 1,100 tpd and average 1,060 tpd with silver production estimated to range from 3.9 million oz to 4.4 million oz, and gold production estimated to range from 11,000 oz to 13,500 ounces. Using an 80:1 silver to gold ratio management estimated production to range between 4.8 million and 5.5 million silver equivalent ounces. Slightly higher throughput offset slightly lower silver equivalent ore grades during the year with production in line with guidance.
Guanaceví Operating Costs
Three months ended December 31, 2025 (compared to the three months ended December 31, 2024)
Direct operating costs per tonne for the three months ended December 31, 2025, were $196.45, 15% lower than $230.50 in the same period in 2024, primarily driven by the higher throughput in the current period as the trunnion failure resulted in lower throughput in Q4 2024. Including royalty and special mining duty costs, direct costs per tonne were $383.98 in Q4 2025 comparable with $365.23 in Q4 2024. Direct costs per tonne remained steady as higher direct costs were offset by 78% higher processed tonnes. Higher direct costs were in turn caused by higher third-party material purchases which have become more expensive on a per tonne basis due to higher metal prices, as well as a higher volume purchased in Q4 2025 compared to Q4 2024. Furthermore, direct costs were impacted by higher royalties which are based on metal prices, special mining duty tax which is based on the entity's earnings, and the appreciation of the Mexican peso quarter over quarter.
The purchase of local purchased material contributed $101.6 per tonne during Q4 2025 compared to $71.21 per tonne in Q4 2024; the volume of purchased material was higher at 24,346 tonnes compared to 13,842 tonnes in the same period in 2024. Total royalty expenses increased from $3.6 million in 2024 to $6.9 million, royalty expenses being included in direct cost per tonne and cost per oz metrics. Royalty expenses have increased due to the higher realized silver prices and volume of metal ounces sold in the period.
Cash costs per silver ounce were $31.18 in Q4 2025, 54% higher than $20.25 in Q4 2024. As noted above, lower silver ounce production was a result of 34% lower silver grade. The impact of the by-product credit was positive, increasing from $8.17 per oz to $12.20 per oz from higher gold prices, despite the consistent quantity of gold ounces sold. AISC per ounce also rose by 31% to $42.31 compared to $32.40 in Q4 2024, primarily due to the higher underlying cash costs per silver ounce and $1.7 million comparatively higher corporate general and administrative costs allocated to the operation, a result of the larger DSU revaluation with the appreciation of the Company’s share price.
Year ended December 31, 2025 (compared to the year ended December 31, 2024)
Direct operating costs per tonne for the year ended December 31, 2025, were $186.16, 1% lower than $188.71 in the same period in 2024. Higher mining costs from increased haulage, water management and ventilation were offset by higher output. Including royalty and special mining duty costs, direct costs per tonne were $342.81, 17% higher than $293.90 in 2024. This increase is reflective of higher costs of third-party material purchases, royalty costs and special mining duties which have become more expensive per tonne due to higher metal prices, and income before tax, as well as the pressure of the Mexican peso appreciating in comparison to the US dollar.
Cash costs per silver ounce, net of by-product credits, were $23.19 for the year ended December 31, 2025, 30% higher than $17.78 in 2024, driven by higher underlying cash costs net of by-product credits, and lower silver production. AISC per ounce were $31.37, 19% higher than $26.29 in 2024, due to the same cost drivers as described above as well as a $1.5 million higher general and administration allocation to Guanaceví, partially offset by $3.3 million lower sustaining capital expenditure compared to 2024.
BOLAÑITOS OPERATIONS
The Bolañitos operation encompasses three underground silver-gold mines and a flotation plant. Bolañitos provides steady employment for 510 employees and engages 235 contractors. Subsequent to year end, on January 15, 2026, the Company completed the planned divestiture of Bolañitos to Guanajuato Silver Company Ltd.
Production Results for the Three Months and Years Ended December 31, 2025 and 2024
|
Three Months Ended December 31 |
BOLAÑITOS |
Twelve Months Ended December 31 |
||||
|
2025 |
2024 |
% Change |
|
2025 |
2024 |
% Change |
|
93,620 |
106,793 |
(12%) |
Ore tonnes processed |
393,940 |
427,646 |
(8%) |
|
66 |
36 |
82% |
Average silver grade (g/t) |
57 |
39 |
47% |
|
85.4 |
85.5 |
(0%) |
Silver recovery (%) |
84.0 |
84.4 |
(0%) |
|
168,783 |
105,732 |
60% |
Total silver ounces produced |
608,388 |
452,627 |
34% |
|
160,647 |
100,651 |
60% |
Payable silver ounces produced |
578,959 |
431,214 |
34% |
|
1.03 |
1.95 |
(47%) |
Average gold grade (g/t) |
1.37 |
1.98 |
(31%) |
|
84.8 |
96.4 |
(12%) |
Gold recovery (%) |
87.9 |
92.7 |
(5%) |
|
2,636 |
6,453 |
(59%) |
Total gold ounces produced |
15,270 |
25,230 |
(39%) |
|
2,530 |
6,285 |
(60%) |
Payable gold ounces produced |
14,795 |
24,552 |
(40%) |
|
379,632 |
621,972 |
(39%) |
Silver equivalent ounces produced(1) |
1,829,957 |
2,471,027 |
(26%) |
|
11.18 |
(33.11) |
134% |
Cash costs per silver ounce(2) |
(4.35) |
(31.47) |
86% |
|
22.23 |
(11.03) |
302% |
Total production costs per ounce(2) |
13.34 |
(7.43) |
280% |
|
35.95 |
(8.78) |
509% |
All in sustaining costs per ounce (2) |
22.06 |
1.47 |
1405% |
|
122.84 |
109.46 |
12% |
Direct operating costs per tonne(2) |
116.19 |
101.49 |
14% |
|
136.00 |
123.73 |
10% |
Direct costs per tonne(2) |
124.21 |
108.63 |
14% |
(1) Silver equivalents are calculated using an 80:1 Ag:Au ratio.
(2) Non-IFRS measure. For a description of how these measures are calculated and a reconciliation of these measures to the most directly comparable measures specified, defined or determined under IFRS and presented in the Company's financial statements, refer to "Non-IFRS Measures".
Bolañitos Production Results
Three months ended December 31, 2025 (compared to the three months ended December 31, 2024)
During the three months ended December 31, 2025, Bolañitos processed 93,620 tonnes of ore, 12% lower than 106,793 tonnes in the same period of 2024, driven by planned down time for maintenance resulting in fewer operating days. The average silver grade was 66 g/t in Q4 2025, 82% higher than 36 g/t in Q4 2024. The higher silver grade was only partially offset by slightly lower throughput, resulting in 60% higher silver production of 168,783 ounces, compared to 105,732 ounces in Q4 2024.
Gold production totaled 2,636 ounces, 59% lower than 6,453 ounces in Q4 2024, reflecting a 47% decrease in average gold grade (1.03 g/t vs. 1.95 g/t), and 12% lower recoveries and throughput. Gold recoveries have been negatively affected by the fluctuations in grades which in turn are caused by accessing different areas of the mine.
Year ended December 31, 2025 (compared to the year ended December 31, 2024)
Silver production at Bolañitos was 608,388 oz during the year ended December 31, 2025, 34% higher than in 2024. Gold production during the year was 39% lower at 15,270 oz compared to the 25,230 oz in 2024.
Plant throughput for the year ended December 31, 2025, was 8% lower at 393,940 tonnes, partially due to the repair of the ball mill motor stator and primary crusher replacement during the year, and partially due to the extended maintenance down time in Q4. Average silver grades were 47% higher at 57 gpt silver driving the 34% higher silver production, however average gold grades were 31% lower at 1.37 gpt gold, driving the 39% lower gold production. Changes in grade reflect expected variations to differences between planned and actual grades and from accessing different areas in the mine.
At Bolañitos, 2025 plant throughput was estimated to range from 1,100 tpd to 1,200 tpd and average 1,170 tpd with silver production estimated to range from 0.6 million oz to 0.8 million oz, and gold production estimated to range from 19,500 oz to 20,500 oz. Using an 80:1 silver to gold ratio management estimated production to range between 2.2 million and 2.4 million silver equivalent ounces. Lower throughput, ore grades and recoveries resulted in lower silver equivalent production than expected during the year. Significantly higher prices resulted in lower grade ores to be mined to extend the mine life of the operations. The lower ore grades impact recoveries, while lower throughput was due to extended downtime within the plant.
Bolañitos Operating Costs
Three months ended December 31, 2025 (compared to the three months ended December 31, 2024)
Direct operating cost per tonne increased by 12% from $109.46 per tonne in Q4 2024 to $122.84 in Q4 2025, driven by 12% lower throughput. Cash costs per silver ounce were $11.18 in Q4 2025, compared to negative $33.11 in Q4 2024. In addition to lower throughput, this change is predominantly caused by the 37% lower by-product credit, partially offset by higher silver production. Total production costs per ounce increased to positive $22.23 per oz from negative $11.03 per oz in Q4 2024, due to the higher cash costs per ounce with no substantial changes in other production costs. As a result of higher cash cost per silver oz and higher sustaining capital expenditures, and higher allocated general and administrative expenses, driven by DSU revaluation, AISC have increased from negative $8.78 per oz to positive $35.95 per oz.
Year ended December 31, 2025 (compared to the year ended December 31, 2024)
Cash costs per silver ounce were negative $4.35 for the year ended December 31, 2025, compared to negative $31.47 in the same period of 2024. This change is predominantly due to the 39% lower gold production, which resulted in a 14% lower by-product credit, in addition to slightly higher direct operating costs driven by appreciation of the Mexican peso in comparison to US dollar and was partially offset by 34% higher silver production. Total production costs per ounce increased to positive $13.34 from negative $7.43 in 2024, reflecting the increase in the cash cost per silver ounce and with no substantial changes in other production costs. AISC per ounce increased to $22.06 compared to $1.47 in the same period of 2024, due to the higher total production cost per ounce and higher sustaining capital expenditures, partially offset by lower loan payments, general and administrative expenses compared to the same period of 2024.
As noted above, on January 15, 2026, subsequent to year end, the Company sold the Bolañitos mine.
KOLPA OPERATIONS
Kolpa, was acquired by Endeavour Silver in May 2025 and is in the Huachocolpa region of Huancavelica, about 490 kilometers southeast of Lima, Peru, a key mining jurisdiction, ranks as the world's third largest silver producer. In 2024, Kolpa processed approximately 685,000 tonnes, yielding 2.0 million ounces of silver, along with 19,820 tonnes lead, 12,554 tonnes zinc and 518 tonnes copper. In silver-equivalent terms, this amounted to a total production of 5.1 million ounces (Moz). The Kolpa produces three types of concentrate and receives payment for other recovered minerals, including gold and antimony. Kolpa provides steady employment for approximately 600 employees and 1,800 contractors.
The Company has filed a technical report prepared in accordance with NI 43-101 entitled, "Technical Report on the Huachocolpa Uno Mine Property, Huancavelica Province, Peru" (the "Current Technical Report"). The Current Technical Report has an effective date of December 31, 2024, and was prepared by Allan Armitage, Ph. D., P. Geo., Ben Eggers, MAIG, P.Geo., Henri Gouin, P.Eng. each of SGS Geological Services, and by Dale Mah, P.Geo., and Donald Gray, SME-RM of Endeavour.
The Current Technical Report contains a historical mineral resource estimate (the "Historical Estimate"), originally disclosed in a technical report titled "Huachocolpa Uno Preliminary Economic Assessment" dated May 7, 2024. The Historical Estimate is not considered current and is not being relied upon by the Company. A qualified person has not done sufficient work to classify the Historical Estimate as current mineral resources. The Company is not treating the Historical Estimate as current mineral resources, has not verified this information and is not relying on it.
Production Results for the Three Months and Year December 31, 2025 and 2024
|
Three Months Ended December 31(3) |
KOLPA |
Twelve Months Ended December 31(3) |
||||
|
2025 |
2024 |
% Change |
|
2025 |
2024 |
% Change |
|
198,830 |
- |
- |
Tonnes processed |
513,478 |
- |
- |
|
108 |
- |
- |
Average silver grade (g/t) |
108 |
- |
- |
|
91.4 |
- |
- |
Silver recovery (%) |
90.7 |
- |
- |
|
631,867 |
- |
- |
Total silver ounces produced |
1,611,194 |
- |
- |
|
596,781 |
- |
- |
Payable silver ounces produced |
1,523,145 |
- |
- |
|
3.06 |
- |
- |
Average Pb grade (%) |
3.08 |
- |
- |
|
94.4 |
- |
- |
Lead recovery (%) |
94.3 |
- |
- |
|
5,750 |
- |
- |
Total lead tonnes produced |
14,917 |
- |
- |
|
5,462 |
- |
- |
Payable lead tonnes produced |
14,161 |
- |
- |
|
1.83 |
- |
- |
Average Zn grade (%) |
2.07 |
- |
- |
|
83.4 |
- |
- |
Zinc recovery (%) |
84.9 |
- |
- |
|
3,034 |
- |
- |
Total zinc tonnes produced |
9,016 |
- |
- |
|
2,578 |
- |
- |
Payable zinc tonnes produced |
7,782 |
- |
- |
|
0.20 |
- |
- |
Average Cu grade (%) |
0.21 |
- |
- |
|
26.7 |
- |
- |
Copper recovery (%) |
26.7 |
- |
- |
|
106 |
- |
- |
Total copper tonnes produced |
284 |
- |
- |
|
102 |
- |
- |
Payable copper tonnes produced |
272 |
- |
- |
|
1,266,557 |
- |
- |
Silver equivalent ounces produced(1) |
3,357,774 |
- |
- |
|
11.42 |
- |
- |
Cash costs per silver ounce(2) |
13.38 |
- |
- |
|
25.30 |
- |
- |
Total production costs per ounce(2) |
27.24 |
- |
- |
|
27.19 |
- |
- |
All in sustaining costs per ounce(2) |
27.99 |
- |
- |
|
121.50 |
- |
- |
Direct operating costs per tonne(2) |
133.74 |
- |
- |
|
131.93 |
- |
- |
Direct costs per tonne(2) |
143.51 |
- |
- |
(1) Silver equivalents are calculated using an 60:1 Ag:Pb ratio, 85:1 Ag:Zn ratio and 300:1 Ag:Cu ratio.
(2) Non-IFRS measure. For a description of how these measures are calculated and a reconciliation of these measures to the most directly comparable measures specified, defined or determined under IFRS and presented in the Company's financial statements, refer to "Non-IFRS Measures".
(3) The production results for the year ended December 31, 2025, show only eight months of operations, following the Kolpa acquisition on May 1, 2025. As the asset was not owned or operated by the Company during the comparative periods in 2024, no corresponding data is presented for those periods. As such, year-over-year comparisons are not applicable and should be interpreted accordingly.
Kolpa Production Results
Three months ended December 31, 2025
During the three months ended December 31, 2025, Kolpa processed 198,830 tonnes. The average silver grade was 108 g/t, with a recovery of 91.4%, resulting in silver production of 631,867 ounces. Lead production totaled 5,750 tonnes, based on an average grade of 3.06% and a recovery of 94.4%. Zinc production was 3,034 tonnes, with an average grade of 1.83% and a recovery of 83.4%. Copper production reached 106 tonnes, with an average grade of 0.2% and a recovery of 26.7%. Throughput was slightly higher in Q4 than Q3 however production was partially offset by lower grades. Production was in line with management's expectations and slightly above historical performance.
Year to date discussion & analysis: Eight months ended December 31, 2025
During the eight months ended December 31, 2025, the Kolpa processed 513,478 tonnes. The average silver grade was 108 g/t, with a recovery of 90.7%, resulting in silver production of 1,611,194 ounces. Lead production totaled 14,917 tonnes, based on an average grade of 3.08% and a recovery of 94.3%. Zinc production was 9,016 tonnes, with an average grade of 2.07% and a recovery of 84.9%. Copper production reached 284 tonnes, with an average grade of 0.21% and a recovery of 26.7%. Production was in line with management's expectations and historical performance.
Kolpa Operating Costs
Three months ended December 31, 2025
Direct cost per tonne was $131.93 slightly below the prior quarters due to the increased throughput. During the three months ended December 31, 2025, Kolpa's cash costs were $11.42 per silver ounce. Costs were in line with prior quarters and management expectations and they reflect the environment of high metal prices which have negatively impacted the cost of purchased third-party material, royalties, Peruvian special mining tax, and employee participation in profits, as well as by appreciating value of the Peruvian sol against the US dollar which increases costs relative to prior quarters. AISC included additional exploration, allocation of DSU revaluation driven by the Company's share price increase which is included in corporate general & administrative costs, as well as sustaining capital expenditures during the period. AISC accounts for a substantial amount of the sustaining capital expenditure which was incurred as part of the post acquisition infrastructure improvement but does not qualify to be classified as expansionary. AISC totaled $27.19 per ounce, due to the reasons stated above.
Year to date discussion & analysis: Eight months ended December 31, 2025
During the eight months ended December 31, 2025, Kolpa's cash costs were $13.38 per silver ounce. Inclusive of depreciation and share-based compensation, total production costs totaled $27.24 per ounce. AISC included additional exploration, general and administrative, and sustaining capital expenditures totaling $27.99 per ounce, driven by the same items described above.
TERRONERA OPERATIONS
Terronera mine, located approximately 40 km northeast of Puerto Vallarta in the state of Jalisco, Mexico, hosts a high-grade silver-gold mineral resource along the Terronera vein. Terronera achieved commercial production on October 1, 2025, after consistently exceeding an average of 90% of the designed nameplate capacity of 2,000 tonnes per day, while also achieving at least 90% of the projected metal recoveries. Terronera provides steady employment for 460 employees and engages 570 contractors.
|
Three Months Ended December 31(3) |
TERRONERA |
Twelve Months Ended December 31(3) |
||||
|
2025 |
2024 |
% Change |
|
2025 |
2024 |
% Change |
|
154,180 |
- |
- |
Ore tonnes processed |
154,180 |
- |
- |
|
86.0 |
- |
- |
Average silver grade (g/t) |
86.0 |
- |
- |
|
82.6 |
- |
- |
Silver recovery (%) |
82.6 |
- |
- |
|
352,002 |
- |
- |
Total silver ounces produced |
352,002 |
- |
- |
|
334,850 |
- |
- |
Payable silver ounces produced |
334,850 |
- |
- |
|
2.27 |
- |
- |
Average gold grade (g/t) |
2.27 |
- |
- |
|
72.5 |
- |
- |
Gold recovery (%) |
72.5 |
- |
- |
|
8,148 |
- |
- |
Total gold ounces produced |
8,148 |
- |
- |
|
7,839 |
- |
- |
Payable gold ounces produced |
7,839 |
- |
- |
|
1,003,822 |
- |
- |
Silver equivalent ounces produced(1) |
1,003,822 |
- |
- |
|
4.76 |
- |
- |
Cash costs per silver ounce(2) |
4.76 |
- |
- |
|
27.49 |
- |
- |
Total production costs per ounce(2) |
27.49 |
- |
- |
|
65.70 |
- |
- |
All in sustaining costs per ounce (2) |
65.70 |
- |
- |
|
222.57 |
- |
- |
Direct operating costs per tonne(2) |
222.57 |
- |
- |
|
230.35 |
- |
- |
Direct costs per tonne(2) |
230.35 |
- |
- |
(1) Silver equivalents are calculated using an 80:1 Ag:Au ratio.
(2) Non-IFRS measure. For a description of how these measures are calculated and a reconciliation of these measures to the most directly comparable measures specified, defined or determined under IFRS and presented in the Company's financial statements, refer to "Non-IFRS Measures".
(3) The Terronera Project achieved commercial production effective October 1, and due to that the production results for the year ended December 31, 2025, show only three months of operations. As the asset was in development prior to October 1, 2025, no corresponding data is presented for those periods. As such, year-over-year comparisons are not applicable and should be interpreted accordingly.
Terronera Production Results
Three months ended December 31, 2025
During Q4 2025, the first period of commercial production, Terronera, produced 352,002 ounces of silver and 8,148 ounces of gold. The plant processed 154,180 ore tonnes with average grades of 86 g/t silver and 2.27 g/t gold. During 2025 ore was mined from areas of a deposit with lower grades including stockwork, as mine development accesses higher-grade areas in H2 2026, which will increase grades. Throughput was impacted by several disruptions associated with new operations. In Q4, electrical disruptions significantly impacted the consistency of throughput, while a number of initiatives commenced to improve the operability and efficiency of the plant. Due to the several starts and stops, recoveries have not substantially progressed beyond recoveries achieved at the late phase of pre-production in the last month of Q3. During the quarter, the mill achieved average metal recoveries of 82.6% for silver and 72.5% for gold, compared to designed recoveries of 89% and 76% respectively.
Terronera Operating Costs
Three months ended December 31, 2025
During the three months ended December 31, 2025, Terronera's direct operating costs were $222.57 per tonne. Direct operating costs were impacted by lower than planned throughput, and higher ramp up costs incurred during the first quarter of commercial operations. Construction contractors were largely demobilized before commercial production, with some finalizing their services during Q4, and operational teams continued to ramp up and complete training through the period. Cash costs were $4.76 per silver ounce. Due to the factors described above, lower metal production resulted in higher-than-expected cash cost per oz. AISC included additional exploration costs, as well as substantial general and administrative costs allocated to Terronera, which were higher than budgeted due to DSU revaluation loss driven by share price appreciation. Additionally, AISC included $16.3 million ($48.67 per oz) capital expenditures classified as sustaining as they do not meet the definition of expansionary; these are one-off capital expenditures related to the optimization of the production of the expanded mine and plant operations. Due to these factors in combination with lower metal production, AISC in Q4 2025 was $65.70 per oz.
EXPLORATION AND EVALUATION
During 2025, the Company advanced exploration activities across its core assets and the newly acquired Kolpa project, with a continued focus on expanding mineral resources and refining geological interpretations. A total of 295 drill holes were completed, representing approximately 55,109 meters of drilling, with total exploration expenditures of $25.6 million for the year, inclusive of holding costs.
At Terronera, during Q4 2025, the Company drilled 15 holes totaling 2,975 meters at a cost of $0.7 million, with activities focused on underground diamond drilling in the La Luz deposit. For the twelve months ended December 31, 2025, a total of 44 drill holes were completed, comprising of 7,146 meters, at an aggregate cost of $1.7 million. The purpose of the drilling is to better define the La Luz ore body to provide a more detailed mine plan. Management expects the drilling to increase the total current resources. In addition, the Company incurred $2.4 million in evaluation and non-capital expenditures over the year.
At Guanaceví, Q4 2025 drilling consisted of 7 holes totaling 1,929 meters at a cost of $0.4 million, focused on underground diamond drilling in the El Curso mine. Drilling targeted the La Cruz area between the Milache and El Curso mines, as well as the Alondra area located between El Curso and Porvenir Cuatro. For the twelve months ended December 31, 2025, the Company completed 23 drill holes totaling 5,870 meters, at an aggregate cost of $1.2 million.
At Bolañitos, during Q4 2025, the Company drilled 6 holes totaling 987 meters at a cost of $0.1 million. Activities primarily involved underground drilling in the Lana NW area targeting the Lana FW vein. For the twelve months ended December 31, 2025, a total of 38 drill holes were completed, comprising 7,889 meters, at an aggregate cost of $0.8 million.
At Kolpa, during the fourth quarter, the Company drilled 46 holes totaling 10,083 meters and completed 2,159 meters of exploration drift development at a cost of $0.7 million. Underground exploration activities were conducted across the Bienaventurada, Poderosa Oeste, Caudalosa Chica, and Yamila areas. Drilling results confirmed mineral potential and supported continued resource development. For the eight months ended December 31, 2025, the Company drilled a total of 138 holes, comprising 24,038 meters of drilling, and completed 5,426 meters of exploration drift development, at an aggregate cost of $4.2 million.
At Pitarrilla, no drilling was conducted during the quarter, with activities instead focused on technical study work and infrastructure rehabilitation at a cost of $1.4 million. Key activities included completion of mine design, continued evaluation of power requirements, clearing of plant and office site, design of the construction camp, design of tailings management facilities and continued baseline studies. Environmental activities progressed through monthly water table monitoring, well rehabilitation, flora relocation, and completion of the first environmental baseline field campaign. The Land Use Change permit was executed through vegetation clearing along access roads and permitted area polygons.
For the twelve months ended December 31, 2025, the Company drilled a total of 42 holes, comprising 7,333 meters of drilling, and completed 670 meters of development primarily in the exploration ramp, drill stations, and cross-cuts, at a total cost of $6.2 million. In addition, $2.8 million was incurred during the year for evaluation and non-capital expenditures to advance Pitarrilla-related studies.
In Chile, no drilling occurred during the quarter; however, $0.2 million was incurred to continue preparation and permitting activities for the next drilling campaign at Catalina. Earlier in the year, drilling activities focused on the Anastasia project, including the Jimena, Millaray, Quillay, and Julieta veins; however, the project was formally closed during the fourth quarter, the option agreement was terminated and the costs capitalized to date of $0.3 million were impaired to nil. Exploration activities at the Aida, Genesis, Karla, and Constanza projects continued through geological mapping, environmental permitting, geochemical and spectral studies, and community engagement efforts. For the twelve months ended December 31, 2025, the Company drilled a total of 10 holes totaling 2,834 meters, at a cost of $1.8 million.
At Parral, Q4 activities at the Veta Colorada area focused on pump monitoring and maintenance of underground infrastructure. Total expenditures for the quarter amounted to $0.1 million, with $0.4 million incurred during the twelve months ended December 31, 2025.
At other properties in Mexico, the Company incurred $0.1 million during the quarter related to care and maintenance activities at the Guadalupe y Calvo, Zacatecas, and El Cubo properties, for total expenditures of $0.2 million during 2025.
The Company also incurred $2.3 million in ongoing holding costs related to exploration concessions and properties across its portfolio, as well as $1.6 million in administrative and corporate costs associated with exploration activities during the year.
CONSOLIDATED FINANCIAL RESULTS
Three months ended December 31, 2025 (compared to the three months ended December 31, 2024)
Revenue of $172.6 million in Q4 2025, net of $3.8 million of smelting and refining costs, has significantly increased compared to $42.2 million, net of $0.5 million of smelting and refining costs, in Q4 2024. Gross sales of $176.4 million in Q4 2025 are 309% higher than gross sales of $42.7 million for the same period in 2024. Gross sales have increased predominantly due to the $50.7 million of revenue contribution from Kolpa, and $50.7 million of revenue from Terronera, with the remaining increase caused by a 74% increase in realized price of silver and 62% increase in realized price of gold, partially offset by slightly lower production from Bolañitos and Guanaceví.
During Q4 2025, the Company sold 1,879,937 oz silver and 12,614 oz gold, at realized prices of $54.83 and $4,283 per oz, respectively, compared to sales of 654,519 oz silver and 8,343 oz gold, at realized prices of $31.56 and $2,647 per oz, respectively, in the same period of 2024. For the three months ended December 31, 2025, the realized prices of silver were within 1% of the average market prices and gold prices were within 3% of market prices. Silver and gold market prices averaged $55.26 and $4,154 per oz, respectively. Additionally, the Company recorded $10.8 million from sales of lead, $7.2 million from sales of zinc, $1.1 million from sales of copper, and $0.3 million from sales of other metals including antimony.
Cost of sales for Q4 2025 was $126.0 million, an increase of 266% over the cost of sales of $34.5 million for Q4 2024. The increase in the cost of sales compared to the prior period was driven by $31.3 million costs at Kolpa and $38.7 million from Terronera. Remaining increase in cost of sales comes from Bolañitos and Guanaceví, predominantly due to the increase in cost of purchased material and royalties and partially due to the higher depreciation cost and higher mining cost which are caused by the advancing ages of the mines. The Company's mine operating earnings were $46.6 million in Q4 2025, $38.8 million higher than the $7.7 million in the comparative period, due to the $11.0 million higher operating earnings in Bolañitos and Guanaceví, $16.6 million operating earnings from Kolpa, and $11.1 million from Terronera..
Exploration, evaluation and development expenses were $6.7 million compared to $6.1 million incurred in the same period of 2024, primarily due to the additional exploration expenditures in Q4 2025 on advancing the Pitarrilla Project as well as additional exploration work at Kolpa, partially offset by the lower expenses at Terronera where in Q4 2024 the Company incurred certain project costs that were not eligible for capitalization, such as supervisory activities and allocated general and administrative costs. General and administrative expenses of $4.9 million in Q4 2025 were higher compared to the $1.9 million incurred in the same period of 2024. Of the $3.0 million increase in general and administrative expenses, $1.8 million was due to the larger revaluation of the DSU's to their fair market value caused by the increase in the share price. Remaining increase is caused by $0.5 million higher direct costs, $0.4 million higher share-based compensation caused by forfeitures in Q4 2024 and $0.3 million comparatively higher salaries. As a result, the Company incurred operating earnings of $34.6 million for the quarter (Q4 2024 - operating loss of $0.5 million).
The Company incurred a foreign exchange loss of $0.1 million in Q4 2025 compared to a gain of $0.4 million in Q4 2024. For the three months period ended December 31, 2025, due to the revaluation of the Mexican peso forward contracts, gold forward swap contracts, silver collars, copper stream liability and the redemption feature derivative embedded into the convertible notes the Company recognized a net loss on derivative contracts of $45.2 million (Q4 2024 - $1.9 million), primarily from the loss on revaluation of the gold forward swap contracts of $25.4 million (Q4 2024 - $0.5 million gain) and silver collar contract of $17.0 million (Q4 2024 - $ nil), and $9.8 million loss on revaluation of copper stream liability (Q4 2024 - $nil), partially offset by $0.6 million gains on Mexican peso forward contracts (Q4 2024 - loss of $2.4 million) and $6.2 million gain on the redemption feature derivative in the convertible note.
The Company incurred $11.9 million in finance charges (Q4 2024 - $0.4 million) primarily from $6.3 million incurred due to write-off of deferred financing costs and penalties incurred on early repayment of the Terronera debt facility. Remaining $5.9 million relates to interest on Terronera debt facility, and Kolpa loans prior to their extinguishment in December, interest on loans related to mobile equipment and leases and accretion of reclamation and rehabilitation liabilities. Additionally, in Q4 2025 the Company recognized a loss of $2.5 million in investment and other income, compared to income of $0.7 million in Q4 2024, predominantly due to the change in the value of marketable securities. These losses, contributed to a loss before taxes for Q4 2025 of $25.0 million (Q4 2024 - loss of $1.6 million).
Income tax recovery was $1.2 million in Q4 2025 compared to recovery of $2.7 million in Q4 2024. The $1.2 million tax recovery is comprised of $11.6 million expense in current income tax (Q4 2024 - recovery of $0.2 million) and a recovery of $12.8 million in deferred income tax (Q4 2024 - recovery of $2.5 million). The current income tax expense consists of $3.6 million in special mining duty taxes and $8.0 million expense of current income taxes. The deferred income tax recovery of $22.4 million primarily reflects the recognition of deferred tax assets on previously unrecognised loss carry forwards, supported by taxable temporary differences arising from the equity component of the convertible note. The related deferred tax liability was recorded in equity, while the deferred tax recovery was recognized in profit or loss. After these tax charges, the Company realized a net loss for the period of $23.8 million (Q4 2024 - net earnings of $1.0 million).
The Company's adjusted net earnings were $4.8 million in Q4 2025, compared to $4.8 million in Q4 2024, due to the number of offsetting differences. Largest differences include $27.2 million realized losses from derivative contracts and $11.5 million comparatively higher financing costs largely due to the early repayment of debt facility, offset by $33.8 million higher operating profit and $3.9 million comparatively higher realized foreign currency revaluation loss. Adjusted net earnings (loss) is a Non-IFRS measure. For a description of how these measures are calculated and a reconciliation of these measures to the most directly comparable measures specified, defined or determined under IFRS and presented in the Company's financial statements, refer to "Non-IFRS Measures".
As at December 31, 2025, the Company's finished goods inventory included 318,008 oz of silver and 1,597 oz of gold, compared to 228,652 oz silver and 775 oz gold at September 30, 2025. The cost allocated to these finished goods was $15.3 million as at December 31, 2025, compared to $8.8 million at September 30, 2025. As at December 31, 2025, the finished goods inventory fair market value was $29.8 million, compared to $13.5 million at September 30, 2025.
Year ended December 31, 2025 (compared to the Year ended December 31, 2024)
Revenue of $467.5 million, net of $9.0 million of smelting and refining costs, increased by 115% compared to $217.6 million, net of $2.0 million of smelting and refining costs, in 2024. Gross sales of $476.5 million in the period are 117% higher than $219.6 million during the same period in 2024.
The increase in gross sales was driven primarily by the addition of $116.5 million from Kolpa and $86.4 million from Terronera as well as a 49% increase in realized silver prices and a 50% increase in realized gold prices. During the period, the Company sold 6,562,106 oz silver and 43,430 oz gold (inclusive of 240,231 oz of silver and 7,094 oz of gold from pre-operating production at Terronera), for realized prices of $40.73 and $3,591 per oz, respectively, compared to sales of 4,645,574 oz silver and 38,522 oz gold, for average realized prices of $27.39 and $2,397 per oz, respectively, in the same period of 2024.
Cost of sales for the year ended December 31, 2025, totaled $384.7 million, an 119% increase over $175.6 million in the same period in 2024. This increase was primarily driven by $87.9 million in cost of sales in Kolpa, as well as by $83.0 million in Terronera, which resulted in mine operating earnings of $82.8 million (2024 - $42.0 million).
Exploration, evaluation and development expenses were $23.4 million, compared to $19.4 million incurred in the same period of 2024, mostly influenced by the higher spending at Pitarrilla and partially offset by the lower development costs ineligible to be capitalized at Terronera such as supervisory activities and allocated general and administrative costs. General and administrative expenses of $23.3 million for the year ended December 31, 2025, were 65% higher compared to the $14.1 million incurred for the same period of 2024, primarily due to the $3.7 million comparatively higher loss on revaluation of directors DSU's carried at fair market value and $3.6 million of Kolpa business acquisition costs. These changes resulted in operating earnings of $35.7 million (2024 - earnings of $8.3 million).
The Company incurred losses on derivative revaluation of $126.2 million (2024 – $30.5 million) mostly driven by $106.0 million loss on gold forward swaps (2024 – 24.6 million), and $21.5 million loss on silver collars (2024 – $ nil) and $13.2 million copper stream liability revaluation (2024 – $ nil) and partially offset by $8.3 million gain on Mexican Peso forward (2024 – loss of $5.9 million) and $6.1 million gain on revaluation of the redemption feature derivative embedded in the convertible senior notes. Due to the timing of transactions and their settlements the Company incurred modest foreign exchange gain of $0.3 million during the year ended December 31, 2025, compared to a more substantial foreign exchange loss of $5.5 million in 2024. The Company incurred $14.5 million in finance charges primarily from $7.0 million write-off of deferred and additional fees incurred on early debt repayment, $4.8 million interest on loans and leases, $1.5 million finance charge on the senior convertible notes, and $1.2 million accretion of reclamation and rehabilitation liabilities. These finance charges are in comparison to $1.5 million for the same period in 2024 where the Company only incurred $0.8 million interest on certain loans and $0.7 million accretion of reclamation and rehabilitation liabilities. Note that due to the Terronera construction, the Terronera debt facility interest was capitalized in the prior year. The Company recognized $0.2 million in investment and other loss compared to $7.2 million in investment and other income in 2024. Investments and other income during the current period were driven by the Company recognizing $2.8 million in interest income (2024 – $7.5 million) and unrealized gain on marketable securities of $0.7 million in 2025 (2024 – loss of $1.8 million) offset by other losses. Additionally, during 2025 the Company incurred $0.8 million revaluation losses on conditional consideration related to acquisition of Kolpa, and $0.7 million provision costs and $0.5 million of other losses, while in 2024 the Company recognized $1.0 million of previously contingent consideration on the sale of the Cubo, and $0.5 million of other gains. As a result, the loss before taxes for the year ended December 31, 2025, was $104.9 million (2024 – $22.0 million).
Income tax expense was $14.2 million for the year ended December 31, 2025, compared to $9.5 million for the same period in 2024. The $14.2 million tax expense is comprised of $36.6 million in current income tax expense (2024 - $12.9 million) and a recovery of $22.4 million in deferred income tax (2024 - recovery of $3.4 million). The current income tax expense consists of $9.1 million in special mining duty taxes and $27.5 million of income taxes (2024 - $5.0 million and $7.9 million respectively). The deferred income tax recovery of $22.4 million primarily reflects the recognition of deferred tax assets on previously unrecognised loss carry forwards, supported by taxable temporary differences arising from the equity component of the convertible note. The related deferred tax liability was recorded in equity, while the deferred tax recovery was recognized in profit or loss.
SELECTED ANNUAL INFORMATION
| Expressed in millions US dollars except per share amounts |
Year ended December 31 | ||
| 2025 | 2024 | 2023 | |
| Revenue | $467.5 | $217.6 | $205.5 |
| Net earnings (loss) | ($119.1) | ($31.5) | $6.1 |
| Basic earnings (loss) per share | ($0.42) | ($0.13) | $0.03 |
| Diluted earnings (loss) per share | ($0.42) | ($0.13) | $0.03 |
| Dividends per share | - | - | - |
| Total assets | 1,235.7 | $719.2 | $474.8 |
| Total long-term liabilities | 379.9 | $155.9 | $30.2 |
KEY ECONOMIC TRENDS
Precious Metal Price Trends
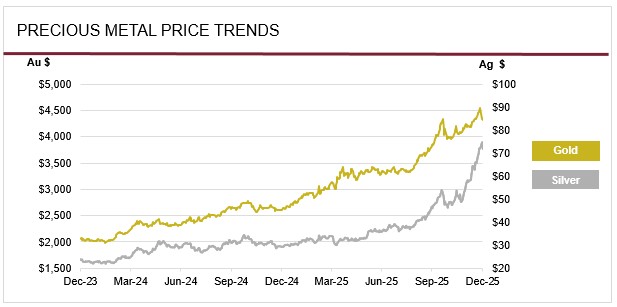
The prices of silver and gold are a critical factor in determining profitability and cash flow from operations. The financial performance of the Company has been, and is expected to continue to be, closely linked to the prices of silver and gold. These precious metals represented 91% of revenue in 2025.
During the year ended December 31, 2025, the average price of silver was $40.21 per ounce, with silver trading between $29.41 and $74.84 per oz. This compares to an average of $23.35 per oz for the year ended December 31, 2024, with a low of $20.09 and a high of $26.03 per oz. For the year ended December 31, 2025, the Company realized an average price of $40.73 per silver oz compared with $27.39 per oz for the year ended December 31, 2024.
During the year ended December 31, 2025, the average price of gold was $3,448 per oz, with gold trading between $2,633 and $4,539 per oz. This compares to an average of $2,385 per oz for the year ended December 31, 2024, with a low of $1,985 and a high of $2,778 per oz. For the year ended December 31, 2025, the Company realized an average price of $3,591 per oz compared with $2,397 per oz for the year ended December 31, 2024.
Several factors drove the largest annual rise in gold price since 2010. Global tensions, including ongoing conflicts in Ukraine and the Middle East, expectations of slower economic growth, concerns over U.S. trade policies, and tariffs pushed investors and central banks toward gold to diversify away from the U.S. dollar and other fiat currencies. These dynamics propelled gold to record highs, with prices reaching an all-time peak of $4,539 per ounce in December 2025 and silver reaching $74.84 per oz in the same month. Beyond the safe haven characteristic of silver, there has been a growing sense of optimism in the silver market, driven by industrial demand and supply constraints. The global push towards electrification, renewable energy, solid state batteries, and electric vehicles, is expected to increase the demand for silver in industrial applications. Silver plays an indispensable role in solar panels, batteries, and other key technologies, positioning it as a strategic metal in the clean energy transition. Over this same period of industrial demand growth, the silver market has faced supply-demand deficits in recent years, with exploration, new discoveries and new production not keeping pace with mine resource depletion. A lack of new major projects coming online, is creating a supply-demand imbalance that has supported the rise of silver price since the beginning of 2023 and especially noted at the end of 2025.
Currency Fluctuations
The Company's operations in Q4 2025 were located in Mexico and Peru therefore a significant portion of operating costs and capital expenditures are denominated in Mexican pesos and Peruvian soles. The Company's corporate activities are based in Vancouver, Canada with a portion of these expenditures being denominated in Canadian dollars.
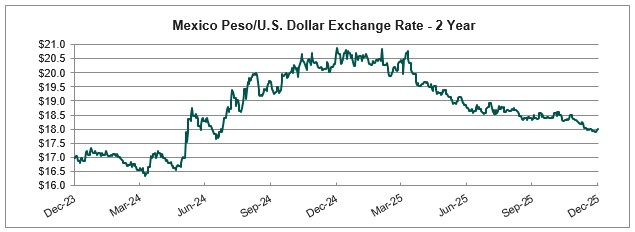
During the year ended December 31, 2025, the Mexican peso strengthened against the U.S. dollar. The average foreign exchange rate was $19.17 Mexican pesos per U.S. dollar, with the peso trading within a range of $17.90 to $20.88. This compares to the same period in 2024 where the peso traded at an average of $18.09 Mexican pesos per U.S. dollar, and a range of $16.34 to $20.88 Mexican pesos per U.S. dollar.
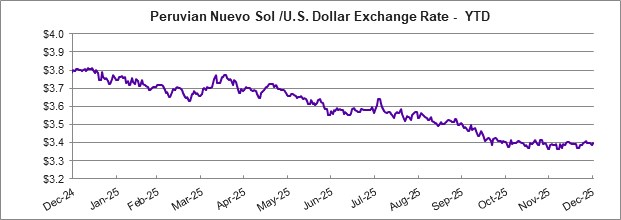
During the period May 1, 2025 to December 31, 2025, the Peruvian sol strengthened against the U.S. dollar. The average foreign exchange rate in the period was $3.52 Peruvian soles per U.S. dollar, with the sol trading within a range of $3.36 to $3.73. The Company was not exposed to the Peruvian sol fluctuation prior to the Kolpa acquisition in May 2025.
Cost Trends
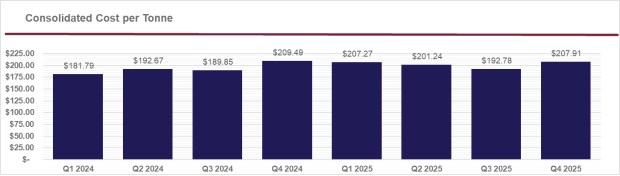
The Company's profitability is subject to industry-wide cost pressures on development and operating costs with respect to labour, energy, consumables and capital expenditures. Underground mining is labour intensive and approximately 33% of the Company's production costs are directly tied to labour. To mitigate the impact of higher labour and consumable costs, the Company focuses on continuous improvement by promoting more efficient use of materials and supplies and by pursuing more advantageous pricing while increasing performance and without compromising operational integrity. Higher metal prices in 2025 drove a substantially higher cost of purchased third party material, higher royalties and higher special mining duty as well as higher processing charges, which in combination with the strengthening Mexican peso and combined with the higher third-party material purchases and lower plant throughput resulted in higher cost per tonne. Additionally, 1% higher special mining duty rate enacted by the Mexico government from January 1, 2025, contributed to higher special mining duty costs in 2025. The increase in cost per tonne was partially offset by incorporating Kolpa operations from May 1, 2025, as Kolpa has lower cost per tonne in comparison to Guanaceví and Bolañitos. The addition of Terronera in Q4 2025 has increased the average cost per tonne by contributing a site cost per tonne of $230.35 during its first quarter of operations; the mine and plant are being ramped up.
ANNUAL OUTLOOK
2026 Production and Cost Guidance
In 2026, silver production from Terronera, Guanaceví, and Kolpa is projected to range between 8.3 and 8.9 million oz, while gold output from Terronera and Guanaceví is expected to range between 46,000 and 48,000 oz. Kolpa is anticipated to contribute significant base metal production, including 22,000 to 24,000 tonnes of lead, 16,000 to 18,000 tonnes of zinc, and 650 to 750 tonnes of copper. Together, these three mines are forecast to deliver 14.6 to 15.6 million silver equivalent ounces.
|
|
|
Terronera |
Guanacevi |
Kolpa |
Consolidated |
|
Tonnes per day |
t |
1,950 - 2,050 |
1,000 - 1,100 |
2,300 - 2,500 |
5,250 - 5,650 |
|
Silver Production |
M oz |
2.4 - 2.6 |
3.6 - 3.8 |
2.3 - 2.5 |
8.3 - 8.9 |
|
Gold Production |
K oz |
35.0 - 36.0 |
11.0 - 12.0 |
- |
46.0 - 48.0 |
|
Lead Production |
K t |
- |
- |
22.0 - 24.0 |
22.0 - 24.0 |
|
Zinc Production |
K t |
- |
- |
16.0 - 18.0 |
16.0 - 18.0 |
|
Copper Production |
t |
- |
- |
650 - 750 |
650 - 750 |
|
Silver Eq Production |
M oz |
5.6 - 5.8 |
4.6 - 4.9 |
4.4 - 4.9 |
14.6 - 15.6 |
(1) Silver equivalent for 2026 guidance is calculated using the following ratios: 90 silver oz to 1 gold oz; 45 silver oz to 1 lead tonne; 61 silver oz to 1 zinc tonne; 238 silver oz to 1 copper tonne.
Consolidated cash costs in 2026 for Terronera, Guanaceví, and Kolpa are projected to range between $12.00 and $13.00 per payable silver oz, while consolidated all-in sustaining costs3 ("AISC") are estimated at $27.00 to $28.00 per oz, net of by-product credits. On a per-ounce basis, consolidated cash costs are expected to decline compared to 2025, driven primarily by higher silver production from these mines and stronger estimated prices for gold and base metals, while being partially offset by lower gold output. AISC, however, is expected to be slightly higher than in 2025 due to increased sustaining mine development during Terronera's first full year of production, post-acquisition capital investment at Kolpa, and increased exploration activities across all sites.
|
|
|
Terronera |
Guanacevi |
Kolpa |
Consolidated |
|
Direct operating costs per tonne |
$/t |
$130 - $140 |
$180 - $190 |
$130 - $140 |
$140 - $150 |
|
Direct costs per tonne |
$/t |
$150 - $160 |
$290 - $300 |
$140 - $150 |
$170 - $180 |
|
Cash costs, net of by-product credits |
$/oz Ag |
($2.00 - $1.00) |
$21.00 - $22.00 |
$13.00 - $14.00 |
$12.00 - $13.00 |
|
AISC, net of by-product credits |
$/oz Ag |
$28.00 - $29.00 |
$29.00 - $30.00 |
$22.00 - $23.00 |
$27.00 - $28.00 |
|
Sustaining capital budget |
$million |
$56.7 |
$24.5 |
$9.8 |
$91.0 |
|
Growth capital budget |
$million |
|
|
$16.7 |
$16.7 |
Operating mines
In 2026, plant throughput at Terronera is expected to range from 1,950 to 2,050 tonnes per day (tpd), averaging approximately 2,000 tpd, with material mined from the Terronera vein. Cash costs per ounce, and direct costs on a per tonne basis are anticipated to be below the consolidated company-wide costs, driven by higher metal production along with improved development efficiencies and mine productivities following ramp up in 2025. During H1 2026, mine production will be from areas of the deposit with lower grades including stockwork, as mine development accesses higher-grade areas in H2 2026, which will increase grades. Efforts will continue to optimize the plant circuits to sustain throughput and enhance metal recoveries.
At Guanaceví, plant throughput in 2026 is projected to range from 1,000 to 1,100 tpd, averaging 1,050 tpd, with ore mined from the Milache concession and the Porvenir Cuatro and Porvenir Dos extensions on the El Curso concessions. The El Curso concessions were leased from a third party with no upfront costs but carry significant royalty obligations on production. Mine grades in 2026 are expected to be slightly lower, while recoveries should remain consistent with 2025. Cash costs per ounce, AISC per ounce, and direct costs3 per tonne are expected to slightly increase compared to 2025 due to reduced output.
At Kolpa, plant throughput in 2026 is forecast to range from 2,300 to 2,500 tpd, averaging 2,400 tpd, with material mined from the Bienaventurada and Poderosa concessions, supplemented by lower-grade material from the Yen open pit. Cash costs per ounce3, AISC per ounce, and direct costs per tonne are expected to improve compared to 2025, supported by higher metal production from increased milling rates and stronger base metal prices, which provide a by-product credit.
Consolidated Operating Costs
Direct operating costs per tonne are projected to range between $140 and $150. At Terronera, operating costs per tonne are expected to fall within $130-$140, a significant reduction to Q4 realized direct operating cost per tonne of $222.57 due to various factors: the transition from diesel generation to LNG in mid-2026, construction team de-mobilisation, workforce and logistics optimisation plans, and 19% higher throughput. Average daily throughput in Q4 2025 was 1,676 tpd, however as noted above this will increase to 2,000 tpd for 2026. Guanaceví's costs are estimated at $180 to $190 per tonne, consistent with 2025. Kolpa's costs are anticipated to improve to $130 to $140 per tonne, primarily due to higher milling rates following the plant expansion.
Direct costs which include third-party material purchases, royalties, and special mining duties, are forecast at $170 to $180 per tonne based on a budgeted silver price of $36 per ounce. These costs are highly sensitive to metal prices, as fluctuations directly impact royalties, duties, and third-party material costs. Guanaceví is expected to incur the highest direct costs at $290 to $300 per tonne, driven by elevated royalties and third-party purchases. In comparison, Terronera is projected at $150 to $160 per tonne, and Kolpa at $140 to $150, both significantly lower than Guanaceví.
To clarify the impact of silver price on the Company's direct costs per tonne, for every $1.00 increase in silver price per oz, direct costs per tonne rise by approximately $0.90 at Terronera, $3.80 at Guanaceví, and $0.50 at Kolpa, reflecting the impact of royalties, duties, and third-party purchases. At a silver price of $75 per oz, direct costs per tonne would be approximately $180-$190 at Terronera, $430-$440 at Guanaceví, and $150-$160 at Kolpa.
For 2026, consolidated cash costs, net of gold by-product credits, are projected to range between $12.00 and $13.00 per payable silver ounce. This consolidated figure reflects negative cash costs at Terronera, estimated between negative $1.00 and negative $2.00, due to its higher gold by-product and lower anticipated per tonne costs. Guanaceví is expected to report higher cash costs, net of gold by-product credits, in the range of $21.00 to $22.00, while Kolpa should maintain steady cash costs, net of by-product credits, between $13.00 and $14.00. Cash costs net of by-product are highly sensitive to by-product metal prices.
AISC3, net of gold by-product credits, are forecast at $27.00 to $28.00 per ounce of payable silver. Despite low cash costs, Terronera's AISC is expected to fall between $28.00 and $29.00, due to sustaining capital requirements in the first year of operation, along with higher mine-site exploration and equipment costs. Guanaceví's AISC is projected at $29.00 to $30.00, roughly in line with 2025 levels, while Kolpa's AISC is anticipated to improve to $22.00-$23.00, primarily due to higher metal production.
Management's 2026 cost forecasts are based on a silver price of $36.00 per oz, a gold price of $3,240 per oz, an exchange rate of 18.50 Mexican pesos per U.S. dollar and 3.60 Peruvian soles per U.S. dollar, as well as annual inflation assumptions of 4% in Mexico and 2% in Peru.
2026 Planned Capital Expenditures
| Project | Sustaining Mine Development |
Sustaining Other Capital |
Total Sustaining Capital |
Growth Capital | Total Capital |
| Terronera | $32.9 million | $23.8 million | $56.7 million | - | $56.7 million |
| Guanaceví | $15.5 million | $9.0 million | $24.5 million | - | $24.5 million |
| Kolpa | $2.7 million | $7.1 million | $9.8 million | $16.7 million | $26.5 million |
| Pitarrilla | - | - | - | $48.0 million | $48.0 million |
| Exploration | - | - | - | $1.8 million | $1.8 million |
| Corporate | - | - | - | $0.3 million | $0.3 million |
| Total | $51.1 million | $39.9 million | $91.0 million | $66.8 million | $157.8 million |
Capital Investments
In 2026, Endeavour plans to invest $91.0 million in sustaining capital across its three operating mines. At budgeted metal prices, these investments are expected to be funded from operating cash flows.
At Terronera, $56.7 million will be allocated to capital projects, including $32.9 million for 9.0 kilometers of mine development in Terronera. The remaining $23.8 million will support one-time mine and plant infrastructure enhancements including the transition from diesel to LNG, construction of a new warehouse, expansion of accommodations by increasing bed capacity and other key initiatives designed to strengthen operational efficiency and sustainability.
At Guanaceví, $24.5 million will be invested in capital projects, with the largest component being 4.5 kilometers of mine development at El Curso and Milache for an estimated $15.5 million. An additional $6.3 million will be for mine infrastructure and equipment, $1.4 million for plant equipment and tailings storage facility expansion, and $1.3 million for various surface infrastructure and equipment upgrades.
At Kolpa, $26.5 million will be invested in capital projects, including $2.7 million for 3.5 kilometers of mine development in the Bienaventurada and Poderosa areas. A further $7.1 million will be for mine infrastructure, equipment, and building improvements. Growth expenditures of $16.7 million will support a plant expansion to increase capacity to 2,500 tonnes per day, including ongoing installation of a new ball mill, upgrades to flotation cells and expansion of the tailings storage facility. Management estimates the plant expansion to be completed in Q1 2026.
The Company also plans to spend $2.1 million to maintain exploration concessions, acquire mobile exploration equipment, and support corporate infrastructure.
Pitarrilla
Endeavour will continue advancing the Pitarrilla project in 2026 with an estimated investment of $65.8 million, which includes $15.0 million for the feasibility study, $2.8 million for exploration work including 8,550 meters of drilling, and $48.0 million in capital expenditures. Capital spending includes $10.4 million for mine equipment, $4.0 million for additional equipment, $11.2 million for camp, warehouse, and surface infrastructure, $7.0 million to complete 1,300 meters of underground development, and $15.4 million in other indirect project costs, including contingency.
2026 Planned Exploration
|
Project |
Activity |
Drill Metres |
Expenditures |
|
Terronera |
Drilling / Others |
10,300 |
$6.9 million |
|
Guanaceví |
Drilling / Others |
8,550 |
$2.2 million |
|
Kolpa |
Drilling / Others |
20,100 |
$9.7 million |
|
Pitarrilla |
Drilling / Others |
8,550 |
$2.8 million |
|
Chile |
Drilling / Others |
2,500 |
$2.0 million |
|
USA |
Drilling / Others |
2,500 |
$1.3 million |
|
Other |
Geology & Targeting |
- |
$1.1 million |
|
Total |
|
52,500 |
$25.9 million |
In 2026, the Company plans to invest $25.9 million in exploration drilling, with approximately 52,500 meters planned across its portfolio. The majority of the budget is allocated to additional drilling at operating sites to support reserve and resource replacement and expansion.
At Terronera, the Company plans to drill approximately 10,300 meters at an estimated cost of $6.9 million. Drilling will be primarily focused on infill drilling along the La Luz vein, with additional drilling planned at the Terronera, Los Cuates, and Quiteria veins.
At the Guanaceví, approximately 8,550 meters of drilling are planned at a cost of $2.2 million, targeting reserve and resource replacement at the El Curso, Alondra, and Milache mines.
At Kolpa, the Company plans to complete approximately 20,100 meters of drilling at an estimated cost of $9.7 million. The program will include both surface and infill drilling at the Bienaventurada and Poderosa mines.
In Chile, management plans to invest $2.0 million to complete approximately 2,500 meters of drilling at the Aida project, with drilling focused on the Mina Vieja and Estrella veins, along with limited surface drilling at the Constanza target.
At the Baxter and Bruner projects in Nevada, USA, the Company plans to invest $1.3 million to complete approximately 2,500 meters of surface drilling.
LIQUIDITY AND CAPITAL RESOURCES
The Company has historically funded its acquisition, exploration and development activities through equity financings, debt facilities and convertible debt. In recent years, the Company has financed most of its acquisition, exploration, development and operating activities from production cash flows, treasury, equity offerings and debt. The Company may choose to undertake equity, debt, convertible debt or other financings, on an as-needed basis, in order to facilitate its growth. On May 27, 2025, the Company filed an updated Base Shelf prospectus, and on July 10, 2025, issued a prospectus supplement for an offering of up to $60 million of shares through an at-the-market ("ATM") distributions ("ATM Facility"). As of December 31, 2025, $35.3 million of the facility remains available. During Q4 2025, the Company closed the offering of $350 million aggregate principal amount of 0.25% unsecured convertible senior notes due 2031 and has used proceeds from the offering to extinguish $150.0 million of loans during December 2025.
Management of the Company believes that operating cash flow and existing current assets will be sufficient to cover capital requirements and meet its short-term obligations for at least the next twelve months. The Company continues to assess financing alternatives, including equity or debt or a combination of both, to fund future growth.
| Expressed in millions of US dollars | As at December 31, 2025 | As at December 31, 2024 | |||||
| Current assets | $ | 423.2 | $ | 157.6 | |||
| Current liabilities | 276.8 | 78.9 | |||||
| Working capital surplus | $ | 146.4 | $ | 78.8 | |||
As at December 31, 2025, the Company had a working capital surplus of $146.4 million (including $26.0 million of net current assets classified as held for sale) compared to $78.8 million as of December 31, 2024. The $67.6 million increase in working capital was primarily due to $117.3 million increase in cash mostly from proceeds from investing activities, offset by the $83.9 million increase in gold forward swaps and silver collars derivative liabilities, due to the increase in metal prices. The working capital balance was further negatively affected by the reclassification to current of those derivatives being settled during the twelve months after the balance sheet date which was partially offset by the reclassification from previously non-current IVA and additional accumulation of IVA for a total of $59.5 million. Additionally, working capital has been impacted by $14.8 million increase in tax payable, addition of $7.7 million of current copper stream liability and number of largely offsetting increases in current assets and liabilities due to the acquisition of Kolpa and transition of Terronera into commercial production and by the reclassification of Bolañitos assets and liabilities held for sale into current assets and liabilities.
Three months ended December 31, 2025 (compared to the three months ended December 31, 2024)
Cash flow provided by operating activities
During Q4 2025, operating activities generated cash flow of $15.4 million compared to using $4.9 million in Q4 2024 and has released $0.4 million in working capital in Q4 2025 (2024 - invested $10.6 million). Higher metal prices helped generate stronger cash flow and as a result cash flow from operations before working capital changes was $15.1 million in Q4 2025, compared to $5.8 million in Q4 2024. While Q4 2025 operating earnings exceeded Q4 2024 by $35.1 million, operating cashflows before working capital changes have increased by $9.3 million, the difference being driven by $14.6 million repayment of precious metal prepayments in Q4 2025, $14.2 million settlements of gold forward swap contracts, silver collars and other realized derivative contract gains and $3.5 million higher exploration and general and administrative costs offset by lower depreciation in 2025.
Cash flow used by investing activities
During Q4 2025, investing activities used net cash of $37.0 million compared to $43.8 million in Q4 2024. Payments for mineral properties, plant and equipment totaled $38.8 million in Q4 2025 compared to $45.9 million in Q4 2024 due to higher capital growth investment at Terronera which was under development at the time, partially offset by capital investments made into Kolpa in Q4 2025.
Of the $38.8 million invested in mineral properties, plants and equipment during Q4 2025, $15.6 million was at Terronera, most significant of which $7.9 million on equipment and infrastructure and $7.7 million on mine development. $9.2 million was invested at Kolpa, of which $7.3 million on equipment and infrastructure primarily related to capacity expansion and $1.9 million on mine development. At Guanaceví, the Company invested $6.4 million, with $4.3 million spent on mine development and $2.1 million on equipment and infrastructure. At Bolañitos, $2.9 million was invested, $1.7 million of which was related to mine development. $3.0 million was invested at Pitarrilla, $2.8 million of which were invested into mobile equipment. The remaining capital expenditure was related to exploration activities or administrative investments.
Cash flow provided by financing activities
Financing activities for the three months period ended December 31, 2025, provided $188.2 million, compared to $101.2 million in the same period of 2024. The largest changes were due to: $339.1 million of proceeds from the December 2025 convertible note offering, and $9.0 million from public equity offering, offset by $152.7 million loan repayments, $5.9 million interest payments and $1.7 million copper stream repayments. In comparison, in Q4 2024 the Company received $68.6 million from public equity offerings and other than $2.3 million interest payments had no substantial financing cash outflows.
Year ended December 31, 2025 (compared to the year ended December 31, 2024)
Cash flow provided by operating activities
During the year ended December 31, 2025, operating activities generated cash flow of $67.4 million compared to $19.1 million in the same period of 2024. Cash flow provided by operations before working capital changes was $51.5 million in 2025, compared to $27.2 million in 2024. While 2025 operating earnings were comparatively $27.4 million higher than 2024, operating cash flow before working capital adjustments was $24.2 higher than 2024, with the difference being predominantly in settlement of realized losses on derivative contracts which was $13.2 million comparatively higher in 2025, $13.1 million of comparatively higher exploration and general and administrative costs.
Cash flow used by investing activities
During the year ended December 31, 2025, investing activities used net cash of $237.4 million compared to $183.5 million in 2024. Payments for mineral properties, plant and equipment totaled $169.2 million in 2025 compared to $195.4 million in 2024, primarily due to lower spending on Terronera during 2025 compared to 2024 due to the higher development expenditures in the prior year. The year ended 2025 also included $72.1 million in net cash used for the Kolpa acquisition.
Of the $169.2 million invested in mineral properties, plants and equipment during the year ended December 31, 2025, $115.8 million was at Terronera, primarily on equipment, infrastructure and mine development. Additionally, $18.6 million was invested at Kolpa, primarily related to the plant capacity expansion and mine development. At Guanaceví, the Company invested $19.6 million, of which $14.6 million was spent on mine development. At Bolañitos, the Company invested $10.4 million, $6.0 million of which was related to mine development. The remaining capital expenditures were related to Pitarrilla, exploration sites, or administrative investments.
Cash flow provided by financing activities
Financing activities for the year ended December 31, 2025, provided $287.0 million, compared to $236.0 million in the same period of 2024. The biggest sources of financing cashflow included $339.1 million of proceeds from the December 2025 convertible note offering, and $35.0 million copper stream prepayment, neither of which provided cash in 2024, as well as $70.5 million from public equity offerings (2024 -$122.4 million), $15.0 million proceeds from loans payable (2024 - $120 million) and $7.2 million from option exercises (2024- $4.0 million). In contrast, the largest outflow were $159.6 million loan repayments (2024 -$4.1 million), $15.7 million interest payments (2024 - $4.2 million) and $3.5 million copper stream payments (2024 - $nil).
Equity financings
On April 8, 2025, the Company completed a bought deal equity offering for the issuance of a total of 11,600,000 common shares at a price of $3.88 per share, which raised net cash proceeds of $45.0 million. On April 16, 2025 the underwriters exercised their over-allotment option with additional issuance of 1,285,000 common shares at a price of $3.88 per share. The Company has received gross proceeds of $50.0 million, less commission of $2.8 million and recognized $0.6 million of other transaction costs related to the financing as share issuance costs, which have been presented net within share capital. The Company used the net proceeds of the offering to fund the purchase price of Minera Kolpa.
| Use of proceeds (millions) | |||
| Net proceeds received | $ | 46.6 | |
| Purchase of Minera Kolpa | 46.6 | ||
| Allocated to working capital | $ | - |
On May 27, 2025, the Company filed an updated Base Shelf prospectus, and on July 10, 2025, issued a prospectus supplement for an offering of up to $60.0 million of shares through an ATM facility. During the year ended December 31, 2025, the Company issued 3,838,915 common shares under this facility at an average price of $6.44 per share for gross proceeds of $24.7 million, less commission of $0.5 million and recognized $0.3 of other transaction costs related to the ATM financing as share issuance costs, which have been presented net within share capital.
| Use of proceeds (millions) | |||
| Net proceeds received | $ | 23.9 | |
| Terronera project funding and ramp-up support | 23.9 | ||
| Allocated to working capital | $ | - |
On November 27, 2024 the Company completed a bought deal equity offering for the issuance of a total of 15,825,000 common shares at a price of $4.60 per share, which raised gross proceeds of $72.8 million. The net proceeds for this financing as at December 31, 2025, have been used as follows:
| Use of proceeds (millions) | |||
| Net proceeds received | $ | 68.6 | |
| Advancing Pitarrilla project | 15.1 | ||
| Allocated to working capital | $ | 53.5 |
Debt financings
On October 6, 2023, the Company, through its wholly-owned subsidiary Terronera Precious Metals, S.A. de C.V. entered into a credit agreement with Société Generale and ING Capital LLC (together with ING Bank N.V.) for a senior secured debt facility for up to $120 million (the "Debt Facility"). On June 23, 2025, the credit agreement was amended and restated to include a third tranche of $15 million bringing the total of the fully drawn debt facility to $135 million. During December 2025, the Company has used proceeds of convertible notes to repay $130 million of the debt facility with remaining $5 million being payable in June 2026.
The Debt Facility includes certain restrictive covenants with respect to the use of the loan proceeds, including restrictions on transferring funds out of the Terronera entity. These restrictions are not expected to have any impact on the Company's ability to meet its obligations.
As part of the Kolpa acquisition, on May 1, 2025, the Company assumed two syndicated loans originally entered into by Minera Kolpa with Banco BTG Pactual S.A. - Cayman Branch and Banco Santander Perú S.A. During December 2025, the Company used the proceeds from the convertible notes to extinguish these loans in full.
Contingencies
Minera Santa Cruz y Garibaldi S.A. de C.V. (“MSCG”), a subsidiary of the Company, received an MXN 238 million assessment on October 12, 2010 by Mexican fiscal authorities for failure to provide the appropriate support for certain expense deductions taken in MSCG’s 2006 tax return, failure to provide appropriate support for loans made to MSCG from affiliated companies, and deemed an deemed an unrecorded distribution of dividends to shareholders, among other individually immaterial items. MSCG immediately initiated a Nullity action and filed an administrative attachment to dispute the assessment.
In June 2015, the Superior Court ruled in favour of MSCG on a number of the matters under appeal; however, the Superior Court ruled against MSCG for failure to provide appropriate support for certain deductions taken in MSCG’s 2006 tax return. In June 2016, the Company received an MXN 122.9 million ($6.8 million) tax assessment based on the June 2015 ruling. The 2016 Assessment comprised of MXN 41.8 million owed ($2.3 million) in taxes, MXN 17.7 million ($1.0 million) in inflationary charges, MXN 40.4 million ($2.2 million) in interest and MXN 23.0 million ($1.3 million) in penalties. The 2016 Assessment was issued for failure to provide the appropriate support for certain expense deductions taken in MSCG’s 2006 tax return and failure to provide appropriate support for loans made to MSCG from affiliated companies.
The Company filed an appeal against the June 2016 Assessment on the basis certain items rejected by the courts were included in the new tax assessment, and a number of deficiencies exist within the assessment. Since the issuance of the tax assessment, interest charges of MXN 24.4 million ($1.4 million) and inflationary charges of MXN 36.5 million ($2.0 million) have accumulated.
Included in the Company's consolidated financial statements are net assets of $1.0 million held by MSCG. Following the Tax Court's rulings, MSCG is in discussions with the tax authorities with regards to the shortfall of assets within MSCG to settle its estimated tax liability. An alternative settlement option would be to transfer the shares and assets of MSCG to the tax authorities. As of December 31, 2025, the Company's income tax payable includes an allowance for transferring the shares and assets of MSCG amounting to $1.0 million. The Company is currently assessing MSCG's settlement options based on ongoing court proceedings and discussion with the tax authorities. The Company has been advised that the appeal filed with the Federal Tax Court, against the June 2016 tax assessment has been rejected. The Company continues to assess MSCG's settlement options.
Compania Minera Del Cubo S.A. de C.V. (“Cubo”), a subsidiary of the Company, received an MXN 58.5 million ($3.3 million) assessment in 2019 by Mexican fiscal authorities (the “Cubo Assessment”) for alleged failure to provide the appropriate support for depreciation deductions taken in the Cubo 2016 tax return and denied eligibility of deductions of certain suppliers. The tax assessment consisted of MXN 24.1 million ($1.3 million) for taxes, MXN 21.0 million ($1.2 million) for penalties, MXN 10.4 million ($0.6 million) for interest and MXN 3.0 million ($0.2 million) for inflation. At the time of the tax assessment the Cubo entity had and continues to have sufficient loss carry forwards which would be applied against the assessed difference of taxable income. The Mexican tax authorities did not consider these losses in the assessment.
Due to the denial of certain suppliers for income tax purposes in the Cubo Assessment, the invoices from these suppliers have been assessed as ineligible for refunds of IVA paid on the invoices. The tax assessment includes MXN 14.7 million ($0.8 million) for re-payment of IVA (value added taxes) refunded on these supplier payments. In the Company’s judgement the suppliers and invoices meet the necessary requirements to be deductible for income tax purposes and the recovery of IVA.
The Company has filed an administrative appeal related to the 2016 Cubo tax assessment. The Company had previously provided a lien on certain El Cubo mining concessions during the appeal process. To facilitate the sale of the El Cubo mine and related assets, the Company elected to pay the assessed amount of $3.6 million during Q1, 2021. During the appeal process the amount paid has been classified as a non-current income tax receivable. As of December 31, 2025, the amount receivable is $4.0 million. Since issuance of the assessment, interest charges of MXN 9.9 ($0.5 million) and inflationary charges of MXN 1.6 ($0.1 million) have accumulated.
In March 2024, the Company was notified that Cubo was subject to a tax audit by the relevant taxation authorities. Following an extended period of correspondence, information requests and discussions with the authorities, Cubo has received a formal assessment relating to certain tax positions taken in prior periods and in November 2025 filed a notice of objection and formally appealed the assessment. The appeal remains under review with the tax authority, and no final determination has been made.
The Company continues to assess that it is probable that its appeal will prevail, and no provision is recognized in respect of the Cubo tax assessments. Cubo has no significant assets beyond the income tax receivable of $4.0 million, paid in 2021.
The Company is required to use judgement to determine certain tax treatments in calculating income tax expense and IVA recoverable. A number of these judgements are subject to various uncertainties. From time to time, Mexican authorities may apply, re-interpret legislation or disregard precedents and it is possible that these uncertainties may be resolved unfavorably for the Company.
Capital Requirements
As of December 31, 2025, the Company held $223.7 million in cash and cash equivalents (including $8.3 million classified as held for sale) and had a working capital of $146.4 million (including $26.0 million of net current assets classified as held for sale). The Company may be required to raise additional funds through future debt or equity financings in order to carry out other business plans.
Contractual Obligations
The Company had the following undiscounted contractual obligations at December 31, 2025:
| Payments due by period (in millions of US dollars) | |||||||||||||||
| Contractual Obligations |
Total | Less than 1 year |
1 - 3 years | 3 - 5 years | More than 5 years |
||||||||||
| Capital asset purchases | $ | 7.4 | $ | 7.4 | $ | - | $ | - | $ | - | |||||
| Accounts payable, accrued liabilities and other | 120.4 | 120.4 | - | - | - | ||||||||||
| Loans payable | 13.4 | 9.3 | 4.1 | - | - | ||||||||||
| Lease liabilities | 2.1 | 1.4 | 0.7 | - | - | ||||||||||
| Other contracts | 0.3 | 0.1 | 0.2 | - | - | ||||||||||
| Reclamation obligations | 27.3 | - | 7.6 | 0.6 | 19.1 | ||||||||||
| Gold forward swaps | 114.7 | 80.1 | 34.6 | - | - | ||||||||||
| Silver collar contracts | 21.5 | 21.5 | - | - | - | ||||||||||
| Copper stream liability | 58.8 | 7.9 | 16.2 | 14.3 | 20.4 | ||||||||||
| Contingent payment | 10.0 | - | 10.0 | - | - | ||||||||||
| Convertible note debenture | 354.5 | 0.5 | 1.8 | 1.8 | 350.4 | ||||||||||
| Total | $ | 730.4 | $ | 248.6 | $ | 75.2 | $ | 16.7 | $ | 389.9 | |||||
FINANCIAL INSTRUMENTS AND FAIR VALUE MEASUREMENTS
As at December 31, 2025, the carrying and fair values of the Company's financial instruments by category were as follows:
| As at December 31, 2025 | As at December 31, 2024 | |||||||||||
| Expressed in millions of US dollars | Carrying value | Estimated Fair value |
Carrying value | Estimated Fair\value | ||||||||
| Financial assets: | ||||||||||||
| Cash and cash equivalents | $ | 215.4 | $ | 215.4 | $ | 106.4 | $ | 106.4 | ||||
| Other investments | 1.0 | 1.0 | 1.1 | 1.1 | ||||||||
| Trade and other receivables | 23.8 | 23.8 | 3.6 | 3.6 | ||||||||
| Derivative assets | 9.1 | 9.1 | - | - | ||||||||
| Loan receivable | 2.6 | 2.6 | 2.6 | 2.6 | ||||||||
| Total financial assets | $ | 251.9 | $ | 251.9 | $ | 113.7 | $ | 113.7 | ||||
| Financial liabilities: | ||||||||||||
| Accounts payable, accrued liabilities and other current liabilities | $ | 120.4 | $ | 120.4 | $ | 53.9 | $ | 53.9 | ||||
| Derivative liabilities | 130.3 | 130.3 | 26.9 | 26.9 | ||||||||
| Copper stream liability | 44.7 | 44.7 | - | - | ||||||||
| Contingent payment | 8.8 | 8.8 | - | - | ||||||||
| Loans payable | 12.7 | 12.7 | 120.2 | 120.2 | ||||||||
| Senior convertible notes | 231.2 | 231.2 | - | - | ||||||||
| Total financial liabilities | $ | 548.1 | $ | 548.1 | $ | 201.0 | $ | 201.0 | ||||
Fair value hierarchy
Fair value is the price that would be received to sell an asset or paid to transfer a liability in an orderly transaction between market participants at the measurement date. The fair value hierarchy establishes three levels to classify the inputs to valuation techniques used to measure fair value. Level 1 inputs are quoted prices (unadjusted) in active markets for identical assets or liabilities. Level 2 inputs are quoted prices in markets that are not active, quoted prices for similar assets or liabilities in active markets, inputs other than quoted prices that are observable for the asset or liability (for example, interest rate and yield curves observable at commonly quoted intervals, forward pricing curves used to value currency and commodity contracts and volatility measurements used to value option contracts), or inputs that are derived principally from or corroborated by observable market data or other means. Level 3 inputs are unobservable (supported by no or little market activity). The fair value hierarchy gives the highest priority to Level 1 inputs and the lowest priority to Level 3 inputs.
Assets and liabilities as at December 31, 2025 that measured at fair value on a recurring basis include:
| As at December 31, 2025 | ||||||||||||
| Expressed in millions of US dollars | Total | Level 1 | Level 2 | Level 3 | ||||||||
| Financial Assets: | ||||||||||||
| Other investments | $ | 1.0 | $ | 0.9 | $ | - | $ | 0.1 | ||||
| Trade receivables | 20.6 | - | 20.6 | - | ||||||||
| Derivative assets | 9.1 | - | 1.1 | 8.0 | ||||||||
| Total financial assets | $ | 30.7 | $ | 0.9 | $ | 21.7 | $ | 8.1 | ||||
| Financial Liabilities: | ||||||||||||
| Cash-settled deferred share units | $ | 8.9 | $ | 8.9 | $ | - | $ | - | ||||
| Copper stream liability | 44.7 | - | - | 44.7 | ||||||||
| Contingent payment | 8.8 | - | - | 8.8 | ||||||||
| Derivative liabilities | 130.3 | - | 130.3 | - | ||||||||
| Total financial liabilities | $ | 192.7 | $ | 8.9 | $ | 130.3 | $ | 53.5 | ||||
Other investments
The Company holds marketable securities classified as Level 1 and Level 3 in the fair value hierarchy. The fair values of Level 1 investments are determined based on a market approach reflecting the closing price of each particular security at the reporting date. The closing price is a quoted market price obtained from the stock exchange that is the principal active market for the particular security, being the market with the greatest volume and level of activity for the assets. For Level 3 investments, which consist of share purchase warrants where inputs are not observable, they have an estimated value determined by using an option pricing model. Changes in fair value on available for sale marketable securities are recognized in earnings or loss.
Trade receivables
The trade receivables consist of receivables from provisional silver and gold sales from the Bolañitos and Kolpa mines. The fair value of receivables arising from concentrate sale contracts that contain provisional pricing mechanisms is determined using the appropriate quoted closing price on the measurement date from the exchange that is the principal active market for the particular metal. As such, these receivables, which meet the definition of an embedded derivative, are classified within Level 2 of the fair value hierarchy.
Derivative assets
The Company also hedged a portion of the estimated remaining capital and operating expenditures incurred in Mexican Pesos. The fair value of the foreign exchange forward contracts is determined using mark-to-market values provided by counterparties. These valuations are based on observable market inputs, including spot rate, forward foreign exchange rates and interest rate curves. Accordingly, the instruments are classified as Level 2 in the fair value hierarchy. Derivative assets further include early redemption derivative asset embedded in the convertible senior notes is valued using FINCAD model with key assumptions being underlying stock volatility and the Company’s credit spread, the instrument classified as Level 3 in the fair value hierarchy.
Deferred share units ("DSUs")
The Company has a cash settled DSU plan whereby DSUs may be granted to independent directors of the Company in lieu of compensation in cash or stock options. The DSUs vest immediately and are redeemable for cash based on the market value of the units at the time of a director's retirement. The DSUs are classified as Level 1 in the fair value hierarchy. The liability is determined based on a market approach reflecting the closing price of the Company's common shares at the reporting date. Changes in fair value are recognized in general and administrative expenses.
Copper stream liability
The Company entered into a copper stream agreement on copper produced by Kolpa. Under the copper stream agreement, the Company received a $35 million prepayment used to finance the cash consideration of Kolpa acquisition on May 1, 2025. The copper stream liability is classified as level 3 in the fair value hierarchy and measured at fair value through profit or loss. The stream is valued using a discounted cash flow model based on current market and operational assumptions. The key unobservable inputs used in the valuations include a discount rate, reflecting credit risk and asset-specific risk, a copper price forecasts, based on observable forward price curves over the expected production term. Valuations involves significant management's judgment related to the life-of-mine production schedule, including expected output timing and volumes.
Contingent payment
Part of the consideration in acquisition of Kolpa was a deferred payable totaling up to $10.0, contingent upon achieving production milestones of two million and four million silver-equivalent ounces. Contingent payment is valued using a probability weighted discounted cashflows with key assumptions being likelihood and timing of the milestones being reached. Its classified as Level 3 in the fair value hierarchy
Derivative liabilities
Company holds certain gold forward swap contracts and silver collars to hedge against the fluctuation in gold and silver prices. The fair value of the gold forward swap contracts and silver collars are determined using mark‑to‑market values provided by counterparties. These valuations are based on observable market inputs, including gold and silver spot price, forward price curve and interest rate curves. Accordingly, the instruments are classified as Level 2 in the fair value hierarchy.
Financial Instrument Risk Exposure and Risk Management
The Company is exposed to a variety of financial instrument related risks. The board of directors approves and monitors the risk management process. The types of risk exposure and the way in which such exposure is managed is provided as follows:
Credit Risk
The Company is exposed to credit risk on its bank accounts, accounts receivable and loan receivable. Credit risk exposure on bank accounts is limited through maintaining the Company's balances with high-credit quality financial institutions, maintaining investment policies, assessing institutional exposure and continual discussion with external advisors. Value-added tax receivables are generated on the purchase of supplies and services to produce silver, which are refundable from the Mexican government. Trade receivables are generated on the sale of concentrate inventory to reputable metal traders. The loan receivable is related to the remaining proceeds for the sale of the El Compas mine to Grupo ROSGO. There has been no indication of a change in the creditworthiness of the counterparty to the loan receivable since the initial recognition.
Liquidity Risk
Liquidity risk is the risk that the Company will not be able to meet its financial obligations as they come due. The Company manages its liquidity risk by continually monitoring forecasted and actual cash flows. The Company has in place a planning and budgeting process to help determine the funds required to support its normal operating requirement and development plans. The Company aims to maintain sufficient liquidity to meet its short-term business requirements, taking into account its anticipated cash flows from operations, its holdings of cash and cash equivalents, and its committed and anticipated liabilities.
The Company's Mexican subsidiaries pay IVA on the purchase and sale of goods and services. The net amount paid is recoverable but is subject to review and assessment by the tax authorities. The Company regularly files the required IVA returns and all supporting documentation with the tax authorities, however a smaller portion of IVA refund requests are denied from time to time based on the alleged lack of compliance with certain formal requirements and information returns by the Company's third-party suppliers. The Company takes necessary legal action on the delayed refunds as well as any denied refunds. The Company is in regular contact with the tax authorities in respect of its IVA filings and believes that the full amount of its IVA receivables will ultimately be received; however, the timing of recovery of these amounts and the nature and extent of any adjustments to the Company's IVA receivables remains uncertain.
Market Risk
The significant market risk exposures to which the Company is exposed are foreign currency risk, interest rate risk, and commodity price risk.
Foreign Currency Risk - The Company's operations in Mexico, Peru and Canada make it subject to foreign currency fluctuations. Certain of the Company's operating expenses are incurred in Mexican pesos, Peruvian sol and Canadian dollars; therefore, the fluctuation of the U.S. dollar in relation to these currencies will consequently have an impact upon the profitability of the Company and may also affect the value of the Company's assets and the amount of shareholders' equity. The Company also hedged a portion of the estimated operating expenditures incurred in Mexican Pesos. As of December 31, 2025, the Company had $30.0 million in Mexican Peso forward contracts with a weighted average rate of 18.95 pesos per US dollar settling between January 2026 and January 2027.
Interest Rate Risk - The interest rate risk is the risk that the fair value or the future cash flows of a financial instrument will fluctuate because of changes in market interest rates. The interest rate on the Debt Facility are variable, and based on the exposure as of December 31, 2025, a 1% change in interest rate would result in an increase or decrease of interest costs of $0.1 million per year. As of December 31, 2025, all of the Company's outstanding equipment financing obligations bear interest at fixed rates and are therefore not exposed to changes in future cash flows attributable to changes in market interest rates.
The Company is exposed to interest rate risk on its cash and cash equivalents. The cash and cash equivalent interest earned is based on bank account interest rates which may fluctuate. Based on the exposure as of December 31, 2025, a 1% change in the interest rates would result in an increase or decrease of approximately $2.3 million in interest earned by the Company. The Company has not entered into any derivative contracts to manage the interest rate risk.
Commodity Price Risk - The Company is subject to commodity price risk related to silver, gold, lead, zinc, and copper. Fluctuations in the market prices of these metals can have a direct and immediate impact on the valuation of related financial instruments, non-financial assets, and overall net earnings. Gold and silver prices have historically fluctuated significantly and are affected by numerous factors outside of the Company's control, including, but not limited to, industrial and retail demand, central bank lending, forward sales by producers and speculators, levels of worldwide production, short-term changes in supply and demand because of speculative hedging activities and certain other factors.
At December 31, 2025, there are 156,830 oz of silver and 3,453 oz of gold as well as trivial amounts of base metals, which do not have a final settlement price and the estimated revenues have been recognized at current market prices. As at December 31, 2025, with other variables unchanged, a 10% decrease in the market value of silver and gold would result in a reduction of revenue and the associated receivable of $2.6 million.
On May 1, 2025, concurrently with the acquisition of Minera Kolpa shares, Endeavour entered into a ten year $35 million copper stream agreement with Versamet Royalties Corporation to help fund the cash portion of the Kolpa acquisition. Under the terms of the stream:
This agreement includes security over the acquired entity and provides Versamet the right of first refusal on future streaming arrangements.
In connection with the Debt Facility, on March 28, 2024, the Company entered into gold forward swap contracts for 68,000 oz, a portion of the expected gold sales in the first three years of production, to hedge against the fluctuation in gold prices. The Company amended the forward swap contracts during the year ended December 31, 2025, which will settle from January 2026 to June 2027 with revised forward price of $2,311 per ounce of gold. As of December 31, 2025, 54,056 oz remains outstanding.
In September 2025 in relation to the amendment to the Debt Facility, the Company implemented un-margined zero cost collars for 968,000 ounces of silver with a price range of $31 to $42. During Q4, the Company settled 226,065 silver oz collars and as of December 31, 2025, had 741,935 silver collar oz outstanding to be settled over the period from January 2026 to June 2026.
OUTSTANDING SHARE DATA
As of February 27, 2026, the Company had the following securities issued, issuable and outstanding:
As at December 31, 2025, the Company's issued share capital was $981.2 million (December 31, 2024 - $851 million), representing 295,410,615 common shares (December 31, 2024 - 262,323,863), and the Company had options outstanding to purchase 1,671,794 common shares (December 31, 2024 - 3,181,491) with a weighted average exercise price of CAD$4.13 (December 31, 2024 - CAD$4.13) as well as convertible senior notes with $350.0 million aggregate principal value convertible into common shares based on an initial conversion rate of 80.2890 common shares per $1,000 principal amount of notes.
The Company considers the items included in the consolidated statement of shareholders' equity as capital. The Company's objective when managing capital is to safeguard its ability to continue as a going concern so that it can continue to provide returns for shareholders and benefits for other stakeholders. The Company manages the capital structure and makes adjustments to it in light of changes in economic conditions and the risk characteristics of the underlying assets. In order to maintain or adjust the capital structure, the Company may issue new shares through private placements, prospectus offerings, convertible debentures, asset acquisitions or return capital to shareholders. The Company is not subject to externally imposed capital requirements.
CHANGES IN ACCOUNTING POLICIES AND CRITICAL ACCOUNTING ESTIMATES
Accounting standards adopted during the period
The accounting policies applied in the Company's consolidated financial statements for the year ended December 31, 2025 are the same as those applied in the Company's annual audited consolidated financial statements as at and for the year ended December 31, 2024, for accounting policies applied to address; business acquisitions, precious metals prepayment obligations, convertible debt instruments and assets and liabilities held for sale - as described in the Company's consolidated financial statements for the year ended December 31, 2025.
Critical Accounting Estimates
The preparation of financial statements requires the Company to make estimates that affect the reported amounts of assets and liabilities and disclosure of contingent assets and liabilities at the date of the financial statements and the reported amounts of revenues and expenses during the reporting period. Significant areas requiring the use of management's judgment relate to the determination of mineralized reserves and resources, determination of the appropriate classification of the Company's convertible senior notes, determination of Bolañitos assets held for sale, the accounting treatment of the copper stream liability, and recognition of deferred tax assets. Significant areas requiring the use of management estimates relate to the valuation of inventory, valuation of the liability, equity and embedded derivative portions of the convertible senior notes, the valuation of assets and liabilities assumed in the acquisition of Minera Kolpa, the valuation of contingent liability arising from acquisition of Minera Kolpa, valuation of gold swap, silver collars, and foreign currency forward contracts, impairment of non-current assets, provision for reclamation and rehabilitation, and income taxes.
Determination of reserves and resources
Judgments about the amount of product that can be economically and legally extracted from the Company’s properties are made by management using a range of geological, technical and economic factors, history of conversion of mineral deposits to proven and probable reserves as well as data regarding quantities, grades, production techniques, recovery rates, production costs, commodity prices and exchange rates. This process may require complex and difficult geological judgments to interpret the data. The Company uses qualified persons (as defined by NI 43-101) to compile this data.
Estimating the quantity and /or grade of reserves and resources requires the size, shape and depth of ore bodies or fields to be determined by analyzing geological data such as drilling samples. Following this, the quantity of reserves and resources that can be extracted in an economical manner is calculated using data regarding the life of mine plans and forecast sales prices (based on current and long-term historical average price trends). Changes in estimates can be the result of estimated future production differing from previous forecasts of future production, expansion of reserves and resources through exploration activities, differences between estimated and actual costs of mining and differences in the commodity price used in the estimation of reserves and resources.
The economic assumptions used to estimate mineral reserves may change from period to period and additional geological data is generated during the course of operations, which may change management’s judgments surrounding reserves and resources. Any changes in management’s judgements may impact the carrying value of mineral properties, plant and equipment, reclamation and rehabilitation provisions, recognition of deferred income tax amounts and depreciation.
Review of asset carrying values and assessment of impairment
Management applies significant judgment in assessing each CGU and assets for the existence of indicators of impairment or impairment reversal at the reporting date. Internal and external factors are considered in assessing whether indicators are present that would necessitate impairment testing. Significant assumptions regarding commodity prices, operating costs, capital expenditures and discount rates are used in determining whether there are any indicators of impairment. These assumptions are reviewed regularly by senior management and compared, when applicable, to relevant market consensus views.
If an indicator of impairment or reversal exists, the asset’s recoverable amount is estimated. The recoverable amount is the greater of fair value less costs of disposal and value in use. The determination of fair value less costs of disposal and value in use requires management to make estimates and assumptions about expected production and sales volumes, metal prices, ore tonnage and grades, recoveries, operating costs, future capital expenditures and appropriate discount rates for future cash flows. The estimates and assumptions are subject to risk and uncertainty, and as such there is the possibility that changes in circumstances will alter these projections, which may impact the recoverable amount of the assets. In such circumstances, some or all of the carrying value of the assets may be further impaired or the impairment charge reduced with the impact recorded in profit or loss.
If an area of interest is abandoned or it is determined that its carrying value cannot be supported by future production or sale, the related costs are charged against operations in the period of abandonment or determination that the carrying value exceeds its fair value. The amounts recorded as mineral properties represent costs incurred to date and do not necessarily reflect present or future values.
Achievement of commercial production
Once a mine reaches the operating levels intended by management, depreciation of capitalized costs begins. Significant judgement is required to determine when certain of the Company’s assets reach this level. Management considers several factors including: completion of a reasonable period of commissioning; consistent operating results achieved at a pre-determined level of design capacity and indications exist that this level will continue; mineral recoveries at or near expected levels; and the transfer of operations from development personnel to operational personnel has been completed.
Estimation of the amount and timing of reclamation and rehabilitation costs
Accounting for restoration requires management to make estimates of the future costs the Company will incur to complete the reclamation and rehabilitation work required to comply with existing laws, regulations and agreements in place at each mining operation and any environmental and social principles the Company is in compliance with. The calculation of the present value of these costs also includes assumptions regarding the timing of reclamation and rehabilitation work, applicable risk-free interest rates for discounting those future cash flows, inflation and foreign exchange rates and assumptions relating to probabilities of alternative estimates of future cash flows. Actual costs incurred may differ from those amounts estimated. Also, future changes to environmental laws and regulations could increase the extent of reclamation and rehabilitation work required to be performed by the Company. Increase in future costs could materially impact the amounts charged to operations for reclamation and rehabilitation.
Deferred Income Taxes
The Company follows the asset and liability method of accounting for income taxes. Under this method, future tax assets and liabilities are recognized for the future tax consequences attributable to differences between the financial statement carrying amounts of existing assets and liabilities and their respective tax bases, and losses carried forward. Future tax assets and liabilities are measured using substantively enacted or enacted tax rates expected to apply to taxable income in the years in which those temporary differences are expected to be recovered or settled. The effect on future tax assets and liabilities of a change in tax rates is recognized in income in the period that includes the substantive enactment date. Future tax assets are recognized to the extent that they are considered more likely than not to be realized.
Judgement is required in determining the recognition and measurement of deferred income tax assets and liabilities on the balance sheet. In the normal course of business, the Company is subject to assessment by taxation authorities in various jurisdictions. These authorities may have different interpretations of tax legislation or tax agreements than those applied by the Company in computing current and deferred income taxes. These different interpretations may alter the timing or amounts of taxable income or deductions.
Final taxes payable and receivable are dependent on many factors, including outcomes of tax litigation and resolution of disputes. The resolution of these uncertainties may result in adjustments to the Company’s tax assets and liabilities.
Management assesses the likelihood and timing of taxable earnings in future periods in recognizing deferred income tax assets. Estimates of future taxable income is based on forecasted cash flows using life of mine projections and the application of existing tax laws in each jurisdiction.
To the extent that future cash flows and taxable income differ significantly from estimates, the ability of the Company to realize the net deferred income tax assets recorded at the balance sheet date could be impacted. In addition, future changes to tax laws could limit the ability of the Company to obtain tax deductions in future periods from deferred income tax assets.
Inventory
In valuing inventories at the lower of cost and net realizable value, the Company makes estimates in determining the net realizable price and in quantifying the contained metal in finished goods and work in progress.
Business Combinations
On the acquisition of a business, the acquisition method of accounting is used, whereby the purchase consideration is allocated to the identifiable assets, liabilities and contingent liabilities (identifiable net assets) on the basis of fair value at the date of acquisition. When the cost of acquisition exceeds the fair values attributable to the Company’s share of identifiable net assets, the difference is treated as purchased goodwill, which is not amortized but is reviewed for impairment annually or more frequently where there is an indication of impairment. If the fair value attributable to the Company’s share of the identifiable net assets exceeds the cost of acquisition, the difference is immediately recognized in profit or loss. Incremental costs related to acquisitions are expensed as incurred.
Determination of the fair value of assets acquired and liabilities assumed and the resulting goodwill, if any, requires that management make estimates based on the information provided by the acquiree. Changes to the provisional values of assets acquired and liabilities assumed, deferred income taxes and resulting goodwill, if any, will be adjusted when the final measurements are determined (within one year of acquisition date).
When purchase consideration is contingent on future events, the initial cost of the acquisition recorded includes an estimate of the fair value of the contingent amounts expected to be payable in the future. When the fair value of contingent consideration as at the date of acquisition is finalized, before the end of the 12 months measurement period, the adjustment is allocated to the identifiable assets acquired and liabilities assumed. Changes to the estimated fair value of contingent consideration subsequent to the acquisition date are recorded in profit or loss.
Financial instruments carried at fair market value
The company has several financial instruments carried at fair market value as described above in “Financial Instruments and fair market value measurements” section. The Company makes estimates on determination of the fair market value at the end of the period and resulting gains (losses) on revaluation using assumptions inputs and methods described above in the “Financial Instruments and fair market value measurements” section.
RISKS AND UNCERTAINTIES
Besides the risks discussed elsewhere in this MD&A, the following are risks and uncertainties that have affected the Company’s financial statements or future performance or that may affect them in the future. See “Risk Factors” in the Company’s Annual Information Form and the Prospectus dated July 10, 2025, for other risks affecting the Company generally.
Interest Rate Risk
Increases to benchmark interest rates may have an impact on the Company’s cost of borrowing under any debt financing that the Company may negotiate, resulting in reduced amounts available to fund the Company’s exploration, development and production activities and could negatively impact the market price of its common shares and/or the price of gold or silver, which could have a material adverse effect on the Company’s operations and financial condition.
Precious Metal Price Fluctuations
The Company’s revenue is primarily dependent on the sale of silver and gold, led, zinc and copper and movements in the spot price of silver, gold, led, zinc and copper may have a direct and immediate impact on the Company’s income and the value of related financial instruments. The Company’s sales are directly dependent on commodity prices. Metal prices have historically fluctuated widely and are affected by numerous factors beyond the Company’s control including international economic and political trends, expectations for inflation, currency exchange rate fluctuations, interest rates, global and regional supply and demand, consumption patterns, speculative market activities, worldwide production and inventory levels, and sales programs by central banks. The exact effect of these factors on metal prices cannot be accurately predicted. Declining market prices for these metals could materially adversely affect the Company’s operations and profitability and could affect the Company’s ability to finance the exploration and development of any of the Company’s other mineral properties.
Fluctuations in the price of consumed commodities
Prices and availability of commodities consumed or used in connection with exploration, development and mining, such as natural gas, diesel, oil, electricity, cyanide and other reagents fluctuate affecting the costs of production at the Company’s operations. These fluctuations can be unpredictable, can occur over short periods of time and may have a materially adverse impact on the Company’s operating costs or the timing and costs of various projects.
Foreign Exchange Rate Fluctuations
Operations in Mexico, Peru, Chile and Canada are subject to foreign currency exchange fluctuations. The Company raises its funds through equity issuances which are generally priced in Canadian dollars or U.S. dollars, and the majority of the exploration costs of the Company are denominated in U.S. dollars, Chilean pesos, Mexican pesos and Peruvian sol. The Company may suffer losses due to adverse foreign currency fluctuations.
Calculation of Reserves and Resources and Precious Metal Recoveries
There is a degree of uncertainty attributable to the calculation and estimation of reserves and resources and their corresponding metal grades to be mined and recovered. Until reserves or resources are actually mined and processed, the quantities of mineralization and metal grades must be considered as estimates only. Any material change in the quantity of mineral reserves, mineral resources, grades and recoveries may affect the economic viability of the Company’s properties.
Economic Conditions for Mining
Events in global financial markets, and the volatility of global financial conditions, will continue to have an impact on the global economy. Many industries, including the mining sector, are impacted by market conditions. Some of the key impacts of financial market turmoil include devaluations and high volatility in global equity, commodity, foreign exchange and precious metal markets and a lack of market liquidity. Financial institutions and large corporations may be forced into bankruptcy or need to be rescued by government authorities. Access to financing may also be negatively impacted by future liquidity crises throughout the world. These factors may impact the Company’s ability to obtain equity or debt financing and, where available, to obtain such financing on terms favorable to the Company.
Increased levels of volatility and market turmoil could have an adverse impact on the Company’s operations and planned growth and the trading price of the securities of the Company may be adversely affected.
The Company assesses on a quarterly basis the carrying values of its mineral properties. Should market conditions and commodity prices worsen and persist in a worsened state for a prolonged period of time, an impairment of the Company’s mineral properties may be required.
Mexican Tax Assessments
The Company is required to use judgement to determine certain tax treatments in calculating income tax expense and IVA recoverable. A number of these judgements are subject to various uncertainties. From time to time, Mexican authorities may apply, re-interpret legislation or disregard precedents and it is possible that these uncertainties may be resolved unfavorably for the Company. See “Contingencies” for further details.
Refinancing and Dilution Risk
The Company’s outstanding unsecured convertible senior notes change the Company’s capital structure and pose a refinancing risk. If the notes are not converted before maturity, the Company will need to repay or refinance the principal amount in 2031, and its ability to do so will depend on operating performance, commodity prices and access to capital markets. Fluctuations in the Company’s share price could affect the likelihood and timing of conversions, potentially leading to dilution of existing shareholders if conversions occur.
Assurance on Financial Statements
The Company prepares the financial reports in accordance with accounting policies and methods prescribed by IFRS. In the preparation of financial reports, management may need to rely upon assumptions, make estimates or use their best judgment in determining the financial condition of the Company. Significant accounting policies and practices are described in more detail in the notes to the annual consolidated financial statements for the year ended December 31, 2025. In order to have a reasonable level of assurance that financial transactions are properly authorized, assets are safeguarded against unauthorized or improper use and transactions are properly recorded and reported, the Company has implemented and continues to analyze the internal control systems for financial reporting.
Mexico Update
Following recent security concerns in Mexico, and temporary blockades in the Jalisco area, operations at Terronera were temporarily paused to ensure safety of our employees. Normal operations were resumed on Wednesday February 25, 2026. Management continues to monitor the situation and respond accordingly.
CONTROLS AND PROCEDURES
Disclosure Controls and Procedures
The Company's officers and management are responsible for establishing and maintaining disclosure controls and procedures for the Company. Disclosure controls and procedures are designed to provide reasonable assurance that material information required to be disclosed by the Company under securities legislation is recorded, processed, summarized and reported within the applicable time periods and to ensure that required information is gathered and communicated to the Company's management, including the Chief Executive Officer (CEO) and Chief Financial Officer (CFO) as is appropriate to permit timely decisions regarding public disclosure. There are inherent limitations to the effectiveness of any system of disclosure controls and procedures. Accordingly, even effective disclosure controls and procedures can only provide reasonable assurance of achieving their control objectives.
At the end of the period covered by this MD&A, management, including the CEO and CFO, conducted an evaluation of the effectiveness of the Company's disclosure controls and procedures pursuant to National Instrument 52-109 "Certification of Disclosure in Issuers Annual and Interim Filings" ("NI 52-109") and Rule 13a -15(b) of the U.S. Securities Exchange Act of 1934, as amended (the "U.S. Exchange Act"). Based upon that evaluation, the Company's CEO and CFO have concluded that, as of the end of the period covered by this MD&A, the Company's disclosure controls and procedures were effective to give reasonable assurance that the information required to be disclosed by the Company in reports that it files or submits is (i) recorded, processed, summarized and reported, within the time periods specified under applicable securities legislation in Canada and in the U.S. Securities and Exchange Commission's rules and forms, and (ii) accumulated and communicated to management, including its principal executive and principal financial officers, or persons performing similar functions, as appropriate to allow timely decisions regarding required disclosure.
Management's Report on Internal Controls over Financial Reporting
Management is responsible for establishing and maintaining adequate internal control over financial reporting (as defined in NI 52-109 and in Rules 13a-15(f) of the U.S. Exchange Act). A Company's internal control over financial reporting is a process designed to provide reasonable assurance regarding the reliability of financial reporting and the preparation of financial statements for external purposes in accordance with applicable generally accepted accounting principles.
A Company's internal control over financial reporting includes those policies and procedures that (i) pertain to the maintenance of records that, in reasonable detail, accurately and fairly reflect the transactions and dispositions of the assets of the Company; (ii) provide reasonable assurance that transactions are recorded as necessary to permit preparation of financial statements in accordance with generally accepted accounting principles, and that receipts and expenditures of the Company are being made only in accordance with authorizations of management and directors of the Company; and (iii) provide reasonable assurance regarding prevention or timely detection of unauthorized acquisition, use, or disposition of the Company's assets that could have a material effect on the financial statements. It should be noted that a control system, no matter how well conceived or operated, can only provide reasonable assurance, not absolute assurance, that the objectives of the control system are met.
Also, projections of any evaluation of effectiveness to future periods are subject to the risk that controls may become inadequate because of changes in conditions, or that the degree of compliance with policies and procedures may deteriorate.
Management of the Company, including the CEO and CFO, assessed the effectiveness of the Company's internal control over financial reporting as of December 31, 2025. In making this assessment, management used the criteria set forth in the Internal Control Integrated Framework (2013) issued by the Committee of Sponsoring Organizations of the Treadway Commission (COSO). Based on its assessment, management has concluded that, as of December 31, 2025, the Company's internal control over financial reporting is effective. Also, management determined that there were no material weaknesses in the Company's internal control over financial reporting as at December 31, 2025.
Limitation on Scope
Management excluded from its assessment of internal control over financial reporting the internal control policies and procedures of Minera Kolpa S.A., which the Company acquired on May 1, 2025. Minera Kolpa's total assets, net assets, total revenues and net income (loss) constitute approximately 19%, 28%, 24% and (12)%, respectively, of the consolidated financial statement amounts as of and for the year ended December 31, 2025. This limitation of scope is in accordance with section 3.3(1)(b) of National Instrument 52-109 - Certification of Disclosure in Issuers' Annual and Interim Filings, which permits an issuer to limit the design of disclosure controls and processes and internal controls over financial reporting to exclude a business acquired not more than 365 days before the end of the financial period to which the CEO's and CFO's annual certification relates.
Changes in Internal Control over Financial Reporting
Management, including the CEO and CFO, has evaluated the Company's internal controls over financial reporting to determine whether any changes occurred during the period that have materially affected, or are reasonably likely to materially affect, the Company's internal controls over financial reporting.
There have been no changes in internal control over financial reporting that occurred during the fiscal year ended December 31, 2025, that have materially affected, or are reasonably likely to materially affect, the Company's internal control over financial reporting.
QUARTERLY RESULTS AND TRENDS
The following table presents selected financial information for each of the most recent eight quarters:
| Table in millions of U.S. dollars except for share numbers and per share amounts | 2025 | 2024 | ||||||
| Q4 | Q3 | Q2 | Q1 | Q4 | Q3 | Q2 | Q1 | |
| Gross Sales | $176.4 | $146.0 | $90.1 | $63.9 | $42.7 | $54.0 | $58.7 | $64.2 |
| Smelting and refining costs included in revenue | 3.8 | 3.1 | 1.5 | 0.4 | 0.5 | 0.5 | 0.5 | 0.5 |
| Total Revenue | 172.6 | 142.9 | 88.6 | 63.5 | 42.2 | 53.5 | 58.2 | 63.7 |
| Direct production costs | 92.0 | 93.9 | 59.2 | 35.2 | 25.4 | 28.7 | 33.7 | 36.7 |
| Royalties | 9.0 | 9.3 | 6.5 | 6.2 | 3.7 | 5.2 | 5.6 | 6.4 |
| Mine operating cash flow before taxes | 71.6 | 39.7 | 22.9 | 22.1 | 13.1 | 19.6 | 18.9 | 20.6 |
| Share-based compensation | 0.2 | 0.1 | 0.1 | - | 0.1 | 0.1 | - | 0.1 |
| Depreciation | 24.9 | 23.9 | 15.0 | 9.2 | 5.3 | 7.0 | 8.7 | 8.9 |
| Mine operating earnings (loss) | $46.5 | $15.7 | $7.8 | $12.9 | $7.7 | $12.5 | $10.2 | $11.6 |
| Basic earnings (loss) per share | ($0.08) | ($0.14) | ($0.07) | ($0.13) | $0.00 | ($0.07) | ($0.06) | ($0.01) |
| Diluted earnings (loss) per share | ($0.08) | ($0.14) | ($0.07) | ($0.13) | $0.00 | ($0.07) | ($0.06) | ($0.01) |
| Weighted shares outstanding | 294,635,507 | 291,373,472 | 283,534,276 | 262,323,863 | 252,169,924 | 246,000,878 | 242,899,679 | 227,503,581 |
| Net earnings (loss) | (23.8) | (42.0) | (20.5) | (32.9) | 1.0 | (17.3) | (14.0) | (1.2) |
| Depreciation | 25.1 | 24.1 | 15.1 | 9.6 | 5.7 | 7.4 | 8.9 | 9.1 |
| Finance costs | 11.6 | 0.7 | 0.8 | 0.2 | 0.3 | 0.4 | 0.1 | 0.1 |
| Current income tax | 11.6 | 10.7 | 9.1 | 5.3 | (0.2) | 4.5 | 2.9 | 5.7 |
| Deferred income tax (recovery) | (12.8) | (6.2) | (3.2) | (0.2) | (2.5) | (0.5) | (0.2) | (0.2) |
| EBITDA | $11.7 | ($12.7) | $1.3 | ($18.0) | $4.4 | ($5.6) | ($2.3) | $13.5 |
The following table presents selected production and costs information for each of the most recent eight quarters:
| 2025 | 2024 | |||||||
| Q4 | Q3 | Q2 | Q1 | Q4 | Q3 | Q2 | Q1 | |
| Processed tonnes | 551,010 | 400,245 | 303,828 | 209,507 | 165,591 | 175,065 | 218,989 | 221,794 |
| Terronera | 154,180 | - | - | - | - | - | - | - |
| Guanaceví | 104,380 | 99,340 | 96,834 | 102,438 | 58,798 | 67,094 | 112,897 | 115,004 |
| Bolañitos | 93,620 | 105,153 | 88,098 | 107,069 | 106,793 | 107,971 | 106,092 | 106,790 |
| Kolpa | 198,830 | 195,752 | 118,896 | - | - | - | - | - |
| Silver ounces | 2,030,206 | 1,766,926 | 1,483,736 | 1,205,793 | 824,529 | 874,717 | 1,312,572 | 1,460,006 |
| Terronera | 352,002 | - | - | - | - | - | - | - |
| Guanaceví | 877,554 | 1,024,321 | 997,875 | 1,015,327 | 718,797 | 768,905 | 1,195,753 | 1,335,742 |
| Bolañitos | 168,783 | 143,916 | 105,223 | 190,466 | 105,732 | 105,812 | 116,819 | 124,263 |
| Kolpa | 631,867 | 598,689 | 380,638 | - | - | - | - | - |
| Silver equivalent ounces(1) | 3,767,713 | 3,037,156 | 2,528,562 | 1,872,833 | 1,550,529 | 1,617,925 | 2,156,453 | 2,270,676 |
| Terronera | 1,003,822 | - | - | - | - | - | - | - |
| Guanaceví | 1,117,703 | 1,279,860 | 1,282,853 | 1,334,447 | 928,557 | 995,146 | 1,535,161 | 1,665,648 |
| Bolañitos | 379,632 | 471,158 | 440,678 | 538,386 | 621,972 | 622,779 | 621,292 | 605,028 |
| Kolpa | 1,266,557 | 1,286,139 | 805,032 | - | - | - | - | - |
| Cash costs per oz (2) | $19.05 | $18.09 | $15.35 | $15.89 | $13.68 | $11.35 | $13.43 | $13.19 |
| Terronera | $4.76 | - | - | - | - | - | - | - |
| Guanaceví | $31.18 | $22.98 | $19.91 | $19.73 | $20.25 | $19.59 | $17.17 | $15.94 |
| Bolañitos | $11.18 | ($11.47) | ($17.26) | ($5.60) | ($33.11) | ($51.38) | ($26.67) | ($17.69) |
| Kolpa | $11.42 | $16.43 | $11.81 | - | - | - | - | - |
| AISC per oz (2) | $41.19 | $30.53 | $25.16 | $24.48 | $27.33 | $25.82 | $23.13 | $21.44 |
| Terronera | $65.70 | - | - | - | - | - | - | - |
| Guanaceví | $42.31 | $31.09 | $26.81 | $26.50 | $32.40 | $30.83 | $24.53 | $21.96 |
| Bolañitos | $35.95 | $27.22 | $7.04 | $13.16 | ($8.78) | ($12.31) | $8.15 | $15.59 |
| Kolpa | $27.19 | $30.31 | $25.66 | - | - | - | - | - |
| Direct costs per tonne (2) | $207.91 | $192.78 | $201.24 | $207.27 | $209.49 | $189.85 | $192.68 | $181.77 |
| Terronera | $230.35 | - | - | - | - | - | - | - |
| Guanaceví | $383.98 | $349.83 | $325.40 | $310.52 | $365.23 | $330.55 | $269.36 | $260.13 |
| Bolañitos | $136.00 | $118.41 | $137.72 | $108.49 | $123.73 | $102.42 | $111.07 | $97.39 |
| Kolpa | $131.93 | $153.03 | $147.20 | - | - | - | - | - |
(1) Silver equivalent production is calculated using an 80:1 (Ag:Au) ratio, 60:1 (Ag:Pb) ratio, 85:1 (Ag:Zn) ratio, and 300:1 (Ag:Cu) ratio.
(2) Cash cost per oz, AISC per oz and direct costs per tonne are non-IFRS measures.
NON-IFRS MEASURES
Non-IFRS and Other Financial Measures and Ratios
We have included certain non-IFRS financial measures and ratios in this MD&A, as discussed below. We believe that these measures, in addition to conventional measures prepared in accordance with IFRS, provide investors an improved ability to evaluate the underlying performance of the Company. The non-IFRS measures and ratios are intended to provide additional information and should not be considered in isolation or as a substitute for measures of performance prepared in accordance with IFRS. These financial measures and ratios do not have any standardized meaning prescribed under IFRS and therefore may not be comparable to other issuers.
Non-IFRS financial measures are defined in National Instrument 52-112 - Non-GAAP and Other Financial Measures Disclosure ("NI 52-112") as a financial measure disclosed that (a) depicts the historical or expected future financial performance, financial position or cash flow of an entity, (b) with respect to its composition, excludes an amount that is included in, or includes an amount that is excluded from, the composition of the most directly comparable financial measure disclosed in the primary financial statements of the entity, (c) is not disclosed in the financial statements of the entity, and (d) is not a ratio, fraction, percentage or similar representation.
A non-IFRS ratio is defined by 52-112 as a financial measure disclosed that (a) is in the form of a ratio, fraction, percentage or similar representation, (b) has a non-IFRS financial measure as one or more of its components, and (c) is not disclosed in the financial statements.
Working capital is a non-IFRS measure that is a common measure of liquidity but does not have any standardized meaning. The most directly comparable measure prepared in accordance with IFRS is current assets and current liabilities. Working capital is calculated by deducting current liabilities from current assets. Working capital should not be considered in isolation or as a substitute from measures prepared in accordance with IFRS. The measure is intended to assist readers in evaluating our liquidity.
| Expressed in millions of US dollars | As at December 31, 2025 | As at December 31, 2024 | ||||
| Current assets | $ | 423.2 | $ | 157.7 | ||
| Current liabilities | $ | 276.8 | 78.9 | |||
| Working capital | $ | 146.4 | $ | 78.8 |
Adjusted earnings and adjusted earnings per share are non-IFRS measures that supplement information to the Company's consolidated financial statements. The Company believes that, in addition to the conventional measures prepared in accordance with IFRS, the Company and certain investors and analysts use this information to evaluate the Company's underlying core operating performance. The presentation of adjusted earnings and adjusted earnings per share is not meant to be a substitute for net income and net income per share presented in accordance with IFRS but rather should be evaluated in conjunction with such IFRS measures.
The Company defines the adjusted earnings as net income adjusted to include certain non-cash and unusual items, and items that in the Company's judgement are subject to volatility as a result of factors which are unrelated to the Company's operation in the period. Certain items that become applicable in a period may be adjusted for, with the Company retroactively presenting comparable periods with an adjustment for such items and, conversely, items no longer applicable may be removed from the calculation. During the current period, the Company has included unrealized foreign exchange (gain) loss, (gain) loss on derivatives, changes in the fair value of its investments in marketable securities and change in fair value of cash settled DSUs and made retroactive adjustments to prior periods for the same.
The following table provides a detailed reconciliation of net income as reported in the Company's financial statement to adjusted earnings and adjusted earnings per share.
| Expressed in millions of US dollars | Three Months Ended December 31 |
Year Ended December 31 |
||||||||||
| 2025 | 2024 | 2025 | 2024 | |||||||||
| Net earnings (loss) for the period per financial statements | (23.8) | ($1.0) | ($119.1) | ($31.5) | ||||||||
| Unrealized foreign exchange (Gain) loss | (0.5) | 1.6 | (4.4) | 5.4 | ||||||||
| Reversal of inventory write-down to net realizable value | (2.4) | - | (2.4) | - | ||||||||
| (Gain) loss on derivatives, copper stream and contingent liabilities revaluations | 29.2 | 1.9 | 110.2 | 30.6 | ||||||||
| Acquisition costs | - | - | 3.6 | - | ||||||||
| Change in fair value of investments | 0.8 | 0.6 | - | 1.8 | ||||||||
| Change in fair value of cash settled DSUs | 1.5 | (0.3) | 5.5 | 1.8 | ||||||||
| Adjusted net earnings (loss) | $ | 4.8 | $ | 4.8 | ($6.7 | ) | $ | 8.0 | ||||
| Basic weighted average share outstanding | 294,635,507 | 252,169,924 | 283,078,337 | 242,181,449 | ||||||||
| Adjusted net earnings (loss) per share | $ | 0.02 | $ | 0.02 | ($0.02 | ) | $ | 0.03 | ||||
Mine operating cash flow before taxes is a non-IFRS measure that does not have a standardized meaning prescribed by IFRS and therefore may not be comparable to similar measures presented by other issuers. Mine operating cash flow is calculated as revenue minus direct production costs and royalties. Mine operating cash flow is used by management to assess the performance of the mine operations, excluding corporate and exploration activities, and is provided to investors as a measure of the Company's operating performance.
| Expressed in millions of US dollars | Three Months Ended December 31 |
Year Ended December 31 |
||||||||||
| 2025 | 2024 | 2025 | 2024 | |||||||||
| Mine operating earnings per financial statements | $ | 46.6 | $ | 7.7 | $ | 82.8 | $ | 42.1 | ||||
| Share-based compensation | 0.2 | 0.1 | 0.5 | 0.3 | ||||||||
| Depreciation | 24.9 | 5.3 | 73.0 | 29.9 | ||||||||
| Mine operating cash flow before taxes | $ | 71.7 | $ | 13.1 | $ | 156.3 | $ | 72.3 | ||||
Operating cash flow before working capital changes per share is a non-IFRS measure that does not have a standardized meaning prescribed by IFRS and therefore may not be comparable to similar measures presented by other issuers. Operating cash flow per share is calculated by dividing cash from operating activities by the weighted average shares outstanding. Operating cash flow per share is used by management to assess operating performance on a per share basis, irrespective of working capital changes and is provided to investors as a measure of the Company's operating performance.
| Expressed in millions of US dollars | Three Months Ended December 31 |
Year Ended December 31 |
||||||||||
| (except for per share amounts) | 2025 | 2024 | 2025 | 2024 | ||||||||
| Cash from (used in) operating activities per financial statements | $ | 15.5 | ($4.9 | ) | $ | 67.4 | $ | 19.1 | ||||
| Net changes in non-cash working capital per financial statements | 0.3 | (10.6 | ) | 16.0 | (8.1 | ) | ||||||
| Operating cash flow before working capital changes | $ | 15.1 | $ | 5.8 | $ | 51.5 | $ | 27.2 | ||||
| Basic weighted average shares outstanding | 294,635,507 | 252,169,924 | 283,078,337 | 242,181,449 | ||||||||
| Operating cash flow before working capital changes per share | $ | 0.05 | $ | 0.02 | $ | 0.18 | $ | 0.11 | ||||
EBITDA is a non-IFRS financial measure, which excludes the following from net earnings:
Adjusted EBITDA excludes the following additional items from EBITDA:
Adjusted EBITDA per share is calculated by dividing Adjusted EBITDA by the basic weighted average number of shares outstanding for the period.
Management believes EBITDA is a valuable indicator of the Company's ability to generate liquidity by producing operating cash flow to fund working capital needs, service debt obligations, and fund capital expenditures. Management uses EBITDA for this purpose.
EBITDA is also frequently used by investors and analysts for valuation purposes whereby EBITDA is multiplied by a factor or "EBITDA multiple" based on an observed or inferred relationship between EBITDA and market values to determine the approximate total enterprise value of a Company.
EBITDA is intended to provide additional information to investors and analysts. It does not have any standardized definition under IFRS and should not be considered in isolation or as a substitute for measures of operating performance prepared in accordance with IFRS. EBITDA excludes the impact of cash costs of financing activities and taxes, and the effects of changes in operating working capital balances and therefore is not necessarily indicative of operating profit or cash flow from operations as determined by IFRS. Other companies may calculate EBITDA and Adjusted EBITDA differently.
Certain items that become applicable in a period may be adjusted for, with the Company retroactively presenting comparable periods with an adjustment for such items and, conversely, items no longer applicable may be removed from the calculation.
| Expressed in millions of US dollars | Three Months Ended December 31 |
Year Ended December 31 |
||||||||||
| 2025 | 2024 | 2025 | 2024 | |||||||||
| Net earnings (loss) for the period per financial statements | ($23.8) | $1.0 | ($119.1) | ($31.5) | ||||||||
| Depreciation - cost of sales | 24.9 | 5.3 | 73.0 | 29.9 | ||||||||
| Depreciation - exploration, evaluation and development | 0.1 | 0.3 | 0.5 | 0.8 | ||||||||
| Depreciation - general & administration | 0.1 | 0.1 | 0.4 | 0.4 | ||||||||
| Finance costs | 11.6 | 0.3 | 13.3 | 0.9 | ||||||||
| Current income tax expense | 11.6 | (0.2) | 36.6 | 12.9 | ||||||||
| Deferred income tax expense (recovery) | (12.8) | (2.5) | (22.4) | (3.4) | ||||||||
| EBITDA | $ | 11.7 | $ | 4.4 | ($17.7 | ) | $ | 10.0 | ||||
| Share based compensation | 0.8 | 0.4 | 3.9 | 3.2 | ||||||||
| Unrealized foreign exchange (gain) loss | (0.5 | ) | 1.6 | (4.4 | ) | 5.4 | ||||||
| Reversal inventory write-down to net realizable value | (2.4 | ) | - | (2.4 | ) | - | ||||||
| (Gain) loss on derivatives, copper stream and contingent liabilities revaluations | 29.2 | 1.9 | 110.2 | 30.6 | ||||||||
| Change in fair value of investments | 0.8 | 0.6 | - | 1.8 | ||||||||
| Change in fair value of cash settled DSUs | 1.5 | (0.3 | ) | 5.5 | 1.8 | |||||||
| Adjusted EBITDA | $ | 44.1 | $ | 8.6 | $ | 95.1 | $ | 52.7 | ||||
| Basic weighted average shares outstanding | 294,635,507 | 252,169,924 | 283,078,337 | 242,181,449 | ||||||||
| Adjusted EBITDA per share | $ | 0.14 | $ | 0.03 | $ | 0.34 | $ | 0.22 | ||||
Cash costs per silver oz, total production costs per oz, direct operating costs per tonne and direct costs per tonne are measures developed by precious metals companies in an effort to provide a comparable standard; however, there can be no assurance that the Company's reporting of these non-IFRS measures and ratios are similar to those reported by other mining companies. Cash costs per oz, total production costs per oz and direct costs per tonne are measures used by the Company to manage and evaluate operating performance at each of the Company's operating mining units. They are widely reported in the silver mining industry as a benchmark for performance, but do not have a standardized meaning and are disclosed in addition to IFRS measures. Direct operating costs include mining, processing (including smelting, refining, transportation and selling costs) and direct overhead at the operation sites. Direct costs include all direct operating costs plus royalties and special mining duty. Cash costs include all direct costs less by-product gold sales and changes in finished gold inventories.
Total production costs include all cash costs plus depreciation, changes in depreciation in finished goods inventory and site share-based compensation. Cash costs per silver ounce and total production costs per ounce are calculated by dividing cash costs and total production costs by the payable silver ounces produced. Direct operating cost per tonne and direct costs per tonne are calculated by dividing direct operating costs and direct costs by the number of processed tonnes. The following tables provide a detailed reconciliation of these measures to the Company's direct production costs, as reported in its consolidated financial statements.
| Expressed in millions of US dollars | Three Months Ended December 31, 2025 |
||||||||||||||
| Terronera | Guanaceví | Bolañitos | Kolpa | Total | |||||||||||
| Direct production costs per financial statements | $ | 30.4 | $ | 28.0 | $ | 11.1 | $ | 22.5 | $ | 92.0 | |||||
| Purchase of the third-party material | - | (10.6 | ) | - | (0.9 | ) | (11.5 | ) | |||||||
| Smelting and refining costs included in revenue | 1.0 | - | 0.4 | 2.5 | 3.8 | ||||||||||
| Opening finished goods | (0.1 | ) | (5.5 | ) | (0.5 | ) | (0.6 | ) | (6.8 | ) | |||||
| Closing finished goods | 3.0 | 8.6 | 0.5 | 0.8 | 12.9 | ||||||||||
| Direct operating costs | 34.3 | 20.5 | 11.5 | 24.2 | 90.5 | ||||||||||
| Purchase of the third-party material | - | 10.6 | - | 0.9 | 11.5 | ||||||||||
| Royalties | 1.2 | 6.9 | 0.2 | 0.6 | 9.0 | ||||||||||
| Special mining duty (1) | - | 2.0 | 1.0 | 0.5 | 3.6 | ||||||||||
| Direct costs | 35.5 | 40.1 | 12.7 | 26.2 | 114.6 | ||||||||||
| By-products sales | (31.2 | ) | (11.9 | ) | (10.9 | ) | (19.3 | ) | (73.4 | ) | |||||
| Opening by-products inventory fair market value | 0.3 | 2.3 | 0.7 | 0.5 | 3.8 | ||||||||||
| Closing by-products inventory fair market value | (3.0 | ) | (3.2 | ) | (0.7 | ) | (0.6 | ) | (7.5 | ) | |||||
| Cash costs net of by-products | 1.6 | 27.3 | 1.8 | 6.8 | 37.5 | ||||||||||
| Depreciation | 7.1 | 7.8 | 1.9 | 8.2 | 24.9 | ||||||||||
| Share-based compensation | 0.1 | - | - | - | 0.2 | ||||||||||
| Opening finished goods depreciation | - | (1.7 | ) | (0.1 | ) | (0.1 | ) | (1.9 | ) | ||||||
| Closing finished goods depreciation | 0.5 | 1.8 | - | 0.2 | 2.4 | ||||||||||
| Total production costs | $ | 9.2 | $ | 35.2 | $ | 3.6 | $ | 15.1 | $ | 63.0 | |||||
| Expressed in millions of US dollars | Three Months Ended December 31, 2024 |
||||||||||||||
| Terronera | Guanaceví | Bolañitos | Kolpa | Total | |||||||||||
| Direct production costs per financial statements | $ | - | $ | 14.0 | $ | 11.4 | $ | - | $ | 25.4 | |||||
| Purchase of the third-party material | - | (4.2 | ) | - | - | (4.2 | ) | ||||||||
| Smelting and refining costs included in revenue | - | - | 0.5 | - | 0.5 | ||||||||||
| Opening finished goods | - | (1.7 | ) | (0.7 | ) | - | (2.4 | ) | |||||||
| Closing finished goods | - | 5.4 | 0.5 | - | 5.9 | ||||||||||
| Direct operating costs | - | 13.5 | 11.7 | - | 25.2 | ||||||||||
| Purchase of the third-party material | - | 4.2 | - | - | 4.2 | ||||||||||
| Royalties | - | 3.6 | 0.1 | - | 3.7 | ||||||||||
| Special mining duty (1) | - | 0.2 | 1.4 | - | 1.6 | ||||||||||
| Direct costs | - | 21.5 | 13.2 | - | 34.7 | ||||||||||
| By-products sales | - | (4.9 | ) | (17.3 | ) | - | (22.2 | ) | |||||||
| Opening by-products inventory fair market value | - | 1.1 | 1.5 | - | 2.6 | ||||||||||
| Closing by-products inventory fair market value | - | (3.2 | ) | (0.8 | ) | - | (4.0 | ) | |||||||
| Cash costs net of by-products | - | 14.5 | (3.4 | ) | - | 11.1 | |||||||||
| Depreciation | - | 3.1 | 2.3 | - | 5.4 | ||||||||||
| Share-based compensation | - | - | 0.1 | - | 0.1 | ||||||||||
| Opening finished goods depreciation | - | (0.5 | ) | (0.2 | ) | - | (0.7 | ) | |||||||
| Closing finished goods depreciation | - | 1.2 | 0.1 | - | 1.3 | ||||||||||
| Total production costs | $ | - | $ | 18.3 | ($1.1 | ) | $ | - | $ | 17.2 | |||||
| Expressed in millions of US dollars | Three Months Ended December 31, 2025 |
||||||||||||||
| Terronera | Guanaceví | Bolañitos | Kolpa | Total | |||||||||||
| Throughput tonnes | 154,180 | 104,380 | 93,620 | 198,830 | 551,010 | ||||||||||
| Payable silver ounces | 334,850 | 874,921 | 160,647 | 596,781 | 1,967,199 | ||||||||||
| Cash costs per silver ounce | $ | 4.76 | $ | 31.18 | $ | 11.18 | $ | 11.42 | $ | 19.05 | |||||
| Total production costs per ounce | $ | 27.49 | $ | 40.19 | $ | 22.23 | $ | 25.30 | $ | 32.05 | |||||
| Direct operating costs per tonne | $ | 222.57 | $ | 196.45 | $ | 122.84 | $ | 121.50 | $ | 164.21 | |||||
| Direct costs per tonne | $ | 230.35 | $ | 383.98 | $ | 136.00 | $ | 131.93 | $ | 207.91 | |||||
| Expressed in millions of US dollars | Three Months Ended December 31, 2024 |
||||||||||||||
| Terronera | Guanaceví | Bolañitos | Kolpa | Total | |||||||||||
| Throughput tonnes | - | 58,798 | 106,793 | - | 165,591 | ||||||||||
| Payable silver ounces | - | 716,641 | 100,651 | - | 817,292 | ||||||||||
| Cash costs per silver ounce | $ | - | $ | 20.25 | ($33.11 | ) | $ | - | $ | 13.68 | |||||
| Total production costs per ounce | $ | - | $ | 25.50 | ($11.03 | ) | $ | - | $ | 21.00 | |||||
| Direct operating costs per tonne | $ | - | $ | 230.50 | $ | 109.46 | $ | - | $ | 152.44 | |||||
| Direct costs per tonne | $ | - | $ | 365.23 | $ | 123.73 | $ | - | $ | 209.49 | |||||
| Expressed in millions of US dollars | Year Ended December 31, 2025 |
||||||||||||||
| Terronera | Guanaceví | Bolañitos | Kolpa | Total | |||||||||||
| Direct production costs per financial statements | $ | 30.4 | $ | 102.8 | $ | 44.1 | $ | 65.6 | $ | 242.9 | |||||
| Purchase of the third-party material | - | (30.9 | ) | - | (2.5 | ) | (33.4 | ) | |||||||
| Smelting and refining costs included in revenue | 1.0 | - | 1.6 | 5.5 | 8.1 | ||||||||||
| Opening finished goods | (0.1 | ) | (5.4 | ) | (0.5 | ) | (0.6 | ) | (6.6 | ) | |||||
| Closing finished goods | 3.0 | 8.6 | 0.5 | 0.8 | 12.9 | ||||||||||
| Direct operating costs | 34.3 | 75.0 | 45.8 | 68.7 | 223.8 | ||||||||||
| Purchase of the third-party material | - | 30.9 | - | 2.5 | 33.4 | ||||||||||
| Royalties | 1.2 | 26.8 | 0.8 | 1.2 | 30.0 | ||||||||||
| Special mining duty (1) | - | 5.4 | 2.4 | 1.3 | 9.1 | ||||||||||
| Direct costs | 35.5 | 138.2 | 48.9 | 73.7 | 296.3 | ||||||||||
| By-products sales | (31.2 | ) | (47.6 | ) | (51.5 | ) | (53.2 | ) | (183.6 | ) | |||||
| Opening by-products inventory fair market value | 0.3 | 3.2 | 0.8 | 0.5 | 4.8 | ||||||||||
| Closing by-products inventory fair market value | (3.0 | ) | (3.2 | ) | (0.7 | ) | (0.6 | ) | (7.5 | ) | |||||
| Cash costs net of by-products | 1.6 | 90.5 | (2.5 | ) | 20.4 | 110.0 | |||||||||
| Depreciation | 7.1 | 28.9 | 10.2 | 21.0 | 67.1 | ||||||||||
| Share-based compensation | 0.1 | 0.2 | 0.1 | 0.1 | 0.5 | ||||||||||
| Opening finished goods depreciation | - | (1.2 | ) | (0.1 | ) | (0.1 | ) | (1.4 | ) | ||||||
| Closing finished goods depreciation | 0.5 | 1.8 | - | 0.2 | 2.4 | ||||||||||
| Total production costs | $ | 9.2 | $ | 120.2 | $ | 7.7 | $ | 41.5 | $ | 178.6 | |||||
| Expressed in millions of US dollars | Year Ended December 31, 2024 |
||||||||||||||
| Terronera | Guanaceví | Bolañitos | Kolpa | Total | |||||||||||
| Direct production costs per financial statements | $ | - | $ | 82.9 | $ | 41.6 | $ | - | $ | 124.5 | |||||
| Purchase of the third-party material | (14.4 | ) | - | (14.4 | ) | ||||||||||
| Smelting and refining costs included in revenue | - | - | 2.0 | - | 2.0 | ||||||||||
| Opening finished goods | - | (7.1 | ) | (0.7 | ) | - | (7.8 | ) | |||||||
| Closing finished goods | - | 5.4 | 0.5 | - | 5.9 | ||||||||||
| Direct operating costs | - | 66.8 | 43.4 | - | 110.2 | ||||||||||
| Purchase of the third-party material | - | 14.4 | - | - | 14.4 | ||||||||||
| Royalties | - | 20.5 | 0.4 | - | 20.9 | ||||||||||
| Special mining duty (1) | - | 2.3 | 2.7 | - | 5.0 | ||||||||||
| Direct costs | - | 104.0 | 46.5 | - | 150.5 | ||||||||||
| By-products sales | - | (32.5 | ) | (59.9 | ) | - | (92.4 | ) | |||||||
| Opening by-products inventory fair market value | - | 2.9 | 0.6 | - | 3.5 | ||||||||||
| Closing by-products inventory fair market value | - | (3.2 | ) | (0.8 | ) | - | (4.0 | ) | |||||||
| Cash costs net of by-products | - | 71.2 | (13.6 | ) | - | 57.6 | |||||||||
| Depreciation | - | 19.5 | 10.4 | - | 29.9 | ||||||||||
| Share-based compensation | - | 0.2 | 0.1 | - | 0.3 | ||||||||||
| Opening finished goods depreciation | - | (1.5 | ) | (0.2 | ) | - | (1.7 | ) | |||||||
| Closing finished goods depreciation | - | 1.2 | 0.1 | - | 1.3 | ||||||||||
| Total production costs | $ | - | $ | 90.6 | ($3.2 | ) | $ | - | $ | 87.4 | |||||
| Expressed in millions of US dollars | Year Ended December 31, 2025 |
||||||||||||||
| Terronera | Guanaceví | Bolañitos | Kolpa | Total | |||||||||||
| Throughput tonnes | 154,180 | 402,992 | 393,940 | 513,478 | 1,464,590 | ||||||||||
| Payable silver ounces | 334,850 | 3,903,332 | 578,959 | 1,523,145 | 6,340,286 | ||||||||||
| Cash costs per silver ounce | $ | 4.76 | $ | 23.19 | ($4.35 | ) | $ | 13.38 | $ | 17.34 | |||||
| Total production costs per ounce | $ | 27.49 | $ | 30.80 | $ | 13.34 | $ | 27.24 | $ | 28.17 | |||||
| Direct operating costs per tonne | $ | 222.57 | $ | 186.16 | $ | 116.19 | $ | 133.74 | $ | 152.79 | |||||
| Direct costs per tonne | $ | 230.35 | $ | 342.81 | $ | 124.21 | $ | 143.51 | $ | 202.30 | |||||
| Expressed in millions of US dollars | Year Ended December 31, 2024 |
||||||||||||||
| Terronera | Guanaceví | Bolañitos | Kolpa | Total | |||||||||||
| Throughput tonnes | - | 353,793 | 427,646 | - | 781,439 | ||||||||||
| Payable silver ounces | - | 4,007,140 | 431,214 | - | 4,438,354 | ||||||||||
| Cash costs per silver ounce | $ | - | $ | 17.78 | ($31.47 | ) | $ | - | $ | 12.99 | |||||
| Total production costs per ounce | $ | - | $ | 22.62 | ($7.43 | ) | $ | - | $ | 19.70 | |||||
| Direct operating costs per tonne | $ | - | $ | 188.71 | $ | 101.49 | $ | - | $ | 140.98 | |||||
| Direct costs per tonne | $ | - | $ | 293.90 | $ | 108.63 | $ | - | $ | 192.51 | |||||
(1) Special mining duty is an EBITDA royalty tax presented as a current income tax in accordance with IFRS.
| Expressed in millions of US dollars | December 31, 2025 | ||||||||||||||
| Terronera | Guanaceví | Bolañitos | Kolpa | Total | |||||||||||
| Closing finished goods | 3.0 | 8.6 | 0.5 | 0.8 | 12.9 | ||||||||||
| Closing finished goods depreciation | 0.5 | 1.8 | 0.0 | 0.2 | 2.4 | ||||||||||
| Finished goods inventory | $ | 3.5 | $ | 10.4 | $ | 0.5 | $ | 0.9 | $ | 15.4 | |||||
| Expressed in millions of US dollars | December 31, 2024 | ||||||||||||||
| Terronera | Guanaceví | Bolañitos | Kolpa | Total | |||||||||||
| Closing finished goods | - | 5.4 | 0.5 | - | 5.9 | ||||||||||
| Closing finished goods depreciation | - | 1.2 | 0.1 | - | 1.3 | ||||||||||
| Finished goods inventory | $ | - | $ | 6.6 | $ | 0.6 | $ | - | $ | 7.2 | |||||
AISC per oz and all-in costs per oz are measures developed by the World Gold Council (and used as a standard of the Silver Institute) in an effort to provide a comparable standard within the precious metal industry; however, there can be no assurance that the Company's reporting of these non-IFRS measures are similar to those reported by other mining companies. These measures are used by the Company to manage and evaluate operating performance at each of the Company's operating mining units and consolidated group and are widely reported in the silver mining industry as a benchmark for performance, but do not have a standardized meaning and are disclosed in addition to IFRS measures. The following tables provide a detailed reconciliation of these measures to the Company's cost of sales, as reported in the Company's consolidated financial statements.
| Expressed in millions of US dollars | Three Months Ended December 31, 2025 |
||||||||||||||
| Terronera | Guanaceví | Bolañitos | Kolpa | Total | |||||||||||
| Cash costs net of by-products | $ | 1.6 | $ | 27.3 | $ | 1.8 | $ | 6.8 | $ | 37.5 | |||||
| Operations share-based compensation | 0.1 | - | - | - | 0.2 | ||||||||||
| Corporate general and administrative | 1.8 | 2.6 | 0.9 | (1.0 | ) | 4.2 | |||||||||
| Corporate share-based compensation | 0.3 | 0.2 | - | 0.2 | 0.7 | ||||||||||
| Reclamation - amortization/accretion | 0.1 | 0.2 | - | 0.1 | 0.3 | ||||||||||
| Mine site expensed exploration | 0.7 | 0.4 | 0.1 | 1.7 | 2.9 | ||||||||||
| Equipment loan payments | 1.2 | - | - | 0.2 | 1.4 | ||||||||||
| Capital expenditures sustaining | 16.3 | 6.4 | 2.9 | 8.3 | 33.9 | ||||||||||
| All-In-Sustaining Costs | $ | 22.0 | $ | 37.0 | $ | 5.8 | $ | 16.2 | $ | 81.0 | |||||
| Growth exploration, evaluation and development | 3.6 | ||||||||||||||
| Growth capital expenditures | 5.0 | ||||||||||||||
| All-In-Costs | $ | 89.6 | |||||||||||||
| Expressed in millions of US dollars | Three Months Ended December 31, 2024 |
||||||||||||||
| Terronera | Guanaceví | Bolañitos | Kolpa | Total | |||||||||||
| Cash costs net of by-products | $ | - | $ | 14.5 | ($3.4 | ) | $ | - | $ | 11.1 | |||||
| Operations share-based compensation | - | - | 0.1 | - | 0.1 | ||||||||||
| Corporate general and administrative | - | 0.9 | 0.7 | - | 1.6 | ||||||||||
| Corporate share-based compensation | - | 0.1 | 0.1 | - | 0.2 | ||||||||||
| Reclamation - amortization/accretion | - | 0.1 | 0.1 | - | 0.2 | ||||||||||
| Mine site expensed exploration | - | 0.4 | 0.2 | - | 0.6 | ||||||||||
| Capital expenditures sustaining | - | 7.2 | 1.3 | - | 8.5 | ||||||||||
| All-In-Sustaining Costs | $ | - | $ | 23.2 | ($0.9 | ) | $ | - | $ | 22.3 | |||||
| Growth exploration, evaluation and development | 5.2 | ||||||||||||||
| Growth capital expenditures | 37.3 | ||||||||||||||
| All-In-Costs | $ | 64.8 | |||||||||||||
| Expressed in millions of US dollars | Three Months Ended December 31, 2025 |
||||||||||||||
| Terronera | Guanaceví | Bolañitos | Kolpa | Total | |||||||||||
| Throughput tonnes | 154,180 | 104,380 | 93,620 | 198,830 | 551,010 | ||||||||||
| Payable silver ounces | 334,850 | 874,921 | 160,647 | 596,781 | 1,967,199 | ||||||||||
| Silver equivalent production (ounces) | 1,003,822 | 1,117,703 | 379,632 | 1,266,557 | 3,767,713 | ||||||||||
| All-in-Sustaining cost per ounce | $ | 65.70 | $ | 42.31 | $ | 35.95 | $ | 27.19 | $ | 41.19 | |||||
| Expressed in millions of US dollars | Three Months Ended December 31, 2024 |
||||||||||||||
| Terronera | Guanaceví | Bolañitos | Kolpa | Total | |||||||||||
| Throughput tonnes | - | 58,798 | 106,793 | - | 165,591 | ||||||||||
| Payable silver ounces | - | 716,641 | 100,651 | - | 817,292 | ||||||||||
| Silver equivalent production (ounces) | - | 928,557 | 621,972 | - | 1,550,529 | ||||||||||
| All-in-Sustaining cost per ounce | $ | - | $ | 32.40 | ($8.78 | ) | $ | - | $ | 27.33 | |||||
| Expressed in millions of US dollars | Year Ended December 31, 2025 |
||||||||||||||
| Terronera | Guanaceví | Bolañitos | Kolpa | Total | |||||||||||
| Cash costs net of by-products | $ | 1.6 | $ | 90.5 | ($2.5 | ) | $ | 20.4 | $ | 110.0 | |||||
| Operations share-based compensation | 0.1 | 0.2 | 0.1 | 0.1 | 0.5 | ||||||||||
| Corporate general and administrative | 1.8 | 8.9 | 3.3 | 6.0 | 19.9 | ||||||||||
| Acquisition costs | - | - | - | (3.6 | ) | (3.6 | ) | ||||||||
| Corporate share-based compensation | 0.3 | 1.3 | 0.5 | 0.9 | 3.0 | ||||||||||
| Reclamation - amortization/accretion | 0.1 | 0.6 | 0.3 | 0.2 | 1.1 | ||||||||||
| Mine site expensed exploration | 0.7 | 1.2 | 0.8 | 4.2 | 7.0 | ||||||||||
| Equipment loan payments | 1.2 | - | - | 0.4 | 1.6 | ||||||||||
| Capital expenditures sustaining | 16.3 | 19.6 | 10.4 | 14.1 | 60.4 | ||||||||||
| All-In-Sustaining Costs | $ | 22.0 | $ | 122.4 | $ | 12.8 | $ | 42.6 | $ | 199.8 | |||||
| Acquisition costs | 3.6 | ||||||||||||||
| Growth exploration, evaluation and development | 15.4 | ||||||||||||||
| Growth capital expenditures | 108.8 | ||||||||||||||
| All-In-Costs | $ | 327.7 | |||||||||||||
| Expressed in millions of US dollars | Year Ended December 31, 2024 |
||||||||||||||
| Terronera | Guanaceví | Bolañitos | Kolpa | Total | |||||||||||
| Cash costs net of by-products | $ | - | $ | 71.2 | ($13.6 | ) | $ | - | $ | 57.6 | |||||
| Operations share-based compensation | - | 0.2 | 0.1 | - | 0.3 | ||||||||||
| Corporate general and administrative | - | 7.4 | 3.6 | - | 11.0 | ||||||||||
| Corporate share-based compensation | - | 1.9 | 0.9 | - | 2.8 | ||||||||||
| Reclamation - amortization/accretion | - | 0.4 | 0.3 | - | 0.7 | ||||||||||
| Mine site expensed exploration | - | 1.1 | 1.2 | - | 2.3 | ||||||||||
| Equipment loan payments | - | 0.2 | 0.3 | - | 0.5 | ||||||||||
| Capital expenditures sustaining | - | 22.9 | 7.9 | - | 30.8 | ||||||||||
| All-In-Sustaining Costs | $ | - | $ | 105.3 | $ | 0.7 | $ | - | $ | 106.0 | |||||
| Growth exploration, evaluation and development | 16.1 | ||||||||||||||
| Growth capital expenditures | 164.6 | ||||||||||||||
| All-In-Costs | $ | 286.7 | |||||||||||||
| Expressed in millions of US dollars | Year Ended December 31, 2025 |
||||||||||||||
| Terronera | Guanaceví | Bolañitos | Kolpa | Total | |||||||||||
| Throughput tonnes | 154,180 | 402,992 | 393,940 | 513,478 | 1,464,590 | ||||||||||
| Payable silver ounces | 334,850 | 3,903,332 | 578,959 | 1,523,145 | 6,340,286 | ||||||||||
| Silver equivalent production (ounces) | 1,003,822 | 5,014,826 | 1,829,957 | 3,357,774 | 11,206,378 | ||||||||||
| All-in-Sustaining cost per ounce | $ | 65.70 | $ | 31.37 | $ | 22.06 | $ | 27.99 | $ | 31.52 | |||||
| Expressed in millions of US dollars | Year Ended December 31, 2024 |
||||||||||||||
| Terronera | Guanaceví | Bolañitos | Kolpa | Total | |||||||||||
| Throughput tonnes | - | 353,793 | 427,646 | - | 781,439 | ||||||||||
| Payable silver ounces | - | 4,007,140 | 431,214 | - | 4,438,354 | ||||||||||
| Silver equivalent production (ounces) | - | 5,124,557 | 2,471,027 | - | 7,595,584 | ||||||||||
| All-in-Sustaining cost per ounce | $ | - | $ | 26.29 | $ | 1.47 | $ | - | $ | 23.88 | |||||
| Expressed in millions of US dollars | Three Months Ended December 31 |
Year Ended December 31 |
||||||||||
| 2025 | 2024 | 2025 | 2024 | |||||||||
| Capital expenditures sustaining | $ | 33.9 | $ | 8.5 | $ | 60.4 | $ | 30.8 | ||||
| Growth capital expenditures | 5.0 | 37.3 | 108.8 | 164.6 | ||||||||
| Property, plant and equipment expenditures per Consolidated Statement of Cash Flows | $ | 38.8 | $ | 45.8 | $ | 169.2 | $ | 195.4 | ||||
| Expressed in millions of US dollars | Three Months Ended December 31 | Year Ended December 31 |
||||||||||
| 2025 | 2024 | 2025 | 2024 | |||||||||
| Mine site expensed exploration | $ | 2.9 | $ | 0.6 | $ | 7.0 | $ | 2.3 | ||||
| Growth exploration, evaluation and development | 3.6 | 5.2 | 15.4 | 16.1 | ||||||||
| Total exploration, evaluation and development | 6.5 | 5.8 | 22.4 | 18.4 | ||||||||
| Exploration, evaluation and development depreciation | 0.1 | 0.3 | 0.5 | 0.8 | ||||||||
| Exploration, evaluation and development share-based compensation | 0.1 | 0.1 | 0.5 | 0.2 | ||||||||
| Exploration, evaluation and development expense | $ | 6.6 | $ | 6.2 | $ | 23.3 | $ | 19.4 | ||||
| Expressed in millions of US dollars | Three Months Ended December 31 | Year Ended December 31 |
||||||||||
| 2025 | 2024 | 2025 | 2024 | |||||||||
| Gross silver sales | $ | 103.1 | $ | 20.7 | $ | 267.3 | $ | 127.3 | ||||
| Silver ounces sold | 1,879,936 | 654,519 | 6,562,106 | 4,645,574 | ||||||||
| Realized silver price per ounce | $ | 54.83 | $ | 31.56 | $ | 40.73 | $ | 27.39 | ||||
1) inclusive of 212,691 oz of silver from pre-operating production at Terronera during three months and 240,321 oz during the Year ended December 31, 2025
| Expressed in millions of US dollars | Three Months Ended December 31 | Year Ended December 31 | ||||||||||
| 2025 | 2024 | 2025 | 2024 | |||||||||
| Gross gold sales | $ | 54.0 | $ | 22.1 | $ | 156.0 | $ | 92.4 | ||||
| Gold ounces sold | 12,614 | 8,343 | 43,430 | 38,522 | ||||||||
| Realized gold price per ounce | $ | 4,283 | $ | 2,647 | $ | 3,591 | $ | 2,397 | ||||
1) inclusive of 6,368 oz of gold from pre-operating production at Terronera during three months and 7,094 oz during the Year ended December 31, 2025
| Expressed in millions of US dollars | Three Months Ended December 31 | Year Ended December 31 | ||||||||||
| 2025 | 2024 | 2025 | 2024 | |||||||||
| Gross lead sales | $ | 10.7 | $ | - | $ | 27.9 | $ | - | ||||
| Lead tonnes sold | 5,456 | - | 14,145 | - | ||||||||
| Realized lead price per tonne | $ | 1,969 | $ | - | $ | 1,975 | $ | - | ||||
| Expressed in millions of US dollars | Three Months Ended December 31 | Year Ended December 31 | ||||||||||
| 2025 | 2024 | 2025 | 2024 | |||||||||
| Gross Zinc sales | $ | 7.2 | $ | - | $ | 21.6 | $ | - | ||||
| Zinc tonnes sold | 2,573 | - | 7,662 | - | ||||||||
| Realized zinc price per tonne | $ | 2,801 | $ | - | $ | 2,820 | $ | - | ||||
| Expressed in millions of US dollars | Three Months Ended December 31 | Year Ended December 31 | ||||||||||
| 2025 | 2024 | 2025 | 2024 | |||||||||
| Gross Copper sales | $ | 1.1 | $ | - | $ | 2.8 | $ | - | ||||
| Copper tonnes sold | 98 | - | 270 | - | ||||||||
| Realized copper price per tonne | $ | 11,434 | $ | - | $ | 10,481 | $ | - | ||||