
Endeavour Silver Corp.
Management’s Discussion & Analysis
For the Three Months Ended March 31, 2026 and 2025
| MANAGEMENT'S DISCUSSION AND ANALYSIS FOR THE PERIOD ENDED MARCH 31, 2026 |
This Management Discussion and Analysis ("MD&A") should be read in conjunction with the condensed consolidated interim financial statements of Endeavour Silver Corp. ("Endeavour" or "the Company") for the period ended March 31, 2026 and the related notes contained therein, which were prepared in accordance with IAS 34 - Interim Financial Reporting of the International Financial
Reporting Standards ("IFRS") as issued by the International Accounting Standards Board ("IASB").
The Company uses certain non-IFRS financial measures in this MD&A as described under "Non-IFRS Measures". Additional information relating to the Company, including the most recent Annual Information Form (the "Annual Information Form"), is available on SEDAR+ at www.sedarplus.com, and the Company's most recent annual report on Form 40-F which has been filed with the U.S. Securities and Exchange Commission (the "SEC") on EDGAR at www.sec.gov. This MD&A contains "forward-looking statements" that are subject to the risk factors set out in a cautionary note contained herein. All dollar ($) amounts are expressed in United States ("$") dollars and tabular amounts are expressed in millions of U.S. dollars unless Canadian dollars (CAN$), Mexican pesos (MXN) or Peruvian soles (PEN) are otherwise indicated. This MD&A is dated as of May 6, 2026, and all information contained herein is current as of May 6, 2026, unless otherwise stated.
Cautionary Note to U.S. Investors Regarding Mineral Reserves and Resources
This MD&A has been prepared in accordance with the requirements of Canadian provincial securities laws, which differ from the requirements of U.S. securities laws. As a result, the Company reports the mineral reserves and resources of the projects it has an interest in according to Canadian standards. Canadian reporting requirements for disclosure of mineral properties are governed by National Instrument 43-101 - Standards of Disclosure for Mineral Projects ("NI 43-101"). NI 43-101 is a rule developed by the Canadian Securities Administrators that establishes standards for all public disclosure an issuer makes of scientific and technical information concerning mineral projects. These standards differ from the requirements of the SEC that are applicable to domestic United States reporting companies under subpart 1300 of Regulation S-K ("S-K 1300") under the Exchange Act. As an issuer that prepares and files its reports with the SEC pursuant to the Multijurisdictional Disclosure System, the Company is not subject to the requirements of S-K 1300. Any mineral reserves and mineral resources reported by the Company in accordance with NI 43-101 may not qualify as such under or differ from those prepared in accordance with S-K 1300. Accordingly, information included or incorporated by reference in this MD&A concerning descriptions of mineralization and estimates of mineral reserves and resources under Canadian standards may not be comparable to similar information made public by United States companies subject to the reporting and disclosure requirements of S-K 1300.
Forward-Looking Statements
This MD&A contains “forward-looking statements” within the meaning of the U.S. Securities Litigation Reform Act of 1995, as amended and “forward-looking information” within the meaning of applicable Canadian securities legislation. Such forward‑looking statements and information include, but are not limited to, the reliability of mineral resource estimates; the continuation of exploration and mining operations; the Company’s future production and cost guidance announcements; The Company’s areas of focus at its properties; mineral resource estimations and life of mine plans; planned expansions, exploration and drilling activities, and the Company’s areas of focus for each; production increases, efficiency programs and cost reductions at the Terronera mine and related timing; investment at the Pitarrilla project; expectations regarding throughput at the Kolpa mine; the Company’s plans for drilling and technical work; the Company’s annual outlook including anticipated performance in 2026, production and cost guidance and financial results, silver and gold grades and recoveries, cash costs per ounce (“oz”), anticipated operating costs, planned capital expenditures and sustaining capital, and the forecast price of gold and silver; planned capital allocation; working capital; the Company’s capital requirements and the adequacy of the operating cash flow and existing working capital to meet capital requirements and the timing and results of various activities. Forward-looking statements are frequently characterized by words such as “plan”, “expect”, “forecast”, “project”, “intend”, ‘believe”, “anticipate”, “outlook” and other similar words, or statements that certain events or conditions “may” or “will” occur. Forward‑looking statements are based on the opinions and estimates of management at the dates the statements are made, and are subject to a variety of risks and uncertainties and other factors that could cause actual events or results to differ materially from those projected in the forward-looking statements.
The Company does not intend to, and does not assume any obligation to, update such forward-looking statements or information, other than as required by applicable law. Forward-looking statements or information involve known and unknown risks, uncertainties and other factors and are based on assumptions that may cause the actual results, level of activity, performance or achievements of the Company and its operations and related timeframes to be materially different from those expressed or implied by such statements. Such factors and assumptions include, among others: the ongoing effects of inflation and supply chain issues on project economics; fluctuations in the prices of silver and gold; fluctuations in the currency markets (particularly the Mexican peso, Chilean peso, Canadian dollar, Peruvian sol, and U.S. dollar); fluctuations in interest rates; effects of inflation changes in national and local governments, legislation, taxation, controls, regulations and political or economic developments in Canada, Peru and Mexico; operating or technical difficulties in mineral exploration, development and mining activities; risks and hazards of mineral exploration, development and mining (including, but not limited to environmental hazards, industrial accidents, unusual or unexpected geological conditions, pressures, cave-ins and flooding); inadequate insurance, or inability to obtain insurance; availability of and costs associated with mining inputs and labour; the speculative nature of mineral exploration and development; diminishing quantities or grades of mineral reserves as properties are mined; risks in obtaining necessary licenses and permits; challenges to the Company's title to properties; as well as those factors described under "Risk Factors" in the Company's most recent Annual Information Form. Although the Company has attempted to identify important factors that could cause actual results to differ materially from those contained in forward-looking statements or information, there may be other factors that cause results to be materially different from those anticipated, described, estimated, assessed or intended. There can be no assurance that any forward-looking statements or information will prove to be accurate as actual results and future events could differ materially from those anticipated in such statements or information. Accordingly, readers should not place undue reliance on forward-looking statements or information.
Certain forward-looking statements and information in this MD&A may be considered "financial outlook" within the meaning of applicable Canadian securities legislation. Financial outlook is presented in this MD&A for the purpose of assisting investors and others in understanding certain key elements of the Company's financial results and business plan, as well as the objectives, strategic priorities and business outlook of the Company, and in obtaining a better understanding of the Company's anticipated operating environment. Readers are cautioned that such financial outlook may not be appropriate for other purposes.
Qualified Person
The scientific and technical information contained in this MD&A relating to the Company's mines and mineral projects has been reviewed and approved by Dale Mah, B.Sc., P.Geo., Vice President Corporate Development of Endeavour, a Qualified Person within the meaning of NI 43-101.
Table of Contents
OVERVIEW OF THE BUSINESS
The Company is engaged in silver mining in Mexico and Peru and related activities including property acquisitions, exploration, development, mineral extraction, processing, refining and reclamation. The Company is also engaged in exploration activities in Chile and Nevada, USA. The Company's operations are comprised of the Guanaceví mine ("Guanaceví") located in Durango, Mexico, the Terronera mine ("Terronera") in Jalisco, Mexico, and the Kolpa mine ("Kolpa") in Huancavelica, Peru. On January 15, 2026, the Company completed the sale of the Bolañitos mine ("Bolañitos"). The Company is advancing several exploration projects in order to achieve its goal of becoming a premier senior producer in the silver mining sector.
The Company's common shares are listed on the Toronto Stock Exchange (TSX: EDR) and the New York Stock Exchange (NYSE: EXK).
OPERATING HIGHLIGHTS
| Q1 2026 Highlights | Three Months Ended March 31 | ||||||||
| 2026 | 2025 | % Change | |||||||
| Production | |||||||||
| Silver ounces produced | 1,875,375 | 1,205,793 | 56% | ||||||
| Gold ounces produced | 11,740 | 8,338 | 41% | ||||||
| Lead tonnes produced | 4,939 | - | - | ||||||
| Zinc tonnes produced | 2,842 | - | - | ||||||
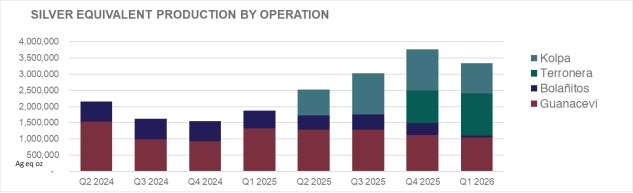
| Silver equivalent ounces produced(1) | 3,341,943 | 1,872,833 | 78% | ||||||
| Cash costs per silver ounce ($)(2) | 22.54 | 15.89 | 42% | ||||||
| Total production costs per ounce ($)(2) | 35.21 | 24.23 | 45% | ||||||
| All-in sustaining costs per ounce ($)(2) | 37.03 | 24.48 | 51% | ||||||
| Processed tonnes | 456,657 | 209,507 | 118% | ||||||
| Direct operating costs per tonne ($) (2) | 186.92 | 142.72 | 31% | ||||||
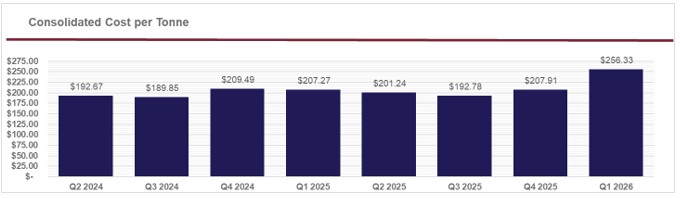
| Direct costs per tonne ($)(2) | 256.33 | 207.27 | 24% | ||||||
| Financial | |||||||||
| Revenue ($ millions) | 209.7 | 63.5 | 230% | ||||||
| Silver ounces sold | 1,642,220 | 1,223,684 | 34% | ||||||
| Gold ounces sold | 10,942 | 8,538 | 28% | ||||||
| Realized silver price per ounce ($) | 85.95 | 31.99 | 169% | ||||||
| Realized gold price per ounce ($) | 5,035 | 2,903 | 73% | ||||||
| Net earnings (loss) ($ millions) | 64.9 | (32.9) | 297% | ||||||
| Adjusted net earnings (loss)(2) ($ millions) | 59.2 | (0.2) | 28861% | ||||||
| Mine operating earnings ($ millions) | 93.5 | 12.8 | 628% | ||||||
| Mine operating cash flow before taxes ($ millions)(2) | 114.6 | 22.1 | 419% | ||||||
| Operating cash flow before working capital changes ($ millions)(2) | 38.8 | 8.3 | 365% | ||||||
| EBITDA ($ millions) (2) | 112.6 | (18.1) | 722% | ||||||
| Adjusted EBITDA ($ millions) (2) | 108.4 | 15.1 | 617% | ||||||
| Working capital ($ millions) (2) | 173.4 | 14.8 | 1071% | ||||||
| Shareholders | |||||||||
| Earnings (loss) per share - basic ($) | 0.23 | (0.13) | 277% | ||||||
| Adjusted earnings (loss) per share - basic ($)(2) | 0.21 | - | 100% | ||||||
| Operating cash flow before working capital changes per share ($)(2) | 0.14 | 0.03 | 367% | ||||||
| Basic weighted average shares outstanding ('000) | 283,078 | 262,323 | 8% | ||||||
(1) Silver equivalents for 2026 are calculated using a 90:1 Ag:Au ratio, 45 silver oz to 1 lead tonne; 61 silver oz to 1 zinc tonne; 238 silver oz to 1 copper tonne ratio. Silver equivalents for 2025 are calculated using an 80:1 Ag:Au ratio.
(2) Non-IFRS measure. For a description of how these measures are calculated and a reconciliation of these measures to the most directly comparable measures specified, defined or determined under IFRS and presented in the Company's financial statements, refer to "Non-IFRS Measures".
The above highlights are key measures used by management, however, they should not be the sole measures used in determining the performance of the Company's operations.
REVIEW OF OPERATING RESULTS
Consolidated Production Results for the Three Months Ended March 31, 2026 and 2025
| CONSOLIDATED | Three Months Ended March 31 | ||||||||
| 2026 | 2025 | % Change | |||||||
| Processed tonnes | 456,657 | 209,507 | 118% | ||||||
| Total silver ounces produced | 1,875,375 | 1,205,793 | 56% | ||||||
| Total gold ounces produced | 11,740 | 8,338 | 41% | ||||||
| Total lead tonnes produced | 4,939 | - | - | ||||||
| Total zinc tonnes produced | 2,842 | - | - | ||||||
| Total copper tonnes produced | 66 | - | - | ||||||
| Silver equivalent ounces produced(1) | 3,341,943 | 1,872,833 | 78% | ||||||
| Cash costs per silver ounce ($)(2) | 22.54 | 15.89 | 42% | ||||||
| Total production costs per ounce ($)(2) | 35.21 | 24.23 | 45% | ||||||
| All-in sustaining costs per ounce ($)(2) | 37.03 | 24.48 | 51% | ||||||
| Direct operating costs per tonne ($)(2) | 186.92 | 142.72 | 31% | ||||||
| Direct costs per tonne ($)(2) | 256.33 | 207.27 | 24% | ||||||
(1) Silver equivalents for 2026 are calculated using a 90:1 Ag:Au ratio, 45 silver oz to 1 lead tonne; 61 silver oz to 1 zinc tonne; 238 silver oz to 1 copper tonne ratio. Silver equivalents for 2025 are calculated using an 80:1 Ag:Au ratio.
(2) Non-IFRS measure. For a description of how these measures are calculated and a reconciliation of these measures to the most directly comparable measures specified, defined or determined under IFRS and presented in the Company's financial statements, refer to "Non-IFRS Measures".
(1) Silver equivalents for 2026 are calculated using a 90:1 Ag:Au ratio, 45 silver oz to 1 lead tonne; 61 silver oz to 1 zinc tonne; 238 silver oz to 1 copper tonne ratio. Silver equivalents for 2025 are calculated using an 80:1 Ag:Au ratio, 60 silver oz to 1 lead tonne; 85 silver oz to 1 zinc tonne; 300 silver oz to 1 copper tonne ratio
Consolidated Production
Three months ended March 31, 2026 (compared to the three months ended March 31, 2025)
Consolidated plant throughput for the quarter was 456,657 tonnes, 118% more than 209,507 tonnes in Q1 2025. Plant throughput has primarily increased due to the additions of Kolpa which contributed 171,727 tonnes; and Terronera which contributed 175,418 tonnes; partially offset by the sale of Bolañitos on January 15, 2026, and 6,914 tonnes (7%) lower throughput at Guanaceví.
Consolidated silver production during Q1 2026 was 1,875,375 oz, 56% higher than 1,205,793 oz in Q1 2025. The higher silver production was primarily due to the same reasons as discussed for plant throughput, with Kolpa contributing 530,118 oz, Terronera contributing 533,301 oz, partially offset by Guanaceví contributing 221,767 oz less than the same period in 2025 due to the lower grade and somewhat lower throughput and by Bolañitos contributing 172,070 oz less than the same period in 2025 due to its sale on January 15, 2026.
Gold production for the first quarter of 2026 totaled 11,740 oz, which was 3,402 oz more than the same period in 2025. This increase was driven by the 8,478 oz produced by Terronera offset by 3,856 oz lower at Bolañitos as a result of the sale of the mine and 1,220 oz lower gold production at Guanaceví due to the lower grade and lower throughput.
The acquisition of Kolpa in Q2 2025 added base metal production to the Company, producing 4,939 tonnes of lead, 2,842 tonnes of zinc, and 66 tonnes of copper during the first quarter of 2026, none of which were present in the comparative period.
Consolidated Operating Costs
Three months ended March 31, 2026 (compared to the three months ended March 31, 2025)
Direct operating costs per tonne in Q1 2026 were $186.92, 31% higher than $142.72 in Q1 2025. The addition of Terronera and Kolpa which had direct operating costs per tonne of $195.11 and $155.92 respectively, during Q1 2026, increased the average cost compared to Q1 2025. Furthermore, the disposal of Bolañitos, which had a lower cost per tonne of $102.81 in Q1 2025, also affected the average cost per tonne. In addition to this, Guanaceví experienced higher costs per tonne in Q1 2026 due to lower throughput and higher underlying direct production costs.
Consolidated cash costs per silver ounce, net of by-product credits, were $22.54 in Q1 2026, representing a 42% increase from $15.89 in Q1 2025 due to the higher metal prices causing higher royalty, third party material cost, and special mining duties. Each mine has different costs and produces different amounts of payable silver, which affect the consolidated cash cost per ounce depending on the mix of production. For the three months ended March 31, 2026, the cash costs per silver ounce were $24.52 for Kolpa, $38.59 for Guanaceví, offset by negative $2.14 for Terronera.
Consolidated All-in Sustaining Costs (AISC) per silver ounce in Q1 2026 were $37.03, 51% higher than $24.48 in Q1 2025, predominantly due to the contribution of Kolpa with AISC of $36.12 per oz and higher AISC at Guanaceví. This was partially offset by the contribution from Terronera which at $22.31 lowered the average AISC.
GUANACEVÍ
Production Results for the Three Months Ended March 31, 2026 and 2025
| GUANACEVÍ | Three Months Ended March 31 | ||||||||
| 2026 | 2025 | % Change | |||||||
| Ore tonnes processed | 95,524 | 102,438 | (7%) | ||||||
| Average silver grade (g/t) | 285 | 348 | (18%) | ||||||
| Silver recovery (%) | 90.7 | 88.6 | 2% | ||||||
| Total silver ounces produced | 793,560 | 1,015,327 | (22%) | ||||||
| Payable silver ounces produced | 785,494 | 1,012,281 | (22%) | ||||||
| Average gold grade (g/t) | 1.02 | 1.30 | (22%) | ||||||
| Gold recovery (%) | 88.4 | 92.9 | (5%) | ||||||
| Total gold ounces produced | 2,769 | 3,989 | (31%) | ||||||
| Payable gold ounces produced | 2,741 | 3,977 | (31%) | ||||||
| Silver equivalent ounces produced(1) | 1,042,779 | 1,334,447 | (22%) | ||||||
| Cash costs per silver ounce ($)(2) | 38.59 | 19.73 | 96% | ||||||
| Total production costs per ounce ($)(2) | 46.76 | 26.66 | 75% | ||||||
| All-in sustaining costs per ounce ($)(2) | 48.47 | 26.50 | 83% | ||||||
| Direct operating costs per tonne ($)(2) | 238.30 | 184.43 | 29% | ||||||
| Direct costs per tonne ($)(2) | 457.23 | 310.52 | 47% | ||||||
(1) Silver equivalents for 2026 are calculated using a 90:1 Ag:Au ratio. Silver equivalents for 2025 are calculated using an 80:1 Ag:Au ratio.
(2) Non-IFRS measure. For a description of how these measures are calculated and a reconciliation of these measures to the most directly comparable measures specified, defined or determined under IFRS and presented in the Company's financial statements, refer to "Non-IFRS Measures".
Guanaceví Production Results
Three months ended March 31, 2026 (compared to the three months ended March 31, 2025)
During the three months ended March 31, 2026, Guanaceví processed 95,524 tonnes of ore, 7% lower than 102,438 tonnes in the same period of 2025, primarily due to a transformer failure which caused a 2.5-day shutdown of the tailing filters. Supplies of local third-party mill feed continued to supplement Guanaceví mine production, amounting to 27% of quarterly throughput. The average silver grade was 285 grams per tonne ("g/t") in Q1 2026, down from 348 g/t in Q1 2025, and despite this silver recovery was 90.7%, up from 88.6% in Q1 2025, resulting in total silver production of 793,560 ounces, which was 22% lower than 1,015,327 ounces produced in Q1 2025.
Gold production totaled 2,769 ounces, 31% lower than 3,989 ounces in Q1 2025. Lower gold production is a result of 22% lower average gold grades (1.02 g/t vs. 1.30 g/t) and 7% lower throughput for the reasons noted above. Changes in grade and recovery are in line with the plan and reflect typical variations between planned and actual grades, and from accessing different areas in the mine.
Guanaceví Operating Costs
Three months ended March 31, 2026 (compared to the three months ended March 31, 2025)
Direct operating costs per tonne for the three months ended March 31, 2026, were $238.30, 29% higher than $184.43 in the same period in 2025, driven by the lower throughput and $3.9 million higher direct operating costs. Direct operating costs were higher due to 16% stronger Mexican peso during the current period compared to the same period in 2025.
Including royalty and special mining duty costs, direct costs per tonne were $457.23 in Q1 2026, a significant increase from $310.52 in Q1 2025. This increase in direct costs per tonne is due to a higher volume and cost of third-party material purchases which have become more expensive on a per tonne basis due to higher metal prices, as well as increasing royalties and special mining duties driven by higher metal prices and higher mine profitability. The purchase of local third-party material in the period contributed $108.32 per tonne compared to $57.26 per tonne in Q1 2025. The royalty and special mining duty contributed $108.32 and $36.21 per tonne respectively during Q1 2026 compared to $59.22 and $9.61 per tonne in Q1 2025.
Cash costs per silver ounce were $38.59 in Q1 2026, 96% higher than $19.73 in Q1 2025. The increase is driven by a combination of the 47% increase in the underlying direct cost per tonne, as well as the 22% lower silver production due to the lower grades. AISC per ounce also rose by 83% to $48.47 compared to $26.50 in Q1 2025, primarily due to the higher underlying cash costs per silver ounce and relatively stable other costs which are allocated to the all in sustaining costs.
KOLPA
Production Results for the Three Months Ended March 31, 2026 and 2025
| KOLPA | Three Months Ended March 31(3) | ||||||||
| 2026 | 2025 | % Change | |||||||
| Processed Tonnes | 171,727 | - | - | ||||||
| Average silver grade (g/t) | 106 | - | - | ||||||
| Silver recovery (%) | 90.6 | - | - | ||||||
| Total silver ounces produced | 530,118 | - | - | ||||||
| Payable silver ounces produced | 501,458 | - | - | ||||||
| Average Pb grade (%) | 3.05 | - | - | ||||||
| Lead recovery (%) | 94.3 | - | - | ||||||
| Total lead tonnes produced | 4,939 | - | - | ||||||
| Payable lead tonnes produced | 4,692 | - | - | ||||||
| Average Zn grade (%) | 1.97 | - | - | ||||||
| Zinc recovery (%) | 84.0 | - | - | ||||||
| Total zinc tonnes produced | 2,842 | - | - | ||||||
| Payable zinc tonnes produced | 2,409 | - | - | ||||||
| Average Cu grade (%) | 0.20 | - | - | ||||||
| Copper recovery (%) | 19.6 | - | - | ||||||
| Total copper tonnes produced | 66 | - | - | ||||||
| Payable copper tonnes produced | 57 | - | - | ||||||
| Silver equivalent ounces produced(1) | 940,050 | - | - | ||||||
| Cash costs per silver ounce ($)(2) | 24.52 | - | - | ||||||
| Total production costs per ounce ($)(2) | 38.43 | - | - | ||||||
| All-in sustaining costs per ounce ($) (2) | 36.12 | - | - | ||||||
| Direct operating costs per tonne ($)(2) | 155.92 | - | - | ||||||
| Direct costs per tonne ($)(2) | 177.82 | - | - | ||||||
(1) Silver equivalents are calculated 45 silver oz to 1 lead tonne; 61 silver oz to 1 zinc tonne; 238 silver oz to 1 copper tonne ratio.
(2) Non-IFRS measure. For a description of how these measures are calculated and a reconciliation of these measures to the most directly comparable measures specified, defined or determined under IFRS and presented in the Company's financial statements, refer to "Non-IFRS Measures".
(3) As the asset was not owned or operated by the Company during the comparative period in 2025, no corresponding data is presented for that period. As such, year-over-year comparisons are not applicable and should be interpreted accordingly.
Kolpa Production Results
Three months ended March 31, 2026
During the three months ended March 31, 2026, Kolpa processed 171,727 tonnes resulting in 530,118 ounces of silver production. In March 2026, new crushers and a new 14' x 24' ball mill were commissioned impacting throughput during commissioning. The new crushing circuit and ball mill are expected to enable consistent throughput in line with the guidance, in the second quarter of 2026. Grades were in line with experience from the 8 months of Endeavour ownership in 2025, except for zinc, which was 1.97 g/t compared to 1.83 g/t in the May to December 2025 period. Recoveries were also in line, except for copper, which was 19.6% compared to 26.7% in the May-December 2025 period.
Huancavelica, the region of Peru where Kolpa is located, experienced rainfall of unusual high intensity in Q1 2026, attributing to a delay in ramping up the plant expansion and leading to increased water treatment and higher humidity of the material being processed during the quarter. Additionally, with higher metal prices and an expansion of mining activities in Peru, there have been labour shortages throughout the mining industry.
Kolpa Operating Costs
Three months ended March 31, 2026
Direct operating costs per tonne was $155.92 slightly higher than the average costs of $133.74 per tonne incurred in period May to December 2025, due to the lower average daily throughput with the commissioning of the new plant equipment. During the three months ended March 31, 2026, Kolpa's cash costs were $24.52 per silver ounce reflecting lower metal production in comparison to $13.38 per oz incurred in period May to December 2025. The higher metal prices have further negatively impacted the cost of purchased third-party material, royalties, Peruvian special mining tax, and employee profit participation. The higher cash costs per ounce underlies the higher AISC which was $36.12 per oz compared to $27.99 per oz during period May to December 2025.
TERRONERA
Production Results for the Three Months Ended March 31, 2026 and 2025
| TERRONERA | Three Months Ended March 31(3) | ||||||||
| 2026 | 2025 | % Change | |||||||
| Ore tonnes processed | 175,418 | - | - | ||||||
| Average silver grade (g/t) | 112.6 | - | - | ||||||
| Silver recovery (%) | 84.0 | - | - | ||||||
| Total silver ounces produced | 533,301 | - | - | ||||||
| Payable silver ounces produced | 510,521 | - | - | ||||||
| Average gold grade (g/t) | 2.07 | - | - | ||||||
| Gold recovery (%) | 72.7 | - | - | ||||||
| Total gold ounces produced | 8,478 | - | - | ||||||
| Payable gold ounces produced | 8,157 | - | - | ||||||
| Silver equivalent ounces produced(1) | 1,296,348 | - | - | ||||||
| Cash costs per silver ounce ($)(2) | (2.14) | - | - | ||||||
| Total production costs per ounce ($)(2) | 16.67 | - | - | ||||||
| All-in sustaining costs per ounce ($)(2) | 22.31 | - | - | ||||||
| Direct operating costs per tonne ($)(2) | 195.11 | - | - | ||||||
| Direct costs per tonne ($)(2) | 233.84 | - | - | ||||||
(1) Silver equivalents are calculated using a 90:1 Ag:Au ratio.
(2) Non-IFRS measure. For a description of how these measures are calculated and a reconciliation of these measures to the most directly comparable measures specified, defined or determined under IFRS and presented in the Company's financial statements, refer to "Non-IFRS Measures".
(3) As the asset was in development prior to October 1, 2025, no corresponding data is presented for those periods. As such, year-over-year comparisons are not applicable and should be interpreted accordingly.
Terronera Production Results
Three months ended March 31, 2026
During the three months ended March 31, 2026, Terronera processed 175,418 tonnes of ore with average grades of 112.6 g/t silver and 2.07 g/t gold, producing 533,301 ounces of silver and 8,478 ounces of gold. Terronera recoveries averaged 84.0% for silver and 72.7% for gold, both slightly below Q1 plan. During the first quarter, plant management refined processes to improve recoveries which gradually improved throughout the period. In March, recoveries were in line with plan and are expected to further improve with additional optimization activities underway. The ore grades achieved during the quarter of 112.6 g/t for silver and 2.07 g/t of gold were in line with plan. Production was also in line with plan and is expected to increase during the year as mine development accesses higher-grade areas in Q3 2026. The February security events in Jalisco had minimal impact at Terronera; operations were paused for three days to ensure employee safety, with a minor impact on overall throughput.
Terronera Operating Costs
Three months ended March 31, 2026
During the three months ended March 31, 2026, Terronera's direct operating costs were $195.11 per tonne, a significant decrease from the $222.57 per tonne during Q4 2025 which was Terronera's first quarter of commercial operations. Construction contractors' demobilization and workflow optimization measures were finalized during Q1 2026; however, the quarter still reflects higher costs incurred in January and February as these measures were being implemented. The Terronera mine and plant results were further impacted by the temporary pause in operations in February.
Cash costs were negative $2.14 per silver ounce in line with the guidance and a substantial improvement on the positive $4.76 per oz incurred in Q4 2025, driven by lower cost per tonne as noted above, higher silver grades achieved, and higher by-product gold credits which resulted from throughput and metal prices. AISC included additional exploration costs, as well as the allocation of general and administrative costs allocated to Terronera which is based upon production metrics. AISC in Q1 2026 was $22.31 compared to $65.70 per oz in Q4 2025, reflecting lower cash costs per oz and a substantial decrease in sustaining capital expenditures during the first quarter relative to the fourth quarter of 2025.
BOLAÑITOS
On January 15, 2026, the Company completed the sale of the Bolañitos, accordingly the Q1 2026 results include production and operating costs of Bolañitos only up to the disposal date. During the 15-day period ended January 15, 2026, production results and operating costs at the Bolañitos Mine were approximately in line with plan and past performance.
Production Results for the Three Months Ended March 31, 2026 and 2025
| BOLAÑITOS | Three Months Ended March 31 | ||||||||
| 2026(2) | 2025 | % Change | |||||||
| Ore tonnes processed | 13,988 | 107,069 | (87%) | ||||||
| Average silver grade (g/t) | 47 | 67 | (29%) | ||||||
| Silver recovery (%) | 86.2 | 83.0 | 4% | ||||||
| Total silver ounces produced | 18,396 | 190,466 | (90%) | ||||||
| Payable silver ounces produced | 17,668 | 181,077 | (90%) | ||||||
| Average gold grade (g/t) | 1.27 | 1.43 | (11%) | ||||||
| Gold recovery (%) | 86.5 | 88.3 | (2%) | ||||||
| Total gold ounces produced | 493 | 4,349 | (89%) | ||||||
| Payable gold ounces produced | 476 | 4,211 | (89%) | ||||||
| Silver equivalent ounces produced(1) | 62,766 | 538,386 | (88%) | ||||||
(1) Silver equivalents for 2026 are calculated using a 90:1 Ag:Au ratio. Silver equivalents are calculated using an 80:1 Ag:Au ratio.
(2) Only includes the 15-day period ended January 15, 2026.
EXPLORATION AND EVALUATION
During the first quarter of 2026, the Company advanced exploration activities across its core assets, including Kolpa, with a continued focus on expanding mineral resources and refining geological interpretations. A total of 57 drill holes were completed, representing approximately 13,649 meters of drilling, with total exploration expenditures of $5.0 million for the quarter, inclusive of holding costs.
At Terronera, during Q1 2026, the Company drilled 6 holes totaling 1,055 meters at a cost of $0.3 million, with activities focused on underground drilling and related technical support in Terronera vein, alongside geological mapping and sampling along the Quiteria vein. Activities in the quarter also included ongoing engagement and follow-ups with regulators, consultants and community stakeholders on project-related matters.
At Guanaceví, Q1 2026 drilling consisted of 7 holes totaling 2,354 meters at a cost of $0.4 million, advancing the underground diamond drilling in the Alondra-Porvenir Dos area. The Company received and compiled laboratory assay results for the quarter's drill holes. Reported drill targets and structures referenced during the quarter include the Santa Cruz and Conglomerate veins in the Alondra area.
At Kolpa, the Company drilled 44 holes totaling 10,245 meters at a cost of $1.4 million during Q1 2026. Underground exploration activities were conducted across the mine and underground drilling programs continued in the Bienaventurada area and the Yamila area.
In Chile, work progressed primarily through permitting and technical preparation across Aida and Genesis during Q1 2026. The Aida Project advanced from ongoing engagement with the Environmental Assessment Service to confirmation of an Environmental Qualification Resolution and related permit-forward planning. Genesis work included mapping, geochemical interpretation, and expansion of soil sampling coverage. During the quarter the Company incurred $0.2 million of exploration costs in Chile.
At Parral and other properties, the Company incurred total of $0.2 million during Q1 2026, with activities focused on routine site care and maintenance.
The Company also incurred $0.7 million in ongoing holding costs related to exploration concessions and properties across its portfolio, as well as $0.2 million in administrative and corporate costs associated with exploration activities during the year.
Pitarrilla
At Pitarrilla, the Company incurred exploration and evaluation costs of $1.8 million, with activities focused on technical and site work. Progress continues on permitting, engineering, and site planning, with teams completing technical designs and models and initiating on-site drilling and testing to support underground development and water management planning.
Activities during the first quarter of 2026 included continued resampling of historical drill holes, ongoing rehabilitation and cleaning work in the ramp and crosscuts, and extensive topographic surveys. No drilling was completed during the quarter; however, by late March, underground drilling had commenced in the ramp as part of a feasibility-phase hydrogeological study to support piezometer installation, alongside continued water-well and environmental monitoring activities.
CONSOLIDATED FINANCIAL RESULTS
Three months ended March 31, 2026 (compared to the three months ended March 31, 2025)
Revenue of $209.7 million in Q1 2026, net of $4.0 million of smelting and refining costs, has significantly increased compared to $63.5 million, net of $0.4 million of smelting and refining costs, in Q1 2025. Gross sales of $213.7 million in Q1 2026 are 234% higher than gross sales of $63.9 million for the same period in 2025. Gross sales have increased predominantly due to the $85.4 million of revenue contribution from Terronera, and $58.4 million of revenue from Kolpa, with the remaining increase caused by an $18.2 million (39%) increase in revenue from Guanaceví driven by higher metal prices. Revenue was partially offset by lower revenue from Bolañitos following its sale on January 15, 2026.
During Q1 2026, the Company sold 1,642,220 oz silver and 10,942 oz gold, at realized prices of $85.95 and $5,035 per oz, respectively, compared to sales of 1,223,684 oz silver and 8,538 oz gold, at realized prices of $31.99 and $2,903 per oz, respectively, in the same period of 2025. For the three months ended March 31, 2026, the realized prices of silver were within 2% of the average market prices and gold prices were within 4% of market prices. Silver and gold market prices averaged $84.1 and $4,863 per oz, respectively. Additionally, the Company recorded $8.9 million from sales of lead, $7.0 million from sales of zinc, $0.7 million from sales of copper, and $0.8 million from sales of other metals including antimony; base metal sales flow from Kolpa which was purchased in Q2 2025.
At the end of the first quarter, silver and gold prices experienced downward pressure and management decided to hold bullion inventory temporarily, increasing finished goods inventory above the historical average. As at March 31, 2026, the Company's finished goods inventory included 491,747 oz of silver and 1,980 oz of gold, compared to 318,008 oz silver and 1,597 oz gold at December 31, 2025. The cost allocated to these finished goods, together with base metals, was $25.7 million as at March 31, 2026, compared to $15.3 million at December 31, 2025. As at March 31, 2026, the total finished goods inventory fair market value was $46.2 million, compared to $29.8 million at December 31, 2025.
Cost of sales for Q1 2026 was $116.3 million, an increase of 130% over the cost of sales of $50.6 million for Q1 2025. The increase in the cost of sales compared to the prior period was driven by $45.7 million from Terronera and $32.9 million costs at Kolpa with the remaining increase from Guanaceví. Guanaceví's cost of sales were higher than the comparative period due to higher cost of purchased material, higher royalties, and higher depreciation and mining costs, caused by the advancing age of the mine. These higher cost of sales were partially offset by lower cost of sales at Bolañitos having only 15 days contribution during the period.
The Company's mine operating earnings were $93.5 million in Q1 2026, $80.5 million higher than the $12.9 million in the comparative period, due to the $38.4 million operating earnings in Terronera, $23.0 million operating earnings from Kolpa, and $20.4 million higher operating earnings from Guanaceví, partially offset by lower operating earnings at Bolañitos. General and administrative expenses of $4.7 million in Q1 2026 were slightly higher than the $4.3 million incurred in the same period. Exploration expenses were $5.0 million compared to $4.5 million in Q1 2025, due to additional exploration expenditures on advancing the Pitarrilla Project and additional exploration work at Kolpa, partially offset by lower exploration expenses at Terronera. In Q1 2025 the Company incurred certain project costs in relation to Terronera that were not eligible for capitalization, such as supervisory activities and allocated general and administrative costs; these did not recur in 2026 now that Terronera is in operation. As a result, the Company incurred operating earnings of $83.7 million for the quarter (Q1 2025 - operating earnings of $4.1 million).
The Company incurred a foreign exchange loss of $0.3 million in Q1 2026 compared to $1.0 million in Q1 2025 due to lower volatility of the Mexican peso in relation to the U.S. dollar. The Company further incurred $24.2 million loss on derivative contract revaluations (Q1 2025 - $31.9 million), primarily from the loss on revaluation of the gold forward swap contracts of $19.1 million (Q1 2025 - loss of $33.7 million) and silver collar contract of $6.8 million (Q1 2025 - $ nil), and $1.4 million loss on revaluation of copper stream liability (Q1 2025 - $nil), partially offset by $0.3 million gain on Mexican peso forward contracts (Q1 2025 - gain of $1.9 million) and $2.6 million gain on the redemption feature derivative in the convertible note.
The Company incurred $5.8 million in finance charges (Q1 2025 - $0.4 million) primarily related to the finance charge on unwinding the discount relating to the senior convertible notes of $4.9 million. Additionally, in Q1 2026 the Company recognized a loss of $3.2 million in investment and other income, compared to income of $1.5 million in Q1 2025, predominantly due to the revaluation of shares of Guanajuato Silver Company Ltd. (“Guanajuato Silver”) received as part of the consideration on sale of Bolañitos. As a result of the sale of Bolañitos, the Company also recorded a gain on sale of $35.6 million in Q1 2026. This contributed to earnings before taxes for Q1 2026 of $85.9 million (Q1 2025 - loss of $27.7 million).
Income tax was $21.0 million in Q1 2026 compared to $5.1 million in Q1 2025. The $21.0 million is comprised of $33.8 million expense in current income tax with the inclusion of Terronera and Kolpa (Q1 2025 - recovery of $5.3 million) and a recovery of $12.8 million in deferred income tax (Q1 2025 - recovery of $0.2 million). The current income tax expense consists of $9.2 million in special mining duty taxes and $24.6 million expense of current income taxes. The deferred income tax recovery of $12.8 million primarily relates to temporary timing differences arising from differences in the recognition of revenue for accounting and tax purposes. These differences in Q1 2026 arose primarily in relation to the buildup of finished goods inventory on hand as noted above.
KEY ECONOMIC TRENDS
Precious Metal Price Trends
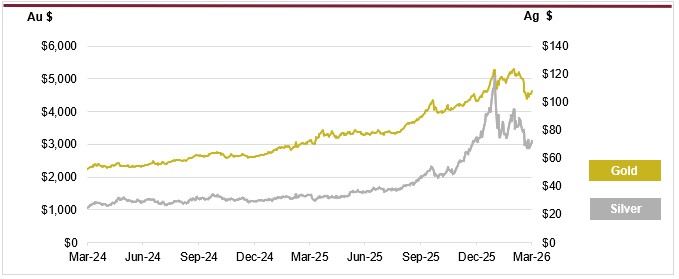
The prices of silver and gold are a critical factor in determining profitability and cash flow from operations. The financial performance of the Company has been, and is expected to continue to be, closely linked to the prices of silver and gold.
During the three months ended March 31, 2026, the average price of silver was $84.10 per ounce, with silver trading between $118.45 and $67.23 per oz. This compares to an average of $31.88 per oz for the three months ended March 31, 2025, with a low of $29.41 and a high of $34.40 per oz. For the three months ended March 31, 2026, the Company realized an average price of $85.95 per silver oz compared with $31.99 per oz for the three months ended March 31, 2025.
During the three months ended March 31, 2026, the average price of gold was $4,863 per oz, with gold trading between $5,269 and $4,384 per oz. This compares to an average of $2,860 per oz for the three months ended March 31, 2025, with a low of $2,633 and a high of $3,115 per oz. For the three months ended March 31, 2026, the Company realized an average price of $5,035 per oz compared with $2,903 per oz for the three months ended March 31, 2025.
Several factors drove these large increases in gold and silver prices; global tensions, including ongoing conflicts in Ukraine, Iran and elsewhere in the Middle East, expectations of slower economic growth, concerns over U.S. trade policies, and tariffs pushed investors and central banks toward gold and silver to diversify away from the U.S. dollar and other fiat currencies. These dynamics propelled precious metals into record price territory, with gold and silver reaching all-time peaks of $5,269 per ounce of gold in March 2026, and $118.45 per ounce of silver in January 2026. Beyond the safe haven characteristics of silver, there has been a growing sense of optimism in the silver market, driven by industrial demand and supply constraints. The global push towards electrification, renewable energy, solid state batteries, and electric vehicles is expected to increase the demand for silver in industrial applications. Silver plays an indispensable role in solar panels, batteries, and other key technologies, positioning it as a strategic metal in the clean energy transition. Over this same period of industrial demand growth, the silver market has faced supply-demand deficits in recent years, with exploration, new discoveries and new production not keeping pace with mineral resource depletion. A lack of new major projects coming online is creating a supply-demand imbalance that has supported the rise in the silver price since the beginning of 2025 and especially noted in early 2026.
Currency Fluctuations
The Company's operations are located in Mexico and Peru, therefore a significant portion of operating costs and capital expenditures are denominated in Mexican pesos and Peruvian soles. The Company's corporate activities are based in Vancouver, Canada with a portion of these expenditures being denominated in Canadian dollars.
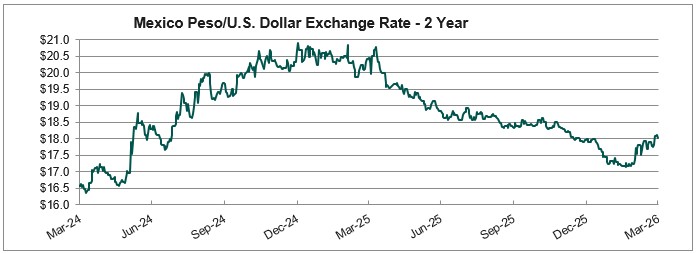
During the three months ended March 31, 2026, the Mexican peso strengthened and then weakened, so much so that it ended the period with no significant net change against the U.S. dollar, creating minimal foreign exchange impact from peso balances revalued into U.S. dollars. The average foreign exchange rate was $17.57 Mexican pesos per U.S. dollar, with the peso trading within a range of $17.14 to $18.10. The average rate was 16% stronger than the comparative period in 2025 where the peso traded at an average of $20.42 Mexican pesos per U.S. dollar, with a range of $19.87 to $20.88 Mexican pesos per U.S. dollar. This stronger Mexican peso in Q1 2026 compared to Q1 2025 drove relatively higher costs when translated into U.S. dollar for financial reporting.
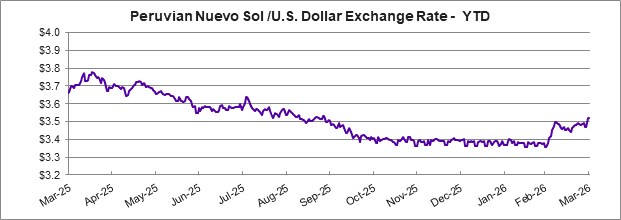
During the three months ended March 31, 2026, the Peruvian sol weakened against the U.S. dollar. The average foreign exchange rate in the period was $3.41 Peruvian soles per U.S. dollar, with the sol trading within a range of $3.36 to $3.52. The Company was not exposed to the Peruvian sol fluctuation prior to the Kolpa acquisition in May 2025. The weaker Peruvian sol drives lower costs when translated into U.S. dollars for financial reporting, however due to many costs in Peru being based on U.S. dollar imports, the impact of the weaker Peruvian sol has a smaller effect.
Cost Trends
As discussed above, the impact of higher metal prices has a key impact on the Company's cost per tonne; $1.00 per ounce increase in the silver price increases cost per tonne by $0.50 at Kolpa, by $0.90 at Terronera, and by $3.80 at Guanaceví. Therefore, the higher precious metal price experienced during Q1 2026 had a negative impact on underlying cost per tonne due to the higher cost of purchased third-party material, higher royalties, higher special mining duties and higher profit participation payments to employees. Furthermore, the Company's profitability is subject to industry-wide cost pressures on development and operating costs with respect to labour, energy, consumables and capital expenditures. Underground mining is labour and energy intensive and approximately 30% of the Company's production costs are directly tied to labour; with a higher price environment more mining operations in Mexico and Peru have been re-started or expanded and there has been a resulting increase in skilled labour compensation. Furthermore, 10-15% of the Company's costs are tied to the cost of energy. Notably since the commissioning and ramp up of Terronera, the impact of diesel costs to power much of the mine and plant operations has been significant, with oil prices increasing during the period due to supply disruptions caused by the ongoing conflicts in the Middle East. At Terronera, the LNG plant is being commissioned and expected to reduce cost per tonne by approximately $8 once it begins operation in mid-2026. To mitigate the impact of higher labour, power and consumable costs, the Company focuses on continuous improvement by promoting more efficient use of materials and supplies and by pursuing more advantageous pricing while increasing performance and without compromising operational integrity.
ANNUAL OUTLOOK
2026 Production and Cost Guidance
For the full year 2026, silver production from Terronera, Guanaceví, and Kolpa is projected to range between 8.3 and 8.9 million oz, while gold output from Terronera and Guanaceví is expected to range between 46,000 and 48,000 oz. During the first half of 2026, mine production at Terronera will be from areas of the deposit with lower grades including stockwork, as mine development accesses higher-grade areas in the second half of 2026, which will improve grades.
| Terronera | Guanaceví | Kolpa | Consolidated | ||
| Tonnes per day | T | 1,950 - 2,050 | 1,000 - 1,100 | 2,300 - 2,500 | 5,250 - 5,650 |
| Silver Production | M oz | 2.4 - 2.6 | 3.6 - 3.8 | 2.3 - 2.5 | 8.3 - 8.9 |
| Gold Production | K oz | 35.0 - 36.0 | 11.0 - 12.0 | - | 46.0 - 48.0 |
| Lead Production | K t | - | - | 22.0 - 24.0 | 22.0 - 24.0 |
| Zinc Production | K t | - | - | 16.0 - 18.0 | 16.0 - 18.0 |
| Copper Production | T | - | - | 650 - 750 | 650 - 750 |
| Silver Eq Production(1) | M oz | 5.6 - 5.8 | 4.6 - 4.9 | 4.4 - 4.9 | 14.6 - 15.6 |
(1) Silver equivalent for 2026 guidance is calculated using the following ratios: 90 silver oz to 1 gold oz; 45 silver oz to 1 lead tonne; 61 silver oz to 1 zinc tonne; 238 silver oz to 1 copper tonne.
During Q1 2026 the Company produced 1,875,375 oz of silver and 11,740 oz of gold. Silver production was below production guidance due to the Terronera's plan to increase throughout the year, and Kolpa's throughput being below the plan due to the factors described in the Kolpa discussion above. Throughput at Kolpa is expected to increase to be consistent 2,500 tonnes per day for the remainder of the year now that the plant expansion has been commissioned.
Consolidated cash costs in 2026 for Terronera, Guanaceví, and Kolpa are projected to range from $12.00 to $13.00 per payable silver oz, while AISC are estimated at $27.00 to $28.00 per oz, net of by-product credits.
| Terronera | Guanacevi | Kolpa | Consolidated | ||
| Direct operating costs per tonne | $/t | $130 - $140 | $180 - $190 | $130 - $140 | $140 - $150 |
| Direct costs per tonne | $/t | $150 - $160 | $290 - $300 | $140 - $150 | $170 - $180 |
| Cash costs, net of by-product credits | $/oz Ag | ($2.00 - $1.00) | $21.00 - $22.00 | $13.00 - $14.00 | $12.00 - $13.00 |
| AISC, net of by-product credits | $/oz Ag | $28.00 - $29.00 | $29.00 - $30.00 | $22.00 - $23.00 | $27.00 - $28.00 |
| Sustaining capital budget | $million | $56.7 | $24.5 | $9.8 | $91.0 |
| Growth capital budget | $million | $16.7 | $16.7 |
Consolidated cash costs in Q1 2026 were $22.54 due to the higher costs at Guanaceví and Kolpa for reasons discussed above. Management expects the costs to improve in the remaining quarters of 2026 due to higher throughput at Kolpa, the impact of ramp up efficiency programs at Terronera, including the LNG plant commissioning, and the higher-grade material expected to be accessed later in the year at Terronera.
Consolidated Operating Costs
Direct operating costs per tonne are projected to range between $140 and $150. Direct costs which include third-party material purchases, royalties, and special mining duties, are forecast to range between $170 and $180 per tonne.
Management's 2026 cost forecasts are based on a silver price of $36.00 per oz, a gold price of $3,240 per oz, an exchange rate of 18.50 Mexican pesos per U.S. dollar and 3.60 Peruvian soles per U.S. dollar, as well as annual inflation assumptions of 4% in Mexico and 2% in Peru. For every $1.00 increase in silver price per oz, direct costs per tonne would be expected to rise by approximately $0.90 at Terronera, $3.80 at Guanaceví, and $0.50 at Kolpa, reflecting the impact of royalties, duties, and third-party purchases.
Consolidated direct operating cost per tonne in Q1 2026 was $186.92 per tonne. Higher consolidated cost per tonne was impacted by higher costs at each of the three operating mines and is expected to improve in the remainder of the year due to higher throughput and the results of efficiency programs underway.
2026 Planned Capital Expenditures
| Project | Sustaining Mine Development |
Sustaining Other Capital |
Total Sustaining Capital |
Growth Capital | Total Capital |
| Terronera | $32.9 million | $23.8 million | $56.7 million | - | $56.7 million |
| Guanaceví | $15.5 million | $9.0 million | $24.5 million | - | $24.5 million |
| Kolpa | $2.7 million | $7.1 million | $9.8 million | $16.7 million | $26.5 million |
| Pitarrilla | - | - | - | $48.0 million | $48.0 million |
| Exploration | - | - | - | $1.8 million | $1.8 million |
| Corporate | - | - | - | $0.3 million | $0.3 million |
| Total | $51.1 million | $39.9 million | $91.0 million | $66.8 million | $157.8 million |
Capital Investments
In 2026, Endeavour plans to invest $91.0 million in sustaining capital across its three operating mines. At budgeted metal prices, these investments are expected to be funded from operating cash flows.
At Terronera, $56.7 million is being allocated to capital projects, including $32.9 million for 9,000 metres of mine development at the Terronera vein. The remaining $23.8 million will support one-time mine and plant infrastructure enhancements, including the transition from diesel to LNG, construction of a new warehouse, expansion of accommodations by increasing bed capacity and other key initiatives designed to strengthen operational efficiency and sustainability.
At Guanaceví, $24.5 million is being invested in capital projects, with the largest component being 4,500 metres of mine development at El Curso and Milache for an estimated $15.5 million. An additional $6.3 million will be for mine infrastructure and equipment, $1.4 million for plant equipment and tailings storage facility expansion, and $1.3 million for various surface infrastructure and equipment upgrades.
At Kolpa, $26.5 million is being invested in capital projects, including $2.7 million for 3,500 metres of mine development in the Bienaventurada and Poderosa areas. A further $7.1 million will be for mine infrastructure, equipment, and building improvements. Growth expenditures of $16.7 million have supported the plant expansion to 2,500 tonnes per day during the first quarter of the year, including the installation of a new ball mill, upgrades to flotation cells and expansion of the tailings storage facility.
The Company is also spending $2.1 million to maintain exploration concessions, acquire mobile exploration equipment, and support corporate infrastructure.
Pitarrilla
Endeavour will continue advancing the Pitarrilla project in 2026 with an estimated investment of $65.8 million, which includes $15.0 million for the feasibility study, $2.8 million for exploration work including 8,550 metres of drilling, and $48.0 million in capital expenditures. Capital spending includes $10.4 million for mine equipment, $4.0 million for additional equipment, $11.2 million for camp, warehouse, and surface infrastructure, $7.0 million to complete 1,300 metres of underground development, and $15.4 million in other indirect project costs, including contingency.
During the first quarter of 2026, the Company invested $0.1 million in Pitarrilla's property plant and equipment. Expenditures at Pitarrilla do not qualify for capitalization until the project formally transitions to the development stage and these costs are expensed through the statement of earnings and loss as exploration costs. Management expects the pace of investment to ramp up in the remainder of 2026, as permitting goals are achieved, and feasibility study work advances.
LIQUIDITY AND CAPITAL RESOURCES
The Company has historically funded its acquisition, exploration and development activities through equity financings, debt facilities and convertible debt. In recent years, the Company has financed most of its acquisition, exploration, development and operating activities from production cash flows, treasury, equity offerings and debt. The Company may choose to undertake equity, debt, convertible debt or other financings, on an as-needed basis, in order to facilitate its growth.
Management of the Company believes that operating cash flow and existing current assets will be sufficient to cover capital requirements and meet its short-term obligations for at least the next twelve months. The Company continues to assess financing alternatives, including equity or debt or a combination of both, to fund future growth. As of March 31, 2026, $35.3 million of capacity under the at-the-market distribution facility remains available through the prospectus supplement dated July 10, 2025.
| Expressed in millions of U.S. dollars | As at March 31, 2026 | As at December 31, 2025 | ||||
| Current assets | $ | 422.9 | $ | 423.2 | ||
| Current liabilities | 249.5 | 276.8 | ||||
| Working capital surplus | $ | 173.4 | $ | 146.4 |
As at March 31, 2026, the Company had a working capital surplus of $173.4 million compared to $146.4 million as of December 31, 2025 (including $26.1 million of net current assets classified as held for sale). The $53.0 million increase during the quarter of working capital excluding net assets classified as held for sale, was primarily due to $20.7 million of cash from operations, $13.3 million increase in inventory, $8.9 million increase in accounts and other receivables due to the higher sales, $8.0 million of shares in Guanajuato Silver received on sale of Bolañitos, and $15.1 million decrease in accounts payable caused by timing of payments and repayments of certain capital items held in payables as of December 31, 2025. This increase was partially offset by $6.1 million increase in income tax payables due to higher profitability of the operations, and approximately $2.5 million net decrease driven by the changes related to other current assets and liabilities.
Three months ended March 31, 2026 (compared to the three months ended March 31, 2025)
Cash flow provided by operating activities
During Q1 2026, operating activities generated cash flow of $20.7 million compared to $3.4 million in Q1 2025, while the Company invested $18.1 million in working capital in Q1 2026 (Q1 2025 - invested $5.0 million). Higher metal prices and metal production helped generate stronger cash flow and as a result cash flow from operations before working capital changes was $38.8 million in Q1 2026, compared to $8.4 million in Q1 2025. Q1 2026 operating earnings exceeded Q1 2025 by $79.6 million, while operating cash flows before working capital changes have increased by $30.4 million. Increase in operating cash flows was lower compared to the increase in the operating earnings due to the $34.6 million settlements of gold forward swap contracts, silver collars and other realized derivative contracts, as well as other payments of income tax and special mining duty tax, partially offset by the higher depreciation and other operating non-cash expenses.
Cash flow used by investing activities
During Q1 2026, investing activities used net cash of $8.4 million compared to $40.6 million in Q1 2025. Payments for mineral properties, plant and equipment totaled $37.9 million in Q1 2026 compared to $41.6 million in Q1 2025 due to higher capital growth investment at Terronera in 2025. In Q1 2026 the Company received $27.5 million of proceeds from sale of Bolañitos, net of the cash held for sale at the time of the disposal.
Of the $37.9 million invested in mineral properties, plants and equipment during Q1 2026, $18.9 million was at Terronera, most significant of which was $9.6 million on settlements of prior periods accounts payables related to mineral properties, plant and equipment, $8.3 million on mine development and $1.0 million on equipment and infrastructure. At Kolpa during the first quarter of 2026, $12.2 million was invested, of which $7.3 million on equipment and infrastructure primarily related to the plant capacity expansion, with $3.8 million on settlements of prior periods accounts payables related to mineral properties, plant and equipment, and $1.0 million on mine development. At Guanaceví, the Company invested $5.7 million, with $3.7 million spent on mine development and $2.0 million on equipment and infrastructure. The remaining capital expenditure was related to Pitarrilla and exploration activities.
Cash flow provided by financing activities
Financing activities for the three months period ended March 31, 2026 used $4.0 million, compared to $4.5 million in the same period of 2025. During Q1 2026, the Company paid $1.3 million in principal repayments on loans and lease liabilities, $1.7 million on repayment of copper stream liability, $0.3 million in interest payments and used $0.9 million of cash in other types of activities. By comparison, in Q1 2025, the Company paid $1.3 million in principal repayments on loans and lease liabilities and $3.2 million in interest payments. Interest payments were higher in the comparative period as the Company had fully drawn the $120 million debt facility for Terronera (the “Debt Facility”), in contrast during the current period only $5 million was outstanding on this Debt Facility.
Equity financings
On May 27, 2025, the Company filed an updated Base Shelf prospectus, and on July 10, 2025, issued a prospectus supplement for an offering of up to $60.0 million of shares through an ATM facility of which $35.3 million remains available as of March 31, 2026.
On November 27, 2024, the Company completed a bought deal equity offering for the issuance of a total of 15,825,000 common shares at a price of $4.60 per share, which raised gross proceeds of $72.8 million. The net proceeds for this financing as at March 31, 2026, have been used as follows:
| Use of proceeds (millions) | ||||
| Net proceeds received | $ | 68.6 | ||
| Advancing Pitarrilla project | 15.1 | |||
| Allocated to working capital | $ | 53.5 | ||
Contingencies
The Company has a number of disputes with the Mexican tax authorities as disclosed in the MD&A for the year ended December 31, 2025, which are currently being addressed in the Mexican court process, and judgment is used to assess the likelihood of outcomes in favour of the Company and recognition of any liabilities. The Company is also required to use judgment to determine certain tax treatments in calculating income tax expense and Mexican value added tax "Impuesto al Valor Agregado" ("IVA") recoverable. These judgments are subject to various uncertainties. From time to time, Mexican authorities may apply, re-interpret legislation or disregard precedents and it is possible that these uncertainties may be resolved unfavorably for the Company.
Capital Requirements
As of March 31, 2026, the Company held $231.8 million in cash and cash equivalents and had a working capital surplus including cash of $173.4 million. The Company may be required to raise additional funds through future debt or equity financings in order to carry out other business plans.
The Company had the following undiscounted contractual obligations inclusive of interest, as at March 31, 2026:
| Payments due by period (in millions of U.S. dollars) | |||||||||||||||
| Contractual Obligations |
Total | Less than 1 year |
1 - 3 years | 3 - 5 years | More than 5 years |
||||||||||
| Capital asset purchases | $ | 9.4 | $ | 9.4 | $ | - | $ | - | $ | - | |||||
| Accounts payable, accrued liabilities and other | 105.3 | 105.3 | - | - | - | ||||||||||
| Loans payable | 12.3 | 8.7 | 3.6 | - | - | ||||||||||
| Lease liabilities | 1.8 | 1.2 | 0.6 | - | - | ||||||||||
| Other contracts | 0.3 | 0.1 | 0.2 | - | - | ||||||||||
| Reclamation obligations | 27.3 | - | 7.6 | 0.6 | 19.1 | ||||||||||
| Gold forward swaps | 114.6 | 88.9 | 25.7 | - | - | ||||||||||
| Silver collar contracts | 12.9 | 12.9 | - | - | - | ||||||||||
| Copper stream liability | 57.6 | 7.9 | 16.2 | 14.7 | 18.9 | ||||||||||
| Contingent payment | 10.0 | 10.0 | - | - | - | ||||||||||
| Convertible note debenture | 354.5 | 1.0 | 1.7 | 351.8 | - | ||||||||||
| Total | $ | 706.1 | $ | 245.4 | $ | 55.6 | $ | 367.1 | $ | 38.0 |
FINANCIAL INSTRUMENTS AND FAIR VALUE MEASUREMENTS
As at March 31, 2026, the carrying and fair values of the Company's financial instruments by category were as follows:
| As at March 31, 2026 | As at December 31, 2025 | |||||||||||
| Expressed in millions of U.S. dollars | Carrying value | Estimated fair value |
Carrying value | Estimated fair value |
||||||||
| Financial assets: | ||||||||||||
| Cash and cash equivalents | $ | 231.8 | $ | 231.8 | $ | 215.4 | $ | 215.4 | ||||
| Other investments | 17.1 | 17.1 | 1.0 | 1.0 | ||||||||
| Trade and other receivables | 32.3 | 32.3 | 23.8 | 23.8 | ||||||||
| Derivative assets | 11.1 | 11.1 | 9.1 | 9.1 | ||||||||
| Loan receivable | 2.6 | 2.6 | 2.6 | 2.6 | ||||||||
| Deferred consideration | 7.6 | 7.6 | - | - | ||||||||
| Total financial assets | $ | 302.5 | $ | 302.5 | $ | 251.9 | $ | 251.9 | ||||
| Financial liabilities: | ||||||||||||
| Accounts payable, accrued liabilities and other current liabilities | $ | 105.3 | $ | 105.3 | $ | 120.4 | $ | 120.4 | ||||
| Derivative liabilities | 121.7 | 121.7 | 130.3 | 130.3 | ||||||||
| Copper stream liability | 44.2 | 44.2 | 44.7 | 44.7 | ||||||||
| Contingent payment | 9.1 | 9.1 | 8.8 | 8.8 | ||||||||
| Loans payable | 11.6 | 11.6 | 12.7 | 12.7 | ||||||||
| Senior convertible notes | 236.1 | 239.5 | 231.2 | 231.2 | ||||||||
| Total financial liabilities | $ | 528.0 | $ | 531.4 | $ | 548.1 | $ | 548.1 | ||||
Fair value hierarchy
Fair value is the price that would be received to sell an asset or paid to transfer a liability in an orderly transaction between market participants at the measurement date. The fair value hierarchy establishes three levels to classify the inputs to valuation techniques used to measure fair value. Level 1 inputs are quoted prices (unadjusted) in active markets for identical assets or liabilities. Level 2 inputs are quoted prices in markets that are not active, quoted prices for similar assets or liabilities in active markets, inputs other than quoted prices that are observable for the asset or liability (for example, interest rate and yield curves observable at commonly quoted intervals, forward pricing curves used to value currency and commodity contracts and volatility measurements used to value option contracts), or inputs that are derived principally from or corroborated by observable market data or other means.
Level 3 inputs are unobservable (supported by no or little market activity). The fair value hierarchy gives the highest priority to Level 1 inputs and the lowest priority to Level 3 inputs.
Assets and liabilities as at March 31, 2026 that are measured at fair value on a recurring basis include:
| As at March 31, 2026 | ||||||||||||
| Expressed in millions of U.S. dollars | Total | Level 1 | Level 2 | Level 3 | ||||||||
| Financial Assets: | ||||||||||||
| Other investments | $ | 17.1 | $ | 17.0 | $ | - | $ | 0.1 | ||||
| Accounts and other receivables | 26.4 | - | 26.4 | - | ||||||||
| Derivative assets | 11.1 | - | 0.3 | 10.8 | ||||||||
| Deferred consideration | 7.6 | - | - | 7.6 | ||||||||
| Total financial assets | $ | 62.2 | $ | 17.0 | $ | 26.7 | $ | 18.5 | ||||
| Financial Liabilities: | ||||||||||||
| Cash-settled deferred share units | $ | 8.8 | $ | 8.8 | $ | - | $ | - | ||||
| Copper stream liability | 44.2 | - | - | 44.2 | ||||||||
| Contingent payment | 9.1 | - | - | 9.1 | ||||||||
| Derivative liabilities | 121.7 | - | 121.7 | - | ||||||||
| Total financial liabilities | $ | 183.8 | $ | 8.8 | $ | 121.7 | $ | 53.3 | ||||
Other investments
The Company holds marketable securities classified as Level 1 and Level 3 in the fair value hierarchy. The fair values of Level 1 investments are determined based on a market approach reflecting the closing price of each particular security at the reporting date. The closing price is a quoted market price obtained from the stock exchange that is the principal active market for the particular security, being the market with the greatest volume and level of activity for the assets. For Level 3 investments, which consist of share purchase warrants where inputs are not observable, the estimated fair value is determined by using an option pricing model. Changes in fair value on available for sale marketable securities are recognized in earnings or loss.
Trade receivables
The trade receivables consist of receivables from provisional silver and gold sales from the Terronera and Kolpa mines. The fair value of receivables arising from concentrate sale contracts that contain provisional pricing mechanisms is determined using the appropriate quoted closing price on the measurement date from the exchange that is the principal active market for the particular metal. As such, these receivables, which meet the definition of an embedded derivative, are classified within Level 2 of the fair value hierarchy.
Deferred consideration
As part of the sale of Bolañitos, the Company is entitled to receive up to $10.0 million of deferred consideration, payable in two installments of $5.0 million each upon the Bolañitos mine achieving the cumulative production milestones of two million and four million silver-equivalent ounces respectively. The deferred consideration represents a financial asset measured at fair value through profit or loss and is re‑measured at the end of each reporting period, with changes in fair value recognized in profit or loss. Deferred consideration is valued using a probability weighted discounted cash flows with key assumptions being likelihood and timing of the milestones being reached. It is classified as Level 3 in the fair value hierarchy.
Derivative assets
The Company also hedged a portion of the estimated remaining capital and operating expenditures incurred in Mexican pesos. The fair value of the foreign exchange forward contracts is determined using mark-to-market values provided by counterparties. These valuations are based on observable market inputs, including spot rate, forward foreign exchange rates and interest rate curves. Accordingly, the instruments are classified as Level 2 in the fair value hierarchy. Derivative assets further include an early redemption derivative asset embedded in the convertible senior notes, which is valued using FINCAD model with key assumptions including underlying stock volatility and the Company's credit spread. This instrument is classified as Level 3 in the fair value hierarchy.
Deferred share units ("DSUs")
The Company previously issued DSUs to independent directors of the Company under a plan which has since been replaced. The DSUs vest immediately and are redeemable for cash based on the market value of the units at the time of a director's retirement. The DSUs are classified as Level 1 in the fair value hierarchy. The liability is determined based on a market approach reflecting the closing price of the Company's common shares at the reporting date. Changes in fair value are recognized in general and administrative expenses.
Copper stream liability
The Company entered into a copper stream agreement on copper produced by Kolpa. Under the copper stream agreement, the Company received a $35 million prepayment used to finance the cash consideration of Kolpa acquisition on May 1, 2025. The copper stream liability is classified as Level 3 in the fair value hierarchy and measured at fair value through profit or loss. The stream is valued using a discounted cash flow model based on current market and operational assumptions. The key unobservable inputs used in the valuations include a discount rate, reflecting credit risk and asset-specific risk, and copper price forecasts, based on observable forward price curves over the expected production term. Valuation involves significant management's judgment related to the life-of-mine production schedule, including expected output timing and volumes.
Contingent payment
Part of the consideration in the acquisition of Kolpa was a deferred payable totaling up to $10.0 million, contingent upon Kolpa'a future technical report's silver-equivalent ounces containing certain number of oz and payable upon filling of the technical report. Consideration is valued using a discounted cash flow model and it is classified as level 3 in the fair value hierarchy.
Derivative liabilities
The Company holds certain gold forward swap contracts and silver collars to hedge against the fluctuation in gold and silver prices. The fair values of the gold forward swap contracts and silver collars are determined using mark-to-market values provided by counterparties. These valuations are based on observable market inputs, including gold and silver spot price, forward price curve and interest rate curves. Accordingly, the instruments are classified as Level 2 in the fair value hierarchy.
Financial Instrument Risk Exposure and Risk Management
The Company is exposed to a variety of financial instrument related risks. The board of directors approves and monitors the risk management process. The types of risk exposure and the way in which such exposure is managed are provided as follows:
Credit Risk
The Company is exposed to credit risk on its bank accounts, accounts receivable and loan receivable. Credit risk exposure on bank accounts is limited through maintaining the Company's balances with high-credit quality financial institutions, maintaining investment policies, assessing institutional exposure and continual discussion with external advisors. Value-added tax receivables are generated on the purchase of supplies and services to produce silver, which are refundable from the Mexican government. Trade receivables are generated on the sale of concentrate inventory to reputable metal traders. The loan receivable is related to the remaining proceeds for the sale of the El Compas mine to Grupo ROSGO. There has been no indication of a change in the creditworthiness of the counterparty to the loan receivable since the initial recognition.
Liquidity Risk
Liquidity risk is the risk that the Company will not be able to meet its financial obligations as they come due. The Company manages its liquidity risk by continually monitoring forecasted and actual cash flows. The Company has in place a planning and budgeting process to help determine the funds required to support its normal operating requirement and development plans. The Company aims to maintain sufficient liquidity to meet its short-term business requirements, taking into account its anticipated cash flows from operations, its holdings of cash and cash equivalents, and its committed and anticipated liabilities.
The Company's Mexican subsidiaries pay IVA on the purchase and sale of goods and services. The net amount paid is recoverable but is subject to review and assessment by the tax authorities. The Company regularly files the required IVA returns and all supporting documentation with the tax authorities, however, a smaller portion of IVA refund requests are denied from time to time based on the alleged lack of compliance with certain formal requirements and information returns by the Company's third-party suppliers. The Company takes necessary legal action on the delayed refunds as well as any denied refunds. The Company is in regular contact with the tax authorities in respect of its IVA filings and believes that the full amount of its IVA receivables will ultimately be received; however, the timing of recovery of these amounts and the nature and extent of any adjustments to the Company's IVA receivables remains uncertain.
Market Risk
The significant market risk exposures to which the Company is exposed are foreign currency risk, interest rate risk, and commodity price risk.
Foreign Currency Risk - The Company's operations in Mexico, Peru and Canada make it subject to foreign currency fluctuations. Certain of the Company's operating expenses are incurred in Mexican pesos, Peruvian soles and Canadian dollars; therefore, the fluctuation of the U.S. dollar in relation to these currencies will consequently impact the profitability of the Company and may also affect the value of the Company's assets and the amount of shareholders' equity. The Company also hedged a portion of the estimated operating expenditures incurred in Mexican pesos. As of March 31, 2026, the Company had $33.0 million in Mexican peso forward contracts with a weighted average rate of 18.47 pesos per U.S. dollar.
Interest Rate Risk - The interest rate risk is the risk that the fair value or the future cash flows of a financial instrument will fluctuate because of changes in market interest rates. The interest rate on the Debt Facility is variable, and based on the exposure as of March 31, 2026, a 1% change in interest rate would result in an increase or decrease of interest costs of $0.1 million per year. As of March 31, 2026, all of the Company's outstanding equipment financing obligations bear interest at fixed rates and are therefore not exposed to changes in future cash flows attributable to changes in market interest rates.
The Company is exposed to interest rate risk on its cash and cash equivalents. The interest earned on cash and cash equivalents is based on bank account interest rates which may fluctuate. Based on the exposure as of March 31, 2026, a 1% change in the interest rates would result in an increase or decrease of approximately $2.3 million in interest earned by the Company. The Company has not entered into any derivative contracts to manage the interest rate risk.
Commodity Price Risk - The Company is subject to commodity price risk related to silver, gold, lead, zinc, and copper. Fluctuations in the market prices of these metals can have a direct and immediate impact on the valuation of related financial instruments, non-financial assets, and overall net earnings. Gold and silver prices have historically fluctuated significantly and are affected by numerous factors outside of the Company's control, including, but not limited to, industrial and retail demand, central bank lending, forward sales by producers and speculators, levels of worldwide production, short-term changes in supply and demand because of speculative hedging activities and certain other factors.
As of March 31, 2026, unfinalized sales of 267,486 oz of silver and 3,418 oz of gold as well as trivial amounts of base metals, which do not have a final settlement price and the estimated revenues have been recognized at current market prices. As at March 31, 2026, with other variables unchanged, a 10% decrease in the market value of silver and gold would result in a reduction of revenue and the associated receivable of $3.5 million.
On March 28, 2024, the Company entered into gold forward swap contracts for 68,000 oz, a portion of the expected gold sales in the first three years of production, to hedge against the fluctuation in gold prices. As of March 31, 2026, 45,244 oz remains outstanding with forward price of $2,311 per ounce of gold.
In September 2025, in relation to the amendment to the Debt Facility, the Company implemented un-margined zero cost collars for 968,000 ounces of silver with a price range of $31 to $42. As of March 31, 2026, the Company had 387,096 silver collar oz outstanding to be settled over the period from April 2026 to June 2026.
OUTSTANDING SHARE DATA
As of May 6, 2026, the Company had the following securities issued, issuable and outstanding:
As at March 31, 2026, the Company's issued share capital was $983.2 million (December 31, 2025 - $961.2 million), representing 295,935,738 common shares (December 31, 2025 - 295,410,615), and the Company had options outstanding to purchase 1,293,922 common shares (December 31, 2025 - 1,671,794) with a weighted average exercise price of CAD$4.28 (December 31, 2025 - CAD$4.13) as well as convertible senior notes with $350.0 million aggregate principal value convertible into common shares based on an initial conversion rate of 80.2890 common shares per $1,000 principal amount of notes.
The Company considers the items included in the consolidated statement of shareholders' equity as capital. The Company's objective when managing capital is to safeguard its ability to continue as a going concern so that it can continue to provide returns for shareholders and benefits for other stakeholders. The Company manages the capital structure and makes adjustments to it in light of changes in economic conditions and the risk characteristics of the underlying assets. In order to maintain or adjust the capital structure, the Company may issue new shares through private placements, prospectus offerings, convertible debentures, asset acquisitions or return capital to shareholders. The Company is not subject to externally imposed capital requirements.
CHANGES IN ACCOUNTING POLICIES AND CRITICAL ACCOUNTING ESTIMATES
Accounting standards adopted during the period
The accounting policies applied in the Company's condensed consolidated interim financial statements for the three months ended March 31, 2026, are the same as those applied in the Company's annual audited consolidated financial statements as at and for the year ended December 31, 2025, except for below:
During the three months ended March 31, 2026, the Company adopted amendments to IFRS 9 Financial Instruments and related amendments to IAS 7 Statement of Cash Flows and IFRS 7 Financial Instruments: Disclosures related to the settlement of financial assets and financial liabilities through electronic payment systems. The amendments clarify the timing of recognition and derecognition of financial assets and financial liabilities settled electronically and introduce an optional exception for certain electronic payment arrangements. The adoption of these amendments did not have a significant impact on the Company's consolidated financial statements.
Critical Accounting Estimates
The preparation of financial statements requires the Company to make estimates that affect the reported amounts of assets and liabilities and disclosure of contingent assets and liabilities at the date of the financial statements and the reported amounts of revenues and expenses during the reporting period. There have been no significant changes to the critical accounting estimates and judgments disclosed in the Company's annual MD&A for the year ended December 31, 2025.
CONTROLS AND PROCEDURES
Disclosure Controls and Procedures
The Company's officers and management are responsible for establishing and maintaining disclosure controls and procedures for the Company. Disclosure controls and procedures are designed to provide reasonable assurance that material information required to be disclosed by the Company under securities legislation is recorded, processed, summarized and reported within the applicable time periods and to ensure that required information is gathered and communicated to the Company's management, including the Chief Executive Officer (CEO) and Chief Financial Officer (CFO) as is appropriate to permit timely decisions regarding public disclosure. There are inherent limitations to the effectiveness of any system of disclosure controls and procedures. Accordingly, even effective disclosure controls and procedures can only provide reasonable assurance of achieving their control objectives.
Changes in Internal Control over Financial Reporting
Management, including the CEO and CFO, has evaluated the Company's internal controls over financial reporting to determine whether any changes occurred during the period that have materially affected, or are reasonably likely to materially affect, the Company's internal controls over financial reporting.
During the three months ended March 31, 2026, there have been no significant changes in internal control over financial reporting that have materially affected, or are reasonably likely to materially affect, the Company's internal control over financial reporting.
Limitation on Scope
As disclosed in the Company's annual MD&A for the year ended December 31, 2025, management excluded from its assessment of internal control over financial reporting the internal control policies and procedures of Minera Kolpa S.A., which the Company acquired on May 1, 2025. Minera Kolpa's total assets, net assets, total revenues and net income (loss) constitute approximately 20%, 27%, 27% and 9%, respectively, of the condensed consolidated interim financial statements amounts as of and for the months ended March 31, 2026. This limitation of scope is in accordance with section 3.3(1)(b) of National Instrument 52-109 - Certification of Disclosure in Issuers' Annual and Interim Filings, which permits an issuer to limit the design of disclosure controls and processes and internal controls over financial reporting to exclude a business acquired not more than 365 days before the end of the relevant financial period. There have been no changes to the limitation on scope during the three months ended March 31, 2026.
QUARTERLY RESULTS AND TRENDS
The following table presents selected financial information for each of the most recent eight quarters:
| Table in millions of U.S. dollars except for share numbers and per share amounts |
2026 | 2025 | 2024 | |||||
| Q1 | Q4 | Q3 | Q2 | Q1 | Q4 | Q3 | Q2 | |
| Gross Sales | $213.7 | $176.4 | $146.0 | $90.1 | $63.9 | $42.7 | $54.0 | $58.7 |
| Smelting and refining costs included in revenue | 4.0 | 3.8 | 3.1 | 1.5 | 0.4 | 0.5 | 0.5 | 0.5 |
| Total Revenue | 209.7 | 172.6 | 142.9 | 88.6 | 63.5 | 42.2 | 53.5 | 58.2 |
| Direct production costs | 84.0 | 92.0 | 93.9 | 59.2 | 35.2 | 25.4 | 28.7 | 33.7 |
| Royalties | 11.2 | 9.0 | 9.3 | 6.5 | 6.2 | 3.7 | 5.2 | 5.6 |
| Mine operating cash flow before taxes | 114.6 | 71.6 | 39.7 | 22.9 | 22.1 | 13.1 | 19.6 | 18.9 |
| Share-based compensation | 0.2 | 0.2 | 0.1 | 0.1 | 0.0 | 0.1 | 0.1 | 0.0 |
| Depreciation | 20.9 | 24.9 | 23.9 | 15.0 | 9.2 | 5.3 | 7.0 | 8.7 |
| Mine operating earnings (loss) | $93.5 | $46.6 | $15.7 | $7.8 | $12.9 | $7.7 | $12.5 | $10.2 |
| Basic earnings (loss) per share | $0.23 | ($0.08) | ($0.14) | ($0.07) | ($0.13) | $0.00 | ($0.07) | ($0.06) |
| Diluted earnings (loss) per share | $0.21 | ($0.08) | ($0.14) | ($0.07) | ($0.13) | $0.00 | ($0.07) | ($0.06) |
| Weighted shares outstanding ('000) | 283,078 | 294,636 | 291,373 | 283,534 | 262,323 | 252,170 | 246,001 | 242,900 |
| Net earnings (loss) | 64.9 | (23.8) | (42.0) | (20.5) | (32.9) | 1.0 | (17.3) | (14.0) |
| Depreciation | 21.1 | 25.1 | 24.1 | 15.1 | 9.6 | 5.7 | 7.4 | 8.9 |
| Finance costs | 5.6 | 11.6 | 0.7 | 0.8 | 0.2 | 0.3 | 0.4 | 0.1 |
| Current income tax | 33.8 | 11.6 | 10.7 | 9.1 | 5.3 | (0.2) | 4.5 | 2.9 |
| Deferred income tax | (12.8) | (12.8) | (6.2) | (3.2) | (0.2) | (2.5) | (0.5) | (0.2) |
| EBITDA | $112.6 | $11.7 | ($12.7) | $1.3 | ($18.0) | $4.3 | ($5.5) | ($2.3) |
The following table presents selected production and costs information for each of the most recent eight quarters:
| Highlights | 2026 | 2025 | 2024 | |||||
| Q1 | Q4 | Q3 | Q2 | Q1 | Q4 | Q3 | Q2 | |
| Processed tonnes | 456,657 | 551,010 | 400,245 | 303,828 | 209,507 | 165,591 | 175,065 | 218,989 |
| Terronera | 175,418 | 154,180 | - | - | - | - | - | - |
| Guanaceví | 95,524 | 104,380 | 99,340 | 96,834 | 102,438 | 58,798 | 67,094 | 112,897 |
| Bolañitos | 13,988 | 93,620 | 105,153 | 88,098 | 107,069 | 106,793 | 107,971 | 106,092 |
| Kolpa | 171,727 | 198,830 | 195,752 | 118,896 | - | - | - | - |
| Silver ounces | 1,875,375 | 2,030,206 | 1,766,926 | 1,483,736 | 1,205,793 | 824,529 | 874,717 | 1,312,572 |
| Terronera | 533,301 | 352,002 | - | - | - | - | - | - |
| Guanaceví | 793,560 | 877,554 | 1,024,321 | 997,875 | 1,015,327 | 718,797 | 768,905 | 1,195,753 |
| Bolañitos | 18,396 | 168,783 | 143,916 | 105,223 | 190,466 | 105,732 | 105,812 | 116,819 |
| Kolpa | 530,118 | 631,867 | 598,689 | 380,638 | - | - | - | - |
| Silver equivalent ounces(1) (1) | 3,341,943 | 3,767,713 | 3,037,156 | 2,528,562 | 1,872,833 | 1,550,529 | 1,617,925 | 2,156,453 |
| Terronera | 1,296,348 | 1,003,822 | - | - | - | - | - | - |
| Guanaceví | 1,042,779 | 1,117,703 | 1,279,860 | 1,282,853 | 1,334,447 | 928,557 | 995,146 | 1,535,161 |
| Bolañitos | 62,766 | 379,632 | 471,158 | 440,678 | 538,386 | 621,972 | 622,779 | 621,292 |
| Kolpa | 940,050 | 1,266,557 | 1,286,139 | 805,032 | - | - | - | - |
| Cash costs per oz (2) | $22.54 | $19.05 | $18.09 | $15.35 | $15.89 | $13.68 | $11.35 | $13.43 |
| Terronera | ($2.14) | $4.76 | - | - | - | - | - | - |
| Guanaceví | $38.59 | $31.18 | $22.98 | $19.91 | $19.73 | $20.25 | $19.59 | $17.17 |
| Bolañitos | ($34.70) | $11.18 | ($11.47) | ($17.26) | ($5.60) | ($33.11) | ($51.38) | ($26.67) |
| Kolpa | $24.52 | $11.42 | $16.43 | $11.81 | - | - | - | - |
| AISC per oz (2) | $37.03 | $41.19 | $25.16 | $24.48 | $27.33 | $25.82 | $23.13 | $21.44 |
| Terronera | $22.31 | $65.70 | - | - | - | - | - | - |
| Guanaceví | $48.47 | $42.31 | $26.81 | $26.50 | $32.40 | $30.83 | $24.53 | $21.96 |
| Bolañitos | ($20.22) | $35.95 | $7.04 | $13.16 | ($8.78) | ($12.31) | $8.15 | $15.59 |
| Kolpa | $36.12 | $27.19 | $25.66 | - | - | - | - | - |
| Direct costs per tonne (2) | $256.33 | $207.91 | $192.78 | $201.24 | $207.27 | $209.49 | $189.85 | $192.68 |
| Terronera | $233.84 | $230.35 | - | - | - | - | - | - |
| Guanaceví | $457.23 | $383.98 | $349.83 | $325.40 | $310.52 | $365.23 | $330.55 | $269.36 |
| Bolañitos | $130.37 | $136.00 | $118.41 | $137.72 | $108.49 | $123.73 | $102.42 | $111.07 |
| Kolpa | $177.82 | $131.93 | $153.03 | $147.20 | - | - | - | - |
(1) Silver equivalents for 2026 are calculated using a 90:1 Ag:Au ratio, 45 silver oz to 1 lead tonne; 61 silver oz to 1 zinc tonne; 238 silver oz to 1 copper tonne ratio. Silver equivalents for 2025 and 2024 are calculated using an 80:1 Ag:Au, 60 silver oz to 1 lead tonne; 85 silver oz to 1 zinc tonne; 300 silver oz to 1 copper tonne ratio.
(2) Cash cost per oz, AISC per oz and direct costs per tonne are non-IFRS measures.
NON-IFRS MEASURES
Non-IFRS and Other Financial Measures and Ratios
We have included certain non-IFRS financial measures and ratios in this MD&A, as discussed below. We believe that these measures, in addition to conventional measures prepared in accordance with IFRS, provide investors with an improved ability to evaluate the underlying performance of the Company. The non-IFRS measures and ratios are intended to provide additional information and should not be considered in isolation or as a substitute for measures of performance prepared in accordance with IFRS. These financial measures and ratios do not have any standardized meaning prescribed under IFRS and therefore may not be comparable to other issuers.
Non-IFRS financial measures are defined under National Instrument 52-112 - Non-GAAP and Other Financial Measures Disclosure ("NI 52-112") as a financial measure disclosed that (a) depicts the historical or expected future financial performance, financial position or cash flow of an entity, (b) with respect to its composition, excludes an amount that is included in, or includes an amount that is excluded from, the composition of the most directly comparable financial measure disclosed in the primary financial statements of the entity, (c) is not disclosed in the financial statements of the entity, and (d) is not a ratio, fraction, percentage or similar representation.
A non-IFRS ratio is defined by 52-112 as a financial measure disclosed that (a) is in the form of a ratio, fraction, percentage or similar representation, (b) has a non-IFRS financial measure as one or more of its components, and (c) is not disclosed in the financial statements.
Working capital is a non-IFRS measure that is a common measure of liquidity but does not have any standardized meaning. The most directly comparable measure prepared in accordance with IFRS is current assets and current liabilities. Working capital is calculated by deducting current liabilities from current assets. Working capital should not be considered in isolation or as a substitute for measures prepared in accordance with IFRS. The measure is intended to assist readers in evaluating the Company's liquidity.
| Expressed in millions of U.S. dollars | As at March 31, 2026 | As at December 31, 2025 | ||||
| Current assets | $ | 422.9 | $ | 423.2 | ||
| Current liabilities | 249.5 | 276.8 | ||||
| Working capital | $ | 173.4 | $ | 146.4 |
Adjusted earnings and adjusted earnings per share are non-IFRS measures that supplement information to the Company's consolidated financial statements. The Company believes that, in addition to the conventional measures prepared in accordance with IFRS, the Company and certain investors and analysts use this information to evaluate the Company's underlying core operating performance. The presentation of adjusted earnings and adjusted earnings per share is not meant to be a substitute for net income and net income per share presented in accordance with IFRS but rather should be evaluated in conjunction with such IFRS measures.
The Company defines the adjusted earnings as net income adjusted to include certain non-cash and unusual items, and items that in the Company's judgment are subject to volatility as a result of factors which are unrelated to the Company's operation in the period. Certain items that become applicable in a period may be adjusted for, with the Company retroactively presenting comparable periods with an adjustment for such items and, conversely, items no longer applicable may be removed from the calculation. During the current period, the Company has included unrealized foreign exchange (gain) loss, (gain) loss on derivatives, changes in the fair value of its investments in marketable securities and change in fair value of cash settled DSUs and made retroactive adjustments to prior periods for the same.
The following table provides a detailed reconciliation of net income as reported in the Company's financial statements to adjusted earnings and adjusted earnings per share.
| Expressed in millions of U.S. dollars | Three Months Ended March 31 | |||||
| (except for share numbers and per share amounts) | 2026 | 2025 | ||||
| Net earnings (loss) for the period per financial statements | $ | 64.9 | ($32.9 | ) | ||
| Unrealized foreign exchange (gain) loss | 0.6 | 0.3 | ||||
| (Gain) loss on derivatives copper stream and contingent liabilities revaluations |
25.4 | 31.9 | ||||
| Gain from sale of Bolañitos | (35.6 | ) | - | |||
| Change in fair value of investments | 4.1 | (0.1 | ) | |||
| Change in fair value of cash settled DSUs | (0.1 | ) | 0.6 | |||
| Adjusted net earnings (loss) | $ | 59.2 | ($0.2 | ) | ||
| Basic weighted average shares outstanding ('000) | 283,078 | 262,323 | ||||
| Adjusted net earnings (loss) per share | $ | 0.21 | ($0.00 | ) | ||
Mine operating cash flow before taxes is a non-IFRS measure that does not have a standardized meaning prescribed by IFRS and therefore may not be comparable to similar measures presented by other issuers. Mine operating cash flow is calculated as revenue minus direct production costs and royalties. Mine operating cash flow is used by management to assess the performance of the mine operations, excluding corporate and exploration activities, and is provided to investors as a measure of the Company's operating performance.
| Expressed in millions of U.S. dollars | Three Months Ended March 31 | |||||
| 2026 | 2025 | |||||
| Mine operating earnings per financial statements | $ | 93.5 | $ | 12.8 | ||
| Share-based compensation | 0.2 | - | ||||
| Depreciation | 20.9 | 9.2 | ||||
| Mine operating cash flow before taxes | $ | 114.6 | $ | 22.1 | ||
Operating cash flow before working capital changes per share is a non-IFRS measure that does not have a standardized meaning prescribed by IFRS and therefore may not be comparable to similar measures presented by other issuers. Operating cash flow per share is calculated by dividing cash from operating activities by the weighted average shares outstanding. Operating cash flow per share is used by management to assess operating performance on a per share basis, irrespective of working capital changes and is provided to investors as a measure of the Company's operating performance.
| Expressed in millions of U.S. dollars | Three Months Ended March 31 | |||||
| (except for per share amounts) | 2026 | 2025 | ||||
| Cash from (used in) operating activities per financial statements | $ | 20.7 | $ | 3.4 | ||
| Net changes in non-cash working capital per financial statements | (18.1 | ) | (5.0 | ) | ||
| Operating cash flow before working capital changes | $ | 38.8 | $ | 8.3 | ||
| Basic weighted average shares outstanding ('000) | 283,078 | 262,323 | ||||
| Operating cash flow before working capital changes per share | $ | 0.14 | $ | 0.03 | ||
EBITDA is a non-IFRS financial measure, which excludes the following from net earnings:
Adjusted EBITDA excludes the following additional items from EBITDA:
Adjusted EBITDA per share is calculated by dividing Adjusted EBITDA by the basic weighted average number of shares outstanding for the period.
Management believes EBITDA is a valuable indicator of the Company's ability to generate liquidity by producing operating cash flow to fund working capital needs, service debt obligations, and fund capital expenditures. Management uses EBITDA for this purpose.
EBITDA is also frequently used by investors and analysts for valuation purposes whereby EBITDA is multiplied by a factor or "EBITDA multiple" based on an observed or inferred relationship between EBITDA and market values to determine the approximate total enterprise value of a company.
EBITDA is intended to provide additional information to investors and analysts. It does not have any standardized definition under IFRS and should not be considered in isolation or as a substitute for measures of operating performance prepared in accordance with IFRS. EBITDA excludes the impact of cash costs of financing activities and taxes, and the effects of changes in operating working capital balances and therefore is not necessarily indicative of operating profit or cash flow from operations as determined by IFRS. Other companies may calculate EBITDA and Adjusted EBITDA differently.
Certain items that become applicable in a period may be adjusted for, with the Company retroactively presenting comparable periods with an adjustment for such items and, conversely, items no longer applicable may be removed from the calculation.
| Expressed in millions of U.S. dollars | Three Months Ended March 31 | |||||
| 2026 | 2025 | |||||
| Net earnings (loss) for the period per financial statements | $ | 64.9 | ($32.9 | ) | ||
| Depreciation - cost of sales | 20.9 | 9.2 | ||||
| Depreciation - exploration, evaluation and development | 0.2 | 0.3 | ||||
| Depreciation - general & administration | 0.1 | 0.1 | ||||
| Finance costs | 5.6 | 0.2 | ||||
| Current income tax expense (recovery) | 33.8 | 5.3 | ||||
| Deferred income tax expense (recovery) | (12.8 | ) | (0.2 | ) | ||
| EBITDA | $ | 112.6 | ($18.1 | ) | ||
| Share based compensation | 1.4 | 0.5 | ||||
| Unrealized foreign exchange (Gain) loss | 0.6 | 0.2 | ||||
| (Gain) loss on derivatives, copper stream and contingent liabilities revaluations | 25.4 | 31.9 | ||||
| (Gain) loss from disposal of Bolañitos | (35.6 | ) | - | |||
| Change in fair value of investments | 4.1 | (0.1 | ) | |||
| Change in fair value of cash settled DSUs | (0.1 | ) | 0.6 | |||
| Adjusted EBITDA | $ | 108.4 | $ | 15.1 | ||
| Basic weighted average shares outstanding ('000) | 283,078 | 262,323 | ||||
| Adjusted EBITDA per share | $ | 0.38 | $ | 0.06 | ||
Cash costs per silver oz, total production costs per oz, direct operating costs per tonne and direct costs per tonne are measures developed by precious metals companies in an effort to provide a comparable standard; however, there can be no assurance that the Company's reporting of these non-IFRS measures and ratios is similar to those reported by other mining companies. Cash costs per oz, total production costs per oz and direct costs per tonne are measures used by the Company to manage and evaluate operating performance at each of the Company's operating mining units. They are widely reported in the silver mining industry as a benchmark for performance, but do not have a standardized meaning and are disclosed in addition to IFRS measures. Direct operating costs include mining, processing (including smelting, refining, transportation and selling costs) and direct overhead at the operation sites. Direct costs include all direct operating costs plus royalties and special mining duty. Cash costs include all direct costs less by-product gold sales and changes in finished gold inventories.
Total production costs include all cash costs plus depreciation, changes in depreciation in finished goods inventory and site share-based compensation. Cash costs per silver ounce and total production costs per ounce are calculated by dividing cash costs and total production costs by the payable silver ounces produced. Direct operating costs per tonne and direct costs per tonne are calculated by dividing direct operating costs and direct costs by the number of processed tonnes. The following tables provide a detailed reconciliation of these measures to the Company's direct production costs, as reported in its consolidated financial statements.
| Expressed in millions of U.S. dollars | Three Months Ended March 31, 2026 |
||||||||||||||
| Terronera | Guanaceví | Bolañitos | Kolpa | Total | |||||||||||
| Direct production costs per financial statements | $ | 33.8 | $ | 24.0 | $ | 1.7 | $ | 24.5 | $ | 83.9 | |||||
| Purchase of the third-party material | - | (10.3 | ) | - | (0.9 | ) | (11.3 | ) | |||||||
| Smelting and refining costs included in revenue | 1.2 | 0.2 | - | 2.6 | 4.0 | ||||||||||
| Opening finished goods | (3.0 | ) | (8.6 | ) | (0.2 | ) | (0.8 | ) | (12.6 | ) | |||||
| Closing finished goods | 2.2 | 17.6 | - | 1.4 | 21.3 | ||||||||||
| Direct operating costs | 34.2 | 22.8 | 1.6 | 26.8 | 85.4 | ||||||||||
| Purchase of the third-party material | - | 10.3 | - | 0.9 | 11.3 | ||||||||||
| Royalties | 2.4 | 7.1 | - | 1.6 | 11.2 | ||||||||||
| Special mining duty (1) | 4.4 | 3.5 | 0.2 | 1.2 | 9.2 | ||||||||||
| Direct costs | 41.0 | 43.7 | 1.8 | 30.5 | 117.1 | ||||||||||
| By-products sales | (42.5 | ) | (10.1 | ) | (2.5 | ) | (17.5 | ) | (72.6 | ) | |||||
| Opening by-products inventory fair market value | 3.0 | 3.2 | 0.1 | 0.6 | 6.9 | ||||||||||
| Closing by-products inventory fair market value | (2.6 | ) | (6.4 | ) | - | (1.3 | ) | (10.4 | ) | ||||||
| Cash costs net of by-products | (1.1 | ) | 30.3 | (0.6 | ) | 12.3 | 40.9 | ||||||||
| Depreciation | 9.4 | 4.7 | - | 6.8 | 20.9 | ||||||||||
| Share-based compensation | 0.1 | 0.1 | - | 0.1 | 0.2 | ||||||||||
| Opening finished goods depreciation | (0.5 | ) | (1.8 | ) | - | (0.2 | ) | (2.4 | ) | ||||||
| Closing finished goods depreciation | 0.6 | 3.5 | - | 0.3 | 4.4 | ||||||||||
| Total production costs | $ | 8.5 | $ | 36.7 | ($0.6 | ) | $ | 19.3 | $ | 63.9 | |||||
| Expressed in millions of U.S. dollars | Three Months Ended March 31, 2025 |
||||||||||||||
| Terronera | Guanaceví | Bolañitos | Kolpa | Total | |||||||||||
| Direct production costs per financial statements | $ | - | $ | 25.4 | $ | 9.7 | $ | - | $ | 35.2 | |||||
| Purchase of the third-party material | - | (5.9 | ) | - | - | (5.9 | ) | ||||||||
| Smelting and refining costs included in revenue | - | - | 0.4 | - | 0.4 | ||||||||||
| Opening finished goods | - | (5.4 | ) | (0.5 | ) | - | (5.9 | ) | |||||||
| Closing finished goods | - | 4.8 | 1.3 | - | 6.1 | ||||||||||
| Direct operating costs | - | 18.9 | 11.0 | - | 29.9 | ||||||||||
| Purchase of the third-party material | - | 5.9 | - | - | 5.9 | ||||||||||
| Royalties | - | 6.1 | 0.2 | - | 6.2 | ||||||||||
| Special mining duty (1) | - | 1.0 | 0.4 | - | 1.4 | ||||||||||
| Direct costs | - | 31.8 | 11.6 | - | 43.4 | ||||||||||
| By-products sales | - | (12.8 | ) | (12.0 | ) | - | (24.8 | ) | |||||||
| Opening by-products inventory fair market value | - | 3.2 | 0.8 | - | 4.0 | ||||||||||
| Closing by-products inventory fair market value | - | (2.2 | ) | (1.4 | ) | - | (3.6 | ) | |||||||
| Cash costs net of by-products | - | 20.0 | (1.0 | ) | - | 19.0 | |||||||||
| Depreciation | - | 6.6 | 2.6 | - | 9.2 | ||||||||||
| Share-based compensation | - | - | - | - | 0.0 | ||||||||||
| Opening finished goods depreciation | - | (1.2 | ) | (0.1 | ) | - | (1.3 | ) | |||||||
| Closing finished goods depreciation | - | 1.6 | 0.4 | - | 2.0 | ||||||||||
| Total production costs | $ | - | $ | 27.0 | $ | 1.9 | $ | - | $ | 28.9 | |||||
(1) Special mining duty is an EBITDA royalty tax presented as a current income tax in accordance with IFRS.
| Three Months Ended March 31, 2026 |
|||||||||||||||
| Terronera | Guanaceví | Bolañitos | Kolpa | Total | |||||||||||
| Throughput tonnes | 175,418 | 95,524 | 13,988 | 171,727 | 456,657 | ||||||||||
| Payable silver ounces | 510,521 | 785,494 | 17,668 | 501,458 | 1,815,142 | ||||||||||
| Cash costs per silver ounce | ($2.14 | ) | $ | 38.59 | ($34.70 | ) | $ | 24.52 | $ | 22.54 | |||||
| Total production costs per ounce | $ | 16.67 | $ | 46.76 | ($34.69 | ) | $ | 38.43 | $ | 35.21 | |||||
| Direct operating costs per tonne | $ | 195.11 | $ | 238.30 | $ | 113.74 | $ | 155.92 | $ | 186.92 | |||||
| Direct costs per tonne | $ | 233.84 | $ | 457.23 | $ | 130.37 | $ | 177.82 | $ | 256.33 | |||||
| Three Months Ended March 31, 2025 |
|||||||||||||||
| Terronera | Guanaceví | Bolañitos | Kolpa | Total | |||||||||||
| Throughput tonnes | - | 102,438 | 107,069 | - | 209,507 | ||||||||||
| Payable silver ounces | - | 1,012,281 | 181,077 | - | 1,193,358 | ||||||||||
| Cash costs per silver ounce | $ | - | $ | 19.73 | ($5.60 | ) | $ | - | $ | 15.89 | |||||
| Total production costs per ounce | $ | - | $ | 26.66 | $ | 10.65 | $ | - | $ | 24.23 | |||||
| Direct operating costs per tonne | $ | - | $ | 184.43 | $ | 102.81 | $ | - | $ | 142.72 | |||||
| Direct costs per tonne | $ | - | $ | 310.52 | $ | 108.49 | $ | - | $ | 207.27 | |||||
| Expressed in millions of U.S. dollars | March 31, 2026 | ||||||||||||||
| Terronera | Guanaceví | Bolañitos | Kolpa | Total | |||||||||||
| Closing finished goods | 2.2 | 17.6 | - | 1.4 | 21.3 | ||||||||||
| Closing finished goods depreciation | 0.6 | 3.5 | - | 0.3 | 4.4 | ||||||||||
| Finished goods inventory | $ | 2.8 | $ | 21.1 | $ | - | $ | 1.7 | $ | 25.7 | |||||
| Expressed in millions of U.S. dollars | March 31, 2025 | ||||||||||||||
| Terronera | Guanaceví | Bolañitos | Kolpa | Total | |||||||||||
| Closing finished goods | - | 4.8 | 1.3 | - | 6.1 | ||||||||||
| Closing finished goods depreciation | - | 1.6 | 0.4 | - | 2.0 | ||||||||||
| Finished goods inventory | $ | - | 6.4 | 1.7 | $ | - | 8.1 | ||||||||
AISC per oz and all-in costs per oz are measures developed by the World Gold Council (and used as a standard of the Silver Institute) in an effort to provide a comparable standard within the precious metal industry; however, there can be no assurance that the Company's reporting of these non-IFRS measures are similar to those reported by other mining companies. These measures are used by the Company to manage and evaluate operating performance at each of the Company's operating mining units and consolidated group and are widely reported in the silver mining industry as a benchmark for performance, but do not have a standardized meaning and are disclosed in addition to IFRS measures. The following tables provide a detailed reconciliation of these measures to the Company's cost of sales, as reported in the Company's consolidated financial statements.
| Expressed in millions of U.S. dollars | Three Months Ended March 31, 2026 |
||||||||||||||
| Terronera | Guanaceví | Bolañitos | Kolpa | Total | |||||||||||
| Cash costs net of by-products | ($1.1 | ) | $ | 30.3 | ($0.6 | ) | $ | 12.3 | $ | 40.9 | |||||
| Operations share-based compensation | 0.1 | 0.1 | - | 0.1 | 0.2 | ||||||||||
| Corporate general and administrative | 1.3 | 1.1 | 0.1 | 1.0 | 3.4 | ||||||||||
| Corporate share-based compensation | 0.5 | 0.4 | - | 0.3 | 1.2 | ||||||||||
| Reclamation - amortization/accretion | 0.1 | 0.1 | - | - | 0.3 | ||||||||||
| Mine site expensed exploration | 0.3 | 0.4 | - | 1.4 | 2.1 | ||||||||||
| Equipment loan payments | 0.9 | - | - | 0.2 | 1.1 | ||||||||||
| Capital expenditures sustaining | 9.3 | 5.7 | 0.2 | 2.9 | 18.1 | ||||||||||
| All-In-Sustaining Costs | $ | 11.4 | $ | 38.1 | ($0.4 | ) | $ | 18.1 | $ | 67.2 | |||||
| Growth exploration, evaluation and development | 2.7 | ||||||||||||||
| Growth capital expenditures | 5.8 | ||||||||||||||
| All-In-Costs | $ | 75.7 | |||||||||||||
| Expressed in millions of U.S. dollars | Three Months Ended March 31, 2025 |
||||||||||||||
| Terronera | Guanaceví | Bolañitos | Kolpa | Total | |||||||||||
| Cash costs net of by-products | $ | - | $ | 20.0 | ($1.0 | ) | $ | - | $ | 19.0 | |||||
| Operations share-based compensation | - | - | - | - | - | ||||||||||
| Corporate general and administrative | - | 2.7 | 1.1 | - | 3.8 | ||||||||||
| Corporate share-based compensation | - | 0.3 | 0.1 | - | 0.4 | ||||||||||
| Reclamation - amortization/accretion | - | 0.1 | 0.1 | - | 0.2 | ||||||||||
| Mine site expensed exploration | - | 0.3 | 0.2 | - | 0.4 | ||||||||||
| Capital expenditures sustaining | - | 3.4 | 1.9 | - | 5.4 | ||||||||||
| All-In-Sustaining Costs | $ | - | $ | 26.8 | $ | 2.4 | $ | - | $ | 29.2 | |||||
| Growth exploration, evaluation and development | 3.8 | ||||||||||||||
| Growth capital expenditures | 36.2 | ||||||||||||||
| All-In-Costs | $ | 69.2 | |||||||||||||
| Three Months Ended March 31, 2026 |
|||||||||||||||
| Terronera | Guanaceví | Bolañitos | Kolpa | Total | |||||||||||
| Throughput tonnes | 175,418 | 95,524 | 13,988 | 171,727 | 456,657 | ||||||||||
| Payable silver ounces | 510,521 | 785,494 | 17,668 | 501,458 | 1,815,142 | ||||||||||
| Silver equivalent production (ounces) | 1,296,348 | 1,042,779 | 62,766 | 940,050 | 3,341,943 | ||||||||||
| All-in-Sustaining cost per ounce | $ | 22.31 | $ | 48.47 | ($20.22 | ) | $ | 36.12 | $ | 37.03 | |||||
| Three Months Ended March 31, 2025 |
|||||||||||||||
| Terronera | Guanaceví | Bolañitos | Kolpa | Total | |||||||||||
| Throughput tonnes | - | 102,438 | 107,069 | - | 209,507 | ||||||||||
| Payable silver ounces | - | 1,012,281 | 181,077 | - | 1,193,358 | ||||||||||
| Silver equivalent production (ounces) | - | 1,334,447 | 538,386 | - | 1,872,833 | ||||||||||
| All-in-Sustaining cost per ounce | $ | - | $ | 26.50 | $ | 13.16 | $ | - | $ | 24.48 | |||||
| Expressed in millions of U.S. dollars | Three Months Ended March 31 | |||||
| 2026 | 2025 | |||||
| Capital expenditures sustaining | $ | 18.1 | $ | 5.4 | ||
| Growth capital expenditures | 5.8 | $ | 36.2 | |||
| Property, plant and equipment expenditures per financial statements | $ | 23.9 | $ | 41.6 | ||
| Expressed in millions of U.S. dollars | Three Months Ended March 31 | |||||
| 2026 | 2025 | |||||
| Mine site expensed exploration | $ | 2.1 | $ | 0.4 | ||
| Growth exploration, evaluation and development | 2.7 | 3.8 | ||||
| Total exploration, evaluation and development | 4.8 | 4.2 | ||||
| Exploration, evaluation and development depreciation | 0.2 | 0.3 | ||||
| Exploration, evaluation and development share-based compensation | 0.1 | 0.1 | ||||
| Exploration, evaluation and development expense | $ | 5.0 | $ | 4.5 | ||
| Expressed in millions of U.S. dollars Unless otherwise stated |
Three Months Ended March 31 | |||||
| 2026 | 2025 | |||||
| Gross silver sales | $ | 141.1 | $ | 39.2 | ||
| Silver ounces sold | 1,642,220 | 1,223,684 | ||||
| Realized silver price per ounce | $ | 85.95 | $ | 31.99 | ||
| Expressed in millions of U.S. dollars Unless otherwise stated |
Three Months Ended March 31 | |||||
| 2026 | 2025 | |||||
| Gross gold sales | $ | 55.1 | $ | 24.8 | ||
| Gold ounces sold | 10,942 | 8,538 | ||||
| Realized gold price per ounce | $ | 5,035 | $ | 2,903 | ||
| Expressed in millions of U.S. dollars Unless otherwise stated |
Three Months Ended March 31 | |||||
| 2026 | 2025 | |||||
| Gross lead sales | $ | 8.9 | $ | - | ||
| Lead tonnes sold | 4,542 | - | ||||
| Realized lead price per tonne | $ | 1,966 | $ | - | ||
| Expressed in millions of U.S. dollars Unless otherwise stated |
Three Months Ended March 31 | |||||
| 2026 | 2025 | |||||
| Gross zinc sales | $ | 7.0 | $ | - | ||
| Zinc tonnes sold | 2,295 | - | ||||
| Realized zinc price per tonne | $ | 3,070 | $ | - | ||
| Expressed in millions of U.S. dollars Unless otherwise stated |
Three Months Ended March 31 | |||||
| 2026 | 2025 | |||||
| Gross copper sales | $ | 0.7 | $ | - | ||
| Copper tonnes sold | 55 | - | ||||
| Realized copper price per tonne | $ | 12,909 | $ | - | ||