QUARTERLY REPORT PURSUANT TO SECTION 13 OR 15(d) OF THE SECURITIES EXCHANGE ACT OF 1934
For the quarterly period ended September 30, 2025
or
☐
TRANSITION REPORT PURSUANT TO SECTION 13 OR 15(d) OF THE SECURITIES EXCHANGE ACT OF 1934
For the transition period from to .
Commission file number: 000-50600
Blackbaud, Inc.
(Exact name of registrant as specified in its charter)
Delaware
11-2617163
(State or other jurisdiction of incorporation or organization)
(I.R.S. Employer Identification No.)
65 Fairchild Street
Charleston, South Carolina29492
(Address of principal executive offices, including zip code)
(843) 216-6200
(Registrant’s telephone number, including area code)
Securities Registered Pursuant to Section 12(b) of the Act:
Title of Each Class
Trading Symbol(s)
Name of Each Exchange on which Registered
Common Stock, $0.001 Par Value
BLKB
Nasdaq Global Select Market
Indicate by check mark whether the registrant (1) has filed all reports required to be filed by Section 13 or 15(d) of the Securities Exchange Act of 1934 during the preceding 12 months (or for such shorter period that the registrant was required to file such reports), and (2) has been subject to such filing requirements for the past 90 days.
Yes☑No☐
Indicate by check mark whether the registrant has submitted electronically every Interactive Data File required to be submitted pursuant to Rule 405 of Regulation S-T (Section 232.405 of this chapter) during the preceding 12 months (or for such shorter period that the registrant was required to submit such files).
Yes☑No☐
Indicate by check mark whether the registrant is a large accelerated filer, an accelerated filer, a non-accelerated filer, a smaller reporting company, or an emerging growth company. See the definitions of “large accelerated filer,” “accelerated filer,” “smaller reporting company,” and "emerging growth company" in Rule 12b-2 of the Exchange Act.
Large accelerated filer
☑
Accelerated filer
☐
Non-accelerated filer
☐
Smaller reporting company
☐
Emerging growth company
☐
If an emerging growth company, indicate by check mark if the registrant has elected not to use the extended transition period for complying with any new or revised financial accounting standards provided pursuant to Section 13(a) of the Exchange Act.☐
Indicate by check mark whether registrant is a shell company (as defined in Rule 12b-2 of the Exchange Act).
Yes☐No☑
The number of shares of the registrant’s Common Stock outstanding as of October 29, 2025 was 47,834,179.
This Quarterly Report on Form 10-Q, including the documents incorporated herein by reference, contains forward-looking statements that anticipate results based on our estimates, assumptions and plans that are subject to uncertainty. These "forward-looking statements" are made subject to the safe-harbor provisions of the Private Securities Litigation Reform Act of 1995, Section 27A of the Securities Act of 1933, as amended, and Section 21E of the Securities Exchange Act of 1934, as amended. Forward-looking statements consist of, among other things, trend analyses, statements regarding future events, future financial performance, our anticipated growth, the effect of general economic and market conditions, our business strategy and our plan to build and grow our domestic and international businesses, our operating results, our ability to successfully integrate acquired businesses and technologies, the effect of foreign currency exchange rate and interest rate fluctuations on our financial results, the impact of expensing stock-based compensation, the sufficiency of our capital resources, our ability to meet our ongoing debt and obligations as they become due, cybersecurity and data protection risks and related liabilities, and current or potential legal proceedings involving us, all of which are based on current expectations, estimates, and forecasts, and the beliefs and assumptions of our management. Words such as “believes,” “seeks,” “expects,” “may,” “might,” “should,” “intends,” “could,” “would,” “likely,” “will,” “targets,” “plans,” “anticipates,” “aims,” “projects,” “estimates” or any variations of such words and similar expressions are also intended to identify such forward-looking statements. These forward-looking statements are subject to risks, uncertainties and assumptions that are difficult to predict. Accordingly, they should not be viewed as assurances of future performance, and actual results may differ materially and adversely from those expressed in any forward-looking statements.
Important factors that could cause actual results to differ materially from our expectations expressed in forward-looking statements include, but are not limited to, those summarized elsewhere in this report, in our Annual Report on Form 10-K for the year ended December 31, 2024 and in our other filings made with the United States Securities & Exchange Commission ("SEC"). Forward-looking statements represent our management's beliefs and assumptions only as of the date of this Quarterly Report on Form 10-Q. We undertake no obligation to update or revise any forward-looking statements, or to update the reasons actual results could differ materially from those anticipated in any forward-looking statement, whether as a result of new information, future events or otherwise.
2
Third Quarter 2025 Form 10-Q
PART I. FINANCIAL INFORMATION
ITEM 1. FINANCIAL STATEMENTS
Blackbaud, Inc. Condensed Consolidated Balance Sheets (Unaudited)
(dollars in thousands, except per share amounts)
September 30, 2025
December 31, 2024
Assets
Current assets:
Cash and cash equivalents
$
38,255
$
67,628
Restricted cash
419,185
741,884
Accounts receivable, net of allowance of $6,196 and $5,228 at September 30, 2025 and December 31, 2024, respectively
82,561
83,539
Customer funds receivable
3,996
1,970
Prepaid expenses and other current assets
94,838
81,572
Total current assets
638,835
976,593
Property and equipment, net
85,332
91,926
Operating lease right-of-use assets
4,931
26,554
Software development costs, net
154,074
148,319
Goodwill
1,056,656
1,052,506
Intangible assets, net
112,697
132,881
Other assets
51,916
67,221
Total assets
$
2,104,441
$
2,496,000
Liabilities and stockholders’ equity
Current liabilities:
Trade accounts payable
$
48,761
$
50,810
Accrued expenses and other current liabilities
53,050
76,484
Due to customers
421,820
742,340
Debt, current portion
22,613
23,875
Deferred revenue, current portion
383,138
358,546
Total current liabilities
929,382
1,252,055
Debt, net of current portion
1,042,005
1,051,110
Deferred tax liability
9,246
24,999
Deferred revenue, net of current portion
1,773
2,015
Operating lease liabilities, net of current portion
Common stock, $0.001 par value; 180,000,000 shares authorized, 72,295,494 and 70,943,373 shares issued at September 30, 2025 and December 31, 2024, respectively; 48,057,972 and 49,245,588 shares outstanding at September 30, 2025 and December 31, 2024, respectively
72
71
Additional paid-in capital
1,369,807
1,291,442
Treasury stock, at cost; 24,237,522 and 21,697,785 shares at September 30, 2025 and December 31, 2024, respectively
(1,231,316)
(1,060,348)
Accumulated other comprehensive loss
(9,198)
(4,869)
Accumulated deficit
(21,176)
(99,457)
Total stockholders’ equity
108,189
126,839
Total liabilities and stockholders’ equity
$
2,104,441
$
2,496,000
The accompanying notes are an integral part of these condensed consolidated financial statements.
Third Quarter 2025 Form 10-Q
3
Blackbaud, Inc.
Condensed Consolidated Statements of Comprehensive Income
(Unaudited)
(dollars in thousands, except per share amounts)
Three months ended September 30,
Nine months ended September 30,
2025
2024
2025
2024
Revenue
$
281,143
$
286,598
$
833,109
$
852,511
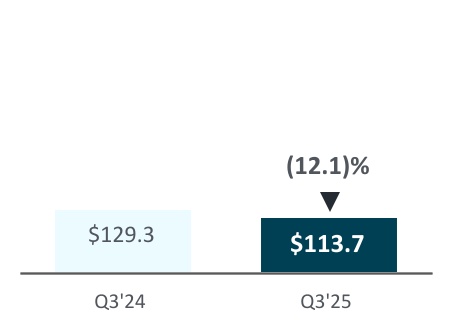
Cost of revenue
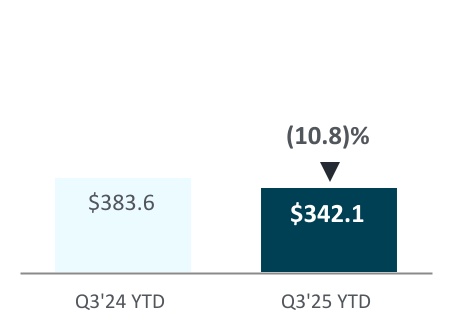
113,653
129,290
342,101
383,615
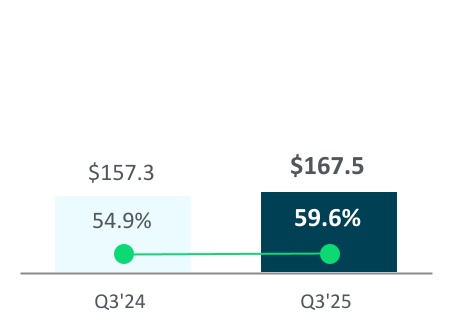
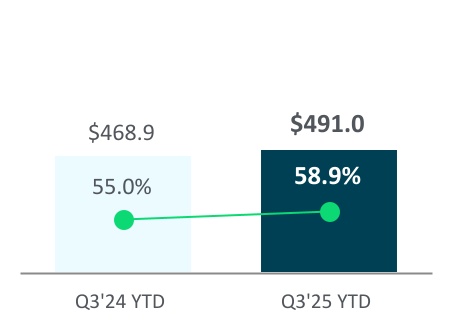
Gross profit
167,490
157,308
491,008
468,896
Operating expenses
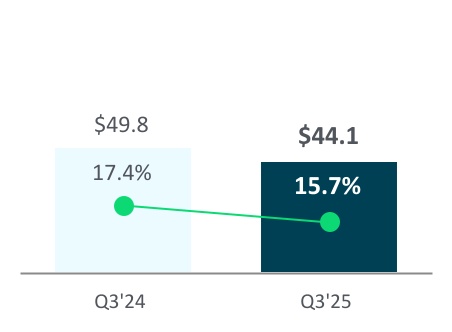
Sales, marketing and customer success
44,105
49,808
132,795
147,400
Research and development
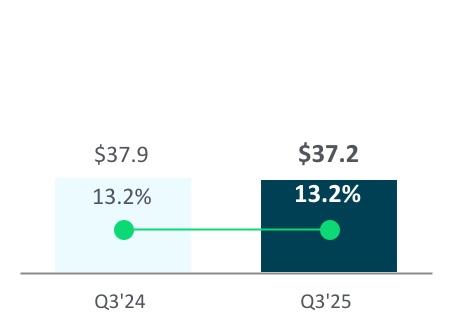
37,198
37,916
104,352
116,045
General and administrative
31,044
27,519
120,579
106,842
Amortization of intangible assets
570
918
1,670
2,724
Total operating expenses
112,917
116,161
359,396
373,011
Income from operations
54,573
41,147
131,612
95,885
Interest expense
(16,774)
(14,140)
(52,130)
(40,131)
Other income, net
3,245
2,997
6,468
9,654
Income before (benefit) provision for income taxes
41,044
30,004
85,950
65,408
Income tax (benefit) provision
(6,448)
11,714
7,669
18,568
Net income
$
47,492
$
18,290
$
78,281
$
46,840
Earnings per share
Basic
$
1.00
$
0.36
$
1.63
$
0.92
Diluted
$
0.98
$
0.35
$
1.61
$
0.90
Common shares and equivalents outstanding
Basic weighted average shares
47,680,002
50,409,292
47,961,631
51,067,255
Diluted weighted average shares
48,498,285
51,632,569
48,634,027
52,107,147
Other comprehensive loss
Foreign currency translation adjustment
$
(2,284)
$
6,463
$
8,299
$
5,617
Unrealized loss on derivative instruments, net of tax
(622)
(13,525)
(12,628)
(10,816)
Total other comprehensive loss
(2,906)
(7,062)
(4,329)
(5,199)
Comprehensive income
$
44,586
$
11,228
$
73,952
$
41,641
The accompanying notes are an integral part of these condensed consolidated financial statements.
4
Third Quarter 2025 Form 10-Q
Blackbaud, Inc. Condensed Consolidated Statements of Cash Flows (Unaudited)
(dollars in thousands)
Nine months ended September 30,
2025
2024
Cash flows from operating activities
Net income
$
78,281
$
46,840
Adjustments to reconcile net income to net cash provided by operating activities:
Depreciation and amortization
64,652
91,618
Provision for credit losses and sales returns
3,788
1,721
Stock-based compensation expense
71,079
76,430
Deferred taxes
(16,682)
(21,776)
Amortization of deferred financing costs and discount
1,940
1,786
Loss on disposition of businesses
—
1,561
Other non-cash adjustments
(5,180)
2,462
Changes in operating assets and liabilities, net of acquisition and disposal of businesses:
Accounts receivable
(2,422)
918
Prepaid expenses and other assets
(9,707)
(934)
Trade accounts payable
(3,233)
18,322
Accrued expenses and other liabilities
2,033
(16,089)
Deferred revenue
22,991
19,527
Net cash provided by operating activities
207,540
222,386
Cash flows from investing activities
Purchase of property and equipment
(4,805)
(7,235)
Capitalized software development costs
(40,268)
(42,882)
Cash used in disposition of business
(12,235)
(1,179)
Other investing activities
—
(5,029)
Net cash used in investing activities
(57,308)
(56,325)
Cash flows from financing activities
Proceeds from issuance of debt
307,000
1,303,400
Payments on debt
(316,922)
(1,080,192)
Debt issuance costs
—
(6,458)
Employee taxes paid for withheld shares upon equity award settlement
(39,669)
(55,950)
Change in due to customers
(323,467)
(263,732)
Change in customer funds receivable
(1,676)
(6,777)
Purchase of treasury stock, including excise tax payments
(133,338)
(325,408)
Net cash used in financing activities
(508,072)
(435,117)
Effect of exchange rate on cash, cash equivalents and restricted cash
5,768
3,527
Net decrease in cash, cash equivalents and restricted cash
(352,072)
(265,529)
Cash, cash equivalents and restricted cash, beginning of period
809,512
728,257
Cash, cash equivalents and restricted cash, end of period
$
457,440
$
462,728
The following table provides a reconciliation of cash and cash equivalents and restricted cash reported within the condensed consolidated balance sheets that sum to the total of the same such amounts shown above in the condensed consolidated statements of cash flows:
(dollars in thousands)
September 30, 2025
December 31, 2024
Cash and cash equivalents
$
38,255
$
67,628
Restricted cash
419,185
741,884
Total cash, cash equivalents and restricted cash in the statement of cash flows
$
457,440
$
809,512
The accompanying notes are an integral part of these condensed consolidated financial statements.
Third Quarter 2025 Form 10-Q
5
Blackbaud, Inc.
Condensed Consolidated Statements of Stockholders' Equity
(Unaudited)
(dollars in thousands)
Common stock
Treasury stock
Additional paid-in capital
Accumulated
other
comprehensive
loss
Accumulated deficit
Total stockholders' equity
Shares
Amount
Shares
Amount
Balance at December 31, 2024
70,943,373
$
71
(21,697,785)
$
(1,060,348)
$
1,291,442
$
(4,869)
$
(99,457)
$
126,839
Net income
—
—
—
—
—
—
4,323
4,323
Purchase of treasury shares under stock repurchase program, inclusive of excise tax
—
—
(1,513,022)
(100,425)
—
—
—
(100,425)
Vesting of restricted stock units
1,023,958
—
—
—
—
—
—
—
Shares withheld to satisfy tax withholdings
—
—
(532,179)
(37,948)
—
—
—
(37,948)
Stock-based compensation
—
—
—
—
28,120
—
—
28,120
Restricted stock grants
299,136
1
—
—
—
—
—
1
Restricted stock cancellations
(8,166)
—
—
—
—
—
—
—
Other comprehensive loss
—
—
—
—
—
(3,433)
—
(3,433)
Balance at March 31, 2025
72,258,301
$
72
(23,742,986)
$
(1,198,721)
$
1,319,562
$
(8,302)
$
(95,134)
$
17,477
Net income
—
—
—
—
—
—
26,466
26,466
Purchase of treasury shares under stock repurchase program, inclusive of excise tax
—
—
—
(19)
—
—
—
(19)
Vesting of restricted stock units
4,951
—
—
—
—
—
—
—
Shares withheld to satisfy tax withholdings
—
—
(13,939)
(868)
—
—
—
(868)
Stock-based compensation
—
—
—
—
27,672
—
—
27,672
Restricted stock grants
23,307
—
—
—
—
—
—
—
Restricted stock cancellations
(22,991)
—
—
—
—
—
—
—
Other comprehensive income
—
—
—
—
—
2,010
—
2,010
Balance at June 30, 2025
72,263,568
$
72
(23,756,925)
$
(1,199,608)
$
1,347,234
$
(6,292)
$
(68,668)
$
72,738
Net income
—
—
—
—
—
—
47,492
47,492
Purchase of treasury shares under stock repurchase program, inclusive of excise tax
—
—
(459,528)
(30,376)
—
—
—
(30,376)
Vesting of restricted stock units
14,234
—
—
—
—
—
—
—
Shares withheld to satisfy tax withholdings
—
—
(21,069)
(1,332)
—
—
—
(1,332)
Stock-based compensation
—
—
—
—
22,573
—
—
22,573
Restricted stock grants
35,790
—
—
—
—
—
—
—
Restricted stock cancellations
(18,098)
—
—
—
—
—
—
—
Other comprehensive loss
—
—
—
—
—
(2,906)
—
(2,906)
Balance at September 30, 2025
72,295,494
$
72
(24,237,522)
$
(1,231,316)
$
1,369,807
$
(9,198)
$
(21,176)
$
108,189
6
Third Quarter 2025 Form 10-Q
Blackbaud, Inc.
Condensed Consolidated Statements of Stockholders' Equity (continued)
(Unaudited)
(dollars in thousands)
Common stock
Treasury stock
Additional paid-in capital
Accumulated
other
comprehensive
loss
Retained earnings
Total stockholders' equity
Shares
Amount
Shares
Amount
Balance at December 31, 2023
69,188,304
$
69
(15,562,864)
$
(591,557)
$
1,203,012
$
(1,688)
$
200,067
$
809,903
Net income
—
—
—
—
—
—
7,306
7,306
Purchase of treasury shares under stock repurchase program, inclusive of excise tax
—
—
(2,954,211)
(211,412)
(52,244)
—
—
(263,656)
Vesting of restricted stock units
1,357,125
—
—
—
—
—
—
—
Shares withheld to satisfy tax withholdings
—
—
(720,189)
(52,723)
—
—
—
(52,723)
Stock-based compensation
—
—
—
—
30,286
—
—
30,286
Restricted stock grants
335,237
2
—
—
—
—
—
2
Restricted stock cancellations
(19,159)
—
—
—
—
—
—
—
Other comprehensive income
—
—
—
—
—
2,910
—
2,910
Balance at March 31, 2024
70,861,507
$
71
(19,237,264)
$
(855,692)
$
1,181,054
$
1,222
$
207,373
$
534,028
Net income
—
—
—
—
—
—
21,244
21,244
Vesting of restricted stock units
10,719
—
—
—
—
—
—
—
Shares withheld to satisfy tax withholdings
—
—
(22,273)
(1,760)
—
—
—
(1,760)
Stock-based compensation
—
—
—
—
25,019
—
—
25,019
Restricted stock grants
21,164
—
—
—
—
—
—
—
Restricted stock cancellations
(9,902)
—
—
—
—
—
—
—
Other comprehensive loss
—
—
—
—
—
(1,047)
—
(1,047)
Balance at June 30, 2024
70,883,488
$
71
(19,259,537)
$
(857,452)
$
1,206,073
$
175
$
228,617
$
577,484
Net income
—
—
—
—
—
—
18,290
18,290
Purchase of treasury shares under stock repurchase program, inclusive of excise tax
—
—
(807,774)
(63,597)
—
—
—
(63,597)
Vesting of restricted stock units
20,659
—
—
—
—
—
—
—
Shares withheld to satisfy tax withholdings
—
—
(19,411)
(1,467)
—
—
—
(1,467)
Stock-based compensation
—
—
—
—
21,125
—
—
21,125
Restricted stock grants
62,998
—
—
—
—
—
—
—
Restricted stock cancellations
(11,205)
—
—
—
—
—
—
—
Other comprehensive loss
—
—
—
—
—
(7,062)
—
(7,062)
Balance at September 30, 2024
70,955,940
$
71
$
(20,086,722)
$
(922,516)
$
1,227,198
$
(6,887)
$
246,907
$
544,773
The accompanying notes are an integral part of these condensed consolidated financial statements.
Notes to Condensed Consolidated Financial Statements
(Unaudited)
1. Organization
We are the leading software provider exclusively dedicated to powering social impact. Serving the nonprofit and education sectors, companies committed to social responsibility and individual change makers, our essential software is built to accelerate impact in fundraising, nonprofit financial management, digital giving, grantmaking, corporate social responsibility and education management. A remote-first company, we have operations in the United States, Australia, Canada, Costa Rica, India and the United Kingdom, supporting users in 100+ countries.
The accompanying condensed consolidated interim financial statements have been prepared pursuant to the rules and regulations of the United States Securities and Exchange Commission ("SEC") for interim financial reporting. These condensed consolidated statements are unaudited and, in the opinion of management, include all adjustments (consisting of normal recurring adjustments and accruals) necessary to state fairly the condensed consolidated balance sheets, condensed consolidated statements of comprehensive income, consolidated statements of cash flows and consolidated statements of stockholders’ equity, for the periods presented in accordance with accounting principles generally accepted in the United States ("U.S.") ("GAAP"). The condensed consolidated balance sheet at December 31, 2024 has been derived from the audited consolidated financial statements at that date. Operating results and cash flows for the three and/or nine months ended September 30, 2025 are not necessarily indicative of the results that may be expected for the fiscal year ending December 31, 2025, or any other future period. Certain information and footnote disclosures normally included in annual financial statements prepared in accordance with GAAP have been omitted in accordance with the rules and regulations for interim reporting of the SEC. These unaudited, condensed consolidated interim financial statements should be read in conjunction with the consolidated financial statements and notes thereto included in our Annual Report on Form 10-K for the year ended December 31, 2024, and other forms filed with the SEC from time to time.
Reclassifications
Our revenue from "recurring" and "one-time services and other" have been combined within "revenue" beginning in 2025 due to the immateriality of our one-time services and other revenue. In order to provide comparability between periods presented, our “recurring“ and “one-time services and other" revenue lines have been combined within “revenue" in the previously reported consolidated statements of comprehensive income to conform to the presentation of the current period. Similarly, "cost of recurring" and "cost of one-time services and other" have been combined within "cost of revenue" in the previously reported consolidated statements of comprehensive income to conform to the presentation of the current period.
Revision of prior period financial statements
During the three months ended September 30, 2025, we identified a prior period error related to the previously recorded valuation allowance, which resulted in an understatement of the deferred tax liability by $15.5 million as of December 31, 2024, March 31, 2025 and June 30, 2025, and a corresponding overstatement of the income tax benefit and an understatement of the net loss for the year ended December 31, 2024. There was no impact to our income tax provision for the first and second quarters of 2025. We evaluated the materiality of the error and determined that the impact was not material to our previously issued consolidated financial statements for the prior periods impacted but that correcting the error in the current period would have been material to our consolidated results of operations for the three and nine months ended September 30, 2025, and would be material to our forecasted consolidated results of operations for the year ended December 31, 2025. Accordingly, we have revised our prior period financial statements and applicable notes to correct the valuation allowance error as of and for the year ended December 31, 2024, and as of and for the three and six months ended June 30, 2025. Additionally, we corrected other unrelated immaterial errors and related notes as of and for the years ended December 31, 2023 and December 31, 2024, as of and for the three months ended March 31, 2024, as of and for the three and six months ended June 30, 2024, as of and for the three and nine months ended September 30, 2024, as of and for the three months ended March 31, 2025, and as of and for the three and six months ended June 30, 2025. See Note 13 for additional information and a summarized quantification of the revised financial statements. Revisions to our previously
Notes to Condensed Consolidated Financial Statements
(Unaudited)
reported disclosures have been reflected in Note 3, Earnings Per Share, Note 5, Consolidated Financial Statement Details, and Note 12, Revenue Recognition.
Basis of consolidation
The unaudited, condensed consolidated financial statements include the accounts of Blackbaud, Inc. and its wholly owned subsidiaries. All intercompany balances and transactions have been eliminated in consolidation.
Use of estimates
The preparation of financial statements in conformity with GAAP requires management to make estimates and assumptions that affect the reported amounts of assets and liabilities and disclosure of contingent assets and liabilities at the date of the financial statements, as well as the reported amounts of revenues and expenses during the reporting periods. On an ongoing basis, we reconsider and evaluate our estimates and assumptions, including those that impact revenue recognition, long-lived and intangible assets, income taxes, business combinations, stock-based compensation, capitalization of software development costs, our allowances for credit losses and sales returns, costs of obtaining contracts, valuation of derivative instruments, loss contingencies and insurance recoveries, among others. Changes in the facts or circumstances underlying these estimates could result in material changes and actual results could materially differ from these estimates.
Recently issued accounting pronouncements
There are no recently issued accounting pronouncements that we expect to have a material impact on our consolidated financial statements when adopted in the future.
Summary of significant accounting policies
There have been no material changes to our significant accounting policies described in our Annual Report on Form 10-K for the year ended December 31, 2024, filed with the SEC on February 21, 2025.
Notes to Condensed Consolidated Financial Statements
(Unaudited)
3. Earnings Per Share
We compute basic earnings per share by dividing net income available to common stockholders by the weighted average number of common shares outstanding during the period. Diluted earnings per share is computed by dividing net income by the weighted average number of common shares and dilutive potential common shares outstanding during the period. Diluted earnings per share reflects the assumed exercise, settlement and vesting of all dilutive securities using the “treasury stock method,” except when the effect is anti-dilutive. Potentially dilutive securities consist of shares issuable upon vesting of restricted stock awards and units.
The following table sets forth the computation of basic and diluted earnings per share:
Three months ended
September 30,
Nine months ended
September 30,
(dollars in thousands, except per share amounts)
2025
2024
2025
2024
Numerator:
Net income
$
47,492
$
18,290
$
78,281
$
46,840
Denominator:
Weighted average common shares
47,680,002
50,409,292
47,961,631
51,067,255
Add effect of dilutive securities:
Restricted stock and units
818,283
1,223,277
672,396
1,039,892
Weighted average common shares assuming dilution
48,498,285
51,632,569
48,634,027
52,107,147
Earnings per share
Basic
$
1.00
$
0.36
$
1.63
$
0.92
Diluted
$
0.98
$
0.35
$
1.61
$
0.90
Anti-dilutive shares excluded from calculations of diluted earnings per share
Notes to Condensed Consolidated Financial Statements
(Unaudited)
4. Fair Value Measurements
We use a three-tier fair value hierarchy to measure fair value. This hierarchy prioritizes the inputs into three broad levels as follows:
•Level 1 - Quoted prices for identical assets or liabilities in active markets;
•Level 2 - Quoted prices for similar assets and liabilities in active markets, quoted prices for identical or similar assets in markets that are not active, and model-derived valuations in which all significant inputs and significant value drivers are observable in active markets; and
•Level 3 - Valuations derived from valuation techniques in which one or more significant inputs are unobservable.
Recurring fair value measurements
Financial assets and liabilities that are measured at fair value on a recurring basis consisted of the following, as of the dates indicated below:
Fair value measurement using
(dollars in thousands)
Quoted Prices in Active Markets for Identical Assets and Liabilities (Level 1)
Significant Other Observable Inputs (Level 2)
Significant Unobservable Inputs (Level 3)
Total
Fair value as of September 30, 2025
Financial assets:
Interest rate swaps
$
—
$
882
$
—
$
882
Foreign currency forward contracts
—
44
—
44
Total financial assets
$
—
$
926
$
—
$
926
Fair value as of September 30, 2025
Financial liabilities:
Interest rate swaps
$
—
$
3,112
$
—
$
3,112
Foreign currency forward contracts
—
174
—
174
Total financial liabilities
$
—
$
3,286
$
—
$
3,286
Fair value as of December 31, 2024
Financial assets:
Interest rate swaps
$
—
$
9,262
$
—
$
9,262
Foreign currency forward contracts
—
1,288
—
1,288
Total financial assets
$
—
$
10,550
$
—
$
10,550
Our derivative instruments within the scope of Accounting Standards Codification ("ASC") 815, Derivatives and Hedging, are required to be recorded at fair value. Our derivative instruments that are recorded at fair value include interest rate swaps and foreign currency forward contracts. See Note 7 to these unaudited, condensed consolidated financial statements for additional information about our derivative instruments.
The fair value of our interest rate swaps and foreign currency forward contracts are based on model-driven valuations using Secured Overnight Financing Rate ("SOFR") rates and foreign currency forward rates, respectively, which are observable at commonly quoted intervals. Accordingly, our interest rate swaps and foreign currency forward contracts are classified within Level 2 of the fair value hierarchy.
Notes to Condensed Consolidated Financial Statements
(Unaudited)
We believe the carrying amounts of our cash and cash equivalents, restricted cash, accounts receivable, trade accounts payable, accrued expenses and other current liabilities and due to customers approximate their fair values at September 30, 2025 and December 31, 2024, due to the immediate or short-term maturity of these instruments.
We believe the carrying amount of our debt approximates its fair value at September 30, 2025 and December 31, 2024, as the debt bears interest rates that approximate market value. As SOFR rates are observable at commonly quoted intervals, our debt under the 2024 Credit Facilities (as defined below) is classified within Level 2 of the fair value hierarchy. The fair value of our fixed rate debt does not exceed the carrying amount.
We did not transfer any assets or liabilities among the levels within the fair value hierarchy during the nine months ended September 30, 2025.
Non-recurring fair value measurements
Assets and liabilities that are measured at fair value on a non-recurring basis include long-lived assets, intangible assets, goodwill and operating lease right-of-use ("ROU") assets. These assets are recognized at fair value during the period in which an acquisition is completed or at lease commencement, from updated estimates and assumptions during the measurement period, or when they are considered to be impaired. These non-recurring fair value measurements, primarily for long-lived assets, intangible assets acquired and operating lease ROU assets, are based on Level 3 unobservable inputs. In the event of an impairment, we determine the fair value of these assets other than goodwill using a discounted cash flow approach, which contains significant unobservable inputs and, therefore, is considered a Level 3 fair value measurement. The unobservable inputs in the analysis generally include future cash flow projections and a discount rate. For goodwill impairment testing, we estimate fair value using market-based methods including the use of market capitalization and consideration of a control premium.
There were no significant non-recurring fair value adjustments to our long-lived assets, intangible assets, goodwill or operating lease ROU assets during the nine months ended September 30, 2025.
Notes to Condensed Consolidated Financial Statements
(Unaudited)
Prepaid expenses and other assets
(dollars in thousands)
September 30, 2025
December 31, 2024
Costs of obtaining contracts(1)(2)
$
55,325
$
57,911
Prepaid software maintenance and subscriptions(3)
30,723
36,277
Taxes, prepaid and receivable
15,303
4,257
Implementation costs for cloud computing arrangements, net(4)(5)
11,098
10,450
Unbilled accounts receivable
8,824
7,352
Investment in equity securities(6)
4,943
4,943
Prepaid insurance
3,403
3,027
Derivative instruments
926
10,550
Other assets
16,209
14,026
Total prepaid expenses and other assets
146,754
148,793
Less: Long-term portion
51,916
67,221
Prepaid expenses and other current assets
$
94,838
$
81,572
(1)Amortization expense from costs of obtaining contracts was $5.1 million and $15.2 million for the three and nine months ended September 30, 2025, respectively, and $5.1 million and $14.8 million for the three and nine months ended September 30, 2024, respectively.
(2)The current portion of costs of obtaining contracts as of September 30, 2025 and December 31, 2024 was $18.3 million and $18.4 million, respectively.
(3)The current portion of prepaid software maintenance and subscriptions as of September 30, 2025 and December 31, 2024 was $29.8 million and $34.0 million, respectively.
(4)These costs primarily relate to the multi-year implementations of our global enterprise resource planning, customer relationship management systems and other cloud-based systems.
(5)Amortization expense from capitalized cloud computing implementation costs was insignificant for the three months ended September 30, 2025 and 2024, and $2.5 million and $2.1 millionfor the nine months ended September 30, 2025 and 2024, respectively. Accumulated amortization for these costs was $13.1 million and $10.6 million as of September 30, 2025 and December 31, 2024, respectively.
(6)Represents a strategic investment that did not result in Blackbaud having significant influence over the investee.
Accrued expenses and other liabilities
(dollars in thousands)
September 30, 2025
December 31, 2024
Taxes payable
$
21,681
$
16,295
Customer credit balances
9,629
9,269
Unrecognized tax benefit
5,120
4,285
Derivative instruments
3,286
—
Accrued health care costs
3,149
3,151
Accrued vacation costs
2,654
2,060
Accrued commissions and salaries
2,291
4,012
Operating lease liabilities, current portion
1,587
4,489
Accrued transaction-based costs related to payments services
608
3,903
Accrued legal costs(1)
539
2,504
Stock-based compensation liability
3
7,292
Accrued costs to sell EVERFI(2)
—
13,985
Other liabilities
11,319
10,035
Total accrued expenses and other liabilities
61,866
81,280
Less: Long-term portion
8,816
4,796
Accrued expenses and other current liabilities
$
53,050
$
76,484
(1)All accrued legal costs are classified as current. See Note 8 to these unaudited, condensed consolidated financial statements for additional information about our loss contingency accruals and other legal expenses.
(2)As previously disclosed, on December 31, 2024, we disposed of our EVERFI business, formerly a wholly-owned subsidiary of Blackbaud, Inc, to a private investment firm that is unaffiliated with Blackbaud for nominal cash consideration. The results of operations of EVERFI are not included in our consolidated results of operations subsequent to the date of disposition.
Notes to Condensed Consolidated Financial Statements
(Unaudited)
Other income, net
Three months ended
September 30,
Nine months ended
September 30,
(dollars in thousands)
2025
2024
2025
2024
Interest income
$
2,371
$
3,118
$
5,994
$
7,981
Currency revaluation gains (losses)
264
(1,315)
(2,635)
(1,412)
Other income, net
610
1,194
3,109
3,085
Other income, net
$
3,245
$
2,997
$
6,468
$
9,654
6. Debt
The following table summarizes our debt balances and the related weighted average effective interest rates, which includes the effect of interest rate swap agreements.
Debt balance at
Weighted average effective interest rate at
(dollars in thousands)
September 30, 2025
December 31, 2024
September 30, 2025
December 31, 2024
Credit facility:
Revolving credit loans
$
236,300
$
229,900
6.05
%
6.37
%
Term loans
775,000
790,000
5.49
%
5.59
%
Real estate loans
53,814
55,135
5.23
%
5.23
%
Other debt
691
2,783
9.13
%
8.77
%
Total debt
1,065,805
1,077,818
5.61
%
5.75
%
Less: Unamortized discount and debt issuance costs
1,187
2,833
Less: Debt, current portion
22,613
23,875
6.00
%
6.21
%
Debt, net of current portion
$
1,042,005
$
1,051,110
5.60
%
5.73
%
2024 Credit Facilities
In April 2024, we entered into a five-year $1.5 billion senior credit facility (the "2024 Credit Facilities"). At September 30, 2025, we were in compliance with our debt covenants under the 2024 Credit Facilities.
Real estate loans
In August 2020, we completed the purchase of our global headquarters facility. As part of the purchase price, we assumed the seller’s obligations under two senior secured notes with a then-aggregate outstanding principal amount of $61.1 million (collectively, the “Real Estate Loans”). The Real Estate Loans require periodic principal payments and the balance of the Real Estate Loans are due upon maturity in April 2038. At September 30, 2025, we were in compliance with our debt covenants under the Real Estate Loans.
Other debt
From time to time, we enter into third-party financing agreements for purchases of software and related services for our internal use. Generally, the agreements are non-interest-bearing notes requiring annual payments. Interest associated with the notes is imputed at the rate we would incur for amounts borrowed under our then-existing credit facility at the inception of the notes.
Notes to Condensed Consolidated Financial Statements
(Unaudited)
The following table summarizes our currently effective supplier financing agreements as of September 30, 2025:
(dollars in thousands)
Term in Months
Number of Annual Payments
First Annual Payment Due
Original Loan Value
Effective dates of agreements (1):
December 2022
39
3
January 2023
$
1,710
January 2023
36
3
April 2023
$
2,491
April 2024
36
3
May 2024
$
2,073
(1)Represent noncash investing and financing transactions during the periods indicated as we purchased software and services by assuming directly related liabilities.
The changes in supplier financing obligations during the nine months ended September 30, 2025, consisted of the following:
(dollars in thousands)
Total
Balance at December 31, 2024
$
2,783
Additions
—
Payments
(2,092)
Balance at September 30, 2025
$
691
7. Derivative Instruments
We generally use derivative instruments to manage our interest rate and foreign currency exchange risk. We currently have derivatives classified as cash flow hedges and net investment hedges. We do not enter into any derivatives for trading or speculative purposes.
All of our derivative instruments are governed by International Swap Dealers Association, Inc. master agreements with our counterparties. As of September 30, 2025 and December 31, 2024, we have presented the fair value of our derivative instruments at the gross amounts in the unaudited, condensed consolidated balance sheets as the gross fair values of our derivative instruments equaled their net fair values.
Cash flow hedges
We have entered into interest rate swap agreements, which effectively convert portions of our variable rate debt under the 2024 Credit Facilities to a fixed rate for the term of the swap agreements. We designated each of the interest rate swaps as cash flow hedges at the inception of the contracts. Our entry into the 2024 Credit Agreement in April 2024 did not affect our interest rate swap agreements, including their designation as cash flow hedges, as the 2024 Credit Agreement has substantially the same critical terms as the 2020 Credit Agreement. As of September 30, 2025 and December 31, 2024, the aggregate notional values of the interest rate swaps were $700.0 million. All of the contracts have maturities on or before October 2028.
We have entered into foreign currency forward contracts to hedge revenues denominated in the Canadian Dollar ("CAD") against changes in the exchange rate with the United States Dollar ("USD"). We designated each of these foreign currency forward contracts as cash flow hedges at the inception of the contracts. As of September 30, 2025 and December 31, 2024, the aggregate notional values of the foreign currency forward contracts designated as cash flow hedges that we held to buy USD in exchange for Canadian Dollars were $34.8 million CAD and $32.8 million CAD, respectively. All of the contracts have maturities of 12 months or less.
Notes to Condensed Consolidated Financial Statements
(Unaudited)
Net investment hedges
We have entered into foreign currency forward contracts to hedge a portion of the foreign currency exposure that arises on translation of our investments denominated in British Pounds ("GBP") into USD. We designated each of these foreign currency forward contracts as net investment hedges at the inception of the contracts. As of September 30, 2025 and December 31, 2024, the aggregate notional values of the foreign currency forward contracts designated as net investment hedges to reduce the volatility of the U.S. dollar value of a portion of our GBP-denominated investments was £12.2 million and £12.9 million, respectively.
The fair values of our derivative instruments were as follows as of:
Asset derivatives
Liability derivatives
(dollars in thousands)
Balance sheet location
September 30, 2025
December 31, 2024
Balance sheet location
September 30, 2025
December 31, 2024
Derivative instruments designated as hedging instruments:
Interest rate swaps, current portion
Prepaid expenses and other current assets
$
431
$
—
Accrued expenses and other current liabilities
$
—
$
—
Foreign currency forward contracts, current portion
Prepaid expenses
and other current assets
$
44
$
1,288
Accrued expenses and other current liabilities
$
174
$
—
Interest rate swaps, long-term
Other assets
451
9,262
Other liabilities
3,112
—
Total derivative instruments designated as hedging instruments
$
926
$
10,550
$
3,286
$
—
The effects of derivative instruments in cash flow and net investment hedging relationships were as follows:
Notes to Condensed Consolidated Financial Statements
(Unaudited)
Our policy requires that derivatives used for hedging purposes be designated and effective as a hedge of the identified risk exposure at the inception of the contract. Accumulated other comprehensive income (loss) includes unrealized gains or losses from the change in fair value measurement of our derivative instruments each reporting period and the related income tax expense or benefit. Excluding net investment hedges, changes in the fair value measurements of the derivative instruments and the related income tax expense or benefit are reflected as adjustments to accumulated other comprehensive income (loss) until the actual hedged expense is incurred or until the hedge is terminated at which point the unrealized gain (loss) and related tax effects are reclassified from accumulated other comprehensive income (loss) to current earnings. For net investment hedges, changes in the fair value measurements of the derivative instruments and the related income tax expense or benefit are reflected as adjustments to translation adjustment, a component of accumulated other comprehensive income (loss), and recognized in earnings only when the hedged GBP investment is liquidated. The estimated accumulated other comprehensive income as of September 30, 2025 that is expected to be reclassified into earnings within the next twelve months is insignificant. There were no ineffective portions of our interest rate swap or foreign currency forward derivatives during the nine months ended September 30, 2025 and 2024. See Note 10 to these unaudited, condensed consolidated financial statements for a summary of the changes in accumulated other comprehensive income (loss) by component. We classify cash flows related to derivative instruments as operating activities in the unaudited, condensed consolidated statements of cash flows.
8. Commitments and Contingencies
Leases
We have operating leases for corporate offices and subleased offices. As of September 30, 2025, we did not have any operating leases that had not yet commenced.
Release from Washington, DC lease
In February 2025, we made a one-time cash release payment of $28.0 million to the lessor in connection with a release from our lease for office space in Washington, DC (which was acquired as part of our acquisition of EVERFI in December 2021). Due to our remote-first workforce strategy, we had not used the office space since February 2023 and had subleased a portion of the space. During the nine months ended September 30, 2025, we recorded a loss on lease termination of $24.3 million in general and administrative expense.
The following table summarizes the components of our lease expense:
Three months ended
September 30,
Nine months ended
September 30,
(dollars in thousands)
2025
2024
2025
2024
Operating lease cost(1)
$
450
$
1,417
$
1,390
$
5,028
Variable lease cost
218
271
570
883
Sublease income
(244)
(914)
(1,413)
(2,518)
Net lease cost
$
424
$
774
$
547
$
3,393
(1)Includes short-term lease costs, which were immaterial.
Notes to Condensed Consolidated Financial Statements
(Unaudited)
Maturities of our operating lease liabilities as of September 30, 2025 were as follows:
Years ending December 31, (dollars in thousands)
Operating leases
2025 - remaining
$
517
2026
1,928
2027
1,898
2028
1,729
2029
1,019
Thereafter
509
Total lease payments
7,600
Less: Amount representing interest
(983)
Present value of future payments
$
6,617
Other commitments
The term loans under the 2024 Credit Facilities require periodic principal payments. The balance of the term loans and any amounts drawn on the revolving credit loans are due upon maturity of the 2024 Credit Facilities in April 2029. The Real Estate Loans also require periodic principal payments and the balance of the Real Estate Loans are due upon maturity in April 2038.
We have contractual obligations for third-party technology used in our solutions and for other services we purchase as part of our normal operations. In certain cases, these arrangements require a minimum annual purchase commitment by us. As of September 30, 2025, the remaining aggregate minimum purchase commitment under these arrangements was approximately $157.8 million through 2030.
Solution and service indemnifications
In the ordinary course of business, we provide certain indemnifications of varying scope to customers against claims of intellectual property infringement made by third parties arising from the use of our solutions or services. We have not identified any losses that might be covered by these indemnifications.
Legal proceedings
We are subject to legal proceedings and claims that arise in the ordinary course of business, as well as certain other non-ordinary course proceedings, claims and investigations, as described below. We make a provision for a loss contingency when it is both probable that a material liability has been incurred and the amount of the loss can be reasonably estimated. If only a range of estimated losses can be determined, we accrue an amount within the range that, in our judgment, reflects the most likely outcome; if none of the estimates within that range is a better estimate than any other amount, we accrue the low end of the range. For proceedings in which an unfavorable outcome is reasonably possible but not probable and an estimate of the loss or range of losses arising from the proceeding can be made, we disclose such an estimate, if material. If such a loss or range of losses is not reasonably estimable, we disclose that fact. We review any such loss contingency provisions at least quarterly and adjust them to reflect the impacts of negotiations, settlements, rulings, advice of legal counsel and other information and events pertaining to a particular case. We recognize insurance recoveries, if any, when they are probable of receipt. All associated costs due to third-party service providers and consultants, including legal fees, are expensed as incurred.
Legal proceedings are inherently unpredictable. However, we believe that we have valid defenses with respect to the legal matters pending or threatened against us and intend to defend ourselves vigorously against all claims asserted. It is possible that our consolidated financial position, results of operations or cash flows could be materially negatively affected in any particular period by an unfavorable resolution of one or more of such legal proceedings.
Notes to Condensed Consolidated Financial Statements
(Unaudited)
Security incident
As previously disclosed, we are subject to risks and uncertainties as a result of a ransomware attack against us in May 2020 in which a cybercriminal removed a copy of a subset of data from our self-hosted environment (the "Security Incident"). For the three months ended September 30, 2025, we incurred insignificant net pre-tax expenses related to the Security Incident for ongoing legal fees. For the nine months ended September 30, 2025, we incurred net pre-tax expenses of $2.8 million related to the Security Incident for ongoing legal fees and recorded accruals for loss contingencies of $1.1 million. During the nine months ended September 30, 2025, we had net cash outlays of $4.3 million related to the Security Incident for ongoing legal fees and $1.8 million paid during the third quarter of 2025 related to previously recorded accruals for loss contingencies related to the Security Incident. As of September 30, 2025, we do not have any recorded liabilities for loss contingencies related to the Security Incident.
In the three months ended September 30, 2025, we paid an insignificant settlement amount to the plaintiffs in the previously disclosed multi-district litigation filed in the United States District Court of South Carolina. On September 22, 2025, that court issued an order definitively closing that case. As a result, all customer constituent class actions related to the Security Incident are now resolved and closed. In addition, as previously reported, insurance companies representing various customers’ interests through subrogation claims contacted us, and certain insurance companies filed subrogation claims in court. A subset of insurance carriers has appealed a dismissal of their claims to the Delaware Supreme Court. These appeals are the only customer claims currently pending. For more information about the completed government investigations and related actions, see Note 11 to our audited consolidated financial statements contained in our Annual Report on Form 10-K filed with the SEC on February 21, 2025 and Note 8 to our unaudited, condensed consolidated financial statements contained in our Quarterly Report on Form 10-Q filed with the SEC on April 30, 2025.
9. Income Taxes
Our income tax (benefit) provision and effective income tax rates, including the effects of period-specific events, were:
Three months ended
September 30,
Nine months ended
September 30,
(dollars in thousands)
2025
2024
2025
2024
Income tax (benefit) provision
$
(6,448)
$
11,714
$
7,669
$
18,568
Effective income tax rate
(15.7)
%
39.0
%
8.9
%
28.4
%
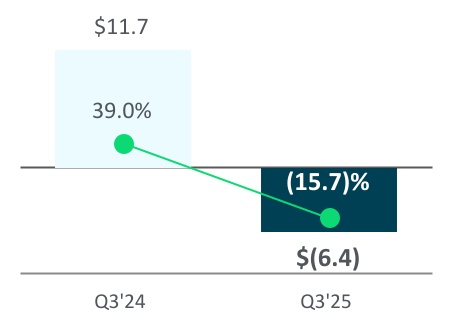
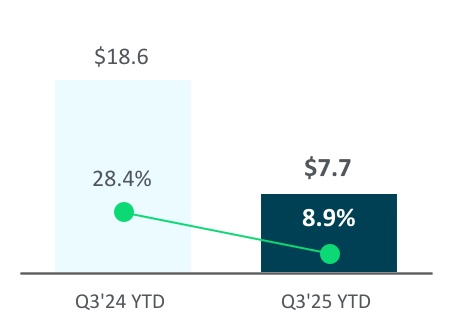
The decreases in our effective income tax rate for the three and nine months ended September 30, 2025 when compared to the same periods in 2024 were primarily due to the favorable impact of a valuation allowance reduction recorded against our net U.S. deferred tax assets.
On July 4, 2025, the One Big Beautiful Bill Act (“OBBBA”) was signed into law. The legislation makes permanent certain provisions of the 2017 Tax Cuts and Jobs Act, including 100% bonus depreciation and restoring immediate expensing of research and development expenditures for activities performed within the United States. Under ASC 740, we recognized the impact of the first phase of the law in the third quarter of 2025. As a result, we recorded a reduction of our estimated annual effective tax rate from 31.4% reported in the second quarter of 2025 to 8.9%, primarily due to the permanent extension of research and development expensing. The impacts of OBBBA on our deferred tax assets resulted in a net downward adjustment of the valuation allowance. Based on our analysis, no further material impact is expected to the tax provision for fiscal year 2025. We currently expect a material impact from future phases in fiscal years 2026 and 2027, but not beyond.
Notes to Condensed Consolidated Financial Statements
(Unaudited)
10. Stockholders' Equity
Stock repurchase program
Under our stock repurchase program, we are authorized to repurchase shares from time to time in accordance with applicable laws both on the open market, including under trading plans established pursuant to Rule 10b5-1 under the Securities Exchange Act of 1934, as amended, and in privately negotiated transactions. The timing and amount of repurchases depends on several factors, including market and business conditions, the trading price of our common stock and the nature of other investment opportunities. The repurchase program does not have an expiration date and may be limited, suspended or discontinued at any time without prior notice. Under the 2024 Credit Agreement, we have restrictions on our ability to repurchase shares of our common stock, which are summarized on page 47 in this report.
We account for purchases of treasury stock under the cost method. On July 16, 2024, our Board of Directors reauthorized, expanded and replenished our stock repurchase program by expanding the total capacity under the program to $800.0 million available for repurchases.
During the three months ended September 30, 2025, we repurchased 459,528 shares for $30.1 million. During the nine months ended September 30, 2025, we repurchased an aggregate of 1,972,550 shares for $130.2 million. The remaining amount available to purchase stock under the approved stock repurchase program was $514.4 million as of September 30, 2025.
Changes in accumulated other comprehensive (loss) income by component
The changes in accumulated other comprehensive (loss) income by component, consisted of the following:
Three months ended
September 30,
Nine months ended
September 30,
(in thousands)
2025
2024
2025
2024
Accumulated other comprehensive (loss) income, beginning of period
$
(6,292)
$
175
$
(4,869)
$
(1,688)
By component:
Gains and losses on cash flow hedges:
Accumulated other comprehensive (loss) income balance, beginning of period
$
(4,207)
$
10,867
$
7,799
$
8,158
Other comprehensive income (loss) before reclassifications, net of tax effects of $—, $3,315, $2,763 and $(625)
1,113
(9,294)
(5,259)
1,558
Amounts reclassified from accumulated other comprehensive income (loss)
(1,735)
(5,740)
(4,606)
(16,832)
Tax expense (benefit) included in provision for income taxes
—
1,509
(2,763)
4,458
Total amounts reclassified from accumulated other comprehensive income (loss)
(1,735)
(4,231)
(7,369)
(12,374)
Net current-period other comprehensive loss
(622)
(13,525)
(12,628)
(10,816)
Accumulated other comprehensive loss balance, end of period
$
(4,829)
$
(2,658)
$
(4,829)
$
(2,658)
Foreign currency translation adjustment:
Accumulated other comprehensive loss balance, beginning of period
$
(2,085)
$
(10,692)
$
(12,668)
$
(9,846)
Translation adjustment
(2,284)
6,463
8,299
5,617
Accumulated other comprehensive loss balance, end of period
(4,369)
(4,229)
(4,369)
(4,229)
Accumulated other comprehensive loss, end of period
Notes to Condensed Consolidated Financial Statements
(Unaudited)
11. Segment Information
We have one operating segment and one reportable segment. Our chief operating decision maker is our chief executive officer ("CEO"), who reviews financial information presented on a consolidated basis, accompanied by disaggregated information about our revenue, for purposes of making decisions about assessing financial performance and allocating resources. Our CEO considers costs of revenue, sales, marketing and customer success, research and development, and general and administrative expense categories on our consolidated statements of comprehensive income as significant. Our CEO uses consolidated operating margin and net income as the primary measures of profit or loss. These financial metrics are used by our CEO to make key operating decisions, such as the allocation of budget between costs of revenues and our different operating expense categories.
Our other segment items include amortization, interest expense, other income, net, and income tax (benefit) provision on our consolidated statements of comprehensive income.
12. Revenue Recognition
Transaction price allocated to the remaining performance obligations
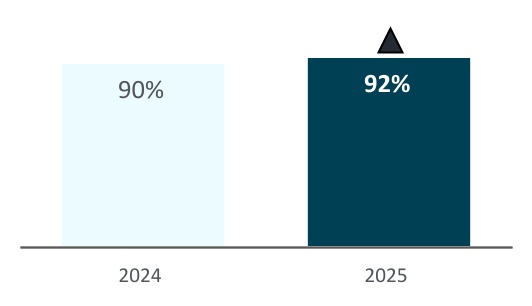
As of September 30, 2025, approximately $1.3 billion of revenue under contract is expected to be recognized from remaining performance obligations. We expect to recognize revenue on approximately 50% of these remaining performance obligations over the next 12 months, with the remainder recognized thereafter.
We applied the practical expedient in ASC 606-10-50-14 and have excluded the value of unsatisfied performance obligations for which we recognize revenue at the amount to which we have the right to invoice for services performed (transactional revenue).
Contract balances
Our closing balances of deferred revenue were as follows:
(in thousands)
September 30, 2025
December 31, 2024
Total deferred revenue
$
384,911
$
360,561
The increase in deferred revenue during the nine months ended September 30, 2025 was primarily due to a seasonal increase in customer contract billings. Historically, due to the timing of customer budget cycles, we have an increase in billings and customer contract renewals at or near the beginning of our third quarter. Generally, our lowest balance of deferred revenue during the year is at the end of our first quarter. The amount of revenue recognized during the nine months ended September 30, 2025 that was included in the deferred revenue balance at the beginning of the period was approximately $324 million. The amount of revenue recognized during the nine months ended September 30, 2025 from performance obligations satisfied in prior periods was insignificant.
Disaggregation of revenue
We sell our cloud solutions and related services in three primary geographical markets: to customers in the United States, to customers in the United Kingdom and to customers located in other countries. The following table presents our revenue by geographic area based on the location of our customers:
Three months ended
September 30,
Nine months ended
September 30,
(dollars in thousands)
2025
2024(1)
2025
2024(1)
United States
$
237,678
$
243,523
$
697,819
$
722,840
United Kingdom
27,494
27,143
87,324
83,252
Other countries
15,971
15,932
47,966
46,419
Total revenue
$
281,143
$
286,598
$
833,109
$
852,511
(1)We have revised certain amounts for the three and nine months ended September 30, 2024. See Note 2 and Note 13 for additional information.
Notes to Condensed Consolidated Financial Statements
(Unaudited)
13. Revision of Prior Period Financial Statements
During the three months ended September 30, 2025, we identified a prior period error related to the previously recorded valuation allowance. This error resulted in an understatement of the deferred tax liability by $15.5 million as of December 31, 2024, March 31, 2025 and June 30, 2025, and a corresponding overstatement of the income tax benefit and an understatement of the net loss for the year ended December 31, 2024. There was no impact to our income tax provision for the first and second quarters of 2025.
In evaluating whether our previously issued consolidated financial statements were materially misstated, we considered the guidance in Accounting Standard Codification (ASC) Topic 250, Accounting Changes and Error Corrections, including ASC Topic 250-10-S99-1 (SAB Topic 1.M), Assessing Materiality, and ASC Topic 250-10-S99-2 (SAB Topic 1.N), Considering the Effects of Prior Year Misstatements when Quantifying Misstatements in Current Year Financial Statements. We concluded that the valuation allowance error was not material to any of the prior reporting periods impacted and, therefore, amendments of previously filed reports were not required. However, the effect of correcting the valuation allowance error in the current period would have been material to the consolidated financial statements for the three and nine months ended September 30, 2025, and would be material to the forecasted consolidated results of operations for the year ending December 31, 2025. Accordingly, the correction of the valuation allowance error, along with other unrelated immaterial prior period errors, has been reflected as a revision to the applicable prior periods in the financial information presented herein and will be reflected in future filings that include such periods.
In accordance with Rule 10D-1(b) under the Securities Exchange Act of 1934, we performed a recovery analysis of incentive-based compensation received by our executive officers during the applicable recovery period. Based on this analysis, no clawback of compensation was required by applicable SEC rules.
We have revised certain prior period financial statements to correct for an accounting error related to the valuation allowance as well as other unrelated immaterial errors. See Note 2, Basis of Presentation, for further information. A summary of revisions to our previously reported financial statements is presented below.
ITEM 2. MANAGEMENT'S DISCUSSION AND ANALYSIS OF FINANCIAL CONDITION AND RESULTS OF OPERATIONS
The following discussion and analysis of our financial condition and results of operations should be read in conjunction with our unaudited, condensed consolidated financial statements and related notes included elsewhere in this Quarterly Report on Form 10-Q. The following discussion and analysis presents financial information denominated in millions of dollars which can lead to differences from rounding when compared to similar information contained in the unaudited, condensed consolidated financial statements and related notes which are primarily denominated in thousands of dollars.
Executive Summary
We are the leading software provider exclusively dedicated to powering social impact. Serving the nonprofit and education sectors, companies committed to social responsibility and individual change makers, our essential software is built to accelerate impact in fundraising, nonprofit financial management, digital giving, grantmaking, corporate social responsibility and education management. A remote-first company, we have operations in the United States, Australia, Canada, Costa Rica, India and the United Kingdom, supporting users in 100+ countries.
Our revenue is primarily generated from the following sources: (i) charging for the use of our software solutions in cloud and hosted environments; and (ii) providing payment and transaction services.
Business Update
Our business has proven its resilience during challenging times. The social impact market has been a consistent grower for many decades, through recessions, business upturns and downturns, and even through the COVID-19 global pandemic. We understand there are concerns about federal grant funding in the U.S. and how it potentially impacts our customers. But similar to COVID-19, we believe this uncertainty only makes our software more critical to our customer’s operations, enabling them to improve fundraising outcomes and to undertake or sharpen their own cost-management initiatives. To be clear, our solutions are not in the funds flow from federal agencies, but are used for fundraising from individual donors, which is even more critical now.
Blackbaud has undertaken a number of operational initiatives that we believe set us up to perform well, even in a challenging market.
•In 2023, we began transitioning our contractual revenue contracts from primarily 1-year to primarily 3-year renewal terms. This modernized approach to contract terms provides increased visibility and consistency for two-thirds of our revenue base and provides better predictability for our customers.
•Over the past several years, we have transitioned the majority of our products and customers to leading public cloud service providers, while shutting down many of our private data centers, with only two of our own data centers remaining.
•We continue to innovate through the increasing use of AI to not only empower our customers but also improve our own internal productivity.
•We have right-sized our operations by rationalizing office leases and renegotiating a number of our significant vendor contracts.
•We are currently expanding our operations in India to gain greater access to talent, while also benefiting from the lower cost of the jurisdiction. In 2024, we began hiring employees in India, including management, to support this expansion.
Despite a strong focus on reducing expenses, we continue to invest aggressively in innovation and our extensive developer network to help our customers raise more money while enhancing and streamlining their operations. Our innovation and end to end workflows continue to be a competitive differentiator and drive sales. We are supporting this initiative through enhancements in sales and marketing programs and we continue to identify, experiment, and scale a range of successful solutions across marketing, customer success, and engineering to be an active innovator through applied AI.
Three specific areas that our management team continues to focus on: 1) acquiring new logos; 2) driving innovation and, as such, strengthening our customer relationships through additional solutions and renewals; and 3) driving higher profitability through operational discipline and efficiencies.
At bbcon®, our annual user conference, we launched our new agentic AI suite, “Agents for Good™, to help social impact organizations expand their teams with virtual team members and achieve more, at scale. This suite of agents from Blackbaud is intended to turn AI into active teammates that autonomously execute complex workflows and free up teams across fundraising, finance and corporate impact.
As a remote-flexible workforce company, we continuously evaluate opportunities to shift various business units, functions or roles to lower-cost jurisdictions, including internationally, when we determine that it would reduce costs without negatively impacting the quality of our products and services. See discussion about our operations in India above.
In February 2025, we announced our intention to repurchase between 3% and 5% of our outstanding common stock as of December 31, 2024, during the course of 2025 under our stock repurchase program. During the three months ended September 30, 2025, we repurchased 459,528 shares for $30.1 million. During the nine months ended September 30, 2025, we repurchased an aggregate of 1,972,550 shares for $130.2 million. Including net share settlement of employee stock compensation, these repurchases represent approximately 5.2% of our outstanding common stock as of December 31, 2024. As of September 30, 2025, $514.4 million remained available under our stock repurchase program. We expect to remain active in the market during the fourth quarter of 2025 and into 2026. Based on our current plans, we expect total repurchases during 2025 to represent between 5.2% and 7.0% of our outstanding common stock as of December 31, 2024. We preliminarily expect our share repurchase activity in 2026 to be similar to 2025.
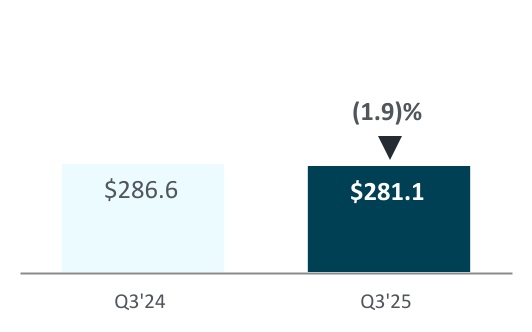
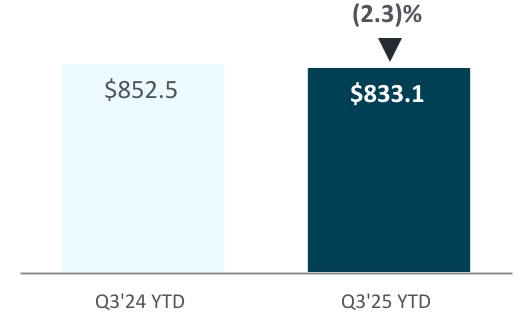
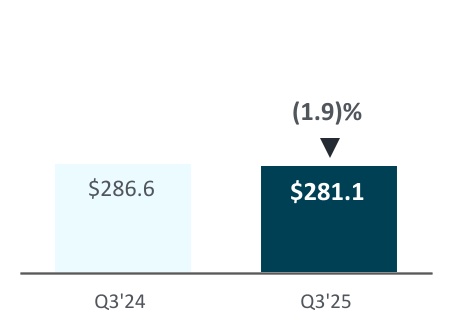
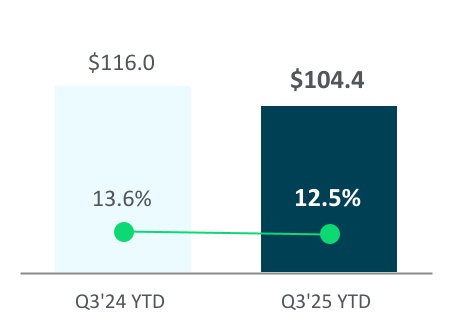
Revenue decreased by $5.5 million and $19.4 million, during the three and nine months ended September 30, 2025, respectively, when compared to the same periods in 2024, driven largely by the following:
-
Decreases in contractual recurring revenue of $11.7 million and $40.1 million, respectively, primarily related to our sale of EVERFI which represented $18.4 million and $63.9 million, respectively. These decreases were partially offset by the positive impact of our pricing initiatives and the performance of our cloud solutions.
-
Decreases in one-time consulting revenue of $1.4 million and $2.6 million, respectively, primarily due to our sale of EVERFI Limited in March 2024 and, to a lesser extent, fewer sales of implementation and customization services.
+
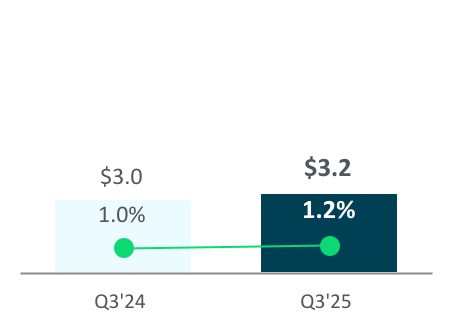
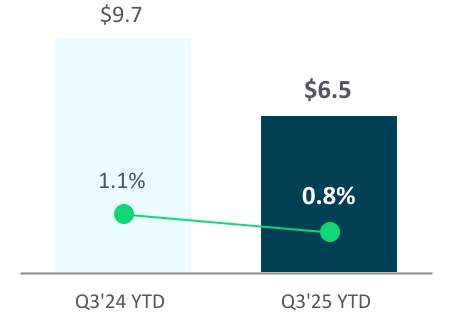
Increases in transactional recurring revenue of $7.7 million and $23.4 million, respectively, primarily due to increases in volume for our Blackbaud Integrated Payments and, to a lesser extent, positive results related to pricing initiatives; also contributing to the increases in transactional recurring revenue during the three and nine months ended September 30, 2025 were increases related to fluctuations in foreign currency exchange rates of $0.7 million and $2.2 million, respectively.
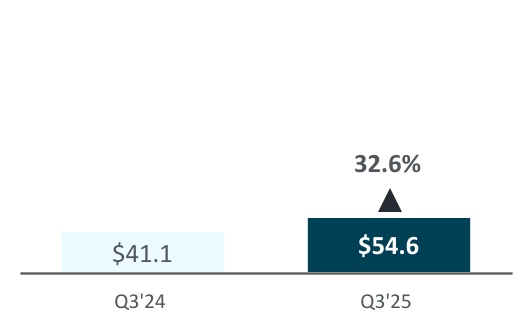
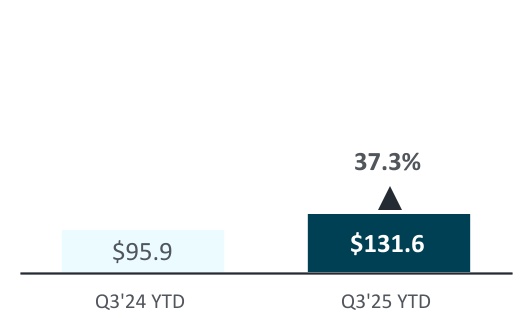
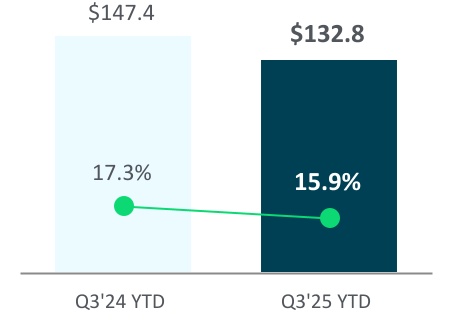
Income from operations increased by $13.4 million and $35.7 million, during the three and nine months ended September 30, 2025, respectively, when compared to the same periods in 2024, driven largely by the following:
+
Decreases in compensation costs other than stock-based compensation of $10.3 million and $33.0 million, respectively, primarily due to our sale of EVERFI
+
Decreases in amortization of intangible assets from business combinations of $8.2 million and $24.1 million, respectively, largely due to the previously disclosed impairment charge related to our EVERFI asset group in December 2024, which primarily included finite-lived intangible assets
+
Decrease in Security Incident-related expenses of $10.0 million, for the nine months ended September 30, 2025, largely related to decreases in loss contingency accruals. See Note 8 to our unaudited, condensed consolidated financial statements in this report for our discussion of the Security Incident.
+
Decreases in third-party contractor costs of $1.6 million and $8.7 million, respectively, primarily due to our sale of EVERFI
+
Decreases in advertising costs of $1.4 million and $4.3 million, respectively, primarily due to our sale of EVERFI
+
Decrease in stock-based compensation expense of $5.4 million, for the nine months ended September 30, 2025, primarily due to a decrease in the grant date fair value of equity award grants, and to a lesser extent, our sale of EVERFI; partially offset by an increase primarily due to estimated overall Company performance against 2025 goals
+
Decrease in rent expense of $2.9 million, for the nine months ended September 30, 2025, primarily related to our release from our lease for office space in Washington, DC in February 2025
-
Increase in acquisition and disposition-related costs within general and administrative expenses of $20.9 million, for the nine months ended September 30, 2025, primarily related to our release from our lease for office space in Washington, DC in February 2025
-
Decreases in total revenue, as described above
-
Decreases of $3.1 million and $5.3 million, respectively, in software development costs that were required to be capitalized under GAAP, primarily due to our sale of EVERFI
-
Increases in transaction-based costs of $1.5 million and $4.9 million, respectively, related to the increase in the volume of transactions for which we process payments and, to a lesser extent, increases in vendor rates
-
Increase in third-party software costs of $2.5 million, for the nine months ended September 30, 2025, primarily related to investments in our internal cybersecurity program
-
Increase in employee severance of $1.9 million, for the nine months ended September 30, 2025, related to a modest and targeted headcount reduction during the three months ended June 30, 2025
We are continuing to make critical investments in the business in areas such as innovation, AI, cybersecurity, and our continued shift of cloud infrastructure to leading public cloud service providers.
We continuously seek opportunities to optimize our portfolio of solutions to focus time and resources on innovation that will have the greatest impact for our customers and the markets we serve, and drive the highest return on investment. To that end, we will continue to simplify and rationalize our portfolio through product sunsets and divestitures of non-core businesses and technologies.
Our recurring subscription contracts are typically for a term of three years at contract inception. A key factor to our overall success is the renewal and expansion of our existing subscription agreements with our customers. Management uses gross dollar retention in analyzing our success at delighting our customers with innovative and cloud solutions. Gross dollar retention is defined as contracted annual recurring revenue ("CARR") divided by beginning CARR with a measurement period of twelve months. For the twelve months ended September 30, 2025, our gross dollar retention was approximately 92%. This gross dollar retention rate increased over our rate for the twelve months ended December 31, 2024 primarily due to our sale of EVERFI. We are continually investing in innovation, which we believe will generate strong gross dollar retention over the long-term.
Balance sheet and cash flow
At September 30, 2025, our cash and cash equivalents were $38.3 million. Under the 2024 Credit Facilities, the carrying amount of our debt was $1.0 billion and our net leverage ratio was 2.45 to 1.00.
During the nine months ended September 30, 2025, we generated $207.5 million in cash from operations, had a net decrease in borrowings of $9.9 million, returned $130.2 million to stockholders by way of share repurchases, and had aggregate cash outlays of $45.1 million for purchases of property and equipment and capitalized software development costs.
On July 4, 2025, the United States enacted the OBBBA, which introduced significant changes to U.S. tax law. See Note 9 to our unaudited, condensed consolidated financial statements in this report for more information. Based on our preliminary review, we expect OBBBA to meaningfully reduce cash taxes for the Company through 2027.
Results of Operations
Comparison of the three and nine months ended September 30, 2025 and 2024
Disposition
As previously disclosed, on December 31, 2024, we disposed of our EVERFI business, formerly a wholly owned subsidiary of Blackbaud, Inc, to a private investment firm that is unaffiliated with Blackbaud for nominal cash consideration. The results of operations of EVERFI are not included in our consolidated results of operations subsequent to the date of disposition.
Reclassifications
Our revenue from "recurring" and "one-time services and other" have been combined within "revenue" beginning in 2025 due to the immateriality of our one-time services and other revenue. In order to provide comparability between periods presented, our “recurring“ and “one-time services and other" revenue lines have been combined within “revenue" in the previously reported consolidated statements of comprehensive income to conform to the presentation of the current period. Similarly, "cost of recurring" and "cost of one-time services and other" have been combined within "cost of revenue" in the previously reported consolidated statements of comprehensive income to conform to the presentation of the current period.
During the third quarter of 2025, we identified a prior period noncash error related to the previously recorded valuation allowance in accounting for income taxes. We have revised previously issued financial statements to correct this error, along with other immaterial prior period errors. None of the revisions were considered material to the prior periods impacted, as disclosed in Note 13 to the unaudited, condensed consolidated financial statements in this report. All amounts in Item 2 of this filing are provided as revised.
Revenue and Cost of Revenue
Revenue ($M)
Cost of revenue ($M)
Gross profit ($M) and gross margin (%)
YoY Growth (%)
YoY Growth (%)
Our revenue includes three components: contractual recurring, transactional recurring and one-time services and other.
•Contractual recurring revenue is primarily comprised of fees for the use of our subscription-based software solutions, which includes providing access to cloud solutions, online training programs and subscription-based analytic services. Contractual recurring revenue also includes fees from maintenance services for our on-premises solutions.
•Transactional recurring revenue is comprised of transaction fees associated with the use of our solutions, including donation processing, tuition management, consumer giving and event-based usage.
•One-time services and other revenue is comprised of fees for one-time consulting, analytic and onsite training services, and fees for retained and managed services contracts that we do not expect to have a term consistent with our cloud solution contracts.
Cost of revenue is primarily comprised of compensation costs for customer support, production IT, professional services and onsite training personnel, hosting and data center costs, third-party contractor expenses, third-party royalty and data expenses, allocated depreciation, facilities and IT support (including cybersecurity) costs, amortization of intangible assets from business combinations, amortization of software development costs, transaction-based costs related to payments services including remittances of amounts due to third-parties, data expense incurred to perform one-time analytic services and other costs incurred in providing support, recurring services and onsite customer training to our customers.
Our customers continue to prefer cloud subscription offerings with integrated analytics, training and payment services. We intend to continue focusing on innovation, quality and integration of our cloud solutions, which we believe will drive future revenue growth.
Revenue decreased by $5.5 million, or 1.9%, and $19.4 million, or 2.3%, during the three and nine months ended September 30, 2025, respectively, when compared to the same periods in 2024. For a discussion of our changes in revenue, see "Revenue" above starting on page 32 in this report.
Cost of revenue decreased by $15.6 million, or 12.1%, and $41.5 million, or 10.8%, during the three and nine months ended September 30, 2025, respectively, when compared to the same periods in 2024, driven primarily by the following:
-
Decreases in amortization of intangible assets from business combinations of $7.9 million and $23.1 million, respectively, largely due to the previously disclosed impairment charge related to our EVERFI asset group in December 2024, which primarily included finite-lived intangible assets
-
Decreases in compensation costs of $5.3 million and $15.9 million, respectively, primarily due to our sale of EVERFI
-
Decreases in allocated overhead costs of $1.7 million and $4.3 million, respectively, primarily related to a reduction in facilities costs and the decreased headcount from our sale of EVERFI
-
Decreases in third-party contractor costs of $1.2 million and $2.6 million, respectively, largely related to our sale of EVERFI and, to a lesser extent, decreased use of outside contractors
+
Increases in transaction-based costs of $1.5 million and $4.7 million, respectively, related to the increase in the volume of transactions for which we process payments and, to a lesser extent, increases in vendor rates
Gross margin increased by 470 basis points and 390 basis points for the three and nine months ended September 30, 2025, respectively, when compared to the same periods in 2024, primarily due to the decreases in cost of revenue outpacing the decreases in revenue.
Operating Expenses
Sales, marketing and customer success ($M)
Research and development ($M)
General and administrative ($M)
Percentages indicate expenses as a percentage of total revenue
Sales, marketing and customer success expense includes compensation costs, variable sales commissions, travel-related expenses, advertising and marketing materials, public relations costs, variable reseller commissions and allocated depreciation, facilities and IT support (including cybersecurity) costs.
We see a large market opportunity in the long-term and will continue to make investments to drive sales effectiveness. We have also implemented software tools to enhance our digital footprint and drive lead generation. The enhancements we are making in our go-to-market approach are intended to reduce our average customer acquisition cost per customer as well as the related payback period while increasing sales velocity.
Sales, marketing and customer success expense decreased by $5.7 million, or 11.4%, and $14.6 million, or 9.9%, during the three and nine months ended September 30, 2025, respectively, when compared to the same periods in 2024. The decreases in dollars and as a percentage of revenue were primarily driven by the following:
-
Decreases in compensation costs of $2.3 million and $7.7 million, respectively, primarily related to our sale of EVERFI
-
Decreases in advertising costs of $1.4 million and $4.3 million, respectively, primarily due to our sale of EVERFI
Research and development
Research and development expense includes compensation costs for engineering and product management personnel, third-party contractor expenses, software development tools and other expenses related to developing new solutions or upgrading and enhancing existing solutions that do not qualify for capitalization, and allocated depreciation, facilities and IT support (including cybersecurity) costs.
We continue to make investments intended to delight our customers with innovative and secure cloud solutions, including AI technology. Research and development expenses decreased by $0.7 million, or 1.9%, and $11.7 million, or 10.1%, during the three and nine months ended September 30, 2025, respectively, when compared to the same periods in 2024. The decreases were primarily driven by the following:
-
Decreases in compensation costs of $2.7 million and $10.6 million, respectively, primarily related to our sale of EVERFI
-
Decrease in third-party contractor costs of $5.4 million, for the nine months ended September 30, 2025, primarily related to our sale of EVERFI
+
Decreases in software development costs of $3.9 million and $5.6 million, respectively, that were required to be capitalized under GAAP, primarily due to our sale of EVERFI
Not included in research and development expense for the three months ended September 30, 2025 and 2024 were $12.1 million and $16.0 million, respectively, and for the nine months ended September 30, 2025 and 2024 were $38.9 million and $44.5 million, respectively, of qualifying costs associated with software development activities that are required to be capitalized under GAAP, such as those for our cloud solutions. Qualifying capitalized development costs associated with our cloud solutions are subsequently amortized to cost of revenue over the related assets' estimated useful life, which generally range from three to seven years. We expect that the amount of software development costs capitalized will be relatively consistent in the near-term as we continue making investments in innovation, quality, security and the integration of our solutions, which we believe will drive long-term revenue growth.
General and administrative expense consists primarily of compensation costs for general corporate functions, including senior management, finance, accounting, legal, human resources and corporate development, Security Incident-related expenses (including legal fees, settlements and loss contingency accruals), third-party professional fees, insurance, allocated depreciation, facilities and IT support (including cybersecurity) costs, acquisition-related expenses and other administrative expenses.
General and administrative expense increased by $3.5 million, or 12.8%, during the three months ended September 30, 2025, when compared to the same period in 2024. The increases in dollars and as a percentage of revenue were primarily driven by the following:
+
Decrease in total costs allocated from general and administrative expense of $3.4 million primarily related to a reduction in facilities costs and the decreased headcount from our sale of EVERFI. Depreciation, facilities and IT support (including cybersecurity) costs are pooled and recorded to general and administrative expense and allocated to other lines of our statements of comprehensive income based on headcount.
General and administrative expense increased by $13.7 million, or 12.9%, during the nine months ended September 30, 2025, when compared to the same period in 2024. The increases in dollars and as a percentage of revenue were primarily driven by the following:
+
Increase in acquisition and disposition-related costs of $20.9 million primarily related to our release from our lease for office space in Washington, DC in February 2025
+
Decrease in total costs allocated from general and administrative expense of $6.8 million primarily related to a reduction in facilities costs and the decreased headcount from our sale of EVERFI. Depreciation, facilities and IT support (including cybersecurity) costs are pooled and recorded to general and administrative expense and allocated to other lines of our statements of comprehensive income based on headcount.
+
Increase in third-party software costs of $2.2 million primarily related to investments in our internal cybersecurity program
-
Decrease in Security Incident-related expenses of $10.0 million largely related to decreases in loss contingency accruals. See Note 8 to our unaudited, condensed consolidated financial statements in this report for our discussion of the Security Incident.
-
Decrease in rent expense of $2.6 million primarily related to our release from our lease for office space in Washington, DC in February 2025
-
Decrease in stock-based compensation costs of $2.3 million primarily due to a decrease in the grant date fair value of equity award grants, and to a lesser extent, our sale of EVERFI; partially offset by an increase primarily due to estimated overall Company performance against 2025 goals
-
Decrease in compensation costs other than stock-based compensation of $1.7 million primarily due to our sale of EVERFI
Interest Expense
Interest expense ($M)
Percentages indicate expenses as a percentage of total revenue
The increases in interest expense in dollars and as a percentage of total revenue during the three and nine months ended September 30, 2025, when compared to the same periods in 2024, were primarily due to our incremental borrowings to fund stock repurchases during 2024 and 2025 and the expiration of favorable interest rate swaps in October 2024. We currently expect interest expense for the full year 2025 to be approximately $66 million to $70 million. Our interest expense in connection with the variable rate portion of our outstanding debt could increase in a rising interest rate environment. See Note 7 to our unaudited, condensed consolidated financial statements in this report for more information regarding our derivative instruments, which we use to manage our variable interest rate risk, and Item 3. Quantitative and Qualitative Disclosures about Market Risk: Interest Rate Risk (below) for more information about our variable interest rate exposure and related risk.
Other Income, Net
Other income, net ($M)
Percentages indicate other income, net as a percentage of total revenue
During the three months ended September 30, 2025, other income, net was relatively consistent with the same period in 2024. The decrease in other income, net in dollars and as a percentage of total revenue during the nine months ended September 30, 2025, when compared to the same period in 2024, was primarily due to a decrease in interest income largely driven by lower year-over-year U.S. federal interest rates and, to a lesser extent, by an increase in the current year currency revaluation loss compared to the prior year loss. See Note 5 to our unaudited, condensed consolidated financial statements in this report for more information regarding our other income.
Deferred Revenue
The table below compares the components of deferred revenue from our unaudited, condensed consolidated balance sheets:
(dollars in millions)
September 30, 2025
December 31, 2024
Change
Deferred revenue(1)
$
384.9
$
360.6
6.8
%
Less: Long-term portion
1.8
2.0
(12.0)
%
Current portion(1)
$
383.1
$
358.5
6.9
%
(1)The individual amounts for each year may not sum to deferred revenue or current portion of deferred revenue due to rounding.
To the extent that our customers are billed for our solutions and services in advance of delivery, we record such amounts in deferred revenue. Our recurring revenue contracts are generally for a term of three years at contract inception with three-year renewals thereafter, billed annually in advance and non-cancelable. We generally invoice our customers with recurring revenue contracts in annual cycles 30 days prior to the end of each one-year period.
The increase in deferred revenue during the nine months ended September 30, 2025 was primarily due to a seasonal increase in customer contract billings. Historically, due to the timing of customer budget cycles, we have an increase in billings and customer contract renewals at or near the beginning of our third quarter. Generally, our lowest balance of deferred revenue during the year is at the end of our first quarter.
The decreases in our effective income tax rate for the three and nine months ended September 30, 2025 when compared to the same periods in 2024 were primarily due to the favorable impact of a valuation allowance reduction recorded against our net U.S. deferred tax assets.
On July 4, 2025, the United States enacted the OBBBA, which introduced significant changes to U.S. tax law. See Note 9 to our unaudited, condensed consolidated financial statements in this report for more information. Based on our preliminary review, we expect OBBBA to meaningfully reduce cash taxes for the Company through 2027.
The operating results analyzed below are presented on a non-GAAP basis. We use non-GAAP financial measures internally in analyzing our operational performance. Accordingly, we believe these non-GAAP measures are useful to investors, as a supplement to GAAP measures, in evaluating our ongoing operational performance. While we believe these non-GAAP measures provide useful supplemental information, non-GAAP financial measures should not be considered in isolation from, or as a substitute for, financial information prepared in accordance with GAAP. In addition, these non-GAAP financial measures may not be completely comparable to similarly titled measures of other companies due to potential differences in the exact method of calculation between companies.
The non-GAAP financial measures discussed below exclude the impact of certain transactions because we believe they are not directly related to our operating performance in any particular period, but are for our long-term benefit over multiple periods. We believe that these non-GAAP financial measures reflect our ongoing business in a manner that allows for meaningful period-to-period comparisons and analysis of trends in our business.
Add: Amortization of intangibles from business combinations
6.8
14.7
20.9
44.0
Add: Employee severance
—
—
0.3
—
Subtotal(1)
9.6
17.6
30.0
54.0
Non-GAAP gross profit(1)
$
177.1
$
174.9
$
521.0
$
522.9
Non-GAAP gross margin
63.0
%
61.0
%
62.5
%
61.3
%
GAAP income from operations
$
54.6
$
41.1
$
131.6
$
95.9
GAAP operating margin
19.4
%
14.4
%
15.8
%
11.2
%
Non-GAAP adjustments:
Add: Stock-based compensation expense
21.7
21.1
71.1
76.4
Add: Amortization of intangibles from business combinations
7.4
15.6
22.6
46.7
Add: Employee severance
(0.2)
—
1.9
—
Add: Acquisition and disposition-related costs(2)
0.4
0.2
25.8
4.9
Add: Security Incident-related costs(3)
0.2
0.6
2.8
12.8
Subtotal(1)
29.4
37.6
124.1
140.8
Non-GAAP income from operations(1)
$
84.0
$
78.7
$
255.8
$
236.7
Non-GAAP operating margin
29.9
%
27.5
%
30.7
%
27.8
%
GAAP income before (benefit) provision for income taxes
$
41.0
$
30.0
$
86.0
$
65.4
GAAP net income
$
47.5
$
18.3
$
78.3
$
46.8
Shares used in computing GAAP diluted earnings per share
48,498,285
51,632,569
48,634,027
52,107,147
GAAP diluted earnings per share
$
0.98
$
0.35
$
1.61
$
0.90
Non-GAAP adjustments:
Add: GAAP income tax (benefit) provision
(6.4)
11.7
7.7
18.6
Add: Total non-GAAP adjustments affecting income from operations
29.4
37.6
124.1
140.8
Non-GAAP income before provision for income taxes(1)
70.5
67.6
210.1
206.2
Assumed non-GAAP income tax provision(4)
17.3
16.6
51.5
50.5
Non-GAAP net income(1)
$
53.2
$
51.0
$
158.6
$
155.7
Shares used in computing non-GAAP diluted earnings per share
48,498,285
51,632,569
48,634,027
52,107,147
Non-GAAP diluted earnings per share
$
1.10
$
0.99
$
3.26
$
2.99
(1)The individual amounts for each year may not sum to subtotal, non-GAAP gross profit, non-GAAP income from operations, non-GAAP income before provision for income taxes or non-GAAP net income due to rounding.
(2)Includes charges of $24.3 million incurred during the nine months ended September 30, 2025 related to the release from our lease for office space in Washington, DC (which was acquired as part of our acquisition of EVERFI in December 2021).
(3)Includes Security Incident-related costs incurred during the three months ended September 30, 2025 and 2024 which were insignificant for on-going legal fees, during the nine months ended September 30, 2025 of $2.8 million, which included approximately $1.1 million in recorded accruals for loss contingencies and during the nine months ended September 30, 2024 of $12.8 million, which included approximately $6.8 million in recorded accruals for loss contingencies. Recorded expenses consisted primarily of payments to third-party service providers and consultants, including legal fees, as well as settlements of customer claims, negotiated settlements and accruals for certain loss contingencies. Not included in this adjustment were costs associated with enhancements to our cybersecurity program. As of September 30, 2025, we do not have any recorded liabilities for loss contingencies related to the Security Incident.
(4)We apply a non-GAAP effective tax rate of 24.5% when calculating non-GAAP net income and non-GAAP diluted earnings per share.
In addition, we use non-GAAP organic revenue growth, non-GAAP organic revenue growth on a constant currency basis, non-GAAP organic recurring revenue growth and non-GAAP organic recurring revenue growth on a constant currency basis in analyzing our operating performance. We believe that these non-GAAP measures are useful to investors, as a supplement to GAAP measures, for evaluating the periodic growth of our business on a consistent basis. Each of these measures of non-GAAP organic revenue growth excludes incremental acquisition-related revenue attributable to companies, if any, acquired in the current fiscal year. For companies, if any, acquired in the immediately preceding fiscal year, each of these non-GAAP organic revenue growth measures reflects presentation of full year incremental non-GAAP revenue derived from such companies as if they were combined throughout the prior period. In addition, each of these non-GAAP organic revenue growth measures excludes prior period revenue associated with divested businesses. The exclusion of the prior period revenue is to present the results of the divested businesses within the results of the combined company for the same period of time in both the prior and current periods. We believe this presentation provides a more comparable representation of our current business’ organic revenue growth and revenue run-rate.
(dollars in millions)
Three months ended
September 30,
Nine months ended
September 30,
2025
2024
2025
2024
GAAP revenue
$
281.1
$
286.6
$
833.1
$
852.5
GAAP revenue growth
(1.9)
%
(2.3)
%
Less: Non-GAAP revenue from divested businesses(1)
—
(19.3)
—
(66.5)
Non-GAAP organic revenue(2)
$
281.1
$
267.3
$
833.1
$
786.0
Non-GAAP organic revenue growth
5.2
%
6.0
%
Non-GAAP organic revenue(2)
$
281.1
$
267.3
$
833.1
$
786.0
Foreign currency impact on Non-GAAP organic revenue(3)
(1.0)
—
(2.6)
—
Non-GAAP organic revenue on constant currency basis(3)
$
280.2
$
267.3
$
830.5
$
786.0
Non-GAAP organic revenue growth on constant currency basis
4.8
%
5.7
%
GAAP recurring revenue
$
275.8
$
279.9
$
815.4
$
832.2
GAAP recurring revenue growth
(1.5)
%
(2.0)
%
Less: Non-GAAP recurring revenue from divested businesses(1)
—
(18.4)
—
(63.9)
Non-GAAP organic recurring revenue(2)
$
275.8
$
261.5
$
815.4
$
768.3
Non-GAAP organic recurring revenue growth
5.5
%
6.1
%
Non-GAAP organic recurring revenue(2)
$
275.8
$
261.5
$
815.4
$
768.3
Foreign currency impact on non-GAAP organic recurring revenue(3)
(1.0)
—
(2.6)
—
Non-GAAP organic recurring revenue on constant currency basis(3)
$
274.8
$
261.5
$
812.8
$
768.3
Non-GAAP organic recurring revenue growth on constant currency basis
5.1
%
5.8
%
(1)Non-GAAP revenue from divested businesses excludes revenue associated with divested businesses. The exclusion of the prior period revenue is to present the results of the divested business with the results of the combined company for the same period of time in both the prior and current periods.
(2)Non-GAAP organic revenue and non-GAAP organic recurring revenue for the prior year periods presented herein may not agree to non-GAAP organic revenue and non-GAAP organic recurring revenue presented in the respective prior period quarterly financial information solely due to the manner in which non-GAAP organic revenue growth and non-GAAP organic recurring revenue growth are calculated.
(3)To determine non-GAAP organic revenue growth and non-GAAP organic recurring revenue growth on a constant currency basis, revenues from entities reporting in foreign currencies were translated to U.S. Dollars using the comparable prior period's quarterly weighted average foreign currency exchange rates. The primary foreign currencies creating the impact are the Australian Dollar, British Pound, Canadian Dollar and Euro.
We define Rule of 40 as non-GAAP organic revenue growth plus non-GAAP adjusted EBITDA margin. Non-GAAP adjusted EBITDA is defined as GAAP net income plus interest, net; income tax provision (benefit); depreciation; amortization of intangible assets from business combinations; amortization of software development costs; stock-based compensation; employee severance; acquisition and disposition-related costs; Security Incident-related costs; and impairment and disposition charges.
Three months ended
September 30,
Nine months ended
September 30,
(dollars in millions)
2025
2024
2025
2024
GAAP net income
$
47.5
$
18.3
$
78.3
$
46.8
Non-GAAP adjustments:
Add: Interest, net
14.4
11.0
46.1
32.2
Add: GAAP income tax (benefit) provision
(6.4)
11.7
7.7
18.6
Add: Depreciation
2.2
3.3
7.8
9.6
Add: Amortization of intangibles from business combinations
7.4
15.6
22.6
46.7
Add: Amortization of software development costs(1)
12.6
13.2
36.8
37.9
Subtotal(2)
30.1
54.8
121.0
144.9
Non-GAAP EBITDA(2)
$
77.6
$
73.1
$
199.2
$
191.8
Non-GAAP EBITDA margin(3)
27.6
%
23.9
%
Non-GAAP adjustments:
Add: Stock-based compensation expense
$
21.7
$
21.1
$
71.1
$
76.4
Add: Employee severance
(0.2)
—
1.9
—
Add: Acquisition and disposition-related costs
0.4
0.2
25.8
4.9
Add: Security Incident-related costs(4)
0.2
0.6
2.8
12.8
Subtotal(2)
22.0
22.0
101.6
94.1
Non-GAAP adjusted EBITDA(2)
$
99.7
$
95.1
$
300.8
$
285.9
Non-GAAP adjusted EBITDA margin(5)
35.4
%
36.1
%
Rule of 40(6)
40.6
%
42.1
%
Non-GAAP adjusted EBITDA
$
99.7
$
95.1
$
300.8
$
285.9
Foreign currency impact on Non-GAAP adjusted EBITDA(7)
(0.5)
(0.6)
(1.4)
(1.1)
Non-GAAP adjusted EBITDA on constant currency basis(7)
$
99.1
$
94.5
$
299.4
$
284.8
Non-GAAP adjusted EBITDA margin on constant currency basis
35.4
%
36.1
%
Rule of 40 on constant currency basis(8)
40.2
%
41.8
%
(1)Includes amortization expense related to software development costs and amortization expense from capitalized cloud computing implementation costs.
(2)The individual amounts for each year may not sum to subtotal, non-GAAP EBITDA, non-GAAP adjusted EBITDA or non-GAAP adjusted EBITDA on a constant currency basis due to rounding.
(3)Measured by GAAP revenue divided by non-GAAP EBITDA.
(4)See additional details in the reconciliation of GAAP to Non-GAAP operating income above.
(5)Measured by non-GAAP organic revenue divided by non-GAAP adjusted EBITDA.
(6)Measured by non-GAAP organic revenue growth plus non-GAAP adjusted EBITDA margin. See Non-GAAP organic revenue growth table above.
(7)To determine non-GAAP adjusted EBITDA on a constant currency basis, non-GAAP adjusted EBITDA from entities reporting in foreign currencies were translated to U.S. Dollars using the comparable prior period's quarterly weighted average foreign currency exchange rates. The primary foreign currencies creating the impact are the Australian Dollar, British Pound, Canadian Dollar and Euro.
(8)Measured by non-GAAP organic revenue growth on constant currency basis plus non-GAAP adjusted EBITDA margin on constant currency basis. See Non-GAAP organic revenue growth table above.
Non-GAAP free cash flow and non-GAAP adjusted free cash flow
Non-GAAP free cash flow is defined as operating cash flow less capital expenditures, including costs required to be capitalized for software development, and capital expenditures for property and equipment.
Non-GAAP adjusted free cash flow is defined as operating cash flow less capital expenditures, including costs required to be capitalized for software development and capital expenditures for property and equipment, plus cash outflows related to the Security Incident.
We believe non-GAAP free cash flow and non-GAAP adjusted free cash flow provides useful measures of the Company's operating performance. Non-GAAP adjusted free cash flow is not intended to represent and should not be viewed as the amount of residual cash flow available for discretionary expenditures.
Nine months ended
September 30,
(dollars in millions)
2025
2024
GAAP net cash provided by operating activities
$
207.5
$
222.4
GAAP operating cash flow margin
24.9
%
26.1
%
Non-GAAP adjustments:
Less: purchase of property and equipment
(4.8)
(7.2)
Less: capitalized software development costs
(40.3)
(42.9)
Non-GAAP free cash flow(1)
$
162.5
$
172.3
Non-GAAP free cash flow margin
19.5
%
20.2
%
Non-GAAP adjustments:
Add: Security Incident-related cash flows
4.3
15.1
Non-GAAP adjusted free cash flow(1)
$
166.8
$
187.4
Non-GAAP adjusted free cash flow margin
20.0
%
22.0
%
(1)The individual amounts for each year may not sum to non-GAAP free cash flow or non-GAAP adjusted free cash flow due to rounding.
Seasonality
Our revenues normally fluctuate as a result of certain seasonal variations in our business. Our first quarter has historically been the seasonal low for bookings, with the second and fourth quarters historically being seasonally higher, and our bookings tend to be back-end loaded within individual quarters given our quarterly quota plans. Transactional revenue is non-contractual and less predictable given the susceptibility to certain drivers such as timing and number of events and marketing campaigns, as well as fluctuations in donation volumes and tuition payments. Our transactional revenue has historically been at its lowest in the first quarter due to the timing of customer fundraising initiatives and events. We have historically experienced seasonal highs during the fourth quarter due to year-end giving campaigns and during the second quarter when a large number of events are held. Our revenue from professional services has historically been lower in the first quarter when many of those services commence and in the fourth quarter due to the holiday season. As a result of these and other factors, our total revenue has historically been lower in the first quarter than in the remainder of our fiscal year, with the fourth quarter historically achieving the highest total revenue. Our expenses, other than transaction-based costs related to our payments services, do not vary significantly as a result of these factors, but do fluctuate on a quarterly basis due to varying timing of expenditures.
Our cash flow from operations normally fluctuates quarterly due to the combination of the timing of customer contract billings and renewals, delivery of professional services and occurrence of customer events, as well as merit-based salary increases, among other factors. Historically, due to lower revenues in our first quarter, combined with the payment of certain annual vendor contracts, our cash flow from operations has been lowest in our first quarter. Due to the timing of customer contract renewals and student enrollments, many of which take place at or near the beginning of our third quarter, our cash flow from operations has generally been lower in our second quarter as compared to our third and fourth quarters. Partially offsetting these favorable drivers of cash flow from operations in our third and fourth quarters are base salary merit increases, which occur in July. In addition, deferred revenues can vary on a seasonal basis due to the timing of customer contract billings and renewals and student enrollments or significant acquisitions. Our cash flow from financing is negatively
impacted in our first quarter when most of our equity awards vest, as we pay taxes on behalf of our employees related to the settlement or exercise of equity awards.
These patterns may change as a result of the continued shift to online giving, growth in volume of transactions for which we process payments, large dollar customer bookings and contract renewals, fluctuations in the timing of vendor payments, or as a result of acquisitions, new market opportunities, new solution introductions or other factors.
Liquidity and Capital Resources
The following table presents selected financial information about our financial position:
(dollars in millions)
September 30, 2025
December 31, 2024
Change
Cash and cash equivalents
$
38.3
$
67.6
(43.4)
%
Property and equipment, net
85.3
91.9
(7.2)
%
Software development costs, net
154.1
148.3
3.9
%
Total carrying value of debt
1,064.6
1,075.0
(1.0)
%
Working capital
(290.5)
(275.5)
(5.5)
%
The following table presents selected financial information about our cash flows:
Nine months ended September 30,
(dollars in millions)
2025
2024
Change
Net cash provided by operating activities
$
207.5
$
222.4
(6.7)
%
Net cash used in investing activities
(57.3)
(56.3)
1.7
%
Net cash used in financing activities
(508.1)
(435.1)
16.8
%
Our principal sources of liquidity are our operating cash flow, funds available under the 2024 Credit Facilities and cash on hand. Our operating cash flow depends on continued customer renewal of our subscription and maintenance arrangements, market acceptance of our solutions and services, the volume and size of transactions for which we process payments and our customers' ability to pay. Based on current estimates of revenue and expenses, we believe that the currently available sources of funds and anticipated cash flows from operations will be adequate for at least the next twelve months to finance our operations, fund anticipated capital expenditures and meet our debt obligations. We also believe that we will be able to continue to meet our long-term cash requirements due to our anticipated cash flow from operations, solid financial position and ability to access capital from financial markets. To the extent we undertake future material acquisitions or investments or unanticipated capital or operating expenditures, we may require additional capital. In that context, we regularly evaluate opportunities to enhance our capital structure, including through potential debt or equity issuances.
As a well-known seasoned issuer, we filed an automatic shelf registration statement for an undetermined amount of debt and equity securities with the SEC on January 10, 2025. Under this universal shelf registration statement we may offer and sell, from time to time, debt securities, common stock, preferred stock, depositary shares, warrants, stock purchase contracts and stock purchase units. Subject to certain conditions and pursuant to applicable SEC regulations, this registration statement is effective for three years from its date of filing with the SEC, or through January 9, 2028.
At September 30, 2025, our total cash and cash equivalents balance included approximately $17.9 million of cash that was held by operations outside the U.S. While these funds may not be needed to fund our U.S. operations for at least the next twelve months, if we need these funds, we may be required to accrue and pay taxes to repatriate the funds. We currently do not intend nor anticipate a need to repatriate our cash held outside the U.S.
Our cash flows from operations are derived principally from: (i) our earnings from on-going operations prior to non-cash expenses such as depreciation, amortization, stock-based compensation, deferred taxes, amortization of deferred financing costs and debt discount and adjustments to our provision for credit losses and sales returns; and (ii) changes in our working capital.
Working capital changes are composed of changes in accounts receivable, prepaid expenses and other assets, trade accounts payable, accrued expenses and other liabilities, and deferred revenue.
Net cash provided by operating activities decreased by $14.8 million during the nine months ended September 30, 2025, when compared to the same period in 2024, primarily due to a $2.8 million decrease in net income adjusted for non-cash expenses and a $12.1 million decrease in cash flow from operations associated with working capital.
The decrease in cash flow from operations associated with working capital during the nine months ended September 30, 2025, when compared to the same period in 2024, was primarily due to:
•fluctuations in the timing of vendor payments; offset by
•a decrease in cash taxes paid.
On July 4, 2025, the United States enacted the OBBBA, which introduced significant changes to U.S. tax law. See Note 9 to our unaudited, condensed consolidated financial statements in this report for more information. Based on our preliminary review, we expect OBBBA to meaningfully reduce cash taxes for the Company through 2027.
Investing Cash Flow
Net cash used in investing activities of $57.3 million remained relatively consistent during the nine months ended September 30, 2025, when compared to the same period in 2024.
During the nine months ended September 30, 2025, we used cash of $40.3 million for software development costs, which was a decrease of $2.6 million when compared to the same period in 2024. We spent $4.8 million for purchases of property and equipment during the nine months ended September 30, 2025, which was a decrease of $2.4 million when compared to the same period in 2024. During the nine months ended September 30, 2025, we used net cash of $12.2 million for the disposition of a business compared to $1.2 million used during the same period in 2024.
Financing Cash Flow
During the nine months ended September 30, 2025, we had a net decrease in borrowings of $9.9 million, primarily due to our stock repurchase program and to satisfy tax obligations of employees upon settlement of equity awards (see discussion below).
We paid $39.7 million to satisfy tax obligations of employees upon settlement of equity awards during the nine months ended September 30, 2025 compared to $56.0 million during the same period in 2024. The amount of taxes paid by us on behalf of employees related to the settlement of equity awards varies from period to period based upon the timing of grants and vesting, as well as the market price for shares of our common stock at the time of settlement. Most of our equity awards currently vest in our first quarter.
During the nine months ended September 30, 2025, cash flow from financing activities associated with changes in restricted cash due to customers decreased $323.5 million, compared to a decrease of $263.7 million during the same period in 2024. This line in the statement of cash flows represents the change in the amount of restricted cash held and payable by us to customers from one period to the next. This restricted cash due to customers is not available to us for operational purposes.
On July 16, 2024, our Board of Directors reauthorized, expanded and replenished our stock repurchase program by expanding the total capacity under the program to $800.0 million available for repurchases. The program does not have an expiration date. Under the stock repurchase program, we are authorized to repurchase shares from time to time in accordance with applicable laws both on the open market, including under trading plans established pursuant to Rule 10b5-1 under the Securities Exchange Act of 1934, as amended, and in privately negotiated transactions. The timing and amount of repurchases depends on several factors, including market and business conditions, the trading price of our common stock and the nature of other investment opportunities. The repurchase program may be limited, suspended or discontinued at any time without prior notice.
In February 2025, we announced our intention to repurchase between 3% and 5% of our outstanding common stock as of December 31, 2024, during the course of 2025 under our stock repurchase program. During the three months ended September 30, 2025, we repurchased 459,528 shares for $30.1 million. During the nine months ended September 30, 2025, we repurchased an aggregate of 1,972,550 shares for $130.2 million. Including net share settlement of employee stock compensation, these repurchases represent approximately 5.2% of our outstanding common stock as of December 31, 2024. As of September 30, 2025, $514.4 million remained available under our stock repurchase program. We expect to remain active in the market during the fourth quarter of 2025 and into 2026. Based on our current plans, we expect total repurchases during 2025 to represent between 5.2% and 7.0% of our outstanding common stock as of December 31, 2024. We preliminarily expect our share repurchase activity in 2026 to be similar to 2025.
2024 Credit Facilities
Historically, we have drawn on our credit facility from time to time to help us meet financial needs, primarily due to the seasonality of our cash flows from operations and financing for business acquisitions. At September 30, 2025, our available borrowing capacity under the 2024 Credit Facilities was $463.5 million. The 2024 Credit Facilities mature in April 2029.
At September 30, 2025, the carrying amount of our debt under the 2024 Credit Facilities was $1.0 billion. Our average daily borrowings during the three and nine months ended September 30, 2025 were $1.0 billion and $1.1 billion, respectively.
The following is a summary of the financial covenants under the 2024 Credit Facilities:
Financial covenant
Requirement
Ratio as of September 30, 2025
Net leverage ratio(1)
≤ 3.75 to 1.00
2.45 to 1.00
Interest coverage ratio
≥ 2.50 to 1.00
6.21 to 1.00
(1)Under the terms of the 2024 Credit Facilities, the Net Leverage Ratio requirement may be increased by up to 0.50 provided we satisfy certain requirements, including a permitted business acquisition, and provided that the maximum Net Leverage Ratio shall not exceed 4.25 to 1.00.
Under the 2024 Credit Facilities, we also have restrictions on our ability to declare and pay dividends and our ability to repurchase shares of our common stock. In order to pay any cash dividends and/or repurchase shares of stock: (i) no default or event of default shall have occurred and be continuing under the 2024 Credit Facilities, and (ii) our pro forma net leverage ratio, as set forth in the 2024 Credit Facilities, must be 0.25 less than the net leverage ratio requirement at the time of dividend declaration or share repurchase. At September 30, 2025, we were in compliance with our debt covenants under the 2024 Credit Facilities. See Note 6 to our unaudited, condensed consolidated financial statements in this report for additional information regarding the 2024 Credit Facilities.
(1)The individual amounts may not sum to the total due to rounding.
Debt
As of September 30, 2025, we had total remaining principal payments of approximately $1.1 billion. These payments represent principal payments only, under the following assumptions: (i) that the amounts outstanding under the 2024 Credit Facilities, our real estate loans and our other debt at September 30, 2025 will remain outstanding until maturity, with minimum payments occurring as currently scheduled, and (ii) that there are no assumed future borrowings on the revolving credit loans under the 2024 Revolving Facility for the purposes of determining minimum commitment amounts. See Note 6 to our unaudited, condensed consolidated financial statements in this report for more information.
Interest payments on debt
In addition to principal payments, as of September 30, 2025, we expect to pay interest expense over the life of our debt obligations of approximately $230.0 million. These payments represent our estimated future interest payments on debt using our debt balances and the related weighted average effective interest rates as of September 30, 2025, which includes the effect of interest rate swap agreements. The actual interest expense recognized in our unaudited, condensed consolidated statements of comprehensive income will depend on the amount of debt, the length of time the debt is outstanding and the interest rate, which could be different from our assumptions on our remaining principal payments described above.
Operating leases
As of September 30, 2025, we had remaining operating lease payments of $7.6 million. These payments have not been reduced by sublease income, incentive payments, reimbursement of leasehold improvements or the amount representing imputed interest which was insignificant. Our operating leases are generally for corporate offices, subleased offices and certain equipment and furniture. Given our remote-first workforce strategy and real estate footprint optimization efforts, we do not anticipate entering any new, material operating leases for offices for the foreseeable future. See Note 8 to our unaudited, condensed consolidated financial statements in this report for more information.
Purchase obligations
As of September 30, 2025, we had remaining purchase obligations of $157.8 million. These purchase obligations are for third-party technology used in our solutions and for other services we purchase as part of our normal operations. In certain cases, these arrangements require a minimum annual purchase commitment by us. Our purchase obligations are not recorded as liabilities on our unaudited, condensed consolidated balance sheets as of September 30, 2025, as we had not received the related services. See Note 8 to our unaudited, condensed consolidated financial statements in this report for more information.
Other commitments
The total liability for uncertain tax positions as of September 30, 2025 was $5.8 million. Our accrued interest and penalties related to tax positions taken on our tax returns was insignificant as of September 30, 2025.
In connection with the settlement of the multi-state Attorneys General investigation, the California Attorney General investigation and the FTC investigation relating to the Security Incident, as discussed in Note 11 to our audited consolidated financial statements contained in our Annual Report on Form 10-K for the fiscal year ended December 31, 2024, we have agreed to implement and improve certain of our cybersecurity programs and tools through May 2044. The currently anticipated costs in connection with these efforts are primarily expected to be expensed as incurred.
Foreign Currency Exchange Rates
Approximately 16% of our total revenue for the nine months ended September 30, 2025 was generated from operations outside the U.S. We do not have significant operations in countries in which the economy is considered to be highly inflationary. Our consolidated financial statements are denominated in U.S. dollars and, accordingly, changes in the exchange rate between foreign currencies and the U.S. dollar will affect the translation of our subsidiaries’ financial results into U.S. dollars for purposes of reporting our consolidated financial results. The accumulated currency translation adjustment, recorded within accumulated other comprehensive loss as a component of stockholders’ equity, was a loss of $4.4 million as of September 30, 2025 and a loss of $12.7 million as of December 31, 2024. We have entered into foreign currency forward contracts to hedge a portion of the foreign currency exposure that arises on translation of our investments denominated in British Pounds into U.S. dollars.
The vast majority of our contracts are entered into by our U.S. or U.K. entities. The contracts entered into by the U.S. entity are almost always denominated in U.S. dollars or Canadian dollars, and contracts entered into by our U.K., Australian and Irish subsidiaries are generally denominated in British Pounds, Australian dollars and Euros, respectively. Historically, as the U.S. dollar weakened, foreign currency translation resulted in an increase in our revenues and expenses denominated in non-U.S. currencies. Conversely, as the U.S. dollar strengthened, foreign currency translation resulted in a decrease in our revenues and expenses denominated in non-U.S. currencies. During the nine months ended September 30, 2025, foreign translation resulted in increases in our revenues and expenses denominated in non-U.S. currencies. Though we have exposure to fluctuations in currency exchange rates, primarily those between the U.S. dollar and both the British Pound and Canadian dollar, the impact has generally not been material to our consolidated results of operations or financial position. For the nine months ended September 30, 2025, the fluctuation in foreign currency exchange rates increased our total revenue and our income from operations by $2.6 million and $1.8 million, respectively. We have entered into foreign currency forward contracts to hedge revenues denominated in the Canadian dollar against changes in the exchange rate with the U.S. dollar. We will continue monitoring such exposure and take action as appropriate. To determine the impacts on revenue (or income from operations) from fluctuations in currency exchange rates, current period revenues (or income from operations) from entities reporting in foreign currencies were translated into U.S. dollars using the comparable prior year period's weighted average foreign currency exchange rates. These impacts are non-GAAP financial information and are not in accordance with, or an alternative to, information prepared in accordance with GAAP.
Critical Accounting Policies and Estimates
There have been no significant changes in our critical accounting policies and estimates during the nine months ended September 30, 2025 as compared to those disclosed in “Management’s Discussion and Analysis of Financial Condition and Results of Operations” included in our Annual Report on Form 10-K for the fiscal year ended December 31, 2024.
Recently Issued Accounting Pronouncements
For a discussion of the impact that recently issued accounting pronouncements are expected to have on our financial position and results of operations when adopted in the future, see Note 2 to our unaudited, condensed consolidated financial statements in this report.
ITEM 3. QUANTITATIVE AND QUALITATIVE DISCLOSURES ABOUT MARKET RISK
We have market rate sensitivity for interest rates and foreign currency exchange rates.
Interest Rate Risk
Our variable rate debt is our primary financial instrument with market risk exposure for changing interest rates. We manage our variable rate interest rate risk through a combination of short-term and long-term borrowings and the use of derivative instruments entered into for hedging purposes. Additionally, our interest income that we primarily earn on restricted cash due to customers for our payment processing solutions acts as a partial natural hedge against our interest rate risk. Our primary interest rate exposure is related to changes in SOFR rates. Due to the nature of our debt, the materiality of the fair values of the derivative instruments and the highly liquid, short-term nature and level of our cash and cash equivalents as of September 30, 2025, we believe that the risk of exposure to changing interest rates for those positions is immaterial. There were no significant changes in how we manage interest rate risk between December 31, 2024 and September 30, 2025.
Foreign Currency Risk
For a discussion of our exposure to foreign currency exchange rate fluctuations, see “Management’s Discussion and Analysis of Financial Condition and Results of Operations — Foreign Currency Exchange Rates” in this report.
ITEM 4. CONTROLS AND PROCEDURES
Evaluation of Disclosure Controls and Procedures
Disclosure controls and procedures (as defined in Securities Exchange Act Rule 13a-15(e) and 15d-15(e)) are designed only to provide reasonable assurance that they will meet their objectives. As of the end of the period covered by this report, we carried out an evaluation, under the supervision and with the participation of our management, including our Chief Executive Officer (principal executive officer) and Chief Financial Officer (principal financial and accounting officer), of the effectiveness of our disclosure controls and procedures (as defined in Rule 13a-15(e) and 15d-15(e)) pursuant to Securities Exchange Act Rule 13a-15(b). Based upon that evaluation, our Chief Executive Officer and Chief Financial Officer have concluded that our disclosure controls and procedures are effective to provide the reasonable assurance discussed above.
Changes in Internal Control Over Financial Reporting
No changes in internal control over financial reporting occurred during the most recent fiscal quarter ended September 30, 2025 with respect to our operations, which have materially affected, or are reasonably likely to materially affect, our internal control over financial reporting.
For a discussion of our legal proceedings, see Note 8 to our unaudited, condensed consolidated financial statements in this report.
ITEM 2. UNREGISTERED SALES OF EQUITY SECURITIES AND USE OF PROCEEDS
Issuer Purchases of Equity Securities
The following table provides information about shares of common stock acquired or repurchased during the three months ended September 30, 2025 under the stock repurchase program then in effect, as well as common stock withheld by us to satisfy the minimum tax obligations of employees due upon vesting of restricted stock awards and units.
Period
Total
number
of shares
purchased(1)
Average price paid per share
Total number of shares purchased as part of publicly announced plans or programs
Approximate
dollar value
of shares
that may yet
be purchased
under the
plans or
programs
(in thousands)(2)
Beginning balance, July 1, 2025
$
544,532
July 1, 2025 through July 31, 2025
—
$
—
—
544,532
August 1, 2025 through August 31, 2025
250,069
64.06
229,000
529,843
September 1, 2025 through September 30, 2025
230,528
66.99
230,528
514,399
Total
480,597
$
65.47
459,528
$
514,399
(1)Includes 21,069 shares in August withheld by us to satisfy the minimum tax obligations of employees due upon vesting of restricted stock awards and units. The level of this acquisition activity varies from period to period based upon the timing of award grants and vesting.
(2)In July 2024, our Board of Directors reauthorized, expanded and replenished our stock repurchase program by raising the total capacity under the program to $800.0 million available for repurchases. The program does not have an expiration date.
During the three months ended September 30, 2025, none of the Company’s directors or executive officers adopted or terminated any contract, instruction or written plan for the purchase or sale of Company securities.
ITEM 6. EXHIBITS
The exhibits listed below are filed or incorporated by reference as part of this Quarterly Report on Form 10-Q:
Inline XBRL Instance Document - the Instance Document does not appear in the interactive data file because its XBRL tags are embedded within the Inline XBRL Document.
Pursuant to the requirements of the Securities Exchange Act of 1934, the Registrant has duly caused this Report to be signed on its behalf by the undersigned thereunto duly authorized.
BLACKBAUD, INC.
Date:
November 3, 2025
By:
/s/ Michael P. Gianoni
Michael P. Gianoni
Chief Executive Officer, President and Vice Chairman of the Board
(Principal Executive Officer)
Date:
November 3, 2025
By:
/s/ Chad M. Anderson
Chad M. Anderson
Executive Vice President and Chief Financial Officer