| Project San Jacinto SUPPLEMENTAL SCHEDULES FOR THE BOARD OF DIRECTORS OF BATTALION OIL CORPORATION SEPTEMBER 1 8 , 2024 | CONFIDENTIAL |

| CONFIDENTIAL Table of Contents 2 Page 1. Selected Public Market Observations 3 2. Benchmarking Data 7 3. Selected Technical Observations 12 4. Pricing 20 5. NAV Analysis Detail 22 6. Glossary of Selected Terms 32 7. Disclaimer 35 |
| Page 1. Selected Public Market Observations 3 2. Benchmarking Data 7 3. Selected Technical Observations 12 4. Pricing 20 5. NAV Analysis Detail 22 6. Glossary of Selected Terms 32 7. Disclaimer 35 |
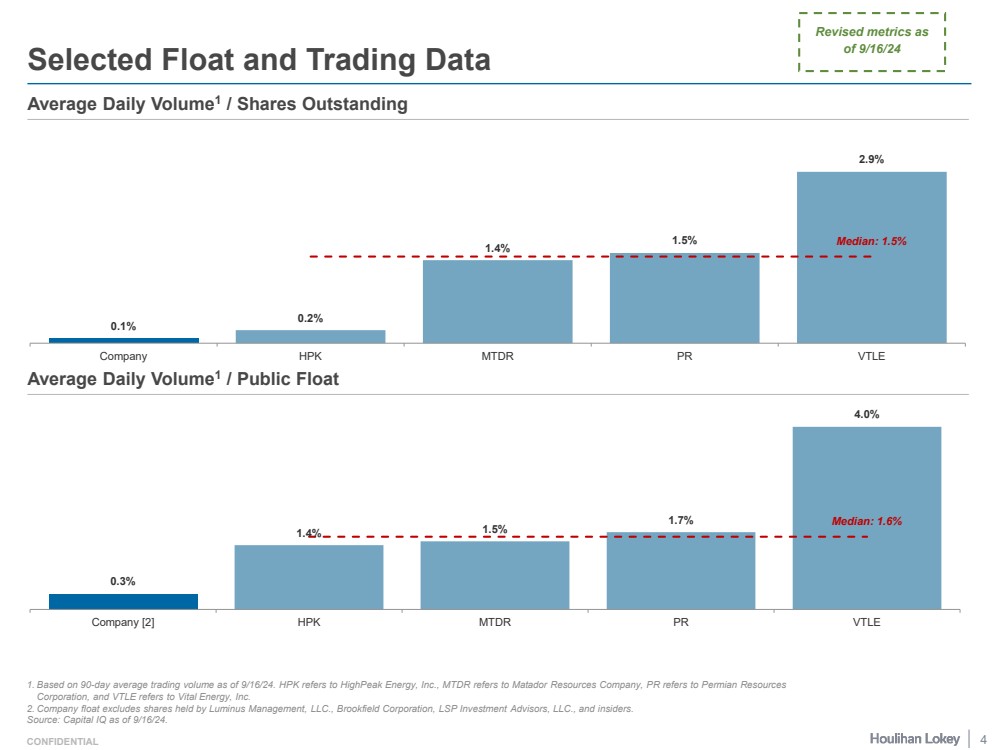
| CONFIDENTIAL Selected Float and Trading Data Average Daily Volume1 / Shares Outstanding Average Daily Volume1 / Public Float 1. Based on 90-day average trading volume as of 9/16/24. HPK refers to HighPeak Energy, Inc., MTDR refers to Matador Resources Company, PR refers to Permian Resources Corporation, and VTLE refers to Vital Energy, Inc. 2. Company float excludes shares held by Luminus Management, LLC., Brookfield Corporation, LSP Investment Advisors, LLC., and insiders. Source: Capital IQ as of 9/16/24. Revised metrics as of 9/16/24 4 0.1% 0.2% 1.4% 1.5% 2.9% Median: 1.5% Company HPK MTDR PR VTLE 0.3% 1.4% 1.5% 1.7% 4.0% Median: 1.6% Company [2] HPK MTDR PR VTLE |
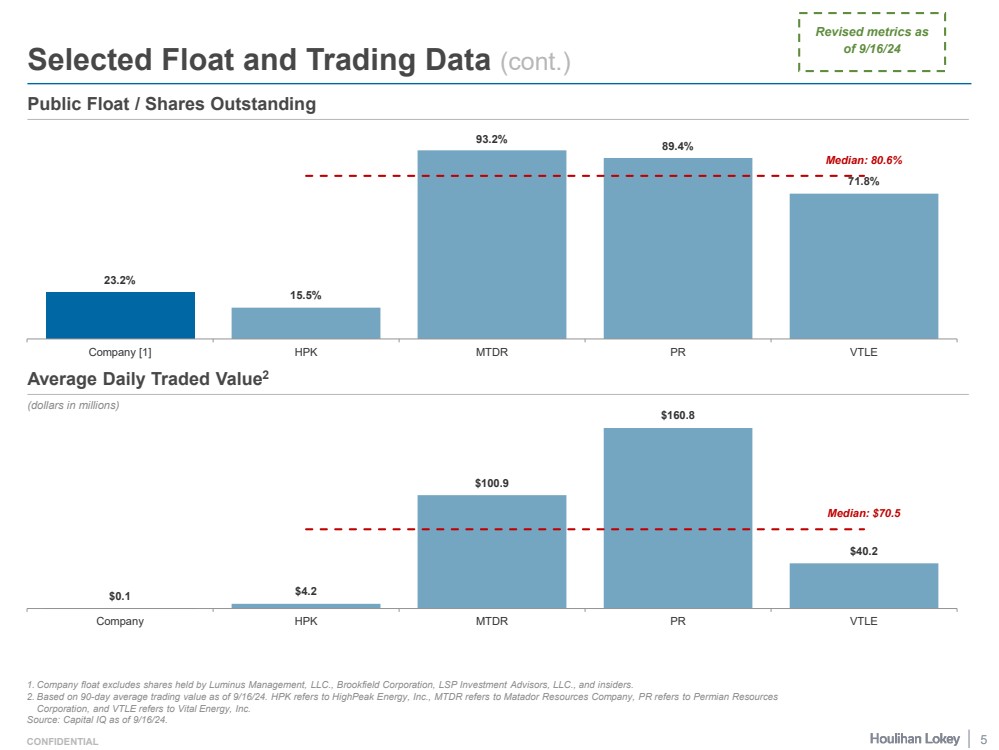
| CONFIDENTIAL Selected Float and Trading Data (cont.) Public Float / Shares Outstanding Average Daily Traded Value2 (dollars in millions) 1. Company float excludes shares held by Luminus Management, LLC., Brookfield Corporation, LSP Investment Advisors, LLC., and insiders. 2. Based on 90-day average trading value as of 9/16/24. HPK refers to HighPeak Energy, Inc., MTDR refers to Matador Resources Company, PR refers to Permian Resources Corporation, and VTLE refers to Vital Energy, Inc. Source: Capital IQ as of 9/16/24. Revised metrics as of 9/16/24 5 $0.1 $4.2 $100.9 $160.8 $40.2 Median: $70.5 Company HPK MTDR PR VTLE 23.2% 15.5% 93.2% 89.4% 71.8% Median: 80.6% Company [1] HPK MTDR PR VTLE |
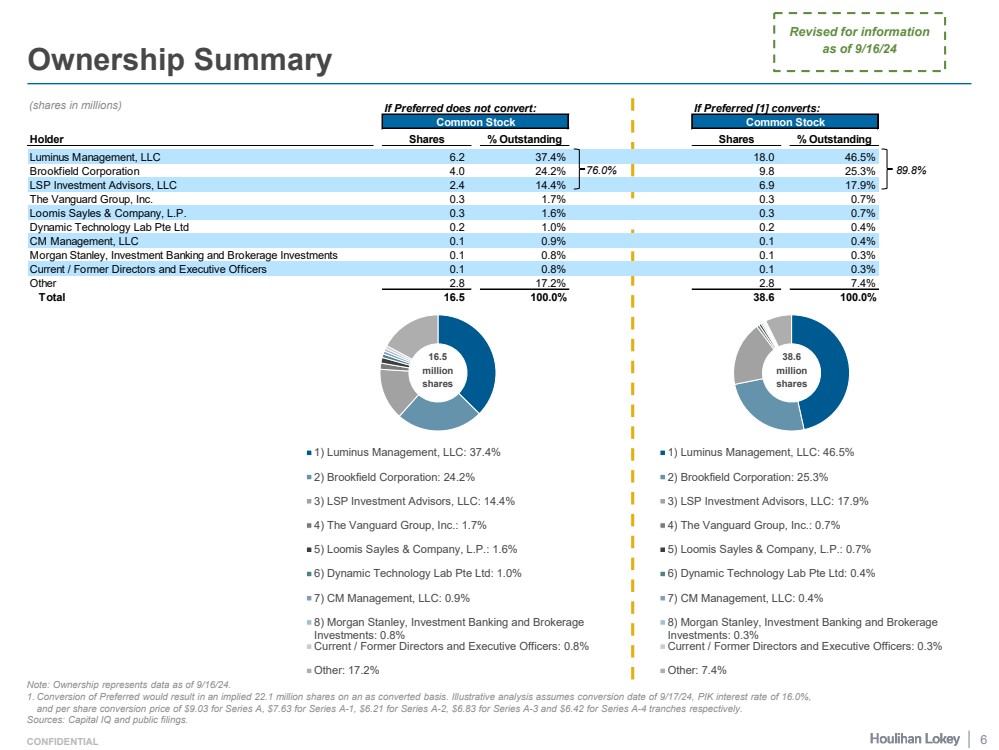
| CONFIDENTIAL Ownership Summary 16.5 million shares Note: Ownership represents data as of 9/16/24. 1. Conversion of Preferred would result in an implied 22.1 million shares on an as converted basis. Illustrative analysis assumes conversion date of 9/17/24, PIK interest rate of 16.0%, and per share conversion price of $9.03 for Series A, $7.63 for Series A-1, $6.21 for Series A-2, $6.83 for Series A-3 and $6.42 for Series A-4 tranches respectively. Sources: Capital IQ and public filings. (shares in millions) 38.6 million shares Revised for information as of 9/16/24 1) Luminus Management, LLC: 37.4% 2) Brookfield Corporation: 24.2% 3) LSP Investment Advisors, LLC: 14.4% 4) The Vanguard Group, Inc.: 1.7% 5) Loomis Sayles & Company, L.P.: 1.6% 6) Dynamic Technology Lab Pte Ltd: 1.0% 7) CM Management, LLC: 0.9% 8) Morgan Stanley, Investment Banking and Brokerage Investments: 0.8% Current / Former Directors and Executive Officers: 0.8% Other: 17.2% 6 If Preferred does not convert: If Preferred [1] converts: Common Stock Common Stock Holder Shares % Outstanding Shares % Outstanding Luminus Management, LLC 6.2 37.4% 18.0 46.5% Brookfield Corporation 4.0 24.2% 76.0% 9.8 25.3% 89.8% LSP Investment Advisors, LLC 2.4 14.4% 6.9 17.9% The Vanguard Group, Inc. 0.3 1.7% 0.3 0.7% Loomis Sayles & Company, L.P. 0.3 1.6% 0.3 0.7% Dynamic Technology Lab Pte Ltd 0.2 1.0% 0.2 0.4% CM Management, LLC 0.1 0.9% 0.1 0.4% Morgan Stanley, Investment Banking and Brokerage Investments 0.1 0.8% 0.1 0.3% Current / Former Directors and Executive Officers 0.1 0.8% 0.1 0.3% Other 2.8 17.2% 2.8 7.4% Total 16.5 100.0% 38.6 100.0% 1) Luminus Management, LLC: 46.5% 2) Brookfield Corporation: 25.3% 3) LSP Investment Advisors, LLC: 17.9% 4) The Vanguard Group, Inc.: 0.7% 5) Loomis Sayles & Company, L.P.: 0.7% 6) Dynamic Technology Lab Pte Ltd: 0.4% 7) CM Management, LLC: 0.4% 8) Morgan Stanley, Investment Banking and Brokerage Investments: 0.3% Current / Former Directors and Executive Officers: 0.3% Other: 7.4% |
| Page 1. Selected Public Market Observations 3 2. Benchmarking Data 7 3. Selected Technical Observations 12 4. Pricing 20 5. NAV Analysis Detail 22 6. Glossary of Selected Terms 32 7. Disclaimer 35 |
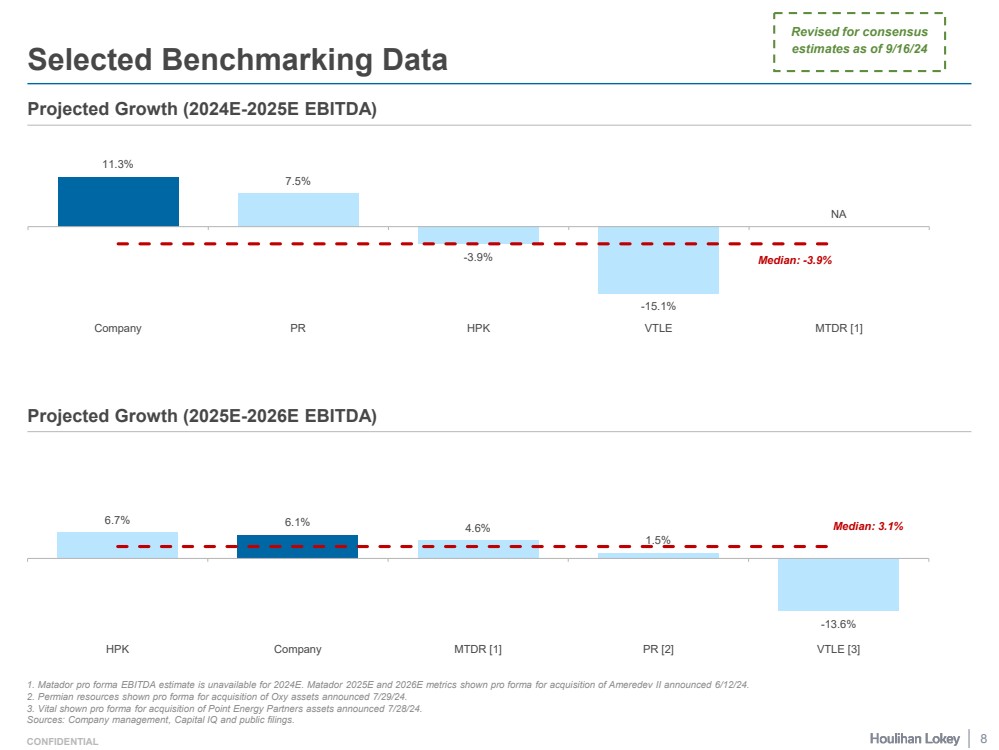
| CONFIDENTIAL 6.7% 6.1% 4.6% 1.5% -13.6% Median: 3.1% HPK Company MTDR [1] PR [2] VTLE [3] Selected Benchmarking Data Projected Growth (2024E-2025E EBITDA) 1. Matador pro forma EBITDA estimate is unavailable for 2024E. Matador 2025E and 2026E metrics shown pro forma for acquisition of Ameredev II announced 6/12/24. 2. Permian resources shown pro forma for acquisition of Oxy assets announced 7/29/24. 3. Vital shown pro forma for acquisition of Point Energy Partners assets announced 7/28/24. Sources: Company management, Capital IQ and public filings. Projected Growth (2025E-2026E EBITDA) Revised for consensus estimates as of 9/16/24 8 11.3% 7.5% -3.9% -15.1% NA Median: -3.9% Company PR HPK VTLE MTDR [1] |
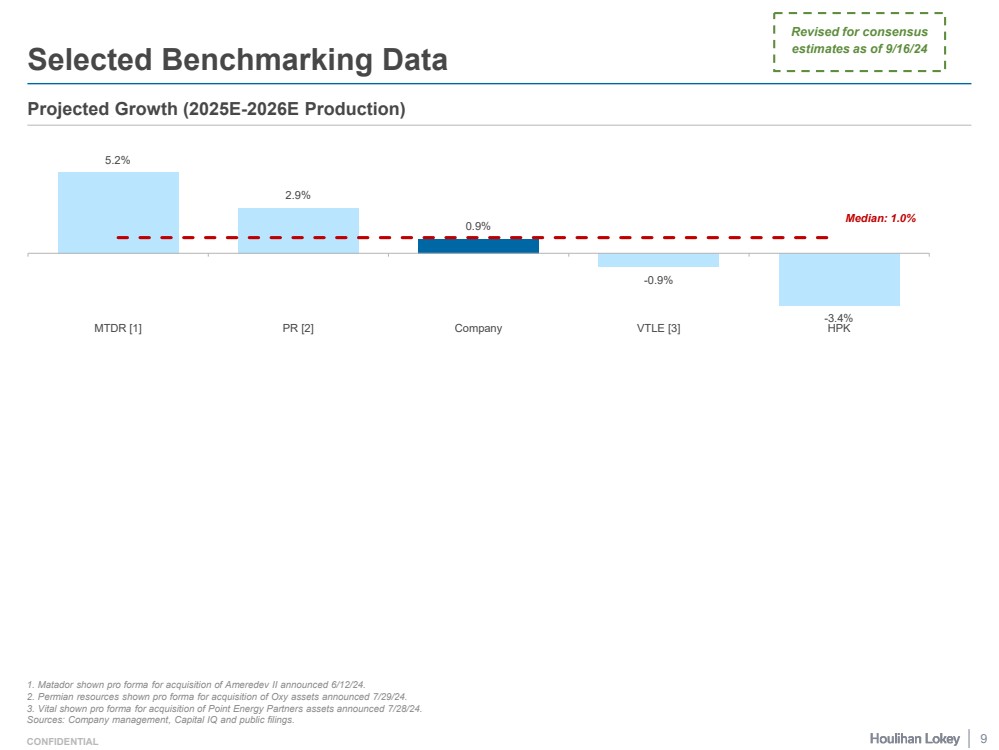
| CONFIDENTIAL 5.2% 2.9% 0.9% -0.9% -3.4% Median: 1.0% MTDR [1] PR [2] Company VTLE [3] HPK Selected Benchmarking Data 1. Matador shown pro forma for acquisition of Ameredev II announced 6/12/24. 2. Permian resources shown pro forma for acquisition of Oxy assets announced 7/29/24. 3. Vital shown pro forma for acquisition of Point Energy Partners assets announced 7/28/24. Sources: Company management, Capital IQ and public filings. Projected Growth (2025E-2026E Production) 9 Revised for consensus estimates as of 9/16/24 |
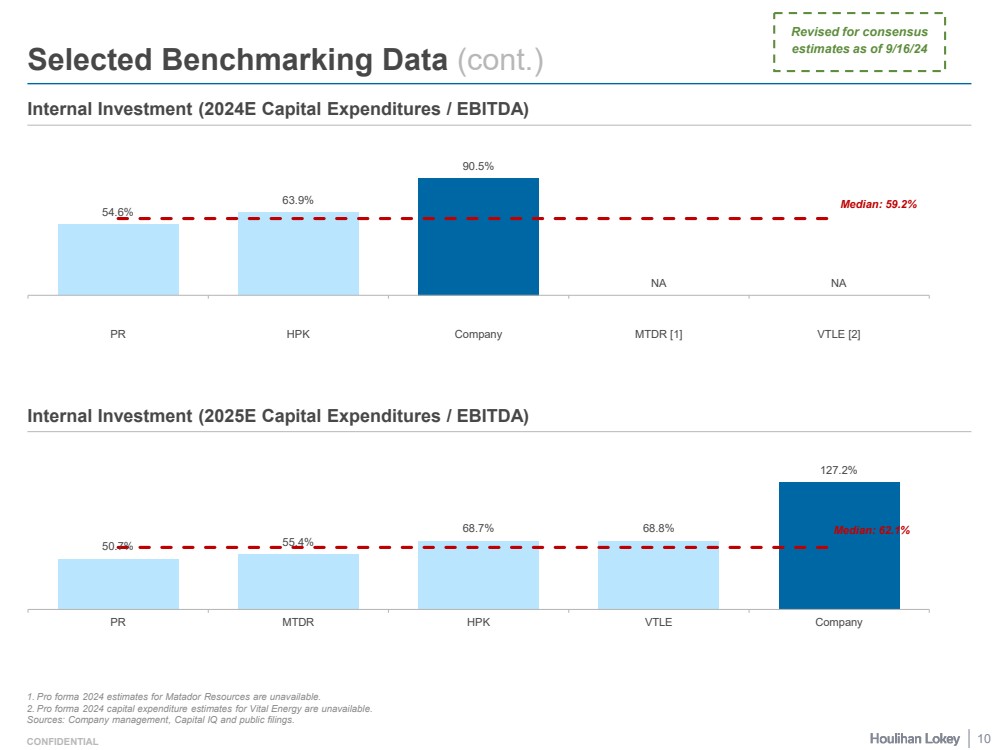
| CONFIDENTIAL Selected Benchmarking Data (cont.) Internal Investment (2024E Capital Expenditures / EBITDA) Internal Investment (2025E Capital Expenditures / EBITDA) 1. Pro forma 2024 estimates for Matador Resources are unavailable. 2. Pro forma 2024 capital expenditure estimates for Vital Energy are unavailable. Sources: Company management, Capital IQ and public filings. Revised for consensus estimates as of 9/16/24 10 54.6% 63.9% 90.5% NA NA Median: 59.2% PR HPK Company MTDR [1] VTLE [2] 50.7% 55.4% 68.7% 68.8% 127.2% Median: 62.1% PR MTDR HPK VTLE Company |
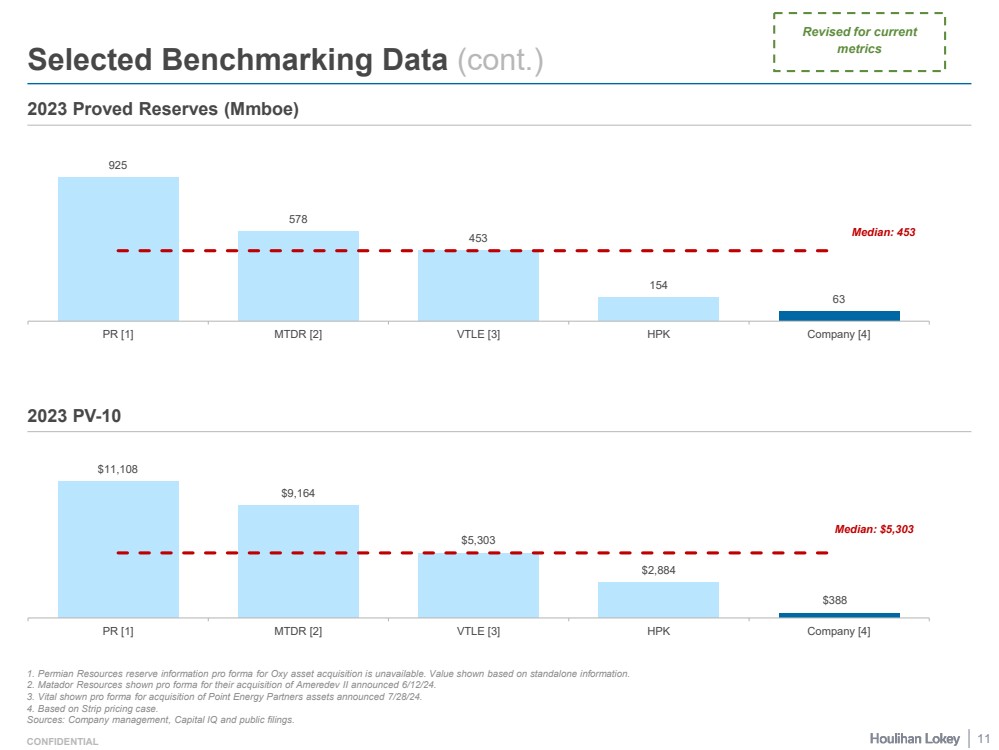
| CONFIDENTIAL $11,108 $9,164 $5,303 $2,884 $388 Median: $5,303 PR [1] MTDR [2] VTLE [3] HPK Company [4] Selected Benchmarking Data (cont.) 2023 Proved Reserves (Mmboe) 2023 PV-10 1. Permian Resources reserve information pro forma for Oxy asset acquisition is unavailable. Value shown based on standalone information. 2. Matador Resources shown pro forma for their acquisition of Ameredev II announced 6/12/24. 3. Vital shown pro forma for acquisition of Point Energy Partners assets announced 7/28/24. 4. Based on Strip pricing case. Sources: Company management, Capital IQ and public filings. Revised for current metrics 11 925 578 453 154 63 Median: 453 PR [1] MTDR [2] VTLE [3] HPK Company [4] |
| Page 1. Selected Public Market Observations 3 2. Benchmarking Data 7 3. Selected Technical Observations 12 4. Pricing 20 5. NAV Analysis Detail 22 6. Glossary of Selected Terms 32 7. Disclaimer 35 |
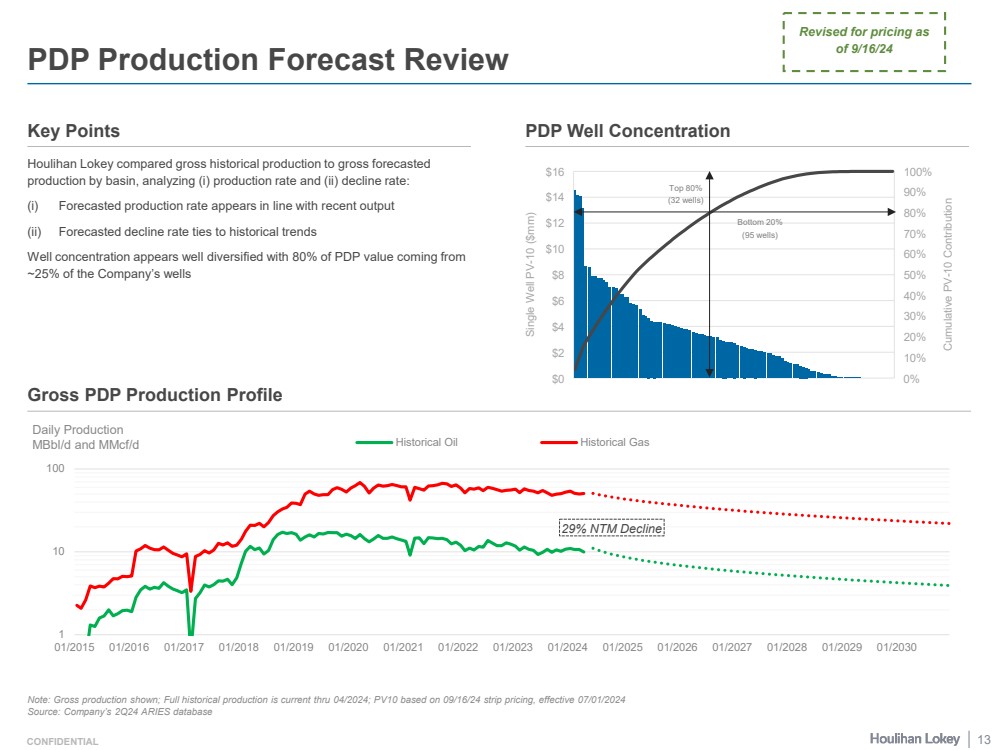
| CONFIDENTIAL PDP Production Forecast Review Houlihan Lokey compared gross historical production to gross forecasted production by basin, analyzing (i) production rate and (ii) decline rate: (i) Forecasted production rate appears in line with recent output (ii) Forecasted decline rate ties to historical trends Well concentration appears well diversified with 80% of PDP value coming from ~25% of the Company’s wells Note: Gross production shown; Full historical production is current thru 04/2024; PV10 based on 09/16/24 strip pricing, effective 07/01/2024 Source: Company’s 2Q24 ARIES database Key Points Gross PDP Production Profile Revised for pricing as of 9/16/24 PDP Well Concentration 13 Single Well PV-10 ($mm) $0 $2 $4 $6 $8 $10 $12 $14 $16 Cumulative PV-10 Contribution 0% 10% 20% 30% 40% 50% 60% 70% 80% 90% 100% Top 80% (32 wells) Bottom 20% (95 wells) 1 10 100 01/2015 01/2016 01/2017 01/2018 01/2019 01/2020 01/2021 01/2022 01/2023 01/2024 01/2025 01/2026 01/2027 01/2028 01/2029 01/2030 Daily Production MBbl/d and MMcf/d Historical Oil Historical Gas 29% NTM Decline |
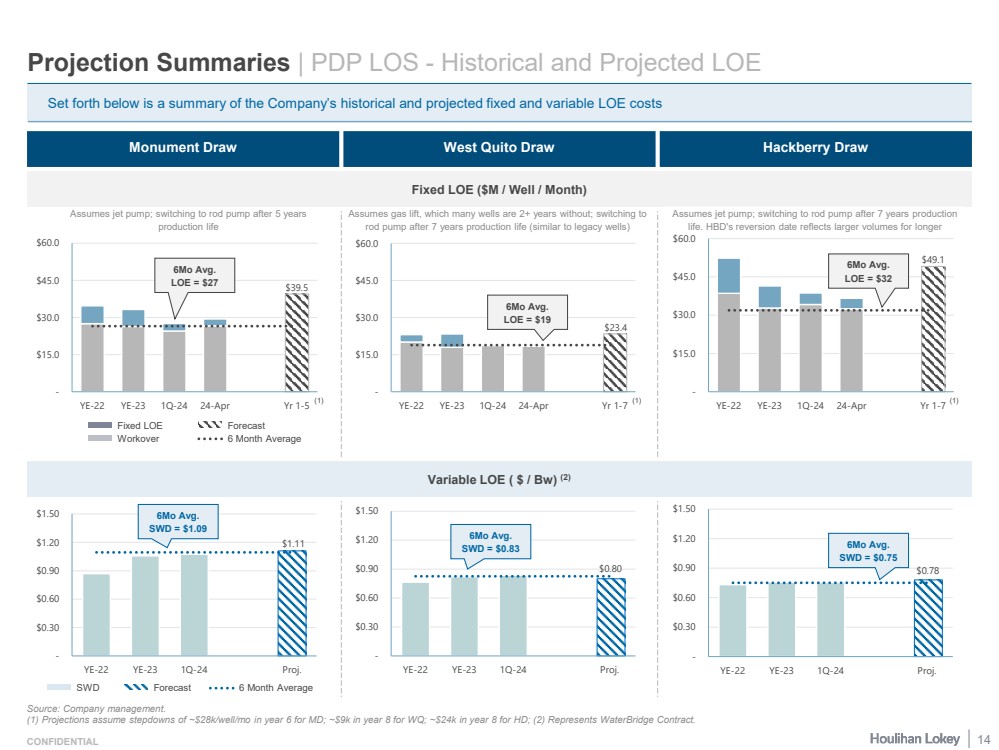
| CONFIDENTIAL Projection Summaries | PDP LOS - Historical and Projected LOE Set forth below is a summary of the Company’s historical and projected fixed and variable LOE costs Source: Company management. (1) Projections assume stepdowns of ~$28k/well/mo in year 6 for MD; ~$9k in year 8 for WQ; ~$24k in year 8 for HD; (2) Represents WaterBridge Contract. Monument Draw West Quito Draw Hackberry Draw Fixed LOE ($M / Well / Month) Variable LOE ( $ / Bw) (2) $0.78 - $0.30 $0.60 $0.90 $1.20 $1.50 YE-22 YE-23 1Q-24 Proj. $0.80 - $0.30 $0.60 $0.90 $1.20 $1.50 YE-22 YE-23 1Q-24 Proj. $1.11 - $0.30 $0.60 $0.90 $1.20 $1.50 YE-22 YE-23 1Q-24 Proj. $49.1 - $15.0 $30.0 $45.0 $60.0 YE-22 YE-23 1Q-24 24-Apr Yr 1-7 $23.4 - $15.0 $30.0 $45.0 $60.0 YE-22 YE-23 1Q-24 24-Apr Yr 1-7 $39.5 - $15.0 $30.0 $45.0 $60.0 YE-22 YE-23 1Q-24 24-Apr Yr 1-5 Assumes gas lift, which many wells are 2+ years without; switching to rod pump after 7 years production life (similar to legacy wells) Assumes jet pump; switching to rod pump after 5 years production life Assumes jet pump; switching to rod pump after 7 years production life. HBD's reversion date reflects larger volumes for longer SWD Forecast Fixed LOE Forecast Workover 6 Month Average 6Mo Avg. LOE = $19 6Mo Avg. LOE = $27 6Mo Avg. LOE = $32 6 Month Average 6Mo Avg. SWD = $1.09 6Mo Avg. SWD = $0.83 6Mo Avg. SWD = $0.75 (1) (1) (1) 14 |
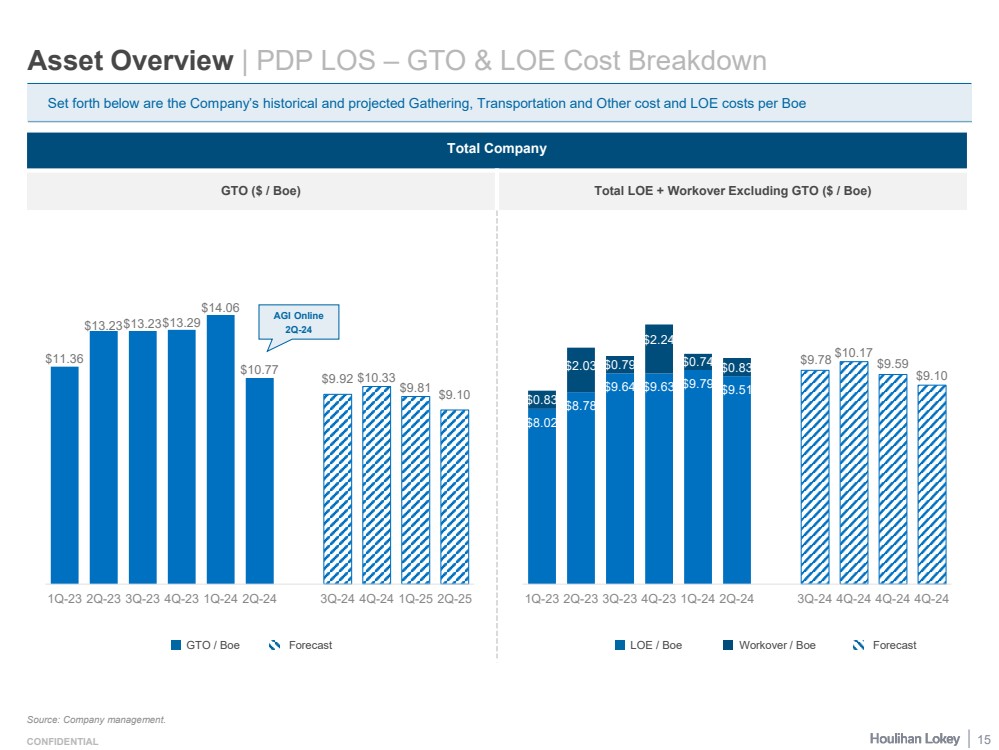
| CONFIDENTIAL Asset Overview | PDP LOS – GTO & LOE Cost Breakdown Set forth below are the Company’s historical and projected Gathering, Transportation and Other cost and LOE costs per Boe Source: Company management. Total Company GTO ($ / Boe) Total LOE + Workover Excluding GTO ($ / Boe) GTO / Boe Forecast LOE / Boe Workover / Boe Forecast $11.36 $13.23 $13.23 $13.29 $14.06 $10.77 $9.92 $10.33 $9.81 $9.10 1Q-23 2Q-23 3Q-23 4Q-23 1Q-24 2Q-24 3Q-24 4Q-24 1Q-25 2Q-25 $8.02 $8.78 $9.64 $9.63 $9.79 $9.51 $9.78 $10.17 $9.59 $9.10 $0.83 $2.03 $0.79 $2.24 $0.74 $0.83 1Q-23 2Q-23 3Q-23 4Q-23 1Q-24 2Q-24 3Q-24 4Q-24 4Q-24 4Q-24 AGI Online 2Q-24 15 |
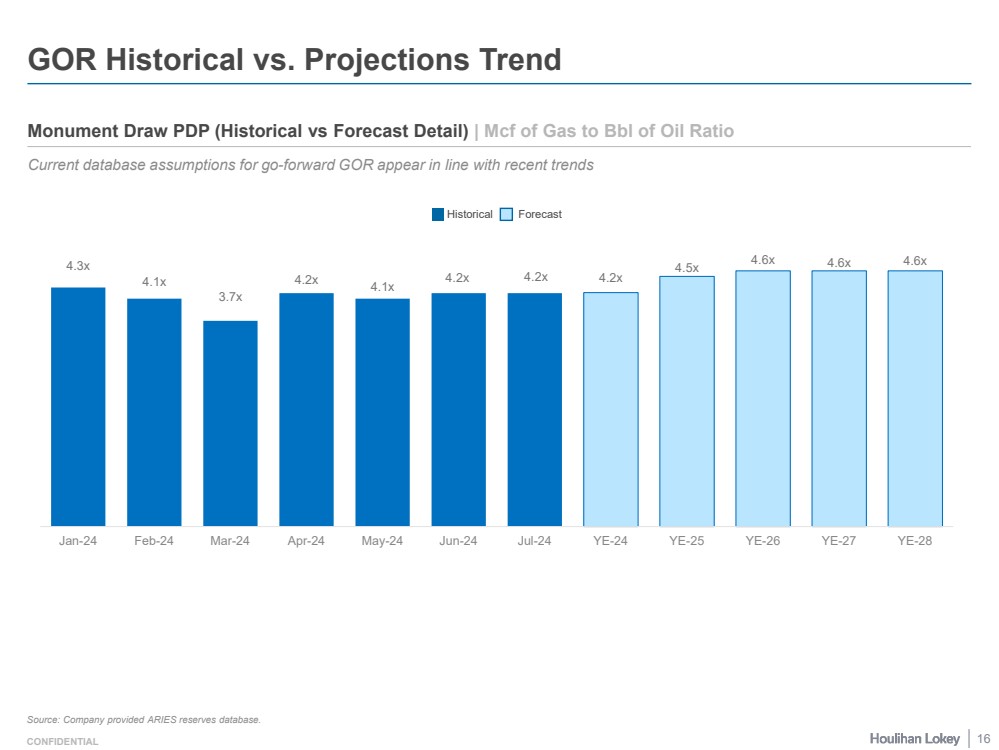
| CONFIDENTIAL GOR Historical vs. Projections Trend Monument Draw PDP (Historical vs Forecast Detail) | Mcf of Gas to Bbl of Oil Ratio Source: Company provided ARIES reserves database. Current database assumptions for go-forward GOR appear in line with recent trends Historical Forecast 4.3x 4.1x 3.7x 4.2x 4.1x 4.2x 4.2x 4.2x 4.5x 4.6x 4.6x 4.6x Jan-24 Feb-24 Mar-24 Apr-24 May-24 Jun-24 Jul-24 YE-24 YE-25 YE-26 YE-27 YE-28 16 |
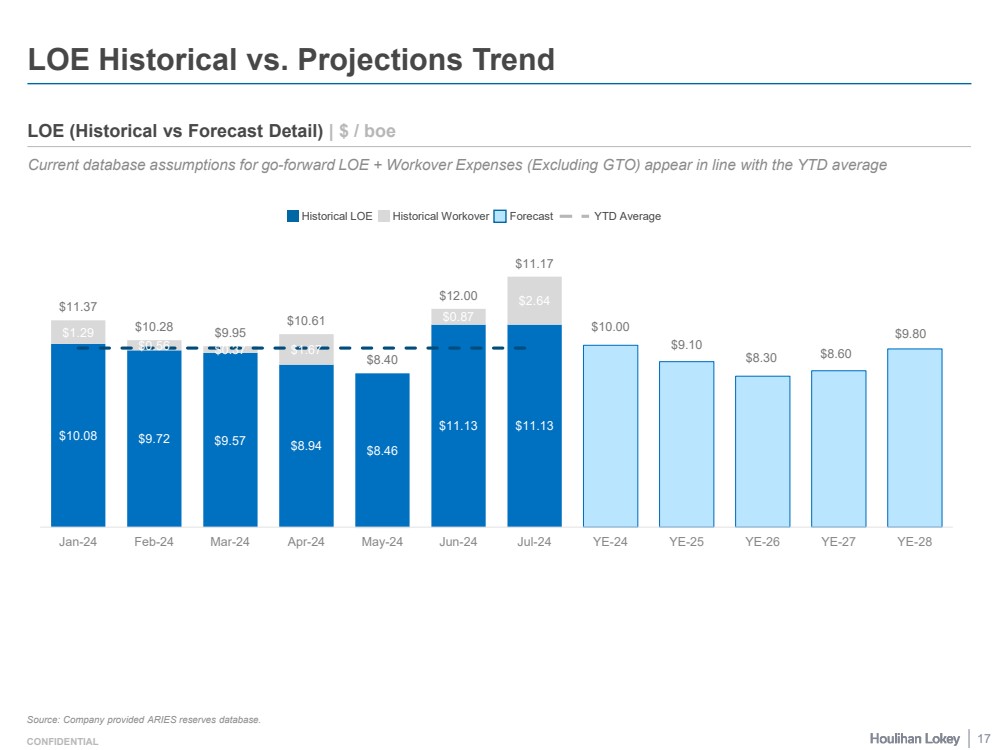
| CONFIDENTIAL $10.08 $9.72 $9.57 $8.94 $8.46 $11.13 $11.13 $1.29 $0.56 $0.37 $1.67 $0.87 $2.64 $10.00 $9.10 $8.30 $8.60 $9.80 $11.37 $10.28 $9.95 $10.61 $8.40 $12.00 $11.17 Jan-24 Feb-24 Mar-24 Apr-24 May-24 Jun-24 Jul-24 YE-24 YE-25 YE-26 YE-27 YE-28 LOE Historical vs. Projections Trend Source: Company provided ARIES reserves database. Current database assumptions for go-forward LOE + Workover Expenses (Excluding GTO) appear in line with the YTD average LOE (Historical vs Forecast Detail) | $ / boe Historical LOE Historical Workover Forecast YTD Average 17 |
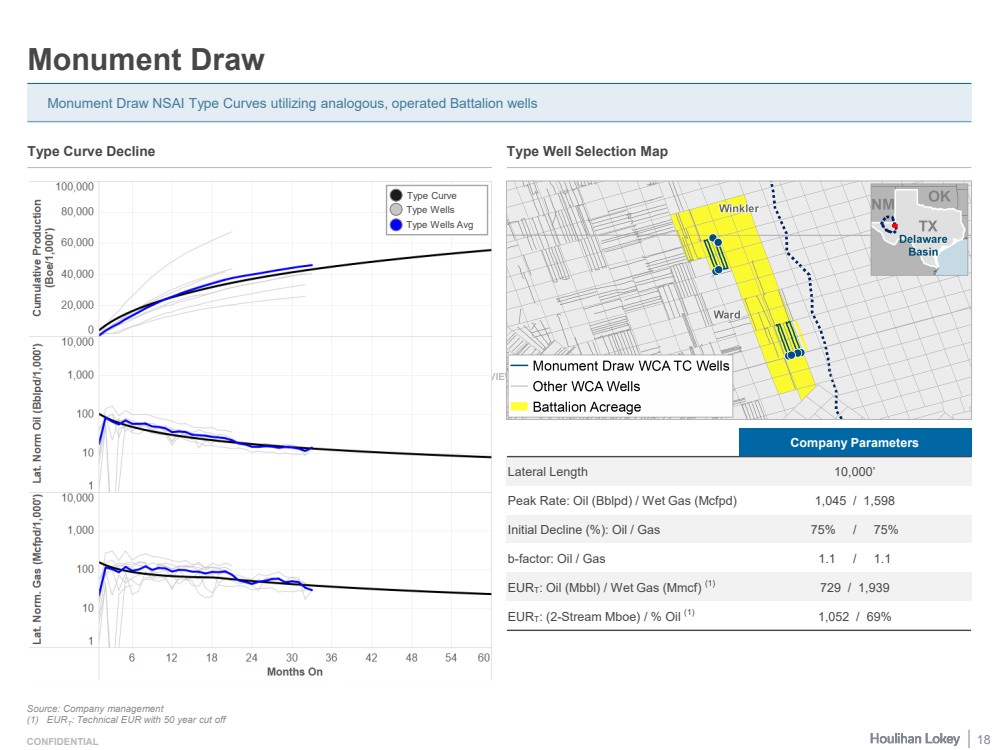
| CONFIDENTIAL - PRELIMINARY DRAFT - SUBJECT TO FURTHER REVIEW CONFIDENTIAL Type Curve Decline Monument Draw Type Well Selection Map Monument Draw NSAI Type Curves utilizing analogous, operated Battalion wells Company Parameters Lateral Length 10,000’ Peak Rate: Oil (Bblpd) / Wet Gas (Mcfpd) 1,045 / 1,598 Initial Decline (%): Oil / Gas 75% / 75% b-factor: Oil / Gas 1.1 / 1.1 EURT: Oil (Mbbl) / Wet Gas (Mmcf) (1) 729 / 1,939 EURT: (2-Stream Mboe) / % Oil (1) 1,052 / 69% Type Curve Type Wells BATL Type Wells Avg Source: Company management (1) EURT: Technical EUR with 50 year cut off 18 |
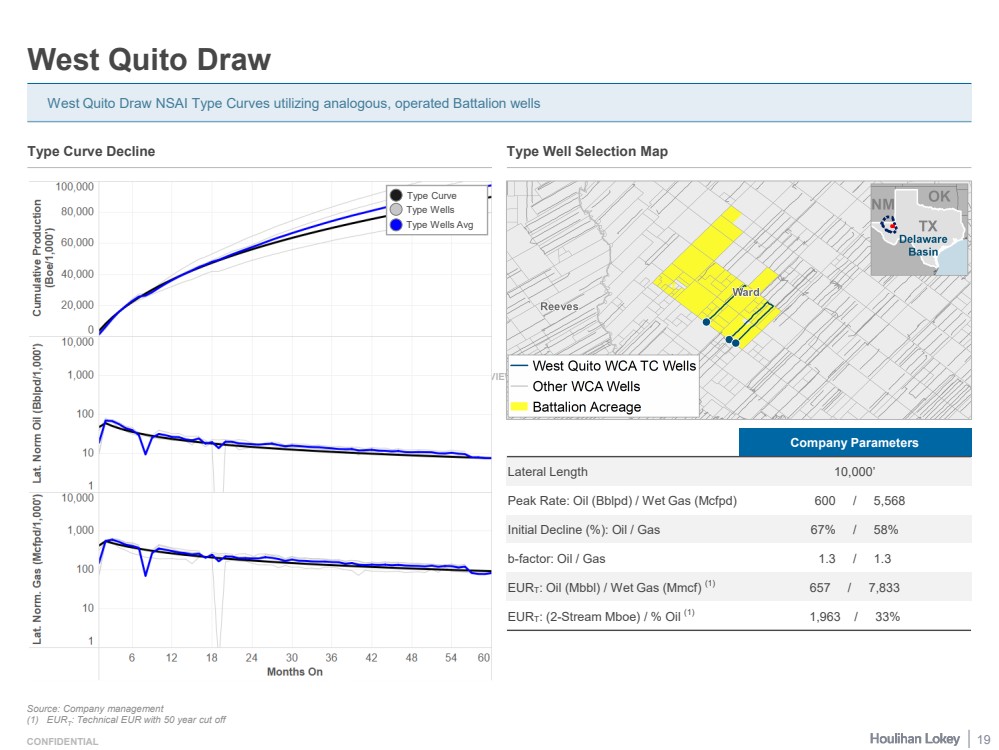
| CONFIDENTIAL - PRELIMINARY DRAFT - SUBJECT TO FURTHER REVIEW CONFIDENTIAL Type Curve Decline West Quito Draw Type Well Selection Map West Quito Draw NSAI Type Curves utilizing analogous, operated Battalion wells Company Parameters Lateral Length 10,000’ Peak Rate: Oil (Bblpd) / Wet Gas (Mcfpd) 600 / 5,568 Initial Decline (%): Oil / Gas 67% / 58% b-factor: Oil / Gas 1.3 / 1.3 EURT: Oil (Mbbl) / Wet Gas (Mmcf) (1) 657 / 7,833 EURT: (2-Stream Mboe) / % Oil (1) 1,963 / 33% Type Curve Type Wells BATL Type Wells Avg Source: Company management (1) EURT: Technical EUR with 50 year cut off 19 |
| Page 1. Selected Public Market Observations 3 2. Benchmarking Data 7 3. Selected Technical Observations 12 4. Pricing 20 5. NAV Analysis Detail 22 6. Glossary of Selected Terms 32 7. Disclaimer 35 |
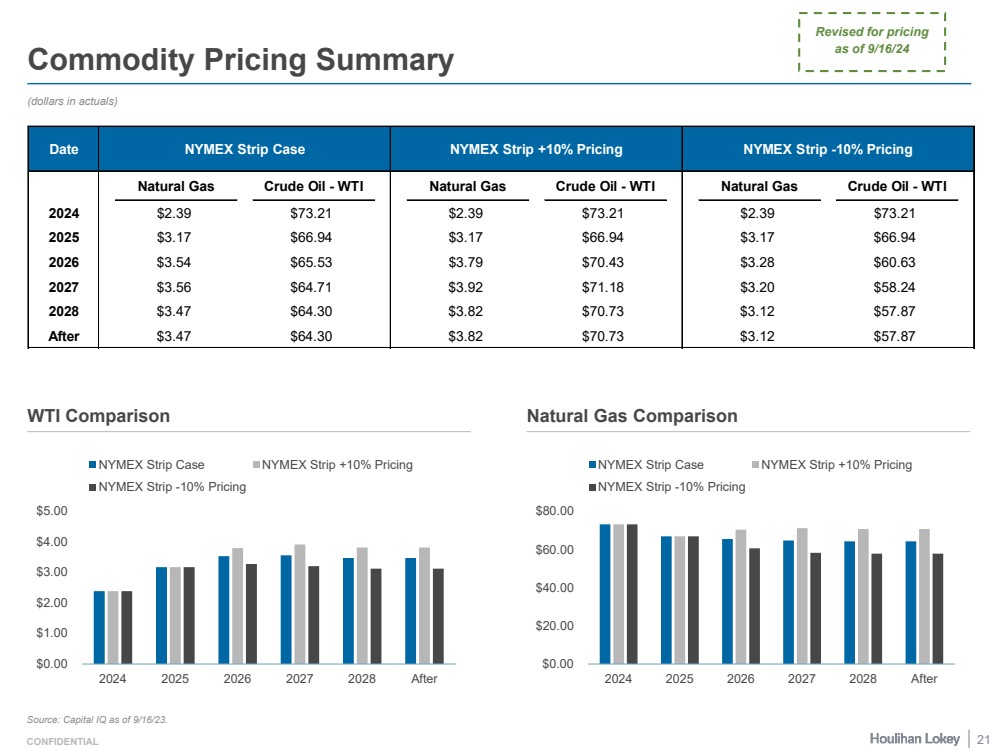
| CONFIDENTIAL Commodity Pricing Summary (dollars in actuals) WTI Comparison Natural Gas Comparison Source: Capital IQ as of 9/16/23. Revised for pricing as of 9/16/24 21 $0.00 $1.00 $2.00 $3.00 $4.00 $5.00 2024 2025 2026 2027 2028 After NYMEX Strip Case NYMEX Strip +10% Pricing NYMEX Strip -10% Pricing $0.00 $20.00 $40.00 $60.00 $80.00 2024 2025 2026 2027 2028 After NYMEX Strip Case NYMEX Strip +10% Pricing NYMEX Strip -10% Pricing Date NYMEX Strip Case NYMEX Strip +10% Pricing NYMEX Strip -10% Pricing Natural Gas Crude Oil - WTI Natural Gas Crude Oil - WTI Natural Gas Crude Oil - WTI 2024 $2.39 $73.21 $2.39 $73.21 $2.39 $73.21 2025 $3.17 $66.94 $3.17 $66.94 $3.17 $66.94 2026 $3.54 $65.53 $3.79 $70.43 $3.28 $60.63 2027 $3.56 $64.71 $3.92 $71.18 $3.20 $58.24 2028 $3.47 $64.30 $3.82 $70.73 $3.12 $57.87 After $3.47 $64.30 $3.82 $70.73 $3.12 $57.87 |
| Page 1. Selected Public Market Observations 3 2. Benchmarking Data 7 3. Selected Technical Observations 12 4. Pricing 20 5. NAV Analysis Detail 22 6. Glossary of Selected Terms 32 7. Disclaimer 35 |
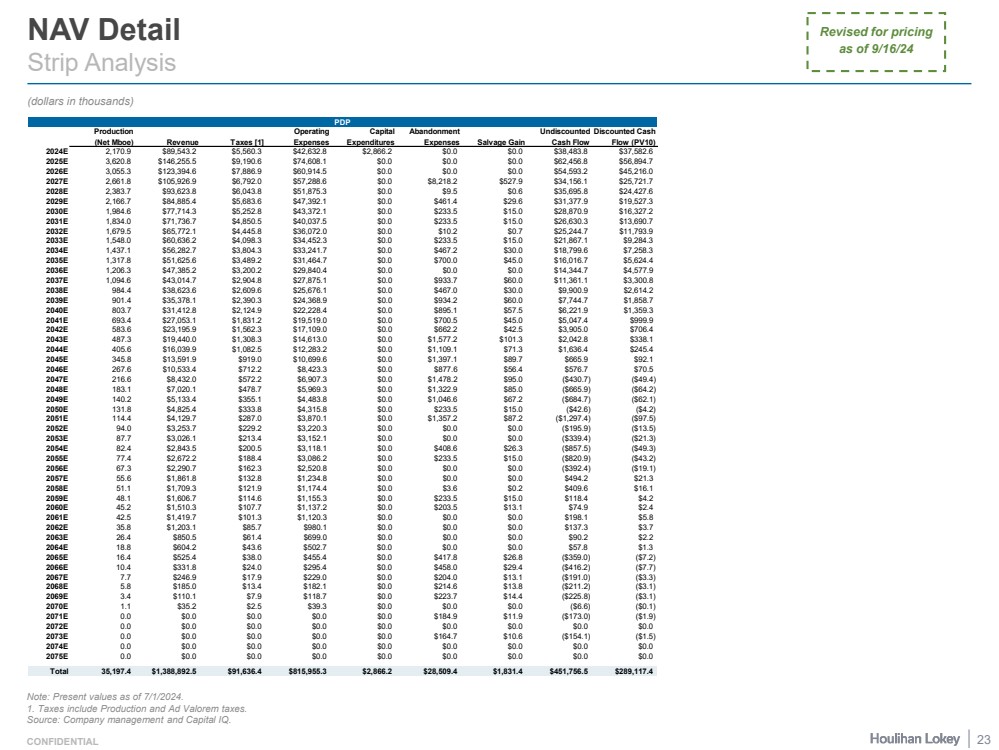
| CONFIDENTIAL NAV Detail Strip Analysis (dollars in thousands) Note: Present values as of 7/1/2024. 1. Taxes include Production and Ad Valorem taxes. Source: Company management and Capital IQ. Revised for pricing as of 9/16/24 23 PDP Production (Net Mboe) Revenue Taxes [1] Operating Expenses Capital Expenditures Abandonment Expenses Salvage Gain Undiscounted Cash Flow Discounted Cash Flow (PV10) 2024E 2,170.9 $89,543.2 $5,560.3 $42,632.8 $2,866.2 $0.0 $0.0 $38,483.8 $37,582.6 2025E 3,620.8 $146,255.5 $9,190.6 $74,608.1 $0.0 $0.0 $0.0 $62,456.8 $56,894.7 2026E 3,055.3 $123,394.6 $7,886.9 $60,914.5 $0.0 $0.0 $0.0 $54,593.2 $45,216.0 2027E 2,661.8 $105,926.9 $6,792.0 $57,288.6 $0.0 $8,218.2 $527.9 $34,156.1 $25,721.7 2028E 2,383.7 $93,623.8 $6,043.8 $51,875.3 $0.0 $9.5 $0.6 $35,695.8 $24,427.6 2029E 2,166.7 $84,885.4 $5,683.6 $47,392.1 $0.0 $461.4 $29.6 $31,377.9 $19,527.3 2030E 1,984.6 $77,714.3 $5,252.8 $43,372.1 $0.0 $233.5 $15.0 $28,870.9 $16,327.2 2031E 1,834.0 $71,736.7 $4,850.5 $40,037.5 $0.0 $233.5 $15.0 $26,630.3 $13,690.7 2032E 1,679.5 $65,772.1 $4,445.8 $36,072.0 $0.0 $10.2 $0.7 $25,244.7 $11,793.9 2033E 1,548.0 $60,636.2 $4,098.3 $34,452.3 $0.0 $233.5 $15.0 $21,867.1 $9,284.3 2034E 1,437.1 $56,282.7 $3,804.3 $33,241.7 $0.0 $467.2 $30.0 $18,799.6 $7,258.3 2035E 1,317.8 $51,625.6 $3,489.2 $31,464.7 $0.0 $700.0 $45.0 $16,016.7 $5,624.4 2036E 1,206.3 $47,385.2 $3,200.2 $29,840.4 $0.0 $0.0 $0.0 $14,344.7 $4,577.9 2037E 1,094.6 $43,014.7 $2,904.8 $27,875.1 $0.0 $933.7 $60.0 $11,361.1 $3,300.8 2038E 984.4 $38,623.6 $2,609.6 $25,676.1 $0.0 $467.0 $30.0 $9,900.9 $2,614.2 2039E 901.4 $35,378.1 $2,390.3 $24,368.9 $0.0 $934.2 $60.0 $7,744.7 $1,858.7 2040E 803.7 $31,412.8 $2,124.9 $22,228.4 $0.0 $895.1 $57.5 $6,221.9 $1,359.3 2041E 693.4 $27,053.1 $1,831.2 $19,519.0 $0.0 $700.5 $45.0 $5,047.4 $999.9 2042E 583.6 $23,195.9 $1,562.3 $17,109.0 $0.0 $662.2 $42.5 $3,905.0 $706.4 2043E 487.3 $19,440.0 $1,308.3 $14,613.0 $0.0 $1,577.2 $101.3 $2,042.8 $338.1 2044E 405.6 $16,039.9 $1,082.5 $12,283.2 $0.0 $1,109.1 $71.3 $1,636.4 $245.4 2045E 345.8 $13,591.9 $919.0 $10,699.6 $0.0 $1,397.1 $89.7 $665.9 $92.1 2046E 267.6 $10,533.4 $712.2 $8,423.3 $0.0 $877.6 $56.4 $576.7 $70.5 2047E 216.6 $8,432.0 $572.2 $6,907.3 $0.0 $1,478.2 $95.0 ($430.7) ($49.4) 2048E 183.1 $7,020.1 $478.7 $5,969.3 $0.0 $1,322.9 $85.0 ($665.9) ($64.2) 2049E 140.2 $5,133.4 $355.1 $4,483.8 $0.0 $1,046.6 $67.2 ($684.7) ($62.1) 2050E 131.8 $4,825.4 $333.8 $4,315.8 $0.0 $233.5 $15.0 ($42.6) ($4.2) 2051E 114.4 $4,129.7 $287.0 $3,870.1 $0.0 $1,357.2 $87.2 ($1,297.4) ($97.5) 2052E 94.0 $3,253.7 $229.2 $3,220.3 $0.0 $0.0 $0.0 ($195.9) ($13.5) 2053E 87.7 $3,026.1 $213.4 $3,152.1 $0.0 $0.0 $0.0 ($339.4) ($21.3) 2054E 82.4 $2,843.5 $200.5 $3,118.1 $0.0 $408.6 $26.3 ($857.5) ($49.3) 2055E 77.4 $2,672.2 $188.4 $3,086.2 $0.0 $233.5 $15.0 ($820.9) ($43.2) 2056E 67.3 $2,290.7 $162.3 $2,520.8 $0.0 $0.0 $0.0 ($392.4) ($19.1) 2057E 55.6 $1,861.8 $132.8 $1,234.8 $0.0 $0.0 $0.0 $494.2 $21.3 2058E 51.1 $1,709.3 $121.9 $1,174.4 $0.0 $3.6 $0.2 $409.6 $16.1 2059E 48.1 $1,606.7 $114.6 $1,155.3 $0.0 $233.5 $15.0 $118.4 $4.2 2060E 45.2 $1,510.3 $107.7 $1,137.2 $0.0 $203.5 $13.1 $74.9 $2.4 2061E 42.5 $1,419.7 $101.3 $1,120.3 $0.0 $0.0 $0.0 $198.1 $5.8 2062E 35.8 $1,203.1 $85.7 $980.1 $0.0 $0.0 $0.0 $137.3 $3.7 2063E 26.4 $850.5 $61.4 $699.0 $0.0 $0.0 $0.0 $90.2 $2.2 2064E 18.8 $604.2 $43.6 $502.7 $0.0 $0.0 $0.0 $57.8 $1.3 2065E 16.4 $525.4 $38.0 $455.4 $0.0 $417.8 $26.8 ($359.0) ($7.2) 2066E 10.4 $331.8 $24.0 $295.4 $0.0 $458.0 $29.4 ($416.2) ($7.7) 2067E 7.7 $246.9 $17.9 $229.0 $0.0 $204.0 $13.1 ($191.0) ($3.3) 2068E 5.8 $185.0 $13.4 $182.1 $0.0 $214.6 $13.8 ($211.2) ($3.1) 2069E 3.4 $110.1 $7.9 $118.7 $0.0 $223.7 $14.4 ($225.8) ($3.1) 2070E 1.1 $35.2 $2.5 $39.3 $0.0 $0.0 $0.0 ($6.6) ($0.1) 2071E 0.0 $0.0 $0.0 $0.0 $0.0 $184.9 $11.9 ($173.0) ($1.9) 2072E 0.0 $0.0 $0.0 $0.0 $0.0 $0.0 $0.0 $0.0 $0.0 2073E 0.0 $0.0 $0.0 $0.0 $0.0 $164.7 $10.6 ($154.1) ($1.5) 2074E 0.0 $0.0 $0.0 $0.0 $0.0 $0.0 $0.0 $0.0 $0.0 2075E 0.0 $0.0 $0.0 $0.0 $0.0 $0.0 $0.0 $0.0 $0.0 Total 35,197.4 $1,388,892.5 $91,636.4 $815,955.3 $2,866.2 $28,509.4 $1,831.4 $451,756.5 $289,117.4 |
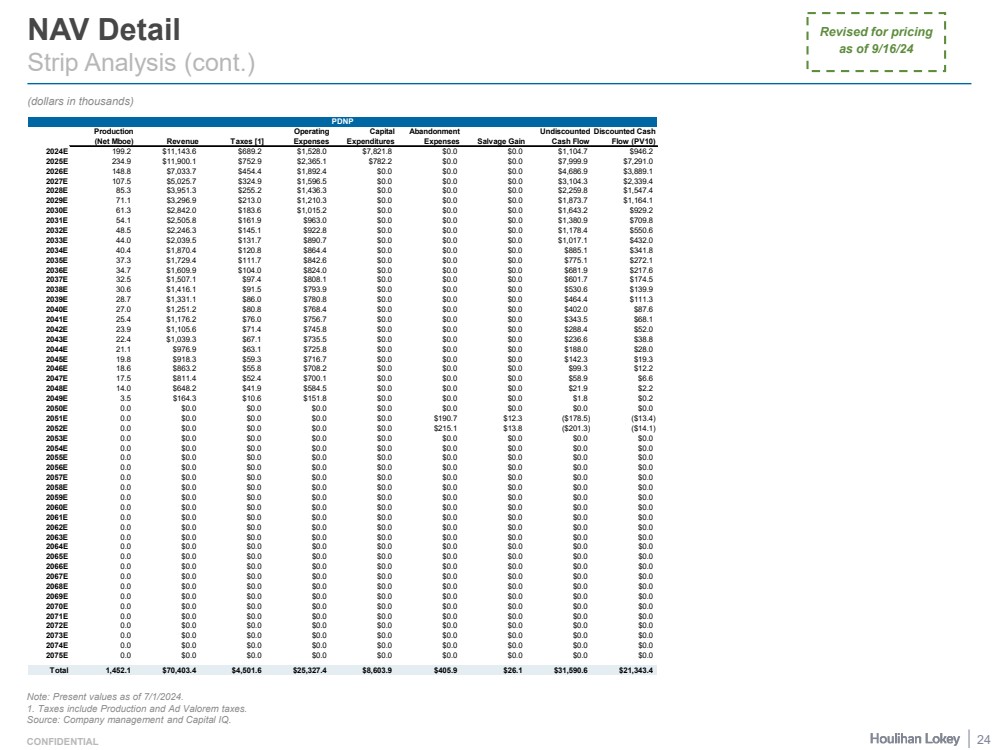
| CONFIDENTIAL NAV Detail Strip Analysis (cont.) (dollars in thousands) Note: Present values as of 7/1/2024. 1. Taxes include Production and Ad Valorem taxes. Source: Company management and Capital IQ. 24 Revised for pricing as of 9/16/24 PDNP Production (Net Mboe) Revenue Taxes [1] Operating Expenses Capital Expenditures Abandonment Expenses Salvage Gain Undiscounted Cash Flow Discounted Cash Flow (PV10) 2024E 199.2 $11,143.6 $689.2 $1,528.0 $7,821.8 $0.0 $0.0 $1,104.7 $946.2 2025E 234.9 $11,900.1 $752.9 $2,365.1 $782.2 $0.0 $0.0 $7,999.9 $7,291.0 2026E 148.8 $7,033.7 $454.4 $1,892.4 $0.0 $0.0 $0.0 $4,686.9 $3,889.1 2027E 107.5 $5,025.7 $324.9 $1,596.5 $0.0 $0.0 $0.0 $3,104.3 $2,339.4 2028E 85.3 $3,951.3 $255.2 $1,436.3 $0.0 $0.0 $0.0 $2,259.8 $1,547.4 2029E 71.1 $3,296.9 $213.0 $1,210.3 $0.0 $0.0 $0.0 $1,873.7 $1,164.1 2030E 61.3 $2,842.0 $183.6 $1,015.2 $0.0 $0.0 $0.0 $1,643.2 $929.2 2031E 54.1 $2,505.8 $161.9 $963.0 $0.0 $0.0 $0.0 $1,380.9 $709.8 2032E 48.5 $2,246.3 $145.1 $922.8 $0.0 $0.0 $0.0 $1,178.4 $550.6 2033E 44.0 $2,039.5 $131.7 $890.7 $0.0 $0.0 $0.0 $1,017.1 $432.0 2034E 40.4 $1,870.4 $120.8 $864.4 $0.0 $0.0 $0.0 $885.1 $341.8 2035E 37.3 $1,729.4 $111.7 $842.6 $0.0 $0.0 $0.0 $775.1 $272.1 2036E 34.7 $1,609.9 $104.0 $824.0 $0.0 $0.0 $0.0 $681.9 $217.6 2037E 32.5 $1,507.1 $97.4 $808.1 $0.0 $0.0 $0.0 $601.7 $174.5 2038E 30.6 $1,416.1 $91.5 $793.9 $0.0 $0.0 $0.0 $530.6 $139.9 2039E 28.7 $1,331.1 $86.0 $780.8 $0.0 $0.0 $0.0 $464.4 $111.3 2040E 27.0 $1,251.2 $80.8 $768.4 $0.0 $0.0 $0.0 $402.0 $87.6 2041E 25.4 $1,176.2 $76.0 $756.7 $0.0 $0.0 $0.0 $343.5 $68.1 2042E 23.9 $1,105.6 $71.4 $745.8 $0.0 $0.0 $0.0 $288.4 $52.0 2043E 22.4 $1,039.3 $67.1 $735.5 $0.0 $0.0 $0.0 $236.6 $38.8 2044E 21.1 $976.9 $63.1 $725.8 $0.0 $0.0 $0.0 $188.0 $28.0 2045E 19.8 $918.3 $59.3 $716.7 $0.0 $0.0 $0.0 $142.3 $19.3 2046E 18.6 $863.2 $55.8 $708.2 $0.0 $0.0 $0.0 $99.3 $12.2 2047E 17.5 $811.4 $52.4 $700.1 $0.0 $0.0 $0.0 $58.9 $6.6 2048E 14.0 $648.2 $41.9 $584.5 $0.0 $0.0 $0.0 $21.9 $2.2 2049E 3.5 $164.3 $10.6 $151.8 $0.0 $0.0 $0.0 $1.8 $0.2 2050E 0.0 $0.0 $0.0 $0.0 $0.0 $0.0 $0.0 $0.0 $0.0 2051E 0.0 $0.0 $0.0 $0.0 $0.0 $190.7 $12.3 ($178.5) ($13.4) 2052E 0.0 $0.0 $0.0 $0.0 $0.0 $215.1 $13.8 ($201.3) ($14.1) 2053E 0.0 $0.0 $0.0 $0.0 $0.0 $0.0 $0.0 $0.0 $0.0 2054E 0.0 $0.0 $0.0 $0.0 $0.0 $0.0 $0.0 $0.0 $0.0 2055E 0.0 $0.0 $0.0 $0.0 $0.0 $0.0 $0.0 $0.0 $0.0 2056E 0.0 $0.0 $0.0 $0.0 $0.0 $0.0 $0.0 $0.0 $0.0 2057E 0.0 $0.0 $0.0 $0.0 $0.0 $0.0 $0.0 $0.0 $0.0 2058E 0.0 $0.0 $0.0 $0.0 $0.0 $0.0 $0.0 $0.0 $0.0 2059E 0.0 $0.0 $0.0 $0.0 $0.0 $0.0 $0.0 $0.0 $0.0 2060E 0.0 $0.0 $0.0 $0.0 $0.0 $0.0 $0.0 $0.0 $0.0 2061E 0.0 $0.0 $0.0 $0.0 $0.0 $0.0 $0.0 $0.0 $0.0 2062E 0.0 $0.0 $0.0 $0.0 $0.0 $0.0 $0.0 $0.0 $0.0 2063E 0.0 $0.0 $0.0 $0.0 $0.0 $0.0 $0.0 $0.0 $0.0 2064E 0.0 $0.0 $0.0 $0.0 $0.0 $0.0 $0.0 $0.0 $0.0 2065E 0.0 $0.0 $0.0 $0.0 $0.0 $0.0 $0.0 $0.0 $0.0 2066E 0.0 $0.0 $0.0 $0.0 $0.0 $0.0 $0.0 $0.0 $0.0 2067E 0.0 $0.0 $0.0 $0.0 $0.0 $0.0 $0.0 $0.0 $0.0 2068E 0.0 $0.0 $0.0 $0.0 $0.0 $0.0 $0.0 $0.0 $0.0 2069E 0.0 $0.0 $0.0 $0.0 $0.0 $0.0 $0.0 $0.0 $0.0 2070E 0.0 $0.0 $0.0 $0.0 $0.0 $0.0 $0.0 $0.0 $0.0 2071E 0.0 $0.0 $0.0 $0.0 $0.0 $0.0 $0.0 $0.0 $0.0 2072E 0.0 $0.0 $0.0 $0.0 $0.0 $0.0 $0.0 $0.0 $0.0 2073E 0.0 $0.0 $0.0 $0.0 $0.0 $0.0 $0.0 $0.0 $0.0 2074E 0.0 $0.0 $0.0 $0.0 $0.0 $0.0 $0.0 $0.0 $0.0 2075E 0.0 $0.0 $0.0 $0.0 $0.0 $0.0 $0.0 $0.0 $0.0 Total 1,452.1 $70,403.4 $4,501.6 $25,327.4 $8,603.9 $405.9 $26.1 $31,590.6 $21,343.4 |
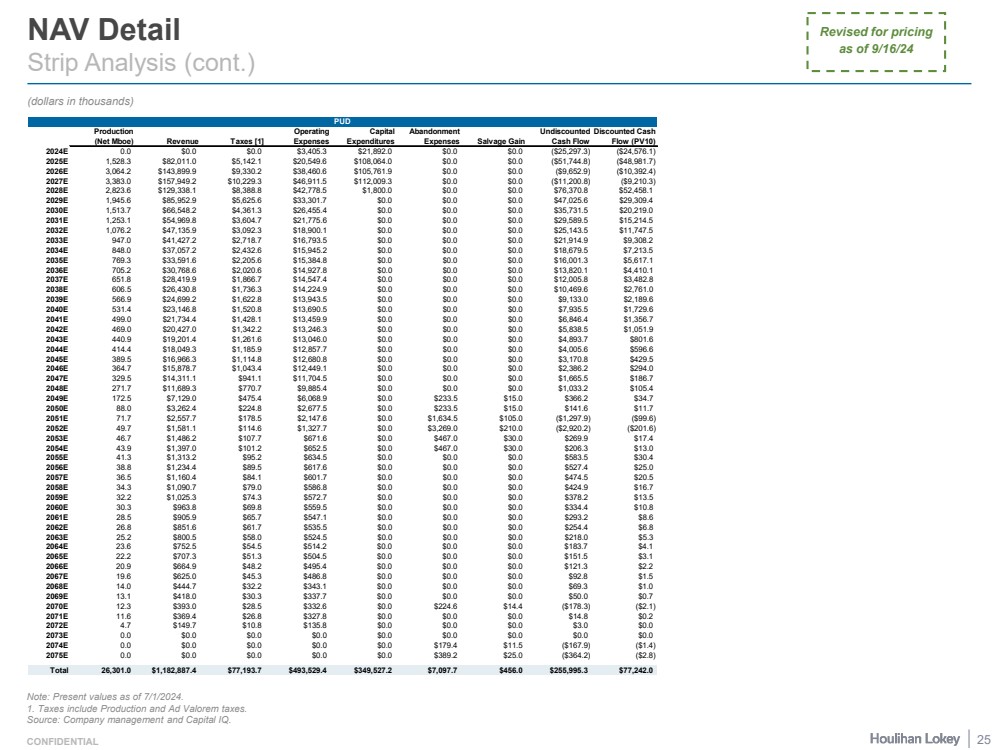
| CONFIDENTIAL NAV Detail Strip Analysis (cont.) (dollars in thousands) Note: Present values as of 7/1/2024. 1. Taxes include Production and Ad Valorem taxes. Source: Company management and Capital IQ. 25 Revised for pricing as of 9/16/24 Production (Net Mboe) Revenue Taxes [1] Operating Expenses Capital Expenditures Abandonment Expenses Salvage Gain Undiscounted Cash Flow Discounted Cash Flow (PV10) 2024E 0.0 $0.0 $0.0 $3,405.3 $21,892.0 $0.0 $0.0 ($25,297.3) ($24,576.1) 2025E 1,528.3 $82,011.0 $5,142.1 $20,549.6 $108,064.0 $0.0 $0.0 ($51,744.8) ($48,981.7) 2026E 3,064.2 $143,899.9 $9,330.2 $38,460.6 $105,761.9 $0.0 $0.0 ($9,652.9) ($10,392.4) 2027E 3,383.0 $157,949.2 $10,229.3 $46,911.5 $112,009.3 $0.0 $0.0 ($11,200.8) ($9,210.3) 2028E 2,823.6 $129,338.1 $8,388.8 $42,778.5 $1,800.0 $0.0 $0.0 $76,370.8 $52,458.1 2029E 1,945.6 $85,952.9 $5,625.6 $33,301.7 $0.0 $0.0 $0.0 $47,025.6 $29,309.4 2030E 1,513.7 $66,548.2 $4,361.3 $26,455.4 $0.0 $0.0 $0.0 $35,731.5 $20,219.0 2031E 1,253.1 $54,969.8 $3,604.7 $21,775.6 $0.0 $0.0 $0.0 $29,589.5 $15,214.5 2032E 1,076.2 $47,135.9 $3,092.3 $18,900.1 $0.0 $0.0 $0.0 $25,143.5 $11,747.5 2033E 947.0 $41,427.2 $2,718.7 $16,793.5 $0.0 $0.0 $0.0 $21,914.9 $9,308.2 2034E 848.0 $37,057.2 $2,432.6 $15,945.2 $0.0 $0.0 $0.0 $18,679.5 $7,213.5 2035E 769.3 $33,591.6 $2,205.6 $15,384.8 $0.0 $0.0 $0.0 $16,001.3 $5,617.1 2036E 705.2 $30,768.6 $2,020.6 $14,927.8 $0.0 $0.0 $0.0 $13,820.1 $4,410.1 2037E 651.8 $28,419.9 $1,866.7 $14,547.4 $0.0 $0.0 $0.0 $12,005.8 $3,482.8 2038E 606.5 $26,430.8 $1,736.3 $14,224.9 $0.0 $0.0 $0.0 $10,469.6 $2,761.0 2039E 566.9 $24,699.2 $1,622.8 $13,943.5 $0.0 $0.0 $0.0 $9,133.0 $2,189.6 2040E 531.4 $23,146.8 $1,520.8 $13,690.5 $0.0 $0.0 $0.0 $7,935.5 $1,729.6 2041E 499.0 $21,734.4 $1,428.1 $13,459.9 $0.0 $0.0 $0.0 $6,846.4 $1,356.7 2042E 469.0 $20,427.0 $1,342.2 $13,246.3 $0.0 $0.0 $0.0 $5,838.5 $1,051.9 2043E 440.9 $19,201.4 $1,261.6 $13,046.0 $0.0 $0.0 $0.0 $4,893.7 $801.6 2044E 414.4 $18,049.3 $1,185.9 $12,857.7 $0.0 $0.0 $0.0 $4,005.6 $596.6 2045E 389.5 $16,966.3 $1,114.8 $12,680.8 $0.0 $0.0 $0.0 $3,170.8 $429.5 2046E 364.7 $15,878.7 $1,043.4 $12,449.1 $0.0 $0.0 $0.0 $2,386.2 $294.0 2047E 329.5 $14,311.1 $941.1 $11,704.5 $0.0 $0.0 $0.0 $1,665.5 $186.7 2048E 271.7 $11,689.3 $770.7 $9,885.4 $0.0 $0.0 $0.0 $1,033.2 $105.4 2049E 172.5 $7,129.0 $475.4 $6,068.9 $0.0 $233.5 $15.0 $366.2 $34.7 2050E 88.0 $3,262.4 $224.8 $2,677.5 $0.0 $233.5 $15.0 $141.6 $11.7 2051E 71.7 $2,557.7 $178.5 $2,147.6 $0.0 $1,634.5 $105.0 ($1,297.9) ($99.6) 2052E 49.7 $1,581.1 $114.6 $1,327.7 $0.0 $3,269.0 $210.0 ($2,920.2) ($201.6) 2053E 46.7 $1,486.2 $107.7 $671.6 $0.0 $467.0 $30.0 $269.9 $17.4 2054E 43.9 $1,397.0 $101.2 $652.5 $0.0 $467.0 $30.0 $206.3 $13.0 2055E 41.3 $1,313.2 $95.2 $634.5 $0.0 $0.0 $0.0 $583.5 $30.4 2056E 38.8 $1,234.4 $89.5 $617.6 $0.0 $0.0 $0.0 $527.4 $25.0 2057E 36.5 $1,160.4 $84.1 $601.7 $0.0 $0.0 $0.0 $474.5 $20.5 2058E 34.3 $1,090.7 $79.0 $586.8 $0.0 $0.0 $0.0 $424.9 $16.7 2059E 32.2 $1,025.3 $74.3 $572.7 $0.0 $0.0 $0.0 $378.2 $13.5 2060E 30.3 $963.8 $69.8 $559.5 $0.0 $0.0 $0.0 $334.4 $10.8 2061E 28.5 $905.9 $65.7 $547.1 $0.0 $0.0 $0.0 $293.2 $8.6 2062E 26.8 $851.6 $61.7 $535.5 $0.0 $0.0 $0.0 $254.4 $6.8 2063E 25.2 $800.5 $58.0 $524.5 $0.0 $0.0 $0.0 $218.0 $5.3 2064E 23.6 $752.5 $54.5 $514.2 $0.0 $0.0 $0.0 $183.7 $4.1 2065E 22.2 $707.3 $51.3 $504.5 $0.0 $0.0 $0.0 $151.5 $3.1 2066E 20.9 $664.9 $48.2 $495.4 $0.0 $0.0 $0.0 $121.3 $2.2 2067E 19.6 $625.0 $45.3 $486.8 $0.0 $0.0 $0.0 $92.8 $1.5 2068E 14.0 $444.7 $32.2 $343.1 $0.0 $0.0 $0.0 $69.3 $1.0 2069E 13.1 $418.0 $30.3 $337.7 $0.0 $0.0 $0.0 $50.0 $0.7 2070E 12.3 $393.0 $28.5 $332.6 $0.0 $224.6 $14.4 ($178.3) ($2.1) 2071E 11.6 $369.4 $26.8 $327.8 $0.0 $0.0 $0.0 $14.8 $0.2 2072E 4.7 $149.7 $10.8 $135.8 $0.0 $0.0 $0.0 $3.0 $0.0 2073E 0.0 $0.0 $0.0 $0.0 $0.0 $0.0 $0.0 $0.0 $0.0 2074E 0.0 $0.0 $0.0 $0.0 $0.0 $179.4 $11.5 ($167.9) ($1.4) 2075E 0.0 $0.0 $0.0 $0.0 $0.0 $389.2 $25.0 ($364.2) ($2.8) Total 26,301.0 $1,182,887.4 $77,193.7 $493,529.4 $349,527.2 $7,097.7 $456.0 $255,995.3 $77,242.0 PUD |
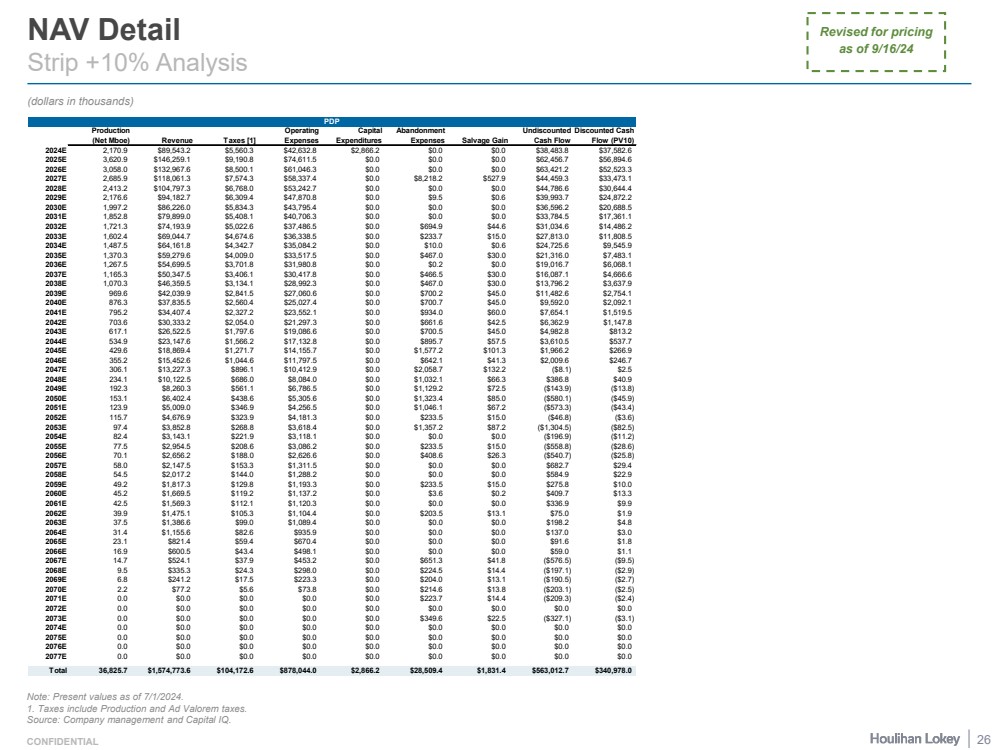
| CONFIDENTIAL NAV Detail Strip +10% Analysis (dollars in thousands) Note: Present values as of 7/1/2024. 1. Taxes include Production and Ad Valorem taxes. Source: Company management and Capital IQ. 26 Revised for pricing as of 9/16/24 PDP Production (Net Mboe) Revenue Taxes [1] Operating Expenses Capital Expenditures Abandonment Expenses Salvage Gain Undiscounted Cash Flow Discounted Cash Flow (PV10) 2024E 2,170.9 $89,543.2 $5,560.3 $42,632.8 $2,866.2 $0.0 $0.0 $38,483.8 $37,582.6 2025E 3,620.9 $146,259.1 $9,190.8 $74,611.5 $0.0 $0.0 $0.0 $62,456.7 $56,894.6 2026E 3,058.0 $132,967.6 $8,500.1 $61,046.3 $0.0 $0.0 $0.0 $63,421.2 $52,523.3 2027E 2,685.9 $118,061.3 $7,574.3 $58,337.4 $0.0 $8,218.2 $527.9 $44,459.3 $33,473.1 2028E 2,413.2 $104,797.3 $6,768.0 $53,242.7 $0.0 $0.0 $0.0 $44,786.6 $30,644.4 2029E 2,176.6 $94,182.7 $6,309.4 $47,870.8 $0.0 $9.5 $0.6 $39,993.7 $24,872.2 2030E 1,997.2 $86,226.0 $5,834.3 $43,795.4 $0.0 $0.0 $0.0 $36,596.2 $20,688.5 2031E 1,852.8 $79,899.0 $5,408.1 $40,706.3 $0.0 $0.0 $0.0 $33,784.5 $17,361.1 2032E 1,721.3 $74,193.9 $5,022.6 $37,486.5 $0.0 $694.9 $44.6 $31,034.6 $14,486.2 2033E 1,602.4 $69,044.7 $4,674.6 $36,338.5 $0.0 $233.7 $15.0 $27,813.0 $11,808.5 2034E 1,487.5 $64,161.8 $4,342.7 $35,084.2 $0.0 $10.0 $0.6 $24,725.6 $9,545.9 2035E 1,370.3 $59,279.6 $4,009.0 $33,517.5 $0.0 $467.0 $30.0 $21,316.0 $7,483.1 2036E 1,267.5 $54,699.5 $3,701.8 $31,980.8 $0.0 $0.2 $0.0 $19,016.7 $6,068.1 2037E 1,165.3 $50,347.5 $3,406.1 $30,417.8 $0.0 $466.5 $30.0 $16,087.1 $4,666.6 2038E 1,070.3 $46,359.5 $3,134.1 $28,992.3 $0.0 $467.0 $30.0 $13,796.2 $3,637.9 2039E 969.6 $42,039.9 $2,841.5 $27,060.6 $0.0 $700.2 $45.0 $11,482.6 $2,754.1 2040E 876.3 $37,835.5 $2,560.4 $25,027.4 $0.0 $700.7 $45.0 $9,592.0 $2,092.1 2041E 795.2 $34,407.4 $2,327.2 $23,552.1 $0.0 $934.0 $60.0 $7,654.1 $1,519.5 2042E 703.6 $30,333.2 $2,054.0 $21,297.3 $0.0 $661.6 $42.5 $6,362.9 $1,147.8 2043E 617.1 $26,522.5 $1,797.6 $19,086.6 $0.0 $700.5 $45.0 $4,982.8 $813.2 2044E 534.9 $23,147.6 $1,566.2 $17,132.8 $0.0 $895.7 $57.5 $3,610.5 $537.7 2045E 429.6 $18,869.4 $1,271.7 $14,155.7 $0.0 $1,577.2 $101.3 $1,966.2 $266.9 2046E 355.2 $15,452.6 $1,044.6 $11,797.5 $0.0 $642.1 $41.3 $2,009.6 $246.7 2047E 306.1 $13,227.3 $896.1 $10,412.9 $0.0 $2,058.7 $132.2 ($8.1) $2.5 2048E 234.1 $10,122.5 $686.0 $8,084.0 $0.0 $1,032.1 $66.3 $386.8 $40.9 2049E 192.3 $8,260.3 $561.1 $6,786.5 $0.0 $1,129.2 $72.5 ($143.9) ($13.8) 2050E 153.1 $6,402.4 $438.6 $5,305.6 $0.0 $1,323.4 $85.0 ($580.1) ($45.9) 2051E 123.9 $5,009.0 $346.9 $4,256.5 $0.0 $1,046.1 $67.2 ($573.3) ($43.4) 2052E 115.7 $4,676.9 $323.9 $4,181.3 $0.0 $233.5 $15.0 ($46.8) ($3.6) 2053E 97.4 $3,852.8 $268.8 $3,618.4 $0.0 $1,357.2 $87.2 ($1,304.5) ($82.5) 2054E 82.4 $3,143.1 $221.9 $3,118.1 $0.0 $0.0 $0.0 ($196.9) ($11.2) 2055E 77.5 $2,954.5 $208.6 $3,086.2 $0.0 $233.5 $15.0 ($558.8) ($28.6) 2056E 70.1 $2,656.2 $188.0 $2,626.6 $0.0 $408.6 $26.3 ($540.7) ($25.8) 2057E 58.0 $2,147.5 $153.3 $1,311.5 $0.0 $0.0 $0.0 $682.7 $29.4 2058E 54.5 $2,017.2 $144.0 $1,288.2 $0.0 $0.0 $0.0 $584.9 $22.9 2059E 49.2 $1,817.3 $129.8 $1,193.3 $0.0 $233.5 $15.0 $275.8 $10.0 2060E 45.2 $1,669.5 $119.2 $1,137.2 $0.0 $3.6 $0.2 $409.7 $13.3 2061E 42.5 $1,569.3 $112.1 $1,120.3 $0.0 $0.0 $0.0 $336.9 $9.9 2062E 39.9 $1,475.1 $105.3 $1,104.4 $0.0 $203.5 $13.1 $75.0 $1.9 2063E 37.5 $1,386.6 $99.0 $1,089.4 $0.0 $0.0 $0.0 $198.2 $4.8 2064E 31.4 $1,155.6 $82.6 $935.9 $0.0 $0.0 $0.0 $137.0 $3.0 2065E 23.1 $821.4 $59.4 $670.4 $0.0 $0.0 $0.0 $91.6 $1.8 2066E 16.9 $600.5 $43.4 $498.1 $0.0 $0.0 $0.0 $59.0 $1.1 2067E 14.7 $524.1 $37.9 $453.2 $0.0 $651.3 $41.8 ($576.5) ($9.5) 2068E 9.5 $335.3 $24.3 $298.0 $0.0 $224.5 $14.4 ($197.1) ($2.9) 2069E 6.8 $241.2 $17.5 $223.3 $0.0 $204.0 $13.1 ($190.5) ($2.7) 2070E 2.2 $77.2 $5.6 $73.8 $0.0 $214.6 $13.8 ($203.1) ($2.5) 2071E 0.0 $0.0 $0.0 $0.0 $0.0 $223.7 $14.4 ($209.3) ($2.4) 2072E 0.0 $0.0 $0.0 $0.0 $0.0 $0.0 $0.0 $0.0 $0.0 2073E 0.0 $0.0 $0.0 $0.0 $0.0 $349.6 $22.5 ($327.1) ($3.1) 2074E 0.0 $0.0 $0.0 $0.0 $0.0 $0.0 $0.0 $0.0 $0.0 2075E 0.0 $0.0 $0.0 $0.0 $0.0 $0.0 $0.0 $0.0 $0.0 2076E 0.0 $0.0 $0.0 $0.0 $0.0 $0.0 $0.0 $0.0 $0.0 2077E 0.0 $0.0 $0.0 $0.0 $0.0 $0.0 $0.0 $0.0 $0.0 Total 36,825.7 $1,574,773.6 $104,172.6 $878,044.0 $2,866.2 $28,509.4 $1,831.4 $563,012.7 $340,978.0 |
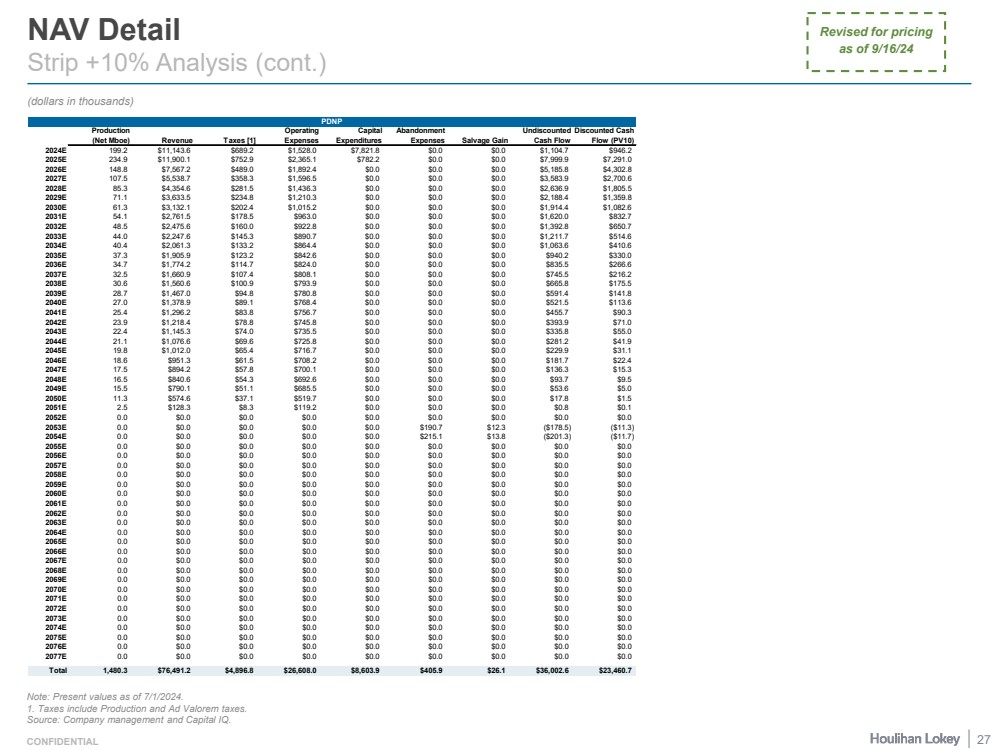
| CONFIDENTIAL NAV Detail Strip +10% Analysis (cont.) (dollars in thousands) Note: Present values as of 7/1/2024. 1. Taxes include Production and Ad Valorem taxes. Source: Company management and Capital IQ. 27 Revised for pricing as of 9/16/24 PDNP Production (Net Mboe) Revenue Taxes [1] Operating Expenses Capital Expenditures Abandonment Expenses Salvage Gain Undiscounted Cash Flow Discounted Cash Flow (PV10) 2024E 199.2 $11,143.6 $689.2 $1,528.0 $7,821.8 $0.0 $0.0 $1,104.7 $946.2 2025E 234.9 $11,900.1 $752.9 $2,365.1 $782.2 $0.0 $0.0 $7,999.9 $7,291.0 2026E 148.8 $7,567.2 $489.0 $1,892.4 $0.0 $0.0 $0.0 $5,185.8 $4,302.8 2027E 107.5 $5,538.7 $358.3 $1,596.5 $0.0 $0.0 $0.0 $3,583.9 $2,700.6 2028E 85.3 $4,354.6 $281.5 $1,436.3 $0.0 $0.0 $0.0 $2,636.9 $1,805.5 2029E 71.1 $3,633.5 $234.8 $1,210.3 $0.0 $0.0 $0.0 $2,188.4 $1,359.8 2030E 61.3 $3,132.1 $202.4 $1,015.2 $0.0 $0.0 $0.0 $1,914.4 $1,082.6 2031E 54.1 $2,761.5 $178.5 $963.0 $0.0 $0.0 $0.0 $1,620.0 $832.7 2032E 48.5 $2,475.6 $160.0 $922.8 $0.0 $0.0 $0.0 $1,392.8 $650.7 2033E 44.0 $2,247.6 $145.3 $890.7 $0.0 $0.0 $0.0 $1,211.7 $514.6 2034E 40.4 $2,061.3 $133.2 $864.4 $0.0 $0.0 $0.0 $1,063.6 $410.6 2035E 37.3 $1,905.9 $123.2 $842.6 $0.0 $0.0 $0.0 $940.2 $330.0 2036E 34.7 $1,774.2 $114.7 $824.0 $0.0 $0.0 $0.0 $835.5 $266.6 2037E 32.5 $1,660.9 $107.4 $808.1 $0.0 $0.0 $0.0 $745.5 $216.2 2038E 30.6 $1,560.6 $100.9 $793.9 $0.0 $0.0 $0.0 $665.8 $175.5 2039E 28.7 $1,467.0 $94.8 $780.8 $0.0 $0.0 $0.0 $591.4 $141.8 2040E 27.0 $1,378.9 $89.1 $768.4 $0.0 $0.0 $0.0 $521.5 $113.6 2041E 25.4 $1,296.2 $83.8 $756.7 $0.0 $0.0 $0.0 $455.7 $90.3 2042E 23.9 $1,218.4 $78.8 $745.8 $0.0 $0.0 $0.0 $393.9 $71.0 2043E 22.4 $1,145.3 $74.0 $735.5 $0.0 $0.0 $0.0 $335.8 $55.0 2044E 21.1 $1,076.6 $69.6 $725.8 $0.0 $0.0 $0.0 $281.2 $41.9 2045E 19.8 $1,012.0 $65.4 $716.7 $0.0 $0.0 $0.0 $229.9 $31.1 2046E 18.6 $951.3 $61.5 $708.2 $0.0 $0.0 $0.0 $181.7 $22.4 2047E 17.5 $894.2 $57.8 $700.1 $0.0 $0.0 $0.0 $136.3 $15.3 2048E 16.5 $840.6 $54.3 $692.6 $0.0 $0.0 $0.0 $93.7 $9.5 2049E 15.5 $790.1 $51.1 $685.5 $0.0 $0.0 $0.0 $53.6 $5.0 2050E 11.3 $574.6 $37.1 $519.7 $0.0 $0.0 $0.0 $17.8 $1.5 2051E 2.5 $128.3 $8.3 $119.2 $0.0 $0.0 $0.0 $0.8 $0.1 2052E 0.0 $0.0 $0.0 $0.0 $0.0 $0.0 $0.0 $0.0 $0.0 2053E 0.0 $0.0 $0.0 $0.0 $0.0 $190.7 $12.3 ($178.5) ($11.3) 2054E 0.0 $0.0 $0.0 $0.0 $0.0 $215.1 $13.8 ($201.3) ($11.7) 2055E 0.0 $0.0 $0.0 $0.0 $0.0 $0.0 $0.0 $0.0 $0.0 2056E 0.0 $0.0 $0.0 $0.0 $0.0 $0.0 $0.0 $0.0 $0.0 2057E 0.0 $0.0 $0.0 $0.0 $0.0 $0.0 $0.0 $0.0 $0.0 2058E 0.0 $0.0 $0.0 $0.0 $0.0 $0.0 $0.0 $0.0 $0.0 2059E 0.0 $0.0 $0.0 $0.0 $0.0 $0.0 $0.0 $0.0 $0.0 2060E 0.0 $0.0 $0.0 $0.0 $0.0 $0.0 $0.0 $0.0 $0.0 2061E 0.0 $0.0 $0.0 $0.0 $0.0 $0.0 $0.0 $0.0 $0.0 2062E 0.0 $0.0 $0.0 $0.0 $0.0 $0.0 $0.0 $0.0 $0.0 2063E 0.0 $0.0 $0.0 $0.0 $0.0 $0.0 $0.0 $0.0 $0.0 2064E 0.0 $0.0 $0.0 $0.0 $0.0 $0.0 $0.0 $0.0 $0.0 2065E 0.0 $0.0 $0.0 $0.0 $0.0 $0.0 $0.0 $0.0 $0.0 2066E 0.0 $0.0 $0.0 $0.0 $0.0 $0.0 $0.0 $0.0 $0.0 2067E 0.0 $0.0 $0.0 $0.0 $0.0 $0.0 $0.0 $0.0 $0.0 2068E 0.0 $0.0 $0.0 $0.0 $0.0 $0.0 $0.0 $0.0 $0.0 2069E 0.0 $0.0 $0.0 $0.0 $0.0 $0.0 $0.0 $0.0 $0.0 2070E 0.0 $0.0 $0.0 $0.0 $0.0 $0.0 $0.0 $0.0 $0.0 2071E 0.0 $0.0 $0.0 $0.0 $0.0 $0.0 $0.0 $0.0 $0.0 2072E 0.0 $0.0 $0.0 $0.0 $0.0 $0.0 $0.0 $0.0 $0.0 2073E 0.0 $0.0 $0.0 $0.0 $0.0 $0.0 $0.0 $0.0 $0.0 2074E 0.0 $0.0 $0.0 $0.0 $0.0 $0.0 $0.0 $0.0 $0.0 2075E 0.0 $0.0 $0.0 $0.0 $0.0 $0.0 $0.0 $0.0 $0.0 2076E 0.0 $0.0 $0.0 $0.0 $0.0 $0.0 $0.0 $0.0 $0.0 2077E 0.0 $0.0 $0.0 $0.0 $0.0 $0.0 $0.0 $0.0 $0.0 Total 1,480.3 $76,491.2 $4,896.8 $26,608.0 $8,603.9 $405.9 $26.1 $36,002.6 $23,460.7 |
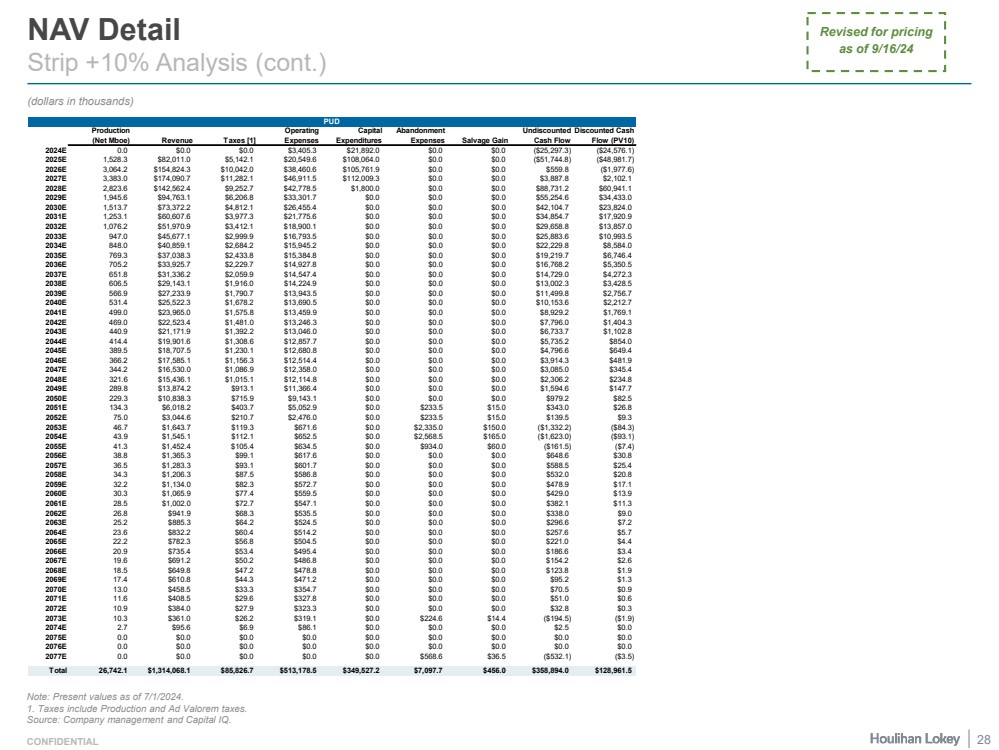
| CONFIDENTIAL NAV Detail Strip +10% Analysis (cont.) (dollars in thousands) Note: Present values as of 7/1/2024. 1. Taxes include Production and Ad Valorem taxes. Source: Company management and Capital IQ. 28 Revised for pricing as of 9/16/24 Production (Net Mboe) Revenue Taxes [1] Operating Expenses Capital Expenditures Abandonment Expenses Salvage Gain Undiscounted Cash Flow Discounted Cash Flow (PV10) 2024E 0.0 $0.0 $0.0 $3,405.3 $21,892.0 $0.0 $0.0 ($25,297.3) ($24,576.1) 2025E 1,528.3 $82,011.0 $5,142.1 $20,549.6 $108,064.0 $0.0 $0.0 ($51,744.8) ($48,981.7) 2026E 3,064.2 $154,824.3 $10,042.0 $38,460.6 $105,761.9 $0.0 $0.0 $559.8 ($1,977.6) 2027E 3,383.0 $174,090.7 $11,282.1 $46,911.5 $112,009.3 $0.0 $0.0 $3,887.8 $2,102.1 2028E 2,823.6 $142,562.4 $9,252.7 $42,778.5 $1,800.0 $0.0 $0.0 $88,731.2 $60,941.1 2029E 1,945.6 $94,763.1 $6,206.8 $33,301.7 $0.0 $0.0 $0.0 $55,254.6 $34,433.0 2030E 1,513.7 $73,372.2 $4,812.1 $26,455.4 $0.0 $0.0 $0.0 $42,104.7 $23,824.0 2031E 1,253.1 $60,607.6 $3,977.3 $21,775.6 $0.0 $0.0 $0.0 $34,854.7 $17,920.9 2032E 1,076.2 $51,970.9 $3,412.1 $18,900.1 $0.0 $0.0 $0.0 $29,658.8 $13,857.0 2033E 947.0 $45,677.1 $2,999.9 $16,793.5 $0.0 $0.0 $0.0 $25,883.6 $10,993.5 2034E 848.0 $40,859.1 $2,684.2 $15,945.2 $0.0 $0.0 $0.0 $22,229.8 $8,584.0 2035E 769.3 $37,038.3 $2,433.8 $15,384.8 $0.0 $0.0 $0.0 $19,219.7 $6,746.4 2036E 705.2 $33,925.7 $2,229.7 $14,927.8 $0.0 $0.0 $0.0 $16,768.2 $5,350.5 2037E 651.8 $31,336.2 $2,059.9 $14,547.4 $0.0 $0.0 $0.0 $14,729.0 $4,272.3 2038E 606.5 $29,143.1 $1,916.0 $14,224.9 $0.0 $0.0 $0.0 $13,002.3 $3,428.5 2039E 566.9 $27,233.9 $1,790.7 $13,943.5 $0.0 $0.0 $0.0 $11,499.8 $2,756.7 2040E 531.4 $25,522.3 $1,678.2 $13,690.5 $0.0 $0.0 $0.0 $10,153.6 $2,212.7 2041E 499.0 $23,965.0 $1,575.8 $13,459.9 $0.0 $0.0 $0.0 $8,929.2 $1,769.1 2042E 469.0 $22,523.4 $1,481.0 $13,246.3 $0.0 $0.0 $0.0 $7,796.0 $1,404.3 2043E 440.9 $21,171.9 $1,392.2 $13,046.0 $0.0 $0.0 $0.0 $6,733.7 $1,102.8 2044E 414.4 $19,901.6 $1,308.6 $12,857.7 $0.0 $0.0 $0.0 $5,735.2 $854.0 2045E 389.5 $18,707.5 $1,230.1 $12,680.8 $0.0 $0.0 $0.0 $4,796.6 $649.4 2046E 366.2 $17,585.1 $1,156.3 $12,514.4 $0.0 $0.0 $0.0 $3,914.3 $481.9 2047E 344.2 $16,530.0 $1,086.9 $12,358.0 $0.0 $0.0 $0.0 $3,085.0 $345.4 2048E 321.6 $15,436.1 $1,015.1 $12,114.8 $0.0 $0.0 $0.0 $2,306.2 $234.8 2049E 289.8 $13,874.2 $913.1 $11,366.4 $0.0 $0.0 $0.0 $1,594.6 $147.7 2050E 229.3 $10,838.3 $715.9 $9,143.1 $0.0 $0.0 $0.0 $979.2 $82.5 2051E 134.3 $6,018.2 $403.7 $5,052.9 $0.0 $233.5 $15.0 $343.0 $26.8 2052E 75.0 $3,044.6 $210.7 $2,476.0 $0.0 $233.5 $15.0 $139.5 $9.3 2053E 46.7 $1,643.7 $119.3 $671.6 $0.0 $2,335.0 $150.0 ($1,332.2) ($84.3) 2054E 43.9 $1,545.1 $112.1 $652.5 $0.0 $2,568.5 $165.0 ($1,623.0) ($93.1) 2055E 41.3 $1,452.4 $105.4 $634.5 $0.0 $934.0 $60.0 ($161.5) ($7.4) 2056E 38.8 $1,365.3 $99.1 $617.6 $0.0 $0.0 $0.0 $648.6 $30.8 2057E 36.5 $1,283.3 $93.1 $601.7 $0.0 $0.0 $0.0 $588.5 $25.4 2058E 34.3 $1,206.3 $87.5 $586.8 $0.0 $0.0 $0.0 $532.0 $20.8 2059E 32.2 $1,134.0 $82.3 $572.7 $0.0 $0.0 $0.0 $478.9 $17.1 2060E 30.3 $1,065.9 $77.4 $559.5 $0.0 $0.0 $0.0 $429.0 $13.9 2061E 28.5 $1,002.0 $72.7 $547.1 $0.0 $0.0 $0.0 $382.1 $11.3 2062E 26.8 $941.9 $68.3 $535.5 $0.0 $0.0 $0.0 $338.0 $9.0 2063E 25.2 $885.3 $64.2 $524.5 $0.0 $0.0 $0.0 $296.6 $7.2 2064E 23.6 $832.2 $60.4 $514.2 $0.0 $0.0 $0.0 $257.6 $5.7 2065E 22.2 $782.3 $56.8 $504.5 $0.0 $0.0 $0.0 $221.0 $4.4 2066E 20.9 $735.4 $53.4 $495.4 $0.0 $0.0 $0.0 $186.6 $3.4 2067E 19.6 $691.2 $50.2 $486.8 $0.0 $0.0 $0.0 $154.2 $2.6 2068E 18.5 $649.8 $47.2 $478.8 $0.0 $0.0 $0.0 $123.8 $1.9 2069E 17.4 $610.8 $44.3 $471.2 $0.0 $0.0 $0.0 $95.2 $1.3 2070E 13.0 $458.5 $33.3 $354.7 $0.0 $0.0 $0.0 $70.5 $0.9 2071E 11.6 $408.5 $29.6 $327.8 $0.0 $0.0 $0.0 $51.0 $0.6 2072E 10.9 $384.0 $27.9 $323.3 $0.0 $0.0 $0.0 $32.8 $0.3 2073E 10.3 $361.0 $26.2 $319.1 $0.0 $224.6 $14.4 ($194.5) ($1.9) 2074E 2.7 $95.6 $6.9 $86.1 $0.0 $0.0 $0.0 $2.5 $0.0 2075E 0.0 $0.0 $0.0 $0.0 $0.0 $0.0 $0.0 $0.0 $0.0 2076E 0.0 $0.0 $0.0 $0.0 $0.0 $0.0 $0.0 $0.0 $0.0 2077E 0.0 $0.0 $0.0 $0.0 $0.0 $568.6 $36.5 ($532.1) ($3.5) Total 26,742.1 $1,314,068.1 $85,826.7 $513,178.5 $349,527.2 $7,097.7 $456.0 $358,894.0 $128,961.5 PUD |
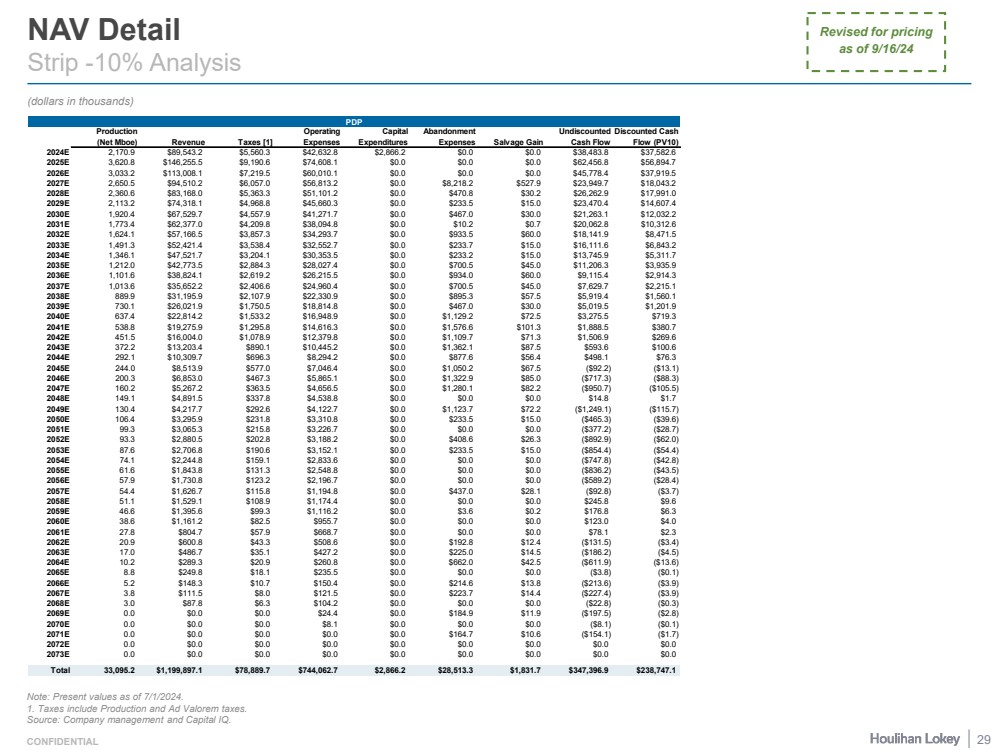
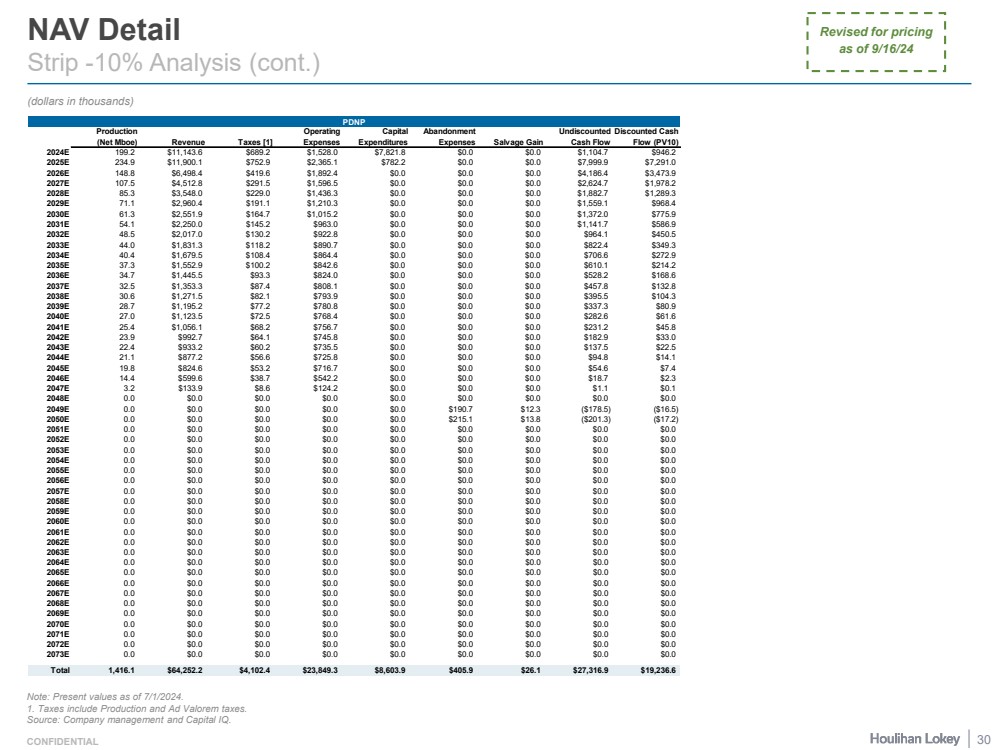
| CONFIDENTIAL NAV Detail Strip -10% Analysis (dollars in thousands) Note: Present values as of 7/1/2024. 1. Taxes include Production and Ad Valorem taxes. Source: Company management and Capital IQ. 29 Revised for pricing as of 9/16/24 PDP Production (Net Mboe) Revenue Taxes [1] Operating Expenses Capital Expenditures Abandonment Expenses Salvage Gain Undiscounted Cash Flow Discounted Cash Flow (PV10) 2024E 2,170.9 $89,543.2 $5,560.3 $42,632.8 $2,866.2 $0.0 $0.0 $38,483.8 $37,582.6 2025E 3,620.8 $146,255.5 $9,190.6 $74,608.1 $0.0 $0.0 $0.0 $62,456.8 $56,894.7 2026E 3,033.2 $113,008.1 $7,219.5 $60,010.1 $0.0 $0.0 $0.0 $45,778.4 $37,919.5 2027E 2,650.5 $94,510.2 $6,057.0 $56,813.2 $0.0 $8,218.2 $527.9 $23,949.7 $18,043.2 2028E 2,360.6 $83,168.0 $5,363.3 $51,101.2 $0.0 $470.8 $30.2 $26,262.9 $17,991.0 2029E 2,113.2 $74,318.1 $4,968.8 $45,660.3 $0.0 $233.5 $15.0 $23,470.4 $14,607.4 2030E 1,920.4 $67,529.7 $4,557.9 $41,271.7 $0.0 $467.0 $30.0 $21,263.1 $12,032.2 2031E 1,773.4 $62,377.0 $4,209.8 $38,094.8 $0.0 $10.2 $0.7 $20,062.8 $10,312.6 2032E 1,624.1 $57,166.5 $3,857.3 $34,293.7 $0.0 $933.5 $60.0 $18,141.9 $8,471.5 2033E 1,491.3 $52,421.4 $3,538.4 $32,552.7 $0.0 $233.7 $15.0 $16,111.6 $6,843.2 2034E 1,346.1 $47,521.7 $3,204.1 $30,353.5 $0.0 $233.2 $15.0 $13,745.9 $5,311.7 2035E 1,212.0 $42,773.5 $2,884.3 $28,027.4 $0.0 $700.5 $45.0 $11,206.3 $3,935.9 2036E 1,101.6 $38,824.1 $2,619.2 $26,215.5 $0.0 $934.0 $60.0 $9,115.4 $2,914.3 2037E 1,013.6 $35,652.2 $2,406.6 $24,960.4 $0.0 $700.5 $45.0 $7,629.7 $2,215.1 2038E 889.9 $31,195.9 $2,107.9 $22,330.9 $0.0 $895.3 $57.5 $5,919.4 $1,560.1 2039E 730.1 $26,021.9 $1,750.5 $18,814.8 $0.0 $467.0 $30.0 $5,019.5 $1,201.9 2040E 637.4 $22,814.2 $1,533.2 $16,948.9 $0.0 $1,129.2 $72.5 $3,275.5 $719.3 2041E 538.8 $19,275.9 $1,295.8 $14,616.3 $0.0 $1,576.6 $101.3 $1,888.5 $380.7 2042E 451.5 $16,004.0 $1,078.9 $12,379.8 $0.0 $1,109.7 $71.3 $1,506.9 $269.6 2043E 372.2 $13,203.4 $890.1 $10,445.2 $0.0 $1,362.1 $87.5 $593.6 $100.6 2044E 292.1 $10,309.7 $696.3 $8,294.2 $0.0 $877.6 $56.4 $498.1 $76.3 2045E 244.0 $8,513.9 $577.0 $7,046.4 $0.0 $1,050.2 $67.5 ($92.2) ($13.1) 2046E 200.3 $6,853.0 $467.3 $5,865.1 $0.0 $1,322.9 $85.0 ($717.3) ($88.3) 2047E 160.2 $5,267.2 $363.5 $4,656.5 $0.0 $1,280.1 $82.2 ($950.7) ($105.5) 2048E 149.1 $4,891.5 $337.8 $4,538.8 $0.0 $0.0 $0.0 $14.8 $1.7 2049E 130.4 $4,217.7 $292.6 $4,122.7 $0.0 $1,123.7 $72.2 ($1,249.1) ($115.7) 2050E 106.4 $3,295.9 $231.8 $3,310.8 $0.0 $233.5 $15.0 ($465.3) ($39.6) 2051E 99.3 $3,065.3 $215.8 $3,226.7 $0.0 $0.0 $0.0 ($377.2) ($28.7) 2052E 93.3 $2,880.5 $202.8 $3,188.2 $0.0 $408.6 $26.3 ($892.9) ($62.0) 2053E 87.6 $2,706.8 $190.6 $3,152.1 $0.0 $233.5 $15.0 ($854.4) ($54.4) 2054E 74.1 $2,244.8 $159.1 $2,833.6 $0.0 $0.0 $0.0 ($747.8) ($42.8) 2055E 61.6 $1,843.8 $131.3 $2,548.8 $0.0 $0.0 $0.0 ($836.2) ($43.5) 2056E 57.9 $1,730.8 $123.2 $2,196.7 $0.0 $0.0 $0.0 ($589.2) ($28.4) 2057E 54.4 $1,626.7 $115.8 $1,194.8 $0.0 $437.0 $28.1 ($92.8) ($3.7) 2058E 51.1 $1,529.1 $108.9 $1,174.4 $0.0 $0.0 $0.0 $245.8 $9.6 2059E 46.6 $1,395.6 $99.3 $1,116.2 $0.0 $3.6 $0.2 $176.8 $6.3 2060E 38.6 $1,161.2 $82.5 $955.7 $0.0 $0.0 $0.0 $123.0 $4.0 2061E 27.8 $804.7 $57.9 $668.7 $0.0 $0.0 $0.0 $78.1 $2.3 2062E 20.9 $600.8 $43.3 $508.6 $0.0 $192.8 $12.4 ($131.5) ($3.4) 2063E 17.0 $486.7 $35.1 $427.2 $0.0 $225.0 $14.5 ($186.2) ($4.5) 2064E 10.2 $289.3 $20.9 $260.8 $0.0 $662.0 $42.5 ($611.9) ($13.6) 2065E 8.8 $249.8 $18.1 $235.5 $0.0 $0.0 $0.0 ($3.8) ($0.1) 2066E 5.2 $148.3 $10.7 $150.4 $0.0 $214.6 $13.8 ($213.6) ($3.9) 2067E 3.8 $111.5 $8.0 $121.5 $0.0 $223.7 $14.4 ($227.4) ($3.9) 2068E 3.0 $87.8 $6.3 $104.2 $0.0 $0.0 $0.0 ($22.8) ($0.3) 2069E 0.0 $0.0 $0.0 $24.4 $0.0 $184.9 $11.9 ($197.5) ($2.8) 2070E 0.0 $0.0 $0.0 $8.1 $0.0 $0.0 $0.0 ($8.1) ($0.1) 2071E 0.0 $0.0 $0.0 $0.0 $0.0 $164.7 $10.6 ($154.1) ($1.7) 2072E 0.0 $0.0 $0.0 $0.0 $0.0 $0.0 $0.0 $0.0 $0.0 2073E 0.0 $0.0 $0.0 $0.0 $0.0 $0.0 $0.0 $0.0 $0.0 Total 33,095.2 $1,199,897.1 $78,889.7 $744,062.7 $2,866.2 $28,513.3 $1,831.7 $347,396.9 $238,747.1 |
| CONFIDENTIAL NAV Detail Strip -10% Analysis (cont.) (dollars in thousands) Note: Present values as of 7/1/2024. 1. Taxes include Production and Ad Valorem taxes. Source: Company management and Capital IQ. 30 Revised for pricing as of 9/16/24 PDNP Production (Net Mboe) Revenue Taxes [1] Operating Expenses Capital Expenditures Abandonment Expenses Salvage Gain Undiscounted Cash Flow Discounted Cash Flow (PV10) 2024E 199.2 $11,143.6 $689.2 $1,528.0 $7,821.8 $0.0 $0.0 $1,104.7 $946.2 2025E 234.9 $11,900.1 $752.9 $2,365.1 $782.2 $0.0 $0.0 $7,999.9 $7,291.0 2026E 148.8 $6,498.4 $419.6 $1,892.4 $0.0 $0.0 $0.0 $4,186.4 $3,473.9 2027E 107.5 $4,512.8 $291.5 $1,596.5 $0.0 $0.0 $0.0 $2,624.7 $1,978.2 2028E 85.3 $3,548.0 $229.0 $1,436.3 $0.0 $0.0 $0.0 $1,882.7 $1,289.3 2029E 71.1 $2,960.4 $191.1 $1,210.3 $0.0 $0.0 $0.0 $1,559.1 $968.4 2030E 61.3 $2,551.9 $164.7 $1,015.2 $0.0 $0.0 $0.0 $1,372.0 $775.9 2031E 54.1 $2,250.0 $145.2 $963.0 $0.0 $0.0 $0.0 $1,141.7 $586.9 2032E 48.5 $2,017.0 $130.2 $922.8 $0.0 $0.0 $0.0 $964.1 $450.5 2033E 44.0 $1,831.3 $118.2 $890.7 $0.0 $0.0 $0.0 $822.4 $349.3 2034E 40.4 $1,679.5 $108.4 $864.4 $0.0 $0.0 $0.0 $706.6 $272.9 2035E 37.3 $1,552.9 $100.2 $842.6 $0.0 $0.0 $0.0 $610.1 $214.2 2036E 34.7 $1,445.5 $93.3 $824.0 $0.0 $0.0 $0.0 $528.2 $168.6 2037E 32.5 $1,353.3 $87.4 $808.1 $0.0 $0.0 $0.0 $457.8 $132.8 2038E 30.6 $1,271.5 $82.1 $793.9 $0.0 $0.0 $0.0 $395.5 $104.3 2039E 28.7 $1,195.2 $77.2 $780.8 $0.0 $0.0 $0.0 $337.3 $80.9 2040E 27.0 $1,123.5 $72.5 $768.4 $0.0 $0.0 $0.0 $282.6 $61.6 2041E 25.4 $1,056.1 $68.2 $756.7 $0.0 $0.0 $0.0 $231.2 $45.8 2042E 23.9 $992.7 $64.1 $745.8 $0.0 $0.0 $0.0 $182.9 $33.0 2043E 22.4 $933.2 $60.2 $735.5 $0.0 $0.0 $0.0 $137.5 $22.5 2044E 21.1 $877.2 $56.6 $725.8 $0.0 $0.0 $0.0 $94.8 $14.1 2045E 19.8 $824.6 $53.2 $716.7 $0.0 $0.0 $0.0 $54.6 $7.4 2046E 14.4 $599.6 $38.7 $542.2 $0.0 $0.0 $0.0 $18.7 $2.3 2047E 3.2 $133.9 $8.6 $124.2 $0.0 $0.0 $0.0 $1.1 $0.1 2048E 0.0 $0.0 $0.0 $0.0 $0.0 $0.0 $0.0 $0.0 $0.0 2049E 0.0 $0.0 $0.0 $0.0 $0.0 $190.7 $12.3 ($178.5) ($16.5) 2050E 0.0 $0.0 $0.0 $0.0 $0.0 $215.1 $13.8 ($201.3) ($17.2) 2051E 0.0 $0.0 $0.0 $0.0 $0.0 $0.0 $0.0 $0.0 $0.0 2052E 0.0 $0.0 $0.0 $0.0 $0.0 $0.0 $0.0 $0.0 $0.0 2053E 0.0 $0.0 $0.0 $0.0 $0.0 $0.0 $0.0 $0.0 $0.0 2054E 0.0 $0.0 $0.0 $0.0 $0.0 $0.0 $0.0 $0.0 $0.0 2055E 0.0 $0.0 $0.0 $0.0 $0.0 $0.0 $0.0 $0.0 $0.0 2056E 0.0 $0.0 $0.0 $0.0 $0.0 $0.0 $0.0 $0.0 $0.0 2057E 0.0 $0.0 $0.0 $0.0 $0.0 $0.0 $0.0 $0.0 $0.0 2058E 0.0 $0.0 $0.0 $0.0 $0.0 $0.0 $0.0 $0.0 $0.0 2059E 0.0 $0.0 $0.0 $0.0 $0.0 $0.0 $0.0 $0.0 $0.0 2060E 0.0 $0.0 $0.0 $0.0 $0.0 $0.0 $0.0 $0.0 $0.0 2061E 0.0 $0.0 $0.0 $0.0 $0.0 $0.0 $0.0 $0.0 $0.0 2062E 0.0 $0.0 $0.0 $0.0 $0.0 $0.0 $0.0 $0.0 $0.0 2063E 0.0 $0.0 $0.0 $0.0 $0.0 $0.0 $0.0 $0.0 $0.0 2064E 0.0 $0.0 $0.0 $0.0 $0.0 $0.0 $0.0 $0.0 $0.0 2065E 0.0 $0.0 $0.0 $0.0 $0.0 $0.0 $0.0 $0.0 $0.0 2066E 0.0 $0.0 $0.0 $0.0 $0.0 $0.0 $0.0 $0.0 $0.0 2067E 0.0 $0.0 $0.0 $0.0 $0.0 $0.0 $0.0 $0.0 $0.0 2068E 0.0 $0.0 $0.0 $0.0 $0.0 $0.0 $0.0 $0.0 $0.0 2069E 0.0 $0.0 $0.0 $0.0 $0.0 $0.0 $0.0 $0.0 $0.0 2070E 0.0 $0.0 $0.0 $0.0 $0.0 $0.0 $0.0 $0.0 $0.0 2071E 0.0 $0.0 $0.0 $0.0 $0.0 $0.0 $0.0 $0.0 $0.0 2072E 0.0 $0.0 $0.0 $0.0 $0.0 $0.0 $0.0 $0.0 $0.0 2073E 0.0 $0.0 $0.0 $0.0 $0.0 $0.0 $0.0 $0.0 $0.0 Total 1,416.1 $64,252.2 $4,102.4 $23,849.3 $8,603.9 $405.9 $26.1 $27,316.9 $19,236.6 |
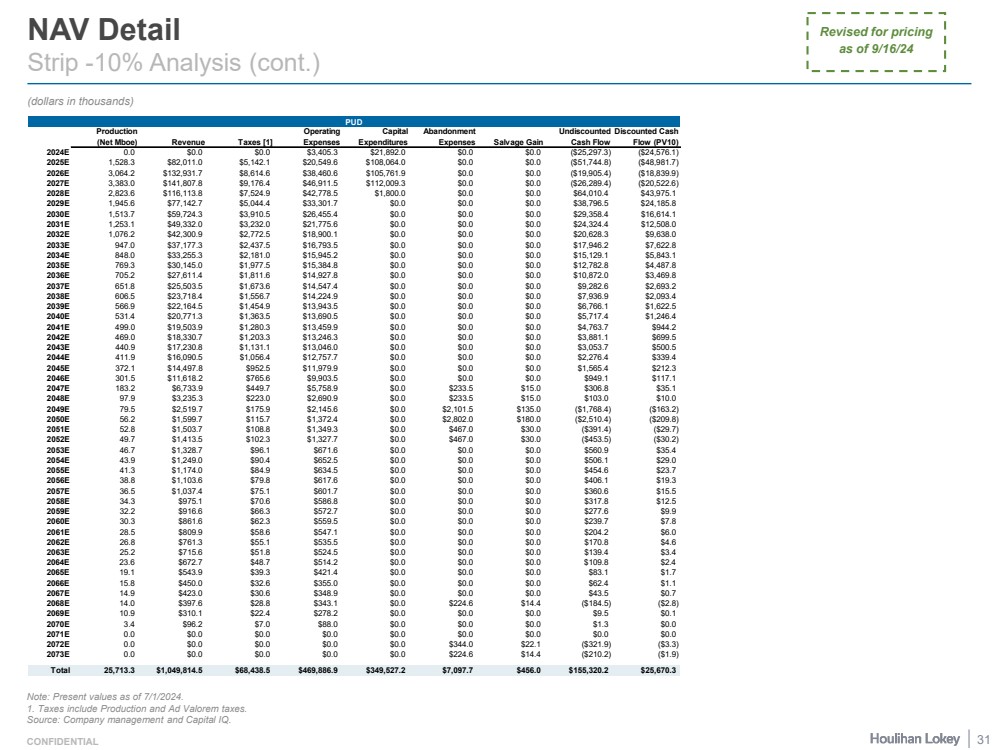
| CONFIDENTIAL NAV Detail Strip -10% Analysis (cont.) (dollars in thousands) Note: Present values as of 7/1/2024. 1. Taxes include Production and Ad Valorem taxes. Source: Company management and Capital IQ. 31 Revised for pricing as of 9/16/24 Production (Net Mboe) Revenue Taxes [1] Operating Expenses Capital Expenditures Abandonment Expenses Salvage Gain Undiscounted Cash Flow Discounted Cash Flow (PV10) 2024E 0.0 $0.0 $0.0 $3,405.3 $21,892.0 $0.0 $0.0 ($25,297.3) ($24,576.1) 2025E 1,528.3 $82,011.0 $5,142.1 $20,549.6 $108,064.0 $0.0 $0.0 ($51,744.8) ($48,981.7) 2026E 3,064.2 $132,931.7 $8,614.6 $38,460.6 $105,761.9 $0.0 $0.0 ($19,905.4) ($18,839.9) 2027E 3,383.0 $141,807.8 $9,176.4 $46,911.5 $112,009.3 $0.0 $0.0 ($26,289.4) ($20,522.6) 2028E 2,823.6 $116,113.8 $7,524.9 $42,778.5 $1,800.0 $0.0 $0.0 $64,010.4 $43,975.1 2029E 1,945.6 $77,142.7 $5,044.4 $33,301.7 $0.0 $0.0 $0.0 $38,796.5 $24,185.8 2030E 1,513.7 $59,724.3 $3,910.5 $26,455.4 $0.0 $0.0 $0.0 $29,358.4 $16,614.1 2031E 1,253.1 $49,332.0 $3,232.0 $21,775.6 $0.0 $0.0 $0.0 $24,324.4 $12,508.0 2032E 1,076.2 $42,300.9 $2,772.5 $18,900.1 $0.0 $0.0 $0.0 $20,628.3 $9,638.0 2033E 947.0 $37,177.3 $2,437.5 $16,793.5 $0.0 $0.0 $0.0 $17,946.2 $7,622.8 2034E 848.0 $33,255.3 $2,181.0 $15,945.2 $0.0 $0.0 $0.0 $15,129.1 $5,843.1 2035E 769.3 $30,145.0 $1,977.5 $15,384.8 $0.0 $0.0 $0.0 $12,782.8 $4,487.8 2036E 705.2 $27,611.4 $1,811.6 $14,927.8 $0.0 $0.0 $0.0 $10,872.0 $3,469.8 2037E 651.8 $25,503.5 $1,673.6 $14,547.4 $0.0 $0.0 $0.0 $9,282.6 $2,693.2 2038E 606.5 $23,718.4 $1,556.7 $14,224.9 $0.0 $0.0 $0.0 $7,936.9 $2,093.4 2039E 566.9 $22,164.5 $1,454.9 $13,943.5 $0.0 $0.0 $0.0 $6,766.1 $1,622.5 2040E 531.4 $20,771.3 $1,363.5 $13,690.5 $0.0 $0.0 $0.0 $5,717.4 $1,246.4 2041E 499.0 $19,503.9 $1,280.3 $13,459.9 $0.0 $0.0 $0.0 $4,763.7 $944.2 2042E 469.0 $18,330.7 $1,203.3 $13,246.3 $0.0 $0.0 $0.0 $3,881.1 $699.5 2043E 440.9 $17,230.8 $1,131.1 $13,046.0 $0.0 $0.0 $0.0 $3,053.7 $500.5 2044E 411.9 $16,090.5 $1,056.4 $12,757.7 $0.0 $0.0 $0.0 $2,276.4 $339.4 2045E 372.1 $14,497.8 $952.5 $11,979.9 $0.0 $0.0 $0.0 $1,565.4 $212.3 2046E 301.5 $11,618.2 $765.6 $9,903.5 $0.0 $0.0 $0.0 $949.1 $117.1 2047E 183.2 $6,733.9 $449.7 $5,758.9 $0.0 $233.5 $15.0 $306.8 $35.1 2048E 97.9 $3,235.3 $223.0 $2,690.9 $0.0 $233.5 $15.0 $103.0 $10.0 2049E 79.5 $2,519.7 $175.9 $2,145.6 $0.0 $2,101.5 $135.0 ($1,768.4) ($163.2) 2050E 56.2 $1,599.7 $115.7 $1,372.4 $0.0 $2,802.0 $180.0 ($2,510.4) ($209.8) 2051E 52.8 $1,503.7 $108.8 $1,349.3 $0.0 $467.0 $30.0 ($391.4) ($29.7) 2052E 49.7 $1,413.5 $102.3 $1,327.7 $0.0 $467.0 $30.0 ($453.5) ($30.2) 2053E 46.7 $1,328.7 $96.1 $671.6 $0.0 $0.0 $0.0 $560.9 $35.4 2054E 43.9 $1,249.0 $90.4 $652.5 $0.0 $0.0 $0.0 $506.1 $29.0 2055E 41.3 $1,174.0 $84.9 $634.5 $0.0 $0.0 $0.0 $454.6 $23.7 2056E 38.8 $1,103.6 $79.8 $617.6 $0.0 $0.0 $0.0 $406.1 $19.3 2057E 36.5 $1,037.4 $75.1 $601.7 $0.0 $0.0 $0.0 $360.6 $15.5 2058E 34.3 $975.1 $70.6 $586.8 $0.0 $0.0 $0.0 $317.8 $12.5 2059E 32.2 $916.6 $66.3 $572.7 $0.0 $0.0 $0.0 $277.6 $9.9 2060E 30.3 $861.6 $62.3 $559.5 $0.0 $0.0 $0.0 $239.7 $7.8 2061E 28.5 $809.9 $58.6 $547.1 $0.0 $0.0 $0.0 $204.2 $6.0 2062E 26.8 $761.3 $55.1 $535.5 $0.0 $0.0 $0.0 $170.8 $4.6 2063E 25.2 $715.6 $51.8 $524.5 $0.0 $0.0 $0.0 $139.4 $3.4 2064E 23.6 $672.7 $48.7 $514.2 $0.0 $0.0 $0.0 $109.8 $2.4 2065E 19.1 $543.9 $39.3 $421.4 $0.0 $0.0 $0.0 $83.1 $1.7 2066E 15.8 $450.0 $32.6 $355.0 $0.0 $0.0 $0.0 $62.4 $1.1 2067E 14.9 $423.0 $30.6 $348.9 $0.0 $0.0 $0.0 $43.5 $0.7 2068E 14.0 $397.6 $28.8 $343.1 $0.0 $224.6 $14.4 ($184.5) ($2.8) 2069E 10.9 $310.1 $22.4 $278.2 $0.0 $0.0 $0.0 $9.5 $0.1 2070E 3.4 $96.2 $7.0 $88.0 $0.0 $0.0 $0.0 $1.3 $0.0 2071E 0.0 $0.0 $0.0 $0.0 $0.0 $0.0 $0.0 $0.0 $0.0 2072E 0.0 $0.0 $0.0 $0.0 $0.0 $344.0 $22.1 ($321.9) ($3.3) 2073E 0.0 $0.0 $0.0 $0.0 $0.0 $224.6 $14.4 ($210.2) ($1.9) Total 25,713.3 $1,049,814.5 $68,438.5 $469,886.9 $349,527.2 $7,097.7 $456.0 $155,320.2 $25,670.3 PUD |
| Page 1. Selected Public Market Observations 3 2. Benchmarking Data 7 3. Selected Technical Observations 12 4. Pricing 20 5. NAV Analysis Detail 22 6. Glossary of Selected Terms 32 7. Disclaimer 35 |
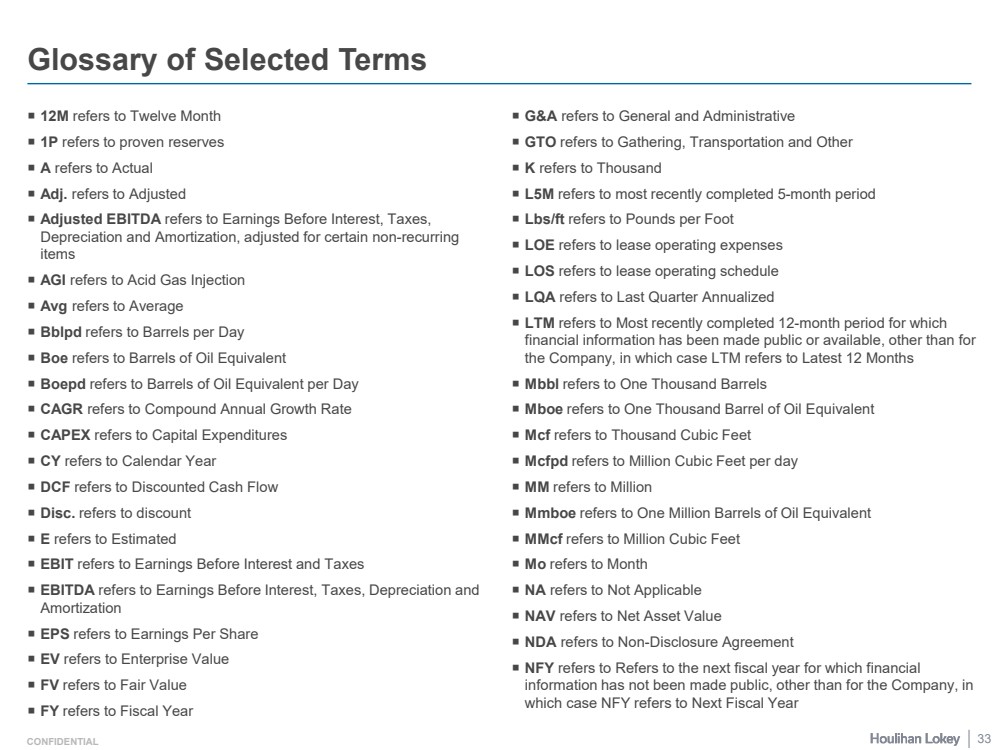
| CONFIDENTIAL 12M refers to Twelve Month 1P refers to proven reserves A refers to Actual Adj. refers to Adjusted Adjusted EBITDA refers to Earnings Before Interest, Taxes, Depreciation and Amortization, adjusted for certain non-recurring items AGI refers to Acid Gas Injection Avg refers to Average Bblpd refers to Barrels per Day Boe refers to Barrels of Oil Equivalent Boepd refers to Barrels of Oil Equivalent per Day CAGR refers to Compound Annual Growth Rate CAPEX refers to Capital Expenditures CY refers to Calendar Year DCF refers to Discounted Cash Flow Disc. refers to discount E refers to Estimated EBIT refers to Earnings Before Interest and Taxes EBITDA refers to Earnings Before Interest, Taxes, Depreciation and Amortization EPS refers to Earnings Per Share EV refers to Enterprise Value FV refers to Fair Value FY refers to Fiscal Year G&A refers to General and Administrative GTO refers to Gathering, Transportation and Other K refers to Thousand L5M refers to most recently completed 5-month period Lbs/ft refers to Pounds per Foot LOE refers to lease operating expenses LOS refers to lease operating schedule LQA refers to Last Quarter Annualized LTM refers to Most recently completed 12-month period for which financial information has been made public or available, other than for the Company, in which case LTM refers to Latest 12 Months Mbbl refers to One Thousand Barrels Mboe refers to One Thousand Barrel of Oil Equivalent Mcf refers to Thousand Cubic Feet Mcfpd refers to Million Cubic Feet per day MM refers to Million Mmboe refers to One Million Barrels of Oil Equivalent MMcf refers to Million Cubic Feet Mo refers to Month NA refers to Not Applicable NAV refers to Net Asset Value NDA refers to Non-Disclosure Agreement NFY refers to Refers to the next fiscal year for which financial information has not been made public, other than for the Company, in which case NFY refers to Next Fiscal Year Glossary of Selected Terms 33 |
| CONFIDENTIAL NFY+1 refers to Next Fiscal Year following NFY NGL refers to Natural Gas Liquid NMF refers to Not Meaningful Figure NTM refers to Next Twelve Months NYMEX refers to New York Mercantile Exchange P&A refers to Plugging and Abandonment PDNP refers to Proved Developed Non-Producing PDP refers to Proved Developed Producing Prem. refers to premium PROB refers to Probable POSS refers to Possible PUD refers to Proved Undeveloped PV refers to Present Value PV-10 refers to present value discounted at ten percent Q refers to Quarter R/P refers to Reserves/Production RADR refers to Risk-Adjusted Discount Rates RAF refers to Reserve Adjustment Factors RSU refers to Restricted Stock Unit SPEE refers to Society of Petroleum Evaluation Engineers SWD refers to Saltwater Disposal UCF refers to Unlevered Cash Flow VWAP refers to Volume-Weighted Average Price WACC refers to Weighted Average Cost of Capital WTI refers to West Texas Intermediate YoY refers to Year-over-Year YTD refers to Year to Date Glossary of Selected Terms (cont.) 34 |
| Page 1. Selected Public Market Observations 3 2. Benchmarking Data 7 3. Selected Technical Observations 12 4. Pricing 20 5. NAV Analysis Detail 22 6. Glossary of Selected Terms 32 7. Disclaimer 35 |
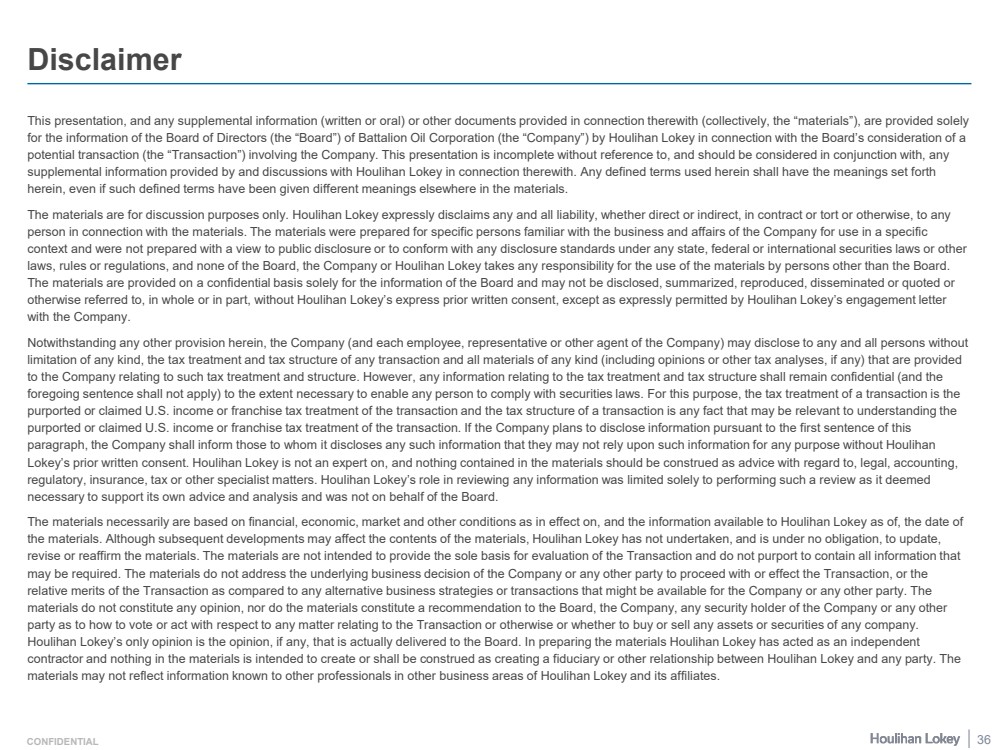
| CONFIDENTIAL This presentation, and any supplemental information (written or oral) or other documents provided in connection therewith (collectively, the “materials”), are provided solely for the information of the Board of Directors (the “Board”) of Battalion Oil Corporation (the “Company”) by Houlihan Lokey in connection with the Board’s consideration of a potential transaction (the “Transaction”) involving the Company. This presentation is incomplete without reference to, and should be considered in conjunction with, any supplemental information provided by and discussions with Houlihan Lokey in connection therewith. Any defined terms used herein shall have the meanings set forth herein, even if such defined terms have been given different meanings elsewhere in the materials. The materials are for discussion purposes only. Houlihan Lokey expressly disclaims any and all liability, whether direct or indirect, in contract or tort or otherwise, to any person in connection with the materials. The materials were prepared for specific persons familiar with the business and affairs of the Company for use in a specific context and were not prepared with a view to public disclosure or to conform with any disclosure standards under any state, federal or international securities laws or other laws, rules or regulations, and none of the Board, the Company or Houlihan Lokey takes any responsibility for the use of the materials by persons other than the Board. The materials are provided on a confidential basis solely for the information of the Board and may not be disclosed, summarized, reproduced, disseminated or quoted or otherwise referred to, in whole or in part, without Houlihan Lokey’s express prior written consent, except as expressly permitted by Houlihan Lokey’s engagement letter with the Company. Notwithstanding any other provision herein, the Company (and each employee, representative or other agent of the Company) may disclose to any and all persons without limitation of any kind, the tax treatment and tax structure of any transaction and all materials of any kind (including opinions or other tax analyses, if any) that are provided to the Company relating to such tax treatment and structure. However, any information relating to the tax treatment and tax structure shall remain confidential (and the foregoing sentence shall not apply) to the extent necessary to enable any person to comply with securities laws. For this purpose, the tax treatment of a transaction is the purported or claimed U.S. income or franchise tax treatment of the transaction and the tax structure of a transaction is any fact that may be relevant to understanding the purported or claimed U.S. income or franchise tax treatment of the transaction. If the Company plans to disclose information pursuant to the first sentence of this paragraph, the Company shall inform those to whom it discloses any such information that they may not rely upon such information for any purpose without Houlihan Lokey’s prior written consent. Houlihan Lokey is not an expert on, and nothing contained in the materials should be construed as advice with regard to, legal, accounting, regulatory, insurance, tax or other specialist matters. Houlihan Lokey’s role in reviewing any information was limited solely to performing such a review as it deemed necessary to support its own advice and analysis and was not on behalf of the Board. The materials necessarily are based on financial, economic, market and other conditions as in effect on, and the information available to Houlihan Lokey as of, the date of the materials. Although subsequent developments may affect the contents of the materials, Houlihan Lokey has not undertaken, and is under no obligation, to update, revise or reaffirm the materials. The materials are not intended to provide the sole basis for evaluation of the Transaction and do not purport to contain all information that may be required. The materials do not address the underlying business decision of the Company or any other party to proceed with or effect the Transaction, or the relative merits of the Transaction as compared to any alternative business strategies or transactions that might be available for the Company or any other party. The materials do not constitute any opinion, nor do the materials constitute a recommendation to the Board, the Company, any security holder of the Company or any other party as to how to vote or act with respect to any matter relating to the Transaction or otherwise or whether to buy or sell any assets or securities of any company. Houlihan Lokey’s only opinion is the opinion, if any, that is actually delivered to the Board. In preparing the materials Houlihan Lokey has acted as an independent contractor and nothing in the materials is intended to create or shall be construed as creating a fiduciary or other relationship between Houlihan Lokey and any party. The materials may not reflect information known to other professionals in other business areas of Houlihan Lokey and its affiliates. Disclaimer 36 |
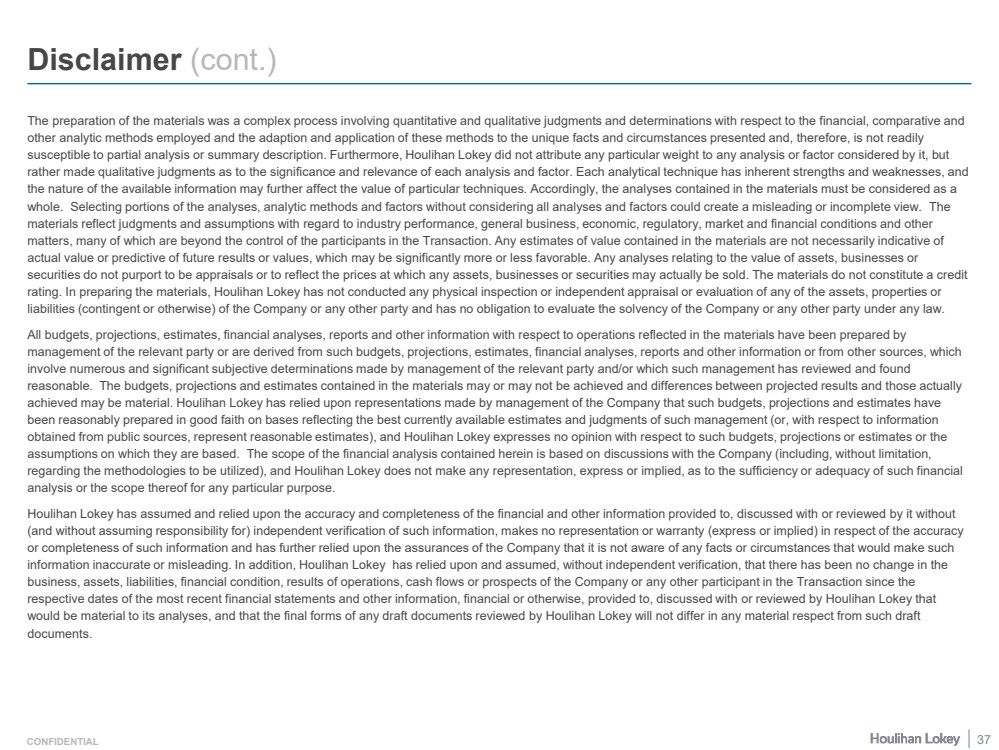
| CONFIDENTIAL The preparation of the materials was a complex process involving quantitative and qualitative judgments and determinations with respect to the financial, comparative and other analytic methods employed and the adaption and application of these methods to the unique facts and circumstances presented and, therefore, is not readily susceptible to partial analysis or summary description. Furthermore, Houlihan Lokey did not attribute any particular weight to any analysis or factor considered by it, but rather made qualitative judgments as to the significance and relevance of each analysis and factor. Each analytical technique has inherent strengths and weaknesses, and the nature of the available information may further affect the value of particular techniques. Accordingly, the analyses contained in the materials must be considered as a whole. Selecting portions of the analyses, analytic methods and factors without considering all analyses and factors could create a misleading or incomplete view. The materials reflect judgments and assumptions with regard to industry performance, general business, economic, regulatory, market and financial conditions and other matters, many of which are beyond the control of the participants in the Transaction. Any estimates of value contained in the materials are not necessarily indicative of actual value or predictive of future results or values, which may be significantly more or less favorable. Any analyses relating to the value of assets, businesses or securities do not purport to be appraisals or to reflect the prices at which any assets, businesses or securities may actually be sold. The materials do not constitute a credit rating. In preparing the materials, Houlihan Lokey has not conducted any physical inspection or independent appraisal or evaluation of any of the assets, properties or liabilities (contingent or otherwise) of the Company or any other party and has no obligation to evaluate the solvency of the Company or any other party under any law. All budgets, projections, estimates, financial analyses, reports and other information with respect to operations reflected in the materials have been prepared by management of the relevant party or are derived from such budgets, projections, estimates, financial analyses, reports and other information or from other sources, which involve numerous and significant subjective determinations made by management of the relevant party and/or which such management has reviewed and found reasonable. The budgets, projections and estimates contained in the materials may or may not be achieved and differences between projected results and those actually achieved may be material. Houlihan Lokey has relied upon representations made by management of the Company that such budgets, projections and estimates have been reasonably prepared in good faith on bases reflecting the best currently available estimates and judgments of such management (or, with respect to information obtained from public sources, represent reasonable estimates), and Houlihan Lokey expresses no opinion with respect to such budgets, projections or estimates or the assumptions on which they are based. The scope of the financial analysis contained herein is based on discussions with the Company (including, without limitation, regarding the methodologies to be utilized), and Houlihan Lokey does not make any representation, express or implied, as to the sufficiency or adequacy of such financial analysis or the scope thereof for any particular purpose. Houlihan Lokey has assumed and relied upon the accuracy and completeness of the financial and other information provided to, discussed with or reviewed by it without (and without assuming responsibility for) independent verification of such information, makes no representation or warranty (express or implied) in respect of the accuracy or completeness of such information and has further relied upon the assurances of the Company that it is not aware of any facts or circumstances that would make such information inaccurate or misleading. In addition, Houlihan Lokey has relied upon and assumed, without independent verification, that there has been no change in the business, assets, liabilities, financial condition, results of operations, cash flows or prospects of the Company or any other participant in the Transaction since the respective dates of the most recent financial statements and other information, financial or otherwise, provided to, discussed with or reviewed by Houlihan Lokey that would be material to its analyses, and that the final forms of any draft documents reviewed by Houlihan Lokey will not differ in any material respect from such draft documents. Disclaimer (cont.) 37 |
| CONFIDENTIAL The materials are not an offer to sell or a solicitation of an indication of interest to purchase any security, option, commodity, future, loan or currency. The materials do not constitute a commitment by Houlihan Lokey or any of its affiliates to underwrite, subscribe for or place any securities, to extend or arrange credit, or to provide any other services. In the ordinary course of business, certain of Houlihan Lokey’s affiliates and employees, as well as investment funds in which they may have financial interests or with which they may co-invest, may acquire, hold or sell, long or short positions, or trade or otherwise effect transactions, in debt, equity, and other securities and financial instruments (including loans and other obligations) of, or investments in, the Company, any Transaction counterparty, any other Transaction participant, any other financially interested party with respect to any transaction, other entities or parties that are mentioned in the materials, or any of the foregoing entities’ or parties’ respective affiliates, subsidiaries, investment funds, portfolio companies and representatives (collectively, the “Interested Parties”), or any currency or commodity that may be involved in the Transaction. Houlihan Lokey provides mergers and acquisitions, restructuring and other advisory and consulting services to clients, which may have in the past included, or may currently or in the future include, one or more Interested Parties, for which services Houlihan Lokey has received, and may receive, compensation. Although Houlihan Lokey in the course of such activities and relationships or otherwise may have acquired, or may in the future acquire, information about one or more Interested Parties or the Transaction, or that otherwise may be of interest to the Board or the Company, Houlihan Lokey shall have no obligation to, and may not be contractually permitted to, disclose such information, or the fact that Houlihan Lokey is in possession of such information, to the Board or the Company or to use such information on behalf of the Board or the Company. Houlihan Lokey’s personnel may make statements or provide advice that is contrary to information contained in the materials. Disclaimer (cont.) 38 |

| CONFIDENTIAL 39 CORPORATE FINANCE FINANCIAL RESTRUCTURING FINANCIAL AND VALUATION ADVISORY HL.com |