Please wait
.2
| | | | | | | | |
| | Highlights |
| | Customer Metrics |
| | Financial Metrics |
| | Capital Structure |
| | |
| | Guidance |
| | Contacts |
| | Financial and Operational Tables |
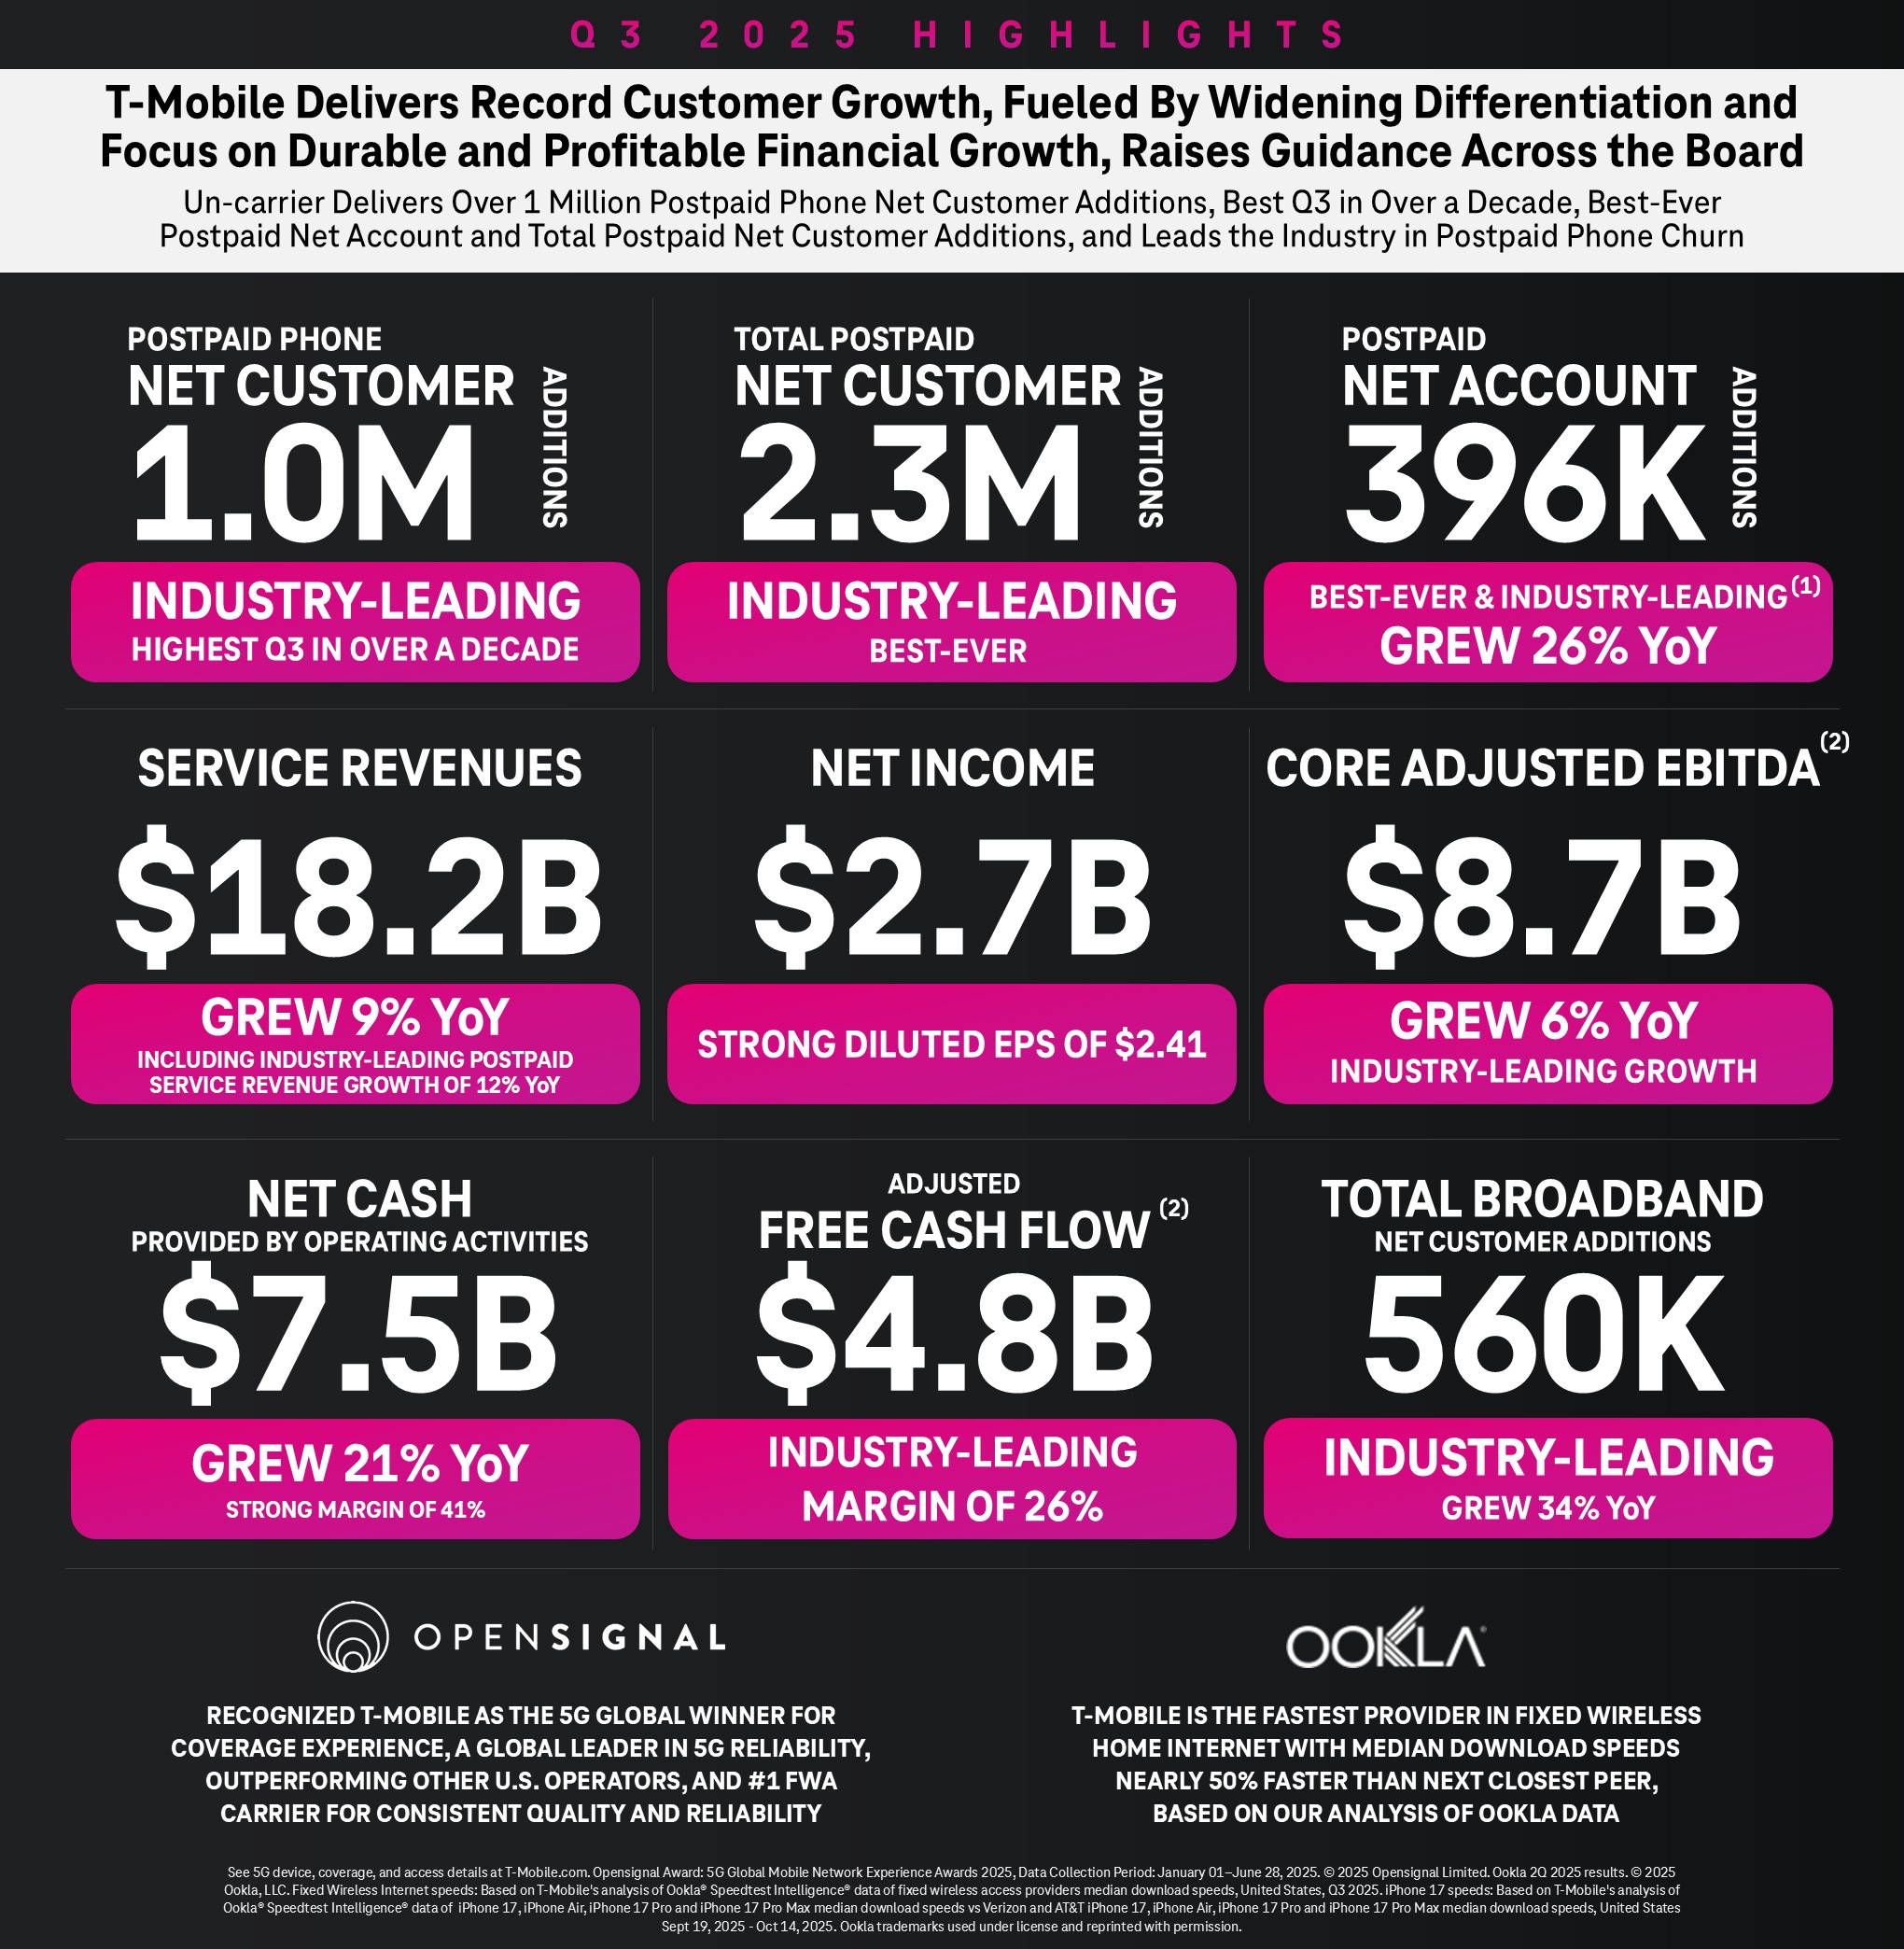
(1)AT&T Inc. does not disclose postpaid net account additions. Comcast and Charter do not disclose postpaid phone net customer additions. Industry-leading claims are based on consensus expectations if results are not yet reported.
(2)Core Adjusted EBITDA, Adjusted Free Cash Flow and Adjusted Free Cash Flow Margin are non-GAAP financial measures. These non-GAAP financial measures should be considered in addition to, but not as a substitute for, the information provided in accordance with GAAP. Reconciliations for these non-GAAP financial measures to the most directly comparable GAAP financial measures are provided in the Reconciliation of Non-GAAP Financial Measures to GAAP Financial Measures tables. We are not able to forecast Net income on a forward-looking basis without unreasonable efforts due to the high variability and difficulty in predicting certain items that affect Net income, including, but not limited to, Income tax expense and Interest expense. Core Adjusted EBITDA should not be used to predict Net income as the difference between this measure and Net income is variable.
| | | | | |
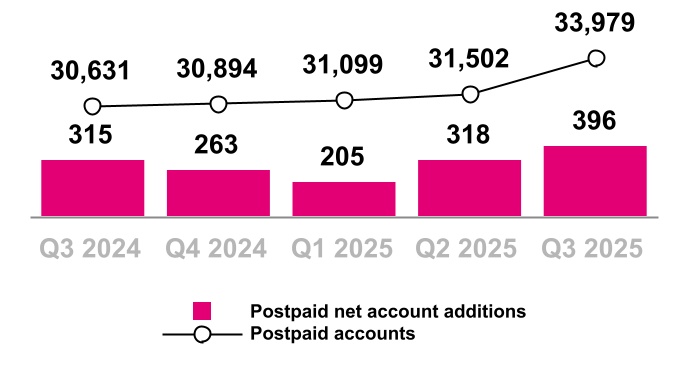
| Postpaid Accounts (in thousands) |
During Q2 2025, we acquired 85,000 postpaid accounts from Lumos.
During Q3 2025, we acquired 1,448,000 postpaid accounts, net of certain base adjustments, through the UScellular acquisition.
During Q3 2025, we acquired 633,000 postpaid accounts from Metronet and other acquisitions.
Continued growth in Postpaid accounts with an increase in net additions primarily due to:
■Higher gross account additions, including fiber account additions following the acquisitions of Metronet and Lumos
■Partially offset by higher account deactivations, including the impact from a growing account base
Continued growth in Postpaid accounts with an increase in net additions primarily due to:
■Higher gross account additions, including seasonal trends and fiber account additions following the acquisition of Metronet
■Partially offset by higher account deactivations, including seasonal trends and the impact from a growing account base
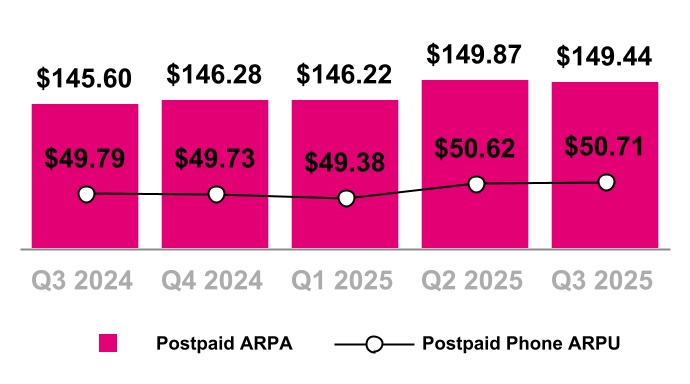
Postpaid ARPA increased 3% primarily due to:
■The positive impact from rate plan optimizations and higher fee revenue, including from the adoption of new tax and fee exclusive plans
■An increase in customers per account, including from the continued adoption of 5G broadband and continued growth of T-Mobile for Business customers, partially offset by fiber and UScellular accounts with fewer customers per account
■Higher premium services, primarily high-end rate plans, net of contra revenues for content included in such plans, and discounts for specific affinity groups (55+, military, and first responders)
■Partially offset by increased promotional activity, including the success of bundled offerings
Postpaid phone ARPU increased 2% primarily due to:
■The positive impact from rate plan optimizations and higher fee revenue, including from the adoption of new tax and fee exclusive plans
■Higher premium services, primarily high-end rate plans, net of contra revenues for content included in such plans, and discounts for specific affinity groups (55+, military, and first responders), partially offset by continued growth in T-Mobile for Business customers with lower ARPU given larger account sizes
■The acquisition of higher-ARPU UScellular customers
■Partially offset by increased promotional activity including the success of bundled offerings
Postpaid ARPA decreased slightly primarily due to:
■A decrease in customers per account due to fiber and UScellular accounts with fewer customers per account, partially offset by the continued adoption of 5G broadband and continued growth of T-Mobile for Business customers
■Increased promotional activity, including the success of bundled offerings
■Mostly offset by higher fee revenue, including from the adoption of new tax and fee exclusive plans, and the positive impact from rate plan optimizations
Postpaid phone ARPU increased slightly primarily due to:
■The positive impact from rate plan optimizations and higher fee revenue, including from the adoption of new tax and fee exclusive plans
■The acquisition of higher-ARPU UScellular customers
■Mostly offset by increased promotional activity, including the success of bundled offerings
| | | | | |
| Postpaid ARPA & Postpaid Phone ARPU |
| | | | | |
| Postpaid Customers (in thousands) |
During Q2 2025, we acquired 97,000 postpaid fiber customers from Lumos.
During Q3 2025, we acquired 3,677,000 postpaid customers, net of certain base adjustments, through the UScellular acquisition.
During Q3 2025, we acquired 755,000 postpaid fiber customers from Metronet and other acquisitions.
Postpaid phone net customer additions increased primarily due to:
■Higher gross additions
■Partially offset by increased deactivations from a growing customer base and higher churn
Postpaid other net customer additions increased primarily due to:
■Higher net additions from mobile internet devices, including from success in business customers
■Higher broadband net additions
■Higher net additions from other connected devices
Postpaid phone net customer additions increased primarily due to:
■Higher gross additions, including seasonal trends
■Partially offset by increased deactivations from a growing customer base
Postpaid other net customer additions increased primarily due to:
■Higher net additions from mobile internet devices, including from success in business customers
■Higher broadband net additions
■Higher net additions from other connected devices
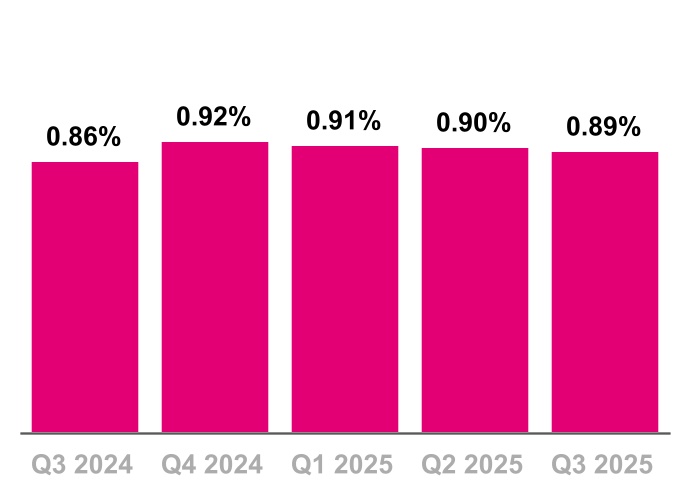
Postpaid phone churn increased 3 basis points primarily due to:
■Higher industry switching
Postpaid phone churn decreased 1 basis point primarily due to:
■Moderation of the temporary impact of current year rate plan optimizations
■Mostly offset by seasonal trends
| | | | | |
| Prepaid Customers (in thousands) |
During Q3 2025, we acquired 349,000 prepaid customers, net of certain base adjustments, through the UScellular acquisition.
Prepaid net customer additions increased primarily due to:
■Higher gross additions
■Partially offset by higher prepaid to postpaid migrations and increased deactivations from a growing customer base
Prepaid net customer additions increased primarily due to:
■Higher gross additions
■Partially offset by seasonally higher churn
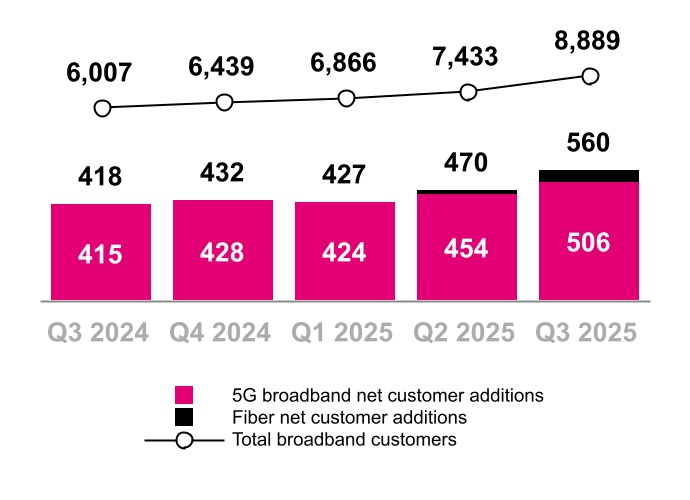
Total broadband net customer additions increased primarily due to:
■Higher gross additions, including fiber gross additions following the acquisitions of Metronet and Lumos
■Lower 5G broadband churn
■Partially offset by increased deactivations from a growing customer base
Total broadband net customer additions increased primarily due to:
■Higher gross additions, including fiber gross additions following the acquisition of Metronet
■Partially offset by increased deactivations from a growing customer base and seasonally higher churn
| | | | | |
| Broadband Customers (in thousands) |
During Q2 2025, we acquired 97,000 fiber customers from Lumos.
During Q3 2025, we acquired 141,000 postpaid 5G broadband customers, net of certain base adjustments, through the UScellular acquisition.
During Q3 2025, we acquired 755,000 fiber customers from Metronet and other acquisitions.
| | | | | |
| Service Revenues ($ in millions) |
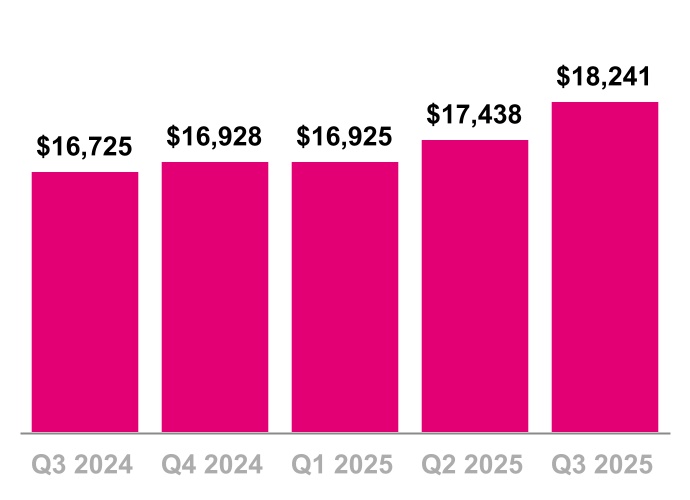
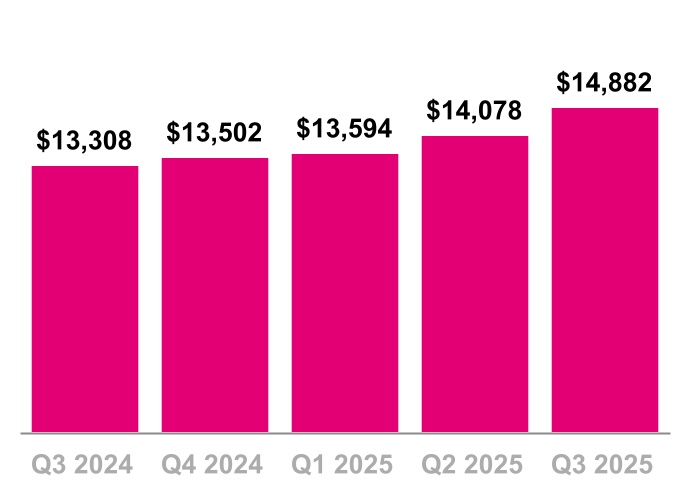
Service revenues increased 9% primarily due to:
■An increase in Postpaid service revenues, including following the acquisitions of UScellular, Metronet and Lumos
Service revenues increased 5% primarily due to:
■An increase in Postpaid service revenues, including following the acquisitions of UScellular and Metronet
Postpaid service revenues increased 12% primarily due to:
■Higher average postpaid accounts, including following the acquisitions of UScellular, Metronet and Lumos
■Higher postpaid ARPA
Postpaid service revenues increased 6% primarily due to:
■Higher average postpaid accounts, including following the acquisitions of UScellular and Metronet
| | | | | |
| Postpaid Service Revenues ($ in millions) |
| | | | | |
| Equipment Revenues ($ in millions) |
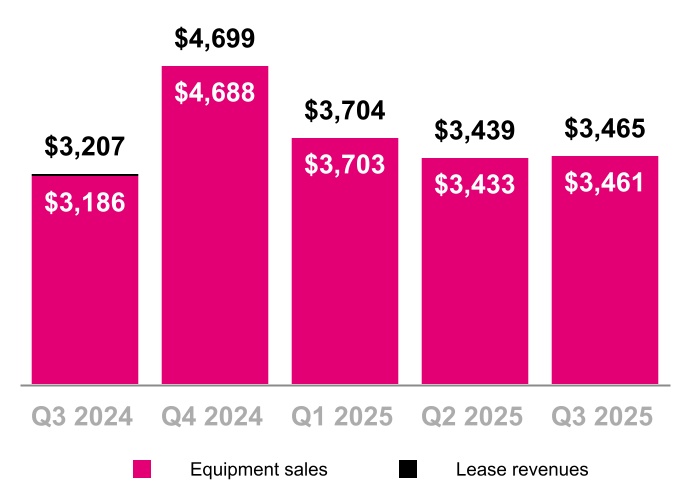
Equipment revenues increased 8% primarily due to:
■A higher number of devices sold, primarily driven by higher postpaid upgrades and following the UScellular acquisition
■A higher average revenue per device sold, net of promotions, primarily driven by an increase in the high-end phone mix
Equipment revenues increased slightly, primarily due to:
■A higher number of devices sold, primarily following the UScellular acquisition, and seasonal trends
■Partially offset by lower liquidation revenue, primarily due to a lower number of liquidated devices
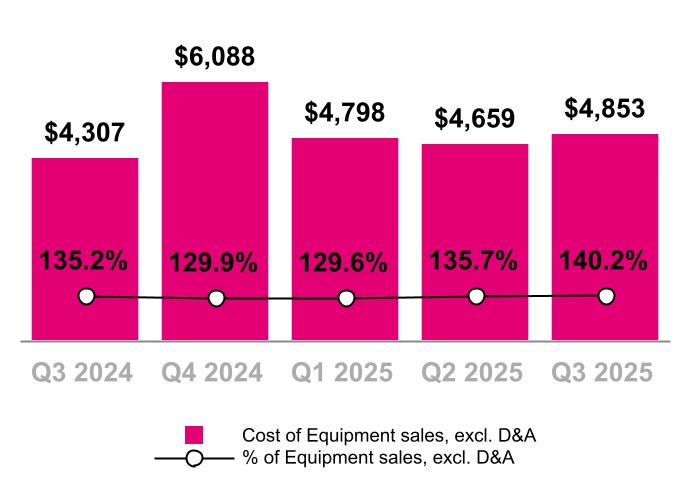
Cost of equipment sales, exclusive of Depreciation and Amortization (D&A), increased 13% primarily due to: ■A higher number of devices sold, primarily driven by higher postpaid upgrades and following the UScellular acquisition
■A higher average cost per device sold, primarily driven by an increase in the high-end phone mix
Cost of equipment sales, exclusive of D&A, increased 4% primarily due to:
■A higher number of devices sold, primarily following the UScellular acquisition, and seasonal trends
■Partially offset by lower liquidation costs, primarily due to a lower number of liquidated devices
| | | | | |
| Cost of Equipment Sales, exclusive of D&A ($ in millions, % of Equipment sales) |
| | | | | |
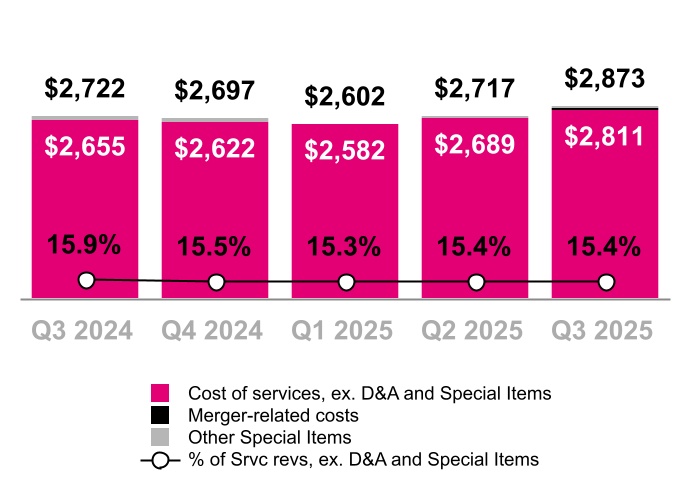
| Cost of Services, exclusive of D&A ($ in millions, % of Service revenues) |
Cost of services, exclusive of D&A, increased 6% primarily due to:
■Higher costs following the acquisition of UScellular
■Wholesale network access costs and customer installation fees paid to Metronet and Lumos
■Partially offset by lower repair and maintenance expenses
Cost of services, exclusive of D&A, increased 6% primarily due to:
■Higher costs following the acquisition of UScellular
■Wholesale network access costs and customer installation fees paid to Metronet
■Partially offset by lower repair and maintenance expenses
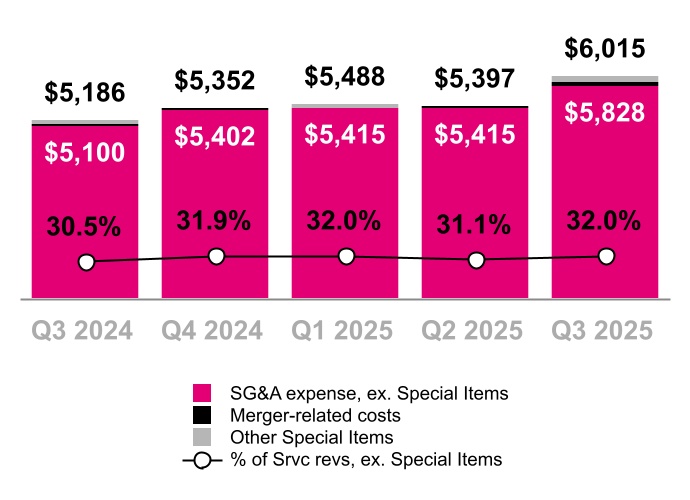
SG&A expense increased 16% primarily due to:
■Higher personnel-related costs, including payroll, benefits and restructuring
■Higher costs following the acquisition of UScellular, including merger-related costs
■Higher advertising expenses
SG&A expense increased 11% primarily due to:
■Higher costs following the acquisition of UScellular, including merger-related costs
■Higher personnel-related costs, including payroll, benefits and restructuring
■A prior quarter gain of $151 million related to the completed sale of a portion of our 3.45 GHz spectrum licenses, which was excluded from Core Adjusted EBITDA
| | | | | |
| Selling, General and Administrative (SG&A) Expense ($ in millions, % of Service revenues) |
| | | | | |
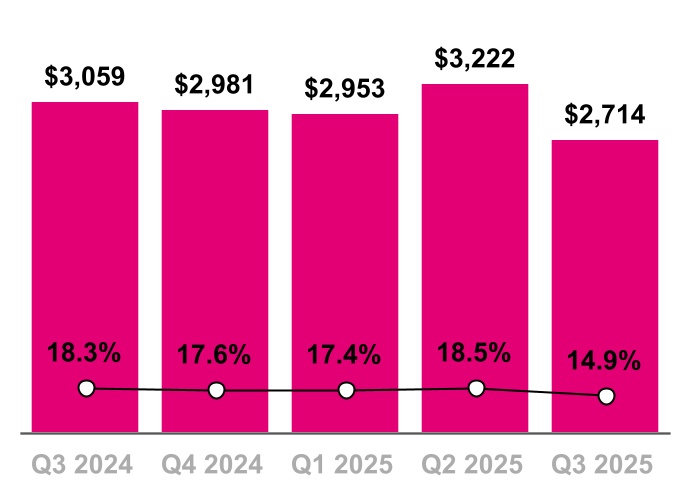
| Net Income ($ in millions, % of Service revenues) |
| | | | | |
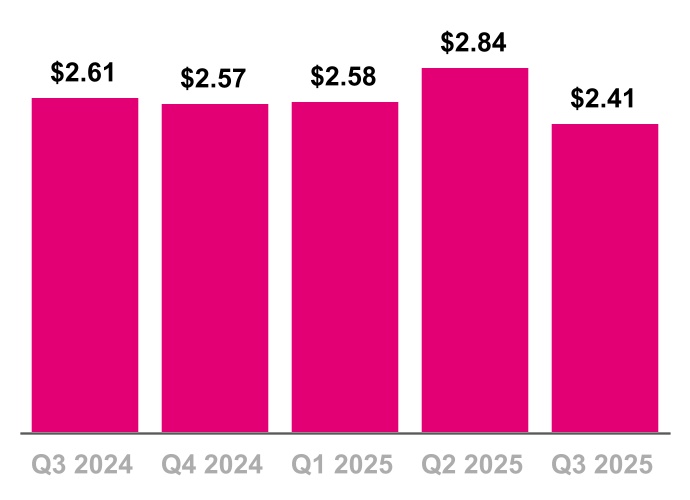
| Diluted Earnings Per Share (Diluted EPS) |
Net income was $2.7 billion and Diluted earnings per share was $2.41 in Q3 2025, compared to $3.1 billion and $2.61 in Q3 2024, primarily due to the factors described above and included the following:
■Impairment expense related to certain capitalized software development costs, net of tax, in Q3 2025 of $208 million, or $0.18 per share.
Net income was $2.7 billion and Diluted earnings per share was $2.41 in Q3 2025, compared to $3.2 billion and $2.84 in Q2 2025, primarily due to the factors described above and included the following:
■Impairment expense related to certain capitalized software development costs, net of tax, in Q3 2025 of $208 million, or $0.18 per share.
| | | | | |
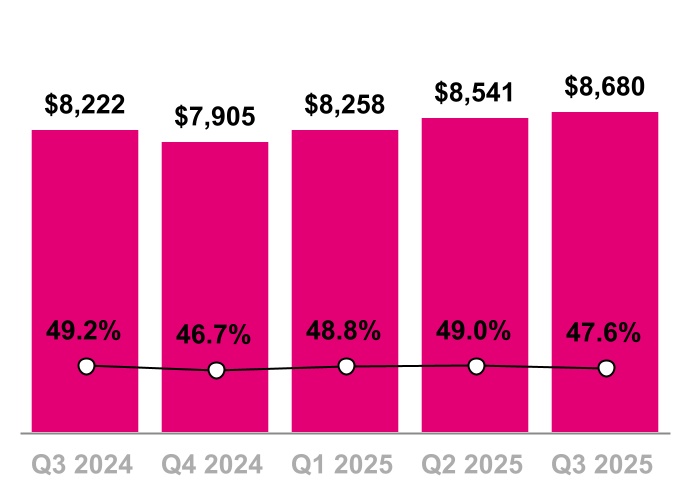
| Core Adjusted EBITDA* ($ in millions, % of Service revenues) |
*Excludes Special Items (see detail on page 25)
Core Adjusted EBITDA increased 6% primarily due to:
■Higher Total service revenues
■Higher Equipment revenues, excluding Lease revenues
■Partially offset by higher SG&A expenses, excluding Special Items, higher Cost of equipment sales, excluding Special Items, and higher Cost of services, excluding Special Items
Core Adjusted EBITDA increased 2% primarily due to:
■Higher Total service revenues
■Partially offset by higher SG&A expenses, excluding Special Items, higher Cost of equipment sales, excluding Special Items, and higher Cost of services, excluding Special Items
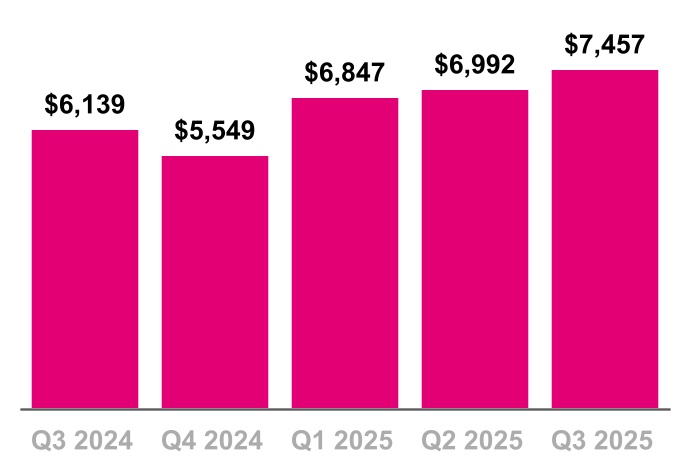
Net cash provided by operating activities increased 21% primarily due to:
■Lower net cash outflows from changes in working capital, including the impact of certain cash proceeds associated with the sale of receivables, which were recognized within investing cash flows before November 1, 2024
■Higher Net income, adjusted for non-cash income and expenses
Net cash provided by operating activities increased 7% primarily due to:
■Higher Net income, adjusted for non-cash income and expenses
■Lower net cash outflows from changes in working capital
The impact of net payments for Merger-related costs on Net cash provided by operating activities was $96 million in Q3 2025 compared to $92 million in Q2 2025 and $132 million in Q3 2024.
| | | | | |
| Net Cash Provided by Operating Activities ($ in millions) |
Effective November 1, 2024, following amendments to the company’s Equipment Installment Plan Sale and Service Receivable Sale arrangements, all cash proceeds associated with the sale of such receivables, a portion of which was previously recognized as Proceeds related to beneficial interests in securitization transactions within investing cash flows, were recognized as operating cash flows. These amendments did not have a net impact on Adjusted Free Cash Flow.
| | | | | |
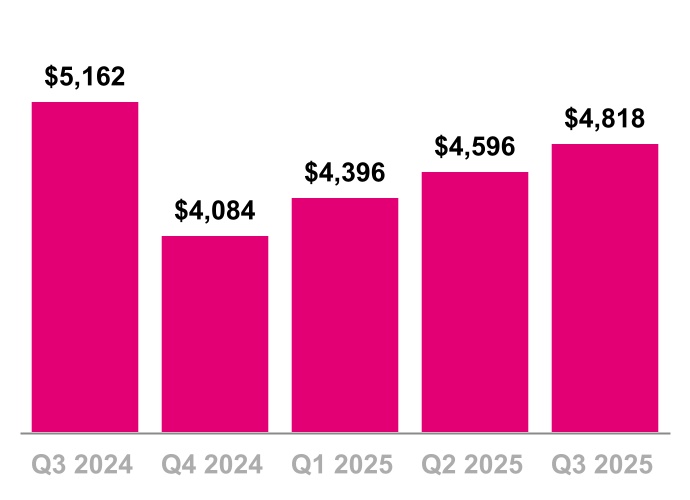
| Cash Purchases of Property and Equipment, incl. Capitalized Interest ($ in millions, % of Service revenues) |
Cash purchases of property and equipment, including capitalized interest, increased 35% primarily due to:
■Planned timing of capital purchases, including for increased greenfield site builds in the second half of the year and incremental capital expenditures following the acquisition of UScellular
Cash purchases of property and equipment, including capitalized interest, increased 10% primarily due to:
■Planned timing of capital purchases, including for increased greenfield site builds in the second half of the year and incremental capital expenditures following the acquisition of UScellular
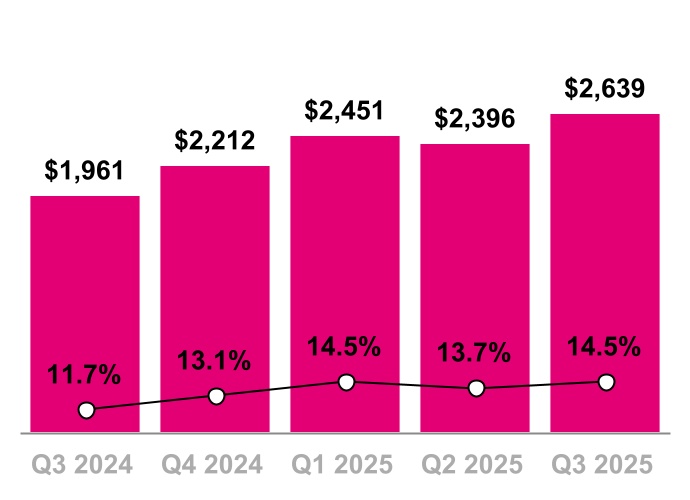
Adjusted Free Cash Flow decreased 7% primarily due to:
■Higher Cash purchases of property and equipment
■Partially offset by higher Net cash provided by operating activities and the impact of certain cash proceeds associated with the sale of receivables, which were recognized within investing cash flows before November 1, 2024, and are now recognized as operating cash flows. This change had no net impact to Adjusted Free Cash Flow.
All cash proceeds from the sale of receivables are now recognized within Net cash provided by operating activities. There were no significant net cash impacts during the quarter from securitization.
Adjusted Free Cash Flow increased 5% primarily due to:
■Higher Net cash provided by operating activities
■Partially offset by higher Cash purchases of property and equipment
The impact of net payments for Merger-related costs on Adjusted Free Cash Flow was $96 million in Q3 2025 compared to $92 million in Q2 2025 and $132 million in Q3 2024
| | | | | |
| Adjusted Free Cash Flow ($ in millions) |
| | | | | |
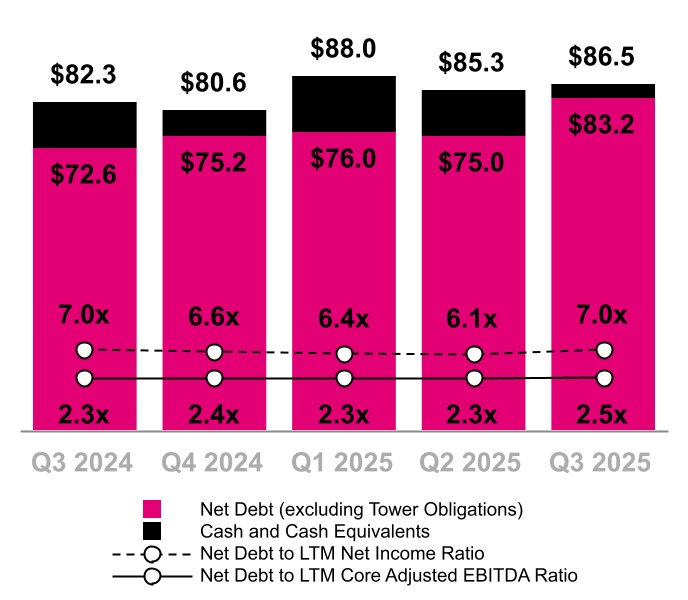
| Total Debt (Excluding Tower Obligations), Net Debt (Excluding Tower Obligations), and Net Debt to LTM Net Income and Core Adj. EBITDA Ratios ($ in billions) |
| | | | | |
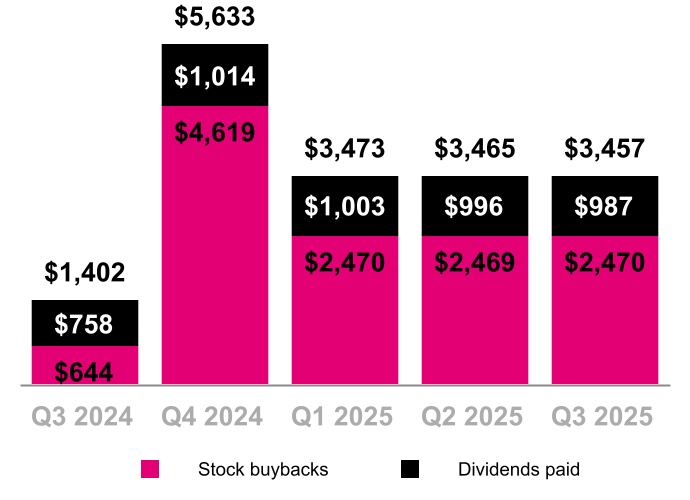
| Stockholder Returns ($ in millions) |
Total debt, excluding tower obligations, at the end of Q3 2025 was $86.5 billion.
Net debt, excluding tower obligations, at the end of Q3 2025 was $83.2 billion.
■On December 13, 2024, the Board of Directors announced a stockholder return program for up to $14.0 billion that will run through December 31, 2025, consisting of additional repurchases of shares and payment of cash dividends. On a cumulative basis, since the company initiated its stockholder return program in Q3 2022, a total of $41.8 billion has been returned to stockholders as of September 30, 2025, with 204.1 million shares repurchased for approximately $34.7 billion, and cumulative cash dividends of $7.0 billion.
■During Q3 2025, 10.2 million shares were repurchased for approximately $2.5 billion.
■During Q3 2025, the company paid a cash dividend of $0.88 per share of common stock, or approximately $987 million, on September 11, 2025.
■During Q3 2025, the Board of Directors increased cash dividends per share by $0.14 or 16%, declaring a cash dividend of $1.02 per share on our issued and outstanding common stock. The dividend will be paid on December 11, 2025, to stockholders of record as of the close of business on November 26, 2025.
2025 Outlook
| | | | | | | | | | | |
| Metric | Previous | Revised | Change at Midpoint |
| Postpaid net customer additions | 6.1 to 6.4 million | 7.2 to 7.4 million | 1.05 million |
Net income (1) | N/A | N/A | N/A |
| Effective tax rate | 24% to 26% | 23% to 24% | (150) bps |
Core Adjusted EBITDA (2) | $33.3 to $33.7 billion | $33.7 to $33.9 billion | $300 million |
| Net cash provided by operating activities | $27.1 to $27.5 billion | $27.8 to $28.0 billion | $600 million |
Capital expenditures (3) | ~$9.5 billion | ~$10.0 billion | $500 million |
| Adjusted Free Cash Flow | $17.6 to $18.0 billion | $17.8 to $18.0 billion | $100 million |
(1)We are not able to forecast Net income on a forward-looking basis without unreasonable efforts due to the high variability and difficulty in predicting certain items that affect GAAP Net income, including, but not limited to, Income tax expense and Interest expense. Core Adjusted EBITDA should not be used to predict Net income as the difference between this measure and Net income is variable.
(2)Management uses Core Adjusted EBITDA as a measure to monitor the financial performance of our operations, excluding the impact of lease revenues from our related device financing programs.
(3)Capital expenditures means cash purchases of property and equipment, including capitalized interest.
Investor Relations
| | | | | | | | | | | | | | | | | | | | |
| | | | | | |
| | | | | | |
| Cathy Yao | | Matthew Hale | | Jon Lanterman | |
| Senior Vice President | | Senior Director | | Senior Director | |
| Investor Relations | | Investor Relations | | Investor Relations | |
| | | | | | | | | | | | | | | | | | | | | | | | | | |
| | | | | | | | |
| | | | | | | | |
| Chris Lo | | Rose Kopecky | | Charles Buffum | | Danna Tao | |
| Investor Relations | | Investor Relations | | Investor Relations | | Investor Relations | |
| Manager | | Manager | | Manager | | Manager | |
investor.relations@t-mobile.com
https://investor.t-mobile.com
T-Mobile US, Inc.
Condensed Consolidated Balance Sheets
(Unaudited)
| | | | | | | | | | | |
| (in millions, except share and per share amounts) | September 30,
2025 | | December 31,
2024 |
| Assets | | | |
| Current assets | | | |
| | | |
| Cash and cash equivalents | $ | 3,310 | | | $ | 5,409 | |
| Accounts receivable, net of allowance for credit losses of $206 and $176 | 5,084 | | | 4,276 | |
Equipment installment plan receivables, net of allowance for credit losses and imputed discount of $646 and $656 | 4,599 | | | 4,379 | |
| | | |
| Inventory | 2,370 | | | 1,607 | |
| | | |
| Prepaid expenses | 1,128 | | | 880 | |
| | | |
| Other current assets | 5,212 | | | 1,853 | |
| | | |
| Total current assets | 21,703 | | | 18,404 | |
| | | |
| Property and equipment, net | 38,718 | | | 38,533 | |
| Operating lease right-of-use assets | 26,070 | | | 25,398 | |
| Financing lease right-of-use assets | 2,955 | | | 3,091 | |
| Goodwill | 13,690 | | | 13,005 | |
| Spectrum licenses | 97,749 | | | 100,558 | |
| Other intangible assets, net | 4,117 | | | 2,512 | |
Equipment installment plan receivables due after one year, net of allowance for credit losses and imputed discount of $186 and $158 | 2,316 | | | 2,209 | |
| | | |
| Other assets | 9,862 | | | 4,325 | |
| | | |
| Total assets | $ | 217,180 | | | $ | 208,035 | |
| Liabilities and Stockholders' Equity | | | |
| Current liabilities | | | |
| | | |
| Accounts payable and accrued liabilities | $ | 9,193 | | | $ | 8,463 | |
| | | |
| Short-term debt | 6,333 | | | 4,068 | |
| | | |
| Deferred revenue | 1,487 | | | 1,222 | |
| Short-term operating lease liabilities | 3,550 | | | 3,281 | |
| Short-term financing lease liabilities | 1,157 | | | 1,175 | |
| | | |
| Other current liabilities | 2,581 | | | 1,965 | |
| | | |
| Total current liabilities | 24,301 | | | 20,174 | |
| | | |
| Long-term debt | 76,365 | | | 72,700 | |
| Long-term debt to affiliates | 1,498 | | | 1,497 | |
| Tower obligations | 3,568 | | | 3,664 | |
| Deferred tax liabilities | 19,222 | | | 16,700 | |
| Operating lease liabilities | 26,780 | | | 26,408 | |
| Financing lease liabilities | 1,186 | | | 1,151 | |
| | | |
| | | |
| Other long-term liabilities | 3,783 | | | 4,000 | |
| | | |
| Total long-term liabilities | 132,402 | | | 126,120 | |
| Commitments and contingencies | | | |
| Stockholders' equity | | | |
| | | |
| | | |
| Common stock, par value $0.00001 per share, 2,000,000,000 shares authorized; 1,275,435,436 and 1,271,074,364 shares issued, 1,118,506,240 and 1,144,579,681 shares outstanding | — | | | — | |
| Additional paid-in capital | 69,267 | | | 68,798 | |
| Treasury stock, at cost, 156,929,196 and 126,494,683 shares issued | (28,064) | | | (20,584) | |
| Accumulated other comprehensive loss | (881) | | | (857) | |
| Retained earnings | 20,155 | | | 14,384 | |
| | | |
| Total stockholders' equity | 60,477 | | | 61,741 | |
| Total liabilities and stockholders' equity | $ | 217,180 | | | $ | 208,035 | |
| | | |
| | | |
| | | |
| | | |
| | | |
| | | |
| | | |
| | | |
| | | |
| | | |
| | | |
| | | |
| | | |
| | | |
| | | |
| | | |
| | | |
| | | |
| | | |
| | | |
T-Mobile US, Inc.
Condensed Consolidated Statements of Comprehensive Income
(Unaudited)
| | | | | | | | | | | | | | | | | | | | | | | | | | | | | |
| Three Months Ended | | Nine Months Ended September 30, |
| (in millions, except share and per share amounts) | September 30,
2025 | | June 30,
2025 | | September 30,
2024 | | 2025 | | 2024 |
| Revenues | | | | | | | | | |
| | | | | | | | | |
| Postpaid revenues | $ | 14,882 | | | $ | 14,078 | | | $ | 13,308 | | | $ | 42,554 | | | $ | 38,838 | |
| Prepaid revenues | 2,625 | | | 2,643 | | | 2,716 | | | 7,911 | | | 7,711 | |
| Wholesale and other service revenues | 734 | | | 717 | | | 701 | | | 2,139 | | | 2,701 | |
| | | | | | | | | |
| | | | | | | | | |
| Total service revenues | 18,241 | | | 17,438 | | | 16,725 | | | 52,604 | | | 49,250 | |
| | | | | | | | | |
| Equipment revenues | 3,465 | | | 3,439 | | | 3,207 | | | 10,608 | | | 9,564 | |
| Other revenues | 251 | | | 255 | | | 230 | | | 763 | | | 714 | |
| | | | | | | | | |
| Total revenues | 21,957 | | | 21,132 | | | 20,162 | | | 63,975 | | | 59,528 | |
| | | | | | | | | |
| Operating expenses | | | | | | | | | |
| | | | | | | | | |
| Cost of services, exclusive of depreciation and amortization shown separately below | 2,873 | | | 2,717 | | | 2,722 | | | 8,192 | | | 8,074 | |
| Cost of equipment sales, exclusive of depreciation and amortization shown separately below | 4,853 | | | 4,659 | | | 4,307 | | | 14,310 | | | 12,794 | |
| Selling, general and administrative | 6,015 | | | 5,397 | | | 5,186 | | | 16,900 | | | 15,466 | |
| Impairment expense | 278 | | | — | | | — | | | 278 | | | — | |
| | | | | | | | | |
| Depreciation and amortization | 3,408 | | | 3,146 | | | 3,151 | | | 9,752 | | | 9,770 | |
| | | | | | | | | |
| | | | | | | | | |
| Total operating expenses | 17,427 | | | 15,919 | | | 15,366 | | | 49,432 | | | 46,104 | |
| | | | | | | | | |
| Operating income | 4,530 | | | 5,213 | | | 4,796 | | | 14,543 | | | 13,424 | |
| | | | | | | | | |
| Other expense, net | | | | | | | | | |
| | | | | | | | | |
| Interest expense, net | (924) | | | (922) | | | (836) | | | (2,762) | | | (2,570) | |
| | | | | | | | | |
| | | | | | | | | |
| Other (expense) income, net | (78) | | | (11) | | | 7 | | | (135) | | | 19 | |
| Total other expense, net | (1,002) | | | (933) | | | (829) | | | (2,897) | | | (2,551) | |
| Income before income taxes | 3,528 | | | 4,280 | | | 3,967 | | | 11,646 | | | 10,873 | |
| Income tax expense | (814) | | | (1,058) | | | (908) | | | (2,757) | | | (2,515) | |
| | | | | | | | | |
| | | | | | | | | |
| | | | | | | | | |
| Net income | $ | 2,714 | | | $ | 3,222 | | | $ | 3,059 | | | $ | 8,889 | | | $ | 8,358 | |
| | | | | | | | | |
| | | | | | | | | |
| | | | | | | | | |
| Net income | $ | 2,714 | | | $ | 3,222 | | | $ | 3,059 | | | $ | 8,889 | | | $ | 8,358 | |
| Other comprehensive income (loss), net of tax | | | | | | | | | |
| | | | | | | | | |
| | | | | | | | | |
Reclassification of loss from cash flow hedges, net of tax effect of $16, $16, $15, $48 and $45 | 48 | | | 47 | | | 44 | | | 141 | | | 130 | |
(Losses) gains on fair value hedges, net of tax effect of $(7), $13, $(5), $(55) and $(15) | (20) | | | 37 | | | (12) | | | (160) | | | (42) | |
Unrealized loss on foreign currency translation adjustment, net of tax effect of $0, $0, $0, $0 and $0 | — | | | (1) | | | — | | | (1) | | | — | |
| | | | | | | | | |
Amortization of actuarial gain, net of tax effect of $0, $(1), $(2), $(1) and $(5) | (1) | | | (2) | | | (4) | | | (4) | | | (13) | |
| | | | | | | | | |
| | | | | | | | | |
| Other comprehensive income (loss) | 27 | | | 81 | | | 28 | | | (24) | | | 75 | |
| | | | | | | | | |
| Total comprehensive income | $ | 2,741 | | | $ | 3,303 | | | $ | 3,087 | | | $ | 8,865 | | | $ | 8,433 | |
| Earnings per share | | | | | | | | | |
| | | | | | | | | |
| | | | | | | | | |
| | | | | | | | | |
| Basic | $ | 2.42 | | | $ | 2.84 | | | $ | 2.62 | | | $ | 7.84 | | | $ | 7.12 | |
| | | | | | | | | |
| | | | | | | | | |
| | | | | | | | | |
| Diluted | $ | 2.41 | | | $ | 2.84 | | | $ | 2.61 | | | $ | 7.82 | | | $ | 7.10 | |
| Weighted-average shares outstanding | | | | | | | | | |
| Basic | 1,123,754,096 | | | 1,132,760,465 | | | 1,166,961,755 | | | 1,133,743,367 | | | 1,174,069,336 | |
| Diluted | 1,126,627,708 | | | 1,134,846,966 | | | 1,170,649,561 | | | 1,136,920,521 | | | 1,177,637,145 | |
| | | | | | | | | |
| | | | | | | | | |
| | | | | | | | | |
| | | | | | | | | |
| | | | | | | | | |
| | | | | | | | | |
| | | | | | | | | |
| | | | | | | | | |
| | | | | | | | | |
| | | | | | | | | |
| | | | | | | | | |
| | | | | | | | | |
| | | | | | | | | |
| | | | | | | | | |
| | | | | | | | | |
| | | | | | | | | |
| | | | | | | | | |
| | | | | | | | | |
| | | | | | | | | |
| | | | | | | | | |
| | | | | | | | | |
| | | | | | | | | |
| | | | | | | | | |
| | | | | | | | | |
| | | | | | | | | |
| | | | | | | | | |
| | | | | | | | | |
| | | | | | | | | |
| | | | | | | | | |
| | | | | | | | | |
T-Mobile US, Inc.
Condensed Consolidated Statements of Cash Flows
(Unaudited)
| | | | | | | | | | | | | | | | | | | | | | | | | | | | | |
| Three Months Ended | | Nine Months Ended September 30, |
| (in millions) | September 30,
2025 | | June 30,
2025 | | September 30,
2024 | | 2025 | | 2024 |
| Operating activities | | | | | | | | | |
| Net income | $ | 2,714 | | | $ | 3,222 | | | $ | 3,059 | | | $ | 8,889 | | | $ | 8,358 | |
| Adjustments to reconcile net income to net cash provided by operating activities | | | | | | | | | |
| | | | | | | | | |
| Depreciation and amortization | 3,408 | | | 3,146 | | | 3,151 | | | 9,752 | | | 9,770 | |
| Stock-based compensation expense | 227 | | | 200 | | | 170 | | | 613 | | | 474 | |
| Deferred income tax expense | 797 | | | 937 | | | 817 | | | 2,505 | | | 2,279 | |
| Bad debt expense | 337 | | | 265 | | | 299 | | | 925 | | | 836 | |
| Losses from sales of receivables | 17 | | | 19 | | | 23 | | | 58 | | | 69 | |
| | | | | | | | | |
| | | | | | | | | |
| | | | | | | | | |
| | | | | | | | | |
| Impairment expense | 278 | | | — | | | — | | | 278 | | | — | |
| | | | | | | | | |
| Changes in operating assets and liabilities | | | | | | | | | |
| Accounts receivable | (366) | | | (338) | | | (734) | | | (797) | | | (2,436) | |
| Equipment installment plan receivables | 44 | | | 65 | | | (72) | | | 133 | | | 360 | |
| Inventory | (537) | | | 264 | | | (448) | | | (591) | | | (57) | |
| Operating lease right-of-use assets | 929 | | | 883 | | | 877 | | | 2,667 | | | 2,605 | |
| Other current and long-term assets | (322) | | | (671) | | | (19) | | | (983) | | | (275) | |
| Accounts payable and accrued liabilities | 890 | | | 107 | | | (165) | | | 729 | | | (1,861) | |
| Short- and long-term operating lease liabilities | (936) | | | (886) | | | (805) | | | (2,720) | | | (2,970) | |
| Other current and long-term liabilities | (239) | | | (82) | | | (125) | | | (409) | | | (657) | |
| Other, net | 216 | | | (139) | | | 111 | | | 247 | | | 249 | |
| | | | | | | | | |
| Net cash provided by operating activities | 7,457 | | | 6,992 | | | 6,139 | | | 21,296 | | | 16,744 | |
| Investing activities | | | | | | | | | |
| | | | | | | | | |
Purchases of property and equipment, including capitalized interest of $(13), $(10), $(9), $(33) and $(26) | (2,639) | | | (2,396) | | | (1,961) | | | (7,486) | | | (6,628) | |
| Purchases of spectrum licenses and other intangible assets, including deposits | (1,590) | | | (842) | | | (2,419) | | | (2,505) | | | (2,636) | |
| | | | | | | | | |
| Proceeds from the sale of property, equipment and intangible assets | 18 | | | 2,066 | | | 15 | | | 2,091 | | | 38 | |
| Proceeds related to beneficial interests in securitization transactions | — | | | — | | | 984 | | | — | | | 2,832 | |
| | | | | | | | | |
| Acquisition of companies, net of cash acquired | (2,797) | | | 1 | | | — | | | (3,523) | | | (390) | |
| | | | | | | | | |
| Investments in unconsolidated affiliates, net | (3,072) | | | (908) | | | — | | | (4,055) | | | — | |
| Other, net | (59) | | | 520 | | | 74 | | | 371 | | | 12 | |
| | | | | | | | | |
| Net cash used in investing activities | (10,139) | | | (1,559) | | | (3,307) | | | (15,107) | | | (6,772) | |
| Financing activities | | | | | | | | | |
| | | | | | | | | |
| Proceeds from issuance of long-term debt, net | 498 | | | (6) | | | 2,480 | | | 8,266 | | | 8,089 | |
| | | | | | | | | |
| | | | | | | | | |
| | | | | | | | | |
| Repayments of financing lease obligations | (318) | | | (331) | | | (347) | | | (964) | | | (1,025) | |
| | | | | | | | | |
| Repayments of long-term debt | (828) | | | (3,257) | | | (223) | | | (4,564) | | | (3,169) | |
| | | | | | | | | |
| | | | | | | | | |
| Repurchases of common stock | (2,479) | | | (2,555) | | | (560) | | | (7,528) | | | (6,541) | |
| Dividends on common stock | (987) | | | (996) | | | (758) | | | (2,986) | | | (2,286) | |
| | | | | | | | | |
| | | | | | | | | |
| Tax withholdings on share-based awards | (92) | | | (30) | | | (36) | | | (394) | | | (244) | |
| | | | | | | | | |
| | | | | | | | | |
| Other, net | (32) | | | (30) | | | (49) | | | (80) | | | (117) | |
| | | | | | | | | |
| Net cash (used in) provided by financing activities | (4,238) | | | (7,205) | | | 507 | | | (8,250) | | | (5,293) | |
| Effect of exchange rate changes on cash and cash equivalents, including restricted cash | — | | | 13 | | | — | | | 13 | | | — | |
| Change in cash and cash equivalents, including restricted cash | (6,920) | | | (1,759) | | | 3,339 | | | (2,048) | | | 4,679 | |
| Cash and cash equivalents, including restricted cash | | | | | | | | | |
| Beginning of period | 10,585 | | | 12,344 | | | 6,647 | | | 5,713 | | | 5,307 | |
| End of period | $ | 3,665 | | | $ | 10,585 | | | $ | 9,986 | | | $ | 3,665 | | | $ | 9,986 | |
| | | | | | | | | |
| | | | | | | | | |
| | | | | | | | | |
| | | | | | | | | |
| | | | | | | | | |
| | | | | | | | | |
| | | | | | | | | |
| | | | | | | | | |
| | | | | | | | | |
| | | | | | | | | |
| | | | | | | | | |
| | | | | | | | | |
| | | | | | | | | |
| | | | | | | | | |
| | | | | | | | | |
| | | | | | | | | |
| | | | | | | | | |
| | | | | | | | | |
| | | | | | | | | |
| | | | | | | | | |
| | | | | | | | | |
| | | | | | | | | |
| | | | | | | | | |
| | | | | | | | | |
| | | | | | | | | |
| | | | | | | | | |
| | | | | | | | | |
| | | | | | | | | |
T-Mobile US, Inc.
Condensed Consolidated Statements of Cash Flows (Continued)
(Unaudited)
| | | | | | | | | | | | | | | | | | | | | | | | | | | | | |
| Three Months Ended | | Nine Months Ended September 30, |
| (in millions) | September 30,
2025 | | June 30,
2025 | | September 30,
2024 | | 2025 | | 2024 |
| Supplemental disclosure of cash flow information | | | | | | | | | |
| Interest payments, net of amounts capitalized | $ | 997 | | | $ | 992 | | | $ | 947 | | | $ | 2,923 | | | $ | 2,778 | |
| Operating lease payments | 1,269 | | | 1,202 | | | 1,127 | | | 3,685 | | | 3,928 | |
| Income tax payments | 65 | | | 347 | | | 50 | | | 427 | | | 164 | |
| Non-cash investing and financing activities | | | | | | | | | |
| Non-cash beneficial interest obtained in exchange for securitized receivables | $ | — | | | $ | — | | | $ | 789 | | | $ | — | | | $ | 2,283 | |
| | | | | | | | | |
| Change in accounts payable and accrued liabilities for purchases of property and equipment | 136 | | | (131) | | | 41 | | | (458) | | | (1,085) | |
| | | | | | | | | |
| | | | | | | | | |
| | | | | | | | | |
| | | | | | | | | |
| Operating lease right-of-use assets obtained in exchange for lease obligations | 1,064 | | | 593 | | | 469 | | | 2,138 | | | 1,300 | |
| Financing lease right-of-use assets obtained in exchange for lease obligations | 324 | | | 430 | | | 409 | | | 1,002 | | | 983 | |
| Deferred consideration related to the Ka’ena Acquisition | — | | | — | | | — | | | — | | | 210 | |
| Debt assumed in the UScellular Acquisition | 1,653 | | | — | | | — | | | 1,653 | | | — | |
T-Mobile US, Inc.
Supplementary Operating and Financial Data
(Unaudited)
| | | | | | | | | | | | | | | | | | | | | | | | | | | | | | | | | | | | | | | | | | | | | | | | | | | | | | | |
| | | Quarter | | Nine Months Ended September 30, |
| (in thousands) | | | Q1 2024 | | Q2 2024 | | Q3 2024 | | Q4 2024 | | Q1 2025 | | Q2 2025 | | Q3 2025 | | 2024 | | 2025 |
| Customers, end of period | | | | | | | | | | | | | | | | | | | |
| | | | | | | | | | | | | | | | | | | |
Postpaid phone customers (1) | | | 76,468 | | | 77,245 | | | 78,110 | | | 79,013 | | | 79,508 | | | 80,338 | | | 84,632 | | | 78,110 | | | 84,632 | |
Postpaid other customers (1) (2) (3) | | | 22,804 | | | 23,365 | | | 24,075 | | | 25,105 | | | 25,947 | | | 26,946 | | | 29,431 | | | 24,075 | | | 29,431 | |
| | | | | | | | | | | | | | | | | | | |
| Total postpaid customers | | | 99,272 | | | 100,610 | | | 102,185 | | | 104,118 | | | 105,455 | | | 107,284 | | | 114,063 | | | 102,185 | | | 114,063 | |
| | | | | | | | | | | | | | | | | | | |
Prepaid customers (1) (4) | | | 21,600 | | | 25,283 | | | 25,307 | | | 25,410 | | | 25,455 | | | 25,494 | | | 25,886 | | | 25,307 | | | 25,886 | |
| | | | | | | | | | | | | | | | | | | |
| Total customers | | | 120,872 | | | 125,893 | | | 127,492 | | | 129,528 | | | 130,910 | | | 132,778 | | | 139,949 | | | 127,492 | | | 139,949 | |
| | | | | | | | | | | | | | | | | | | |
| | | | | | | | | | | | | | | | | | | |
| | | | | | | | | | | | | | | | | | | |
| | | | | | | | | | | | | | | | | | | |
| | | | | | | | | | | | | | | | | | | |
Adjustments to customers (1) (2) (3) (4) | | | — | | | 3,504 | | | — | | | — | | | — | | | 97 | | | 4,781 | | | 3,504 | | | 4,878 | |
| | | | | | | | | | | | | | | | | | | |
| | | | | | | | | | | | | | | | | | | |
| | | | | | | | | | | | | | | | | | | |
| | | | | | | | | | | | | | | | | | | |
| | | | | | | | | | | | | | | | | | | |
| | | | | | | | | | | | | | | | | | | |
| | | | | | | | | | | | | | | | | | | |
| | | | | | | | | | | | | | | | | | | |
| | | | | | | | | | | | | | | | | | | |
| | | | | | | | | | | | | | | | | | | |
| | | | | | | | | | | | | | | | | | | |
| | | | | | | | | | | | | | | | | | | |
| | | | | | | | | | | | | | | | | | | |
| | | | | | | | | | | | | | | | | | | |
| | | | | | | | | | | | | | | | | | | |
| | | | | | | | | | | | | | | | | | | |
| | | | | | | | | | | | | | | | | | | |
| | | | | | | | | | | | | | | | | | | |
| | | | | | | | | | | | | | | | | | | |
| | | | | | | | | | | | | | | | | | | |
| | | | | | | | | | | | | | | | | | | |
| | | | | | | | | | | | | | | | | | | |
| | | | | | | | | | | | | | | | | | | |
| | | | | | | | | | | | | | | | | | | |
| | | | | | | | | | | | | | | | | | | |
| | | | | | | | | | | | | | | | | | | |
| | | | | | | | | | | | | | | | | | | |
| | | | | | | | | | | | | | | | | | | |
| | | | | | | | | | | | | | | | | | | |
| | | | | | | | | | | | | | | | | | | |
| | | | | | | | | | | | | | | | | | | |
| | | | | | | | | | | | | | | | | | | |
(1)In the third quarter of 2025, we acquired 3,287,000 postpaid phone customers, 390,000 postpaid other customers and 349,000 prepaid customers through the UScellular acquisition, which includes the impact of certain base adjustments to align the policies of UScellular and T-Mobile.
(2)In the third quarter of 2025, we acquired 755,000 fiber customers from Metronet and other acquisitions.
(3)In the second quarter of 2025, we acquired 97,000 fiber customers from Lumos.
(4)In the second quarter of 2024, we acquired 3,504,000 prepaid customers through the Ka’ena acquisition, which includes the impact of certain base adjustments to align the policies of Ka’ena and T-Mobile.
| | | | | | | | | | | | | | | | | | | | | | | | | | | | | | | | | | | | | | | | | | | | | | | | | | | | | | | |
| | | Quarter | | Nine Months Ended September 30, |
| (in thousands) | | | Q1 2024 | | Q2 2024 | | Q3 2024 | | Q4 2024 | | Q1 2025 | | Q2 2025 | | Q3 2025 | | 2024 | | 2025 |
| Net customer additions (losses) | | | | | | | | | | | | | | | | | | | |
| | | | | | | | | | | | | | | | | | | |
| Postpaid phone customers | | | 532 | | | 777 | | | 865 | | | 903 | | | 495 | | | 830 | | | 1,007 | | | 2,174 | | | 2,332 | |
| Postpaid other customers | | | 688 | | | 561 | | | 710 | | | 1,030 | | | 842 | | | 902 | | | 1,340 | | | 1,959 | | | 3,084 | |
| | | | | | | | | | | | | | | | | | | |
| Total postpaid customers | | | 1,220 | | | 1,338 | | | 1,575 | | | 1,933 | | | 1,337 | | | 1,732 | | | 2,347 | | | 4,133 | | | 5,416 | |
| | | | | | | | | | | | | | | | | | | |
| Prepaid customers | | | (48) | | | 179 | | | 24 | | | 103 | | | 45 | | | 39 | | | 43 | | | 155 | | | 127 | |
| | | | | | | | | | | | | | | | | | | |
| Total net customer additions | | | 1,172 | | | 1,517 | | | 1,599 | | | 2,036 | | | 1,382 | | | 1,771 | | | 2,390 | | | 4,288 | | | 5,543 | |
| | | | | | | | | | | | | | | | | | | |
| Migrations from prepaid to postpaid plans | | | 145 | | | 140 | | | 175 | | | 160 | | | 115 | | | 205 | | | 215 | | | 460 | | | 535 | |
| | | | | | | | | | | | | | | | | | | |
| | | | | | | | | | | | | | | | | | | |
| | | | | | | | | | | | | | | | | | | |
| | | | | | | | | | | | | | | | | | | |
| | | | | | | | | | | | | | | | | | | |
| | | | | | | | | | | | | | | | | | | |
| | | | | | | | | | | | | | | | | | | |
| | | | | | | | | | | | | | | | | | | |
| | | | | | | | | | | | | | | | | | | |
| | | | | | | | | | | | | | | | | | | |
| | | | | | | | | | | | | | | | | | | |
| | | | | | | | | | | | | | | | | | | |
| | | | | | | | | | | | | | | | | | | |
| | | | | | | | | | | | | | | | | | | |
| | | | | | | | | | | | | | | | | | | |
| | | | | | | | | | | | | | | | | | | |
| | | | | | | | | | | | | | | | | | | |
| | | | | | | | | | | | | | | | | | | |
| | | | | | | | | | | | | | | | | | | |
| | | | | | | | | | | | | | | | | | | |
| | | | | | | | | | | | | | | | | | | |
| | | | | | | | | | | | | | | | | | | |
| | | | | | | | | | | | | | | | | | | |
| | | | | | | | | | | | | | | | | | | |
| | | | | | | | | | | | | | | | | | | |
| | | | | | | | | | | | | | | | | | | |
| | | | | | | | | | | | | | | | | | | |
| | | | | | | | | | | | | | | | | | | |
| | | | | | | | | | | | | | | | | | | |
| | | | | | | | | | | | | | | | | | | |
| | | | | | | | | | | | | | | | | | | |
| | | | | | | | | | | | | | | | | | | |
| | | | | | | | | | | | | | | | | | | |
| | | | | | | | | | | | | | | | | | | |
| | | | | | | | | | | | | | | | | | | |
| | | | | | | | | | | | | | | | | | | |
| | | | | | | | | | | | | | | | | | | |
| | | | | | | | | | | | | | | | | | | |
| | | | | | | | | | | | | | | | | | | |
| | | | | | | | | | | | | | | | | | | |
| | | | | | | | | | | | | | | | | | | |
| | | | | | | | | | | | | | | | | | | |
| | | | | | | | | | | | | | | | | | | |
| | | | | | | | | | | | | | | | | | | | | | | | | | | | | | | | | | | | | | | | | | | | | | | | | | | | | | | |
| | | Quarter | | Nine Months Ended September 30, |
| | | Q1 2024 | | Q2 2024 | | Q3 2024 | | Q4 2024 | | Q1 2025 | | Q2 2025 | | Q3 2025 | | 2024 | | 2025 |
| Churn | | | | | | | | | | | | | | | | | | | |
| Postpaid phone churn | | | 0.86 | % | | 0.80 | % | | 0.86 | % | | 0.92 | % | | 0.91 | % | | 0.90 | % | | 0.89 | % | | 0.84 | % | | 0.90 | % |
| Prepaid churn | | | 2.75 | % | | 2.54 | % | | 2.78 | % | | 2.85 | % | | 2.68 | % | | 2.65 | % | | 2.77 | % | | 2.69 | % | | 2.70 | % |
| | | | | | | | | | | | | | | | | | | | | | | | | | | | | | | | | | | | | | | | | | | | | | | | | | | | | | | |
| | | Quarter | | Nine Months Ended September 30, |
| | | Q1 2024 | | Q2 2024 | | Q3 2024 | | Q4 2024 | | Q1 2025 | | Q2 2025 | | Q3 2025 | | 2024 | | 2025 |
| Postpaid upgrade rate | | | | | | | | | | | | | | | | | | | |
| Postpaid device upgrade rate | | | 2.4 | % | | 2.3 | % | | 2.6 | % | | 3.6 | % | | 2.8 | % | | 2.5 | % | | 2.7 | % | | 7.5 | % | | 8.0 | % |
T-Mobile US, Inc.
Supplementary Operating and Financial Data
(Unaudited)
| | | | | | | | | | | | | | | | | | | | | | | | | | | | | | | | | | | | | | | | | | | | | | | | | | | | | | | |
| | | Quarter | | Nine Months Ended September 30, |
| (in thousands) | | | Q1 2024 | | Q2 2024 | | Q3 2024 | | Q4 2024 | | Q1 2025 | | Q2 2025 | | Q3 2025 | | 2024 | | 2025 |
| Accounts, end of period | | | | | | | | | | | | | | | | | | | |
Total postpaid accounts (1) (2) (3) | | | 30,015 | | 30,316 | | 30,631 | | 30,894 | | 31,099 | | 31,502 | | 33,979 | | 30,631 | | 33,979 |
| | | | | | | | | | | | | | | | | | | |
| | | | | | | | | | | | | | | | | | | |
(1)In the second quarter of 2025, we acquired 85,000 postpaid accounts from Lumos.
(2)In the third quarter of 2025, we acquired 633,000 postpaid accounts from Metronet and other acquisitions.
(3)In the third quarter of 2025, we acquired 1,448,000 postpaid accounts through the UScellular acquisition, which includes the impact of certain base adjustments to align the policies of UScellular and T-Mobile.
| | | | | | | | | | | | | | | | | | | | | | | | | | | | | | | | | | | | | | | | | | | | | | | | | | | | | | | |
| | | Quarter | | Nine Months Ended September 30, |
| (in thousands) | | | Q1 2024 | | Q2 2024 | | Q3 2024 | | Q4 2024 | | Q1 2025 | | Q2 2025 | | Q3 2025 | | 2024 | | 2025 |
| Net account additions | | | | | | | | | | | | | | | | | | | |
| Postpaid net account additions | | | 218 | | 301 | | 315 | | 263 | | 205 | | 318 | | 396 | | 834 | | 919 |
| | | | | | | | | | | | | | | | | | | |
| | | | | | | | | | | | | | | | | | | |
| | | | | | | | | | | | | | | | | | | | | | | | | | | | | | | | | | | | | | | | | | | | | | | | | | | | | | | |
| | | Quarter | | Nine Months Ended September 30, |
| (in thousands) | | | Q1 2024 | | Q2 2024 | | Q3 2024 | | Q4 2024 | | Q1 2025 | | Q2 2025 | | Q3 2025 | | 2024 | | 2025 |
| Broadband customers, end of period | | | | | | | | | | | | | | | | | | | |
Postpaid 5G broadband customers (1) | | | 4,634 | | 4,992 | | 5,377 | | 5,742 | | 6,129 | | 6,556 | | 7,163 | | 5,377 | | 7,163 |
| Prepaid 5G broadband customers | | | 547 | | 595 | | 625 | | 688 | | 725 | | 752 | | 792 | | 625 | | 792 |
| Total 5G broadband customers, end of period | | | 5,181 | | 5,587 | | 6,002 | | 6,430 | | 6,854 | | 7,308 | | 7,955 | | 6,002 | | 7,955 |
Fiber customers (2) (3) | | | 1 | | 2 | | 5 | | 9 | | 12 | | 125 | | 934 | | 5 | | 934 |
| Total broadband customers, end of period | | | 5,182 | | 5,589 | | 6,007 | | 6,439 | | 6,866 | | 7,433 | | 8,889 | | 6,007 | | 8,889 |
Adjustments to customers (1) (2) (3) | | | — | | — | | — | | — | | — | | 97 | | 896 | | — | | 993 |
| | | | | | | | | | | | | | | | | | | |
| | | | | | | | | | | | | | | | | | | |
(1)In the third quarter of 2025, we acquired 141,000 postpaid 5G broadband customers through the UScellular acquisition, which includes the impact of certain base adjustments to align the policies of UScellular and T-Mobile.
(2)In the third quarter of 2025, we acquired 755,000 fiber customers from Metronet and other acquisitions.
(3)In the second quarter of 2025, we acquired 97,000 fiber customers from Lumos.
| | | | | | | | | | | | | | | | | | | | | | | | | | | | | | | | | | | | | | | | | | | | | | | | | | | | | | | |
| | | Quarter | | Nine Months Ended September 30, |
| (in thousands) | | | Q1 2024 | | Q2 2024 | | Q3 2024 | | Q4 2024 | | Q1 2025 | | Q2 2025 | | Q3 2025 | | 2024 | | 2025 |
| Broadband - net customer additions | | | | | | | | | | | | | | | | | | | |
| Postpaid 5G broadband customers | | | 346 | | 358 | | 385 | | 365 | | 387 | | 427 | | 466 | | 1,089 | | 1,280 |
| Prepaid 5G broadband customers | | | 59 | | 48 | | 30 | | 63 | | 37 | | 27 | | 40 | | 137 | | 104 |
| Total 5G broadband net customer additions | | | 405 | | 406 | | 415 | | 428 | | 424 | | 454 | | 506 | | 1,226 | | 1,384 |
| Fiber customers | | | — | | 1 | | 3 | | 4 | | 3 | | 16 | | 54 | | 4 | | 73 |
| Total broadband net customer additions | | | 405 | | 407 | | 418 | | 432 | | 427 | | 470 | | 560 | | 1,230 | | 1,457 |
| | | | | | | | | | | | | | | | | | | |
| | | | | | | | | | | | | | | | | | | |
| | | | | | | | | | | | | | | | | | | | | | | | | | | | | | | | | | | | | | | | | | | | | | | | | | | | | | | |
| | | Quarter | | Nine Months Ended September 30, |
| (in millions) | | | Q1 2024 | | Q2 2024 | | Q3 2024 | | Q4 2024 | | Q1 2025 | | Q2 2025 | | Q3 2025 | | 2024 | | 2025 |
| Device financing - equipment installment plans | | | | | | | | | | | | | | | | | | | |
| Gross EIP financed | | | $ | 3,218 | | | $ | 3,037 | | | $ | 3,304 | | | $ | 4,689 | | | $ | 3,565 | | | $ | 3,503 | | | $ | 3,871 | | | $ | 9,559 | | | $ | 10,939 | |
| EIP billings | | | 3,880 | | | 3,604 | | | 3,423 | | | 3,509 | | | 3,551 | | | 3,553 | | | 3,766 | | | 10,907 | | | 10,870 | |
| EIP receivables, net | | | 5,967 | | | 5,556 | | | 5,347 | | | 6,588 | | | 6,405 | | | 6,201 | | | 6,915 | | | 5,347 | | | 6,915 | |
| | | | | | | | | | | | | | | | | | | |
| | | | | | | | | | | | | | | | | | | |
| | | | | | | | | | | | | | | | | | | |
| Device financing - leased devices | | | | | | | | | | | | | | | | | | | |
| Lease revenues | | | $ | 35 | | | $ | 26 | | | $ | 21 | | | $ | 11 | | | $ | 1 | | | $ | 6 | | | $ | 4 | | | $ | 82 | | | $ | 11 | |
| Leased device depreciation | | | 22 | | | 15 | | | 11 | | | 6 | | | 4 | | | 1 | | | — | | | 48 | | | 5 | |
| | | | | | | | | | | | | | | | | | | |
| | | | | | | | | | | | | | | | | | | |
| | | | | | | | | | | | | | | | | | | |
| | | | | | | | | | | | | | | | | | | |
| | | | | | | | | | | | | | | | | | | | | | | | | | | | | | | | | | | | | | | | | | | | | | | | | | | | | | | |
| | | Quarter | | Nine Months Ended September 30, |
| (in dollars) | | | Q1 2024 | | Q2 2024 | | Q3 2024 | | Q4 2024 | | Q1 2025 | | Q2 2025 | | Q3 2025 | | 2024 | | 2025 |
| Operating measures | | | | | | | | | | | | | | | | | | | |
| Postpaid ARPA | | | $ | 140.88 | | | $ | 142.54 | | | $ | 145.60 | | | $ | 146.28 | | | $ | 146.22 | | | $ | 149.87 | | | $ | 149.44 | | | $ | 143.02 | | | $ | 148.54 | |
| Postpaid phone ARPU | | | 48.79 | | 49.07 | | 49.79 | | 49.73 | | 49.38 | | 50.62 | | 50.71 | | 49.22 | | 50.25 |
| Prepaid ARPU | | | 37.18 | | 35.94 | | 35.81 | | 35.49 | | 34.67 | | 34.63 | | 33.93 | | 36.27 | | 34.41 |
| | | | | | | | | | | | | | | | | | | |
| | | | | | | | | | | | | | | | | | | |
T-Mobile US, Inc.
Supplementary Operating and Financial Data (continued)
(Unaudited)
| | | | | | | | | | | | | | | | | | | | | | | | | | | | | | | | | | | | | | | | | | | | | | | | | | | | | | | |
| | | Quarter | | Nine Months Ended September 30, |
| (in millions, except percentages) | | | Q1 2024 | | Q2 2024 | | Q3 2024 | | Q4 2024 | | Q1 2025 | | Q2 2025 | | Q3 2025 | | 2024 | | 2025 |
| Financial measures | | | | | | | | | | | | | | | | | | | |
| | | | | | | | | | | | | | | | | | | |
| Service revenues | | | $ | 16,096 | | | $ | 16,429 | | | $ | 16,725 | | | $ | 16,928 | | | $ | 16,925 | | | $ | 17,438 | | | $ | 18,241 | | | $ | 49,250 | | | $ | 52,604 | |
| | | | | | | | | | | | | | | | | | | |
| Equipment revenues | | | $ | 3,251 | | | $ | 3,106 | | | $ | 3,207 | | | $ | 4,699 | | | $ | 3,704 | | | $ | 3,439 | | | $ | 3,465 | | | $ | 9,564 | | | $ | 10,608 | |
| Lease revenues | | | 35 | | | 26 | | | 21 | | | 11 | | | 1 | | | 6 | | | 4 | | | 82 | | | 11 | |
| Equipment sales | | | $ | 3,216 | | | $ | 3,080 | | | $ | 3,186 | | | $ | 4,688 | | | $ | 3,703 | | | $ | 3,433 | | | $ | 3,461 | | | $ | 9,482 | | | $ | 10,597 | |
| | | | | | | | | | | | | | | | | | | |
| Total revenues | | | $ | 19,594 | | | $ | 19,772 | | | $ | 20,162 | | | $ | 21,872 | | | $ | 20,886 | | | $ | 21,132 | | | $ | 21,957 | | | $ | 59,528 | | | $ | 63,975 | |
| | | | | | | | | | | | | | | | | | | |
| Net income | | | $ | 2,374 | | | $ | 2,925 | | | $ | 3,059 | | | $ | 2,981 | | | $ | 2,953 | | | $ | 3,222 | | | $ | 2,714 | | | $ | 8,358 | | | $ | 8,889 | |
| Net income margin | | | 14.7 | % | | 17.8 | % | | 18.3 | % | | 17.6 | % | | 17.4 | % | | 18.5 | % | | 14.9 | % | | 17.0 | % | | 16.9 | % |
| | | | | | | | | | | | | | | | | | | |
| Adjusted EBITDA | | | $ | 7,652 | | | $ | 8,053 | | | $ | 8,243 | | | $ | 7,916 | | | $ | 8,259 | | | $ | 8,547 | | | $ | 8,684 | | | $ | 23,948 | | | $ | 25,490 | |
| Adjusted EBITDA margin | | | 47.5 | % | | 49.0 | % | | 49.3 | % | | 46.8 | % | | 48.8 | % | | 49.0 | % | | 47.6 | % | | 48.6 | % | | 48.5 | % |
| Core Adjusted EBITDA | | | $ | 7,617 | | | $ | 8,027 | | | $ | 8,222 | | | $ | 7,905 | | | $ | 8,258 | | | $ | 8,541 | | | $ | 8,680 | | | $ | 23,866 | | | $ | 25,479 | |
| Core Adjusted EBITDA margin | | | 47.3 | % | | 48.9 | % | | 49.2 | % | | 46.7 | % | | 48.8 | % | | 49.0 | % | | 47.6 | % | | 48.5 | % | | 48.4 | % |
| | | | | | | | | | | | | | | | | | | |
| Cost of services, exclusive of depreciation and amortization | | | $ | 2,688 | | | $ | 2,664 | | | $ | 2,722 | | | $ | 2,697 | | | $ | 2,602 | | | $ | 2,717 | | | $ | 2,873 | | | $ | 8,074 | | | $ | 8,192 | |
| | | | | | | | | | | | | | | | | | | |
| | | | | | | | | | | | | | | | | | | |
| Merger-related costs | | | 107 | | | 73 | | | — | | | — | | | — | | | — | | | 7 | | | 180 | | | 7 | |
| Other Special Items | | | 1 | | | — | | | 67 | | | 75 | | | 20 | | | 28 | | | 55 | | | 68 | | | 103 | |
| | | | | | | | | | | | | | | | | | | |
| Cost of services, excluding depreciation and amortization and Special Items | | | $ | 2,580 | | | $ | 2,591 | | | $ | 2,655 | | | $ | 2,622 | | | $ | 2,582 | | | $ | 2,689 | | | $ | 2,811 | | | $ | 7,826 | | | $ | 8,082 | |
| | | | | | | | | | | | | | | | | | | |
| Cost of equipment sales, exclusive of depreciation and amortization | | | $ | 4,399 | | | $ | 4,088 | | | $ | 4,307 | | | $ | 6,088 | | | $ | 4,798 | | | $ | 4,659 | | | $ | 4,853 | | | $ | 12,794 | | | $ | 14,310 | |
| | | | | | | | | | | | | | | | | | | |
| | | | | | | | | | | | | | | | | | | |
| | | | | | | | | | | | | | | | | | | |
| Merger-related costs | | | — | | | — | | | — | | | — | | | — | | | — | | | 2 | | | — | | | 2 | |
| Cost of equipment sales, exclusive of depreciation and amortization and Special Items | | | $ | 4,399 | | | $ | 4,088 | | | $ | 4,307 | | | $ | 6,088 | | | $ | 4,798 | | | $ | 4,659 | | | $ | 4,851 | | | $ | 12,794 | | | $ | 14,308 | |
| | | | | | | | | | | | | | | | | | | |
| Selling, general and administrative | | | $ | 5,138 | | | $ | 5,142 | | | $ | 5,186 | | | $ | 5,352 | | | $ | 5,488 | | | $ | 5,397 | | | $ | 6,015 | | | $ | 15,466 | | | $ | 16,900 | |
| | | | | | | | | | | | | | | | | | | |
| | | | | | | | | | | | | | | | | | | |
| Merger-related costs (gain), net | | | 23 | | | (82) | | | 16 | | | 10 | | | 14 | | | 33 | | | 64 | | | (43) | | | 111 | |
| Other Special Items | | | 12 | | | 37 | | | 70 | | | (60) | | | 59 | | | (51) | | | 123 | | | 119 | | | 131 | |
| | | | | | | | | | | | | | | | | | | |
| Selling, general and administrative, excluding Special Items | | | $ | 5,103 | | | $ | 5,187 | | | $ | 5,100 | | | $ | 5,402 | | | $ | 5,415 | | | $ | 5,415 | | | $ | 5,828 | | | $ | 15,390 | | | $ | 16,658 | |
| | | | | | | | | | | | | | | | | | | | |
| Total bad debt expense and losses from sales of receivables | | | $ | 303 | | | $ | 280 | | | $ | 322 | | | $ | 349 | | | $ | 345 | | | $ | 284 | | | $ | 354 | | | $ | 905 | | | $ | 983 | |
| Bad debt and losses from sales of receivables as a percentage of Total revenues | | | 1.5 | % | | 1.4 | % | | 1.6 | % | | 1.6 | % | | 1.7 | % | | 1.3 | % | | 1.6 | % | | 1.5 | % | | 1.5 | % |
| | | | | | | | | | | | | | | | | | | |
| Cash purchases of property and equipment including capitalized interest | | | $ | 2,627 | | | $ | 2,040 | | | $ | 1,961 | | | $ | 2,212 | | | $ | 2,451 | | | $ | 2,396 | | | $ | 2,639 | | | $ | 6,628 | | | $ | 7,486 | |
| Capitalized interest | | | 9 | | | 8 | | | 9 | | | 8 | | | 10 | | | 10 | | | 13 | | | 26 | | | 33 | |
| | | | | | | | | | | | | | | | | | | |
| Net cash proceeds from securitization | | | $ | (29) | | | $ | (30) | | | $ | (29) | | | $ | (27) | | | $ | (26) | | | $ | (23) | | | $ | (25) | | | $ | (88) | | | $ | (74) | |
| | | | | | | | | | | | | | | | | | | |
| Net cash payments for Merger-related costs | | | $ | 293 | | | $ | 241 | | | $ | 132 | | | $ | 123 | | | $ | 70 | | | $ | 92 | | | $ | 96 | | | $ | 666 | | | $ | 258 | |
| | | | | | | | | | | | | | | | | | | |
| | | | | | | | | | | | | | | | | | | |
| | | | | | | | | | | | | | | | | | | |
| | | | | | | | | | | | | | | | | | | |
| | | | | | | | | | | | | | | | | | | |
| | | | | | | | | | | | | | | | | | | |
| | | | | | | | | | | | | | | | | | | |
| | | | | | | | | | | | | | | | | | | |
| | | | | | | | | | | | | | | | | | | |
| | | | | | | | | | | | | | | | | | | |
| | | | | | | | | | | | | | | | | | | |
| | | | | | | | | | | | | | | | | | | |
| | | | | | | | | | | | | | | | | | | |
| | | | | | | | | | | | | | | | | | | |
| | | | | | | | | | | | | | | | | | | |
| | | | | | | | | | | | | | | | | | | |
| | | | | | | | | | | | | | | | | | | |
| | | | | | | | | | | | | | | | | | | |
| | | | | | | | | | | | | | | | | | | |
| | | | | | | | | | | | | | | | | | | |
| | | | | | | | | | | | | | | | | | | |
| | | | | | | | | | | | | | | | | | | |
| | | | | | | | | | | | | | | | | | | |
| | | | | | | | | | | | | | | | | | | |
| | | | | | | | | | | | | | | | | | | |
| | | | | | | | | | | | | | | | | | | |
| | | | | | | | | | | | | | | | | | | |
| | | | | | | | | | | | | | | | | | | |
T-Mobile US, Inc.
Supplementary Operating and Financial Data
(Unaudited)
| | | | | | | | | | | | | | | | | | | | | | | | | | | | | | | | | | | | | | | | | | | | | | | | | | | | | | | |
| | | Quarter | | Nine Months Ended September 30, |
| (in millions, except share and per share amounts) | | | Q1 2024 | | Q2 2024 | | Q3 2024 | | Q4 2024 | | Q1 2025 | | Q2 2025 | | Q3 2025 | | 2024 | | 2025 |
| Stockholder returns | | | | | | | | | | | | | | | | | | | |
| Total repurchases | | | $ | 3,568 | | | $ | 2,277 | | | $ | 644 | | | $ | 4,619 | | | $ | 2,470 | | | $ | 2,469 | | | $ | 2,470 | | | $ | 6,489 | | | $ | 7,409 | |
| Total shares repurchased | | | 21,933,790 | | | 13,979,843 | | | 3,179,707 | | | 20,283,582 | | | 10,091,227 | | | 10,148,791 | | | 10,204,072 | | | 39,093,340 | | | 30,444,090 | |
| Average purchase price per share | | | $ | 162.69 | | | $ | 162.85 | | | $ | 202.45 | | | $ | 227.72 | | | $ | 244.77 | | | $ | 243.32 | | | $ | 242.01 | | | $ | 165.98 | | | $ | 243.36 | |
| Total dividends paid | | | $ | 769 | | | $ | 759 | | | $ | 758 | | | $ | 1,014 | | | $ | 1,003 | | | $ | 996 | | | $ | 987 | | | $ | 2,286 | | | $ | 2,986 | |
| Dividends per share | | | $ | 0.65 | | | $ | 0.65 | | | $ | 0.65 | | | $ | 0.88 | | | $ | 0.88 | | | $ | 0.88 | | | $ | 0.88 | | | $ | 1.95 | | | $ | 2.64 | |
| Total stockholder returns | | | $ | 4,337 | | | $ | 3,036 | | | $ | 1,402 | | | $ | 5,633 | | | $ | 3,473 | | | $ | 3,465 | | | $ | 3,457 | | | $ | 8,775 | | | $ | 10,395 | |
| Cumulative total repurchases | | | $ | 19,775 | | | $ | 22,052 | | | $ | 22,696 | | | $ | 27,315 | | | $ | 29,785 | | | $ | 32,254 | | | $ | 34,724 | | | $ | 22,696 | | | $ | 34,724 | |
| Cumulative shares repurchased | | | 136,220,243 | | | 150,200,086 | | | 153,379,793 | | | 173,663,375 | | | 183,754,602 | | | 193,903,393 | | | 204,107,465 | | | 153,379,793 | | | 204,107,465 | |
| Cumulative stockholder returns | | | $ | 21,291 | | | $ | 24,327 | | | $ | 25,729 | | | $ | 31,362 | | | $ | 34,835 | | | $ | 38,300 | | | $ | 41,757 | | | $ | 25,729 | | | $ | 41,757 | |
| | | | | | | | | | | | | | | | | | | |
| | | | | | | | | | | | | | | | | | | |
T-Mobile US, Inc.
Reconciliation of Non-GAAP Financial Measures to GAAP Financial Measures
(Unaudited)
This Investor Factbook includes non-GAAP financial measures. The non-GAAP financial measures should be considered in addition to, but not as a substitute for, the information provided in accordance with GAAP. Reconciliations for the non-GAAP financial measures to the most directly comparable GAAP financial measures are provided below. T-Mobile is not able to forecast Net income on a forward-looking basis without unreasonable efforts due to the high variability and difficulty in predicting certain items that affect GAAP net income, including, but not limited to, Income tax expense and Interest expense. Adjusted EBITDA and Core Adjusted EBITDA should not be used to predict Net income, as the difference between either of these measures and Net income is variable.
Adjusted EBITDA and Core Adjusted EBITDA are reconciled to Net income as follows:
| | | | | | | | | | | | | | | | | | | | | | | | | | | | | | | | | | | | | | | | | | | | | | | | | | | | | | | |
| | | Quarter | | Nine Months Ended September 30, |
| (in millions, except percentages) | | | Q1 2024 | | Q2 2024 | | Q3 2024 | | Q4 2024 | | Q1 2025 | | Q2 2025 | | Q3 2025 | | 2024 | | 2025 |
| Net income | | | $ | 2,374 | | | $ | 2,925 | | | $ | 3,059 | | | $ | 2,981 | | | $ | 2,953 | | | $ | 3,222 | | | $ | 2,714 | | | $ | 8,358 | | | $ | 8,889 | |
| Adjustments: | | | | | | | | | | | | | | | | | | | |
| | | | | | | | | | | | | | | | | | | |
| | | | | | | | | | | | | | | | | | | |
| Interest expense, net | | | 880 | | | 854 | | | 836 | | | 841 | | | 916 | | | 922 | | | 924 | | | 2,570 | | | 2,762 | |
| | | | | | | | | | | | | | | | | | | |
| | | | | | | | | | | | | | | | | | | |
| Other (income) expense, net | | | (20) | | | 8 | | | (7) | | | (94) | | | 46 | | | 11 | | | 78 | | | (19) | | | 135 | |
| Income tax expense | | | 764 | | | 843 | | | 908 | | | 858 | | | 885 | | | 1,058 | | | 814 | | | 2,515 | | | 2,757 | |
| | | | | | | | | | | | | | | | | | | |
| Operating income | | | 3,998 | | | 4,630 | | | 4,796 | | | 4,586 | | | 4,800 | | | 5,213 | | | 4,530 | | | 13,424 | | | 14,543 | |
| Depreciation and amortization | | | 3,371 | | | 3,248 | | | 3,151 | | | 3,149 | | | 3,198 | | | 3,146 | | | 3,408 | | | 9,770 | | | 9,752 | |
| | | | | | | | | | | | | | | | | | | |
Stock-based compensation (1) | | | 140 | | | 147 | | | 143 | | | 156 | | | 168 | | | 178 | | | 217 | | | 430 | | | 563 | |
| | | | | | | | | | | | | | | | | | | |
| | | | | | | | | | | | | | | | | | | |
| | | | | | | | | | | | | | | | | | | |
Merger-related costs (gain), net (2) | | | 130 | | | (9) | | | 16 | | | 10 | | | 14 | | | 33 | | | 73 | | | 137 | | | 120 | |
Legal-related expenses (recoveries), net (3) | | | — | | | 15 | | | 1 | | | (105) | | | 6 | | | (4) | | | 8 | | | 16 | | | 10 | |
| Impairment expense | | | — | | | — | | | — | | | — | | | — | | | — | | | 278 | | | — | | | 278 | |
| | | | | | | | | | | | | | | | | | | |
Other, net (4) | | | 13 | | | 22 | | | 136 | | | 120 | | | 73 | | | (19) | | | 170 | | | 171 | | | 224 | |
| | | | | | | | | | | | | | | | | | | |
| | | | | | | | | | | | | | | | | | | |
| Adjusted EBITDA | | | 7,652 | | | 8,053 | | | 8,243 | | | 7,916 | | | 8,259 | | | 8,547 | | | 8,684 | | | 23,948 | | | 25,490 | |
| Lease revenues | | | (35) | | | (26) | | | (21) | | | (11) | | | (1) | | | (6) | | | (4) | | | (82) | | | (11) | |
| Core Adjusted EBITDA | | | $ | 7,617 | | | $ | 8,027 | | | $ | 8,222 | | | $ | 7,905 | | | $ | 8,258 | | | $ | 8,541 | | | $ | 8,680 | | | $ | 23,866 | | | $ | 25,479 | |
| Net income margin (Net income divided by Service revenues) | | | 14.7 | % | | 17.8 | % | | 18.3 | % | | 17.6 | % | | 17.4 | % | | 18.5 | % | | 14.9 | % | | 17.0 | % | | 16.9 | % |
| Adjusted EBITDA margin (Adjusted EBITDA divided by Service revenues) | | | 47.5 | % | | 49.0 | % | | 49.3 | % | | 46.8 | % | | 48.8 | % | | 49.0 | % | | 47.6 | % | | 48.6 | % | | 48.5 | % |
| Core Adjusted EBITDA margin (Core Adjusted EBITDA divided by Service revenues) | | | 47.3 | % | | 48.9 | % | | 49.2 | % | | 46.7 | % | | 48.8 | % | | 49.0 | % | | 47.6 | % | | 48.5 | % | | 48.4 | % |
| | | | | | | | | | | | | | | | | | | |
| | | | | | | | | | | | | | | | | | | |
| | | | | | | | | | | | | | | | | | | |
| | | | | | | | | | | | | | | | | | | |
| | | | | | | | | | | | | | | | | | | |
| | | | | | | | | | | | | | | | | | | |
| | | | | | | | | | | | | | | | | | | |
| | | | | | | | | | | |
| | | | | | | | | | | | | | | | | | | |
| | | | | | | | | | | | | | | | | | | |
| | | | | | | | | | | | | | | | | | | |
| | | | | | | | | | | | | | | | | | | |
| | | | | | | | | | | | | | | | | | | |
| | | | | | | | | | | | | | | | | | | |
| | | | | | | | | | | | | | | | | | | |
| | | | | | | | | | | | | | | | | | | |
| | | | | | | | | | | | | | | | | | | |
| | | | | | | | | | | | | | | | | | | |
| | | | | | | | | | | | | | | | | | | |
| | | | | | | | | | | | | | | | | | | |
| | | | | | | | | | | | | | | | | | | |
| | | | | | | | | | | | | | | | | | | |
| | | | | | | | | | | | | | | | | | | |
| | | | | | | | | | | | | | | | | | | |
| | | | | | | | | | | | | | | | | | | |
| | | | | | | | | | | | | | | | | | | |
| | | | | | | | | | | | | | | | | | | |
| | | | | | | | | | | | | | | | | | | |
| | | | | | | | | | | | | | | | | | | |
| | | | | | | | | | | | | | | | | | | |
| | | | | | | | | | | | | | | | | | | |
| | | | | | | | | | | | | | | | | | | |
| | | | | | | | | | | | | | | | | | | |
| | | | | | | | | | | | | | | | | | | |
| | | | | | | | | | | | | | | | | | | |
| | | | | | | | | | | | | | | | | | | |
| | | | | | | | | | | | | | | | | | | |
| | | | | | | | | | | | | | | | | | | |
| | | | | | | | | | | | | | | | | | | |
(1)Stock-based compensation includes payroll tax impacts and may not agree to stock-based compensation expense on the Condensed Consolidated Financial Statements. Additionally, certain stock-based compensation expenses associated with the Sprint merger have been included in Merger-related costs (gain), net.
(2)Merger-related costs (gain), net, for the three months ended June 30, 2024, includes the $100 million gain recognized for the extension fee previously paid by DISH associated with the license purchase agreement for 800 MHz spectrum licenses, which was not purchased.
(3)Legal-related expenses (recoveries), net, consists of the settlement of certain litigation and compliance costs associated with the August 2021 cyberattack and is presented net of insurance recoveries.
(4)Other, net, primarily consists of certain severance, restructuring and other expenses, gains and losses, not directly attributable to the Sprint merger or UScellular acquisition, which are not reflective of T-Mobile’s core business activities and are, therefore, excluded from Adjusted EBITDA and Core Adjusted EBITDA.
T-Mobile US, Inc.
Reconciliation of Non-GAAP Financial Measures to GAAP Financial Measures (continued)
(Unaudited)
Net debt (excluding tower obligations) to the LTM Net income, LTM Adjusted EBITDA and LTM Core Adjusted EBITDA ratios are calculated as follows:
| | | | | | | | | | | | | | | | | | | | | | | | | | | | | | | | | | | | | | | | | | | |
| (in millions, except net debt ratios) | | | Mar 31, 2024 | | Jun 30, 2024 | | Sep 30, 2024 | | Dec 31, 2024 | | Mar 31, 2025 | | Jun 30, 2025 | | Sep 30,
2025 |
| | | | | | | | | | | | | | | |
| Short-term debt | | | $ | 5,356 | | | $ | 5,867 | | | $ | 5,851 | | | $ | 4,068 | | | $ | 8,214 | | | $ | 6,408 | | | $ | 6,333 | |
| | | | | | | | | | | | | | | |
| Short-term financing lease liabilities | | | 1,265 | | | 1,252 | | | 1,252 | | | 1,175 | | | 1,136 | | | 1,157 | | | 1,157 | |
| Long-term debt | | | 71,361 | | | 70,203 | | | 72,522 | | | 72,700 | | | 76,033 | | | 75,018 | | | 76,365 | |
| Long-term debt to affiliates | | | 1,496 | | | 1,496 | | | 1,497 | | | 1,497 | | | 1,497 | | | 1,497 | | | 1,498 | |
| Financing lease liabilities | | | 1,163 | | | 1,133 | | | 1,185 | | | 1,151 | | | 1,117 | | | 1,188 | | | 1,186 | |
| Total debt (excluding tower obligations) | | | $ | 80,641 | | | $ | 79,951 | | | $ | 82,307 | | | $ | 80,591 | | | $ | 87,997 | | | $ | 85,268 | | | $ | 86,539 | |
| Less: Cash and cash equivalents | | | (6,708) | | | (6,417) | | | (9,754) | | | (5,409) | | | (12,003) | | | (10,259) | | | (3,310) | |
| | | | | | | | | | | | | | | |
| Net debt (excluding tower obligations) | | | $ | 73,933 | | | $ | 73,534 | | | $ | 72,553 | | | $ | 75,182 | | | $ | 75,994 | | | $ | 75,009 | | | $ | 83,229 | |
| Divided by: Last twelve months Net income | | | $ | 8,751 | | | $ | 9,455 | | | $ | 10,372 | | | $ | 11,339 | | | $ | 11,918 | | | $ | 12,215 | | | $ | 11,870 | |
| Net debt (excluding tower obligations) to LTM Net income Ratio | | | 8.4 | | | 7.8 | | | 7.0 | | | 6.6 | | | 6.4 | | | 6.1 | | | 7.0 | |
| | | | | | | | | | | | | | | |
| | | | | | | | | | | | | | | |
| | | | | | | | | | | | | | | |
| | | | | | | | | | | | | | | |
| Divided by: Last twelve months Adjusted EBITDA | | | $ | 29,881 | | | $ | 30,529 | | | $ | 31,172 | | | $ | 31,864 | | | $ | 32,471 | | | $ | 32,965 | | | $ | 33,406 | |
| Net debt (excluding tower obligations) to LTM Adjusted EBITDA Ratio | | | 2.5 | | | 2.4 | | | 2.3 | | | 2.4 | | | 2.3 | | | 2.3 | | | 2.5 | |
| Divided by: Last twelve months Core Adjusted EBITDA | | | $ | 29,681 | | | $ | 30,372 | | | $ | 31,047 | | | $ | 31,771 | | | $ | 32,412 | | | $ | 32,926 | | | $ | 33,384 | |
| Net debt (excluding tower obligations) to LTM Core Adjusted EBITDA Ratio | | | 2.5 | | | 2.4 | | | 2.3 | | | 2.4 | | | 2.3 | | | 2.3 | | | 2.5 | |
| | | | | | | | | | | | | | | |
| | | | | | | | | | | | | | | |
| | | | | | | | | | | | | | | |
| | | | | | | | | | | | | | | |
| | | | | | | | | | | | | | | |
| | | | | | | | | | | | | | | |
| | | | | | | | | | | | | | | |
| | | | | | | | | | | | | | | |
| | | | | | | | | | | | | | | |
| | | | | | | | | | | | | | | |
| | | | | | | | | | | | | | | |
| | | | | | | | | | | | | | | |
| | | | | | | | | | | | | | | |
Adjusted Free Cash Flow is calculated as follows:
| | | | | | | | | | | | | | | | | | | | | | | | | | | | | | | | | | | | | | | | | | | | | | | | | | | | | | | |
| | | Quarter | | Nine Months Ended September 30, |
| (in millions, except percentages) | | | Q1 2024 | | Q2 2024 | | Q3 2024 | | Q4 2024 | | Q1 2025 | | Q2 2025 | | Q3 2025 | | 2024 | | 2025 |
| | | | | | | | | | | | | | | | | | | |
Net cash provided by operating activities (1) | | | $ | 5,084 | | | $ | 5,521 | | | $ | 6,139 | | | $ | 5,549 | | | $ | 6,847 | | | $ | 6,992 | | | $ | 7,457 | | | $ | 16,744 | | | $ | 21,296 | |
| Cash purchases of property and equipment, including capitalized interest | | | (2,627) | | | (2,040) | | | (1,961) | | | (2,212) | | | (2,451) | | | (2,396) | | | (2,639) | | | (6,628) | | | (7,486) | |
| | | | | | | | | | | | | | | | | | | |
Proceeds related to beneficial interests in securitization transactions (1) | | | 890 | | | 958 | | | 984 | | | 747 | | | — | | | — | | | — | | | 2,832 | | | — | |
| | | | | | | | | | | | | | | | | | | |
| | | | | | | | | | | | | | | | | | | |
| | | | | | | | | | | | | | | | | | | |
| Adjusted Free Cash Flow | | | $ | 3,347 | | | $ | 4,439 | | | $ | 5,162 | | | $ | 4,084 | | | $ | 4,396 | | | $ | 4,596 | | | $ | 4,818 | | | $ | 12,948 | | | $ | 13,810 | |
Net cash provided by operating activities margin | | | 31.6 | % | | 33.6 | % | | 36.7 | % | | 32.8 | % | | 40.5 | % | | 40.1 | % | | 40.9 | % | | 34.0 | % | | 40.5 | % |
Adjusted Free Cash Flow margin | | | 20.8 | % | | 27.0 | % | | 30.9 | % | | 24.1 | % | | 26.0 | % | | 26.4 | % | | 26.4 | % | | 26.3 | % | | 26.3 | % |
| | | | | | | | | | | | | | | | | | | |
| | | | | | | | | | | | | | | | | | | |
| | | | | | | | | | | | | | | | | | | |
| | | | | | | | | | | | | | | | | | | |
| | | | | | | | | | | | | | | | | | | |
| | | | | | | | | | | | | | | | | | | |
| | | | | | | | | | | | | | | | | | | |
| | | | | | | | | | | | | | | | | | | |
| | | | | | | | | | | | | | | | | | | |
| | | | | | | | | | | | | | | | | | | |
| | | | | | | | | | | | | | | | | | | |
| | | | | | | | | | | | | | | | | | | |
| | | | | | | | | | | | | | | | | | | |
| | | | | | | | | | | | | | | | | | | |
| | | | | | | | | | | | | | | | | | | |
| | | | | | | | | | | | | | | | | | | |
| | | | | | | | | | | | | | | | | | | |
| | | | | | | | | | | | | | | | | | | |
| | | | | | | | | | | | | | | | | | | |
| | | | | | | | | | | | | | | | | | | |
| | | | | | | | | | | | | | | | | | | |
| | | | | | | | | | | | | | | | | | | |
| | | | | | | | | | | | | | | | | | | |
| | | | | | | | | | | | | | | | | | | |
| | | | | | | | | | | | | | | | | | | |
| | | | | | | | | | | | | | | | | | | |
| | | | | | | | | | | | | | | | | | | |
| | | | | | | | | | | | | | | | | | | |
| | | | | | | | | | | | | | | | | | | |
| | | | | | | | | | | | | | | | | | | |
(1)Effective November 1, 2024, following amendments to the company’s Equipment Installment Plan Sale and Service Receivable Sale arrangements, all cash proceeds associated with the sale of such receivables, a portion of which was previously recognized as Proceeds related to beneficial interests in securitization transactions within investing cash flows, were recognized as operating cash flows. These amendments did not have a net impact on Adjusted Free Cash Flow.
T-Mobile US, Inc.
Reconciliation of Non-GAAP Financial Measures to GAAP Financial Measures (continued)
(Unaudited)
The current guidance range for Adjusted Free Cash Flow is calculated as follows:
| | | | | | | | | | | |
| FY 2025 |
| (in millions) | Guidance Range |
| | | |
| Net cash provided by operating activities | $ | 27,800 | | | $ | 28,000 | |
| | | |
| Cash purchases of property and equipment, including capitalized interest | (10,000) | | | (10,000) | |
| | | |
| | | |
| | | |
| Adjusted Free Cash Flow | $ | 17,800 | | | $ | 18,000 | |
| | | |
| | | |
| | | |
| | | |
| | | |
| | | |
The previous guidance range for Adjusted Free Cash Flow was calculated as follows:
| | | | | | | | | | | |
| FY 2025 |
| (in millions) | Guidance Range |
| | | |
| Net cash provided by operating activities | $ | 27,100 | | | $ | 27,500 | |
| | | |
| Cash purchases of property and equipment, including capitalized interest | (9,500) | | | (9,500) | |
| | | |
| | | |
| | | |
| Adjusted Free Cash Flow | $ | 17,600 | | | $ | 18,000 | |
| | | |
| | | |
| | | |
| | | |
| | | |
| | | |
Definitions of Terms
Operating and financial measures are utilized by T-Mobile’s management to evaluate its operating performance and, in certain cases, its ability to meet liquidity requirements. Although companies in the wireless industry may not define measures in precisely the same way, T-Mobile believes the measures facilitate key operating performance comparisons with other companies in the wireless industry to provide management, investors and analysts with useful information to assess and evaluate past performance and assist in forecasting future performance.
1.Account - A billing account number that generates revenue. Postpaid accounts generally consist of customers that are qualified for postpaid service utilizing phones, 5G broadband modems, fiber connections, mobile internet devices, including tablets and hotspots, wearables, DIGITS or other connected devices, including SyncUP and IoT, where they generally pay after receiving service.
2.Customer - A SIM number with a unique T-Mobile identifier which is associated with an account that generates revenue. Customers are qualified either for postpaid service utilizing phones, 5G broadband modems, fiber connections, mobile internet devices, including tablets and hotspots, wearables, DIGITS or other connected devices, including SyncUP and IoT, where they generally pay after receiving service, or prepaid service, where they generally pay in advance of receiving service.
3.Churn - The number of customers whose service was deactivated as a percentage of the average number of customers during the specified period further divided by the number of months in the period. The number of customers whose service was deactivated is presented net of customers that subsequently have their service restored within a certain period of time and excludes customers who received service for less than a certain minimum period of time.
4.Postpaid Average Revenue Per Account (“ARPA”) - Average monthly postpaid service revenue earned per account. Postpaid service revenues for the specified period divided by the average number of postpaid accounts during the period, further divided by the number of months in the period.
Average Revenue Per User (“ARPU”) - Average monthly service revenue earned per customer. Service revenues for the specified period divided by the average number of customers during the period, further divided by the number of months in the period.
Postpaid phone ARPU excludes postpaid other customers and related revenues.
Service revenues - Postpaid, including handset insurance, prepaid, wholesale and other service revenues.
5.Cost of services - Costs directly attributable to providing wireless service through the operation of T-Mobile’s network, including direct switch and cell site costs, such as rent, network access and transport costs, utilities, maintenance, associated labor costs, long distance costs, regulatory program costs, roaming fees paid to other carriers and data content costs.
Cost of equipment sales - Costs of devices and accessories sold to customers and dealers, device costs to fulfill insurance and warranty claims, write-downs of inventory related to shrinkage and obsolescence, and shipping and handling costs.
Selling, general and administrative expenses - Costs not directly attributable to providing wireless service for the operation of sales, customer care and corporate activities. These include all commissions paid to dealers and retail employees for activations and upgrades, labor and facilities costs associated with retail sales force and administrative space, marketing and promotional costs, customer support and billing, bad debt expense and administrative support activities.
6.Net income margin - Net income divided by Service revenues.
7.Adjusted EBITDA and Core Adjusted EBITDA - Adjusted EBITDA represents earnings before Interest expense, net of Interest income, Income tax expense, Depreciation and amortization, stock-based compensation and Special Items. Core Adjusted EBITDA represents Adjusted EBITDA less device lease revenues. Core Adjusted EBITDA and Adjusted EBITDA are non-GAAP financial measures utilized by T-Mobile’s management, including our chief operating decision maker, to monitor the financial performance of our operations and allocate resources of the Company as a whole. T-Mobile historically used Adjusted EBITDA and T-Mobile currently uses Core Adjusted EBITDA internally as a measure to evaluate and compensate its personnel and management for their performance. T-Mobile uses Adjusted EBITDA and Core Adjusted EBITDA as benchmarks to evaluate its operating performance in comparison to competitors. Management believes analysts and investors use Core Adjusted EBITDA and Adjusted EBITDA as supplemental measures to evaluate overall operating performance and to facilitate comparisons with other wireless communications services companies because they are indicative of T-Mobile’s ongoing operating performance and trends by excluding the impact of Interest expense from financing, non-cash depreciation and amortization from capital investments, non-cash stock-based compensation and Special Items. Management believes analysts and investors use Core Adjusted EBITDA because it normalizes for the transition in the company’s device financing strategy, by excluding the impact of device lease revenues from Adjusted EBITDA, to align with the related depreciation expense on leased devices, which is excluded from the definition of Adjusted EBITDA. Core Adjusted EBITDA and Adjusted EBITDA have limitations as analytical tools and should not be considered in isolation or as a substitute for Income from operations, Net income or any other measure of financial performance reported in accordance with U.S. Generally Accepted Accounting Principles (“GAAP”).
8.Special Items - Certain expenses, gains, and losses which are not reflective of our ongoing performance. Special Items include Merger-related costs (gain), net, certain legal-related recoveries and expenses, Impairment expense, restructuring costs not directly attributable to the Sprint merger or UScellular acquisition (including severance), and other non-core gains and losses.
9.Adjusted EBITDA margin and Core Adjusted EBITDA margin - Adjusted EBITDA margin is calculated as Adjusted EBITDA divided by Service revenues. Core Adjusted EBITDA margin is calculated as Core Adjusted EBITDA divided by Service revenues. Adjusted EBITDA margin and Core Adjusted EBITDA margin are non-GAAP financial measures utilized by T-Mobile’s management, including our chief operating decision maker, to monitor the financial performance of our operations and allocate resources of the Company as a whole.
10.Net cash provided by operating activities margin - Net cash provided by operating activities margin is calculated as Net cash provided by operating activities divided by Service revenues.
11.Adjusted Free Cash Flow - Net cash provided by operating activities less cash payments for purchases of property and equipment, plus proceeds from sales of tower sites and proceeds related to beneficial interests in securitization transactions. Adjusted Free Cash Flow is utilized by T-Mobile’s management, investors, and analysts of our financial information to evaluate cash available to pay debt, repurchase shares, pay dividends and provide further investment in the business.
12.Adjusted Free Cash Flow margin - Adjusted Free Cash Flow margin is calculated as Adjusted Free Cash Flow divided by Service revenues. Adjusted Free Cash Flow Margin is utilized by T-Mobile’s management, investors, and analysts to evaluate the company’s ability to convert service revenue efficiently into cash available to pay debt, repurchase shares, pay dividends and provide further investment in the business.
13.Net debt - Short-term debt, short-term debt to affiliates, long-term debt (excluding tower obligations), and long-term debt to affiliates, short-term financing lease liabilities and financing lease liabilities, less cash and cash equivalents.
14.Merger-related costs includes Sprint merger-related costs and UScellular merger-related costs.
15.Sprint merger-related costs include:
•Integration costs to achieve efficiencies in network, retail, information technology and back office operations, migrate customers to the T-Mobile network and billing systems and the impact of legal matters assumed as part of the Sprint merger;
•Restructuring costs, including severance, store rationalization and network decommissioning; and
•Transaction costs, including legal and professional services related to the completion of the Sprint merger and the acquisitions of affiliates.
16.UScellular merger-related costs to date include:
•Integration costs to achieve efficiencies in network, retail, information technology and back office operations and migrate customers to the T-Mobile network and billing systems;
•Restructuring costs, including severance and network decommissioning; and
•Transaction costs, including legal and professional services related to the completion of the UScellular acquisition.
Cautionary Statement Regarding Forward-Looking Statements
This communication includes forward-looking statements within the meaning of the Private Securities Litigation Reform Act of 1995. All statements other than statements of historical fact, including information concerning T-Mobile US, Inc.’s future results of operations, are forward-looking statements. These forward-looking statements are generally identified by the words “anticipate,” “believe,” “estimate,” “expect,” “intend,” “may,” “could” or similar expressions. Forward-looking statements are based on current expectations and assumptions, which are subject to risks and uncertainties and may cause actual results to differ materially from the forward-looking statements. Important factors that could affect future results and cause those results to differ materially from those expressed in the forward-looking statements include, among others, the following: competition, industry consolidation and changes in the market for wireless communications services and other forms of connectivity; criminal cyberattacks, disruption, data loss or other security breaches; our inability to timely adopt and effectively deploy network technology developments; our inability to effectively execute our digital transformation and drive customer and employee adoption of emerging technologies; our inability to retain or motivate key personnel, hire qualified personnel or maintain our corporate culture; system failures and business disruptions, allowing for unauthorized use of or interference with our network and other systems; the scarcity and cost of additional wireless spectrum, and regulations relating to spectrum use; the timing and effects of any pending and future acquisition, divestiture, investment, joint venture or merger involving us, including our inability to obtain any required regulatory approval necessary to consummate any such transactions or to achieve the expected benefits of such transactions; adverse economic, political or market conditions in the U.S. and international markets, including changes resulting from increases in inflation or interest rates, tariffs and trade restrictions, supply chain disruptions, fluctuations in global currencies, immigration policies, and impacts of geopolitical instability, such as the Ukraine-Russia and Israel-Hamas wars and further escalations thereof; potential operational delays, higher procurement and operational costs, and regulatory and compliance complexities as result of changes to trade policies, including higher tariffs, restrictions and other economic disincentives to trade; our inability to successfully deliver new products and services; any disruption or failure of our third parties (including key suppliers) to provide products or services for the operation of our business; sociopolitical volatility and polarization and risks related to environmental, social and governance matters; our substantial level of indebtedness and our inability to service our debt obligations in accordance with their terms; changes in the credit market conditions, credit rating downgrades or an inability to access debt markets; our inability to maintain effective internal control over financial reporting; any changes in regulations or in the regulatory framework under which we operate; laws and regulations relating to the handling of privacy, data protection and artificial intelligence; unfavorable outcomes of and increased costs from existing or future regulatory or legal proceedings; difficulties in protecting our intellectual property rights or if we infringe on the intellectual property rights of others; our offering of regulated financial services products and exposure to a wide variety of state and federal regulations; new or amended tax laws or regulations or administrative interpretations and judicial decisions affecting the scope or application of tax laws or regulations; our wireless licenses, including those controlled through leasing agreements, are subject to renewal and may be revoked; our exclusive forum provision as provided in our Certificate of Incorporation; interests of Deutsche Telekom AG (“DT”), our controlling stockholder, which may differ from the interests of other stockholders; our current and future stockholder return programs may not be fully utilized, and our share repurchases and dividend payments pursuant thereto may fail to have the desired impact on stockholder value; future sales of our common stock by DT and SoftBank Group Corp. and our inability to attract additional equity financing outside the United States due to foreign ownership limitations by the Federal Communications Commission; and other risks as disclosed in our most recent annual report on Form 10-K, and subsequent Forms 10-Q and other filings with the Securities and Exchange Commission. Given these risks and uncertainties, readers are cautioned not to place undue reliance on such forward-looking statements. We undertake no obligation to revise or publicly release the results of any revision to these forward-looking statements, except as required by law.
About T-Mobile US, Inc.
As the supercharged Un-carrier, T-Mobile US, Inc. (NASDAQ: TMUS) is powered by an award-winning 5G network that connects more people, in more places, than ever before. With T-Mobile’s unique value proposition of best network, best value and best experiences, the Un-carrier is redefining connectivity and fueling competition while continuing to drive the next wave of innovation in wireless and beyond. Headquartered in Bellevue, Wash., T-Mobile provides services through its subsidiaries and operates its flagship brands, T-Mobile, Metro by T-Mobile and Mint Mobile. For more information, visit https://www.t-mobile.com.