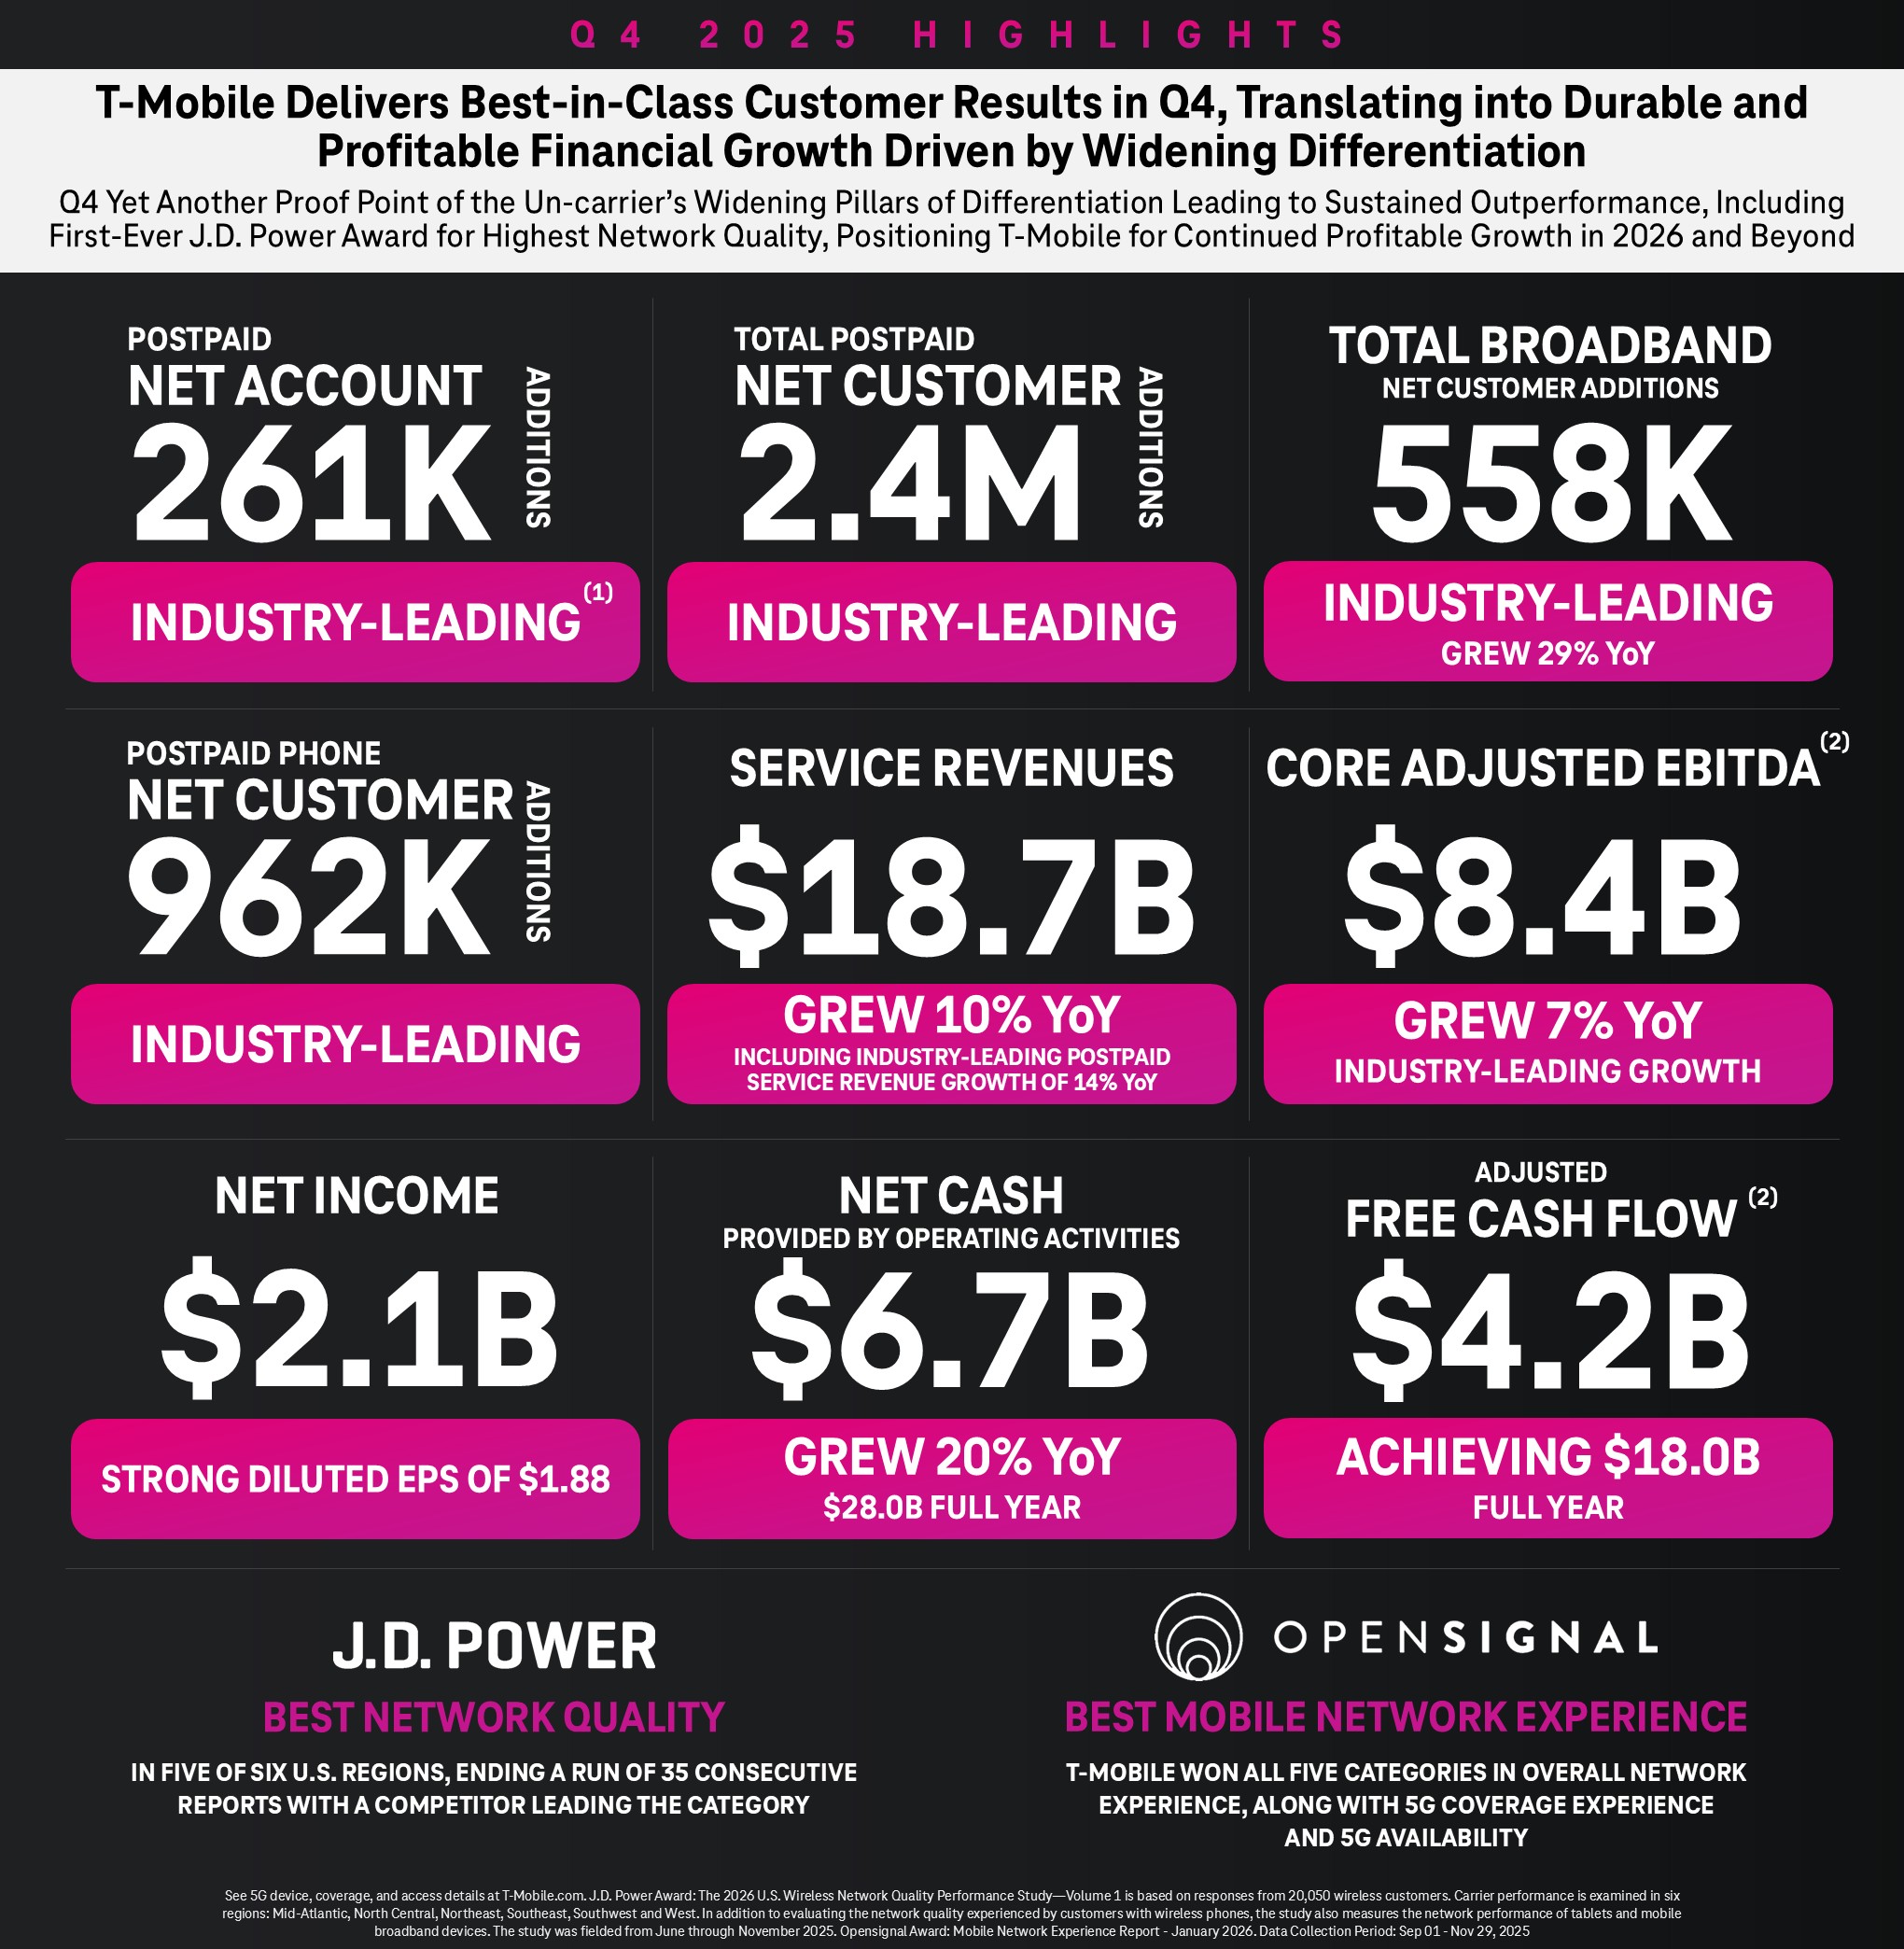
(1)AT&T Inc. does not disclose postpaid net account additions. Comcast and Charter do not disclose postpaid phone net customer additions. Industry-leading claims are based on consensus expectations if results are not yet reported.
(2)Core Adjusted EBITDA, Adjusted Free Cash Flow and Adjusted Free Cash Flow margin are non-GAAP financial measures. These non-GAAP financial measures should be considered in addition to, but not as a substitute for, the information provided in accordance with GAAP. Reconciliations for these non-GAAP financial measures to the most directly comparable GAAP financial measures are provided in the Reconciliation of Non-GAAP Financial Measures to GAAP Financial Measures tables. We are not able to forecast Net income on a forward-looking basis without unreasonable efforts due to the high variability and difficulty in predicting certain items that affect Net income, including, but not limited to, Special Items, Income tax expense and Interest expense. Core Adjusted EBITDA should not be used to predict Net income as the difference between this measure and Net income is variable.
4
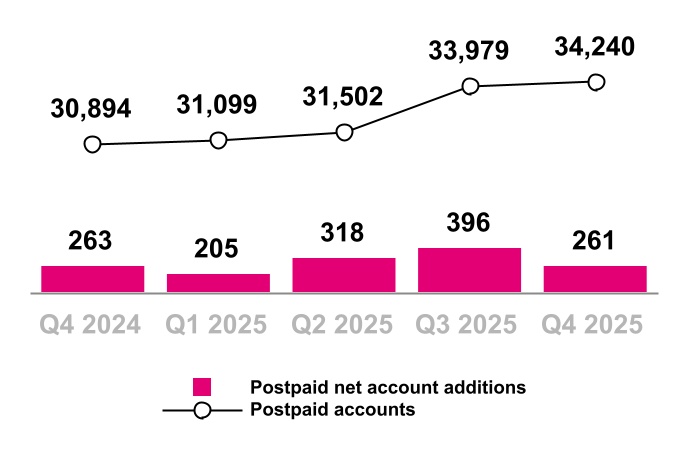
Postpaid Accounts
(in thousands)
During Q2 2025, we acquired 85,000 postpaid accounts from Lumos.
During Q3 2025, we acquired 1,448,000 postpaid accounts, net of certain base adjustments, through the UScellular acquisition.
During Q3 2025, we acquired 633,000 postpaid accounts from Metronet and other acquisitions.
Year-Over-Year
Continued growth in Postpaid accounts with net additions relatively flat primarily due to:
■Higher account deactivations driven by the impact from a growing account base, including following the UScellular acquisition, and higher industry switching
■Mostly offset by higher gross account additions, including fiber account additions following the acquisitions of Metronet and Lumos
Sequential
Continued growth in Postpaid accounts with a decrease in net additions primarily due to:
■Higher account deactivations, including seasonal trends, higher industry switching and the impact from a growing account base
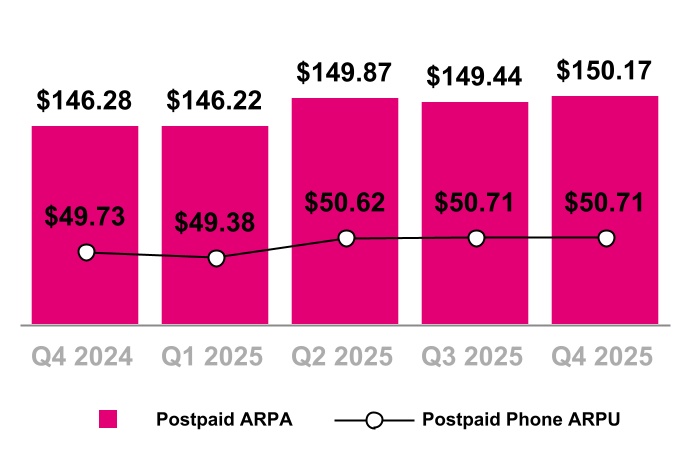
Year-Over-Year
Postpaid ARPA increased 3% primarily due to:
■The positive impact from rate plan optimizations and higher fee revenue, including from the adoption of new tax and fee exclusive plans
■An increase in customers per account, including from the continued adoption of 5G broadband and continued growth of T-Mobile for Business customers, partially offset by fiber and UScellular accounts with fewer customers per account
■Partially offset by increased promotional activity, including the success of bundled offerings
Postpaid phone ARPU increased 2% primarily due to:
■The positive impact from rate plan optimizations and higher fee revenue, including from the adoption of new tax and fee exclusive plans
■The acquisition of higher-ARPU UScellular customers
■Partially offset by increased promotional activity, including the success of bundled offerings
Sequential
Postpaid ARPA increased slightly primarily due to:
■An increase in customers per account, including from the continued adoption of 5G broadband and continued growth of T-Mobile for Business customers, partially offset by fiber and UScellular accounts with fewer customers per account
■Higher fee revenue, including from the adoption of new tax and fee exclusive plans
■Mostly offset by increased promotional activity, including the success of bundled offerings
Sequential
Postpaid phone ARPU was flat primarily due to:
■Higher fee revenue, including from the adoption of new tax and fee exclusive plans
■The acquisition of higher-ARPU UScellular customers
■Offset by increased promotional activity, including the success of bundled offerings
Postpaid ARPA & Postpaid Phone ARPU
5
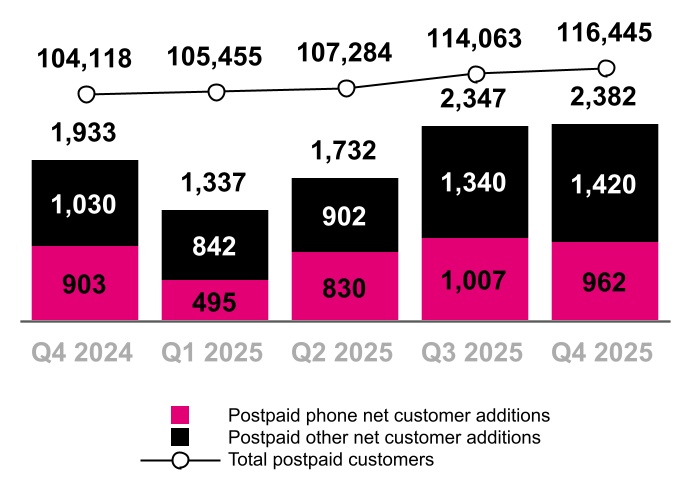
Postpaid Customers
(in thousands)
During Q2 2025, we acquired 97,000 postpaid fiber customers from Lumos.
During Q3 2025, we acquired 3,677,000 postpaid customers, net of certain base adjustments, through the UScellular acquisition.
During Q3 2025, we acquired 755,000 postpaid fiber customers from Metronet and other acquisitions.
Year-Over-Year
Postpaid phone net customer additions increased primarily due to:
■Higher gross additions
■Partially offset by increased deactivations from higher churn and a growing customer base
Postpaid other net customer additions increased primarily due to:
■Higher net additions from mobile internet devices, including from success in business customers
■Higher broadband net additions
■Higher net additions from other connected devices
Sequential
Postpaid phone net customer additions decreased primarily due to:
■Increased deactivations from higher churn and a growing customer base
■Partially offset by higher gross additions, including seasonal trends
Postpaid other net customer additions increased primarily due to:
■Higher net additions from mobile internet devices
■Higher net additions from other connected devices
Year-Over-Year
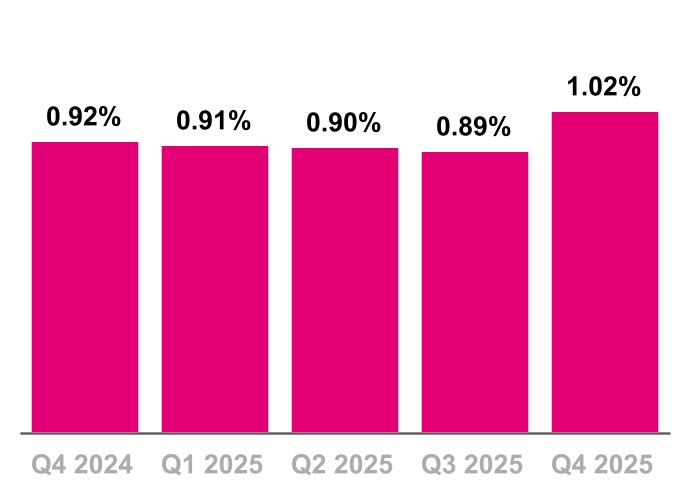
Postpaid phone churn increased 10 basis points primarily due to:
■Higher industry switching
Sequential
Postpaid phone churn increased 13 basis points primarily due to:
■Seasonal trends
■Higher industry switching
Postpaid Phone Churn
6
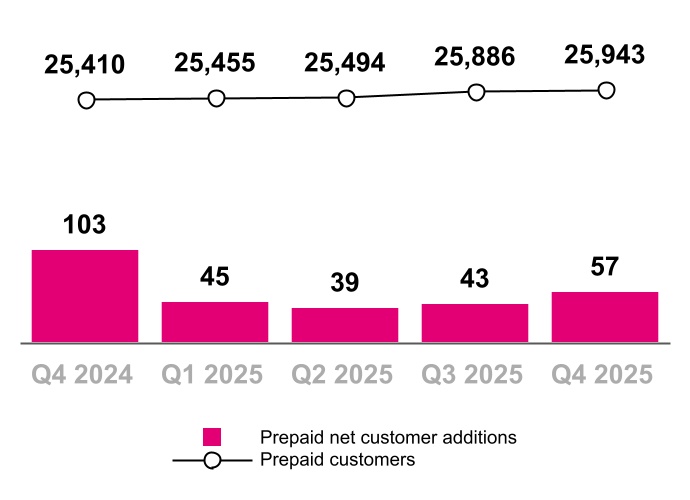
Prepaid Customers
(in thousands)
During Q3 2025, we acquired 349,000 prepaid customers, net of certain base adjustments, through the UScellular acquisition.
Year-Over-Year
Prepaid net customer additions decreased primarily due to:
■Increased deactivations from a growing customer base
■Lower gross additions
■Partially offset by lower churn
Sequential
Prepaid net customer additions increased primarily due to:
■Fewer prepaid to postpaid migrations
Year-Over-Year
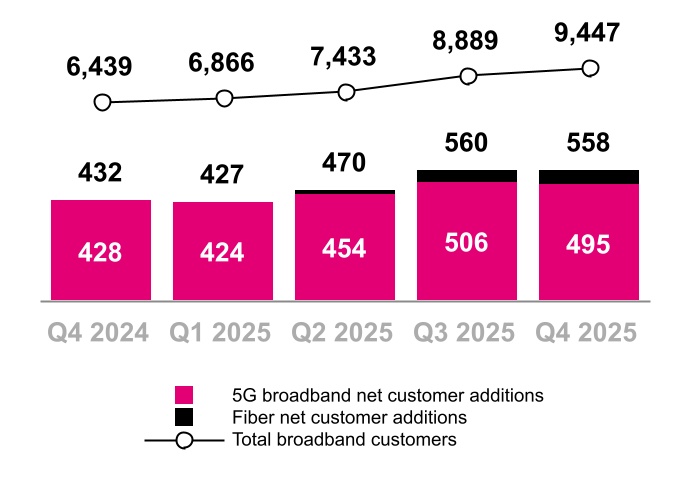
Total broadband net customer additions increased primarily due to:
■Higher gross additions, including fiber gross additions following the acquisitions of Metronet and Lumos
■Lower 5G broadband churn
■Partially offset by increased deactivations from a growing customer base
Sequential
Total broadband net customer additions were relatively flat primarily due to:
■Increased deactivations from a growing customer base
■Mostly offset by lower 5G broadband churn
Broadband Customers
(in thousands)
During Q2 2025, we acquired 97,000 fiber customers from Lumos.
During Q3 2025, we acquired 141,000 postpaid 5G broadband customers, net of certain base adjustments, through the UScellular acquisition.
During Q3 2025, we acquired 755,000 fiber customers from Metronet and other acquisitions.
7
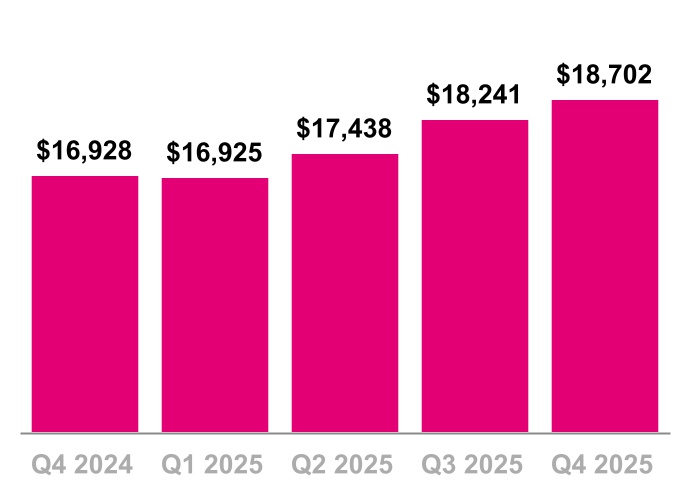
Service Revenues
($ in millions)
Year-Over-Year
Service revenues increased 10% primarily due to:
■An increase in Postpaid service revenues, including following the acquisitions of UScellular, Metronet and Lumos
■Partially offset by lower Prepaid service revenues
Sequential
Service revenues increased 3% primarily due to:
■An increase in Postpaid service revenues, including following the acquisitions of Metronet and UScellular which closed during Q3
Year-Over-Year
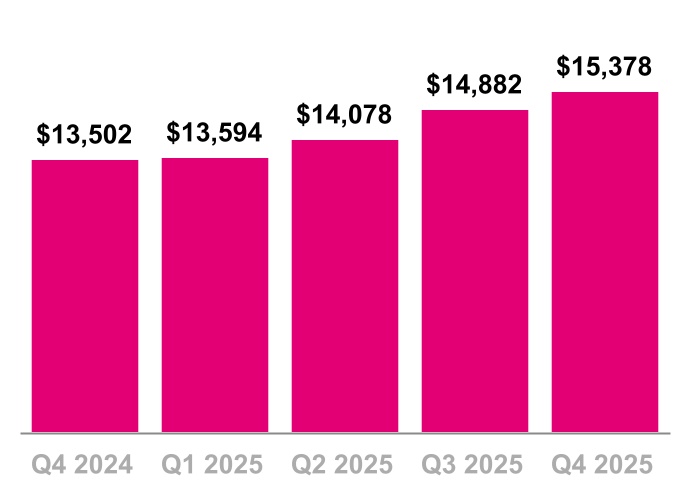
Postpaid service revenues increased 14% primarily due to:
■Higher average postpaid accounts, including following the acquisitions of UScellular, Metronet and Lumos
■Higher postpaid ARPA
Sequential
Postpaid service revenues increased 3% primarily due to:
■Higher average postpaid accounts, including following the acquisitions of UScellular and Metronet which closed during Q3
Postpaid Service Revenues
($ in millions)
8
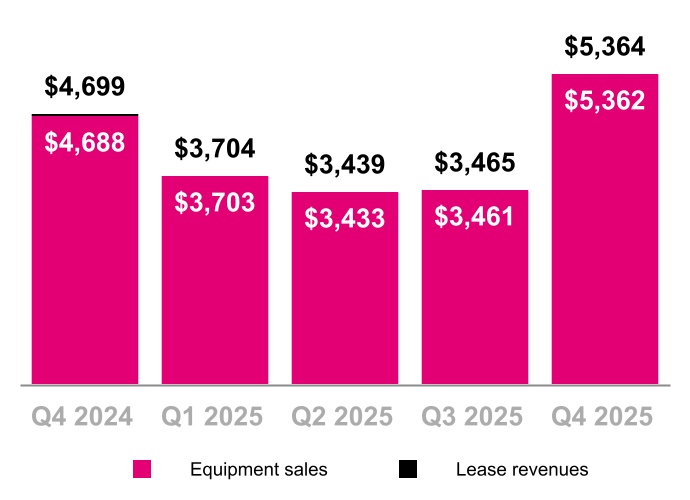
Equipment Revenues
($ in millions)
Year-Over-Year
Equipment revenues increased 14% primarily due to:
■A higher average revenue per device sold, net of promotions, primarily driven by an increase in the high-end phone mix
■Higher liquidation revenue primarily due to a higher number of liquidated devices
■A higher number of devices sold, including following the UScellular acquisition
Sequential
Equipment revenues increased 55% primarily due to:
■A higher average revenue per device sold, net of promotions, primarily due to an increase in the high-end phone mix, including seasonal trends
■A higher number of devices sold, including seasonal trends and following the UScellular acquisition which closed during Q3
■Higher liquidation revenue primarily due to a higher number of liquidated devices and an increase in the high-end phone mix
Year-Over-Year
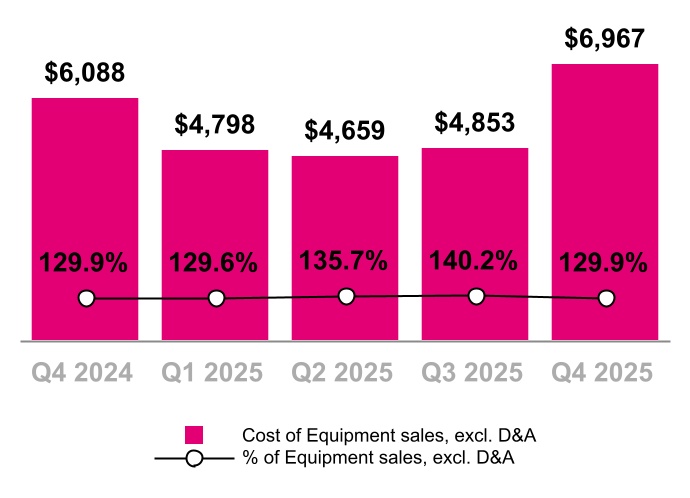
Cost of equipment sales, exclusive of Depreciation and Amortization (D&A), increased 14% primarily due to:
■A higher average cost per device sold primarily driven by an increase in the high-end phone mix
■A higher number of devices sold, including following the UScellular acquisition
■Higher liquidation costs primarily due to a higher number of liquidated devices
Sequential
Cost of equipment sales, exclusive of D&A, increased 44% primarily due to:
■A higher average cost per device sold primarily due to an increase in the high-end phone mix, including seasonal trends
■A higher number of devices sold, including seasonal trends and following the UScellular acquisition which closed during Q3
■Higher liquidation costs primarily due to a higher number of liquidated devices and an increase in the high-end phone mix
Cost of Equipment Sales, exclusive of D&A
($ in millions, % of Equipment sales)
9
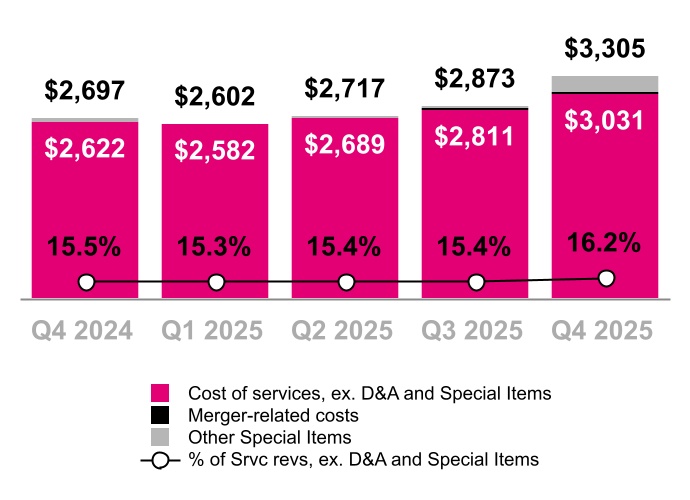
Cost of Services, exclusive of D&A
($ in millions, % of Service revenues)
Year-Over-Year
Cost of services, exclusive of D&A, increased 23% primarily due to:
■Higher costs following the UScellular acquisition, including merger-related costs
■Wholesale network access costs and customer installation fees paid to Metronet and Lumos
■$111 million of severance and related costs associated with the 2025 workforce transformation and reinvestment initiative
■Higher restructuring costs associated with network optimization
Sequential
Cost of services, exclusive of D&A, increased 15% primarily due to:
■$111 million of severance and related costs associated with the 2025 workforce transformation and reinvestment initiative
■Higher repair and maintenance expenses
■Higher restructuring costs associated with network optimization
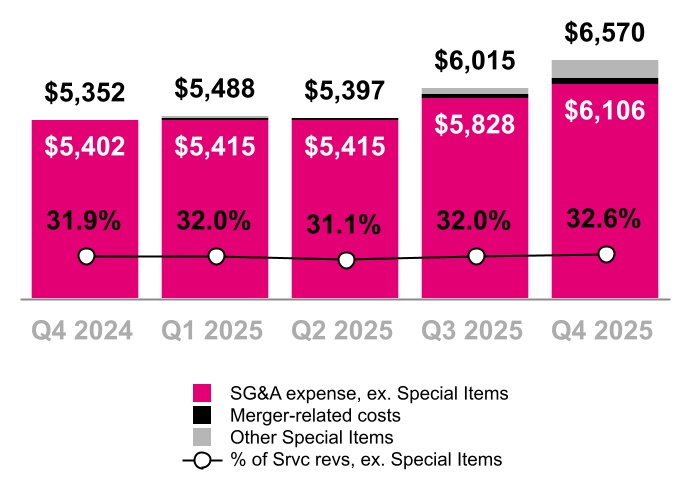
Year-Over-Year
SG&A expense increased 23% primarily due to:
■Higher costs following the UScellular acquisition, including merger-related costs
■$279 million of severance and related costs associated with the 2025 workforce transformation and reinvestment initiative
■Prior year gains related to the closing of certain spectrum exchange transactions and legal-related insurance recoveries
■Higher personnel-related costs, including payroll and benefits
■Higher advertising expenses
Sequential
SG&A expense increased 9% primarily due to:
■$279 million of severance and related costs associated with the 2025 workforce transformation and reinvestment initiative
■Higher advertising expenses
Selling, General and Administrative (SG&A) Expense
($ in millions, % of Service revenues)
10
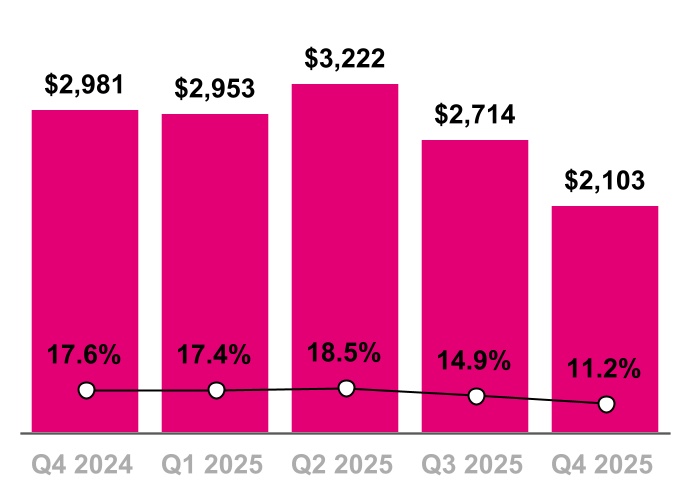
Net Income
($ in millions, % of Service revenues)
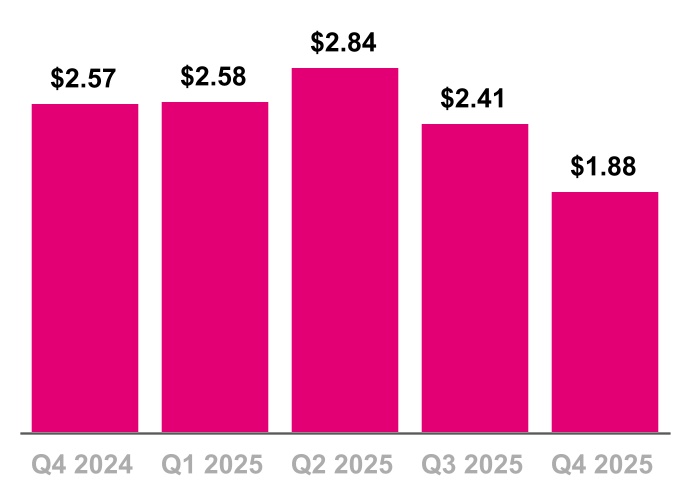
Diluted Earnings Per Share
(Diluted EPS)
Year-Over-Year
Net income was $2.1 billion and Diluted earnings per share was $1.88 in Q4 2025, compared to $3.0 billion and $2.57 in Q4 2024, primarily due to the factors described above and included the following:
■Severance and related costs associated with the 2025 workforce transformation and reinvestment initiative, net of tax, of $293 million, or $0.26 per share, in Q4 2025
Sequential
Net income was $2.1 billion and Diluted earnings per share was $1.88 in Q4 2025, compared to $2.7 billion and $2.41 in Q3 2025, primarily due to the factors described above and included the following:
■Severance and related costs associated with the 2025 workforce transformation and reinvestment initiative, net of tax, of $293 million, or $0.26 per share, in Q4 2025
■Impairment expense related to certain capitalized software development costs, net of tax, of $208 million, or $0.18 per share, in Q3 2025
11
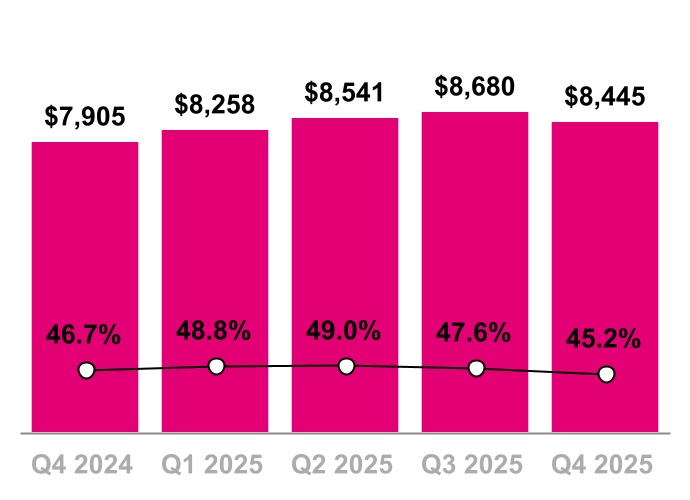
Core Adjusted EBITDA*
($ in millions, % of Service revenues)
*Excludes Special Items (see detail on page 25)
Year-Over-Year
Core Adjusted EBITDA increased 7% primarily due to:
■Partially offset by higher Cost of equipment sales, excluding Special Items, higher SG&A expenses, excluding Special Items, and higher Cost of services, excluding Special Items
Sequential
Core Adjusted EBITDA decreased 3% primarily due to:
■Higher Cost of equipment sales, excluding Special Items
■Higher SG&A expenses, excluding Special Items
■Higher Cost of services, excluding Special Items
■Partially offset by higher Equipment revenues, excluding Lease revenues, and higher Total service revenues
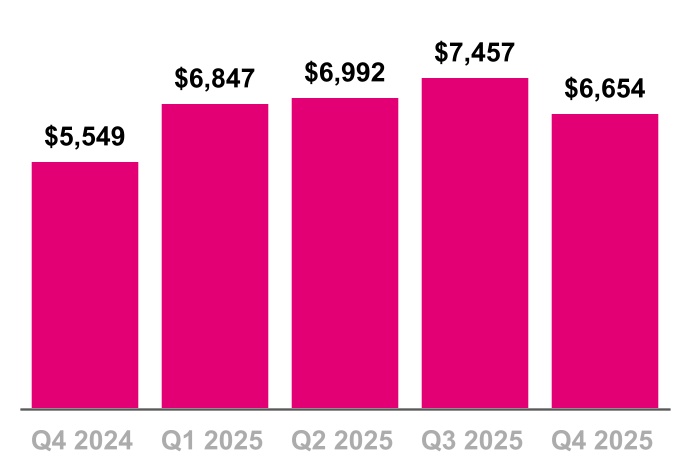
Year-Over-Year
Net cash provided by operating activities increased 20% primarily due to:
■Lower net cash outflows from changes in working capital, including the impact of certain cash proceeds associated with the sale of receivables, which were recognized within investing cash flows before November 1, 2024
■Partially offset by lower Net income, adjusted for non-cash income and expenses
Sequential
Net cash provided by operating activities decreased 11% primarily due to:
■Lower Net income, adjusted for non-cash income and expenses
■Partially offset by lower net cash outflows from changes in working capital
The impact of net payments for Merger-related costs on Net cash provided by operating activities was $100 million in Q4 2025 compared to $96 million in Q3 2025 and $123 million in Q4 2024.
Net Cash Provided by Operating Activities
($ in millions)
Effective November 1, 2024, following amendments to the company’s Equipment Installment Plan Sale and Service Receivable Sale arrangements, all cash proceeds associated with the sale of such receivables, a portion of which was previously recognized as Proceeds related to beneficial interests in securitization transactions within investing cash flows, were recognized as operating cash flows. These amendments did not have a net impact on Adjusted Free Cash Flow.
12
Cash Purchases of Property and Equipment, incl. Capitalized Interest
($ in millions, % of Service revenues)
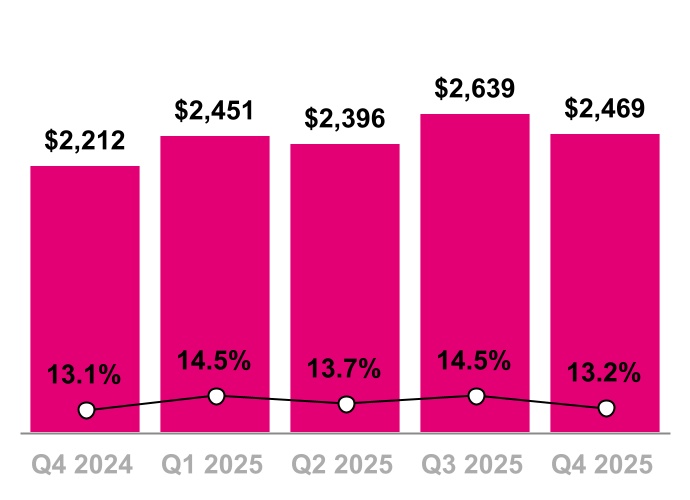
Year-Over-Year
Cash purchases of property and equipment, including capitalized interest, increased 12% primarily due to:
■Planned timing of capital purchases, including for increased greenfield site builds and incremental capital expenditures following the UScellular acquisition
Sequential
Cash purchases of property and equipment, including capitalized interest, decreased 6% primarily due to:
■Planned timing of capital purchases
Year-Over-Year
Adjusted Free Cash Flow increased 2% primarily due to:
■Higher Net cash provided by operating activities
■Partially offset by the impact of certain cash proceeds associated with the sale of receivables, which were recognized within investing cash flows before November 1, 2024, and are now recognized as operating cash flows, and higher Cash purchases of property and equipment. The change to the recognition of cash proceeds from the sale of receivables had no net impact to Adjusted Free Cash Flow.
All cash proceeds from the sale of receivables are now recognized within Net cash provided by operating activities. There were no significant net cash impacts during the quarter from securitization.
Sequential
Adjusted Free Cash Flow decreased 13% primarily due to:
■Lower Net cash provided by operating activities
■Partially offset by lower Cash purchases of property and equipment
The impact of net payments for Merger-related costs on Adjusted Free Cash Flow was $100 million in Q4 2025 compared to $96 million in Q3 2025 and $123 million in Q4 2024
Adjusted Free Cash Flow
($ in millions)
13
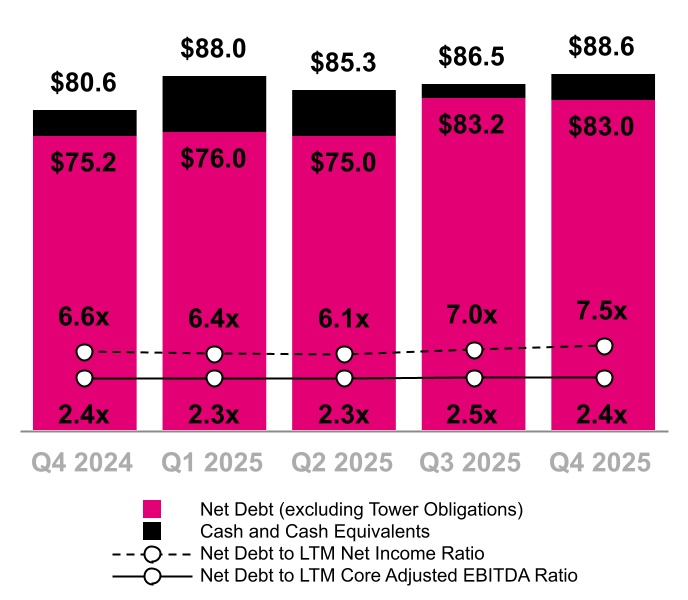
Total Debt (Excluding Tower Obligations),
Net Debt (Excluding Tower Obligations), and
Net Debt to LTM Net Income and Core Adj. EBITDA Ratios
($ in billions)
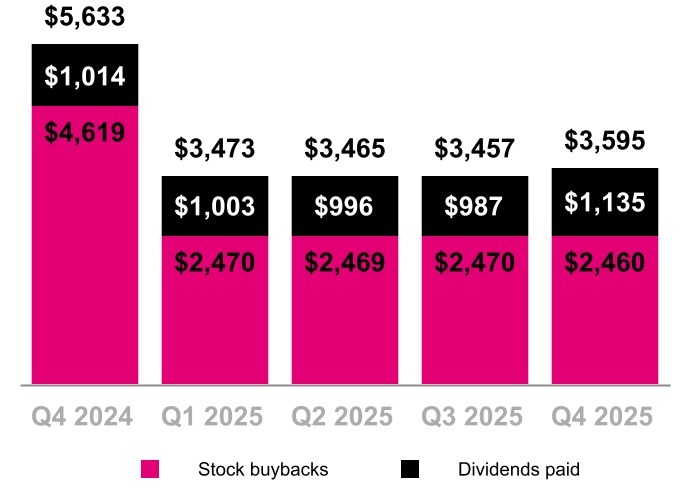
Stockholder Returns
($ in millions)
Total debt, excluding tower obligations, at the end of Q4 2025 was $88.6 billion.
Net debt, excluding tower obligations, at the end of Q4 2025 was $83.0 billion.
■On a cumulative basis, since the company initiated its stockholder return program in Q3 2022, a total of $45.4 billion has been returned to stockholders as of December 31, 2025, with 216.0 million shares repurchased for $37.2 billion, and cumulative cash dividends of $8.2 billion.
■During Q4 2025, 11.9 million shares were repurchased for $2.5 billion.
■During Q4 2025, the company paid a cash dividend of $1.02 per share of common stock, or $1.1 billion, on December 11, 2025.
■On December 11, 2025 the Board of Directors announced a stockholder return program for up to $14.6 billion that will run through December 31, 2026, consisting of additional repurchases of shares and payment of cash dividends, with the next dividend payable on March 12, 2026.
14
2026 Outlook
Postpaid net account additions
900 thousand to
1.0 million
Net income (1)
N/A
Effective tax rate
25% to 26%
Core Adjusted EBITDA (2)
$37.0 to $37.5 billion
Net cash provided by operating activities
$28.0 to $28.7 billion
Capital expenditures (3)
~$10.0 billion
Adjusted Free Cash Flow
$18.0 to $18.7 billion
(1)We are not able to forecast Net income on a forward-looking basis without unreasonable efforts due to the high variability and difficulty in predicting certain items that affect GAAP Net income, including, but not limited to, Special Items, Income tax expense and Interest expense. Core Adjusted EBITDA should not be used to predict Net income as the difference between this measure and Net income is variable.
(2)Management uses Core Adjusted EBITDA as a measure to monitor the financial performance of our operations, excluding the impact of lease revenues from our related device financing programs.
(3)Capital expenditures means cash purchases of property and equipment, including capitalized interest.
15
Investor Relations
Cathy Yao
Matthew Hale
Jon Lanterman
Senior Vice President
Senior Director
Senior Director
Investor Relations
Investor Relations
Investor Relations
Chris Lo
Rose Kopecky
Charles Buffum
Danna Tao
Investor Relations
Investor Relations
Investor Relations
Investor Relations
Manager
Manager
Manager
Manager
investor.relations@t-mobile.com
https://investor.t-mobile.com
16
T-Mobile US, Inc.
Consolidated Balance Sheets
(Unaudited)
(in millions, except share and per share amounts)
December 31, 2025
December 31, 2024
Assets
Current assets
Cash and cash equivalents
$
5,598
$
5,409
Accounts receivable, net of allowance for credit losses of $226 and $176
4,874
4,276
Equipment installment plan receivables, net of allowance for credit losses and imputed discount of $733 and $656
4,997
4,379
Inventory
2,405
1,607
Prepaid expenses
1,215
880
Other current assets
5,372
1,853
Total current assets
24,461
18,404
Property and equipment, net
38,333
38,533
Operating lease right-of-use assets
25,692
25,398
Financing lease right-of-use assets
2,760
3,091
Goodwill
13,678
13,005
Spectrum licenses
98,032
100,558
Other intangible assets, net
3,843
2,512
Equipment installment plan receivables due after one year, net of allowance for credit losses and imputed discount of $213 and $158
2,683
2,209
Other assets
9,755
4,325
Total assets
$
219,237
$
208,035
Liabilities and Stockholders' Equity
Current liabilities
Accounts payable and accrued liabilities
$
10,280
$
8,463
Short-term debt
5,135
4,068
Deferred revenue
1,533
1,222
Short-term operating lease liabilities
3,814
3,281
Short-term financing lease liabilities
1,163
1,175
Other current liabilities
2,575
1,965
Total current liabilities
24,500
20,174
Long-term debt
79,649
72,700
Long-term debt to affiliates
1,498
1,497
Tower obligations
3,532
3,664
Deferred tax liabilities
19,583
16,700
Operating lease liabilities
26,371
26,408
Financing lease liabilities
1,107
1,151
Other long-term liabilities
3,794
4,000
Total long-term liabilities
135,534
126,120
Commitments and contingencies
Stockholders' equity
Common stock, par value $0.00001 per share, 2,000,000,000 shares authorized; 1,275,774,235 and 1,271,074,364 shares issued, 1,106,930,661 and 1,144,579,681 shares outstanding
—
—
Additional paid-in capital
69,460
68,798
Treasury stock, at cost, 168,843,574 and 126,494,683 shares issued
(30,545)
(20,584)
Accumulated other comprehensive loss
(848)
(857)
Retained earnings
21,136
14,384
Total stockholders' equity
59,203
61,741
Total liabilities and stockholders' equity
$
219,237
$
208,035
17
T-Mobile US, Inc.
Consolidated Statements of Comprehensive Income
(Unaudited)
Three Months Ended
Year Ended December 31,
(in millions, except share and per share amounts)
December 31, 2025
September 30, 2025
December 31, 2024
2025
2024
Revenues
Postpaid revenues
$
15,378
$
14,882
$
13,502
$
57,932
$
52,340
Prepaid revenues
2,586
2,625
2,688
10,497
10,399
Wholesale and other service revenues
738
734
738
2,877
3,439
Total service revenues
18,702
18,241
16,928
71,306
66,178
Equipment revenues
5,364
3,465
4,699
15,972
14,263
Other revenues
268
251
245
1,031
959
Total revenues
24,334
21,957
21,872
88,309
81,400
Operating expenses
Cost of services, exclusive of depreciation and amortization shown separately below
3,305
2,873
2,697
11,497
10,771
Cost of equipment sales, exclusive of depreciation and amortization shown separately below
6,967
4,853
6,088
21,277
18,882
Selling, general and administrative
6,570
6,015
5,352
23,470
20,818
Impairment expense
—
278
—
278
—
Depreciation and amortization
3,756
3,408
3,149
13,508
12,919
Total operating expenses
20,598
17,427
17,286
70,030
63,390
Operating income
3,736
4,530
4,586
18,279
18,010
Other expense, net
Interest expense, net
(1,012)
(924)
(841)
(3,774)
(3,411)
Other (expense) income, net
(89)
(78)
94
(224)
113
Total other expense, net
(1,101)
(1,002)
(747)
(3,998)
(3,298)
Income before income taxes
2,635
3,528
3,839
14,281
14,712
Income tax expense
(532)
(814)
(858)
(3,289)
(3,373)
Net income
$
2,103
$
2,714
$
2,981
$
10,992
$
11,339
Net income
$
2,103
$
2,714
$
2,981
$
10,992
$
11,339
Other comprehensive income, net of tax
Reclassification of loss from cash flow hedges, net of tax effect of $17, $16, $15, $65 and $60
49
48
46
190
176
(Losses) gains on fair value hedges, net of tax effect of $(9), $(7), $20, $(64) and $5
(27)
(20)
58
(187)
16
Unrealized loss on foreign currency translation adjustment, net of tax effect of $0, $0, $0, $0 and $0
—
—
—
(1)
—
Actuarial gain (loss), net of amortization and reclassification, on pension and other postretirement benefits, net of tax effect of $3, $0, $(24), $2 and $(29)
11
(1)
(72)
7
(85)
Other comprehensive income
33
27
32
9
107
Total comprehensive income
$
2,136
$
2,741
$
3,013
$
11,001
$
11,446
Earnings per share
Basic
$
1.89
$
2.42
$
2.58
$
9.75
$
9.70
Diluted
$
1.88
$
2.41
$
2.57
$
9.72
$
9.66
Weighted-average shares outstanding
Basic
1,115,209,714
1,123,754,096
1,154,679,440
1,127,984,348
1,169,195,373
Diluted
1,117,388,934
1,126,627,708
1,159,095,696
1,131,076,251
1,173,213,898
18
T-Mobile US, Inc.
Consolidated Statements of Cash Flows
(Unaudited)
Three Months Ended
Year Ended December 31,
(in millions)
December 31, 2025
September 30, 2025
December 31, 2024
2025
2024
Operating activities
Net income
$
2,103
$
2,714
$
2,981
$
10,992
$
11,339
Adjustments to reconcile net income to net cash provided by operating activities
Depreciation and amortization
3,756
3,408
3,149
13,508
12,919
Stock-based compensation expense
216
227
175
829
649
Deferred income tax expense
359
797
841
2,864
3,120
Bad debt expense
445
337
356
1,370
1,192
Losses (gains) from sales of receivables
—
17
(7)
58
62
Impairment expense
—
278
—
278
—
Changes in operating assets and liabilities
Accounts receivable
42
(366)
(652)
(755)
(3,088)
Equipment installment plan receivables
(1,010)
44
(883)
(877)
(523)
Inventory
(24)
(537)
188
(615)
131
Operating lease right-of-use assets
968
929
875
3,635
3,480
Other current and long-term assets
(505)
(322)
(136)
(1,488)
(411)
Accounts payable and accrued liabilities
813
890
(180)
1,542
(2,041)
Short- and long-term operating lease liabilities
(737)
(936)
(909)
(3,457)
(3,879)
Other current and long-term liabilities
30
(239)
(21)
(379)
(678)
Other, net
198
216
(228)
445
21
Net cash provided by operating activities
6,654
7,457
5,549
27,950
22,293
Investing activities
Purchases of property and equipment, including capitalized interest of $(10), $(13), $(8), $(43) and $(34)
(2,469)
(2,639)
(2,212)
(9,955)
(8,840)
Purchases of spectrum licenses and other intangible assets, including deposits
(63)
(1,590)
(835)
(2,568)
(3,471)
Proceeds from the sale of property, equipment and intangible assets
77
18
61
2,168
99
Proceeds related to beneficial interests in securitization transactions
—
—
747
—
3,579
Acquisition of companies, net of cash acquired
—
(2,797)
17
(3,523)
(373)
Investments in unconsolidated affiliates, net
(1)
(3,072)
(18)
(4,056)
(18)
Other, net
(44)
(59)
(60)
327
(48)
Net cash used in investing activities
(2,500)
(10,139)
(2,300)
(17,607)
(9,072)
Financing activities
Proceeds from issuance of long-term debt, net
3,744
498
498
12,010
8,587
Repayments of financing lease obligations
(288)
(318)
(342)
(1,252)
(1,367)
Repayments of long-term debt
(1,635)
(828)
(1,904)
(6,199)
(5,073)
Repurchases of common stock
(2,446)
(2,479)
(4,687)
(9,974)
(11,228)
Dividends on common stock
(1,135)
(987)
(1,014)
(4,121)
(3,300)
Tax withholdings on share-based awards
(40)
(92)
(25)
(434)
(269)
Other, net
(31)
(32)
(48)
(111)
(165)
Net cash used in financing activities
(1,831)
(4,238)
(7,522)
(10,081)
(12,815)
Effect of exchange rate changes on cash and cash equivalents, including restricted cash
(12)
—
—
1
—
Change in cash and cash equivalents, including restricted cash
2,311
(6,920)
(4,273)
263
406
Cash and cash equivalents, including restricted cash
Beginning of period
3,665
10,585
9,986
5,713
5,307
End of period
$
5,976
$
3,665
$
5,713
$
5,976
$
5,713
19
T-Mobile US, Inc.
Consolidated Statements of Cash Flows (Continued)
(Unaudited)
Three Months Ended
Year Ended December 31,
(in millions)
December 31, 2025
September 30, 2025
December 31, 2024
2025
2024
Supplemental disclosure of cash flow information
Interest payments, net of amounts capitalized
$
959
$
997
$
905
$
3,882
$
3,683
Operating lease payments
1,079
1,269
1,234
4,764
5,162
Income tax payments, net of refunds received
36
63
44
451
179
Non-cash investing and financing activities
Non-cash beneficial interest obtained in exchange for securitized receivables
$
—
$
—
$
138
$
—
$
2,421
Change in accounts payable and accrued liabilities for purchases of property and equipment
231
136
1,190
(227)
105
Operating lease right-of-use assets obtained in exchange for lease obligations
590
1,064
441
2,728
1,741
Financing lease right-of-use assets obtained in exchange for lease obligations
230
324
239
1,232
1,222
Deferred consideration related to the Ka’ena Acquisition
—
—
8
—
218
Debt assumed in the UScellular Acquisition
—
1,653
—
1,653
—
20
T-Mobile US, Inc.
Supplementary Operating and Financial Data
(Unaudited)
Quarter
Year Ended December 31,
(in thousands)
Q1 2024
Q2 2024
Q3 2024
Q4 2024
Q1 2025
Q2 2025
Q3 2025
Q4 2025
2024
2025
Customers, end of period
Postpaid phone customers (1)
76,468
77,245
78,110
79,013
79,508
80,338
84,632
85,594
79,013
85,594
Postpaid other customers (1) (2) (3)
22,804
23,365
24,075
25,105
25,947
26,946
29,431
30,851
25,105
30,851
Total postpaid customers
99,272
100,610
102,185
104,118
105,455
107,284
114,063
116,445
104,118
116,445
Prepaid customers (1) (4)
21,600
25,283
25,307
25,410
25,455
25,494
25,886
25,943
25,410
25,943
Total customers
120,872
125,893
127,492
129,528
130,910
132,778
139,949
142,388
129,528
142,388
Adjustments to customers (1) (2) (3) (4)
—
3,504
—
—
—
97
4,781
—
3,504
4,878
(1)In the third quarter of 2025, we acquired 3,287,000 postpaid phone customers, 390,000 postpaid other customers and 349,000 prepaid customers through the UScellular acquisition, which includes the impact of certain base adjustments to align the policies of UScellular and T-Mobile.
(2)In the third quarter of 2025, we acquired 755,000 fiber customers from Metronet and other acquisitions.
(3)In the second quarter of 2025, we acquired 97,000 fiber customers from Lumos.
(4)In the second quarter of 2024, we acquired 3,504,000 prepaid customers through the Ka’ena acquisition, which includes the impact of certain base adjustments to align the policies of Ka’ena and T-Mobile.
Quarter
Year Ended December 31,
(in thousands)
Q1 2024
Q2 2024
Q3 2024
Q4 2024
Q1 2025
Q2 2025
Q3 2025
Q4 2025
2024
2025
Net customer additions (losses)
Postpaid phone customers
532
777
865
903
495
830
1,007
962
3,077
3,294
Postpaid other customers
688
561
710
1,030
842
902
1,340
1,420
2,989
4,504
Total postpaid customers
1,220
1,338
1,575
1,933
1,337
1,732
2,347
2,382
6,066
7,798
Prepaid customers
(48)
179
24
103
45
39
43
57
258
184
Total net customer additions
1,172
1,517
1,599
2,036
1,382
1,771
2,390
2,439
6,324
7,982
Migrations from prepaid to postpaid plans
145
140
175
160
115
205
215
185
620
720
Quarter
Year Ended December 31,
Q1 2024
Q2 2024
Q3 2024
Q4 2024
Q1 2025
Q2 2025
Q3 2025
Q4 2025
2024
2025
Churn
Postpaid phone churn
0.86
%
0.80
%
0.86
%
0.92
%
0.91
%
0.90
%
0.89
%
1.02
%
0.86
%
0.93
%
Prepaid churn
2.75
%
2.54
%
2.78
%
2.85
%
2.68
%
2.65
%
2.77
%
2.76
%
2.73
%
2.72
%
Quarter
Year Ended December 31,
Q1 2024
Q2 2024
Q3 2024
Q4 2024
Q1 2025
Q2 2025
Q3 2025
Q4 2025
2024
2025
Postpaid upgrade rate
Postpaid device upgrade rate
2.4
%
2.3
%
2.6
%
3.6
%
2.8
%
2.5
%
2.7
%
3.8
%
11.1
%
11.8
%
21
T-Mobile US, Inc.
Supplementary Operating and Financial Data (Continued)
(Unaudited)
Quarter
Year Ended December 31,
(in thousands)
Q1 2024
Q2 2024
Q3 2024
Q4 2024
Q1 2025
Q2 2025
Q3 2025
Q4 2025
2024
2025
Accounts, end of period
Total postpaid accounts (1) (2) (3)
30,015
30,316
30,631
30,894
31,099
31,502
33,979
34,240
30,894
34,240
(1)In the second quarter of 2025, we acquired 85,000 postpaid accounts from Lumos.
(2)In the third quarter of 2025, we acquired 633,000 postpaid accounts from Metronet and other acquisitions.
(3)In the third quarter of 2025, we acquired 1,448,000 postpaid accounts through the UScellular acquisition, which includes the impact of certain base adjustments to align the policies of UScellular and T-Mobile.
Quarter
Year Ended December 31,
(in thousands)
Q1 2024
Q2 2024
Q3 2024
Q4 2024
Q1 2025
Q2 2025
Q3 2025
Q4 2025
2024
2025
Net account additions
Postpaid net account additions
218
301
315
263
205
318
396
261
1,097
1,180
Quarter
Year Ended December 31,
(in thousands)
Q1 2024
Q2 2024
Q3 2024
Q4 2024
Q1 2025
Q2 2025
Q3 2025
Q4 2025
2024
2025
Broadband customers, end of period
Postpaid 5G broadband customers (1)
4,634
4,992
5,377
5,742
6,129
6,556
7,163
7,602
5,742
7,602
Prepaid 5G broadband customers
547
595
625
688
725
752
792
848
688
848
Total 5G broadband customers, end of period
5,181
5,587
6,002
6,430
6,854
7,308
7,955
8,450
6,430
8,450
Fiber customers (2) (3)
1
2
5
9
12
125
934
997
9
997
Total broadband customers, end of period
5,182
5,589
6,007
6,439
6,866
7,433
8,889
9,447
6,439
9,447
Adjustments to customers (1) (2) (3)
—
—
—
—
—
97
896
—
—
993
(1)In the third quarter of 2025, we acquired 141,000 postpaid 5G broadband customers through the UScellular acquisition, which includes the impact of certain base adjustments to align the policies of UScellular and T-Mobile.
(2)In the third quarter of 2025, we acquired 755,000 fiber customers from Metronet and other acquisitions.
(3)In the second quarter of 2025, we acquired 97,000 fiber customers from Lumos.
Quarter
Year Ended December 31,
(in thousands)
Q1 2024
Q2 2024
Q3 2024
Q4 2024
Q1 2025
Q2 2025
Q3 2025
Q4 2025
2024
2025
Broadband - net customer additions
Postpaid 5G broadband customers
346
358
385
365
387
427
466
439
1,454
1,719
Prepaid 5G broadband customers
59
48
30
63
37
27
40
56
200
160
Total 5G broadband net customer additions
405
406
415
428
424
454
506
495
1,654
1,879
Fiber customers
—
1
3
4
3
16
54
63
8
136
Total broadband net customer additions
405
407
418
432
427
470
560
558
1,662
2,015
22
T-Mobile US, Inc.
Supplementary Operating and Financial Data (Continued)
(Unaudited)
Quarter
Year Ended December 31,
(in millions)
Q1 2024
Q2 2024
Q3 2024
Q4 2024
Q1 2025
Q2 2025
Q3 2025
Q4 2025
2024
2025
Device financing - equipment installment plans
Gross EIP financed
$
3,218
$
3,037
$
3,304
$
4,689
$
3,565
$
3,503
$
3,871
$
5,774
$
14,248
$
16,713
EIP billings
3,880
3,604
3,423
3,509
3,551
3,553
3,766
4,066
14,416
14,936
EIP receivables, net
5,967
5,556
5,347
6,588
6,405
6,201
6,915
7,680
6,588
7,680
Device financing - leased devices
Lease revenues
$
35
$
26
$
21
$
11
$
1
$
6
$
4
$
2
$
93
$
13
Leased device depreciation
22
15
11
6
4
1
—
—
54
5
Quarter
Year Ended December 31,
(in dollars)
Q1 2024
Q2 2024
Q3 2024
Q4 2024
Q1 2025
Q2 2025
Q3 2025
Q4 2025
2024
2025
Operating measures
Postpaid ARPA
$
140.88
$
142.54
$
145.60
$
146.28
$
146.22
$
149.87
$
149.44
$
150.17
$
143.85
$
148.97
Postpaid phone ARPU
48.79
49.07
49.79
49.73
49.38
50.62
50.71
50.71
49.35
50.37
Prepaid ARPU
37.18
35.94
35.81
35.49
34.67
34.63
33.93
33.33
36.06
34.14
23
T-Mobile US, Inc.
Supplementary Operating and Financial Data (continued)
(Unaudited)
Quarter
Year Ended December 31,
(in millions, except percentages)
Q1 2024
Q2 2024
Q3 2024
Q4 2024
Q1 2025
Q2 2025
Q3 2025
Q4 2025
2024
2025
Financial measures
Service revenues
$
16,096
$
16,429
$
16,725
$
16,928
$
16,925
$
17,438
$
18,241
$
18,702
$
66,178
$
71,306
Equipment revenues
$
3,251
$
3,106
$
3,207
$
4,699
$
3,704
$
3,439
$
3,465
$
5,364
$
14,263
$
15,972
Lease revenues
35
26
21
11
1
6
4
2
93
13
Equipment sales
$
3,216
$
3,080
$
3,186
$
4,688
$
3,703
$
3,433
$
3,461
$
5,362
$
14,170
$
15,959
Total revenues
$
19,594
$
19,772
$
20,162
$
21,872
$
20,886
$
21,132
$
21,957
$
24,334
$
81,400
$
88,309
Net income
$
2,374
$
2,925
$
3,059
$
2,981
$
2,953
$
3,222
$
2,714
$
2,103
$
11,339
$
10,992
Net income margin
14.7
%
17.8
%
18.3
%
17.6
%
17.4
%
18.5
%
14.9
%
11.2
%
17.1
%
15.4
%
Adjusted EBITDA
$
7,652
$
8,053
$
8,243
$
7,916
$
8,259
$
8,547
$
8,684
$
8,447
$
31,864
$
33,937
Adjusted EBITDA margin
47.5
%
49.0
%
49.3
%
46.8
%
48.8
%
49.0
%
47.6
%
45.2
%
48.1
%
47.6
%
Core Adjusted EBITDA
$
7,617
$
8,027
$
8,222
$
7,905
$
8,258
$
8,541
$
8,680
$
8,445
$
31,771
$
33,924
Core Adjusted EBITDA margin
47.3
%
48.9
%
49.2
%
46.7
%
48.8
%
49.0
%
47.6
%
45.2
%
48.0
%
47.6
%
Cost of services, exclusive of depreciation and amortization
$
2,688
$
2,664
$
2,722
$
2,697
$
2,602
$
2,717
$
2,873
$
3,305
$
10,771
$
11,497
Merger-related costs
107
73
—
—
—
—
7
24
180
31
Other Special Items
1
—
67
75
20
28
55
250
143
353
Cost of services, excluding depreciation and amortization and Special Items
$
2,580
$
2,591
$
2,655
$
2,622
$
2,582
$
2,689
$
2,811
$
3,031
$
10,448
$
11,113
Cost of equipment sales, exclusive of depreciation and amortization
$
4,399
$
4,088
$
4,307
$
6,088
$
4,798
$
4,659
$
4,853
$
6,967
$
18,882
$
21,277
Merger-related costs
$
—
—
—
—
—
—
2
8
—
10
Cost of equipment sales, exclusive of depreciation and amortization and Special Items
$
4,399
$
4,088
$
4,307
$
6,088
$
4,798
$
4,659
$
4,851
$
6,959
$
18,882
$
21,267
Selling, general and administrative
$
5,138
$
5,142
$
5,186
$
5,352
$
5,488
$
5,397
$
6,015
$
6,570
$
20,818
$
23,470
Merger-related costs (gain), net
23
(82)
16
10
14
33
64
111
(33)
222
Other Special Items
12
37
70
(60)
59
(51)
123
353
59
484
Selling, general and administrative, excluding Special Items
$
5,103
$
5,187
$
5,100
$
5,402
$
5,415
$
5,415
$
5,828
$
6,106
$
20,792
$
22,764
Total bad debt expense and losses from sales of receivables
$
303
$
280
$
322
$
349
$
345
$
284
$
354
$
445
$
1,254
$
1,428
Bad debt and losses from sales of receivables as a percentage of Total revenues
1.5
%
1.4
%
1.6
%
1.6
%
1.7
%
1.3
%
1.6
%
1.8
%
1.5
%
1.6
%
Cash purchases of property and equipment including capitalized interest
$
2,627
$
2,040
$
1,961
$
2,212
$
2,451
$
2,396
$
2,639
$
2,469
$
8,840
$
9,955
Capitalized interest
9
8
9
8
10
10
13
10
34
43
Net cash proceeds from securitization
$
(29)
$
(30)
$
(29)
$
(27)
$
(26)
$
(23)
$
(25)
$
(22)
$
(115)
$
(96)
Net cash payments for Merger-related costs
$
293
$
241
$
132
$
123
$
70
$
92
$
96
$
100
$
789
$
358
24
T-Mobile US, Inc.
Supplementary Operating and Financial Data (Continued)
(Unaudited)
Quarter
Year Ended December 31,
(in millions, except share and per share amounts)
Q1 2024
Q2 2024
Q3 2024
Q4 2024
Q1 2025
Q2 2025
Q3 2025
Q4 2025
2024
2025
Stockholder returns
Total repurchases
$
3,568
$
2,277
$
644
$
4,619
$
2,470
$
2,469
$
2,470
$
2,460
$
11,108
$
9,869
Total shares repurchased
21,933,790
13,979,843
3,179,707
20,283,582
10,091,227
10,148,791
10,204,072
11,919,136
59,376,922
42,363,226
Average purchase price per share
$
162.69
$
162.85
$
202.45
$
227.72
$
244.77
$
243.32
$
242.01
$
206.38
$
187.07
$
232.96
Total dividends paid
$
769
$
759
$
758
$
1,014
$
1,003
$
996
$
987
$
1,135
$
3,300
$
4,121
Dividends per share
$
0.65
$
0.65
$
0.65
$
0.88
$
0.88
$
0.88
$
0.88
$
1.02
$
2.83
$
3.66
Total stockholder returns
$
4,337
$
3,036
$
1,402
$
5,633
$
3,473
$
3,465
$
3,457
$
3,595
$
14,408
$
13,990
Cumulative total repurchases
$
19,775
$
22,052
$
22,696
$
27,315
$
29,785
$
32,254
$
34,724
$
37,184
$
27,315
$
37,184
Cumulative shares repurchased
136,220,243
150,200,086
153,379,793
173,663,375
183,754,602
193,903,393
204,107,465
216,026,601
173,663,375
216,026,601
Cumulative stockholder returns
$
21,291
$
24,327
$
25,729
$
31,362
$
34,835
$
38,300
$
41,757
$
45,352
$
31,362
$
45,352
25
T-Mobile US, Inc.
Reconciliation of Non-GAAP Financial Measures to GAAP Financial Measures
(Unaudited)
This Investor Factbook includes non-GAAP financial measures, including Adjusted EBITDA, Core Adjusted EBITDA, Net Debt, Adjusted Free Cash Flow and Adjusted Free Cash Flow margin. The non-GAAP financial measures should be considered in addition to, but not as a substitute for, the information provided in accordance with GAAP. Reconciliations for the non-GAAP financial measures to the most directly comparable GAAP financial measures are provided below. T-Mobile is not able to forecast Net income on a forward-looking basis without unreasonable efforts due to the high variability and difficulty in predicting certain items that affect GAAP net income, including, but not limited to, Special Items, Income tax expense and Interest expense. Adjusted EBITDA and Core Adjusted EBITDA should not be used to predict Net income, as the difference between either of these measures and Net income is variable.
Adjusted EBITDA and Core Adjusted EBITDA are reconciled to Net income as follows:
Quarter
Year Ended December 31,
(in millions, except percentages)
Q1 2024
Q2 2024
Q3 2024
Q4 2024
Q1 2025
Q2 2025
Q3 2025
Q4 2025
2024
2025
Net income
$
2,374
$
2,925
$
3,059
$
2,981
$
2,953
$
3,222
$
2,714
$
2,103
$
11,339
$
10,992
Adjustments:
Interest expense, net
880
854
836
841
916
922
924
1,012
3,411
3,774
Other (income) expense, net
(20)
8
(7)
(94)
46
11
78
89
(113)
224
Income tax expense
764
843
908
858
885
1,058
814
532
3,373
3,289
Operating income
3,998
4,630
4,796
4,586
4,800
5,213
4,530
3,736
18,010
18,279
Depreciation and amortization
3,371
3,248
3,151
3,149
3,198
3,146
3,408
3,756
12,919
13,508
Stock-based compensation (1)
140
147
143
156
168
178
217
209
586
772
Merger-related costs (gain), net (2)
130
(9)
16
10
14
33
73
143
147
263
Network restructuring initiative
costs (3)
—
—
—
—
—
—
—
93
—
93
Legal-related expenses (recoveries), net (4)
—
15
1
(105)
6
(4)
8
6
(89)
16
Impairment expense
—
—
—
—
—
—
278
—
—
278
Other, net (5)
13
22
136
120
73
(19)
170
504
291
728
Adjusted EBITDA
7,652
8,053
8,243
7,916
8,259
8,547
8,684
8,447
31,864
33,937
Lease revenues
(35)
(26)
(21)
(11)
(1)
(6)
(4)
(2)
(93)
(13)
Core Adjusted EBITDA
$
7,617
$
8,027
$
8,222
$
7,905
$
8,258
$
8,541
$
8,680
$
8,445
$
31,771
$
33,924
Net income margin (Net income divided by Service revenues)
14.7
%
17.8
%
18.3
%
17.6
%
17.4
%
18.5
%
14.9
%
11.2
%
17.1
%
15.4
%
Adjusted EBITDA margin (Adjusted EBITDA divided by Service revenues)
47.5
%
49.0
%
49.3
%
46.8
%
48.8
%
49.0
%
47.6
%
45.2
%
48.1
%
47.6
%
Core Adjusted EBITDA margin (Core Adjusted EBITDA divided by Service revenues)
47.3
%
48.9
%
49.2
%
46.7
%
48.8
%
49.0
%
47.6
%
45.2
%
48.0
%
47.6
%
(1)Stock-based compensation includes payroll tax impacts and may not agree to stock-based compensation expense on the Consolidated Financial Statements. Additionally, certain stock-based compensation expenses associated with the Sprint merger have been included in Merger-related costs (gain), net.
(2)Merger-related costs (gain), net, for the three months ended June 30, 2024 and the year ended December 31, 2024, includes the $100 million gain recognized for the extension fee previously paid by DISH associated with the license purchase agreement for 800 MHz spectrum licenses, which was not purchased.
(3)In Q4 2025, we began implementing network restructuring initiatives as a result of recent technological advancements that enhanced our Customer-Driven Coverage insights. Network restructuring initiative costs consist of network decommissioning and contract termination costs related to the rationalization of our network and backhaul services and the elimination of duplicative costs.
(4)Legal-related expenses (recoveries), net, consists of the settlement of certain litigation and compliance costs associated with the August 2021 cyberattack and is presented net of insurance recoveries.
(5)Other, net, primarily consists of certain severance, restructuring and other expenses, gains and losses, not directly attributable to the Sprint merger or UScellular acquisition, which are not reflective of T-Mobile’s ongoing core business activities and are, therefore, excluded from Adjusted EBITDA and Core Adjusted EBITDA. Other, net, for the three months ended and year ended December 31, 2025, includes $390 million of severance and related costs associated with the 2025 workforce transformation.
26
T-Mobile US, Inc.
Reconciliation of Non-GAAP Financial Measures to GAAP Financial Measures (continued)
(Unaudited)
Net debt (excluding tower obligations) to the LTM Net income, LTM Adjusted EBITDA and LTM Core Adjusted EBITDA ratios are calculated as follows:
(in millions, except net debt ratios)
Mar 31, 2024
Jun 30, 2024
Sep 30, 2024
Dec 31, 2024
Mar 31, 2025
Jun 30, 2025
Sep 30, 2025
Dec 31, 2025
Short-term debt
$
5,356
$
5,867
$
5,851
$
4,068
$
8,214
$
6,408
$
6,333
$
5,135
Short-term financing lease liabilities
1,265
1,252
1,252
1,175
1,136
1,157
1,157
1,163
Long-term debt
71,361
70,203
72,522
72,700
76,033
75,018
76,365
79,649
Long-term debt to affiliates
1,496
1,496
1,497
1,497
1,497
1,497
1,498
1,498
Financing lease liabilities
1,163
1,133
1,185
1,151
1,117
1,188
1,186
1,107
Total debt (excluding tower obligations)
$
80,641
$
79,951
$
82,307
$
80,591
$
87,997
$
85,268
$
86,539
$
88,552
Less: Cash and cash equivalents
(6,708)
(6,417)
(9,754)
(5,409)
(12,003)
(10,259)
(3,310)
(5,598)
Net debt (excluding tower obligations)
$
73,933
$
73,534
$
72,553
$
75,182
$
75,994
$
75,009
$
83,229
$
82,954
Divided by: Last twelve months Net income
$
8,751
$
9,455
$
10,372
$
11,339
$
11,918
$
12,215
$
11,870
$
10,992
Net debt (excluding tower obligations) to LTM Net income Ratio
8.4
7.8
7.0
6.6
6.4
6.1
7.0
7.5
Divided by: Last twelve months Adjusted EBITDA
$
29,881
$
30,529
$
31,172
$
31,864
$
32,471
$
32,965
$
33,406
$
33,937
Net debt (excluding tower obligations) to LTM Adjusted EBITDA Ratio
2.5
2.4
2.3
2.4
2.3
2.3
2.5
2.4
Divided by: Last twelve months Core Adjusted EBITDA
$
29,681
$
30,372
$
31,047
$
31,771
$
32,412
$
32,926
$
33,384
$
33,924
Net debt (excluding tower obligations) to LTM Core Adjusted EBITDA Ratio
2.5
2.4
2.3
2.4
2.3
2.3
2.5
2.4
Adjusted Free Cash Flow and Adjusted Free Cash Flow margin are calculated as follows:
Quarter
Year Ended December 31,
(in millions, except percentages)
Q1 2024
Q2 2024
Q3 2024
Q4 2024
Q1 2025
Q2 2025
Q3 2025
Q4 2025
2024
2025
Net cash provided by operating activities (1)
$
5,084
$
5,521
$
6,139
$
5,549
$
6,847
$
6,992
$
7,457
$
6,654
$
22,293
$
27,950
Cash purchases of property and equipment, including capitalized interest
(2,627)
(2,040)
(1,961)
(2,212)
(2,451)
(2,396)
(2,639)
(2,469)
(8,840)
(9,955)
Proceeds related to beneficial interests in securitization transactions (1)
890
958
984
747
—
—
—
—
3,579
—
Adjusted Free Cash Flow
$
3,347
$
4,439
$
5,162
$
4,084
$
4,396
$
4,596
$
4,818
$
4,185
$
17,032
$
17,995
Net cash provided by operating activities margin
31.6
%
33.6
%
36.7
%
32.8
%
40.5
%
40.1
%
40.9
%
35.6
%
33.7
%
39.2
%
Adjusted Free Cash Flow margin
20.8
%
27.0
%
30.9
%
24.1
%
26.0
%
26.4
%
26.4
%
22.4
%
25.7
%
25.2
%
(1)Effective November 1, 2024, following amendments to the company’s Equipment Installment Plan Sale and Service Receivable Sale arrangements, all cash proceeds associated with the sale of such receivables, a portion of which was previously recognized as Proceeds related to beneficial interests in securitization transactions within investing cash flows, were recognized as operating cash flows. These amendments did not have a net impact on Adjusted Free Cash Flow.
27
T-Mobile US, Inc.
Reconciliation of Non-GAAP Financial Measures to GAAP Financial Measures (continued)
(Unaudited)
The guidance range for Adjusted Free Cash Flow is calculated as follows:
FY 2026
(in millions)
Guidance Range
Net cash provided by operating activities
$
28,000
$
28,700
Cash purchases of property and equipment, including capitalized interest
(10,000)
(10,000)
Adjusted Free Cash Flow
$
18,000
$
18,700
28
Definitions of Terms
Operating and financial measures are utilized by T-Mobile’s management to evaluate its operating performance and, in certain cases, its ability to meet liquidity requirements. Although companies in the telecommunications industry may not define measures in precisely the same way, T-Mobile believes the measures facilitate key operating performance comparisons with other companies in the telecommunications industry to provide management, investors and analysts with useful information to assess and evaluate past performance and assist in forecasting future performance.
1.Account - A billing account number that generates revenue. Postpaid accounts generally consist of customers that are qualified for postpaid service utilizing phones, 5G broadband gateways, fiber connections, mobile internet devices, including tablets and hotspots, wearables, DIGITS or other connected devices, including SyncUP and IoT, where they generally pay after receiving service.
2.Customer - A SIM number with a unique T-Mobile identifier which is associated with an account that generates revenue. Customers are qualified either for postpaid service utilizing phones, 5G broadband gateways, fiber connections, mobile internet devices, including tablets and hotspots, wearables, DIGITS or other connected devices, including SyncUP and IoT, where they generally pay after receiving service, or prepaid service, where they generally pay in advance of receiving service.
3.Churn - The number of customers whose service was deactivated as a percentage of the average number of customers during the specified period further divided by the number of months in the period. The number of customers whose service was deactivated is presented net of customers that subsequently have their service restored within a certain period of time and excludes customers who received service for less than a certain minimum period of time.
4.Postpaid Average Revenue Per Account (“ARPA”) - Average monthly postpaid service revenue earned per account. Postpaid service revenues for the specified period divided by the average number of postpaid accounts during the period, further divided by the number of months in the period.
Average Revenue Per User (“ARPU”) - Average monthly service revenue earned per customer. Service revenues for the specified period divided by the average number of customers during the period, further divided by the number of months in the period.
Postpaid phone ARPU excludes postpaid other customers and related revenues.
Service revenues - Postpaid, including handset insurance, prepaid, wholesale and other service revenues.
5.Cost of services - Costs directly attributable to providing wireless communications and broadband services, including direct switch and cell site costs, such as rent, network access and transport costs, utilities, maintenance, associated labor costs, long distance costs, regulatory program costs, roaming fees paid to other carriers and data content costs.
Cost of equipment sales - Costs of devices and accessories sold to customers and dealers, device costs to fulfill insurance and warranty claims, write-downs of inventory related to shrinkage and obsolescence, and shipping and handling costs.
Selling, general and administrative expenses - Costs not directly attributable to providing wireless communications and broadband services for the operation of sales, customer care and corporate activities. These include all commissions paid to dealers and retail employees for activations and upgrades, labor and facilities costs associated with retail sales force and administrative space, marketing and promotional costs, customer support and billing, bad debt expense and administrative support activities.
6.Net income margin - Net income divided by Service revenues.
7.Adjusted EBITDA and Core Adjusted EBITDA - Adjusted EBITDA represents earnings before Interest expense, net of Interest income, Income tax expense, Depreciation and amortization, stock-based compensation and Special Items. Core Adjusted EBITDA represents Adjusted EBITDA less device lease revenues. Core Adjusted EBITDA and Adjusted EBITDA are non-GAAP financial measures utilized by T-Mobile’s management, including our chief operating decision maker, to monitor the financial performance of our operations and allocate resources of the Company as a whole. T-Mobile historically used Adjusted EBITDA and T-Mobile currently uses Core Adjusted EBITDA internally as a measure to evaluate and compensate its personnel and management for their performance. T-Mobile uses Adjusted EBITDA and Core Adjusted EBITDA as benchmarks to evaluate its operating performance in comparison to competitors. Management believes analysts and investors use Core Adjusted EBITDA and Adjusted EBITDA as supplemental measures to evaluate overall operating performance and to facilitate comparisons with other wireless communications and broadband services companies because they are indicative of T-Mobile’s ongoing operating performance and trends by excluding the impact of Interest expense from financing, non-cash depreciation and amortization from capital investments, non-cash stock-based compensation and Special Items. Management believes analysts and investors use Core Adjusted EBITDA because it normalizes for the transition in the company’s device financing strategy, by excluding the impact of device lease revenues from Adjusted EBITDA, to align with the related depreciation expense on leased devices, which is excluded from the definition of Adjusted EBITDA. Core Adjusted EBITDA and Adjusted EBITDA have limitations as analytical tools and should not be considered in isolation or as a substitute for Income from operations, Net income or any other measure of financial performance reported in accordance with U.S. Generally Accepted Accounting Principles (“GAAP”).
8.Special Items - Certain expenses, gains, and losses which are not reflective of our ongoing performance. Special Items include Merger-related costs (gain), net, network restructuring initiative costs (as discussed above), certain legal-related recoveries and expenses, Impairment expense, restructuring costs not directly attributable to the Sprint merger or UScellular acquisition (including severance), and other non-core gains and losses.
9.Adjusted EBITDA margin and Core Adjusted EBITDA margin - Adjusted EBITDA margin is calculated as Adjusted EBITDA divided by Service revenues. Core Adjusted EBITDA margin is calculated as Core Adjusted EBITDA divided by Service revenues. Adjusted EBITDA margin and Core Adjusted EBITDA margin are non-GAAP financial measures utilized by T-Mobile’s management, including our chief operating decision maker, to monitor the financial performance of our operations and allocate resources of the Company as a whole.
10.Net cash provided by operating activities margin - Net cash provided by operating activities margin is calculated as Net cash provided by operating activities divided by Service revenues.
11.Adjusted Free Cash Flow - Net cash provided by operating activities less cash payments for purchases of property and equipment, plus proceeds related to beneficial interests in securitization transactions. Adjusted Free Cash Flow is utilized by T-Mobile’s management, investors, and analysts of our financial information to evaluate cash available to pay debt, repurchase shares, pay dividends and provide further investment in the business.
29
12.Adjusted Free Cash Flow margin - Adjusted Free Cash Flow margin is calculated as Adjusted Free Cash Flow divided by Service revenues. Adjusted Free Cash Flow margin is utilized by T-Mobile’s management, investors, and analysts to evaluate the company’s ability to convert service revenue efficiently into cash available to pay debt, repurchase shares, pay dividends and provide further investment in the business.
13.Net debt - Short-term debt, short-term debt to affiliates, long-term debt (excluding tower obligations), and long-term debt to affiliates, short-term financing lease liabilities and financing lease liabilities, less cash and cash equivalents.
14.Merger-related costs include Sprint merger-related costs and UScellular merger-related costs.
15.Sprint merger-related costs include:
•Integration costs to achieve efficiencies in network, retail, information technology and back office operations, migrate customers to the T-Mobile network and billing systems and the impact of legal matters assumed as part of the Sprint merger;
•Restructuring costs, including severance, store rationalization and network decommissioning; and
•Transaction costs, including legal and professional services related to the completion of the Sprint merger and the acquisitions of affiliates.
16.UScellular merger-related costs to date include:
•Integration costs to achieve efficiencies in network, retail, information technology and back office operations and migrate customers to the T-Mobile network and billing systems;
•Restructuring costs, including contract terminations, severance and network decommissioning; and
•Transaction costs, including legal and professional services related to the completion of the UScellular acquisition.
This communication includes forward-looking statements within the meaning of the Private Securities Litigation Reform Act of 1995. All statements other than statements of historical fact, including information concerning T-Mobile US, Inc.’s future results of operations, are forward-looking statements. These forward-looking statements are generally identified by the words “anticipate,” “believe,” “estimate,” “expect,” “intend,” “may,” “could” or similar expressions. Forward-looking statements are based on current expectations and assumptions, which are subject to risks and uncertainties and may cause actual results to differ materially from the forward-looking statements. Important factors that could affect future results and cause those results to differ materially from those expressed in the forward-looking statements include, among others, the following: competition, industry consolidation and changes in the market for wireless communications services and other forms of connectivity; cyberattacks, disruptions, data loss or other security breaches; our inability to adopt and deploy network technologies in a timely and effective manner; our inability to effectively execute our digital transformation and drive customer and employee adoption of emerging technologies; our inability to retain or motivate key personnel, hire qualified personnel or maintain our corporate culture; system failures and business disruptions, allowing for unauthorized use of or interference with our network and other systems; the scarcity and cost of additional wireless spectrum, and regulations relating to spectrum use; the timing and effects of any pending and future acquisition, investment, joint venture, merger or divestiture involving us, including our inability to obtain any required regulatory approval necessary to consummate any such transactions or to achieve the expected benefits of such transactions; adverse economic, political or market conditions in the U.S. and international markets, including changes resulting from increases in inflation or interest rates, tariffs and trade restrictions, supply chain disruptions, fluctuations in global currencies, immigration policies, and impacts of geopolitical instability, such as the Ukraine-Russia and Israel-Hamas wars and further escalations thereof; potential operational delays, higher procurement and operational costs, and increased regulatory and compliance complexities as result of changes to trade policies, including higher tariffs, restrictions and other economic disincentives to trade; our inability to successfully deliver new products and services; any disruption or failure of our third parties (including key suppliers) to provide products or services for the operation of our business; sociopolitical volatility and polarization and risks related to environmental, social and governance matters; our substantial level of indebtedness and our inability to service our debt obligations in accordance with their terms; changes in the credit market conditions, credit rating downgrades or an inability to access debt markets; our inability to maintain effective internal control over financial reporting; compliance with the current regulatory framework, including our national security obligations, and any changes in regulations or in the regulatory framework under which we operate; laws and regulations relating to the handling of privacy, data protection and artificial intelligence; unfavorable outcomes of and increased costs from existing or future regulatory or legal proceedings; difficulties in protecting our intellectual property rights or if we infringe on the intellectual property rights of others; our offering of regulated financial services products and exposure to a wide variety of state and federal regulations; new or amended tax laws or regulations or administrative interpretations and judicial decisions affecting the scope or application of tax laws or regulations; our wireless licenses, including those controlled through leasing agreements, are subject to renewal and may be revoked; our exclusive forum provision as provided in our Certificate of Incorporation; interests of Deutsche Telekom AG (“DT”), our controlling stockholder, which may differ from the interests of other stockholders; our current and future stockholder return programs may not be fully utilized, and our share repurchases and dividend payments pursuant thereto may fail to have the desired impact on stockholder value; future sales of our common stock by DT and SoftBank Group Corp. and our inability to attract additional equity financing outside the United States due to foreign ownership limitations by the Federal Communications Commission; and other risks as disclosed in our most recent annual report on Form 10-K, and subsequent Forms 10-Q and other filings with the Securities and Exchange Commission. Given these risks and uncertainties, readers are cautioned not to place undue reliance on such forward-looking statements. We undertake no obligation to revise or publicly release the results of any revision to these forward-looking statements, except as required by law.
About T-Mobile US, Inc.
As the supercharged Un-carrier, T-Mobile US, Inc. (NASDAQ: TMUS) is powered by an award-winning 5G network that connects more people, in more places, than ever before. With T-Mobile’s unique value proposition of best network, best value and best experiences, the Un-carrier is redefining connectivity and fueling competition while continuing to drive the next wave of innovation in wireless and beyond. Headquartered in Bellevue, Wash., T-Mobile provides services through its subsidiaries and operates its flagship brands, T-Mobile, Metro by T-Mobile and Mint Mobile. For more information, visit https://www.t-mobile.com.