Kite Realty Group Trust | 30 South Meridian Street, Suite 1100 | Indianapolis, Indiana 46204 | 888.577.5600 | www.kiterealty.com
PRESS RELEASE
Contact Information: Kite Realty Group
Tyler Henshaw
SVP, Capital Markets & Investor Relations
317.713.7780
thenshaw@kiterealty.com
Kite Realty Group Reports Third Quarter 2025 Operating Results
Indianapolis, Indiana, October 29, 2025 – Kite Realty Group (NYSE: KRG), a premier owner and operator of high-quality, open-air grocery-anchored centers and vibrant mixed-use assets, reported today its operating results for the third quarter ended September 30, 2025. For the quarters ended September 30, 2025 and 2024, net loss attributable to common shareholders was $16.2 million, or $0.07 per diluted share, compared to net income of $16.7 million, or $0.08 per diluted share, respectively. For the nine months ended September 30, 2025 and 2024, net income attributable to common shareholders was $117.8 million, or $0.54 per diluted share, compared to a net loss of $17.8 million, or $0.08 per diluted share, respectively.
Company raises 2025 guidance
Leased over 1.2 million square feet at 12.2% comparable blended cash leasing spreads
Repurchased 3.4 million shares of common stock for $74.9 million at an average price of $22.35
Board of Trustees raises quarterly dividend on common shares by 7.4% on a year-over-year basis
“Momentum is building across every part of our operating platform,” said John A. Kite, Chairman and Chief Executive Officer. “We are raising both our full-year FFO per share guidance and same property NOI assumption. Leasing demand remains exceptional, with 1.2 million square feet executed during the quarter and solid sequential gains in our leased rate. We are channeling that momentum into long-term value creation — driving higher embedded rent bumps, backfilling space with well-capitalized tenants, and continuing to optimize the portfolio.”
Third Quarter 2025 Financial and Operational Results
▪Generated NAREIT FFO of the Operating Partnership of $118.8 million, or $0.53 per diluted share.
▪Generated Core FFO of the Operating Partnership of $116.3 million, or $0.52 per diluted share.
▪Same Property Net Operating Income (NOI) increased by 2.1%.
▪Executed 167 new and renewal leases representing approximately 1.2 million square feet.
▪Blended cash leasing spreads of 12.2% on 129 comparable leases, including 26.1% on 24 comparable new leases, 12.9% on 51 comparable non-option renewals, and 7.8% on 54 comparable option renewals.
▪Cash leasing spreads of 18.9% on a blended basis for comparable new and non-option renewal leases.
▪Executed 7 new anchor leases representing approximately 175,000 square feet at comparable cash leasing spreads of 38.4%. Anchor leasing activity included Whole Foods, Crate & Barrel, Homesense, and Nordstrom Rack.
▪Operating retail portfolio annualized base rent (ABR) per square foot of $22.11 at September 30, 2025, a 5.2% increase year-over-year.
▪Retail portfolio leased percentage of 93.9% at September 30, 2025, a 60-basis point increase sequentially.
▪Anchor leased percentage of 95.0% at September 30, 2025, an 80-basis point increase sequentially.
i
▪Small shop leased percentage of 91.8% at September 30, 2025, a 20-basis point increase sequentially.
▪Portfolio leased-to-occupied spread at period end of 280 basis points, which represents $34.6 million of signed-not-open NOI.
Third Quarter 2025 Capital Allocation Activity
▪To date, repurchased 3.4 million shares of common stock, at an average price of $22.35 per share, for $74.9 million.
▪As previously announced, sold Humblewood Shopping Center (Houston MSA), an 85,682 square foot center, for $18.3 million.
Third Quarter 2025 Balance Sheet Overview
▪As of September 30, 2025, the Company’s net debt to Adjusted EBITDA was 5.0x.
▪Repaid the $80.0 million principal balance of the 4.47% senior unsecured notes that matured on September 10, 2025. The Company has no remaining debt maturing until September 2026.
▪As previously announced, the Company closed on pricing amendments with respect to the Company’s $1.1 billion unsecured revolving credit facility, $250 million unsecured term loan maturing on October 24, 2028, and $300 million unsecured term loan maturing on July 29, 2029.
Dividend
On October 28, 2025, the Company’s Board of Trustees declared a fourth quarter 2025 dividend of $0.29 per common share, which represents a 7.4% year-over-year increase. The fourth quarter dividend will be paid on or about January 16, 2026, to shareholders of record as of January 9, 2026.
2025 Earnings Guidance
The Company expects to generate net income attributable to common shareholders of $0.60 to $0.62 per diluted share in 2025. The Company is raising its 2025 NAREIT FFO guidance range to $2.09 to $2.11 per diluted share from $2.06 to $2.10 per diluted share, and its Core FFO guidance range to $2.05 to $2.07 per diluted share from $2.02 to $2.06 per diluted share, based, in part, on the following assumptions:
▪2025 Same Property NOI range of 2.25% to 2.75%.
▪Full-year credit disruption of 1.85% of total revenues at the midpoint, inclusive of a 0.95% general bad debt reserve and a 0.90% impact from anchor bankruptcies.
▪Interest expense, net of interest income, excluding unconsolidated joint ventures, of $124.5 million at the midpoint.
The following table reconciles the Company’s 2025 net income guidance range to the Company’s 2025 NAREIT and Core FFO guidance ranges:
Low
High
Net income
$
0.60
$
0.62
Realized gain on sales of operating properties, net
(0.49)
(0.49)
Impairment charges
0.18
0.18
Depreciation and amortization
1.80
1.80
NAREIT FFO
$
2.09
$
2.11
Non-cash items
(0.04)
(0.04)
Core FFO
$
2.05
$
2.07
Earnings Conference Call
Kite Realty Group will conduct a conference call to discuss its financial results on Thursday, October 30, 2025, at 11:00 a.m. Eastern Time. A live webcast of the conference call will be available on KRG’s website at www.kiterealty.com or at the following link: KRG Third Quarter 2025 Webcast. The dial-in registration link is: KRG Third Quarter 2025 Teleconference Registration. In addition, a webcast replay link will be available on KRG’s website.
ii
About Kite Realty Group
Kite Realty Group (NYSE: KRG), a real estate investment trust (REIT), is a premier owner and operator of open-air shopping centers and mixed-use assets. The Company’s primarily grocery-anchored portfolio is located in high-growth Sun Belt and select strategic gateway markets. The combination of necessity-based grocery-anchored neighborhood and community centers, along with vibrant mixed-use assets, makes the KRG portfolio an ideal platform for both retailers and consumers. Publicly listed since 2004, KRG has over 60 years of experience in developing, constructing and operating real estate. Using operational, investment, development, and redevelopment expertise, KRG continuously optimizes its portfolio to maximize value and return to shareholders. As of September 30, 2025, the Company owned interests in 180 U.S. open-air shopping centers and mixed-use assets, comprising approximately 29.7 million square feet of gross leasable space. For more information, please visit kiterealty.com.
Connect with KRG: LinkedIn | X | Instagram | Facebook
Safe Harbor
This release, together with other statements and information publicly disseminated by us, contains certain forward-looking statements within the meaning of Section 27A of the Securities Act of 1933 and Section 21E of the Securities Exchange Act of 1934. Such statements are based on assumptions and expectations that may not be realized and are inherently subject to risks, uncertainties and other factors, many of which cannot be predicted with accuracy and some of which might not even be anticipated. Future events and actual results, performance, transactions or achievements, financial or otherwise, may differ materially from the results, performance, transactions or achievements, financial or otherwise, expressed or implied by the forward-looking statements.
Risks, uncertainties and other factors that might cause such differences, some of which could be material, include but are not limited to: economic, business, banking, real estate and other market conditions, particularly in connection with low or negative growth in the U.S. economy as well as economic uncertainty (including from an economic slowdown or recession, federal government shutdown, disruptions related to tariffs and other trade or sanction issues, rising interest rates, inflation, unemployment, or limited growth in consumer income or spending); financing risks, including the availability of, and costs associated with, sources of liquidity; the Company’s ability to refinance, or extend the maturity dates of, the Company’s indebtedness; the level and volatility of interest rates; the financial stability of the Company’s tenants; the competitive environment in which the Company operates, including potential oversupplies of, or a reduction in demand for, rental space; acquisition, disposition, development and joint venture risks; property ownership and management risks, including the relative illiquidity of real estate investments, and expenses, vacancies or the inability to rent space on favorable terms or at all; the Company’s ability to maintain the Company’s status as a real estate investment trust for U.S. federal income tax purposes; potential environmental and other liabilities; impairment in the value of real estate property the Company owns; the attractiveness of our properties to tenants, the actual and perceived impact of e-commerce on the value of shopping center assets, and changing demographics and customer traffic patterns; business continuity disruptions and a deterioration in our tenants’ ability to operate in affected areas or delays in the supply of products or services to us or our tenants from vendors that are needed to operate efficiently, causing costs to rise sharply and inventory to fall; risks related to our current geographical concentration of properties in the states of Texas, Florida, and North Carolina and the metropolitan statistical areas of New York, Atlanta, Seattle, Chicago, and Washington, D.C.; civil unrest, acts of violence, terrorism or war, acts of God, climate change, epidemics, pandemics, natural disasters and severe weather conditions, including such events that may result in underinsured or uninsured losses or other increased costs and expenses; changes in laws and government regulations, including governmental orders affecting the use of the Company’s properties or the ability of its tenants to operate, and the costs of complying with such changed laws and government regulations; possible changes in consumer behavior due to public health crises and the fear of future pandemics; our ability to satisfy environmental, social or governance standards set by various constituencies; insurance costs and coverage, especially in Florida and Texas coastal areas and North Carolina; risks associated with cyber attacks and the loss of confidential information and other business disruptions; risks associated with the use of artificial intelligence and related tools; other factors affecting the real estate industry generally; and other risks identified in reports the Company files with the Securities and Exchange Commission or in other documents that it publicly disseminates, including, in particular, the section titled “Risk Factors” in the Company’s Annual Report on Form 10-K for the fiscal year ended December 31, 2024, and in the Company’s quarterly reports on Form 10-Q. The Company undertakes no obligation to publicly update or revise these forward-looking statements, whether as a result of new information, future events or otherwise.
This Earnings Release also includes certain forward-looking non-GAAP information. These non-GAAP financial measures should be considered along with, but not as alternatives to, net income (loss) as a measure of our operating performance. Please see the following pages for the corresponding definitions and reconciliations of such non-GAAP financial measures.
iii
Kite Realty Group
Contact Information
Corporate Office
30 South Meridian Street, Suite 1100
Indianapolis, IN 46204
(888) 577-5600
(317) 577-5600
www.kiterealty.com
Investor Relations Contact
Analyst Coverage
Analyst Coverage
Tyler Henshaw
Robert W. Baird & Co.
J.P. Morgan
Senior Vice President, Capital Markets and IR
Mr. Wes Golladay
Mr. Michael W. Mueller/Mr. Hongliang Zhang
(317) 713-7780
(216) 737-7510
(212) 622-6689/(212) 622-6416
thenshaw@kiterealty.com
wgolladay@rwbaird.com
michael.w.mueller@jpmorgan.com/
hongliang.zhang@jpmorgan.com
Matt Hunt
Bank of America/Merrill Lynch
Senior Director, Capital Markets and IR
Mr. Jeffrey Spector/Mr. Samir Khanal
KeyBanc Capital Markets
(317) 713-7646
(646) 855-1363/(646) 855-1497
Mr. Todd Thomas
mhunt@kiterealty.com
jeff.spector@bofa.com/
(917) 368-2286
samar.khanal@bofa.com
tthomas@keybanccm.com
Transfer Agent
BTIG
Ladenburg Thalmann
Broadridge Financial Solutions
Mr. Michael Gorman
Mr. Floris van Dijkum
Ms. Kristen Tartaglione
(212) 738-6138
(212) 409-2075
2 Journal Square, 7th Floor
mgorman@btig.com
fvandijkum@ladenburg.com
Jersey City, NJ 07306
(201) 714-8094
Citigroup Global Markets
Piper Sandler
Mr. Craig Mailman
Mr. Alexander Goldfarb
(212) 816-4471
(212) 466-7937
craig.mailman@citi.com
alexander.goldfarb@psc.com
Stock Specialist
GTS
Compass Point Research & Trading, LLC
Raymond James
545 Madison Avenue, 15th Floor
Mr. Ken Billingsley
Mr. RJ Milligan
New York, NY 10022
(202) 534-1393
(727) 567-2585
(212) 715-2830
kbillingsley@compasspointllc.com
rjmilligan@raymondjames.com
Green Street
UBS
Ms. Paulina Rojas Schmidt
Mr. Michael Goldsmith
(949) 640-8780
(212) 713-2951
projasschmidt@greenstreet.com
michael.goldsmith@ubs.com
Jefferies LLC
Wells Fargo
Ms. Linda Tsai
Mr. James Feldman/Mr. Cooper Clark
(212) 778-8011
(212) 215-5328/(212) 214-1146
ltsai@jefferies.com
james.feldman@wellsfargo.com/
cooper.clark@wellsfargo.com
3rd Quarter 2025 Supplemental Financial and Operating Statistics
1
Kite Realty Group
Results Overview
(dollars in thousands, except per share and per square foot amounts)
Three Months Ended September 30,
Nine Months Ended September 30,
Summary Financial Results
2025
2024
2025
2024
Total revenue (page 4)
$
205,055
$
207,253
$
640,212
$
625,268
Net (loss) income attributable to common shareholders (page 4)
$
(16,207)
$
16,729
$
117,841
$
(17,753)
Net (loss) income per diluted share (page 4)
$
(0.07)
$
0.08
$
0.54
$
(0.08)
Net operating income (NOI) (page 6)
$
149,550
$
153,822
$
470,310
$
460,256
Adjusted EBITDA (page 6)
$
142,754
$
141,018
$
439,144
$
425,469
NAREIT Funds From Operations (FFO) (page 7)
$
118,821
$
113,926
$
355,566
$
344,253
NAREIT FFO per diluted share (page 7)
$
0.53
$
0.51
$
1.58
$
1.54
Core FFO (page 7)
$
116,284
$
109,162
$
347,508
$
328,110
Core FFO per diluted share (page 7)
$
0.52
$
0.49
$
1.55
$
1.47
Dividend payout ratio (as % of NAREIT FFO)
51
%
49
%
51
%
49
%
Three Months Ended
Summary Operating and Financial Ratios
September 30, 2025
June 30, 2025
March 31, 2025
December 31, 2024
September 30, 2024
NOI margin (page 6)
73.6
%
74.0
%
74.2
%
74.3
%
74.5
%
NOI margin – retail (page 6)
74.3
%
74.4
%
74.7
%
75.1
%
75.2
%
Same Property NOI performance (page 5)
2.1
%
3.3
%
3.1
%
4.8
%
3.0
%
Total property NOI performance (page 5)
1.2
%
2.0
%
7.4
%
4.9
%
1.2
%
Net debt to Adjusted EBITDA, current quarter (page 9)
5.0x
5.1x
4.7x
4.7x
4.9x
Recovery ratio of retail operating properties (page 6)
91.8
%
92.0
%
91.4
%
92.1
%
91.2
%
Recovery ratio of consolidated portfolio (page 6)
88.2
%
87.8
%
86.5
%
87.4
%
86.6
%
Outstanding Classes of Stock
Common shares and units outstanding (page 18)
221,579,773
224,707,781
224,661,888
223,859,664
223,626,166
Summary Portfolio Statistics
Number of properties
Operating retail/mixed-use(1)
178
179
180
179
179
Standalone office(2)
2
2
2
2
1
Development and redevelopment projects (page 13)
1
1
1
2
3
Owned retail operating gross leasable area (GLA)(3)
Total new and renewal lease cash rent spread (page 16)
12.2
%
17.0
%
13.7
%
12.5
%
11.1
%
2025 Guidance
Current (as of 10/29/25)
Previous (as of 7/30/25)
Original (as of 2/11/25)
NAREIT FFO per diluted share
$2.09 to $2.11
$2.06 to $2.10
$2.02 to $2.08
Core FFO per diluted share
$2.05 to $2.07
$2.02 to $2.06
$1.98 to $2.04
(1)Operating retail/mixed-use properties consist of retail and office components at consolidated and unconsolidated properties and exclude one property classified as held for sale as of September 30, 2025, as well as Eastgate Crossing, which was reclassified from our operating portfolio in September 2025 due to significant disruption caused by severe flooding as a result of Tropical Storm Chantal.
(2)Standalone office properties include the Company’s headquarters at 30 South Meridian and the Carillon medical office building.
(3)Owned GLA represents gross leasable area owned by the Company and excludes the square footage of non-retail property components and development and redevelopment projects.
(4)Represents the number of multifamily units that the Company has an economic interest in.
3rd Quarter 2025 Supplemental Financial and Operating Statistics
2
Kite Realty Group
Consolidated Balance Sheets
(dollars in thousands)
(unaudited)
September 30, 2025
December 31, 2024
Assets:
Investment properties, at cost
$
7,417,916
$
7,634,191
Less: accumulated depreciation
(1,728,295)
(1,587,661)
Net investment properties
5,689,621
6,046,530
Cash and cash equivalents
68,743
128,056
Tenant and other receivables, including accrued straight-line rent
of $72,140 and $67,377, respectively
129,656
125,768
Restricted cash and escrow deposits
23,511
5,271
Deferred costs, net
200,954
238,213
Short-term deposits
—
350,000
Prepaid and other assets
100,847
104,627
Investments in unconsolidated subsidiaries
374,868
19,511
Assets associated with investment property held for sale
59,515
73,791
Total assets
$
6,647,715
$
7,091,767
Liabilities and Equity:
Liabilities:
Mortgage and other indebtedness, net
$
2,941,548
$
3,226,930
Accounts payable and accrued expenses
203,114
202,651
Deferred revenue and other liabilities
222,602
246,100
Liabilities associated with investment property held for sale
4,399
4,009
Total liabilities
3,371,663
3,679,690
Commitments and contingencies
Limited Partners’ interests in the Operating Partnership
101,301
98,074
Equity:
Common shares, $0.01 par value, 490,000,000 shares authorized,
216,730,185 and 219,667,067 shares issued and outstanding at
September 30, 2025 and December 31, 2024, respectively
2,167
2,197
Additional paid-in capital
4,800,058
4,868,554
Accumulated other comprehensive income
25,184
36,612
Accumulated deficit
(1,654,579)
(1,595,253)
Total shareholders’ equity
3,172,830
3,312,110
Noncontrolling interests
1,921
1,893
Total equity
3,174,751
3,314,003
Total liabilities and equity
$
6,647,715
$
7,091,767
3rd Quarter 2025 Supplemental Financial and Operating Statistics
3
Kite Realty Group
Consolidated Statements of Operations
(dollars in thousands, except per share amounts)
(unaudited)
Three Months Ended September 30,
Nine Months Ended September 30,
2025
2024
2025
2024
Revenue:
Rental income
$
202,193
$
204,934
$
632,547
$
616,583
Other property-related revenue
1,571
1,864
5,096
4,463
Fee income
1,291
455
2,569
4,222
Total revenue
205,055
207,253
640,212
625,268
Expenses:
Property operating
28,536
27,756
87,243
84,401
Real estate taxes
25,678
25,220
80,090
78,247
General, administrative and other
14,183
13,259
39,831
39,009
Depreciation and amortization
89,370
96,656
285,488
296,326
Impairment charges
39,305
—
39,305
66,201
Total expenses
197,072
162,891
531,957
564,184
Other (expense) income:
Interest expense
(33,162)
(31,640)
(100,168)
(92,985)
Income tax expense of taxable REIT subsidiaries
(106)
(35)
(315)
(325)
Gain (loss) on sales of operating properties, net
5,742
602
108,855
(864)
Net gains from outlot sales
6,096
—
6,096
1,858
Equity in loss of unconsolidated subsidiaries
(4,619)
(607)
(8,464)
(1,201)
Gain on sale of unconsolidated property, net
—
—
—
2,325
Other income, net
1,656
4,371
6,194
12,294
Net (loss) income
(16,410)
17,053
120,453
(17,814)
Net loss (income) attributable to noncontrolling interests
203
(324)
(2,612)
61
Net (loss) income attributable to common shareholders
$
(16,207)
$
16,729
$
117,841
$
(17,753)
Net (loss) income per common share – basic and diluted
$
(0.07)
$
0.08
$
0.54
$
(0.08)
Weighted average common shares outstanding – basic
219,408,533
219,665,836
219,652,052
219,596,590
Weighted average common shares outstanding – diluted
219,408,533
220,096,693
219,768,504
219,596,590
3rd Quarter 2025 Supplemental Financial and Operating Statistics
4
Kite Realty Group
Same Property Net Operating Income (“NOI”)
(dollars in thousands)
(unaudited)
Three Months Ended September 30,
Nine Months Ended September 30,
2025
2024
Change
2025
2024
Change
Number of properties in Same Property Pool for the period(1)
174
174
174
174
Leased percentage at period end
93.8
%
95.0
%
93.8
%
95.0
%
Economic occupancy percentage at period end
91.1
%
92.3
%
91.1
%
92.3
%
Economic occupancy percentage(2)
90.5
%
91.7
%
90.9
%
91.4
%
Minimum rent
$
151,219
$
147,372
$
450,525
$
438,290
Tenant recoveries
41,332
39,526
125,657
120,384
Bad debt reserve
(2,001)
(1,556)
(5,469)
(3,640)
Other income, net
2,197
2,225
6,764
6,903
Total revenue
192,747
187,567
577,477
561,937
Property operating
(24,361)
(22,795)
(73,718)
(71,518)
Real estate taxes
(24,265)
(23,663)
(74,378)
(72,804)
Total expenses
(48,626)
(46,458)
(148,096)
(144,322)
Same Property NOI(3)
$
144,121
$
141,109
2.1
%
$
429,381
$
417,615
2.8
%
Reconciliation of Same Property NOI to most
directly comparable GAAP measure:
Net operating income – same properties
$
144,121
$
141,109
$
429,381
$
417,615
Net operating income – non-same activity(4)
5,429
12,713
40,929
40,783
Net gains from outlot sales
6,096
—
6,096
1,858
Total property NOI
155,646
153,822
1.2
%
476,406
460,256
3.5
%
Other (expense) income, net
(1,778)
4,184
(16)
14,990
General, administrative and other
(14,183)
(13,259)
(39,831)
(39,009)
Impairment charges
(39,305)
—
(39,305)
(66,201)
Depreciation and amortization
(89,370)
(96,656)
(285,488)
(296,326)
Interest expense
(33,162)
(31,640)
(100,168)
(92,985)
Gain (loss) on sales of operating properties, net
5,742
602
108,855
(864)
Gain on sale of unconsolidated property, net
—
—
—
2,325
Net loss (income) attributable to noncontrolling
interests
203
(324)
(2,612)
61
Net (loss) income attributable to common shareholders
$
(16,207)
$
16,729
$
117,841
$
(17,753)
(1)Same Property NOI excludes the following:
▪properties acquired or placed in service during 2024 and 2025;
▪The Corner – IN, which was reclassified from active development into our operating portfolio in March 2025;
▪Eastgate Crossing, which was reclassified from our operating portfolio in September 2025 due to significant disruption caused by severe flooding as a result of Tropical Storm Chantal;
▪our active development project at One Loudoun Expansion noted on page 13;
▪Hamilton Crossing Centre and Edwards Multiplex – Ontario, which were reclassified from our operating portfolio into redevelopment in June 2014 and March 2023, respectively;
▪properties sold or classified as held for sale during 2024 and 2025; and
▪standalone office properties, including the Carillon medical office building, which was reclassified from active redevelopment into our office portfolio in December 2024.
(2)Excludes leases that are signed but for which tenants have not yet commenced the payment of cash rent. Calculated as a weighted average based on the timing of cash rent commencement and expiration during the period.
(3)Same Property NOI for all periods presented includes 52% of the NOI from the three previously wholly owned properties that were contributed to the GIC Portfolio Joint Venture in June 2025.
(4)Includes non-cash activity across the portfolio as well as NOI from properties not included in the Same Property Pool, including properties sold during both periods.
3rd Quarter 2025 Supplemental Financial and Operating Statistics
5
Kite Realty Group
Net Operating Income and Adjusted EBITDA by Quarter
(dollars in thousands)
(unaudited)
Three Months Ended
September 30, 2025
June 30, 2025
March 31, 2025
December 31, 2024
September 30, 2024
Revenue:
Minimum rent
$
144,110
$
149,092
$
150,150
$
149,331
$
145,971
Minimum rent – ground leases
10,637
10,450
10,644
10,750
10,758
Lease termination income
18
2,725
7,390
152
800
Straight-line rent
2,681
2,129
2,266
1,592
2,902
Non-cash market rent
1,919
1,569
3,538
3,158
2,264
Tenant reimbursements
43,666
45,103
46,213
44,058
42,453
Bad debt reserve
(2,119)
(1,625)
(2,076)
(1,755)
(1,468)
Other property-related revenue(1)
985
870
1,640
1,338
1,402
Overage rent
1,281
1,738
1,048
2,680
1,253
Total revenue
203,178
212,051
220,813
211,304
206,335
Expenses:
Property operating – recoverable(2)
24,038
24,849
25,798
24,913
23,961
Property operating – non-recoverable(2)
4,131
3,700
3,661
3,972
3,469
Real estate taxes
25,459
26,492
27,604
25,495
25,083
Total expenses
53,628
55,041
57,063
54,380
52,513
NOI
149,550
157,010
163,750
156,924
153,822
Other (expense) income:
General, administrative and other
(14,183)
(13,390)
(12,258)
(13,549)
(13,259)
Fee income
1,291
853
425
441
455
Net gains from outlot sales
6,096
—
—
2,505
—
Total other (expense) income
(6,796)
(12,537)
(11,833)
(10,603)
(12,804)
Adjusted EBITDA
142,754
144,473
151,917
146,321
141,018
Impairment charges
(39,305)
—
—
—
—
Depreciation and amortization
(89,370)
(97,887)
(98,231)
(97,009)
(96,656)
Interest expense
(33,162)
(34,052)
(32,954)
(32,706)
(31,640)
Equity in (loss) earnings of unconsolidated subsidiaries
(4,619)
(3,238)
(607)
43
(607)
Income tax (expense) benefit of taxable REIT subsidiaries
(106)
(199)
(10)
186
(35)
Loss on extinguishment of debt
—
—
—
(180)
—
Interest income
1,659
493
4,049
5,453
4,333
Other (expense) income, net
(3)
(13)
9
122
38
Gain on sales of operating properties, net
5,742
103,022
91
—
602
Net (loss) income
(16,410)
112,599
24,264
22,230
17,053
Net loss (income) attributable to noncontrolling interests
203
(2,281)
(534)
(406)
(324)
Net (loss) income attributable to common shareholders
$
(16,207)
$
110,318
$
23,730
$
21,824
$
16,729
NOI/Revenue – Retail properties
74.3
%
74.4
%
74.7
%
75.1
%
75.2
%
NOI/Revenue
73.6
%
74.0
%
74.2
%
74.3
%
74.5
%
Recovery Ratio(3)
– Retail properties
91.8
%
92.0
%
91.4
%
92.1
%
91.2
%
– Consolidated
88.2
%
87.8
%
86.5
%
87.4
%
86.6
%
(1)Other property-related revenue also includes the net operating results of Eddy Street Parking Garage and Union Station Parking Garage.
(2)Recoverable expenses include recurring G&A expense of $4.1 million allocable to the property operations in the three months ended September 30, 2025, a portion of which is recoverable. Non-recoverable expenses primarily include ground rent, professional fees, and marketing costs.
(3)“Recovery Ratio” is computed by dividing tenant reimbursements by the sum of recoverable property operating expense and real estate tax expense.
3rd Quarter 2025 Supplemental Financial and Operating Statistics
6
Kite Realty Group
NAREIT Funds From Operations (“FFO”)(1)
(dollars in thousands, except per share amounts)
(unaudited)
Three Months Ended September 30,
Nine Months Ended September 30,
2025
2024
2025
2024
Net (loss) income
$
(16,410)
$
17,053
$
120,453
$
(17,814)
Less: net income attributable to noncontrolling interests in properties
(82)
(63)
(233)
(204)
Less/add: (gain) loss on sales of operating properties, net
(5,742)
(602)
(108,855)
864
Less: gain on sale of unconsolidated property, net
—
—
—
(2,325)
Add: impairment charges
39,305
—
39,305
66,201
Add: depreciation and amortization of consolidated and unconsolidated entities,
net of noncontrolling interests
101,750
97,538
304,896
297,531
NAREIT FFO of the Operating Partnership(1)
118,821
113,926
355,566
344,253
Less: Limited Partners’ interests in FFO
(2,569)
(1,971)
(7,498)
(5,739)
FFO attributable to common shareholders(1)
$
116,252
$
111,955
$
348,068
$
338,514
FFO, as defined by NAREIT, per share of the Operating Partnership – basic
$
0.53
$
0.51
$
1.58
$
1.54
FFO, as defined by NAREIT, per share of the Operating Partnership – diluted
$
0.53
$
0.51
$
1.58
$
1.54
Weighted average common shares outstanding – basic
219,408,533
219,665,836
219,652,052
219,596,590
Weighted average common shares outstanding – diluted
219,531,606
219,979,239
219,768,504
219,861,005
Weighted average common shares and units outstanding – basic
224,258,121
223,529,610
224,386,126
223,323,641
Weighted average common shares and units outstanding – diluted
224,381,194
223,843,013
224,502,578
223,588,056
Reconciliation of NAREIT FFO to Core FFO(2)
NAREIT FFO of the Operating Partnership(1)
$
118,821
$
113,926
$
355,566
$
344,253
Add:
Amortization of deferred financing costs
1,856
1,062
5,251
2,978
Non-cash compensation expense and other
2,926
2,816
8,490
8,444
Less:
Straight-line rent – minimum rent and common area maintenance
3,789
3,286
9,202
10,062
Market rent amortization income
2,500
2,265
7,921
6,922
Amortization of debt discounts, premiums and hedge instruments
1,030
3,091
4,676
10,581
Core FFO of the Operating Partnership
$
116,284
$
109,162
$
347,508
$
328,110
Core FFO per share of the Operating Partnership – diluted
$
0.52
$
0.49
$
1.55
$
1.47
Reconciliation of Core FFO to Adjusted Funds From Operations (“AFFO”)(2)
Core FFO of the Operating Partnership
$
116,284
$
109,162
$
347,508
$
328,110
Less:
Maintenance capital expenditures
7,583
6,085
23,076
18,750
Tenant-related capital expenditures(3)
14,744
30,090
68,339
73,734
Total Recurring AFFO of the Operating Partnership
$
93,957
$
72,987
$
256,093
$
235,626
(1)“NAREIT FFO of the Operating Partnership” measures 100% of the operating performance of the Operating Partnership’s real estate properties. “FFO attributable to common shareholders” reflects a reduction for the redeemable noncontrolling weighted average diluted interest in the Operating Partnership.
(2)Includes the Company’s pro rata share from unconsolidated joint ventures.
(3)Excludes landlord work, tenant improvements and leasing commissions related to development and redevelopment projects.
3rd Quarter 2025 Supplemental Financial and Operating Statistics
7
Kite Realty Group
Joint Venture Summary as of September 30, 2025
(dollars in thousands)
Consolidated Investments
Investments
Total Debt
Partner Economic
Ownership Interest(1)
Partner Share of Debt
Partner Share of Annual EBITDA
Delray Marketplace
$
12,800
2
%
$
256
$
—
One Loudoun – Pads G&H Residential
95,095
10
%
9,509
848
Total
$
107,895
$
9,765
$
848
(1)Economic ownership % represents the partner’s share of cash flow.
Unconsolidated Investments
Investments
Total GLA
Multifamily Units
KRG Economic Ownership Interest
Nuveen Portfolio
416,011
—
20
%
Embassy Suites at Eddy Street Commons
—
—
35
%
Glendale Center Apartments
—
—
11.5
%
The Corner – IN
23,852
285
50
%
Legacy West
785,722
782
52
%
GIC Portfolio
921,280
—
52
%
Total
2,146,865
1,067
Total Unconsolidated Investments
Investment as of September 30, 2025
$
374,868
Three Months Ended
September 30, 2025
June 30, 2025
EBITDA
$
10,203
$
5,689
Depreciation and amortization
(12,705)
(6,932)
Interest expense
(2,849)
(2,185)
KRG share of management fees
732
190
KRG share of net loss
$
(4,619)
$
(3,238)
3rd Quarter 2025 Supplemental Financial and Operating Statistics
8
Kite Realty Group
Key Debt Metrics as of September 30, 2025
(dollars in thousands)
September 30, 2025
Debt Covenant
Threshold(1)
Senior Unsecured Notes Covenants
Total debt to undepreciated assets
38.7%
<60%
Secured debt to undepreciated assets
4.1%
<40%
Undepreciated unencumbered assets to unsecured debt
268.7%
>150%
Debt service coverage
4.5x
>1.5x
Unsecured Credit Facility Covenants
Maximum leverage
34.9%
<60%
Minimum fixed charge coverage
4.4x
>1.5x
Secured indebtedness
3.8%
<45%
Unsecured debt interest coverage
4.0x
>1.75x
Unsecured leverage
33.2%
<60%
Senior Unsecured Debt Ratings
Fitch Ratings
BBB/Positive
Moody's Investors Service
Baa2/Stable
Standard & Poor's Rating Services
BBB/Stable
Liquidity
Cash and cash equivalents
$
68,743
Availability under unsecured credit facility
1,095,800
$
1,164,543
Unencumbered Consolidated NOI as a % of Total Consolidated NOI
95
%
(1)For a complete listing of all debt covenants related to the Company’s Senior Unsecured Notes and Unsecured Credit Facility, as well as definitions of the terms, refer to the Company’s filings with the SEC.
Net Debt to Adjusted EBITDA
Mortgage and other indebtedness, net
$
2,941,548
Add: Company share of unconsolidated joint venture debt
202,690
Add: debt discounts, premiums and issuance costs, net
2,714
Less: Partner share of consolidated joint venture debt
(9,765)
Company's consolidated debt and share of unconsolidated debt
3,137,187
Less: cash and cash equivalents
(68,743)
Less: restricted cash and escrow deposits
(23,511)
Less: Company share of unconsolidated joint venture cash and cash equivalents
(13,736)
Company share of Net Debt
$
3,031,197
Q3 2025 Adjusted EBITDA, Annualized:
– Consolidated Adjusted EBITDA
$
571,016
– Unconsolidated Adjusted EBITDA
40,812
– Minority interest Adjusted EBITDA(2)
(848)
610,980
Ratio of Company share of Net Debt to Adjusted EBITDA
5.0x
(2)See page 8 for details.
3rd Quarter 2025 Supplemental Financial and Operating Statistics
9
Kite Realty Group
Summary of Outstanding Debt as of September 30, 2025
(dollars in thousands)
Total Outstanding Debt
Amount Outstanding
Ratio
Weighted Average Interest Rate
Weighted Average Years to Maturity
Fixed rate debt(1)
$
2,781,462
89
%
4.24
%
4.6
Variable rate debt
162,800
5
%
5.08
%
3.7
Debt discounts, premiums and issuance costs, net
(2,714)
N/A
N/A
N/A
Total consolidated debt
2,941,548
94
%
4.29
%
4.6
KRG share of unconsolidated debt
191,487
6
%
4.35
%
4.4
Total
$
3,133,035
100
%
4.29
%
4.6
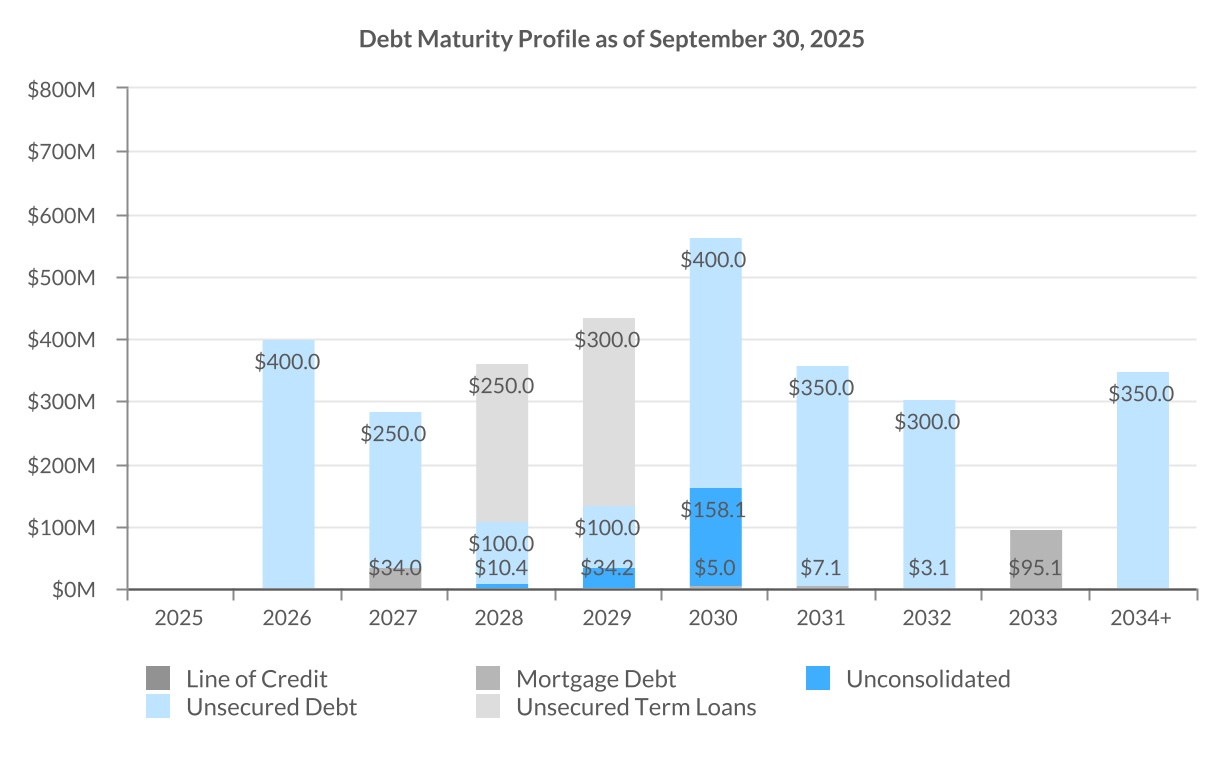
Schedule of Maturities by Year
Secured Debt
Scheduled Principal Payments
Term Maturities
Unsecured Debt
Total Consolidated Debt
Total Unconsolidated Debt
Total Debt Outstanding
2025
$
1,325
$
—
$
—
$
1,325
$
—
$
1,325
2026
4,581
—
400,000
404,581
—
404,581
2027
3,120
10,600
250,000
263,720
—
263,720
2028
3,757
—
350,000
(2)
353,757
10,378
364,135
2029
4,324
—
400,000
404,324
34,232
438,556
2030 and beyond
23,767
92,788
1,400,000
1,516,555
158,080
1,674,635
Debt discounts, premiums and issuance costs, net
—
810
(3,524)
(2,714)
(11,203)
(13,917)
Total
$
40,874
$
104,198
$
2,796,476
$
2,941,548
$
191,487
$
3,133,035
(1)Fixed rate debt includes the portion of variable rate debt that has been hedged by interest rate swaps. As of September 30, 2025, $400.0 million in variable rate debt is hedged to a fixed rate for a weighted average of 0.3 years.
(2)Assumes the Company exercises its option to extend the maturity date of the $250.0 million unsecured term loan by one year to 2028.
3rd Quarter 2025 Supplemental Financial and Operating Statistics
10
Kite Realty Group
Maturity Schedule of Outstanding Debt as of September 30, 2025
(dollars in thousands)
Description
Contractual
Interest Rate(1)
Swapped
Interest Rate(1)
Maturity Date
Balance as of September 30, 2025
% of Total Outstanding
Senior Unsecured Notes
4.08%
4.08%
9/30/2026
$
100,000
Senior Unsecured Notes
4.00%
4.00%
10/1/2026
300,000
2026 Debt Maturities
4.02%
4.02%
400,000
13
%
Senior Unsecured Exchangeable Notes
0.75%
0.75%
4/1/2027
175,000
Northgate North
4.50%
4.50%
6/1/2027
21,151
Delray Marketplace(2)
SOFR + 2.15%
SOFR + 2.15%
8/4/2027
12,800
Senior Unsecured Notes
4.57%
4.57%
9/10/2027
75,000
2027 Debt Maturities
2.29%
2.29%
283,951
9
%
Unsecured Term Loan(3)
SOFR + 0.85%
3.84%
10/24/2028
250,000
Senior Unsecured Notes
4.24%
4.24%
12/28/2028
100,000
2028 Debt Maturities
4.85%
3.95%
350,000
11
%
Senior Unsecured Notes
4.82%
4.82%
6/28/2029
100,000
Unsecured Term Loan(4)
SOFR + 0.85%
3.76%
7/29/2029
300,000
Unsecured Credit Facility(5)
SOFR + 1.05%
SOFR + 1.05%
10/3/2029
—
2029 Debt Maturities
4.94%
4.02%
400,000
13
%
Rampart Commons
5.73%
5.73%
6/10/2030
5,003
Senior Unsecured Notes
4.75%
4.75%
9/15/2030
400,000
The Shoppes at Union Hill
3.75%
3.75%
6/1/2031
7,111
Senior Unsecured Notes
4.95%
4.95%
12/15/2031
350,000
Nora Plaza Shops
3.80%
3.80%
2/1/2032
3,102
Senior Unsecured Notes
5.20%
5.20%
8/15/2032
300,000
One Loudoun – Pads G&H Residential
5.36%
5.36%
5/1/2033
95,095
Senior Unsecured Notes(6)
4.60%
4.60%
3/1/2034
350,000
2030 and beyond Debt Maturities
4.89%
4.89%
1,510,311
48
%
Debt discounts, premiums and issuance costs, net
(2,714)
Total debt per consolidated balance sheet
4.52%
4.29%
$
2,941,548
94
%
KRG share of unconsolidated debt
Nuveen Portfolio
4.09%
4.09%
7/1/2028
$
10,378
The Corner – IN(7)
SOFR + 2.86%
SOFR + 2.86%
11/23/2029
34,232
Legacy West
3.80%
3.80%
5/1/2030
158,080
KRG share of unconsolidated debt
4.35%
4.35%
202,690
KRG share of debt discounts and issuance costs, net
(11,203)
Total KRG share of unconsolidated debt
191,487
6
%
Total consolidated and KRG share of
unconsolidated debt
4.51%
4.29%
$
3,133,035
As of September 30, 2025, the Company is a party to the following interest rate swaps:
Interest Rate Swaps
Swap Maturity Date
KRG Receives
KRG Pays
Aggregate Notional
Interest rate swap on Term Loan Due 7/29/2029
7/17/2026
1-month SOFR (4.13%)
1.68%
$
150,000
Interest rate swap on Term Loan Due 10/24/2028
10/24/2025
1-month SOFR (4.13%)
2.99%
250,000
$
400,000
(1)At September 30, 2025, daily SOFR was 4.24% and one-month SOFR was 4.13%.
(2)The property is held in a joint venture. The loan is guaranteed by Kite Realty Group, LP. Assumes the Company exercises its option to extend the maturity date by one year to 2027.
(3)Assumes the Company exercises its option to extend the maturity date by one year to 2028.
(4)As of September 30, 2025, $150.0 million of the $300.0 million term loan balance is hedged to a fixed rate of 1.68% plus a credit spread of 0.85% based on the Company’s current credit rating until July 17, 2026. The swapped rate shown is the weighted average rate as of September 30, 2025.
(5)Assumes the Company exercises its option to extend the maturity date by one year to 2029.
(6)The interest rate reflects the impact of forward-starting interest rate swaps that fixed the underlying index on a portion of the outstanding principal prior to the issuance of the unsecured notes.
(7)The Corner – IN includes three loans with varying rates and maturity dates. As of September 30, 2025, the loans had a weighted average interest rate of 6.99% and a majority of the amount outstanding was at a floating rate. The maturity date shown is the weighted average maturity date as of September 30, 2025.
3rd Quarter 2025 Supplemental Financial and Operating Statistics
11
Kite Realty Group
Acquisitions and Dispositions
(dollars in thousands)
Acquisitions
Property Name
Acquisition Date
Metropolitan Statistical Area (“MSA”)
Grocery Anchor
Retail GLA
Office GLA
Acquisition Price – at KRG’s share
Village Commons
January 15, 2025
Miami
Publix
170,976
—
$
68,400
Legacy West(1)
April 28, 2025
Dallas/Ft. Worth
N/A
342,011
443,553
408,200
Total acquisitions
512,987
443,553
$
476,600
(1)The Company entered into a joint venture (KRG 52% noncontrolling interest) with GIC, and in April 2025, the joint venture acquired Legacy West for a gross purchase price of $785.0 million, including the assumption of $304.0 million of debt with an interest rate of 3.80%. Legacy West also contains 782 multifamily units.
Property Dispositions
Property Name
Disposition Date
MSA
Grocery Anchor
GLA
Sales Price
Stoney Creek Commons
April 4, 2025
Indianapolis
N/A
84,094
$
9,500
Fullerton Metrocenter
June 25, 2025
Los Angeles
Sprouts, Target
241,027
118,500
Denton Crossing(2)
June 27, 2025
Dallas/Ft. Worth
Kroger (shadow)
343,345
39,263
Parkway Towne Crossing(2)
June 27, 2025
Dallas/Ft. Worth
Target (shadow)
180,736
27,743
The Landing at Tradition(2)
June 27, 2025
Port St. Lucie, FL
The Fresh Market, Target (shadow)
397,199
45,114
Humblewood Shopping Center(3)
July 21, 2025
Houston
N/A
85,682
18,250
Hamilton Crossing Centre(4)
August 15, 2025
Indianapolis
N/A
—
847
DePauw University Bookstore and Café
October 10, 2025
Indianapolis
N/A
11,974
600
Total dispositions
1,344,057
$
259,817
(2)The Company contributed this previously wholly owned property into a newly formed joint venture with GIC (the “GIC Portfolio Joint Venture”) and has retained a 52% noncontrolling interest in the property. The sales price reflects 48% of the total agreed upon value.
(3)Disposition proceeds related to this property are temporarily restricted related to a potential 1031 Exchange.
(4)The Company sold two land parcels to Republic Airways Inc.
3rd Quarter 2025 Supplemental Financial and Operating Statistics
12
Kite Realty Group
Development and Redevelopment Projects
(dollars in thousands)
Project
MSA
KRG Ownership %
Projected
Completion Date(1)
Total Owned GLA
Total Multifamily Units
Total Project Costs – at KRG's Share
KRG Equity Requirement
KRG Remaining Spend
Estimated Stabilized NOI to KRG
Estimated
Remaining NOI
to Come Online(2)
Active Projects
One Loudoun Expansion(3)
Washington, D.C./Baltimore
100%
Q4 2026– Q2 2027
119,000
—
$81.0M–$91.0M
$65.0M–$75.0M
$53.0M–$63.0M
$4.7M–$6.2M
$2.0M–$3.5M
Future Opportunities(4)
Project
MSA
Project Description
Carillon
Washington, D.C./Baltimore
Potential of 1.2 million square feet of commercial GLA and 3,000 multifamily units for additional expansion.
Downtown Crown
Washington, D.C./Baltimore
Potential of 42,000 square feet of commercial GLA for additional expansion.
Edwards Multiplex – Ontario
Los Angeles, CA
Potential redevelopment of existing Regal Theatre.
Glendale Town Center
Indianapolis, IN
Potential of 200 multifamily units for additional expansion.
Hamilton Crossing Centre – Phase II
Indianapolis, IN
Addition of mixed-use (multifamily, office and retail) components adjacent to the Republic Airways headquarters.
Main Street Promenade
Chicago, IL
Potential of 16,000 square feet of commercial GLA for additional expansion.
One Loudoun Hotel
Washington, D.C./Baltimore
Potential for 1.7 million square feet remaining following the planned approximately 170-room hotel.
One Loudoun Residential
Washington, D.C./Baltimore
Potential for approximately 1,300 multifamily units remaining following the planned 400 additional multifamily units.
The Shops at Legacy East
Dallas/Ft. Worth, TX
Potential of 285 multifamily units for additional expansion.
(1)Projected completion date represents the earlier of one year after completion of project construction or substantial occupancy of the property. The range for the One Loudoun Expansion represents a staggered stabilization schedule for the various buildings.
(2)Estimated remaining NOI to come online excludes in-place NOI and NOI related to tenants that have signed leases but have not yet commenced paying rent.
(3)KRG’s equity requirement is shown net of 2 over 2 land sale net proceeds of $15.9 million.
(4)These opportunities are deemed potential at this time and are subject to various contingencies, many of which could be beyond the Company’s control.
3rd Quarter 2025 Supplemental Financial and Operating Statistics
13
Kite Realty Group
Geographic Diversification – ABR by Region and State as of September 30, 2025
(dollars in thousands)
Region/State
Number of
Properties(1)
Owned GLA(2)
Total
Weighted
ABR(3)
% of
Weighted
ABR(3)
South
Texas
44
8,646
$
188,839
29.6
%
Florida
31
3,717
71,829
11.2
%
Virginia
7
1,307
38,184
6.0
%
Maryland
9
1,535
34,919
5.5
%
Georgia
11
1,849
31,200
4.9
%
North Carolina
7
1,379
29,975
4.7
%
Tennessee
3
580
8,905
1.4
%
Oklahoma
3
505
8,593
1.3
%
South Carolina
2
262
3,824
0.6
%
Total South
117
19,780
416,268
65.2
%
West
Washington
10
1,651
32,178
5.0
%
Nevada
5
846
29,868
4.7
%
Arizona
5
714
16,093
2.5
%
Utah
2
388
8,600
1.4
%
California
1
292
4,479
0.7
%
Total West
23
3,891
91,218
14.3
%
Midwest
Indiana
16
1,940
39,578
6.2
%
Illinois
7
1,222
27,168
4.3
%
Michigan
1
308
6,901
1.1
%
Missouri
1
453
4,358
0.7
%
Ohio
1
236
2,152
0.3
%
Total Midwest
26
4,159
80,157
12.6
%
Northeast
New York
7
890
27,783
4.3
%
New Jersey
4
342
11,867
1.9
%
Massachusetts
1
264
4,927
0.8
%
Connecticut
1
206
4,078
0.6
%
Pennsylvania
1
136
1,982
0.3
%
Total Northeast
14
1,838
50,637
7.9
%
Total(4)
180
29,668
$
638,280
100.0
%
(1)Number of properties represents consolidated and unconsolidated retail/mixed-use properties and standalone office properties.
(2)Owned GLA represents gross leasable area owned by the Company and excludes the square footage of development and redevelopment projects.
(3)Total weighted ABR and percent of weighted ABR includes ground lease rent and represents the Company’s share of the ABR at consolidated and unconsolidated properties.
(4)Excludes one operating retail property classified as held for sale as of September 30, 2025.
3rd Quarter 2025 Supplemental Financial and Operating Statistics
14
Kite Realty Group
Top 25 Tenants by ABR as of September 30, 2025
(dollars in thousands, except per square foot data)
The following table includes the Company’s operating retail/mixed-use properties and standalone office properties.
Credit Ratings
Tenant
Primary DBA/ Number of Stores
Number
of Stores(1)
Total
Leased
GLA(2)
ABR(3)
% of
Weighted ABR(4)
S&P
Moody’s
1
The TJX Companies, Inc.
T.J. Maxx (18), Marshalls (13), HomeGoods (11), Homesense (5), Sierra (3), T.J. Maxx & HomeGoods combined (2)
Chico’s (7), Talbots (7), LOFT (5), Soma (4), Ann Taylor (4), White House Black Market (4)
30
127
4,443
0.7
%
N/A
N/A
24
Dollar Tree, Inc.
27
310
4,284
0.7
%
BBB
Baa2
25
Albertsons Companies, Inc.
Safeway (3), Tom Thumb (2), Jewel-Osco (1)
6
281
4,198
0.7
%
BB+
Ba1
Total Top Tenants
454
10,208
$
167,127
26.1
%
(1)Number of stores represents stores at consolidated and unconsolidated properties.
(2)Total leased GLA excludes the square footage of structures located on land owned by the Company and ground-leased to tenants.
(3)ABR represents the monthly contractual rent for September 30, 2025, for each applicable tenant multiplied by 12 and does not include tenant reimbursements. ABR represents 100% of the ABR at consolidated properties and the Company’s share of the ABR at unconsolidated properties, including ground lease rent.
(4)Percent of weighted ABR includes ground lease rent and represents the Company’s share of the ABR at consolidated and unconsolidated properties.
3rd Quarter 2025 Supplemental Financial and Operating Statistics
15
Kite Realty Group
Retail Leasing Spreads
Comparable Space(1)(2)
Category
Total
Leases(1)
Total
Sq. Ft.(1)
Leases
Sq. Ft.
Prior Rent PSF(3)
New Rent PSF(4)
Cash Rent Spread
TI, LL Work,
Lease Commissions PSF(5)
New Leases – Q3 2025
43
275,001
24
148,324
$
24.91
$
31.41
26.1
%
New Leases – Q2 2025
64
342,658
38
219,271
19.65
25.80
31.3
%
New Leases – Q1 2025
58
169,703
26
76,021
32.89
38.02
15.6
%
New Leases – Q4 2024
48
233,043
23
97,594
25.32
31.29
23.6
%
Total
213
1,020,405
111
541,210
$
23.97
$
30.04
25.3
%
$
97.19
Non-Option Renewals – Q3 2025
70
306,526
51
177,659
$
25.12
$
28.36
12.9
%
Non-Option Renewals – Q2 2025
63
223,294
52
159,247
27.12
32.47
19.7
%
Non-Option Renewals – Q1 2025
91
331,781
67
232,071
23.57
28.30
20.1
%
Non-Option Renewals – Q4 2024
93
447,352
69
323,610
20.67
23.65
14.4
%
Total
317
1,308,953
239
892,587
$
23.46
$
27.37
16.7
%
$
4.51
Option Renewals – Q3 2025
54
648,417
54
648,417
$
18.93
$
20.41
7.8
%
Option Renewals – Q2 2025
43
648,679
43
648,679
12.72
13.76
8.2
%
Option Renewals – Q1 2025
33
342,345
33
342,345
17.15
18.36
7.0
%
Option Renewals – Q4 2024
29
533,995
29
533,995
13.24
14.14
6.8
%
Total
159
2,173,436
159
2,173,436
$
15.40
$
16.56
7.5
%
$
—
Total – Q3 2025
167
1,229,944
129
974,400
$
20.97
$
23.53
12.2
%
Total – Q2 2025
170
1,214,631
133
1,027,197
16.43
19.23
17.0
%
Total – Q1 2025
182
843,829
126
650,437
21.28
24.20
13.7
%
Total – Q4 2024
170
1,214,390
121
955,199
16.99
19.11
12.5
%
Total
689
4,502,794
509
3,607,233
$
18.68
$
21.26
13.8
%
$
15.70
(1)Excludes office and ground leases. Comparable space leases on this table are included for second generation retail spaces. Comparable leases represent those leases for which there was a former tenant within the last 12 months.
(2)Comparable renewals exclude leases with terms 24 months or shorter.
(3)Prior rent represents minimum rent, if any, paid by the prior tenant in the final 12 months of the term. All amounts reported at lease execution.
(4)Contractual rent represents contractual minimum rent per square foot for the first 12 months of the lease.
(5)Includes redevelopment costs for tenant-specific landlord work and tenant allowances provided to tenants.
3rd Quarter 2025 Supplemental Financial and Operating Statistics
16
Kite Realty Group
Lease Expirations as of September 30, 2025
(dollars in thousands, except per square foot data)
The following table includes the Company’s operating retail/mixed-use properties and standalone office properties as of September 30, 2025.
Operating Portfolio
Expiring GLA(2)
Expiring Retail ABR per Sq. Ft.(3)
Number of
Expiring
Leases(1)
Shop Tenants
Anchor Tenants
Office Tenants
Expiring ABR (Pro rata)
Expiring Ground Lease ABR (Pro rata)
% of Total ABR (Pro rata)
Shop Tenants
Anchor Tenants
Total
2025
107
235,616
152,945
59,446
$
12,348
$
105
2.0
%
$
31.41
$
20.24
$
27.01
2026
427
972,628
1,209,968
123,598
49,600
2,429
8.2
%
31.21
14.18
21.77
2027
578
1,250,632
2,330,434
127,639
75,904
5,777
12.8
%
34.42
14.71
21.59
2028
612
1,317,308
2,537,204
325,926
90,441
6,638
15.2
%
36.46
14.77
22.19
2029
587
1,237,622
2,900,572
184,072
90,996
3,581
14.8
%
36.28
15.17
21.48
2030
469
1,121,096
1,990,075
120,309
65,124
5,846
11.1
%
32.98
13.09
20.26
2031
284
662,500
1,466,619
223,861
50,215
3,096
8.4
%
36.10
14.93
21.52
2032
220
532,337
1,137,005
179,104
38,670
466
6.0
%
34.23
14.87
21.04
2033
209
533,466
699,678
30,589
31,009
4,156
5.5
%
37.93
15.59
25.26
2034
187
388,334
689,269
79,914
29,093
2,224
4.9
%
41.98
17.13
26.09
Beyond
335
693,904
1,916,652
229,490
65,047
5,515
11.1
%
41.40
16.98
23.47
4,015
8,945,443
17,030,421
1,683,948
$
598,447
$
39,833
100.0
%
$
35.56
$
15.04
$
22.11
(1)Lease expirations table reflects rents in place as of September 30, 2025 and does not include option periods; 2025 expirations include 37 month-to-month tenants. This column also excludes ground leases.
(2)Expiring GLA excludes the square footage of structures located on land owned by the Company and ground-leased to tenants.
(3)ABR represents the monthly contractual rent as of September 30, 2025 for each applicable tenant multiplied by 12. Excludes tenant reimbursements and ground lease revenue.
3rd Quarter 2025 Supplemental Financial and Operating Statistics
17
Kite Realty Group
Components of Net Asset Value as of September 30, 2025
(dollars in thousands)
Cash Net Operating Income (“NOI”)
Page
Other Assets(1)
Page
GAAP property NOI (incl. ground lease revenue)
$
149,550
6
Cash, cash equivalents and restricted cash
$
92,254
3
Lease termination income
(18)
6
Tenant and other receivables (net of SLR)
57,516
3
Non-cash revenue adjustments
(6,289)
Prepaid and other assets
100,847
3
Other property-related revenue
(985)
6
Ground lease (“GL”) revenue
(10,637)
6
Consolidated Cash Property NOI (excl. GL)
$
131,621
Annualized Consolidated Cash Property NOI
(excl. ground leases)
$
526,484
Adjustments to Normalize Annualized Cash NOI
Liabilities
Remaining NOI to come online from development and redevelopment projects(2)
$
2,750
13
Mortgage and other indebtedness, net
$
(2,944,262)
10
Unconsolidated Adjusted EBITDA
40,812
Pro rata adjustment for joint venture debt
(192,925)
General and administrative expense allocable to property management activities included in property expenses ($4.1 million in Q3)
16,400
6, note 2
Accounts payable and accrued expenses
(203,114)
3
Total Adjustments
59,962
Other liabilities
(222,602)
3
Projected remaining under construction development/redevelopment(3)
(58,000)
13
Annualized Normalized Portfolio Cash NOI
(excl. ground leases)
$
586,446
Annualized ground lease NOI
42,548
Total Annualized Portfolio Cash NOI(4)
$
628,994
Common shares and Units outstanding
221,579,773
(1)Excludes construction in progress and entitled land held for development.
(2)Excludes the projected cash NOI and related cost from the future opportunities outlined on page 13.
(3)Remaining costs on page 13 for the development project.
(4)The above components of net asset value exclude NOI related to tenants that have signed leases but have not yet commenced paying rent as of September 30, 2025.
3rd Quarter 2025 Supplemental Financial and Operating Statistics
18
Kite Realty Group
Non-GAAP Financial Measures
NAREIT Funds from Operations
NAREIT Funds From Operations (“FFO”) is a widely used performance measure for real estate companies and is provided here as a supplemental measure of our operating performance. The Company calculates FFO, a non-GAAP financial measure, in accordance with the best practices described in the April 2002 National Policy Bulletin of the National Association of Real Estate Investment Trusts (“NAREIT”), as restated in 2018. The NAREIT white paper defines FFO as net income (calculated in accordance with GAAP), excluding (i) depreciation and amortization related to real estate, (ii) gains and losses from the sale of certain real estate assets, (iii) gains and losses from change in control, and (iv) impairment write-downs of certain real estate assets and investments in entities when the impairment is directly attributable to decreases in the value of depreciable real estate held by the entity.
Considering the nature of our business as a real estate owner and operator, the Company believes that FFO is helpful to investors in measuring our operational performance because it excludes various items included in net income that do not relate to or are not indicative of our operating performance, such as gains or losses from sales of depreciated property and depreciation and amortization, which can make periodic and peer analyses of operating performance more difficult. FFO (a) should not be considered as an alternative to net income (calculated in accordance with GAAP) for the purpose of measuring our financial performance, (b) is not an alternative to cash flows from operating activities (calculated in accordance with GAAP) as a measure of our liquidity, and (c) is not indicative of funds available to satisfy our cash needs, including our ability to make distributions. The Company’s computation of FFO may not be comparable to FFO reported by other REITs that do not define the term in accordance with the current NAREIT definition or that interpret the current NAREIT definition differently than we do. A reconciliation of net income (calculated in accordance with GAAP) to FFO is included elsewhere in this Financial Supplement.
From time to time, the Company may report or provide guidance with respect to “FFO, as adjusted,” which removes the impact of certain non-recurring and non-operating transactions or other items the Company does not consider to be representative of its core operating results including, without limitation, (i) gains or losses associated with the early extinguishment of debt, (ii) gains or losses associated with litigation involving the Company that is not in the normal course of business, (iii) merger and acquisition costs, (iv) the impact on earnings from employee severance, (v) the excess of redemption value over carrying value of preferred stock redemption, and (vi) the impact of prior period bad debt or the collection of accounts receivable previously written off (“prior period collection impact”), which are not otherwise adjusted in the Company’s calculation of FFO.
Core Funds from Operations
Core Funds From Operations (“Core FFO”) is a non-GAAP financial measure of operating performance that modifies FFO for certain non-cash transactions that result in recording income or expense and impact the Company’s period-over-period performance, including (i) amortization of deferred financing costs, (ii) non-cash compensation expense and other, (iii) straight-line rent related to minimum rent and common area maintenance, (iv) market rent amortization income, and (v) amortization of debt discounts, premiums and hedge instruments, and include adjustments related to our pro rata share from unconsolidated joint ventures for these categories as applicable. The Company believes that Core FFO is useful to investors in evaluating the core cash flow-generating operations of the Company by adjusting for items that we do not consider to be part of our core business operations, allowing for comparison of core operating performance of the Company between periods. Core FFO should not be considered as an alternative to net income as an indicator of the Company’s performance or as an alternative to cash flow as a measure of liquidity or the Company’s ability to make distributions. The Company’s computation of Core FFO may differ from the methodology for calculating Core FFO used by other REITs, and therefore, may not be comparable to such other REITs.
Adjusted Funds from Operations
Adjusted Funds From Operations (“AFFO”) is a non-GAAP financial measure of operating performance used by many companies in the real estate industry. AFFO modifies FFO for certain cash and non-cash transactions that are not included in FFO. AFFO should not be considered as an alternative to net income as an indicator of the Company’s performance or as an alternative to cash flow as a measure of liquidity or the Company’s ability to make distributions. Management considers AFFO a useful supplemental measure of the Company’s performance. The Company’s computation of AFFO may differ from the methodology for calculating AFFO used by other REITs, and therefore, may not be comparable to such other REITs. A reconciliation of net income (calculated in accordance with GAAP) to AFFO is included elsewhere in this Financial Supplement.
Net Operating Income, Cash Net Operating Income and Same Property Net Operating Income
The Company uses net operating income (“NOI”) and cash NOI, which are non-GAAP financial measures, to evaluate the performance of our properties. The Company also uses total property NOI, which is defined as NOI plus net gains from outlot sales. The Company defines NOI and cash NOI as income from our real estate, including lease termination fees received from tenants, less our property operating expenses. NOI and cash NOI exclude amortization of capitalized tenant improvement costs and leasing commissions and certain corporate-level expenses, including merger and acquisition costs. Cash NOI also excludes other property-related revenue as that activity is recurring but unpredictable in its occurrence, straight-line rent adjustments, and amortization of in-place lease liabilities, net. The Company believes that NOI and cash NOI are helpful to investors as measures of our operating performance because they exclude various items included in net income that do not relate to or are not indicative of our operating performance, such as depreciation and amortization, interest expense, and impairment, if any.
3rd Quarter 2025 Supplemental Financial and Operating Statistics
19
Kite Realty Group
Non-GAAP Financial Measures (continued)
Net Operating Income, Cash Net Operating Income and Same Property Net Operating Income (continued)
The Company also uses same property NOI (“Same Property NOI”), a non-GAAP financial measure, to evaluate the performance of our properties. Same Property NOI is net income excluding properties that have not been owned for the full periods presented. Same Property NOI also excludes (i) net gains from outlot sales, (ii) straight-line rent revenue, (iii) lease termination income in excess of lost rent, (iv) amortization of lease intangibles, and (v) significant prior period expense recoveries and adjustments, if any. When the Company receives payments in excess of any accounts receivable for terminating a lease, Same Property NOI will include such excess payments as monthly rent until the earlier of the expiration of 12 months or the start date of a replacement tenant.
The Company believes that Same Property NOI is helpful to investors as a measure of our operating performance because it includes only the NOI of properties that have been owned for the full periods presented. The Company believes such presentation eliminates disparities in net income due to the acquisition or disposition of properties during the particular periods presented and thus provides a more consistent metric for the comparison of our properties. Same Property NOI includes the results of properties that have been owned for the entire current and prior year reporting periods. Same Property NOI for all periods presented includes 52% of the NOI from the three previously wholly owned properties that were contributed to the GIC Portfolio Joint Venture in June 2025.
NOI and Same Property NOI should not, however, be considered as an alternative to net income (calculated in accordance with GAAP) as an indicator of our financial performance. The Company’s computation of NOI and Same Property NOI may differ from the methodology used by other REITs and, therefore, may not be comparable to such other REITs.
When evaluating the properties that are included in the Same Property Pool, we have established specific criteria for determining the inclusion of properties acquired or those recently under development. An acquired property is included in the Same Property Pool when there is a full quarter of operations in both years subsequent to the acquisition date. Development and redevelopment properties are included in the Same Property Pool four full quarters after the properties have been transferred to the operating portfolio. A redevelopment property is first excluded from the Same Property Pool when the execution of a redevelopment plan is likely, and we (a) begin recapturing space from tenants or (b) the contemplated plan significantly impacts the operations of the property. For the three and nine months ended September 30, 2025, the Same Property Pool excludes the following: (i) properties acquired or placed in service during 2024 and 2025; (ii) The Corner – IN, which was reclassified from active development into our operating portfolio in March 2025; (iii) Eastgate Crossing, which was reclassified from our operating portfolio in September 2025 due to significant disruption caused by severe flooding as a result of Tropical Storm Chantal; (iv) our active development project at One Loudoun Expansion; (v) Hamilton Crossing Centre and Edwards Multiplex – Ontario, which were reclassified from our operating portfolio into redevelopment in June 2014 and March 2023, respectively; (vi) properties sold or classified as held for sale during 2024 and 2025; and (vii) standalone office properties, including the Carillon medical office building, which was reclassified from active redevelopment into our office portfolio in December 2024.
Earnings Before Interest, Taxes, Depreciation and Amortization (“EBITDA”) and Net Debt to Adjusted EBITDA
The Company defines EBITDA, a non-GAAP financial measure, as net income before interest expense, income tax expense of the taxable REIT subsidiaries, and depreciation and amortization. For informational purposes, the Company also provides Adjusted EBITDA, which it defines as EBITDA less (i) EBITDA from unconsolidated entities, as adjusted, (ii) gains on sales of operating properties or impairment charges, (iii) merger and acquisition costs, (iv) other income and expense, (v) noncontrolling interest Adjusted EBITDA, and (vi) other non-recurring activity or items impacting comparability from period to period. Annualized Adjusted EBITDA is Adjusted EBITDA for the most recent quarter multiplied by four. Net Debt to Adjusted EBITDA is the Company’s share of net debt divided by Annualized Adjusted EBITDA. EBITDA, Adjusted EBITDA, Annualized Adjusted EBITDA and Net Debt to Adjusted EBITDA, as calculated by the Company, are not comparable to EBITDA and EBITDA-related measures reported by other REITs that do not define EBITDA and EBITDA-related measures exactly as we do. EBITDA, Adjusted EBITDA and Annualized Adjusted EBITDA do not represent cash generated from operating activities in accordance with GAAP and should not be considered alternatives to net income as an indicator of performance or as alternatives to cash flows from operating activities as an indicator of liquidity.
Considering the nature of our business as a real estate owner and operator, the Company believes that EBITDA, Adjusted EBITDA and the ratio of Net Debt to Adjusted EBITDA are helpful to investors in measuring our operational performance because they exclude various items included in net income that do not relate to or are not indicative of our operating performance, such as gains or losses from sales of depreciated property and depreciation and amortization, which can make periodic and peer analyses of operating performance more difficult. For informational purposes, the Company also provides Annualized Adjusted EBITDA, adjusted as described above. The Company believes this supplemental information provides a meaningful measure of its operating performance. The Company believes presenting EBITDA and the related measures in this manner allows investors and other interested parties to form a more meaningful assessment of the Company’s operating results.
3rd Quarter 2025 Supplemental Financial and Operating Statistics