.2
Disclaimer
Certain statements included or incorporated by reference in this document may constitute forward-looking statements or financial outlooks under applicable securities legislation. Such forward-looking statements or information typically contain statements with words such as "anticipate", "believe", "expect", "plan", "intend", "estimate", "propose", or similar words suggesting future outcomes or statements regarding an outlook. Forward looking statements or information in this document may include, but are not limited to: capital expenditures and Vermilion’s ability to fund such expenditures; Vermilion’s additional debt capacity providing it with additional working capital; the flexibility of Vermilion’s capital program and operations; business strategies and objectives; operational and financial performance; estimated volumes of reserves and resources; petroleum and natural gas sales; future production levels and the timing thereof, including Vermilion’s 2021 guidance, and rates of average annual production growth; the effect of changes in crude oil and natural gas prices, changes in exchange rates and significant declines in production or sales volumes due to unforeseen circumstances; the effect of possible changes in critical accounting estimates; statements regarding the growth and size of Vermilion’s future project inventory, and the wells expected to be drilled in 2021; exploration and development plans and the timing thereof; Vermilion’s ability to reduce its debt, including its ability to redeem senior unsecured notes prior to maturity; statements regarding Vermilion’s hedging program, its plans to add to its hedging positions, and the anticipated impact of Vermilion’s hedging program on project economics and free cash flows; the potential financial impact of climate-related risks; acquisition and disposition plans and the timing thereof; operating and other expenses, including the payment and amount of future dividends; royalty and income tax rates and Vermilion’s expectations regarding future taxes and taxability; and the timing of regulatory proceedings and approvals.
Such forward-looking statements or information are based on a number of assumptions, all or any of which may prove to be incorrect. In addition to any other assumptions identified in this document, assumptions have been made regarding, among other things: the ability of Vermilion to obtain equipment, services and supplies in a timely manner to carry out its activities in Canada and internationally; the ability of Vermilion to market crude oil, natural gas liquids, and natural gas successfully to current and new customers; the timing and costs of pipeline and storage facility construction and expansion and the ability to secure adequate product transportation; the timely receipt of required regulatory approvals; the ability of Vermilion to obtain financing on acceptable terms; foreign currency exchange rates and interest rates; future crude oil, natural gas liquids, and natural gas prices; and management’s expectations relating to the timing and results of exploration and development activities.
Although Vermilion believes that the expectations reflected in such forward-looking statements or information are reasonable, undue reliance should not be placed on forward-looking statements because Vermilion can give no assurance that such expectations will prove to be correct. Financial outlooks are provided for the purpose of understanding Vermilion’s financial position and business objectives, and the information may not be appropriate for other purposes. Forward-looking statements or information are based on current expectations, estimates, and projections that involve a number of risks and uncertainties which could cause actual results to differ materially from those anticipated by Vermilion and described in the forward-looking statements or information. These risks and uncertainties include, but are not limited to: the ability of management to execute its business plan; the risks of the oil and gas industry, both domestically and internationally, such as operational risks in exploring for, developing and producing crude oil, natural gas liquids, and natural gas; risks and uncertainties involving geology of crude oil, natural gas liquids, and natural gas deposits; risks inherent in Vermilion's marketing operations, including credit risk; the uncertainty of reserves estimates and reserves life and estimates of resources and associated expenditures; the uncertainty of estimates and projections relating to production and associated expenditures; potential delays or changes in plans with respect to exploration or development projects; Vermilion's ability to enter into or renew leases on acceptable terms; fluctuations in crude oil, natural gas liquids, and natural gas prices, foreign currency exchange rates and interest rates; health, safety, and environmental risks; uncertainties as to the availability and cost of financing; the ability of Vermilion to add production and reserves through exploration and development activities; the possibility that government policies or laws may change or governmental approvals may be delayed or withheld; uncertainty in amounts and timing of royalty payments; risks associated with existing and potential future law suits and regulatory actions against Vermilion; and other risks and uncertainties described elsewhere in this document or in Vermilion's other filings with Canadian securities regulatory authorities.
The forward-looking statements or information contained in this document are made as of the date hereof and Vermilion undertakes no obligation to update publicly or revise any forward-looking statements or information, whether as a result of new information, future events, or otherwise, unless required by applicable securities laws.
All crude oil and natural gas reserve and resource information contained in this document has been prepared and presented in accordance with National Instrument 51-101 Standards of Disclosure for Oil and Gas Activities and the Canadian Oil and Gas Evaluation Handbook. Reserves estimates have been made assuming that development of each property in respect of which the estimate is made will occur, without regard to the likely availability of funding required for such development. The actual crude oil and natural gas reserves and future production will be greater than or less than the estimates provided in this document.
Natural gas volumes have been converted on the basis of six thousand cubic feet of natural gas to one barrel of oil equivalent. Barrels of oil equivalent (boe) may be misleading, particularly if used in isolation. A boe conversion ratio of six thousand cubic feet to one barrel of oil is based on an energy equivalency conversion method primarily applicable at the burner tip and does not represent a value equivalency at the wellhead.
Financial data contained within this document are reported in Canadian dollars unless otherwise stated.
Vermilion Energy Inc. ■ Page 1 ■ 2020 Annual Report
Abbreviations
| $M | thousand dollars |
| $MM | million dollars |
| AECO | the daily average benchmark price for natural gas at the AECO ‘C’ hub in Alberta |
| bbl(s) | barrel(s) |
| bbls/d | barrels per day |
| boe | barrel of oil equivalent, including: crude oil, condensate, natural gas liquids, and natural gas (converted on the basis of one boe for six mcf of natural gas) |
| boe/d | barrel of oil equivalent per day |
| GJ | gigajoules |
| LSB | light sour blend crude oil reference price |
| mbbls | thousand barrels |
| mcf | thousand cubic feet |
| mmcf/d | million cubic feet per day |
| NBP | the reference price paid for natural gas in the United Kingdom at the National Balancing Point Virtual Trading Point. |
| NGLs | natural gas liquids, which includes butane, propane, and ethane |
| PRRT | Petroleum Resource Rent Tax, a profit based tax levied on petroleum projects in Australia |
| tCO2e | tonnes of carbon dioxide equivalent |
| TTF | the price for natural gas in the Netherlands, quoted in megawatt hours of natural gas, at the Title Transfer Facility Virtual Trading Point |
| WTI | West Texas Intermediate, the reference price paid for crude oil of standard grade in US dollars at Cushing, Oklahoma |
Vermilion Energy Inc. ■ Page 2 ■ 2020 Annual Report
Management's Discussion and Analysis
The following is Management’s Discussion and Analysis (“MD&A”), dated March 5, 2021, of Vermilion Energy Inc.’s (“Vermilion”, “we”, “our”, “us” or the “Company”) operating and financial results as at and for the three months and year ended December 31, 2020 compared with the corresponding periods in the prior year.
This discussion should be read in conjunction with the audited consolidated financial statements for the year ended December 31, 2020 and 2019, together with the accompanying notes. Additional information relating to Vermilion, including its Annual Information Form, is available on SEDAR at www.sedar.com or on Vermilion’s website at www.vermilionenergy.com.
The audited consolidated financial statements for the year ended December 31, 2020 and comparative information have been prepared in Canadian dollars and in accordance with International Financial Reporting Standards (“IFRS” or, alternatively, “GAAP”) as issued by the International Accounting Standards Board ("IASB").
This MD&A includes references to certain financial and performance measures which do not have standardized meanings prescribed by IFRS. These measures include:
| • | Fund flows from operations: Fund flows from operations is a measure of profit or loss in accordance with IFRS 8 “Operating Segments”. Please see "Segmented Information" in the "Notes to the Consolidated Financial Statements" for a reconciliation of fund flows from operations to net earnings. We analyze fund flows from operations both on a consolidated basis, core region, and on a business unit basis in order to assess the contribution of each business unit to our ability to generate income necessary to pay dividends, repay debt, fund asset retirement obligations, and make capital investments. |
| • | Net debt: Net debt is a capital management measure in accordance with IAS 1 "Presentation of Financial Statements". Net debt is comprised of long-term debt plus current liabilities less current assets and represents Vermilion's net financing obligations after adjusting for the timing of working capital fluctuations. Net debt excludes lease obligations which are secured by a corresponding right-of-use asset. Please see "Capital disclosures" in the "Notes to the Consolidated Financial Statements" for additional information. |
| • | Netbacks: Netbacks are per boe and per mcf performance measures used in the analysis of operational activities. We assess netbacks both on a consolidated basis and on a business unit basis in order to compare and assess the operational and financial performance of each business unit versus other business units and also versus third-party crude oil and natural gas producers. |
In addition, this MD&A includes references to certain financial measures which are not specified, defined, or determined under IFRS and are therefore considered non-GAAP financial measures. These non-GAAP financial measures are unlikely to be comparable to similar financial measures presented by other issuers. For a full description of these non-GAAP financial measures and a reconciliation of these measures to their most directly comparable GAAP measures, please refer to “Non-GAAP Financial Measures”.
Product Type Disclosure
Under National Instrument 51-101 "Standards of Disclosure for Oil and Gas Activities", disclosure of production volumes should include segmentation by product type as defined in the instrument. In this report, references to "crude oil" mean "light crude oil and medium crude oil" and references to "natural gas" mean "conventional natural gas".
In addition, in Supplemental Table 4 "Production", Vermilion provides a reconciliation from total production volumes to product type and also a reconciliation of "crude oil and condensate" and "NGLs" to the product types "light crude oil and medium crude oil" and "natural gas liquids".
Production volumes reported are based on quantities as measured at the first point of sale.
Vermilion Energy Inc. ■ Page 3 ■ 2020 Annual Report
Guidance
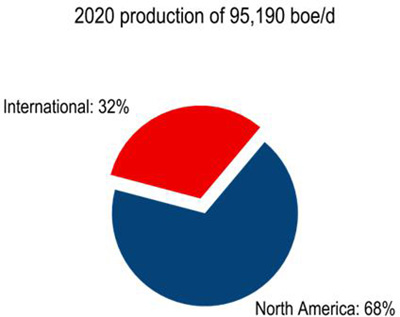
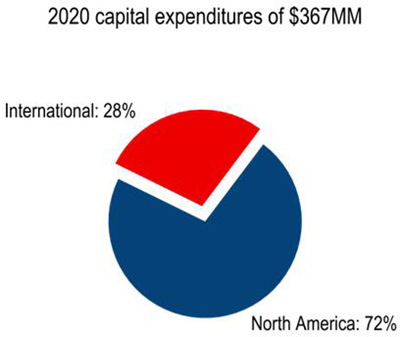
On October 31, 2019, we released our 2020 capital budget and associated production guidance. On March 16, 2020, we announced a reduction of our 2020 capital budget and associated production guidance in response to a decrease in oil prices as a result of the coronavirus ("COVID-19") pandemic and the ensuing oil price war between OPEC+ members. On November 9, 2020, we reduced the upper end of our annual production guidance range to reflect revised production estimates, which take into account the deferred startup of new natural gas production in the Netherlands to take advantage of higher European natural gas prices during the winter months. Actual 2020 capital spending of $367 million and 2020 average production of 95,190 boe/d were both slightly above the midpoint of our guidance ranges.
On January 18, 2021, we released our 2021 capital budget and associated production guidance.
The following table summarizes our guidance:
| Date | Capital Expenditures ($MM) | Production (boe/d) | |
| 2020 Guidance | |||
| 2020 Guidance | October 31, 2019 | 450 | 100,000 to 103,000 |
| 2020 Guidance | March 16, 2020 | 350 to 370 | 94,000 to 98,000 |
| 2020 Guidance | November 9, 2020 | 350 to 370 | 94,000 to 96,000 |
| 2020 Actual Results | March 8, 2021 | 367 | 95,190 |
| 2021 Guidance | |||
| 2021 Guidance | January 18, 2021 | 300 | 83,000 to 85,000 |
Vermilion Energy Inc. ■ Page 4 ■ 2020 Annual Report
Vermilion's Business
Vermilion is a Calgary, Alberta based international oil and gas producer focused on the acquisition, exploration, development, and optimization of producing properties in North America, Europe, and Australia. We manage our business through our Calgary head office and our international business unit offices.
| |
|
| |
| | |
Vermilion Energy Inc. ■ Page 5 ■ 2020 Annual Report
Consolidated Results Overview
| Q4 2020 | Q3 2020 | Q4 2019 | Q4/20
vs. Q3/20 |
Q4/20
vs. Q4/19 |
2020 | 2019 | 2020
vs. 2019 | ||||||
| Production (1) | |||||||||||||
| Crude oil and condensate (bbls/d) | 40,555 | 43,240 | 46,261 | (6)% | (12)% | 43,421 | 47,902 | (9)% | |||||
| NGLs (bbls/d) | 8,627 | 9,509 | 8,160 | (9)% | 6% | 8,937 | 7,984 | 12% | |||||
| Natural gas (mmcf/d) | 232.00 | 256.34 | 260.72 | (10)% | (11)% | 256.99 | 266.82 | (4)% | |||||
| Total (boe/d) | 87,848 | 95,471 | 97,875 | (8)% | (10)% | 95,190 | 100,357 | (5)% | |||||
| (Draw) build in inventory (mbbls) | (118) | (68) | 169 | (260) | (12) | ||||||||
| Financial metrics | |||||||||||||
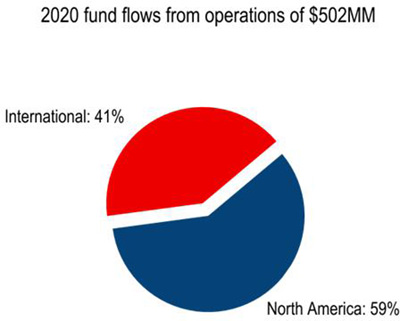
| Fund flows from operations ($M) | 135,212 | 114,776 | 215,592 | 18% | (37)% | 502,065 | 908,055 | (45)% | |||||
| Per share ($/basic share) | 0.85 | 0.73 | 1.38 | 16% | (38)% | 3.18 | 5.87 | (46)% | |||||
| Net (loss) earnings ($M) | (57,707) | (69,926) | 1,477 | (18)% | N/A | (1,517,427) | 32,799 | N/A | |||||
| Per share ($/basic share) | (0.36) | (0.44) | 0.01 | (18)% | N/A | (9.61) | 0.21 | N/A | |||||
| Net debt ($M) | 2,105,983 | 2,136,219 | 1,993,194 | (1)% | 6% | 2,105,983 | 1,993,194 | 6% | |||||
| Cash dividends ($/share) | — | — | 0.690 | —% | (100)% | 0.575 | 2.760 | (79)% | |||||
| Activity | |||||||||||||
| Capital expenditures ($M) | 59,894 | 31,330 | 100,625 | 91% | (41)% | 367,202 | 523,164 | (30)% | |||||
| Acquisitions ($M) | 4,821 | 6,720 | 9,165 | 25,810 | 38,472 | ||||||||
| (1) | Please refer to Supplemental Table 4 "Production" for disclosure by product type. |
| Financial performance review |
Q4 2020 vs. Q3 2020
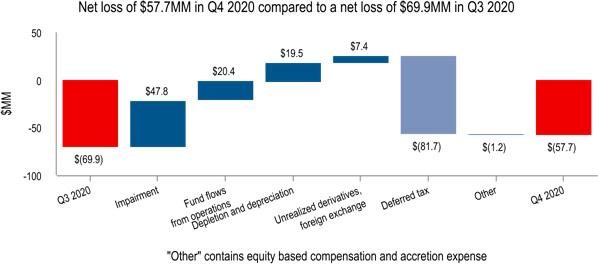
| • | We recorded a net loss of $57.7 million ($0.36/basic share) in Q4 2020 compared to a net loss of $69.9 million ($0.44/basic share) in Q3 2020. This quarter-over-quarter decrease in net loss was primarily driven by decreased impairment charges in Q4 2020, increased funds flow from operations, and lower depletion and depreciation charges, partially offset by an increase in deferred taxes. |
Vermilion Energy Inc. ■ Page 6 ■ 2020 Annual Report
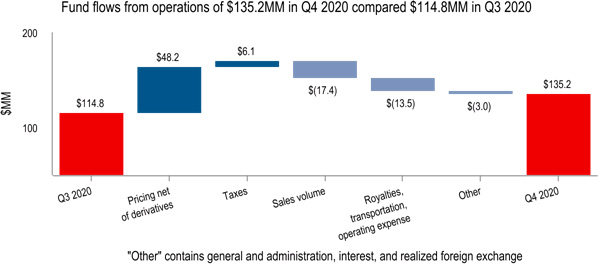
| • | Fund flows from operations for Q4 2020 increased versus Q3 2020 from $114.8 million to $135.2 million primarily driven by realized commodity pricing which increased 21% from $31.86/boe to $38.57/boe. This was partially offset by lower sales volumes mainly due to decreased production in Q4 2020 driven by natural decline. |
Q4 2020 vs. Q4 2019
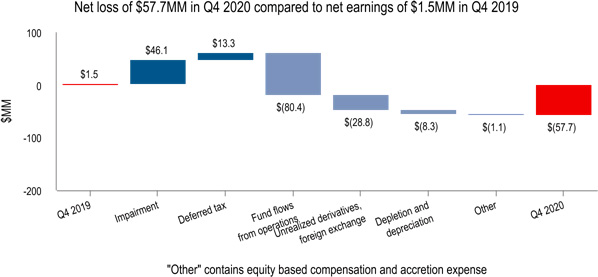
| • | We recorded a net loss of $57.7 million ($0.36/basic share) for Q4 2020 compared to net earnings of $1.5 million ($0.01/basic share) in Q4 2019. The decrease was primarily driven by lower fund flows from operations of $80.4 million due to lower commodity prices in 2020, partially offset by lower impairment charges compared to Q4 2019. |
Vermilion Energy Inc. ■ Page 7 ■ 2020 Annual Report
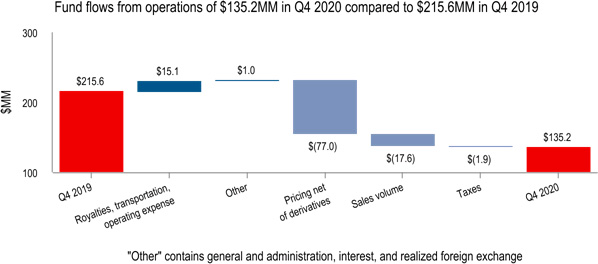
| • | We generated fund flows from operations of $135.2 million in Q4 2020, a decrease from $215.6 million in Q4 2019 primarily as a result of lower commodity prices and lower sales volumes primarily due to natural decline on our production. Our consolidated realized price per boe decreased from $44.00/boe in Q4 2019 to $38.57/boe in Q4 2020. |
2020 vs. 2019
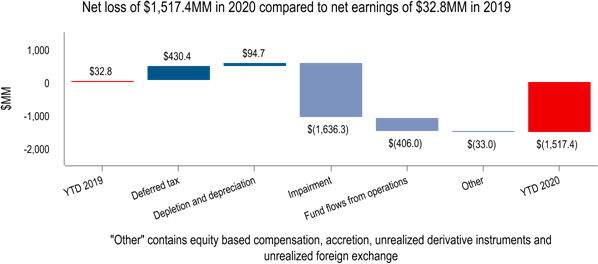
| • | For the year ended December 31, 2020, a net loss of $1,517.4 million was recorded compared to net earnings of $32.8 million for the comparable period in 2019. The decrease in net earnings was primarily due to impairment charges we recorded of $1.2 billion in 2020 (net of $0.4 billion income tax recovery) and lower fund flows from operations driven by decreases in realized prices due to the impacts of COVID-19 and the OPEC+ price war. |
Vermilion Energy Inc. ■ Page 8 ■ 2020 Annual Report
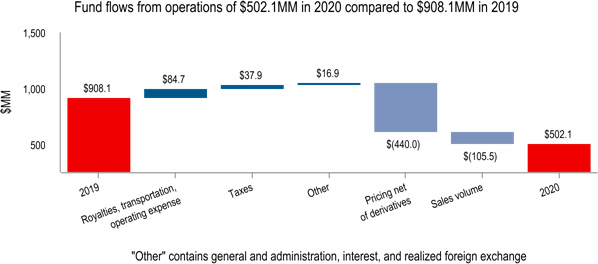
| • | Fund flows from operations decreased by 45% for the year ended December 31, 2020 versus the same period in 2019 primarily driven by a 31% decrease in our consolidated realized price from $46.12/boe to $31.90/boe due to lower commodity prices. Sales volumes decreased year-over-year primarily due to decreases in France stemming from the confinement measures in 2020 and resulting refinery shut-down, in Ireland as a result of natural decline, and in Australia due to timing of liftings. |
| Production review |
Q4 2020 vs. Q3 2020
| • | Consolidated average production of 87,848 boe/d during Q4 2020 represented a decrease of 8% from Q3 2020 production of 95,471 boe/d. Production decreases in Canada of 5,416 boe/d and in the United States of 796 boe/d were primarily driven by natural declines, and in Australia of 768 boe/d due to 11-day planned turnaround activities. |
Q4 2020 vs. Q4 2019
| • | Consolidated average production of 87,848 boe/d in Q4 2020 represented a decrease of 10% from Q4 2019 production of 97,875 boe/d. Production decreases in Canada of 4,753 boe/d, in Ireland of 1,256 boe/d and in France of 1,009 boe/d were mainly due to natural declines. |
2020 vs. 2019
| • | Consolidated average production of 95,190 boe/d for the year ended December 31, 2020 represented a decrease of 5% from the comparable period in 2019 of 100,357 boe/d. Production decreases were primarily in France due to the Grandpuits refinery temporary shutdown in Q2 2020, in Ireland due to natural declines and planned turnarounds, in Australia due to downtime throughout 2020 and cyclone activity in Q1 2020 and in Canada due to natural declines. These decreases were partially offset by production increases in the United States due to new wells brought online in 2019 and 2020. |
Vermilion Energy Inc. ■ Page 9 ■ 2020 Annual Report
| Activity review |
| • | For the three months ended December 31, 2020, capital expenditures of $59.9 million were incurred. |
| • | In our North America core region, capital expenditures of $33.8 million were incurred during the fourth quarter. In Canada, $32.9 million was incurred primarily related to increased drilling activity where we drilled seven (6.6 net) wells. |
| • | In our International core region, capital expenditures of $26.1 million were incurred during the quarter. $12.8 million of capital expenditures were incurred in France primarily related to increased activity on well workovers and facilities, $4.4 million were incurred in Australia primarily related to asset optimization projects, $3.4 million were in the Netherlands primarily related to workovers and facility projects, and $3.1 million in Germany primarily related to various field optimization projects. |
| Sustainability review |
Dividends
| • | On March 6, 2020, in response to weakness in commodity prices and reduced global economic prospects following the outbreak of COVID-19, Vermilion's board of directors approved a 50% reduction to the March dividend, payable April 15, 2020, to $0.115 per share. On April 15, due to further deterioration of economic prospects and commodity prices resulting from the impact of COVID-19, the board of directors suspended the monthly dividend as a further measure to strengthen the financial position of the Company. |
| • | Total dividends of $0.575 per common share were declared for the year ended December 31, 2020. |
Long-term debt and net debt
| • | Long-term debt remained consistent at $1.9 billion as at December 31, 2020 from December 31, 2019. |
| • | Net debt increased to $2.1 billion as at December 31, 2020 from $2.0 billion as at December 31, 2019, primarily due to a decrease in net working capital driven by the change in the mark-to-market position of our European gas derivative instruments and our equity swap position moving into current liabilities. |
| • | The ratio of net debt to four quarter trailing fund flows from operations increased to 4.19 as at December 31, 2020 (December 31, 2019 - 2.20) mainly due to lower four quarter trailing fund flows from operations as a result of lower commodity prices, combined with an increase in net debt. |
Vermilion Energy Inc. ■ Page 10 ■ 2020 Annual Report
Benchmark Commodity Prices
| Q4 2020 | Q3 2020 | Q4 2019 | Q4/20 vs. Q3/20 |
Q4/20
vs. Q4/19 |
2020 | 2019 | 2020
vs. 2019 | ||||||
| Crude oil | |||||||||||||
| WTI ($/bbl) | 55.58 | 54.54 | 75.19 | 2% | (26)% | 52.86 | 75.67 | (30)% | |||||
| WTI (US $/bbl) | 42.66 | 40.93 | 56.96 | 4% | (25)% | 39.40 | 57.03 | (31)% | |||||
| Edmonton Sweet index ($/bbl) | 50.28 | 49.86 | 68.10 | 1% | (26)% | 45.72 | 69.19 | (34)% | |||||
| Edmonton Sweet index (US $/bbl) | 38.59 | 37.42 | 51.59 | 3% | (25)% | 34.08 | 52.15 | (35)% | |||||
| Saskatchewan LSB index ($/bbl) | 50.76 | 50.06 | 68.09 | 1% | (26)% | 45.80 | 69.66 | (34)% | |||||
| Saskatchewan LSB index (US $/bbl) | 38.96 | 37.57 | 51.58 | 4% | (25)% | 34.14 | 52.50 | (35)% | |||||
| Canadian C5+ Condensate index ($/bbl) | 55.43 | 50.02 | 69.97 | 11% | (21)% | 49.85 | 70.13 | (29)% | |||||
| Canadian C5+ Condensate index (US $/bbl) | 42.54 | 37.54 | 53.01 | 13% | (20)% | 37.16 | 52.86 | (30)% | |||||
| Dated Brent ($/bbl) | 57.63 | 57.29 | 83.49 | 1% | (31)% | 55.90 | 85.31 | (35)% | |||||
| Dated Brent (US $/bbl) | 44.23 | 43.00 | 63.25 | 3% | (30)% | 41.67 | 64.30 | (35)% | |||||
| Natural gas | |||||||||||||
| AECO ($/mcf) | 2.64 | 2.24 | 2.48 | 18% | 7% | 2.23 | 1.76 | 27% | |||||
| NBP ($/mcf) | 6.99 | 3.67 | 5.38 | 91% | 30% | 4.30 | 5.90 | (27)% | |||||
| NBP (€/mcf) | 4.50 | 2.36 | 3.68 | 91% | 22% | 2.81 | 3.97 | (29)% | |||||
| TTF ($/mcf) | 6.63 | 3.51 | 5.36 | 89% | 24% | 4.18 | 5.90 | (29)% | |||||
| TTF (€/mcf) | 4.27 | 2.25 | 3.67 | 90% | 16% | 2.74 | 3.97 | (31)% | |||||
| Henry Hub ($/mcf) | 3.47 | 2.63 | 3.30 | 32% | 5% | 2.78 | 3.49 | (20)% | |||||
| Henry Hub (US $/mcf) | 2.66 | 1.97 | 2.50 | 35% | 6% | 2.07 | 2.63 | (21)% | |||||
| Average exchange rates | |||||||||||||
| CDN $/US $ | 1.30 | 1.33 | 1.32 | (2)% | (2)% | 1.34 | 1.33 | 1% | |||||
| CDN $/Euro | 1.55 | 1.56 | 1.46 | (1)% | 6% | 1.53 | 1.49 | 3% | |||||
| Realized prices | |||||||||||||
| Crude oil and condensate ($/bbl) | 55.31 | 52.77 | 71.25 | 5% | (22)% | 50.53 | 74.42 | (32)% | |||||
| NGLs ($/bbl) | 19.20 | 15.04 | 14.63 | 28% | 31% | 13.06 | 13.61 | (4)% | |||||
| Natural gas ($/mcf) | 4.13 | 2.34 | 3.61 | 77% | 14% | 2.77 | 3.58 | (23)% | |||||
| Total ($/boe) | 38.57 | 31.86 | 44.00 | 21% | (12)% | 31.90 | 46.12 | (31)% | |||||
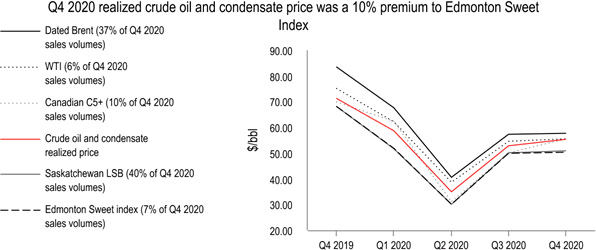
As an internationally diversified producer, we are exposed to a range of commodity prices. In our North America core region, our crude oil is sold at benchmarks linked to WTI (including the Edmonton Sweet index, the Saskatchewan LSB index, and the Canadian C5+ index) and our natural gas is sold at the AECO index (in Canada) or the Henry Hub index (in the United States). In our International core region, our crude oil is sold with reference to Dated Brent and our natural gas is sold with reference to NBP, TTF, or indices highly correlated to TTF.
Vermilion Energy Inc. ■ Page 11 ■ 2020 Annual Report
| • | Crude oil prices increased in Q4 2020 relative to Q3 2020 due to continued global demand recovery, a coordinated supply cut from the OPEC+ group, and lower US shale production, with WTI and Brent prices rising quarter-over-quarter by 4% and 3% respectively. For the three months ended December 31, 2020, WTI and Brent prices decreased by 25% and 30%, respectively, versus the comparable period in the prior year. |
| • | In Canadian dollar terms, quarter-over-quarter, the Edmonton Sweet differential increased by $0.62/bbl to a discount of $5.30/bbl against WTI, and the Saskatchewan LSB differential increased by $0.34/bbl to a discount of $4.82/bbl against WTI. |
| • | Approximately 37% of Vermilion’s Q4 2020 crude oil and condensate production was priced at the Dated Brent index (which averaged a premium to WTI of US$1.57/bbl), while the remainder of our crude oil and condensate production was priced at the Saskatchewan LSB, Canadian C5+, Edmonton Sweet, and WTI indices. |
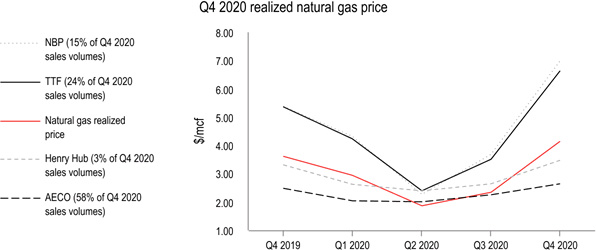
| • | In Canadian dollar terms, prices for European natural gas (TTF and NBP) rose by 89% and 91%, respectively, in Q4 2020 compared to Q3 2020. Seasonal demand and competition for LNG cargoes improved prices. |
| • | Natural gas prices at AECO in Q4 2020 increased by 18% compared to Q3 2020, with seasonal demand and export increases improving prices. |
| • | For Q4 2020, average European natural gas prices represented a $4.17/mcf premium to AECO. Approximately 39% of our natural gas production in Q4 2020 benefited from this premium European pricing. |
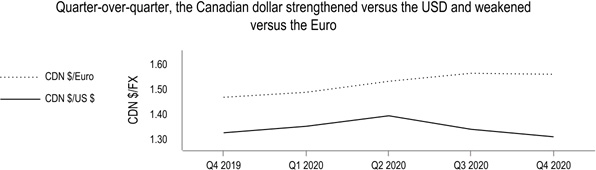
| • | For the three months ended December 31, 2020, the Canadian dollar strengthened 2% against the US dollar quarter-over-quarter. The annual average in 2020 was 1% weaker versus 2019. |
| • | For the three months ended December 31, 2020, the Canadian dollar remained flat against the Euro quarter-over-quarter. The annual average in 2020 was 3% weaker versus 2019. |
Vermilion Energy Inc. ■ Page 12 ■ 2020 Annual Report
North America
| Q4 2020 | Q4 2019 | 2020 | 2019 | |||||||||
| Production (1) | ||||||||||||
| Crude oil and condensate (bbls/d) | 26,459 | 30,560 | 29,043 | 30,798 | ||||||||
| NGLs (bbls/d) | 8,628 | 8,161 | 8,937 | 7,984 | ||||||||
| Natural gas (mmcf/d) | 142.13 | 153.34 | 158.85 | 155.24 | ||||||||
| Total production volume (boe/d) | 58,774 | 64,276 | 64,456 | 64,654 | ||||||||
| (1) | Please refer to Supplemental Table 4 "Production" for disclosure by product type. |
| Q4 2020 | Q4 2019 | 2020 | 2019 | |||||||||||||
| $M | $/boe | $M | $/boe | $M | $/boe | $M | $/boe | |||||||||
| Sales | 175,808 | 32.51 | 229,782 | 38.86 | 635,637 | 26.94 | 903,434 | 38.28 | ||||||||
| Royalties | (19,670) | (3.64) | (29,443) | (4.98) | (72,407) | (3.07) | (112,785) | (4.78) | ||||||||
| Transportation | (10,358) | (1.92) | (10,384) | (1.76) | (42,843) | (1.82) | (41,261) | (1.75) | ||||||||
| Operating | (59,162) | (10.94) | (65,927) | (11.15) | (236,704) | (10.03) | (259,160) | (10.98) | ||||||||
| General and administration (1) | (10,484) | (1.94) | (5,745) | (0.97) | (29,784) | (1.26) | (20,368) | (0.86) | ||||||||
| Corporate income tax recovery (expense) (1) | 241 | 0.04 | (660) | (0.11) | (202) | (0.01) | (406) | (0.02) | ||||||||
| Fund flows from operations | 76,375 | 14.12 | 117,623 | 19.89 | 253,697 | 10.75 | 469,454 | 19.89 | ||||||||
| Capital expenditures | (33,781) | (69,775) | (265,261) | (350,940) | ||||||||||||
| Free cash flow | 42,594 | 47,848 | (11,564) | 118,514 | ||||||||||||
| (1) | Includes amounts from Corporate segment. |
In North America, production averaged 58,774 boe/d in Q4 2020, a decrease of 9% year-over-year primarily due to natural decline and reduced capital activity. For the year-ended 2020, annual average production remained relatively consistent compared to the prior year as decreases in Canada due to natural declines were partially offset by production increases in the United States due to new wells brought online in 2019 and 2020.
We resumed drilling activity in Alberta in the fourth quarter, drilling seven (6.6 net) Mannville wells and completing two (1.6 net) wells that were brought on production prior to year-end. The remaining five (5.0 net) wells were completed and brought on production in early 2021. No drilling or completion activity occurred in southeast Saskatchewan or Wyoming during the fourth quarter.
| Sales |
| Q4 2020 | Q4 2019 | 2020 | 2019 | |||||||||||||
| $M | $/boe | $M | $/boe | $M | $/boe | $M | $/boe | |||||||||
| Canada | 160,719 | 32.45 | 206,897 | 38.38 | 569,191 | 26.38 | 828,070 | 37.82 | ||||||||
| United States | 15,089 | 33.24 | 22,885 | 43.77 | 66,446 | 32.93 | 75,364 | 44.17 | ||||||||
| North America | 175,808 | 32.51 | 229,782 | 38.86 | 635,637 | 26.94 | 903,434 | 38.28 | ||||||||
Sales in North America decreased for the three months and year ended December 31, 2020 versus the comparable prior periods due to lower benchmark prices across all products as a result of the ongoing COVID-19 pandemic and OPEC+ price war in the first quarter of 2020.
| Royalties |
| Q4 2020 | Q4 2019 | 2020 | 2019 | |||||||||||||
| $M | $/boe | $M | $/boe | $M | $/boe | $M | $/boe | |||||||||
| Canada | (15,240) | (3.08) | (24,127) | (4.48) | (54,961) | (2.55) | (94,079) | (4.30) | ||||||||
| United States | (4,430) | (9.76) | (5,316) | (10.17) | (17,446) | (8.65) | (18,706) | (10.96) | ||||||||
| North America | (19,670) | (3.64) | (29,443) | (4.98) | (72,407) | (3.07) | (112,785) | (4.78) | ||||||||
Royalties in North America decreased for the three months and year ended December 31, 2020 versus the same periods in the prior year and were primarily due to lower crude oil and condensate pricing within Canada.
Vermilion Energy Inc. ■ Page 13 ■ 2020 Annual Report
| Transportation |
| Q4 2020 | Q4 2019 | 2020 | 2019 | |||||||||||||
| $M | $/boe | $M | $/boe | $M | $/boe | $M | $/boe | |||||||||
| Canada | (9,987) | (2.02) | (10,384) | (1.93) | (41,494) | (1.92) | (41,261) | (1.88) | ||||||||
| United States | (371) | (0.82) | — | — | (1,349) | (0.67) | — | — | ||||||||
| North America | (10,358) | (1.92) | (10,384) | (1.76) | (42,843) | (1.82) | (41,261) | (1.75) | ||||||||
Transportation expense in North America remained relatively consistent on a dollar and per boe basis for the three months and year ended December 31, 2020 versus the comparable prior periods. During spring 2020, our United States business unit began transporting production on select wells via pipeline resulting in transportation costs.
| Operating expense |
| Q4 2020 | Q4 2019 | 2020 | 2019 | |||||||||||||
| $M | $/boe | $M | $/boe | $M | $/boe | $M | $/boe | |||||||||
| Canada | (54,725) | (11.05) | (60,931) | (11.30) | (218,596) | (10.13) | (242,790) | (11.09) | ||||||||
| United States | (4,437) | (9.77) | (4,996) | (9.56) | (18,108) | (8.97) | (16,370) | (9.59) | ||||||||
| North America | (59,162) | (10.94) | (65,927) | (11.15) | (236,704) | (10.03) | (259,160) | (10.98) | ||||||||
Operating expenses in North America for the three months and year ended December 31, 2020 decreased by 10.3% and 8.7%, respectively, versus the comparable prior periods. This decrease in Q4 2020 versus Q4 2019 is primarily due to lower activity levels and a reduction in headcount costs in Q4 2020 as we focus on cost reduction initiatives. Year-over-year, the decrease is primarily in Canada due to a deferral of facility costs, lower headcount costs, lower utility costs, and other cost reductions initiatives. The focus on cost reduction initiatives in 2020 in response to global commodity price pressures helped contribute to the 8.7% decrease on a per unit basis for the year ended December 31, 2020 compared to prior year.
Vermilion Energy Inc. ■ Page 14 ■ 2020 Annual Report
International
| Q4 2020 | Q4 2019 | 2020 | 2019 | |||||||||
| Production (1) | ||||||||||||
| Crude oil and condensate (bbls/d) | 14,096 | 15,702 | 14,376 | 17,105 | ||||||||
| Natural gas (mmcf/d) | 89.86 | 107.38 | 98.15 | 111.58 | ||||||||
| Total production volume (boe/d) | 29,073 | 33,598 | 30,734 | 35,703 | ||||||||
| Total sales volume (boe/d) | 30,336 | 31,760 | 31,444 | 35,737 | ||||||||
| (1) | Please refer to Supplemental Table 4 "Production" for disclosure by product type. |
| Q4 2020 | Q4 2019 | 2020 | 2019 | |||||||||||||
| $M | $/boe | $M | $/boe | $M | $/boe | $M | $/boe | |||||||||
| Sales | 140,390 | 50.30 | 159,020 | 54.42 | 483,908 | 42.05 | 786,429 | 60.29 | ||||||||
| Royalties | (8,438) | (3.02) | (11,236) | (3.85) | (34,147) | (2.97) | (50,881) | (3.90) | ||||||||
| Transportation | (6,699) | (2.40) | (5,186) | (1.77) | (24,868) | (2.16) | (31,185) | (2.39) | ||||||||
| Operating | (47,414) | (16.99) | (44,656) | (15.28) | (180,547) | (15.69) | (180,918) | (13.87) | ||||||||
| General and administration | (8,158) | (2.92) | (10,824) | (3.70) | (31,056) | (2.70) | (38,608) | (2.96) | ||||||||
| Corporate income tax recovery (expense) | 6,291 | 2.25 | 6,495 | 2.22 | 6,012 | 0.52 | (25,877) | (1.98) | ||||||||
| PRRT | (4,038) | (1.45) | (1,453) | (0.50) | (20,151) | (1.75) | (25,947) | (1.99) | ||||||||
| Fund flows from operations | 71,934 | 25.77 | 92,160 | 31.54 | 199,151 | 17.30 | 433,013 | 33.20 | ||||||||
| Capital expenditures | (26,113) | (30,850) | (101,941) | (172,224) | ||||||||||||
| Free cash flow | 45,821 | 61,310 | 97,210 | 260,789 | ||||||||||||
Production from our International assets averaged 29,073 boe/d in Q4 2020, a decrease of 13% year-over-year primarily due to natural decline. For the year-ended December 31, 2020, our production in Europe was impacted by lower crude oil production in France resulting from COVID-19 confinement measures impacting workover activities and the temporary shutdown of the Grandpuits refinery during Q2, in addition to production declines in Netherlands, Germany, and Ireland. In Australia, we completed an 11-day planned maintenance turnaround during Q4 2020, which also contributed to the production decrease.
The year-over-year production decrease from our International assets, along with significant decline in reference prices, resulted in decreases in sales and correspondingly fund flows from operations. However, given our continued focus on cost reductions across the business, such as operating costs, general and administration expenses, and capital expenditures, we continued to generate free cash flow from our international assets.
| Sales |
| Q4 2020 | Q4 2019 | 2020 | 2019 | |||||||||||||
| $M | $/boe | $M | $/boe | $M | $/boe | $M | $/boe | |||||||||
| Australia | 30,148 | 75.99 | 21,872 | 68.63 | 141,452 | 76.70 | 184,490 | 93.33 | ||||||||
| France | 53,198 | 58.11 | 77,781 | 53.55 | 182,292 | 55.39 | 326,699 | 83.01 | ||||||||
| Netherlands | 22,967 | 34.40 | 25,215 | 33.88 | 65,575 | 23.02 | 112,857 | 37.37 | ||||||||
| Germany | 10,681 | 39.87 | 11,531 | 39.14 | 34,210 | 30.40 | 57,312 | 45.75 | ||||||||
| Ireland | 23,118 | 43.38 | 21,824 | 33.65 | 58,446 | 25.59 | 104,274 | 36.81 | ||||||||
| Central and Eastern Europe | 278 | 27.22 | 797 | 31.39 | 1,933 | 16.66 | 797 | 31.19 | ||||||||
| International | 140,390 | 50.30 | 159,020 | 54.42 | 483,908 | 42.05 | 786,429 | 60.29 | ||||||||
As a result of changes in inventory levels, our sales volumes for crude oil in Australia, France, and Germany may differ from our production volumes in those business units. The following table provides the crude oil sales volumes (consisting entirely of "light crude oil and medium crude oil") for those jurisdictions.
| Crude oil sales volumes (bbls/d) | Q4 2020 | Q4 2019 | 2020 | 2019 | ||||||||
| Australia | 4,312 | 2,691 | 5,039 | 5,416 | ||||||||
| France | 9,951 | 10,454 | 8,991 | 10,752 | ||||||||
| Germany | 996 | 629 | 967 | 881 | ||||||||
Vermilion Energy Inc. ■ Page 15 ■ 2020 Annual Report
Sales decreased by $18.6 million for the three months ended December 31, 2020 versus the same period in the prior year primarily due to lower sales volumes across our European business units driven by natural decline of our production and a decline in realized pricing on our crude oil. These sales decreases were partially offset by an increase in realized pricing on our European gas sales and an increase in sales volumes in Australia due to the timing of our liftings.
Sales decreased by $302.5 million for the year ended December 31, 2020 versus the same period in the prior year due to significant decreases in realized prices driven by lower year-over-year commodity prices, including severely depressed commodity prices during second quarter of 2020. In addition to pricing decreases, sales volumes were down primarily due to natural decline across all areas and production decreases in France following downtime at the Grandpuits refinery and restricted field activity resulting from COVID-19 confinement measures put in place by the French government.
| Royalties |
| Q4 2020 | Q4 2019 | 2020 | 2019 | |||||||||||||
| $M | $/boe | $M | $/boe | $M | $/boe | $M | $/boe | |||||||||
| France | (9,416) | (10.28) | (10,265) | (9.73) | (32,069) | (9.75) | (43,895) | (11.15) | ||||||||
| Netherlands | (150) | (0.22) | (130) | (0.17) | (444) | (0.16) | (1,469) | (0.49) | ||||||||
| Germany | 1,190 | 4.44 | (587) | (1.99) | (990) | (0.88) | (5,264) | (4.20) | ||||||||
| Central and Eastern Europe | (62) | (6.07) | (254) | (10.00) | (644) | (5.55) | (253) | (9.90) | ||||||||
| International | (8,438) | (3.02) | (11,236) | (3.85) | (34,147) | (2.97) | (50,881) | (3.90) | ||||||||
Royalties in our International core region are primarily incurred in France, where royalties include charges based on a percentage of sales and fixed per boe charges. Royalties decreased in our International core region in the three months and year ended December 31, 2020 versus the same periods in the prior year due to lower sales prices in France and Netherlands combined with the full year impact of a ruling reducing 2020 Germany gas royalties recorded in the fourth quarter.
Our production in Australia and Ireland is not subject to royalties.
| Transportation |
| Q4 2020 | Q4 2019 | 2020 | 2019 | |||||||||||||
| $M | $/boe | $M | $/boe | $M | $/boe | $M | $/boe | |||||||||
| France | (4,264) | (4.66) | (3,215) | (4.23) | (14,604) | (4.44) | (21,609) | (5.49) | ||||||||
| Germany | (1,537) | (5.74) | (963) | (3.27) | (5,839) | (5.19) | (5,117) | (4.09) | ||||||||
| Ireland | (898) | (1.68) | (1,008) | (1.55) | (4,425) | (1.94) | (4,459) | (1.57) | ||||||||
| International | (6,699) | (2.40) | (5,186) | (1.77) | (24,868) | (2.16) | (31,185) | (2.39) | ||||||||
Transportation expense for the three months ended December 31, 2020 increased versus the same period in 2019 due to increased costs related to transportation system maintenance in France.
For the year ended December 31, 2020, transportation expense decreased versus the same period in 2019 due mainly to lower costs in France. In France, the year-over-year decrease was due to additional costs incurred in 2019 relating to the Grandpuits refinery outage which resulted in the need to arrange alternative delivery points and transportation methods at a higher incremental cost. In Germany, the changes related to the timing of prior period adjustments.
Our production in Australia, Netherlands and Central and Eastern Europe is not subject to transportation expense.
Vermilion Energy Inc. ■ Page 16 ■ 2020 Annual Report
| Operating expense |
| Q4 2020 | Q4 2019 | 2020 | 2019 | |||||||||||||
| $M | $/boe | $M | $/boe | $M | $/boe | $M | $/boe | |||||||||
| Australia | (14,438) | (36.39) | (8,438) | (34.09) | (54,581) | (29.59) | (49,810) | (25.20) | ||||||||
| France | (16,230) | (17.73) | (16,142) | (16.38) | (57,128) | (17.36) | (61,281) | (15.57) | ||||||||
| Netherlands | (7,772) | (11.64) | (9,758) | (13.11) | (32,410) | (11.38) | (32,125) | (10.64) | ||||||||
| Germany | (5,643) | (21.07) | (7,405) | (25.14) | (20,732) | (18.42) | (24,970) | (19.93) | ||||||||
| Ireland | (3,232) | (6.06) | (2,854) | (4.40) | (15,232) | (6.67) | (12,431) | (4.39) | ||||||||
| Central and Eastern Europe | (99) | (9.69) | (59) | (2.32) | (464) | (4.00) | (301) | (11.78) | ||||||||
| International | (47,414) | (16.99) | (44,656) | (15.28) | (180,547) | (15.69) | (180,918) | (13.87) | ||||||||
Operating expenses for Q4 2020 increased by $2.8 million compared to Q4 2019. This is mainly due to increased costs in Australia where operating expenses are deferred on the balance sheet until oil is sold at which point the related expenses are recognized into income. Q4 2019 had a larger build of inventory compared to the draws made in Q4 2020, therefore higher costs related to inventory were incurred in Q4 2020. This increase was partially offset by lower activity levels in Germany and lower facility maintenance and repair costs in the Netherlands.
For the year ended December 31, 2020, operating expenses remained relatively consistent on a dollar basis and increased by 13.1% on a per boe basis. Cost reductions were due to reduced activity in France during the COVID-19 confinement period earlier in 2020 and lower activity levels in Germany. This was offset by increased costs in Australia resulting from a higher deferral of costs relating to inventory builds on the balance sheet in 2019 offset by lower major project expense work. Cost increases in Ireland were due to increased maintenance activity.
Vermilion Energy Inc. ■ Page 17 ■ 2020 Annual Report
Consolidated Financial Performance Review
| ($M except per share) | Dec 31, 2020 | Dec 31, 2019 | Dec 31, 2018 | |||
| Total assets | 4,109,139 | 5,866,120 | 6,270,671 | |||
| Long-term debt | 1,933,848 | 1,924,665 | 1,796,207 | |||
| Petroleum and natural gas sales | 1,119,545 | 1,689,863 | 1,678,117 | |||
| Net (loss) earnings | (1,517,427) | 32,799 | 271,650 | |||
| Net (loss) earnings per share | ||||||
| Basic | (9.61) | 0.21 | 1.93 | |||
| Diluted | (9.61) | 0.21 | 1.91 | |||
| Cash dividends ($/share) | 0.58 | 2.76 | 2.72 | |||
| Fund flows from operations |
| Q4 2020 | Q4 2019 | 2020 | 2019 | |||||||||||||
| $M | $/boe | $M | $/boe | $M | $/boe | $M | $/boe | |||||||||
| Sales | 316,198 | 38.57 | 388,802 | 44.00 | 1,119,545 | 31.90 | 1,689,863 | 46.12 | ||||||||
| Royalties | (28,108) | (3.43) | (40,679) | (4.60) | (106,554) | (3.04) | (163,666) | (4.47) | ||||||||
| Transportation | (17,057) | (2.08) | (15,570) | (1.76) | (67,711) | (1.93) | (72,446) | (1.98) | ||||||||
| Operating | (106,576) | (13.00) | (110,583) | (12.52) | (417,251) | (11.89) | (440,078) | (12.01) | ||||||||
| General and administration | (18,642) | (2.27) | (16,569) | (1.88) | (60,840) | (1.73) | (58,976) | (1.61) | ||||||||
| Corporate income tax recovery (expense) | 6,532 | 0.80 | 5,835 | 0.66 | 5,810 | 0.17 | (26,283) | (0.72) | ||||||||
| PRRT | (4,038) | (0.49) | (1,453) | (0.16) | (20,151) | (0.57) | (25,947) | (0.71) | ||||||||
| Interest expense | (19,808) | (2.42) | (19,169) | (2.17) | (75,077) | (2.14) | (81,377) | (2.22) | ||||||||
| Realized gain on derivatives | 790 | 0.10 | 22,712 | 2.57 | 109,093 | 3.11 | 84,219 | 2.30 | ||||||||
| Realized foreign exchange gain (loss) | 1,329 | 0.16 | 2,013 | 0.23 | 11,110 | 0.32 | (4,954) | (0.14) | ||||||||
| Realized other income | 4,592 | 0.56 | 253 | 0.03 | 4,091 | 0.12 | 7,700 | 0.21 | ||||||||
| Fund flows from operations | 135,212 | 16.50 | 215,592 | 24.40 | 502,065 | 14.32 | 908,055 | 24.77 | ||||||||
Fluctuations in fund flows from operations may occur as a result of changes in production levels, commodity prices, and costs to produce petroleum and natural gas. In addition, fund flows from operations may be affected by the timing of crude oil shipments in Australia and France. When crude oil inventory is built up, the related operating expense, royalties, and depletion expense are deferred and carried as inventory on the consolidated balance sheet. When the crude oil inventory is subsequently drawn down, the related expenses are recognized.
General and administration
| • | General and administration expense increased by 11.1% in Q4 2020 versus Q4 2019 due lower recoveries as a result of lower salary allocations from reduced capital activity in Q4 2020 and costs associated with work-force reductions. |
| • | General and administration expense for the year ended December 31, 2020 were relatively consistent with 2019 as cost savings and government subsidies recorded during the year were offset by higher employee costs incurred in 2020 and lower capitalized costs. |
PRRT and corporate income taxes
| • | PRRT increased in Q4 2020 versus Q4 2019 due to higher sales. For the year ended December 31, 2020, PRRT decreased versus the prior year comparable period due to lower Australia sales. |
| • | Corporate income taxes in Q4 2020 and for the year ended December 31, 2020 versus the comparable periods decreased due to tax recoveries resulting from the significant decreases in commodity prices during the year. |
Interest expense
| • | Interest expense remained relatively consistent between Q4 2020 and Q4 2019. For the year ended December 31, 2020, interest expense decreased by 7.7% versus the prior year comparable period due to declining market interest rates as a function of the impact of COVID-19. |
Vermilion Energy Inc. ■ Page 18 ■ 2020 Annual Report
Realized gain or loss on derivatives
| • | Realized gains on derivatives relate to receipts for European natural gas and crude oil hedges. For the year ended December 31, 2020, realized gains also included the receipt of $16.8 million (US $12.7 million) due to the reset the Euro principal amount of the CAD-to-EUR cross currency interest rate swap in Q1 2020, and the receipt of $25.5 million (US $18.2 million) as a result of a number of transactions that resulted in the termination of the USD-to-CAD and CAD-to-EUR cross currency interest swaps in Q2 2020. |
| • | A listing of derivative positions as at December 31, 2020 is included in “Supplemental Table 2” of this MD&A. |
Realized other income
| • | Realized other income for the year ended December 31, 2020 primarily relates to amounts in Q4 2020 for funding under the Saskatchewan Accelerated Site Closure program to complete abandonment and reclamation on inactive oil and gas wells and facilities. |
| Net earnings |
The following table shows a reconciliation from fund flows from operations to net (loss) earnings:
| ($M) | Q4 2020 | Q4 2019 | 2020 | 2019 | ||||
| Fund flows from operations | 135,212 | 215,592 | 502,065 | 908,055 | ||||
| Equity based compensation | (11,012) | (11,233) | (42,906) | (64,233) | ||||
| Unrealized loss on derivative instruments | (66,863) | (30,362) | (100,955) | (57,427) | ||||
| Unrealized foreign exchange gain (loss) | 50,519 | 42,848 | 49,012 | 57,225 | ||||
| Unrealized other expense | (202) | (204) | (833) | (825) | ||||
| Accretion | (9,134) | (7,833) | (35,318) | (32,667) | ||||
| Depletion and depreciation | (148,219) | (139,940) | (580,461) | (675,177) | ||||
| Deferred tax | (8,008) | (21,335) | 374,313 | (56,096) | ||||
| Impairment | — | (46,056) | (1,682,344) | (46,056) | ||||
| Net (loss) earnings | (57,707) | 1,477 | (1,517,427) | 32,799 | ||||
Fluctuations in net earnings from period-to-period are caused by changes in both cash and non-cash based income and charges. Cash based items are reflected in fund flows from operations. Non-cash items include: equity based compensation expense, unrealized gains and losses on derivative instruments, unrealized foreign exchange gains and losses, accretion, depletion and depreciation expense, and deferred taxes. In addition, non-cash items may also include gains resulting from business combinations or charges resulting from impairment or impairment reversals.
Equity based compensation
Equity based compensation expense relates primarily to non-cash compensation expense attributable to long-term incentives granted to directors, officers, and employees under security-based arrangements. Equity based compensation expense remained consistent between the three months ended December 31, 2020 and three months ended December 31, 2019. Equity based compensation expense for the year ended December 31, 2020 decreased versus the prior year comparable period due to the lower value of VIP awards outstanding in the current period.
Unrealized gain or loss on derivative instruments
Unrealized gain or loss on derivative instruments arise as a result of changes in forecasts for future prices and rates. As Vermilion uses derivative instruments to manage the commodity price exposure of our future crude oil and natural gas production, we will normally recognize unrealized gains on derivative instruments when future commodity price forecasts decline and vice-versa. As derivative instruments are settled, the unrealized gain or loss previously recognized is reversed, and the settlement results in a realized gain or loss on derivative instruments.
USD-to-CAD cross currency interest rate swaps may be entered into to hedge the foreign exchange movements on USD borrowings on our revolving credit facility. As such, unrealized gains and losses on our cross currency interest swaps are offset by unrealized losses and gains on foreign exchange relating to the underlying USD borrowings from our revolving credit facility.
In Q3 2019, we entered into two equity swaps to hedge the exposure of our long-term incentive plans. The swaps are expected to settle in September 2021 and October 2021. Included in current liabilities and net debt as at December 31, 2020, is a mark-to-market liability of $59.6 million relating to the positions settling in September 2021 and October 2021.
For the three months ended December 31, 2020, we recognized a net unrealized loss on derivative instruments of $66.9 million. This consists of a $47.0 million unrealized loss on our European natural gas commodity derivative instruments and a $40.2 million unrealized loss on our USD-to-CAD foreign exchange swaps. This was partially offset by an unrealized gain of $9.6 million from our equity swaps and an unrealized gain of $8.6 million on our North American natural gas commodity derivative instruments.
Vermilion Energy Inc. ■ Page 19 ■ 2020 Annual Report
For the year ended December 31, 2020, we recognized a net unrealized loss on derivative instruments of $101.0 million. This consists of unrealized losses of $59.1 million on our equity swaps and $51.6 million from our European natural gas commodity derivative instruments. These are partially offset by unrealized gains of $9.4 million on our crude oil commodity derivative instruments.
Unrealized foreign exchange gains or losses
As a result of Vermilion’s international operations, Vermilion has monetary assets and liabilities denominated in currencies other than the Canadian dollar. These monetary assets and liabilities include cash, receivables, payables, long-term debt, derivative instruments and intercompany loans. Unrealized foreign exchange gains and losses result from translating these monetary assets and liabilities from their underlying currency to the Canadian dollar.
In 2020, unrealized foreign exchange gains and losses primarily resulted from:
| • | The translation of Euro denominated intercompany loans from Vermilion Energy Inc. to our international subsidiaries. An appreciation in the Euro against the Canadian dollar will result in an unrealized foreign exchange gain (and vice-versa). Under IFRS, the offsetting foreign exchange loss or gain is recorded as a currency translation adjustment within other comprehensive income. As a result, consolidated comprehensive income reflects the offsetting of these translation adjustments while net earnings reflects only the parent company's side of the translation. |
| • | The translation of USD borrowings on our revolving credit facility. The unrealized foreign exchange gains or losses on these borrowings are offset by unrealized derivative gains or losses on associated USD-to-CAD cross currency interest rate swaps (discussed further below). |
| • | The translation of our USD denominated senior unsecured notes prior to June 12, 2019 and from May 5, 2020 onward. During the period between June 12, 2019 and May 5, 2020 the USD senior notes were hedged by a USD-to-CAD cross currency interest rate swap. Subsequent to the termination of these instrument, amounts recognized in the hedge accounting reserve will be recognized into earnings through unrealized foreign exchange loss over the period of the hedged cash flows. |
For the three months ended December 31, 2020, we recognized a net unrealized foreign exchange gain of $50.5 million. The impact of the US dollar weakening 5.0% against the Canadian dollar resulted in an unrealized gain of $42.0 million and $19.7 million on our USD borrowings from our revolving credit facility and our senior unsecured notes, respectively. These were partially offset primarily due to the strengthening of the Euro against the Canadian dollar resulting in net unrealized losses of $7.6 million on intercompany loans.
For the year ended December 31, 2020, we recognized a net unrealized foreign exchange gain of $49.0 million primarily due to unrealized gains on our USD-to-CAD and CAD-to-EUR cross currency interest swaps of $36.4 million, and impacts of the US dollar weakening 2.0% against the Canadian dollar resulting in unrealized gains on our USD borrowings from our revolving credit facility and our senior unsecured notes of $8.5 million and 4.0 million, respectively.
As at December 31, 2020, a $0.01 appreciation of the Euro against the Canadian dollar would result in a $0.9 million increase to net earnings as a result of an unrealized gain on foreign exchange. In contrast, a $0.01 appreciation of the US dollar against the Canadian dollar would result in a $2.7 million decrease to net earnings as a result of an unrealized loss on foreign exchange.
Accretion
Accretion expense is recognized to update the present value of the asset retirement obligation balance. For the year ended December 31, 2020 accretion expense increased versus all comparable period primarily due to a weakening Canadian dollar versus the Euro.
Depletion and depreciation
Depletion and depreciation expense is recognized to allocate the cost of capital assets over the useful life of the respective assets. Depletion and depreciation expense per unit of production is determined for each depletion unit (which are groups of assets within a specific production area that have similar economic lives) by dividing the sum of the net book value of capital assets and future development costs by total proved plus probable reserves.
Fluctuations in depletion and depreciation expense are primarily the result of changes in produced crude oil and natural gas volumes and changes in depletion and depreciation per unit. Fluctuations in depletion and depreciation per unit are the result of changes in reserves, depletable base (net book value of capital assets and future development costs), and relative production mix.
Depletion and depreciation on a per boe basis for Q4 2020 of $18.08 increased from $15.84 due to the impact of reflecting an increase in proved and probable reserves in Q4 2019. For the year ended December 31, 2020, depletion and depreciation decreased on a per boe basis to $16.54 (December 31, 2019 -$18.43) primarily due to impairment charges taken in 2020.
Vermilion Energy Inc. ■ Page 20 ■ 2020 Annual Report
Deferred tax
Deferred tax assets arise when the tax basis of an asset exceeds its accounting basis (known as a deductible temporary difference). Conversely, deferred tax liabilities arise when the tax basis of an asset is less than its accounting basis (known as a taxable temporary difference). Deferred tax assets are recognized only to the extent that it is probable that there are future taxable profits against which the deductible temporary difference can be utilized. Deferred tax assets and liabilities are measured at the enacted or substantively enacted tax rate that is expected to apply when the asset is realized, or the liability is settled.
As such, fluctuations in deferred tax expenses and recoveries primarily arise as a result of: changes in the accounting basis of an asset or liability without a corresponding tax basis change (e.g. when derivative assets and liabilities are marked-to-market or when accounting depletion differs from tax depletion), changes in available tax losses (e.g. if they are utilized to offset taxable income), changes in estimated future taxable profits resulting in a derecognition or recognition of deferred tax assets, and changes in enacted or substantively enacted tax rates.
For the three months and year ended December 31, 2020, a deferred tax recovery was recognized of $8.0 million and $374.3 million, respectively, as a result of the impairment charges recorded in those periods.
Impairment
Impairment losses are recognized when indicators of impairment arise and the carrying amount of a cash generating unit ("CGU") exceeds its recoverable amount, determined as the higher of fair value less costs of disposal or value-in-use.
In the fourth quarter of 2020, indicators of impairment were present in our France CGUs due to a decrease in estimated reserves as a result of economic revisions. As a result of the indicators of impairment, the Company performed impairment tests on its four France CGUs and the recoverable amounts were determined using fair value less costs to sell, which considered future after-tax cash flows from proved plus probable reserves and an after-tax discount rate of 9.5%. Based on the results of the impairment tests completed, recoverable amounts were determined to be greater than the carrying values of the CGUs tested and no impairment charges were recorded.
In the third quarter of 2020, indicators of impairment were present due to a decline in the Company’s market capitalization. As a result of the indicators of impairment, the Company performed impairment tests across all CGUs. The recoverable amounts were determined using fair value less costs to sell, which considered future after-tax cash flows from proved plus probable reserves and an after-tax discount rate of 11.5%. Based on the results of the impairment tests completed, the Company recognized non-cash impairment charges of $35.4 million (net of $12.4 million income tax recovery) in the Neocomian CGU due to increased estimated transportation expenses as a result of an announcement during the quarter that the third-party Grandpuits refinery plans on converting into a zero-crude platform in 2021. As a result of this change, the Company's estimates that incremental transportation expenses will be incurred to transport the crude oil production in the Neocomian, Chaunoy, and Champotran CGUs to alternative refineries in France.
In the second quarter of 2020, indicators of impairment were present due to a decline in the Company’s market capitalization. As a result of the indicators of impairment, the Company performed impairment tests across all CGUs. The recoverable amounts were determined using fair value less costs to sell, which considered future after-tax cash flows from proved plus probable reserves and an after-tax discount rate of 11.5%. Based on the results of the impairment tests completed, the Company recognized non-cash impairment charges of $53.1 million (net of $16.6 million income tax recovery).
In the first quarter of 2020, indicators of impairment were present due to global commodity price forecasts deteriorating from decreases in demand and an increase of supply around the world. As a result of the indicators of impairment, the Company performed impairment tests across all CGUs. The recoverable amounts were determined using fair value less costs to sell, which considered future after-tax cash flows from proved plus probable reserves and an after-tax discount rate of 11.5%. Based on the results of the impairment tests completed, the Company recognized non-cash impairment charges of $1.2 billion (net of $0.4 billion income tax recovery).
Vermilion Energy Inc. ■ Page 21 ■ 2020 Annual Report
Taxes
| Current income tax rates |
Vermilion typically pays corporate income taxes in France, Netherlands, and Australia. In addition, Vermilion pays PRRT in Australia which is a profit based tax applied at a rate of 40% on sales less operating expenses, capital expenditures, and other eligible expenditures. PRRT is deductible in the calculation of taxable income in Australia.
For 2020 and 2019, taxable income was subject to corporate income tax at the following statutory rates:
| Jurisdiction | 2020 | 2019 | ||
| Canada | 25.3 | % | 26.7 | % |
| United States | 21.0 | % | 21.0 | % |
| France | 28.9 | % | 32.0 | % |
| Netherlands (1) | 50.0 | % | 50.0 | % |
| Germany | 31.6 | % | 31.8 | % |
| Ireland | 25.0 | % | 25.0 | % |
| Australia | 30.0 | % | 30.0 | % |
| (1) | In the Netherlands, an additional 10% uplift deduction is allowed against taxable income that is applied to operating expenses, eligible general and administration expenses, and tax deductions for depletion and abandonment retirement obligations. |
| Tax legislation changes |
On July 1, 2020, the Alberta government reduced the provincial corporate tax rate from 10% to 8%, accelerating the previously enacted schedule of rate reductions.
On December 28, 2019, the French Parliament approved the Finance Bill for 2020. The Finance Bill for 2020 provides for a progressive decrease of the French corporate income tax rate for companies with sales below €250 million from 32.0% to 25.8% by 2022, with a reduction in 2021 to 27.4%.
| Tax pools |
As at December 31, 2020, we had the following tax pools:
| ($M) | Oil & Gas Assets | Tax Losses | Other | Total | ||||||
| Canada | 1,962,908 | (1) | 1,305,737 | (4) | 21,333 | 3,289,978 | ||||
| United States | 207,751 | (2) | 167,157 | (7) | 25,522 | 400,430 | ||||
| France | 383,841 | (2) | 62,028 | (6) | 11,422 | 457,291 | ||||
| Netherlands | 46,484 | (3) | 20,351 | (4) | 1,387 | 68,222 | ||||
| Germany | 160,033 | (3) | 148,563 | (5) | 11,419 | 320,015 | ||||
| Ireland | — | 1,173,198 | (4) | 7,377 | 1,180,575 | |||||
| Australia | 253,918 | (1) | — | — | 253,918 | |||||
| Total | 3,014,935 | 2,877,034 | 78,460 | 5,970,429 | ||||||
| (1) | Deduction calculated using various declining balance rates. |
| (2) | Deduction calculated using a combination of straight-line over the assets life and unit of production method. |
| (3) | Deduction calculated using a unit of production method. |
| (4) | Tax losses can be carried forward and applied at 100% against taxable income. |
| (5) | Tax losses carried forward are available to offset the first €1 million of taxable income and 60% of taxable profits in excess each taxation year. |
| (6) | Tax losses carried forward are available to offset the first €1 million of taxable income and 50% of taxable profits in excess each taxation year. |
| (7) | Tax losses of $47 million created prior to January 1, 2018 are carried forward and applied at 100% against taxable income, tax losses of $120 million created after January 1, 2018 are carried forward and applied to 80% of taxable income in each taxation year. |
Vermilion Energy Inc. ■ Page 22 ■ 2020 Annual Report
Financial Position Review
| Balance sheet strategy |
We regularly review whether our forecast of fund flows from operations is sufficient to finance planned capital expenditures, abandonment and reclamation expenditures, and dividends. To the extent that fund flows from operations forecasts are not expected to be sufficient to fulfill such expenditures, we will evaluate our ability to finance any shortfall by reducing some or all categories of expenditures, reducing or eliminating dividends, with issuances of equity, or with debt (including borrowing using the unutilized capacity of our existing revolving credit facility). We have a long-term goal of maintaining a ratio of net debt to fund flows from operations of less than 1.5.
Due to the significant decline in commodity prices following the outbreak of COVID-19 and the ensuing OPEC+ price war, our ratio of net debt to fund flows from operations continues to remain beyond our target of less than 1.5 and was 4.19 at December 31, 2020. We responded to this rapid change in market conditions by significantly reducing our cost structure, which included suspending our monthly dividend payment, reducing our capital expenditures, and identified expense savings that were executed in 2020. Going forward, we will continue to monitor for changes in forecasted fund flows from operations and, as appropriate, will adjust our exploration and development capital plans (and associated growth targets) to minimize any further increase to debt. As commodity prices improve, we intend to strengthen our balance sheet through the reduction of debt and will continue to target a ratio of net debt to fund flows from operations of less than 1.5.
| Net debt |
Net debt is reconciled to long-term debt, as follows:
| As at | ||||
| ($M) | Dec 31, 2020 | Dec 31, 2019 | ||
| Long-term debt | 1,933,848 | 1,924,665 | ||
| Current liabilities | 433,128 | 416,210 | ||
| Current assets | (260,993) | (347,681) | ||
| Net debt | 2,105,983 | 1,993,194 | ||
| Ratio of net debt to four quarter trailing fund flows from operations | 4.19 | 2.20 | ||
As at December 31, 2020, net debt increased to $2.1 billion (December 31, 2019 - $2.0 billion) primarily due to the impact of lower current assets and also due to increased borrowings on long-term debt. The Company will draw on unutilized capacity of the revolving credit facility to working capital deficiencies. The ratio of net debt to four quarter trailing fund flows from operations increased to 4.19 (December 31, 2019 - 2.20) due to lower four quarter trailing fund flows from operations as a result of lower commodity prices, combined with an increase in net debt.
| Long-term debt |
The balances recognized on our balance sheet are as follows:
| As at | ||||
| ($M) | Dec 31, 2020 | Dec 31, 2019 | ||
| Revolving credit facility | 1,555,215 | 1,539,225 | ||
| Senior unsecured notes | 378,633 | 385,440 | ||
| Long-term debt | 1,933,848 | 1,924,665 | ||
Vermilion Energy Inc. ■ Page 23 ■ 2020 Annual Report
Revolving Credit Facility
In Q1 2020, we negotiated an extension to our $2.1 billion revolving credit facility to extend the maturity to May 31, 2024.
As at December 31, 2020, Vermilion had in place a bank revolving credit facility maturing May 31, 2024 with terms and outstanding positions as follows:
| As at | ||||
| ($M) | Dec 31, 2020 | Dec 31, 2019 | ||
| Total facility amount | 2,100,000 | 2,100,000 | ||
| Amount drawn | (1,555,215) | (1,539,225) | ||
| Letters of credit outstanding | (23,210) | (10,230) | ||
| Unutilized capacity | 521,575 | 550,545 | ||
As at December 31, 2020, the revolving credit facility was subject to the following financial covenants:
| As at | |||||
| Financial covenant | Limit | Dec 31, 2020 | Dec 31, 2019 | ||
| Consolidated total debt to consolidated EBITDA | Less than 4.0 | 3.48 | 1.94 | ||
| Consolidated total senior debt to consolidated EBITDA | Less than 3.5 | 2.82 | 1.56 | ||
| Consolidated EBITDA to consolidated interest expense | Greater than 2.5 | 8.12 | 13.46 | ||
Our financial covenants include financial measures defined within our revolving credit facility agreement that are not defined under IFRS. These financial measures are defined by our revolving credit facility agreement as follows:
| • | Consolidated total debt: Includes all amounts classified as “Long-term debt”, “Current portion of long-term debt”, and “Lease obligations” (including the current portion included within "Accounts payable and accrued liabilities" but excluding operating leases as defined under IAS 17) on our balance sheet. |
| • | Consolidated total senior debt: Defined as consolidated total debt excluding unsecured and subordinated debt. |
| • | Consolidated EBITDA: Defined as consolidated net earnings before interest, income taxes, depreciation, accretion and certain other non-cash items, adjusted for the impact of the acquisition of a material subsidiary. |
| • | Total interest expense: Includes all amounts classified as "Interest expense", but excludes interest on operating leases as defined under IAS 17. |
In addition, our revolving credit facility has provisions relating to our liability management ratings in Alberta and Saskatchewan whereby if our security adjusted liability management ratings fall below specified limits in a province, a portion of the asset retirement obligations are included in the definitions of consolidated total debt and consolidated total senior debt. An event of default occurs if our security adjusted liability management ratings breach additional lower limits for a period greater than 90 days. As of December 31, 2020, Vermilion's liability management ratings were higher than the specified levels, and as such, no amounts relating to asset retirement obligations were included in the calculation of consolidated total debt and consolidated total senior debt.
Due to the OPEC+ price war in the first quarter of 2020 and the ongoing COVID-19 pandemic, worldwide crude oil and natural gas prices have significantly declined. The impacts of these decreases has had an adverse effect on the Company's financial position for the year ended December 31, 2020 and is expected to result in continued pressure on our forecasted cash flows and earnings. The Company is currently in compliance with all financial covenants related to its revolving credit facility, but is at risk of breaching one or more of the financial covenants if worldwide oil and natural gas prices decline in the future. If we believe we are at risk of being in non-compliance with our financial covenants, we will approach our lending syndicate and request temporary covenant relief or other measures to ensure the credit facility remains available. There is no certainty that discussions surrounding covenant relief or other measures would be successful.
Senior Unsecured Notes
On March 13, 2017, Vermilion issued US $300.0 million of senior unsecured notes at par. The notes bear interest at a rate of 5.625% per annum, paid semi-annually on March 15 and September 15, and mature on March 15, 2025. As direct senior unsecured obligations of Vermilion, the notes rank equally in right of payment with existing and future senior indebtedness of the Company.
The senior unsecured notes were recognized at amortized cost and include the transaction costs directly related to the issuance.
Vermilion Energy Inc. ■ Page 24 ■ 2020 Annual Report
Vermilion may redeem some or all of the senior unsecured notes at the redemption prices set forth in the following table plus any accrued and unpaid interest, if redeemed during the twelve-month period beginning on March 15 of each of the years indicated below:
| Year | Redemption price | |
| 2021 | 102.813 | % |
| 2022 | 101.406 | % |
| 2023 and thereafter | 100.000 | % |
Cross currency interest rate swaps
On June 12, 2019, Vermilion entered into a series of cross currency interest rate swaps with a syndicate of banks. Vermilion applied hedge accounting to these derivative instruments. The cross currency interest rate swaps had an original maturity of March 15, 2025.
The USD-to-CAD cross currency interest swaps were designated as the hedging instrument in a cash flow hedge while the CAD-to-EUR cross currency interest rate swaps were designated as the hedging instrument in a net investment hedge.
During the quarter ended June 30, 2020, Vermilion executed a number of transactions that resulted in a termination of the cross currency interest rate swaps in exchange for $42.3 million ($16.8 million received in the three months ended March 30, 2020 and $25.5 million received in the three months ended June 30, 2020). As a result of the termination, Vermilion has discontinued hedge accounting and amounts previously recognized for the hedge reserve within accumulated other comprehensive income will be reclassified into net income over the remaining life of the senior unsecured notes.
| Shareholders' capital |
Dividends declared for the year ended December 31, 2020 were $90.1 million.
The following table outlines our dividend payment history:
| Date | Monthly dividend per unit or share | |
| January 2003 to December 2007 | $0.170 | |
| January 2008 to December 2012 | $0.190 | |
| January 2013 to December 2013 | $0.200 | |
| January 2014 to March 2018 | $0.215 | |
| April 2018 to February 2020 | $0.230 | |
| March 2020 | $0.115 |
In the current economic and commodity outlook following the outbreak of COVID-19, there was uncertainty regarding our ability to achieve a 100% payout ratio at a reasonable level of capital expenditures. Therefore, in the first half of 2020, we reduced our 2020 capital budget and suspended our monthly dividend to strengthen the financial position of the Company during this period of weak commodity prices. We will evaluate our ability to finance any shortfall by reducing some or all categories of expenditures, with issuances of equity, or with debt (including borrowing using the unutilized capacity of our existing revolving credit facility). Our ability to restore a dividend will be dependent upon stronger commodity prices combined with a balance sheet that reflects the Company's ability to sustain such dividend over the long-term.
The following table reconciles the change in shareholders’ capital:
| Shareholders’ Capital | Number of Shares ('000s) | Amount ($M) | ||
| Balance at December 31, 2019 | 156,290 | 4,119,031 | ||
| Shares issued for the Dividend Reinvestment Plan | 619 | 8,277 | ||
| Vesting of equity based awards | 1,103 | 49,188 | ||
| Equity based compensation | 415 | 3,203 | ||
| Share-settled dividends on vested equity based awards | 297 | 1,461 | ||
| Balance at December 31, 2020 | 158,724 | 4,181,160 | ||
As at December 31, 2020, there were approximately 6.2 million equity based compensation awards outstanding. As at March 5, 2021, there were approximately 158.9 million common shares issued and outstanding.
Vermilion had a normal course issuer bid approved by the Toronto Stock Exchange that allowed us to purchase up to 7,750,000 common shares (representing approximately 5% of shares outstanding common shares) that commenced on August 9, 2019 and which expired on August 8, 2020. Vermilion did not purchase any shares during the period.
Vermilion Energy Inc. ■ Page 25 ■ 2020 Annual Report
At Vermilion's Annual General and Special Meeting held on April 28, 2020 shareholders of the Company approved a $3.7 billion reduction in the stated capital of Vermilion's common shares, with the $3.7 billion reduction deducted from the stated capital account maintained for the common shares of Vermilion and an offsetting increase to the contributed surplus account of Vermilion. The transaction did not result in an adjustment to the financial statements under IFRS.
Contractual Obligations and Commitments
As at December 31, 2020, we had the following contractual obligations and commitments:
| ($M) | Less than 1 year | 1 - 3 years | 3 - 5 years | After 5 years | Total | |||||
| Long-term debt (1) | 62,328 | 124,656 | 1,986,421 | — | 2,173,405 | |||||
| Lease obligations | 43,131 | 41,002 | 36,437 | 32,408 | 152,978 | |||||
| Processing and transportation agreements | 32,122 | 38,643 | 19,839 | 22,519 | 113,123 | |||||
| Purchase obligations | 25,390 | 12,265 | 885 | — | 38,540 | |||||
| Drilling and service agreements | 15,881 | 57,827 | 38,061 | — | 111,769 | |||||
| Total contractual obligations and commitments | 178,852 | 274,393 | 2,081,643 | 54,927 | 2,589,815 | |||||
(1) Interest on revolving credit facility calculated assuming an annual interest rate of 2.63%.
(2) Commitments denominated in foreign currencies have been translated using the related spot rates on December 31, 2020.
Asset Retirement Obligations
As at December 31, 2020, asset retirement obligations were $467.7 million compared to $618.2 million as at December 31, 2019. The decrease in asset retirement obligations is primarily attributable to an increase in the credit-adjusted risk-free rate from December 31, 2019 to December 31, 2020. This decrease was partially offset by changes in the estimated costs, accretion expense and the Euro strengthening against the Canadian dollar.
The present value of the obligation is calculated using a credit-adjusted risk-free rate, calculated using a credit spread added to risk-free rates based on long-term, risk-free government bonds. Vermilion's credit spread is determined as the yield to maturity on its senior unsecured notes as at the reporting period.
The risk-free rates and credit spread used as inputs to discount the obligations were as follows:
| Dec 31, 2020 | Dec 31, 2019 | Change | ||||
| Country specific risk-free rate | ||||||
| Canada | 1.2 | % | 1.7 | % | (0.5) | % |
| United States | 1.6 | % | 2.4 | % | (0.8) | % |
| France | 0.3 | % | 0.9 | % | (0.6) | % |
| Netherlands | (0.6) | % | (0.1) | % | (0.5) | % |
| Germany | (0.2) | % | 0.3 | % | (0.5) | % |
| Ireland | (0.1) | % | 0.6 | % | (0.7) | % |
| Australia | 1.3 | % | 1.6 | % | (0.3) | % |
| Credit spread added to above noted risk-free rates | 10.0 | % | 5.3 | % | 4.7 | % |
Vermilion Energy Inc. ■ Page 26 ■ 2020 Annual Report
Risks and Uncertainties
Crude oil and natural gas exploration, production, acquisition and marketing operations involve a number of risks and uncertainties that have affected the financial statements and are reasonably likely to affect them in the future. These risks and uncertainties are discussed further below.
Commodity prices
Crude oil and natural gas prices have fluctuated significantly in recent years due to supply and demand factors. Changes in crude oil and natural gas prices affect the level of revenue we generate, the amount of proceeds we receive and payments we make on our commodity derivative instruments, and the level of taxes that we pay. In addition, lower crude oil and natural gas prices would reduce the recoverable amount of our capital assets and could result in impairments or impairment reversals.
Exchange rates
Exchange rate changes impact the Canadian dollar equivalent revenue and costs that we recognize. The majority of our crude oil and condensate revenue stream is priced in US dollars and as such an increase in the strength of the Canadian dollar relative to the US dollar would result in the receipt of fewer Canadian dollars for our revenue. We also incur expenses and capital costs in US dollars, Euros and Australian dollars and thus a decrease in strength of the Canadian dollar relative to those currencies may result in the payment of more Canadian dollars for our expenditures.
In addition, exchange rate changes impact the Canadian equivalent carrying balances for our assets and liabilities. For foreign currency denominated monetary assets (such as cash and cash equivalents, long-term debt, and intercompany loans), the impact of changes in exchange rates is recorded in net earnings as a foreign exchange gain or loss.
Production and sales volumes
Our production and sales volumes affect the level of revenue we generate and correspondingly the royalties and taxes that we pay. In addition, significant declines in production or sales volumes due to unforeseen circumstances may also result in an indicator of impairment and potential impairment charges.
Interest rates
Changes in interest rates impact the amount of interest expense we pay on our variable rate debt and also our ability to obtain fixed rate financing in the future.
Tax and royalty rates
Changes in tax and royalty rates in the jurisdictions that we operate in would impact the amount of current taxes and royalties that we pay. In addition, changes to substantively enacted tax rates would impact the carrying balance of deferred tax assets and liabilities, potentially resulting in a deferred tax recovery or incremental deferred tax expense.
In addition to the above, we are exposed to risk factors that impact our company and business. For further information on these risk factors, please refer to our Annual Information Form, available on SEDAR at www.sedar.com or on our website at www.vermilionenergy.com.
COVID-19
The emergence of COVID-19 has resulted in emergency actions by governments worldwide, which has had an effect in all of our operating jurisdictions. The actions taken by these governments have typically included, but is not limited to travel bans, mandatory and self-imposed quarantines and isolations, social distancing, and the closing of non-essential businesses which has had significant negative effects on economies, including a substantial decline in crude oil and natural gas demand.
The full extent of the risks surrounding the severity and timing of the COVID-19 pandemic is continually evolving; therefore, there is significant risk and uncertainty which may have a material and adverse effect on our operations. The following risks disclosed in our Annual Information Form for the year ended December 31, 2020 may be exacerbated as a result of the COVID-19 pandemic: market risks related to the volatility of oil and gas prices, volatility of foreign exchange rates, volatility of the market price of common shares, and hedging arrangements; operational risks related to increasing operating costs or declines in production levels, operator performance and payment delays, and government regulations; financing risks related to the ability to obtain additional financing, ability to service debt, and variations in interest rates and foreign exchanges rates; and other risks related to cyber-security as our workforce moves to remote connections, accounting adjustments, effectiveness of internal controls, and reliance on key personnel, management, and labour.
Due to the COVID-19 pandemic, Vermilion has implemented social distancing measures which require deemed non-critical employees to work remotely and has encouraged critical staff to do the same. These measures may, but are not expected to have an effect on the design and performance of internal controls throughout the Company and will be continually monitored to mitigate any risks associated with changes in its control environment.
Vermilion Energy Inc. ■ Page 27 ■ 2020 Annual Report
As part of our cyber security program, policies governing access, networks, and systems are reviewed at minimum on an annual basis. With increased work from home requirements due to COVID-19, a further risk assessment was performed against these policies that considered the changing cyber threat landscape. The result of this assessment was a series of recommendations that were implemented in the first half of 2020 to further strengthen the organization’s cyber resiliency while balancing the need to enable our workforce to continue to be efficient when working from home.
Other than Vermilion's response to COVID-19, there has been no change in Vermilion’s internal control over financial reporting during the period covered by this MD&A that materially affected, or is reasonably likely to materially affect, its internal control over financial reporting.
Financial Risk Management
To mitigate the risks affecting our business whenever possible, we seek to hire personnel with experience in specific areas. In addition, we provide continued training and development to staff to further develop their skills. When appropriate, we use third party consultants with relevant experience to augment our internal capabilities with respect to certain risks.
We consider our commodity price risk management program as a form of insurance that protects our cash flow and rate of return. The primary objective of the risk management program is to support our dividends and our internal capital development program. The level of commodity price risk management that occurs is dependent on the amount of debt that is carried. When debt levels are higher, we will be more active in protecting our cash flow stream through our commodity price risk management strategy.
When executing our commodity price risk management programs, we use derivative financial instruments encompassing over-the-counter financial structures as well as fixed and collar structures to economically hedge a part of our physical crude oil and natural gas production. We have strict controls and guidelines in relation to these activities and contract principally with counterparties that have investment grade credit ratings.
Critical Accounting Estimates
The preparation of financial statements in accordance with IFRS requires us to make estimates. Critical accounting estimates are those accounting estimates that require us to make assumptions about matters that are highly uncertain at the time the estimate is made and a different estimate could have been made in the current period or the estimate could change period-to-period.
The carrying amount of asset retirement obligations
The carrying amount of asset retirement obligations ($467.7 million as at December 31, 2020) is the present value of estimated future costs, discounted from the estimated abandonment date using a credit-adjusted risk-free rate. Estimated future costs are based on our assessment of regulatory requirements and the present condition of our assets. The estimated abandonment date is based on the reserve life of the associated assets. The credit-adjusted risk-free rate is based on prevailing interest rates for the appropriate term, risk-free government bonds adjusted for our estimated credit spread (determined by reference to the trading prices for debt issued by similarly rated independent oil and gas producers, including our own senior unsecured notes). Changes in these estimates would result in a change in the carrying amount of asset retirement obligations and capital assets and, to a significantly lesser degree, future accretion and depletion expense.
The estimated abandonment date may change from period to period as the estimated abandonment date changes in response to new information, such as changes in reserve life assumptions or regulations. A one year increase or decrease in the estimated abandonment date would decrease or increase asset retirement obligations (with an offsetting increase to capital assets) by approximately $37.7 million.
The estimated credit-adjusted risk-free rate may change from period to period in response to market conditions in Canada and the international jurisdictions that we operate in. A 0.5% increase or decrease in the credit-adjusted risk-free rate would decrease or increase asset retirement obligations by approximately $26.8 million.
Vermilion Energy Inc. ■ Page 28 ■ 2020 Annual Report
The recognition of deferred tax assets
The extent to which deferred tax assets are recognized are based on estimates of future profitability. These estimates are based on estimated future commodity prices and estimates of reserves. As at December 31, 2020, the deferred tax asset balance of $484.5 million primarily related to Canada as a deferred tax asset has not been recognized on our non-expiring tax loss pools in Ireland.
In Canada, we have $36.0 million of non-expiring oil and gas tax pools where $9.0 million of deferred tax assets has not been recognized as there is uncertainty on our ability to fully use these pools based on estimated future taxable profits. Estimated future taxable profits are calculated using proved and probable reserves and forecast pricing. A 5% increase or decrease in sales would increase or decrease the amount of deferred tax assets recognized by approximately $5.0 million.
In Ireland, we have $1.2 billion of non-expiring tax loss pools where $248.2 million of deferred tax assets has not been recognized as there is uncertainty on our ability to fully use these losses based on estimated future taxable profits. Estimated future taxable profits are calculated using proved and probable reserves and forecast pricing. A 5% increase or decrease in sales would not increase or decrease the amount of deferred tax assets recognized.
Depletion and depreciation
Capital assets are grouped into depletion units, which are groups of assets within a specific production area that have similar economic lives. Depletion units represent the lowest level of disaggregation for which costs are accumulated for the purposes of calculating depletion and depreciation.
The net carrying value of each depletion unit is depleted using the unit of production method by reference to the ratio of production in the period to the total proved and probable reserves, taking into account the future development costs necessary to bring the applicable reserves into production.
Key judgments that are made to reserve estimates such as revisions in reserves, changes in forecast commodity prices, foreign exchange rates, capital or operating costs would impact the amount of depletion and depreciation recorded in a period.
The estimated recoverable amount of cash generating units
Each reporting period, we assess our CGUs for indicators of impairment or impairment reversal. If an indicator of impairment or impairment reversal is identified, we estimate the recoverable amount of the CGU. Judgment is required when determining whether indicators of impairment or impairment reversal exist, as well as judgments made when determining the recoverable amount of a CGU. Changes in any of the key judgments, such as a revision in reserves, changes in forecast commodity prices, foreign exchange rates, capital or operating costs would impact the estimated recoverable amount.
In the fourth quarter of 2020, indicators of impairment were present in our France CGUs due to a decrease in estimated reserves as a result of economic revisions. As a result of the indicators of impairment, the Company performed impairment tests on its four France CGUs and the recoverable amounts were determined using fair value less costs to sell, which considered future after-tax cash flows from proved plus probable reserves and an after-tax discount rate of 9.5%. Based on the results of the impairment tests completed, recoverable amounts were determined to be greater than the carrying values of the CGUs tested and no impairment charges were recorded. A 1% increase in the assumed after-tax discount rate would reduce the estimated recoverable amount of assets tested and result in an impairment of $5.6 million while a 5% decrease in revenues (due to a decrease in commodity price forecasts or reserve estimates) would reduce the estimated recoverable amount of assets tested and result in an impairment of $24.8 million.
In the third quarter of 2020, indicators of impairment were present due to a decline in the Company’s market capitalization. As a result of the indicators of impairment, the Company performed impairment tests across all CGUs. The recoverable amounts were determined using fair value less costs to sell, which considered future after-tax cash flows from proved plus probable reserves and an after-tax discount rate of 11.5%. Based on the results of the impairment tests completed, the Company recognized non-cash impairment charges of $35.4 million (net of $12.4 million income tax recovery) in the Neocomian CGU due to increased estimated transportation expenses as a result of an announcement during the quarter that the third-party Grandpuits refinery plans on converting into a zero-crude platform in 2021. As a result of this change, the Company's estimates that incremental transportation expenses will be incurred to transport the crude oil production in the Neocomian, Chaunoy, and Champotran CGUs to alternative refineries in France. A 1% increase in the assumed after-tax discount rate would reduce the estimated recoverable amount of impaired assets by $5.2 million (resulting in a $53.0 million impairment) while a 5% decrease in revenues (due to a decrease in commodity price forecasts or reserve estimates) would reduce the estimated recoverable amount of impaired assets by $13.2 million (resulting in a $61.0 million impairment).
Vermilion Energy Inc. ■ Page 29 ■ 2020 Annual Report
In the second quarter of 2020, indicators of impairment were present due to a decline in the Company’s market capitalization. As a result of the indicators of impairment, the Company performed impairment tests across all CGUs. The recoverable amounts were determined using fair value less costs to sell, which considered future after-tax cash flows from proved plus probable reserves and an after-tax discount rate of 11.5%. Based on the results of the impairment tests completed, the Company recognized non-cash impairment charges of $53.1 million (net of $16.6 million income tax recovery). A 1% increase in the assumed after-tax discount rate would reduce the estimated recoverable amount of impaired assets by $14.0 million (resulting in a $83.7 million impairment) while a 5% decrease in revenues (due to a decrease in commodity price forecasts or reserve estimates) would reduce the estimated recoverable amount of impaired assets by $37.5 million (resulting in a $107.2 million impairment).
In the first quarter of 2020, indicators of impairment were present due to global commodity price forecasts deteriorating from decreases in demand and an increase of supply around the world. As a result of the indicators of impairment, the Company performed impairment tests across all CGUs. The recoverable amounts were determined using fair value less costs to sell, which considered future after-tax cash flows from proved plus probable reserves and an after-tax discount rate of 11.5%. Based on the results of the impairment tests completed, the Company recognized non-cash impairment charges of $1.2 billion (net of $0.4 billion income tax recovery). A 1% increase in the assumed after-tax discount rate would reduce the estimated recoverable amount of impaired assets by $137.7 million (resulting in a $1.7 billion impairment) while a 5% decrease in revenues (due to a decrease in commodity price forecasts or reserve estimates) would reduce the estimated recoverable amount of impaired assets by $272.3 million (resulting in a $1.8 billion impairment).
Off Balance Sheet Arrangements
We have not entered into any guarantee or off balance sheet arrangements that would materially impact our financial position or results of operations.
Recently Adopted Accounting Pronouncements
Vermilion did not adopt any new accounting pronouncements as at December 31, 2020.
Health, Safety and Environment
We are committed to ensuring our activities are conducted in a manner that will protect the health and safety of our employees, contractors, and the public. Our health, safety, and environment (“HSE”) vision is “Best in Class HSE”, our mission is to fully integrate health, safety, and environment into our business, where our culture is recognized as a model by industry and stakeholders, resulting in a safe and healthy workplace. Our mantra is HSE: Everywhere. Everyday. Everyone.
We maintain health, safety and environmental practices and procedures in compliance with or exceeding regulatory requirements and industry standards. All of our personnel are expected to work safely and in accordance with established regulations and procedures, and we seek to reduce impacts to land, water and air. During 2020 we:
| • | Maintained clear priorities around 5 key focus areas of HSE Culture, Communication and Knowledge Management, Management Systems, Health, and Environment & Operational Stewardship; |
| • | Activated our Emergency Response and Business Continuity Plans to address COVID-19 with a primary focus on healthy and safe operations; |
| • | Completed ongoing HSE Performance Monitoring through key performance indicator development, analysis and reporting; |
| • | Continued comprehensive investigations of our incidents and near misses to ensure root causes were identified and corrective actions effectively implemented; |
| • | Implemented action plans to address the findings of our latest HSE Perception Survey, which we conduct every three years. Our results all factored in the favorable range; |
| • | Implemented a new Event and Environmental Management Information System; |
| • | Implemented recently updated corporate standards updates related to operational risk management, contractor management, marine transportation, and environmental management; |
| • | Continued reinforcement of the “Vermilion High 5”, an individual safety awareness initiative aimed at keeping front-line workers safe; |
| • | Further developed and validated critical procedures and initiated competency assessments as part of fit-for-purpose training and competency programs; |
| • | Submitted our First CDP Water report. Continued submitting our CDP Climate report; |
| • | Managed our waste products by reducing, recycling and recovering; |
| • | Reduced long-term environmental liabilities through decommissioning, abandoning and reclaiming well leases and facilities; |
| • | Further refined and expanded our enterprise wide corporate risk register; |
| • | Continued the development of a robust hazard identification and risk mitigation program specific to environmentally sensitive areas; |
Vermilion Energy Inc. ■ Page 30 ■ 2020 Annual Report
| • | Continued the development of our Corporate Process Safety Management System with emphasis on Process Hazards Analysis and risk reduction measures; |
| • | Performed auditing, management inspections and workforce observations to measure compliance and identify potential hazards and apply risk reduction measures; and |
| • | Developed, communicated and measured against leading and lagging HSE key performance indicators. |
We are a member of several organizations concerned with environment, health and safety, including numerous regional co-operatives and synergy groups. In the area of stakeholder relations, we work to build long-term relationships with environmental stakeholders and communities.
Environmental, Social and Governance (ESG)
In 2020 we continued to support recommendations from the Task Force on Climate-related Financial Disclosures (TCFD) and the Sustainability Accounting Standards Board (SASB) in our ESG strategy and reporting, focusing not only on climate but also on sustainability in a wider context. In 2020, our Board of Directors and senior management analyzed the results of their robust scenario analysis that was based on reporting from the World Economic Forum, including a “Gradual, Business as Usual” scenario and a “Rapid, 2ºC or lower, Sustainable Development” scenario. This included factors such as the influence of new technologies, technology growth, government policy, and emerging markets that will impact the speed of the energy transition, and the resulting risks and opportunities for Vermilion. Our 2020 performance in sustainability rankings such as CDP Climate, SAM, and Sustainalytics continued to be at the top of our peer group.
Sustainability
As a responsible oil and gas producer, we consistently seek to deliver long-term shareholder value by operating in an economically, environmentally and socially sustainable manner that is recognized as a model in our industry.
Vermilion understands our stakeholders’ expectations that we deliver strong financial results in a responsible and ethical way. As a result, we align our strategic priorities in the following order:
| • | the safety and health of our staff and those involved directly or indirectly in our operations; |
| • | our responsibility to protect the environment. We follow the Precautionary Principle introduced in 1992 by the United Nations "Rio Declaration on Environment and Development" by using environmental risk as part of our development decision criteria, and by continually seeking improved environmental performance in our operations; and |
| • | economic success through a focus on operational excellence across our business, which includes technical and process excellence, efficiency, expertise, stakeholder relations, and respectful and fair treatment of staff, contractors, partners and suppliers. |
Reflecting these priorities, we have positioned Vermilion purposefully within the energy transition. Predictions differ about the manner and speed of the transition, but our own scenario analyses are clear that Vermilion can best contribute by focusing on producing energy responsibly: reliably, cost-effectively and safely. We also believe those stakeholders who are concerned about sustainability, including investors, governments, regulators, communities and citizens, should turn to best-in-class operators such as Vermilion. Our crude oil and natural gas assets are strategic resources that can, and should, be deployed in the service of the transition and, indeed, of the framework for the planet’s health and wellbeing represented by the United Nations Sustainable Development Goals (SDGs).
To support our strategy, we regularly communicate with our stakeholders, including through our sustainability reporting. In 2020, this included providing alignment with TCFD and SASB. For more information, please see references to sustainability throughout this document, including the Climate Risk discussion. For additional context, our Sustainability Report is available online at www.vermilionenergy.com (under the heading “Our Responsibility”).
Vermilion’s sustainability performance and reporting have earned consistently strong recognition from external stakeholders:
| Accomplishments |
| • | The Company received the top ranking for our peer group in SAM's 2020 Corporate Sustainability Assessment ("CSA”) and was selected for The Sustainability Yearbook 2021, indicating that our sustainability performance is within the top 15% of our industry (SAM's Upstream Oil & Gas and Integrated category). |
| • | Vermilion was ranked top of our peer group in the Sustainalytics ESG Risk Rating. |
| • | Vermilion maintained its MSCI ESG rating of AA in 2020. |
| • | As of February 2021, our ISS decile ratings were 1 for both Environmental and Social QualityScores, which assess corporate disclosure and transparency practices in these areas, where 1 indicates the lowest risk. |
Vermilion Energy Inc. ■ Page 31 ■ 2020 Annual Report
Climate-related Disclosures: TCFD 2(a) and 2(b)
Vermilion has publicly communicated our identified climate-related risks and opportunities since our first annual CDP Climate Change response in 2014. We progressed this transparency by submitting our first CDP Water Security questionnaire in 2020. The following table summarizes climate-related issues as per TCFD Strategy recommendations 2(a) and 2(b).
For more information on our sustainability- and climate-related governance, strategy, risk management, and metrics and targets, please see our 2021 Proxy Statement and Information Circular, our online sustainability reporting, particularly the Index and Performance Metrics sections, and our 2020 CDP Responses, which include additional details for the following summaries of risks and opportunities.
Vermilion Energy Inc. ■ Page 32 ■ 2020 Annual Report
| Category
/ Issue |
Description of Impacts1 | Potential Financial Impact | Management Approach |
| Short-term Transition Risks (0-3 Years) | |||
Policy and Legal: Increased Pricing of GHG Emissions e.g. Carbon Tax
|
In April 2019, our Saskatchewan operations became subject to the federal Greenhouse Gas Pollution Pricing Act, with carbon tax rates set at $20 per tonne of CO2e in 2019, rising to $50 by 2022. In Alberta, the TIER system will apply a tax rate of $30 per tonne of CO2e commencing January 2020. Since carbon pricing mechanisms are vulnerable to changes in government policy, regions with upcoming elections, coalition governments or minority governments may be subject to changes that cannot yet be identified. We note the political focus in the EU and Canada on a COVID-19 economic recovery that is both climate-focused and responsive to social justice issues such as labour practices. | Based on the probable cost scenarios identified in our Carbon Liability Assessment Tool, our Canadian carbon tax liability is not expected to exceed $0.5MM/year in the medium term. The Ireland EU ETS liability is forecasted to be approximately $1.1MM/year between 2021 and 2025. The Ireland Carbon Tax liability is forecasted to be an additional approximately $0.3MM/year over this period. Commencing in 2021, our Netherlands operations will likely be subject to an indirect carbon tax applied to the price of fossil fuels. The cost implication of the tax is expected to be limited. | Vermilion continues to monitor and comply with taxation requirements, engaging external subject matter experts and in-house experts in engineering, asset integrity, optimization, health safety & environment, and sustainability that assess our operations to determine where we are able to apply the principles of Operational Excellence supporting Integrated Sustainability. As a result, the potential financial impact is significantly decreased and anticipated to decrease further in the short term. Vermilion's ongoing efforts to reduce the energy intensity of our operations also contribute to managing this risk. |
Policy and Legal: Enhanced Emissions Reporting Obligations
|
Emissions reporting obligations are an ongoing risk and can change due to political and regulatory evolution. The impact to Vermilion would be a decreased netback on a per BOE basis, due to increased expenditures for personnel time and system development and implementation. Based on the current output of Vermilion's facilities in Canada and Europe and on the current regulated thresholds, the cost associated with meeting emission reporting obligations will likely increase in the short-term. | The financial impact is anticipated to be realized as a small increase in operational cost associated with the management and quantification of emissions to meet new reporting requirements. This is built into Vermilion's operating expenses and is currently estimated at $0.4MM annually. | Regulations in all of our business units are monitored on an ongoing basis, and assumptions/scenario planning is used annually to assess risk. Vermilion also engages stakeholders relating to emissions reporting obligations. Management of this risk is built into Vermilion's operations and our Enterprise Risk Matrix. |
Policy and Legal and Technology: Mandates on and Regulation of Existing Products and Services
|
Vermilion's operations are subject to regional regulatory changes that result in changes to equipment requirements such as engineering and equipment modifications to reduce carbon emissions and / or emissions of criteria air contaminants. | Operational changes to comply with methane reduction regulations is expected at approx. $1.5MM in the short term, with those associated with eliminating routine flaring in France not expected to exceed $0.5MM. Costs associated with the Netherlands MJA3 program are built into operating costs and no significant expenditures are anticipated in the short term. | Vermilion is allocating resources to complete these works on a planned program basis, as opposed to a reactive single replacement program, resulting in an overall reduction in costs associated with the work. Tying in vented equipment to flaring infrastructure in Canada is an example of projects planned in the near term to address this risk. |
| Medium-term Transition Risks (3-6 Years) | |||
Policy and Legal: Changes in Emissions Regulations
|
The risk associated with a change in emission regulations in one or more of our business units is accounted for by Vermilion's Enterprise Risk Matrix, with mitigation measures being reviewed, updated, and implemented on an annual basis. A shift in international regulations may also result in an impact to Vermilion's supply chain, resulting in a limitation of market access or direct impact to the price of our products. As Vermilion maintains a diversified asset base, we believe the risk to the marketability of our products is low. | Based on the anticipated changes in the various regulatory regimes under which Vermilion operates, the financial impact due to a regulatory change over the next 3 years is anticipated to be less than $2.0MM. This does not include the cost associated with emission reduction projects completed on an annual basis, or previous projects that have annual emissions reductions. | The formalization of Integrated Sustainability as a strategic objective in Vermilion’s long-term strategic plan allows us to better understand, identify, proactively respond, and manage the potential risk and uncertainty inherent in an evolving regulatory framework, both at a regional and corporate level. This includes the Sustainability Committee at the Board of Directors level, monthly Executive Committee meetings on Sustainability strategy and performance, and risk identification at the corporate and business unit level. |
| Medium-term Physical Risks (3-6 Years) | |||
| Acute: Increased Severity of Extreme Weather Events such as Cyclones and Floods |
Vermilion owns and operates an offshore platform in the Wandoo field off northwestern Australia, co-owns and operates the Corrib project off the Irish coast, and owns and operates oil fields in the coastal area of SW France. Extreme weather events have the potential to directly impact our offshore operations resulting in down time or damage to infrastructure, and can impact the downstream handling capacity of our partners, resulting in a limitation to the distribution and sale of our products. | Based on the value of the Wandoo Platform and a 1-in-10,000 year cyclonic event, the financial implications associated with damage due to a severe weather event is estimated at $234.5MM (total impact before insurance). The third-party costs associated with potential damages from extreme weather events are not tracked by Vermilion. | Vermilion maintains insurance as a mitigative measure to reduce the financial impact associated with damage to our assets due to severe weather events. We also have a robust asset integrity program that maintains our offshore facilities to their original design specifications of CAT 5 hurricane force. We also have protocols for monitoring and preparing for cyclones, and have invested in our emergency response capabilities in the event of damage to our assets as a result of a severe weather event. |
| Long-term Transition Risks (6-50 Years) | |||
Market and Reputational: Changing Customer Behaviour
|
As consumers and governments become more socially aware of the sources of their energy, negative perceptions of organizations or production methods have the potential to impact energy sector companies through company valuations, restricted licensing and permitting, and stakeholder opposition.
|
The impact of decreased consumer confidence and perception is not calculable. On a per share basis, the market impact of the loss of $1 per share would be approximately $156.0MM. The direct cost of Vermilion's operating excellence and risk management cannot be quantified on a single risk basis. | Vermilion is positioned within the evolving energy transition, with an unwavering commitment to our priorities of health and safety, environmental protection, and economic prosperity. We believe that those commitments, and our contributions to the UN SDGs constitute qualitative advantages that set us apart from our competitors. Sustainable practices are ingrained into the way we operate, and we will continue to focus on our Integrated Sustainability strategic objective. We believe this advantage attracts investors to Vermilion and will continue to give Vermilion a competitive advantage in the future. |
Vermilion Energy Inc. ■ Page 33 ■ 2020 Annual Report
| Category
/ Issue |
Description of Impacts1 | Potential Financial Impact | Management Approach |
| Long-term Physical Risks (6-50 Years) | |||
| Chronic: Changes in Temperature Extremes, Including Rising Mean Temperatures |
A decrease or increase in the temperature extremes experienced in winter/summer months (i.e. lower seasonal lows, higher seasonal highs) could result in an increase in fuel gas for a variety of equipment essential for safe production, along with additional equipment (e.g. building heaters, line heaters). This would require additional resources (infrastructure) as well as increase our carbon footprint. Temperature extremes also have the potential to increase capital costs associated with drilling, completion and workover operations due to increased timelines, decreased productivity, equipment breakdown, etc. | For example, an overall increase in seasonal lows (warmer winters) would have a direct impact on Vermilion's more northern onshore operations and could result in a decrease in ability to access lands and increase construction capital requirements. The financial implications on an annual basis are difficult to quantify; however, based on Vermilion's experience, the most significant financial implications would result from shutdowns in drilling or completions locations. The estimated cost of this would be $0.5MM per day of delay. | As extreme weather cannot be controlled, Vermilion uses our various Management Systems and processes to protect the health and safety of our workers, contractors and the public, and to protect the environment from adverse effect. For example, we have reduced the potential impact related to access in remote assets by using multi-well pads wherever possible. This reduces the aerial impact of these activities on the environment, habitat fragmentation and carbon emissions associated with lease construction and equipment mobilization/demobilization. This would significantly decrease capital considerations in the event that limited frost days occurred. |
Chronic: Changes In Precipitation Patterns and Extreme Variability in Weather Patterns
|
Vermilion holds assets inland, in coastal regions, and offshore. A change in precipitation in any of these locations could have a negative impact on operations due to drought or flooding. Flooding could result in limited access to locations / facilities, and poses a risk to our corporate headquarters. Alternatively, drought conditions could impact the availability of surface and / or groundwater, which Vermilion, in part, relies on for drilling and completion activities. This could negatively impact forecasted growth by increasing the timelines and capital costs to bring new infrastructure onto production. | The financial implications of a single time event (i.e. wild fire) has been assessed on a case-specific basis, and the financial implications of this event is believed to be substantive (impact > $10.0MM). Vermilion maintains insurance to mitigate the potential impact of precipitation-related extreme events (i.e. Wildfire, Flooding). | As these incidents are out of Vermilion's control, we take all measures possible to ensure effective emergency response to extreme weather events, to ensure the protection of the health and safety of our workers, contractors and the public, the protection of the environment and limiting the financial impact of the event. In the case of a longer term extreme precipitation event or drought, in the past Vermilion has implemented water management programs to reduce our reliance on fresh water sources to limit the potential impact on operations. |
Chronic: Rising Sea Levels
|
Vermilion owns and operates assets in the Netherlands. We have identified and assessed the potential risk associated with rising sea levels here, as it has the potential to physically impact our operations due to issues such as flooding, transportation difficulties and supply chain interruptions. Rising sea levels also pose a threat related to the salinization of groundwater. | It has been estimated that a rise in sea level could have a maximum foreseeable financial impact of $91.3MM at our main gas processing facility Garijp (GTC) in the Netherlands, caused by an extreme tide/extreme wind event 1 in 10000 years. The cost of insurance coverage associated with this risk is estimated at $0.4MM per annum. | Other than conventional berm protection, there is no measure available to protect Vermilion's assets in the Netherlands in the event that water levels rise to a level resulting in one of our main facilities being temporarily invaded by sea water. Based on Vermilion's assessment of the probability of these events occurring over the next 5 years being less than 0.05%, Vermilion has accepted this level of risk exposure. Vermilion currently includes a review of this risk in our annual risk management process. |
| Short-term Opportunities (0-3 Years) | |||
Products and Services: Development of New Products and Services through R&D and Innovation
|
As Vermilion has developed our emissions quantification programs across the globe, we have developed more robust methods for sharing of technologies and techniques from across our operations, both internally and externally. Our increased focus on tracking emissions has supported the assessment of opportunities across business units and sharing of technical expertise. | As this opportunity is in the early stage of assessment, it is difficult to quantify the financial impact, but it is estimated at up to $2.0MM per year. Potential also exists for significant cost adjustments, as assets slated for abandonment would be repurposed to enable them to continue to generate energy. | We have technical experts who provide input into renewable energy projects as they are identified. These teams are supported by corporate sustainability staff in connecting internal and external stakeholders. These teams have responsibilities specific to geothermal opportunities as these projects move through their preliminary stages. To further support identification of opportunities, and engagement with stakeholders, Vermilion has appointed sustainability leads in all our business units. |
| Short-term Opportunities (0-3 Years) | |||
Products and Services: Access to New Markets
|
More stringent global measures to reduce emissions from individual ships by 30 per cent by 2030, established through amendments to MARPOL Annex VI, came into force on Jan1 2020, limiting the sulphur content of bunker fuel to a maximum of 0.5%. Vermilion’s Australian Wando facility produces 4500 bbl/d of low sulphur crude oil that will be sought by refineries in the short term to meet IMO regulations. | Vermilion conservatively foresees achieving a premium of $10/bbl for its Wandoo production over the next three years for cumulative incremental revenue of $49.3MM. | Vermilion continues to access local markets for our low sulphur production, while exploring regions to expand our operations. Our Marketing group ensures that Vermilion meets its contractual obligation with our buyers in terms of volumes, delivery dates and crude quality, and maintain our reputation of being a reliable source of low sulphur feedstock to refineries. |
| Medium-term Opportunities (3-6 Years) | |||
Energy Source: Participation in Carbon Market
|
Under the revised EU ETS Directive in effect 2021-2030, it is anticipated that there will be an active market and consumers for the offset credits generated at some of Vermilion's sustainability initiatives around the world. This upcoming shift in the cap and trade scheme will likely provide opportunities for Vermilion to generate certified energy reduction/offset credits through our geothermal cogeneration projects in France. | Vermilion is not accounting for any short term financial impact. It is estimated that following the change to the EU ETS in Phase 4, the carbon price will stabilize at between approximately €15 and €30 per tCO2e. The financial impact to Vermilion annually is estimated to be up to $0.5MM. | We are currently evaluating the benefit that certified offset credits from various emission reduction projects across our operations
could provide. Examples of projects that have the potential to generate credits is our Tomato Greenhouse and eco-neighbourhood geothermal coproduction projects in France. Vermilion's project assessment framework is applied to each identified opportunity, including considerations associated with emissions offset.
|
Vermilion Energy Inc. ■ Page 34 ■ 2020 Annual Report
| Category
/ Issue |
Description of Impacts1 | Potential Financial Impact | Management Approach |
| Long-term Opportunities (6-50 Years) | |||
Products and Services: Shift in Consumer Preferences
|
Under the Canadian Environmental Protection Act and based on commitments made by the Canadian and Alberta governments relating to COP21, there is a commitment to reduce emissions for coal-fired power generation. Based on this and with a number of power generating facilities in Alberta nearing the end of their service life, the demand for natural gas is likely to increase due to increased use of combined cycle gas turbine (CCGT) power generation. Alberta has also committed to significantly reducing its demand for coal for power generation by 2050. | The short term impact of this regulatory change on gas pricing is anticipated to be low and increase to medium in the mid to long term. Once the regulations have come into effect and the implementation period has occurred, there is a potential to see an impact on the marketable price and demand for natural gas. As a natural gas and oil producer, Vermilion would benefit from an increase in marketable prices for natural gas in our Canadian operations. Based on 2019 production, an increase in gas price of $1 per MMBTU, the impact to sales would be approximately $54.0MM. | As we move further into the energy transition, we foresee natural gas playing an impactful role as a less carbon intense fuel than other options (i.e. coal). Vermilion continues to focus on the identification of resources and assets where we have the opportunity to apply our industry leading expertise to optimize production while reducing emissions. An example of our strategy to realize this opportunity is our asset base in Alberta, which currently includes a large liquids rich gas play. Vermilion's marketing team is also actively pursuing options for our natural gas production that will enable Vermilion to achieve the best netbacks on production. |
Products and Services: Ability to Diversify Business Activities
|
Vermilion maintains a diverse, stable global portfolio of oil and gas assets. Our strong record of safe and socially conscious development of energy resources has provided opportunities to access and develop these resources. We see our commitment to sustainability as core to our business, which has provided important organizational focus on emissions quantification and management. As consumers become more aware of and involved in the selection of their energy sources and associated carbon intensity, we believe that Vermilion will continue to be a top quartile choice, providing us with opportunities not available to peer organizations. | The financial impact of changing consumer preferences in difficult to quantify. We foresee opportunities in two distinct areas. We see opportunity in consumers selecting premium energy products, with these products demanding a higher price than other energy sources on the market. Currently we estimate the potential impact of premium pricing in the long-term to be $1-5 per BOE or $36.6MM/yr (100,357 boe/d*365days*$1/boe)based on $1 at 2019 production levels). The second opportunity we have identified, and are already receiving benefit from, is access to more stringent markets, supported by our environmental and sustainability performance. Vermilion has entered into the German, Hungarian, Croatian, and Slovak oil and gas operations in the last several years. Our sustainability performance has supported our entry into these markets. | Vermilion made the organizational change to established Integrated Sustainability as one of our strategic objectives in 2015. This provided
important organizational focus on matters such as environmental performance, including climate change. Our strategy is to continue to support Integrated Sustainability, with personnel who are experts in their field, as well as financially supporting programs and projects that reduce emissions while optimizing production. An example of this is the addition of personnel who have specific responsibilities associated with sustainability in our business units, including study and feasibility assessment of green energy generation.
|
Energy Source: Shift Toward Decentralized Energy Generation
|
The carbon intensity of energy used around the world has a direct relationship to where the energy product was generated. Vermilion’s business unit structure supports production and distribution of energy products into local markets. This strategy results in the significant reduction of the carbon footprint of our energy when compared to non-local sources. | On an operating netback (sales) basis, based on current estimates, the financial premium of our non-Canadian assets was $450.0MM. | Vermilion continues to assess where we can access local markets for our production, while exploring regions to expand our operations. The actions taken in the past several years to realize this opportunity include alterations to our structure, our strategic objectives and our operational development plans to support Vermilion as a distributed energy provider, and exploration and development programs in regions with relatively low energy production as compared to consumption (i.e. Hungary). |
Notes:
| (1) | Risk summary is based on our fiscal year 2019 environmental reporting through CDP Climate. Fiscal year 2020 environmental reporting will be available in mid-2021. |
Vermilion Energy Inc. ■ Page 35 ■ 2020 Annual Report
Corporate Governance
We are committed to a high standard of corporate governance practices, a dedication that begins at the Board level and extends throughout the Company. We believe good corporate governance is in the best interest of our shareholders, and that successful companies are those that deliver growth and a competitive return along with a commitment to the environment, to the communities where they operate, and to their employees.
We comply with the objectives and guidelines relating to corporate governance adopted by the Canadian Securities Administrators and the Toronto Stock Exchange ("TSX"). In addition, the Board monitors and considers the implementation of corporate governance standards proposed by various regulatory and non-regulatory authorities in Canada. A discussion of corporate governance policies is included each year in our proxy materials for our annual general meeting of shareholders, copies of which are available on SEDAR (www.sedar.com).
As a Canadian reporting issuer with securities listed on the TSX and the New York Stock Exchange (“NYSE”), Vermilion is required to comply with all applicable Canadian requirements adopted by the Canadian Securities Administrators and the TSX, and applicable rules for foreign private issuers adopted by the U.S. Securities and Exchange Commission that give effect to the provisions of the Sarbanes-Oxley Act of 2002.
Our corporate governance practices also incorporate many “best practices” derived from those required to be followed by US domestic companies under the NYSE listing standards. We are required by Section 303A.11 of the NYSE Listed Company Manual to identify any significant ways in which our corporate governance practices differ from those required to be followed by US domestic companies under NYSE listing standards. We believe that there are no such significant differences in our corporate governance practices, except as follows:
| • | Shareholder Approval of Equity Compensation Plans. Section 303A.8 of the NYSE Listed Company Manual requires shareholder approval of all “equity compensation plans” and material revisions to those plans. The definition of “equity compensation plans” covers plans that provide for the delivery of newly issued securities, and also plans which rely on securities reacquired on the market by the issuing company for the purpose of redistribution to employees and directors. The TSX rules provide that equity compensation plans and material amendments thereto require shareholder approval only if they involve newly issued securities and the amendments are not otherwise addressed in the plan’s amendment procedures. In addition, the TSX rules require that every three years after institution, all unallocated options, rights or other entitlements under equity compensation plans which do not have a fixed maximum aggregate of securities issuable must be approved by shareholders. Vermilion follows the TSX rules with respect to shareholder approval of equity compensation plans and material revisions to those plans. |
Disclosure Controls and Procedures
Our officers have established and maintained disclosure controls and procedures and evaluated the effectiveness of these controls in conjunction with our filings.
As of December 31, 2020, we have evaluated the effectiveness of the design and operation of our disclosure controls and procedures. Based on this evaluation, the President, for this specific purpose of acting in the capacity of Chief Executive Officer, and Chief Financial Officer have concluded and certified that our disclosure controls and procedures are effective.
Internal Control Over Financial Reporting
A company's internal control over financial reporting is a process to provide reasonable assurance regarding the reliability of financial reporting and the preparation of financial statements for external purposes in accordance with generally accepted accounting principles. A company's internal control over financial reporting includes those policies and procedures that (1) pertain to the maintenance of records that, in reasonable detail, accurately and fairly reflect the transactions of the company; (2) provide reasonable assurance that transactions are recorded as necessary to permit preparation of financial statements in accordance with generally accepted accounting principles, and that receipts and expenditures of the company are being made only in accordance with authorizations of management and directors of the company; and (3) provide reasonable assurance regarding prevention or timely detection of unauthorized acquisition, use, or disposition of the company's assets that could have a material effect on the financial statements.
The Chief Executive Officer and the Chief Financial Officer of Vermilion have assessed the effectiveness of Vermilion’s internal control over financial reporting as defined in Rule 13a-15 under the US Securities Exchange Act of 1934 and as defined in Canada by National Instrument 52-109, Certification of Disclosure in Issuers’ Annual and Interim Filings. The assessment was based on the framework in Internal Control – Integrated Framework (2013) issued by the Committee of Sponsoring Organizations of the Treadway Commission. The President, for this specific purpose of acting in the capacity of Chief Executive Officer, and the Chief Financial Officer of Vermilion have concluded that Vermilion’s internal control over financial reporting was effective as of December 31, 2020. The effectiveness of Vermilion’s internal control over financial reporting as of December 31, 2020 has been audited by Deloitte LLP, as reflected in their report included in the 2020 audited annual financial statements filed with
Vermilion Energy Inc. ■ Page 36 ■ 2020 Annual Report
the US Securities and Exchange Commission. No changes were made to Vermilion’s internal control over financial reporting during the year ended December 31, 2020, that have materially affected, or are reasonably likely to materially affect, the internal controls over financial reporting.
Vermilion Energy Inc. ■ Page 37 ■ 2020 Annual Report
Supplemental Table 1: Netbacks
The following table includes financial statement information on a per unit basis by business unit. Liquids includes crude oil, condensate, and NGLs. Natural gas sales volumes have been converted on a basis of six thousand cubic feet of natural gas to one barrel of oil equivalent.
| Q4 2020 | 2020 | Q4 2019 | 2019 | |||||||
| Liquids | Natural Gas | Total | Liquids | Natural Gas | Total | Total | Total | |||
| $/bbl | $/mcf | $/boe | $/bbl | $/mcf | $/boe | $/boe | $/boe | |||
| Canada | ||||||||||
| Sales | 43.65 | 2.82 | 32.45 | 36.86 | 2.06 | 26.38 | 38.38 | 37.82 | ||
| Royalties | (5.03) | (0.06) | (3.08) | (4.25) | (0.05) | (2.55) | (4.48) | (4.30) | ||
| Transportation | (2.60) | (0.20) | (2.02) | (2.51) | (0.19) | (1.92) | (1.93) | (1.88) | ||
| Operating | (12.92) | (1.41) | (11.05) | (12.05) | (1.26) | (10.13) | (11.30) | (11.09) | ||
| Operating netback | 23.10 | 1.15 | 16.30 | 18.05 | 0.56 | 11.78 | 20.67 | 20.55 | ||
| General and administration | (1.60) | (1.18) | (1.38) | (1.07) | ||||||
| Fund flows from operations netback | 14.70 | 10.60 | 19.29 | 19.48 | ||||||
| United States | ||||||||||
| Sales | 39.70 | 1.97 | 33.24 | 39.43 | 1.77 | 32.93 | 43.77 | 44.17 | ||
| Royalties | (11.64) | (0.59) | (9.76) | (10.30) | (0.50) | (8.65) | (10.17) | (10.96) | ||
| Transportation | (1.06) | — | (0.82) | (0.86) | — | (0.67) | — | — | ||
| Operating | (10.05) | (1.48) | (9.77) | (9.16) | (1.39) | (8.97) | (9.56) | (9.59) | ||
| Operating netback | 16.95 | (0.10) | 12.89 | 19.11 | (0.12) | 14.64 | 24.04 | 23.62 | ||
| General and administration | (5.22) | (3.68) | (4.01) | (4.43) | ||||||
| Fund flows from operations netback | 7.67 | 10.96 | 20.03 | 19.19 | ||||||
| France | ||||||||||
| Sales | 58.11 | — | 58.11 | 55.39 | — | 55.39 | 80.87 | 83.01 | ||
| Royalties | (10.28) | — | (10.28) | (9.74) | — | (9.75) | (10.67) | (11.15) | ||
| Transportation | (4.66) | — | (4.66) | (4.44) | — | (4.44) | (3.34) | (5.49) | ||
| Operating | (17.73) | — | (17.73) | (17.36) | — | (17.36) | (16.78) | (15.57) | ||
| Operating netback | 25.44 | — | 25.44 | 23.85 | — | 23.84 | 50.08 | 50.80 | ||
| General and administration | (3.68) | (3.98) | (5.01) | (3.91) | ||||||
| Current income taxes | (0.15) | (0.04) | (5.16) | (5.45) | ||||||
| Fund flows from operations netback | 21.61 | 19.82 | 39.91 | 41.44 | ||||||
| Netherlands | ||||||||||
| Sales | 49.63 | 5.70 | 34.40 | 45.99 | 3.79 | 23.02 | 33.88 | 37.37 | ||
| Royalties | — | (0.04) | (0.22) | — | (0.03) | (0.16) | (0.17) | (0.49) | ||
| Operating | — | (1.97) | (11.64) | — | (1.92) | (11.38) | (13.11) | (10.64) | ||
| Operating netback | 49.63 | 3.69 | 22.54 | 45.99 | 1.84 | 11.48 | 20.60 | 26.24 | ||
| General and administration | — | (0.43) | (1.03) | (0.88) | ||||||
| Current income taxes | 4.74 | 1.32 | 15.05 | 1.31 | ||||||
| Fund flows from operations netback | 27.28 | 12.37 | 34.62 | 26.67 | ||||||
| Germany | ||||||||||
| Sales | 51.53 | 5.64 | 39.87 | 48.43 | 3.69 | 30.40 | 39.14 | 45.75 | ||
| Royalties | (1.17) | 1.23 | 4.44 | (2.18) | (0.05) | (0.88) | (1.99) | (4.20) | ||
| Transportation | (13.10) | (0.32) | (5.74) | (11.73) | (0.36) | (5.19) | (3.27) | (4.09) | ||
| Operating | (20.53) | (3.56) | (21.07) | (21.08) | (2.87) | (18.42) | (25.14) | (19.93) | ||
| Operating netback | 16.73 | 2.99 | 17.50 | 13.44 | 0.41 | 5.91 | 8.74 | 17.53 | ||
| General and administration | (7.44) | (5.80) | (6.64) | (6.75) | ||||||
| Fund flows from operations netback | 10.06 | 0.11 | 2.10 | 10.78 | ||||||
| Ireland | ||||||||||
| Sales | — | 7.23 | 43.38 | — | 4.26 | 25.59 | 33.65 | 36.81 | ||
| Transportation | — | (0.28) | (1.68) | — | (0.32) | (1.94) | (1.55) | (1.57) | ||
| Operating | — | (1.01) | (6.06) | — | (1.11) | (6.67) | (4.40) | (4.39) | ||
| Operating netback | — | 5.94 | 35.64 | — | 2.83 | 16.98 | 27.70 | 30.85 | ||
| General and administration | (0.07) | (0.26) | (0.75) | (0.88) | ||||||
| Fund flows from operations netback | 35.57 | 16.72 | 26.95 | 29.97 | ||||||
Vermilion Energy Inc. ■ Page 38 ■ 2020 Annual Report
| Q4 2020 | 2020 | Q4 2019 | 2019 | |||||||
| Liquids | Natural Gas | Total | Liquids | Natural Gas | Total | Total | Total | |||
| $/bbl | $/mcf | $/boe | $/bbl | $/mcf | $/boe | $/boe | $/boe | |||
| Australia | ||||||||||
| Sales | 75.99 | — | 75.99 | 76.70 | — | 76.70 | 88.35 | 93.33 | ||
| Operating | (36.39) | — | (36.39) | (29.59) | — | (29.59) | (34.09) | (25.20) | ||
| PRRT (1) | (10.18) | — | (10.18) | (10.93) | — | (10.93) | (5.87) | (13.13) | ||
| Operating netback | 29.42 | — | 29.42 | 36.18 | — | 36.18 | 48.39 | 55.00 | ||
| General and administration | (2.56) | (2.08) | (5.97) | (2.50) | ||||||
| Current income taxes | 7.55 | 1.14 | (2.00) | (4.25) | ||||||
| Fund flows from operations netback | 34.41 | 35.24 | 40.42 | 48.25 | ||||||
| Total Company | ||||||||||
| Sales | 49.14 | 4.13 | 38.57 | 44.22 | 2.77 | 31.90 | 44.00 | 46.12 | ||
| Realized hedging gain (loss) | (1.15) | 0.29 | 0.10 | 3.46 | 0.45 | 3.11 | 2.57 | 2.30 | ||
| Royalties | (6.05) | — | (3.43) | (5.22) | (0.06) | (3.04) | (4.60) | (4.47) | ||
| Transportation | (2.87) | (0.18) | (2.08) | (2.63) | (0.18) | (1.93) | (1.76) | (1.98) | ||
| Operating | (15.79) | (1.56) | (13.00) | (14.53) | (1.44) | (11.89) | (12.52) | (12.01) | ||
| PRRT (1) | (0.87) | — | (0.49) | (1.04) | — | (0.57) | (0.16) | (0.71) | ||
| Operating netback | 22.41 | 2.68 | 19.67 | 24.26 | 1.54 | 17.58 | 27.53 | 29.25 | ||
| General and administration | (2.27) | (1.73) | (1.88) | (1.61) | ||||||
| Interest expense | (2.42) | (2.14) | (2.17) | (2.22) | ||||||
| Realized foreign exchange loss | 0.16 | 0.32 | 0.23 | (0.14) | ||||||
| Other income | 0.56 | 0.12 | 0.03 | 0.21 | ||||||
| Corporate income taxes | 0.80 | 0.17 | 0.66 | (0.72) | ||||||
| Fund flows from operations netback | 16.50 | 14.32 | 24.40 | 24.77 | ||||||
| (1) | Vermilion considers Australian PRRT to be an operating item and, accordingly, has included PRRT in the calculation of operating netbacks. Current income taxes presented above excludes PRRT. |
Vermilion Energy Inc. ■ Page 39 ■ 2020 Annual Report
Supplemental Table 2: Hedges
The prices in these tables may represent the weighted averages for several contracts with foreign currency amounts translated to the disclosure currency using forward rates as at the month-end date. The weighted average price for the portfolio of options listed below may not have the same payoff profile as the individual contracts. As such, the presentation of the weighted average prices is purely for indicative purposes.
The following tables outline Vermilion’s outstanding risk management positions as at December 31, 2020:
| Unit | Currency | Bought
Put Volume |
Weighted
Average Bought Put Price |
Sold
Call Volume |
Weighted
Average Sold Call Price |
Sold
Put Volume |
Weighted
Average Sold Put Price |
Sold
Swap Volume |
Weighted
Average Sold Swap Price |
Bought
Swap Volume |
Weighted
Average Bought Swap Price | |||||||||||
| Dated Brent | ||||||||||||||||||||||
| Q1 2021 | bbl | USD | 1,000 | 47.50 | 1,000 | 53.75 | 1,000 | 40.00 | 2,000 | 49.18 | — | — | ||||||||||
| Q2 2021 | bbl | USD | — | — | — | — | — | — | 500 | 47.50 | — | — | ||||||||||
| WTI | ||||||||||||||||||||||
| Q1 2021 | bbl | USD | 4,500 | 45.00 | 4,500 | 51.26 | 4,500 | 37.50 | 4,300 | 45.51 | — | — | ||||||||||
| Q2 2021 | bbl | USD | 4,000 | 45.00 | 4,000 | 53.50 | 4,000 | 37.50 | 2,150 | 45.54 | — | — | ||||||||||
| AECO | ||||||||||||||||||||||
| Q2 2021 | mcf | CAD | — | — | — | — | — | — | 9,478 | 2.12 | — | — | ||||||||||
| Q3 2021 | mcf | CAD | — | — | — | — | — | — | 9,478 | 2.12 | — | — | ||||||||||
| Q4 2021 | mcf | CAD | — | — | — | — | — | — | 3,194 | 2.12 | — | — | ||||||||||
| AECO Basis (AECO less NYMEX Henry Hub) | ||||||||||||||||||||||
| Q1 2021 | mcf | USD | — | — | — | — | — | — | 30,000 | (1.11) | — | — | ||||||||||
| Q2 2021 | mcf | USD | — | — | — | — | — | — | 45,000 | (1.08) | — | — | ||||||||||
| Q3 2021 | mcf | USD | — | — | — | — | — | — | 45,000 | (1.08) | — | — | ||||||||||
| Q4 2021 | mcf | USD | — | — | — | — | — | — | 35,054 | (1.09) | — | — | ||||||||||
| Q1 2022 | mcf | USD | — | — | — | — | — | — | 30,000 | (1.10) | — | — | ||||||||||
| Q2 2022 | mcf | USD | — | — | — | — | — | — | 35,000 | (1.09) | — | — | ||||||||||
| Q3 2022 | mcf | USD | — | — | — | — | — | — | 35,000 | (1.09) | — | — | ||||||||||
| Q4 2022 | mcf | USD | — | — | — | — | — | — | 11,793 | (1.09) | — | — | ||||||||||
| NYMEX Henry Hub | ||||||||||||||||||||||
| Q1 2021 | mcf | USD | 15,000 | 2.73 | 15,000 | 2.90 | — | — | 33,500 | 2.86 | — | — | ||||||||||
| Q2 2021 | mcf | USD | 10,000 | 2.65 | 10,000 | 2.77 | — | — | 28,500 | 2.83 | — | — | ||||||||||
| Q3 2021 | mcf | USD | 10,000 | 2.65 | 10,000 | 2.77 | — | — | 28,500 | 2.83 | — | — | ||||||||||
| Q4 2021 | mcf | USD | 10,000 | 2.65 | 10,000 | 2.77 | — | — | 21,870 | 2.78 | — | — | ||||||||||
| Ventura Basis (Ventura less NYMEX Henry Hub) | ||||||||||||||||||||||
| Q1 2021 | mcf | USD | — | — | — | — | — | — | — | — | 10,000 | 0.04 | ||||||||||
| Q2 2021 | mcf | USD | — | — | — | — | — | — | — | — | 10,000 | 0.04 | ||||||||||
| Q3 2021 | mcf | USD | — | — | — | — | — | — | — | — | 10,000 | 0.04 | ||||||||||
| Q4 2021 | mcf | USD | — | — | — | — | — | — | — | — | 3,370 | 0.04 | ||||||||||
| SoCal Border | — | — | ||||||||||||||||||||
| Q1 2021 | mcf | USD | — | — | — | — | — | — | 5,000 | 3.40 | — | — | ||||||||||
| Conway Propane | — | — | ||||||||||||||||||||
| Q1 2021 | bbl | USD | — | — | — | — | — | — | 500 | 56% WTI | — | — | ||||||||||
Vermilion Energy Inc. ■ Page 40 ■ 2020 Annual Report
| Unit | Currency | Bought
Put Volume |
Weighted
Average Bought Put Price |
Sold
Call Volume |
Weighted
Average Sold Call Price |
Sold
Put Volume |
Weighted
Average Sold Put Price |
Sold
Swap Volume |
Weighted
Average Sold Swap Price |
Bought
Swap Volume |
Weighted
Average Bought Swap Price | |||||||||||
| NBP | ||||||||||||||||||||||
| Q1 2021 | mcf | EUR | 58,962 | 5.37 | 61,419 | 5.45 | 58,962 | 3.88 | 2,457 | 4.69 | — | — | ||||||||||
| Q2 2021 | mcf | EUR | 49,135 | 5.37 | 49,135 | 5.43 | 49,135 | 3.87 | 2,457 | 4.69 | — | — | ||||||||||
| Q3 2021 | mcf | EUR | 49,135 | 5.37 | 49,135 | 5.42 | 49,135 | 3.87 | 2,457 | 4.69 | — | — | ||||||||||
| Q4 2021 | mcf | EUR | 58,962 | 5.37 | 58,962 | 5.36 | 58,962 | 3.88 | 2,457 | 4.69 | — | — | ||||||||||
| Q1 2022 | mcf | EUR | 34,394 | 5.18 | 34,394 | 5.88 | 34,394 | 3.63 | 2,457 | 4.69 | — | — | ||||||||||
| Q2 2022 | mcf | EUR | 27,024 | 5.07 | 27,024 | 5.64 | 27,024 | 3.50 | 2,457 | 4.69 | — | — | ||||||||||
| Q3 2022 | mcf | EUR | 14,740 | 4.86 | 14,740 | 5.42 | 14,740 | 3.42 | 2,457 | 4.69 | — | — | ||||||||||
| Q4 2022 | mcf | EUR | 14,740 | 4.86 | 14,740 | 5.41 | 14,740 | 3.42 | 2,457 | 4.69 | — | — | ||||||||||
| Q1 2023 | mcf | EUR | 7,370 | 4.74 | 7,370 | 4.96 | 7,370 | 3.32 | — | — | — | — | ||||||||||
| TTF | ||||||||||||||||||||||
| Q2 2021 | mcf | EUR | 2,457 | 4.25 | 2,457 | 3.93 | 2,457 | 2.93 | — | — | — | — | ||||||||||
| Q3 2021 | mcf | EUR | 2,457 | 4.25 | 2,457 | 3.92 | 2,457 | 2.93 | — | — | — | — | ||||||||||
| Q1 2022 | mcf | EUR | 2,457 | 4.84 | 2,457 | 5.64 | 2,457 | 3.52 | — | — | — | — | ||||||||||
| Q2 2022 | mcf | EUR | 2,457 | 4.84 | 2,457 | 5.64 | 2,457 | 3.52 | — | — | — | — | ||||||||||
| Q3 2022 | mcf | EUR | 2,457 | 4.84 | 2,457 | 5.64 | 2,457 | 3.52 | — | — | — | — | ||||||||||
| Q4 2022 | mcf | EUR | 2,457 | 4.84 | 2,457 | 5.64 | 2,457 | 3.52 | — | — | — | — | ||||||||||
| Q1 2023 | mcf | EUR | 2,457 | 4.84 | 2,457 | 5.64 | 2,457 | 3.52 | — | — | — | — | ||||||||||
| VET Equity Swaps | Initial Share Price | Share Volume | |||||||
| Swap | Jan 2020 - Sep 2021 | 20.9788 | CAD | 2,250,000 | |||||
| Swap | Jan 2020 - Oct 2021 | 22.4587 | CAD | 1,500,000 | |||||
| Foreign Currency Swaps | Notional Amount | Notional Amount | Average Rate | |||||||
| Swap | Jan 2021 | 1,200,342,790 | USD | 1,570,298,550 | CAD | 1.3082 | ||||
The following sold option instruments allow the counterparties, at the specified date, to enter into a derivative instrument contract with Vermilion at the detailed terms:
| Period if Option Exercised | Unit | Currency | Option
Expiration Date |
Bought
Put Volume |
Weighted
Average Bought Put Price |
Sold
Call Volume |
Weighted
Average Sold Call Price |
Sold
Put Volume |
Weighted
Average Sold Put Price |
Sold
Swap Volume |
Weighted
Average Sold Swap Price | ||||||||
| NYMEX | |||||||||||||||||||
| Apr 2021 - Oct 2021 | mcf | USD | 24-Mar-21 | — | — | — | — | — | — | 10,000 | 2.90 | ||||||||
| NBP | |||||||||||||||||||
| Jan 2022 - Dec 2022 | mcf | EUR | 30-Jun-21 | — | — | — | — | — | — | 2,457 | 5.13 | ||||||||
| Dated Brent | |||||||||||||||||||
| Apr 2021 - Mar 2022 | bbl | USD | 31-Mar-21 | — | — | — | — | — | — | 500 | 52.00 | ||||||||
Vermilion Energy Inc. ■ Page 41 ■ 2020 Annual Report
Supplemental Table 3: Capital Expenditures and Acquisitions
| By classification ($M) | Q4 2020 | Q3 2020 | Q4 2019 | 2020 | 2019 | |||||
| Drilling and development | 52,903 | 29,762 | 97,114 | 352,481 | 486,677 | |||||
| Exploration and evaluation | 6,991 | 1,568 | 3,511 | 14,721 | 36,487 | |||||
| Capital expenditures | 59,894 | 31,330 | 100,625 | 367,202 | 523,164 | |||||
| Acquisitions | 4,821 | 6,720 | 9,165 | 25,810 | 38,472 | |||||
| Acquisitions | 4,821 | 6,720 | 9,165 | 25,810 | 38,472 | |||||
| By category ($M) | Q4 2020 | Q3 2020 | Q4 2019 | 2020 | 2019 | |||||
| Drilling, completion, new well equip and tie-in, workovers and recompletions | 42,063 | 13,220 | 72,515 | 285,401 | 411,390 | |||||
| Production equipment and facilities | 21,866 | 15,800 | 29,221 | 70,483 | 87,711 | |||||
| Seismic, studies, land and other | (4,035) | 2,310 | (1,111) | 11,318 | 24,063 | |||||
| Capital expenditures | 59,894 | 31,330 | 100,625 | 367,202 | 523,164 | |||||
| Acquisitions | 4,821 | 6,720 | 9,165 | 25,810 | 38,472 | |||||
| Total capital expenditures and acquisitions | 64,715 | 38,050 | 109,790 | 393,012 | 561,636 | |||||
| Capital expenditures by country ($M) | Q4 2020 | Q3 2020 | Q4 2019 | 2020 | 2019 | |||||
| Canada | 32,942 | 3,837 | 66,643 | 199,141 | 293,744 | |||||
| United States | 839 | 5,738 | 3,132 | 66,120 | 57,196 | |||||
| France | 12,830 | 12,638 | 8,745 | 42,328 | 74,641 | |||||
| Netherlands | 3,417 | 1,553 | 9,651 | 10,105 | 23,605 | |||||
| Germany | 3,127 | 1,558 | 5,177 | 15,819 | 21,684 | |||||
| Ireland | 211 | 928 | 923 | 1,823 | 1,372 | |||||
| Australia | 4,392 | 3,926 | 6,452 | 24,520 | 30,550 | |||||
| Corporate | 2,136 | 1,152 | (98) | 7,346 | 20,372 | |||||
| Total capital expenditures | 59,894 | 31,330 | 100,625 | 367,202 | 523,164 | |||||
| Acquisitions by country ($M) | Q4 2020 | Q3 2020 | Q4 2019 | 2020 | 2019 | |||||
| Canada | 791 | 6,621 | 5,003 | 13,111 | 24,064 | |||||
| United States | 946 | 90 | 575 | 7,643 | 3,799 | |||||
| Netherlands | — | — | — | — | 908 | |||||
| Germany | 828 | 9 | 1,456 | 1,420 | 7,570 | |||||
| Corporate | 2,256 | — | 2,131 | 3,636 | 2,131 | |||||
| Total acquisitions | 4,821 | 6,720 | 9,165 | 25,810 | 38,472 | |||||
In 2020, included in cash expenditures on acquisitions of $25.8 million is: $14.4 million relating to the carry component of farm-in arrangements;$11.7 million paid to acquire land; $0.5 million in asset improvements incurred subsequent to acquisitions for compliance with safety, environmental, and Vermilion's operating standards; and $0.8 million net received from vendors in relation to the purchase of assets from other oil and gas producers.
Vermilion Energy Inc. ■ Page 42 ■ 2020 Annual Report
Supplemental Table 4: Production
| Q4/20 | Q3/20 | Q2/20 | Q1/20 | Q4/19 | Q3/19 | Q2/19 | Q1/19 | Q4/18 | Q3/18 | Q2/18 | Q1/18 | |||||||||||||
| Canada | ||||||||||||||||||||||||
| Light and medium crude oil (bbls/d) | 19,301 | 19,847 | 22,545 | 22,767 | 23,259 | 23,610 | 23,973 | 25,067 | 25,640 | 24,602 | 13,103 | 5,960 | ||||||||||||
| Condensate (1) (bbls/d) | 4,662 | 5,200 | 5,047 | 4,634 | 4,140 | 4,072 | 4,872 | 4,096 | 3,918 | 3,875 | 3,905 | 3,312 | ||||||||||||
| Other NGLs (1) (bbls/d) | 7,334 | 8,350 | 8,248 | 6,943 | 7,005 | 6,632 | 7,352 | 6,968 | 6,816 | 6,126 | 5,589 | 5,106 | ||||||||||||
| NGLs (bbls/d) | 11,996 | 13,550 | 13,295 | 11,577 | 11,145 | 10,704 | 12,224 | 11,064 | 10,734 | 10,001 | 9,494 | 8,418 | ||||||||||||
| Conventional natural gas (mmcf/d) | 135.27 | 155.15 | 164.08 | 151.16 | 145.14 | 145.14 | 151.87 | 151.37 | 146.65 | 136.77 | 127.32 | 106.21 | ||||||||||||
| Total (boe/d) | 53,840 | 59,256 | 63,187 | 59,537 | 58,593 | 58,504 | 61,507 | 61,360 | 60,814 | 57,397 | 43,817 | 32,078 | ||||||||||||
| United States | ||||||||||||||||||||||||
| Light and medium crude oil (bbls/d) | 2,495 | 3,243 | 3,971 | 2,481 | 3,149 | 2,717 | 2,421 | 1,750 | 1,582 | 1,455 | 652 | 573 | ||||||||||||
| Condensate (1) (bbls/d) | 1 | 6 | 6 | 6 | 12 | 4 | 63 | (8) | 23 | 6 | 3 | 1 | ||||||||||||
| Other NGLs (1) (bbls/d) | 1,294 | 1,158 | 1,340 | 1,079 | 1,156 | 1,140 | 754 | 929 | 998 | 714 | 62 | 20 | ||||||||||||
| NGLs (bbls/d) | 1,295 | 1,164 | 1,346 | 1,085 | 1,168 | 1,144 | 817 | 921 | 1,021 | 720 | 65 | 21 | ||||||||||||
| Conventional natural gas (mmcf/d) | 6.87 | 7.94 | 8.35 | 6.72 | 8.20 | 6.38 | 7.06 | 5.89 | 5.65 | 4.82 | 0.40 | 0.15 | ||||||||||||
| Total (boe/d) | 4,934 | 5,730 | 6,708 | 4,685 | 5,683 | 4,925 | 4,414 | 3,653 | 3,545 | 2,979 | 784 | 618 | ||||||||||||
| France | ||||||||||||||||||||||||
| Light and medium crude oil (bbls/d) | 9,255 | 9,347 | 7,046 | 9,957 | 10,264 | 10,347 | 9,800 | 11,342 | 11,317 | 11,407 | 11,683 | 11,037 | ||||||||||||
| Conventional natural gas (mmcf/d) | — | — | — | — | — | — | — | 0.77 | 0.82 | — | — | — | ||||||||||||
| Total (boe/d) | 9,255 | 9,347 | 7,046 | 9,957 | 10,264 | 10,347 | 9,800 | 11,470 | 11,454 | 11,407 | 11,683 | 11,037 | ||||||||||||
| Netherlands | ||||||||||||||||||||||||
| Light and medium crude oil (bbls/d) | 1 | — | 1 | 3 | 4 | 1 | 9 | — | — | — | — | — | ||||||||||||
| Condensate (1) (bbls/d) | 99 | 83 | 86 | 84 | 86 | 81 | 91 | 93 | 112 | 84 | 87 | 77 | ||||||||||||
| NGLs (bbls/d) | 99 | 83 | 86 | 84 | 86 | 81 | 91 | 93 | 112 | 84 | 87 | 77 | ||||||||||||
| Conventional natural gas (mmcf/d) | 42.95 | 46.09 | 47.31 | 48.33 | 47.99 | 44.08 | 52.90 | 51.51 | 51.82 | 44.37 | 43.49 | 44.79 | ||||||||||||
| Total (boe/d) | 7,257 | 7,764 | 7,972 | 8,143 | 8,088 | 7,429 | 8,917 | 8,677 | 8,749 | 7,479 | 7,335 | 7,541 | ||||||||||||
| Germany | ||||||||||||||||||||||||
| Light and medium crude oil (bbls/d) | 960 | 964 | 1,039 | 909 | 800 | 845 | 1,047 | 978 | 913 | 1,019 | 1,008 | 1,078 | ||||||||||||
| Conventional natural gas (mmcf/d) | 11.50 | 11.25 | 13.23 | 14.64 | 15.44 | 14.54 | 14.56 | 16.71 | 16.94 | 14.88 | 14.63 | 16.19 | ||||||||||||
| Total (boe/d) | 2,876 | 2,839 | 3,244 | 3,349 | 3,373 | 3,269 | 3,474 | 3,763 | 3,736 | 3,498 | 3,447 | 3,777 | ||||||||||||
| Ireland | ||||||||||||||||||||||||
| Conventional natural gas (mmcf/d) | 34.76 | 35.12 | 38.57 | 41.38 | 42.30 | 43.21 | 49.21 | 51.71 | 52.03 | 51.38 | 56.56 | 60.87 | ||||||||||||
| Total (boe/d) | 5,793 | 5,853 | 6,428 | 6,896 | 7,049 | 7,202 | 8,201 | 8,619 | 8,672 | 8,563 | 9,426 | 10,144 | ||||||||||||
| Australia | ||||||||||||||||||||||||
| Light and medium crude oil (bbls/d) | 3,781 | 4,549 | 5,299 | 4,041 | 4,548 | 5,564 | 6,689 | 5,862 | 4,174 | 4,704 | 4,132 | 4,971 | ||||||||||||
| Total (boe/d) | 3,781 | 4,549 | 5,299 | 4,041 | 4,548 | 5,564 | 6,689 | 5,862 | 4,174 | 4,704 | 4,132 | 4,971 | ||||||||||||
| Central and Eastern Europe | ||||||||||||||||||||||||
| Conventional natural gas (mmcf/d) | 0.67 | 0.80 | 2.89 | 3.27 | 1.66 | — | — | — | 2.86 | 1.17 | — | — | ||||||||||||
| Total (boe/d) | 111 | 132 | 483 | 546 | 276 | — | — | — | 477 | 195 | — | — | ||||||||||||
| Consolidated | ||||||||||||||||||||||||
| Light and medium crude oil (bbls/d) | 35,793 | 37,951 | 39,899 | 40,157 | 42,024 | 43,084 | 43,938 | 45,001 | 43,625 | 43,186 | 30,579 | 23,619 | ||||||||||||
| Condensate (1) (bbls/d) | 4,762 | 5,289 | 5,142 | 4,724 | 4,237 | 4,158 | 5,026 | 4,181 | 4,053 | 3,965 | 3,995 | 3,389 | ||||||||||||
| Other NGLs (1) (bbls/d) | 8,627 | 9,509 | 9,588 | 8,022 | 8,160 | 7,772 | 8,107 | 7,897 | 7,815 | 6,839 | 5,651 | 5,126 | ||||||||||||
| NGLs (bbls/d) | 13,389 | 14,798 | 14,730 | 12,746 | 12,397 | 11,930 | 13,133 | 12,078 | 11,868 | 10,804 | 9,646 | 8,515 | ||||||||||||
| Conventional natural gas (mmcf/d) | 232.00 | 256.34 | 274.42 | 265.51 | 260.72 | 253.36 | 275.60 | 277.96 | 276.77 | 253.38 | 242.40 | 228.20 | ||||||||||||
| Total (boe/d) | 87,848 | 95,471 | 100,366 | 97,154 | 97,875 | 97,239 | 103,003 | 103,404 | 101,621 | 96,222 | 80,625 | 70,167 | ||||||||||||
Vermilion Energy Inc. ■ Page 43 ■ 2020 Annual Report
| 2020 | 2019 | 2018 | 2017 | 2016 | 2015 | |||||||||||||
| Canada | ||||||||||||||||||
| Light and medium crude oil (bbls/d) | 21,106 | 23,971 | 17,400 | 6,015 | 6,657 | 9,549 | ||||||||||||
| Condensate (1) (bbls/d) | 4,886 | 4,295 | 3,754 | 3,036 | 2,514 | 1,807 | ||||||||||||
| Other NGLs (1) (bbls/d) | 7,719 | 6,988 | 5,914 | 4,144 | 2,552 | 2,301 | ||||||||||||
| NGLs (bbls/d) | 12,605 | 11,283 | 9,668 | 7,180 | 5,066 | 4,108 | ||||||||||||
| Conventional natural gas (mmcf/d) | 151.38 | 148.35 | 129.37 | 97.89 | 84.29 | 71.64 | ||||||||||||
| Total (boe/d) | 58,942 | 59,979 | 48,630 | 29,510 | 25,771 | 25,598 | ||||||||||||
| United States | ||||||||||||||||||
| Light and medium crude oil (bbls/d) | 3,046 | 2,514 | 1,069 | 662 | 393 | 231 | ||||||||||||
| Condensate (1) (bbls/d) | 5 | 18 | 8 | 4 | — | — | ||||||||||||
| Other NGLs (1) (bbls/d) | 1,218 | 996 | 452 | 50 | 29 | 7 | ||||||||||||
| NGLs (bbls/d) | 1,223 | 1,014 | 460 | 54 | 29 | 7 | ||||||||||||
| Conventional natural gas (mmcf/d) | 7.47 | 6.89 | 2.78 | 0.39 | 0.21 | 0.05 | ||||||||||||
| Total (boe/d) | 5,514 | 4,675 | 1,992 | 781 | 457 | 247 | ||||||||||||
| France | ||||||||||||||||||
| Light and medium crude oil (bbls/d) | 8,903 | 10,435 | 11,362 | 11,084 | 11,896 | 12,267 | ||||||||||||
| Conventional natural gas (mmcf/d) | — | 0.19 | 0.21 | — | 0.44 | 0.97 | ||||||||||||
| Total (boe/d) | 8,903 | 10,467 | 11,396 | 11,085 | 11,970 | 12,429 | ||||||||||||
| Netherlands | ||||||||||||||||||
| Light and medium crude oil (bbls/d) | 1 | 3 | — | — | — | — | ||||||||||||
| Condensate (1) (bbls/d) | 88 | 88 | 90 | 90 | 88 | 99 | ||||||||||||
| NGLs (bbls/d) | 88 | 88 | 90 | 90 | 88 | 99 | ||||||||||||
| Conventional natural gas (mmcf/d) | 46.16 | 49.10 | 46.13 | 40.54 | 47.82 | 44.76 | ||||||||||||
| Total (boe/d) | 7,782 | 8,274 | 7,779 | 6,847 | 8,058 | 7,559 | ||||||||||||
| Germany | ||||||||||||||||||
| Light and medium crude oil (bbls/d) | 968 | 917 | 1,004 | 1,060 | — | — | ||||||||||||
| Conventional natural gas (mmcf/d) | 12.65 | 15.31 | 15.66 | 19.39 | 14.90 | 15.78 | ||||||||||||
| Total (boe/d) | 3,076 | 3,468 | 3,614 | 4,291 | 2,483 | 2,630 | ||||||||||||
| Ireland | ||||||||||||||||||
| Conventional natural gas (mmcf/d) | 37.44 | 46.57 | 55.17 | 58.43 | 50.89 | 0.03 | ||||||||||||
| Total (boe/d) | 6,240 | 7,762 | 9,195 | 9,737 | 8,482 | 5 | ||||||||||||
| Australia | ||||||||||||||||||
| Light and medium crude oil (bbls/d) | 4,416 | 5,662 | 4,494 | 5,770 | 6,304 | 6,454 | ||||||||||||
| Total (boe/d) | 4,416 | 5,662 | 4,494 | 5,770 | 6,304 | 6,454 | ||||||||||||
| Central and Eastern Europe | ||||||||||||||||||
| Conventional natural gas (mmcf/d) | 1.90 | 0.42 | 1.02 | — | — | — | ||||||||||||
| Total (boe/d) | 317 | 70 | 169 | — | — | — | ||||||||||||
| Consolidated | ||||||||||||||||||
| Light and medium crude oil (bbls/d) | 38,441 | 43,502 | 35,329 | 24,591 | 25,250 | 28,502 | ||||||||||||
| Condensate (1) (bbls/d) | 4,980 | 4,400 | 3,853 | 3,130 | 2,602 | 1,906 | ||||||||||||
| Other NGLs (1) (bbls/d) | 8,937 | 7,984 | 6,366 | 4,194 | 2,582 | 2,308 | ||||||||||||
| NGLs (bbls/d) | 13,917 | 12,384 | 10,219 | 7,324 | 5,184 | 4,214 | ||||||||||||
| Conventional natural gas (mmcf/d) | 256.99 | 266.82 | 250.33 | 216.64 | 198.55 | 133.24 | ||||||||||||
| Total (boe/d) | 95,190 | 100,357 | 87,270 | 68,021 | 63,526 | 54,922 | ||||||||||||
| (1) | Under National Instrument 51-101 "Standards of Disclosure for Oil and Gas Activities", disclosure of production volumes should include segmentation by product type as defined in the instrument. This table provides a reconciliation from "crude oil and condensate", "NGLs" and "natural gas" to the product types. Elsewhere in this report, references to "crude oil" mean "light crude oil and medium crude oil" and references to "natural gas" mean "conventional natural gas". Production volumes reported are based on quantities as measured at the first point of sale. |
Vermilion Energy Inc. ■ Page 44 ■ 2020 Annual Report
Supplemental Table 5: Segmented Financial Results
| Three Months Ended December 31, 2020 | ||||||||||||||||||
| ($M) | Canada | USA | France | Netherlands | Germany | Ireland | Australia | Corporate | Total | |||||||||
| Drilling and development | 32,942 | 839 | 12,749 | 3,412 | 3,221 | 211 | 4,392 | (4,863) | 52,903 | |||||||||
| Exploration and evaluation | — | — | 81 | 5 | (94) | — | — | 6,999 | 6,991 | |||||||||
| Crude oil and condensate sales | 112,489 | 11,796 | 53,198 | 455 | 4,720 | 1 | 30,148 | — | 212,807 | |||||||||
| NGL sales | 13,195 | 2,046 | — | — | — | — | — | — | 15,241 | |||||||||
| Natural gas sales | 35,035 | 1,247 | — | 22,512 | 5,961 | 23,117 | — | 278 | 88,150 | |||||||||
| Sales of purchased commodities | — | — | — | — | — | — | — | 31,902 | 31,902 | |||||||||
| Royalties | (15,240) | (4,430) | (9,416) | (150) | 1,190 | — | — | (62) | (28,108) | |||||||||
| Revenue from external customers | 145,479 | 10,659 | 43,782 | 22,817 | 11,871 | 23,118 | 30,148 | 32,118 | 319,992 | |||||||||
| Purchased commodities | — | — | — | — | — | — | — | (31,902) | (31,902) | |||||||||
| Transportation | (9,987) | (371) | (4,264) | — | (1,537) | (898) | — | — | (17,057) | |||||||||
| Operating | (54,725) | (4,437) | (16,230) | (7,772) | (5,643) | (3,232) | (14,438) | (99) | (106,576) | |||||||||
| General and administration | (7,929) | (2,369) | (3,369) | 1 | (1,992) | (38) | (1,015) | (1,931) | (18,642) | |||||||||
| PRRT | — | — | — | — | — | — | (4,038) | — | (4,038) | |||||||||
| Corporate income taxes | — | — | (141) | 3,164 | — | — | 2,995 | 514 | 6,532 | |||||||||
| Interest expense | — | — | — | — | — | — | — | (19,808) | (19,808) | |||||||||
| Realized gain on derivative instruments | — | — | — | — | — | — | — | 790 | 790 | |||||||||
| Realized foreign exchange gain | — | — | — | — | — | — | — | 1,329 | 1,329 | |||||||||
| Realized other income | — | — | — | — | — | — | — | 4,592 | 4,592 | |||||||||
| Fund flows from operations | 72,838 | 3,482 | 19,778 | 18,210 | 2,699 | 18,950 | 13,652 | (14,397) | 135,212 | |||||||||
| Year Ended December 31, 2020 | ||||||||||||||||||
| ($M) | Canada | USA | France | Netherlands | Germany | Ireland | Australia | Corporate | Total | |||||||||
| Total assets | 1,805,464 | 328,902 | 703,567 | 130,063 | 198,357 | 257,990 | 105,898 | 578,898 | 4,109,139 | |||||||||
| Drilling and development | 199,141 | 66,120 | 42,145 | 10,331 | 13,005 | 1,823 | 24,520 | (4,604) | 352,481 | |||||||||
| Exploration and evaluation | — | — | 183 | (226) | 2,814 | — | — | 11,950 | 14,721 | |||||||||
| Crude oil and condensate sales | 418,610 | 55,099 | 182,292 | 1,502 | 17,143 | 13 | 141,452 | 8 | 816,119 | |||||||||
| NGL sales | 36,204 | 6,513 | — | — | — | — | — | — | 42,717 | |||||||||
| Natural gas sales | 114,377 | 4,834 | — | 64,073 | 17,067 | 58,433 | — | 1,925 | 260,709 | |||||||||
| Sales of purchased commodities | — | — | — | — | — | — | — | 127,853 | 127,853 | |||||||||
| Royalties | (54,961) | (17,446) | (32,069) | (444) | (990) | — | — | (644) | (106,554) | |||||||||
| Revenue from external customers | 514,230 | 49,000 | 150,223 | 65,131 | 33,220 | 58,446 | 141,452 | 129,142 | 1,140,844 | |||||||||
| Purchased commodities | — | — | — | — | — | — | — | (127,853) | (127,853) | |||||||||
| Transportation | (41,494) | (1,349) | (14,604) | — | (5,839) | (4,425) | — | — | (67,711) | |||||||||
| Operating | (218,596) | (18,108) | (57,128) | (32,410) | (20,732) | (15,232) | (54,581) | (464) | (417,251) | |||||||||
| General and administration | (25,462) | (7,420) | (13,108) | (1,220) | (6,532) | (594) | (3,841) | (2,663) | (60,840) | |||||||||
| PRRT | — | — | — | — | — | — | (20,151) | — | (20,151) | |||||||||
| Corporate income taxes | — | — | (141) | 3,774 | — | — | 2,106 | 71 | 5,810 | |||||||||
| Interest expense | — | — | — | — | — | — | — | (75,077) | (75,077) | |||||||||
| Realized gain on derivative instruments | — | — | — | — | — | — | — | 109,093 | 109,093 | |||||||||
| Realized foreign exchange gain | — | — | — | — | — | — | — | 11,110 | 11,110 | |||||||||
| Realized other income | — | — | — | — | — | — | — | 4,091 | 4,091 | |||||||||
| Fund flows from operations | 228,678 | 22,123 | 65,242 | 35,275 | 117 | 38,195 | 64,985 | 47,450 | 502,065 | |||||||||
Vermilion Energy Inc. ■ Page 45 ■ 2020 Annual Report
Supplemental Table 6: Operational and Financial Data by Core Region
Production volumes (1)
| Q4/20 | Q3/20 | Q2/20 | Q1/20 | Q4/19 | Q3/19 | Q2/19 | Q1/19 | Q4/18 | Q3/18 | Q2/18 | Q1/18 | |||||||||||||
| North America | ||||||||||||||||||||||||
| Crude oil and condensate (bbls/d) | 26,459 | 28,296 | 31,569 | 29,888 | 30,560 | 30,403 | 31,329 | 30,905 | 31,163 | 29,938 | 17,663 | 9,846 | ||||||||||||
| NGLs (bbls/d) | 8,628 | 9,508 | 9,588 | 8,022 | 8,161 | 7,772 | 8,106 | 7,897 | 7,814 | 6,840 | 5,651 | 5,126 | ||||||||||||
| Natural gas (mmcf/d) | 142.13 | 163.09 | 172.43 | 157.88 | 153.34 | 151.52 | 158.93 | 157.26 | 152.30 | 141.59 | 127.72 | 106.35 | ||||||||||||
| Total (boe/d) | 58,774 | 64,986 | 69,895 | 64,222 | 64,276 | 63,429 | 65,921 | 65,013 | 64,359 | 60,376 | 44,601 | 32,696 | ||||||||||||
| International | ||||||||||||||||||||||||
| Crude oil and condensate (bbls/d) | 14,096 | 14,943 | 13,471 | 14,994 | 15,702 | 16,838 | 17,636 | 18,275 | 16,516 | 17,214 | 16,910 | 17,163 | ||||||||||||
| NGLs (bbls/d) | — | — | — | — | — | — | — | — | — | — | — | — | ||||||||||||
| Natural gas (mmcf/d) | 89.86 | 93.25 | 101.99 | 107.63 | 107.38 | 101.83 | 116.67 | 120.70 | 124.48 | 111.79 | 114.68 | 121.85 | ||||||||||||
| Total (boe/d) | 29,073 | 30,484 | 30,472 | 32,932 | 33,598 | 33,811 | 37,081 | 38,391 | 37,262 | 35,846 | 36,023 | 37,470 | ||||||||||||
| Consolidated | ||||||||||||||||||||||||
| Crude oil and condensate (bbls/d) | 40,555 | 43,240 | 45,041 | 44,881 | 46,261 | 47,242 | 48,964 | 49,182 | 47,678 | 47,151 | 34,574 | 27,008 | ||||||||||||
| NGLs (bbls/d) | 8,627 | 9,509 | 9,588 | 8,022 | 8,160 | 7,772 | 8,107 | 7,897 | 7,815 | 6,839 | 5,651 | 5,126 | ||||||||||||
| Natural gas (mmcf/d) | 232.00 | 256.34 | 274.42 | 265.51 | 260.72 | 253.36 | 275.60 | 277.96 | 276.77 | 253.38 | 242.40 | 228.20 | ||||||||||||
| Total (boe/d) | 87,848 | 95,471 | 100,366 | 97,154 | 97,875 | 97,239 | 103,003 | 103,404 | 101,621 | 96,222 | 80,625 | 70,167 | ||||||||||||
| (1) | Please refer to Supplemental Table 4 "Production" for disclosure by product type. |
Sales volumes
| Q4/20 | Q3/20 | Q2/20 | Q1/20 | Q4/19 | Q3/19 | Q2/19 | Q1/19 | Q4/18 | Q3/18 | Q2/18 | Q1/18 | |||||||||||||
| North America | ||||||||||||||||||||||||
| Crude oil and condensate (bbls/d) | 26,459 | 28,297 | 31,569 | 29,888 | 30,560 | 30,404 | 31,327 | 30,906 | 31,162 | 29,938 | 17,664 | 9,846 | ||||||||||||
| NGLs (bbls/d) | 8,628 | 9,508 | 9,588 | 8,022 | 8,161 | 7,772 | 8,106 | 7,897 | 7,814 | 6,840 | 5,651 | 5,126 | ||||||||||||
| Natural gas (mmcf/d) | 142.13 | 163.09 | 172.43 | 157.88 | 153.34 | 151.52 | 158.93 | 157.26 | 152.30 | 141.59 | 127.72 | 106.35 | ||||||||||||
| Total (boe/d) | 58,774 | 64,986 | 69,895 | 64,222 | 64,276 | 63,429 | 65,921 | 65,013 | 64,359 | 60,376 | 44,601 | 32,696 | ||||||||||||
| International | ||||||||||||||||||||||||
| Crude oil and condensate (bbls/d) | 15,359 | 15,689 | 12,202 | 17,090 | 13,864 | 18,575 | 16,009 | 20,163 | 16,458 | 16,559 | 16,991 | 16,078 | ||||||||||||
| NGLs (bbls/d) | — | — | — | — | — | — | — | — | — | — | — | 77 | ||||||||||||
| Natural gas (mmcf/d) | 89.86 | 93.25 | 101.99 | 107.63 | 107.38 | 101.83 | 116.67 | 120.70 | 124.48 | 111.02 | 114.68 | 121.85 | ||||||||||||
| Total (boe/d) | 30,336 | 31,229 | 29,201 | 35,028 | 31,760 | 35,547 | 35,454 | 40,279 | 37,204 | 35,062 | 36,104 | 36,462 | ||||||||||||
| Consolidated | ||||||||||||||||||||||||
| Crude oil and condensate (bbls/d) | 41,818 | 43,985 | 43,771 | 46,977 | 44,423 | 48,979 | 47,337 | 51,068 | 47,620 | 46,368 | 34,655 | 26,001 | ||||||||||||
| NGLs (bbls/d) | 8,627 | 9,509 | 9,588 | 8,022 | 8,160 | 7,772 | 8,107 | 7,897 | 7,815 | 6,839 | 5,651 | 5,126 | ||||||||||||
| Natural gas (mmcf/d) | 232.00 | 256.34 | 274.42 | 265.51 | 260.72 | 253.36 | 275.60 | 277.96 | 276.77 | 253.38 | 242.40 | 228.20 | ||||||||||||
| Total (boe/d) | 89,111 | 96,217 | 99,096 | 99,250 | 96,037 | 98,976 | 101,377 | 105,291 | 101,563 | 95,437 | 80,706 | 69,159 | ||||||||||||
Vermilion Energy Inc. ■ Page 46 ■ 2020 Annual Report
Financial results
| Q4/20 | Q3/20 | Q2/20 | Q1/20 | Q4/19 | Q3/19 | Q2/19 | Q1/19 | Q4/18 | Q3/18 | Q2/18 | Q1/18 | |||||||||||||
| North America | ||||||||||||||||||||||||
| Crude oil and condensate sales ($/bbl) | 51.06 | 49.79 | 28.94 | 50.25 | 66.31 | 66.67 | 72.40 | 65.95 | 54.90 | 80.22 | 79.66 | 75.13 | ||||||||||||
| NGL sales ($/bbl) | 19.20 | 15.04 | 8.94 | 8.92 | 14.63 | 6.14 | 11.25 | 22.49 | 25.70 | 27.97 | 26.06 | 25.37 | ||||||||||||
| Natural gas sales ($/mcf) | 2.77 | 2.02 | 1.60 | 1.92 | 2.29 | 1.18 | 1.15 | 2.52 | 1.79 | 1.46 | 1.09 | 1.95 | ||||||||||||
| Sales ($/boe) | 32.51 | 28.94 | 18.24 | 29.22 | 38.86 | 35.52 | 38.56 | 40.17 | 33.94 | 46.37 | 37.98 | 32.96 | ||||||||||||
| Royalties ($/boe) | (3.64) | (3.58) | (1.67) | (3.54) | (4.98) | (4.93) | (4.22) | (5.00) | (5.01) | (6.71) | (4.17) | (3.73) | ||||||||||||
| Transportation ($/boe) | (1.92) | (1.74) | (1.72) | (1.91) | (1.76) | (1.78) | (1.63) | (1.83) | (1.88) | (1.63) | (1.28) | (1.54) | ||||||||||||
| Operating ($/boe) | (10.94) | (7.82) | (9.60) | (11.93) | (11.15) | (10.67) | (10.66) | (11.46) | (10.96) | (10.48) | (8.90) | (8.38) | ||||||||||||
| General and administration ($/boe) | (1.94) | (0.78) | (1.52) | (0.84) | (0.97) | (0.60) | (1.04) | (0.83) | (0.28) | (0.36) | (1.43) | (0.85) | ||||||||||||
| Corporate income taxes ($/boe) | 0.04 | (0.02) | (0.02) | (0.04) | (0.11) | 0.09 | (0.02) | (0.03) | 0.10 | (0.16) | (0.23) | 0.22 | ||||||||||||
| PRRT ($/boe) | — | — | — | — | — | — | — | — | — | — | — | — | ||||||||||||
| Fund flows netback ($/boe) | 14.12 | 14.99 | 3.72 | 10.96 | 19.89 | 17.63 | 20.99 | 21.03 | 15.91 | 27.04 | 21.97 | 18.68 | ||||||||||||
| Fund flows from operations | 76,375 | 89,635 | 23,639 | 64,048 | 117,623 | 102,867 | 125,893 | 123,071 | 94,200 | 150,202 | 89,177 | 54,961 | ||||||||||||
| Capital expenditures | (33,781) | (9,575) | (23,979) | (197,926) | (69,775) | (91,027) | (42,047) | (148,091) | (93,092) | (101,223) | (39,396) | (84,983) | ||||||||||||
| Free cash flow | 42,594 | 80,060 | (340) | (133,878) | 47,848 | 11,840 | 83,846 | (25,020) | 1,108 | 48,979 | 49,781 | (30,022) | ||||||||||||
| International | ||||||||||||||||||||||||
| Crude oil and condensate sales ($/bbl) | 62.65 | 58.19 | 50.27 | 73.35 | 82.14 | 84.55 | 93.28 | 84.95 | 87.56 | 95.32 | 95.65 | 83.41 | ||||||||||||
| NGL sales ($/bbl) | — | — | — | — | — | — | — | — | — | — | — | — | ||||||||||||
| Natural gas sales ($/mcf) | 6.27 | 2.91 | 2.28 | 4.44 | 5.49 | 4.29 | 5.73 | 8.46 | 10.78 | 10.34 | 8.86 | 9.17 | ||||||||||||
| Sales ($/boe) | 50.30 | 37.94 | 28.98 | 49.42 | 54.42 | 56.46 | 60.98 | 67.87 | 74.80 | 77.76 | 73.16 | 67.43 | ||||||||||||
| Royalties ($/boe) | (3.02) | (3.32) | (2.16) | (3.27) | (3.85) | (3.89) | (3.97) | (3.89) | (4.16) | (5.13) | (4.44) | (3.66) | ||||||||||||
| Transportation ($/boe) | (2.40) | (2.28) | (2.04) | (1.94) | (1.77) | (2.76) | (3.40) | (1.66) | (1.70) | (1.45) | (1.78) | (1.72) | ||||||||||||
| Operating ($/boe) | (16.99) | (15.18) | (14.35) | (16.13) | (15.28) | (13.13) | (11.76) | (15.28) | (13.89) | (12.26) | (13.03) | (13.16) | ||||||||||||
| General and administration ($/boe) | (2.92) | (2.53) | (2.72) | (2.63) | (3.70) | (3.10) | (2.93) | (2.27) | (3.27) | (3.49) | (2.55) | (2.81) | ||||||||||||
| Corporate income taxes ($/boe) | 2.25 | 0.04 | (0.02) | (0.11) | 2.22 | (1.55) | (3.63) | (4.30) | (2.49) | (2.65) | (3.57) | (2.85) | ||||||||||||
| PRRT ($/boe) | (1.45) | (1.27) | (1.21) | (2.90) | (0.50) | (1.78) | (2.56) | (2.87) | 0.71 | 0.08 | (0.81) | (1.48) | ||||||||||||
| Fund flows netback ($/boe) | 25.77 | 13.40 | 6.47 | 22.44 | 31.54 | 30.26 | 32.73 | 37.60 | 49.99 | 52.88 | 46.97 | 41.75 | ||||||||||||
| Fund flows from operations | 71,934 | 38,498 | 17,193 | 71,526 | 92,160 | 98,955 | 105,600 | 136,298 | 171,119 | 170,563 | 154,319 | 137,002 | ||||||||||||
| Capital expenditures | (26,113) | (21,755) | (18,295) | (35,778) | (30,850) | (36,852) | (50,560) | (53,962) | (70,488) | (44,962) | (40,588) | (43,482) | ||||||||||||
| Free cash flow | 45,821 | 16,743 | (1,102) | 35,748 | 61,310 | 62,103 | 55,040 | 82,336 | 100,631 | 125,601 | 113,731 | 93,520 | ||||||||||||
| Q4/20 | Q3/20 | Q2/20 | Q1/20 | Q4/19 | Q3/19 | Q2/19 | Q1/19 | Q4/18 | Q3/18 | Q2/18 | Q1/18 | |||||||||||||
| Consolidated | ||||||||||||||||||||||||
| Crude oil and condensate sales ($/bbl) | 55.31 | 52.79 | 34.89 | 58.66 | 71.25 | 73.45 | 79.46 | 73.45 | 66.19 | 85.84 | 87.50 | 80.02 | ||||||||||||
| NGL sales ($/bbl) | 19.20 | 15.04 | 8.94 | 8.92 | 14.63 | 6.14 | 11.25 | 22.49 | 25.69 | 27.97 | 26.06 | 25.37 | ||||||||||||
| Natural gas sales ($/mcf) | 4.13 | 2.34 | 1.85 | 2.94 | 3.61 | 2.43 | 3.09 | 5.10 | 5.83 | 5.35 | 4.77 | 5.81 | ||||||||||||
| Sales ($/boe) | 38.57 | 31.86 | 21.40 | 36.35 | 44.01 | 43.04 | 46.40 | 50.77 | 48.90 | 57.90 | 53.72 | 51.13 | ||||||||||||
| Royalties ($/boe) | (3.43) | (3.50) | (1.81) | (3.45) | (4.60) | (4.56) | (4.13) | (4.58) | (4.70) | (6.13) | (4.29) | (3.69) | ||||||||||||
| Transportation ($/boe) | (2.08) | (1.92) | (1.81) | (1.92) | (1.76) | (2.13) | (2.25) | (1.76) | (1.81) | (1.56) | (1.50) | (1.64) | ||||||||||||
| Operating ($/boe) | (13.00) | (10.21) | (11.00) | (13.41) | (12.52) | (11.55) | (11.04) | (12.92) | (12.04) | (11.13) | (10.75) | (10.90) | ||||||||||||
| General and administration ($/boe) | (2.27) | (1.35) | (1.88) | (1.47) | (1.88) | (1.50) | (1.70) | (1.38) | (1.37) | (1.51) | (1.93) | (1.88) | ||||||||||||
| Corporate income taxes ($/boe) | 0.80 | — | (0.02) | (0.06) | 0.66 | (0.50) | (1.28) | (1.66) | (0.85) | (1.07) | (1.73) | (1.40) | ||||||||||||
| PRRT ($/boe) | (0.49) | (0.41) | (0.36) | (1.02) | (0.16) | (0.64) | (0.90) | (1.10) | 0.26 | 0.03 | (0.36) | (0.78) | ||||||||||||
| Interest ($/boe) | (2.42) | (1.97) | (1.98) | (2.21) | (2.17) | (2.16) | (2.34) | (2.21) | (2.23) | (2.25) | (2.26) | (2.50) | ||||||||||||
| Realized derivatives ($/boe) | 0.10 | 0.47 | 6.07 | 5.47 | 2.57 | 4.06 | 1.54 | 1.09 | (3.03) | (4.26) | (3.79) | (2.85) | ||||||||||||
| Realized foreign exchange ($/boe) | 0.16 | (0.31) | 0.44 | 0.94 | 0.23 | (0.37) | (0.17) | (0.22) | 0.63 | (0.35) | (0.56) | 0.25 | ||||||||||||
| Realized other ($/boe) | 0.56 | 0.29 | 0.03 | (0.37) | 0.03 | 0.04 | 0.02 | 0.73 | 0.03 | 0.02 | 0.03 | 0.03 | ||||||||||||
| Fund flows netback ($/boe) | 16.49 | 12.97 | 9.08 | 18.85 | 24.40 | 23.74 | 24.14 | 26.76 | 23.80 | 29.69 | 26.58 | 25.77 | ||||||||||||
| Fund flows from operations | 135,212 | 114,776 | 81,852 | 170,225 | 215,592 | 216,153 | 222,738 | 253,572 | 222,342 | 260,705 | 195,190 | 160,415 | ||||||||||||
| Capital expenditures | (59,894) | (31,330) | (42,274) | (233,704) | (100,625) | (127,879) | (92,607) | (202,053) | (163,580) | (146,185) | (79,984) | (128,465) | ||||||||||||
| Free cash flow | 75,318 | 83,446 | 39,578 | (63,479) | 114,967 | 88,274 | 130,131 | 51,519 | 58,762 | 114,520 | 115,206 | 31,950 | ||||||||||||
Vermilion Energy Inc. ■ Page 47 ■ 2020 Annual Report
Non-GAAP Financial Measures
This MD&A includes references to certain financial measures which do not have standardized meanings and may not be comparable to similar measures presented by other issuers. These financial measures include fund flows from operations, a measure of profit or loss in accordance with IFRS 8 “Operating Segments” (please see Segmented Information in the Notes to the Consolidated Financial Statements) and net debt, a measure of capital in accordance with IAS 1 “Presentation of Financial Statements” (please see Capital Disclosures in the Notes to the Consolidated Financial Statements).
In addition, this MD&A includes financial measures which are not specified, defined, or determined under IFRS and are therefore considered non-GAAP financial measures and may not be comparable to similar measures presented by other issuers. These non-GAAP financial measures include:
Acquisitions: The sum of acquisitions from the Consolidated Statements of Cash Flows, Vermilion common shares issued as consideration, the estimated value of contingent consideration, the amount of acquiree's outstanding long-term debt assumed plus or net of acquired working capital deficit or surplus. We believe that including these components provides a useful measure of the economic investment associated with our acquisition activity.
Capital expenditures: The sum of drilling and development and exploration and evaluation from the Consolidated Statements of Cash Flows. We consider capital expenditures to be a useful measure of our investment in our existing asset base. Capital expenditures are also referred to as E&D capital.
Cash dividends per share: Represents cash dividends declared per share and is a useful measure of the dividends a common shareholder was entitled to during the period.
Covenants: The financial covenants on our revolving credit facility contain non-GAAP measures. The definitions for these financial covenants are included in Financial Position Review.
Diluted shares outstanding: The sum of shares outstanding at the period end plus outstanding awards under the VIP, based on current estimates of future performance factors and forfeiture rates.
Free cash flow: Represents fund flows from operations in excess of capital expenditures. We use free cash flow to determine the funding available for investing and financing activities, including payment of dividends, repayment of long-term debt, reallocation to existing business units, and deployment into new ventures. We also assess free cash flow as a percentage of fund flows from operations, which is a measure of the percentage of fund flows from operations that is retained for incremental investing and financing activities.
Fund flows from operations per basic and diluted share: Management assesses fund flows from operations on a per share basis as we believe this provides a measure of our operating performance after taking into account the issuance and potential future issuance of Vermilion common shares. Fund flows from operations per basic share is calculated by dividing fund flows from operations by the basic weighted average shares outstanding as defined under IFRS. Fund flows from operations per diluted share is calculated by dividing fund flows from operations by the sum of basic weighted average shares outstanding and incremental shares issuable under the equity based compensation plans as determined using the treasury stock method.
Net dividends: We define net dividends as dividends declared less proceeds received for the issuance of shares pursuant to the Dividend Reinvestment Plan. Management monitors net dividends and net dividends as a percentage of fund flows from operations to assess our ability to pay dividends.
Operating netback: Sales less royalties, operating expense, transportation costs, PRRT, and realized hedging gains and losses presented on a per unit basis. Management assesses operating netback as a measure of the profitability and efficiency of our field operations. In contrast, fund flows from operations netback also includes general and administration expense, corporate income taxes, and interest. Fund flows from operations netback is used by management to assess the profitability of our business units and Vermilion as a whole.
Payout: We define payout as net dividends plus drilling and development costs, exploration and evaluation costs, and asset retirement obligations settled. Management uses payout and payout as a percentage of fund flows from operations (also referred to as the payout or sustainability ratio) to assess the amount of cash distributed back to shareholders and re-invested in the business for maintaining production and organic growth.
Return on capital employed (ROCE): ROCE is a measure that we use to analyze our profitability and the efficiency of our capital allocation process. ROCE is calculated by dividing net earnings before interest and taxes ("EBIT") by average capital employed over the preceding twelve months. Capital employed is calculated as total assets less current liabilities while average capital employed is calculated using the balance sheets at the beginning and end of the twelve-month period.
Vermilion Energy Inc. ■ Page 48 ■ 2020 Annual Report
The following tables reconcile net dividends, payout, and diluted shares outstanding from their most directly comparable GAAP measures as presented in our financial statements:
| ($M) | Q4 2020 | Q3 2020 | Q4 2019 | 2020 | 2019 | |||||
| Dividends declared | — | — | 107,702 | 90,067 | 427,311 | |||||
| Shares issued for the Dividend Reinvestment Plan | — | — | (10,200) | (8,277) | (34,937) | |||||
| Net dividends | — | — | 97,502 | 81,790 | 392,374 | |||||
| Drilling and development | 52,903 | 29,762 | 97,114 | 352,481 | 486,677 | |||||
| Exploration and evaluation | 6,991 | 1,568 | 3,511 | 14,721 | 36,487 | |||||
| Asset retirement obligations settled | 7,271 | 2,305 | 7,352 | 14,278 | 19,442 | |||||
| Payout | 67,165 | 33,635 | 205,479 | 463,270 | 934,980 | |||||
| % of fund flows from operations | 50 | % | 29 | % | 95 | % | 92 | % | 103 | % |
| ('000s of shares) | Q4 2020 | Q3 2020 | Q4 2019 | |||
| Shares outstanding | 158,724 | 158,308 | 156,290 | |||
| Potential shares issuable pursuant to the VIP | 6,672 | 5,492 | 3,622 | |||
| Diluted shares outstanding | 165,396 | 163,800 | 159,912 | |||
The following tables reconciles the calculation of return on capital employed:
| Twelve Months Ended | ||||
| ($M) | Dec 31, 2020 | Dec 31, 2019 | ||
| Net (loss) earnings | (1,517,427) | 32,799 | ||
| Taxes | (359,972) | 108,326 | ||
| Interest expense | 75,077 | 81,377 | ||
| EBIT | (1,802,322) | 222,502 | ||
| Average capital employed | 4,562,960 | 5,578,691 | ||
| Return on capital employed | (40) | % | 4 | % |
Vermilion Energy Inc. ■ Page 49 ■ 2020 Annual Report