.2
The Bancorp Investor Presentation January 2026
Forward Looking Statements & Other Disclosures © The Bancorp | Investor Presentation, January 2026 2 Statements in this presentation regarding The Bancorp, Inc.’s (“The Bancorp”) business , that are not historical facts, are “forward - looking statements.” These statements may be identified by the use of forward - looking terminology, including the words “intend,” “may,” “believe,” “will,” “expect,” “look,” “anticipate,” “plan,” “estimate,” “continue,” or similar words. Forward - looking statements include but are not limited to, statements regarding our anticipated 2026, 2027 and 2028 results, including earnings per share accretion, future growth, profitability, productivity and efficiency, the expansion, expected timelines and implementation of our Fintech initiatives and revenue streams, the possible benefits of our platform restructuring and adoption of AI tools, and share repurchases. These forward - looking statements rela te to our current assumptions, projections, and expectations about our business and future events, including current expectations about important economic and political factors, among other factors, and are subject to risks and uncertainties, which could cause the actual results, events, or achievements to differ materially from those set forth in or implied by the forward - looking statements and related assumptions. Factors that could cause results to differ from those expressed in the forward - looking statements also include, but are not limited to, the risks and uncertainties referenced or described in The Bancorp’s filings with the Securities and Exchange Commission, including the “Risk Factors” and “Management’s Discussion and Analysis of Financial Condition and Results of Operations” sections of the Company’s Annual Report on Form 10 - K, as amended, for the fiscal year ended December 31, 2024 and other documents that the Company files from time to time with the Securities and Exchange Commission. The Bancorp does not undertake any duty to publicly revise or update forward - looking statements in this presentation to reflect events or circumstances that arise after the date of this presentation , except as may be required under applicable law. This presentation contains information regarding financial results that is calculated and presented on the basis of methodologies other than in accordance with accounting principles generally accepted in the United States (“GAAP”), such as those identified in the Appendix. Any non - GAAP financial measures used in this presentation are in addition to, and should not be considered superior to, or a substitute for, financial statements prepared in accordance with GAAP. Non - GAAP financial measures are subject to significant inherent limitations. The non - GAAP measures presented herein may not be comparable to similar non - GAAP measures presented by other companies. This presentation includes market, industry and economic data that was obtained from various publicly available sources and other sources believed by the Company to be true. Although the Company believes it to be reliable, the Company has not independently verified any of the data from third party sources referred to in this presentation or analyzed or verified the underlying reports relied upon or referred to by such sources, or ascertained the underlying economic and other assumptions relied upon by such sources. The Company believes that its market, industry, and economic data is accurate and that its estimates and assumptions are reasonable, but there can be no assurance as to the accuracy or completeness thereof. Past performance is not indicative nor a guarantee of future results. Copies of the documents filed by The Bancorp with the SEC are available free of charge from the website of the SEC at www.sec.gov as well as on The Bancorp’s website at www.thebancorp.com .
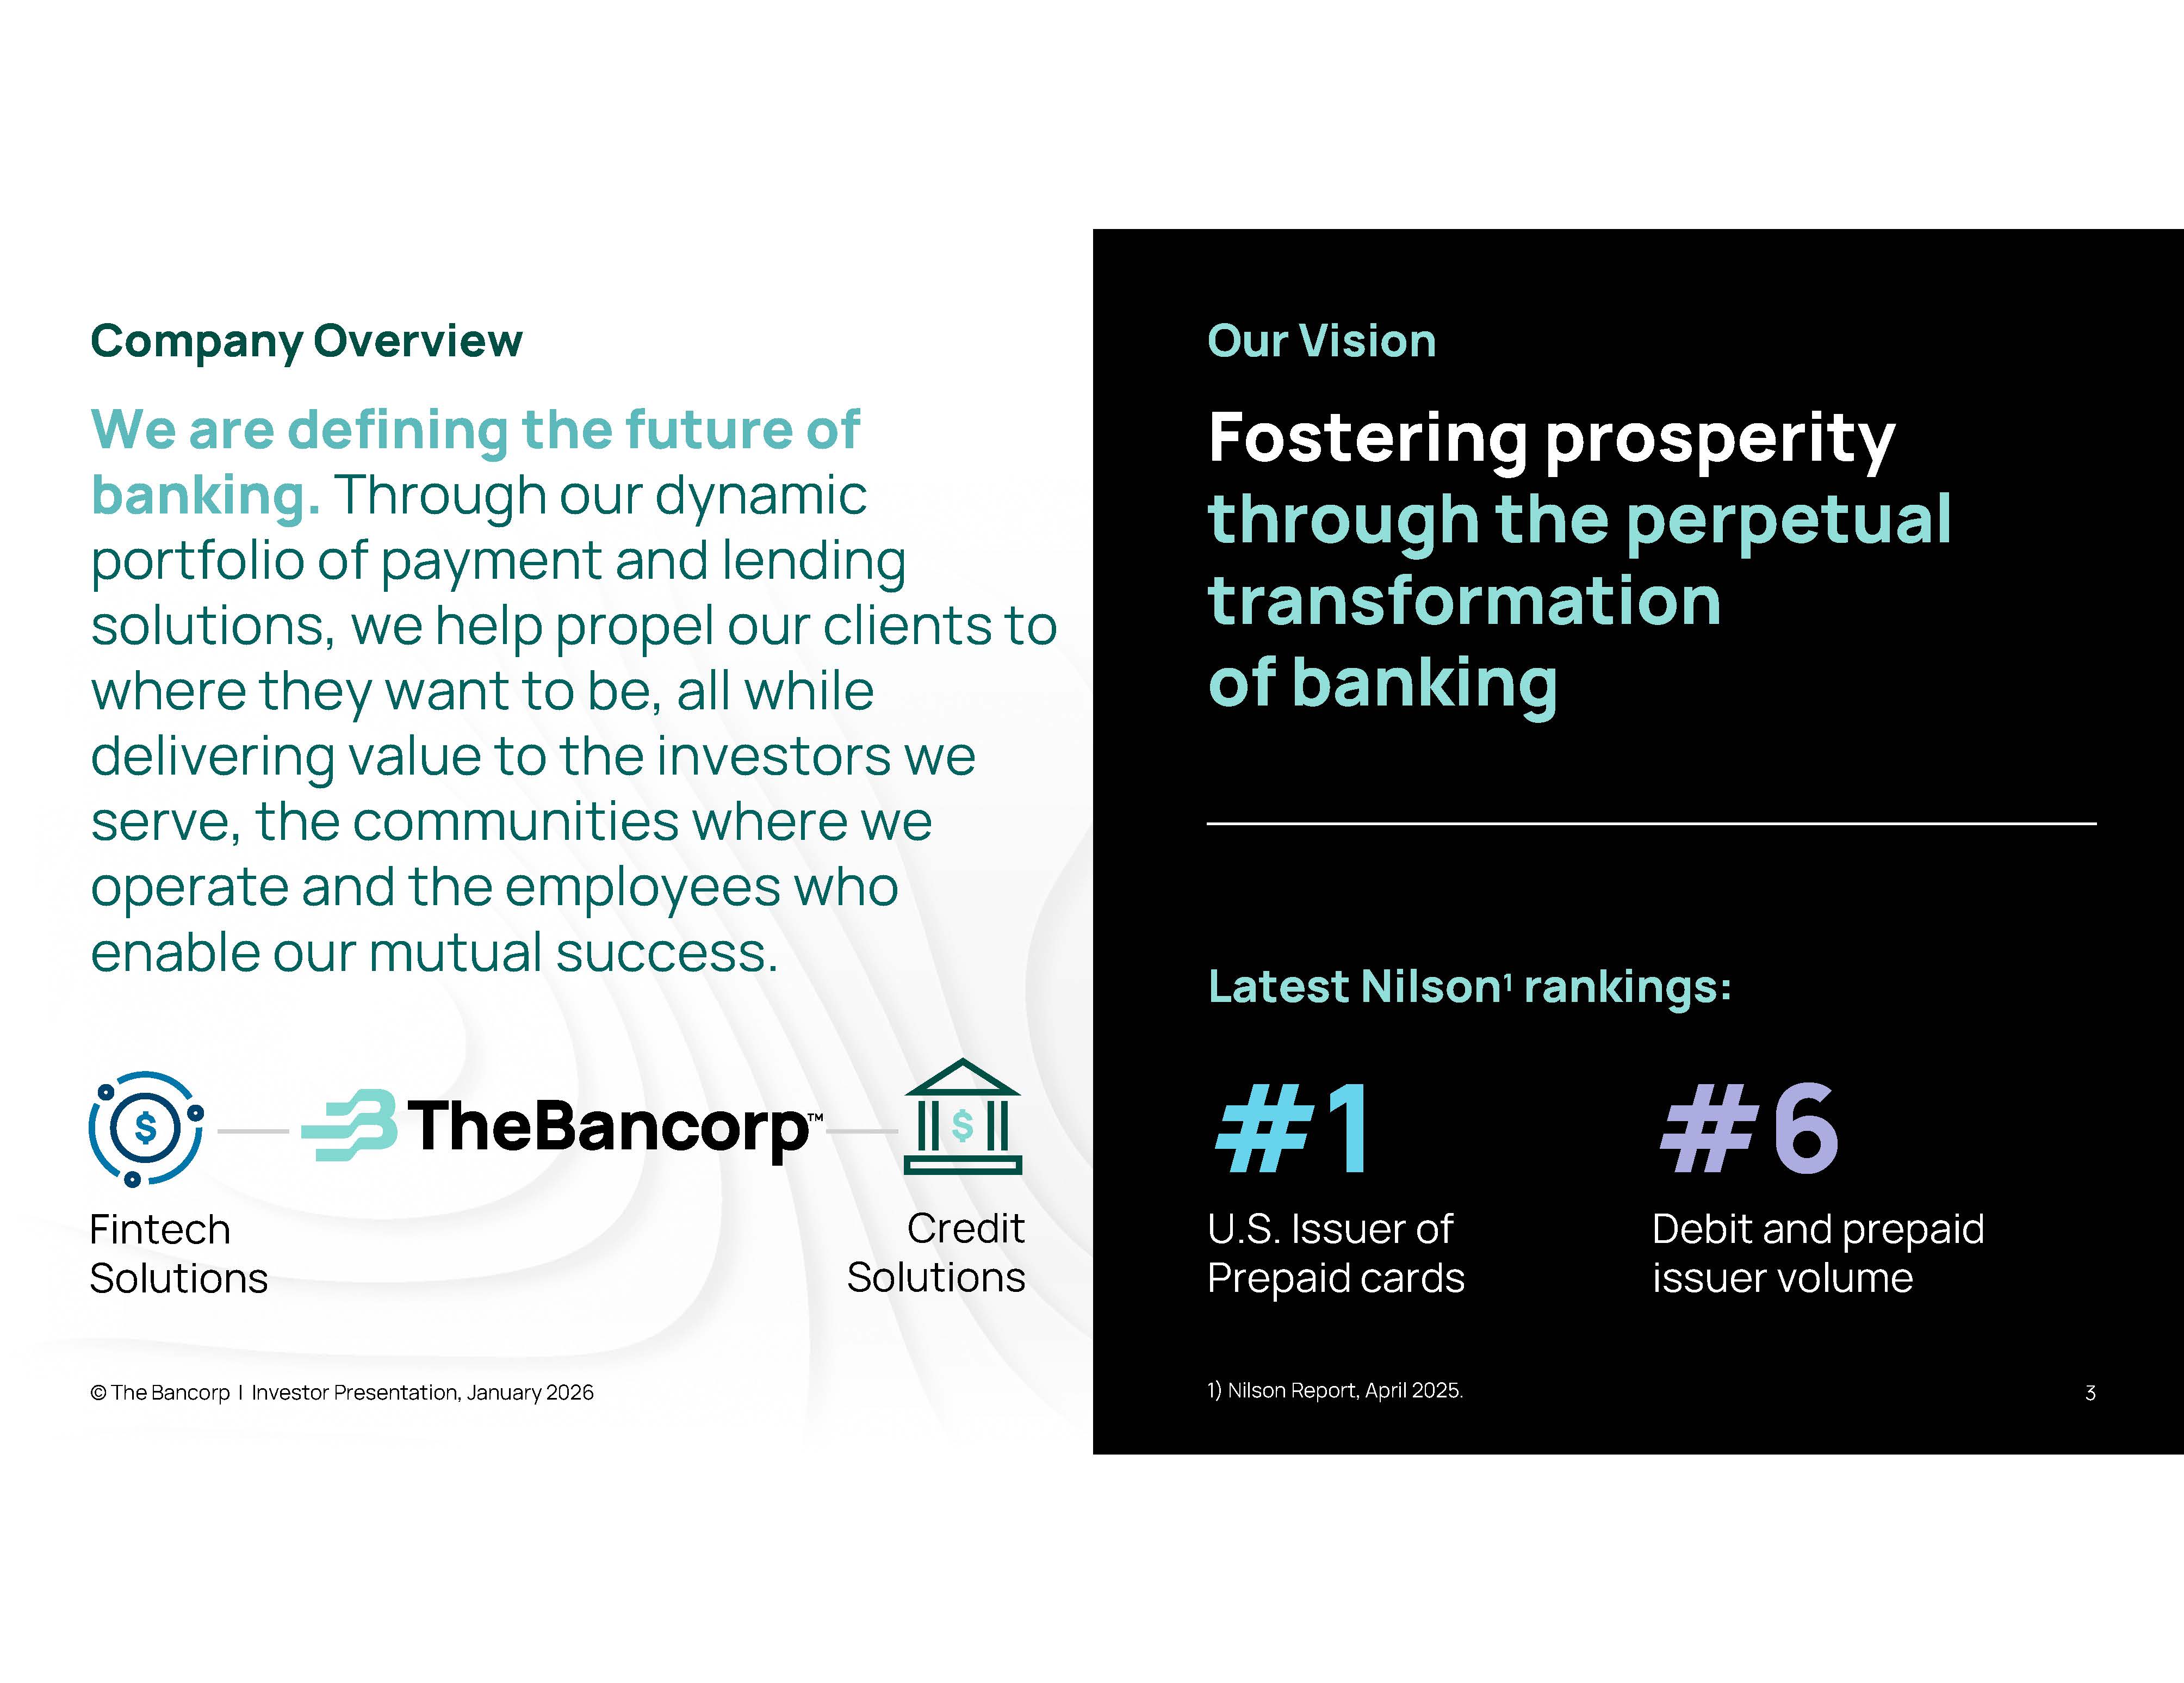
Company Overview 3 We are defining the future of banking. Through our dynamic portfolio of payment and lending solutions, we help propel our clients to where they want to be, all while delivering value to the investors we serve, the communities where we operate and the employees who enable our mutual success. Our Vision Fostering prosperity through the perpetual transformation of banking #1 U.S. Issuer of Prepaid cards #6 Debit and prepaid issuer volume Latest Nilson 1 rankings: 1) Nilson Report, April 2025. © The Bancorp | Investor Presentation, January 2026 Fintech Solutions Credit Solutions
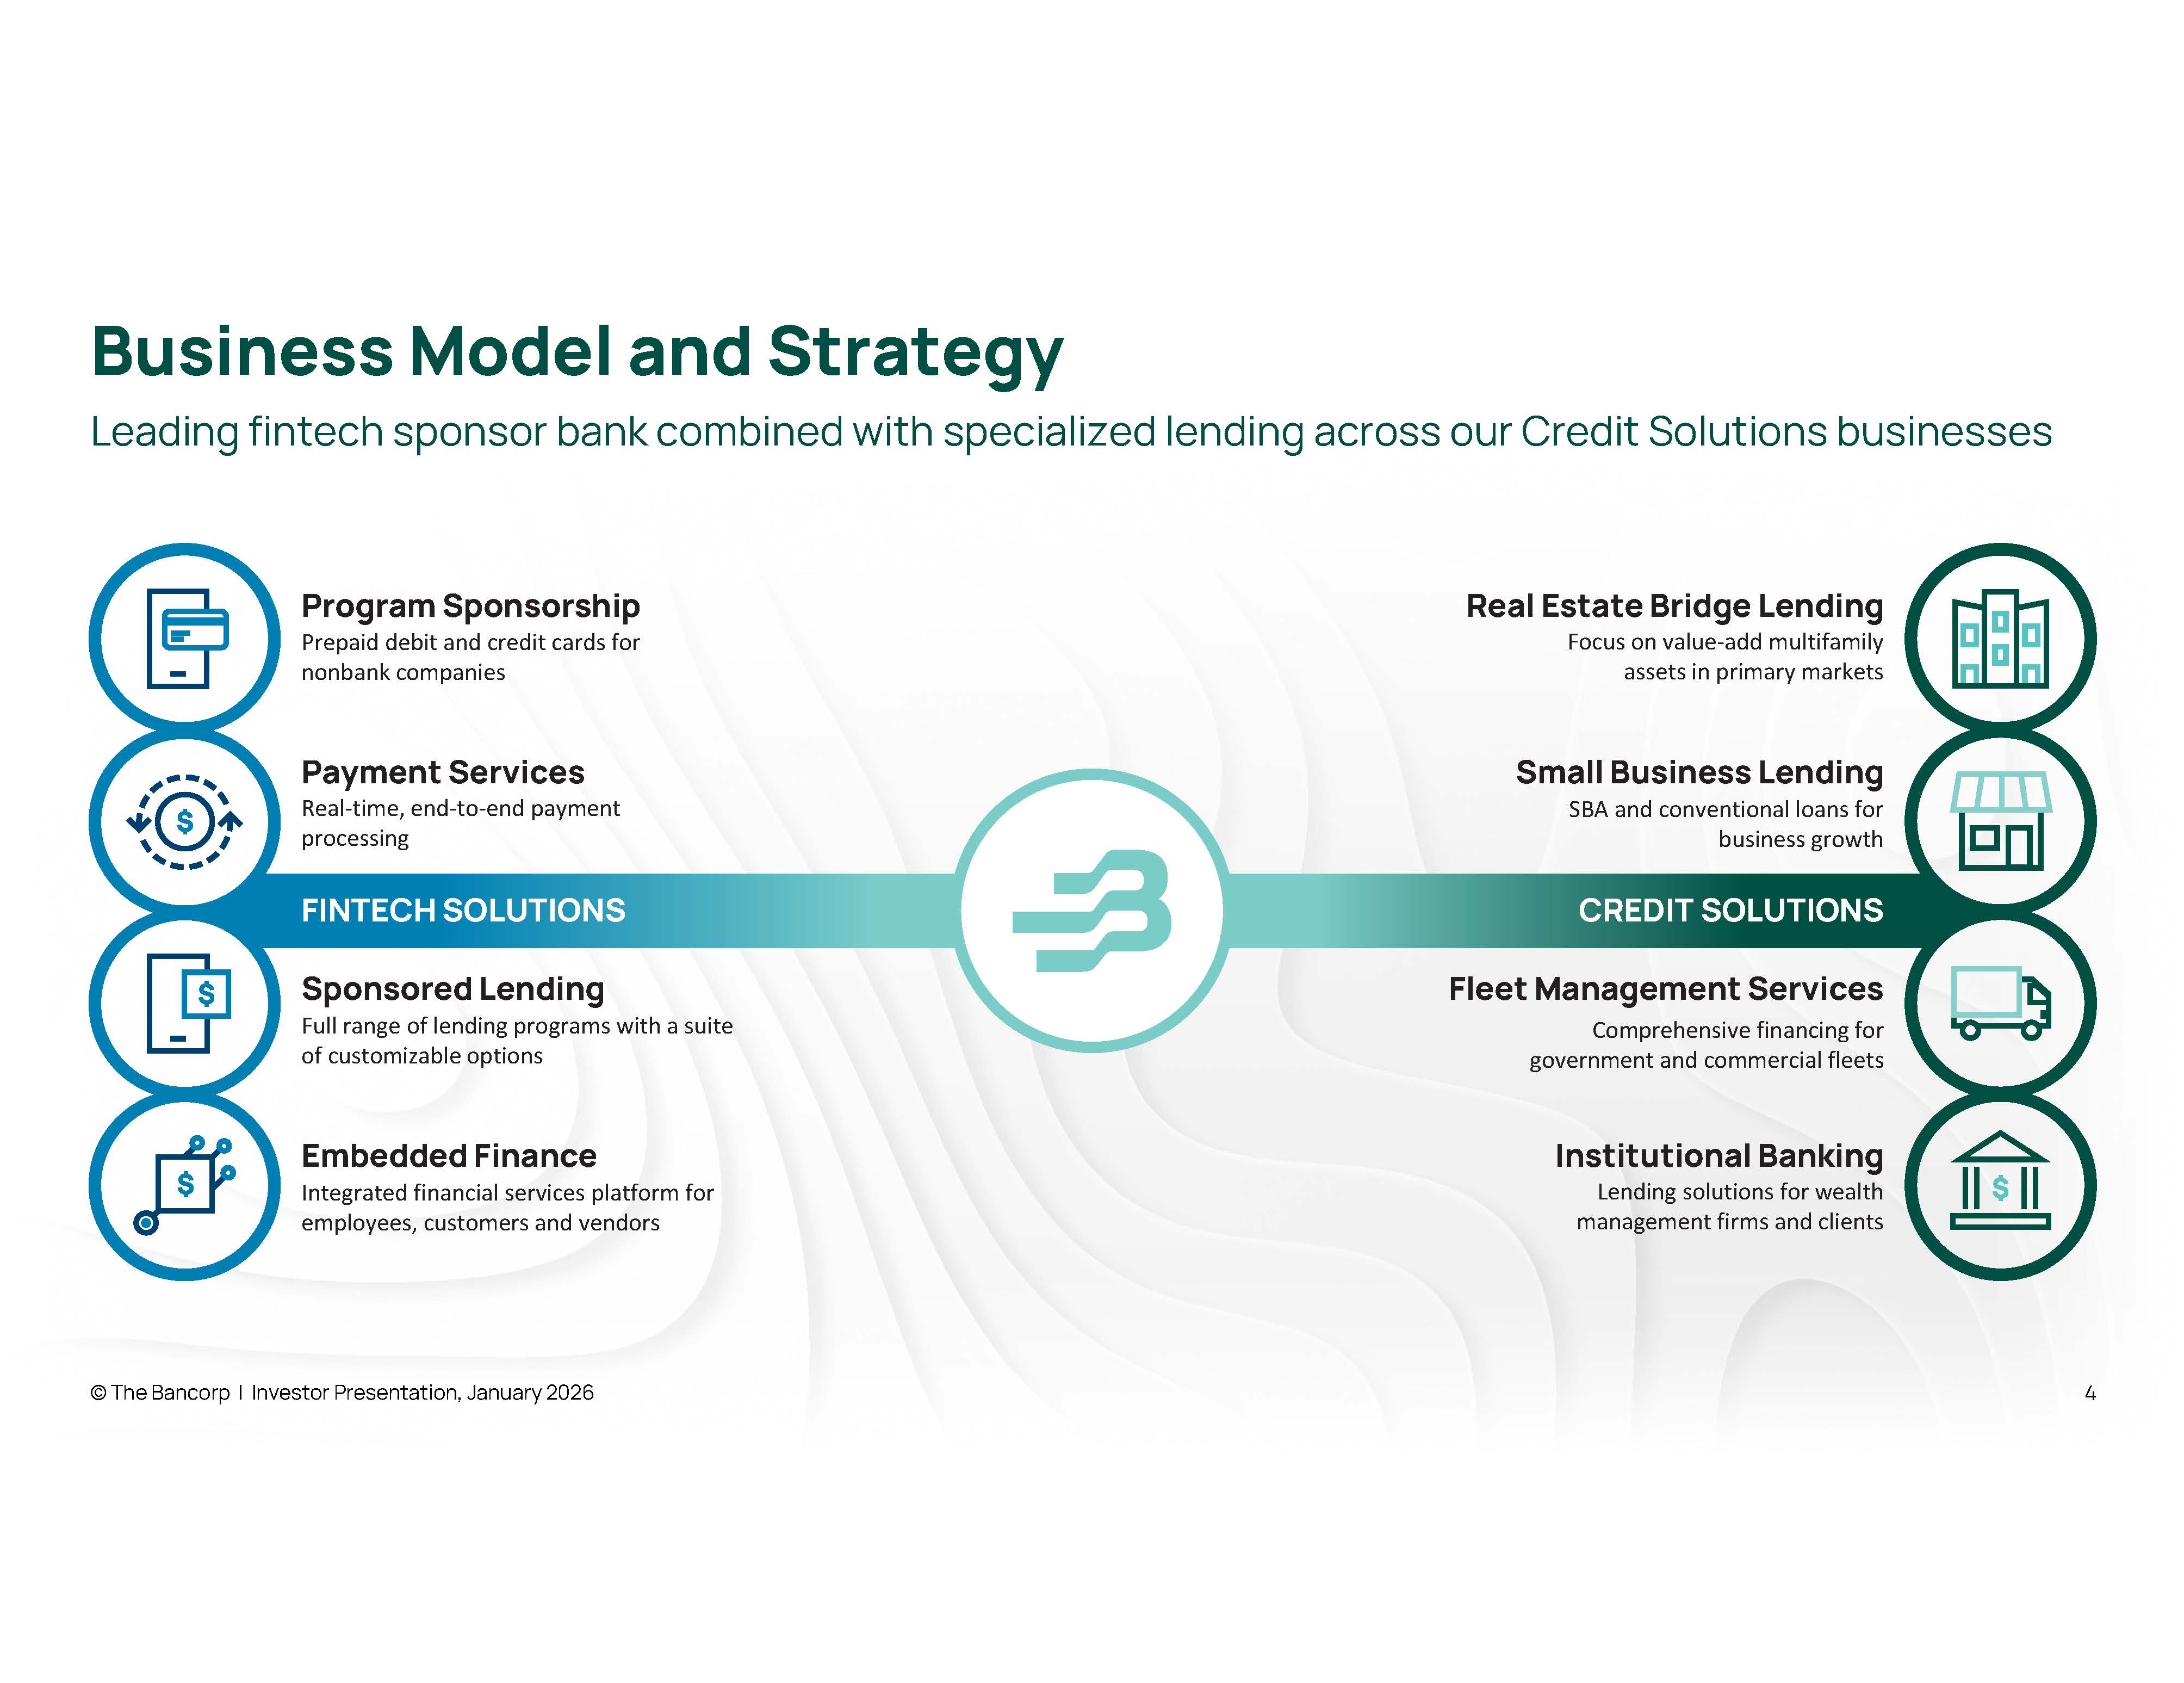
Business Model and Strategy © The Bancorp | Investor Presentation, January 2026 4 Leading fintech sponsor bank combined with specialized lending across our Credit Solutions businesses Real Estate Bridge Lending Focus on value - add multifamily assets in primary markets Small Business Lending SBA and conventional loans for business growth Fleet Management Services Comprehensive financing for government and commercial fleets Institutional Banking Lending solutions for wealth management firms and clients Sponsored Lending Full range of lending programs with a suite of customizable options CREDIT SOLUTIONS FINTECH SOLUTIONS Payment Services Real - time, end - to - end payment processing Program Sponsorship Prepaid debit and credit cards for nonbank companies Embedded Finance Integrated financial services platform for employees, customers and vendors
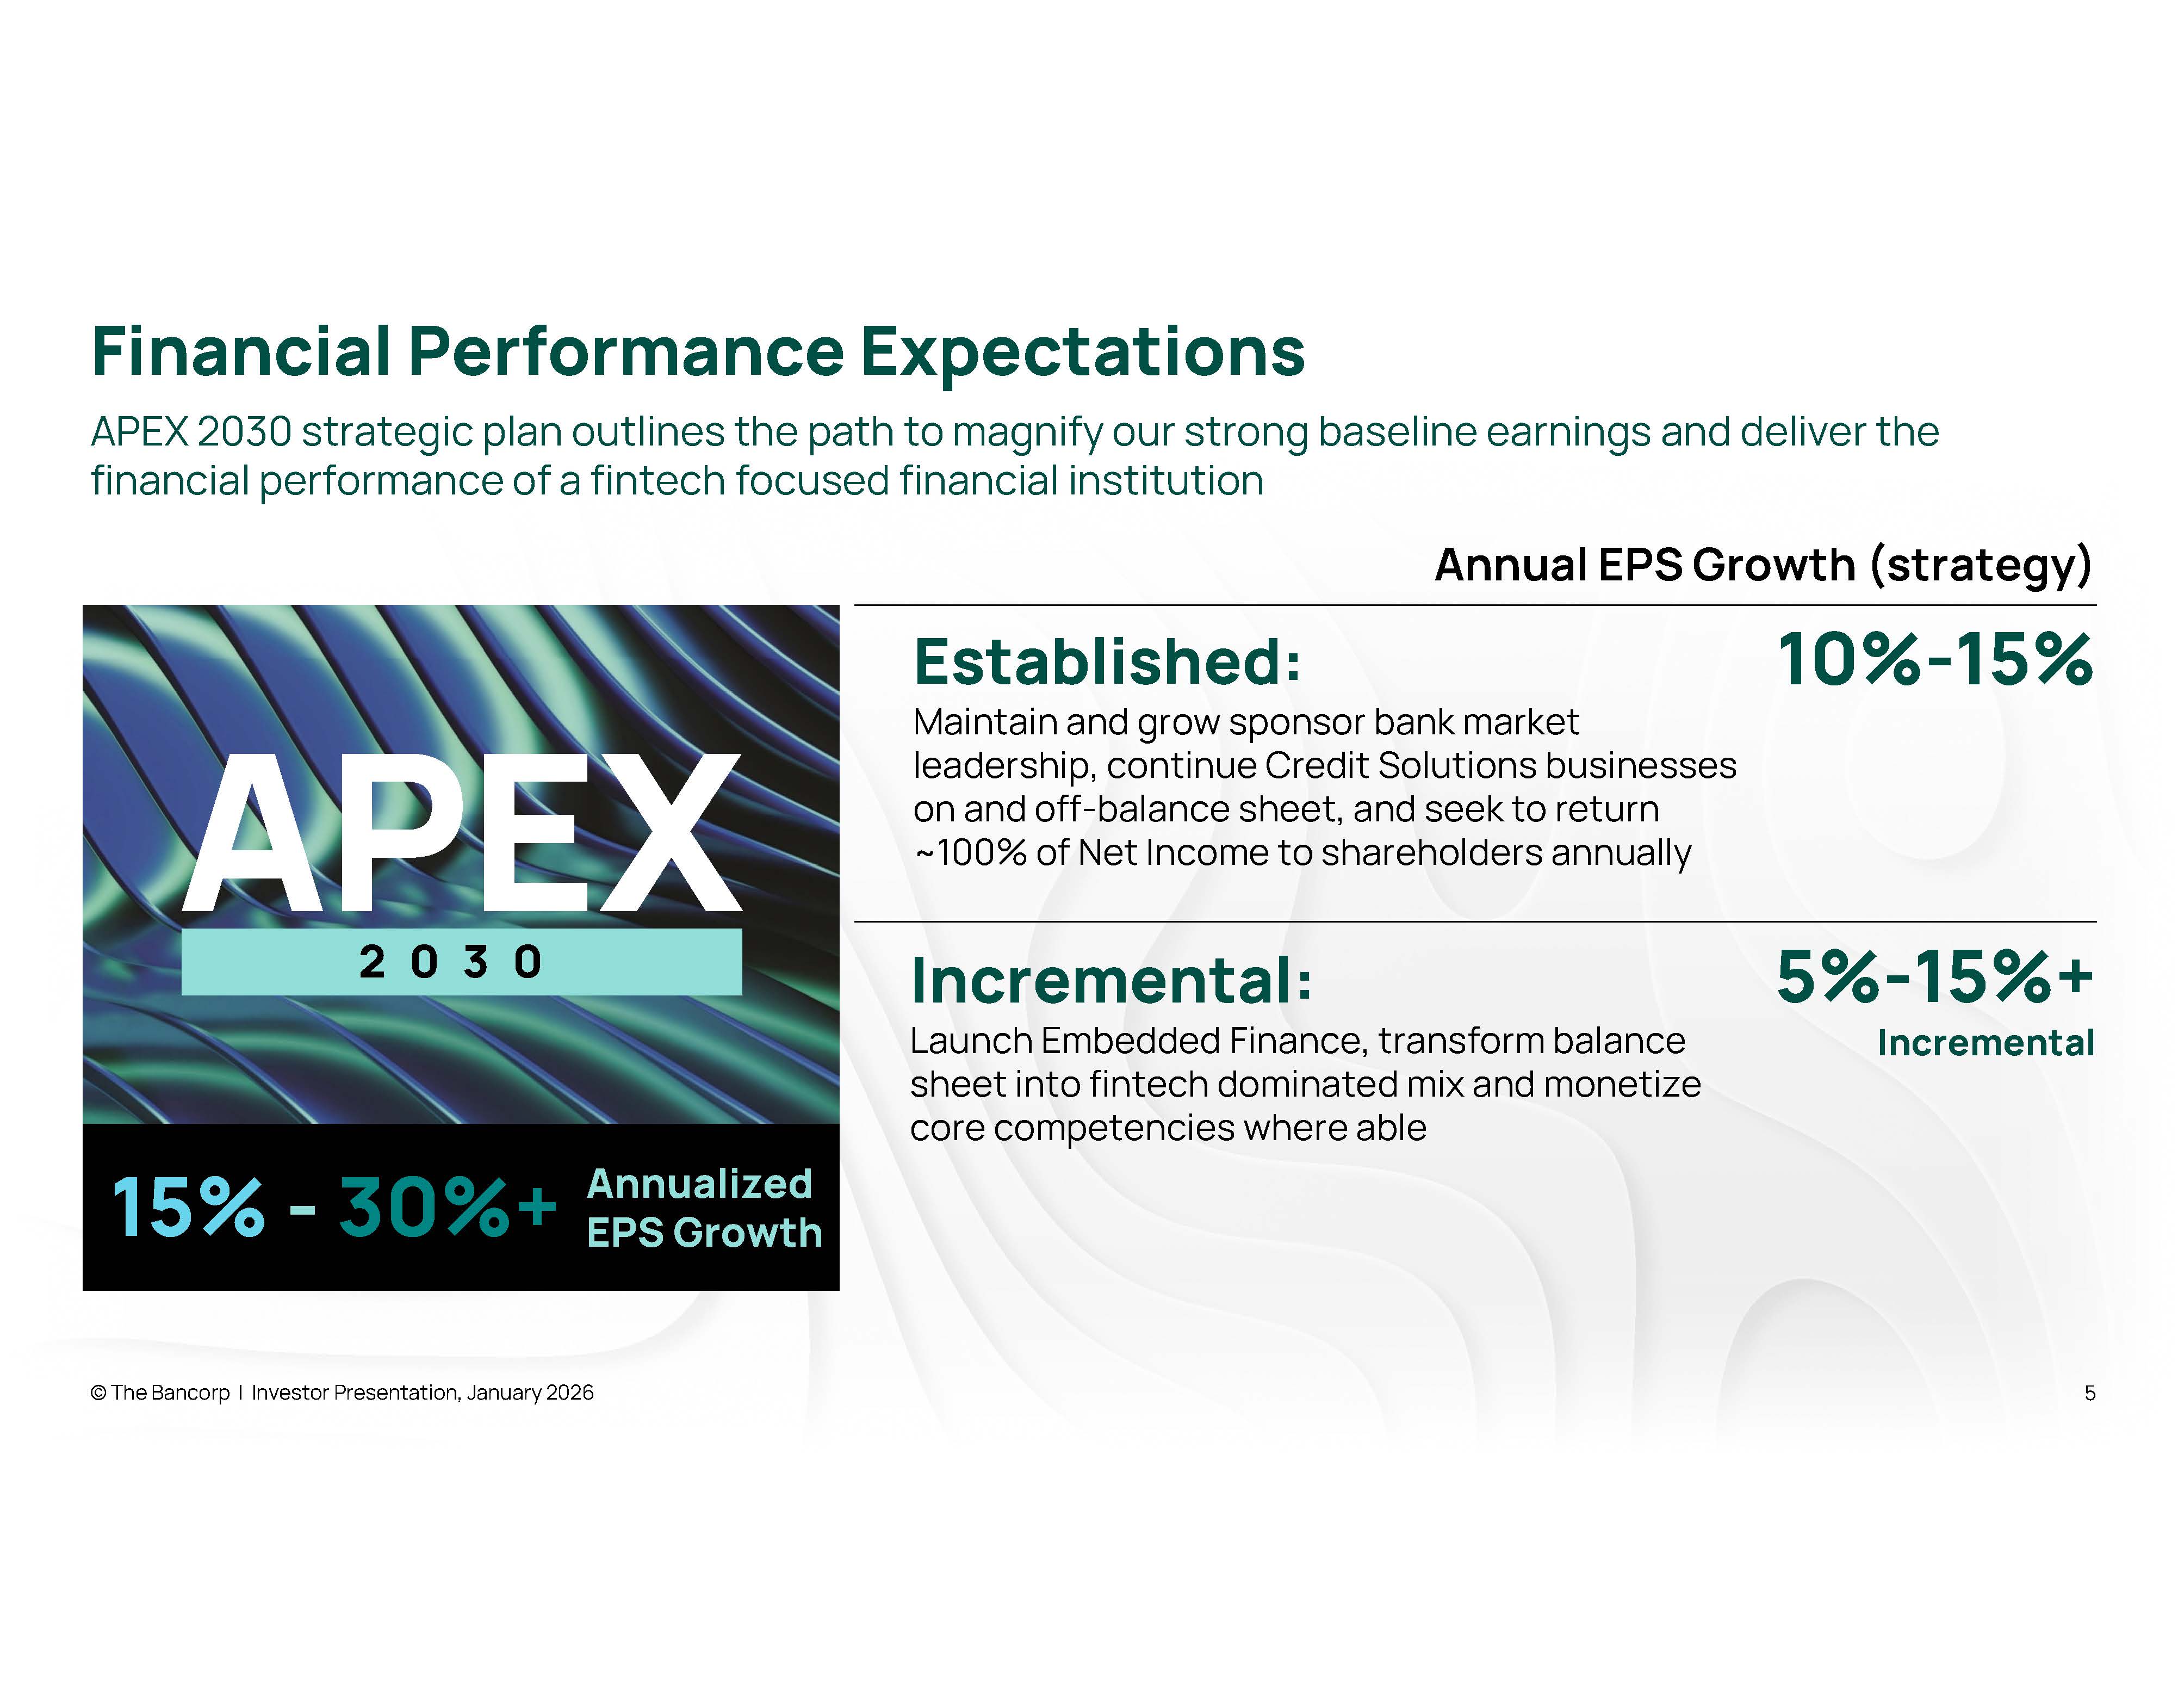
© The Bancorp | Investor Presentation, January 2026 5 Established: Maintain and grow sponsor bank market leadership, continue Credit Solutions businesses on and off - balance sheet, and seek to return ~100% of Net Income to shareholders annually Incremental: Launch Embedded Finance, transform balance sheet into fintech dominated mix and monetize core competencies where able Annual EPS Growth (strategy) 10% - 15% 5% - 15%+ Incremental APEX 2030 15% - 30%+ Annualized EPS Growth Financial Performance Expectations APEX 2030 strategic plan outlines the path to magnify our strong baseline earnings and deliver the financial performance of a fintech focused financial institution
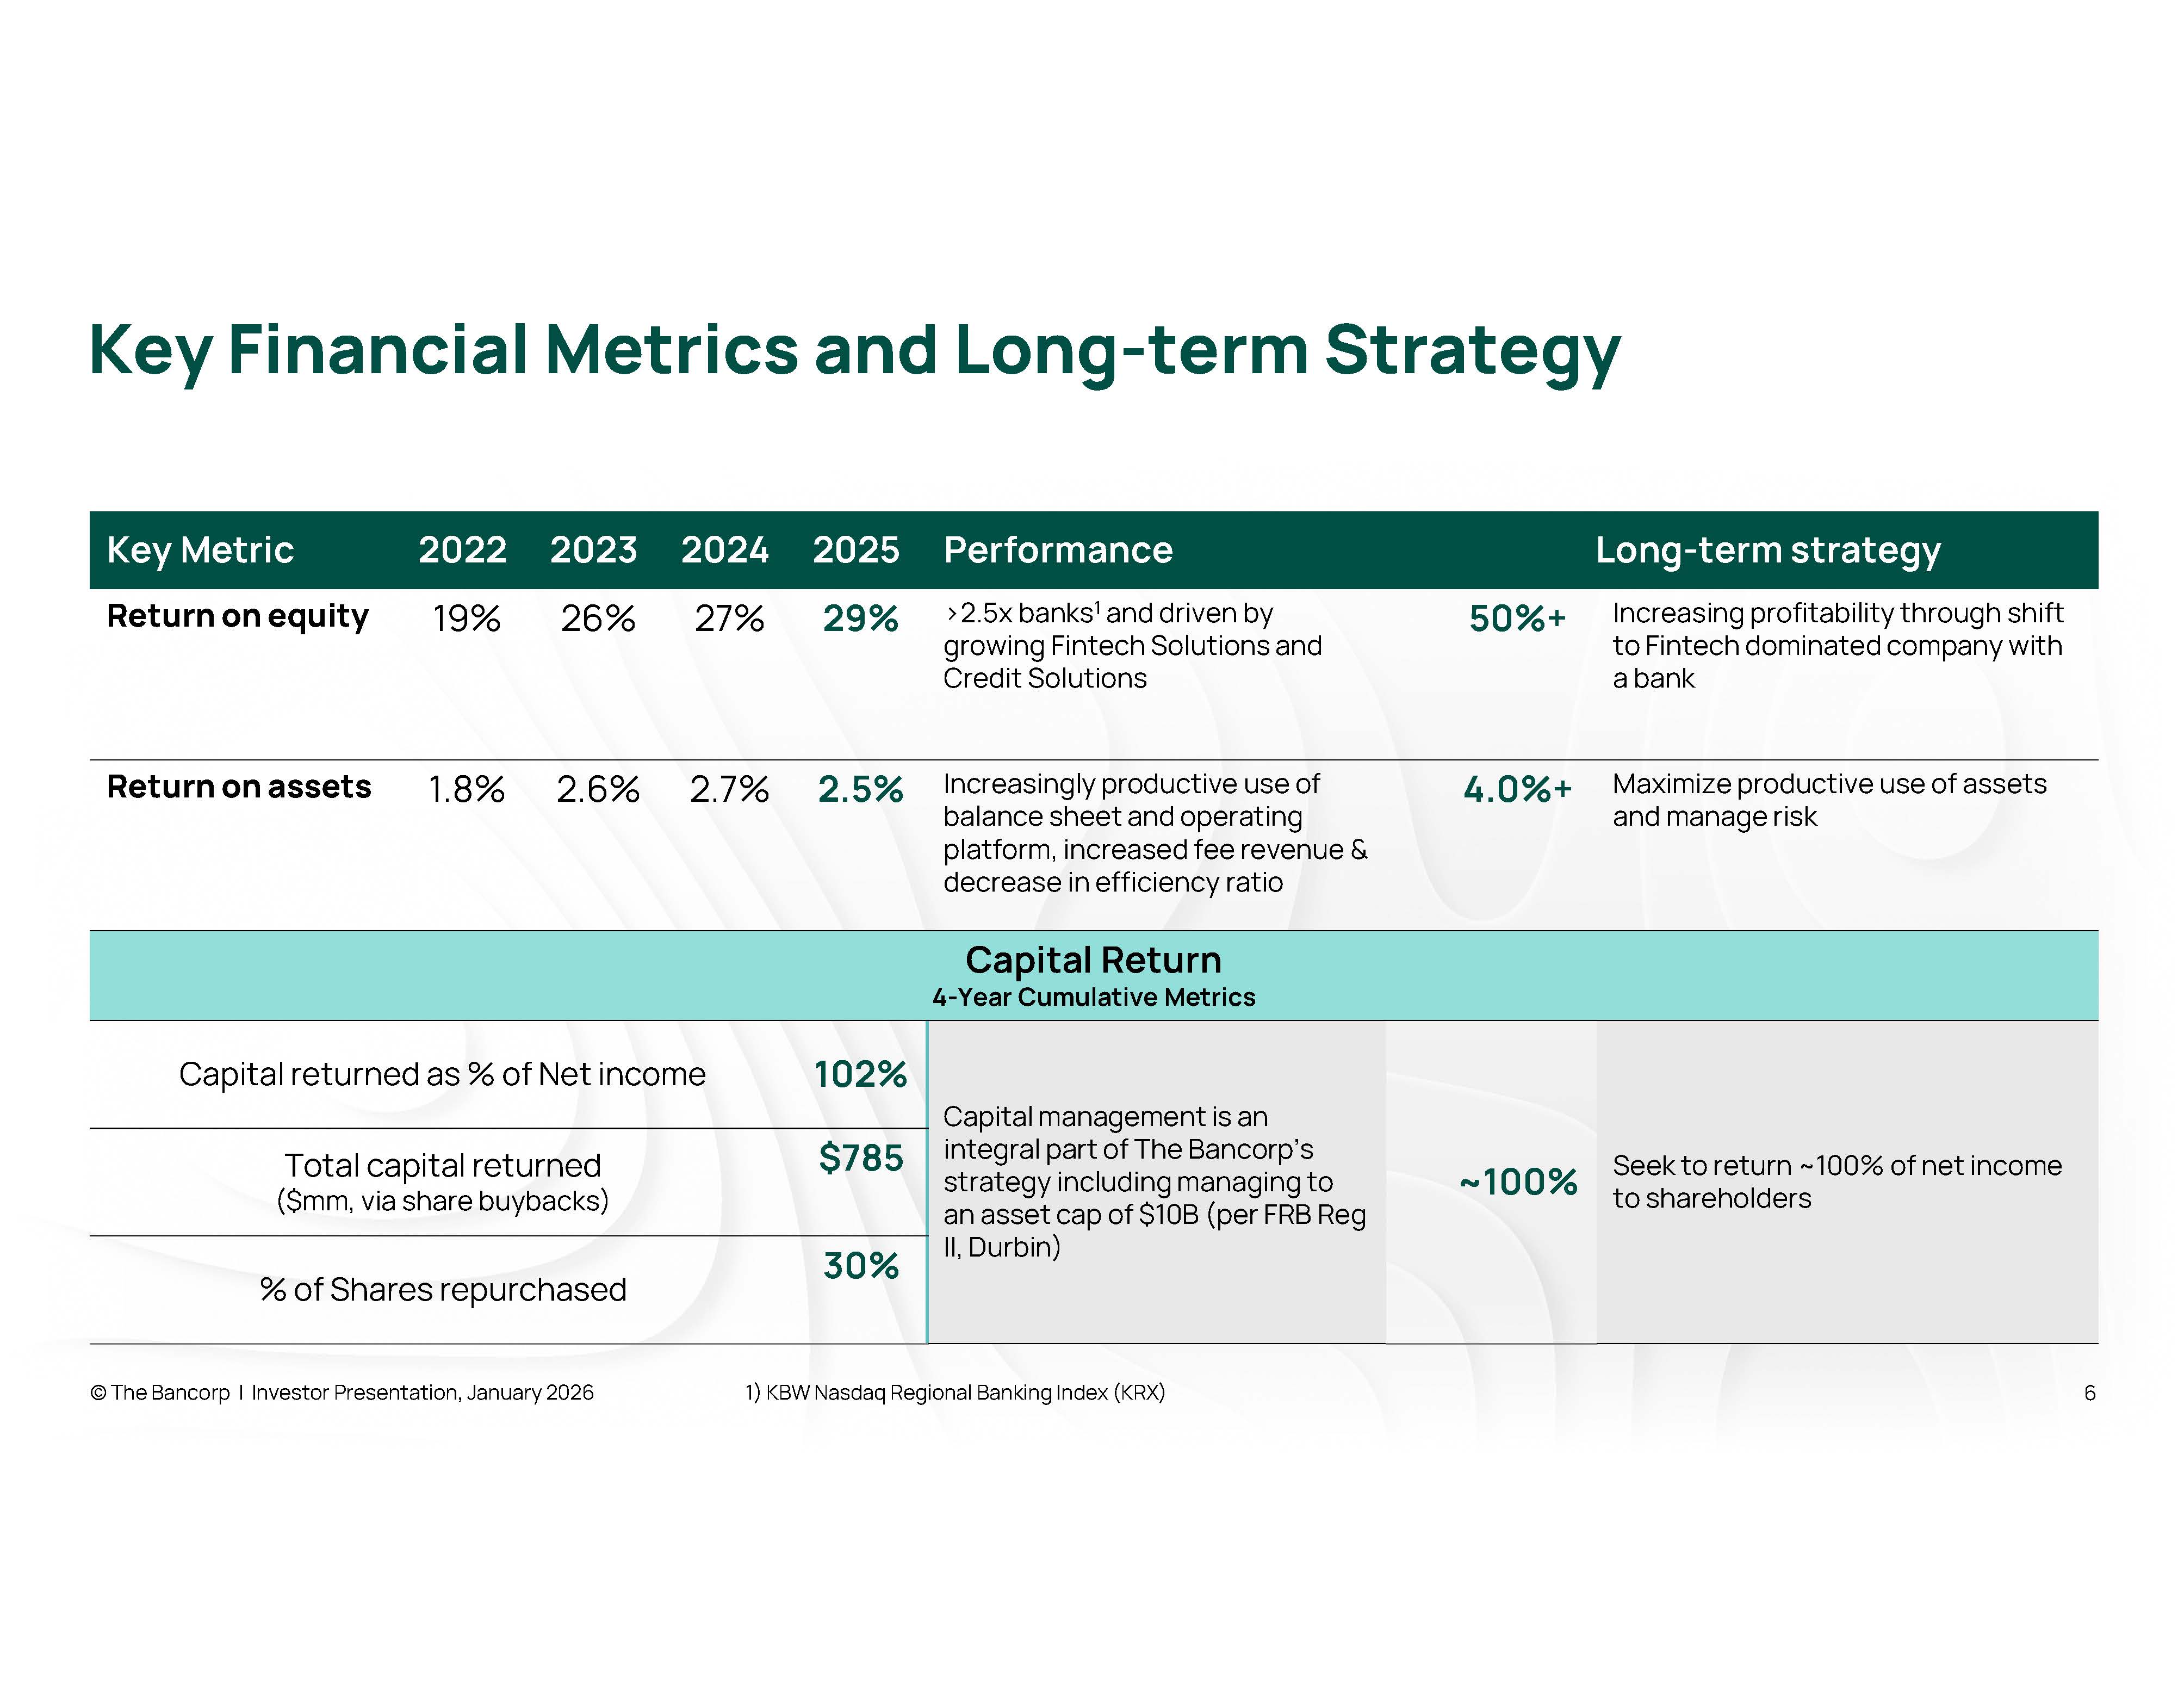
Key Financial Metrics and Long - term Strategy © The Bancorp | Investor Presentation, January 2026 1) KBW Nasdaq Regional Banking Index (KRX) 6 Long - term strategy Performance 2025 2024 2023 2022 Key Metric Increasing profitability through shift to Fintech dominated company with a bank 50%+ >2.5x banks 1 and driven by growing Fintech Solutions and Credit Solutions 29% 27% 26% 19% Return on equity Maximize productive use of assets and manage risk 4.0%+ Increasingly productive use of balance sheet and operating platform, increased fee revenue & decrease in efficiency ratio 2.5% 2.7% 2.6% 1.8% Return on assets Capital Return 4 - Year Cumulative Metrics Seek to return ~100% of net income to shareholders ~100% Capital management is an integral part of The Bancorp’s strategy including managing to an asset cap of $10B (per FRB Reg II, Durbin) 102% Capital returned as % of Net income $785 Total capital returned ($mm, via share buybacks) 30% % of Shares repurchased
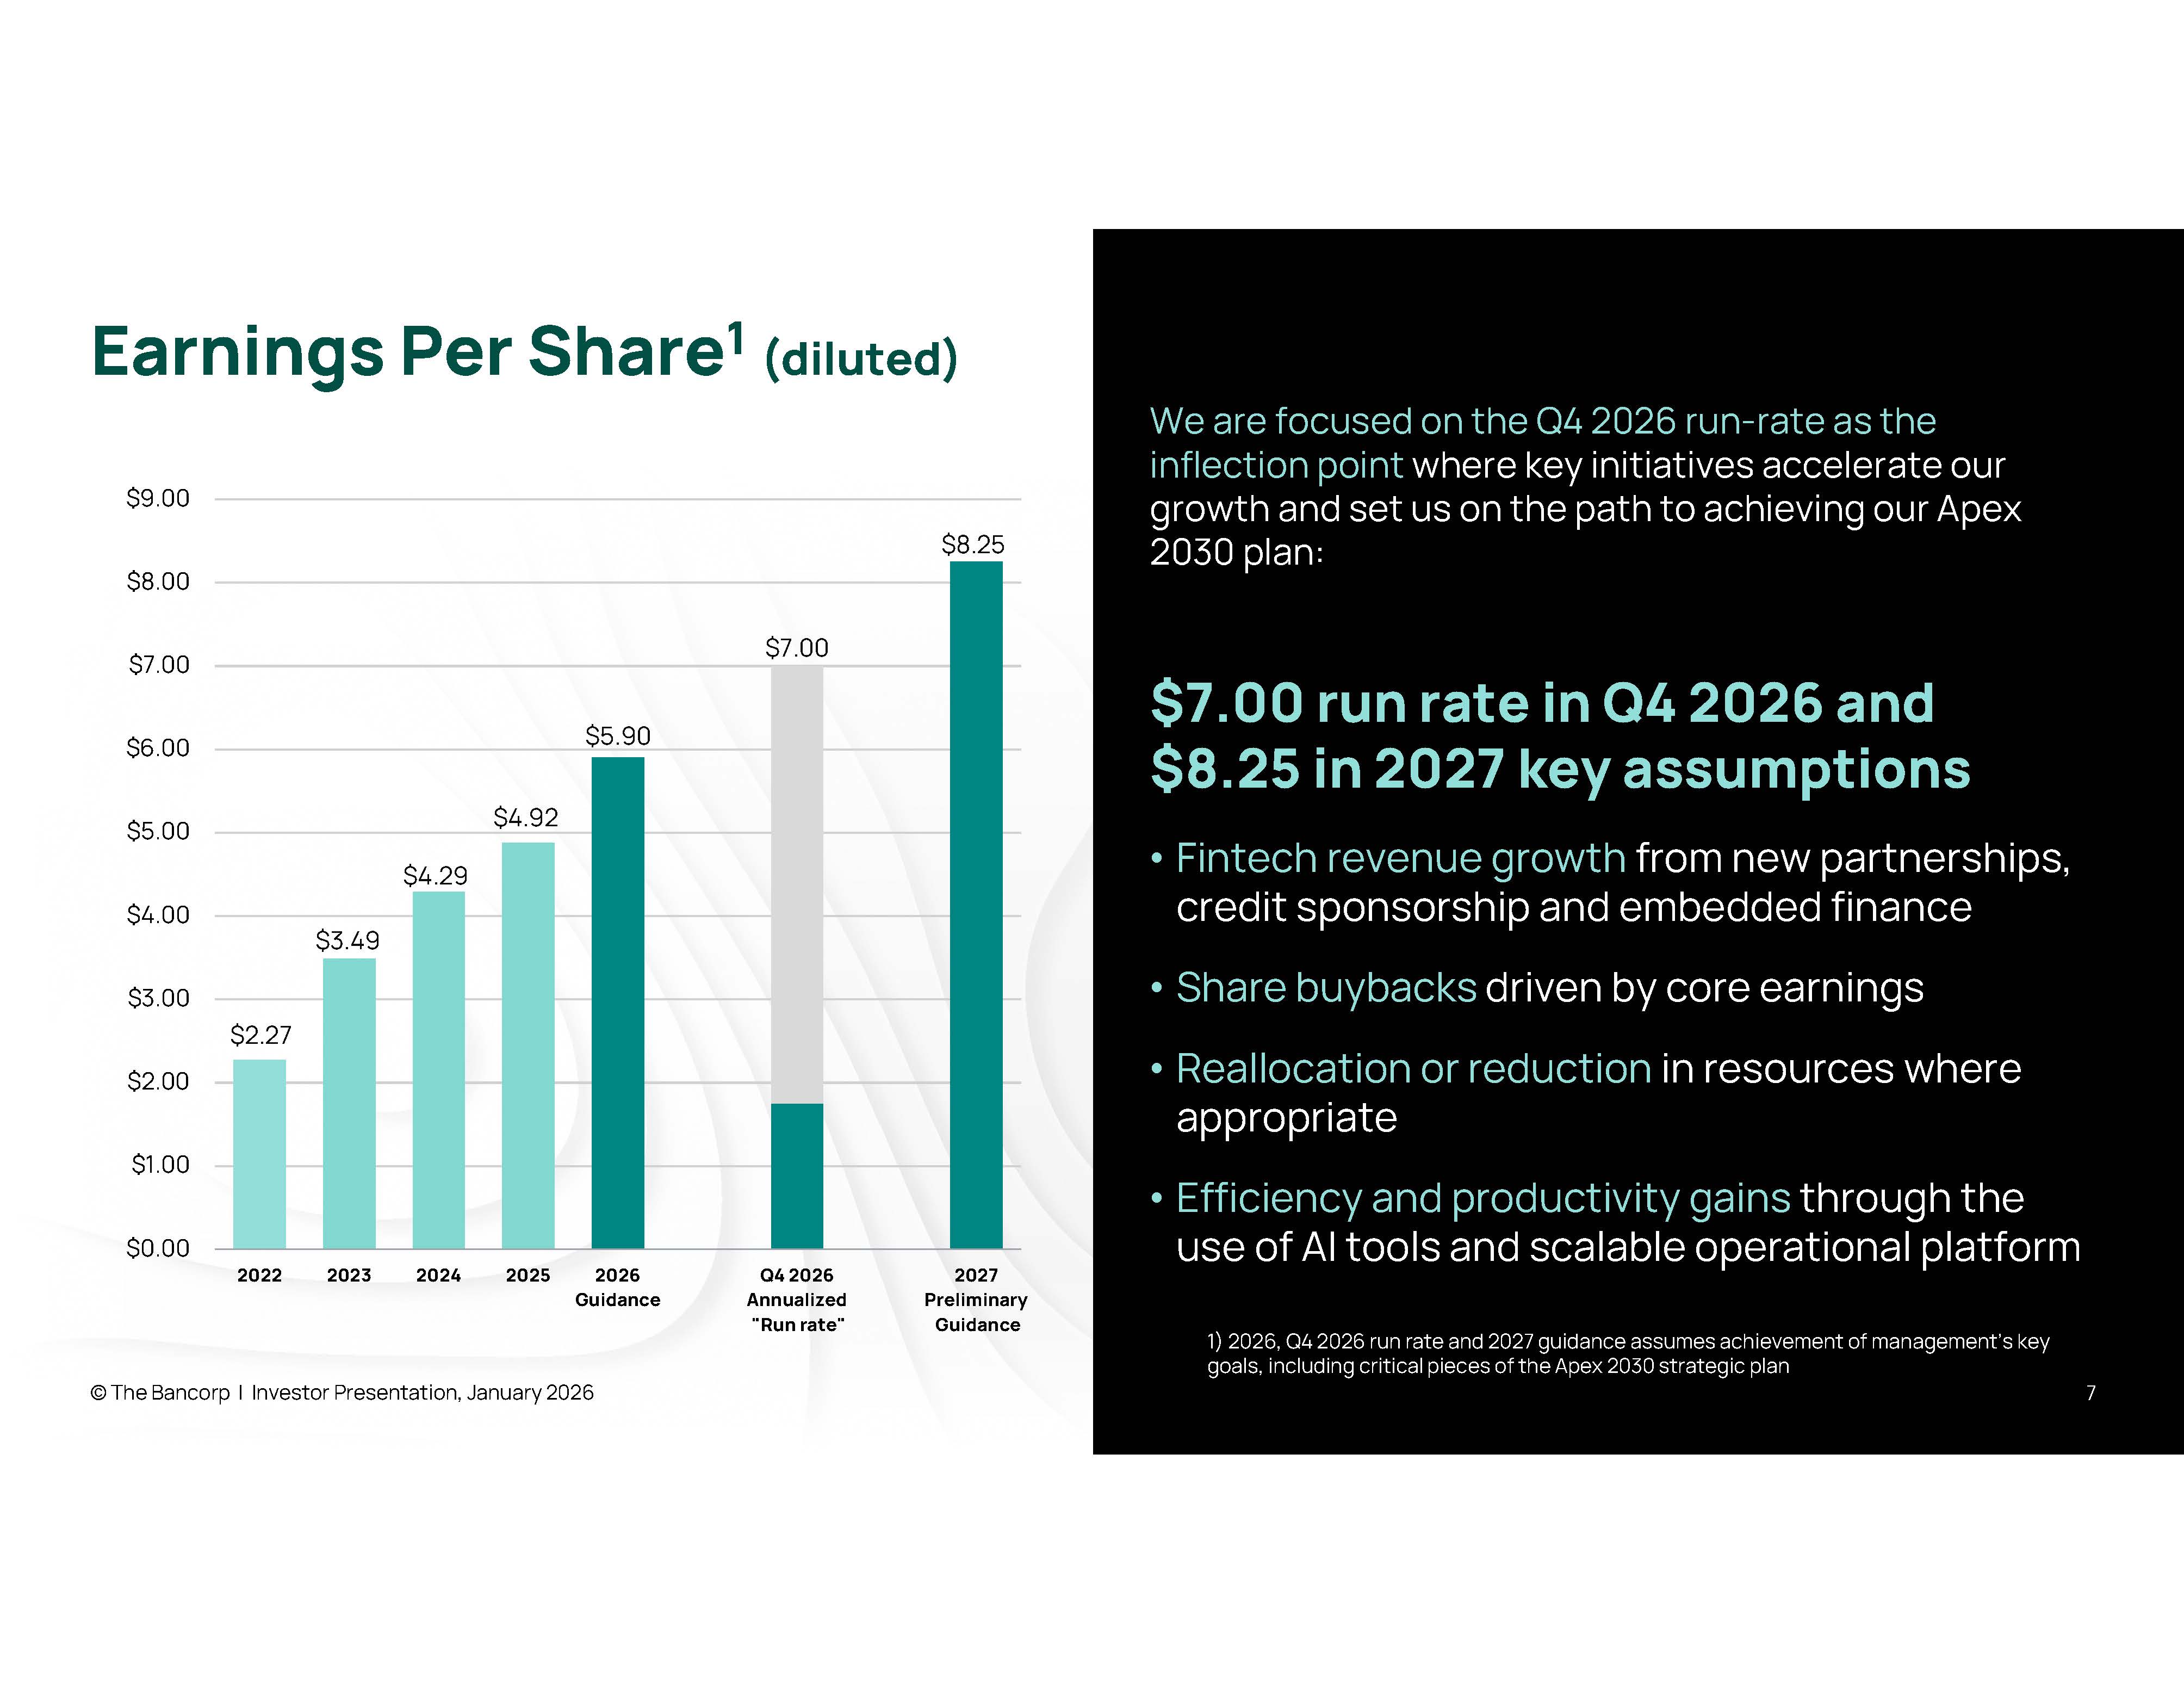
$0.00 $1.00 $2.00 $3.00 $4.00 $5.00 $6.00 $7.00 $8.00 $9.00 2022 2023 2024 2025 2026 Guidance Q4 2026 Annualized "Run rate" 2027 Preliminary Guidance Earnings Per Share 1 (diluted) 7 We are focused on the Q4 2026 run - rate as the inflection point where key initiatives accelerate our growth and set us on the path to achieving our Apex 2030 plan: $7.00 run rate in Q4 2026 and $8.25 in 2027 key assumptions • Fintech revenue growth from new partnerships, credit sponsorship and embedded finance • Share buybacks driven by core earnings • Reallocation or reduction in resources where appropriate • Efficiency and productivity gains through the use of AI tools and scalable operational platform $5.90 $3.49 $4.29 $7.00 $8.25 $2.27 © The Bancorp | Investor Presentation, January 2026 $4.92 1) 2026, Q4 2026 run rate and 2027 guidance assumes achievement of management’s key goals, including critical pieces of the Apex 2030 strategic plan
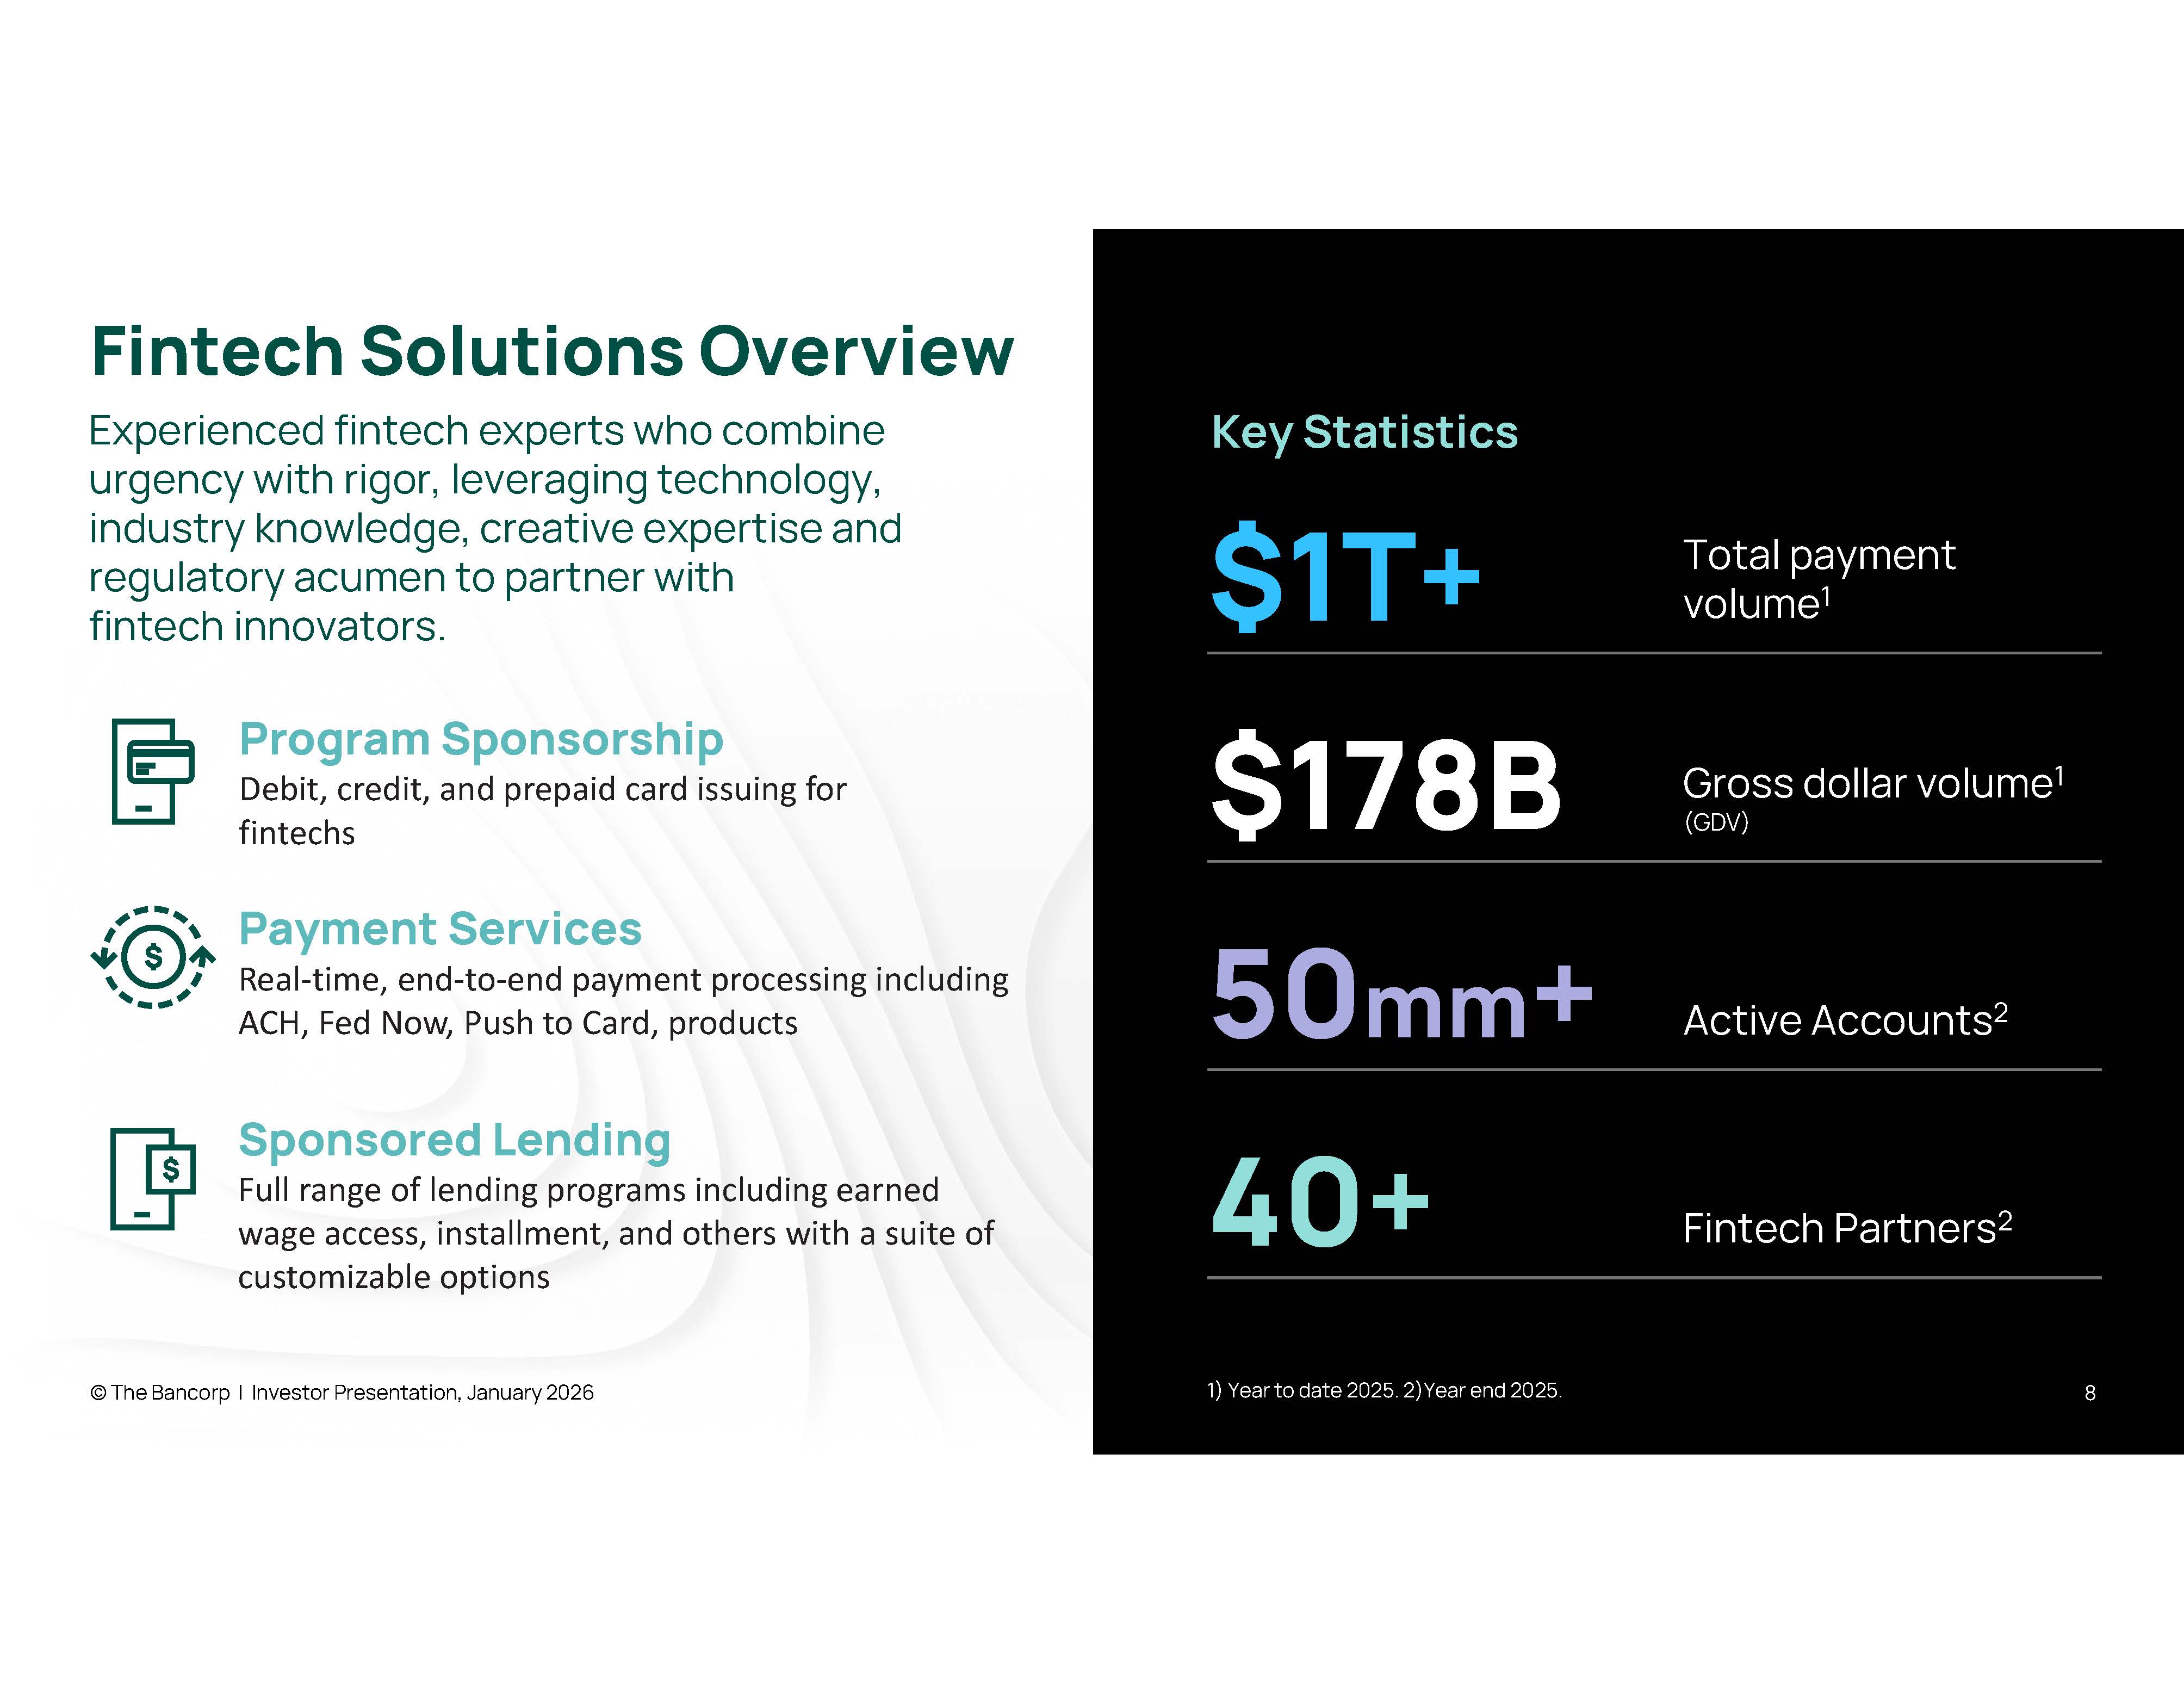
Fintech Solutions Overview © The Bancorp | Investor Presentation, January 2026 8 Key Statistics Total payment volume 1 $1T+ Gross dollar volume 1 (GDV) $178B Active Accounts 2 50 mm + Fintech Partners 2 40+ 1) Year to date 2025. 2)Year end 2025. Program Sponsorship D ebit , credit, and prepaid card issuing for fintechs Sponsored Lending Full range of lending programs including earned wage access, installment, and others with a suite of customizable options Payment Services Real - time, end - to - end payment processing including ACH, Fed Now, Push to Card, products Experienced fintech experts who combine urgency with rigor, leveraging technology, industry knowledge, creative expertise and regulatory acumen to partner with fintech innovators.
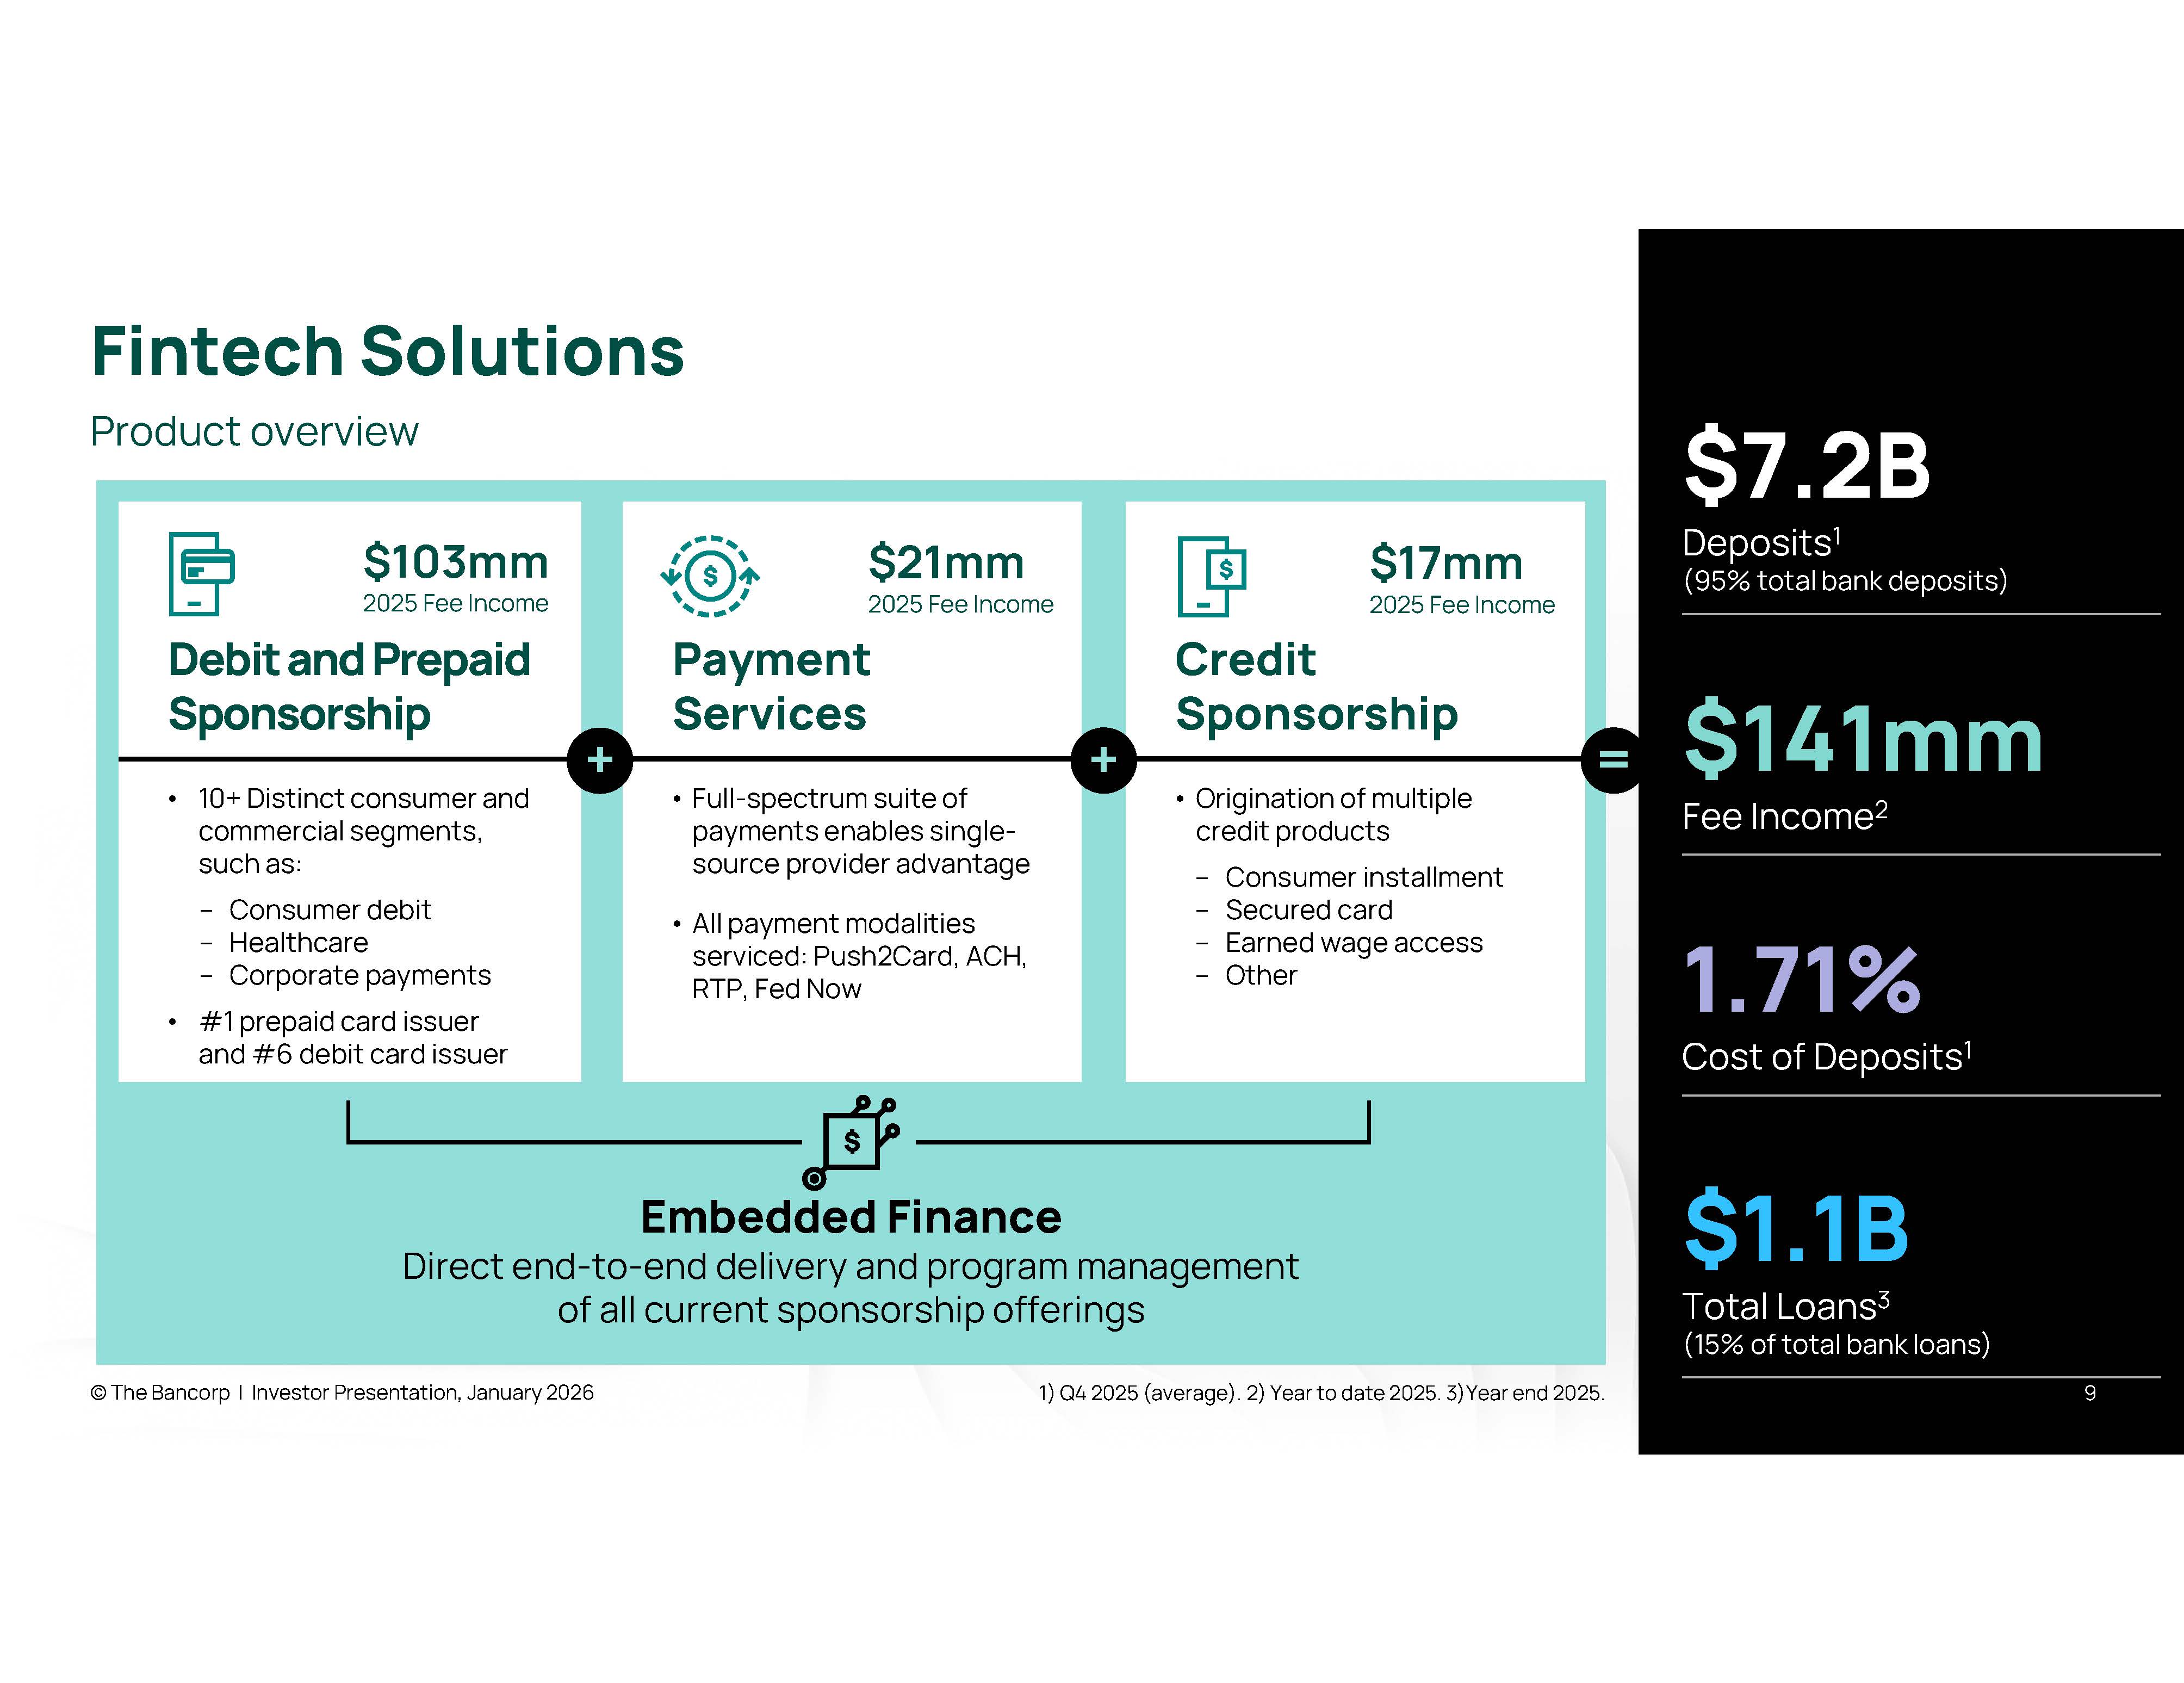
Embedded Finance Direct end - to - end delivery and program management of all current sponsorship offerings Fintech Solutions © The Bancorp | Investor Presentation, January 2026 9 Product overview $7.2B Deposits 1 (95% total bank deposits) $141mm Fee Income 2 1.71% Cost of Deposits 1 $1.1B Total Loans 3 (15% of total bank loans) Credit Sponsorship • Origination of multiple credit products – Consumer installment – Secured card – Earned wage access – Other $17mm 2025 Fee Income 1) Q4 2025 (average). 2) Year to date 2025. 3)Year end 2025. Payment Services • Full - spectrum suite of payments enables single - source provider advantage • All payment modalities serviced: Push2Card, ACH, RTP, Fed Now $21mm 2025 Fee Income Debit and Prepaid Sponsorship • 10+ Distinct consumer and commercial segments, such as: – Consumer debit – Healthcare – Corporate payments • #1 prepaid card issuer and #6 debit card issuer $103mm 2025 Fee Income + = +
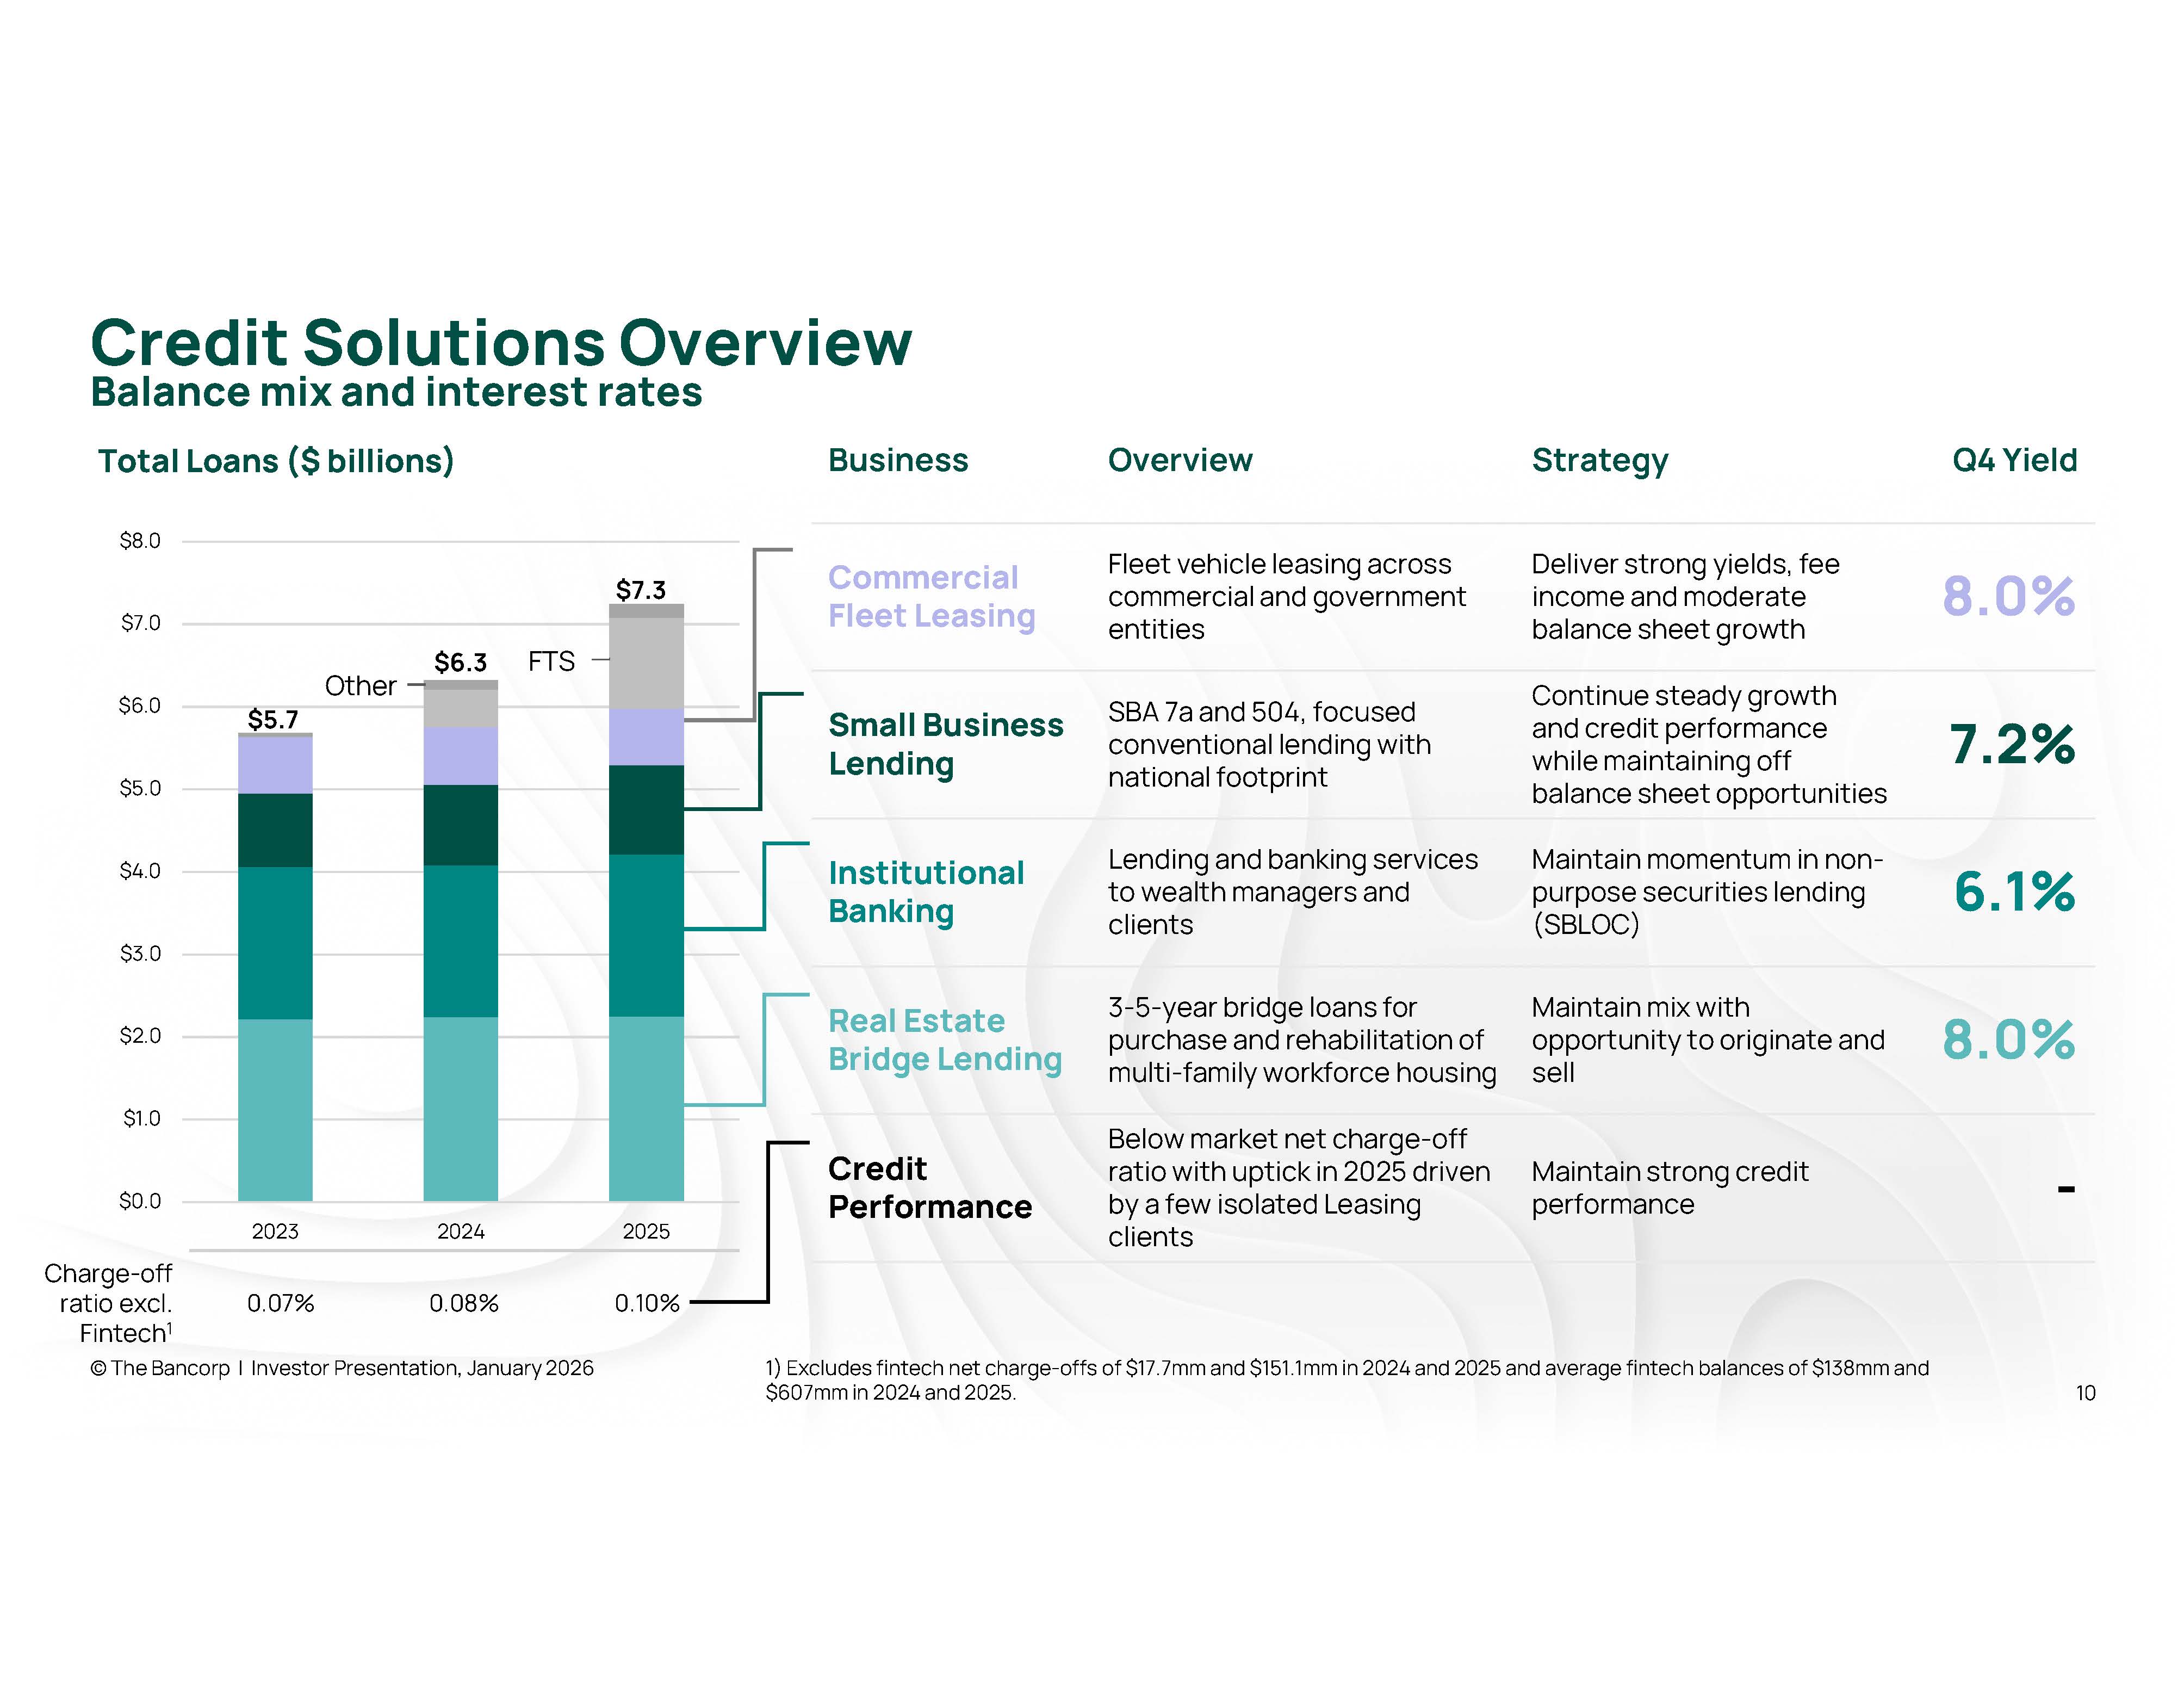
© The Bancorp | Investor Presentation, January 2026 1) Excludes fintech net charge - offs of $ 17.7 mm and $ 151.1 mm in 2024 and 2025 and average fintech balances of $138mm and $607mm in 2024 and 2025. 10 $0.0 $1.0 $2.0 $3.0 $4.0 $5.0 $6.0 $7.0 $8.0 2023 2024 2025 Total Loans ($ billions) Q4 Yield Strategy Overview Business 8.0% Deliver strong yields, fee income and moderate balance sheet growth Fleet vehicle leasing across commercial and government entities Commercial Fleet Leasing 7.2% Continue steady growth and credit performance while maintaining off balance sheet opportunities SBA 7a and 504, focused conventional lending with national footprint Small Business Lending 6.1% Maintain momentum in non - purpose securities lending (SBLOC) Lending and banking services to wealth managers and clients Institutional Banking 8.0% Maintain mix with opportunity to originate and sell 3 - 5 - year bridge loans for purchase and rehabilitation of multi - family workforce housing Real Estate Bridge Lending - Maintain strong credit performance Below market net charge - off ratio with uptick in 2025 driven by a few isolated Leasing clients Credit Performance 0.10% 0.08% 0.07% Charge - off ratio excl. Fintech 1 Balance mix and interest rates Credit Solutions Overview FTS Other $7.3 $6.3 $5.7
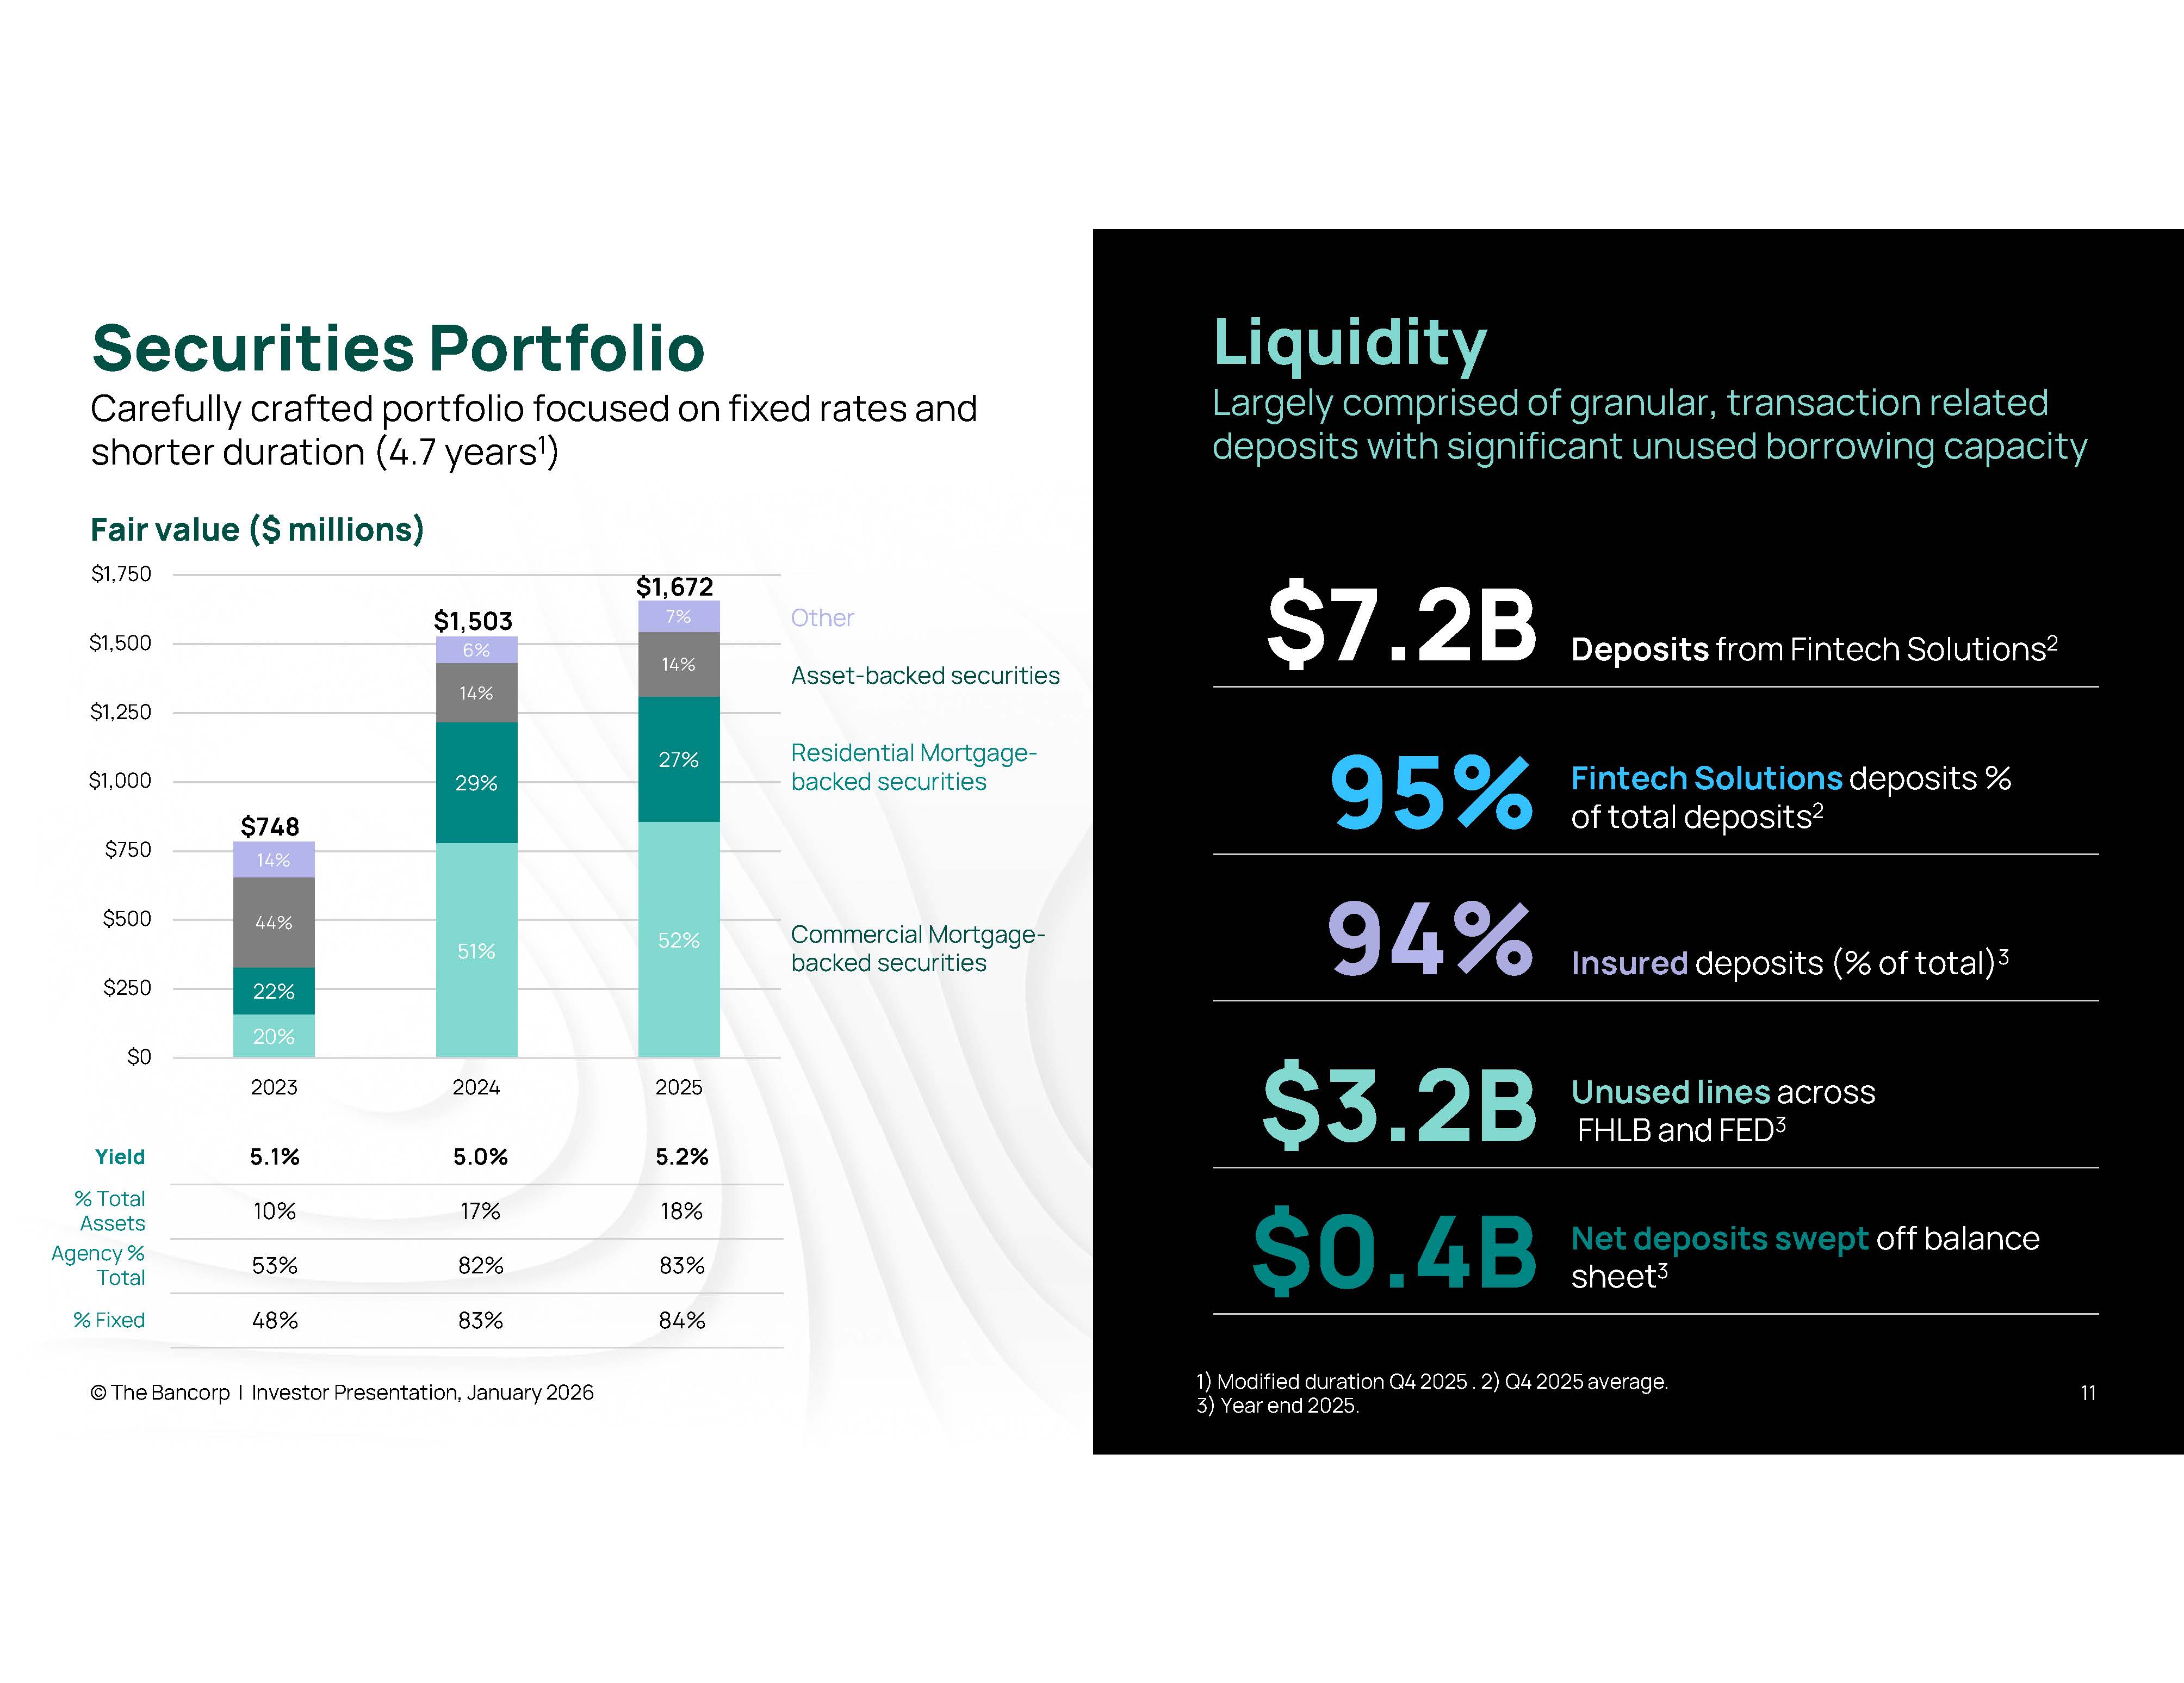
© The Bancorp | Investor Presentation, January 2026 11 20% 51% 52% 22% 29% 27% 44% 14% 14% 14% 6% 7% $0 $250 $500 $750 $1,000 $1,250 $1,500 $1,750 2023 2024 2025 Securities Portfolio Carefully crafted portfolio focused on fixed rates and shorter duration (4.7 years 1 ) 5.2% 5.0% 5.1% Yield 18% 17% 10% % Total Assets 83% 82% 53% Agency % Total 84% 83% 48% % Fixed $748 $1,503 $1,672 Commercial Mortgage - backed securities Other Residential Mortgage - backed securities Asset - backed securities Liquidity Largely comprised of granular, transaction related deposits with significant unused borrowing capacity Deposits from Fintech Solutions 2 $7.2B Fintech Solutions deposits % of total deposits 2 95% Insured deposits (% of total) 3 9 4 % Unused lines across FHLB and FED 3 $3.2B Net deposits swept off balance sheet 3 $0.4B 1) Modified duration Q4 2025 . 2) Q4 2025 average. 3) Year end 2025. Fair value ($ millions)
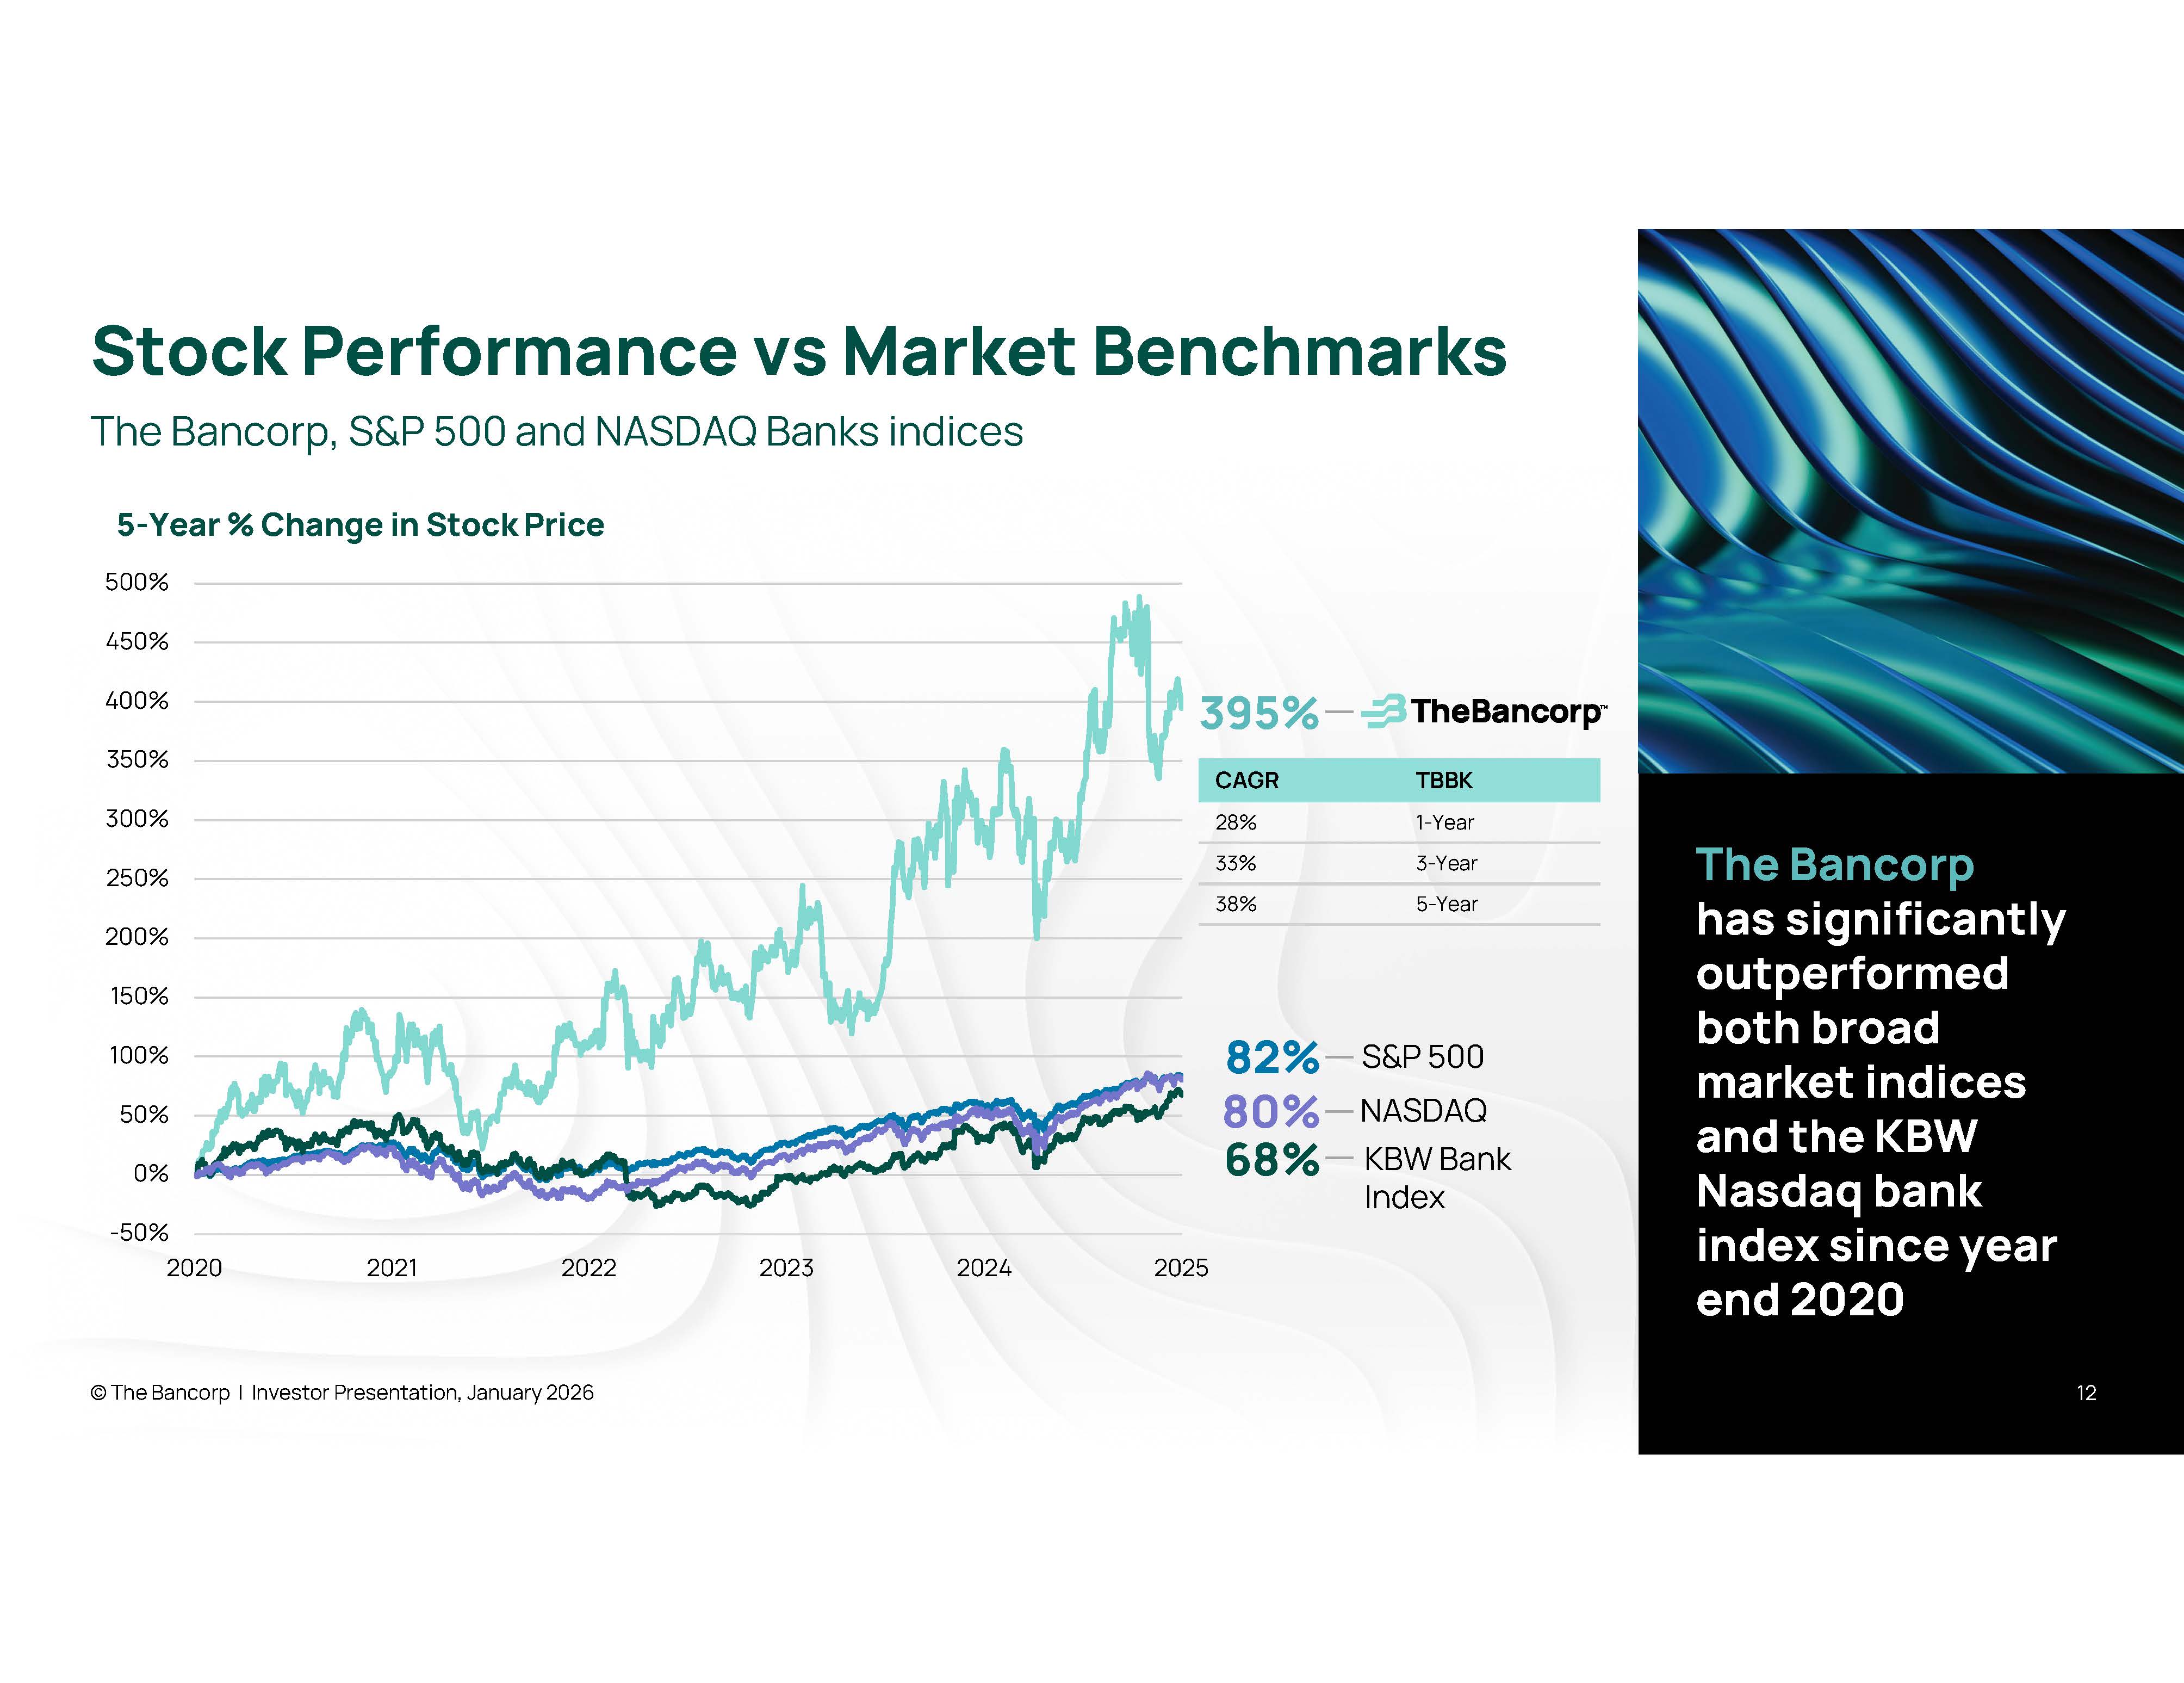
Stock Performance vs Market Benchmarks © The Bancorp | Investor Presentation, January 2026 12 The Bancorp, S&P 500 and NASDAQ Banks indices The Bancorp has significantly outperformed both broad market indices and the KBW Nasdaq bank index since year end 2020 -50% 0% 50% 100% 150% 200% 250% 300% 350% 400% 450% 500% 2020 2021 2022 2023 2024 2025 5 - Year % Change in Stock Price 395% 82% 68% S&P 500 KBW Bank Index 80% NASDAQ TBBK CAGR 1 - Year 28% 3 - Year 33% 5 - Year 38%