COASTALSOUTH BANCSHARES, INC. Investor Presentation June 2025
Disclaimer Disclaimer CoastalSouth Bancshares, Inc. (the “Company,” “COSO”, “we,” “our” or “us”) has filed a registration statement on Form S-1 (including a preliminary prospectus) with the Securities and Exchange Commission (the “SEC”) for the offering to which this presentation relates. The registration statement has not yet become effective. The Company’s securities may not be sold, nor may any offers to buy be accepted, prior to the time the registration statement becomes effective. Before you invest, you should read the preliminary prospectus and the other documents the Company files with the SEC for more complete information about the Company and this offering. You can obtain these documents for free by visiting EDGAR on the SEC website at www.sec.gov. Alternatively, copies of the preliminary prospectus may be obtained by contacting Piper Sandler & Co., Attention: Prospectus Department, 800 Nicollet Mall, J12S03, Minneapolis, MN 55402, or by telephone at (800) 747-3924, or by email at prospectus@psc.com. This Investor Presentation does not purport to contain all of the information that may be material or relevant to an investment decision. In addition, certain financial information presented in this Investor Presentation has not been audited. In all cases, interested parties should conduct their own investigation and analysis of the Company and the data set forth in this Investor Presentation and other information provided by or on behalf of the Company. The contents of this Investor Presentation should not be construed as investment, legal or tax advice. This Investor Presentation does not constitute an offer to sell, nor a solicitation of an offer to buy, any securities by any person in any jurisdiction in which it is unlawful for such a person to make such an offering or solicitation. Neither the SEC nor any other regulatory agency has approved or disapproved of our securities or passed upon the accuracy or adequacy of this presentation. Any representation to the contrary is a criminal offense. Our common stock is not a deposit account of Coastal States Bank, our wholly-owned bank subsidiary and South Carolina bank (our “Bank”) and is not insured by the FDIC or any other governmental agency. No money or other consideration is being solicited and if sent in response will not be accepted. We are under no obligation to make an offering. We may choose to make an offering to some, but not all, of the people who indicate an interest in investing. Any such offering of securities will only be made by means of a registration statement (including a prospectus) filed with the SEC, after such registration statement becomes effective. The information included in any registration statement will be more complete than the information we are providing now, and could differ in important ways. No such registration statement has become effective as of the date of this presentation. Forward Looking Statements This Investor Presentation contains forward-looking statements as defined in the Private Securities Litigation Reform Act of 1995. Words or phrases such as “may,” “should,” “could,” “predict,” “potential,” “believe,” “will likely result,” “expect,” “continue,” “will,” “anticipate,” “seek,” “estimate,” “intend,” “plan,” “projection,” “would” and “outlook,” or the negative version of those words or other comparable words are intended to identify forward-looking statements but are not the exclusive means of identifying such statements. These forward-looking statements are not historical facts, and are based on current expectations, estimates and projections about the Company’s business based on the beliefs of and certain assumptions made by the Company’s management, many of which assumptions, by their nature, are inherently uncertain and beyond the Company’s control. Accordingly, you are cautioned that any such forward-looking statements are not guarantees of future performance and are subject to certain risks, uncertainties and assumptions that are difficult to predict. Although the Company believes that the expectations reflected in such forward-looking statements are reasonable as of the date made, they may prove to be materially different from the results expressed or implied by such forward-looking statements. Unless required by law, the Company also disclaims any obligation to update any forward-looking statements. Interested parties should not place undue reliance on any forward-looking statement and should carefully consider the risks and other factors that the Company faces. 2
Disclaimer (cont.) Industry Information Certain of the information contained in this Investor Presentation may be derived from information provided by industry sources. The Company believes that such information is accurate and that the sources from which it has been obtained are reliable. The Company cannot guarantee the accuracy of such information, however, and has not independently verified such information. By attending this presentation, you acknowledge that you will be solely responsible for your own assessment of the market and our market position and that you will conduct your own analysis and be solely responsible for forming your own view of the potential future performance of our business. Our and our Bank’s logos and other trademarks referred to and included in this Investor Presentation belong to us. Solely for convenience, we may refer to our trademarks herein without the “®“ “SM” or the “TM” symbols, but such references are not intended to indicate that we will not assert, to the fullest extent under applicable law, our rights to our trademarks. Non-GAAP Financial Measures In addition to results presented in accordance with U.S. generally accepted accounting principles (“GAAP”), this presentation contains certain non-GAAP financial measures. The Company believes that providing certain non-GAAP financial measures provides investors with information useful in understanding our financial performance, performance trends and financial position. Our management uses these measures for internal planning and forecasting purposes and we believe that our presentation and discussion, together with the accompanying reconciliations, allows investors, security analysts and other interested parties to view our performance and the factors and trends affecting our business in a manner similar to management. These non-GAAP measures should not be considered a substitute for GAAP measures and we strongly encourage investors to review our consolidated financial statements in their entirety and not to rely on any single financial measure to evaluate the Company. Non-GAAP financial measures have inherent limitations, are not uniformly applied and are not audited. Because non-GAAP financial measures are not standardized, it may not be possible to compare these financial measures with other companies’ non-GAAP financial measures having the same or similar names. The delivery of this Investor Presentation will not, under any circumstances, create an implication that there has been no change in the affairs of the Company since the date of this Investor Presentation. The Company is not making any implied or express representation or warranty as to the accuracy or completeness of the information summarized herein or made available in connection with any further investigation of the Company. The Company expressly disclaims any and all liability which may be based on such information, errors therein or omission therefrom. 3
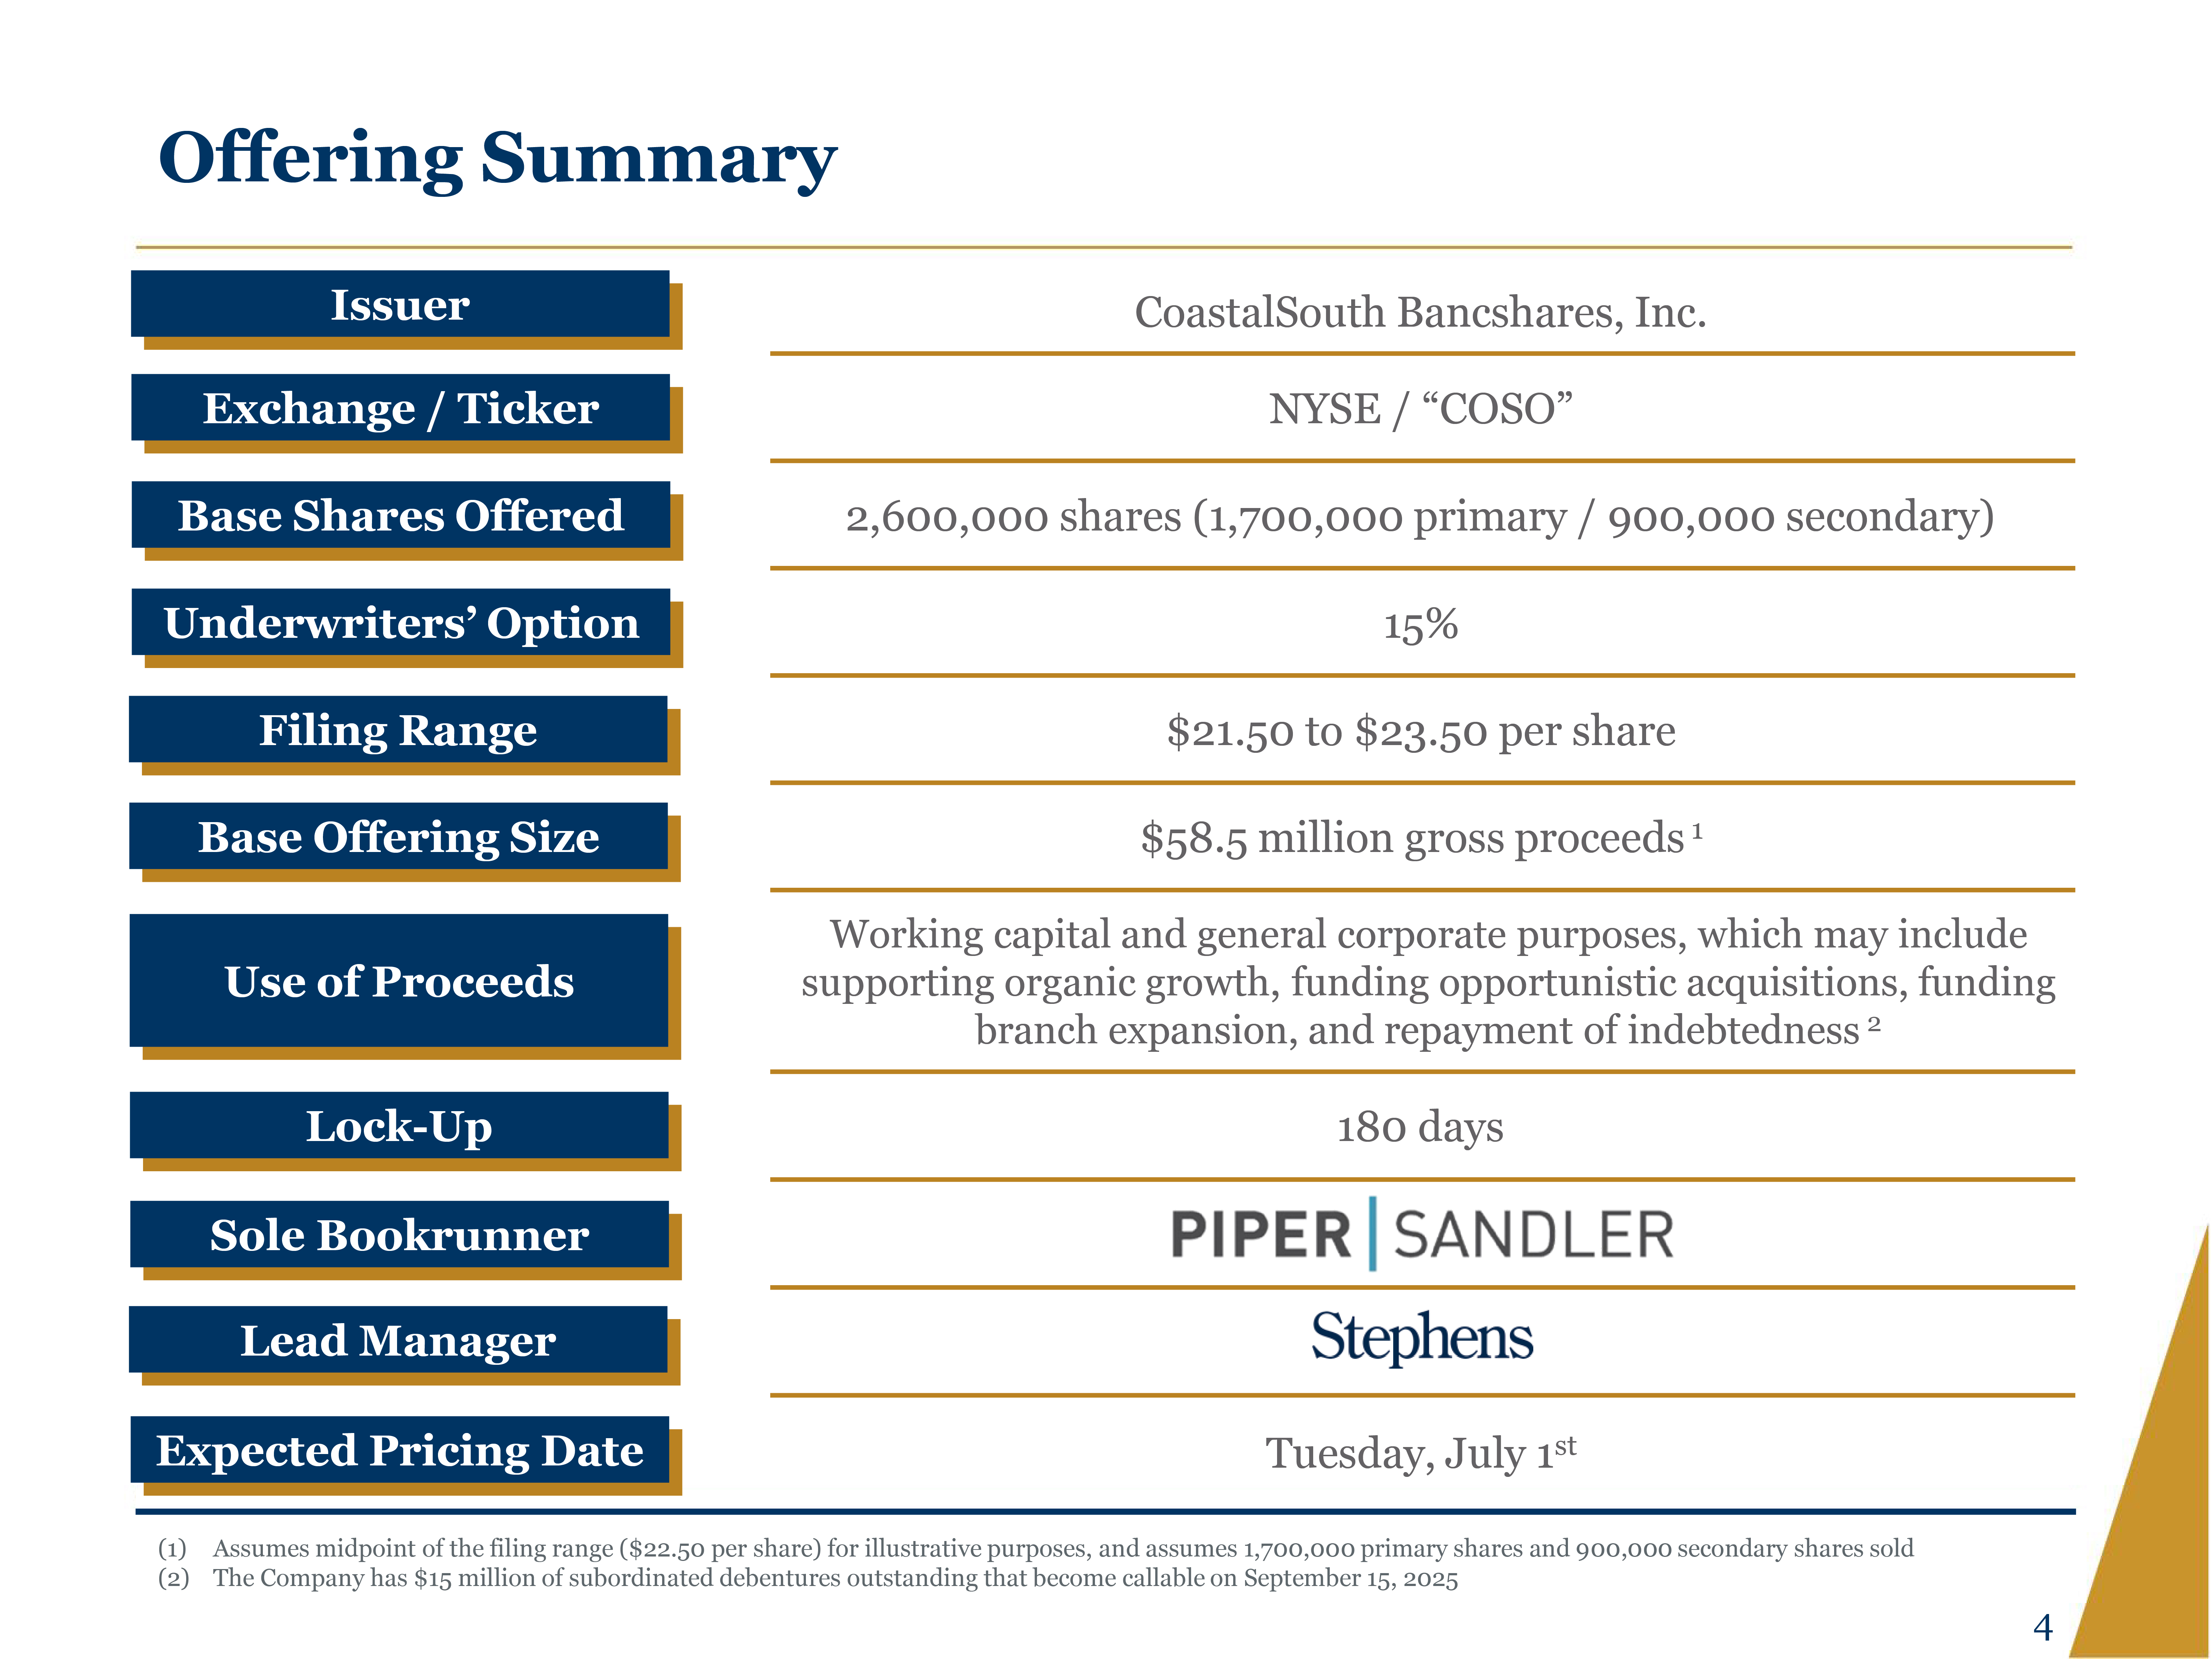
Offering Summary Issuer CoastalSouth Bancshares, Inc. Exchange / Ticker NYSE / “COSO” Base Shares Offered 2,600,000 shares (1,700,000 primary / 900,000 secondary) Underwriters’ Option 15% Filing Range $21.50 to $23.50 per share Base Offering Size $58.5 million gross proceeds1 Use of Proceeds Working capital and general corporate purposes, which may include supporting organic growth, funding opportunistic acquisitions, funding branch expansion, and repayment of indebtedness2 Lock-Up 180 days Sole Bookrunner PIPER | SANDLER Lead Manager Stephens Expected Pricing Date Tuesday, July 1st (1) Assumes midpoint of the filing range ($22.50 per share) for illustrative purposes, and assumes 1,700,000 primary shares and 900,000 secondary shares sold (2) The Company has $15 million of subordinated debentures outstanding that become callable on September 15, 2025 4
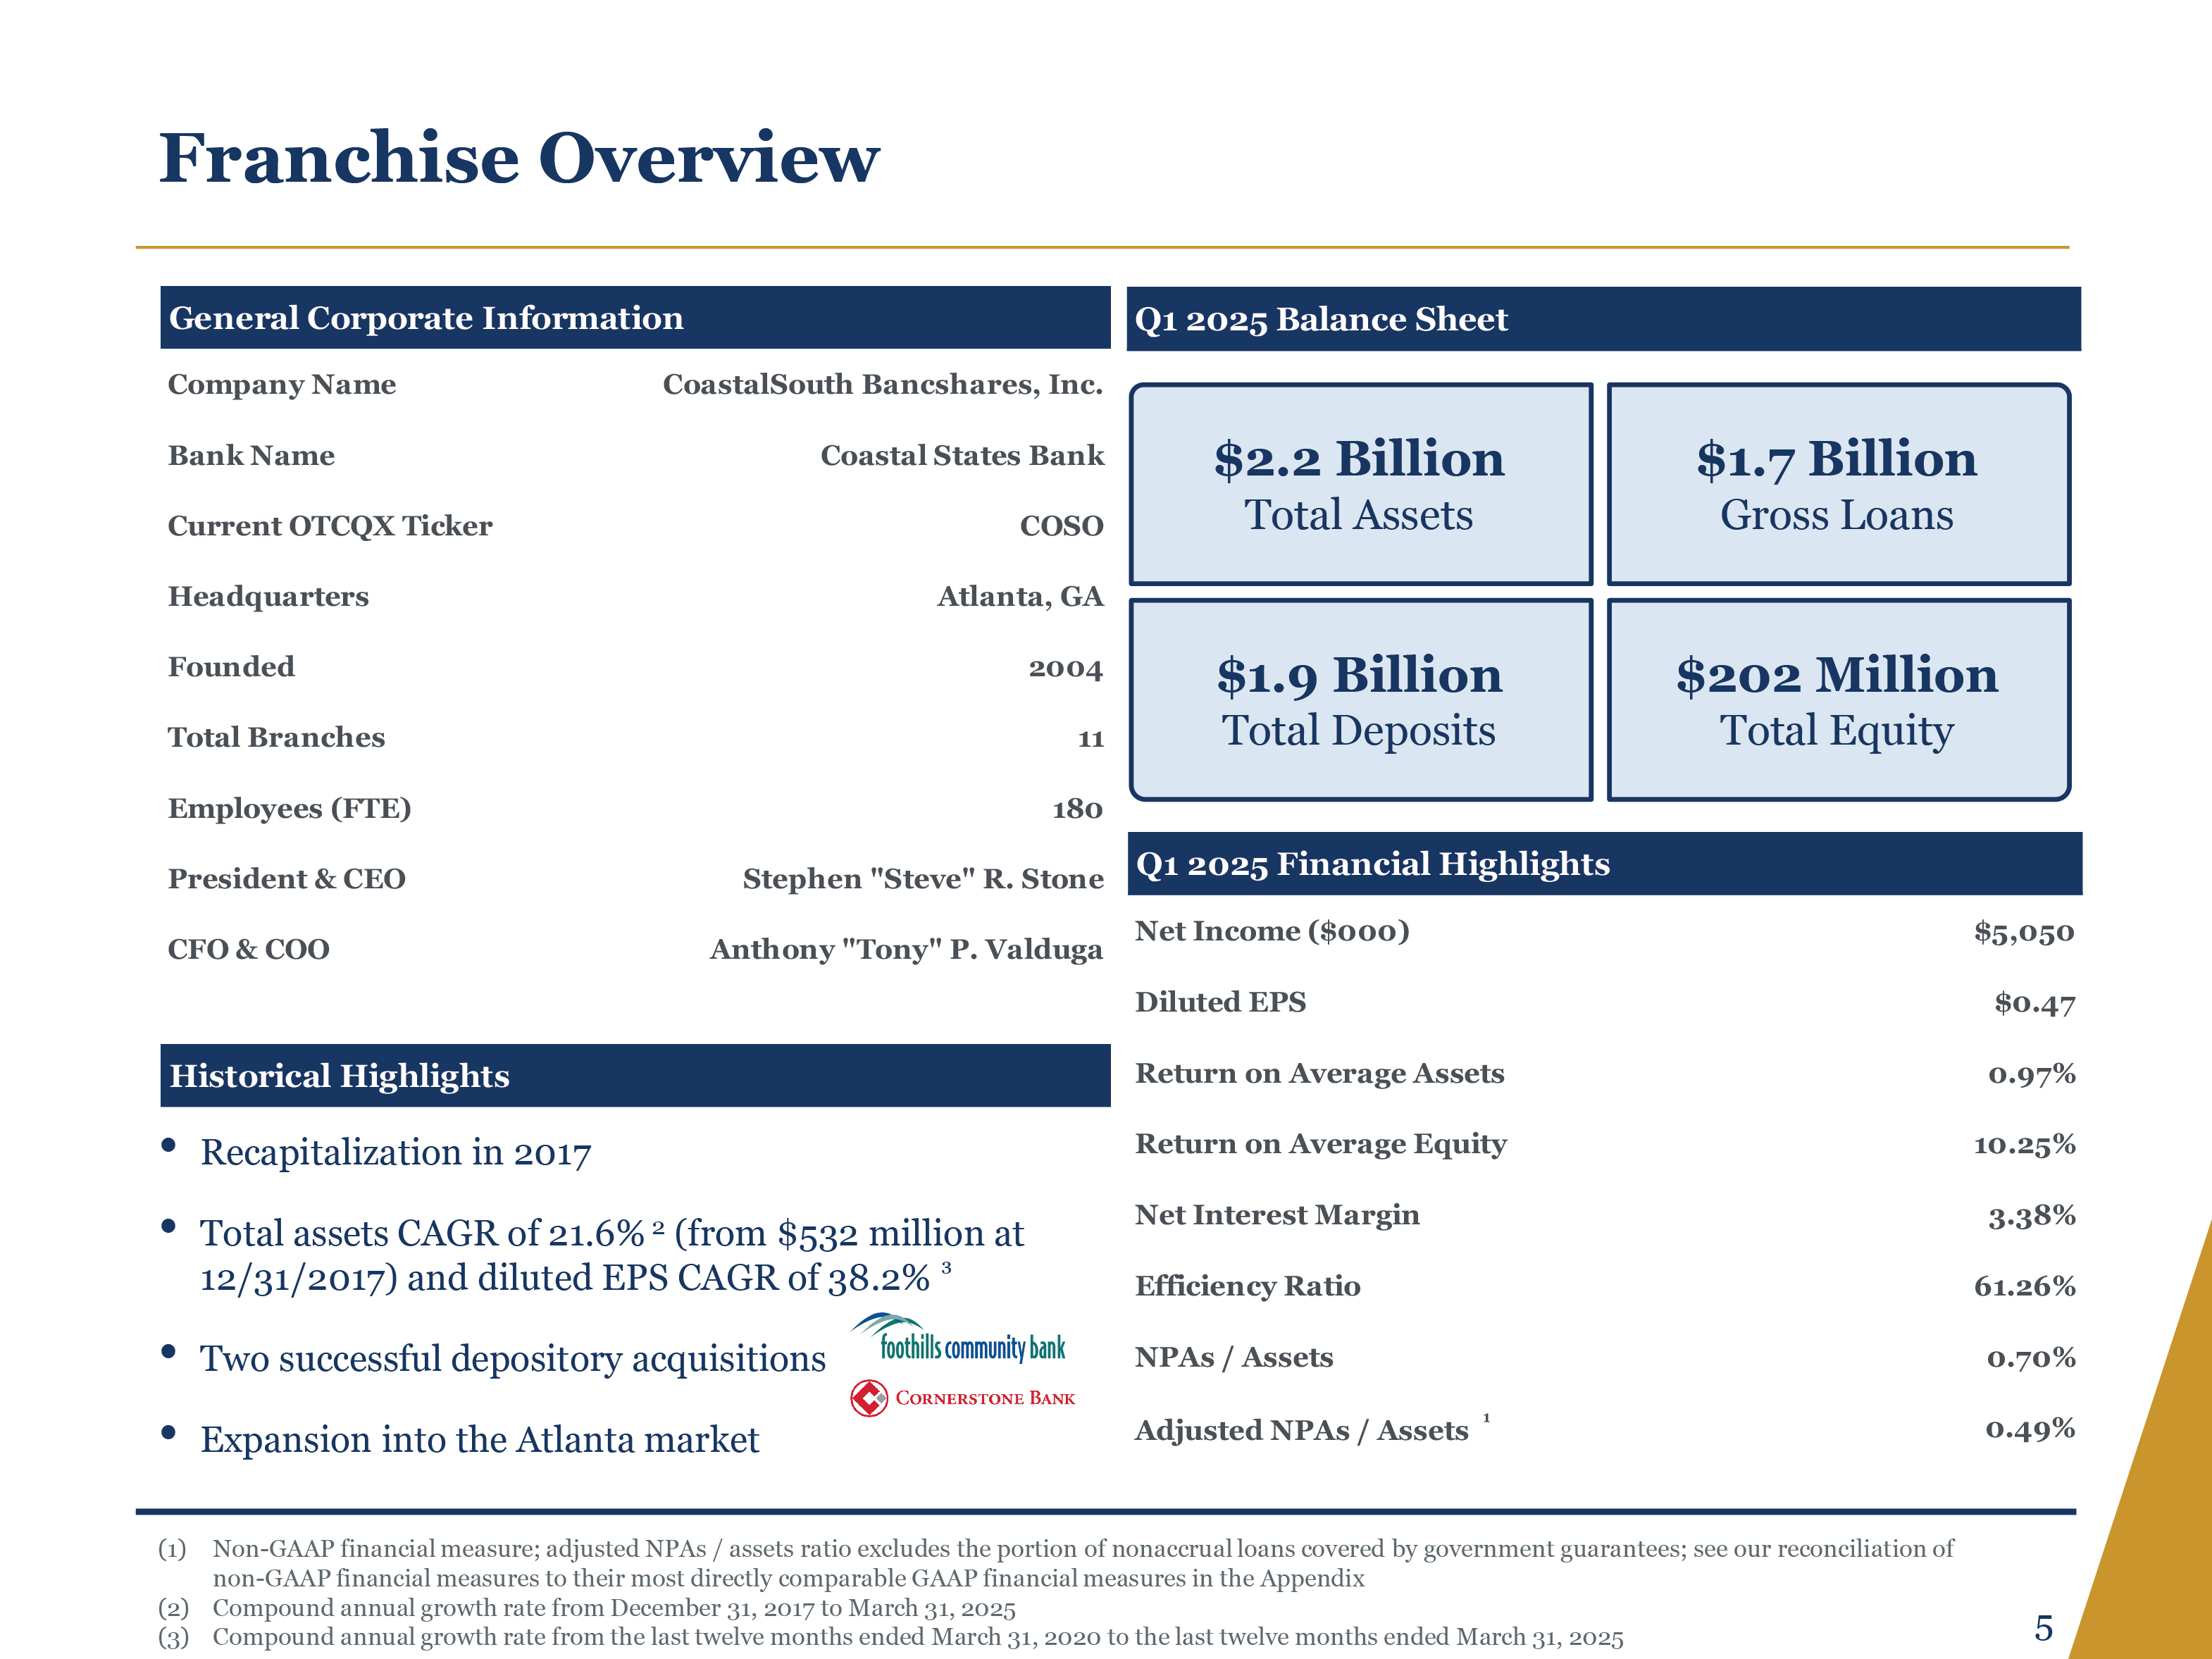
Franchise Overview General Corporate Information Company Name CoastalSouth Bancshares, Inc. Bank Name Coastal States Bank Current OTCQX Ticker COSO Headquarters Atlanta, GA Founded 2004 Total Branches 11 Employees (FTE) 180 President & CEO Stephen "Steve" R. Stone CFO & COO Anthony "Tony" P. Valduga Q1 2025 Balance Sheet $2.2 Billion Total Assets $1.7 Billion Gross Loans $1.9 Billion Total Deposits $202 Million Total Equity Historical Highlights Recapitalization in 2017 Total assets CAGR of 21.6% 2 (from $532 million at 12/31/2017) and diluted EPS CAGR of 38.2% ³ Two successful depository acquisitions Expansion into the Atlanta market Logo Q1 2025 Financial Highlights Net Income ($ooo) $5,050 Diluted EPS $0.47 Return on Average Assets 0.97% Return on Average Equity 10.25% Net Interest Margin 3.38% Efficiency Ratio 61.26% NPAs / Assets 0.70% Adjusted NPAs / Assets1 0.49% (1) Non-GAAP financial measure; adjusted NPAs / assets ratio excludes the portion of nonaccrual loans covered by government guarantees; see our reconciliation of non-GAAP financial measures to their most directly comparable GAAP financial measures in the Appendix (2) Compound annual growth rate from December 31, 2017 to March 31, 2025 (3) Compound annual growth rate from the last twelve months ended March 31, 2020 to the last twelve months ended March 31, 2025 5
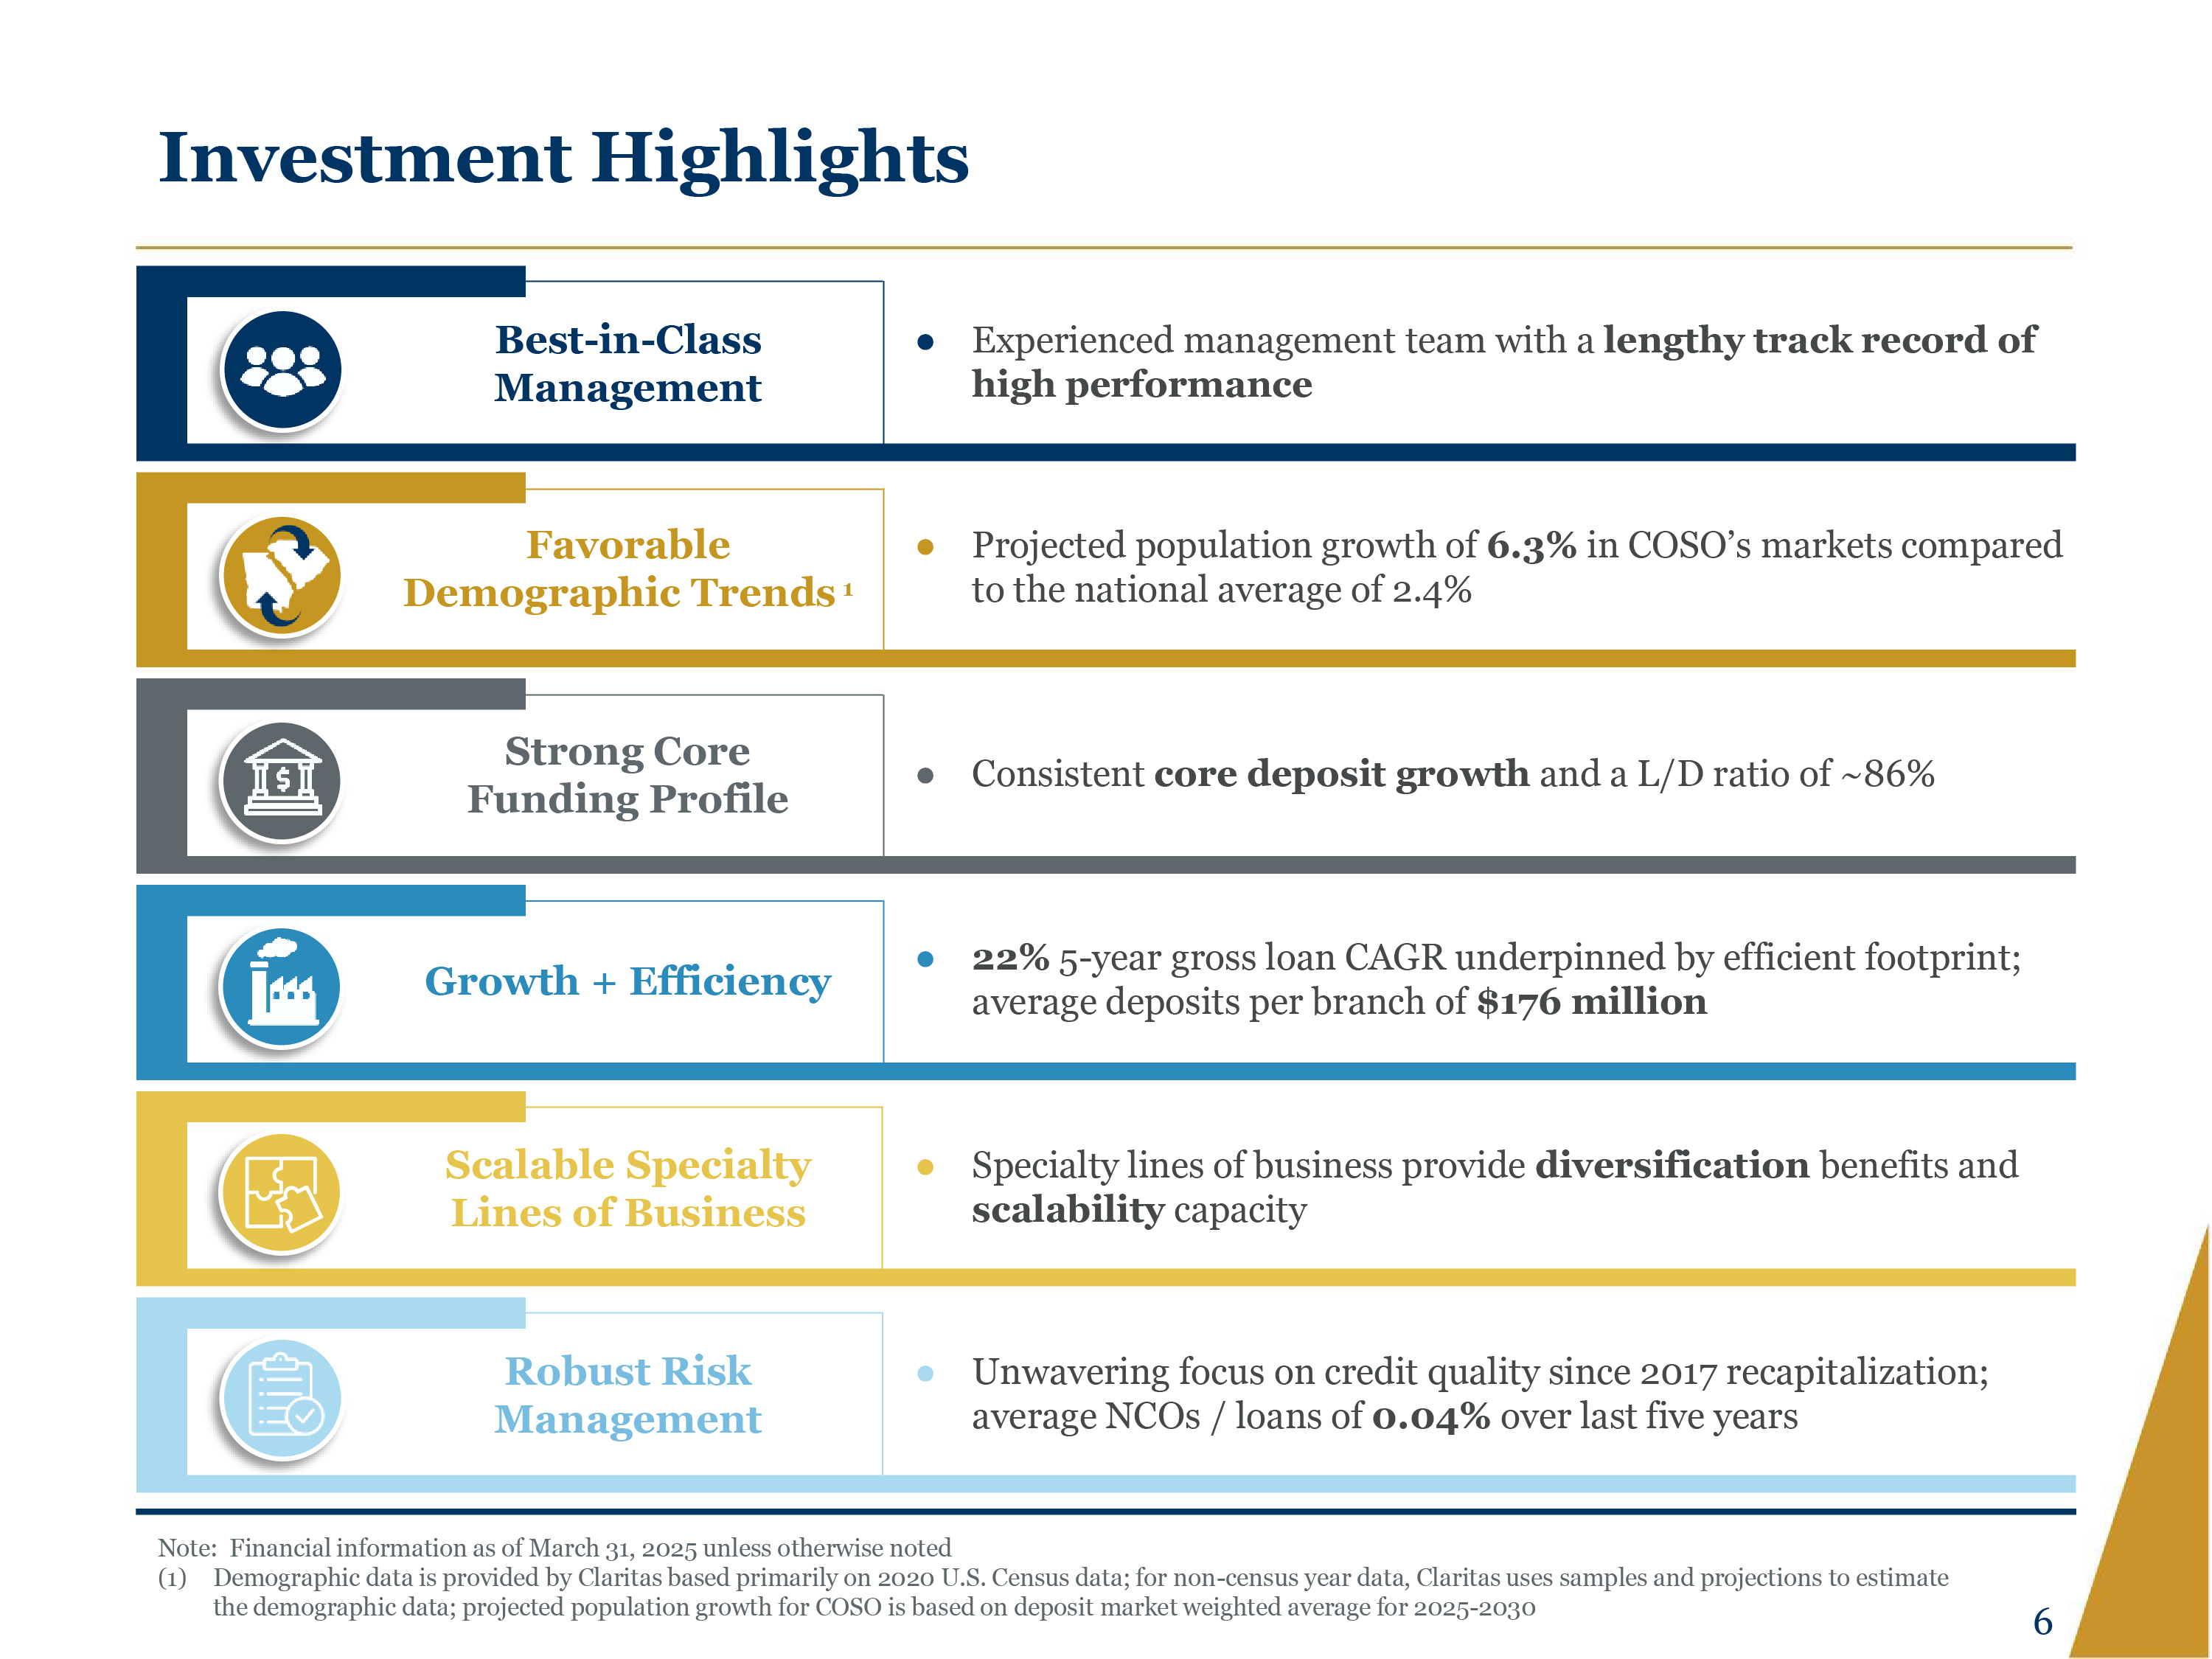
Investment Highlights Logo Best-in-Class Management Experienced management team with a lengthy track record of high performance Favorable Demographic Trends 1 Projected population growth of 6.3% in COSO’s markets compared to the national average of 2.4% Strong Core Funding Profile Consistent core deposit growth and a L/D ratio of ~86% Growth + Efficiency 22% 5-year gross loan CAGR underpinned by efficient footprint; average deposits per branch of $176 million Scalable Specialty Lines of Business Specialty lines of business provide diversification benefits and scalability capacity Robust Risk Management Unwavering focus on credit quality since 2017 recapitalization; average NCOs / loans of 0.04% over last five years Note: Financial information as of March 31, 2025 unless otherwise noted (1) Demographic data is provided by Claritas based primarily on 2020 U.S. Census data; for non-census year data, Claritas uses samples and projections to estimate the demographic data; projected population growth for COSO is based on deposit market weighted average for 2025-2030 6
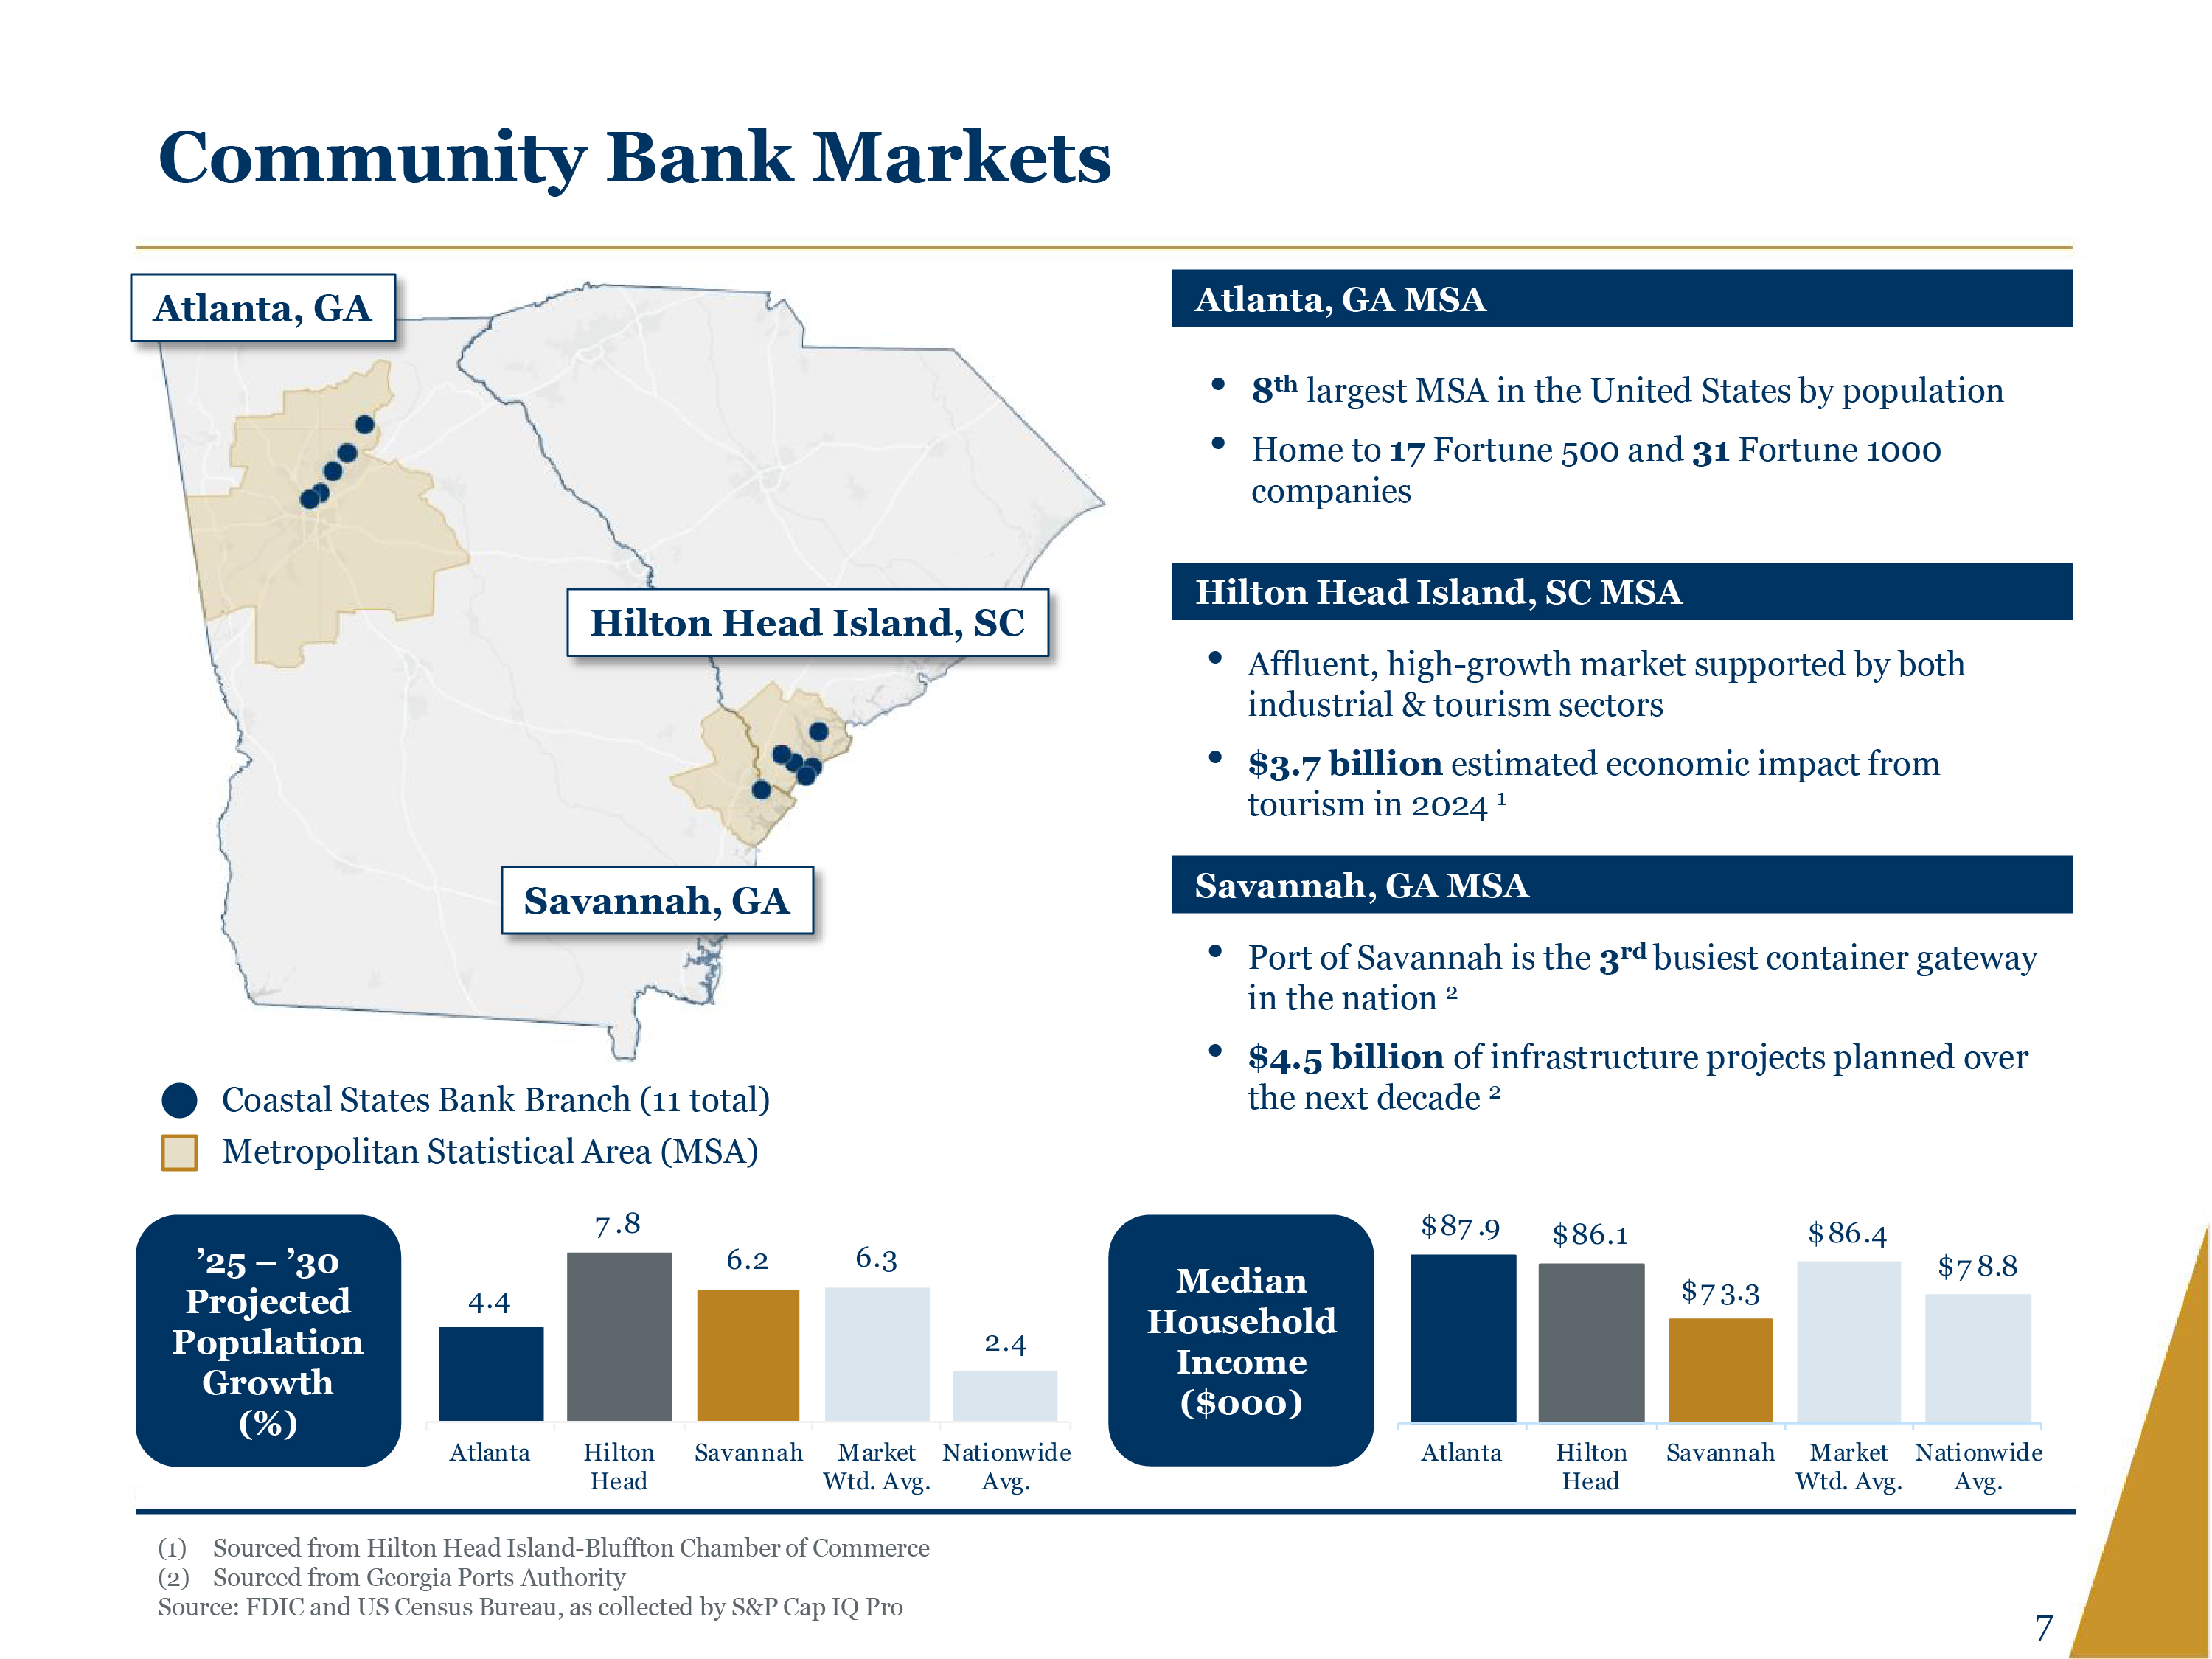
Community Bank Markets Atlanta, GA Hilton Head Island, SC Savannah, GA Coastal States Bank Branch (11 total) Metropolitan Statistical Area (MSA) ’25 – ’30 Projected Population Growth (%) Atlanta, GA MSA 8thlargest MSA in the United States by population Home to 17 Fortune 500 and 31 Fortune 1000 companies Hilton Head Island, SC MSA Affluent, high-growth market supported by both industrial & tourism sectors $3.7 billion estimated economic impact from tourism in 2024 1 Savannah, GA MSA Port of Savannah is the 3rd busiest container gateway in the nation 2 $4.5 billion of infrastructure projects planned over the next decade 2 4.4 Atlanta 7.8 Hilton Head 6.2 Savannah 6.3 Market Wgt. Avg. 2.4 Nationwide Avg. Median Household Income ($000) $87.9 Atlanta $86.1 Hilton Head $73.3 Savannah $86.4 Market Wgt. Avg. $78.8 Nationwide Avg. (1) Sourced from Hilton Head Island-Bluffton Chamber of Commerce (2) Sourced from Georgia Ports Authority Source: FDIC and US Census Bureau, as collected by S&P Cap IQ Pro 7
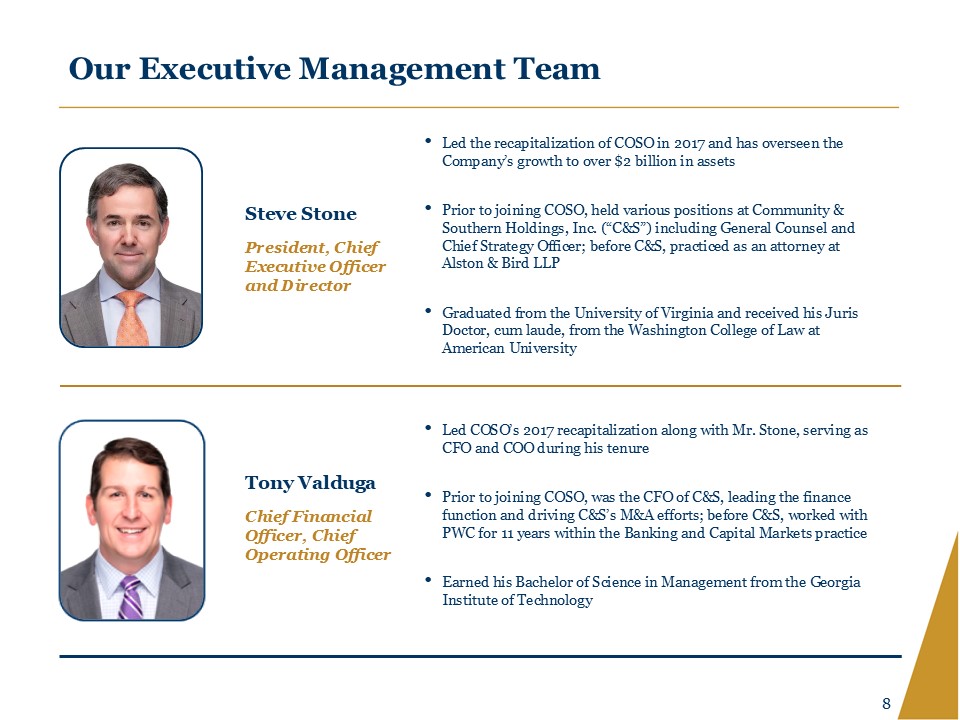
Our Executive Management Team Steve Stone President, Chief Executive Officer and Director Led the recapitalization of COSO in 2017 and has overseen the Company’s growth to over $2 billion in assets Prior to joining COSO, held various positions at Community & Southern Holdings, Inc. (“C&S”) including General Counsel and Chief Strategy Officer; before C&S, practiced as an attorney at Alston & Bird LLP Graduated from the University of Virginia and received his Juris Doctor, cum laude, from the Washington College of Law at American University Tony Valduga Chief Financial Officer, Chief Operating Officer Led COSO’s 2017 recapitalization along with Mr. Stone, serving as CFO and COO during his tenure Prior to joining COSO, was the CFO of C&S, leading the finance function and driving C&S’s M&A efforts; before C&S, worked with PWC for 11 years within the Banking and Capital Markets practice Earned his Bachelor of Science in Management from the Georgia Institute of Technology 8
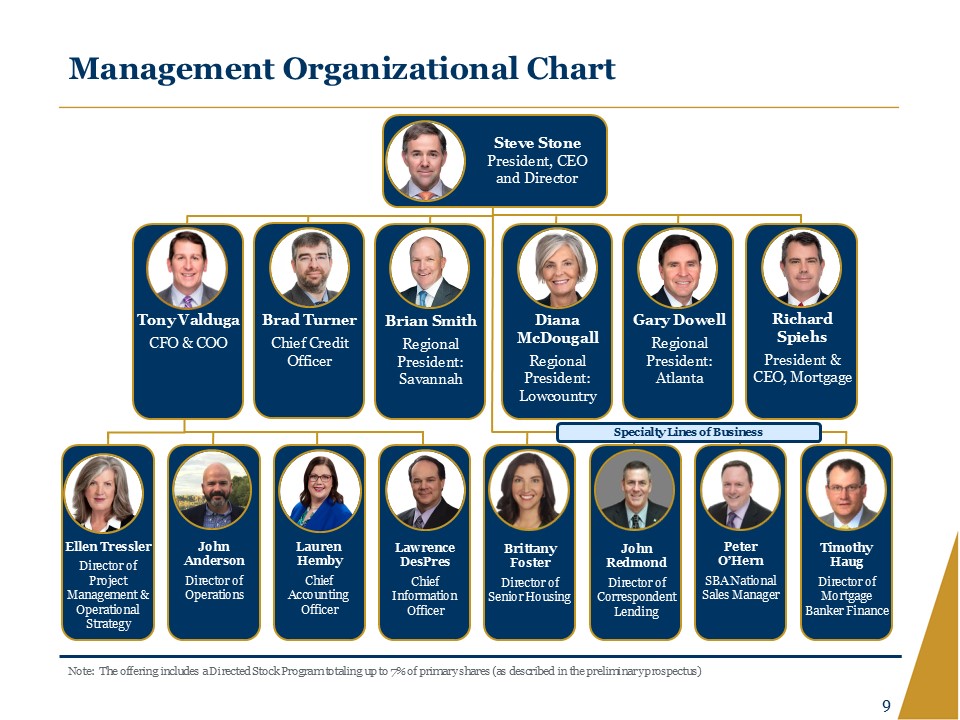
Management Organizational Chart Steve Stone President, CEO and Director Tony Valduga CFO & COO Brad Turner Chief Credit Officer Brian Smith Regional President: Savannah Diana McDougall Regional President: Lowcountry Gary Dowell Regional President: Atlanta Richard Spiehs President & CEO, Mortgage Specialty Lines of Business Ellen Tressler Director of Project Management & Operational Strategy John Anderson Director of Operations Lauren Hemby Chief Accounting Officer Lawrence DesPres Chief Information Officer Brittany Foster Director of Senior Housing John Redmond Director of Correspondent Lending Peter O’Hern SBA National Sales Manager Timothy Haug Director of Mortgage Banker Finance Note: The offering includes a Directed Stock Program totaling up to 7% of primary shares (as described in the preliminary prospectus) 9
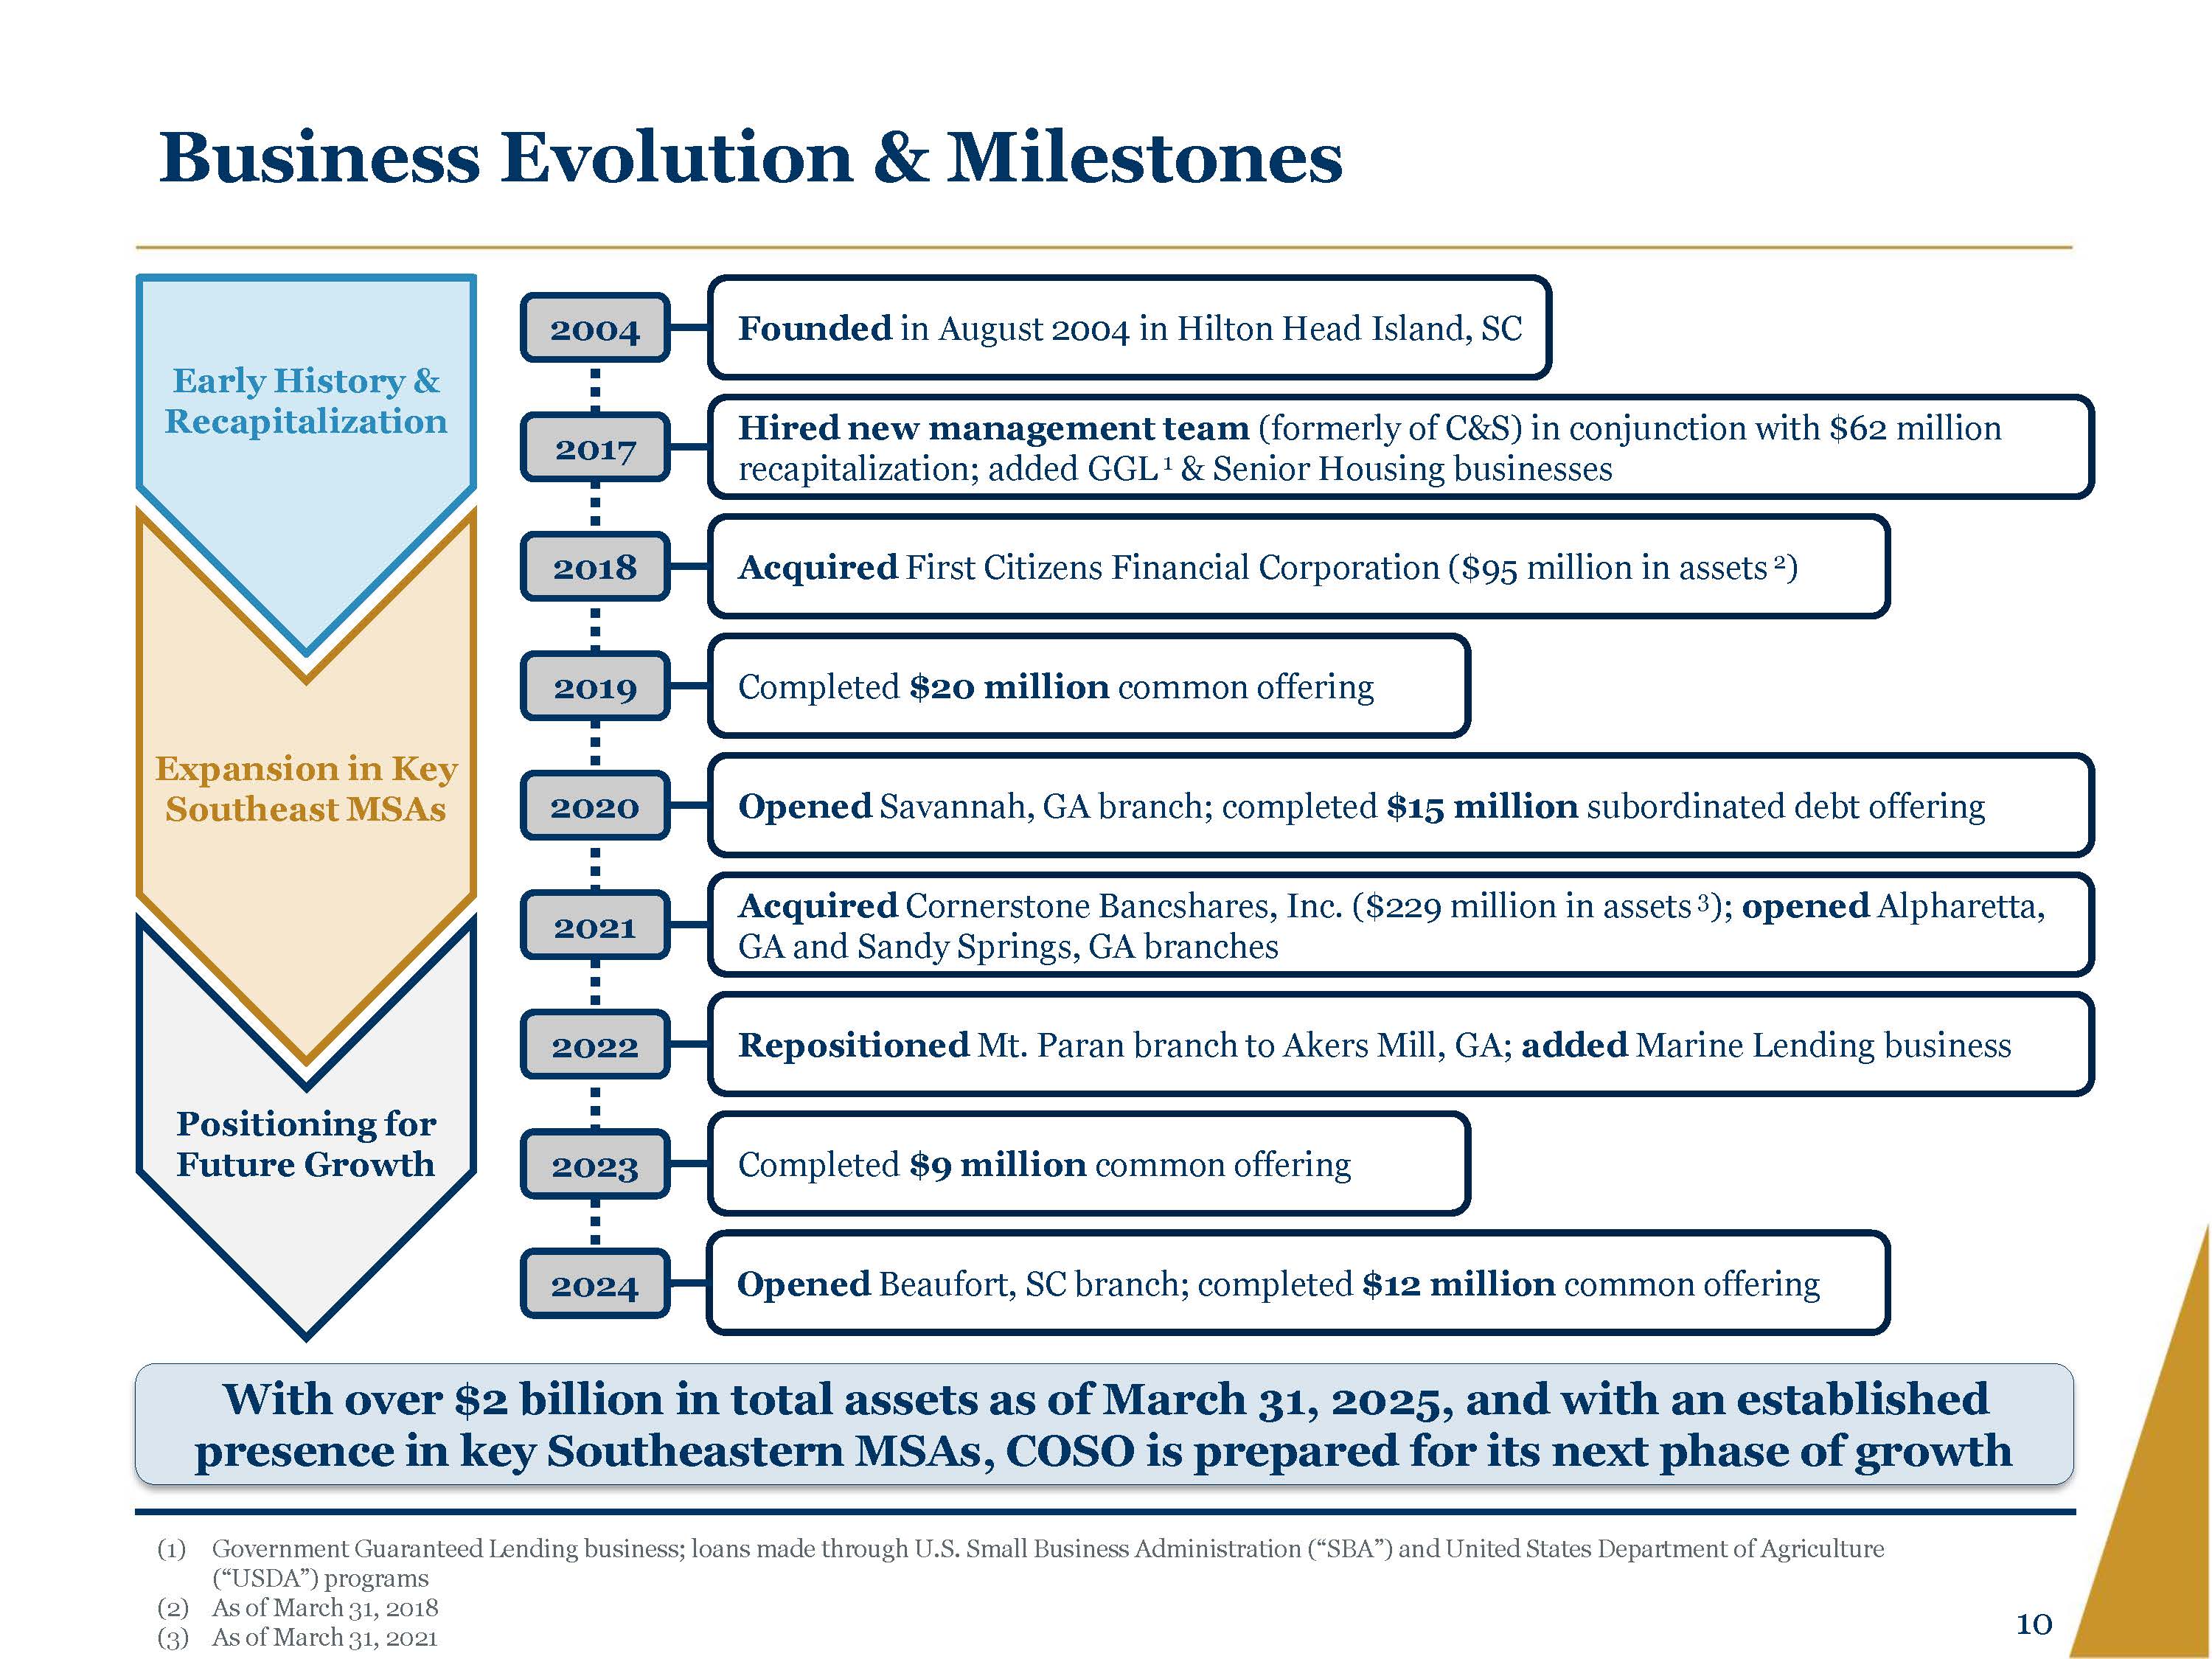
Business Evolution & Milestones Early History & Recapitalization Expansion in Key Southeast MSAs Positioning for Future Growth 2004 2017 2018 2019 2020 2021 2022 2023 2024 Founded in August 2004 in Hilton Head Island, SC Hired new management team (formerly of C&S) in conjunction with $62 million recapitalization; added GGL 1 & Senior Housing businesses Acquired First Citizens Financial Corporation ($95 million in assets 2) Completed $20 million common offering Opened Savannah, GA branch; completed $15 million subordinated debt offering Acquired Cornerstone Bancshares, Inc. ($229 million in assets 3); opened Alpharetta, GA and Sandy Springs, GA branches Repositioned Mt. Paran branch to Akers Mill, GA; added Marine Lending business Completed $9 million common offering Opened Beaufort, SC branch; completed $12 million common offering With over $2 billion in total assets as of March 31, 2025, and with an established presence in key Southeastern MSAs, COSO is prepared for its next phase of growth (1) Government Guaranteed Lending business; loans made through U.S. Small Business Administration (“SBA”) and United States Department of Agriculture (“USDA”) programs (2) As of March 31, 2018 (3) As of March 31, 2021 10
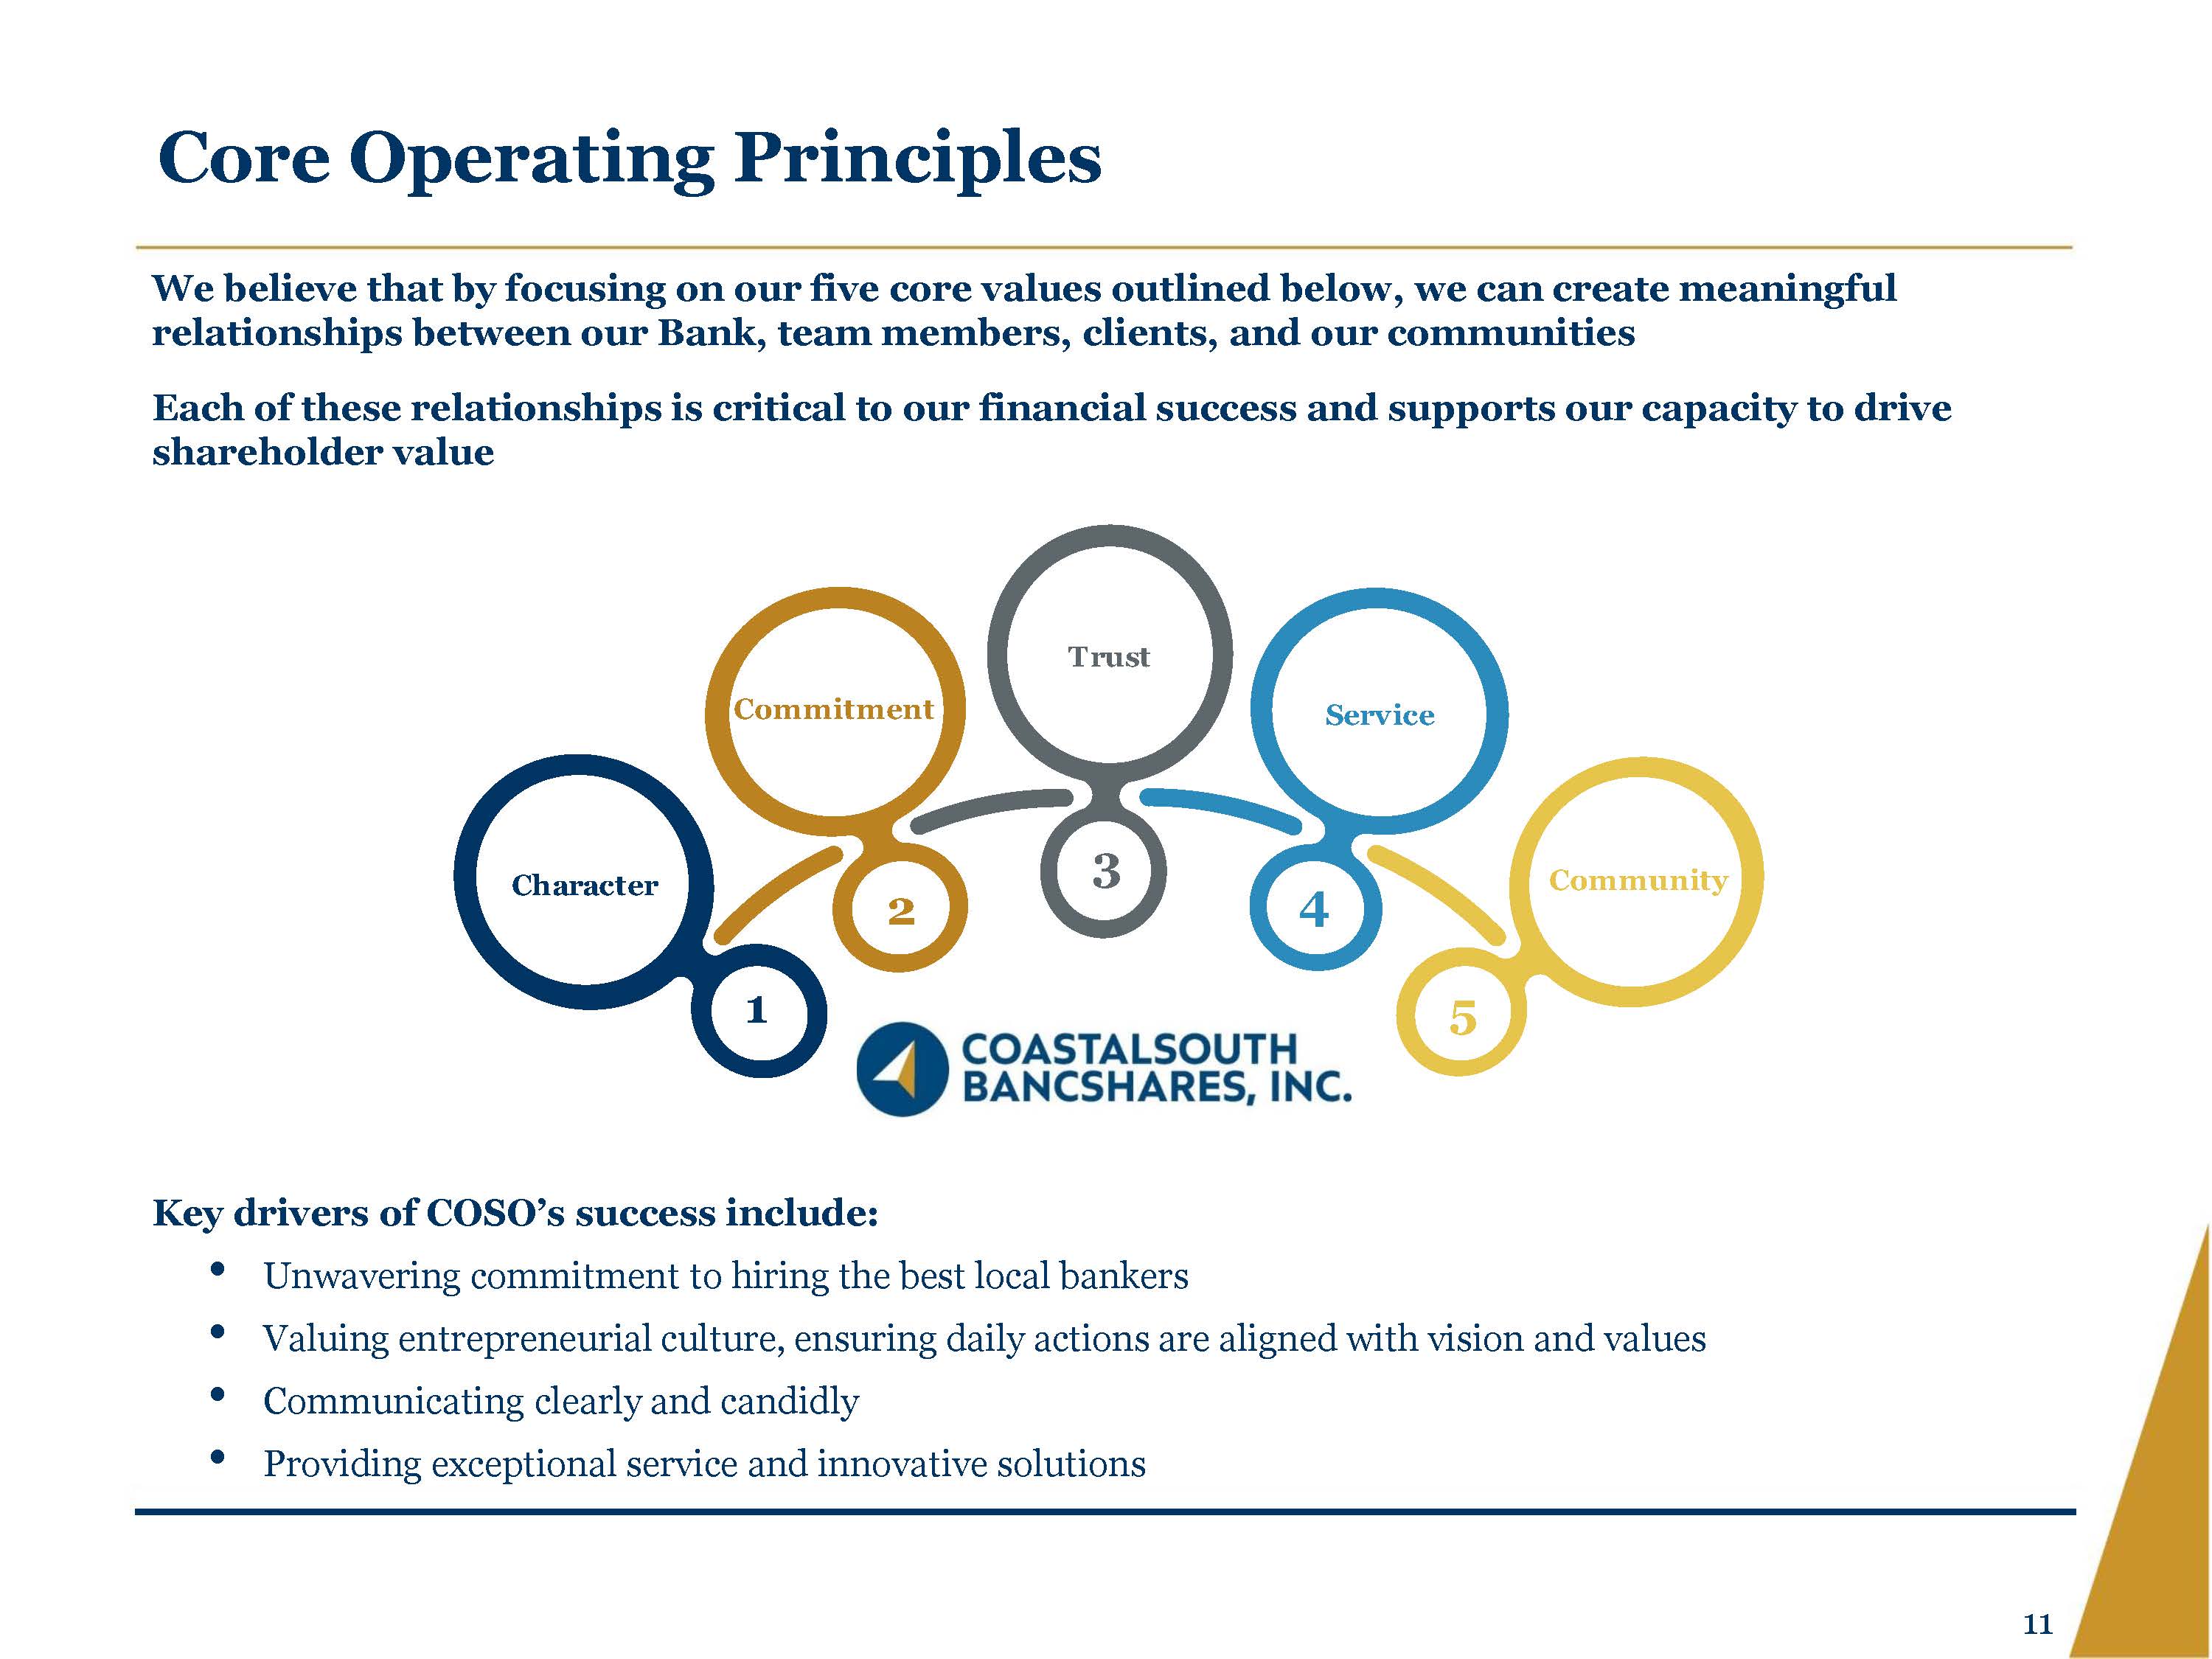
Core Operating Principles We believe that by focusing on our five core values outlined below, we can create meaningful relationships between our Bank, team members, clients, and our communities Each of these relationships is critical to our financial success and supports our capacity to drive shareholder value Character Commitment Trust Service Community Coastalsouth Bancshares, inc Key drivers of COSO’s success include: Unwavering commitment to hiring the best local bankers Valuing entrepreneurial culture, ensuring daily actions are aligned with vision and values Communicating clearly and candidly Providing exceptional service and innovative solutions 11
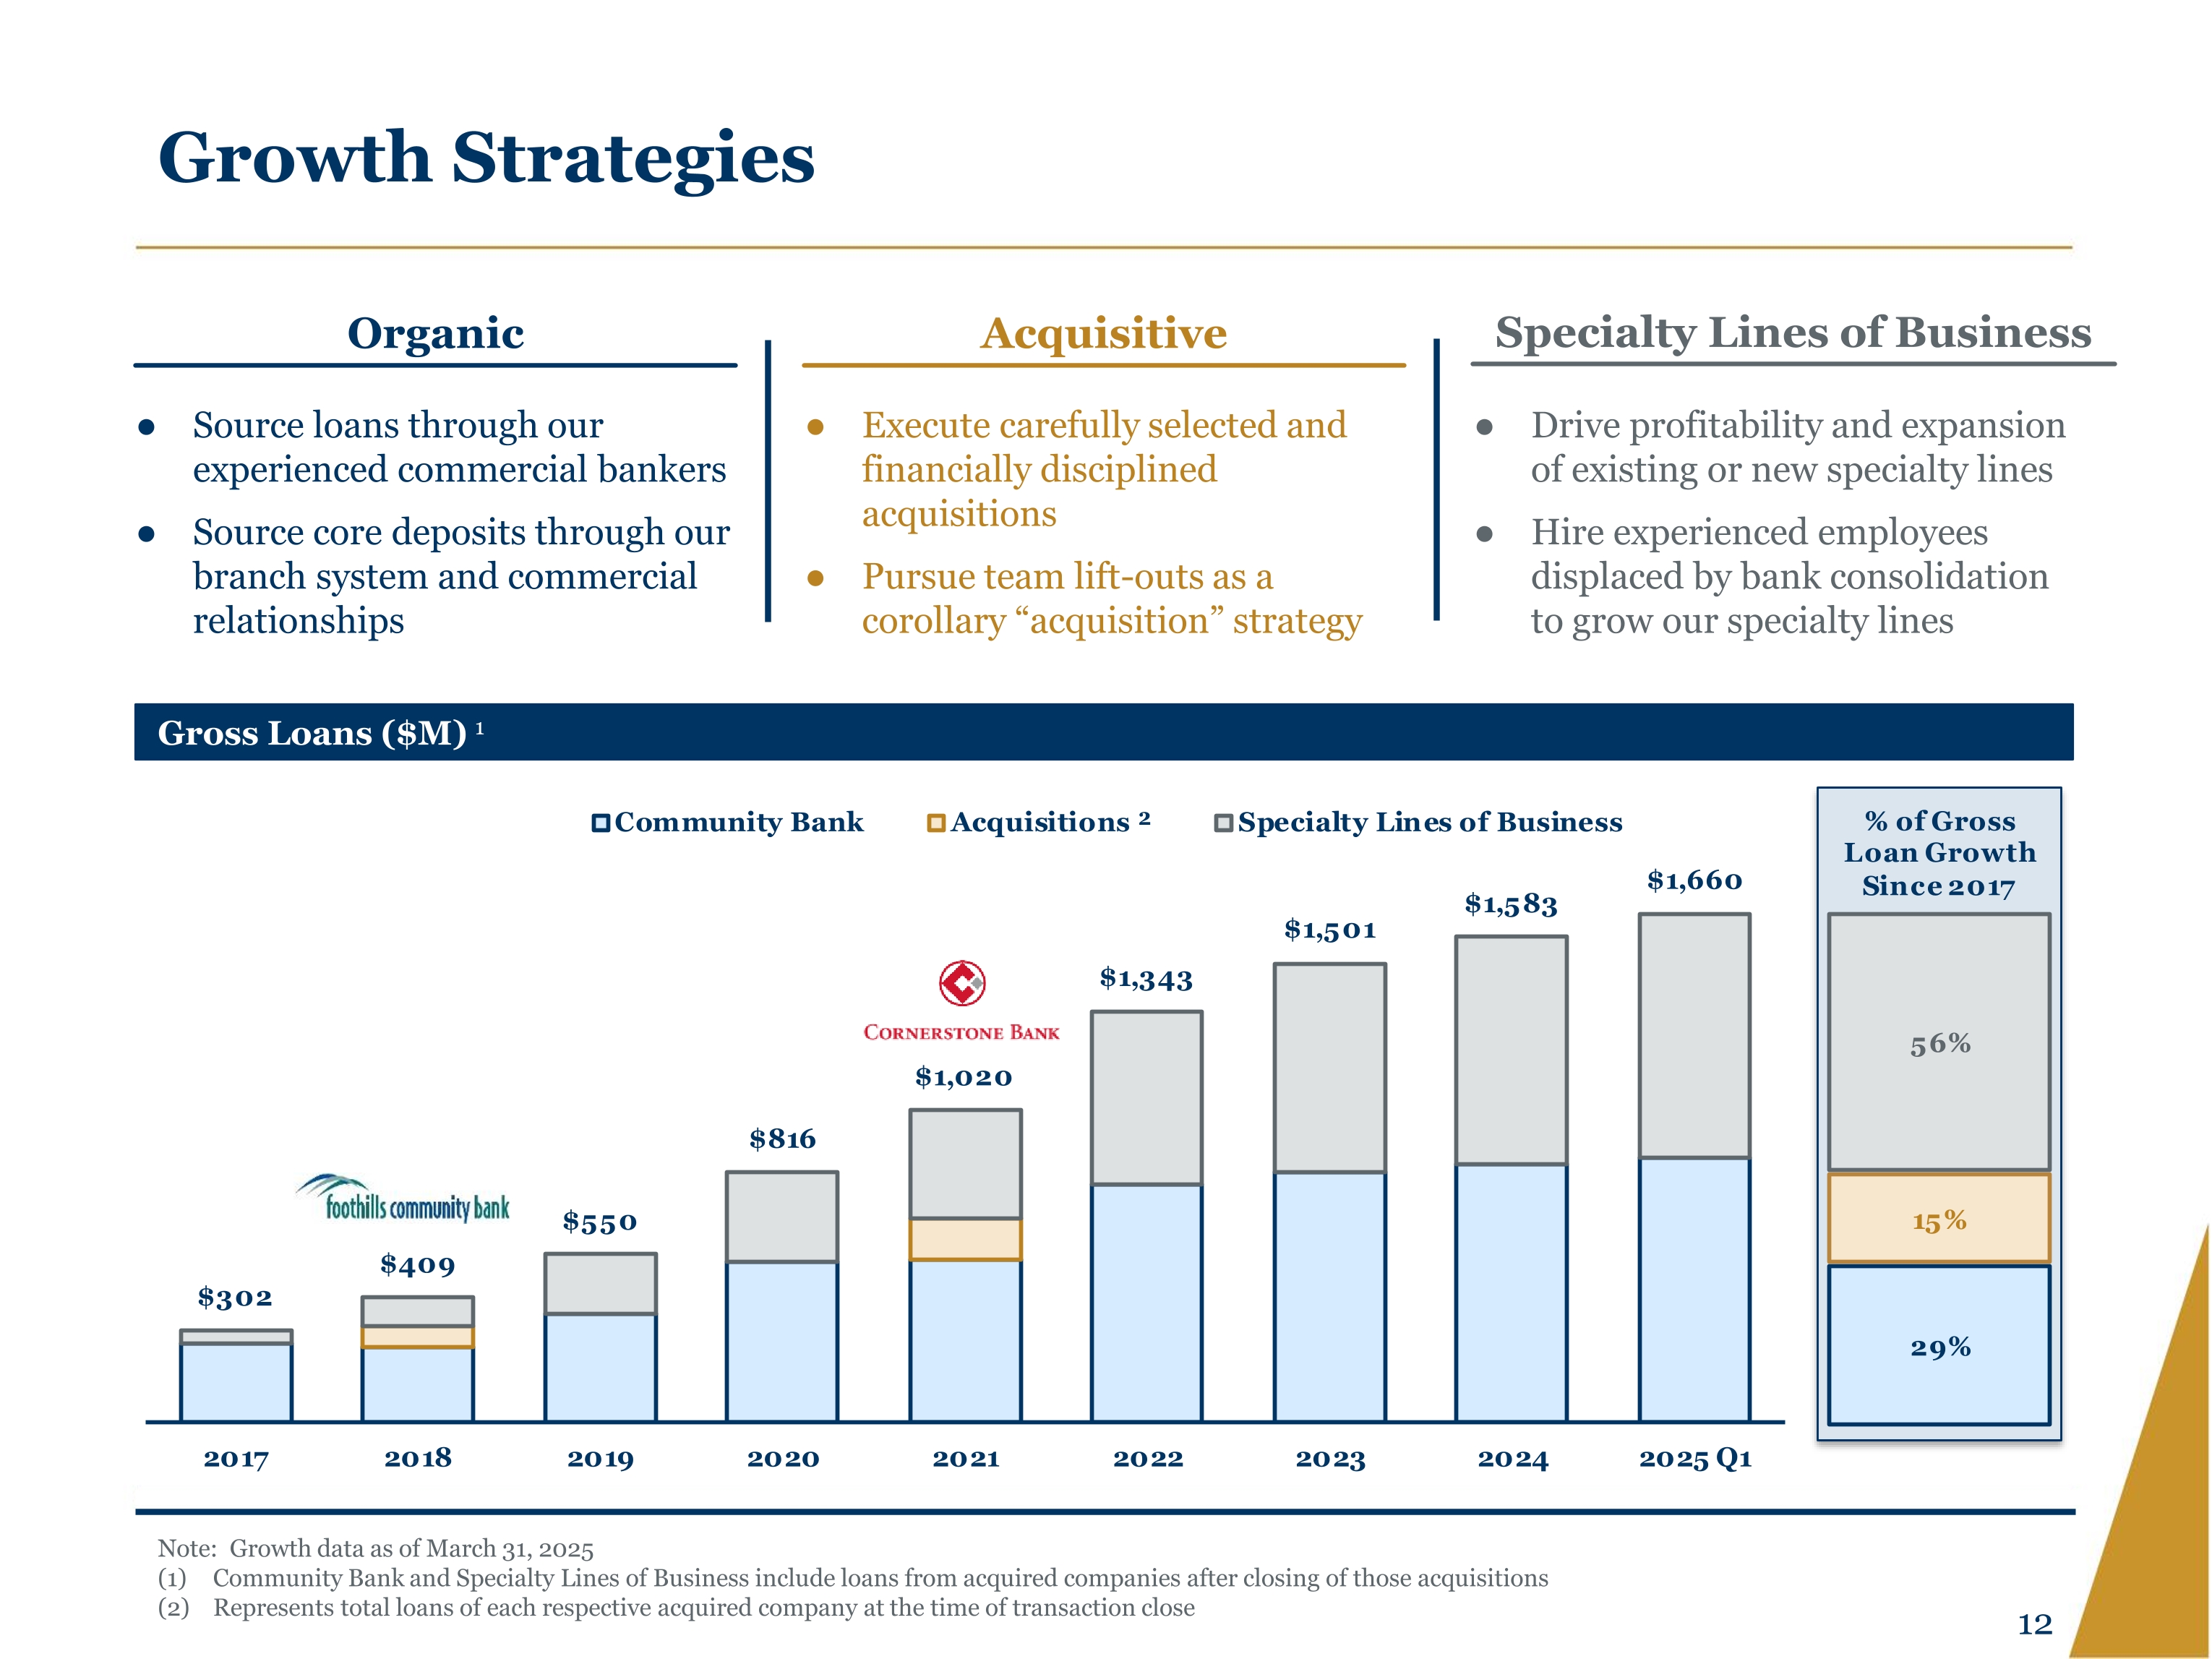
Growth Strategies Organic Source loans through our experienced commercial bankers Source core deposits through our branch system and commercial relationships Acquisitive Execute carefully selected and financially disciplined acquisitions Pursue team lift-outs as a corollary “acquisition” strategy Specialty Lines of Business Drive profitability and expansion of existing or new specialty lines Hire experienced employees displaced by bank consolidation to grow our specialty lines Gross Loans ($M) 1 Community Bank Acquisitions 2 Specialty Lines Business $302 $409 $550 $816 $1,020 $1,343 $1,583 $1,660 2017 2018 2019 2020 2021 2022 2023 2024 2025Q1 % of gross loan growth Since 2017 56% 15% 29% Cornerstone Bank Note: Growth data as of March 31, 2025 (1) Community Bank and Specialty Lines of Business include loans from acquired companies after closing of those acquisitions (2) Represents total loans of each respective acquired company at the time of transaction close 12
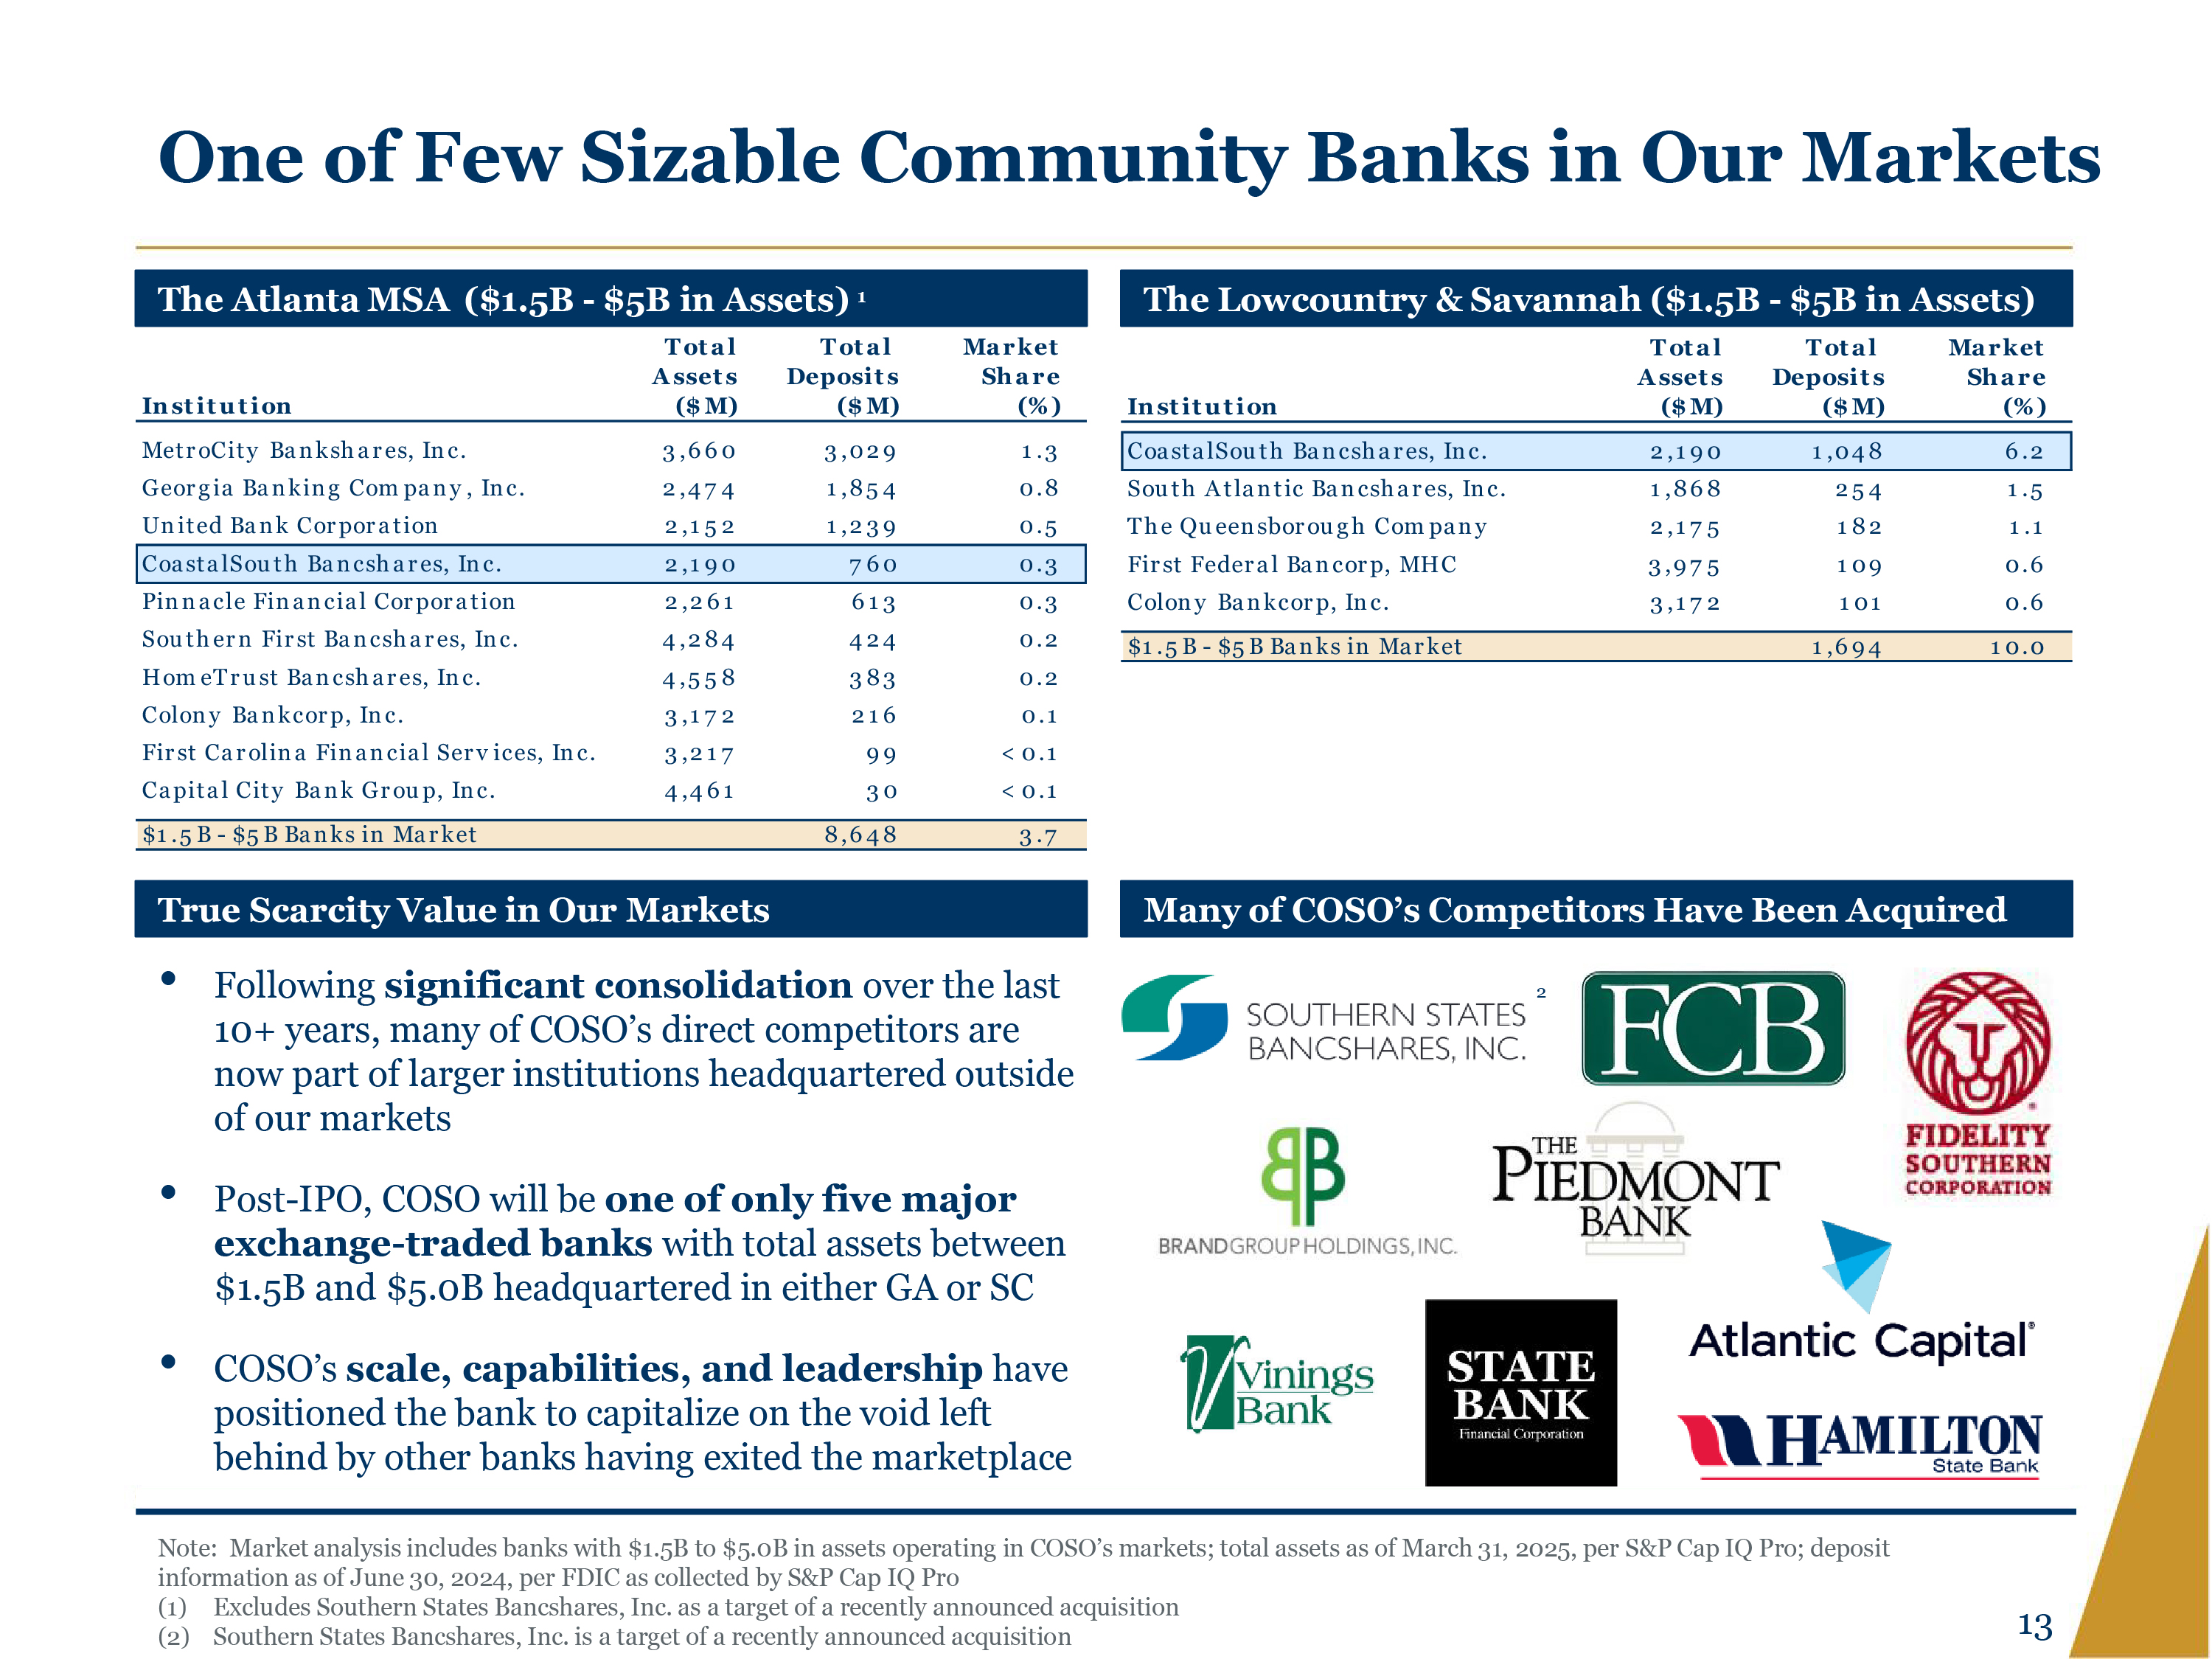
One of Few Sizable Community Banks in Our Markets 1 The Atlanta MSA ($1.5B - $5B in Assets) 1 The Lowcountry & Savannah ($1.5B - $5B in Assets) Total Assets Institution ($M) Total Deposits ($M) Market Share (%) Total Assets Total Deposits Market Share Institution ($M) ($M) (%) MetroCity Bankshares, Inc. 3,660 3,029 1.3 Georgia Banking Company, Inc. 2,474 1,854 0.8 CoastalSouth Bancshares, Inc. South Atlantic Bancshares, Inc. 2,190 1,048 6.2 1,868 254 1.5 United Bank Corporation 2,152 1,239 0.5 The Queensborough Company 2,175 182 1.1 Coastal South Bancshares, Inc. 2,190 760 0.3 First Federal Bancorp, MHC 3,975 109 0.6 Pinnacle Financial Corporation 2,261 613 0.3 Colony Bankcorp, Inc. 3,172 101 0.6 Southern First Bancshares, Inc. 4,284 424 0.2 $1.5 B-$5B Banks in Market 1,694 10.0 HomeTrust Bancshares, Inc. 4,558 383 0.2 Colony Bankcorp, Inc. 3,172 216 0.1 First Carolina Financial Services, Inc. 3,217 99 < 0.1 Capital City Bank Group, Inc. 4,461 30 < 0.1 - $1.5B $5B Banks in Market 8,648 3.7 True Scarcity Value in Our Markets • Following significant consolidation over the last 10+ years, many of COSO's direct competitors are now part of larger institutions headquartered outside of our markets Post-IPO, COSO will be one of only five major exchange-traded banks with total assets between $1.5B and $5.0B headquartered in either GA or SC COSO's scale, capabilities, and leadership have positioned the bank to capitalize on the void left behind by other banks having exited the marketplace Many of COSO's Competitors Have Been Acquired SOUTHERN STATES BANCSHARES, INC. &B BRANDGROUP HOLDINGS, INC. V Vinings Bank 2 THE FCB PIEDMONT BANK STATE BANK Financial Corporation FIDELITY SOUTHERN CORPORATION Atlantic Capital HAMILTON State Bank Note: Market analysis includes banks with $1.5B to $5.0B in assets operating in COSO's markets; total assets as of March 31, 2025, per S&P Cap IQ Pro; deposit information as of June 30, 2024, per FDIC as collected by S&P Cap IQ Pro (1) Excludes Southern States Bancshares, Inc. as a target of a recently announced acquisition (2) Southern States Bancshares, Inc. is a target of a recently announced acquisition 13
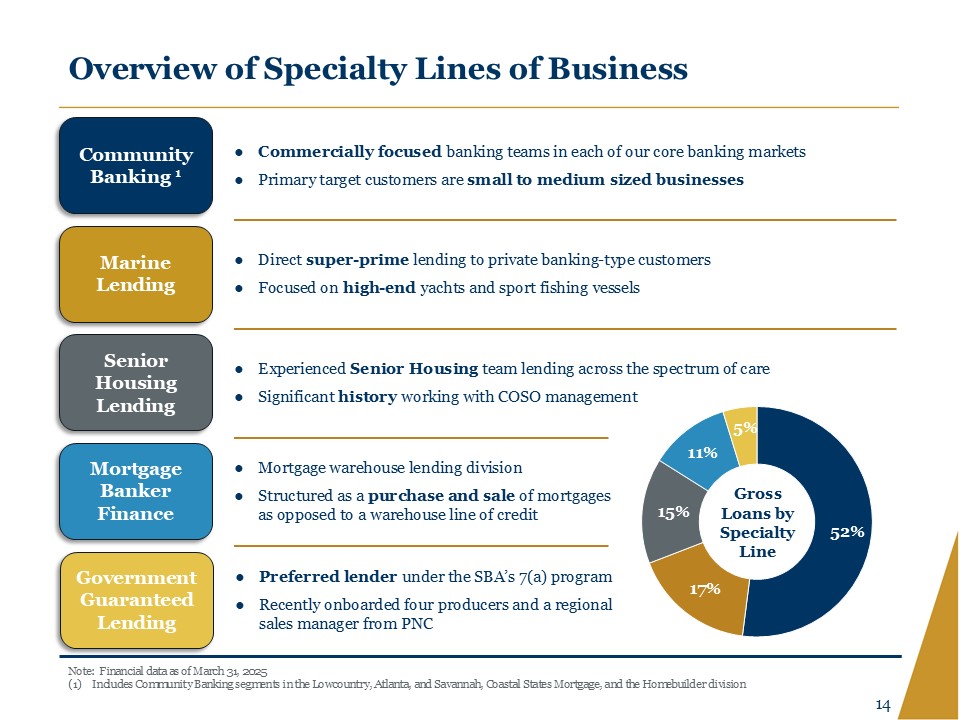
Overview of Specialty Lines of Business Community Banking 1 Commercially focused banking teams in each of our core banking markets Primary target customers are small to medium sized businesses Marine Lending Direct super-prime lending to private banking-type customers Focused on high-end yachts and sport fishing vessels Senior Housing Lending Experienced Senior Housing team lending across the spectrum of care Significant history working with COSO management Mortgage Banker Finance Mortgage warehouse lending division Structured as a purchase and sale of mortgages as opposed to a warehouse line of credit Government Guaranteed Lending Preferred lender under the SBA’s 7(a) program Recently onboarded four producers and a regional sales manager from PNC Gross Loans by Specialty Line 52% 17% 15% 11% 5% Note: Financial data as of March 31, 2025 (1) Includes Community Banking segments in the Lowcountry, Atlanta, and Savannah, Coastal States Mortgage, and the Homebuilder division 14
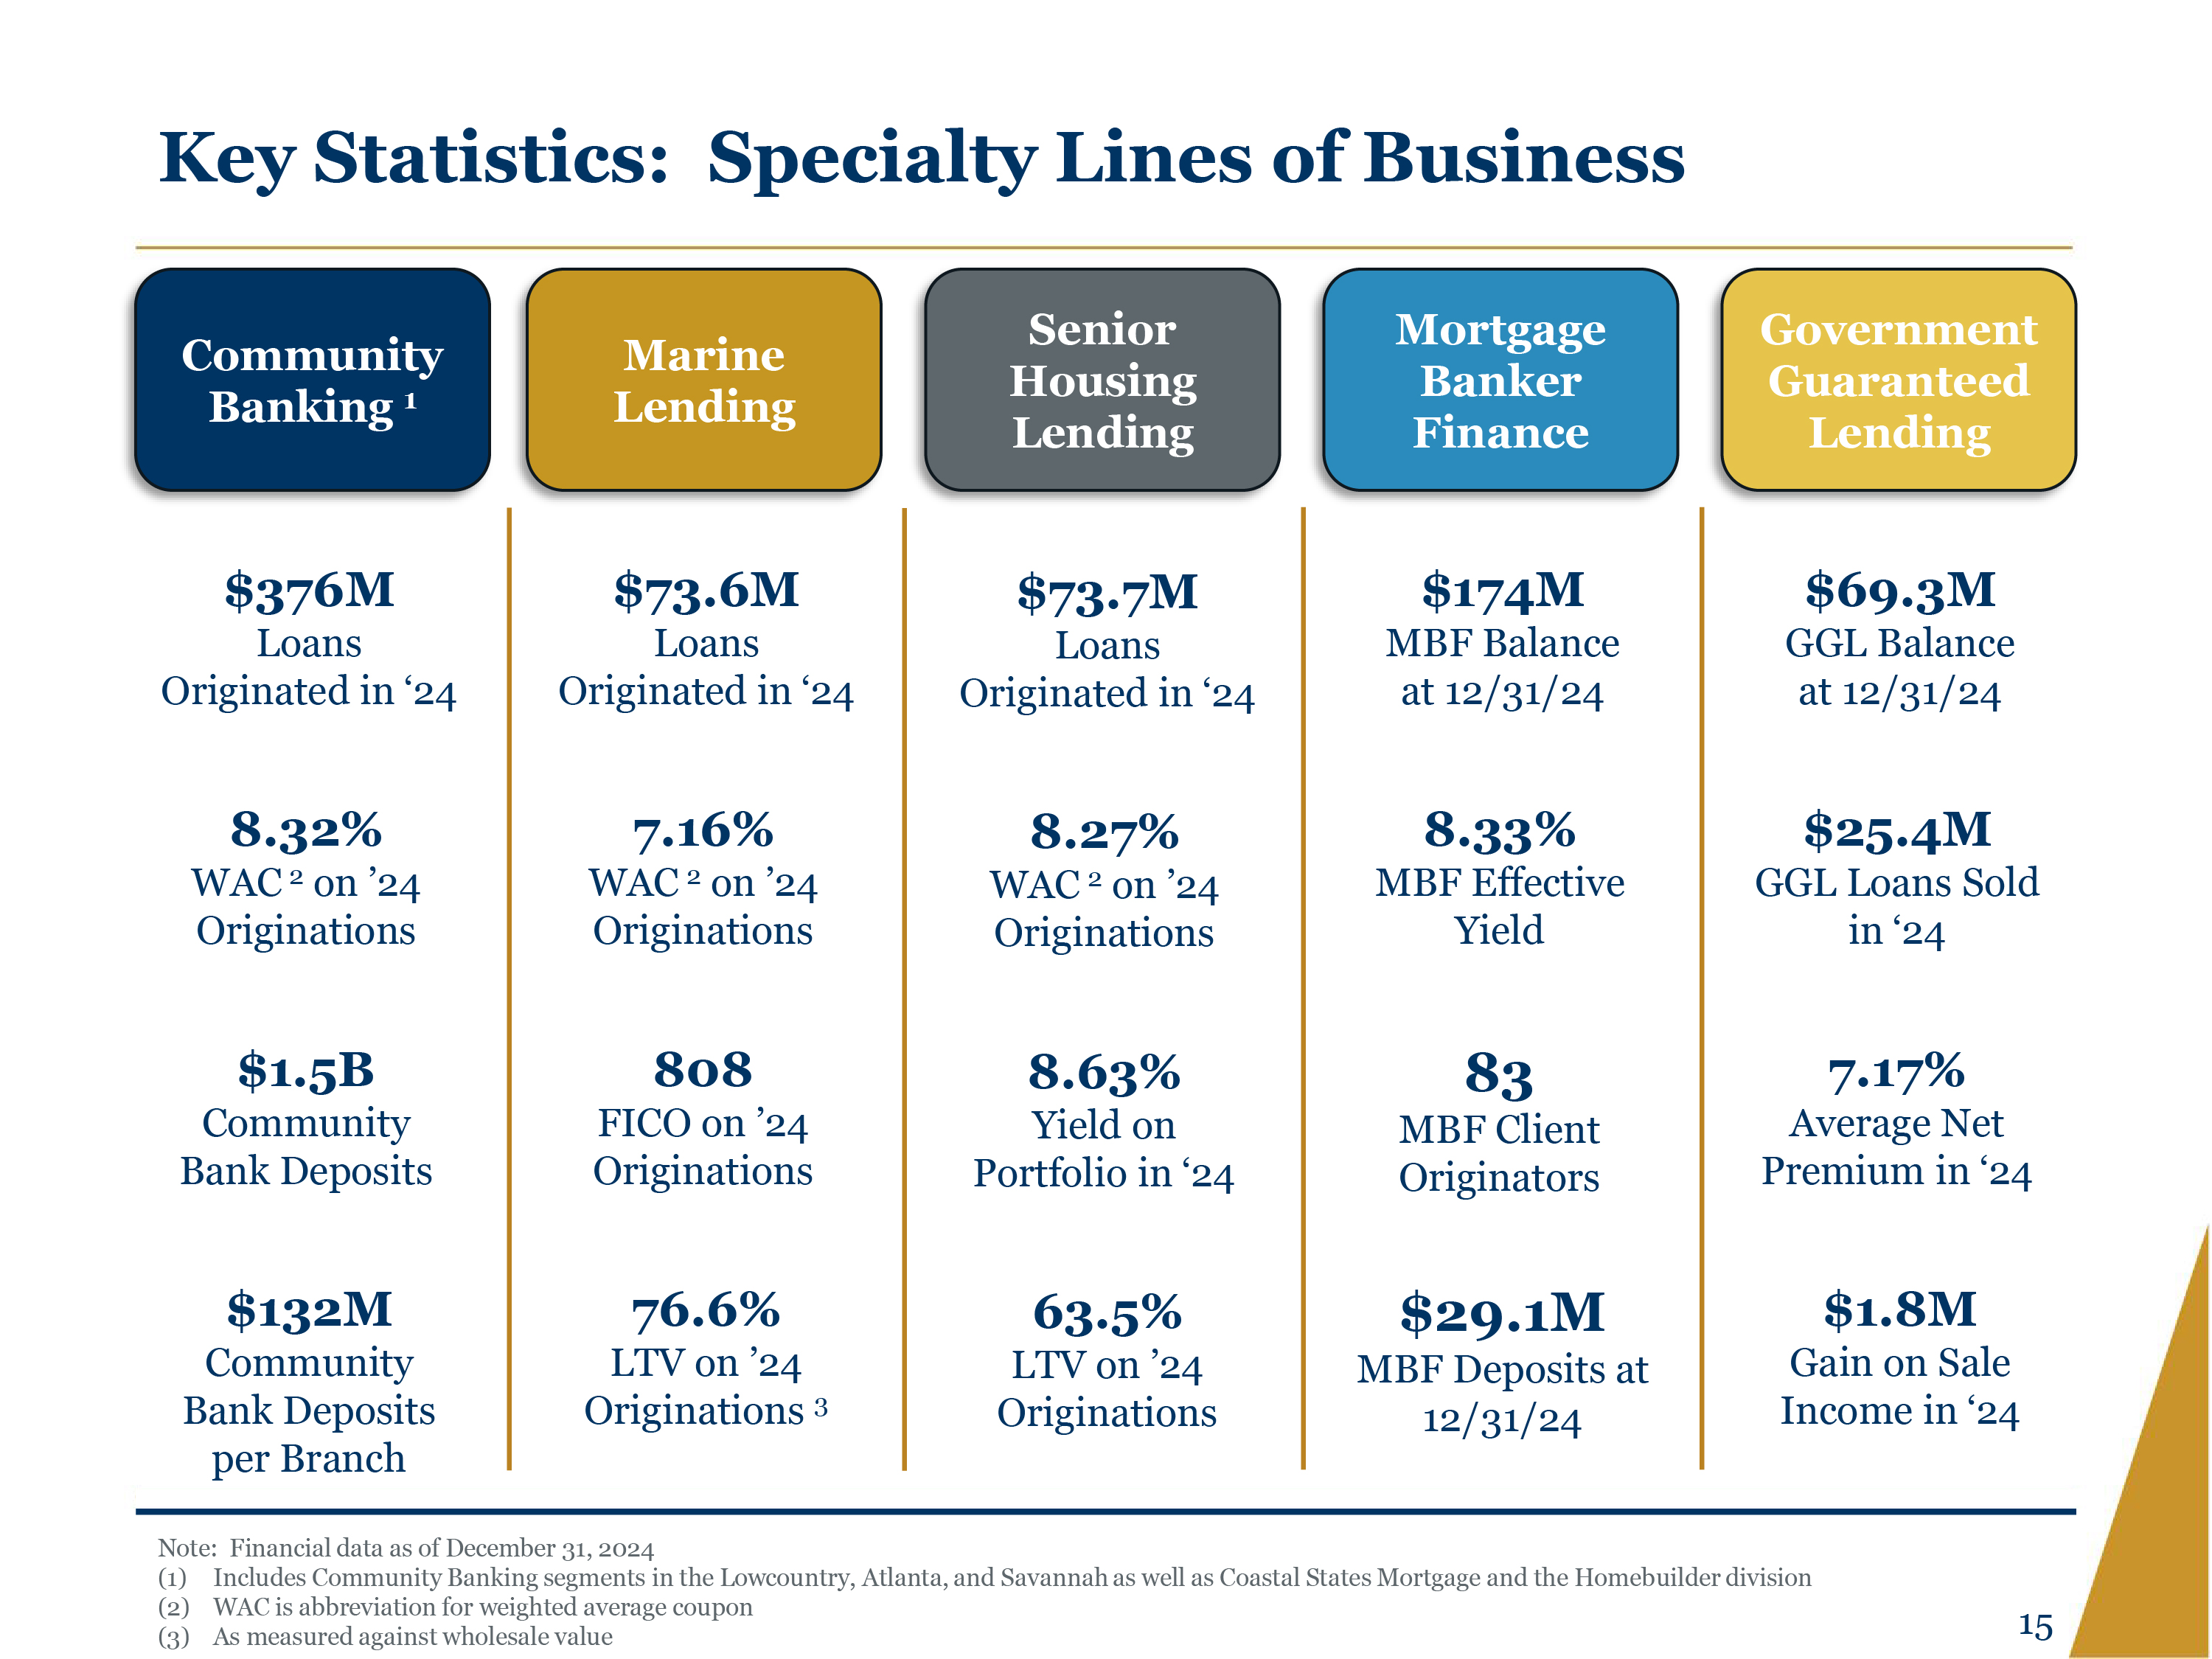
Key Statistics: Specialty Lines of Business Senior Community Banking 1 Marine Housing Mortgage Banker Government Guaranteed 1 Lending Lending Finance Lending $73.6M Loans $73.7M Loans $376M Loans Originated in '24 8.32% WAC2 on '24 Originations $1.5B Community Bank Deposits $132M Community Bank Deposits per Branch Originated in '24 7.16% WAC2 on '24 Originations 808 FICO on '24 Originations 76.6% Originated in '24 8.27% WAC2 on '24 Originations 8.63% Yield on Portfolio in '24 $174M MBF Balance at 12/31/24 8.33% MBF Effective Yield 83 MBF Client Originators LTV on '24 Originations 3 63.5% LTV on '24 Originations $29.1M MBF Deposits at 12/31/24 Note: Financial data as of December 31, 2024 $69.3M GGL Balance at 12/31/24 $25.4M GGL Loans Sold in '24 7.17% Average Net Premium in '24 $1.8M Gain on Sale Income in '24 (1) Includes Community Banking segments in the Lowcountry, Atlanta, and Savannah as well as Coastal States Mortgage and the Homebuilder division (2) WAC is abbreviation for weighted average coupon (3) As measured against wholesale value 15
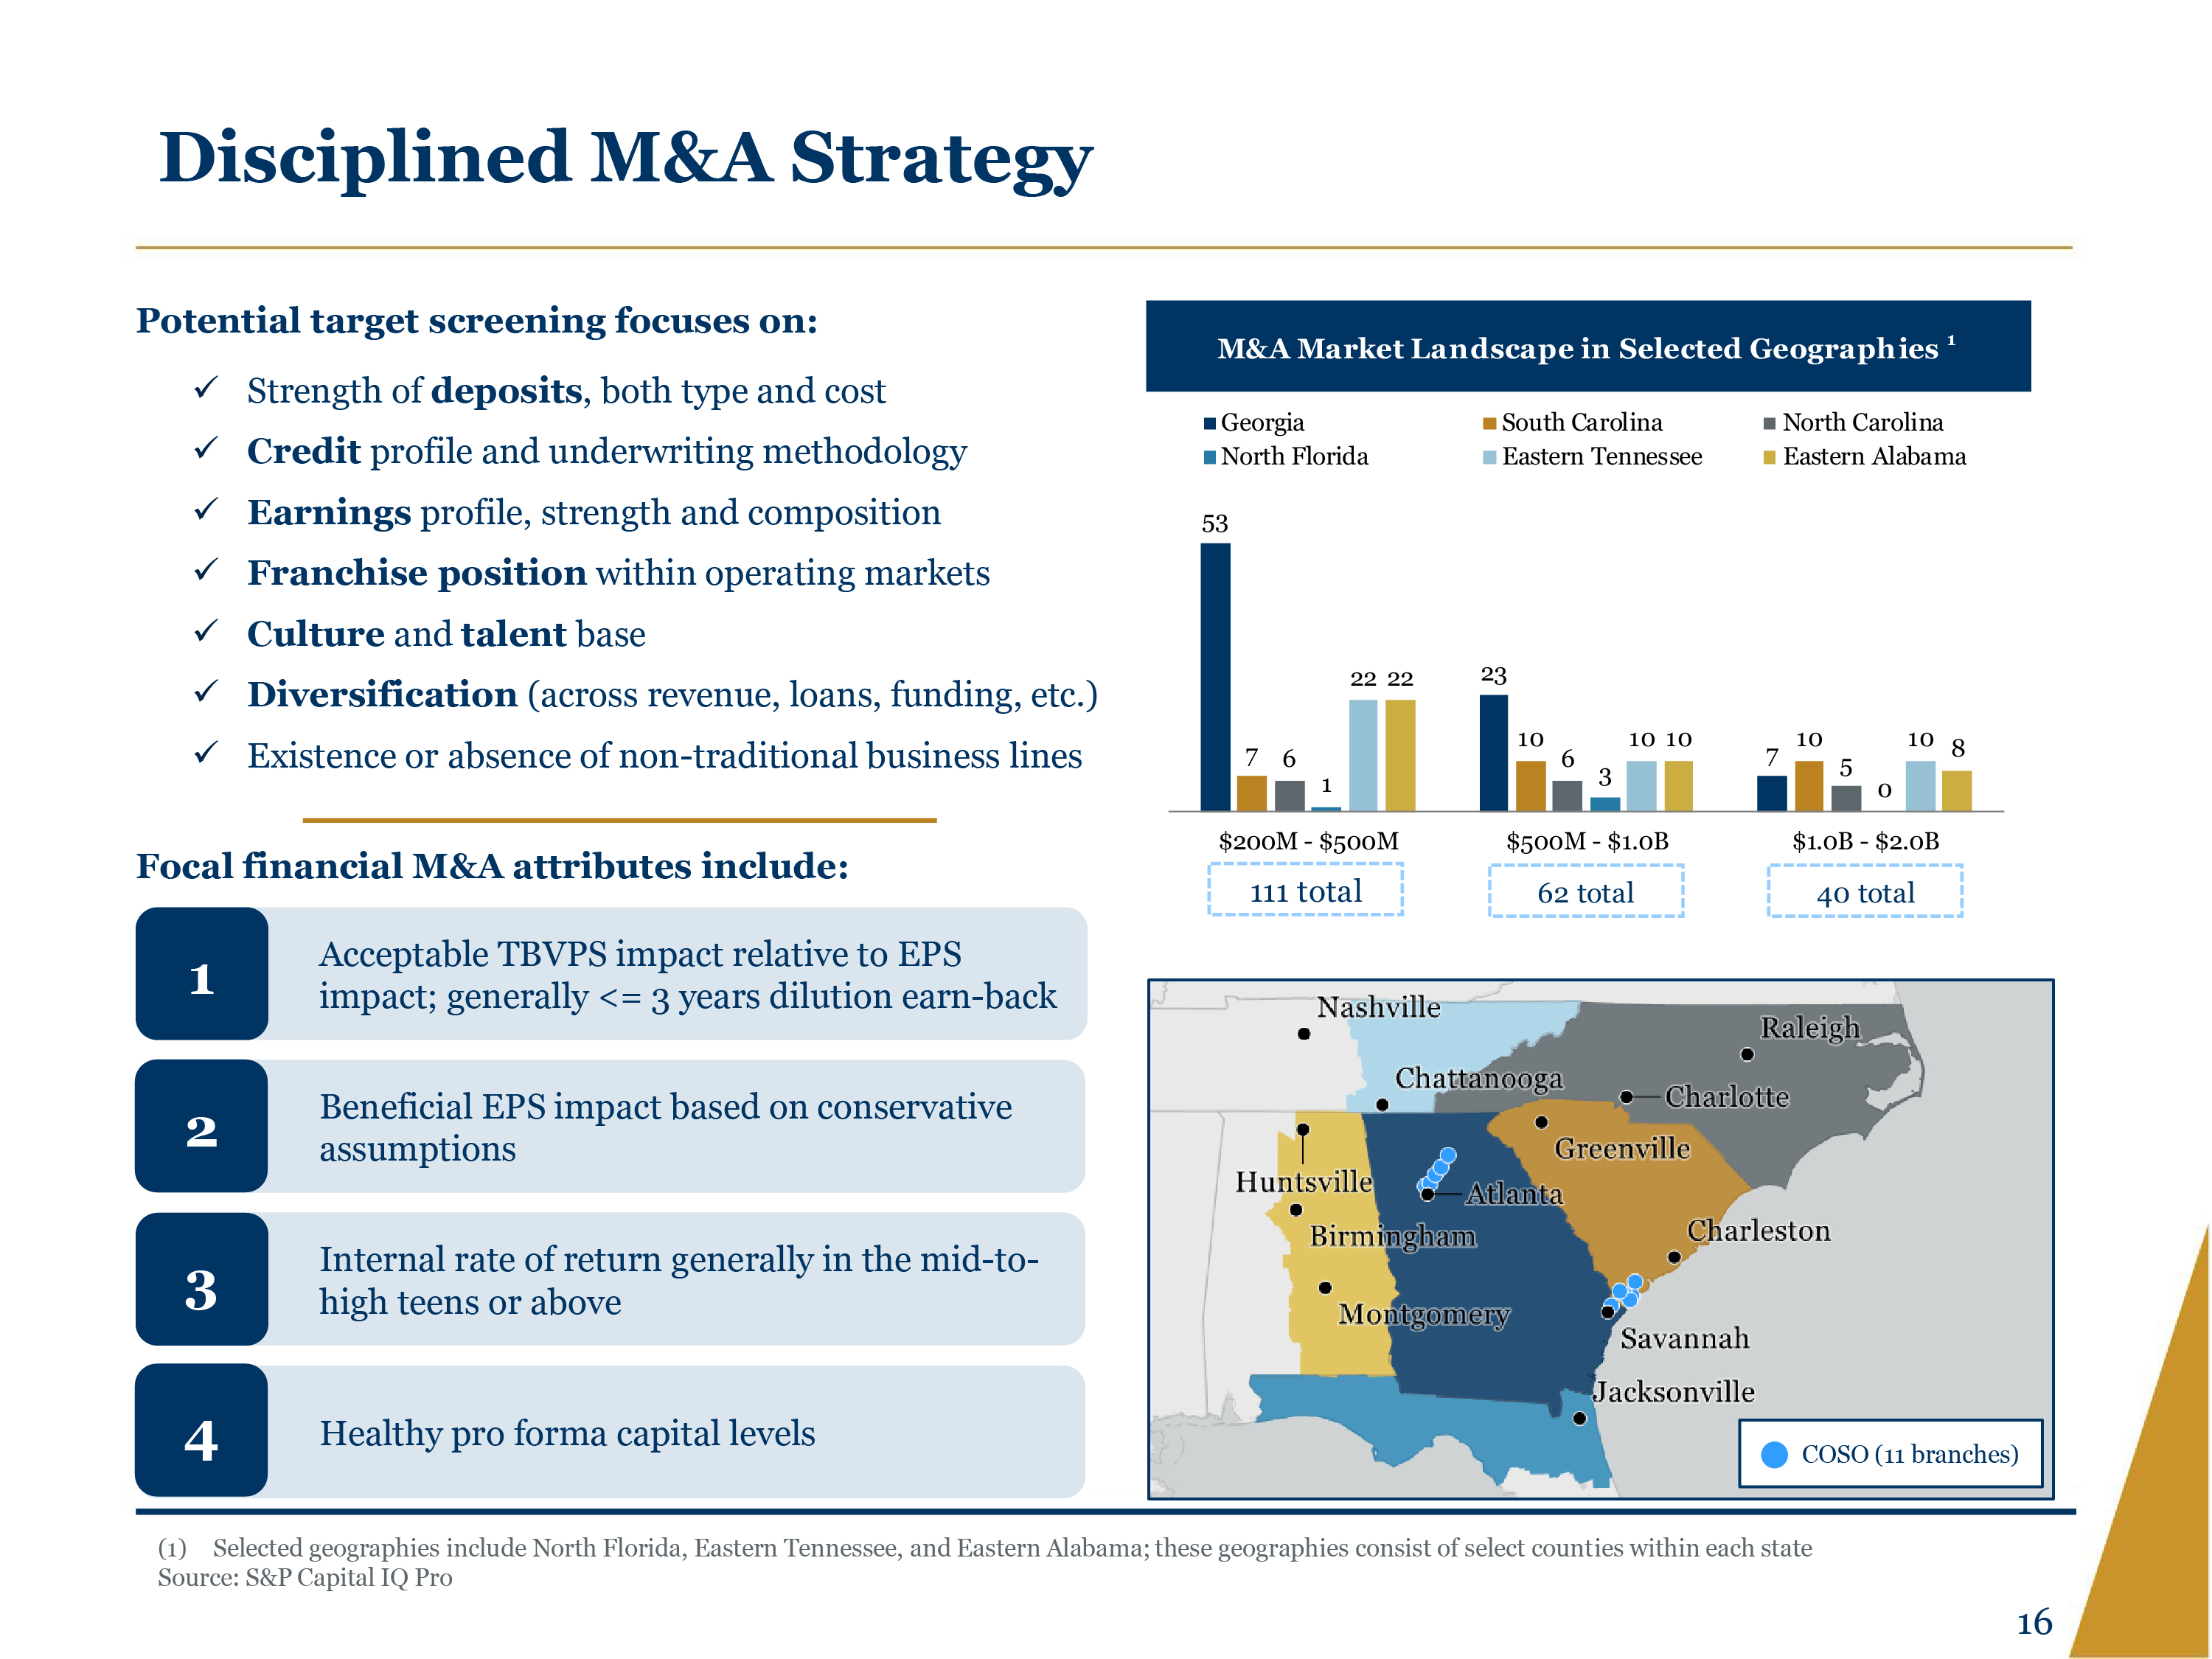
Disciplined M&A Strategy Potential target screening focuses on: Strength of deposits, both type and cost Credit profile and underwriting methodology Earnings profile, strength and composition Franchise position within operating markets Culture and talent base Diversification (across revenue, loans, funding, etc.) Existence or absence of non-traditional business lines Focal financial M&A attributes include:1 Acceptable TBVPS impact relative to EPS impact; generally <= 3 years dilution earn-back 2 Beneficial EPS impact based on conservative assumptions 3 Internal rate of return generally in the mid-to-high teens or above 4 Healthy pro forma capital levels M&A Market Landscape in Selected Geographies 1 Georgia North Florida South Carolina Eastern Tennessee North Carolina Eastern Alabama $200M - $500M $500M - $1.0B $1.0B - $2.0B 111 TOTAL 62 TOTAL 40 TOTAL (1) Focal geographies include North Florida, Eastern Tennessee, and Eastern Alabama; these geographies consist of select counties within each state Source: S&P Capital IQ Pro 16
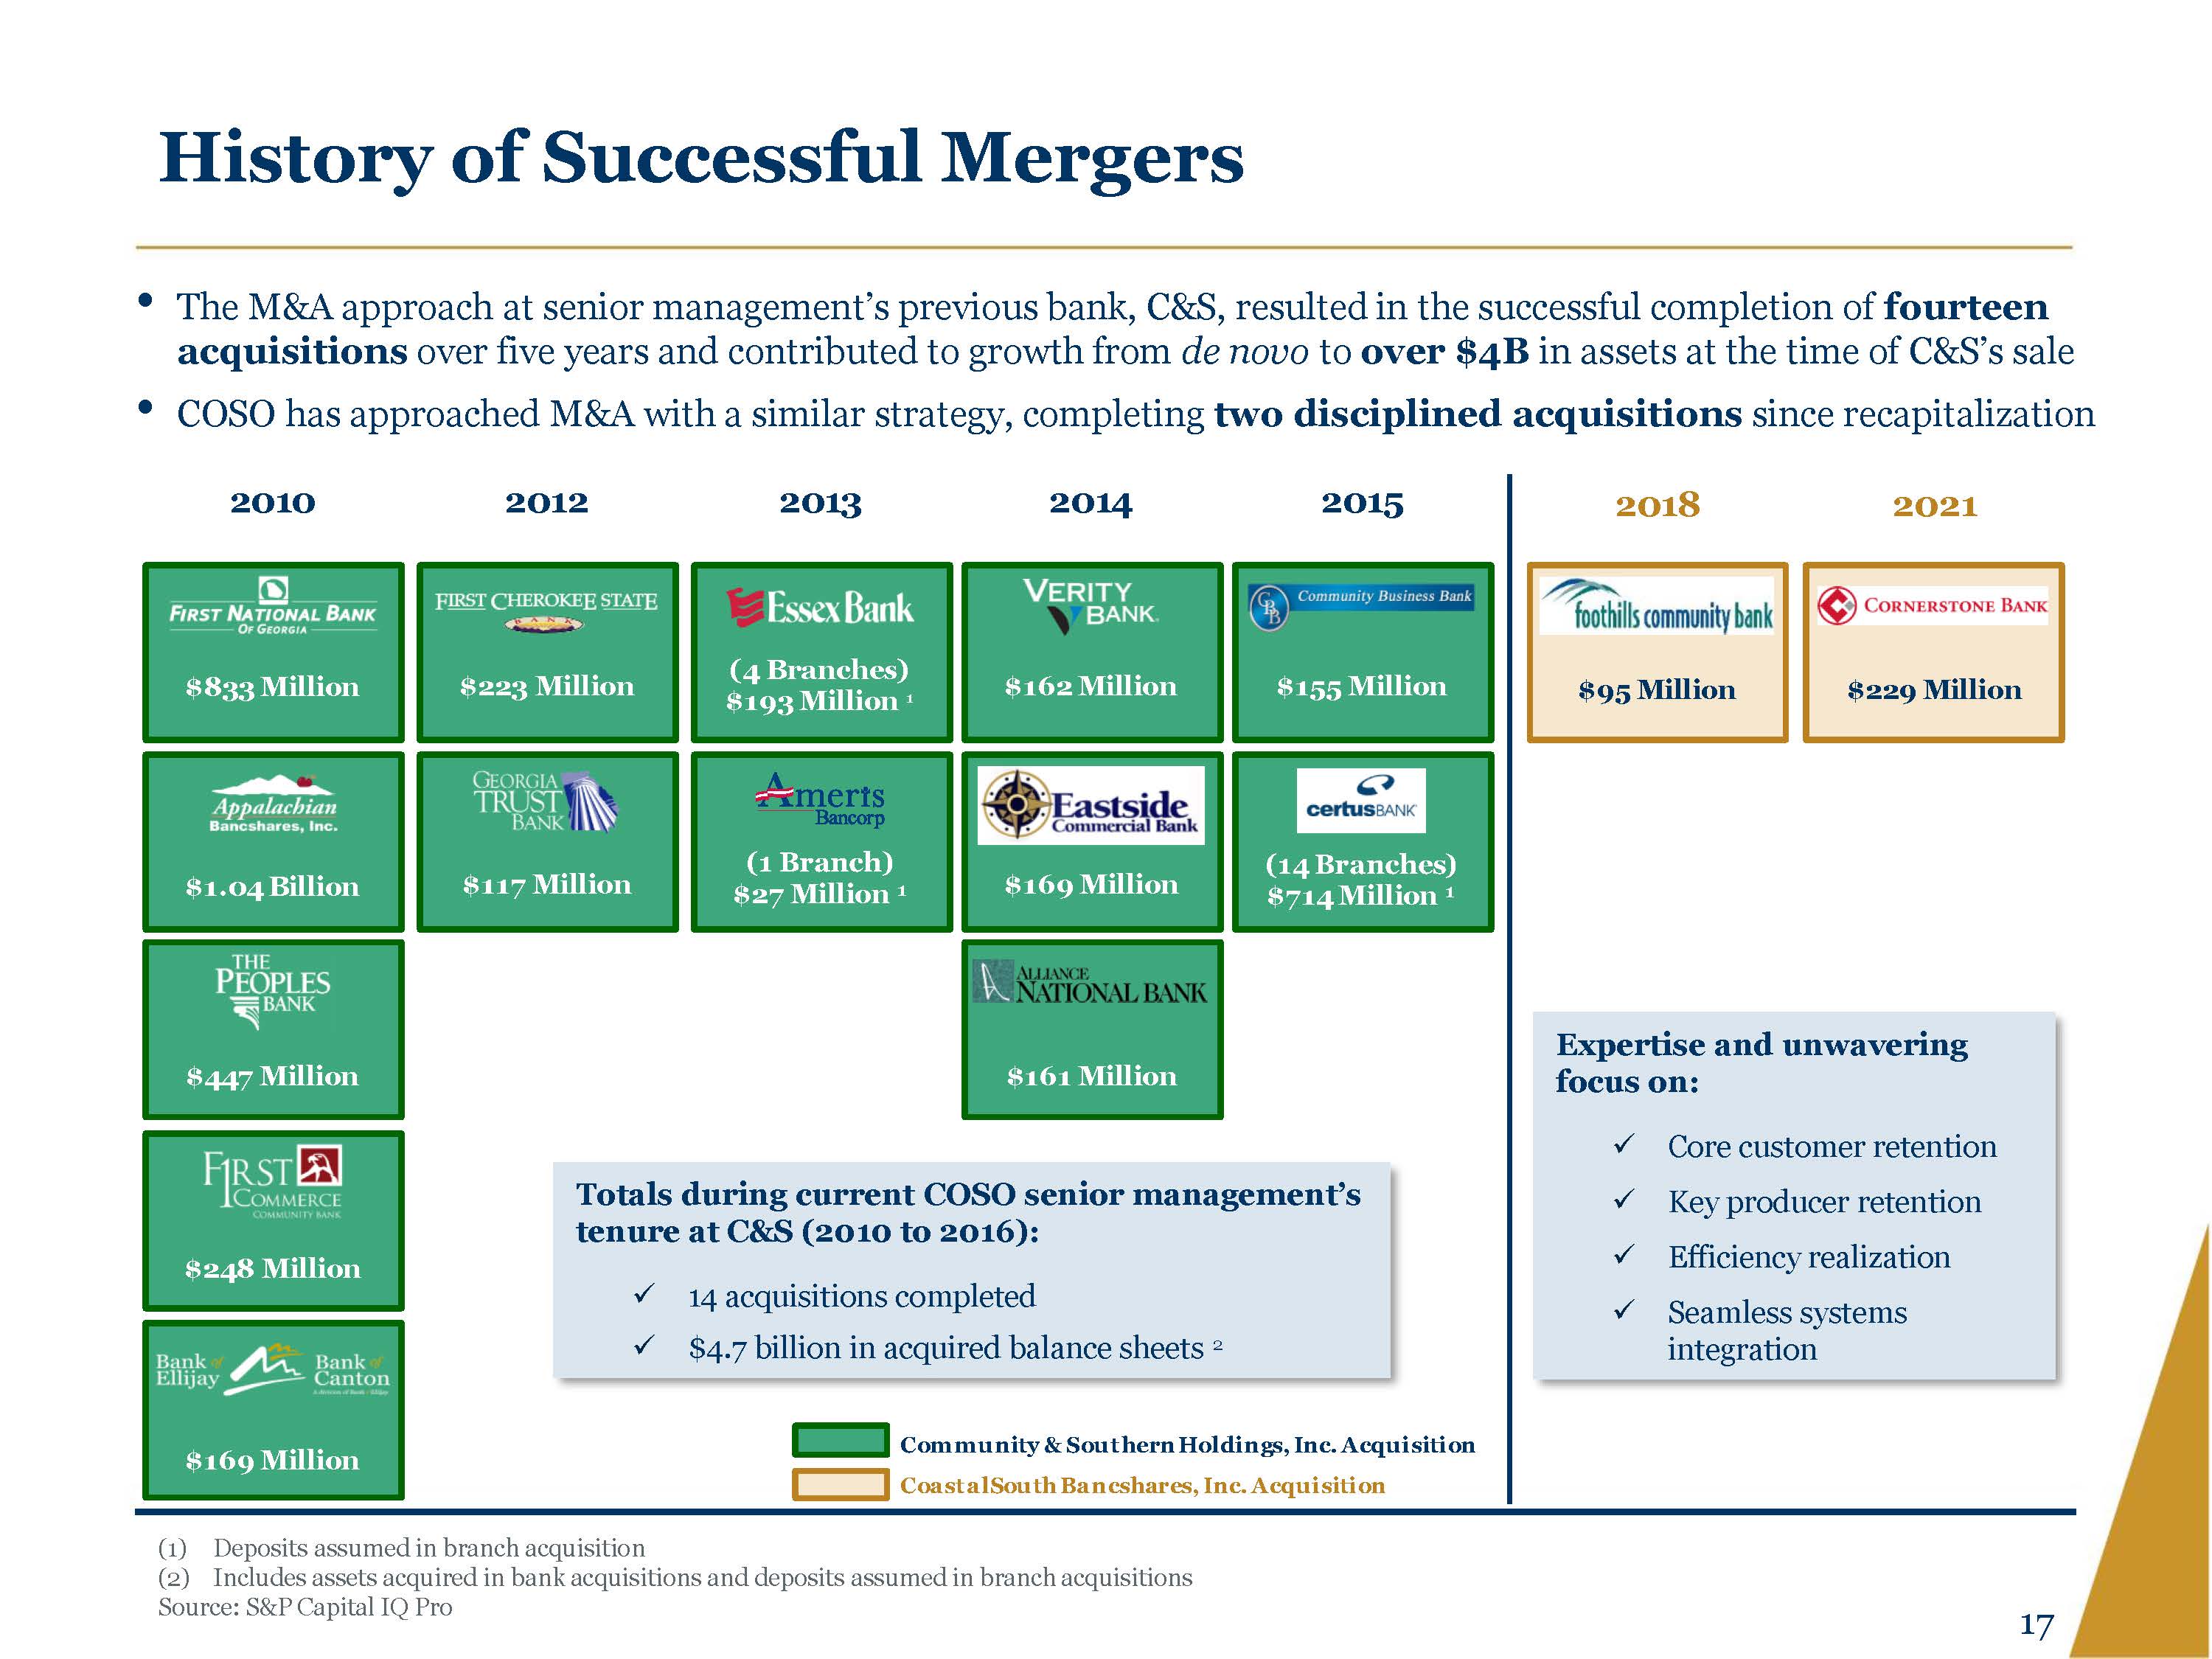
History of Successful Mergers The M&A approach at senior management’s previous bank, C&S, resulted in the successful completion of fourteen acquisitions over five years and contributed to growth from de novo to over $4B in assets at the time of C&S’s sale COSO has approached M&A with a similar strategy, completing two disciplined acquisitions since recapitalization Totals during current COSO senior management’s tenure at C&S (2010 to 2016): 14 acquisitions completed $4.7 billion in acquired balance sheets 2 Expertise and unwavering focus on: Core customer retention Key producer retention Efficiency realization Seamless systems integration 2010 2012 2013 2014 2015 2018 2021 $833 million $223 million (4 Branches) $193 million 1 $162 million $155 million $1.04 Billion $117 million (1 Branch) $27 million 1 $169 million (14 Branches) $714 million 1 $447 million $161 million $248 million $169 million $95 million $229 million Community & Southern Holdings, Ihc. Acquisition Coastalsouth Bancshares, inc. Acquisition (1 )Deposits assumed in branch acquisition (2) Includes assets acquired in bank acquisitions and deposits assumed in branch acquisitions Source: S&P Capital IQ Pro 17
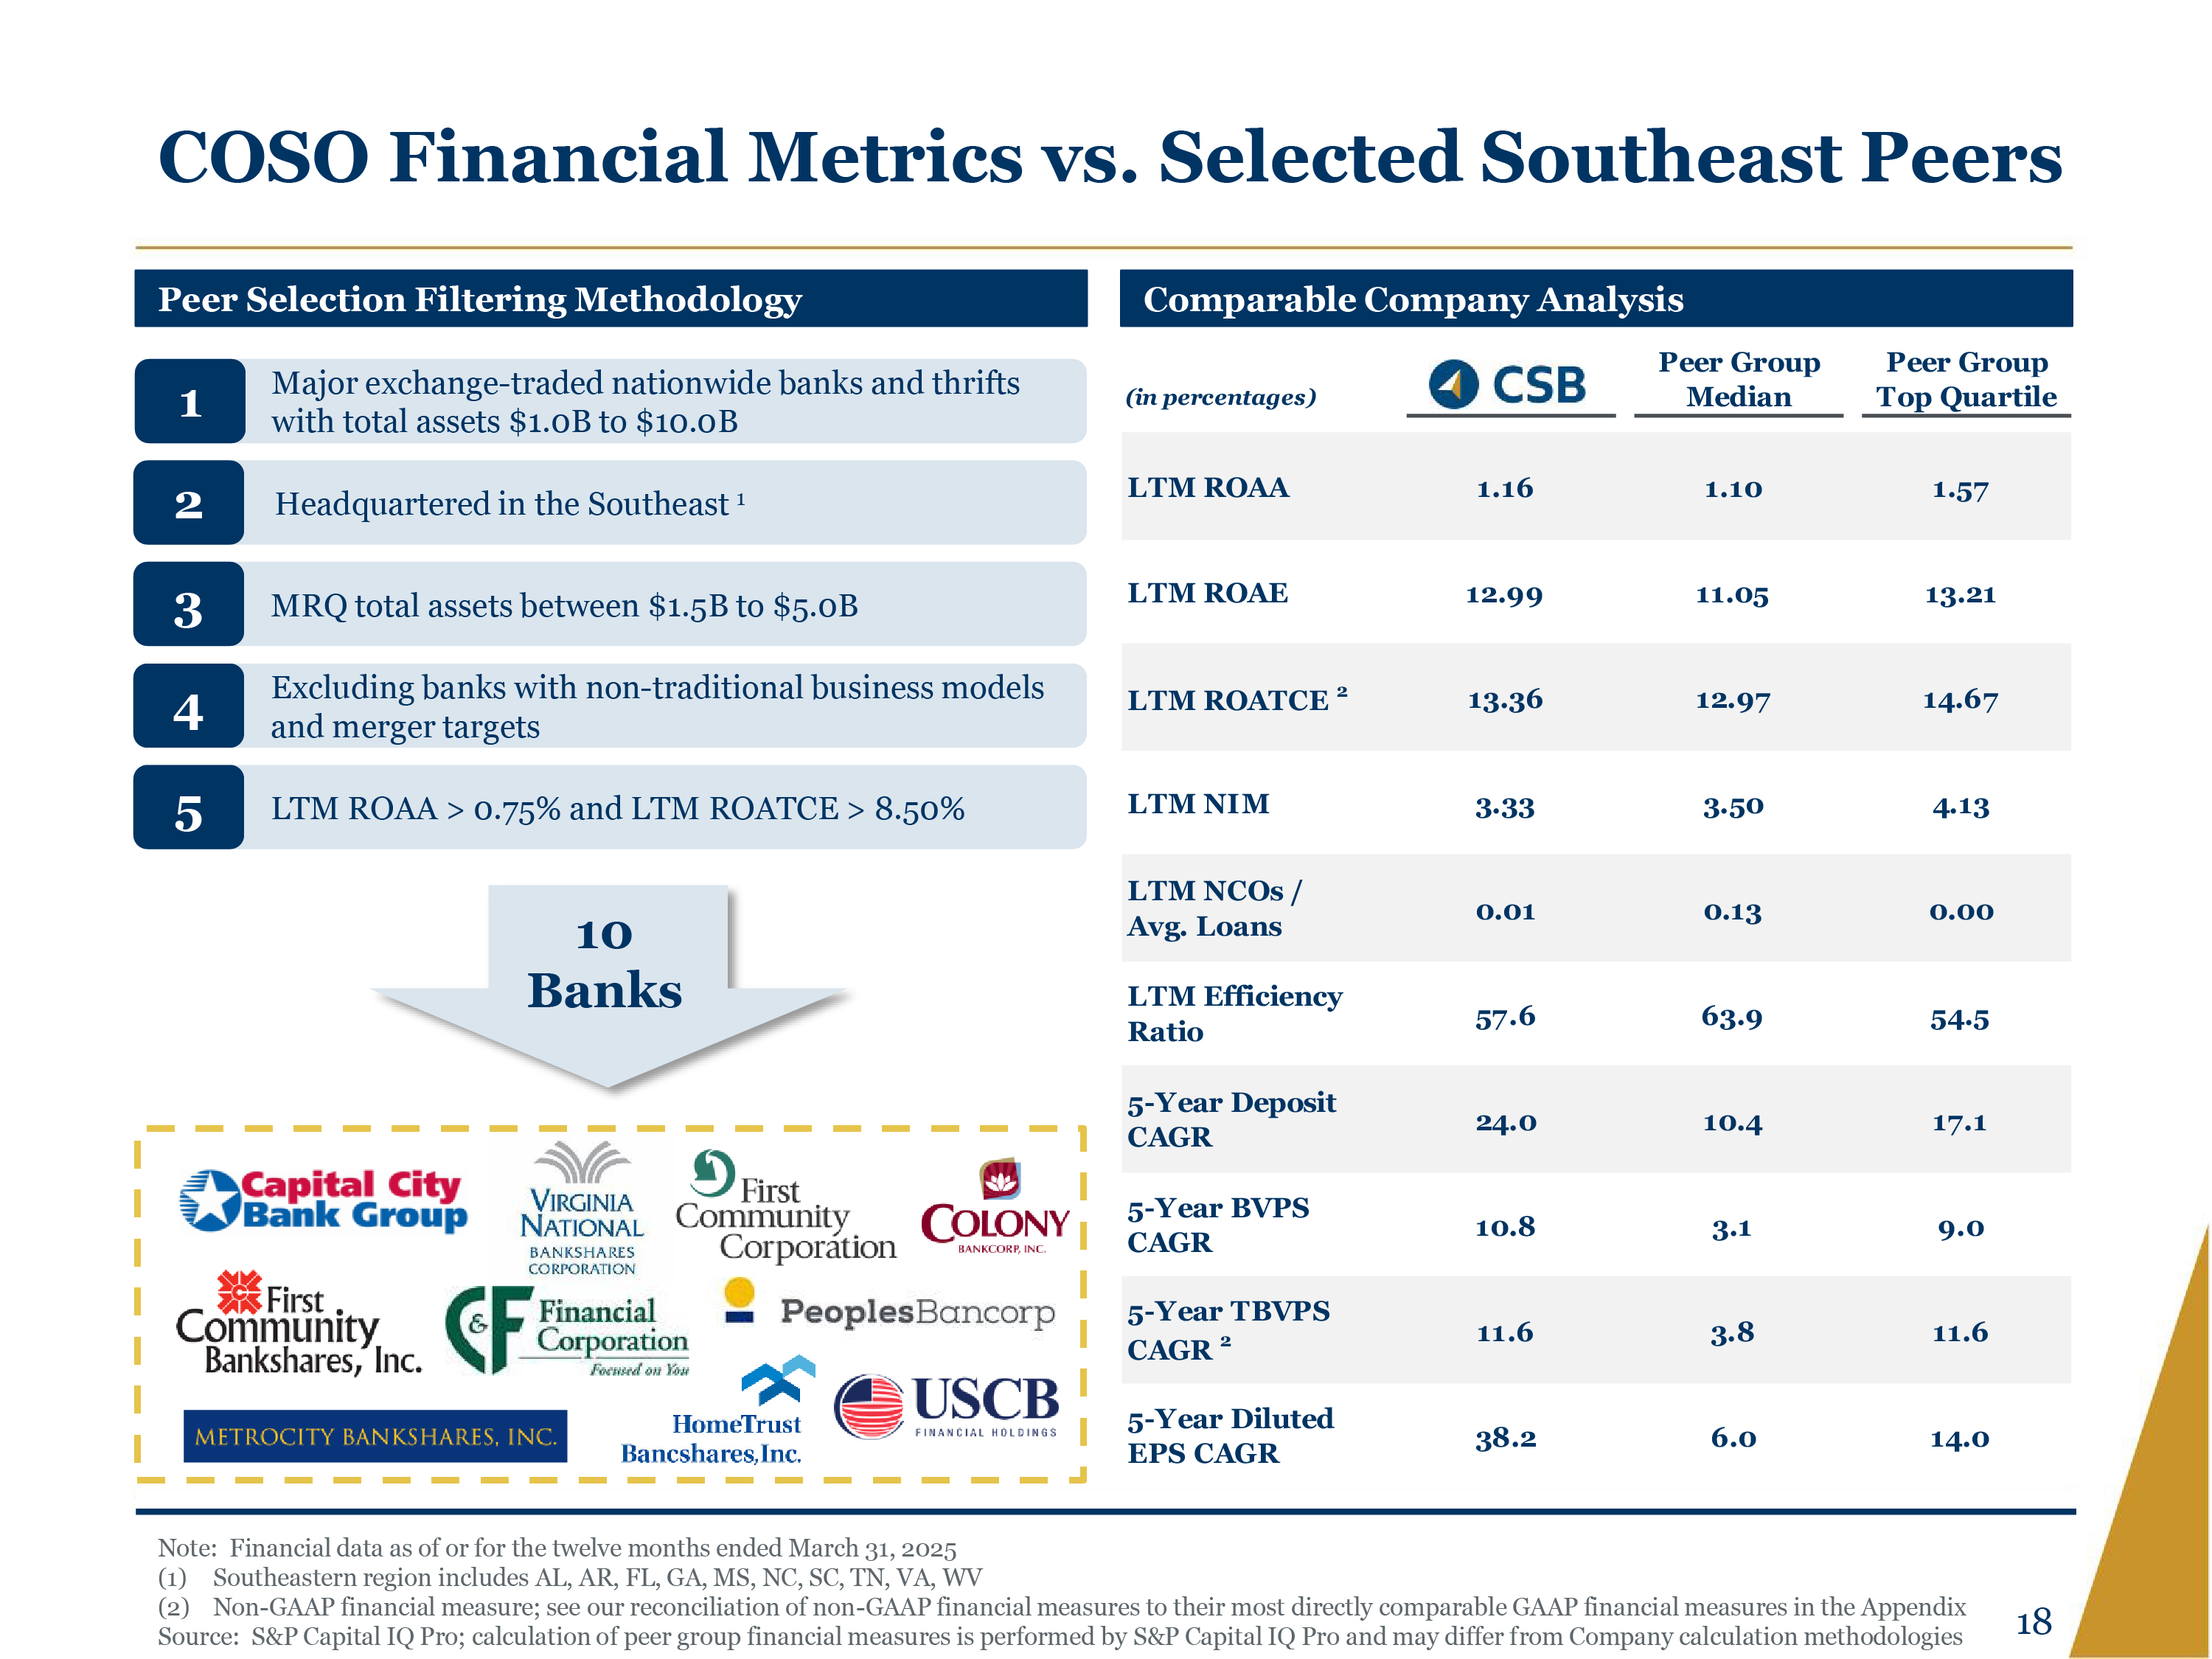
COSO Financial Metrics vs. Selected Southeast Peers Peer Selection Filtering Methodology 1 Major exchange-traded nationwide banks and thrifts with total assets $1.0B to $10.0B 2 Headquartered in the Southeast 1 3 MRQ total assets between $1.5B to $5.0B 4 Excluding banks with non-traditional business models and merger targets 5 LTM ROAA > 0.75% and LTM ROATCE > 8.50% 10 Banks Comparable Company Analysis (in percentages) CSB Peer Group Median Peer Group Top Quartile LTM ROAA 1.16 1.10 1.57 LTM ROAE 12.99 11.05 13.21 LTM ROATCE 13.36 12.97 14.67 LTM NIM 3.33 3.50 4.13 LTM NCOs / Avg. Loans 0.01 0.13 0.00 LTM Efficiency Ratio 57.6 63.9 54.5 5-Year Deposit CAGR 24.0 10.4 17.1 5-Year BVPS CAGR 10.8 3.1 9.0 5-Year TBVPS CAGR 2 11.6 3.8 11.6 5-Year Diluted EPS CAGR 38.2 6.0 14.0 Note: Financial data as of or for the twelve months ended March 31, 2025 (1) Southeastern region includes AL, AR, FL, GA, MS, NC, SC, TN, VA, WV (2) Non-GAAP financial measure; see our reconciliation of non-GAAP financial measures to their most directly comparable GAAP financial measures in the Appendix Source: S&P Capital IQ Pro; calculation of peer group financial measures is performed by S&P Capital IQ Pro and may differ from Company calculation methodologies 18
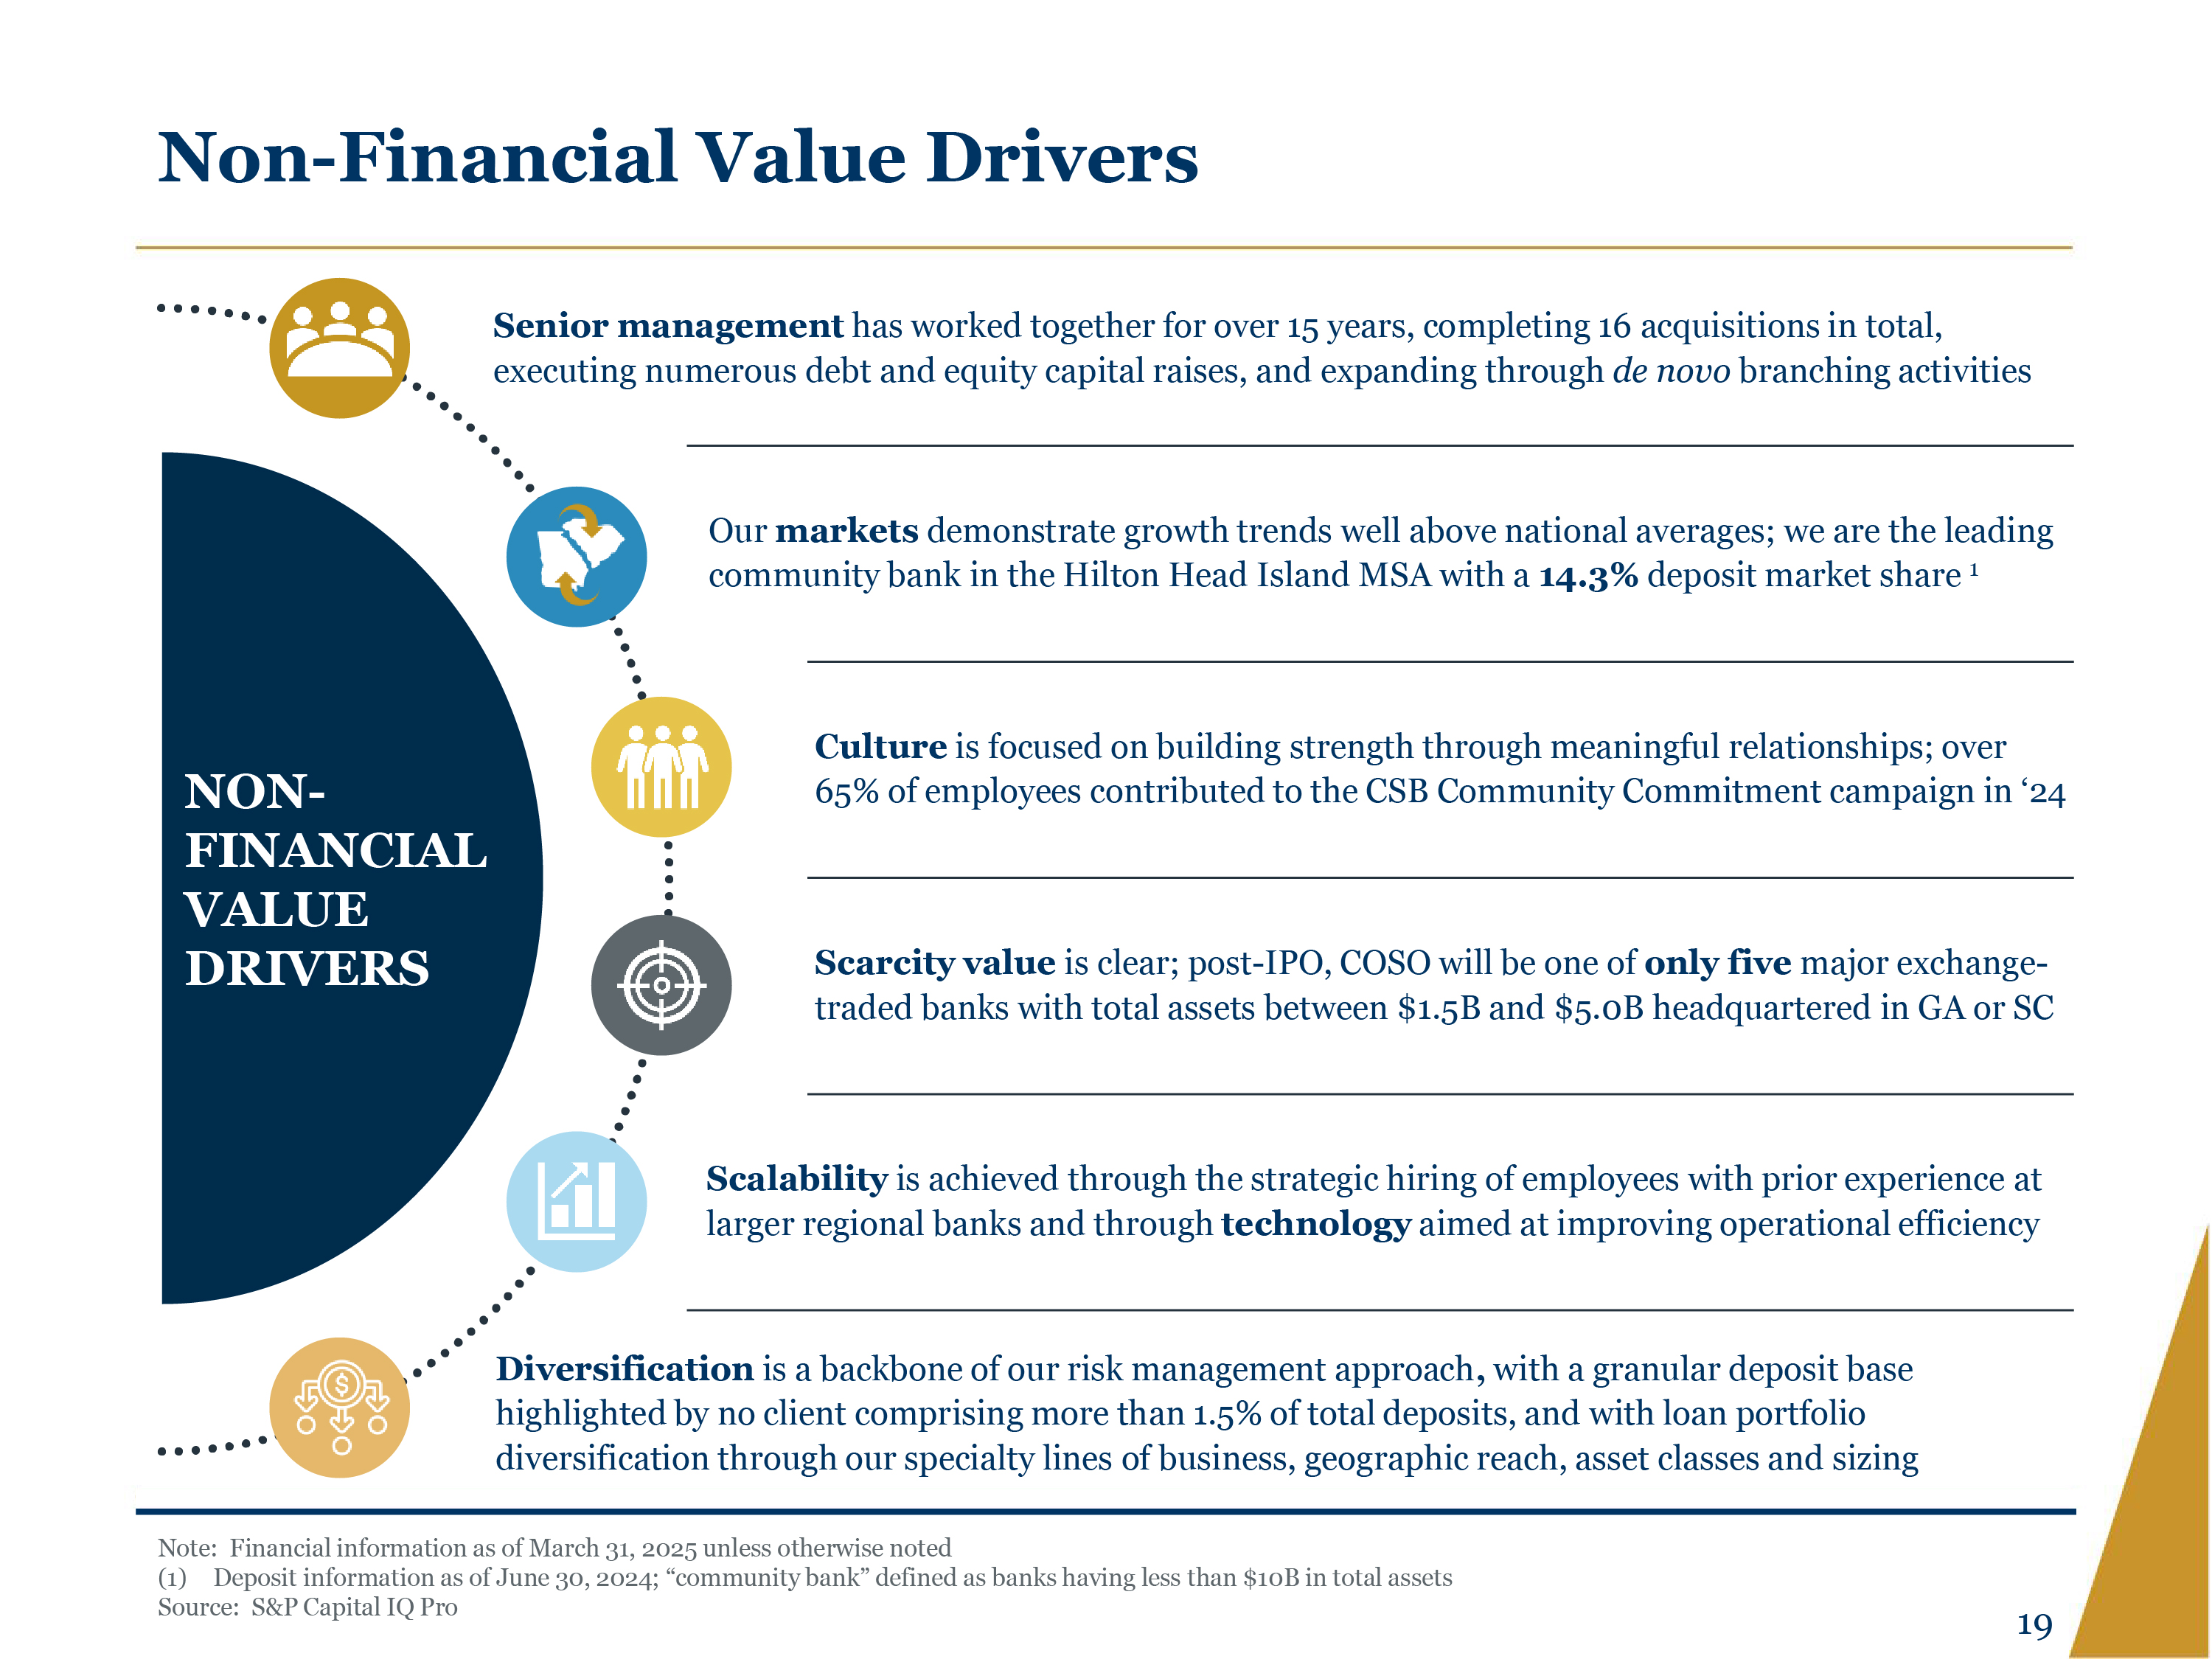
Non-Financial Value Drivers Senior management has worked together for over 15 years, completing 16 acquisitions in total, executing numerous debt and equity capital raises, and expanding through de novo branching activities Our markets demonstrate growth trends well above national averages; we are the leading community bank in the Hilton Head Island MSA with a 14.3% deposit market share 1 Culture is focused on building strength through meaningful relationships; over 65% of employees contributed to the CSB Community Commitment campaign in ‘24 Scarcity value is clear; post-IPO, COSO will be one of only five major exchange-traded banks with total assets between $1.5B and $5.0B headquartered in GA or SC Scalability is achieved through the strategic hiring of employees with prior experience at larger regional banks and through technology aimed at improving operational efficiency Diversification is a backbone of our risk management approach, with a granular deposit base highlighted by no client comprising more than 1.5% of total deposits, and with loan portfolio diversification through our specialty lines of business, geographic reach, asset classes and sizing NON-FINANCIAL VALUE DRIVERS Note: Financial information as of March 31, 2025 unless otherwise noted Deposit information as of June 30, 2024; “community bank” defined as banks having less than $10B in total assets Source: S&P Capital IQ Pro 19
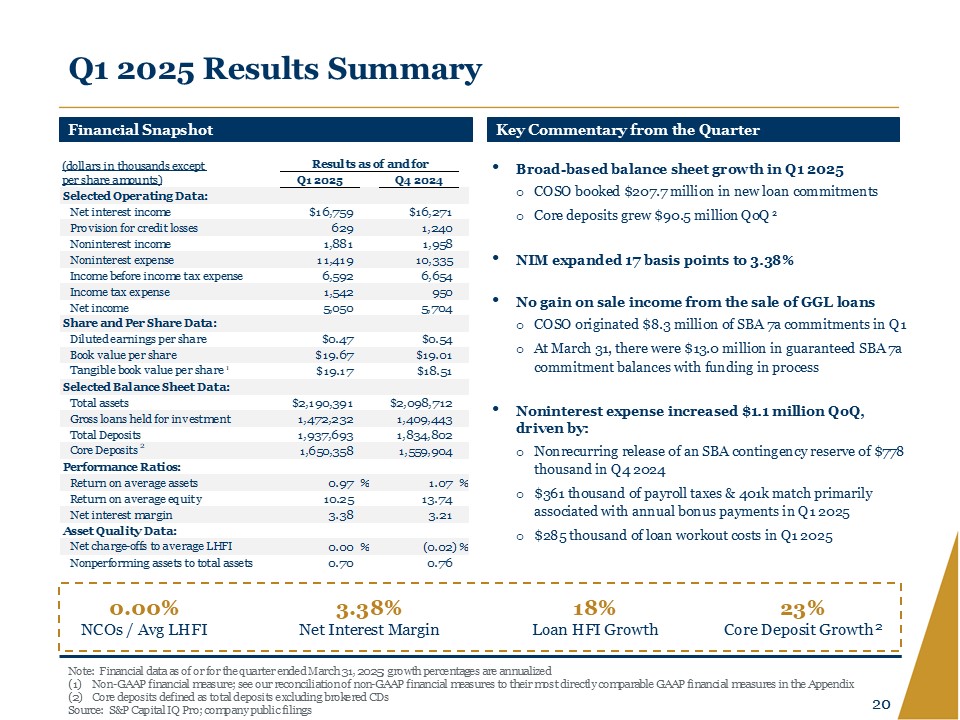
Q1 2025 Results Summary Financial Snapshot (dollars in thousands except per share amounts) Results as of and for Q1 2025 Q4 2024 Selected Operating Data: Net interest income $16,759 $16,271 Provision for credit losses 629 1,240 Noninterest income 1,881 1,958 Noninterest expense 11,419 10,335 Income before income tax expense 6,592 6,654 Income tax expense 1,542 950 Net income 5,050 5,704 Share and Per Share Data: Diluted earnings per share $0.47 $0.54 Book value per share $19.67 $19.01 Tangible book value per share 1 $19.17 $18.51 Selected Balance Sheet Data: Total assets $2,190,391 $2,098,712 Gross loans held for investment 1,472,232 1,409,443 Total Deposits 1,937,693 1,834,802 Core Deposits 2 1,650,358 1,559,904 Performance Ratios: Return on average assets 0.97 % 1.07 % Return on average equity 10.25 13.74 Net interest margin 3.38 3.21 Asset Quality Data: Net charge-offs to average LHFI 0.00% (0.02)% Nonperforming assets to total assets 0.70 0.76 Key Commentary from the Quarter Broad-based balance sheet growth in Q1 2025 COSO booked $207.7 million in new loan commitments Core deposits grew $90.5 million QoQ 2 NIM expanded 17 basis points to 3.38% No gain on sale income from the sale of GGL loans COSO originated $8.3 million of SBA 7a commitments in Q1 At March 31, there were $13.0 million in guaranteed SBA 7a commitment balances with funding in process Noninterest expense increased $1.1 million QoQ, driven by: Nonrecurring release of an SBA contingency reserve of $778 thousand in Q4 2024 $361 thousand of payroll taxes & 401k match primarily associated with annual bonus payments in Q1 2025 $285 thousand of loan workout costs in Q1 2025 0.00% NCOs / Avg LHFI 3.38% Net Interest Margin 18% Loan HFI Growth 23% Core Deposit Growth 2 Note: Financial data as of or for the quarter ended March 31, 2025; growth percentages are annualized (1) Non-GAAP financial measure; see our reconciliation of non-GAAP financial measures to their most directly comparable GAAP financial measures in the Appendix (2) Core deposits defined as total deposits excluding brokered CDs Source: S&P Capital IQ Pro; company public filings 20
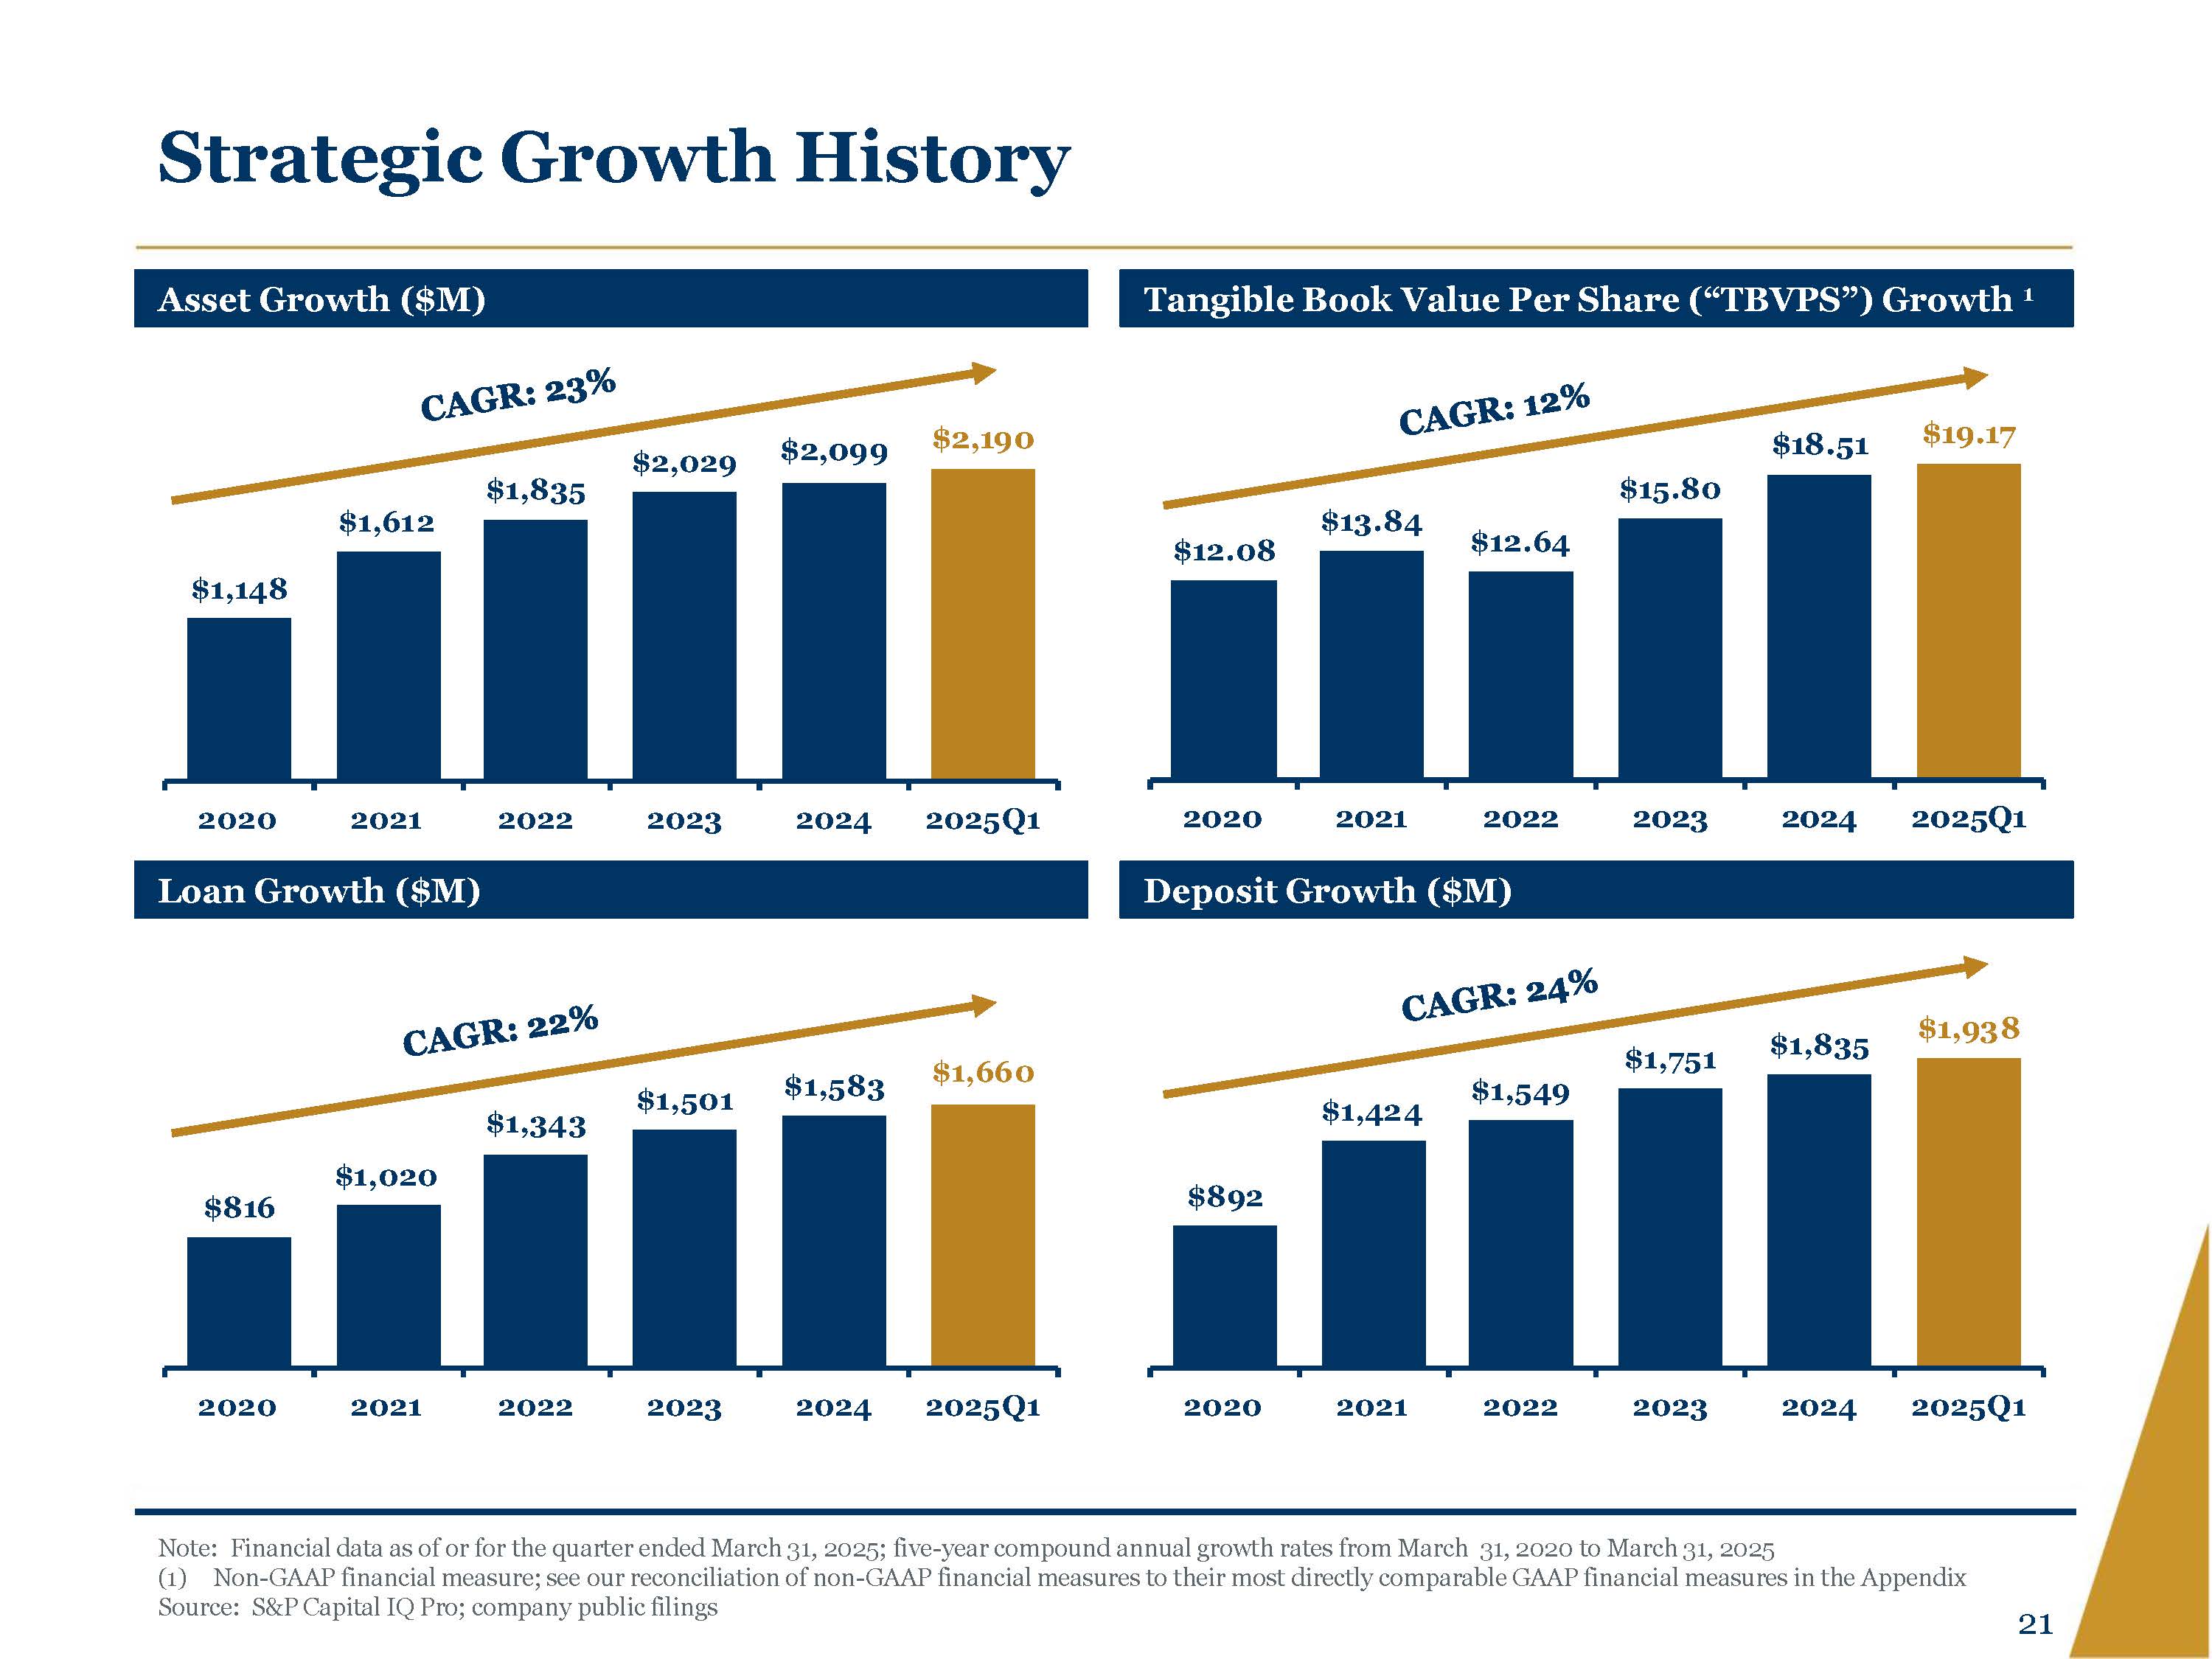
Strategic Growth History Asset Growth ($M) CAGR: 23% $ 1,148 $1,612 $ 1,835 $2,029 $2,099 $2,190 2020 2021 2022 2023 2024 2025Q1 Tangible Book Value Per Share (“TBVPS”) Growth 1 CAGR: 12% $12.08 $13.84 $12.64 $15.80 $18.51 $19.17 2020 2021 2022 2023 2024 2025Q1 Loan Growth ($M) CAGR: 22% $816 $1,020 $1,343 $1,501 $1,583 $1,660 2020 2021 2022 2023 2024 2025Q1 Deposit Growth ($M) CAGR: 24% $892 $1,424 $1,549 $1,751 $1,835 $1,938 2020 2021 2022 2023 2024 2025Q1 Note: Financial data as of or for the quarter ended March 31, 2025; five-year compound annual growth rates from March 31, 2020 to March 31, 2025 (1)Non-GAAP financial measure; see our reconciliation of non-GAAP financial measures to their most directly comparable GAAP financial measures in the Appendix Source: S&P Capital IQ Pro; company public filings 21
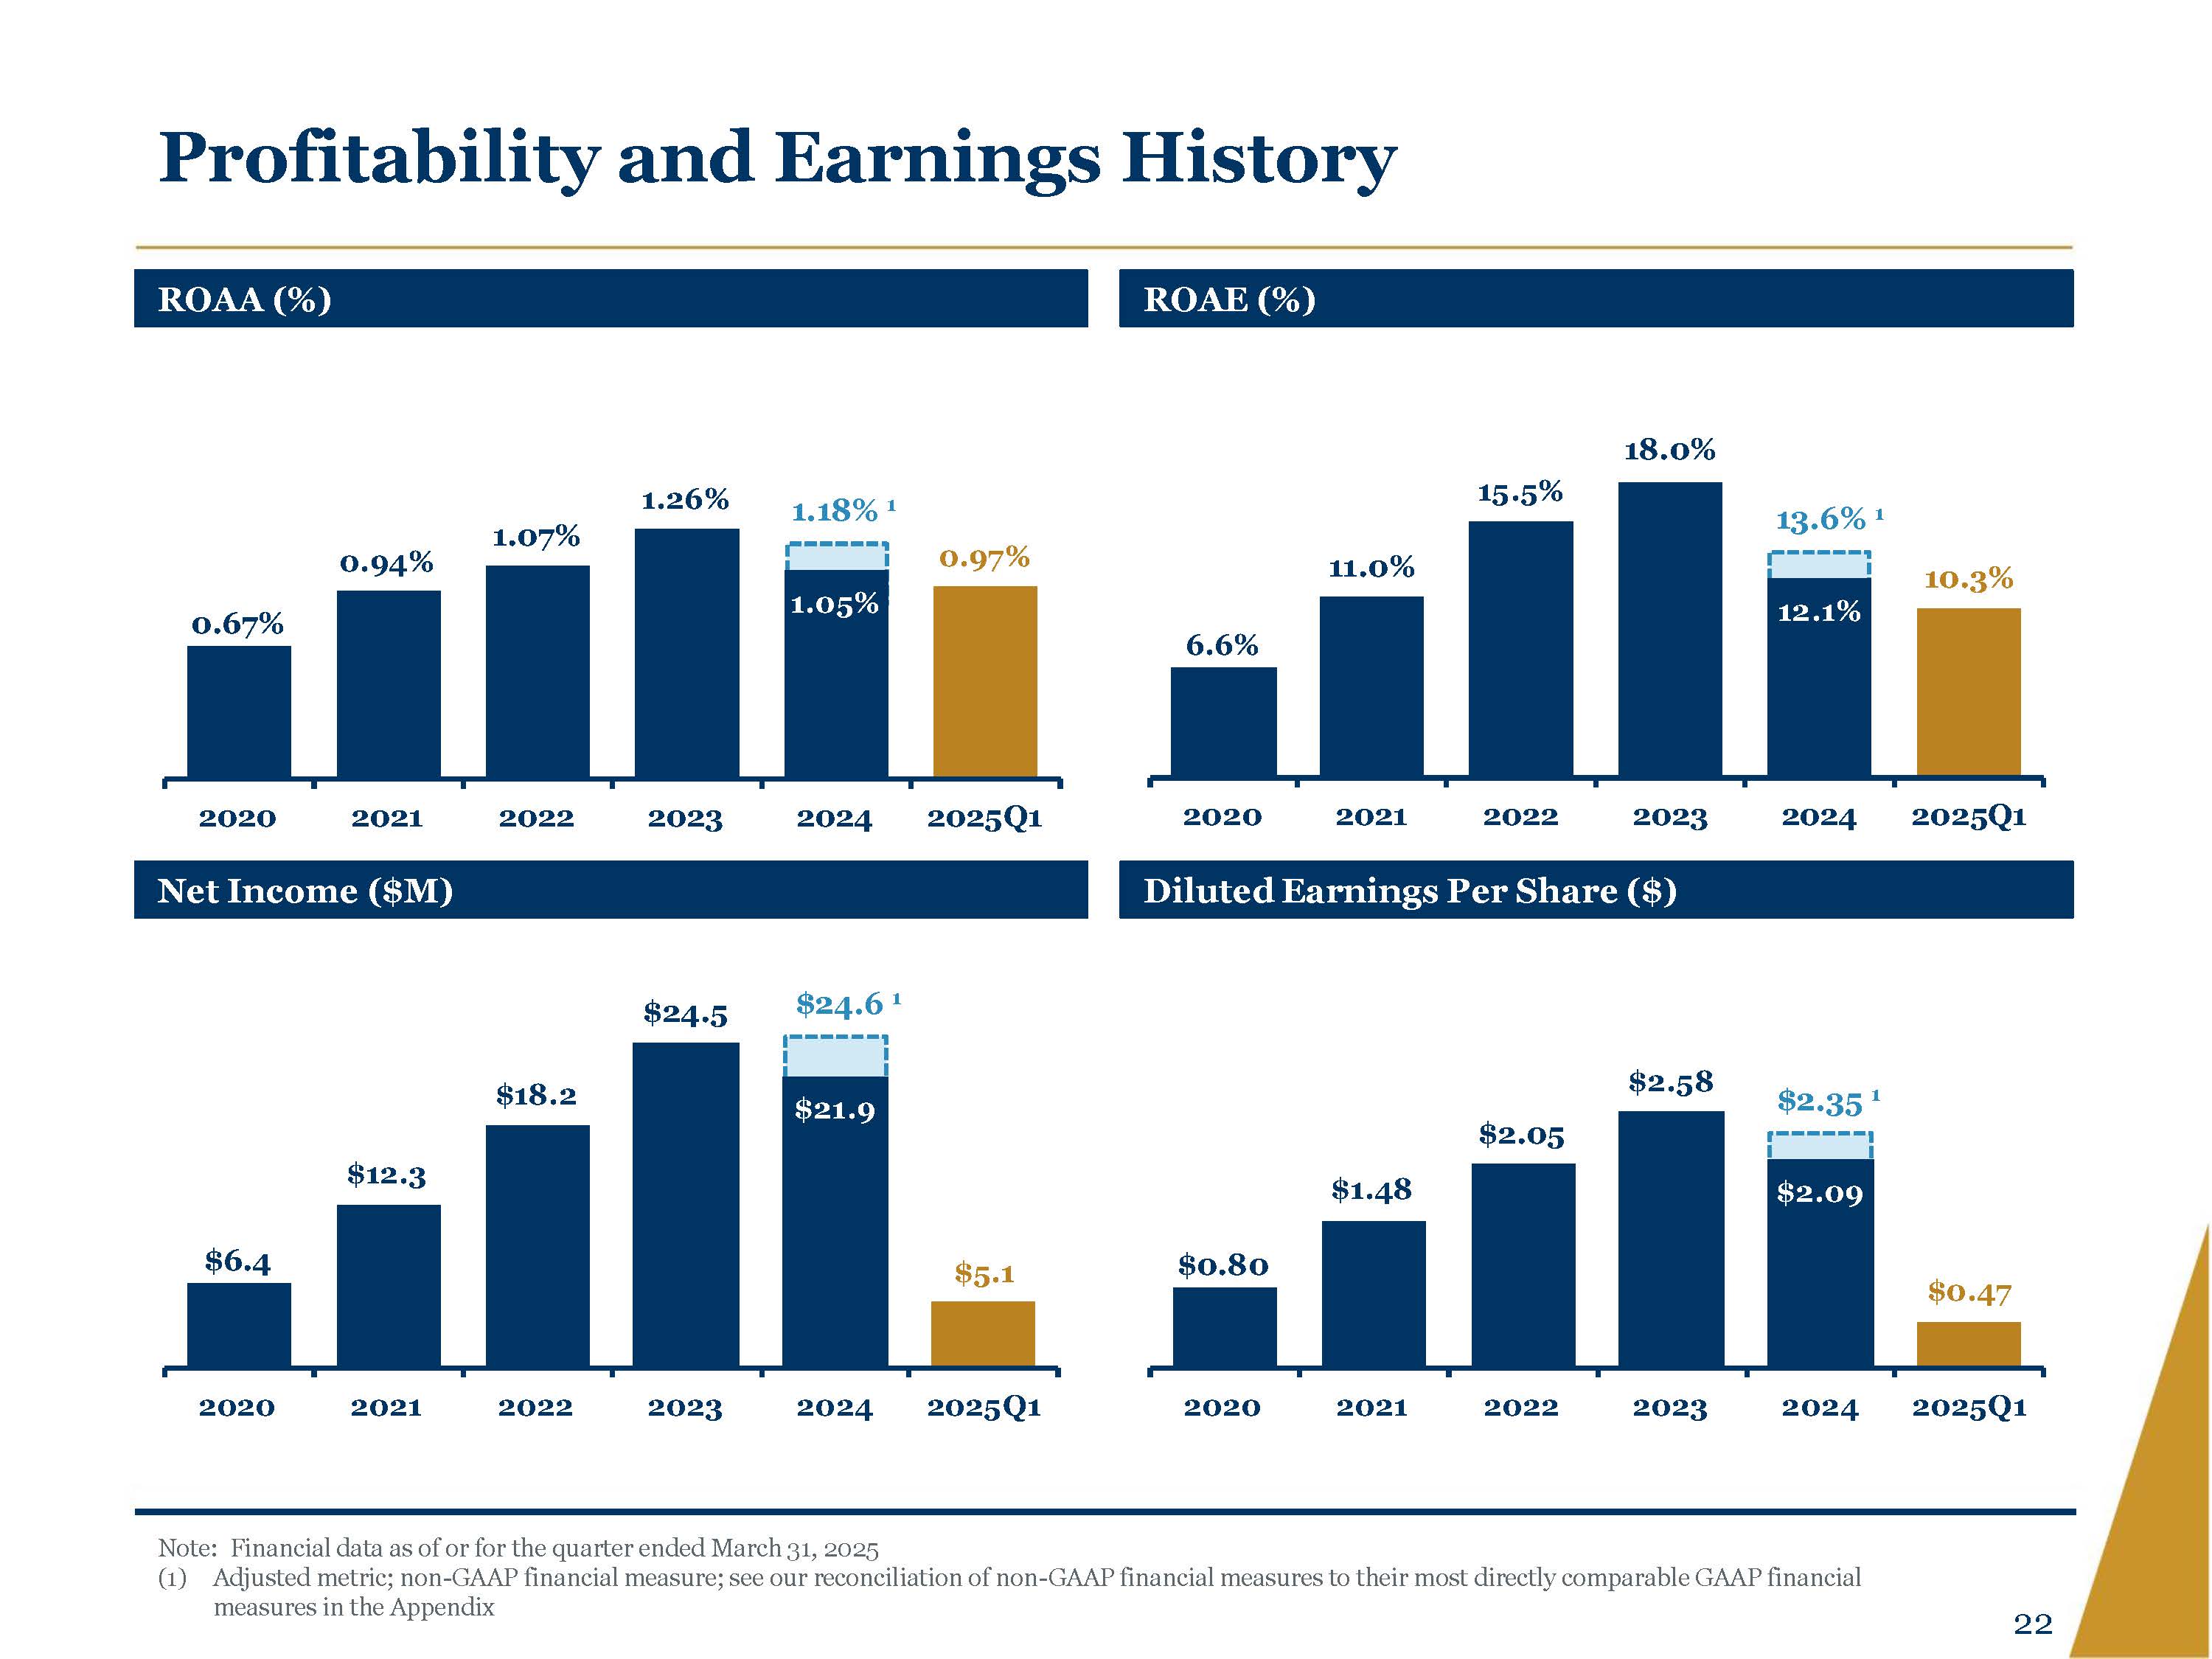
Profitability and Earnings History ROAA (%) 0.67% 0.94% 1.07% 1.26% 1.18% 1 1.05% 0.97% 2020 2021 2022 2023 2024 2025Q1 ROAE (%) 6.6% 11.0% 15.5% 18.0% 13.6% 1 12.1% 10.3% 2020 2021 2022 2023 2024 2025Q1 Net Income ($M) $6.4 $12.3 $18.2 $24.5 $24.6 1 $21.9 $5.1 2020 2021 2022 2023 2024 2025Q1 Diluted Earnings Per Share ($) $0.80 $1.48 $2.05 $2.58 $2.35 1 $2.09 $0.47 2020 2021 2022 2023 2024 2025Q1 Note: Financial data as of or for the quarter ended March 31, 2025 (1) Adjusted metric; non-GAAP financial measure; see our reconciliation of non-GAAP financial measures to their most directly comparable GAAP financial measures in the Appendix 22
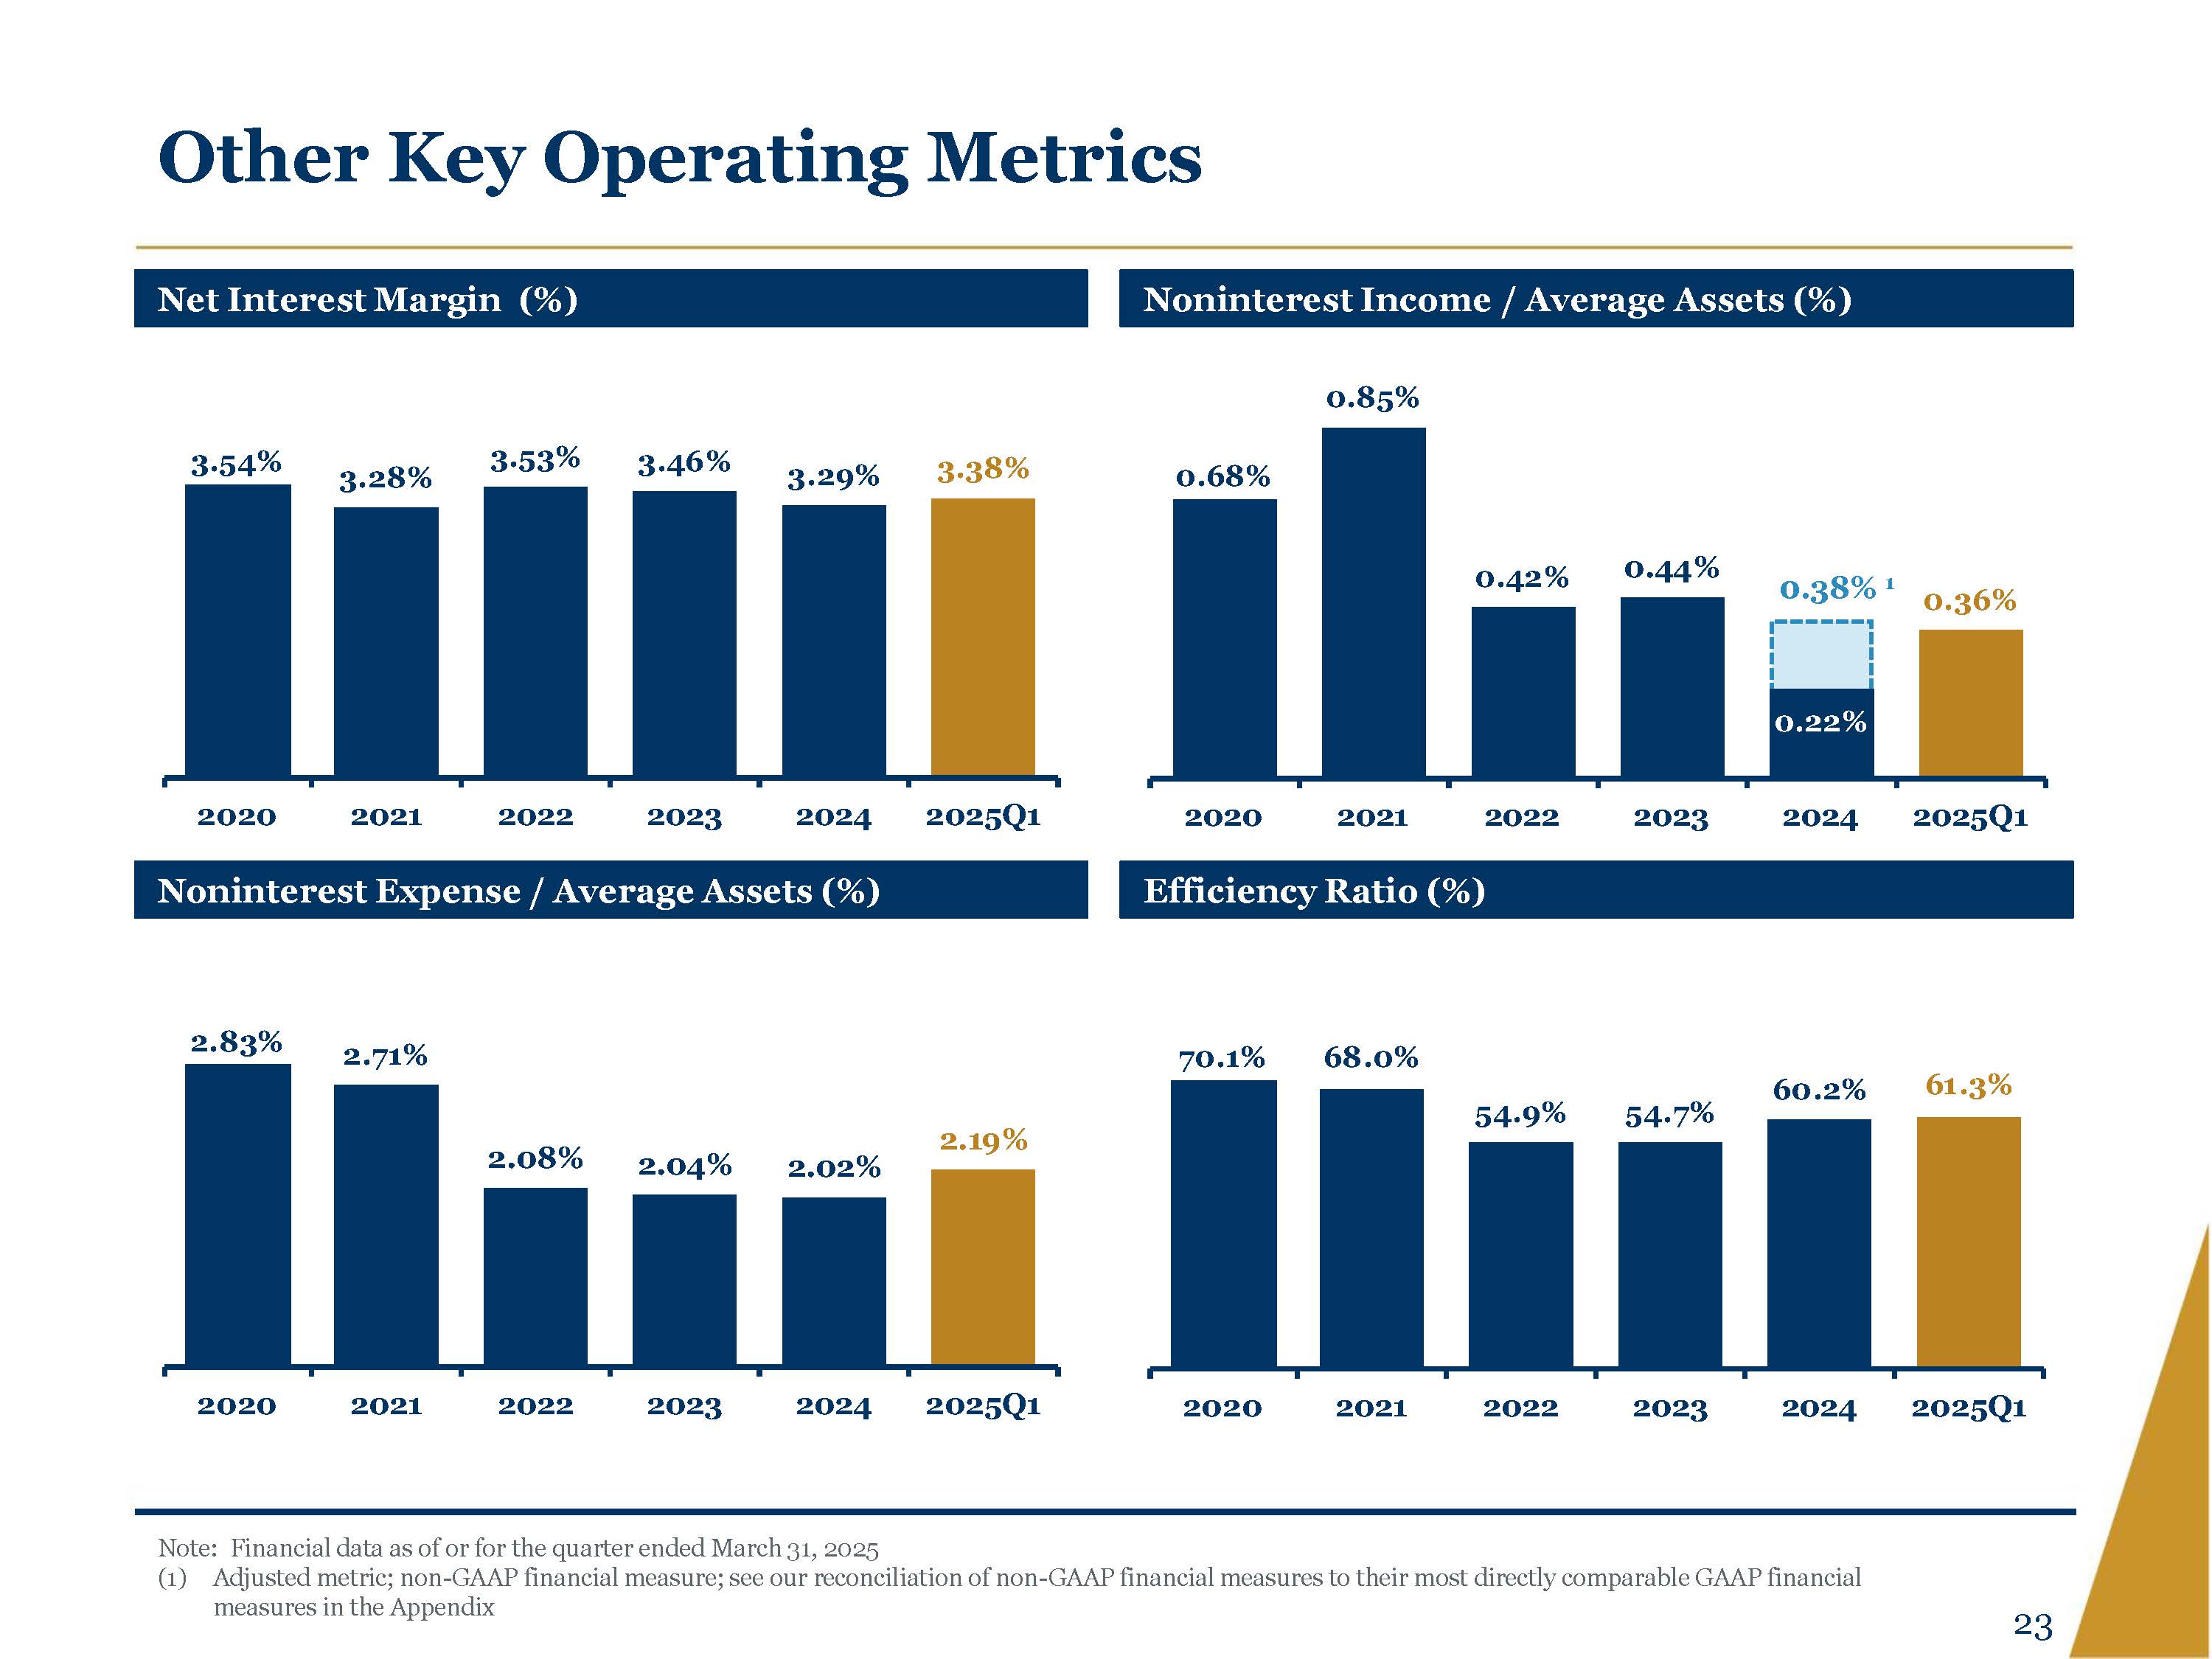
Other Key Operating Metrics Net Interest Margin (%) 3.54% 3.28% 3.53% 3.46% 3.29% 3.38% 2020 2021 2022 2023 2024 2025Q1 Noninterest Income / Average Assets (%) 0.68% 0.85% 0.42% 0.44% 0.38% 1 0.22% 0.36% 2020 2021 2022 2023 2024 2025Q1 Noninterest Expense / Average Assets (%) 2.83% 2.71% 2.08% 2.04% 2.02% 2.19% 2020 2021 2022 2023 2024 2025Q1 Efficiency Ratio (%) 70.1% 68.0% 54.9% 54.7% 60.2% 61.3% 2020 2021 2022 2023 2024 2025Q1 Note: Financial data as of or for the quarter ended March 31, 2025 (1) Adjusted metric; non-GAAP financial measure; see our reconciliation of non-GAAP financial measures to their most directly comparable GAAP financial measures in the Appendix 23
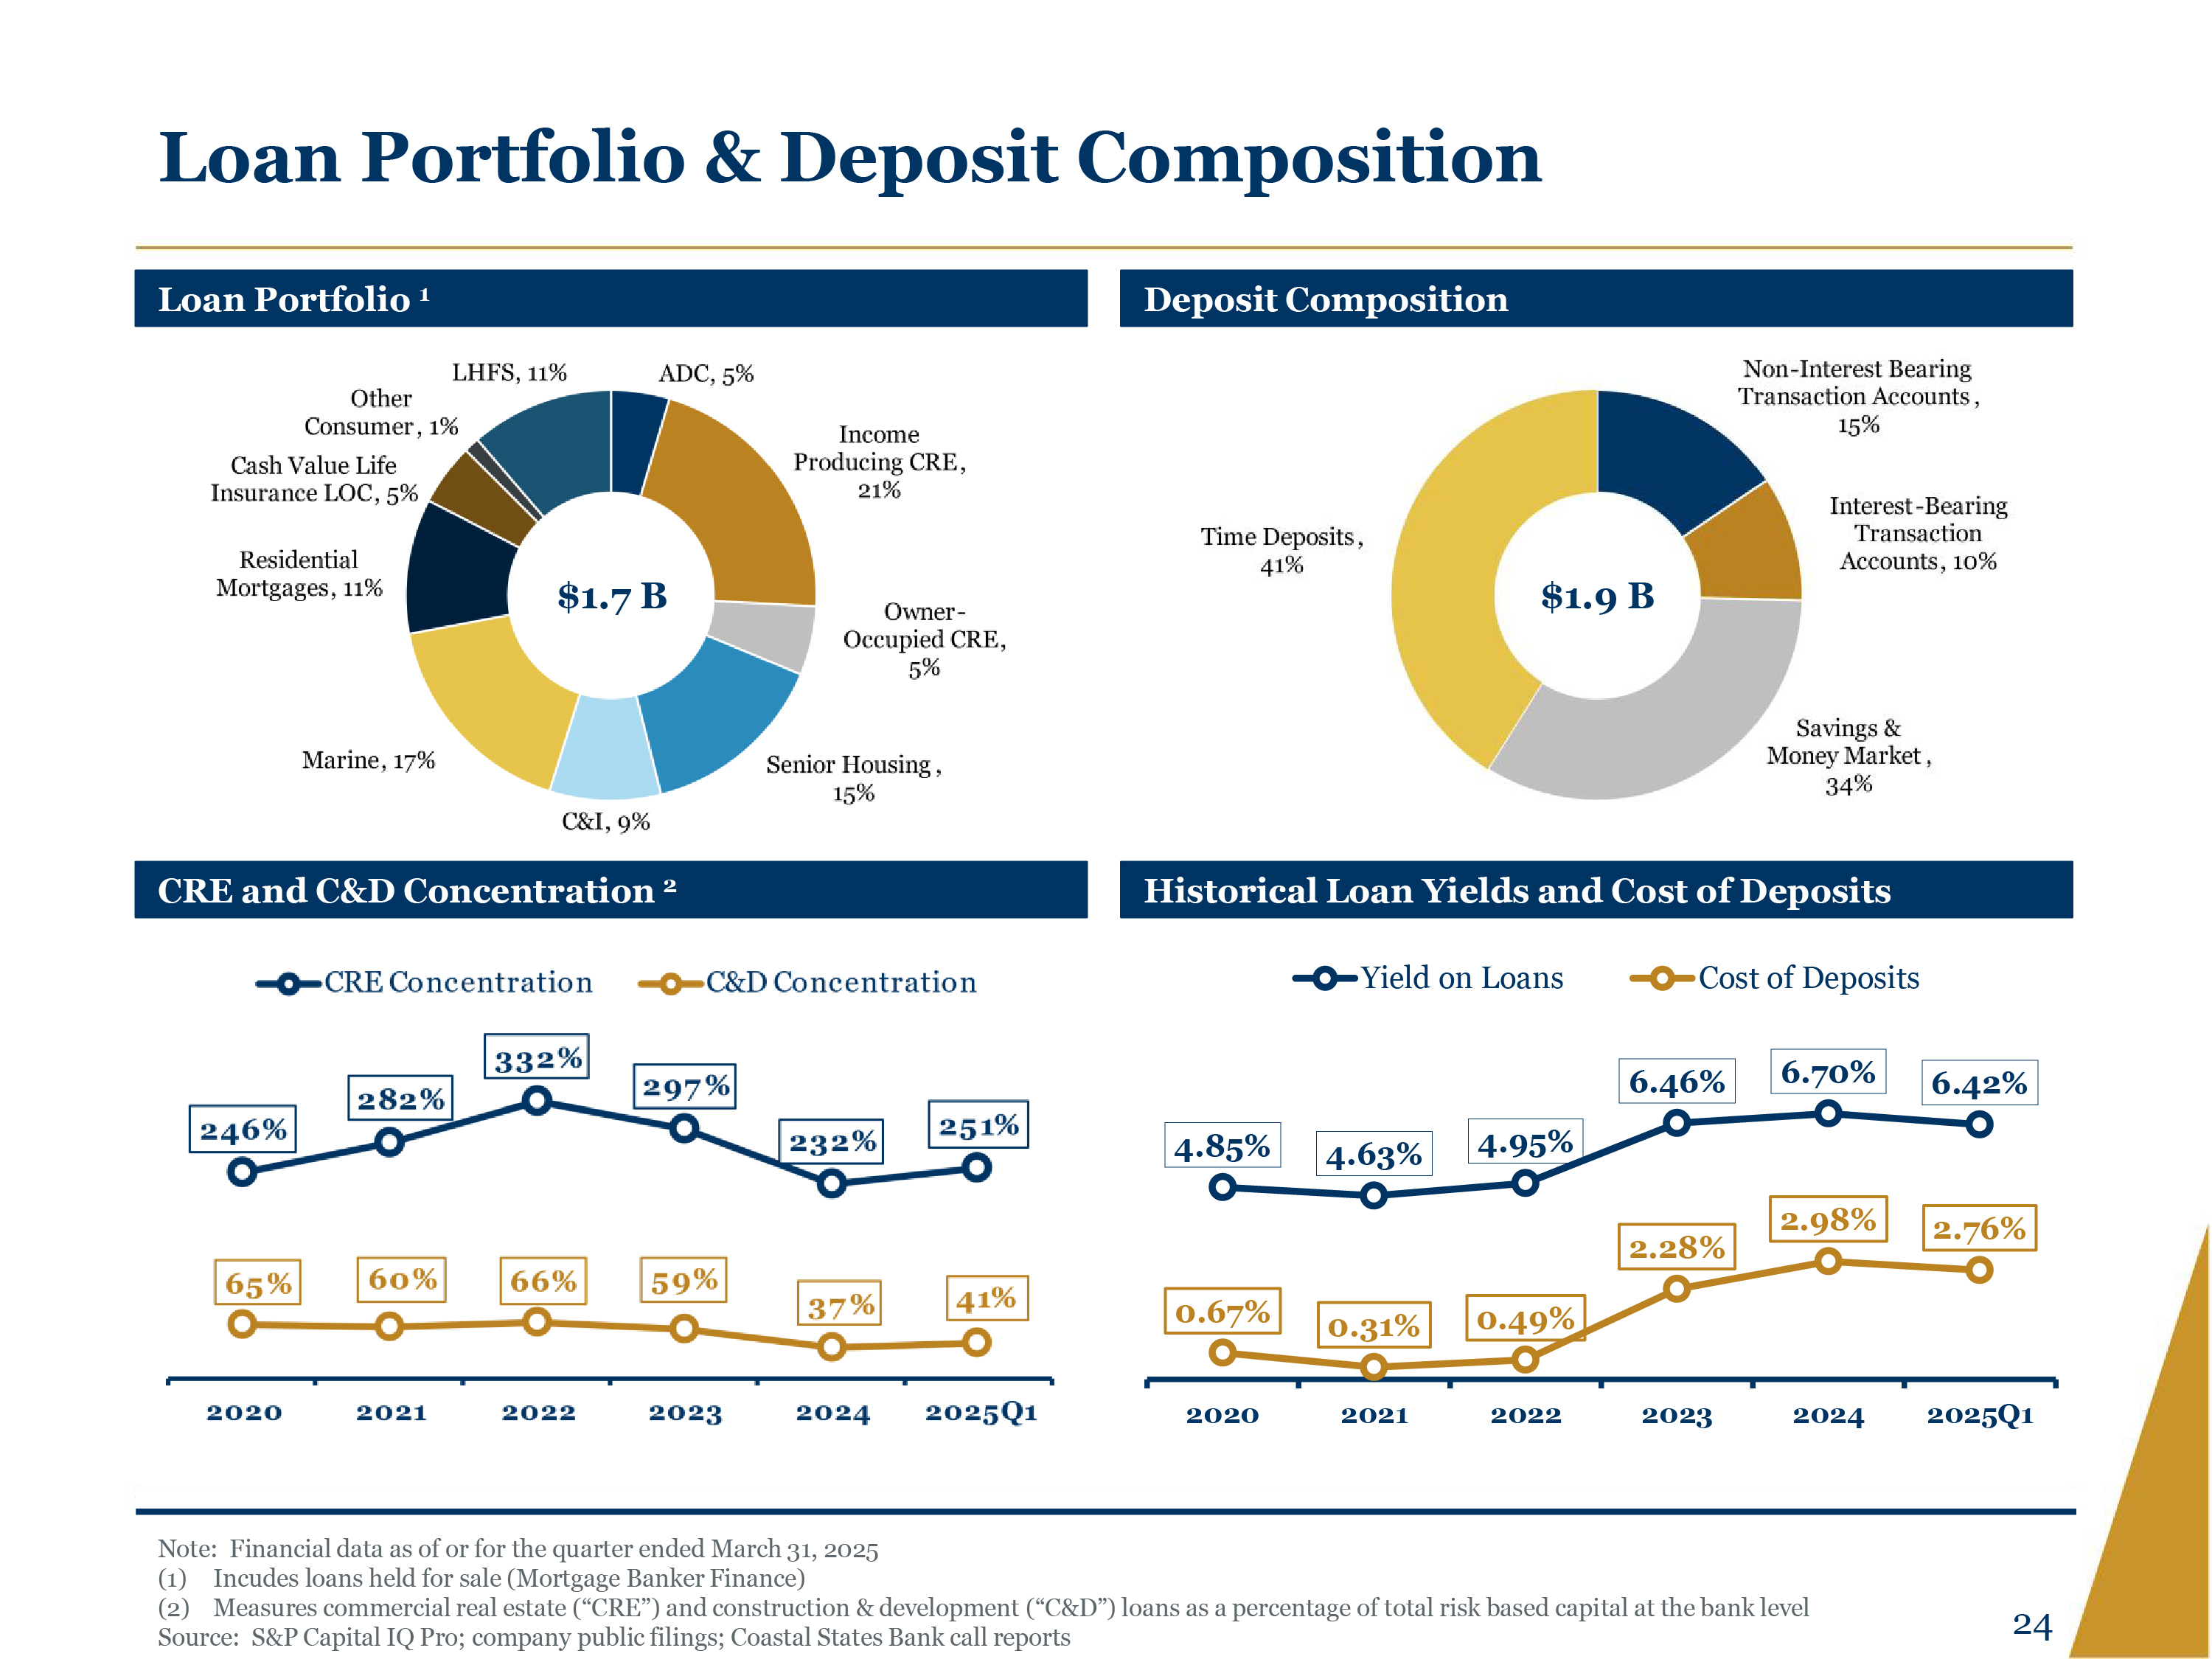
Loan Portfolio & Deposit Composition Loan Portfolio 1 LHFS, 11% other Consumer, 1% Cash Value Life Insurance LOC, 5% Residential Mortgage, 11% Marine, 17% C&I, 9% Senior Housing, 15% Owner-Occupied CRE, 5% Income Producing CRE, 21% ADC, 5% $1.7B CRE and C&D Concentration 2 CRE Concentration C&D Concentration 246% 282% 332% 297% 232% 251% 65% 60% 66% 59% 37% 41% 2020 2021 2022 2023 2024 2025Q1 Deposit Composition Time Deposits, 41% Saving & Money Market, 34% Interest-Bearing Transaction Accounts, 10% Non-Interest Bearing Transaction Accounts, 15% $1.9B Historical Loan Yields and Cost of Deposits Yield on Loans Cost of Deposits 4.85% 4.63% 4.95% 6.46% 6.70% 6.42% 0.67% 0.31% 0.49% 2.28% 2.98% 2.76% 2020 2021 2022 2023 2024 2025Q1 Note: Financial data as of or for the quarter ended March 31, 2025 1) Incudes loans held for sale (Mortgage Banker Finance) 2) Measures commercial real estate (“CRE”) and construction & development (“C&D”) loans as a percentage of total risk-based capital at the bank level Source: S&P Capital IQ Pro; company public filings; Coastal States Bank call reports 24
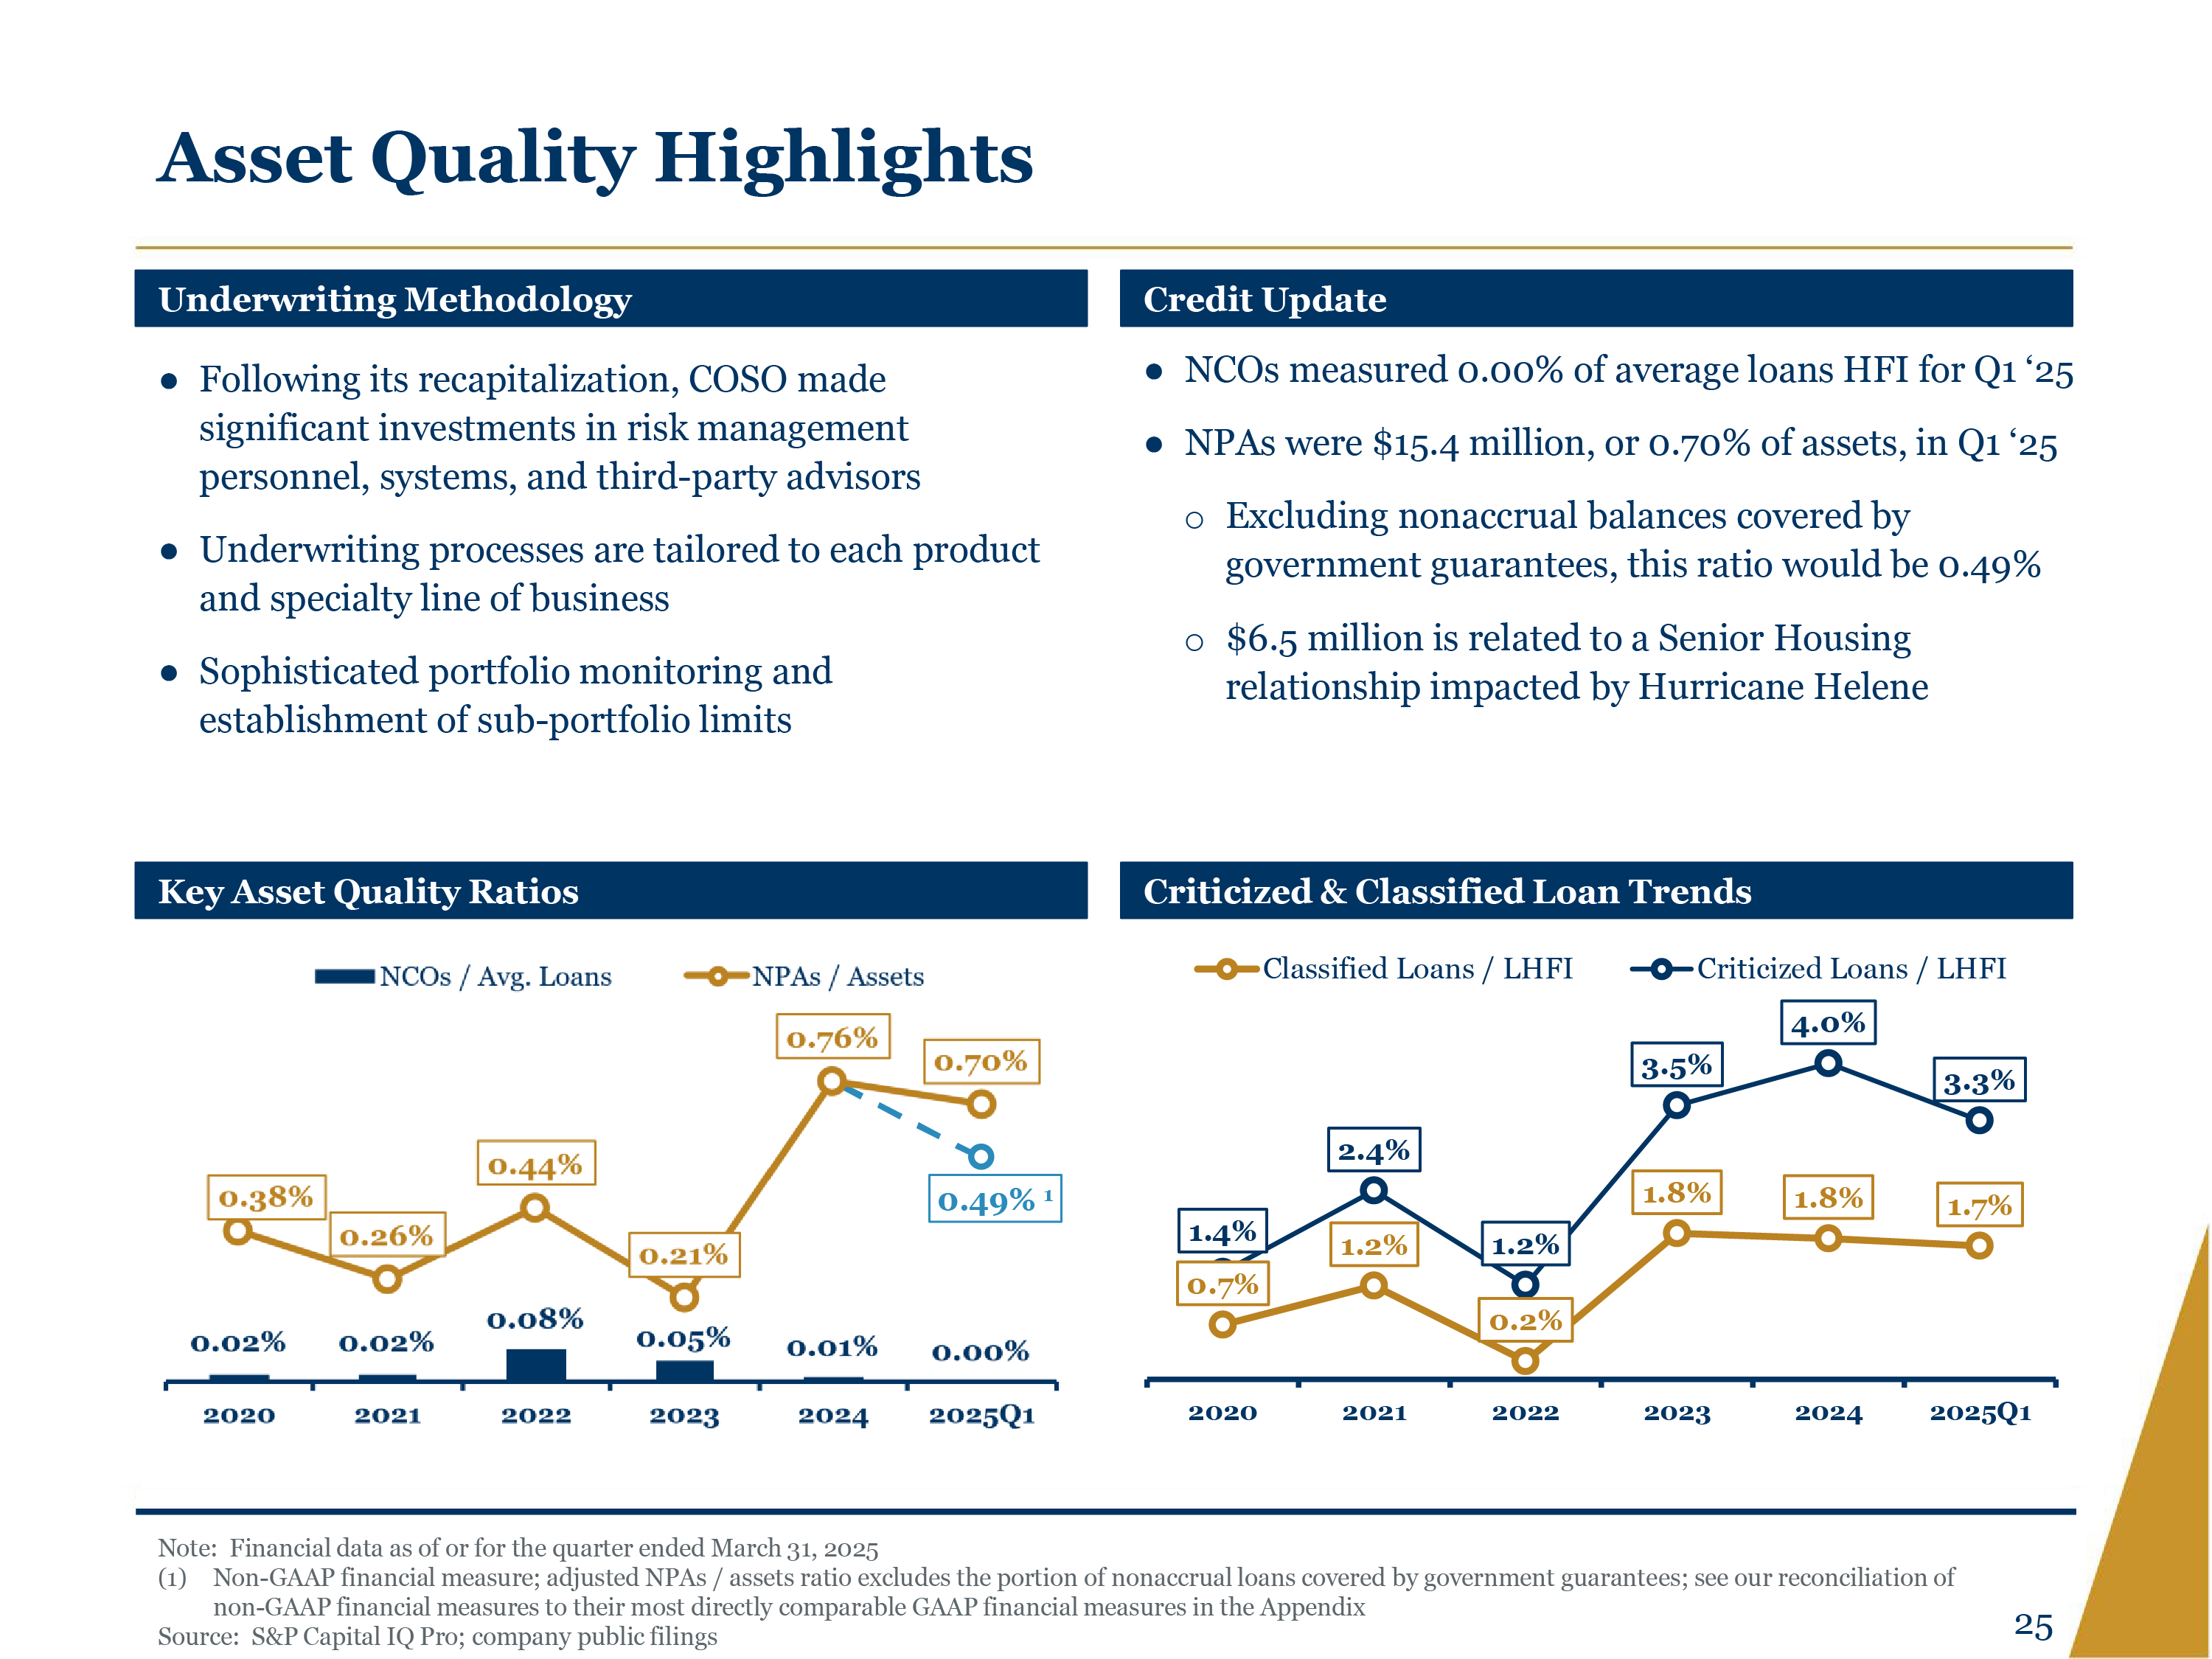
Asset Quality Highlights Underwriting Methodology Following its recapitalization, COSO made significant investments in risk management personnel, systems, and third-party advisors Underwriting processes are tailored to each product and specialty line of business Sophisticated portfolio monitoring and establishment of sub-portfolio limits Credit Update NCOs measured 0.00% of average loans HFI for Q1 ‘25 NPAs were $15.4 million, or 0.70% of assets, in Q1 ‘25 Excluding nonaccrual balances covered by government guarantees, this ratio would be 0.49% $6.5 million is related to a Senior Housing relationship impacted by Hurricane Helene Key Asset Quality Ratios NCOs / Avg. Loans NPAs / Assets 0.38% 0.26% 0.44% 0.21% 0.76% 0.70% 0.49% 1 0.02% 0.02% 0.08% 0.05% 0.01% 0.00% 2020 2021 2022 2023 2024 2025Q1 Criticized & Classified Loan Trends Classified Loans / LHFI Criticized Loans / LHFI 1.4% 2.4% 1.2% 3.5% 4.0% 3.3% 0.7% 1.2% 0.2% 1.8% 1.8% 1.7% 2020 2021 2022 2023 2024 2025Q1 Note: Financial data as of or for the quarter ended March 31, 2025 (1) Non-GAAP financial measure; adjusted NPAs / assets ratio excludes the portion of nonaccrual loans covered by government guarantees; see our reconciliation of non-GAAP financial measures to their most directly comparable GAAP financial measures in the Appendix Source: S&P Capital IQ Pro; company public filings 25
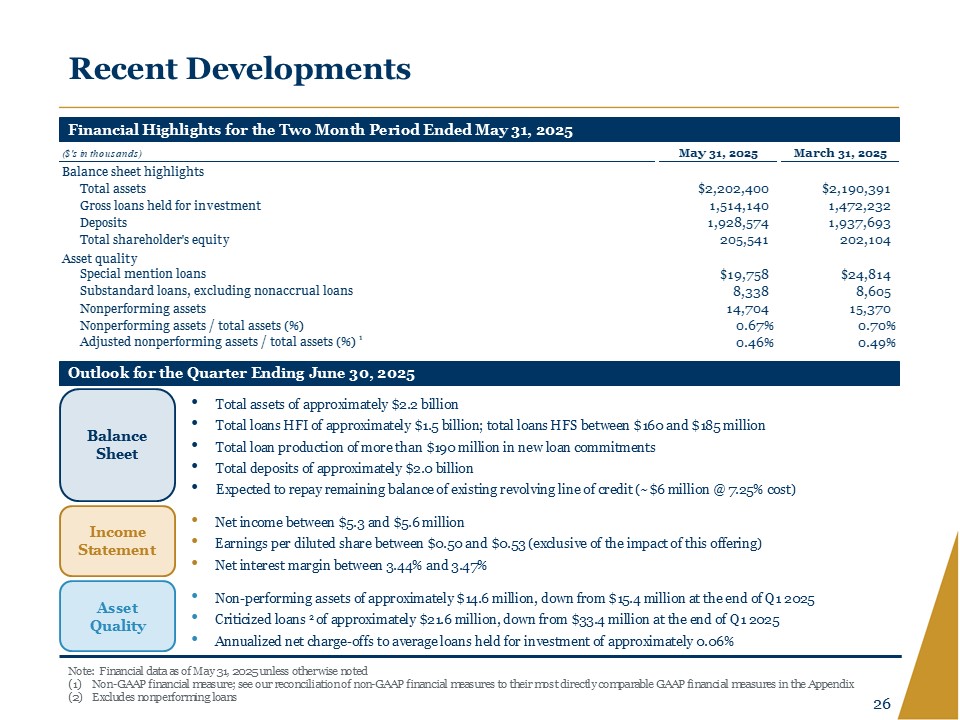
Financial Highlights for the Two Month Period Ended May 31, 2025 Balance sheet highlights Total assets Gross loans held for investment Deposits Total shareholder's equity Asset quality Special mention loans Substandard loans, excluding nonaccrual loans Nonperforming assets Nonperforming assets / total assets (%) Adjusted nonperforming assets / total assets (%) 1 $2,202,400 1,514,140 1,928,574 205,541 $19,758 8,338 14,704 0.67% 0.46% $2,190,391 1,472,232 1,937,693 202,104 $24,814 8,605 15,370 0.70% 0.49% Outlook for the Quarter Ending June 30, 2025 Outlook for the Quarter Ending June 30, 2025 Balance Sheet Total assets of approximately $2.2 billion Total loans HFI of approximately $1.5 billion; total loans HFS between $160 and $185 million Total loan production of more than $190 million in new loan commitments Total deposits of approximately $2.0 billion Expected to repay remaining balance of existing revolving line of credit (~$6 million @ 7.25% cost) Income Statement Net income between $5.3 and $5.6 million Earnings per diluted share between $0.50 and $0.53 (exclusive of the impact of this offering) Net interest margin between 3.44% and 3.47% Asset Quality Non-performing assets of approximately $14.6 million, down from $15.4 million at the end of Q1 2025 Criticized loans 2 of approximately $21.6 million, down from $33.4 million at the end of Q1 2025 Annualized net charge-offs to average loans held for investment of approximately 0.06% Note: Financial data as of May 31, 2025 unless otherwise noted (1) Non-GAAP financial measure; see our reconciliation of non-GAAP financial measures to their most directly comparable GAAP financial measures in the Appendix (2) Excludes nonperforming loans 26
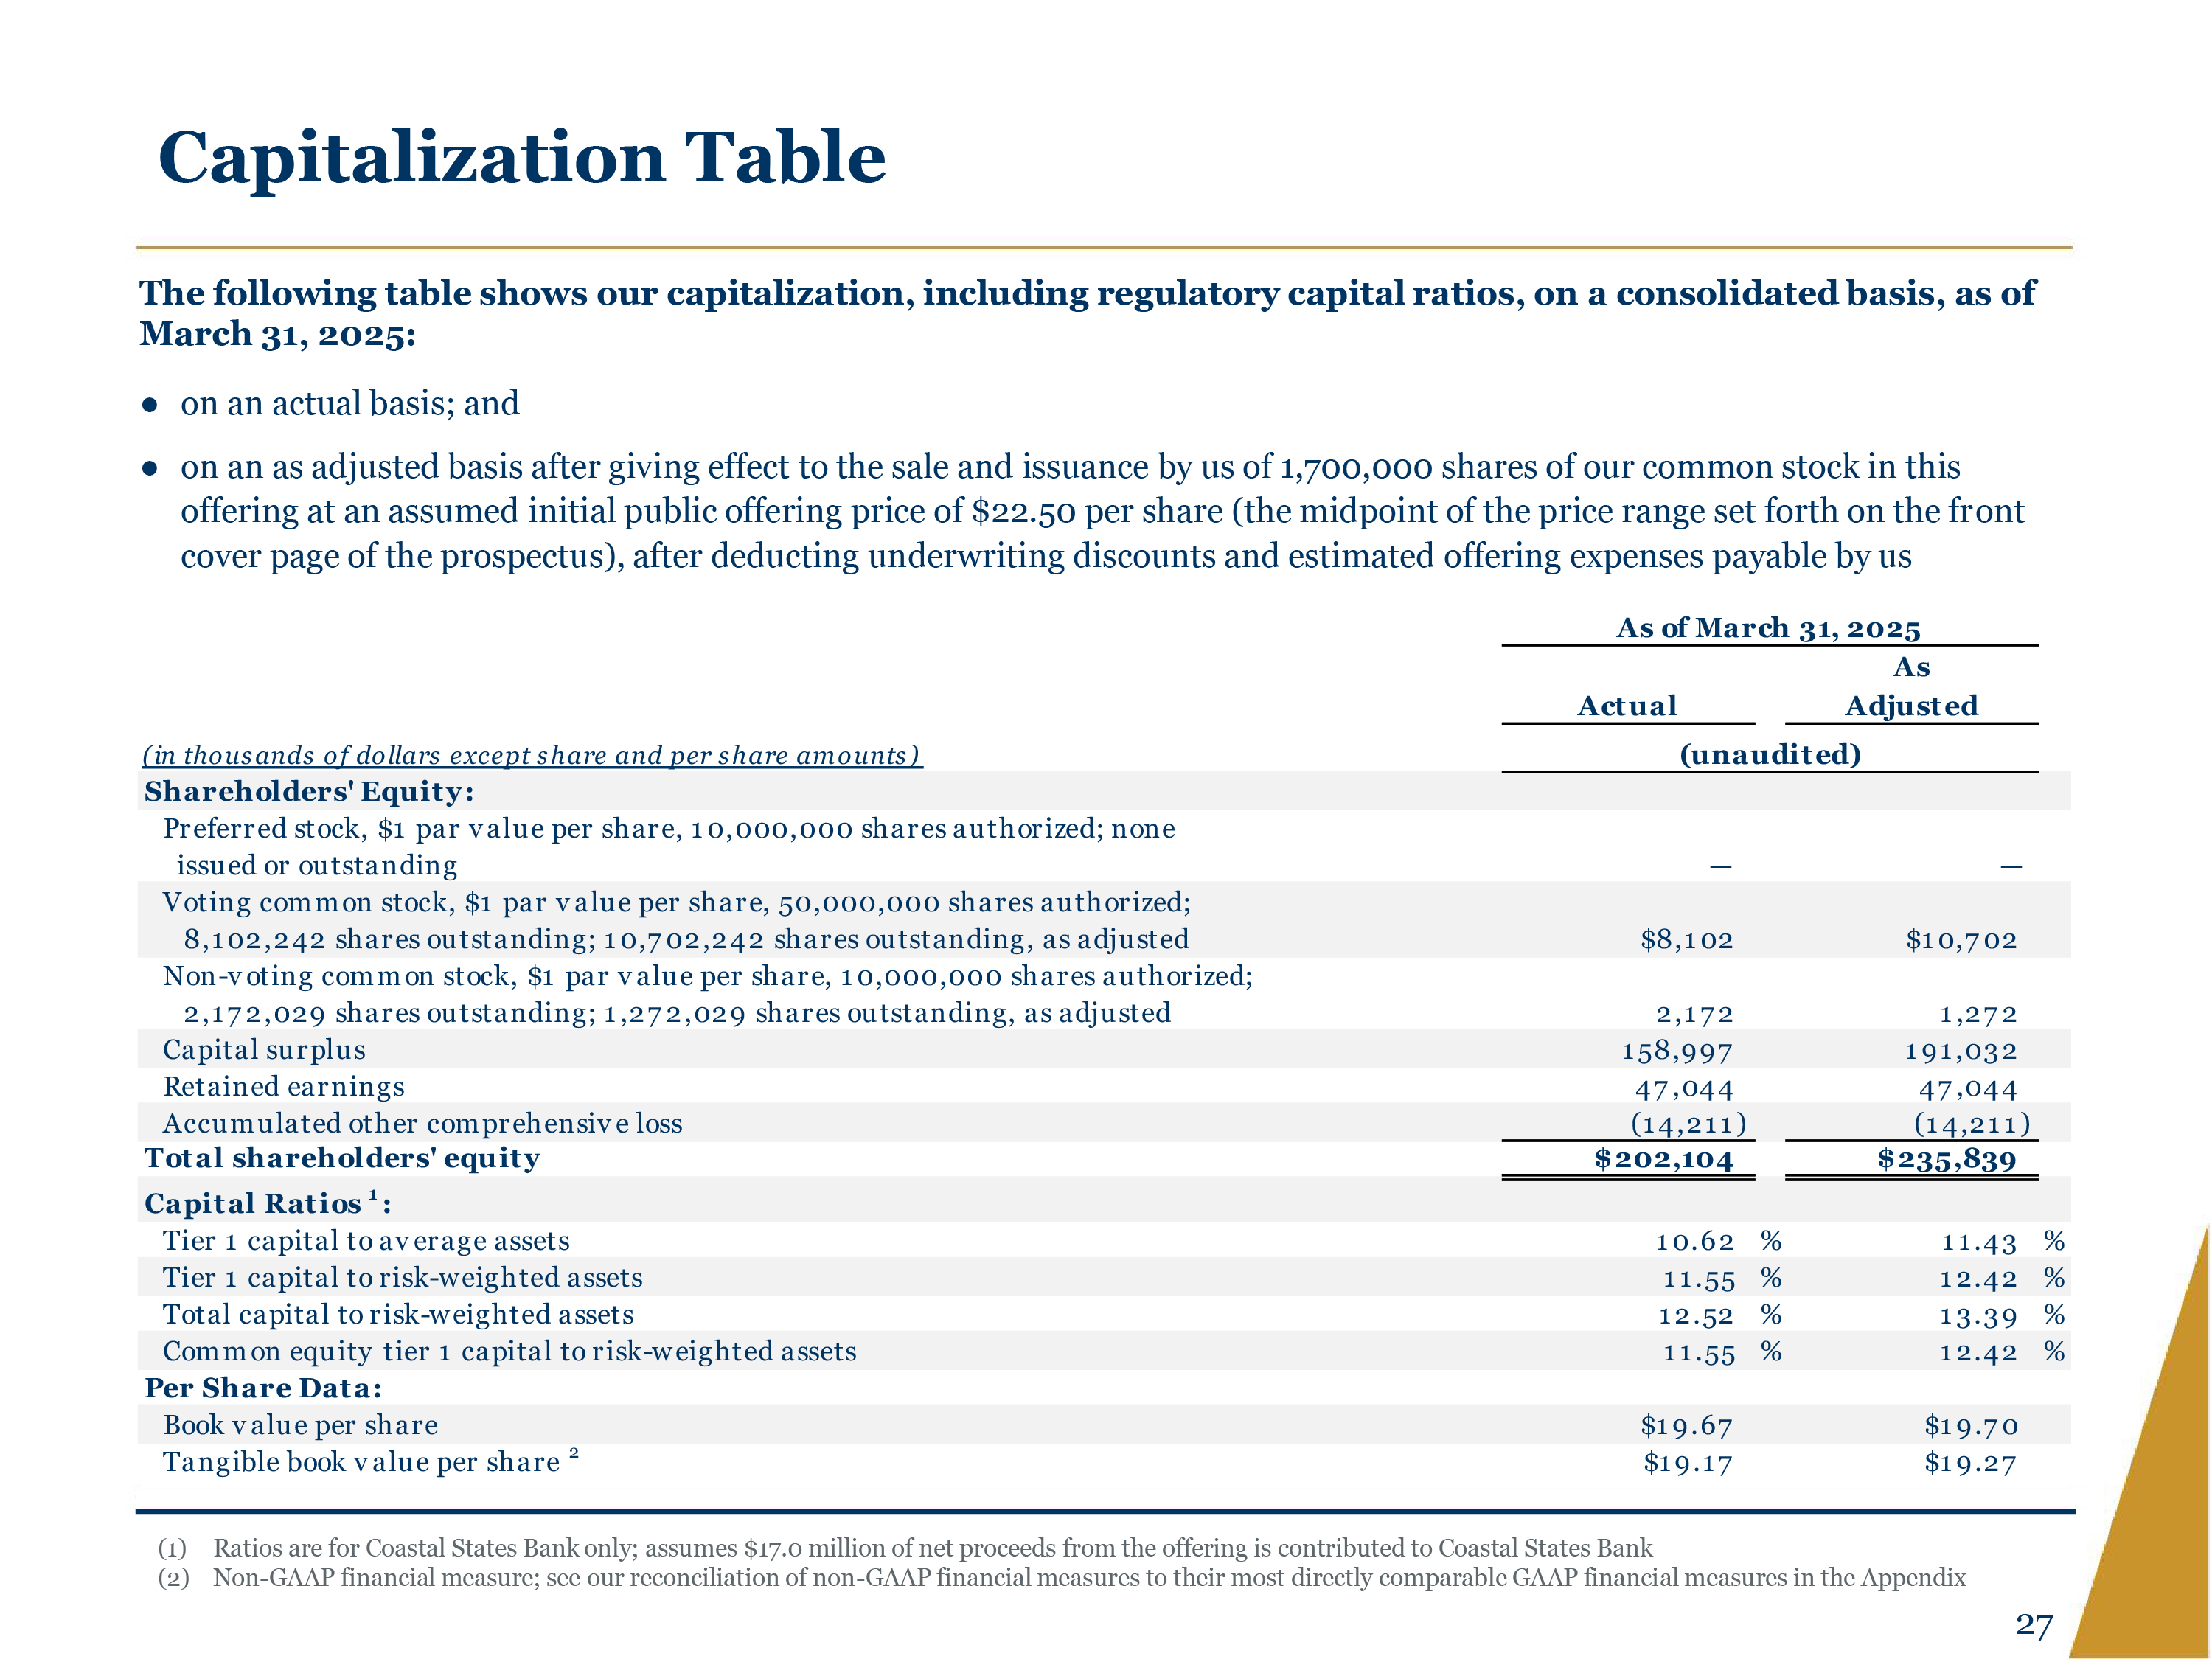
Capitalization Table The following table shows our capitalization, including regulatory capital ratios, on a consolidated basis, as of March 31, 2025: on an actual basis; and on an as adjusted basis after giving effect to the sale and issuance by us of 1,700,000 shares of our common stock in this offering at an assumed initial public offering price of $22.50 per share (the midpoint of the price range set forth on the front cover page of the prospectus), after deducting underwriting discounts and estimated offering expenses payable by us As of March 31, 2025 Actual As Adjusted (unaudited) (in thousands of dollars except share and per share amounts) Shareholders' Equity: Preferred stock, $1 par value per share, 10,000,000 shares authorized; none issued or outstanding — — Voting common stock, $1 par value per share, 50,000,000 shares authorized; 8,102,242 shares outstanding; 10,702,242 shares outstanding, as adjusted $8,102 $10,702 Non-voting common stock, $1 par value per share, 10,000,000 shares authorized; 2,172,029 shares outstanding; 1,272,029 shares outstanding, as adjusted 2,172 1,272 Capital surplus 158,997 192,720 Retained earnings 47,044 47,044 Accumulated other comprehensive loss (14,211) (14,211) Total shareholders' equity $202,104 $237,567 Capital Ratios 1: Tier 1 capital to average assets 10.62% 11.43% Tier 1 capital to risk-weighted assets 11.55% 12.42% Total capital to risk-weighted assets 12.52% 13.39% Common equity Tier 1 capital to risk-weighted assets 11.55% 12.42% Per Share Data: Book value per share $19.67 $19.70 Tangible book value per share 2 $19.17 $19.27 (1) Ratios are for Coastal States Bank only; assumes 75% of the net proceeds, or $25.3 million, is contributed to the bank (2) Non-GAAP financial measure; see our reconciliation of non-GAAP financial measures to their most directly comparable GAAP financial measures in the Appendix 27
Investment Summary Best-in-Class Management Favorable Demographic Trends Strong Core Funding Profile within Sizable and Growing Markets Established, Efficient and Growing Commercial Franchise Scalable Specialty Lines of Business Robust Risk Management Process 28
COASTALSOUTH BANCSHARES, INC. Appendix
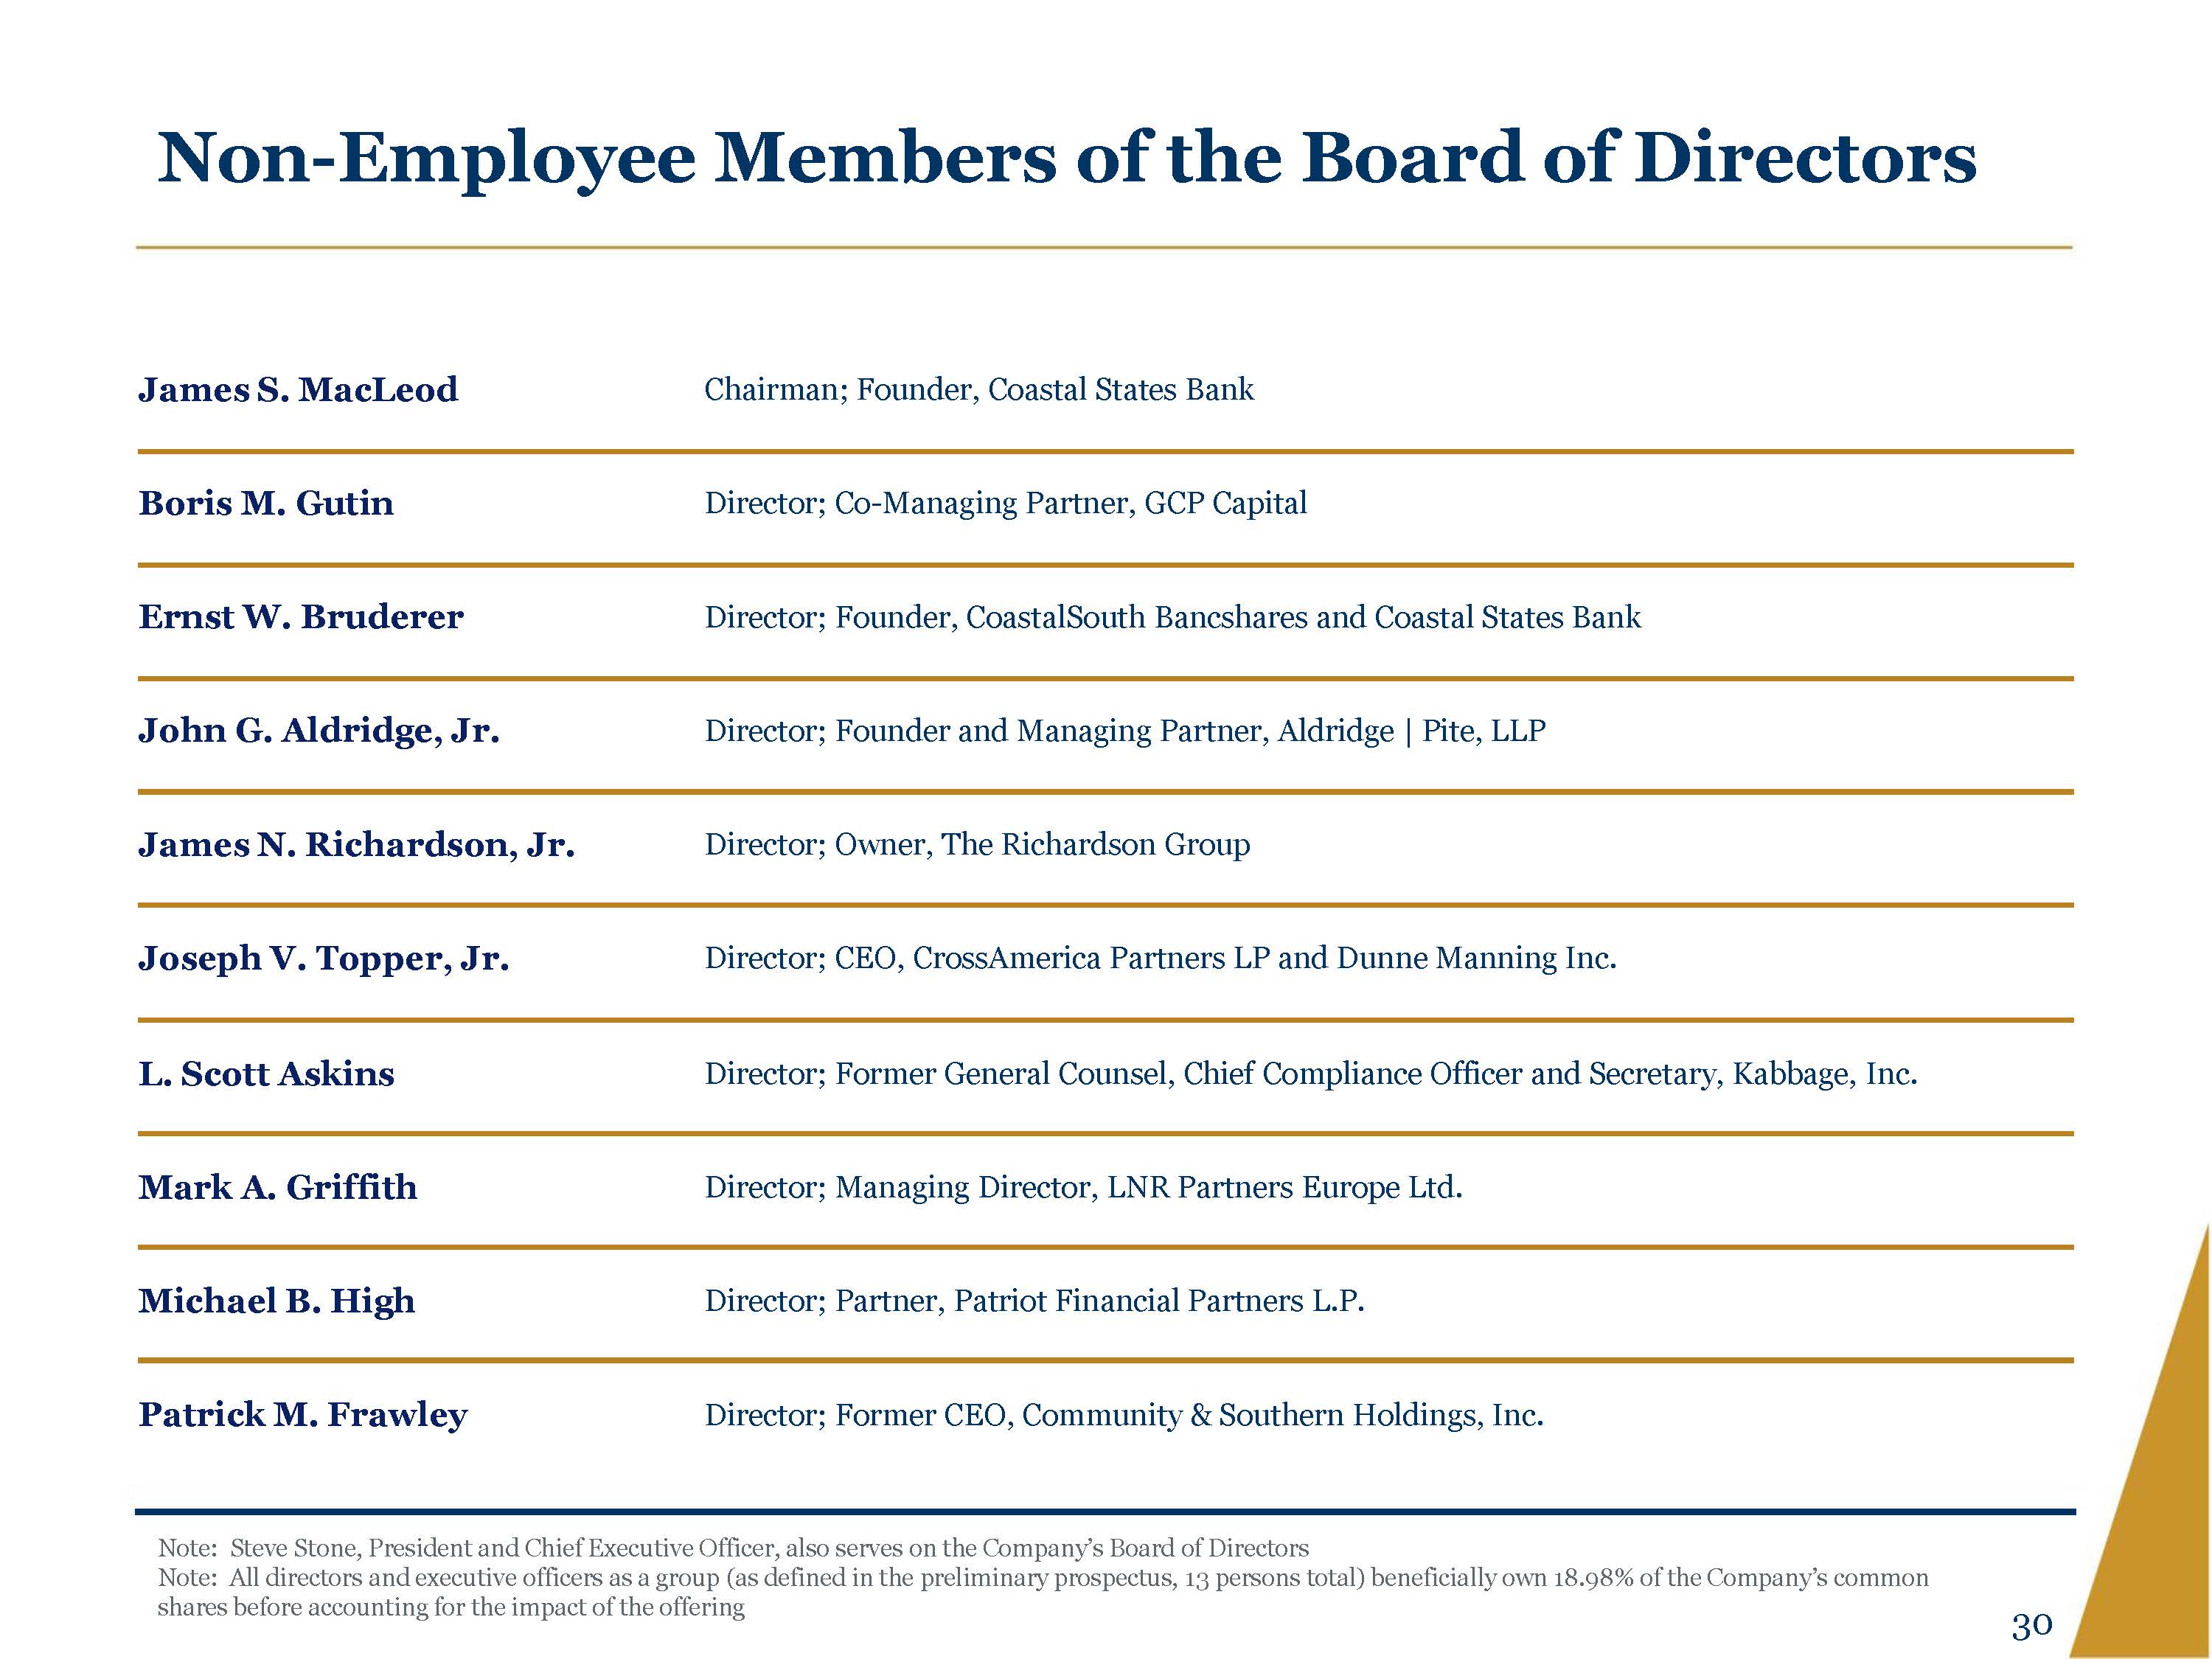
Non-Employee Members of the Board of Directors James S. MacLeod Chairman; Founder, Coastal States Bank Boris M. Gutin Director; Co-Managing Partner, GCP Capital Ernst W. Bruderer Director; Founder, CoastalSouth Bancshares and Coastal States Bank John G. Aldridge, Jr. Director; Founder and Managing Partner, Aldridge | Pite, LLP James N. Richardson, Jr. Director; Owner, The Richardson Group Joseph V. Topper, Jr. Director; CEO, CrossAmerica Partners LP and Dunne Manning Inc. L. Scott Askins Director; Former General Counsel, Chief Compliance Officer and Secretary, Kabbage, Inc. Mark A. Griffith Director; Managing Director, LNR Partners Europe Ltd. Michael B. High Director; Partner, Patriot Financial Partners L.P. Patrick M. Frawley Director; Former CEO, Community & Southern Holdings, Inc. Note: Steve Stone, President and Chief Executive Officer, also serves on the Company’s Board of Directors Note: All directors and executive officers as a group (as defined in the preliminary prospectus, 13 persons total) beneficially own 18.98% of the Company’s common shares before accounting for the impact of the offering 30
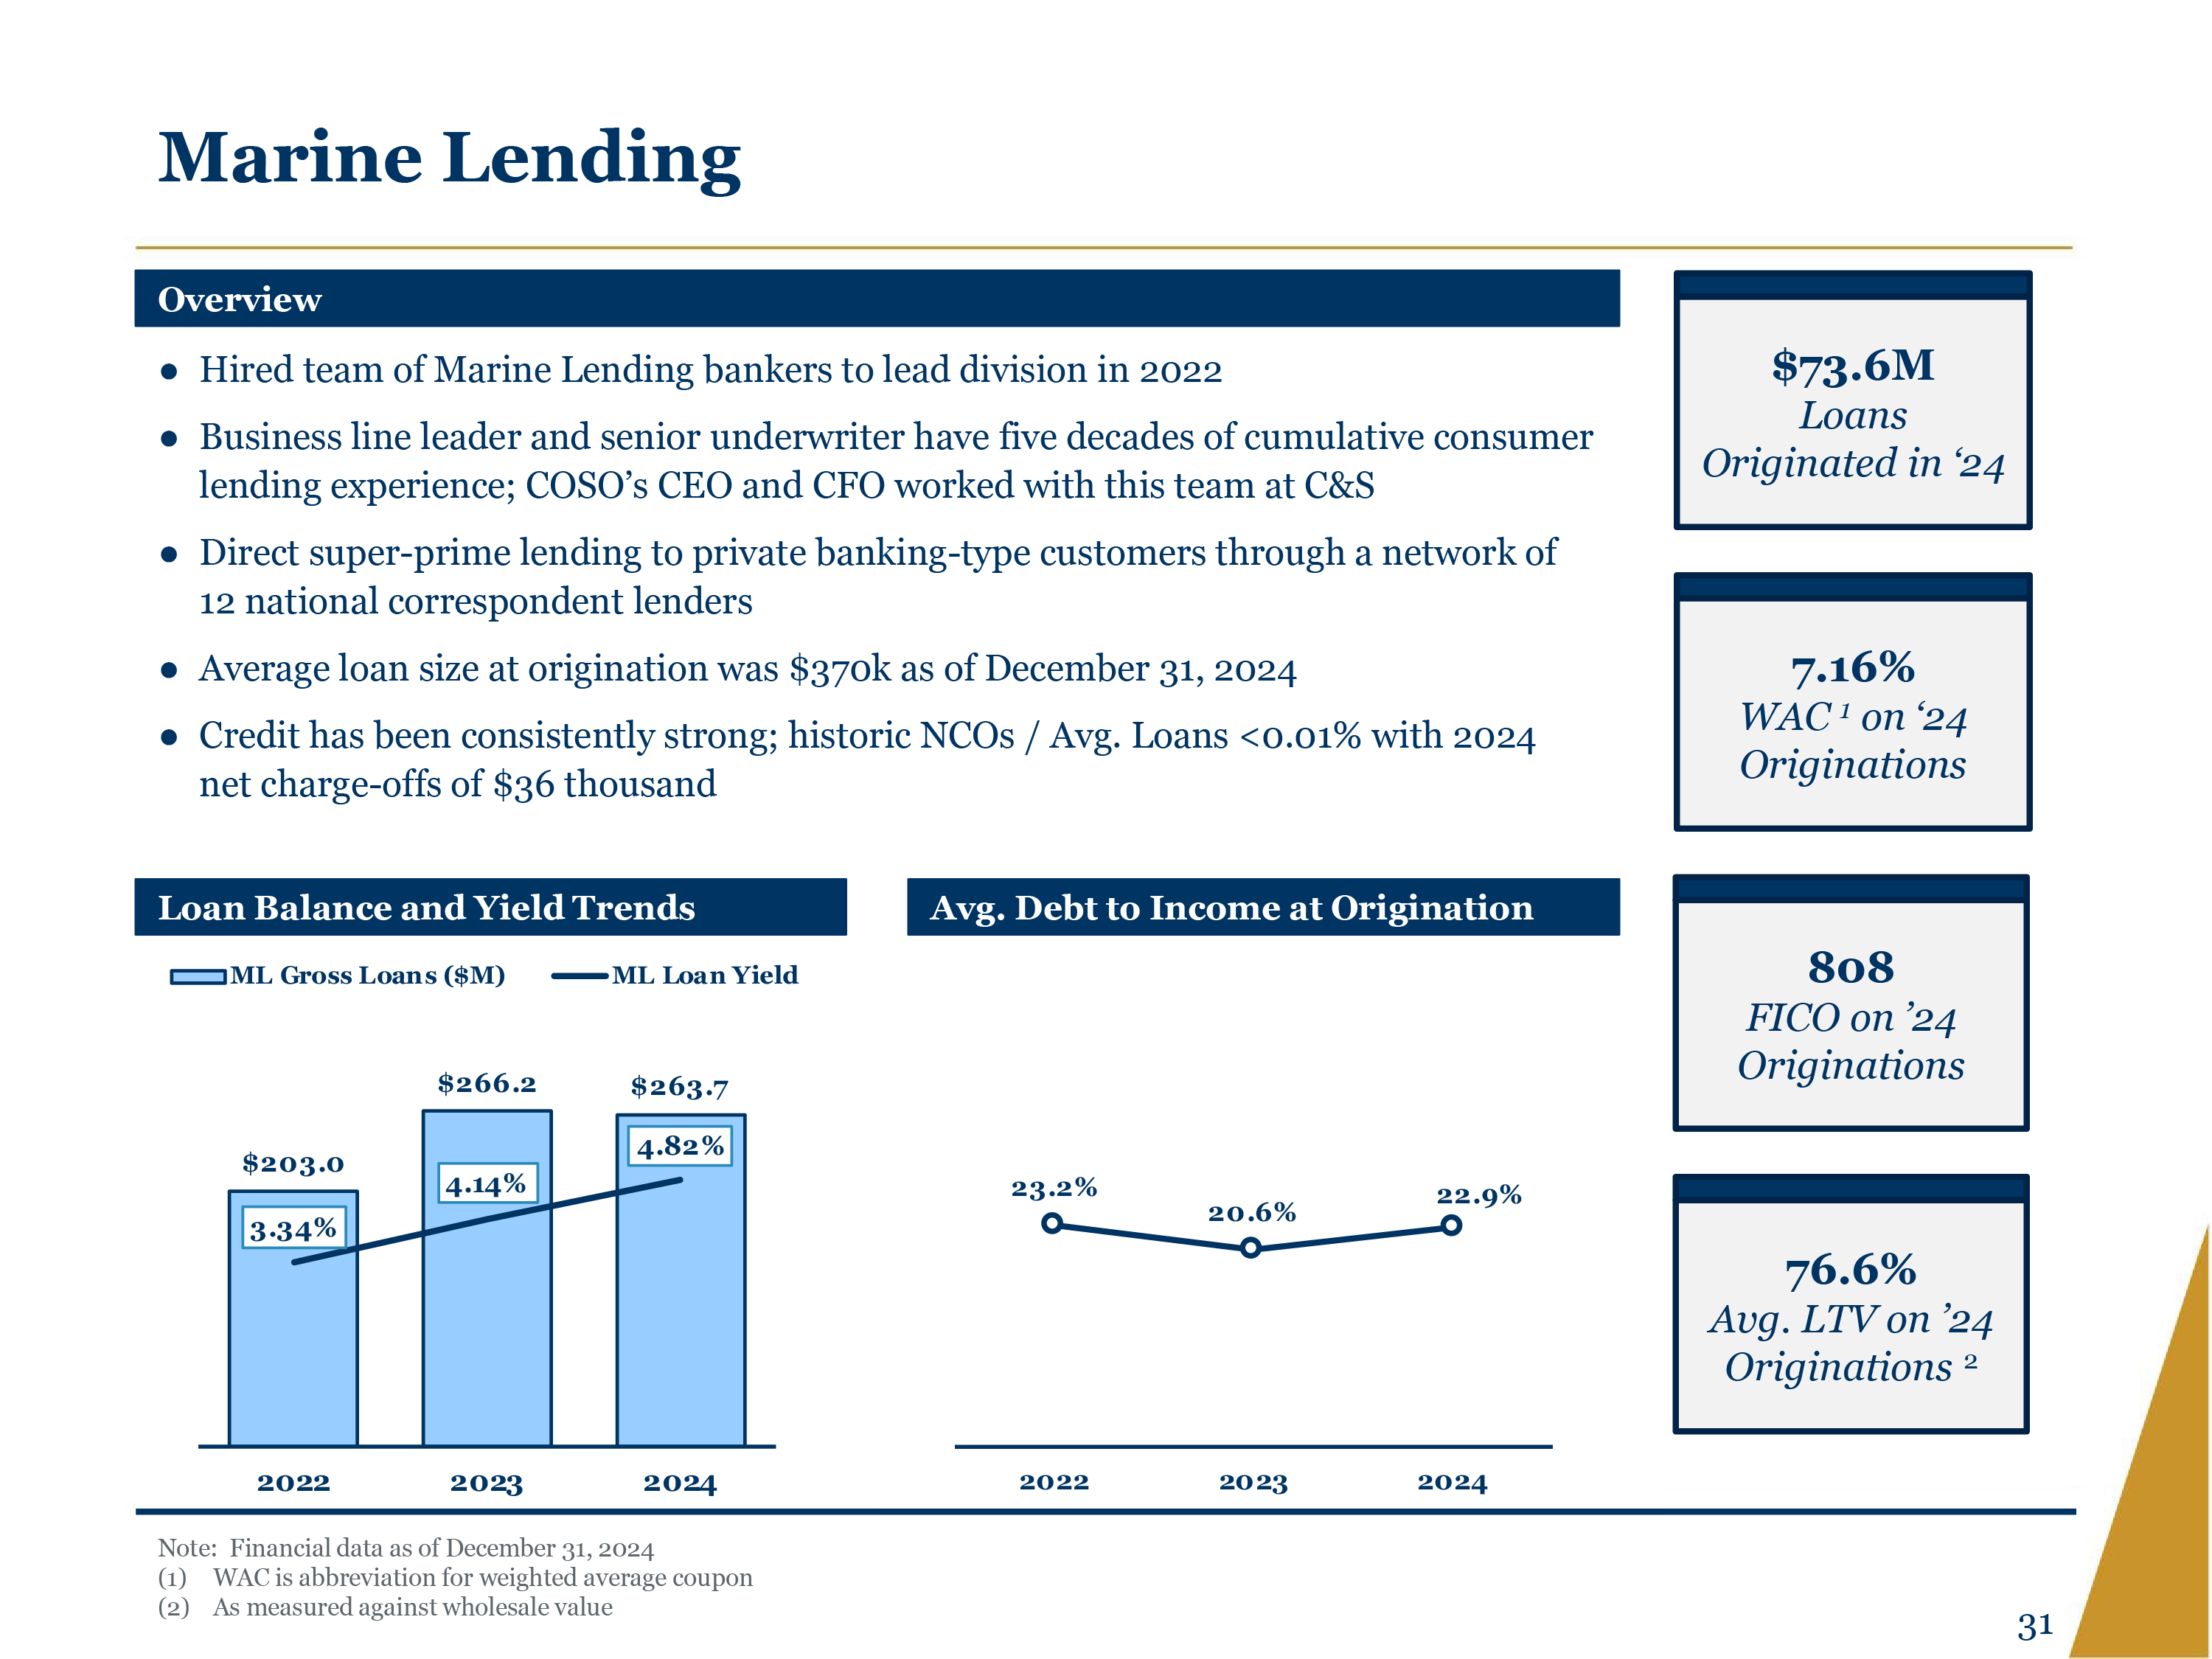
Marine Lending Overview Hired team of Marine Lending bankers to lead division in 2022 Business line leader and senior underwriter have five decades of cumulative consumer lending experience; COSO’s CEO and CFO worked with this team at C&S Direct super-prime lending to private banking-type customers through a network of 12 national correspondent lenders Average loan size at origination was $370k as of December 31, 2024 Credit has been consistently strong; historic NCOs / Avg. Loans <0.01% with 2024 net charge-offs of $36 thousand $73.6M Loans Originated in ‘24 7.16% WAC 1 on ‘24 Originations Loan Balance and Yield Trends Avg. Debt to Income at Origination ML Gross loans ($M) ML Loan Yield $203.0 3.34% 2022 $266.2 4.14 2023 $263.7 4.82% 2024 23.2% 2022 20.6% 2023 22.9% 2024 808 FICO on ’24 Originations 76.6% Avg. LTV on ’24 Originations2 Note: Financial data as of December 31, 2024 (1) WAC is abbreviation for weighted average coupon (2) As measured against wholesale value 31
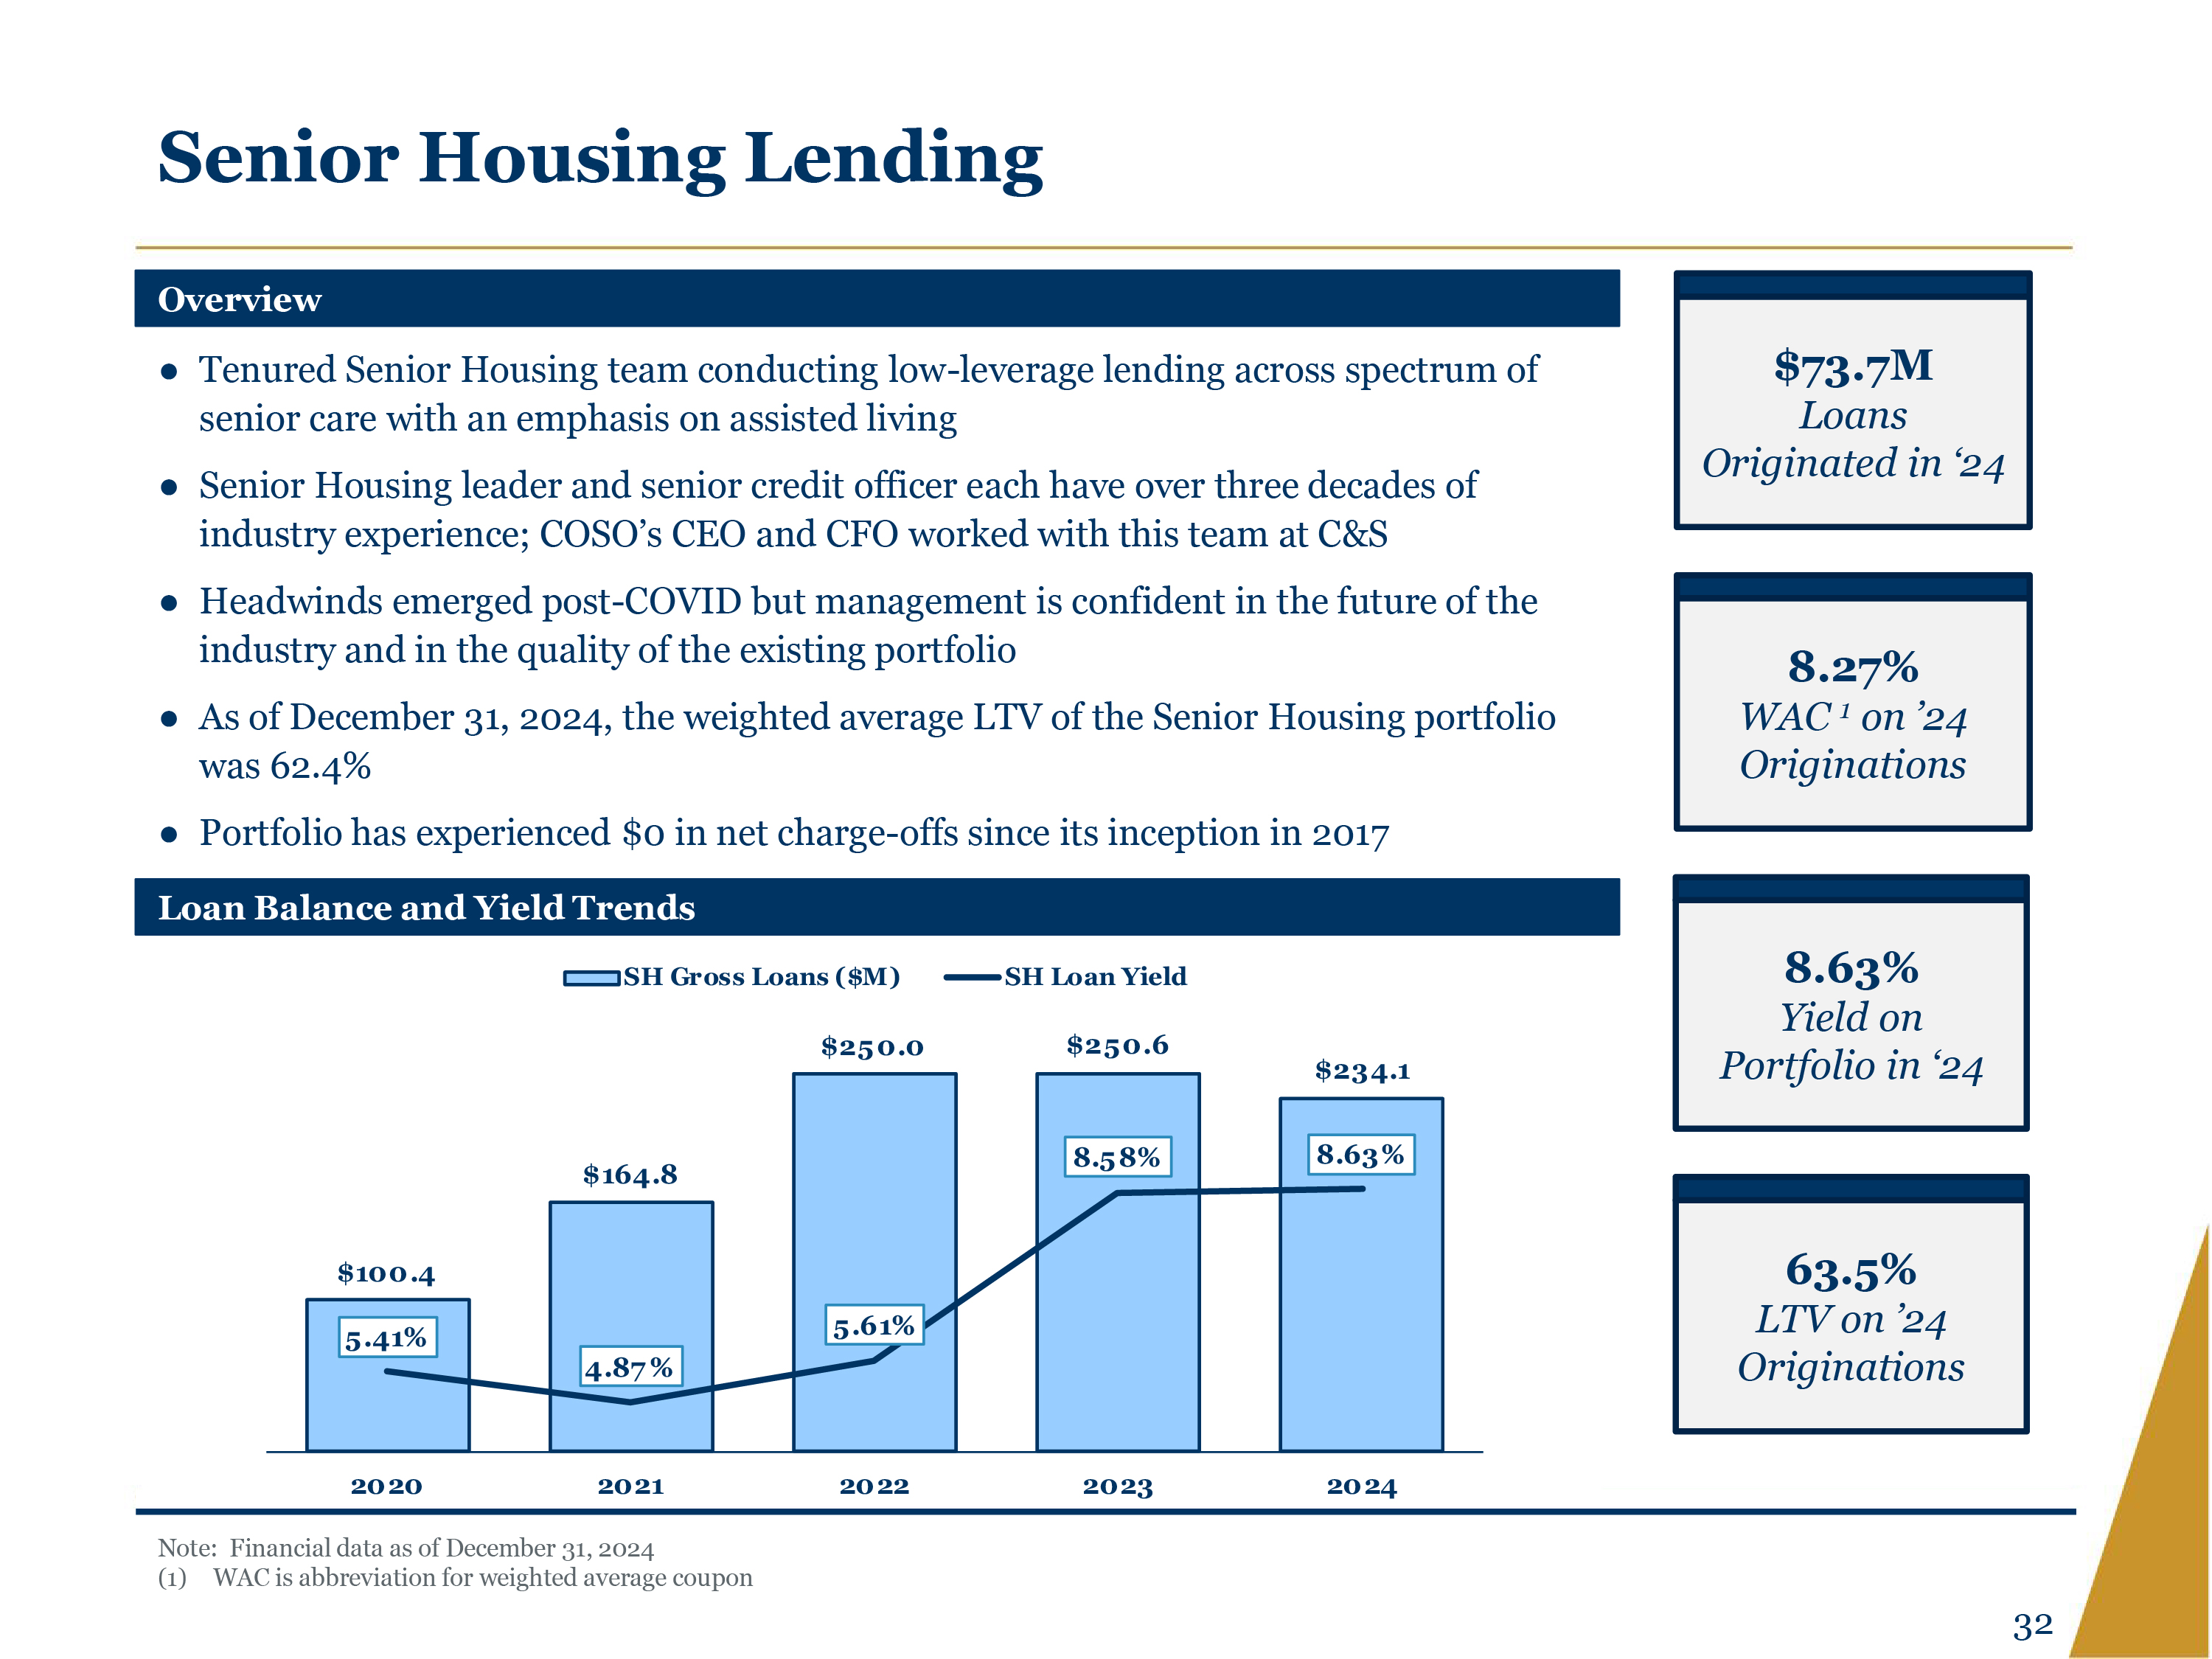
Senior Housing Lending Overview Tenured Senior Housing team conducting low-leverage lending across spectrum of senior care with an emphasis on assisted living Senior Housing leader and senior credit officer each have over three decades of industry experience; COSO’s CEO and CFO worked with this team at C&S Headwinds emerged post-COVID but management is confident in the future of the industry and in the quality of the existing portfolio As of December 31, 2024, the weighted average LTV of the Senior Housing portfolio was 62.4% Portfolio has experienced $0 in net charge-offs since its inception in 2017 Loan Balance and Yield Trends SH Gross Loans ($M) SH Loan Yield $100.4 5.41% 2020 $164.8 4.87% 2021 $250.0 5.61% 2022 $250.6 8.58% 2023 $234.1 8.63% 2024 $73.7M Loans Originated in ‘24 8.27% WAC 1 on ’24 Originations 8.63% Yield on Portfolio in ‘24 63.5% LTV on ’24 Originations Note: Financial data as of December 31, 2024 (1) WAC is abbreviation for weighted average coupon 32
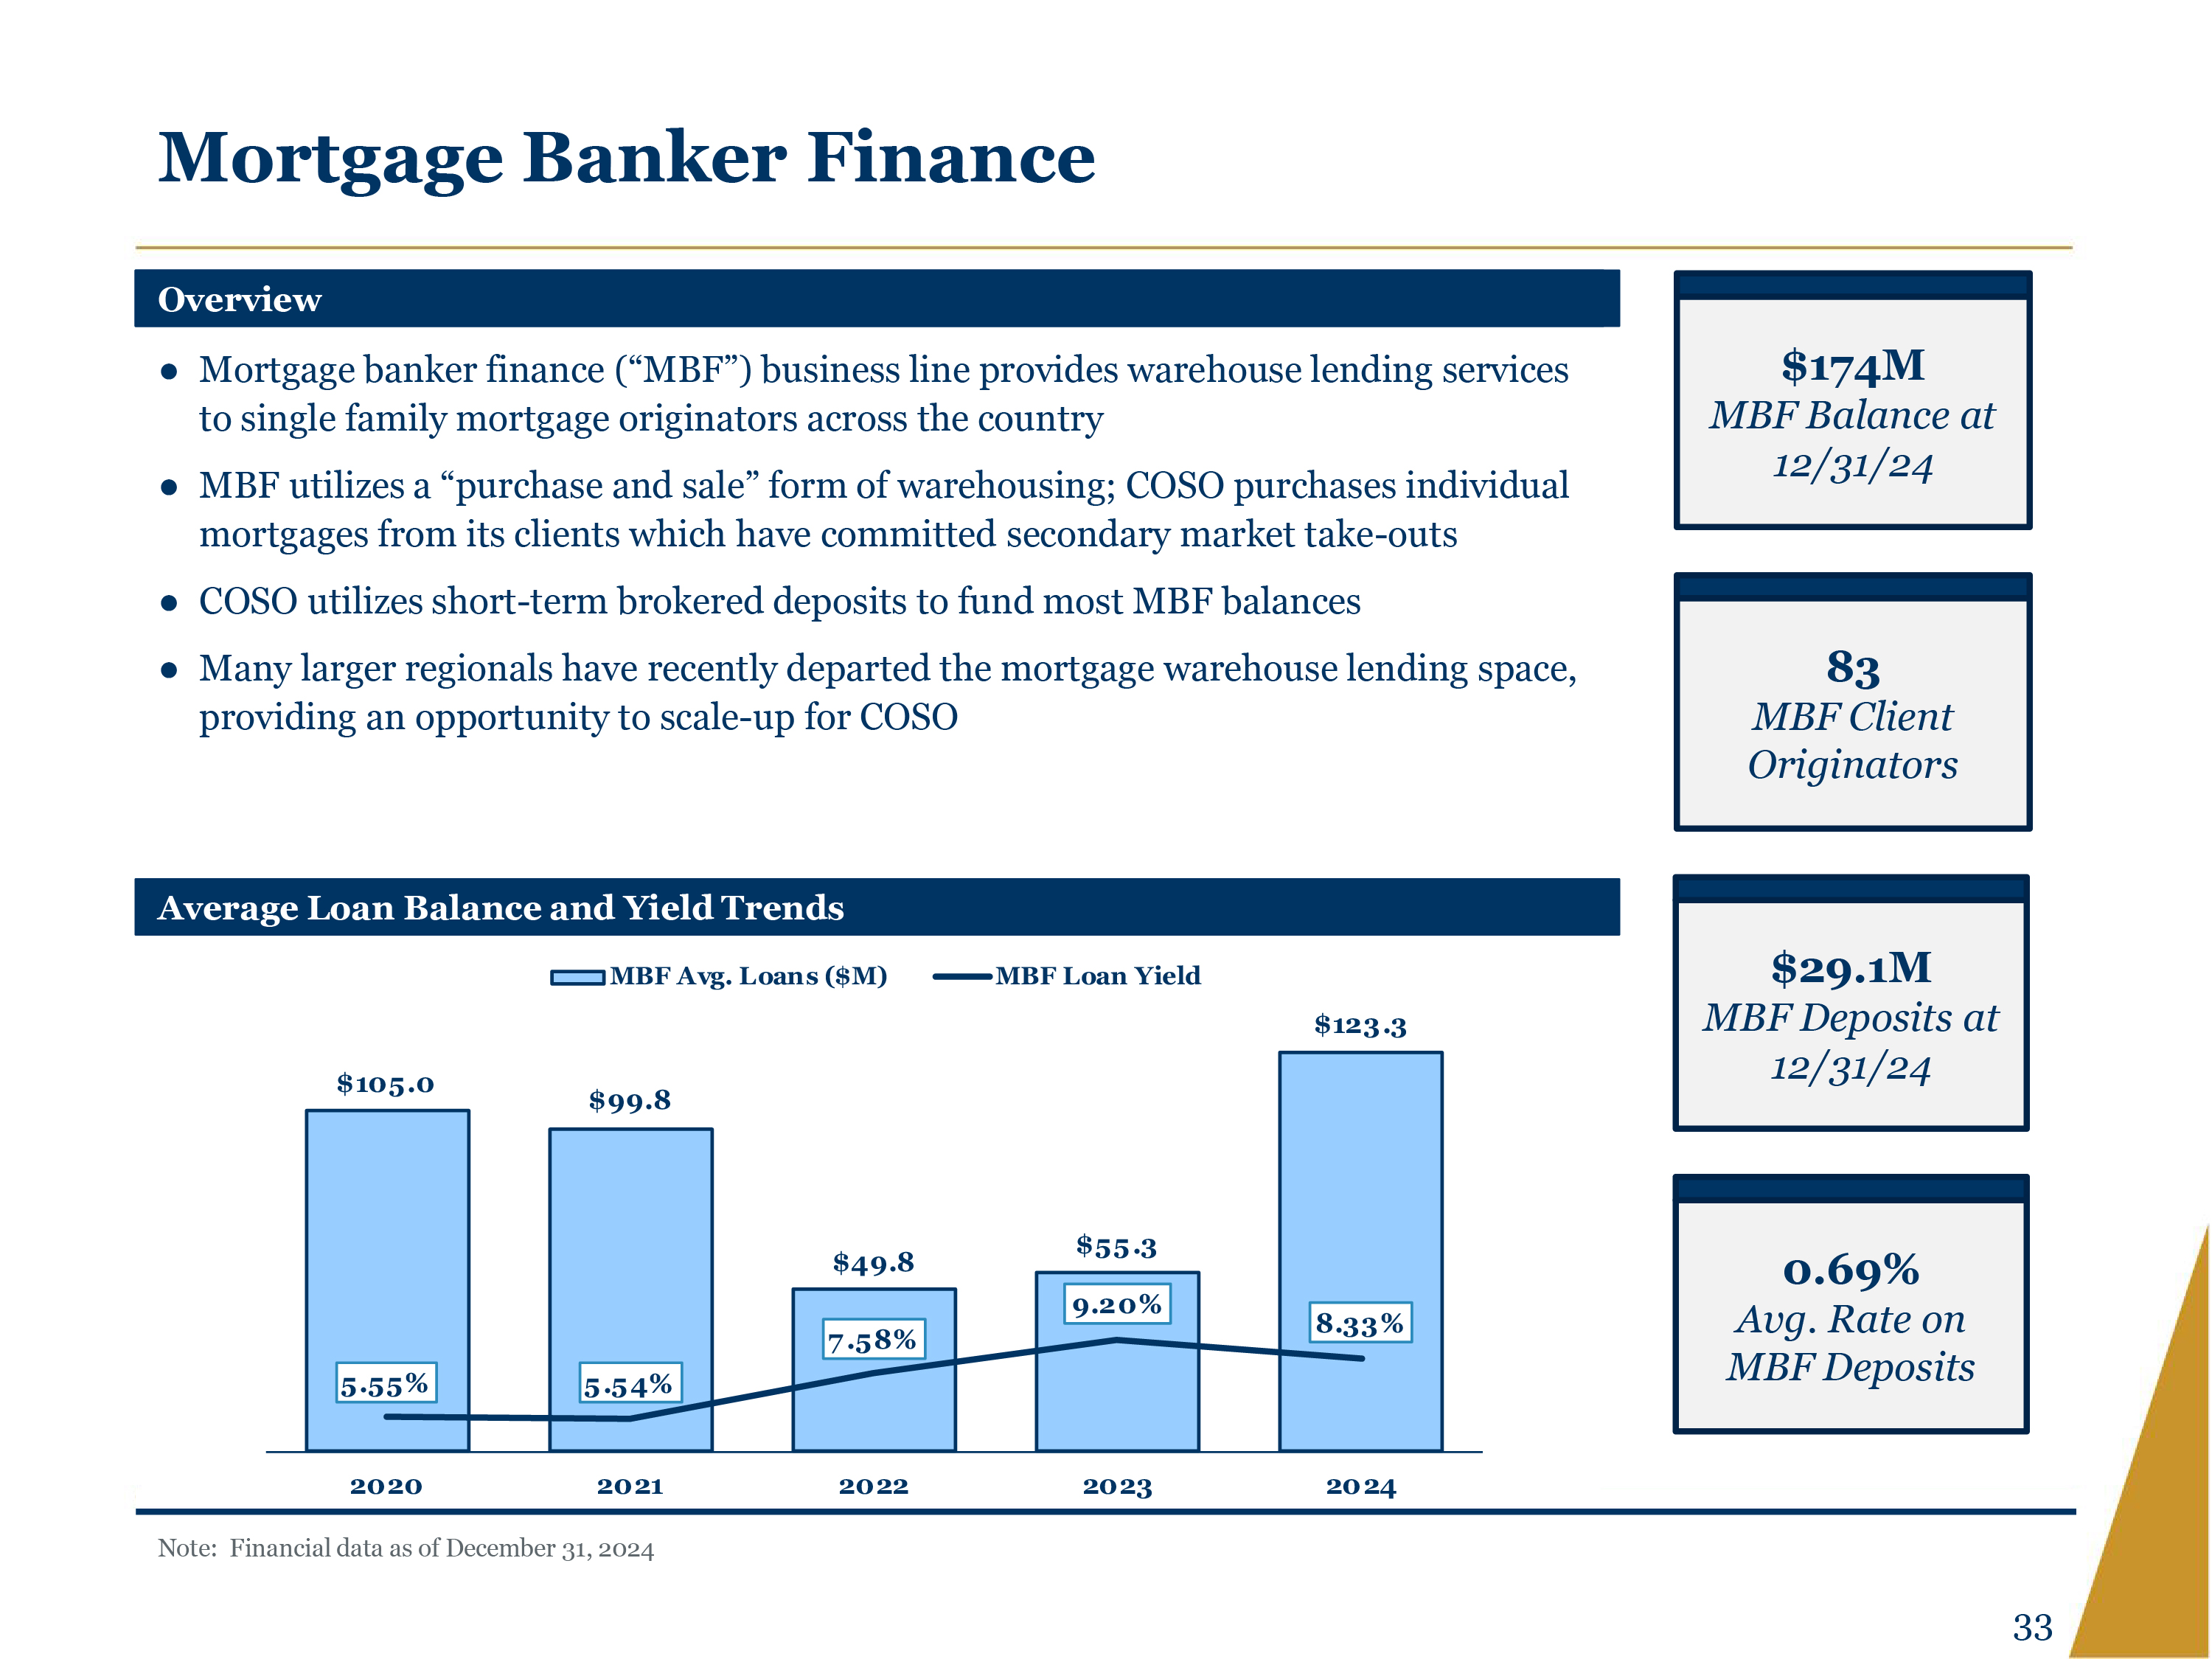
Mortgage Banker Finance Overview Mortgage banker finance (“MBF”) business line provides warehouse lending services to single family mortgage originators across the country MBF utilizes a “purchase and sale” form of warehousing; COSO purchases individual mortgages from its clients which have committed secondary market take-outs COSO utilizes short-term brokered deposits to fund most MBF balances Many larger regionals have recently departed the mortgage warehouse lending space, providing an opportunity to scale-up for COSO Average Loan Balance and Yield Trends MBF Avg. Loans ($M) MBF Loan Yield $105.0 5.55% 2020 $99.8 5.54 2021 $49.8 7.58% 2022 $55.3 9.20% 2023 $123.3 8.33% 2024 $174M MBF Balance at 12/31/24 83 MBF Client Originators $29.1M MBF Deposits at 12/31/24 0.69% Avg. Rate on MBF Deposits Note: Financial data as of December 31, 2024 33
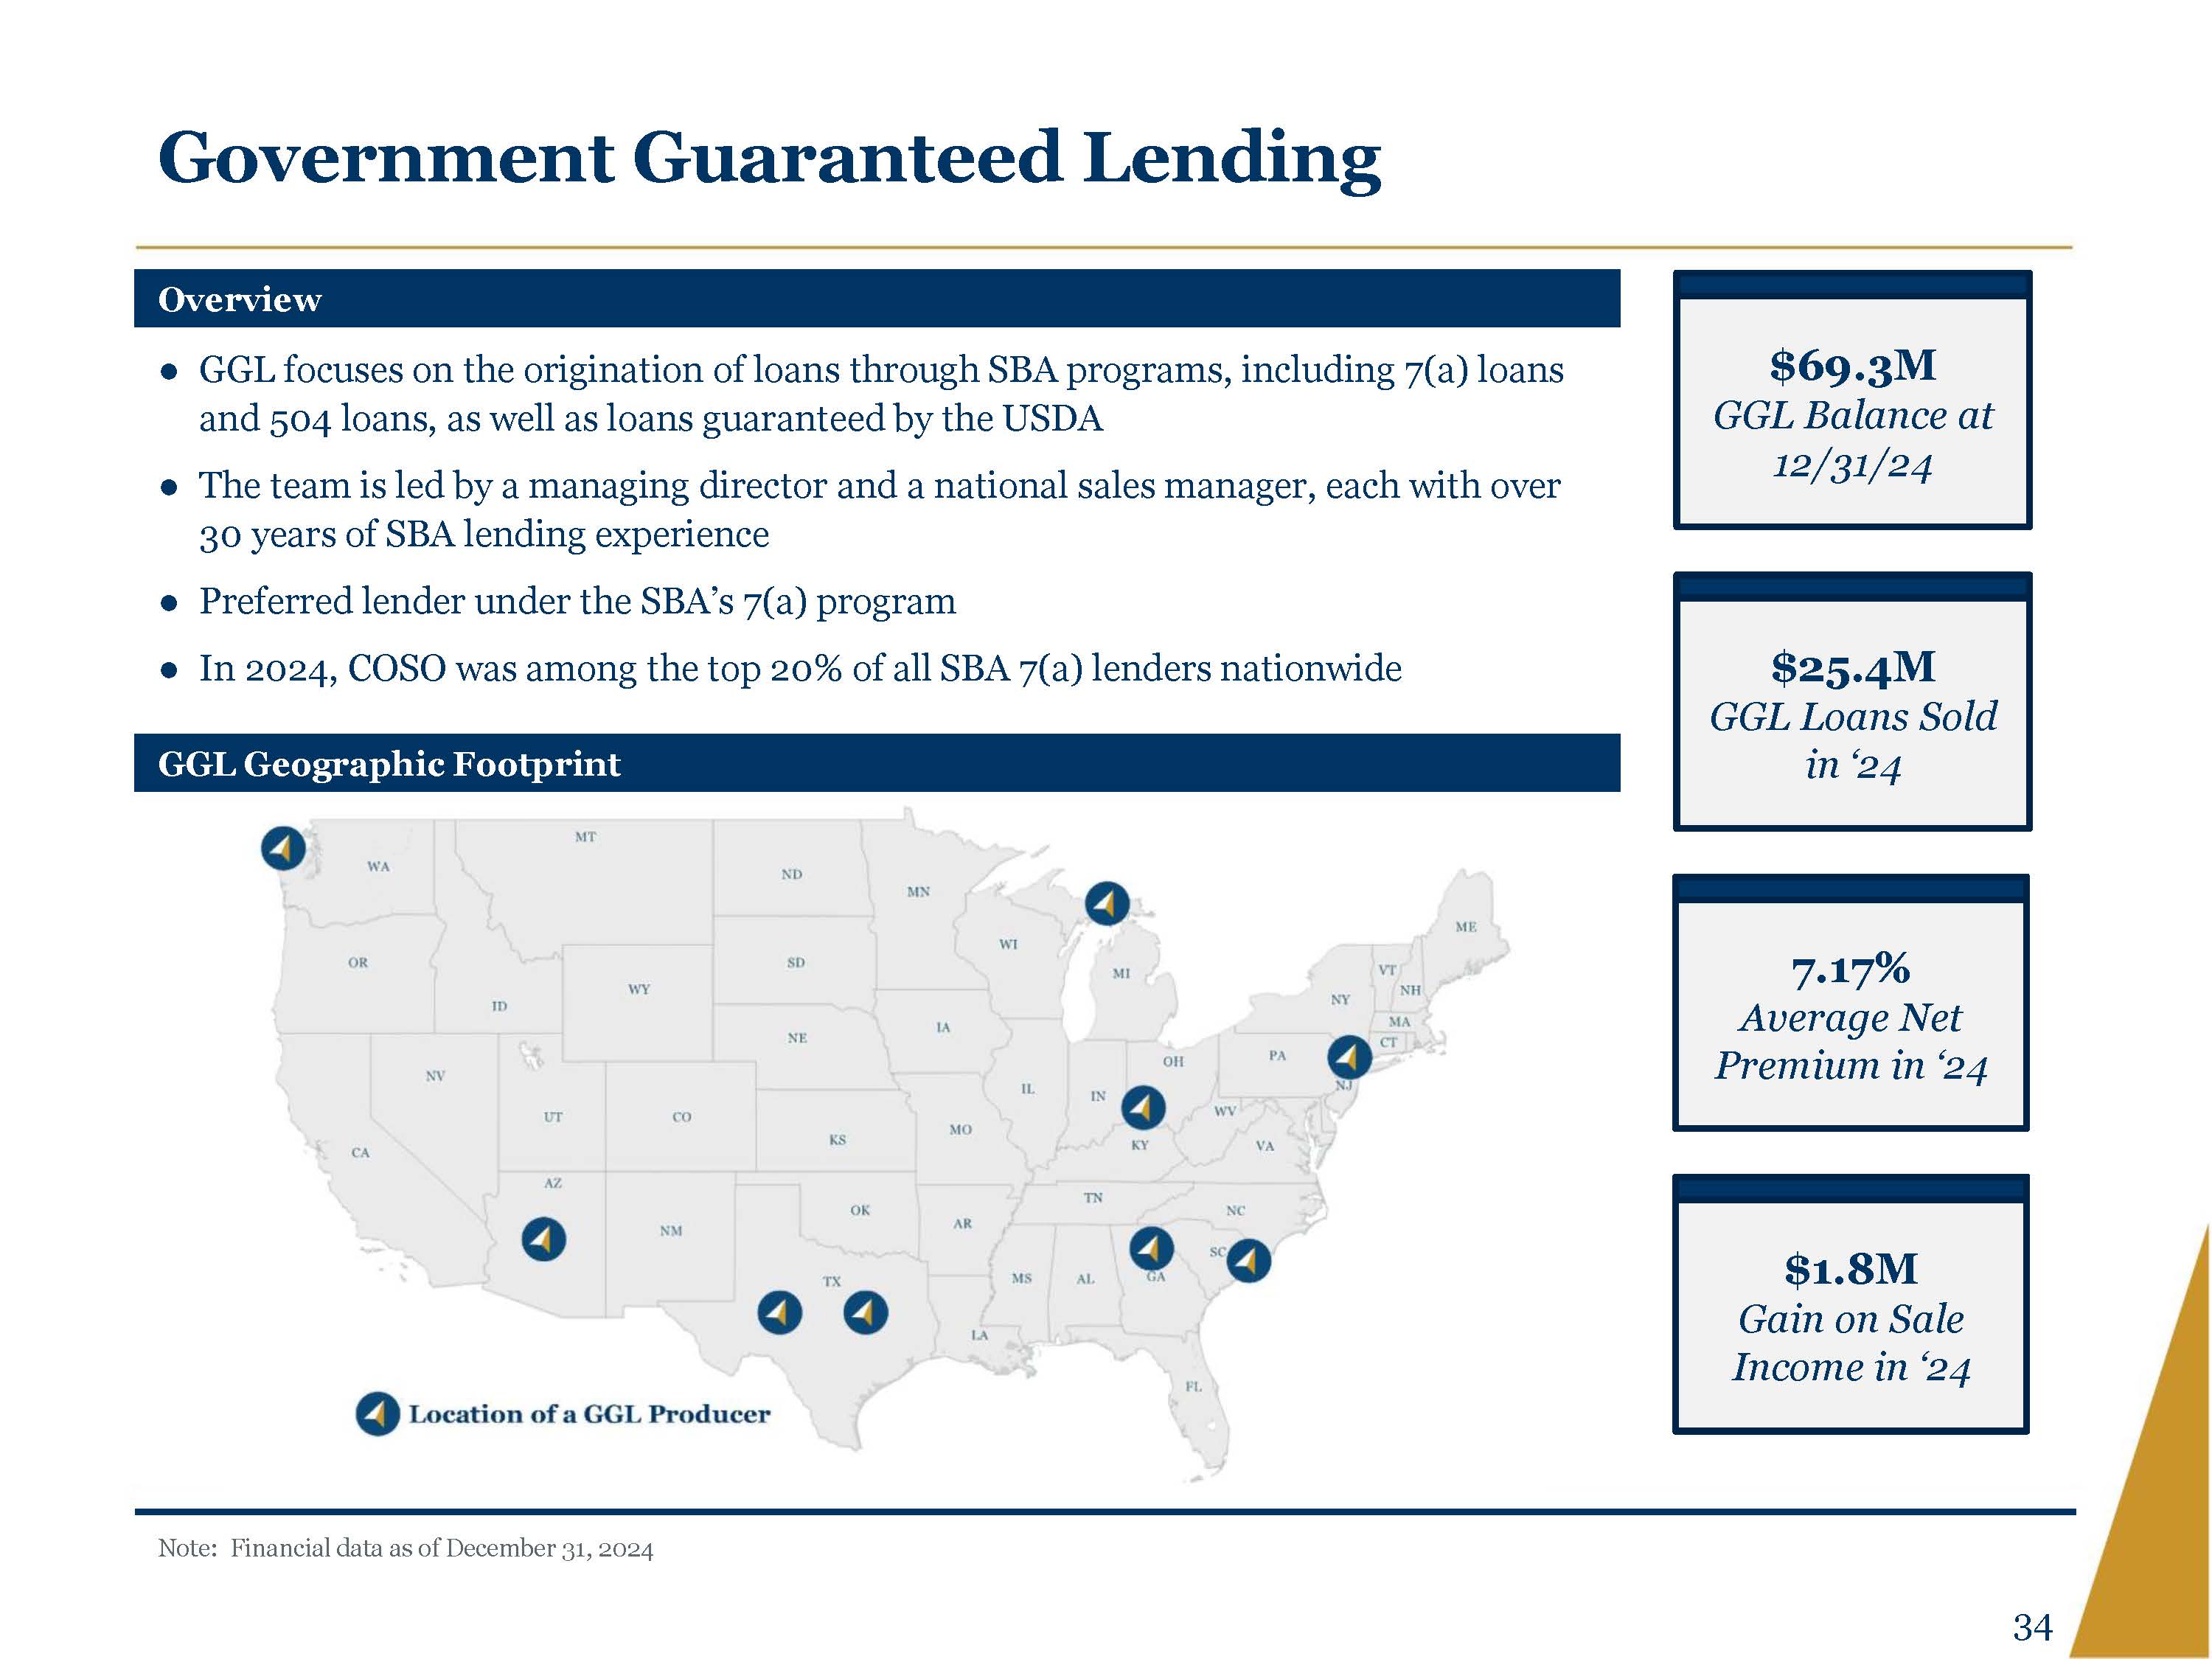
Government Guaranteed Lending Overview GGL focuses on the origination of loans through SBA programs, including 7(a) loans and 504 loans, as well as loans guaranteed by the USDA The team is led by a managing director and a national sales manager, each with over 30 years of SBA lending experience Preferred lender under the SBA’s 7(a) program In 2024, COSO was among the top 20% of all SBA 7(a) lenders nationwide $69.3M GGL Balance at 12/31/24 $25.4M GGL Loans Sold in ’24 7.17% Average Net Premium in ’24 $1.8M Gain on Sale Income in ‘24 GGL Geographic Footprint Image Note: Financial data as of December 31, 2024 34
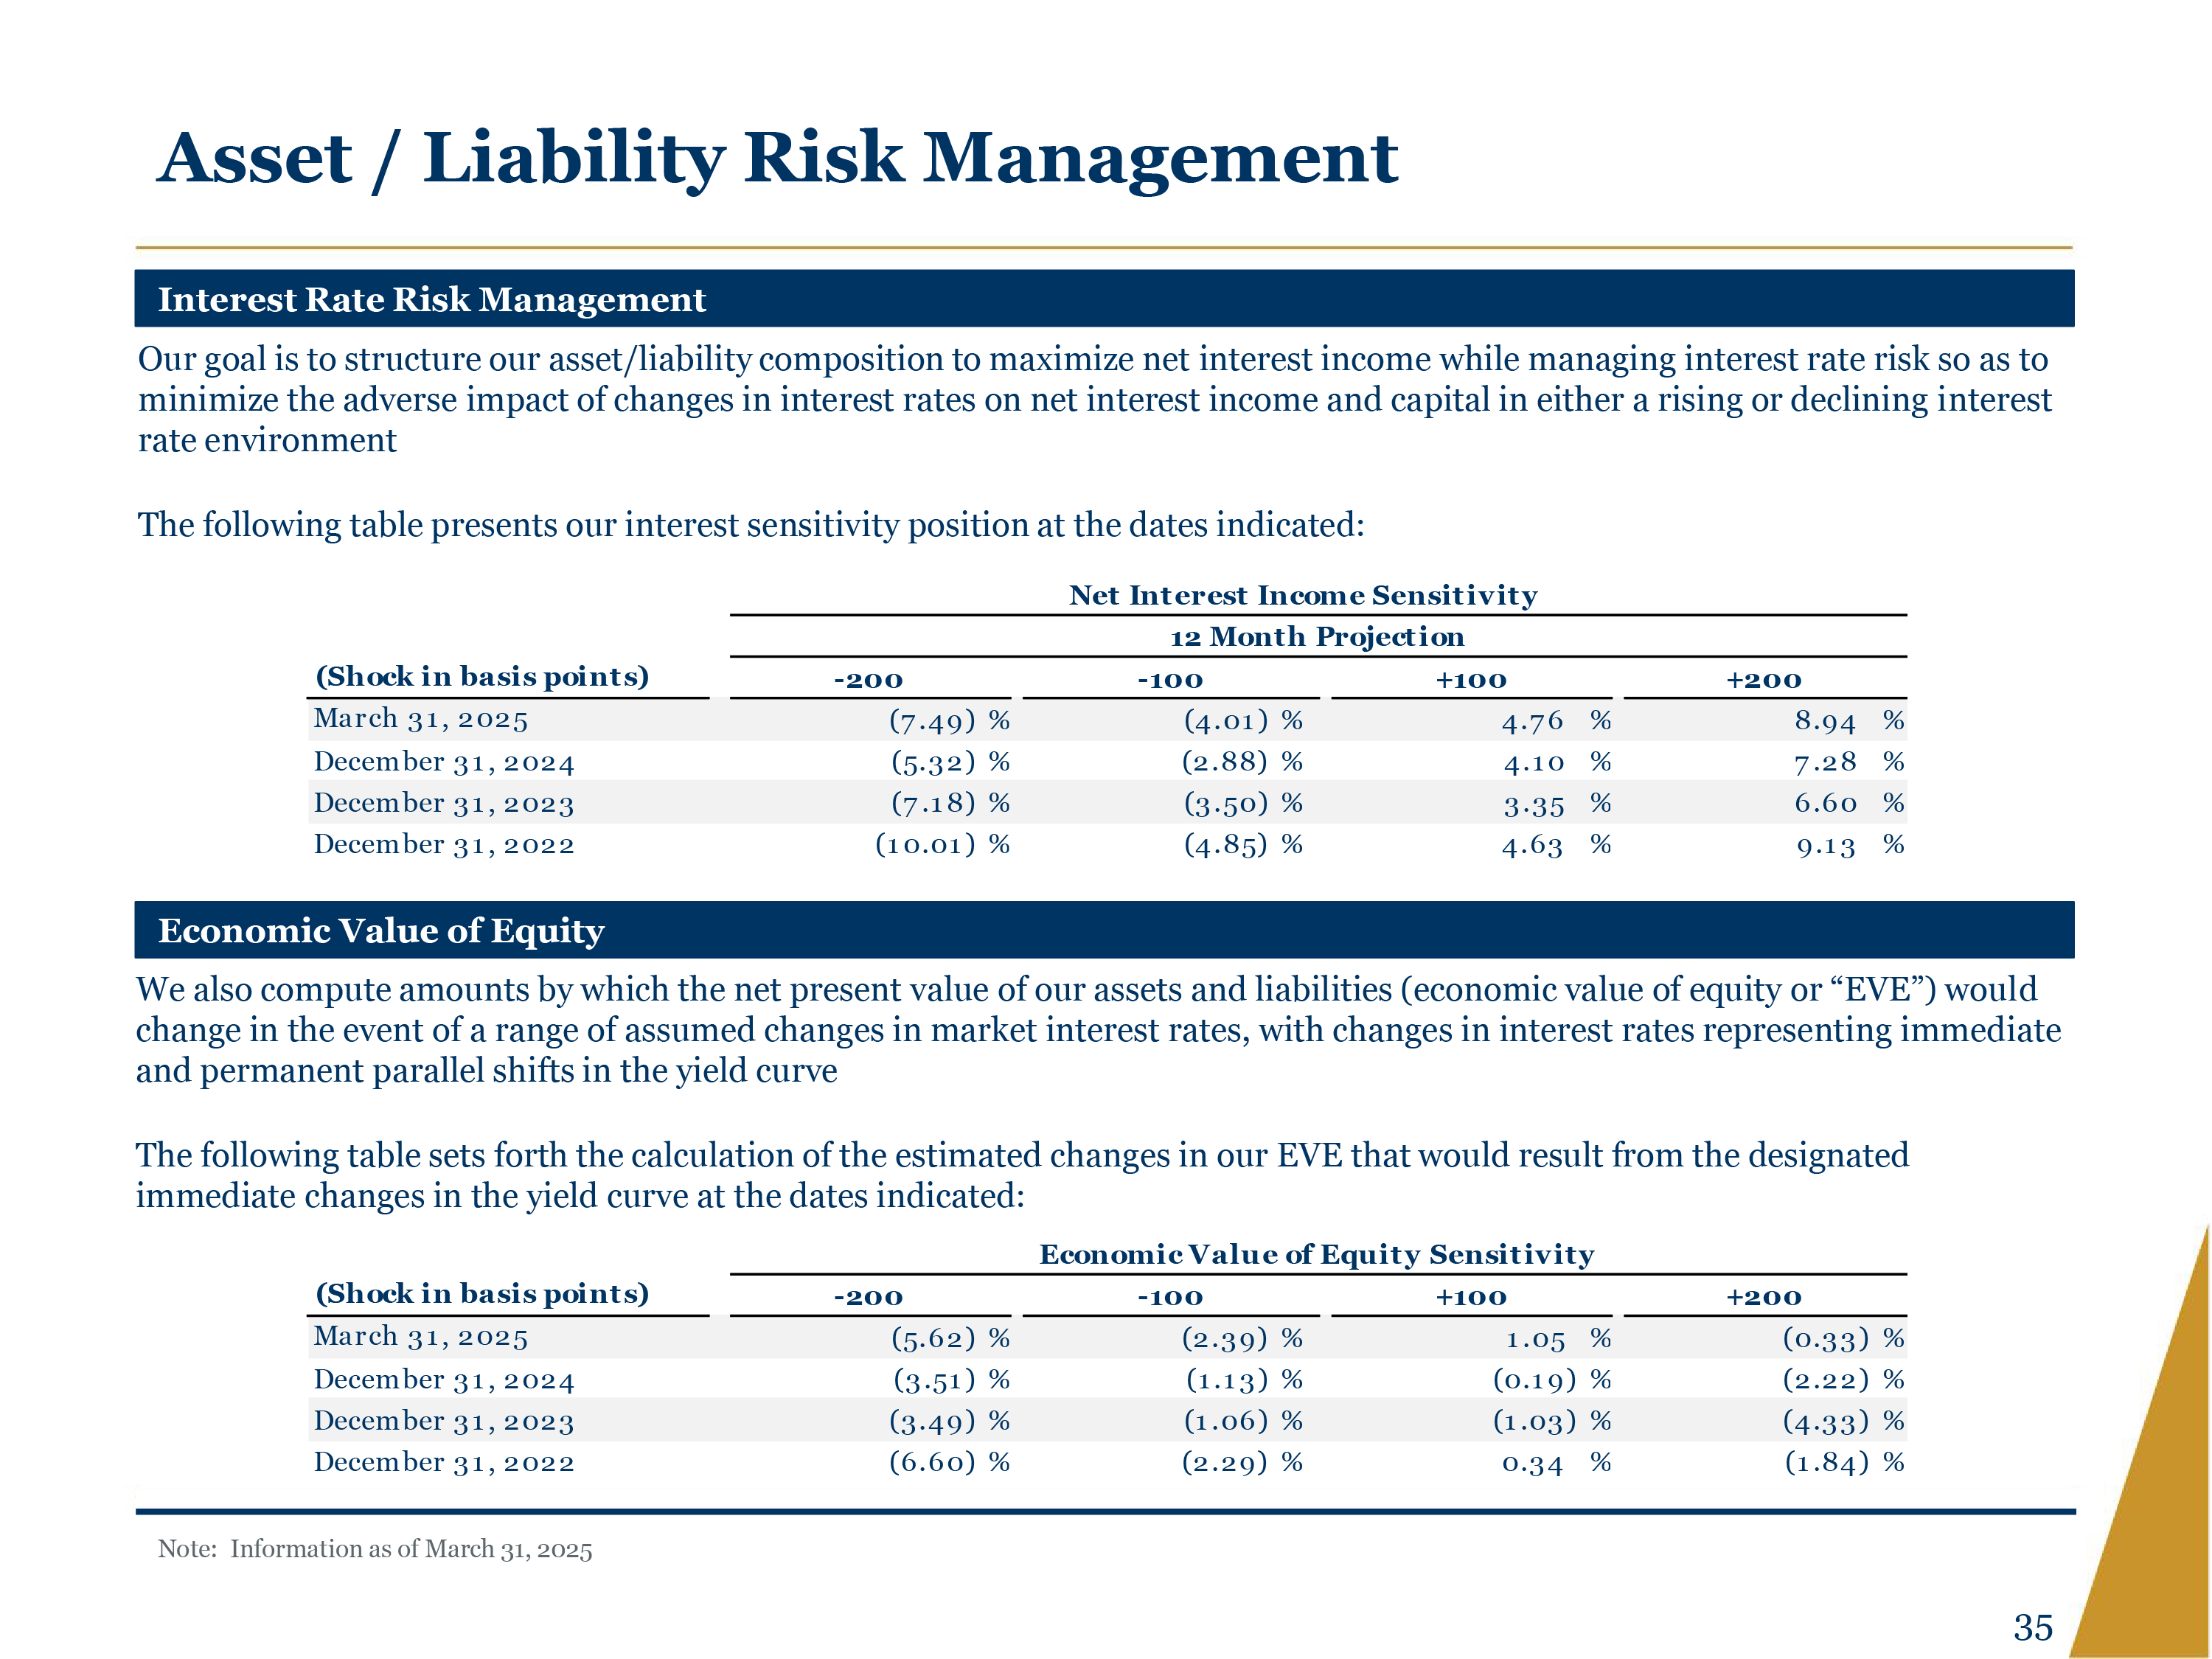
Asset / Liability Risk Management Interest Rate Risk Management Our goal is to structure our asset/liability composition to maximize net interest income while managing interest rate risk so as to minimize the adverse impact of changes in interest rates on net interest income and capital in either a rising or declining interest rate environment The following table presents our interest sensitivity position at the dates indicated: Net Interest Income Sensitivity 12 Month Projection (Shock in basis points) -200 -100 +100 +200 March 31, 2025 December 31, 2024 December 31, 2023 December 31, 2022 (7.49) % (5.32) % (7.18) % (10.01) % (4.01) % (2.88) % (3.50) % (4.85) % 4.76 % 4.10 % 3.35 % 4.63 % 8.94 % 7.28 % 6.60 % 9.13 % Economic Value of Equity We also compute amounts by which the net present value of our assets and liabilities (economic value of equity or “EVE”) would change in the event of a range of assumed changes in market interest rates, with changes in interest rates representing immediate and permanent parallel shifts in the yield curve The following table sets forth the calculation of the estimated changes in our EVE that would result from the designated immediate changes in the yield curve at the dates indicated: Economic Value of Equity Sensitivity (Shock in basis points) -200 -100 +100 +200 March 31, 2025 December 31, 2024 December 31, 2023 December 31, 2022 (5.62) % (3.51) % (3.49) % (6.60) % (2.39) % (1.13) % (1.06) % (2.29) % 1.05 % (0.19 ) % (1.03) % 0.34 % (0.33) % (2.22 ) % (4.33) % (1.84) % Note: Information as of March 31, 2025 35
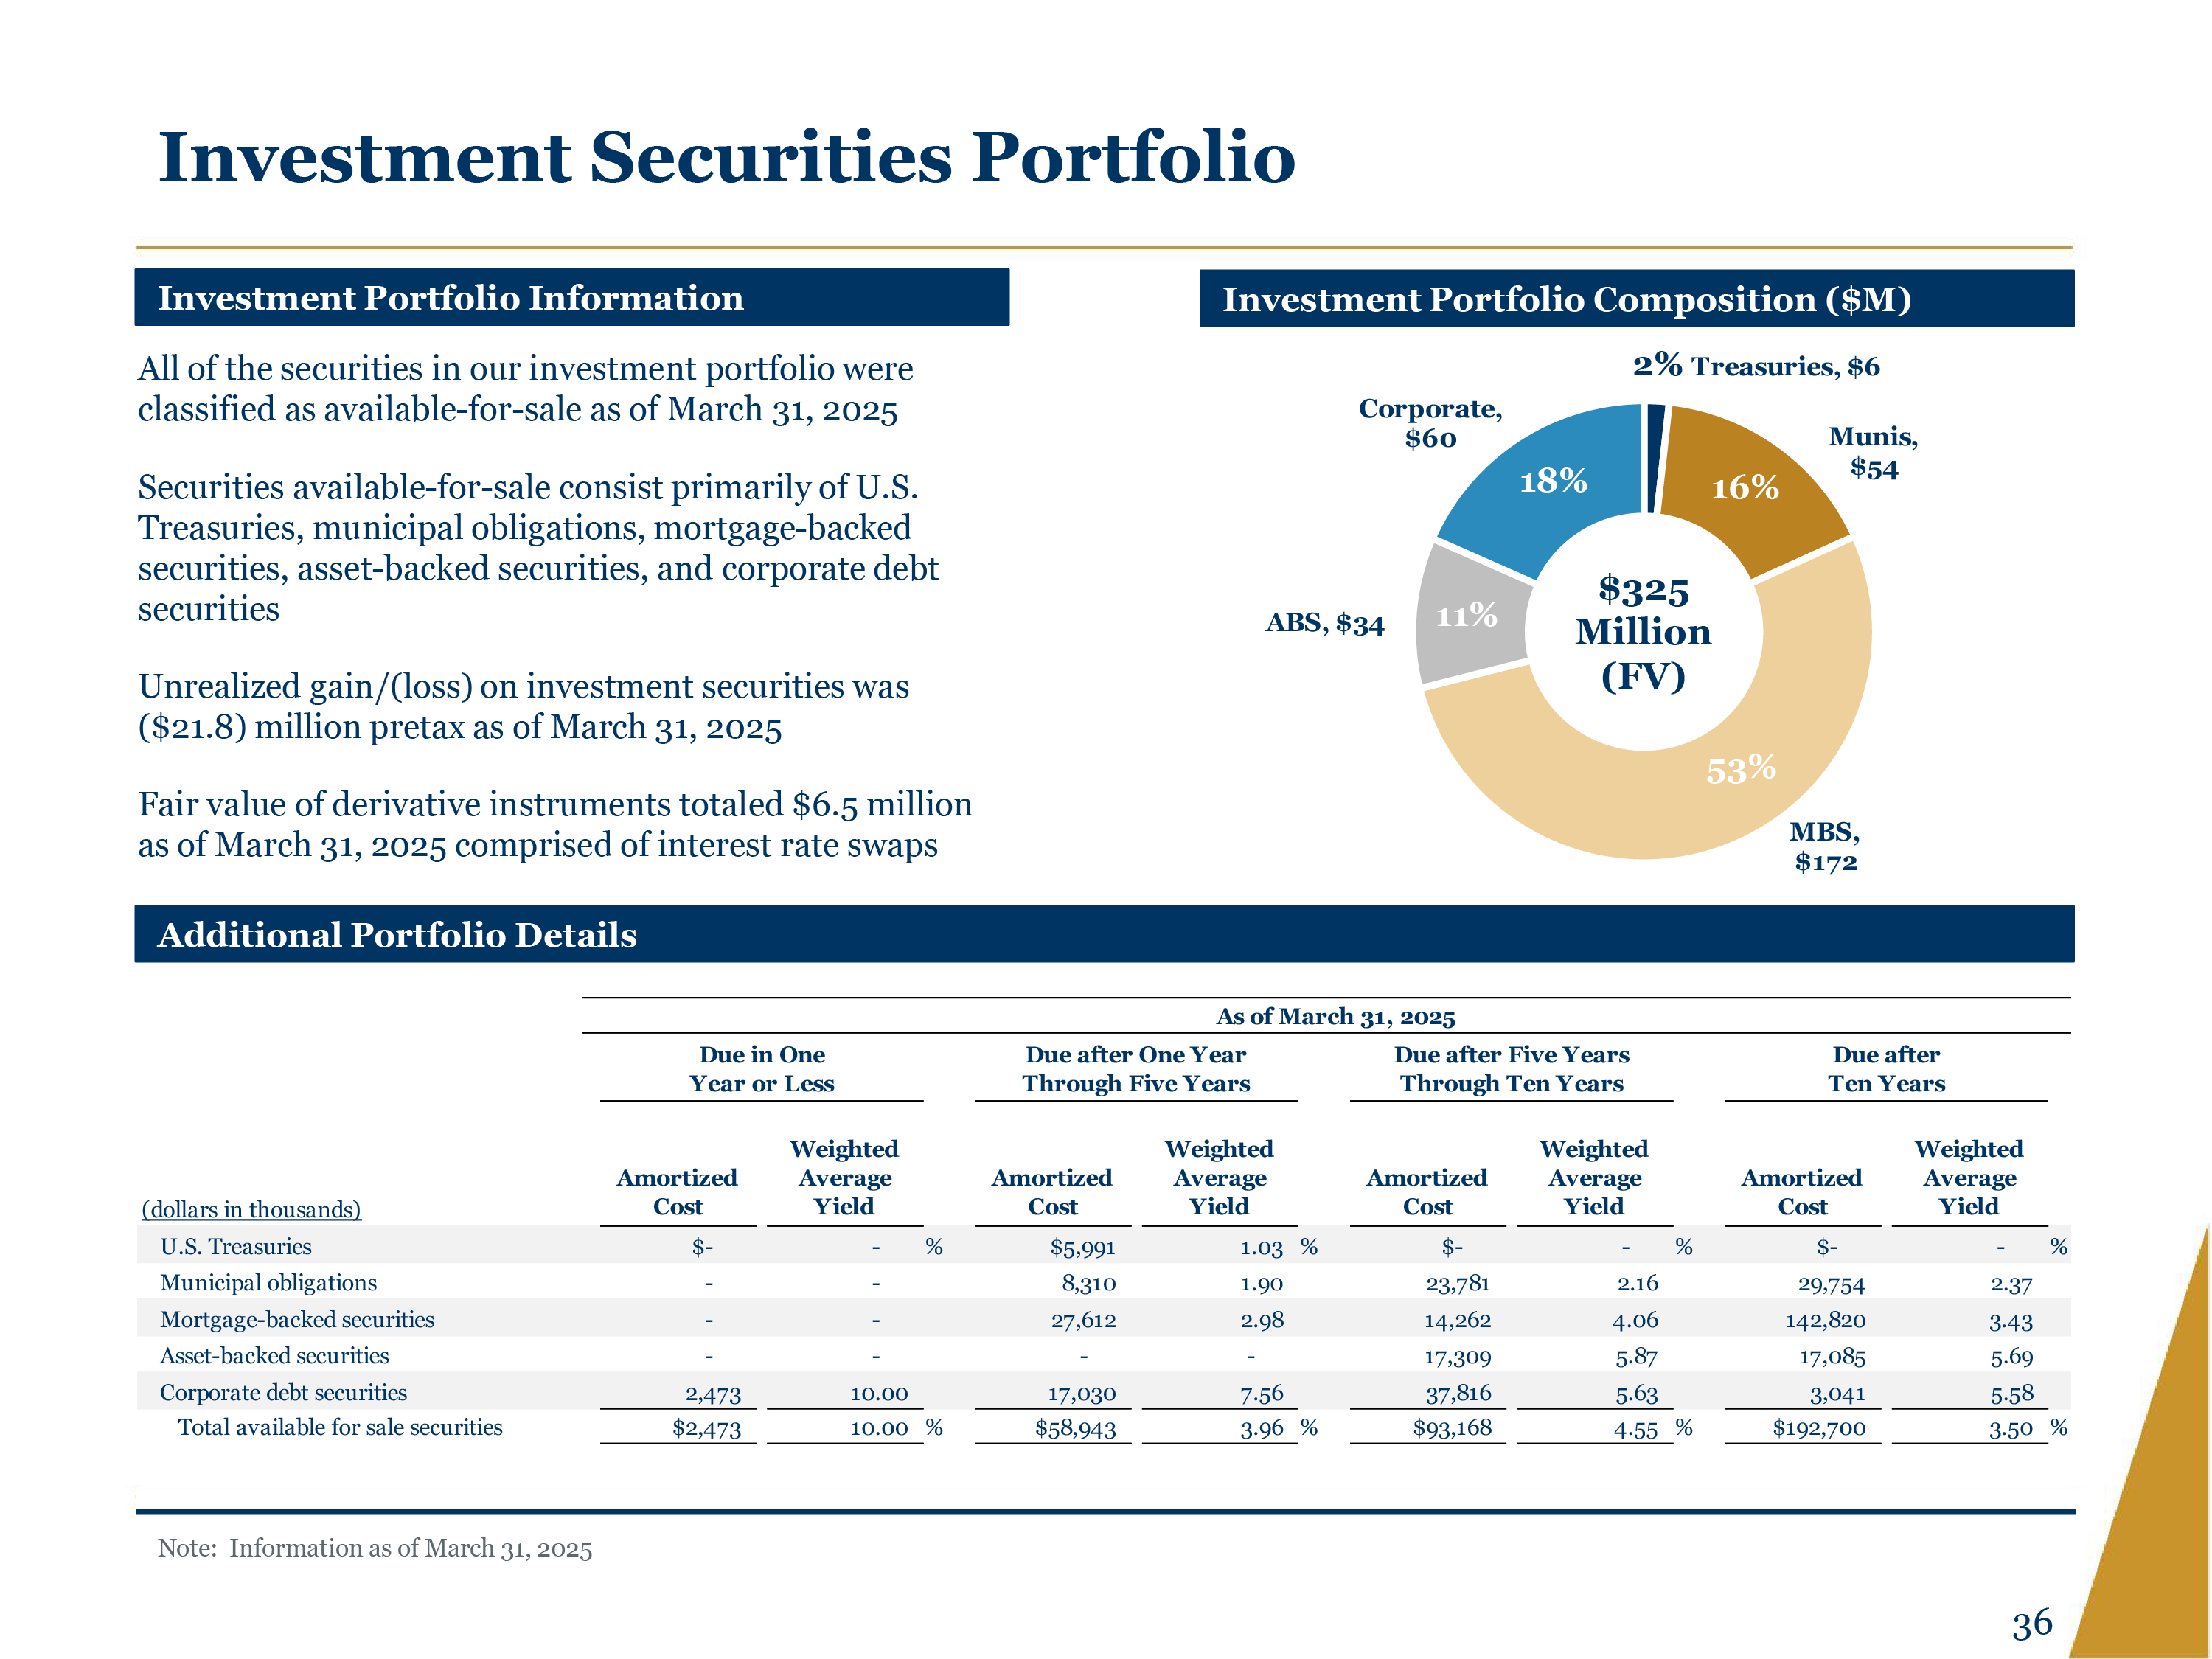
Investment Securities Portfolio Investment Portfolio Information All of the securities in our investment portfolio were classified as available-for-sale as of March 31, 2025 Securities available-for-sale consist primarily of U.S. Treasuries, municipal obligations, mortgage-backed securities, asset-backed securities, and corporate debt securities Unrealized gain/(loss) on investment securities was ($21.8) million pretax as of March 31, 2025 Fair value of derivative instruments totaled $6.5 million as of March 31, 2025 comprised of interest rate swaps Investment Portfolio Composition ($M) Corporate, $60 2% Treasuries, $6 Munis $54 ABS, $34 MBS, $172 11% 18% 16% 53% $325 Million (FV) Additional Portfolio Details As of March 31, 2025 Due in One Year or Less Due after One Year Through Five Years Due after Five Years Through Ten Years Due after Ten Years (dollars in thousands) Amortized Cost Weighted Average Yield Amortized Cost Weighted Average Yield Amortized Cost Weighted Average Yield Amortized Cost Weighted Average Yield U.S. Treasuries Municipal obligations Mortgage-backed securities Asset-backed securities Corporate debt securities Total available for sale securities $- - - - 2,473 $2,473 -% - - - 10.00 10.00 % $5,991 8,310 27,612 - 17,030 $58,943 1.03 % 1.90 2.98 - 7.56 3.96 % $ - 23,781 14,262 17,309 37,816 $93,168 -% 2.16 4.06 5.87 5.63 4.55 % $- 29 ,754 142,820 17,085 3,041 $192 ,700 -% 2.37 3.43 5.69 5.58 3.50 % Note: Information as of March 31, 2025 36
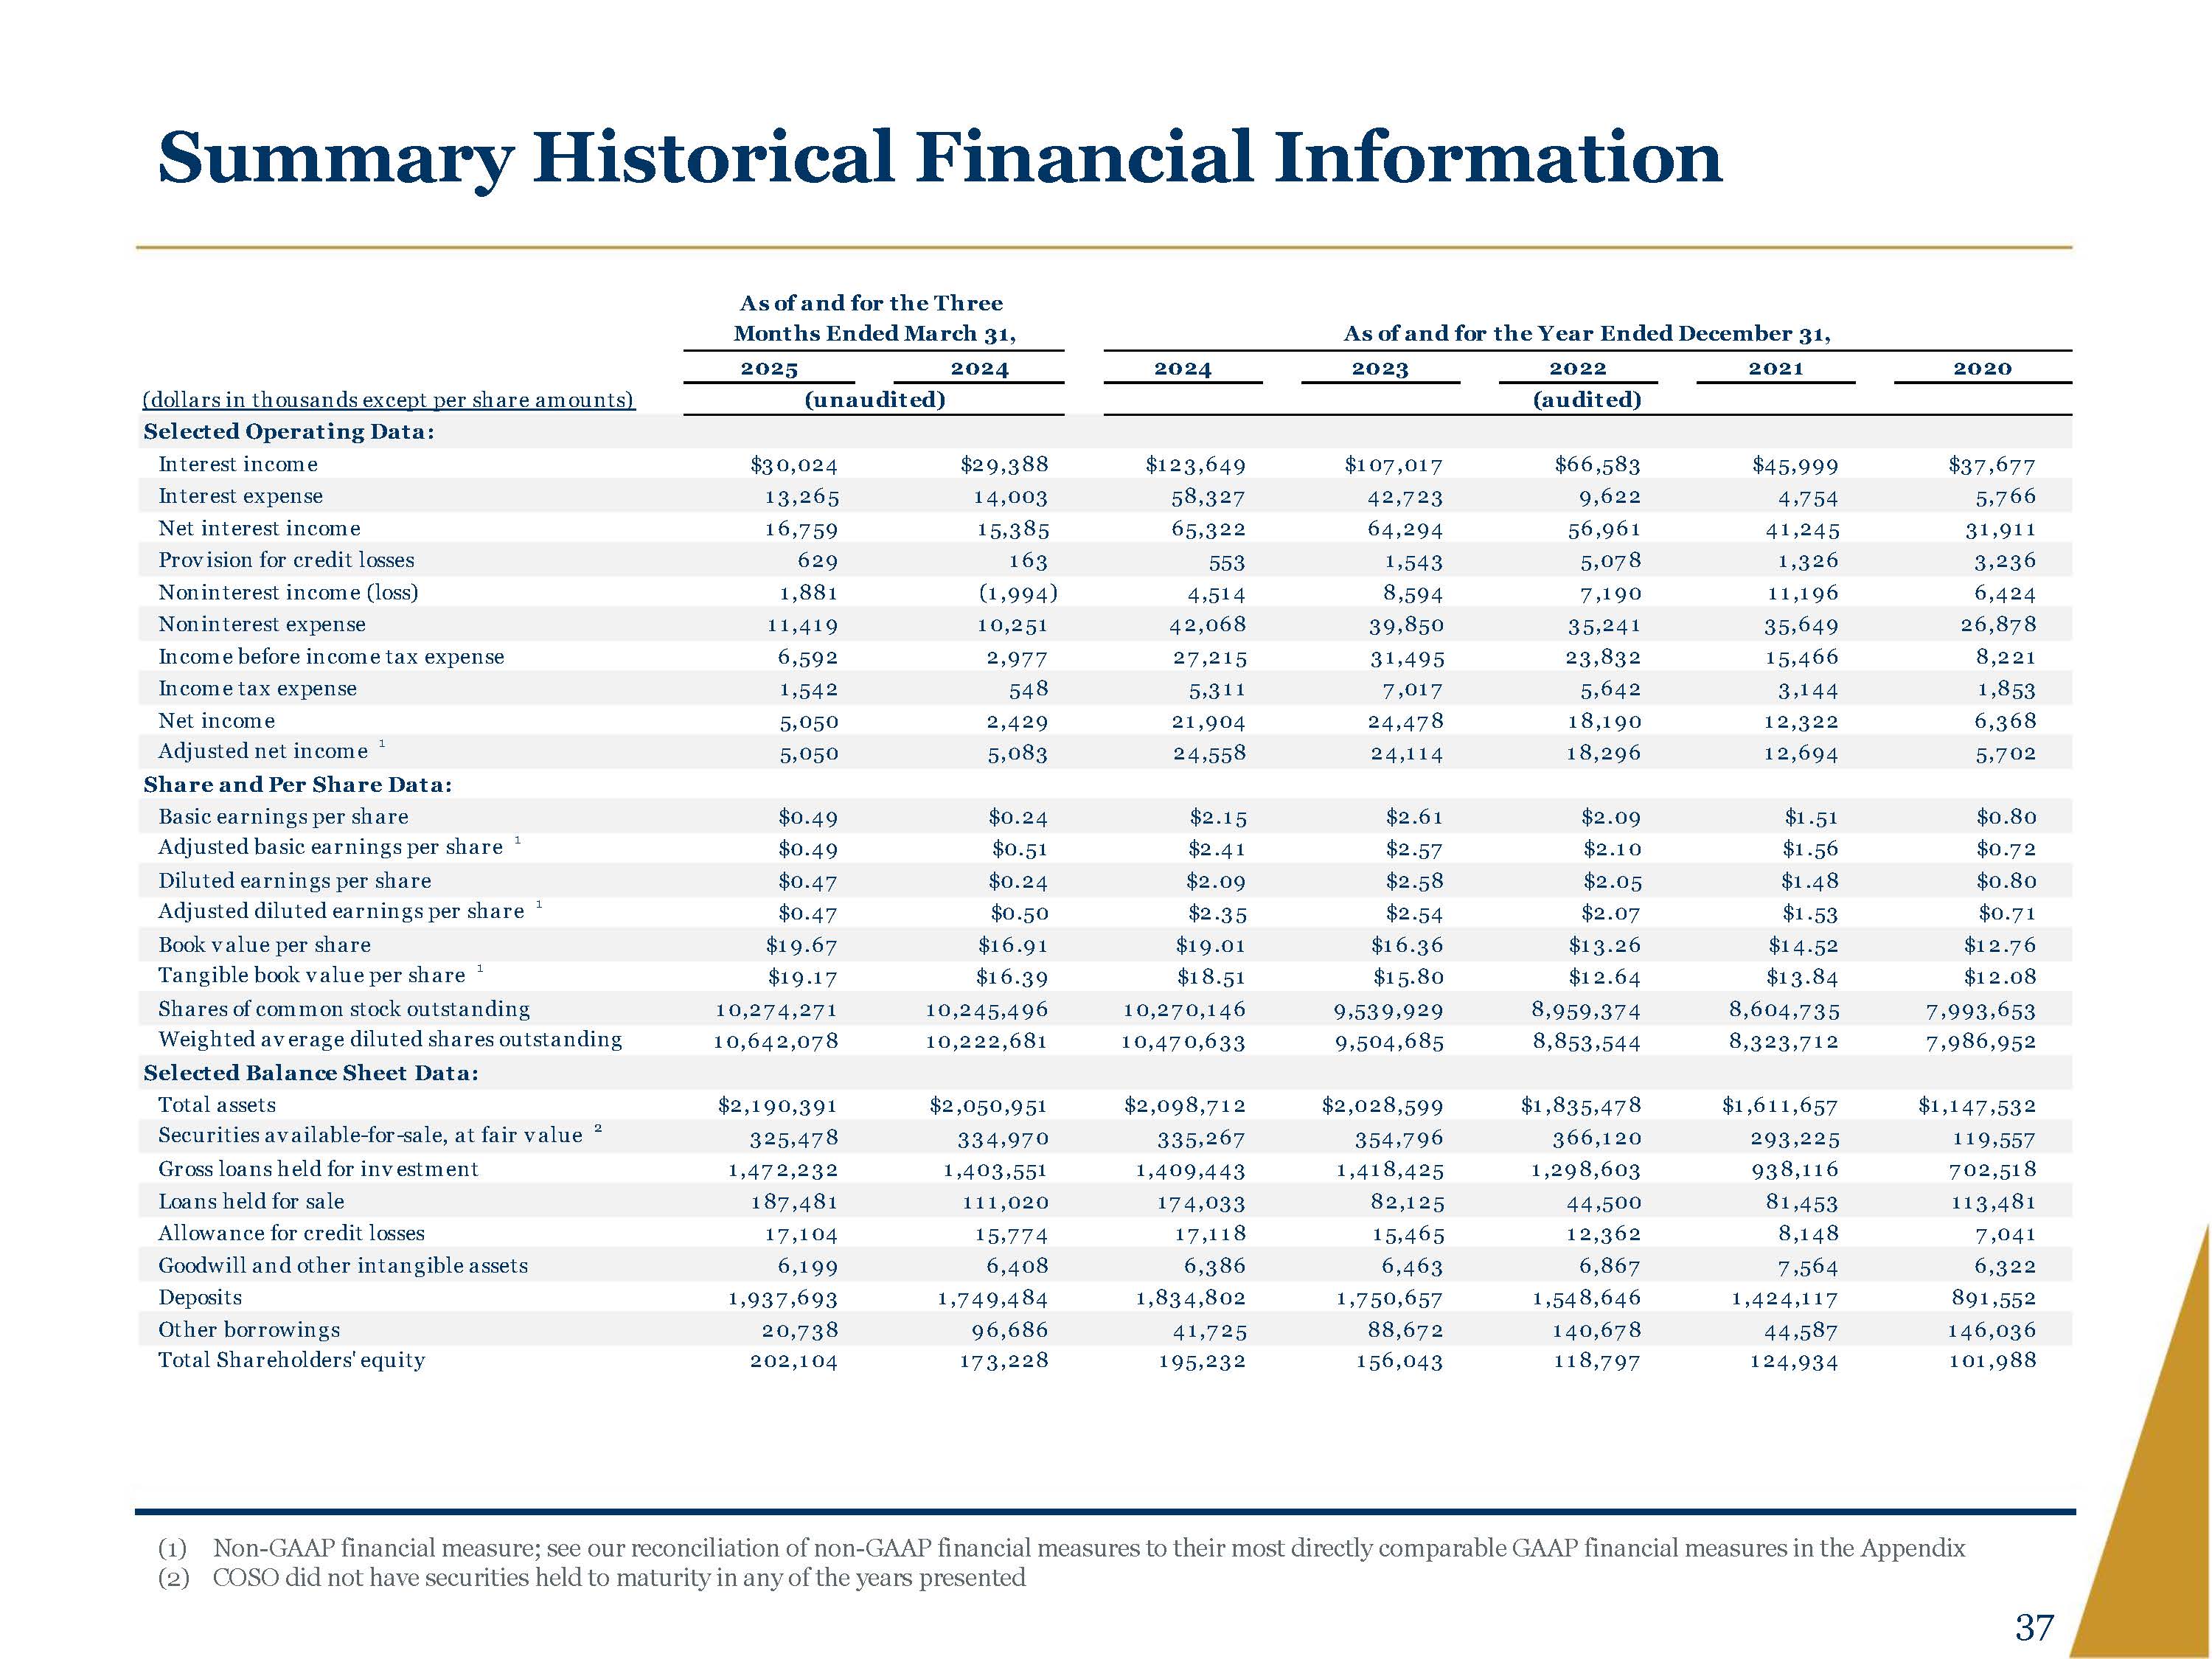
Summary Historical Financial Information As of and for the Three Months Ended March 31, As of and for the Year Ended December 31, 2025 2024 2024 2023 2022 2021 2020 (dollars in thousands except per share amounts) (unaudited) (audited) Selected Operating Data: Interest income $30,024 $29,388 $123,649 $107,017 $66,583 $45,999 $37,677 Interest expense 13,265 14,003 58,327 42,723 9,622 4,754 5,766 Net interest income 16,759 15,385 65,322 64,294 56,961 41,245 31,911 Provision for credit losses 629 163 553 1,543 5,078 1,326 3,236 Noninterest income (loss) 1,881 (1,994) 4,514 8,594 7,190 11,196 6,424 Noninterest expense 11,419 10,251 42,068 39,850 35,241 35,649 26,878 Income before income tax expense 6,592 2,977 27,215 31,495 23,832 15,466 8,221 Income tax expense 1,542 548 5,311 7,017 5,642 3,144 1,853 Net income 5,050 2,429 21,904 24,478 18,190 12,322 6,368 Adjusted net income 1 5,050 5,083 24,558 24,114 18,296 12,694 5,702 Share and Per Share Data: Basic earnings per share $0.49 $0.24 $2.15 $2.61 $2.09 $1.51 $0.80 Adjusted basic earnings per share 1 $0.49 $0.51 $2.41 $2.57 $2.10 $1.56 $0.72 Diluted earnings per share $0.47 $0.24 $2.09 $2.58 $2.05 $1.48 $0.80 Adjusted diluted earnings per share 1 $0.47 $0.50 $2.35 $2.54 $2.07 $1.53 $0.71 Book value per share $19.67 $16.91 $19.01 $16.36 $13.26 $14.52 $12.76 Tangible book value per share 1 $19.17 $16.39 $18.51 $15.80 $12.64 $13.84 $12.08 Shares of common stock outstanding 10,274,271 10,245,496 10,270,146 9,539,929 8,959,374 8,604,735 7,993,653 Weighted average diluted shares outstanding 10,642,078 10,222,681 10,470,633 9,504,685 8,853,544 8,323,712 7,986,952 Selected Balance Sheet Data: Total assets $2,190,391 $2,050,951 $2,098,712 $2,028,599 $1,835,478 $1,611,657 $1,147,532 Securities available for sale, at fair value 2 325,478 334,970 335,267 354,796 366,120 293,225 119,557 Gross loans held for investment 1,472,232 1,403,551 1,409,443 1,418,425 1,298,603 938,116 702,518 Loans held for sale 187,481 111,020 174,033 82,125 44,500 81,453 113,481 Allowance for credit losses 17,104 15,774 17,118 15,465 12,362 8,148 7,041 Goodwill and other intangible assets 6,199 6,408 6,386 6,463 6,867 7,564 6,322 Deposits 1,937,693 1,749,484 1,834,802 1,750,657 1,548,646 1,424,117 891,552 Other borrowings 20,738 96,686 41,725 88,672 140,678 44,587 146,036 Total Shareholders' equity 202,104 173,228 195,232 156,043 118,797 124,934 101,988 (1) Non GAAP financial measure; see our reconciliation of non GAAP financial measures to their most directly comparable GAAP financial measures in the Appendix (2) COSO did not have securities held to maturity in any of the years presented 37
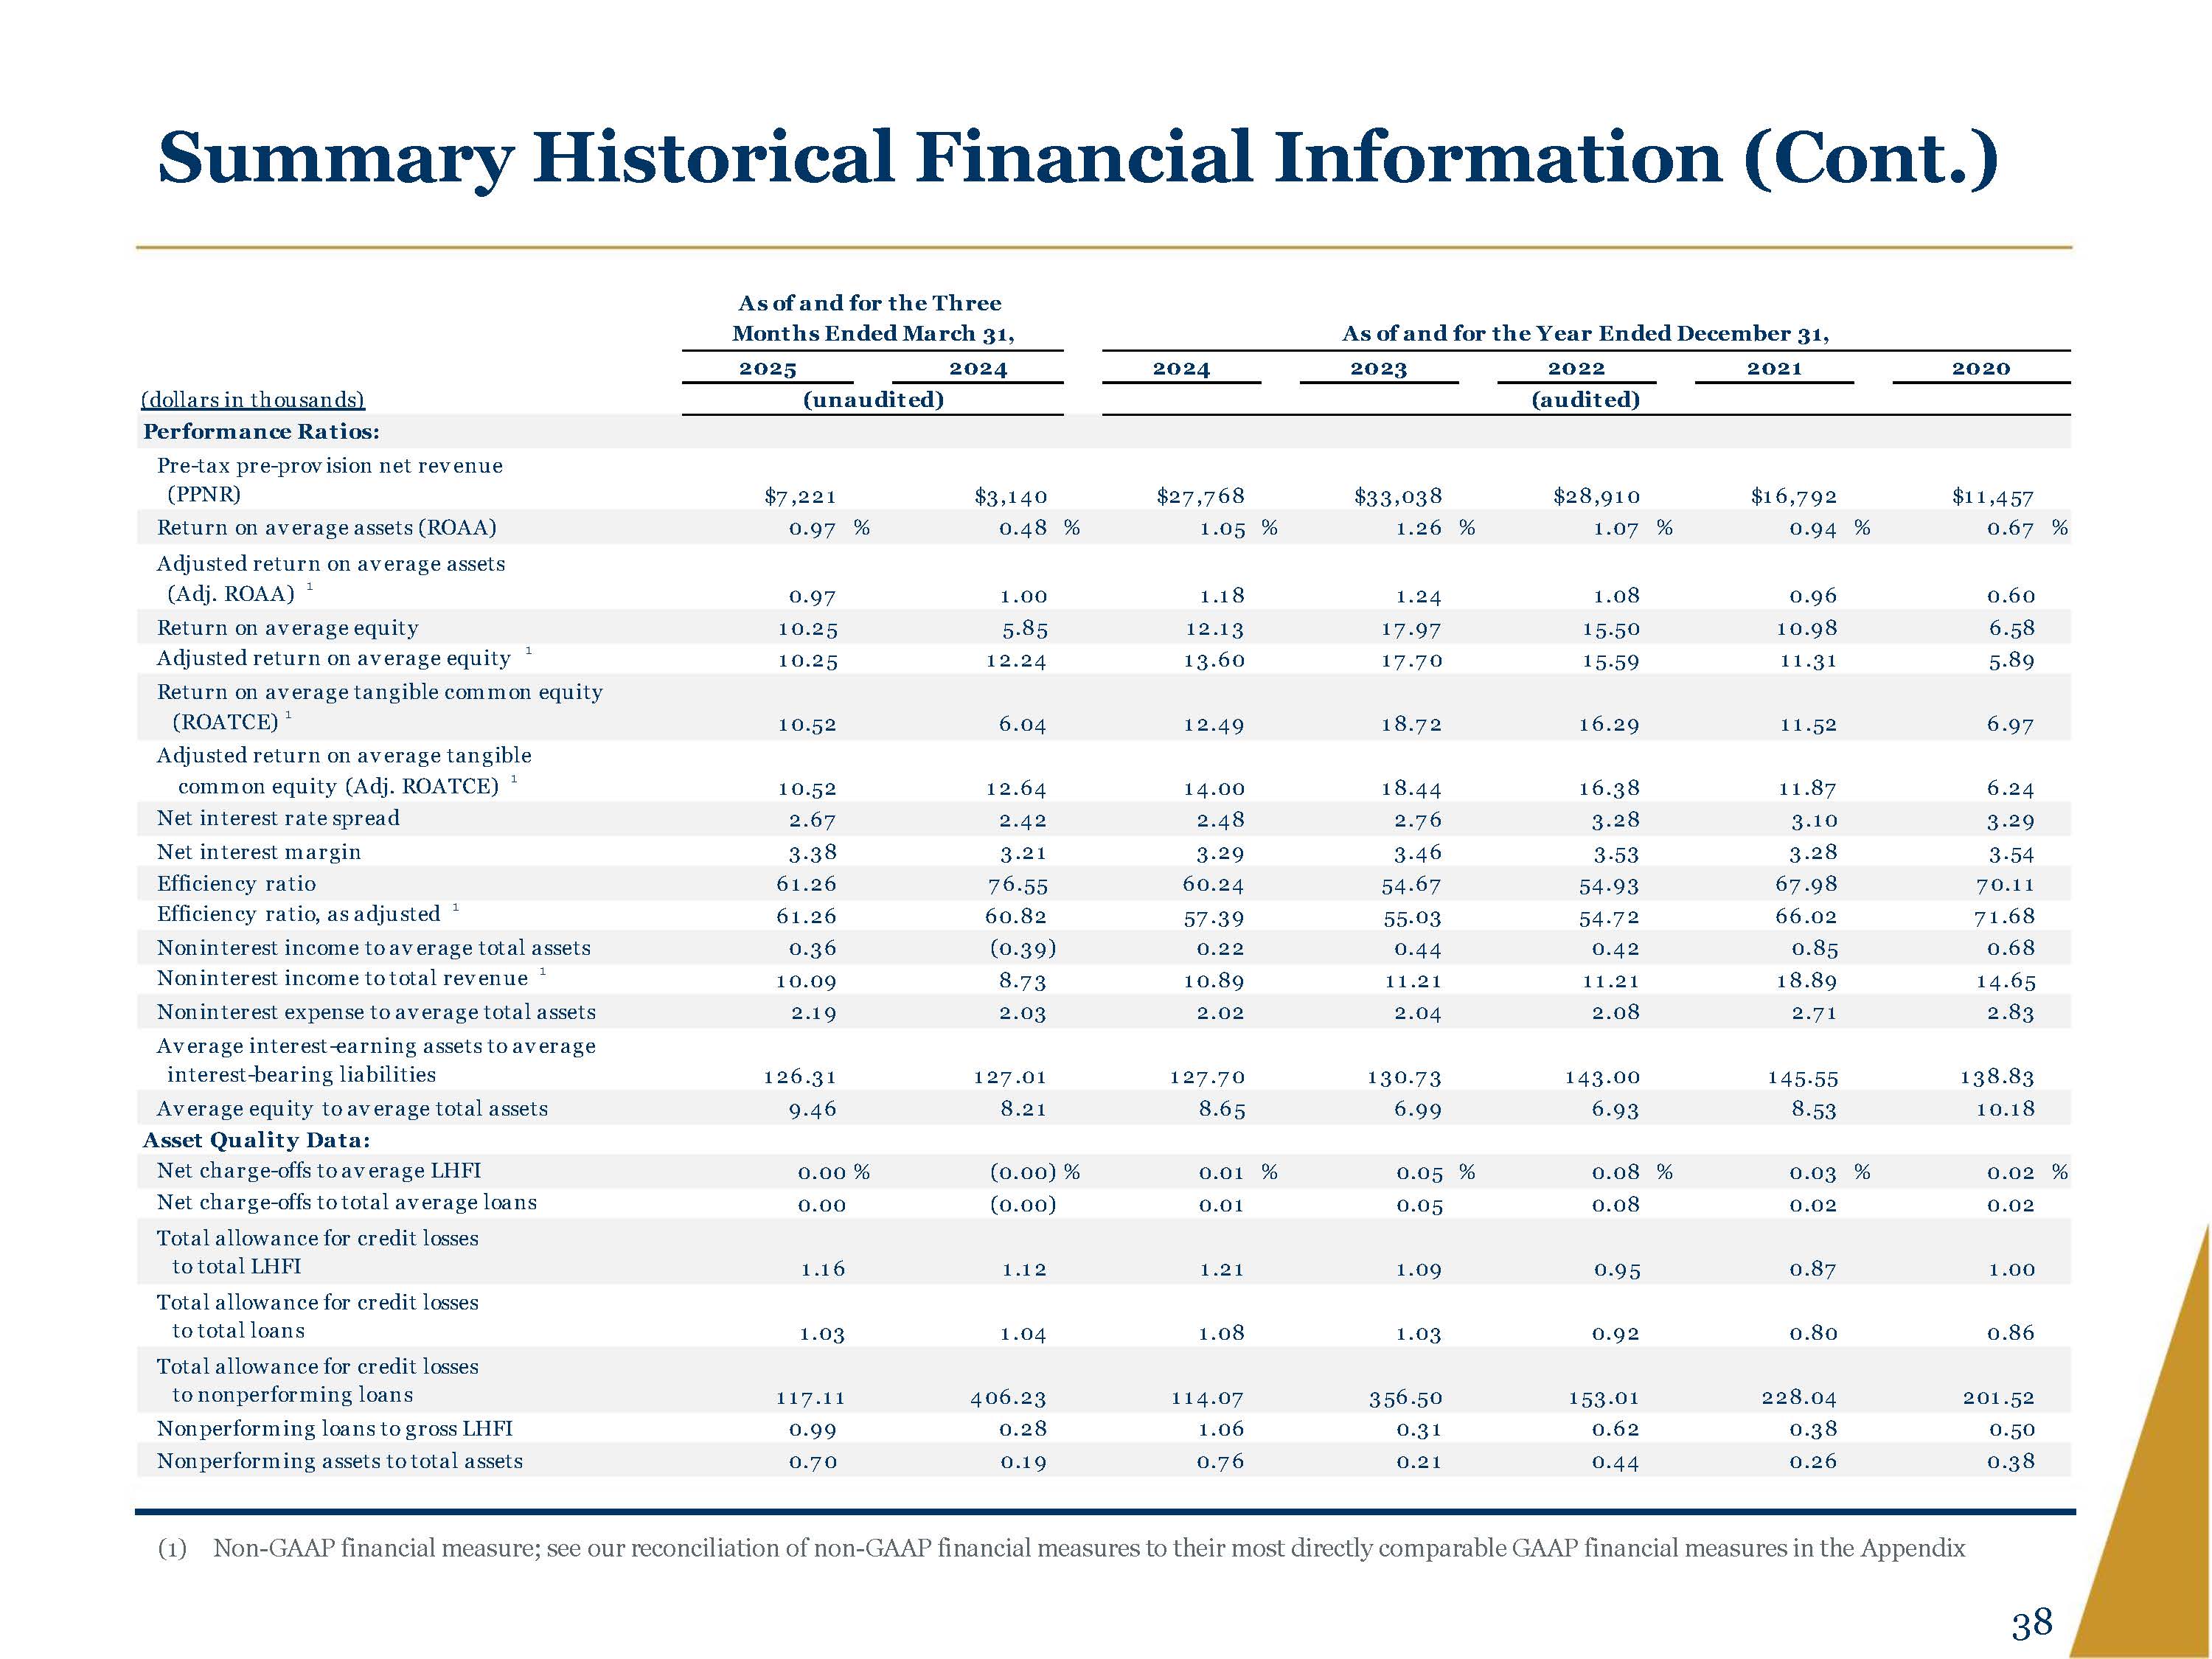
Summary Historical Financial Information (Cont.) As of and for the Three Months Ended March 31, As of and for the Year Ended December 31, 2025 2024 2024 2023 2022 2021 2020 (dollars in thousands) (unaudited) (audited) Performance Ratios: Pre tax pre provision net revenue (PPNR) $7,221 $3,140 $27,768 $33,038 $28,910 $16,792 $11,457 Return on average assets (ROAA) 0.97 % 0.48 % 1.05 % 1.26 % 1.07 % 0.94 % 0.67 % Adjusted return on average assets (Adj. ROAA) 1 0.97 1.00 1.18 1.24 1.08 0.96 0.60 Return on average equity 10.25 5.85 12.13 17.97 15.50 10.98 6.58 Adjusted return on average equity 1 10.25 12.24 13.60 17.70 15.59 11.31 5.89 Return on average tangible common equity (ROATCE) 1 10.52 6.04 12.49 18.72 16.29 11.52 6.97 Adjusted return on average tangible common equity (Adj. ROATCE) 1 10.52 12.64 14.00 18.44 16.38 11.87 6.24 Net interest rate spread 2.67 2.42 2.48 2.76 3.28 3.10 3.29 Net interest margin 3.38 3.21 3.29 3.46 3.53 3.28 3.54 Efficiency ratio 61.26 76.55 60.24 54.67 54.93 67.98 70.11 Efficiency ratio, as adjusted 1 61.26 60.82 57.39 55.03 54.72 66.02 71.68 Noninterest income to average total assets 0.36 (0.39) 0.22 0.44 0.42 0.85 0.68 Noninterest income to total revenue 1 10.09 8.73 10.89 11.21 11.21 18.89 14.65 Noninterest expense to average total assets 2.19 2.03 2.02 2.04 2.08 2.71 2.83 Average interest earning assets to average interest bearing liabilities 126.31 127.01 127.70 130.73 143.00 145.55 138.83 Average equity to average total assets 9.46 8.21 8.65 6.99 6.93 8.53 10.18 Asset Quality Data: Net charge offs to average LHFI 0.00 % (0.00) % 0.01 % 0.05 % 0.08 % 0.03 % 0.02 % Net charge offs to total average loans 0.00 (0.00) 0.01 0.05 0.08 0.02 0.02 Total allowance for credit losses to total LHFI 1.16 1.12 1.21 1.09 0.95 0.87 1.00 Total allowance for credit losses to total loans 1.03 1.04 1.08 1.03 0.92 0.80 0.86 Total allowance for credit losses to nonperforming loans 117.11 406.23 114.07 356.50 153.01 228.04 201.52 Nonperforming loans to gross LHFI 0.99 0.28 1.06 0.31 0.62 0.38 0.50 Nonperforming assets to total assets 0.70 0.19 0.76 0.21 0.44 0.26 0.38 (1) Non GAAP financial measure; see our reconciliation of non GAAP financial measures to their most directly comparable GAAP financial measures in the Appendix 38
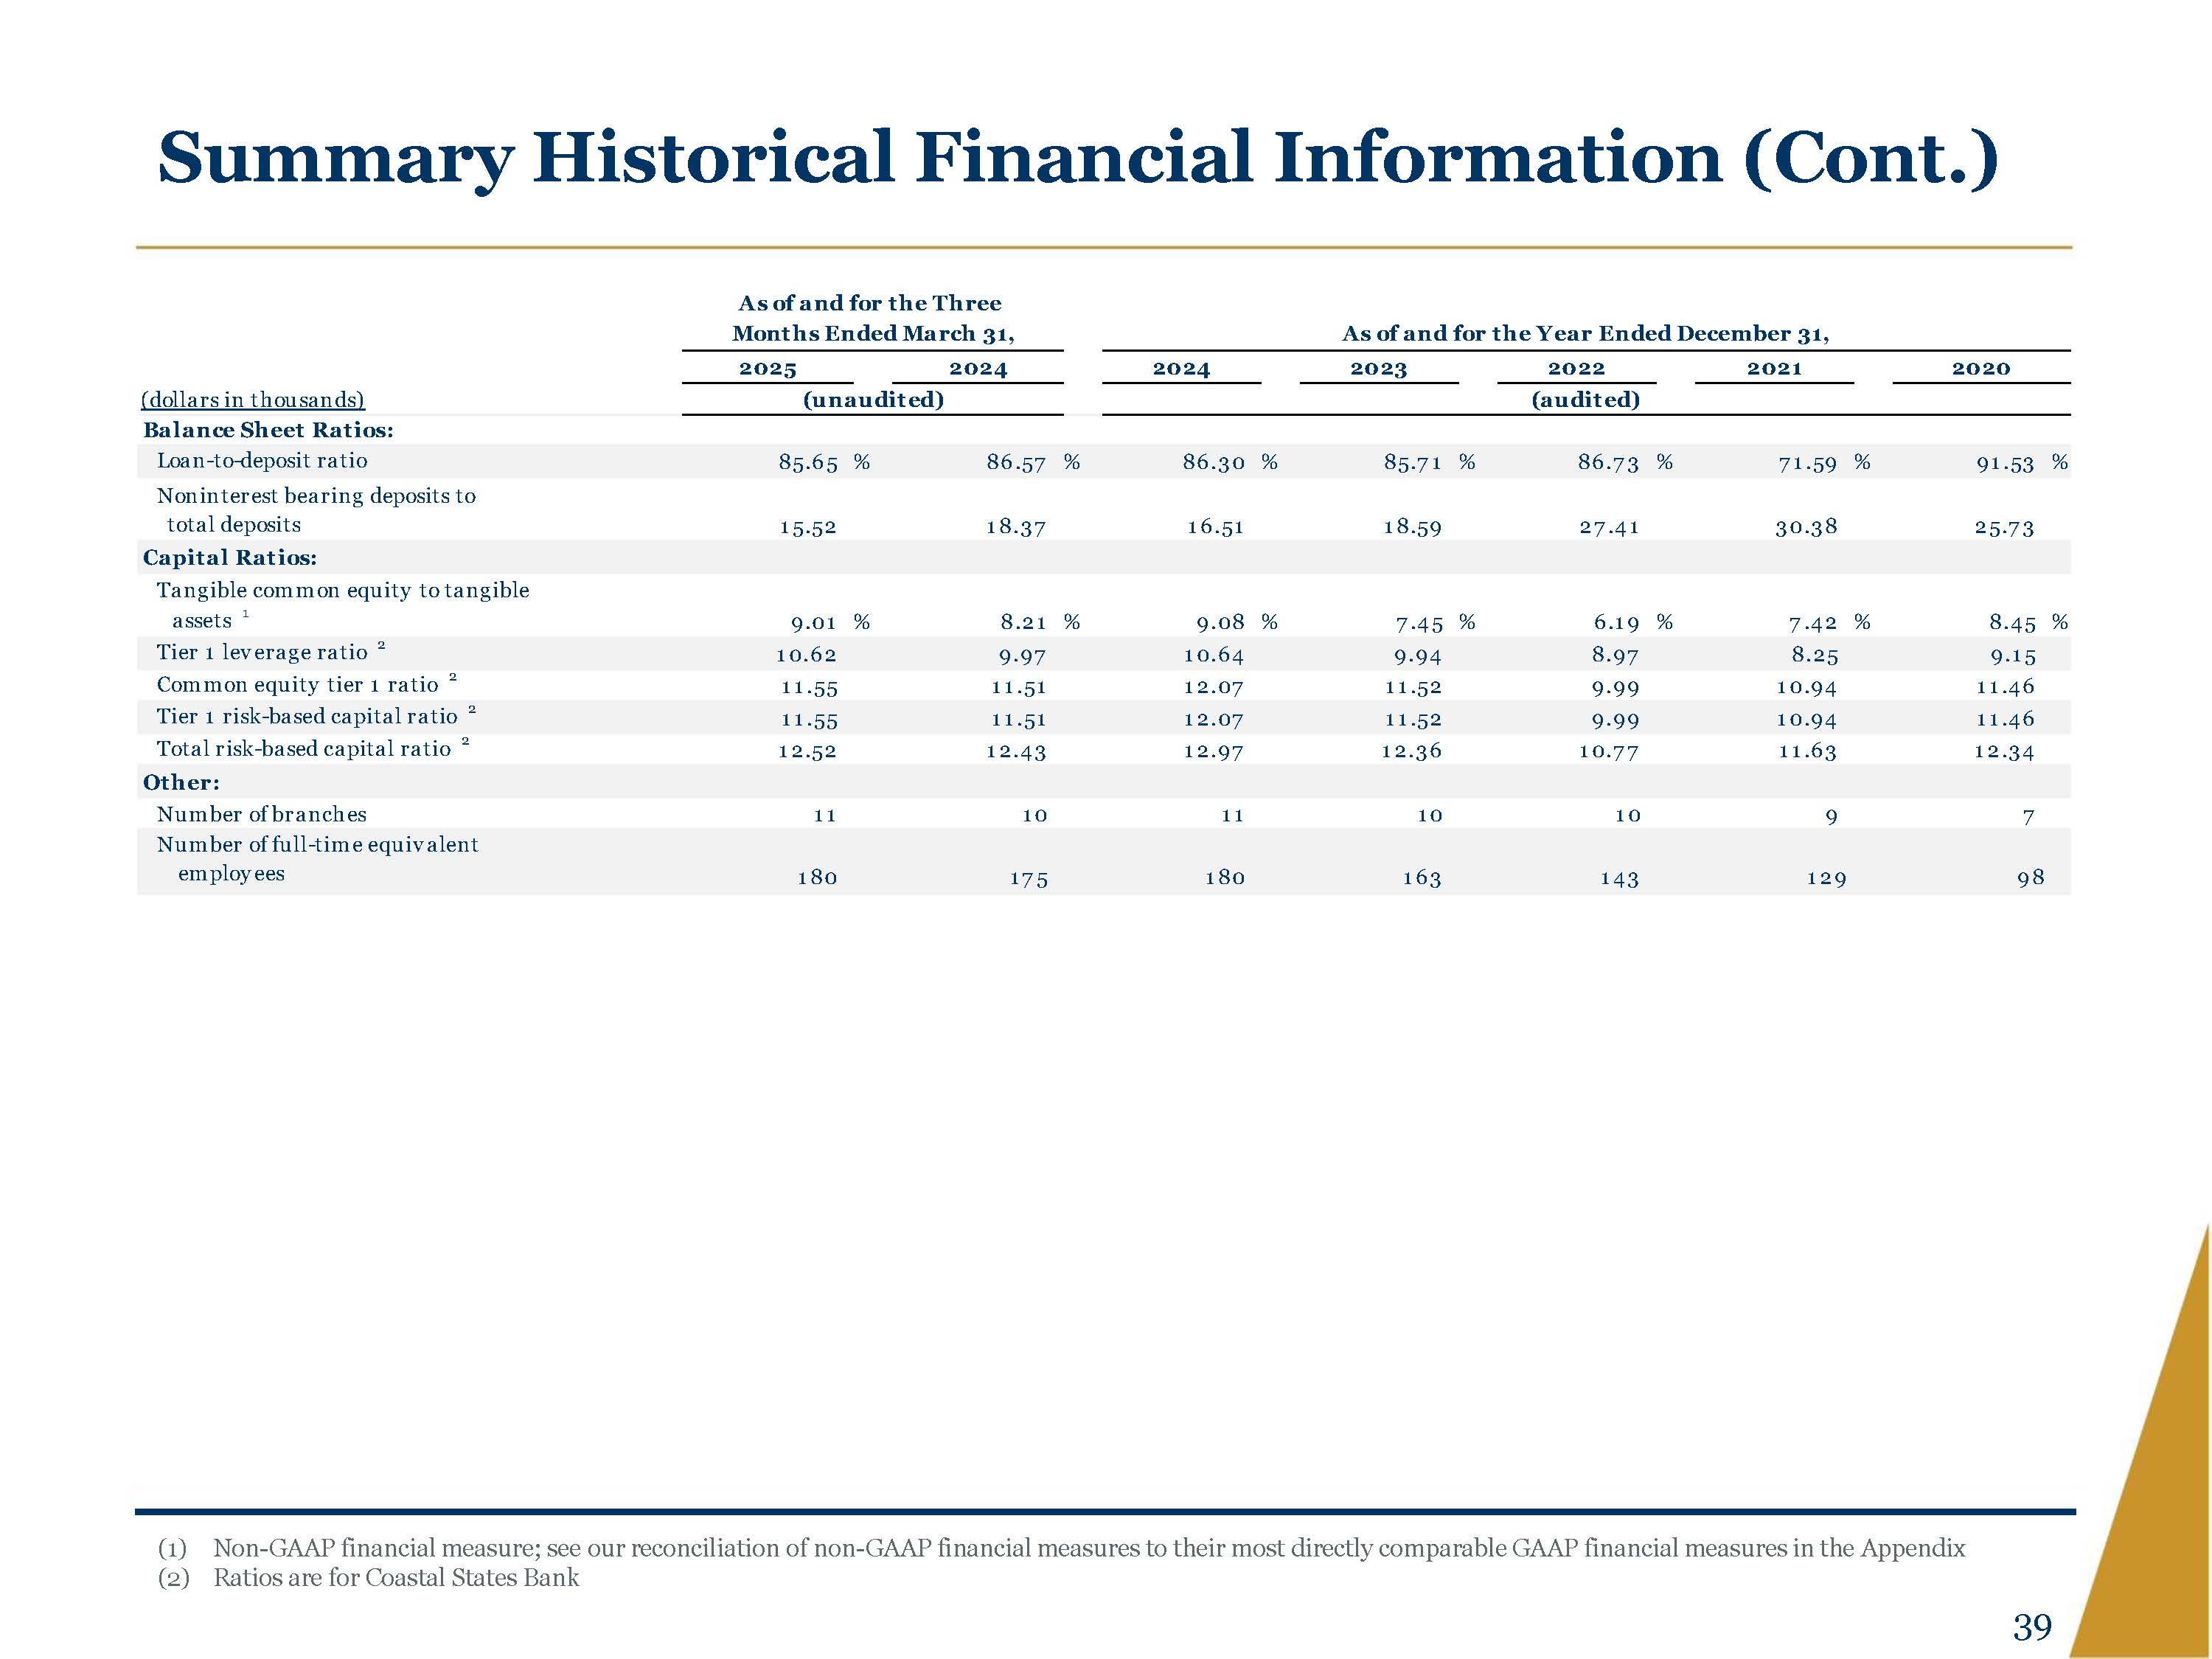
Summary Historical Financial Information (Cont.) As of and for the Three Months Ended March 31, As of and for the Year Ended December 31, , 2025 2024 2024 2023 2022 2021 2020 (dollars in thousands) (unaudited) (audited) Balance Sheet Ratios: Loan to deposit ratio 85.65 % 86.57 % 86.30 % 85.71 % 86.73 % 71.59 % 91.53 % Noninterest bearing deposits to total deposits 15.52 18.37 16.51 18.59 27.41 30.38 25.73 Capital Ratios: Tangible common equity to tangible assets 1 9.01 % 8.21 % 9.08 % 7.45 % 6.19 % 7.42 % 8.45 % Tier 1 leverage ratio 2 10.62 9.97 10.64 9.94 8.97 8.25 9.15 Common equity tier 1 ratio 2 11.55 11.51 12.07 11.52 9.99 10.94 11.46 Tier 1 risk based capital ratio 2 11.55 11.51 12.07 11.52 9.99 10.94 11.46 Total risk based capital ratio 2 12.52 12.43 12.97 12.36 10.77 11.63 12.34 Other: Number of branches 11 10 11 10 10 9 7 Number of full time equivalent employ ees 180 175 180 163 143 129 98 (1) Non GAAP financial measure; see our reconciliation of non GAAP financial measures to their most directly comparable GAAP financial measures in the Appendix (2) Ratios are for Coastal States Bank 39
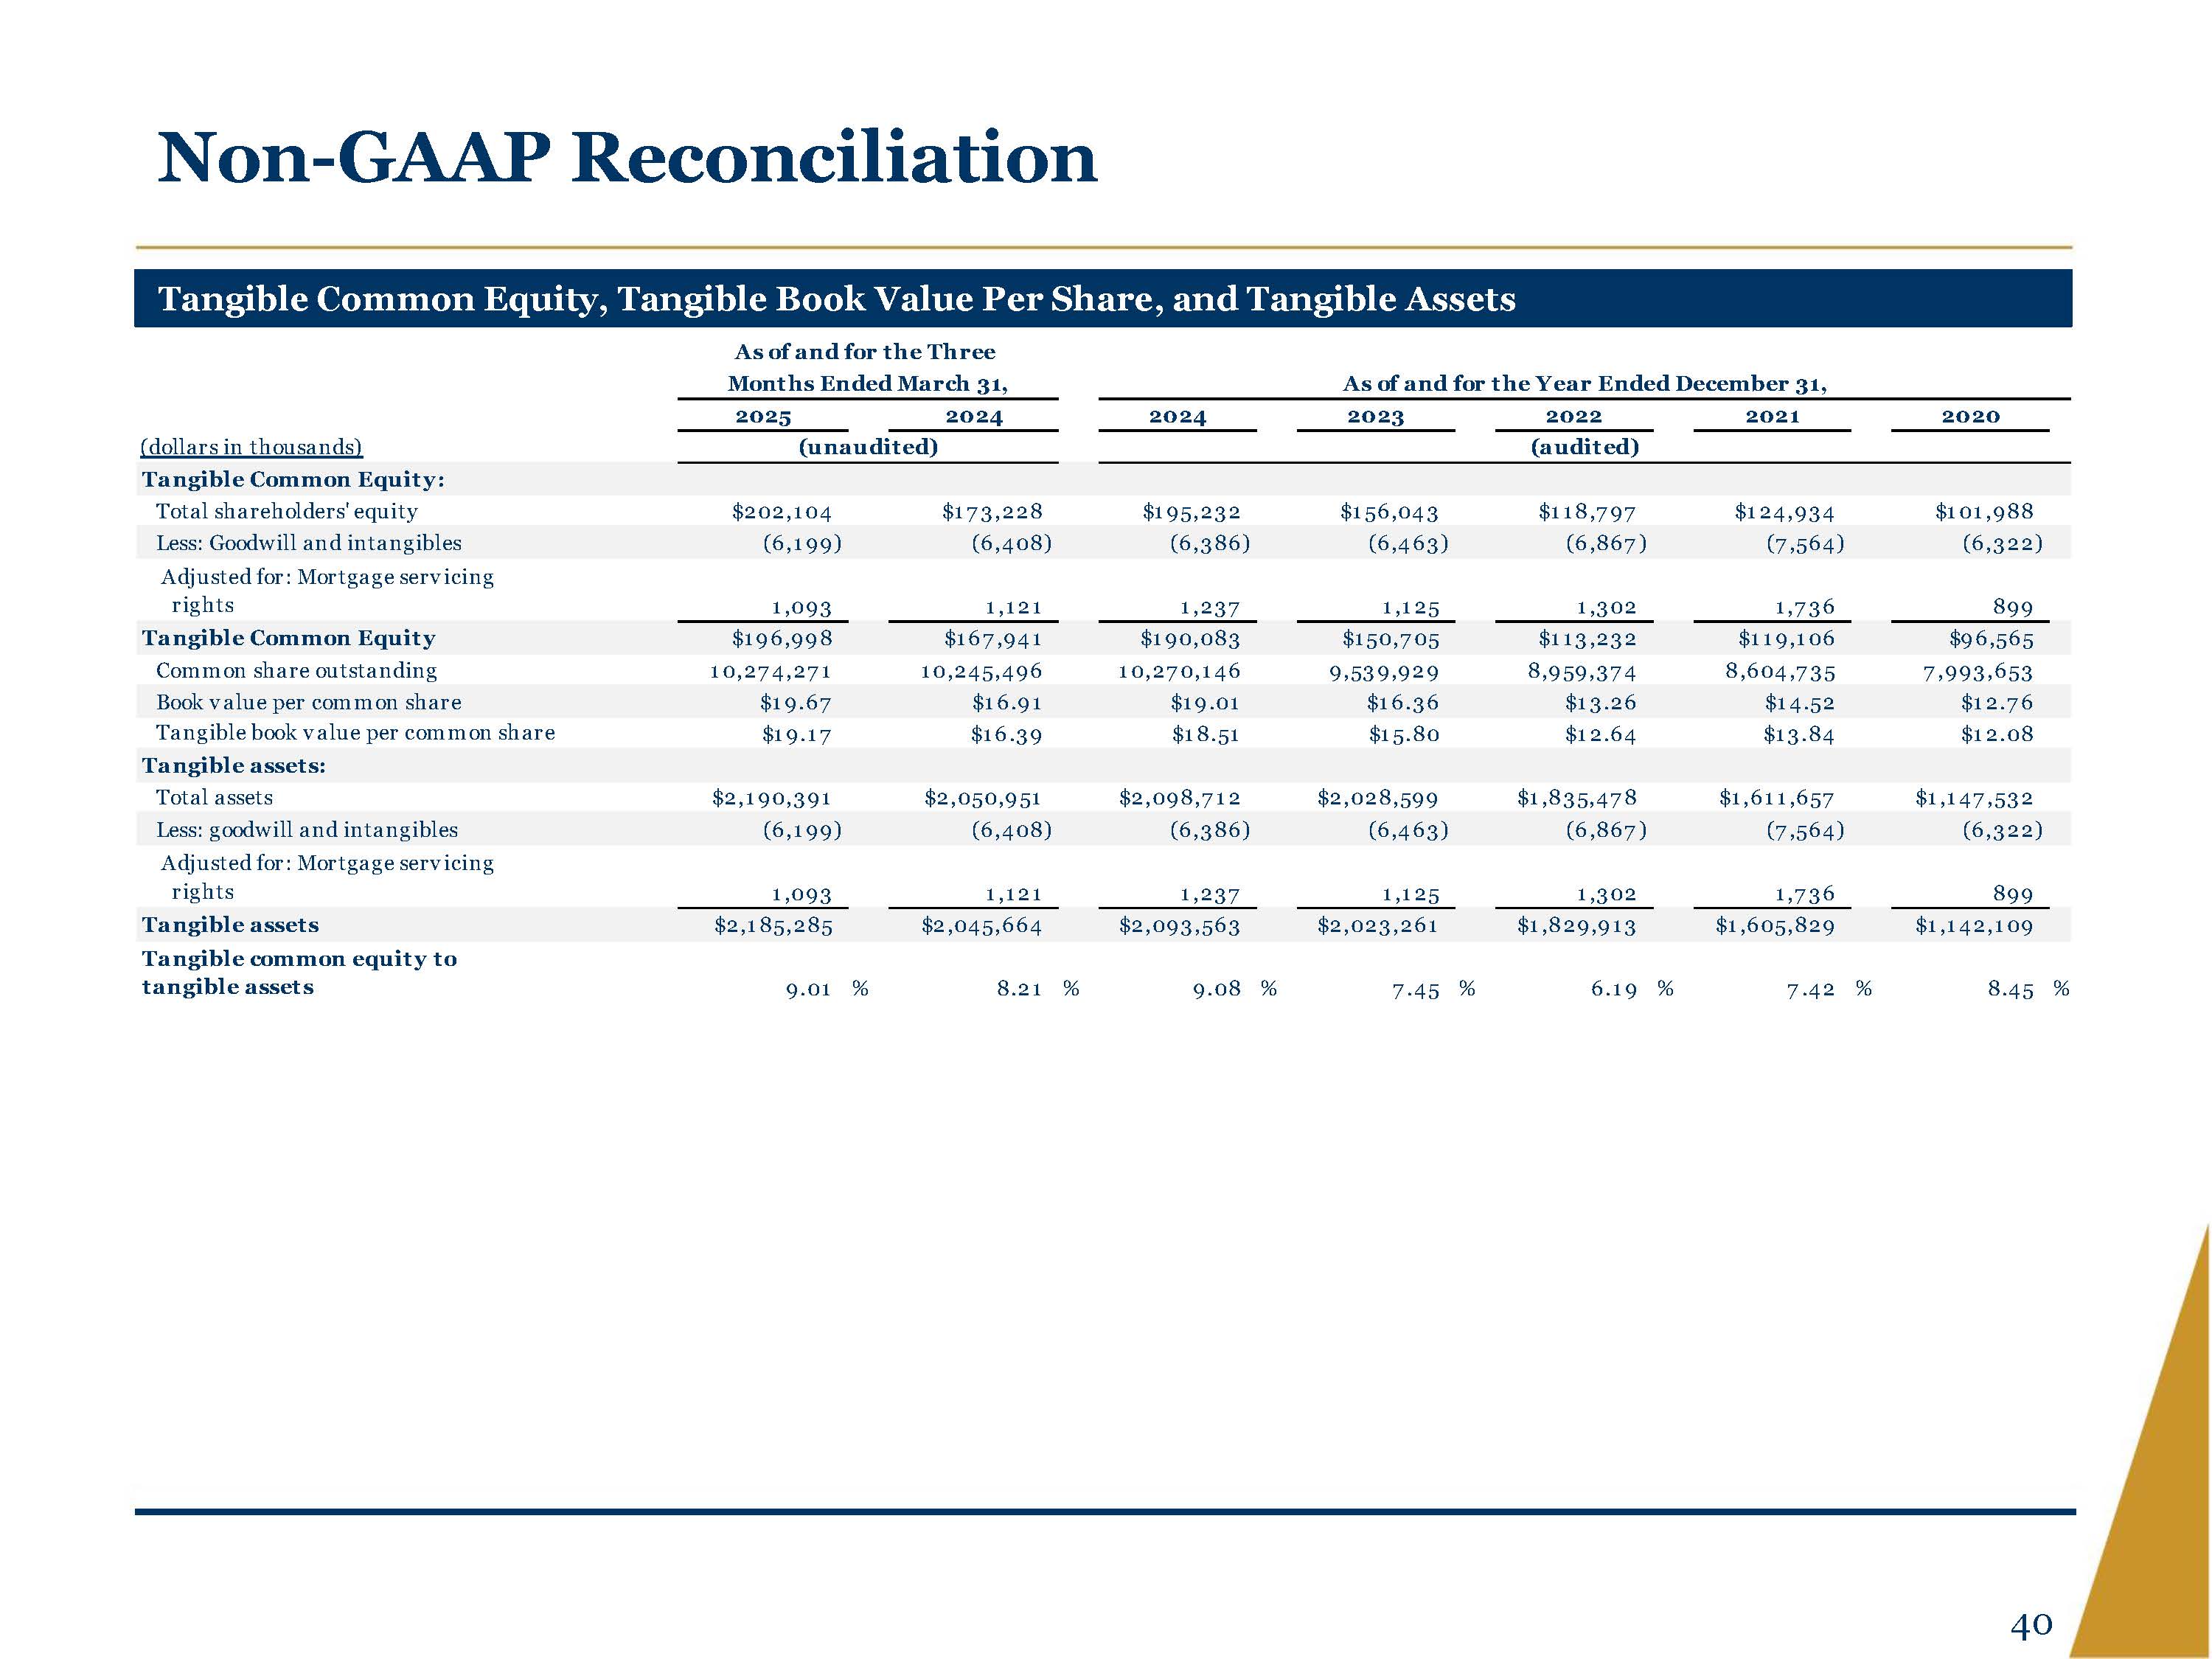
Non GAAP Reconciliation Tangible Common Equity, Tangible Book Value Per Share, and Tangible Assets As of and for the Three Months Ended March 31, As of and for the Year Ended December 31, 2025 2024 2024 2023 2022 2021 2020 (dollars in thousands) (unaudited) (audited) Tangible Common Equity: Total shareholders' equity $202,104 $173,228 $195,232 $156,043 $118,797 $124,934 $101,988 Less: Goodwill and intangibles (6,199) (6,408) (6,386) (6,463) (6,867) (7,564) (6,322) Adjusted for: Mortgage servicing rights 1,093 1,121 1,237 1,125 1,302 1,736 899 Tangible Common Equity $196,998 $167,941 $190,083 $150,705 $113,232 $119,106 $96,565 Common share outstanding 10,274,271 10,245,496 10,270,146 9,539,929 8,959,374 8,604,735 7,993,653 Book value per common share $19.67 $16.91 $19.01 $16.36 $13.26 $14.52 $12.76 Tangible book value per common share $19.17 $16.39 $18.51 $15.80 $12.64 $13.84 $12.08 Tangible assets: Total assets $2,190,391 $2,050,951 $2,098,712 $2,028,599 $1,835,478 $1,611,657 $1,147,532 Less: goodwill and intangibles (6,199) (6,408) (6,386) (6,463) (6,867) (7,564) (6,322) Adjusted for: Mortgage servicing rights 1,093 1,121 1,237 1,125 1,302 1,736 899 Tangible assets $2,185,285 $2,045,664 $2,093,563 $2,023,261 $1,829,913 $1,605,829 $1,142,109 Tangible common equity to tangible assets 9.01 % 8.21 % 9.08 % 7.45 % 6.19 % 7.42 % 8.45 % 40
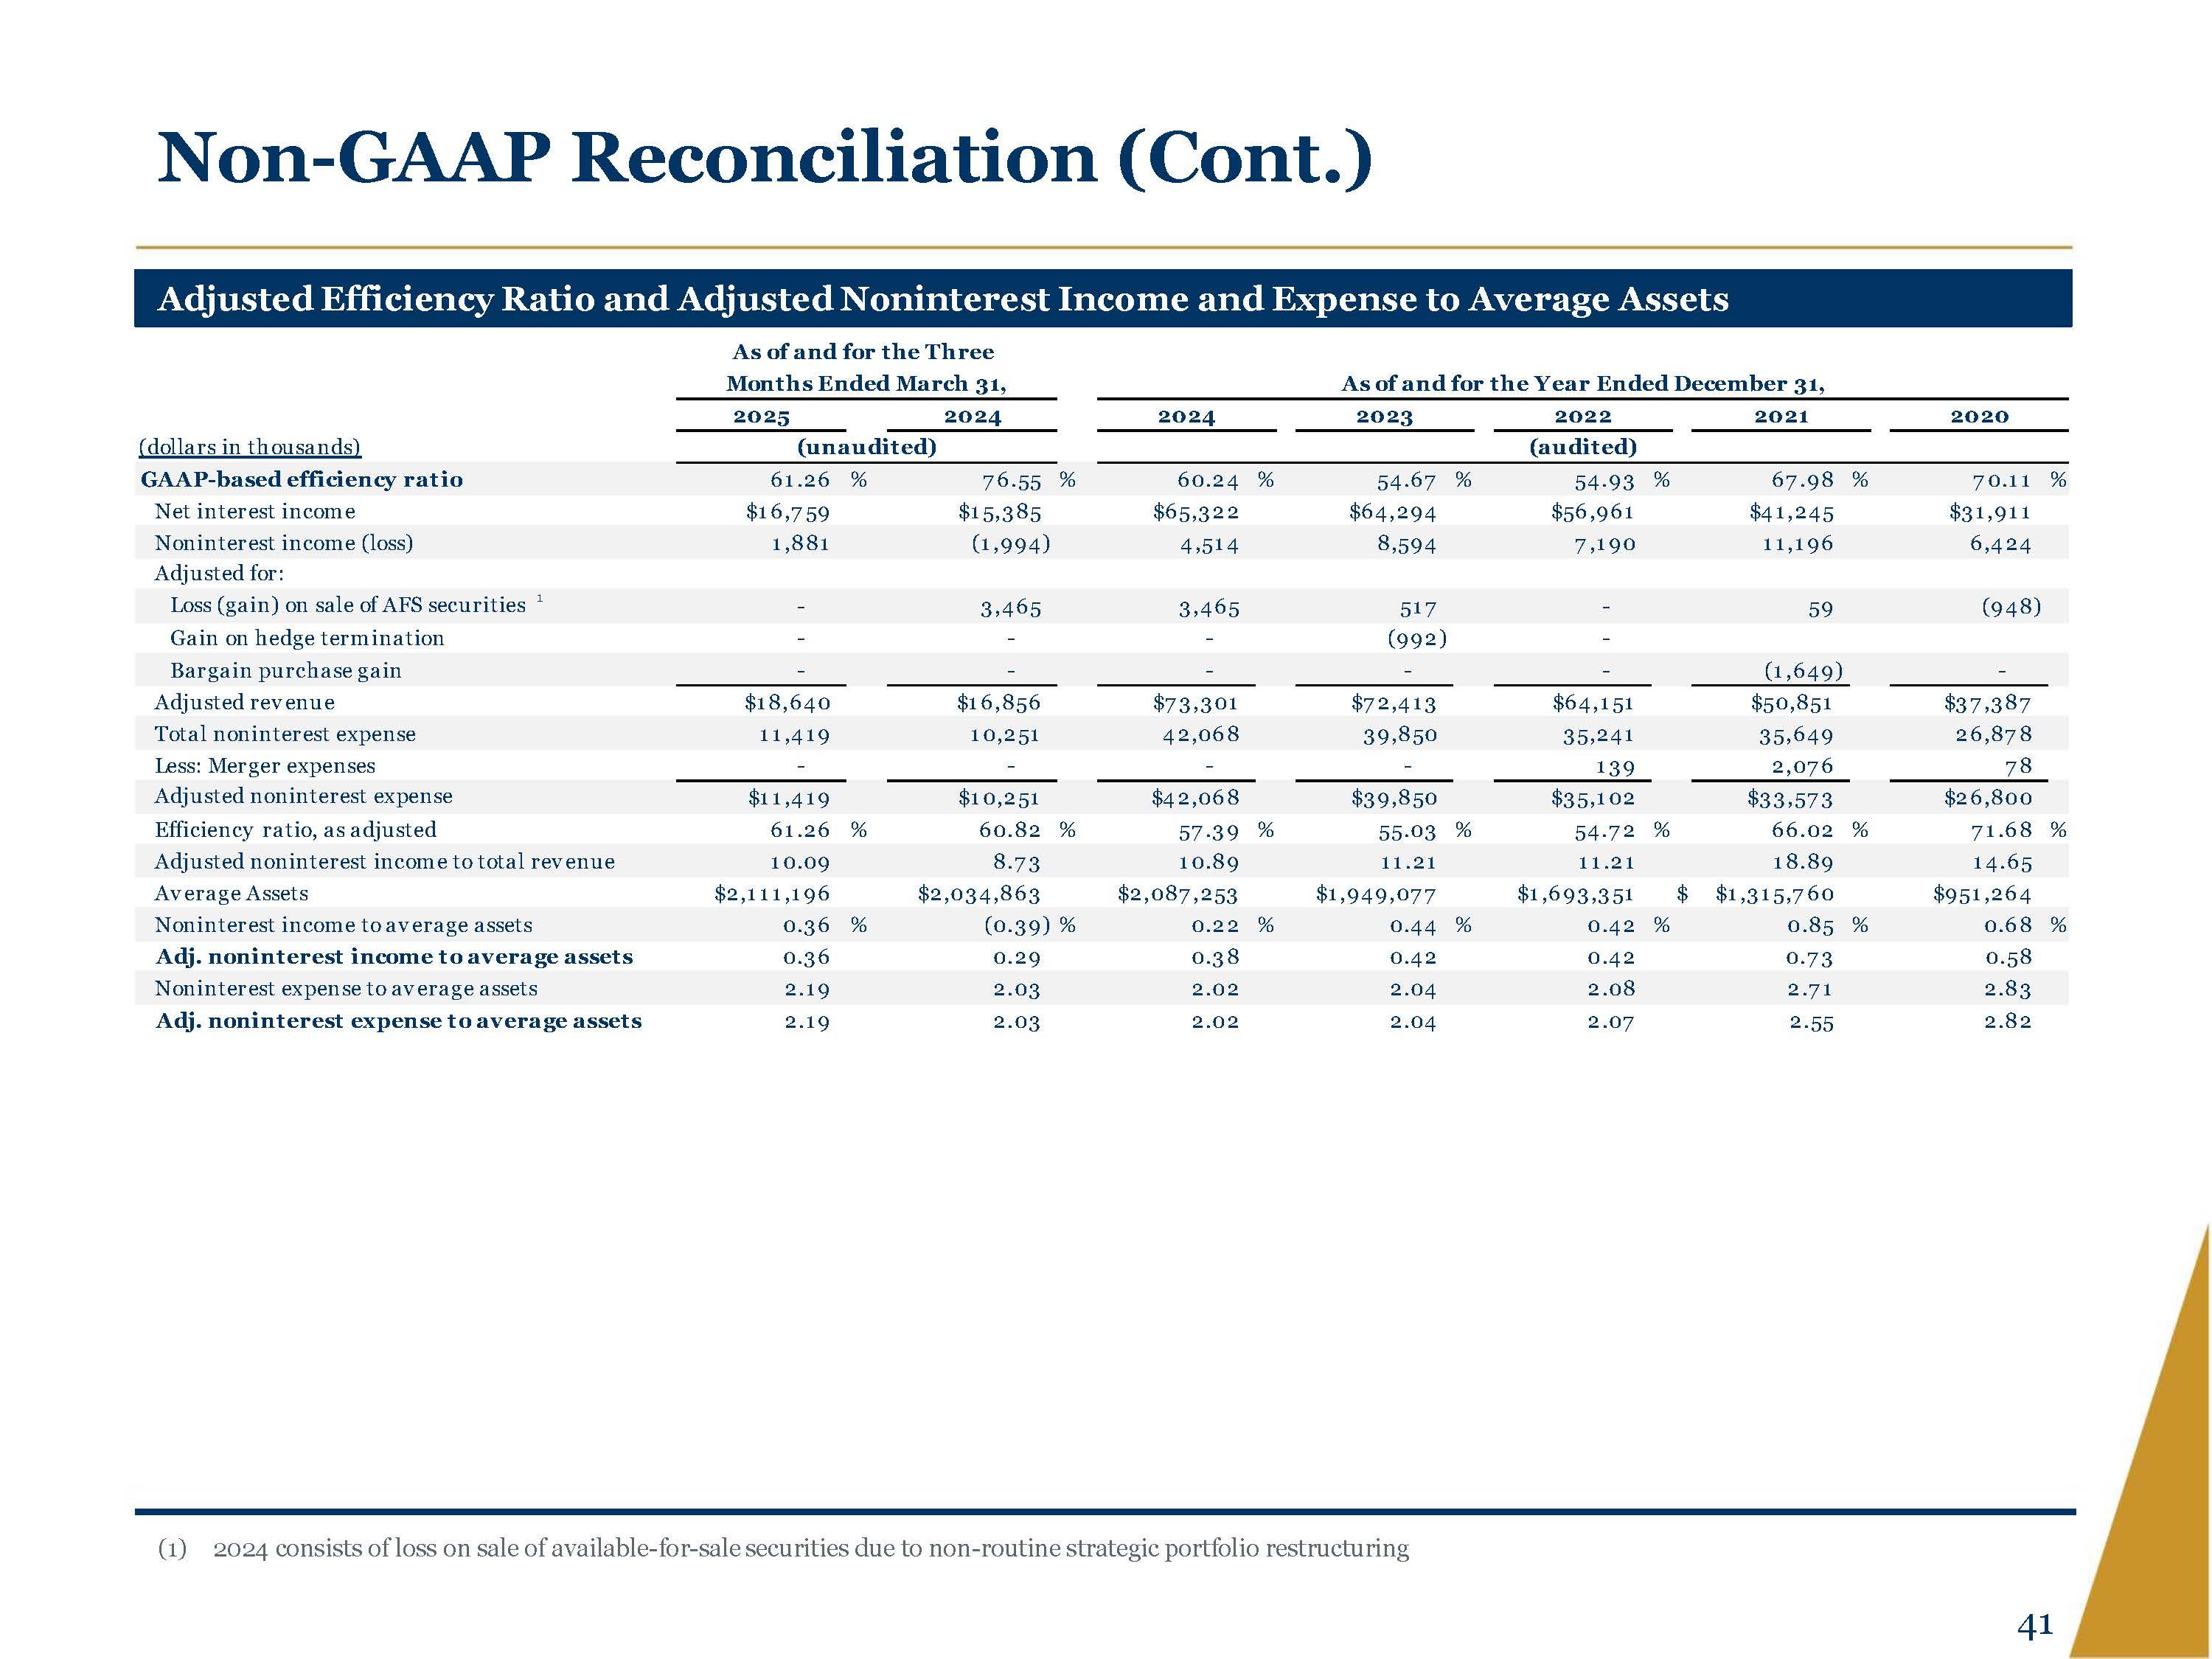
Non GAAP Reconciliation (Cont.) Adjusted Efficiency Ratio and Adjusted Noninterest Income and Expense to Average Assets As of and for the Three Months Ended March 31, As of and for the Year Ended December 31, 2025 2024 2024 2023 2022 2021 2020 (dollars in thousands) (unaudited) (audited) GAAP based efficiency ratio 61.26 % 76.55 % 60.24 % 54.67 % 54.93 % 67.98 % 70.11 % Net interest income $16,759 $15,385 $65,322 $64,294 $56,961 $41,245 $31,911 Noninterest income (loss) 1,881 (1,994) 4,514 8,594 7,190 11,196 6,424 Adjusted for: Loss (gain) on sale of AFS securities 1 3,465 3,465 517 59 (948) Gain on hedge termination (992) Bargain purchase gain (1,649) Adjusted revenue $18,640 $16,856 $73,301 $72,413 $64,151 $50,851 $37,387 Total noninterest expense 11,419 10,251 42,068 39,850 35,241 35,649 26,878 Less: Merger expenses 139 2,076 78 Adjusted noninterest expense $11,419 $10,251 $42,068 $39,850 $35,102 $33,573 $26,800 Efficiency ratio, as adjusted 61.26 % 60.82 % 57.39 % 55.03 % 54.72 % 66.02 % 71.68 % Adjusted noninterest income to total revenue 10.09 8.73 10.89 11.21 11.21 18.89 14.65 Average Assets $2,111,196 $2,034,863 $2,087,253 $1,949,077 $1,693,351 $ $1,315,760 $951,264 Noninterest income to average assets 0.36 % (0.39) % 0.22 % 0.44 % 0.42 % 0.85 % 0.68 % Adj. noninterest income to average assets 0.36 0.29 0.38 0.42 0.42 0.73 0.58 Noninterest expense to average assets 2.19 2.03 2.02 2.04 2.08 2.71 2.83 Adj. noninterest expense to average assets 2.19 2.03 2.02 2.04 2.07 2.55 2.82 (1) 2024 consists of loss on sale of available for sale securities due to non routine strategic portfolio restructuring 41
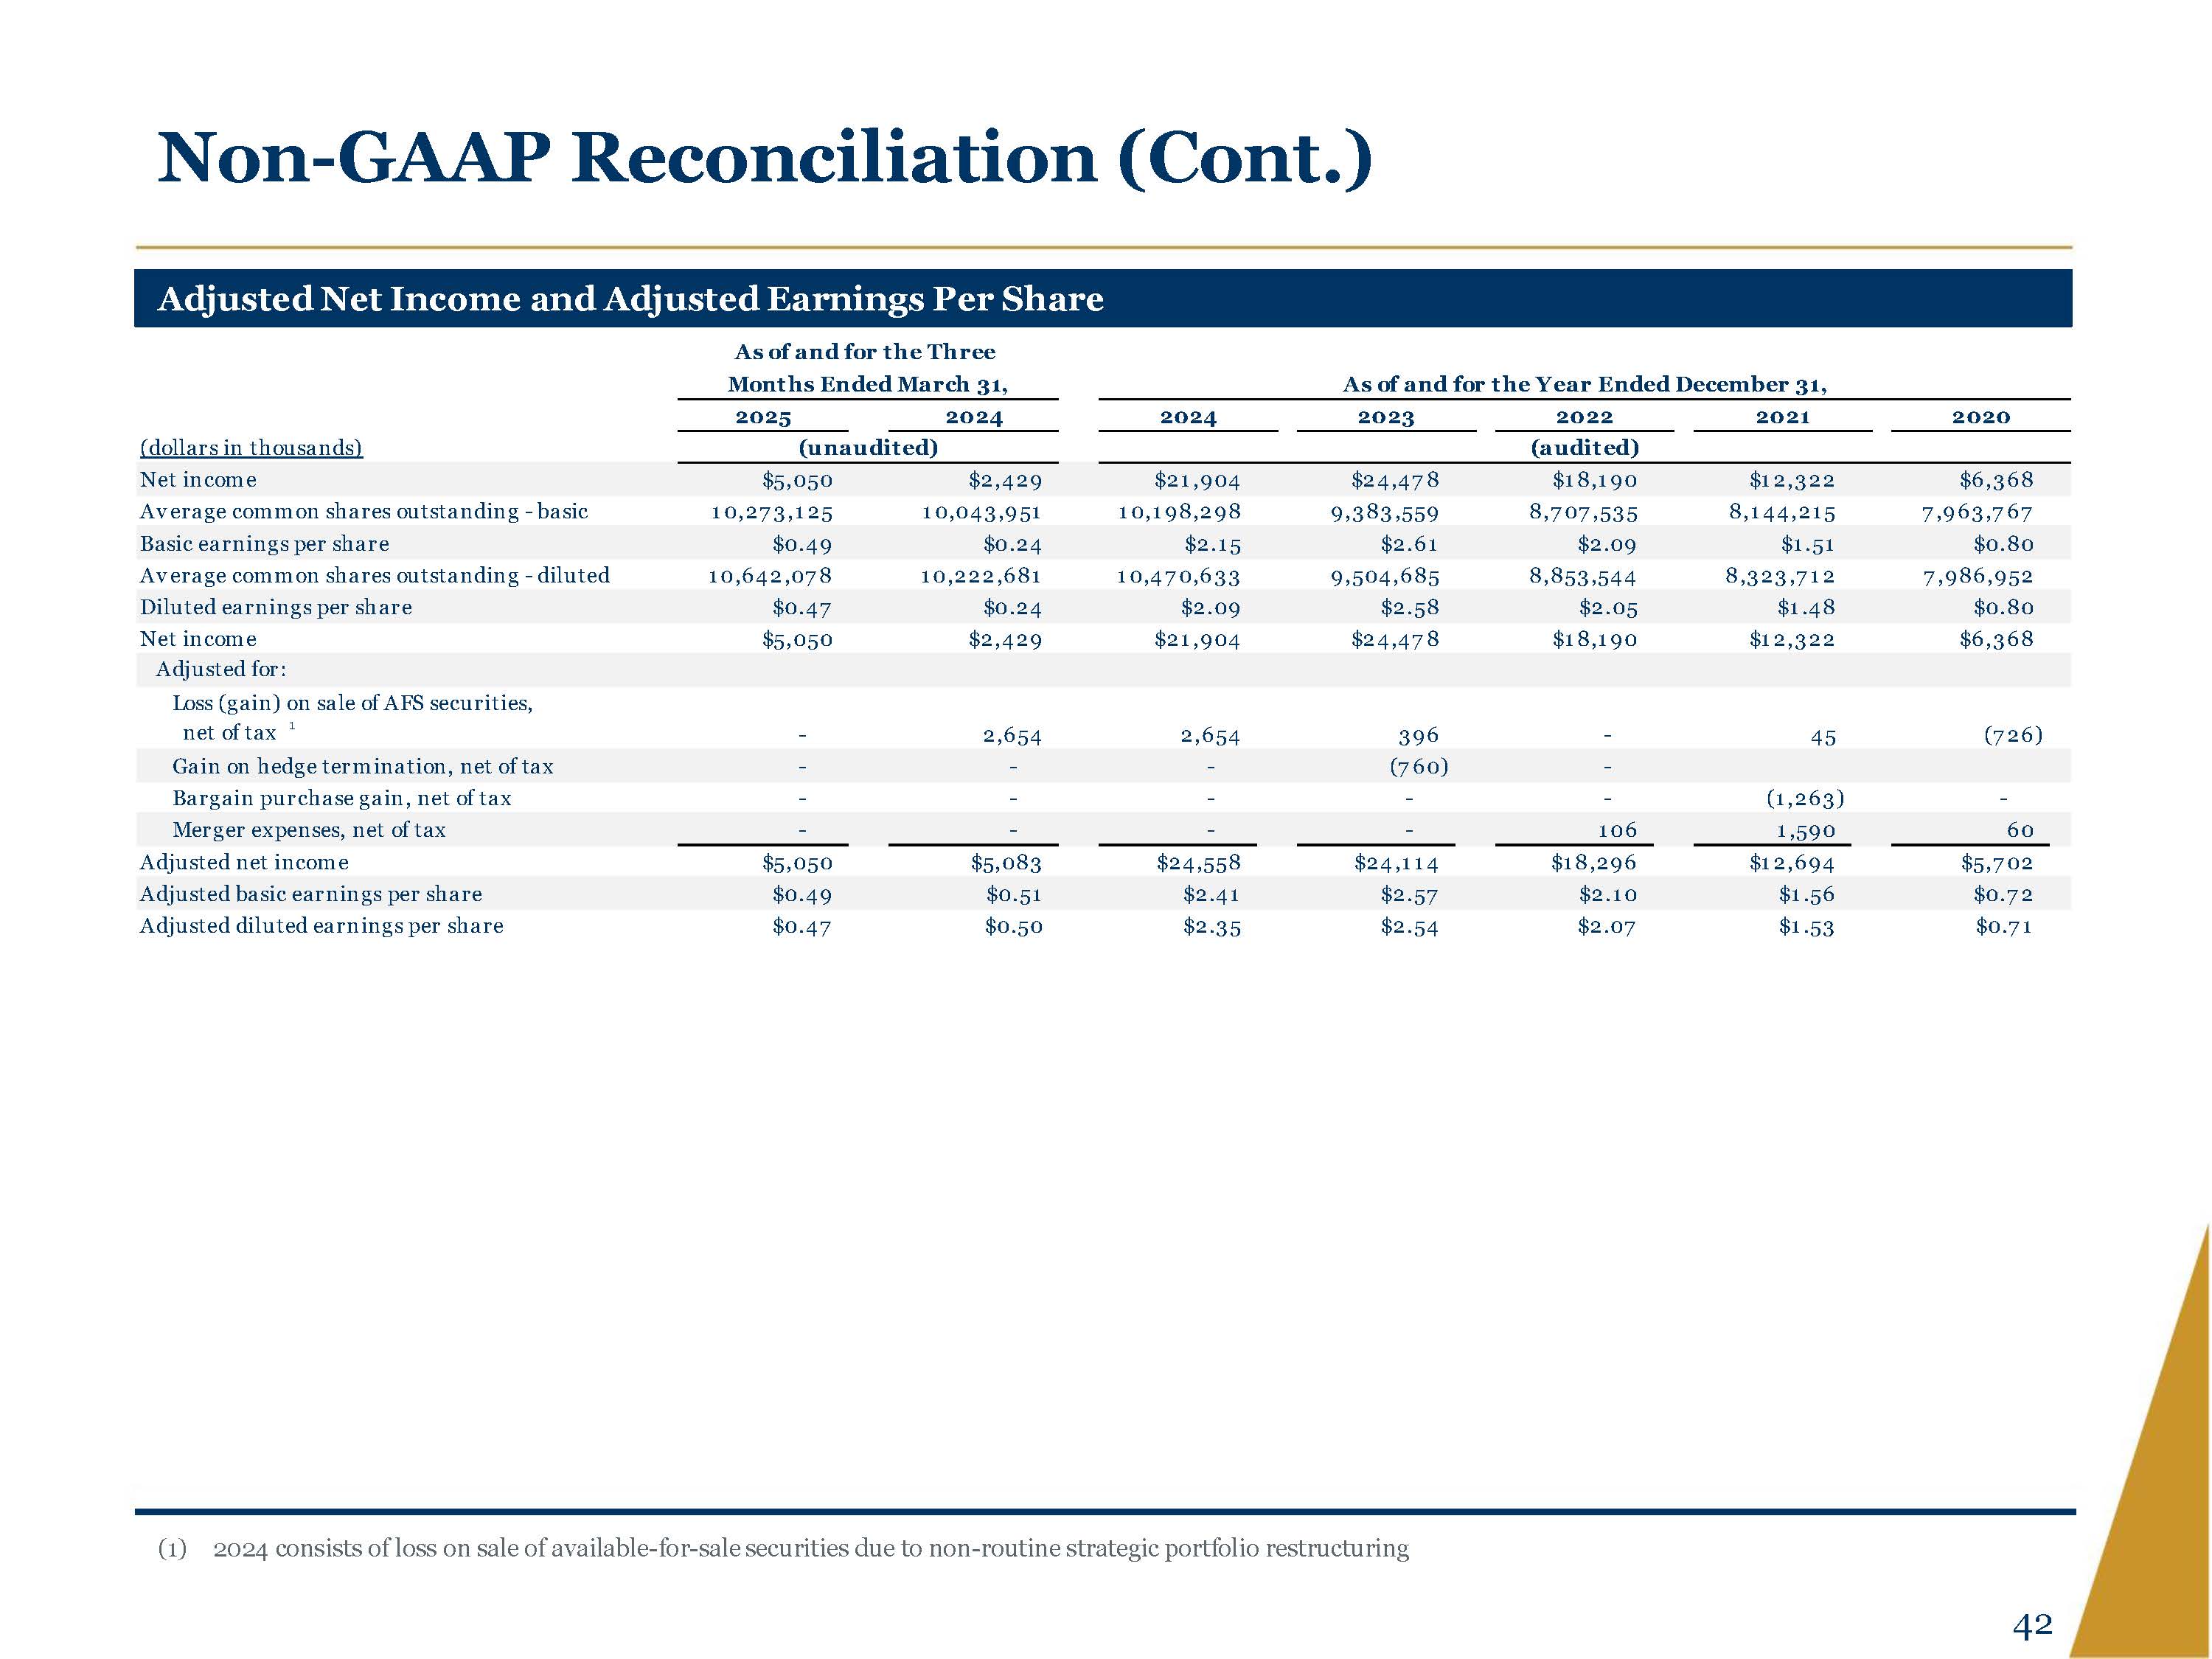
Non GAAP Reconciliation (Cont.) Adjusted Net Income and Adjusted Earnings Per Share As of and for the Three Months Ended March 31, As of and for the Year Ended December 31, 2025 2024 2024 2023 2022 2021 2020 (dollars in thousands) (unaudited) (audited) Net income $5,050 $2,429 $21,904 $24,478 $18,190 $12,322 $6,368 Average common shares outstanding basic 10,273,125 10,043,951 10,198,298 9,383,559 8,707,535 8,144,215 7,963,767 Basic earnings per share $0.49 $0.24 $2.15 $2.61 $2.09 $1.51 $0.80 Average common shares outstanding diluted 10,642,078 10,222,681 10,470,633 9,504,685 8,853,544 8,323,712 7,986,952 Diluted earnings per share $0.47 $0.24 $2.09 $2.58 $2.05 $1.48 $0.80 Net income $5,050 $2,429 $21,904 $24,478 $18,190 $12,322 $6,368 Adjusted for: Loss (gain) on sale of AFS securities, net of tax 1 2,654 2,654 396 45 (726) Gain on hedge termination, net of tax (760) Bargain purchase gain, net of tax (1,263) Merger expenses, net of tax 106 1,590 60 Adjusted net income $5,050 $5,083 $24,558 $24,114 $18,296 $12,694 $5,702 Adjusted basic earnings per share $0.49 $0.51 $2.41 $2.57 $2.10 $1.56 $0.72 Adjusted diluted earnings per share $0.47 $0.50 $2.35 $2.54 $2.07 $1.53 $0.71 (1) 2024 consists of loss on sale of available for sale securities due to non routine strategic portfolio restructuring 42
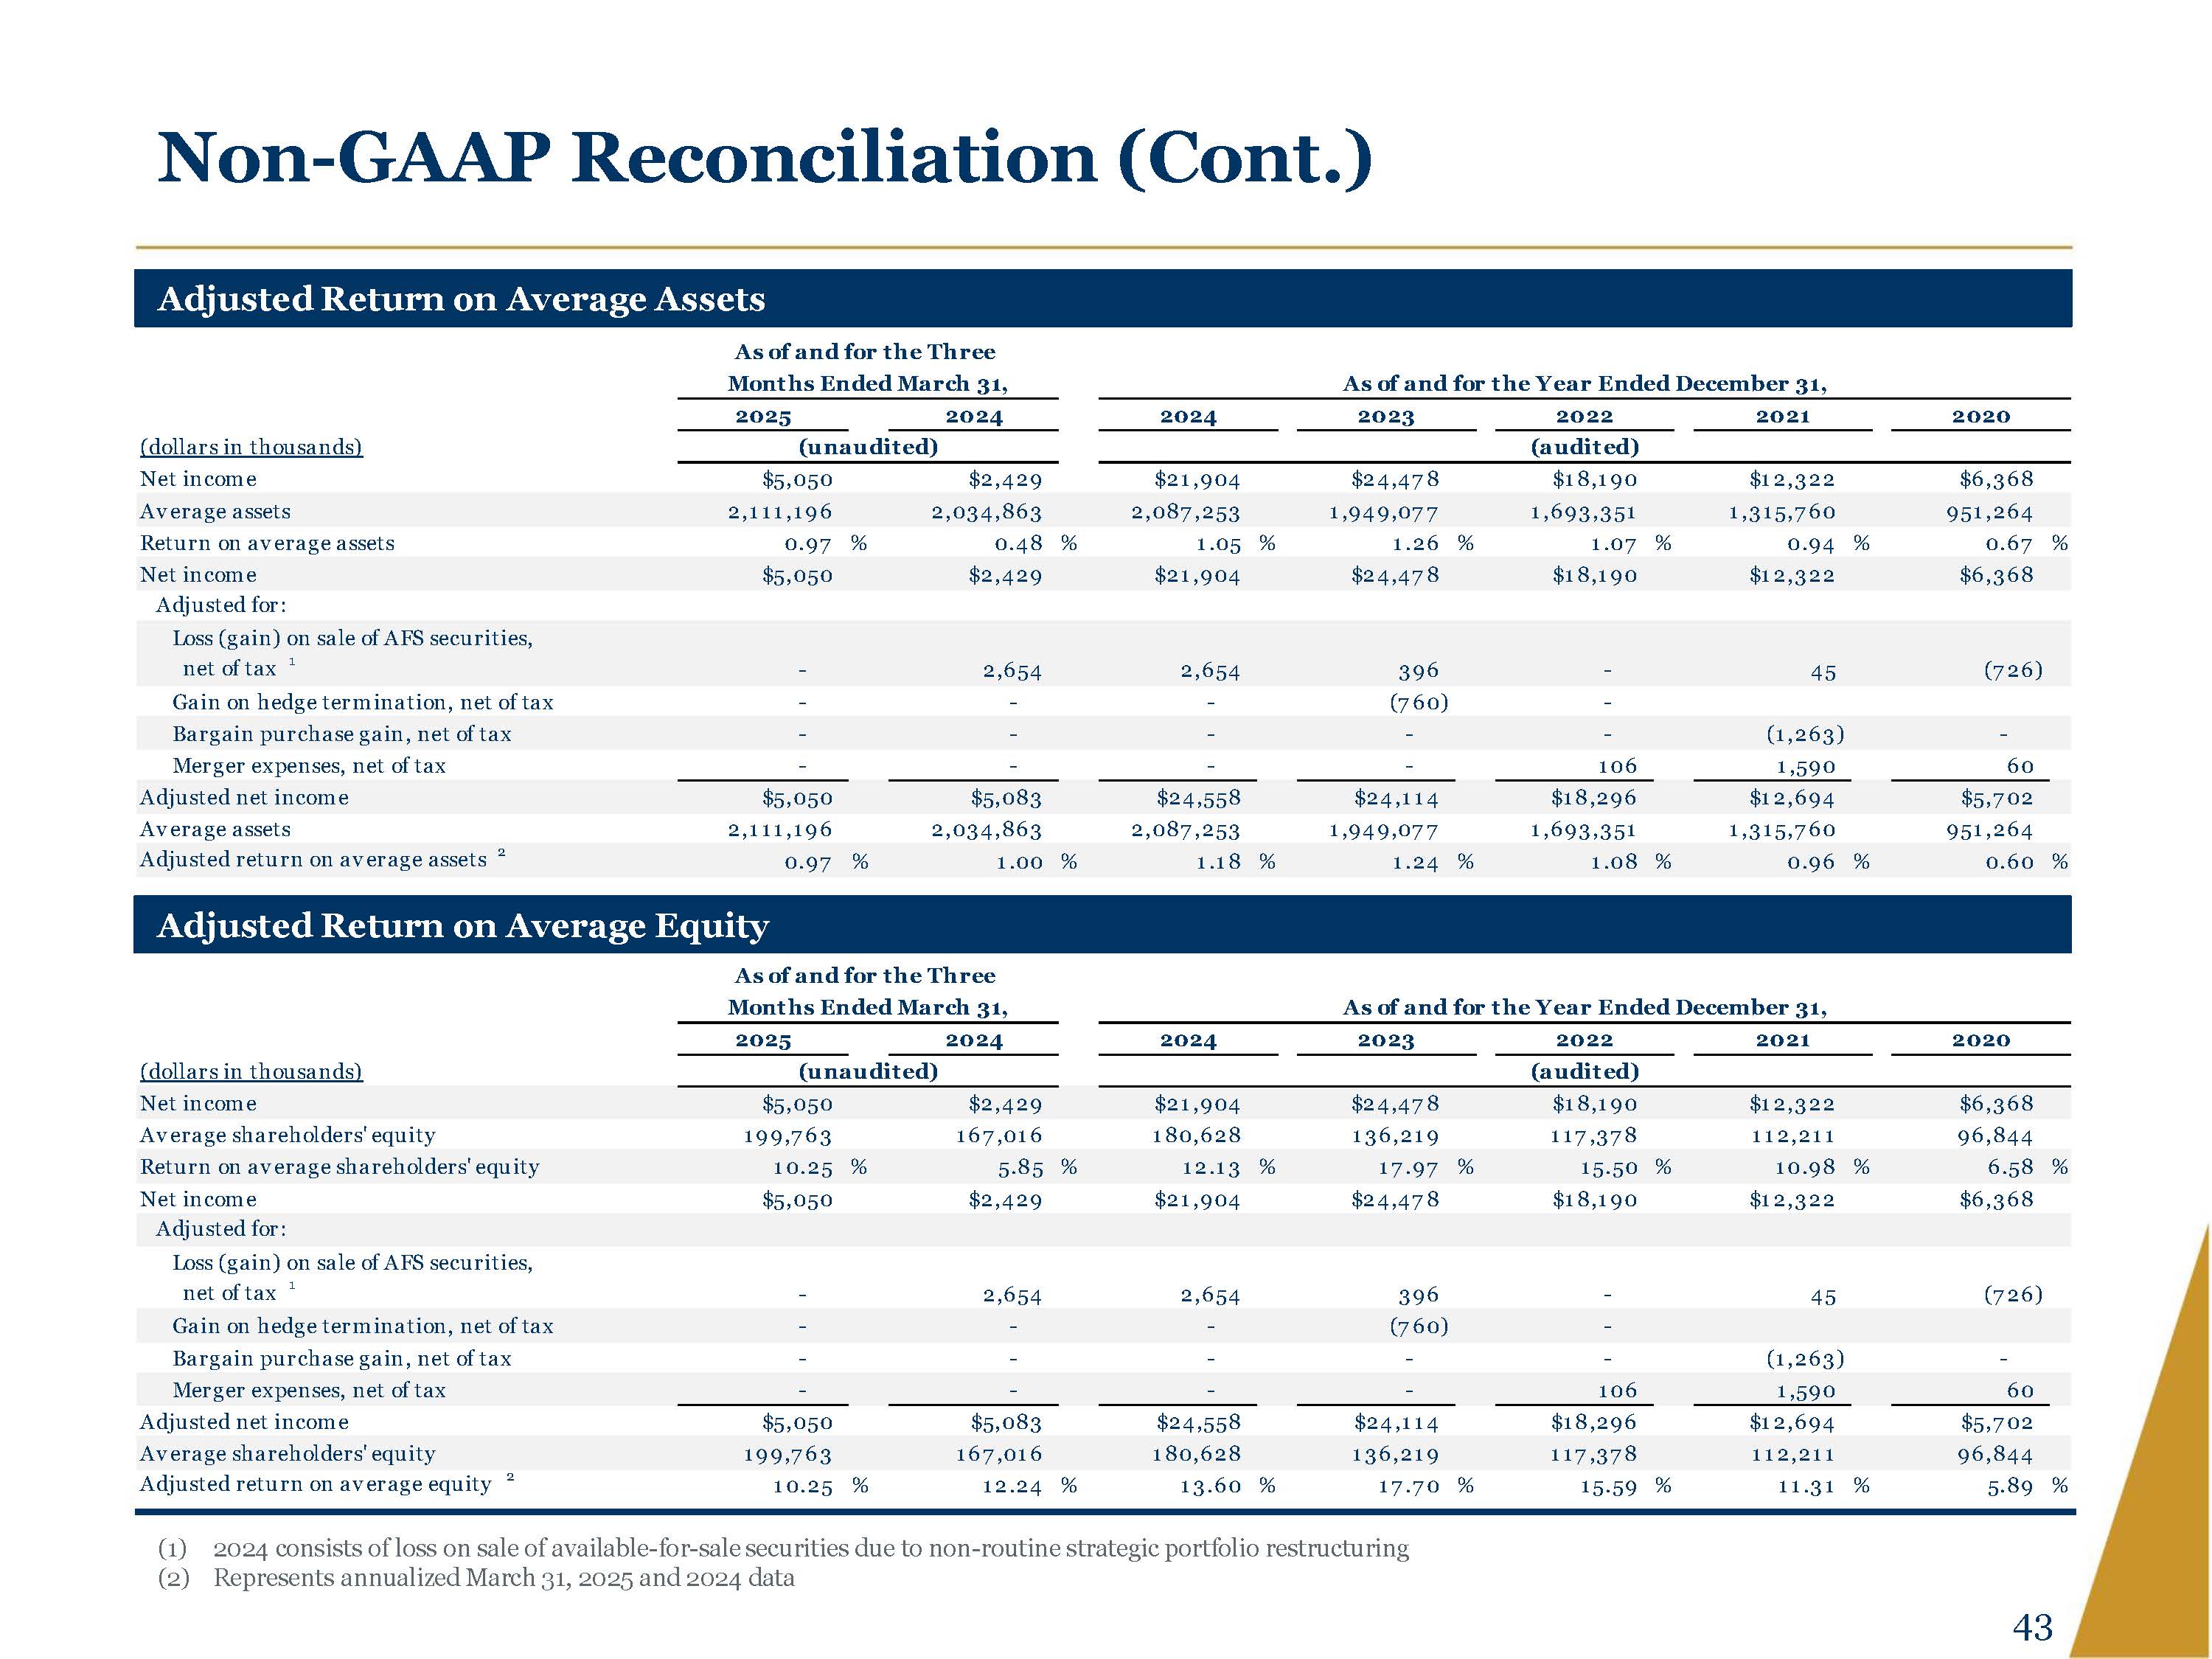
Non GAAP Reconciliation (Cont.) Adjusted Return on Average Assets As of and for the Three Months Ended March 31, As of and for the Year Ended December 31, 2025 2024 2024 2023 2022 2021 2020 (dollars in thousands) (unaudited) (audited) Net income $5,050 $2,429 $21,904 $24,478 $18,190 $12,322 $6,368 Average assets 2,111,196 2,034,863 2,087,253 1,949,077 1,693,351 1,315,760 951,264 Return on average assets 0.97 % 0.48 % 1.05 % 1.26 % 1.07 % 0.94 % 0.67 % Net income $5,050 $2,429 $21,904 $24,478 $18,190 $12,322 $6,368 Adjusted for: Loss (gain) on sale of AFS securities, net of tax 1 2,654 2,654 396 45 (726) Gain on hedge termination, net of tax (760) Bargain purchase gain, net of tax (1,263) Merger expenses, net of tax 106 1,590 60 Adjusted net income $5,050 $5,083 $24,558 $24,114 $18,296 $12,694 $5,702 Average assets 2,111,196 2,034,863 2,087,253 1,949,077 1,693,351 1,315,760 951,264 Adjusted return on average assets 2 0.97 % 1.00 % 1.18 % 1.24 % 1.08 % 0.96 % 0.60 % Adjusted Return on Average Equity As of and for the Three Months Ended March 31, As of and for the Year Ended December 31, 2025 2024 2024 2023 2022 2021 2020 (dollars in thousands) (unaudited) (audited) Net income $5,050 $2,429 $21,904 $24,478 $18,190 $12,322 $6,368 Average shareholders' equity Return on average shareholders' equity Net income 199,763 10.25 $5,050 % 167,016 5.85 $2,429 % 180,628 12.13 $21,904 % 136,219 17.97 $24,478 % 117,378 15.50 $18,190 % 112,211 10.98 $12,322 % 96,844 6.58 % $6,368 Adjusted for: Loss (gain) on sale of AFS securities, net of tax 1 2,654 2,654 396 45 (726) Gain on hedge termination, net of tax (760) Bargain purchase gain, net of tax (1,263) Merger expenses, net of tax 106 1,590 60 Adjusted net income $5,050 $5,083 $24,558 $24,114 $18,296 $12,694 $5,702 Average shareholders' equity 199,763 167,016 180,628 136,219 117,378 112,211 96,844 Adjusted return on average equity 2 10.25 % 12.24 % 13.60 % 17.70 % 15.59 % 11.31 % 5.89 % (1) 2024 consists of loss on sale of available for sale securities due to non routine strategic portfolio restructuring (2) Represents annualized March 31, 2025 and 2024 data 43
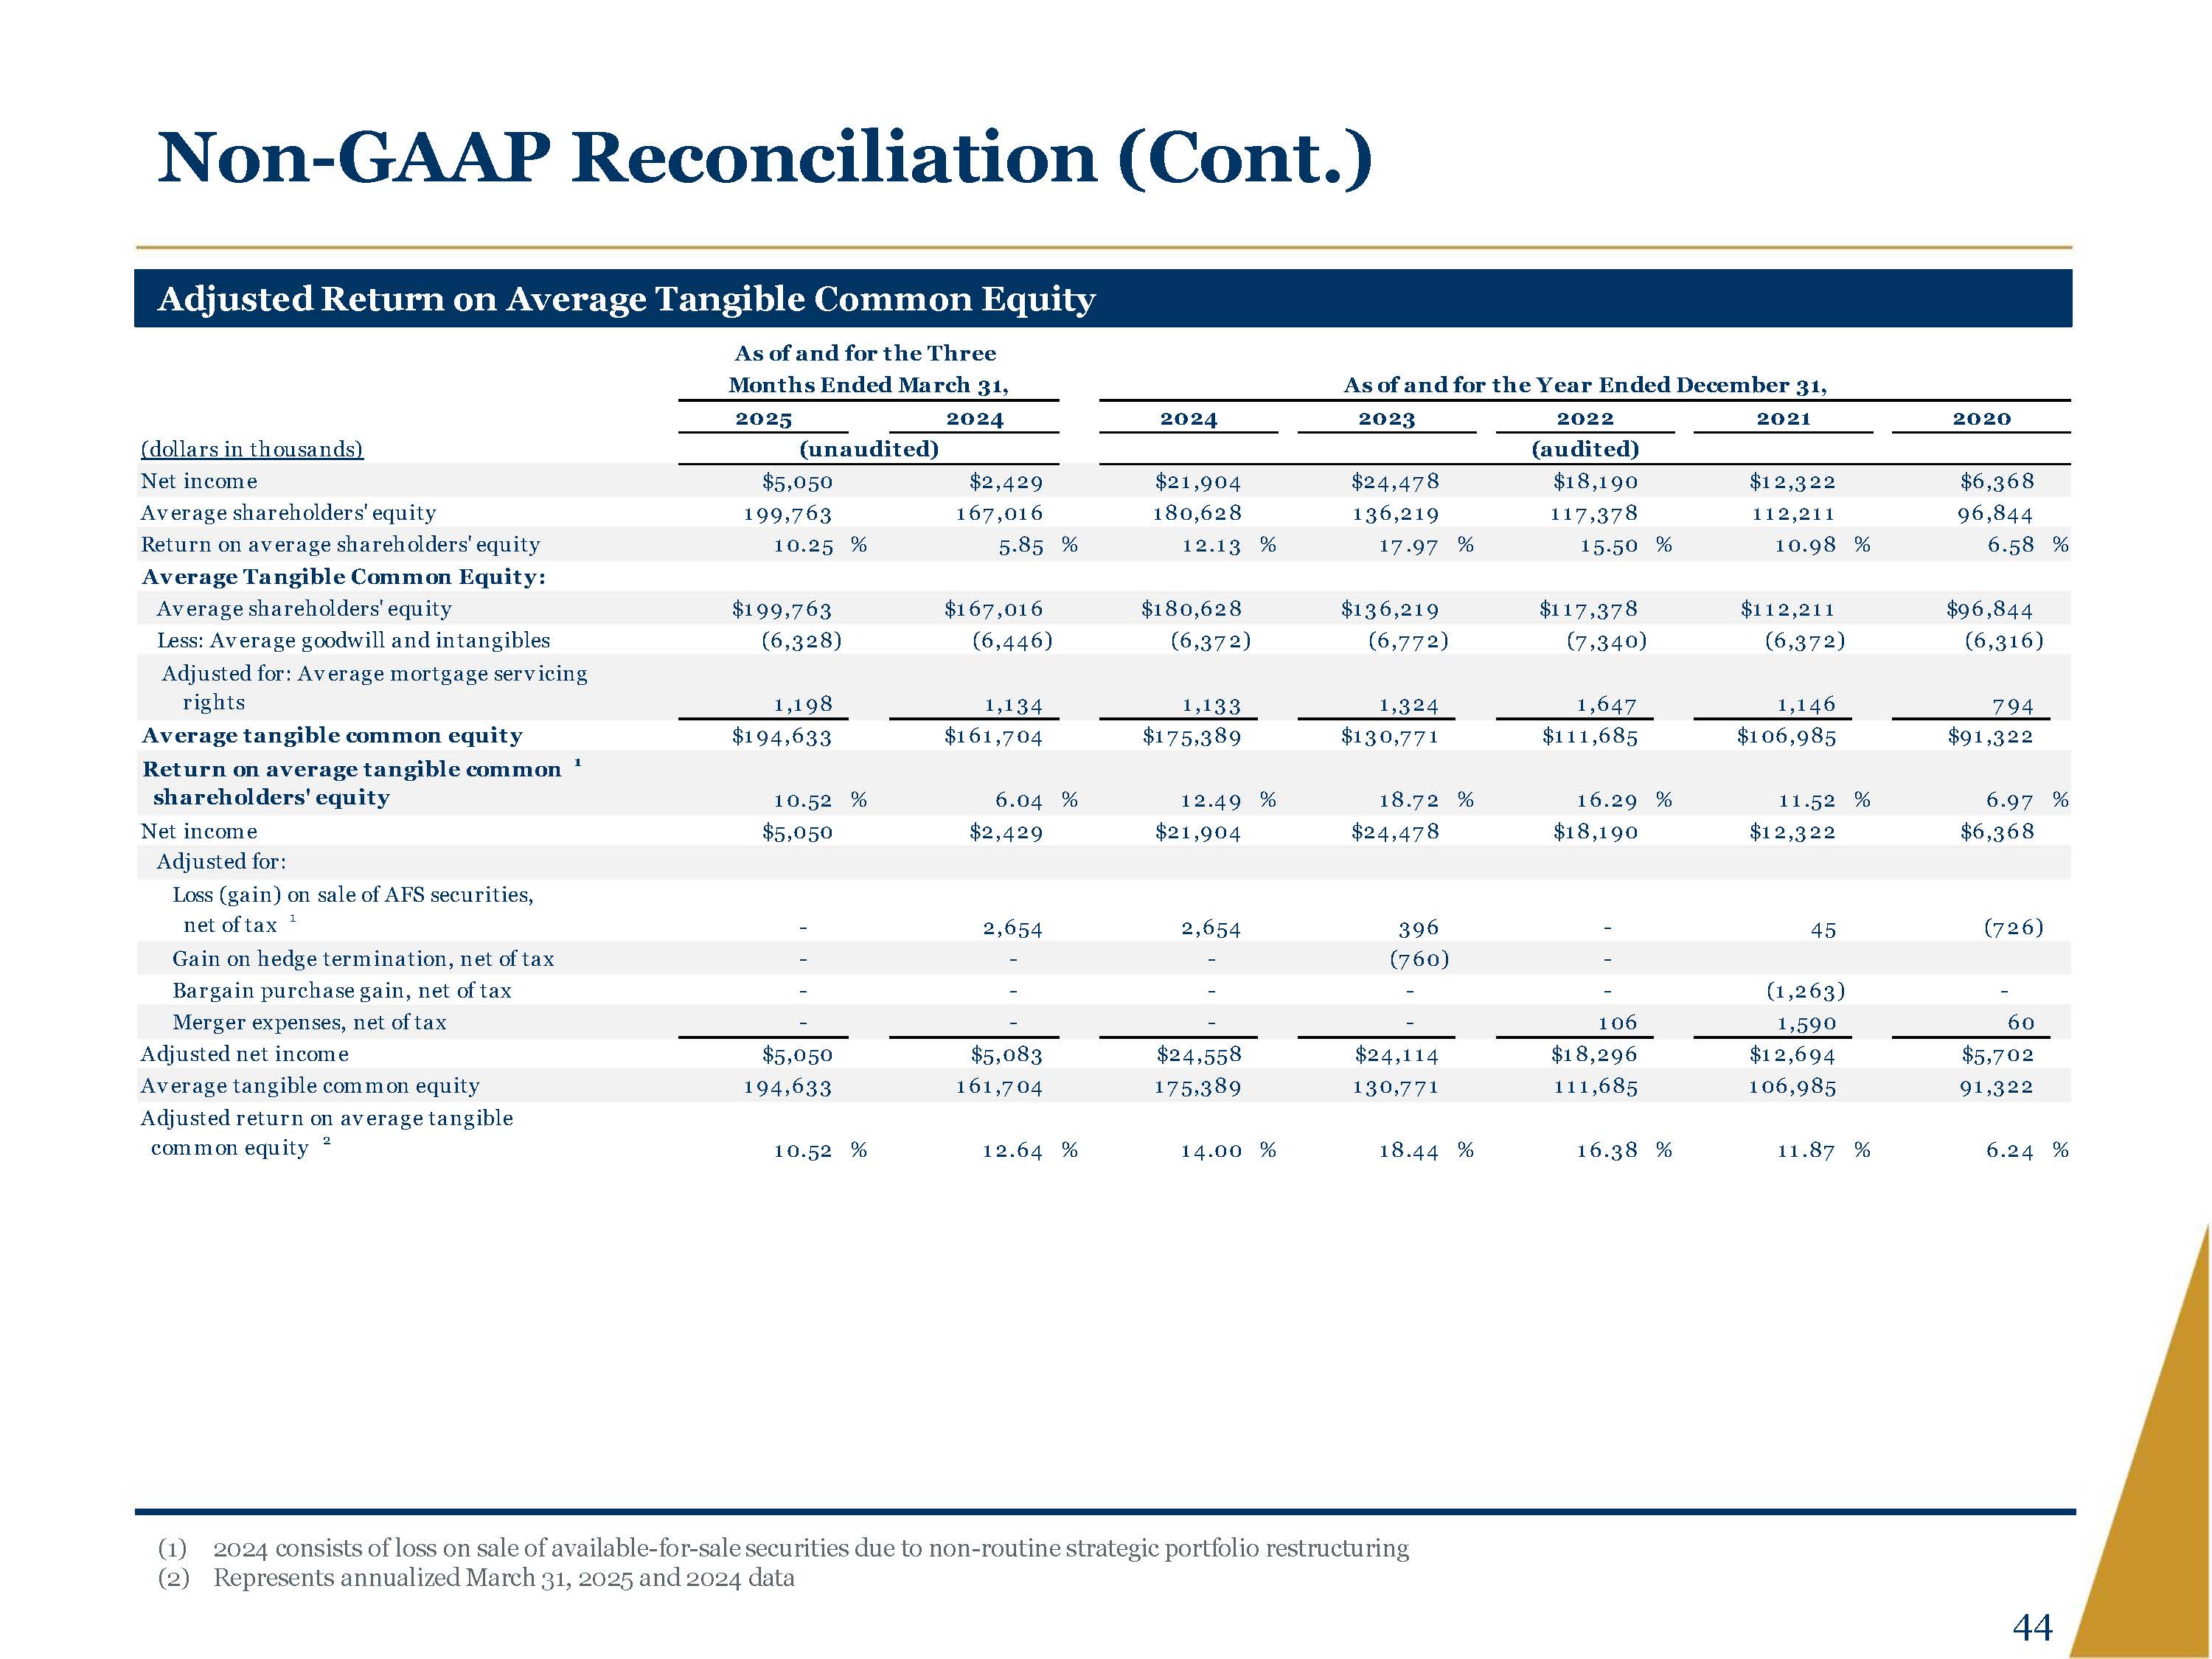
Non GAAP Reconciliation (Cont.) Adjusted Return on Average Tangible Common Equity (dollars in thousands) As of and for the Three Months Ended March 31, As of and for the Year Ended December 31, 2025 (unaudited) 2024 2024 2023 2022 (audited) 2021 2020 Net income $5,050 $2,429 $21,904 $24,478 $18,190 $12,322 $6,368 Average shareholders' equity Return on average shareholders' equity Average Tangible Common Equity: 199,763 10.25 % 167,016 5.85 % 180,628 12.13 % 136,219 17.97 % 117,378 15.50 % 112,211 10.98 % 96,844 6.58 % Average shareholders' equity $199,763 $167,016 $180,628 $136,219 $117,378 $112,211 $96,844 Less: Average goodwill and intangibles (6,328) (6,446) (6,372) (6,772) (7,340) (6,372) (6,316) Adjusted for: Average mortgage servicing rights 1,198 1,134 1,133 1,324 1,647 1,146 794 Average tangible common equity $194,633 $161,704 $175,389 $130,771 $111,685 $106,985 $91,322 Return on average tangible common 1 shareholders' equity 10.52 % 6.04 % 12.49 % 18.72 % 16.29 % 11.52 % 6.97 % Net income $5,050 $2,429 $21,904 $24,478 $18,190 $12,322 $6,368 Adjusted for: Loss (gain) on sale of AFS securities, net of tax 1 2,654 2,654 396 45 (726) Gain on hedge termination, net of tax (760) Bargain purchase gain, net of tax (1,263) Merger expenses, net of tax 106 1,590 60 Adjusted net income $5,050 $5,083 $24,558 $24,114 $18,296 $12,694 $5,702 Average tangible common equity 194,633 161,704 175,389 130,771 111,685 106,985 91,322 Adjusted return on average tangible common equity 2 10.52 % 12.64 % 14.00 % 18.44 % 16.38 % 11.87 % 6.24 % (1) 2024 consists of loss on sale of available for sale securities due to non routine strategic portfolio restructuring (2) Represents annualized March 31, 2025 and 2024 data 44

Non GAAP Reconciliation (Cont.) Adjusted Nonperforming Assets to Total Assets Ratio Period Ended As of and for the Three May 31, Months Ended March 31, As of and for the Year Ended December 31, 2025 2025 2024 2024 2023 2022 2021 2020 (dollars in thousands) (unaudited) (audited) Total nonperforming assets $14,542 $15,370 $3,883 $15,870 $4,338 $8,079 $4,213 $4,304 Total assets 2,202,400 2,190,391 2,050,951 2,098,712 2,028,599 1,835,478 1,611,657 1,147,532 GAAP based nonperforming assets to total assets 0.66 % 0.70 % 0.19 % 0.76 % 0.21 % 0.44 % 0.26 % 0.38 % Total nonperforming assets $14,542 $15,370 $3,883 $15,870 $4,338 $8,079 $4,213 $4,304 Adjusted for: Guaranteed portions of nonaccrual loans (4,607) (4,692) (2,817) (4,811) (2,689) (218) (226) Adjusted total nonperforming assets $9,935 $10,678 $1,066 $11,059 $1,649 $7,861 $3,987 $4,304 Total assets $2,202,400 $2,190,391 $2,050,951 $2,098,712 $2,028,599 $1,835,478 $1,611,657 $1,147,532 Adjusted nonperforming assets to total assets 0.45 % 0.49 % 0.05 % 0.53 % 0.08 % 0.43 % 0.25 % 0.38 % 45

logo Local. And Proud Of It.®