
INVESTOR PRESENTATION SEPTEMBER 2025
FORWARD LOOKING STATEMENTS & USE OF NON-GAAP FINANCIAL MEASURES 2 FORWARD LOOKING STATEMENTS This presentation contains forward-looking statements within the meaning of federal securities laws and regulations. These forward-looking statements are identified by their use of terms and phrases such as "believe," "expect," "intend," "project," "forecast," "plan" and other similar terms and phrases, including references to assumptions and forecasts of future results. Forward-looking statements are not guarantees of future performance and involve known and unknown risks, uncertainties and other factors which may cause the actual results to differ materially from those anticipated at the time the forward-looking statements are made. These risks include, but are not limited to: the adverse impact of any future pandemic, epidemic or outbreak of any highly infectious disease on the U.S., regional and global economies, travel, the hospitality industry, and the financial condition and results of operations of the Company and its hotels; negative developments or volatility in the economy, including, but not limited to elevated inflation and interest rates, job loss or growth trends, the imposition of trade sanctions or tariffs and any potential retaliatory responses thereto, an increase in unemployment or a decrease in corporate earnings and investment; risks associated with the lodging industry overall, including, without limitation, decreases in the frequency of travel, decreases in the demand for, or frequency of, international travel as a result of evolving global trade dynamics or otherwise, and increases in operating costs; relationships with property managers; the ability to compete effectively in areas such as access, location, quality of accommodations and room rate structures; changes in taxes and government regulations which influence or determine wages, prices, construction procedures and costs; and other risk factors contained in the Company's filings with the Securities and Exchange Commission. Although the Company believes the expectations reflected in such forward- looking statements are based upon reasonable assumptions, it can give no assurance that the expectations will be attained or that any deviation will not be material. All information in this presentation is as of the date of this presentation, and the Company undertakes no obligation to update any forward-looking statement to conform the statement to actual results or changes in the Company's expectations. This presentation contains statistics and other data that has been obtained or compiled from information made available by third-party service providers and believed to be reliable, but the accuracy and completeness of the information is not assured. The Company has not independently verified any such information. USE OF NON-GAAP FINANCIAL MEASURES We use the following non-GAAP financial measures that we believe are useful to investors as key measures of our operating performance: EBITDA, EBITDAre, Adjusted EBITDA, Hotel EBITDA, Hotel Adjusted EBITDA, FFO, and Adjusted FFO. These measures should not be considered in isolation or as a substitute for measures of performance in accordance with U.S. GAAP. EBITDA, EBITDAre, Adjusted EBITDA, Hotel EBITDA, Hotel Adjusted EBITDA, FFO and Adjusted FFO, as calculated by us, may not be comparable to other companies that do not define such terms exactly as the Company. A detailed explanation of these non-GAAP financial measures and the reconciliation of such measures to the most directly comparable financial measures prepared in accordance with U.S. GAAP can be found in the Company’s second quarter 2025 earnings press release dated August 7, 2025.
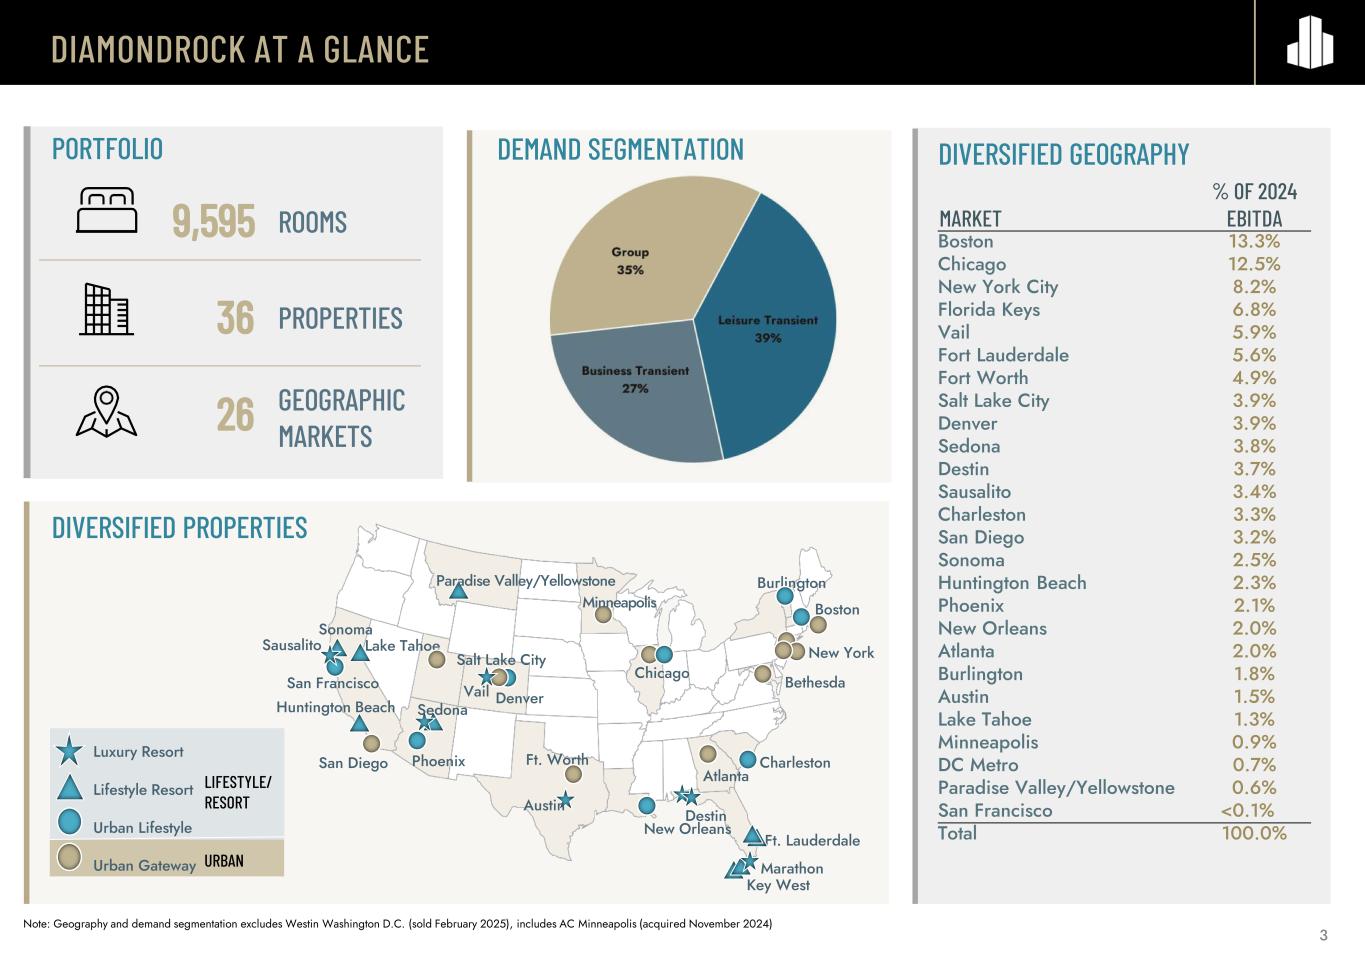
DIAMONDROCK AT A GLANCE DIVERSIFIED PROPERTIES 9,595 36 26 ROOMS GEOGRAPHIC MARKETS PROPERTIES MARKET % OF 2024 EBITDA Boston 13.3% Chicago 12.5% New York City 8.2% Florida Keys 6.8% Vail 5.9% Fort Lauderdale 5.6% Fort Worth 4.9% Salt Lake City 3.9% Denver 3.9% Sedona 3.8% Destin 3.7% Sausalito 3.4% Charleston 3.3% San Diego 3.2% Sonoma 2.5% Huntington Beach 2.3% Phoenix 2.1% New Orleans 2.0% Atlanta 2.0% Burlington 1.8% Austin 1.5% Lake Tahoe 1.3% Minneapolis 0.9% DC Metro 0.7% Paradise Valley/Yellowstone 0.6% San Francisco <0.1% Total 100.0% Luxury Resort Lifestyle Resort Urban Lifestyle Urban Gateway LIFESTYLE/ RESORT URBAN Boston Ft. Worth Ft. Lauderdale Chicago Vail Sausalito Salt Lake City San Diego Key West Sonoma Burlington Phoenix Denver Destin Atlanta Huntington Beach Charleston New Orleans San Francisco Lake Tahoe Sedona New York Austin Paradise Valley/Yellowstone Marathon Minneapolis Bethesda Note: Geography and demand segmentation excludes Westin Washington D.C. (sold February 2025), includes AC Minneapolis (acquired November 2024) DIVERSIFIED GEOGRAPHYDEMAND SEGMENTATIONPORTFOLIO 3
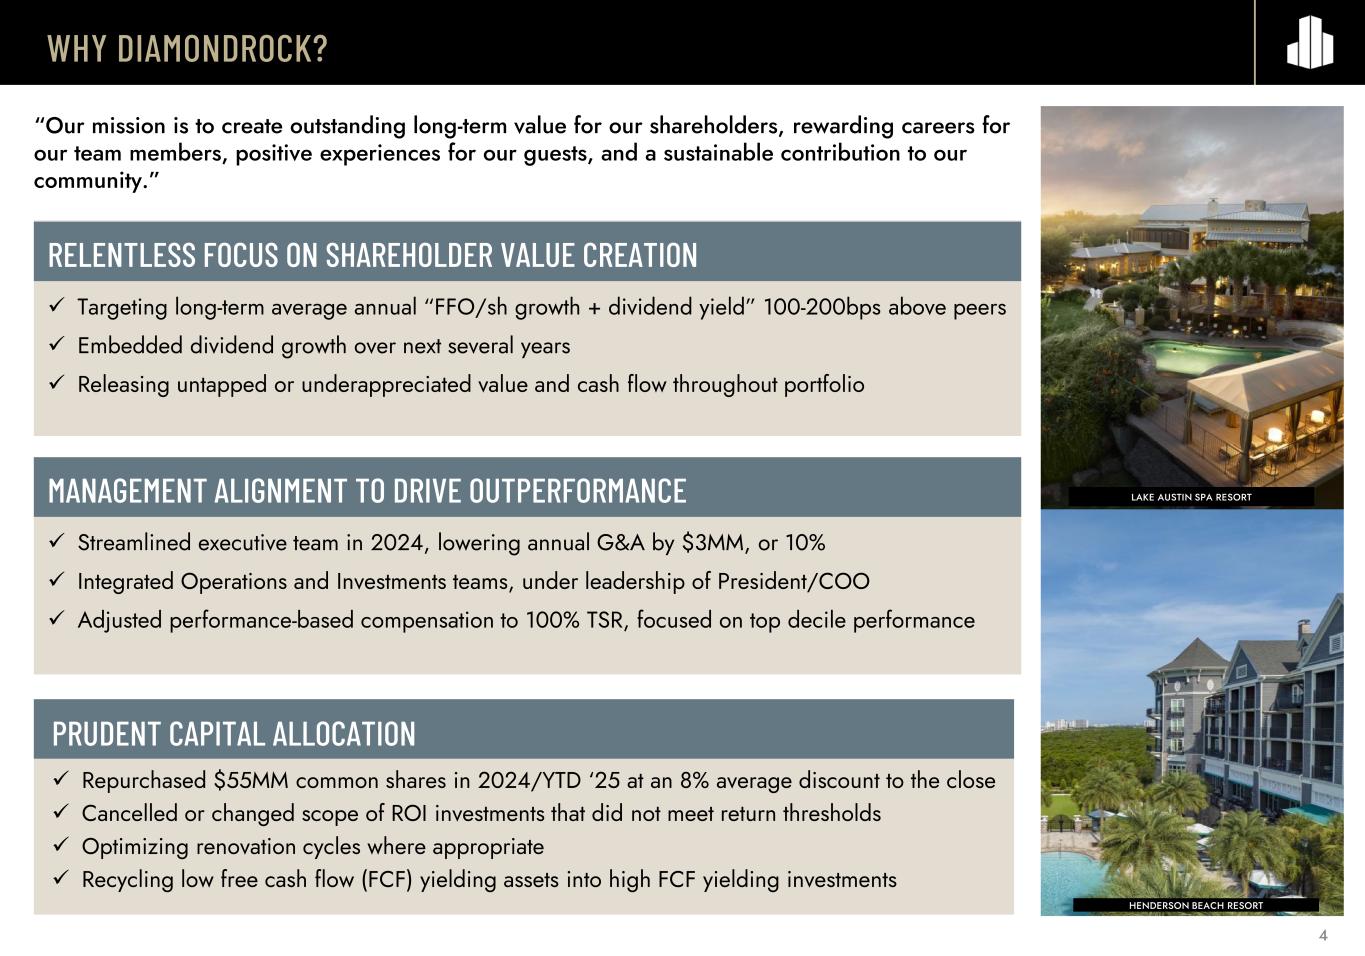
WHY DIAMONDROCK? “Our mission is to create outstanding long-term value for our shareholders, rewarding careers for our team members, positive experiences for our guests, and a sustainable contribution to our community.” PRUDENT CAPITAL ALLOCATION ✓ Repurchased $55MM common shares in 2024/YTD ‘25 at an 8% average discount to the close ✓ Cancelled or changed scope of ROI investments that did not meet return thresholds ✓ Optimizing renovation cycles where appropriate ✓ Recycling low free cash flow (FCF) yielding assets into high FCF yielding investments 4 RELENTLESS FOCUS ON SHAREHOLDER VALUE CREATION ✓ Targeting long-term average annual “FFO/sh growth + dividend yield” 100-200bps above peers ✓ Embedded dividend growth over next several years ✓ Releasing untapped or underappreciated value and cash flow throughout portfolio MANAGEMENT ALIGNMENT TO DRIVE OUTPERFORMANCE ✓ Streamlined executive team in 2024, lowering annual G&A by $3MM, or 10% ✓ Integrated Operations and Investments teams, under leadership of President/COO ✓ Adjusted performance-based compensation to 100% TSR, focused on top decile performance LAKE AUSTIN SPA RESORT HENDERSON BEACH RESORT
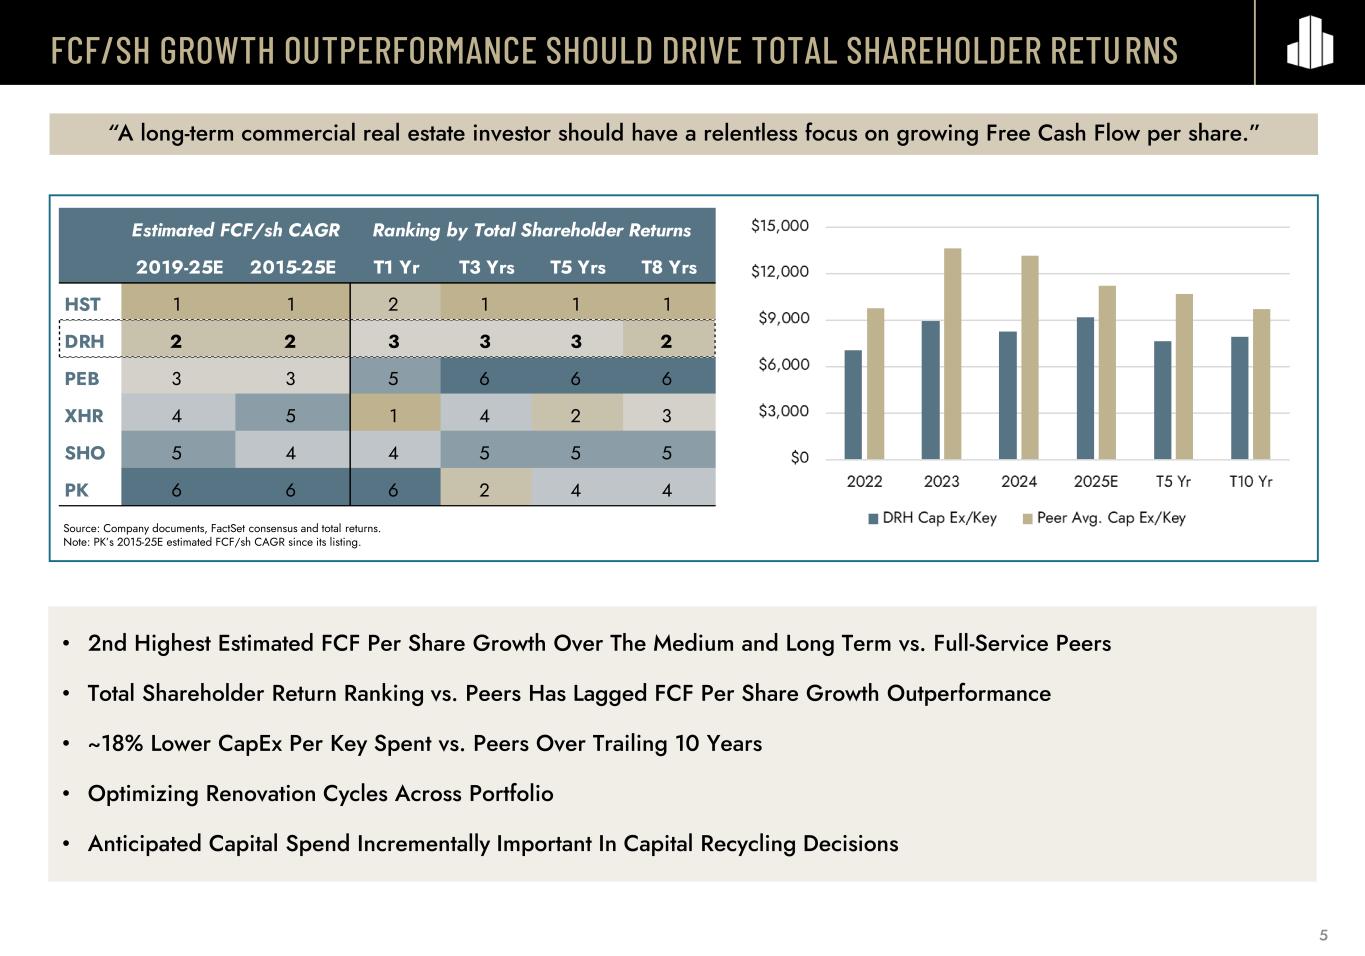
5 • 2nd Highest Estimated FCF Per Share Growth Over The Medium and Long Term vs. Full-Service Peers • Total Shareholder Return Ranking vs. Peers Has Lagged FCF Per Share Growth Outperformance • ~18% Lower CapEx Per Key Spent vs. Peers Over Trailing 10 Years • Optimizing Renovation Cycles Across Portfolio • Anticipated Capital Spend Incrementally Important In Capital Recycling Decisions “A long-term commercial real estate investor should have a relentless focus on growing Free Cash Flow per share.” Source: Company documents, FactSet consensus and total returns. Note: PK’s 2015-25E estimated FCF/sh CAGR since its listing. FCF/SH GROWTH OUTPERFORMANCE SHOULD DRIVE TOTAL SHAREHOLDER RETURNS 2019-25E 2015-25E T1 Yr T3 Yrs T5 Yrs T8 Yrs HST 1 1 2 1 1 1 DRH 2 2 3 3 3 2 PEB 3 3 5 6 6 6 XHR 4 5 1 4 2 3 SHO 5 4 4 5 5 5 PK 6 6 6 2 4 4 Estimated FCF/sh CAGR Ranking by Total Shareholder Returns
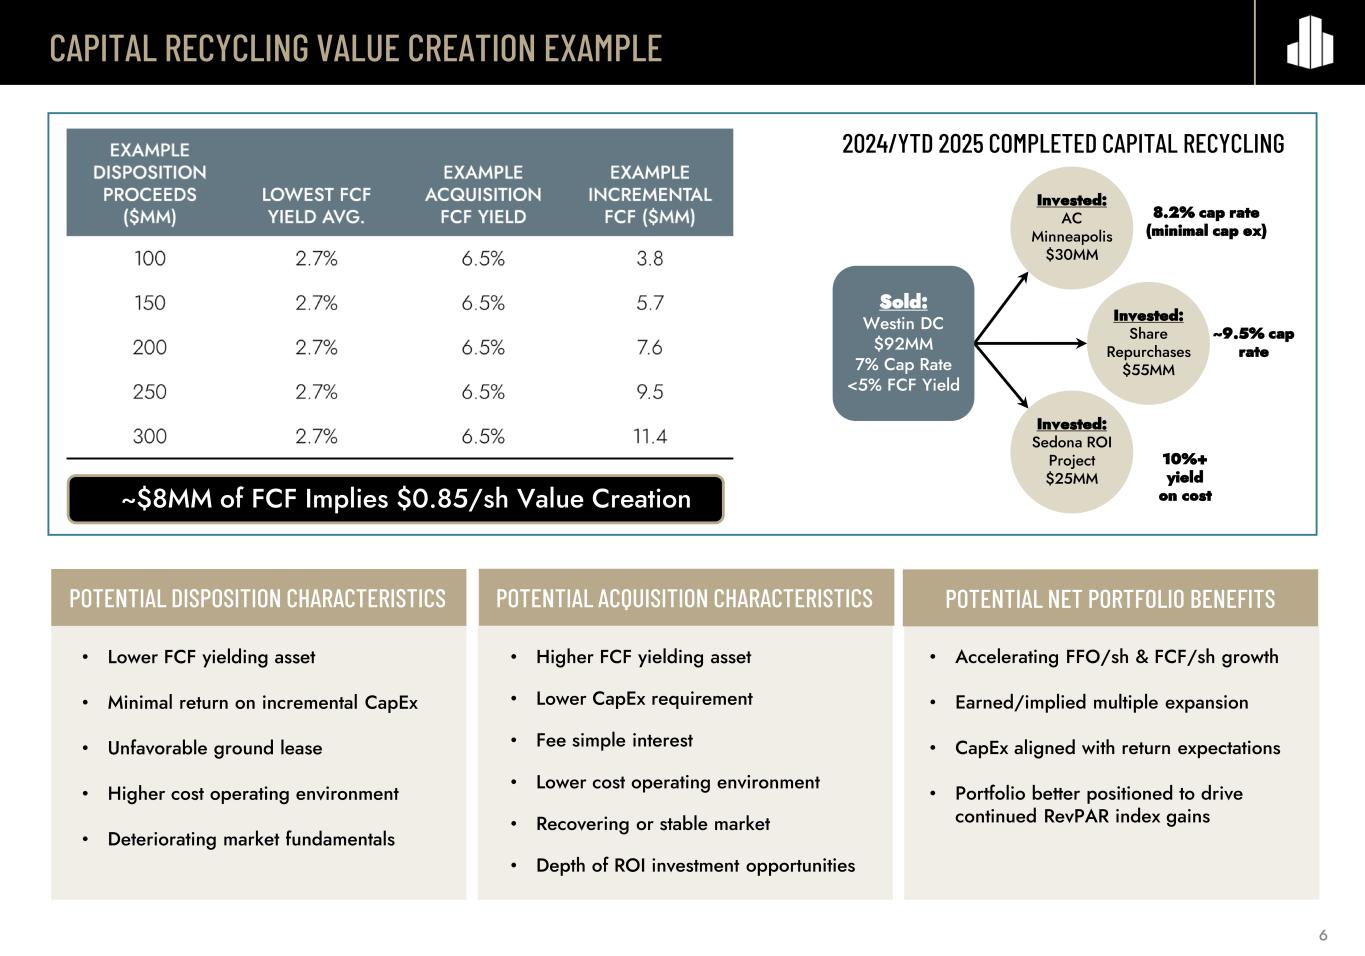
CAPITAL RECYCLING VALUE CREATION EXAMPLE POTENTIAL DISPOSITION CHARACTERISTICS POTENTIAL ACQUISITION CHARACTERISTICS POTENTIAL NET PORTFOLIO BENEFITS • Lower FCF yielding asset • Minimal return on incremental CapEx • Unfavorable ground lease • Higher cost operating environment • Deteriorating market fundamentals • Higher FCF yielding asset • Lower CapEx requirement • Fee simple interest • Lower cost operating environment • Recovering or stable market • Depth of ROI investment opportunities • Accelerating FFO/sh & FCF/sh growth • Earned/implied multiple expansion • CapEx aligned with return expectations • Portfolio better positioned to drive continued RevPAR index gains ~$8MM of FCF Implies $0.85/sh Value Creation 2024/YTD 2025 COMPLETED CAPITAL RECYCLING 8.2% cap rate (minimal cap ex) Invested: AC Minneapolis $30MM Invested: Share Repurchases $55MM Invested: Sedona ROI Project $25MM ~9.5% cap rate 10%+ yield on cost Sold: Westin DC $92MM 7% Cap Rate <5% FCF Yield 6
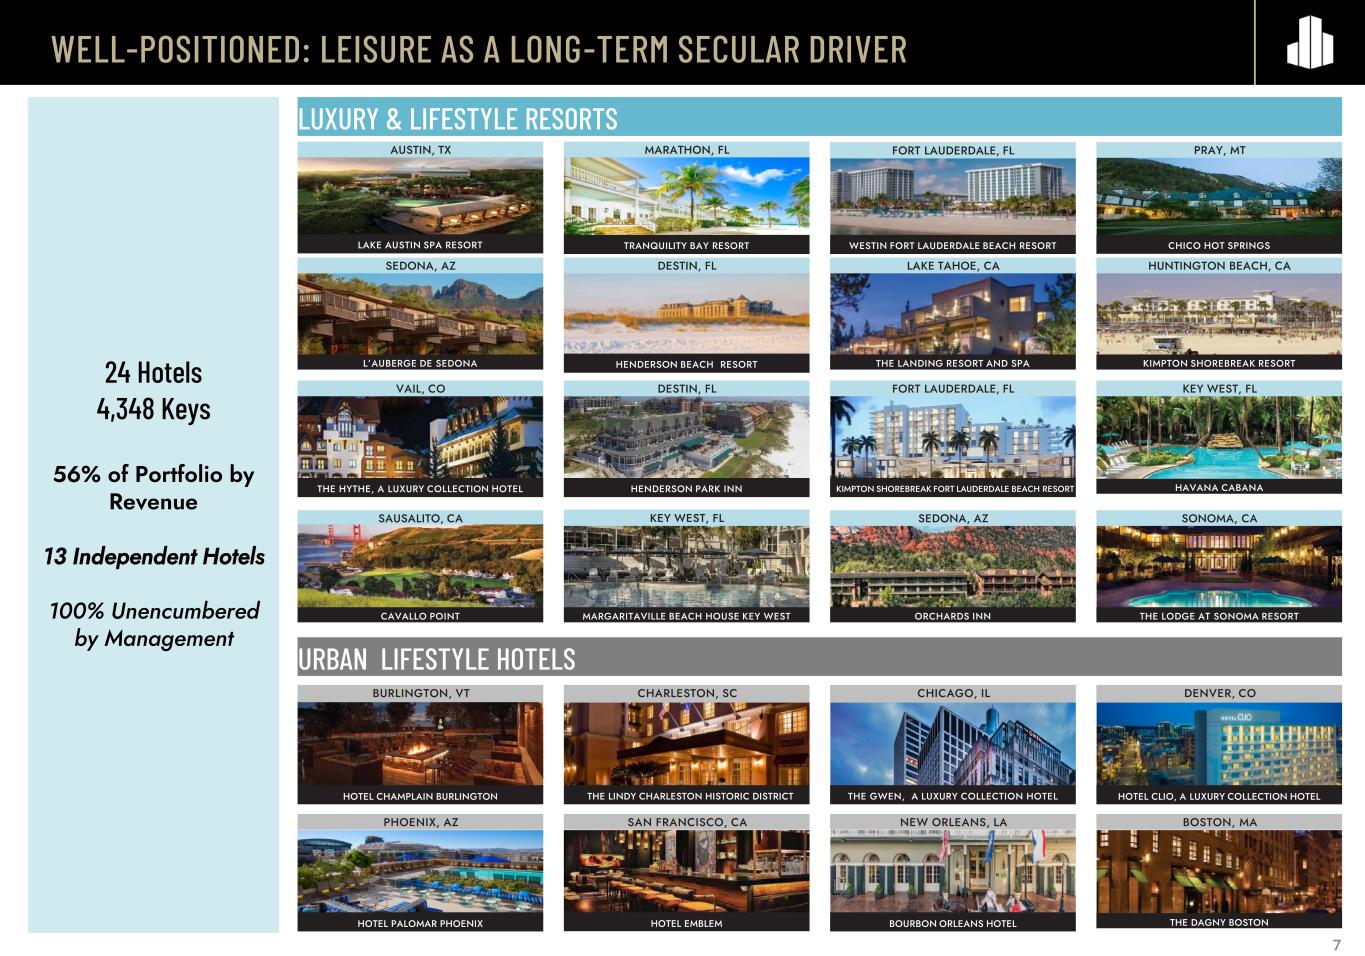
24 Hotels 4,348 Keys 56% of Portfolio by Revenue 13 Independent Hotels 100% Unencumbered by Management WELL-POSITIONED: LEISURE AS A LONG-TERM SECULAR DRIVER LUXURY & LIFESTYLE RESORTS URBAN LIFESTYLE HOTELS SAUSALITO, CA L’AUBERGE DE SEDONA THE LANDING RESORT AND SPA SEDONA, AZ SONOMA, CA HAVANA CABANA KIMPTON SHOREBREAK RESORT BURLINGTON, VT CHARLESTON, SC THE LINDY CHARLESTON HISTORIC DISTRICT CHICAGO, IL THE GWEN, A LUXURY COLLECTION HOTEL SAN FRANCISCO, CAPHOENIX, AZ NEW ORLEANS, LA HOTEL CLIO, A LUXURY COLLECTION HOTELHOTEL CHAMPLAIN BURLINGTON BOSTON, MA DENVER, CO HENDERSON BEACH RESORT LAKE AUSTIN SPA RESORT WESTIN FORT LAUDERDALE BEACH RESORT MARGARITAVILLE BEACH HOUSE KEY WEST TRANQUILITY BAY RESORT MARATHON, FLAUSTIN, TX FORT LAUDERDALE, FL KEY WEST, FL DESTIN, FLSEDONA, AZ LAKE TAHOE, CA HUNTINGTON BEACH, CA VAIL, CO DESTIN, FL FORT LAUDERDALE, FL KEY WEST, FL THE HYTHE, A LUXURY COLLECTION HOTEL HENDERSON PARK INN KIMPTON SHOREBREAK FORT LAUDERDALE BEACH RESORT CAVALLO POINT ORCHARDS INN THE LODGE AT SONOMA RESORT CHICO HOT SPRINGS HOTEL PALOMAR PHOENIX BOURBON ORLEANS HOTELHOTEL EMBLEM THE DAGNY BOSTON PRAY, MT 7
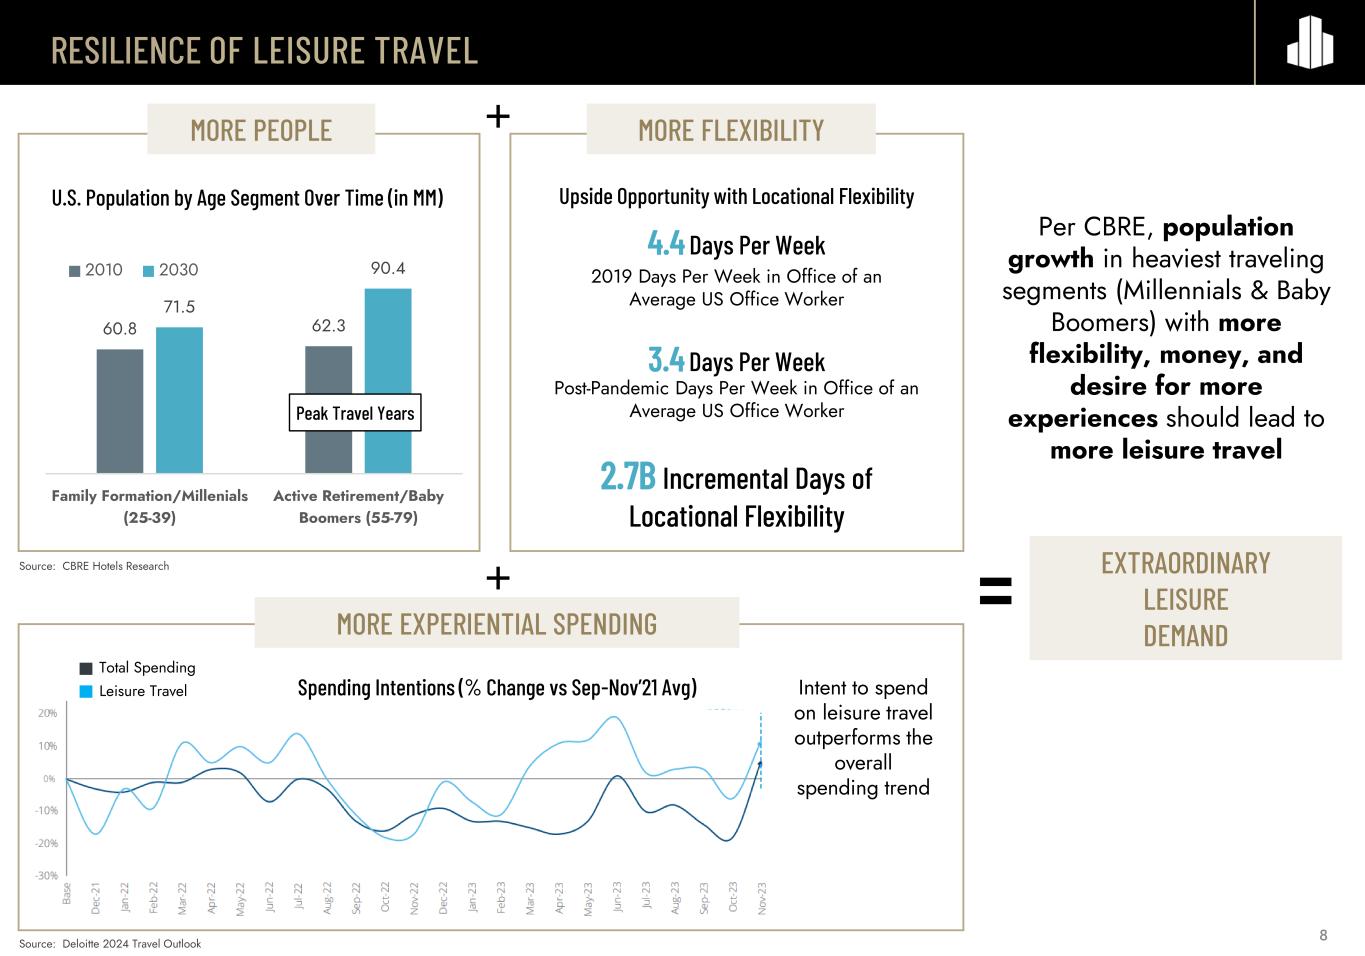
RESILIENCE OF LEISURE TRAVEL 8 Per CBRE, population growth in heaviest traveling segments (Millennials & Baby Boomers) with more flexibility, money, and desire for more experiences should lead to more leisure travel 60.8 62.3 71.5 90.4 Family Formation/Millenials (25-39) Active Retirement/Baby Boomers (55-79) 2010 2030 U.S. Population by Age Segment Over Time (in MM) Peak Travel Years EXTRAORDINARY LEISURE DEMAND= 4.4 Days Per Week 2019 Days Per Week in Office of an Average US Office Worker 3.4 Days Per Week Post-Pandemic Days Per Week in Office of an Average US Office Worker 2.7B Incremental Days of Locational Flexibility Upside Opportunity with Locational Flexibility Source: CBRE Hotels Research MORE PEOPLE MORE FLEXIBILITY Intent to spend on leisure travel outperforms the overall spending trend Spending Intentions (% Change vs Sep-Nov’21 Avg) Total Spending Leisure Travel Source: Deloitte 2024 Travel Outlook MORE EXPERIENTIAL SPENDING
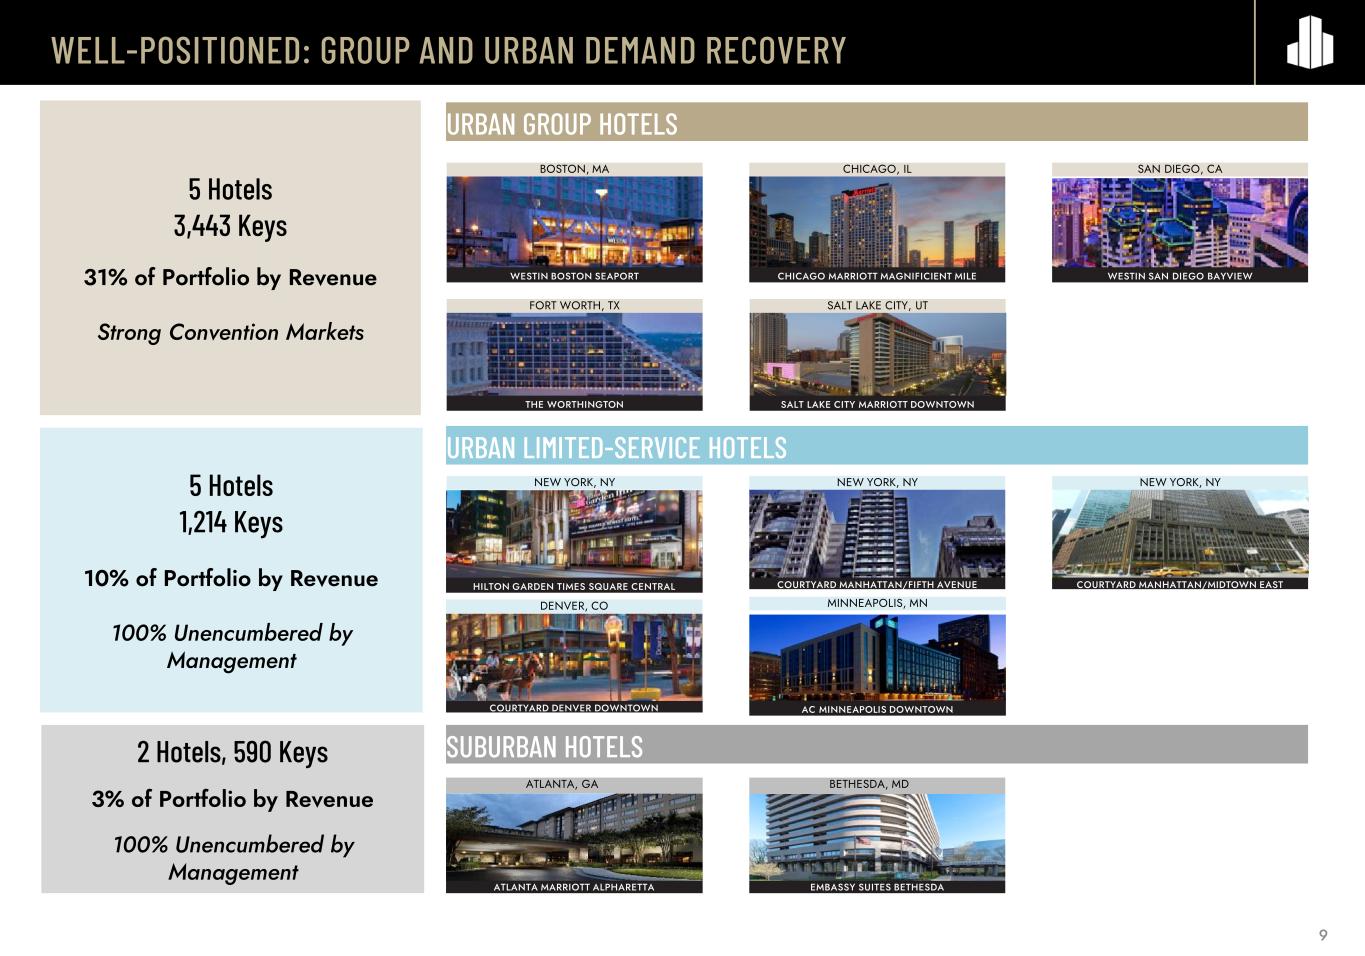
WELL-POSITIONED: GROUP AND URBAN DEMAND RECOVERY 9 COURTYARD MANHATTAN/FIFTH AVENUE COURTYARD MANHATTAN/MIDTOWN EASTHILTON GARDEN TIMES SQUARE CENTRAL 5 Hotels 1,214 Keys 10% of Portfolio by Revenue 100% Unencumbered by Management 5 Hotels 3,443 Keys 31% of Portfolio by Revenue Strong Convention Markets 2 Hotels, 590 Keys 3% of Portfolio by Revenue 100% Unencumbered by Management THE WORTHINGTON SALT LAKE CITY MARRIOTT DOWNTOWN EMBASSY SUITES BETHESDAATLANTA MARRIOTT ALPHARETTA URBAN GROUP HOTELS URBAN LIMITED-SERVICE HOTELS SUBURBAN HOTELS CHICAGO, ILBOSTON, MA BETHESDA, MDATLANTA, GA NEW YORK, NYNEW YORK, NYNEW YORK, NY DENVER, CO COURTYARD DENVER DOWNTOWN SAN DIEGO, CA FORT WORTH, TX SALT LAKE CITY, UT CHICAGO MARRIOTT MAGNIFICIENT MILEWESTIN BOSTON SEAPORT WESTIN SAN DIEGO BAYVIEW MINNEAPOLIS, MN AC MINNEAPOLIS DOWNTOWN
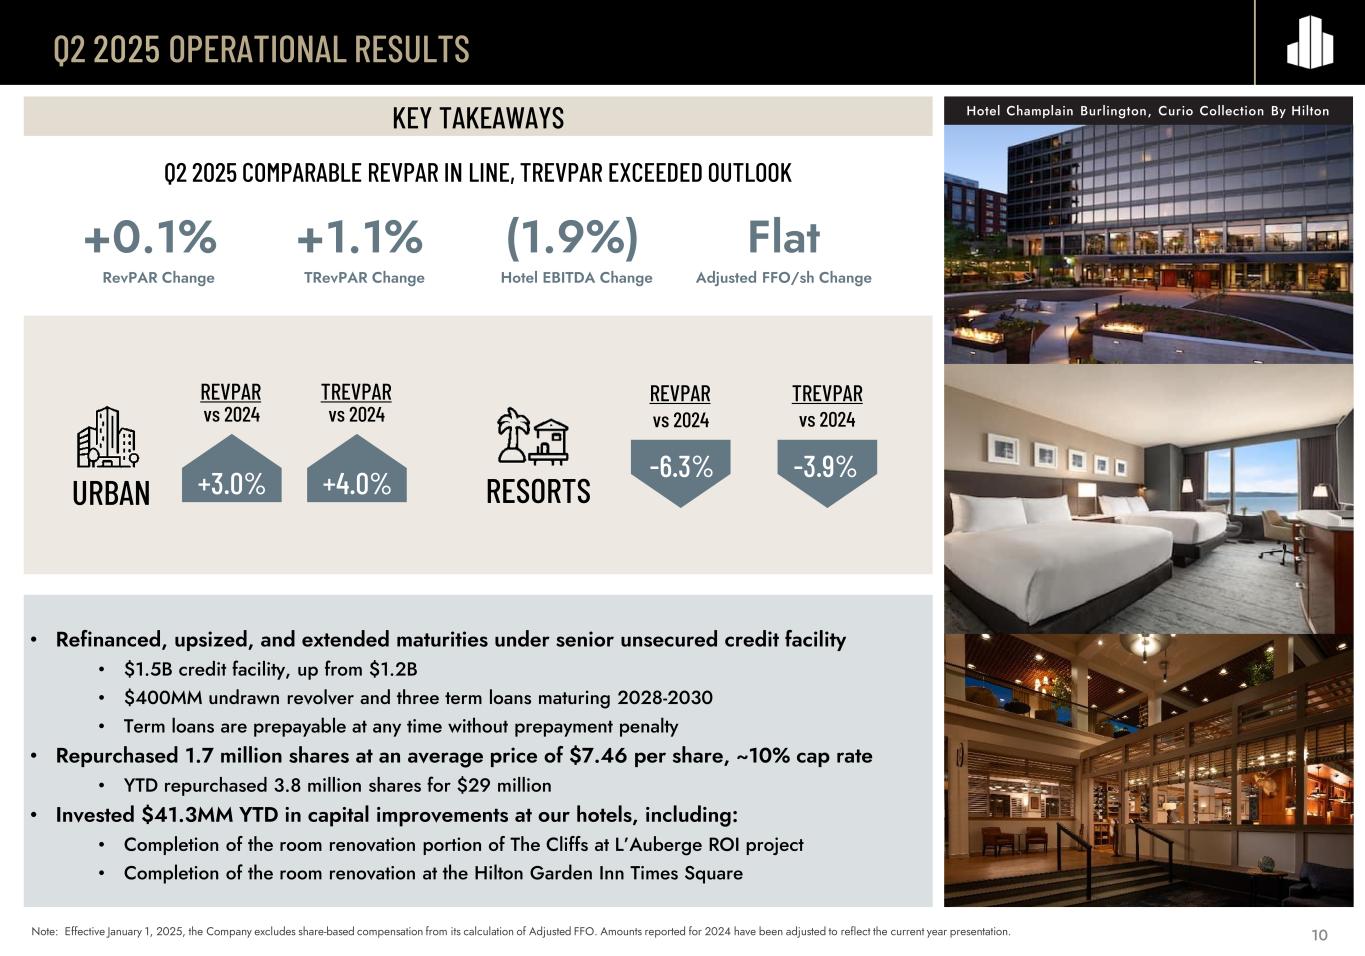
Q2 2025 OPERATIONAL RESULTS KEY TAKEAWAYS Hotel Champlain Burlington, Curio Collection By Hilton • Refinanced, upsized, and extended maturities under senior unsecured credit facility • $1.5B credit facility, up from $1.2B • $400MM undrawn revolver and three term loans maturing 2028-2030 • Term loans are prepayable at any time without prepayment penalty • Repurchased 1.7 million shares at an average price of $7.46 per share, ~10% cap rate • YTD repurchased 3.8 million shares for $29 million • Invested $41.3MM YTD in capital improvements at our hotels, including: • Completion of the room renovation portion of The Cliffs at L’Auberge ROI project • Completion of the room renovation at the Hilton Garden Inn Times Square Q2 2025 COMPARABLE REVPAR IN LINE, TREVPAR EXCEEDED OUTLOOK +0.1% (1.9%) Flat RevPAR Change Hotel EBITDA Change Adjusted FFO/sh Change +1.1% TRevPAR Change URBAN RESORTS -6.3% -3.9%+4.0%+3.0% REVPAR TREVPAR vs 2024vs 2024 REVPAR TREVPAR vs 2024 vs 2024 10Note: Effective January 1, 2025, the Company excludes share-based compensation from its calculation of Adjusted FFO. Amounts reported for 2024 have been adjusted to reflect the current year presentation.
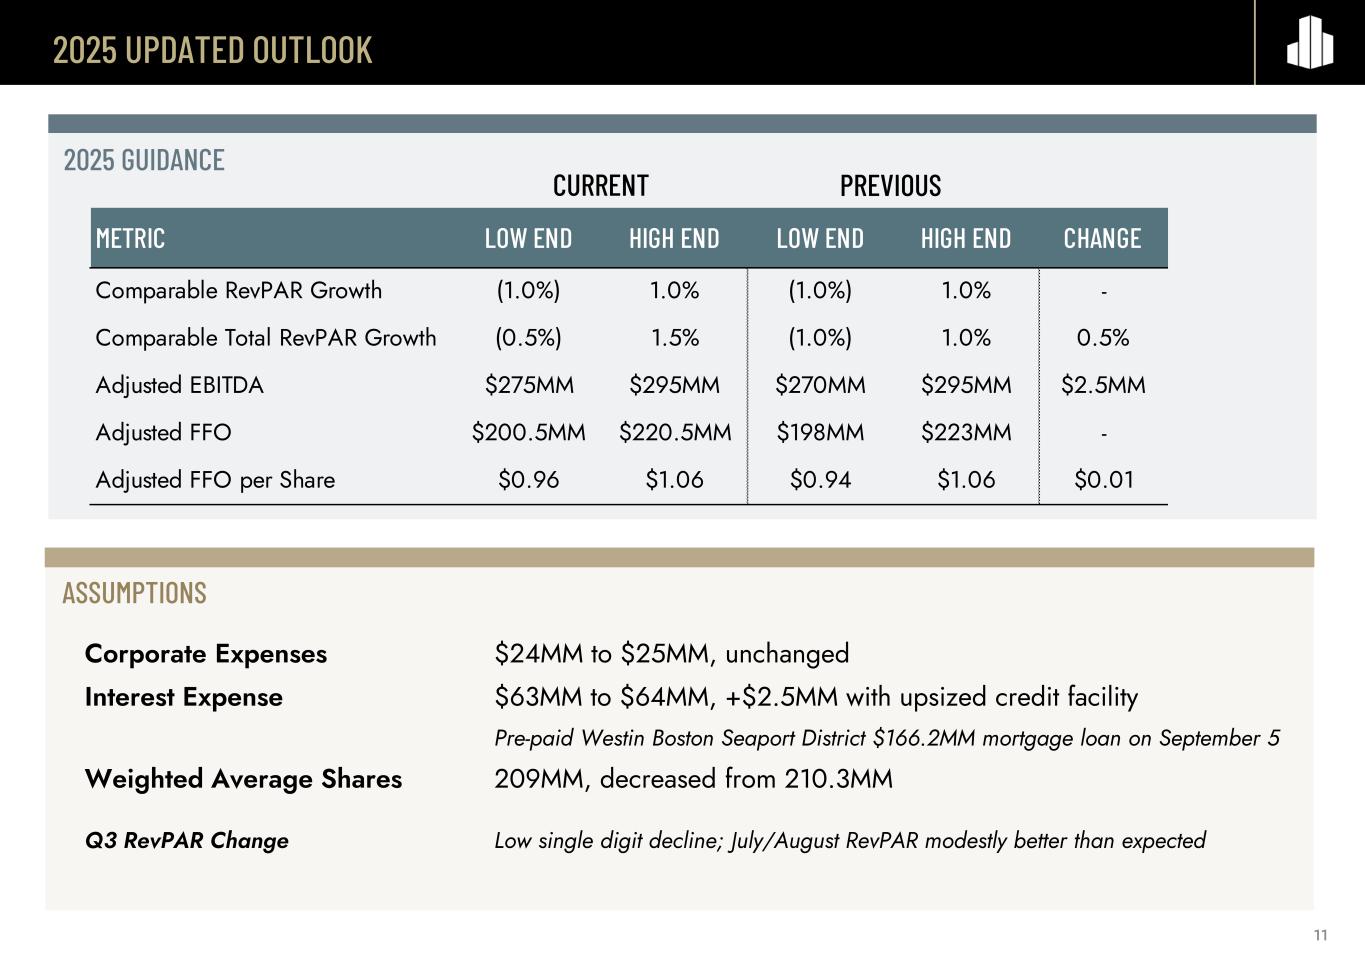
2025 UPDATED OUTLOOK ASSUMPTIONS CURRENT Corporate Expenses $24MM to $25MM, unchanged Interest Expense $63MM to $64MM, +$2.5MM with upsized credit facility Pre-paid Westin Boston Seaport District $166.2MM mortgage loan on September 5 Weighted Average Shares 209MM, decreased from 210.3MM Q3 RevPAR Change Low single digit decline; July/August RevPAR modestly better than expected 2025 GUIDANCE PREVIOUS 11 METRIC LOW END HIGH END LOW END HIGH END CHANGE Comparable RevPAR Growth (1.0%) 1.0% (1.0%) 1.0% - Comparable Total RevPAR Growth (0.5%) 1.5% (1.0%) 1.0% 0.5% Adjusted EBITDA $275MM $295MM $270MM $295MM $2.5MM Adjusted FFO $200.5MM $220.5MM $198MM $223MM - Adjusted FFO per Share $0.96 $1.06 $0.94 $1.06 $0.01
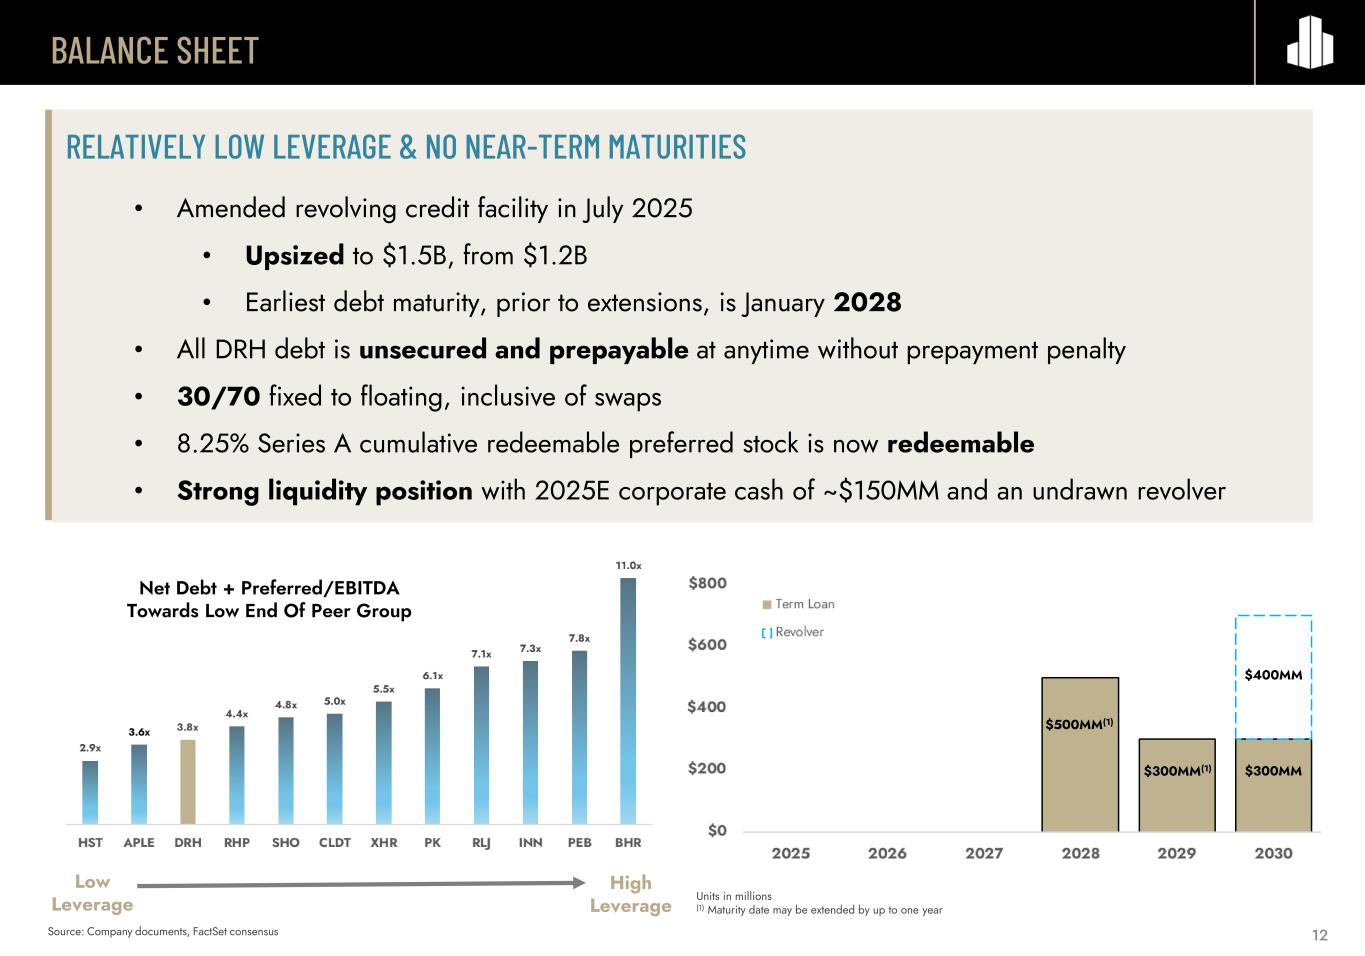
BALANCE SHEET 12 High Leverage Low Leverage RELATIVELY LOW LEVERAGE & NO NEAR-TERM MATURITIES • Amended revolving credit facility in July 2025 • Upsized to $1.5B, from $1.2B • Earliest debt maturity, prior to extensions, is January 2028 • All DRH debt is unsecured and prepayable at anytime without prepayment penalty • 30/70 fixed to floating, inclusive of swaps • 8.25% Series A cumulative redeemable preferred stock is now redeemable • Strong liquidity position with 2025E corporate cash of ~$150MM and an undrawn revolver Net Debt + Preferred/EBITDA Towards Low End Of Peer Group $500MM(1) $300MM(1) $300MM $400MM Source: Company documents, FactSet consensus Units in millions (1) Maturity date may be extended by up to one year
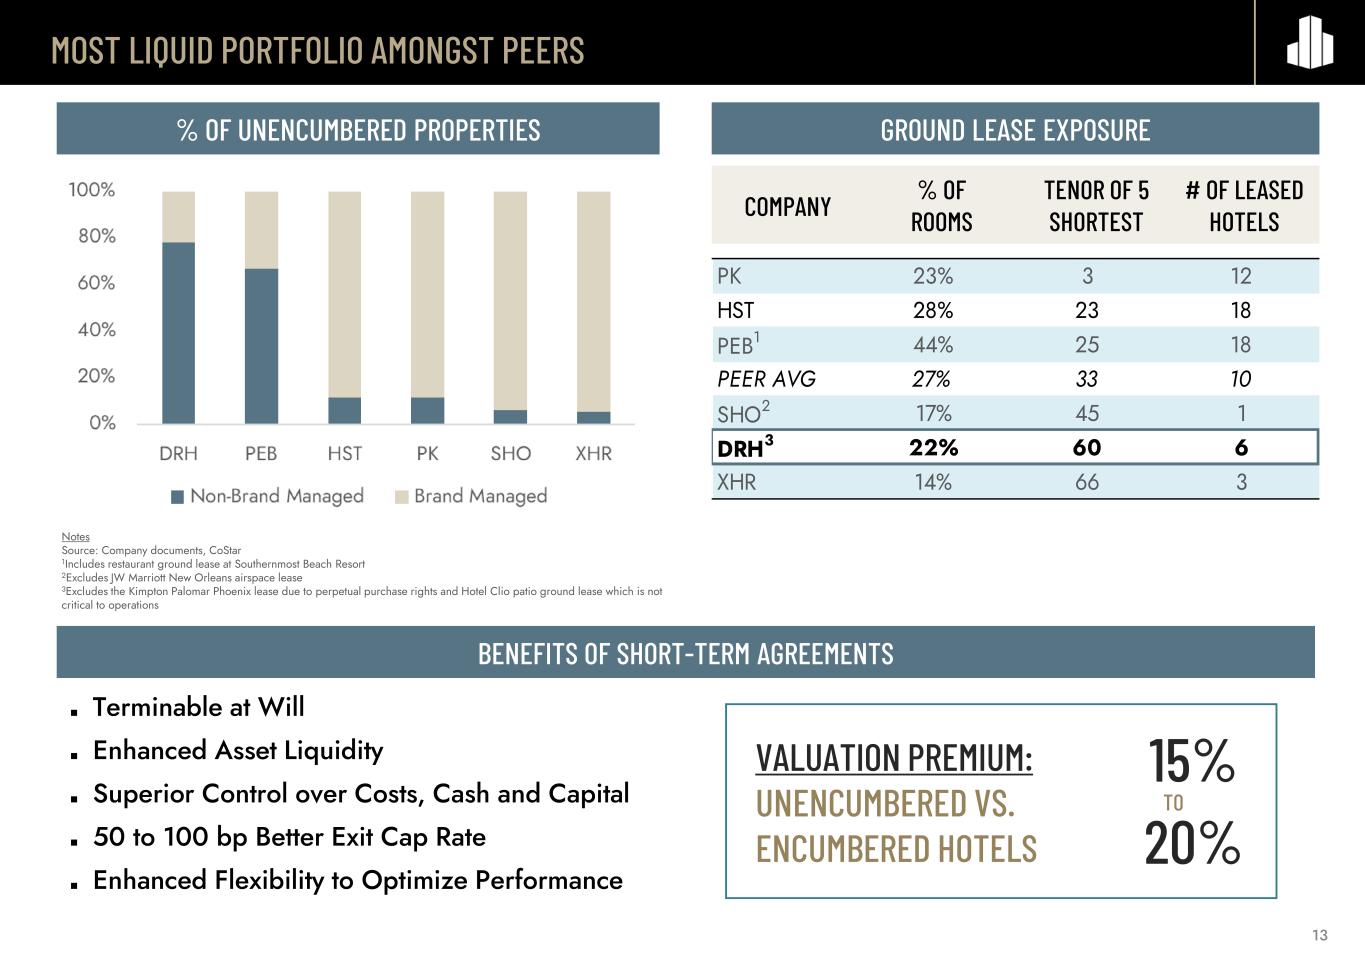
MOST LIQUID PORTFOLIO AMONGST PEERS 13 BENEFITS OF SHORT-TERM AGREEMENTS ■ Terminable at Will ■ Enhanced Asset Liquidity ■ Superior Control over Costs, Cash and Capital ■ 50 to 100 bp Better Exit Cap Rate ■ Enhanced Flexibility to Optimize Performance VALUATION PREMIUM: UNENCUMBERED VS. ENCUMBERED HOTELS % OF UNENCUMBERED PROPERTIES Notes Source: Company documents, CoStar 1Includes restaurant ground lease at Southernmost Beach Resort 2Excludes JW Marriott New Orleans airspace lease 3Excludes the Kimpton Palomar Phoenix lease due to perpetual purchase rights and Hotel Clio patio ground lease which is not critical to operations TO GROUND LEASE EXPOSURE % OF ROOMS TENOR OF 5 SHORTEST # OF LEASED HOTELSCOMPANY PK 23% 3 12 HST 28% 23 18 PEB1 44% 25 18 PEER AVG 27% 33 10 SHO2 17% 45 1 DRH3 22% 60 6 XHR 14% 66 3 15% 20%
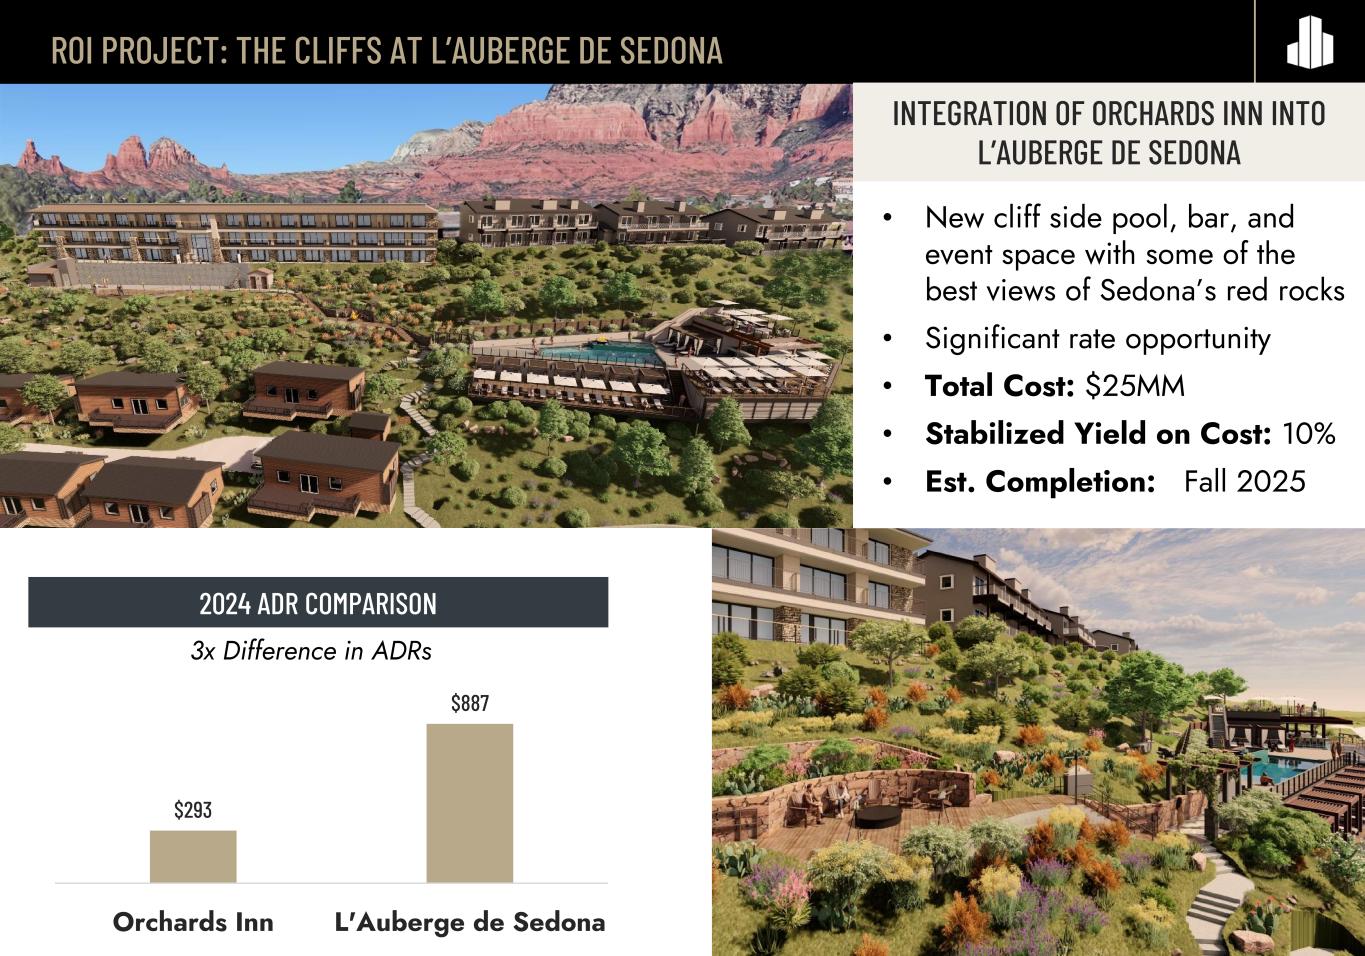
ROI PROJECT: THE CLIFFS AT L’AUBERGE DE SEDONA 14 INTEGRATION OF ORCHARDS INN INTO L’AUBERGE DE SEDONA • New cliff side pool, bar, and event space with some of the best views of Sedona’s red rocks • Significant rate opportunity • Total Cost: $25MM • Stabilized Yield on Cost: 10% • Est. Completion: Fall 2025 2024 ADR COMPARISON 3x Difference in ADRs $293 $887 Orchards Inn L'Auberge de Sedona
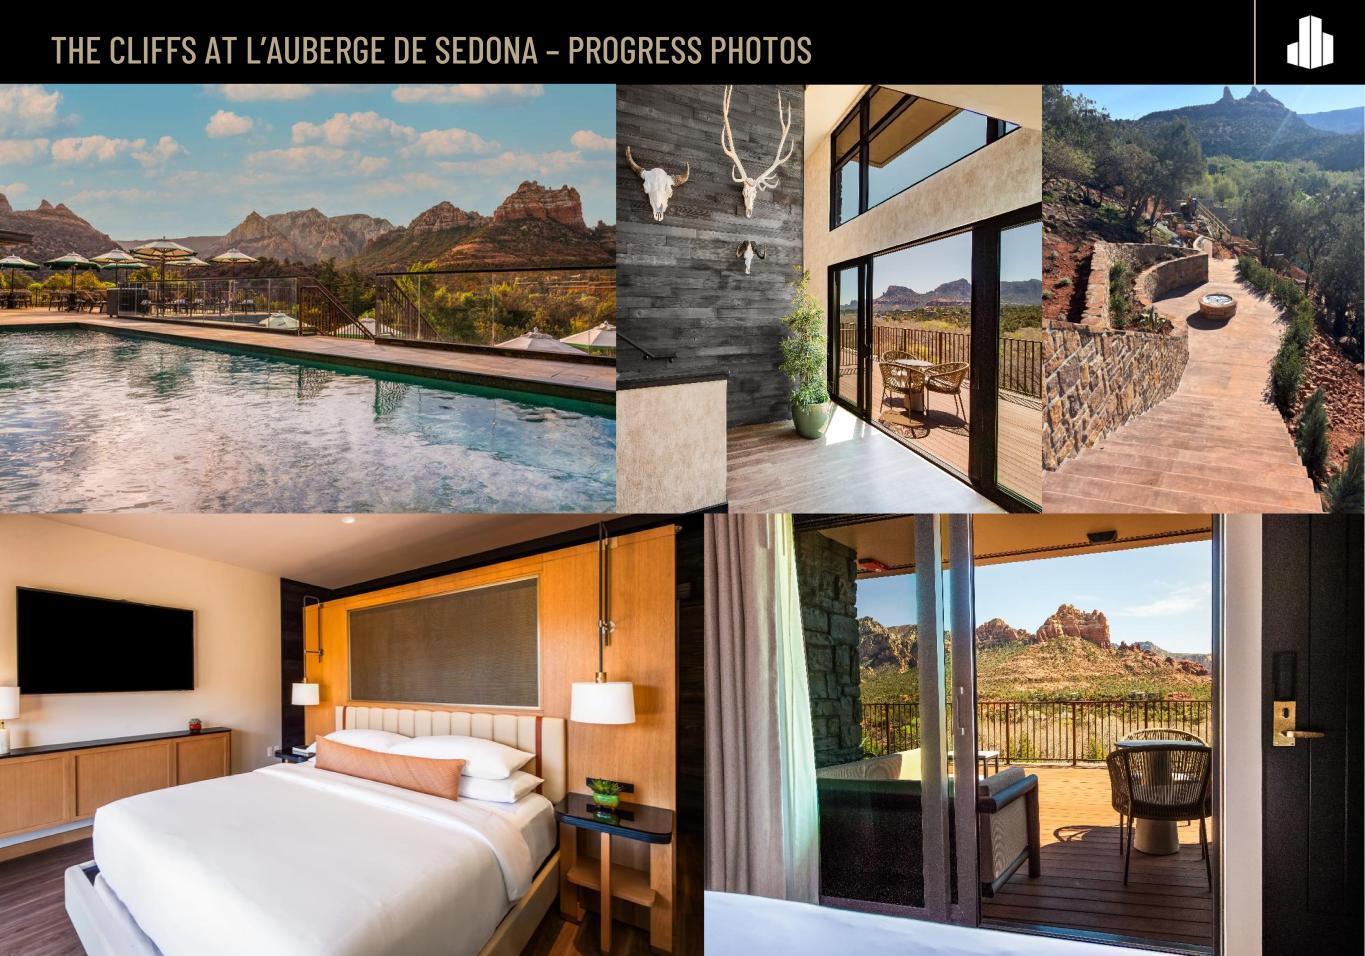
THE CLIFFS AT L’AUBERGE DE SEDONA – PROGRESS PHOTOS 15
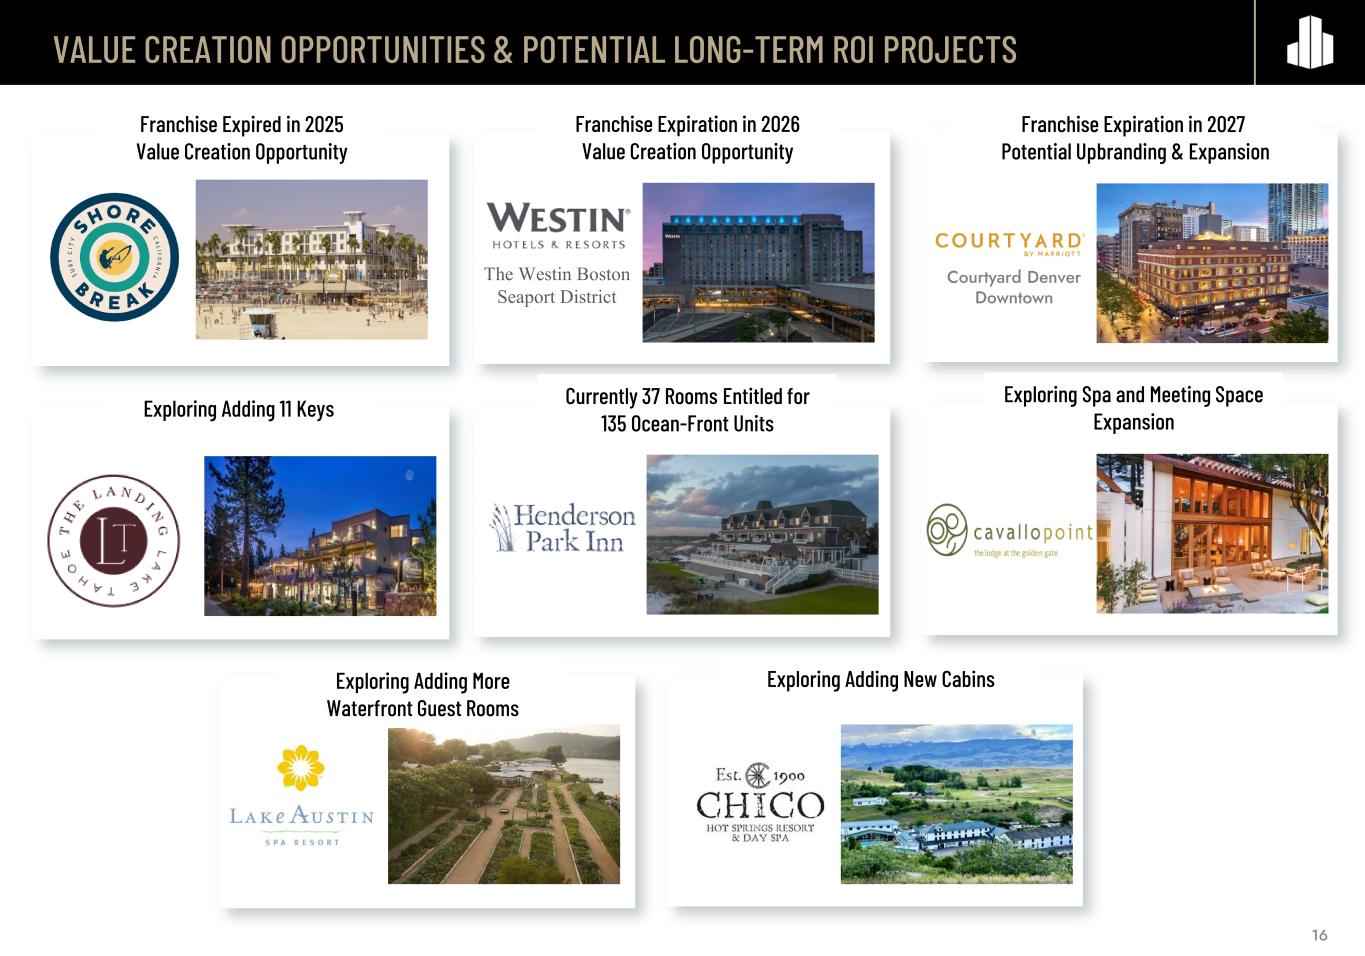
VALUE CREATION OPPORTUNITIES & POTENTIAL LONG-TERM ROI PROJECTS Courtyard Denver Downtown The Westin Boston Seaport District Exploring Adding More Waterfront Guest Rooms Franchise Expiration in 2027 Potential Upbranding & Expansion Franchise Expiration in 2026 Value Creation Opportunity Currently 37 Rooms Entitled for 135 Ocean-Front Units Exploring Adding 11 Keys Franchise Expired in 2025 Value Creation Opportunity Exploring Adding New Cabins Exploring Spa and Meeting Space Expansion 16
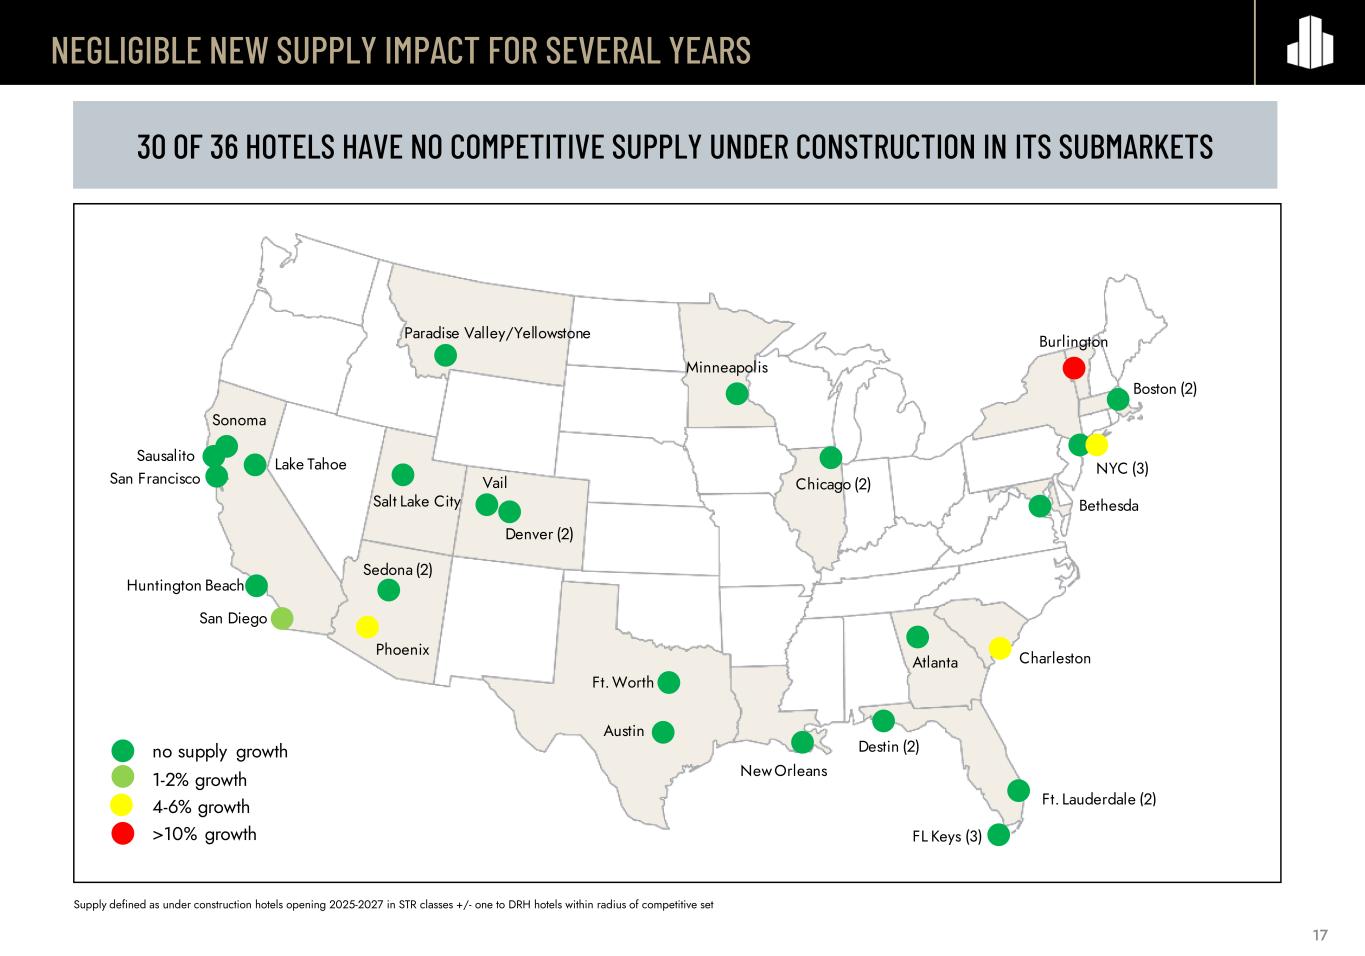
NEGLIGIBLE NEW SUPPLY IMPACT FOR SEVERAL YEARS 17 v v no supply growth 1-2% growth 4-6% growth >10% growth v Sonoma Lake TahoeSausalito San Francisco Huntington Beach San Diego Phoenix Sedona (2) Salt Lake City Paradise Valley/Yellowstone Minneapolis Chicago (2) Atlanta Destin (2) New Orleans FL Keys (3) Ft. Lauderdale (2) Charleston Bethesda Boston (2) Burlington NYC (3) Denver (2) Austin Ft. Worth Vail 30 OF 36 HOTELS HAVE NO COMPETITIVE SUPPLY UNDER CONSTRUCTION IN ITS SUBMARKETS Supply defined as under construction hotels opening 2025-2027 in STR classes +/- one to DRH hotels within radius of competitive set
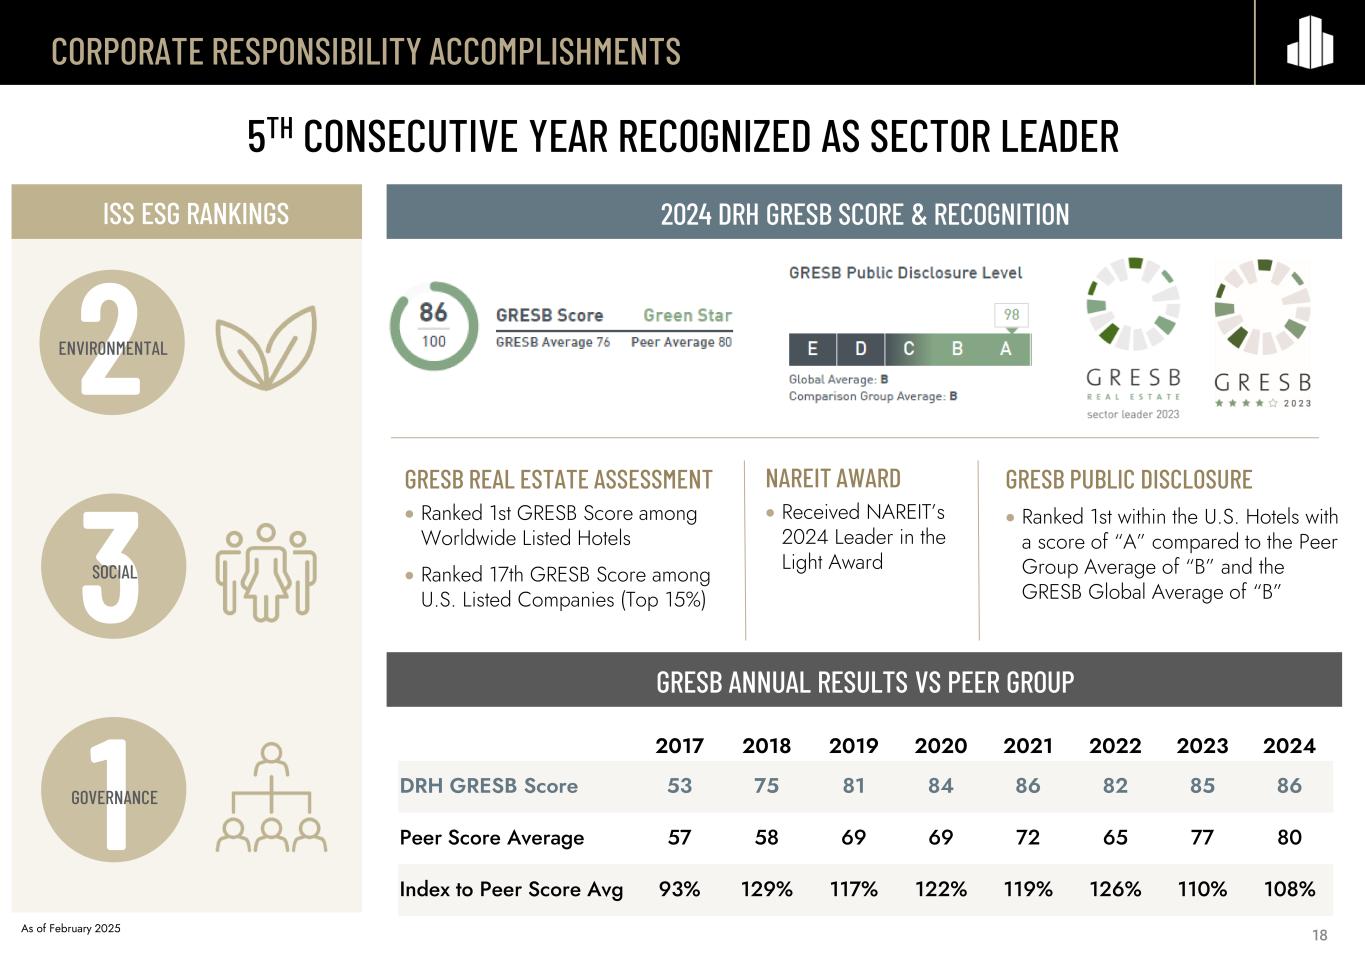
CORPORATE RESPONSIBILITY ACCOMPLISHMENTS GRESB ANNUAL RESULTS VS PEER GROUP 2017 2018 2019 2020 2021 2022 2023 2024 DRH GRESB Score 53 75 81 84 86 82 85 86 Peer Score Average 57 58 69 69 72 65 77 80 Index to Peer Score Avg 93% 129% 117% 122% 119% 126% 110% 108% 2024 DRH GRESB SCORE & RECOGNITION 5TH CONSECUTIVE YEAR RECOGNIZED AS SECTOR LEADER GRESB REAL ESTATE ASSESSMENT • Ranked 1st GRESB Score among Worldwide Listed Hotels • Ranked 17th GRESB Score among U.S. Listed Companies (Top 15%) GRESB PUBLIC DISCLOSURE • Ranked 1st within the U.S. Hotels with a score of “A” compared to the Peer Group Average of “B” and the GRESB Global Average of “B” ISS ESG RANKINGS 2ENVIRONMENTAL 3SOCIAL 1GOVERNANCE As of February 2025 NAREIT AWARD • Received NAREIT’s 2024 Leader in the Light Award 18

19