Axos Q4 Fiscal 2025 Earnings Supplement NYSE: AXJuly 30, 2025
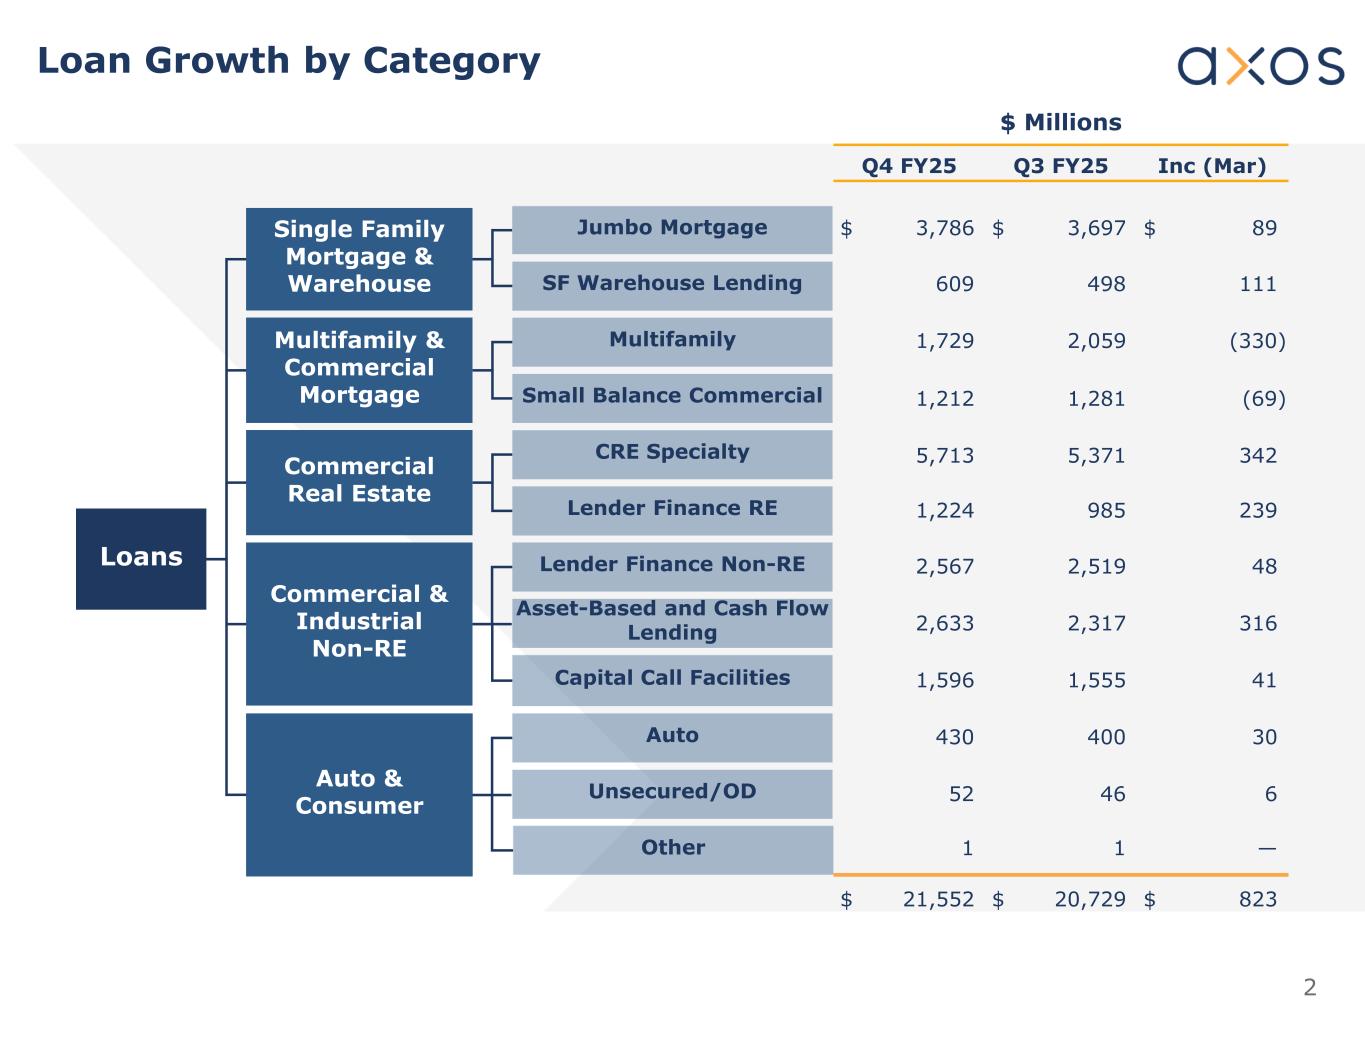
2 Loan Growth by Category $ Millions SF Warehouse Lending Multifamily Small Balance Commercial Jumbo Mortgage Asset-Based and Cash Flow Lending Lender Finance Non-RE Capital Call Facilities Auto Unsecured/OD Single Family Mortgage & Warehouse Multifamily & Commercial Mortgage Commercial Real Estate Commercial & Industrial Non-RE Loans Inc (Mar)Q3 FY25Q4 FY25 $ 89$ 3,697$ 3,786 111498609 (330)2,0591,729 (69)1,2811,212 3425,3715,713 2399851,224 482,5192,567 3162,3172,633 411,5551,596 30400430 64652 —11 $ 823$ 20,729$ 21,552 Lender Finance RE CRE Specialty Other Auto & Consumer
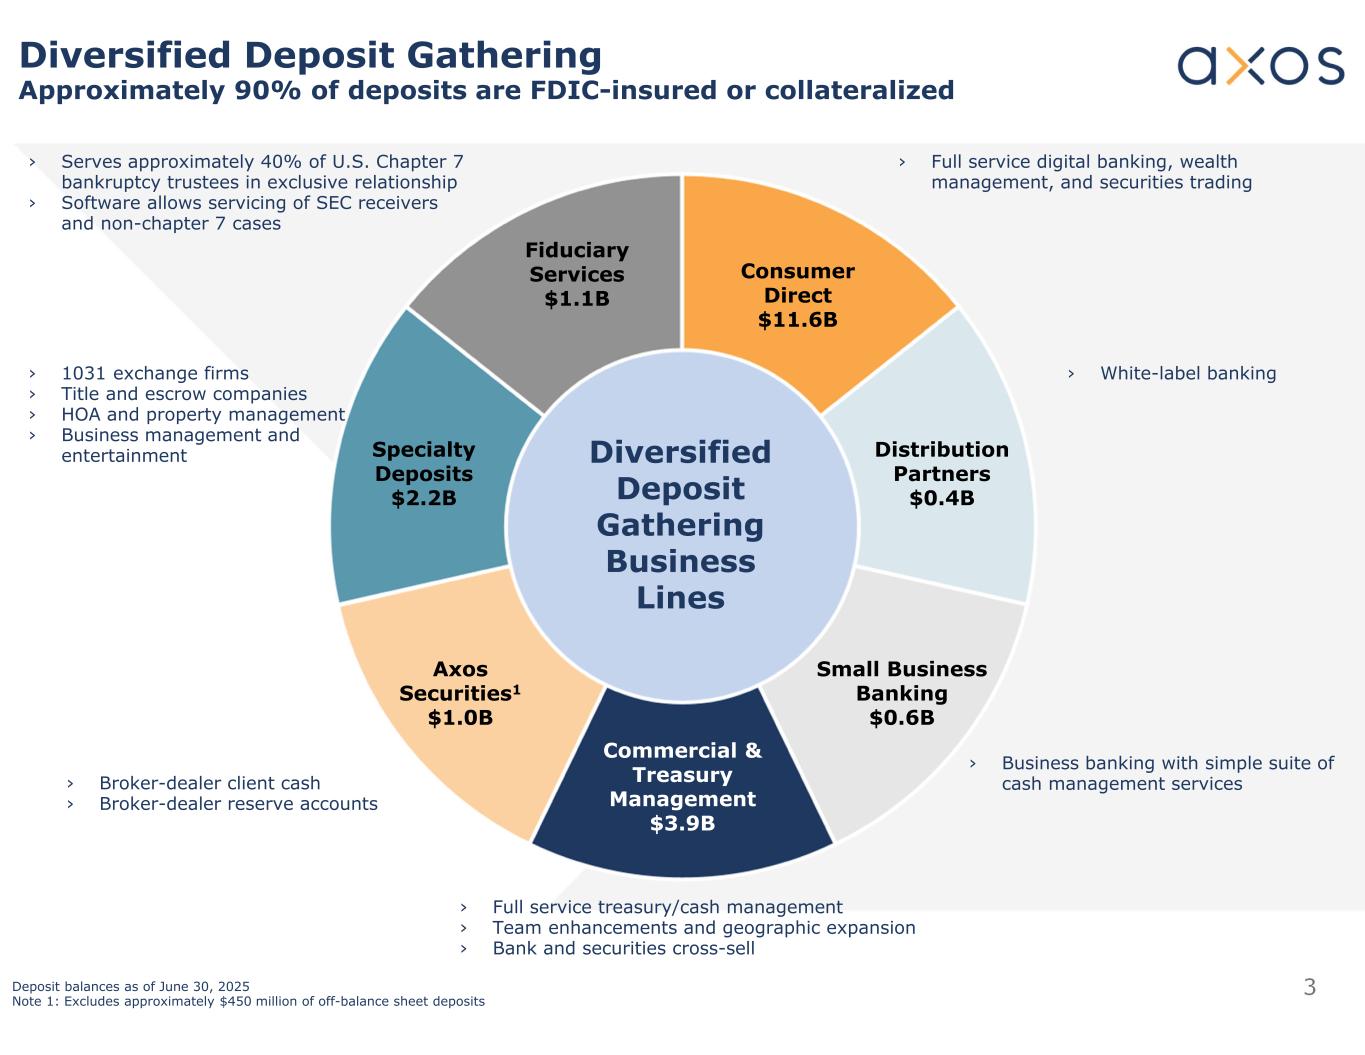
3 Diversified Deposit Gathering Approximately 90% of deposits are FDIC-insured or collateralized Deposit balances as of June 30, 2025 Note 1: Excludes approximately $450 million of off-balance sheet deposits › Serves approximately 40% of U.S. Chapter 7 bankruptcy trustees in exclusive relationship › Software allows servicing of SEC receivers and non-chapter 7 cases › Full service digital banking, wealth management, and securities trading › White-label banking › Business banking with simple suite of cash management services › 1031 exchange firms › Title and escrow companies › HOA and property management › Business management and entertainment › Broker-dealer client cash › Broker-dealer reserve accounts › Full service treasury/cash management › Team enhancements and geographic expansion › Bank and securities cross-sell Fiduciary Services $1.1B Consumer Direct $11.6B Specialty Deposits $2.2B Distribution Partners $0.4B Axos Securities1 $1.0B Small Business Banking $0.6B Commercial & Treasury Management $3.9B Diversified Deposit Gathering Business Lines
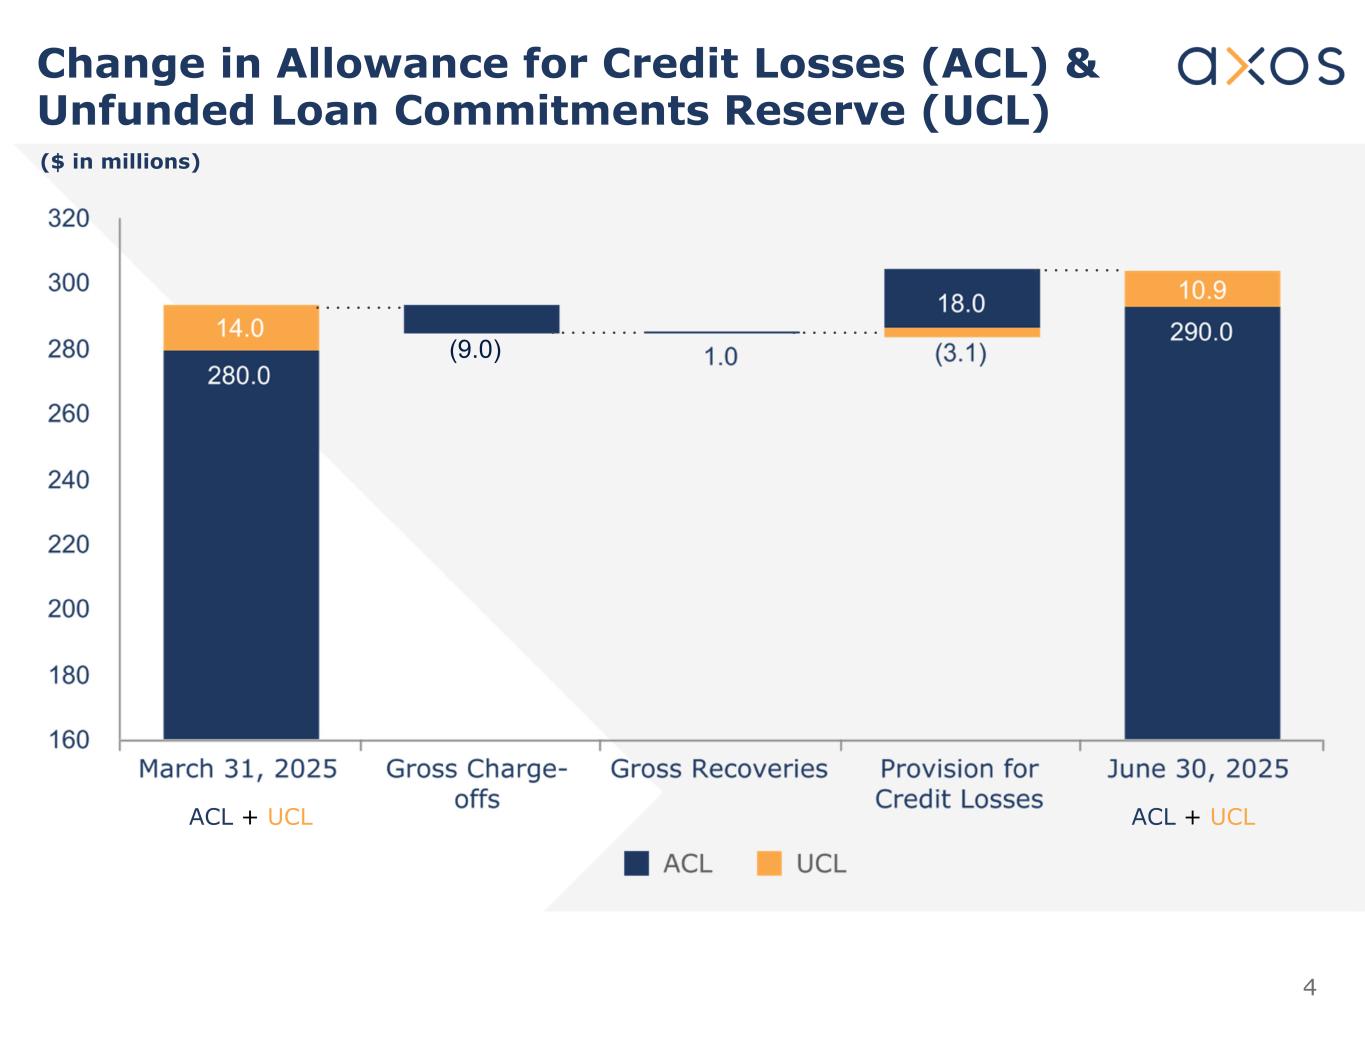
4 Change in Allowance for Credit Losses (ACL) & Unfunded Loan Commitments Reserve (UCL) ($ in millions) ACL + UCL ACL + UCL (9.0)
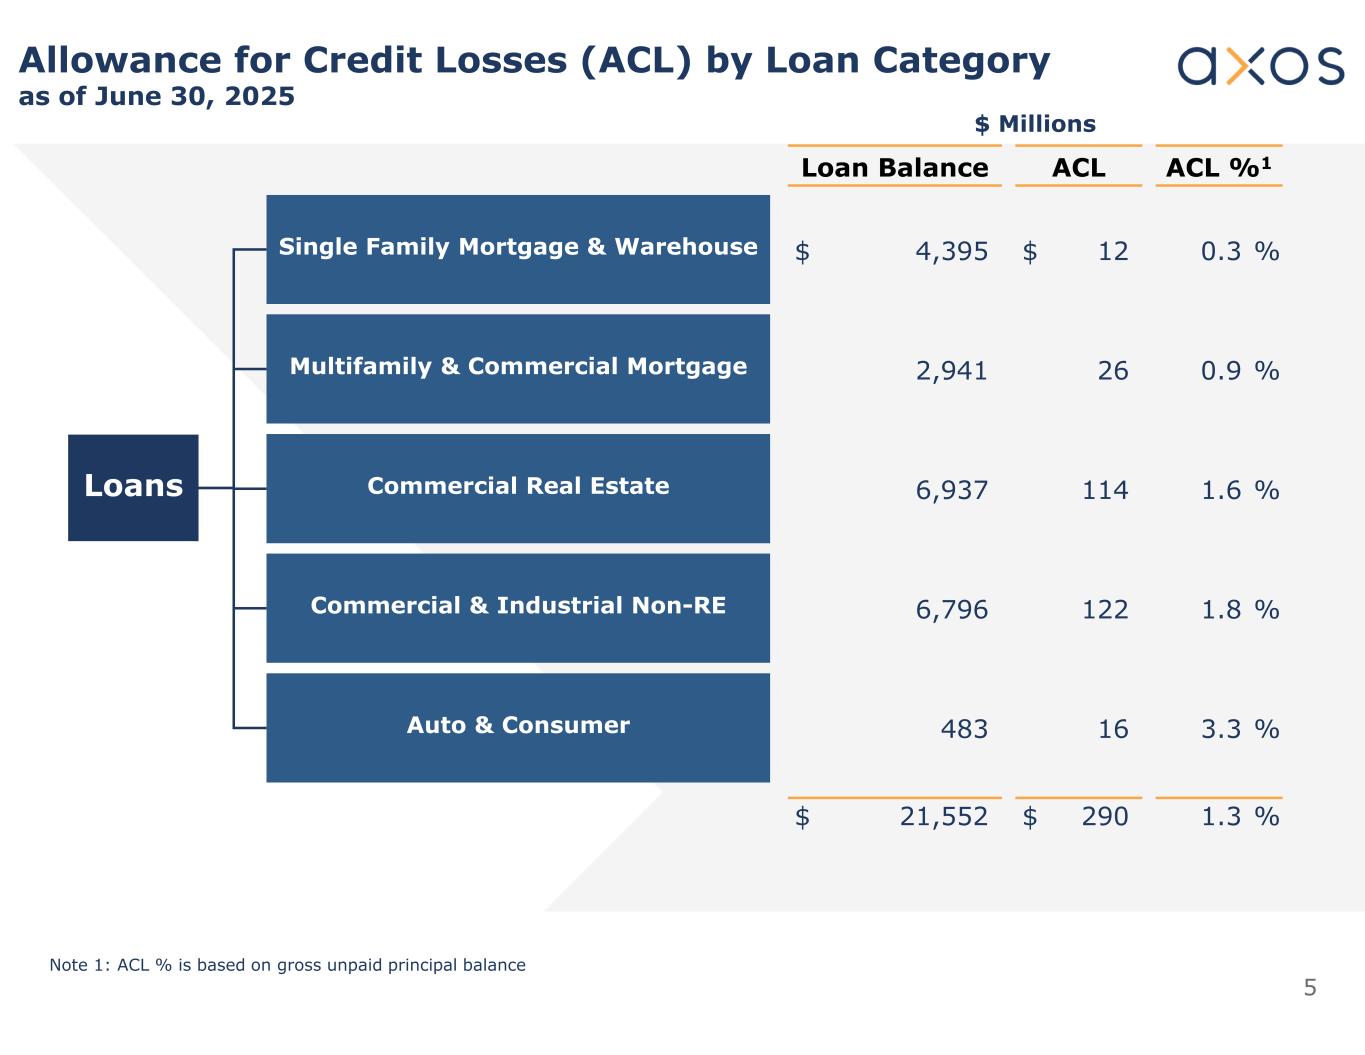
5 Allowance for Credit Losses (ACL) by Loan Category as of June 30, 2025 $ Millions ACL %1ACLLoan Balance 0.3 %$ 12$ 4,395 0.9 %262,941 1.6 %1146,937 1.8 %1226,796 3.3 %16483 1.3 %$ 290$ 21,552 Single Family Mortgage & Warehouse Multifamily & Commercial Mortgage Commercial Real Estate Commercial & Industrial Non-RE Auto & Consumer Loans Note 1: ACL % is based on gross unpaid principal balance
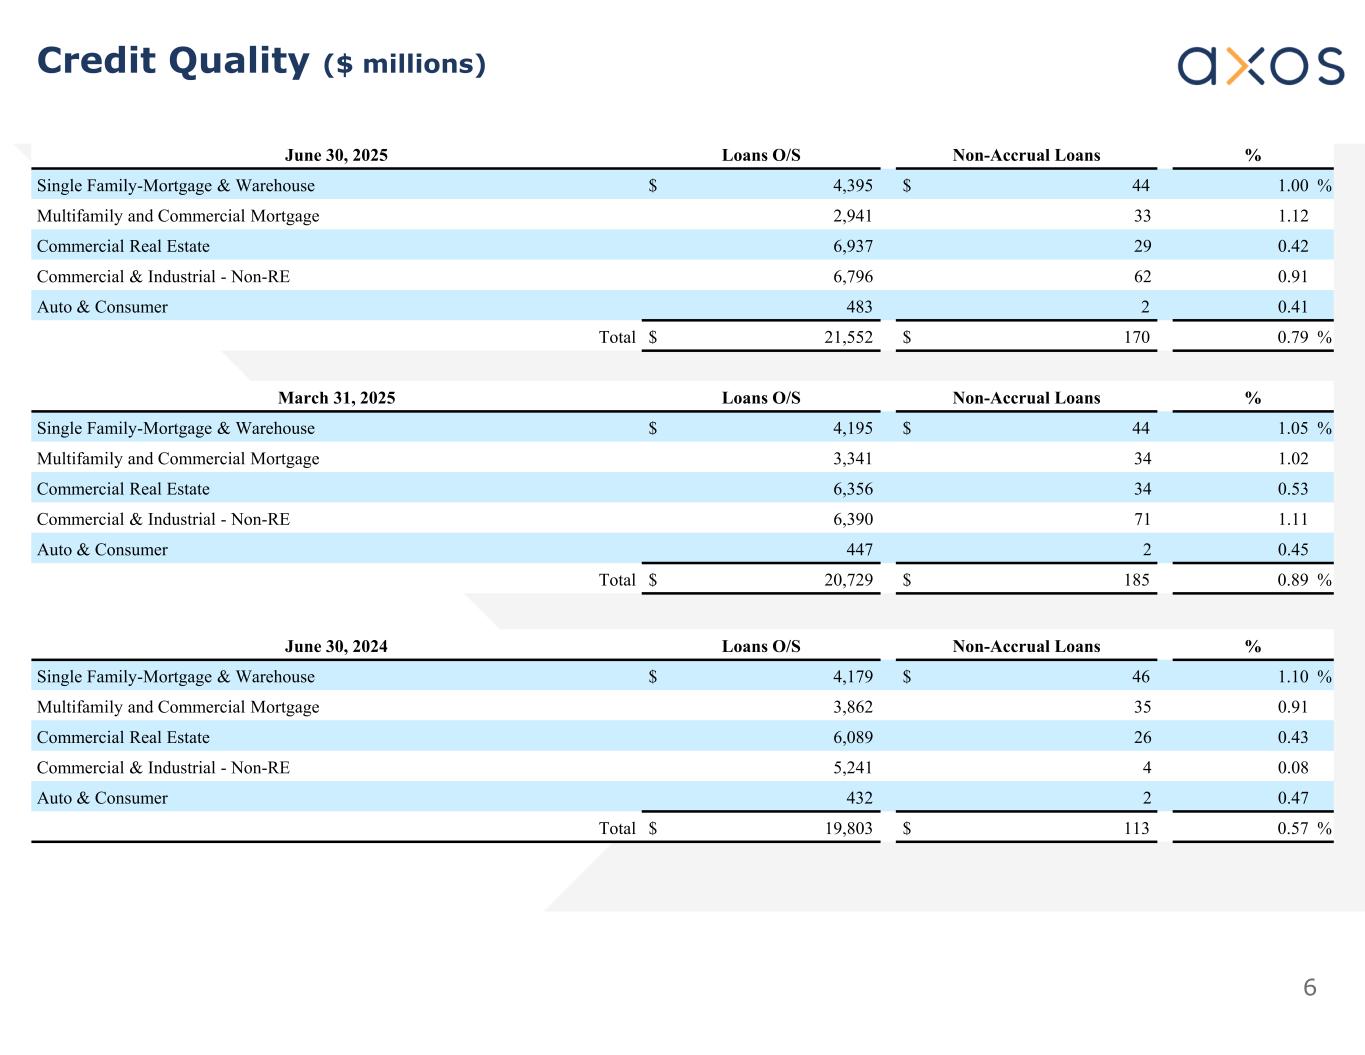
6 Credit Quality ($ millions) %Non-Accrual LoansLoans O/SJune 30, 2025 1.00 %$ 44$ 4,395Single Family-Mortgage & Warehouse 1.12332,941Multifamily and Commercial Mortgage 0.42296,937Commercial Real Estate 0.91626,796Commercial & Industrial - Non-RE 0.412483Auto & Consumer 0.79 %$ 170$ 21,552Total %Non-Accrual LoansLoans O/SMarch 31, 2025 1.05 %$ 44$ 4,195Single Family-Mortgage & Warehouse 1.02343,341Multifamily and Commercial Mortgage 0.53346,356Commercial Real Estate 1.11716,390Commercial & Industrial - Non-RE 0.452447Auto & Consumer 0.89 %$ 185$ 20,729Total %Non-Accrual LoansLoans O/SJune 30, 2024 1.10 %$ 46$ 4,179Single Family-Mortgage & Warehouse 0.91353,862Multifamily and Commercial Mortgage 0.43266,089Commercial Real Estate 0.0845,241Commercial & Industrial - Non-RE 0.472432Auto & Consumer 0.57 %$ 113$ 19,803Total
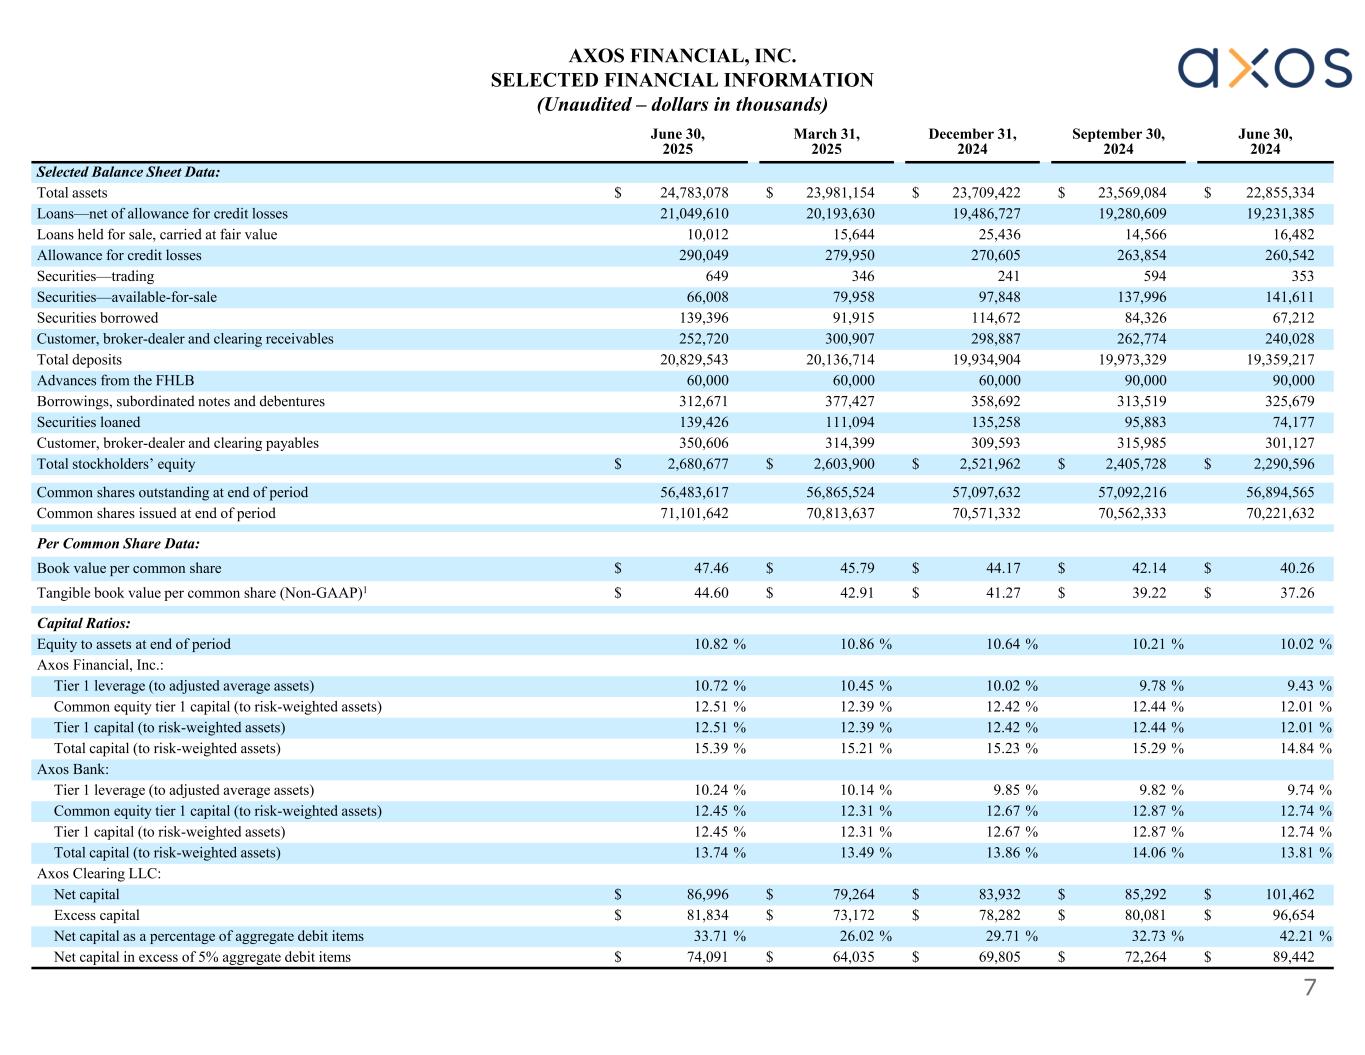
7 June 30, 2024 September 30, 2024 December 31, 2024 March 31, 2025 June 30, 2025 Selected Balance Sheet Data: $ 22,855,334$ 23,569,084$ 23,709,422$ 23,981,154$ 24,783,078Total assets 19,231,38519,280,60919,486,72720,193,63021,049,610Loans—net of allowance for credit losses 16,48214,56625,43615,64410,012Loans held for sale, carried at fair value 260,542263,854270,605279,950290,049Allowance for credit losses 353594241346649Securities—trading 141,611137,99697,84879,95866,008Securities—available-for-sale 67,21284,326114,67291,915139,396Securities borrowed 240,028262,774298,887300,907252,720Customer, broker-dealer and clearing receivables 19,359,21719,973,32919,934,90420,136,71420,829,543Total deposits 90,00090,00060,00060,00060,000Advances from the FHLB 325,679313,519358,692377,427312,671Borrowings, subordinated notes and debentures 74,17795,883135,258111,094139,426Securities loaned 301,127315,985309,593314,399350,606Customer, broker-dealer and clearing payables $ 2,290,596$ 2,405,728$ 2,521,962$ 2,603,900$ 2,680,677Total stockholders’ equity 56,894,56557,092,21657,097,63256,865,52456,483,617Common shares outstanding at end of period 70,221,63270,562,33370,571,33270,813,63771,101,642Common shares issued at end of period Per Common Share Data: $ 40.26$ 42.14$ 44.17$ 45.79$ 47.46Book value per common share $ 37.26$ 39.22$ 41.27$ 42.91$ 44.60Tangible book value per common share (Non-GAAP)1 Capital Ratios: 10.02 %10.21 %10.64 %10.86 %10.82 %Equity to assets at end of period Axos Financial, Inc.: 9.43 %9.78 %10.02 %10.45 %10.72 %Tier 1 leverage (to adjusted average assets) 12.01 %12.44 %12.42 %12.39 %12.51 %Common equity tier 1 capital (to risk-weighted assets) 12.01 %12.44 %12.42 %12.39 %12.51 %Tier 1 capital (to risk-weighted assets) 14.84 %15.29 %15.23 %15.21 %15.39 %Total capital (to risk-weighted assets) Axos Bank: 9.74 %9.82 %9.85 %10.14 %10.24 %Tier 1 leverage (to adjusted average assets) 12.74 %12.87 %12.67 %12.31 %12.45 %Common equity tier 1 capital (to risk-weighted assets) 12.74 %12.87 %12.67 %12.31 %12.45 %Tier 1 capital (to risk-weighted assets) 13.81 %14.06 %13.86 %13.49 %13.74 %Total capital (to risk-weighted assets) Axos Clearing LLC: $ 101,462$ 85,292$ 83,932$ 79,264$ 86,996Net capital $ 96,654$ 80,081$ 78,282$ 73,172$ 81,834Excess capital 42.21 %32.73 %29.71 %26.02 %33.71 %Net capital as a percentage of aggregate debit items $ 89,442$ 72,264$ 69,805$ 64,035$ 74,091Net capital in excess of 5% aggregate debit items AXOS FINANCIAL, INC. SELECTED FINANCIAL INFORMATION (Unaudited – dollars in thousands)
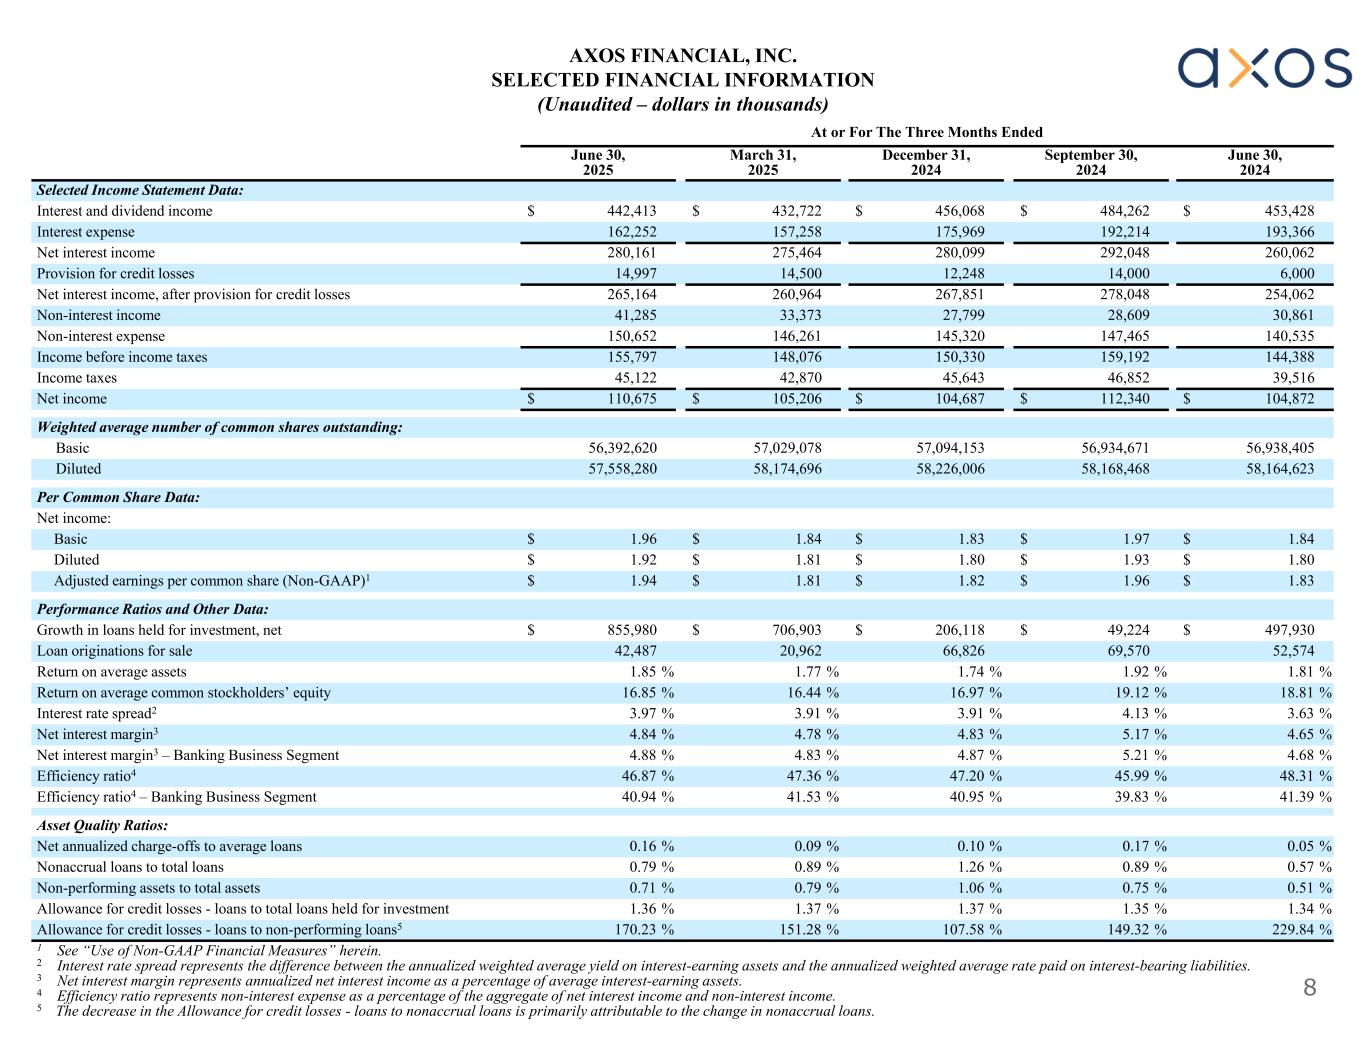
8 At or For The Three Months Ended June 30, 2024 September 30, 2024 December 31, 2024 March 31, 2025 June 30, 2025 Selected Income Statement Data: $ 453,428$ 484,262$ 456,068$ 432,722$ 442,413Interest and dividend income 193,366192,214175,969157,258162,252Interest expense 260,062292,048280,099275,464280,161Net interest income 6,00014,00012,24814,50014,997Provision for credit losses 254,062278,048267,851260,964265,164Net interest income, after provision for credit losses 30,86128,60927,79933,37341,285Non-interest income 140,535147,465145,320146,261150,652Non-interest expense 144,388159,192150,330148,076155,797Income before income taxes 39,51646,85245,64342,87045,122Income taxes $ 104,872$ 112,340$ 104,687$ 105,206$ 110,675Net income Weighted average number of common shares outstanding: 56,938,40556,934,67157,094,15357,029,07856,392,620Basic 58,164,62358,168,46858,226,00658,174,69657,558,280Diluted Per Common Share Data: Net income: $ 1.84$ 1.97$ 1.83$ 1.84$ 1.96Basic $ 1.80$ 1.93$ 1.80$ 1.81$ 1.92Diluted $ 1.83$ 1.96$ 1.82$ 1.81$ 1.94Adjusted earnings per common share (Non-GAAP)1 Performance Ratios and Other Data: $ 497,930$ 49,224$ 206,118$ 706,903$ 855,980Growth in loans held for investment, net 52,57469,57066,82620,96242,487Loan originations for sale 1.81 %1.92 %1.74 %1.77 %1.85 %Return on average assets 18.81 %19.12 %16.97 %16.44 %16.85 %Return on average common stockholders’ equity 3.63 %4.13 %3.91 %3.91 %3.97 %Interest rate spread2 4.65 %5.17 %4.83 %4.78 %4.84 %Net interest margin3 4.68 %5.21 %4.87 %4.83 %4.88 %Net interest margin3 – Banking Business Segment 48.31 %45.99 %47.20 %47.36 %46.87 %Efficiency ratio4 41.39 %39.83 %40.95 %41.53 %40.94 %Efficiency ratio4 – Banking Business Segment Asset Quality Ratios: 0.05 %0.17 %0.10 %0.09 %0.16 %Net annualized charge-offs to average loans 0.57 %0.89 %1.26 %0.89 %0.79 %Nonaccrual loans to total loans 0.51 %0.75 %1.06 %0.79 %0.71 %Non-performing assets to total assets 1.34 %1.35 %1.37 %1.37 %1.36 %Allowance for credit losses - loans to total loans held for investment 229.84 %149.32 %107.58 %151.28 %170.23 %Allowance for credit losses - loans to non-performing loans5 1 See “Use of Non-GAAP Financial Measures” herein. 2 Interest rate spread represents the difference between the annualized weighted average yield on interest-earning assets and the annualized weighted average rate paid on interest-bearing liabilities. 3 Net interest margin represents annualized net interest income as a percentage of average interest-earning assets. 4 Efficiency ratio represents non-interest expense as a percentage of the aggregate of net interest income and non-interest income. 5 The decrease in the Allowance for credit losses - loans to nonaccrual loans is primarily attributable to the change in nonaccrual loans. AXOS FINANCIAL, INC. SELECTED FINANCIAL INFORMATION (Unaudited – dollars in thousands)
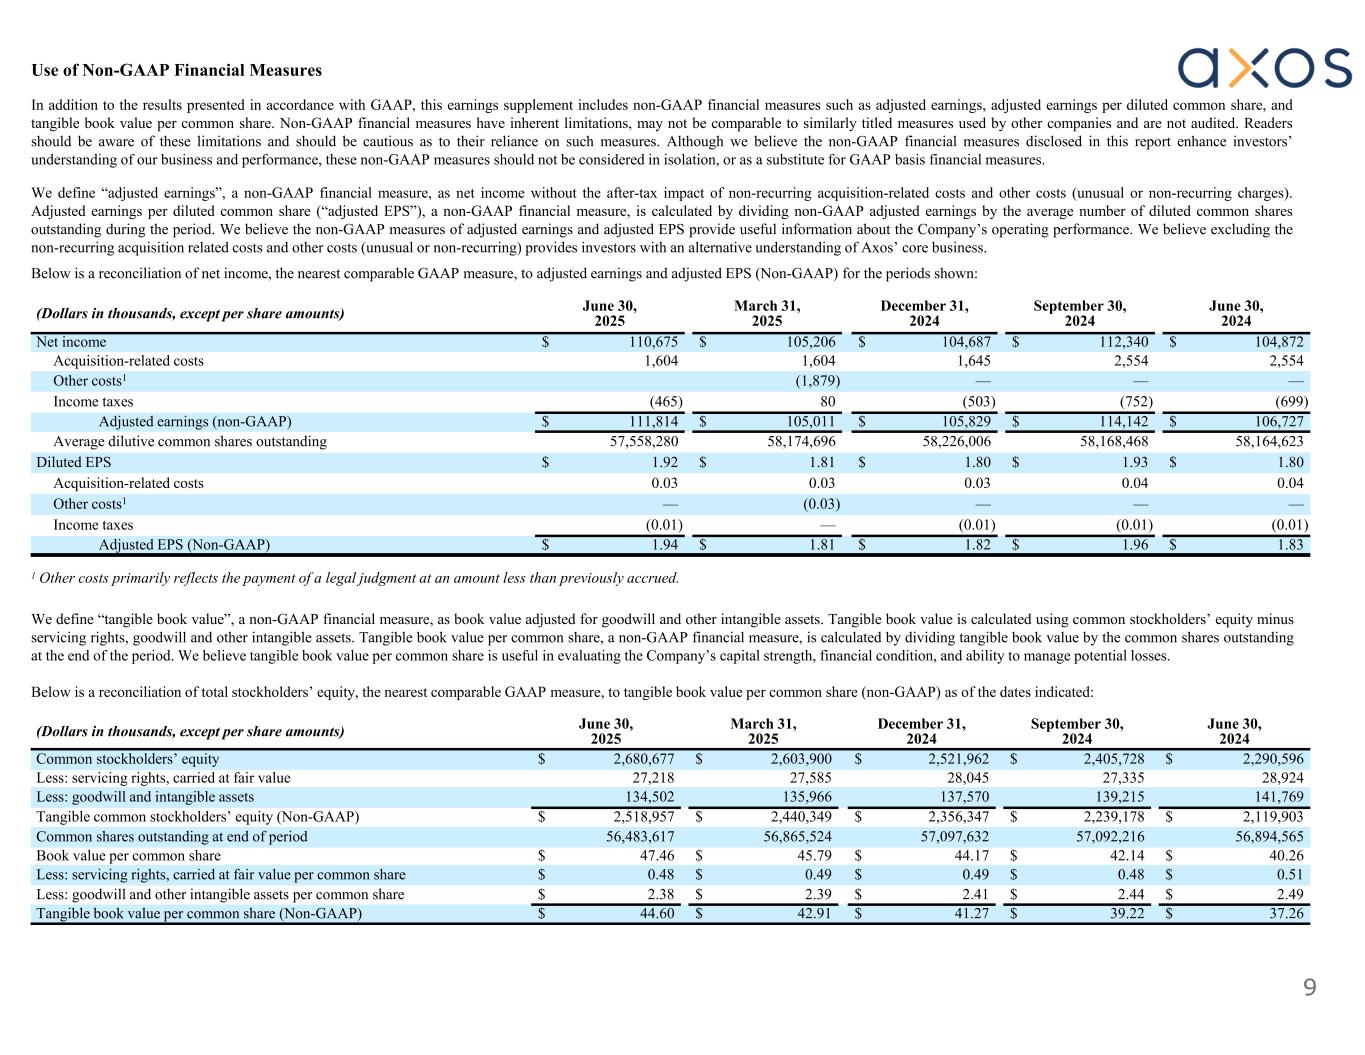
9 June 30, 2024 September 30, 2024 December 31, 2024 March 31, 2025 June 30, 2025(Dollars in thousands, except per share amounts) $ 104,872$ 112,340$ 104,687$ 105,206$ 110,675Net income 2,5542,5541,6451,6041,604Acquisition-related costs ———(1,879)Other costs1 (699)(752)(503)80(465)Income taxes $ 106,727$ 114,142$ 105,829$ 105,011$ 111,814Adjusted earnings (non-GAAP) 58,164,62358,168,46858,226,00658,174,69657,558,280Average dilutive common shares outstanding $ 1.80$ 1.93$ 1.80$ 1.81$ 1.92Diluted EPS 0.040.040.030.030.03Acquisition-related costs ———(0.03)—Other costs1 (0.01)(0.01)(0.01)—(0.01)Income taxes $ 1.83$ 1.96$ 1.82$ 1.81$ 1.94Adjusted EPS (Non-GAAP) 1 Other costs primarily reflects the payment of a legal judgment at an amount less than previously accrued. We define “tangible book value”, a non-GAAP financial measure, as book value adjusted for goodwill and other intangible assets. Tangible book value is calculated using common stockholders’ equity minus servicing rights, goodwill and other intangible assets. Tangible book value per common share, a non-GAAP financial measure, is calculated by dividing tangible book value by the common shares outstanding at the end of the period. We believe tangible book value per common share is useful in evaluating the Company’s capital strength, financial condition, and ability to manage potential losses. Below is a reconciliation of total stockholders’ equity, the nearest comparable GAAP measure, to tangible book value per common share (non-GAAP) as of the dates indicated: June 30, 2024 September 30, 2024 December 31, 2024 March 31, 2025 June 30, 2025(Dollars in thousands, except per share amounts) $ 2,290,596$ 2,405,728$ 2,521,962$ 2,603,900$ 2,680,677Common stockholders’ equity 28,92427,33528,04527,58527,218Less: servicing rights, carried at fair value 141,769139,215137,570135,966134,502Less: goodwill and intangible assets $ 2,119,903$ 2,239,178$ 2,356,347$ 2,440,349$ 2,518,957Tangible common stockholders’ equity (Non-GAAP) 56,894,56557,092,21657,097,63256,865,52456,483,617Common shares outstanding at end of period $ 40.26$ 42.14$ 44.17$ 45.79$ 47.46Book value per common share $ 0.51$ 0.48$ 0.49$ 0.49$ 0.48Less: servicing rights, carried at fair value per common share $ 2.49$ 2.44$ 2.41$ 2.39$ 2.38Less: goodwill and other intangible assets per common share $ 37.26$ 39.22$ 41.27$ 42.91$ 44.60Tangible book value per common share (Non-GAAP) Use of Non-GAAP Financial Measures In addition to the results presented in accordance with GAAP, this earnings supplement includes non-GAAP financial measures such as adjusted earnings, adjusted earnings per diluted common share, and tangible book value per common share. Non-GAAP financial measures have inherent limitations, may not be comparable to similarly titled measures used by other companies and are not audited. Readers should be aware of these limitations and should be cautious as to their reliance on such measures. Although we believe the non-GAAP financial measures disclosed in this report enhance investors’ understanding of our business and performance, these non-GAAP measures should not be considered in isolation, or as a substitute for GAAP basis financial measures. We define “adjusted earnings”, a non-GAAP financial measure, as net income without the after-tax impact of non-recurring acquisition-related costs and other costs (unusual or non-recurring charges). Adjusted earnings per diluted common share (“adjusted EPS”), a non-GAAP financial measure, is calculated by dividing non-GAAP adjusted earnings by the average number of diluted common shares outstanding during the period. We believe the non-GAAP measures of adjusted earnings and adjusted EPS provide useful information about the Company’s operating performance. We believe excluding the non-recurring acquisition related costs and other costs (unusual or non-recurring) provides investors with an alternative understanding of Axos’ core business. Below is a reconciliation of net income, the nearest comparable GAAP measure, to adjusted earnings and adjusted EPS (Non-GAAP) for the periods shown:
10 Greg Garrabrants, President and CEO Derrick Walsh, EVP and CFO investors@axosfinancial.com www.axosfinancial.com Johnny Lai, SVP Corporate Development and Investor Relations Phone: 858.649.2218 Mobile: 858.245.1442 jlai@axosfinancial.com Contact Information