BlueLinx Q2 2025 Results Delivering What Matters July 30, 2025 © BlueLinx 2025. All Rights Reserved. 1 .2
This presentation contains forward-looking statements. Forward-looking statements include, without limitation, any statement that predicts, forecasts, indicates or implies future results, performance, liquidity levels or achievements, and may contain the words “believe,” “anticipate,” “could”, “expect,” “estimate,” “intend,” “may”, “project,” “plan,” “should”, “will”, “will be,” “will likely continue,” “will likely result”, “would” or words or phrases of similar meaning. The forward-looking statements in this presentation include statements about our strategy, liquidity, and debt, our long-run positioning relative to industry conditions, future share repurchases, and our third quarter 2025 outlook. Forward-looking statements in this press release are based on estimates and assumptions made by our management that, although believed by us to be reasonable, are inherently uncertain. Forward- looking statements involve risks and uncertainties that may cause our business, strategy, or actual results to differ materially from the forward-looking statements. These risks and uncertainties include those discussed in greater detail in our filings with the Securities and Exchange Commission. We operate in a changing environment in which new risks can emerge from time to time. It is not possible for management to predict all of these risks, nor can it assess the extent to which any factor, or a combination of factors, may cause our business, strategy, or actual results to differ materially from those contained in forward-looking statements. Factors that may cause these differences include, among other things: adverse housing market conditions; consolidation among competitors, suppliers, and customers; escalating changes in retaliatory trade policies of the United States and other countries; our dependence on international suppliers and manufacturers for certain products and related exposure to risks of new or increased tariffs and other risks that could affect our financial condition; pricing and product cost variability; disintermediation risk; volumes of product sold; competition; the cyclical nature of the industry in which we operate; loss of products or key suppliers and manufacturers; information technology security risks and business interruption risks; effective inventory management relative to our sales volume or the prices of the products we produce; the ability to attract, train, and retain highly qualified associates and other key personnel while controlling related labor costs; potential acquisitions and the integration and completion of such acquisitions; business disruptions; exposure to product liability and other claims and legal proceedings related to our business and the products we distribute; natural disasters, catastrophes, fire, wars or other unexpected events; the impacts of climate change; successful implementation of our strategy; wage increases or work stoppages by our union employees; costs imposed by federal, state, local, and other regulations; compliance costs associated with federal, state, and local environmental protection laws; the effects of epidemics, global pandemics or other widespread public health crises and governmental rules and regulations; fluctuations in our operating results; our level of indebtedness and our ability to incur additional debt to fund future needs; the covenants of the instruments governing our indebtedness limiting the discretion of our management in operating the business; the potential to incur more debt; the fact that we have consummated certain sale leaseback transactions with resulting long-term non-cancelable leases, many of which are or will be finance leases; the fact that we lease many of our distribution centers, and we would still be obligated under these leases even if we close a leased distribution center; inability to raise funds necessary to finance a required repurchase of our senior secured notes; a lowering or withdrawal of debt ratings; changes in our product mix; increases in fuel and other energy prices or availability of third-part freight providers; changes in insurance-related deductible/retention liabilities based on actual loss development experience; the possibility that the value of our deferred tax assets could become impaired; changes in our expected annual effective tax rate could be volatile; the costs and liabilities related to our participation in multi-employer pension plans could increase; the risk that our cash flows and capital resources may be insufficient to service our existing or future indebtedness; interest rate risk, which could cause our debt service obligations to increase; and changes in, or interpretation of, accounting principles. Given these risks and uncertainties, we caution you not to place undue reliance on forward-looking statements. We expressly disclaim any obligation to update or revise any forward-looking statement as a result of new information, future events or otherwise, except as required by law. Immaterial Rounding Differences. Immaterial rounding adjustments and differences may exist between slides, press releases, and previously issued presentations. This presentation and the associated remarks made during this conference call are integrally related and are intended to be presented and understood together. 2 Safe Harbor Statement

Opening Remarks 3 Shyam Reddy President & CEO
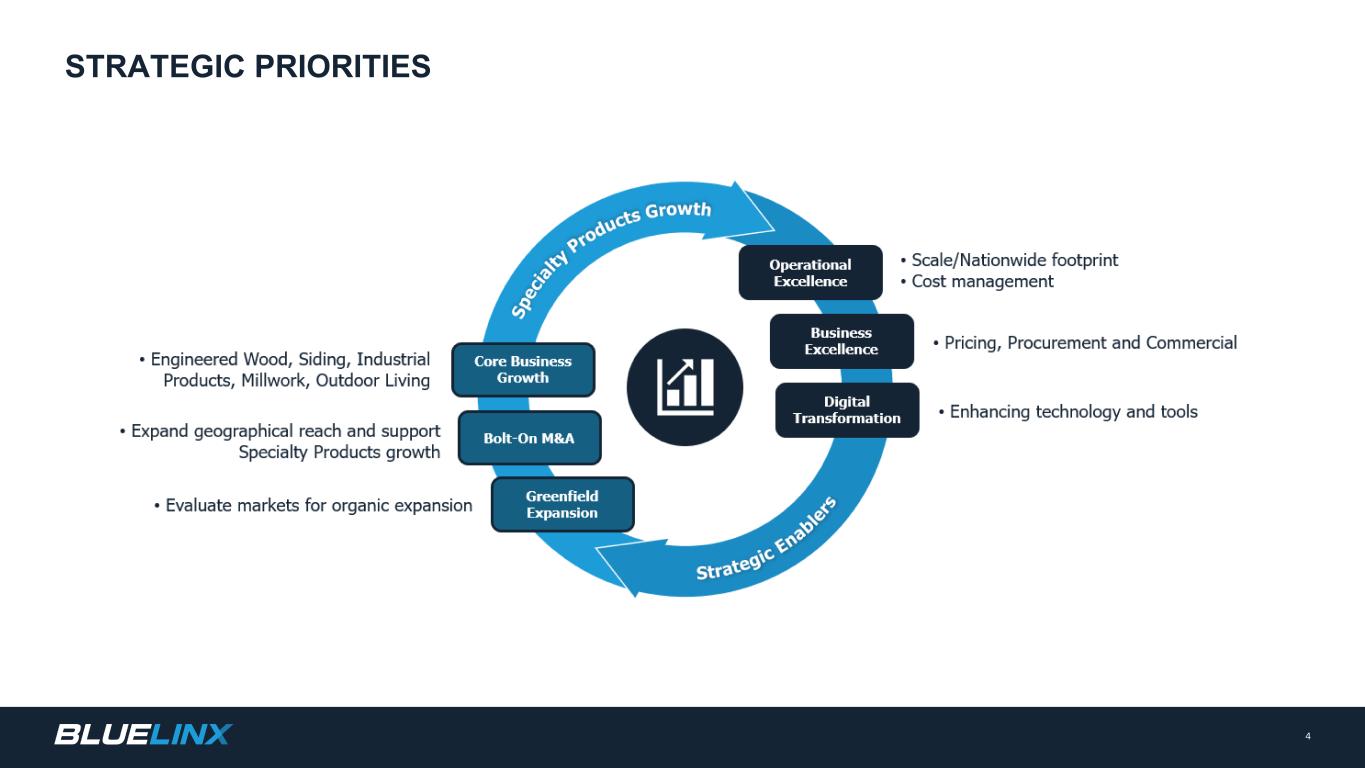
4 STRATEGIC PRIORITIES
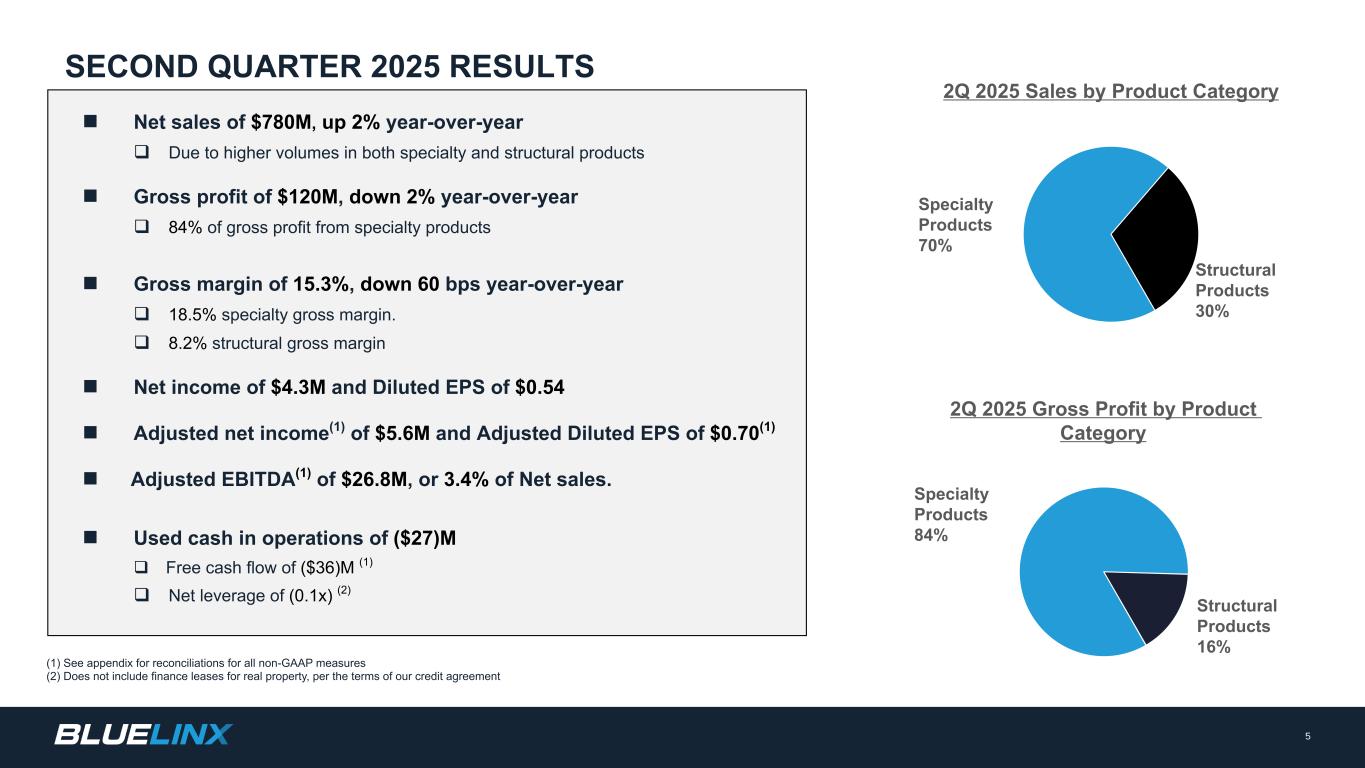
n Net sales of $780M, up 2% year-over-year q Due to higher volumes in both specialty and structural products n Gross profit of $120M, down 2% year-over-year q 84% of gross profit from specialty products n Gross margin of 15.3%, down 60 bps year-over-year q 18.5% specialty gross margin. q 8.2% structural gross margin n Net income of $4.3M and Diluted EPS of $0.54 n Adjusted net income(1) of $5.6M and Adjusted Diluted EPS of $0.70(1) n Adjusted EBITDA(1) of $26.8M, or 3.4% of Net sales. n Used cash in operations of ($27)M q Free cash flow of ($36)M (1) q Net leverage of (0.1x) (2) (1) See appendix for reconciliations for all non-GAAP measures (2) Does not include finance leases for real property, per the terms of our credit agreement Explosive profitable growth with a highly engaged team 5 SECOND QUARTER 2025 RESULTS 2Q 2025 Sales by Product Category Specialty Products 70% Structural Products 30% 2Q 2025 Gross Profit by Product Category Specialty Products 84% Structural Products 16%
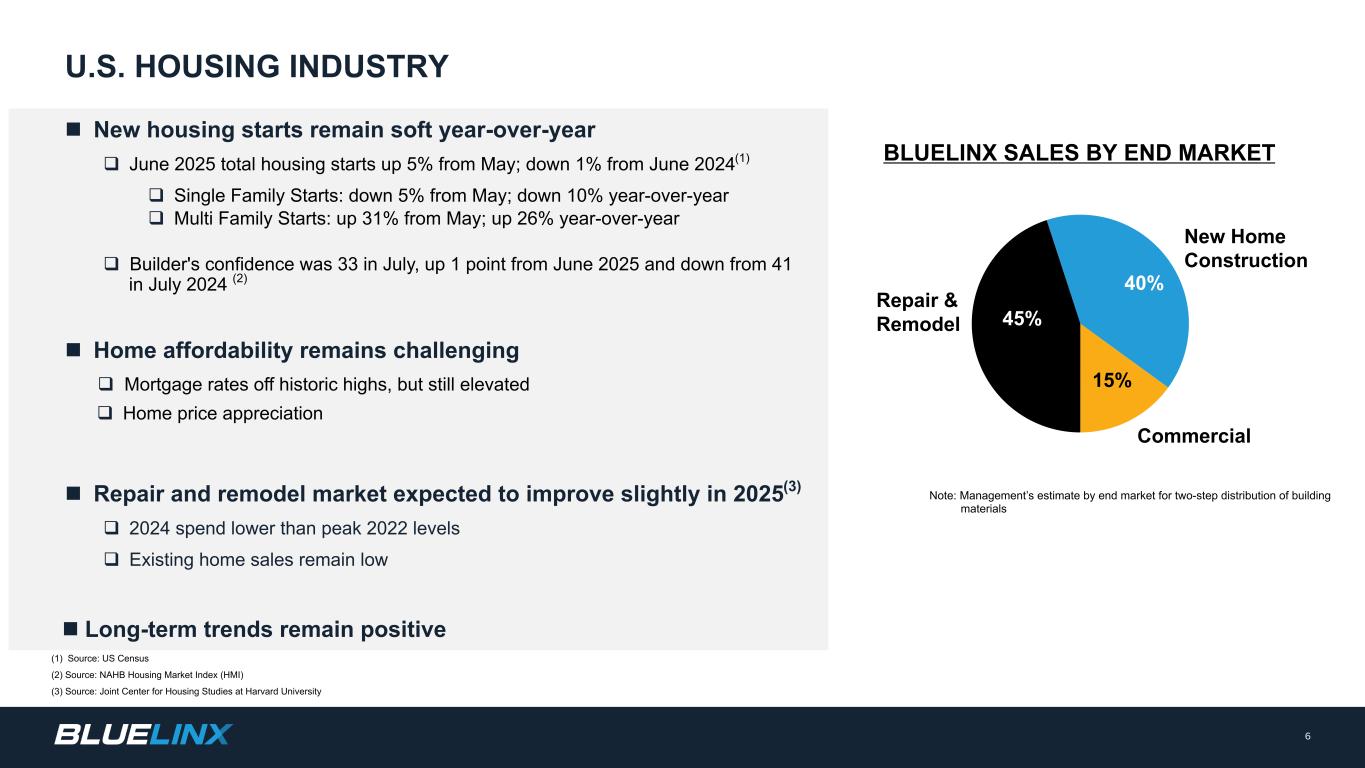
n New housing starts remain soft year-over-year q June 2025 total housing starts up 5% from May; down 1% from June 2024(1) q Single Family Starts: down 5% from May; down 10% year-over-year q Multi Family Starts: up 31% from May; up 26% year-over-year q Builder's confidence was 33 in July, up 1 point from June 2025 and down from 41 in July 2024 (2) n Home affordability remains challenging q Mortgage rates off historic highs, but still elevated q Home price appreciation n Repair and remodel market expected to improve slightly in 2025(3) q 2024 spend lower than peak 2022 levels q Existing home sales remain low n Long-term trends remain positive Note: Management’s estimate by end market for two-step distribution of building materials (1) Source: US Census (2) Source: NAHB Housing Market Index (HMI) (3) Source: Joint Center for Housing Studies at Harvard University 6 U.S. HOUSING INDUSTRY BLUELINX SALES BY END MARKET Repair & Remodel 45% New Home Construction 40% Commercial 15%
Financial Review 7 Kelly Wall SVP, Chief Financial Officer and Treasurer
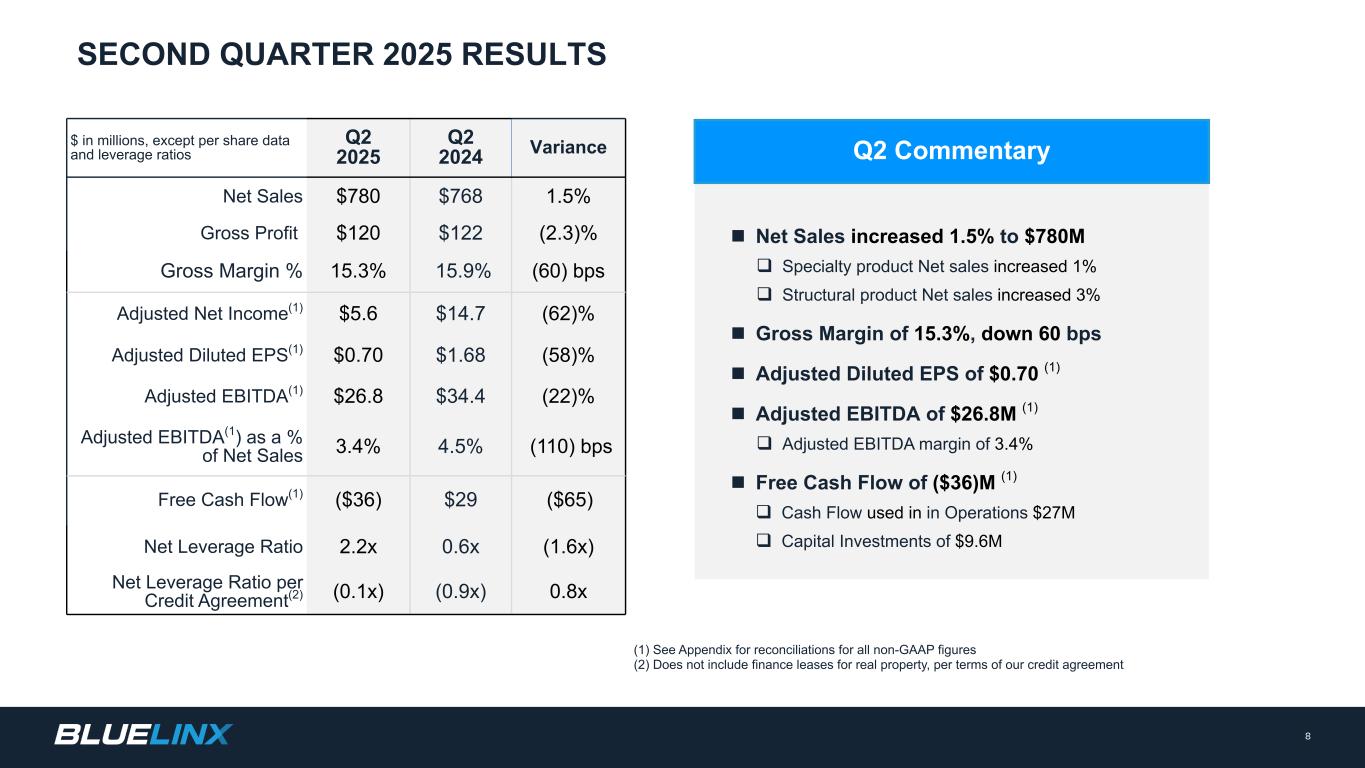
n Net Sales increased 1.5% to $780M q Specialty product Net sales increased 1% q Structural product Net sales increased 3% n Gross Margin of 15.3%, down 60 bps n Adjusted Diluted EPS of $0.70 (1) n Adjusted EBITDA of $26.8M (1) q Adjusted EBITDA margin of 3.4% n Free Cash Flow of ($36)M (1) q Cash Flow used in in Operations $27M q Capital Investments of $9.6M 8 SECOND QUARTER 2025 RESULTS (1) See Appendix for reconciliations for all non-GAAP figures (2) Does not include finance leases for real property, per terms of our credit agreement Q2 Commentary$ in millions, except per share data and leverage ratios Q2 2025 Q2 2024 Variance Net Sales $780 $768 1.5% Gross Profit $120 $122 (2.3)% Gross Margin % 15.3% 15.9% (60) bps Adjusted Net Income(1) $5.6 $14.7 (62)% Adjusted Diluted EPS(1) $0.70 $1.68 (58)% Adjusted EBITDA(1) $26.8 $34.4 (22)% Adjusted EBITDA(1) as a % of Net Sales 3.4% 4.5% (110) bps Free Cash Flow(1) ($36) $29 ($65) Net Leverage Ratio 2.2x 0.6x (1.6x) Net Leverage Ratio per Credit Agreement(2) (0.1x) (0.9x) 0.8x
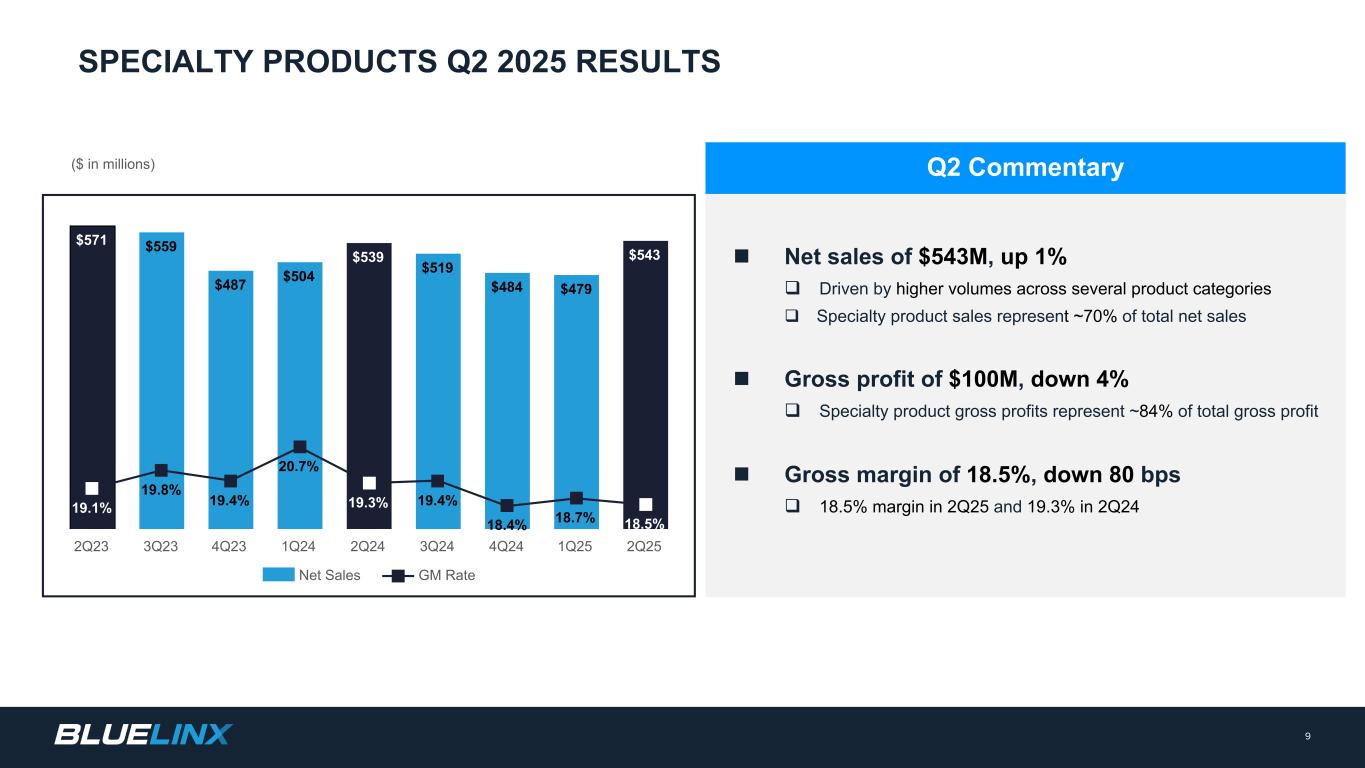
($ in millions) n Net sales of $543M, up 1% q Driven by higher volumes across several product categories q Specialty product sales represent ~70% of total net sales n Gross profit of $100M, down 4% q Specialty product gross profits represent ~84% of total gross profit n Gross margin of 18.5%, down 80 bps q 18.5% margin in 2Q25 and 19.3% in 2Q24 Q2 Commentary 9 SPECIALTY PRODUCTS Q2 2025 RESULTS $571 $559 $487 $504 $539 $519 $484 $479 $543 19.1% 19.8% 19.4% 20.7% 19.3% 19.4% 18.4% 18.7% 18.5% Net Sales GM Rate 2Q23 3Q23 4Q23 1Q24 2Q24 3Q24 4Q24 1Q25 2Q25
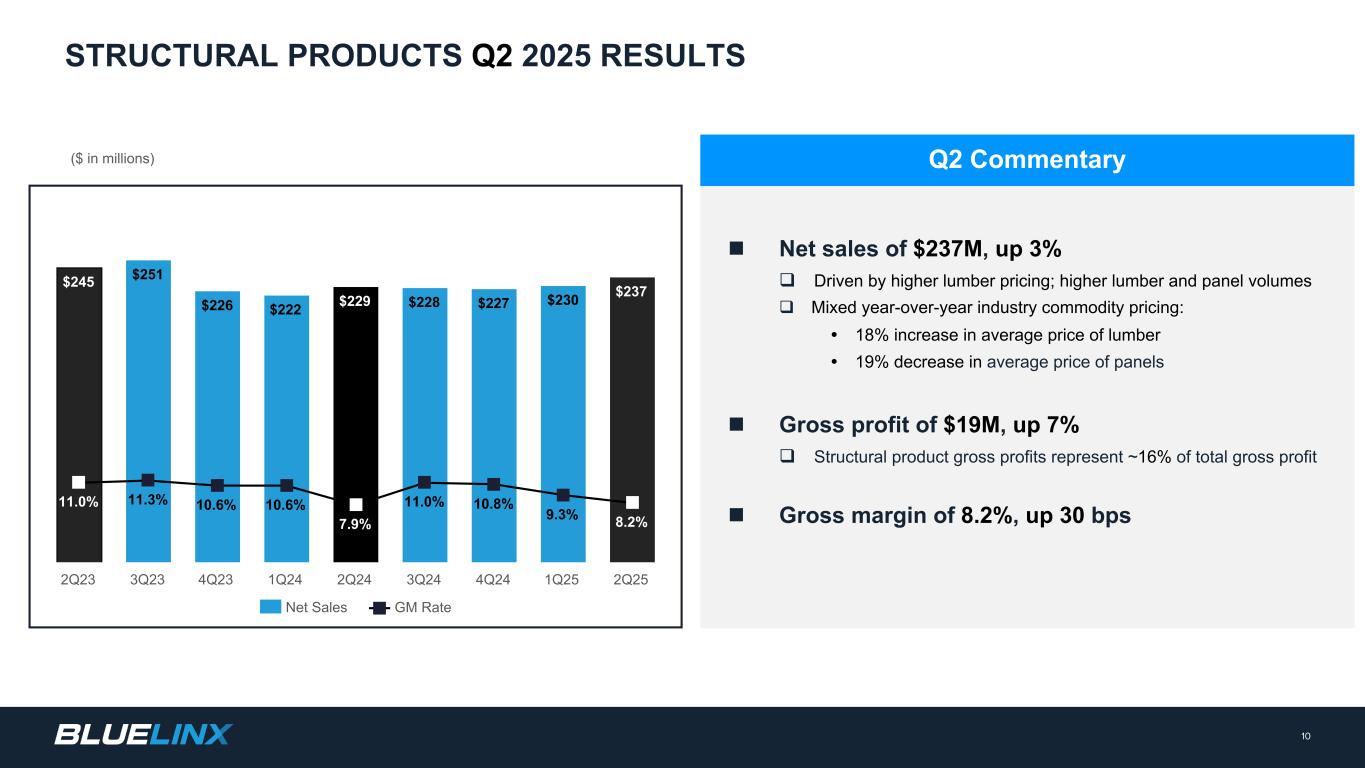
($ in millions) n Net sales of $237M, up 3% q Driven by higher lumber pricing; higher lumber and panel volumes q Mixed year-over-year industry commodity pricing: Ÿ 18% increase in average price of lumber Ÿ 19% decrease in average price of panels n Gross profit of $19M, up 7% q Structural product gross profits represent ~16% of total gross profit n Gross margin of 8.2%, up 30 bps Q2 Commentary 10 STRUCTURAL PRODUCTS Q2 2025 RESULTS $245 $251 $226 $222 $229 $228 $227 $230 $237 11.0% 11.3% 10.6% 10.6% 7.9% 11.0% 10.8% 9.3% 8.2% Net Sales GM Rate 2Q23 3Q23 4Q23 1Q24 2Q24 3Q24 4Q24 1Q25 2Q25
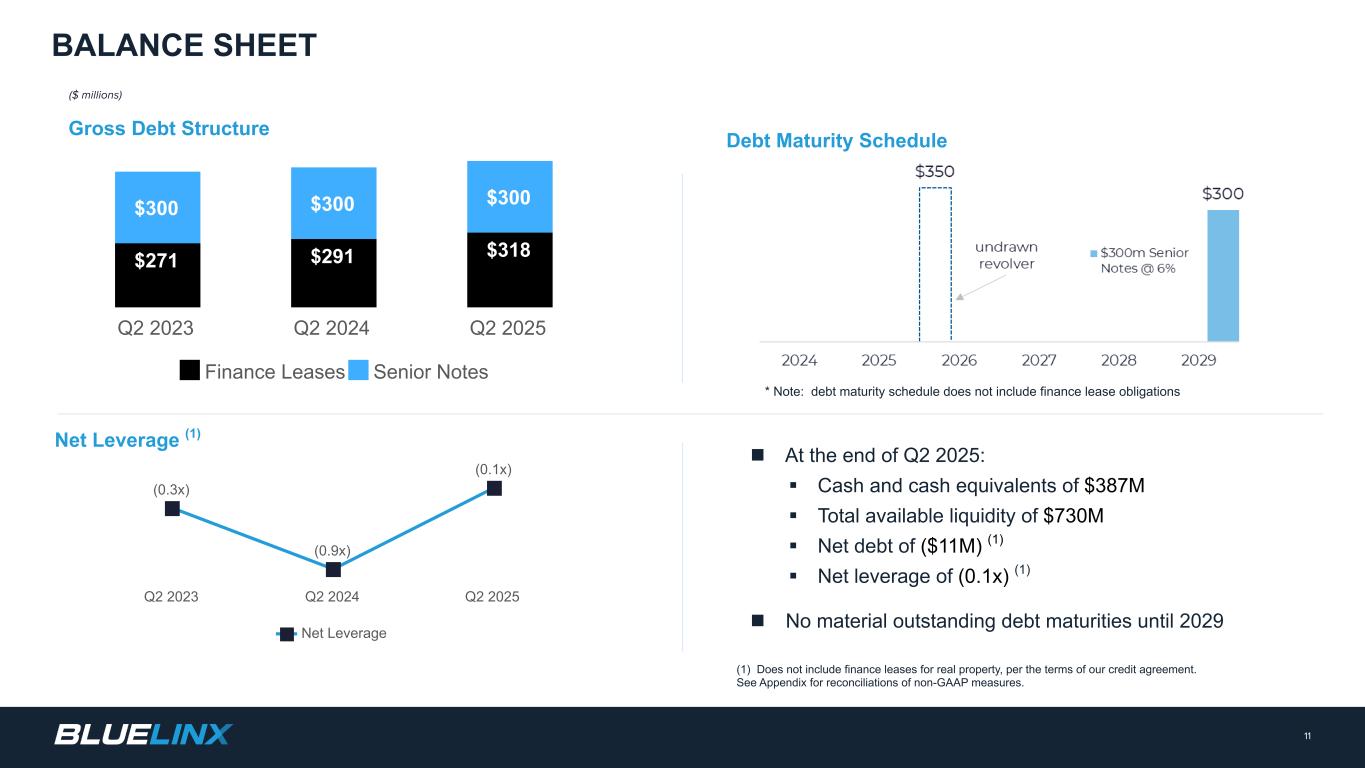
(1) Does not include finance leases for real property, per the terms of our credit agreement. See Appendix for reconciliations of non-GAAP measures. n At the end of Q2 2025: § Cash and cash equivalents of $387M § Total available liquidity of $730M § Net debt of ($11M) (1) § Net leverage of (0.1x) (1) n No material outstanding debt maturities until 2029 ($ millions) Debt Maturity Schedule * Note: debt maturity schedule does not include finance lease obligations Net Leverage (1) 11 BALANCE SHEET $300 $271 $291 $318 $300 $300 $300 Finance Leases Senior Notes Q2 2023 Q2 2024 Q2 2025 (0.3x) (0.9x) (0.1x) Net Leverage Q2 2023 Q2 2024 Q2 2025 Gross Debt Structure
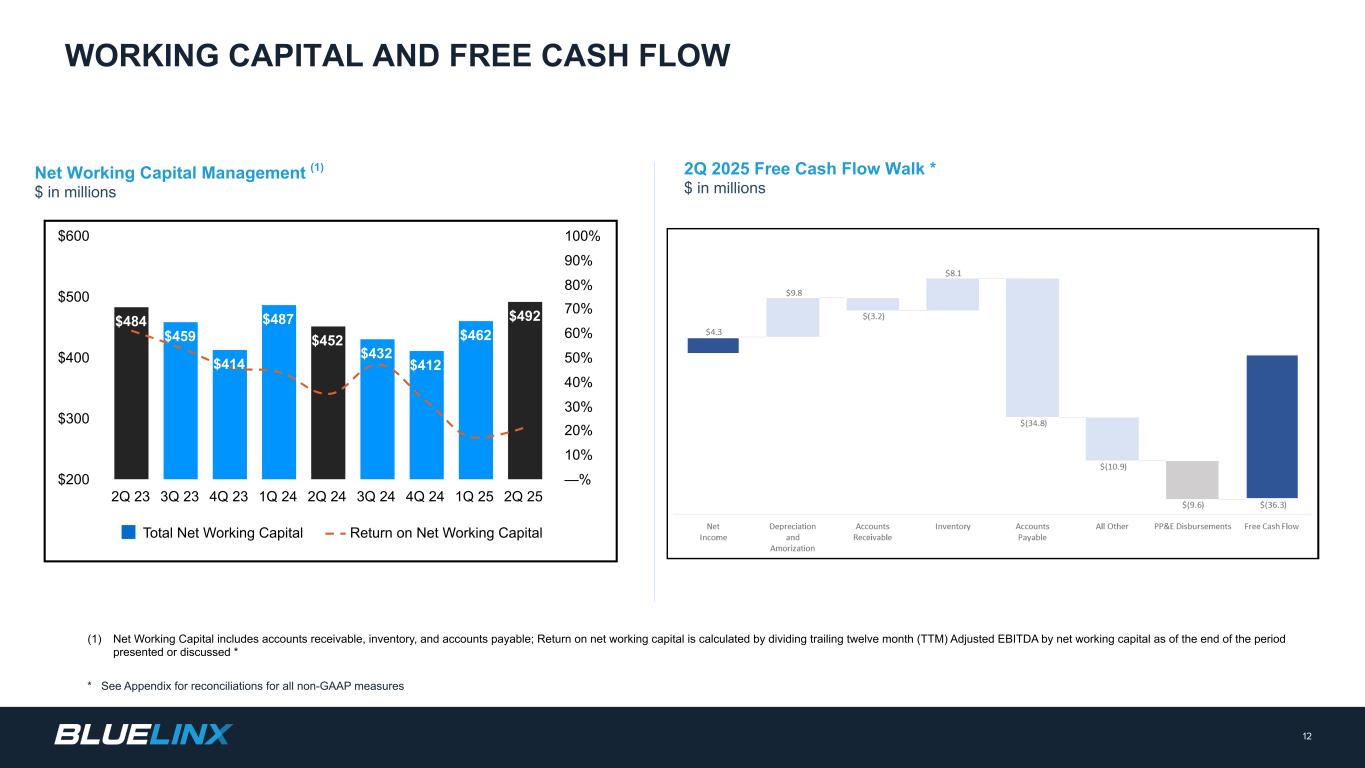
2Q 2025 Free Cash Flow Walk * $ in millions Net Working Capital Management (1) $ in millions * See Appendix for reconciliations for all non-GAAP measures (1) Net Working Capital includes accounts receivable, inventory, and accounts payable; Return on net working capital is calculated by dividing trailing twelve month (TTM) Adjusted EBITDA by net working capital as of the end of the period presented or discussed * 12 WORKING CAPITAL AND FREE CASH FLOW $484 $459 $414 $487 $452 $432 $412 $462 $492 Total Net Working Capital Return on Net Working Capital 2Q 23 3Q 23 4Q 23 1Q 24 2Q 24 3Q 24 4Q 24 1Q 25 2Q 25 $200 $300 $400 $500 $600 —% 10% 20% 30% 40% 50% 60% 70% 80% 90% 100%
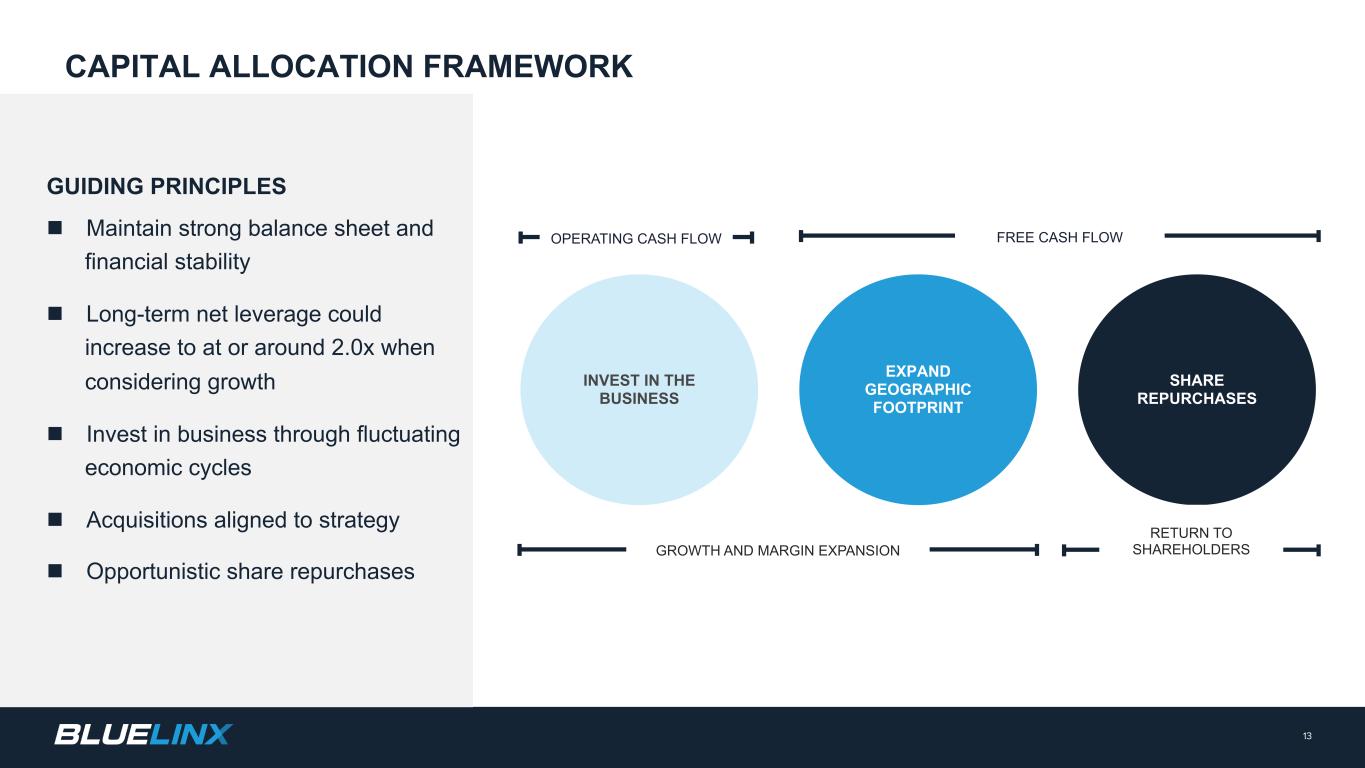
INVEST IN THE BUSINESS EXPAND GEOGRAPHIC FOOTPRINT SHARE REPURCHASES OPERATING CASH FLOW GUIDING PRINCIPLES n Maintain strong balance sheet and financial stability n Long-term net leverage could increase to at or around 2.0x when considering growth n Invest in business through fluctuating economic cycles n Acquisitions aligned to strategy n Opportunistic share repurchases FREE CASH FLOW RETURN TO SHAREHOLDERSGROWTH AND MARGIN EXPANSION 13 CAPITAL ALLOCATION FRAMEWORK

Q&A 14

Appendix 15
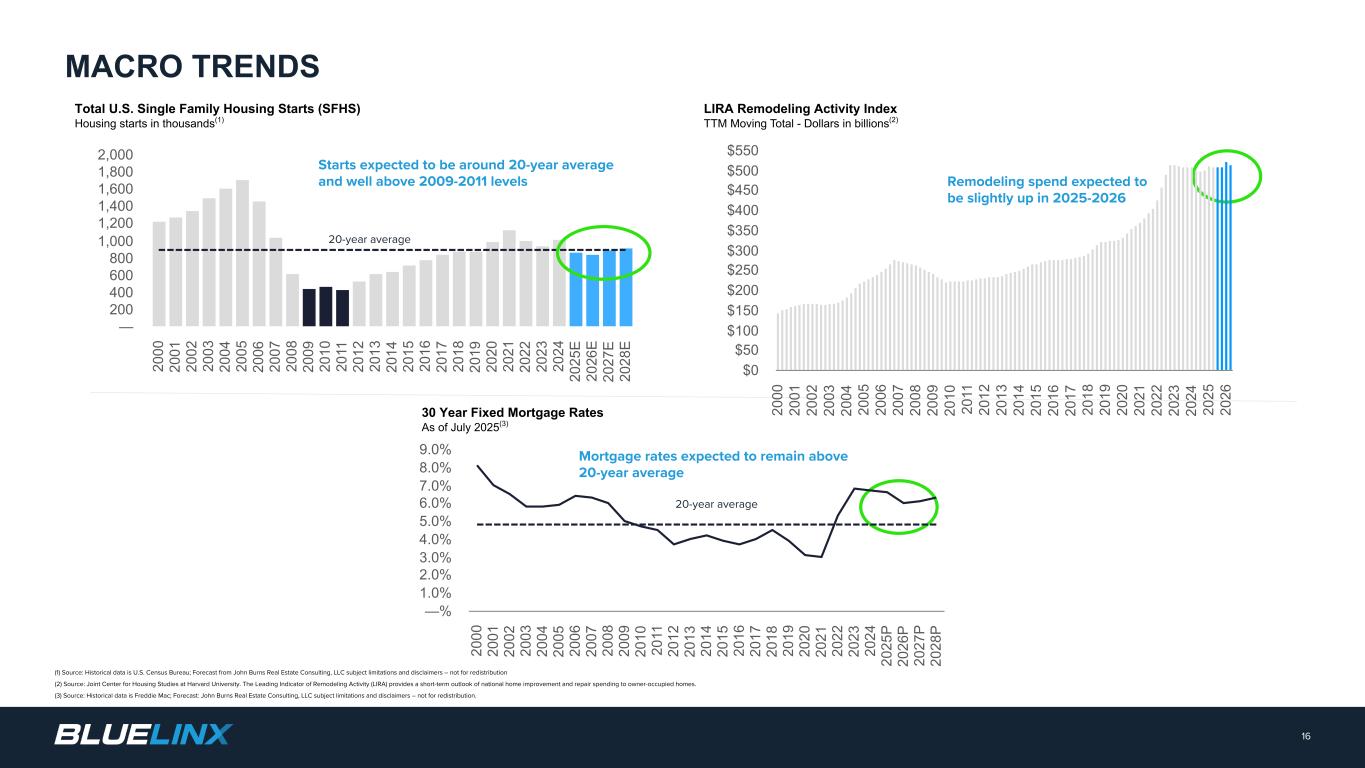
20-year average (1) Source: Historical data is U.S. Census Bureau; Forecast from John Burns Real Estate Consulting, LLC subject limitations and disclaimers – not for redistribution (2) Source: Joint Center for Housing Studies at Harvard University. The Leading Indicator of Remodeling Activity (LIRA) provides a short-term outlook of national home improvement and repair spending to owner-occupied homes. (3) Source: Historical data is Freddie Mac; Forecast: John Burns Real Estate Consulting, LLC subject limitations and disclaimers – not for redistribution. Mortgage rates expected to remain above 20-year average Starts expected to be around 20-year average and well above 2009-2011 levels 16 MACRO TRENDS Remodeling spend expected to be slightly up in 2025-2026 20-year average 20 00 20 01 20 02 20 03 20 04 20 05 20 06 20 07 20 08 20 09 20 10 20 11 20 12 20 13 20 14 20 15 20 16 20 17 20 18 20 19 20 20 20 21 20 22 20 23 20 24 20 25 E 20 26 E 20 27 E 20 28 E — 200 400 600 800 1,000 1,200 1,400 1,600 1,800 2,000 Total U.S. Single Family Housing Starts (SFHS) Housing starts in thousands(1) 20 00 20 01 20 02 20 03 20 04 20 05 20 06 20 07 20 08 20 09 20 10 20 11 20 12 20 13 20 14 20 15 20 16 20 17 20 18 20 19 20 20 20 21 20 22 20 23 20 24 20 25 20 26 $0 $50 $100 $150 $200 $250 $300 $350 $400 $450 $500 $550 LIRA Remodeling Activity Index TTM Moving Total - Dollars in billions(2) 20 00 20 01 20 02 20 03 20 04 20 05 20 06 20 07 20 08 20 09 20 10 20 11 20 12 20 13 20 14 20 15 20 16 20 17 20 18 20 19 20 20 20 21 20 22 20 23 20 24 20 25 P 20 26 P 20 27 P 20 28 P —% 1.0% 2.0% 3.0% 4.0% 5.0% 6.0% 7.0% 8.0% 9.0% 30 Year Fixed Mortgage Rates As of July 2025(3)
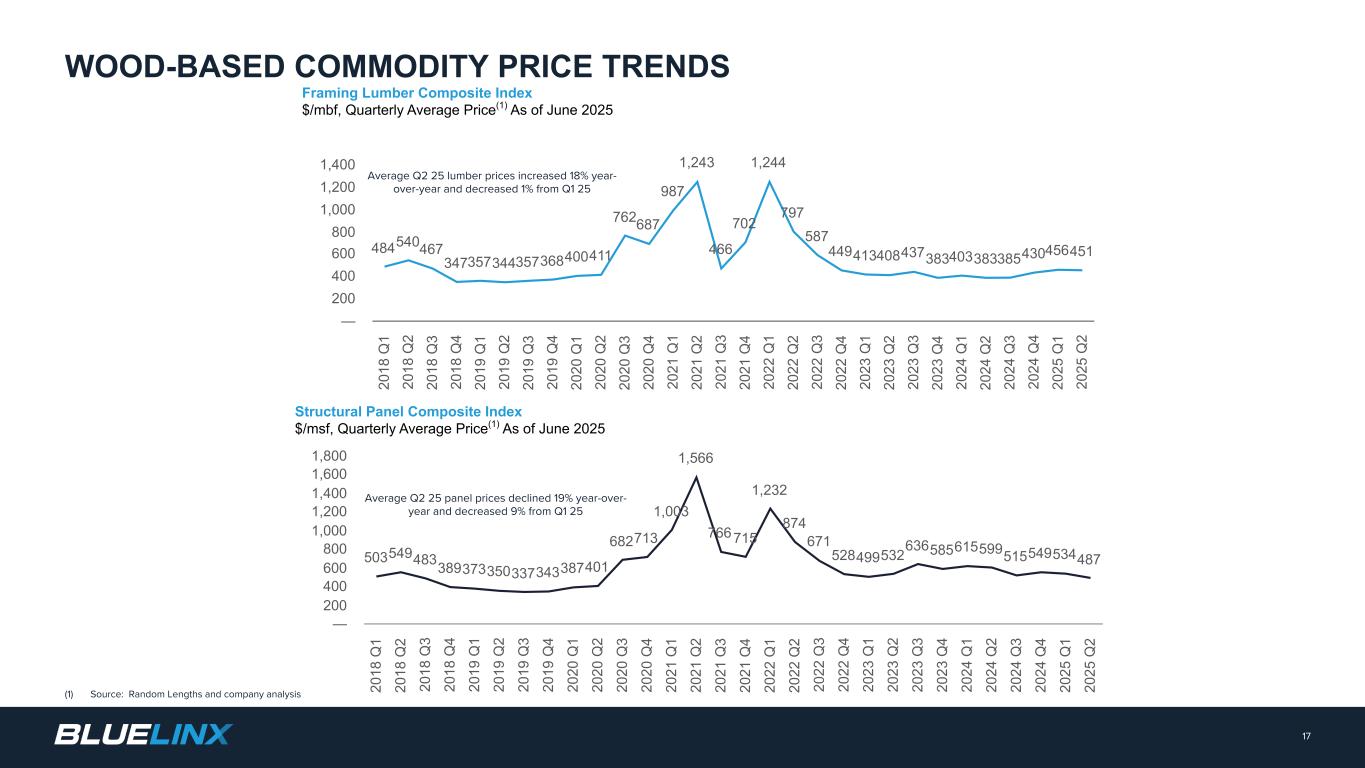
Average Q2 25 lumber prices increased 18% year- over-year and decreased 1% from Q1 25 (1) Source: Random Lengths and company analysis 17 WOOD-BASED COMMODITY PRICE TRENDS Average Q2 25 panel prices declined 19% year-over- year and decreased 9% from Q1 25 484540467 347357344357368400411 762687 987 1,243 466 702 1,244 797 587 449413408437383403383385430456451 20 18 Q 1 20 18 Q 2 20 18 Q 3 20 18 Q 4 20 19 Q 1 20 19 Q 2 20 19 Q 3 20 19 Q 4 20 20 Q 1 20 20 Q 2 20 20 Q 3 20 20 Q 4 20 21 Q 1 20 21 Q 2 20 21 Q 3 20 21 Q 4 20 22 Q 1 20 22 Q 2 20 22 Q 3 20 22 Q 4 20 23 Q 1 20 23 Q 2 20 23 Q 3 20 23 Q 4 20 24 Q 1 20 24 Q 2 20 24 Q 3 20 24 Q 4 20 25 Q 1 20 25 Q 2 — 200 400 600 800 1,000 1,200 1,400 503549483389373350337343387401 682713 1,003 1,566 766715 1,232 874 671 528499532 636585615599515549534487 20 18 Q 1 20 18 Q 2 20 18 Q 3 20 18 Q 4 20 19 Q 1 20 19 Q 2 20 19 Q 3 20 19 Q 4 20 20 Q 1 20 20 Q 2 20 20 Q 3 20 20 Q 4 20 21 Q 1 20 21 Q 2 20 21 Q 3 20 21 Q 4 20 22 Q 1 20 22 Q 2 20 22 Q 3 20 22 Q 4 20 23 Q 1 20 23 Q 2 20 23 Q 3 20 23 Q 4 20 24 Q 1 20 24 Q 2 20 24 Q 3 20 24 Q 4 20 25 Q 1 20 25 Q 2 — 200 400 600 800 1,000 1,200 1,400 1,600 1,800 Framing Lumber Composite Index $/mbf, Quarterly Average Price(1) As of June 2025 Structural Panel Composite Index $/msf, Quarterly Average Price(1) As of June 2025
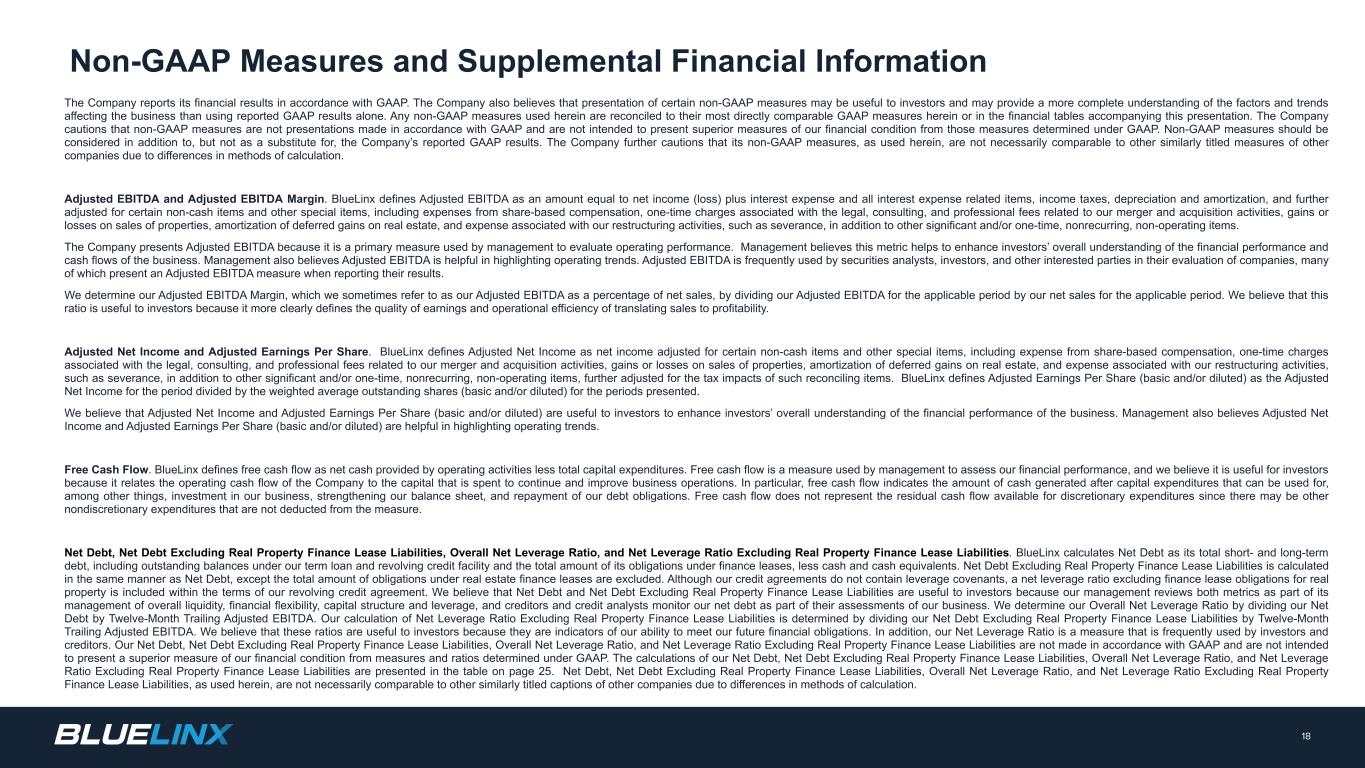
The Company reports its financial results in accordance with GAAP. The Company also believes that presentation of certain non-GAAP measures may be useful to investors and may provide a more complete understanding of the factors and trends affecting the business than using reported GAAP results alone. Any non-GAAP measures used herein are reconciled to their most directly comparable GAAP measures herein or in the financial tables accompanying this presentation. The Company cautions that non-GAAP measures are not presentations made in accordance with GAAP and are not intended to present superior measures of our financial condition from those measures determined under GAAP. Non-GAAP measures should be considered in addition to, but not as a substitute for, the Company’s reported GAAP results. The Company further cautions that its non-GAAP measures, as used herein, are not necessarily comparable to other similarly titled measures of other companies due to differences in methods of calculation. Adjusted EBITDA and Adjusted EBITDA Margin. BlueLinx defines Adjusted EBITDA as an amount equal to net income (loss) plus interest expense and all interest expense related items, income taxes, depreciation and amortization, and further adjusted for certain non-cash items and other special items, including expenses from share-based compensation, one-time charges associated with the legal, consulting, and professional fees related to our merger and acquisition activities, gains or losses on sales of properties, amortization of deferred gains on real estate, and expense associated with our restructuring activities, such as severance, in addition to other significant and/or one-time, nonrecurring, non-operating items. The Company presents Adjusted EBITDA because it is a primary measure used by management to evaluate operating performance. Management believes this metric helps to enhance investors’ overall understanding of the financial performance and cash flows of the business. Management also believes Adjusted EBITDA is helpful in highlighting operating trends. Adjusted EBITDA is frequently used by securities analysts, investors, and other interested parties in their evaluation of companies, many of which present an Adjusted EBITDA measure when reporting their results. We determine our Adjusted EBITDA Margin, which we sometimes refer to as our Adjusted EBITDA as a percentage of net sales, by dividing our Adjusted EBITDA for the applicable period by our net sales for the applicable period. We believe that this ratio is useful to investors because it more clearly defines the quality of earnings and operational efficiency of translating sales to profitability. Adjusted Net Income and Adjusted Earnings Per Share. BlueLinx defines Adjusted Net Income as net income adjusted for certain non-cash items and other special items, including expense from share-based compensation, one-time charges associated with the legal, consulting, and professional fees related to our merger and acquisition activities, gains or losses on sales of properties, amortization of deferred gains on real estate, and expense associated with our restructuring activities, such as severance, in addition to other significant and/or one-time, nonrecurring, non-operating items, further adjusted for the tax impacts of such reconciling items. BlueLinx defines Adjusted Earnings Per Share (basic and/or diluted) as the Adjusted Net Income for the period divided by the weighted average outstanding shares (basic and/or diluted) for the periods presented. We believe that Adjusted Net Income and Adjusted Earnings Per Share (basic and/or diluted) are useful to investors to enhance investors’ overall understanding of the financial performance of the business. Management also believes Adjusted Net Income and Adjusted Earnings Per Share (basic and/or diluted) are helpful in highlighting operating trends. Free Cash Flow. BlueLinx defines free cash flow as net cash provided by operating activities less total capital expenditures. Free cash flow is a measure used by management to assess our financial performance, and we believe it is useful for investors because it relates the operating cash flow of the Company to the capital that is spent to continue and improve business operations. In particular, free cash flow indicates the amount of cash generated after capital expenditures that can be used for, among other things, investment in our business, strengthening our balance sheet, and repayment of our debt obligations. Free cash flow does not represent the residual cash flow available for discretionary expenditures since there may be other nondiscretionary expenditures that are not deducted from the measure. Net Debt, Net Debt Excluding Real Property Finance Lease Liabilities, Overall Net Leverage Ratio, and Net Leverage Ratio Excluding Real Property Finance Lease Liabilities. BlueLinx calculates Net Debt as its total short- and long-term debt, including outstanding balances under our term loan and revolving credit facility and the total amount of its obligations under finance leases, less cash and cash equivalents. Net Debt Excluding Real Property Finance Lease Liabilities is calculated in the same manner as Net Debt, except the total amount of obligations under real estate finance leases are excluded. Although our credit agreements do not contain leverage covenants, a net leverage ratio excluding finance lease obligations for real property is included within the terms of our revolving credit agreement. We believe that Net Debt and Net Debt Excluding Real Property Finance Lease Liabilities are useful to investors because our management reviews both metrics as part of its management of overall liquidity, financial flexibility, capital structure and leverage, and creditors and credit analysts monitor our net debt as part of their assessments of our business. We determine our Overall Net Leverage Ratio by dividing our Net Debt by Twelve-Month Trailing Adjusted EBITDA. Our calculation of Net Leverage Ratio Excluding Real Property Finance Lease Liabilities is determined by dividing our Net Debt Excluding Real Property Finance Lease Liabilities by Twelve-Month Trailing Adjusted EBITDA. We believe that these ratios are useful to investors because they are indicators of our ability to meet our future financial obligations. In addition, our Net Leverage Ratio is a measure that is frequently used by investors and creditors. Our Net Debt, Net Debt Excluding Real Property Finance Lease Liabilities, Overall Net Leverage Ratio, and Net Leverage Ratio Excluding Real Property Finance Lease Liabilities are not made in accordance with GAAP and are not intended to present a superior measure of our financial condition from measures and ratios determined under GAAP. The calculations of our Net Debt, Net Debt Excluding Real Property Finance Lease Liabilities, Overall Net Leverage Ratio, and Net Leverage Ratio Excluding Real Property Finance Lease Liabilities are presented in the table on page 25. Net Debt, Net Debt Excluding Real Property Finance Lease Liabilities, Overall Net Leverage Ratio, and Net Leverage Ratio Excluding Real Property Finance Lease Liabilities, as used herein, are not necessarily comparable to other similarly titled captions of other companies due to differences in methods of calculation. 18 Non-GAAP Measures and Supplemental Financial Information
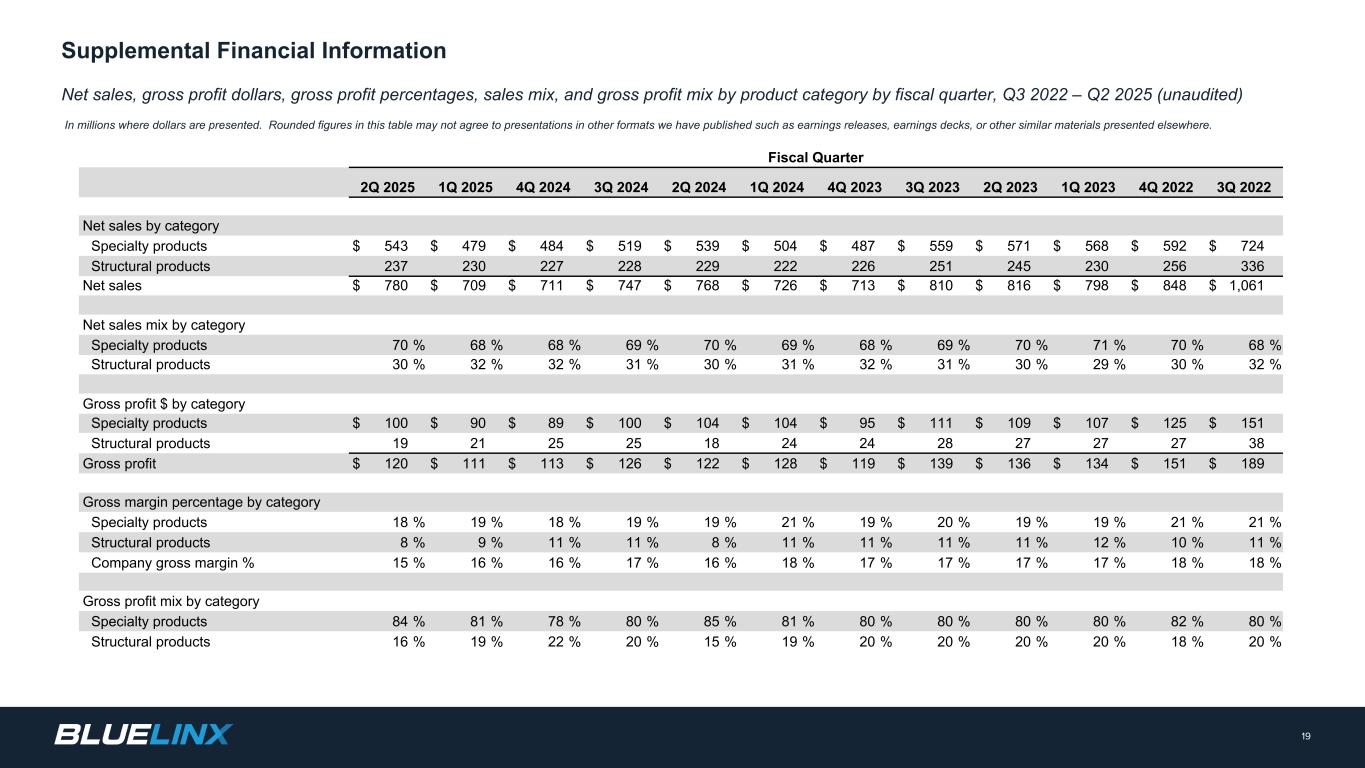
Supplemental Financial Information Net sales, gross profit dollars, gross profit percentages, sales mix, and gross profit mix by product category by fiscal quarter, Q3 2022 – Q2 2025 (unaudited) In millions where dollars are presented. Rounded figures in this table may not agree to presentations in other formats we have published such as earnings releases, earnings decks, or other similar materials presented elsewhere. 19 Supplementary Financial Information Fiscal Quarter 2Q 2025 1Q 2025 4Q 2024 3Q 2024 2Q 2024 1Q 2024 4Q 2023 3Q 2023 2Q 2023 1Q 2023 4Q 2022 3Q 2022 Net sales by category Specialty products $ 543 $ 479 $ 484 $ 519 $ 539 $ 504 $ 487 $ 559 $ 571 $ 568 $ 592 $ 724 Structural products 237 230 227 228 229 222 226 251 245 230 256 336 Net sales $ 780 $ 709 $ 711 $ 747 $ 768 $ 726 $ 713 $ 810 $ 816 $ 798 $ 848 $ 1,061 Net sales mix by category Specialty products 70 % 68 % 68 % 69 % 70 % 69 % 68 % 69 % 70 % 71 % 70 % 68 % Structural products 30 % 32 % 32 % 31 % 30 % 31 % 32 % 31 % 30 % 29 % 30 % 32 % Gross profit $ by category Specialty products $ 100 $ 90 $ 89 $ 100 $ 104 $ 104 $ 95 $ 111 $ 109 $ 107 $ 125 $ 151 Structural products 19 21 25 25 18 24 24 28 27 27 27 38 Gross profit $ 120 $ 111 $ 113 $ 126 $ 122 $ 128 $ 119 $ 139 $ 136 $ 134 $ 151 $ 189 Gross margin percentage by category Specialty products 18 % 19 % 18 % 19 % 19 % 21 % 19 % 20 % 19 % 19 % 21 % 21 % Structural products 8 % 9 % 11 % 11 % 8 % 11 % 11 % 11 % 11 % 12 % 10 % 11 % Company gross margin % 15 % 16 % 16 % 17 % 16 % 18 % 17 % 17 % 17 % 17 % 18 % 18 % Gross profit mix by category Specialty products 84 % 81 % 78 % 80 % 85 % 81 % 80 % 80 % 80 % 80 % 82 % 80 % Structural products 16 % 19 % 22 % 20 % 15 % 19 % 20 % 20 % 20 % 20 % 18 % 20 %
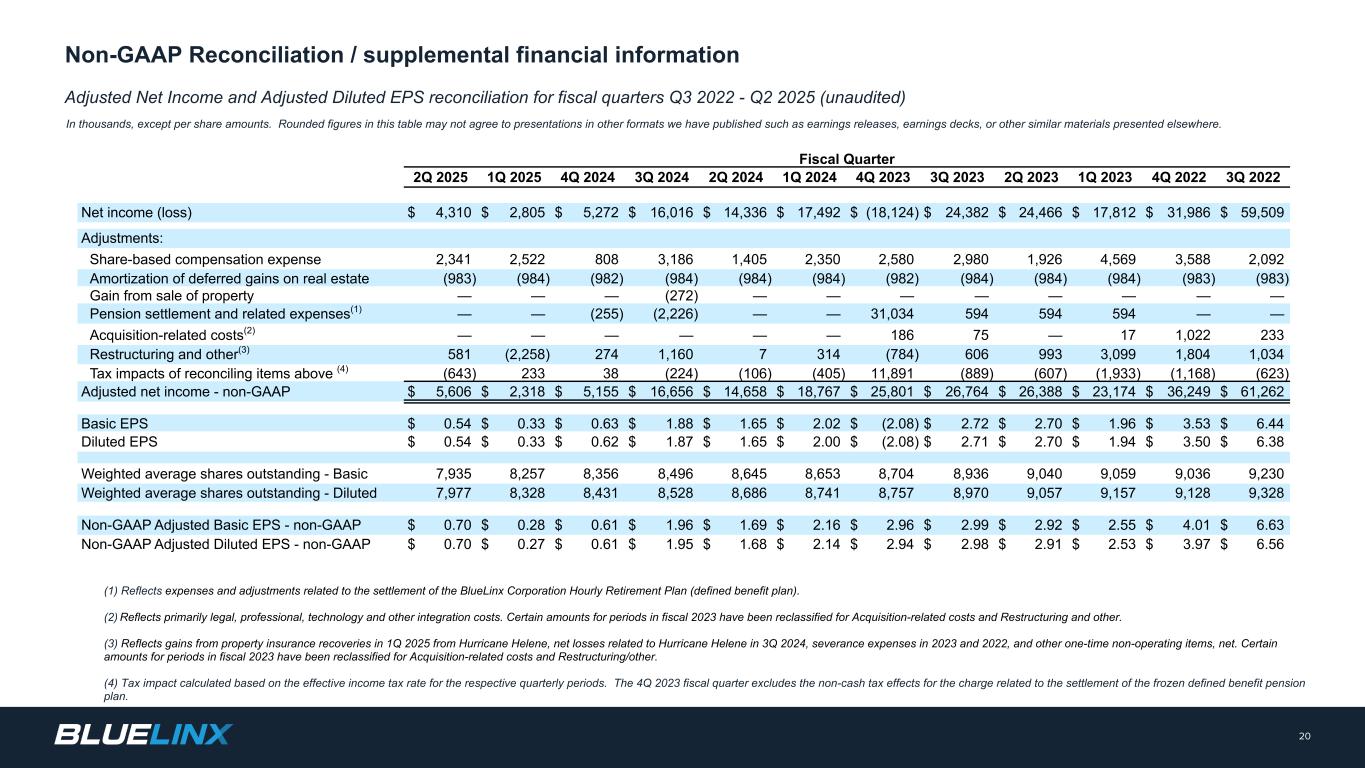
Adjusted Net Income and Adjusted Diluted EPS reconciliation for fiscal quarters Q3 2022 - Q2 2025 (unaudited) In thousands, except per share amounts. Rounded figures in this table may not agree to presentations in other formats we have published such as earnings releases, earnings decks, or other similar materials presented elsewhere. 20 Non-GAAP Reconciliation / supplemental financial information (1) Reflects expenses and adjustments related to the settlement of the BlueLinx Corporation Hourly Retirement Plan (defined benefit plan). (2) Reflects primarily legal, professional, technology and other integration costs. Certain amounts for periods in fiscal 2023 have been reclassified for Acquisition-related costs and Restructuring and other. (3) Reflects gains from property insurance recoveries in 1Q 2025 from Hurricane Helene, net losses related to Hurricane Helene in 3Q 2024, severance expenses in 2023 and 2022, and other one-time non-operating items, net. Certain amounts for periods in fiscal 2023 have been reclassified for Acquisition-related costs and Restructuring/other. (4) Tax impact calculated based on the effective income tax rate for the respective quarterly periods. The 4Q 2023 fiscal quarter excludes the non-cash tax effects for the charge related to the settlement of the frozen defined benefit pension plan. Fiscal Quarter 2Q 2025 1Q 2025 4Q 2024 3Q 2024 2Q 2024 1Q 2024 4Q 2023 3Q 2023 2Q 2023 1Q 2023 4Q 2022 3Q 2022 Net income (loss) $ 4,310 $ 2,805 $ 5,272 $ 16,016 $ 14,336 $ 17,492 $ (18,124) $ 24,382 $ 24,466 $ 17,812 $ 31,986 $ 59,509 Adjustments: Share-based compensation expense 2,341 2,522 808 3,186 1,405 2,350 2,580 2,980 1,926 4,569 3,588 2,092 Amortization of deferred gains on real estate (983) (984) (982) (984) (984) (984) (982) (984) (984) (984) (983) (983) Gain from sale of property — — — (272) — — — — — — — — Pension settlement and related expenses(1) — — (255) (2,226) — — 31,034 594 594 594 — — Acquisition-related costs(2) — — — — — — 186 75 — 17 1,022 233 Restructuring and other(3) 581 (2,258) 274 1,160 7 314 (784) 606 993 3,099 1,804 1,034 Tax impacts of reconciling items above (4) (643) 233 38 (224) (106) (405) 11,891 (889) (607) (1,933) (1,168) (623) Adjusted net income - non-GAAP $ 5,606 $ 2,318 $ 5,155 $ 16,656 $ 14,658 $ 18,767 $ 25,801 $ 26,764 $ 26,388 $ 23,174 $ 36,249 $ 61,262 Basic EPS $ 0.54 $ 0.33 $ 0.63 $ 1.88 $ 1.65 $ 2.02 $ (2.08) $ 2.72 $ 2.70 $ 1.96 $ 3.53 $ 6.44 Diluted EPS $ 0.54 $ 0.33 $ 0.62 $ 1.87 $ 1.65 $ 2.00 $ (2.08) $ 2.71 $ 2.70 $ 1.94 $ 3.50 $ 6.38 Weighted average shares outstanding - Basic 7,935 8,257 8,356 8,496 8,645 8,653 8,704 8,936 9,040 9,059 9,036 9,230 Weighted average shares outstanding - Diluted 7,977 8,328 8,431 8,528 8,686 8,741 8,757 8,970 9,057 9,157 9,128 9,328 Non-GAAP Adjusted Basic EPS - non-GAAP $ 0.70 $ 0.28 $ 0.61 $ 1.96 $ 1.69 $ 2.16 $ 2.96 $ 2.99 $ 2.92 $ 2.55 $ 4.01 $ 6.63 Non-GAAP Adjusted Diluted EPS - non-GAAP $ 0.70 $ 0.27 $ 0.61 $ 1.95 $ 1.68 $ 2.14 $ 2.94 $ 2.98 $ 2.91 $ 2.53 $ 3.97 $ 6.56
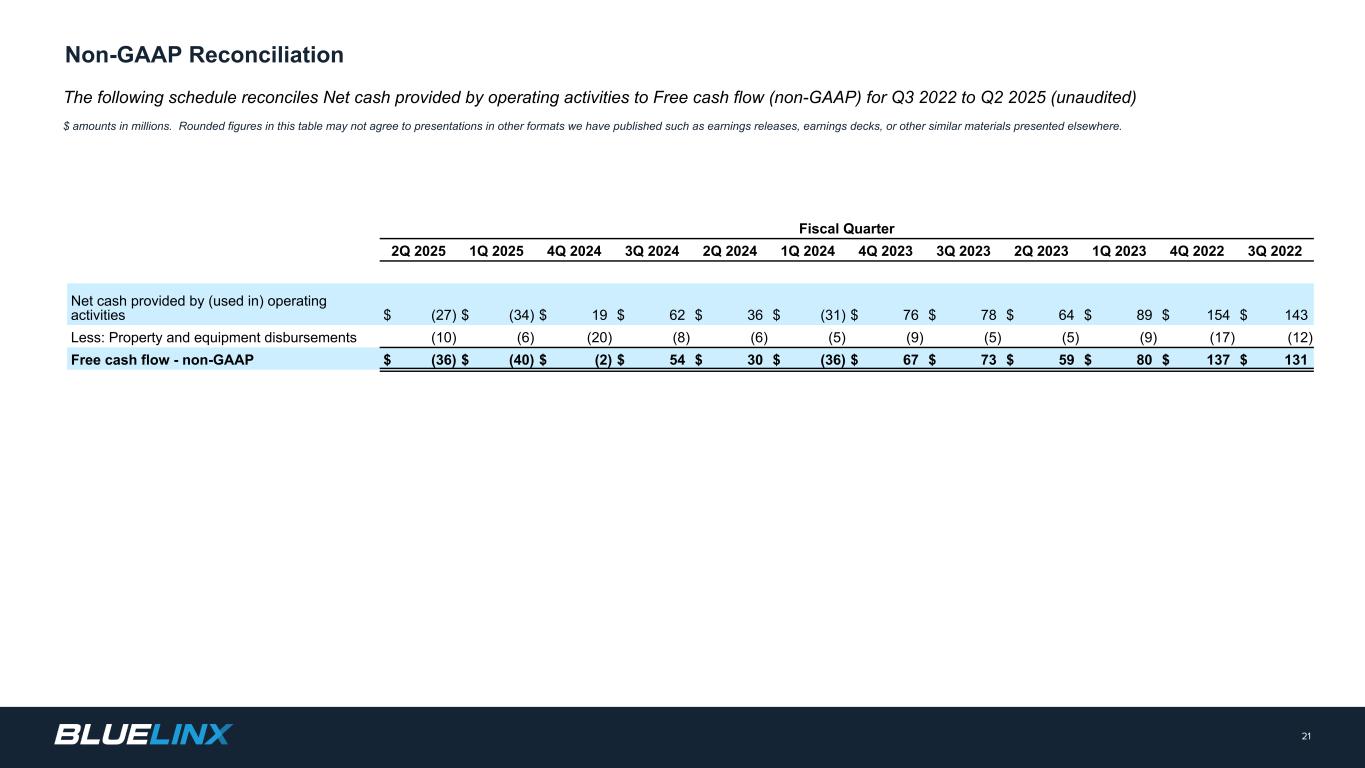
The following schedule reconciles Net cash provided by operating activities to Free cash flow (non-GAAP) for Q3 2022 to Q2 2025 (unaudited) $ amounts in millions. Rounded figures in this table may not agree to presentations in other formats we have published such as earnings releases, earnings decks, or other similar materials presented elsewhere. 21 Non-GAAP Reconciliation Fiscal Quarter 2Q 2025 1Q 2025 4Q 2024 3Q 2024 2Q 2024 1Q 2024 4Q 2023 3Q 2023 2Q 2023 1Q 2023 4Q 2022 3Q 2022 Net cash provided by (used in) operating activities $ (27) $ (34) $ 19 $ 62 $ 36 $ (31) $ 76 $ 78 $ 64 $ 89 $ 154 $ 143 Less: Property and equipment disbursements (10) (6) (20) (8) (6) (5) (9) (5) (5) (9) (17) (12) Free cash flow - non-GAAP $ (36) $ (40) $ (2) $ 54 $ 30 $ (36) $ 67 $ 73 $ 59 $ 80 $ 137 $ 131
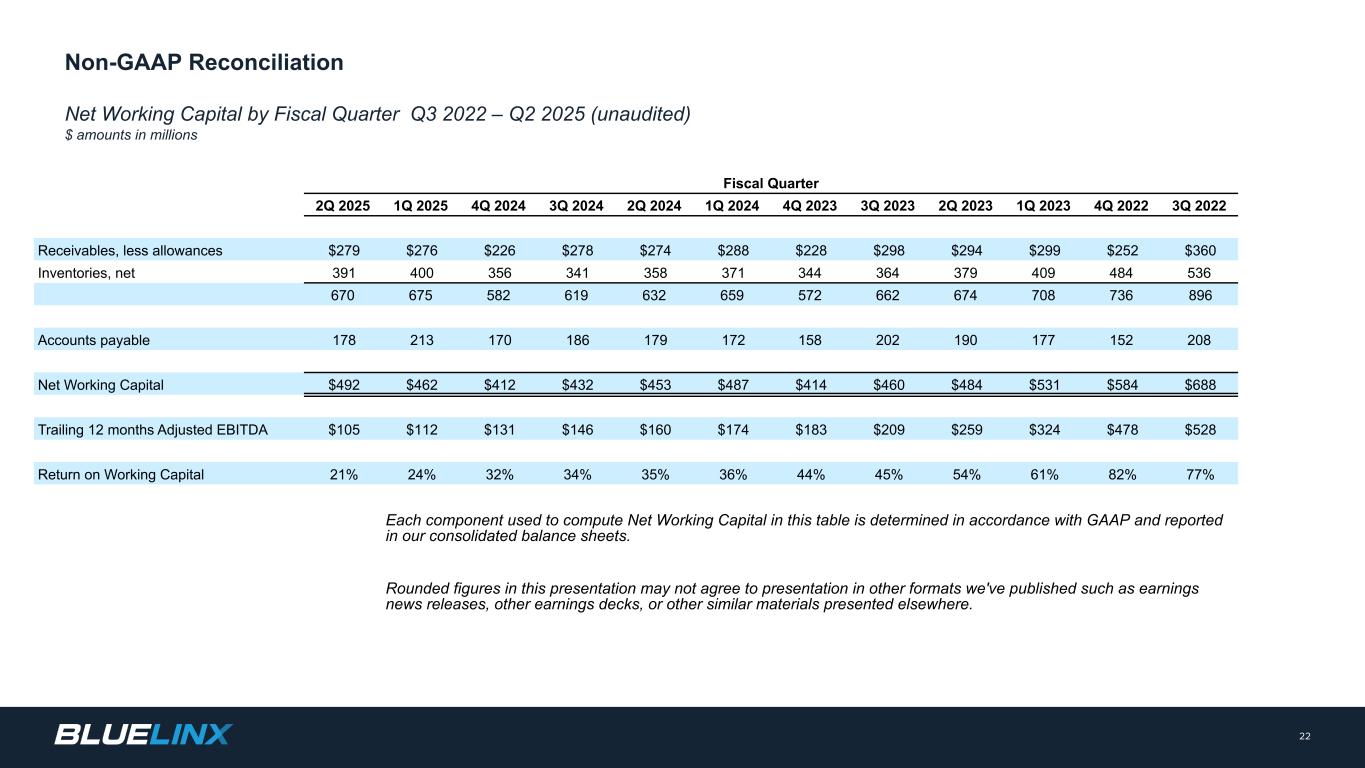
Non-GAAP Reconciliation Net Working Capital by Fiscal Quarter Q3 2022 – Q2 2025 (unaudited) $ amounts in millions 22 Fiscal Quarter 2Q 2025 1Q 2025 4Q 2024 3Q 2024 2Q 2024 1Q 2024 4Q 2023 3Q 2023 2Q 2023 1Q 2023 4Q 2022 3Q 2022 Receivables, less allowances $279 $276 $226 $278 $274 $288 $228 $298 $294 $299 $252 $360 Inventories, net 391 400 356 341 358 371 344 364 379 409 484 536 670 675 582 619 632 659 572 662 674 708 736 896 Accounts payable 178 213 170 186 179 172 158 202 190 177 152 208 Net Working Capital $492 $462 $412 $432 $453 $487 $414 $460 $484 $531 $584 $688 Trailing 12 months Adjusted EBITDA $105 $112 $131 $146 $160 $174 $183 $209 $259 $324 $478 $528 Return on Working Capital 21% 24% 32% 34% 35% 36% 44% 45% 54% 61% 82% 77% Each component used to compute Net Working Capital in this table is determined in accordance with GAAP and reported in our consolidated balance sheets. Rounded figures in this presentation may not agree to presentation in other formats we've published such as earnings news releases, other earnings decks, or other similar materials presented elsewhere.
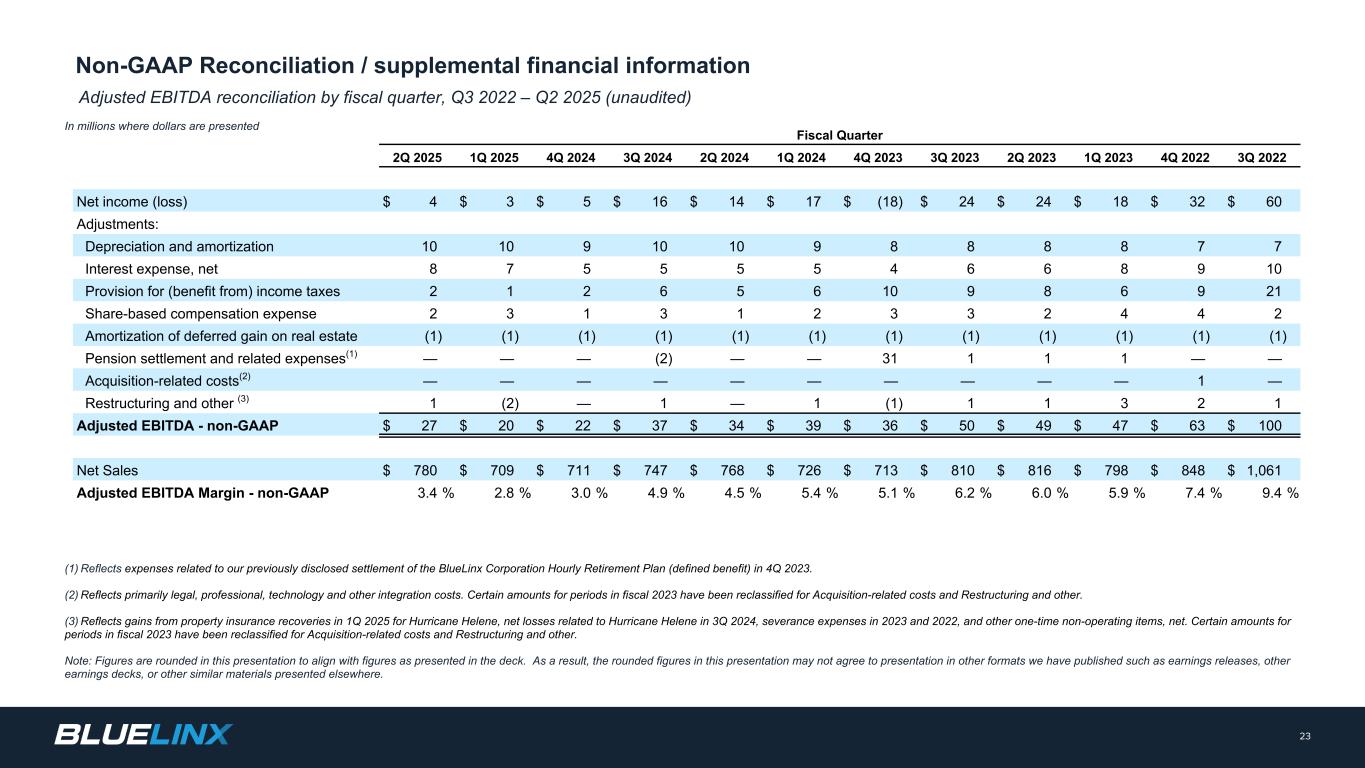
Adjusted EBITDA reconciliation by fiscal quarter, Q3 2022 – Q2 2025 (unaudited) In millions where dollars are presented 23 (1) Reflects expenses related to our previously disclosed settlement of the BlueLinx Corporation Hourly Retirement Plan (defined benefit) in 4Q 2023. (2) Reflects primarily legal, professional, technology and other integration costs. Certain amounts for periods in fiscal 2023 have been reclassified for Acquisition-related costs and Restructuring and other. (3) Reflects gains from property insurance recoveries in 1Q 2025 for Hurricane Helene, net losses related to Hurricane Helene in 3Q 2024, severance expenses in 2023 and 2022, and other one-time non-operating items, net. Certain amounts for periods in fiscal 2023 have been reclassified for Acquisition-related costs and Restructuring and other. Note: Figures are rounded in this presentation to align with figures as presented in the deck. As a result, the rounded figures in this presentation may not agree to presentation in other formats we have published such as earnings releases, other earnings decks, or other similar materials presented elsewhere. Fiscal Quarter 2Q 2025 1Q 2025 4Q 2024 3Q 2024 2Q 2024 1Q 2024 4Q 2023 3Q 2023 2Q 2023 1Q 2023 4Q 2022 3Q 2022 Net income (loss) $ 4 $ 3 $ 5 $ 16 $ 14 $ 17 $ (18) $ 24 $ 24 $ 18 $ 32 $ 60 Adjustments: Depreciation and amortization 10 10 9 10 10 9 8 8 8 8 7 7 Interest expense, net 8 7 5 5 5 5 4 6 6 8 9 10 Provision for (benefit from) income taxes 2 1 2 6 5 6 10 9 8 6 9 21 Share-based compensation expense 2 3 1 3 1 2 3 3 2 4 4 2 Amortization of deferred gain on real estate (1) (1) (1) (1) (1) (1) (1) (1) (1) (1) (1) (1) Pension settlement and related expenses(1) — — — (2) — — 31 1 1 1 — — Acquisition-related costs(2) — — — — — — — — — — 1 — Restructuring and other (3) 1 (2) — 1 — 1 (1) 1 1 3 2 1 Adjusted EBITDA - non-GAAP $ 27 $ 20 $ 22 $ 37 $ 34 $ 39 $ 36 $ 50 $ 49 $ 47 $ 63 $ 100 Net Sales $ 780 $ 709 $ 711 $ 747 $ 768 $ 726 $ 713 $ 810 $ 816 $ 798 $ 848 $ 1,061 Adjusted EBITDA Margin - non-GAAP 3.4 % 2.8 % 3.0 % 4.9 % 4.5 % 5.4 % 5.1 % 6.2 % 6.0 % 5.9 % 7.4 % 9.4 % Non-GAAP Reconciliation / supplemental financial information
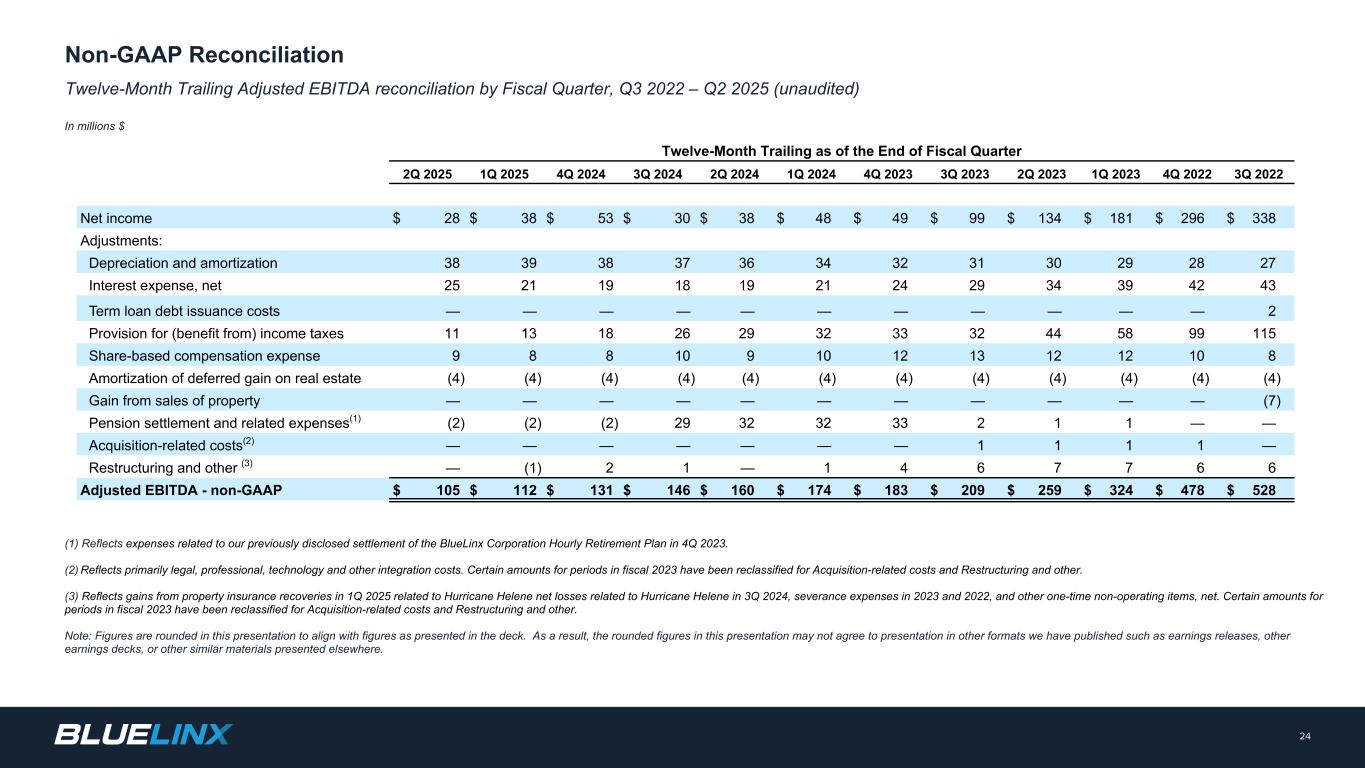
Twelve-Month Trailing Adjusted EBITDA reconciliation by Fiscal Quarter, Q3 2022 – Q2 2025 (unaudited) In millions $ 24 Non-GAAP Reconciliation (1) Reflects expenses related to our previously disclosed settlement of the BlueLinx Corporation Hourly Retirement Plan in 4Q 2023. (2) Reflects primarily legal, professional, technology and other integration costs. Certain amounts for periods in fiscal 2023 have been reclassified for Acquisition-related costs and Restructuring and other. (3) Reflects gains from property insurance recoveries in 1Q 2025 related to Hurricane Helene net losses related to Hurricane Helene in 3Q 2024, severance expenses in 2023 and 2022, and other one-time non-operating items, net. Certain amounts for periods in fiscal 2023 have been reclassified for Acquisition-related costs and Restructuring and other. Note: Figures are rounded in this presentation to align with figures as presented in the deck. As a result, the rounded figures in this presentation may not agree to presentation in other formats we have published such as earnings releases, other earnings decks, or other similar materials presented elsewhere. Twelve-Month Trailing as of the End of Fiscal Quarter 2Q 2025 1Q 2025 4Q 2024 3Q 2024 2Q 2024 1Q 2024 4Q 2023 3Q 2023 2Q 2023 1Q 2023 4Q 2022 3Q 2022 Net income $ 28 $ 38 $ 53 $ 30 $ 38 $ 48 $ 49 $ 99 $ 134 $ 181 $ 296 $ 338 Adjustments: Depreciation and amortization 38 39 38 37 36 34 32 31 30 29 28 27 Interest expense, net 25 21 19 18 19 21 24 29 34 39 42 43 Term loan debt issuance costs — — — — — — — — — — — 2 Provision for (benefit from) income taxes 11 13 18 26 29 32 33 32 44 58 99 115 Share-based compensation expense 9 8 8 10 9 10 12 13 12 12 10 8 Amortization of deferred gain on real estate (4) (4) (4) (4) (4) (4) (4) (4) (4) (4) (4) (4) Gain from sales of property — — — — — — — — — — — (7) Pension settlement and related expenses(1) (2) (2) (2) 29 32 32 33 2 1 1 — — Acquisition-related costs(2) — — — — — — — 1 1 1 1 — Restructuring and other (3) — (1) 2 1 — 1 4 6 7 7 6 6 Adjusted EBITDA - non-GAAP $ 105 $ 112 $ 131 $ 146 $ 160 $ 174 $ 183 $ 209 $ 259 $ 324 $ 478 $ 528
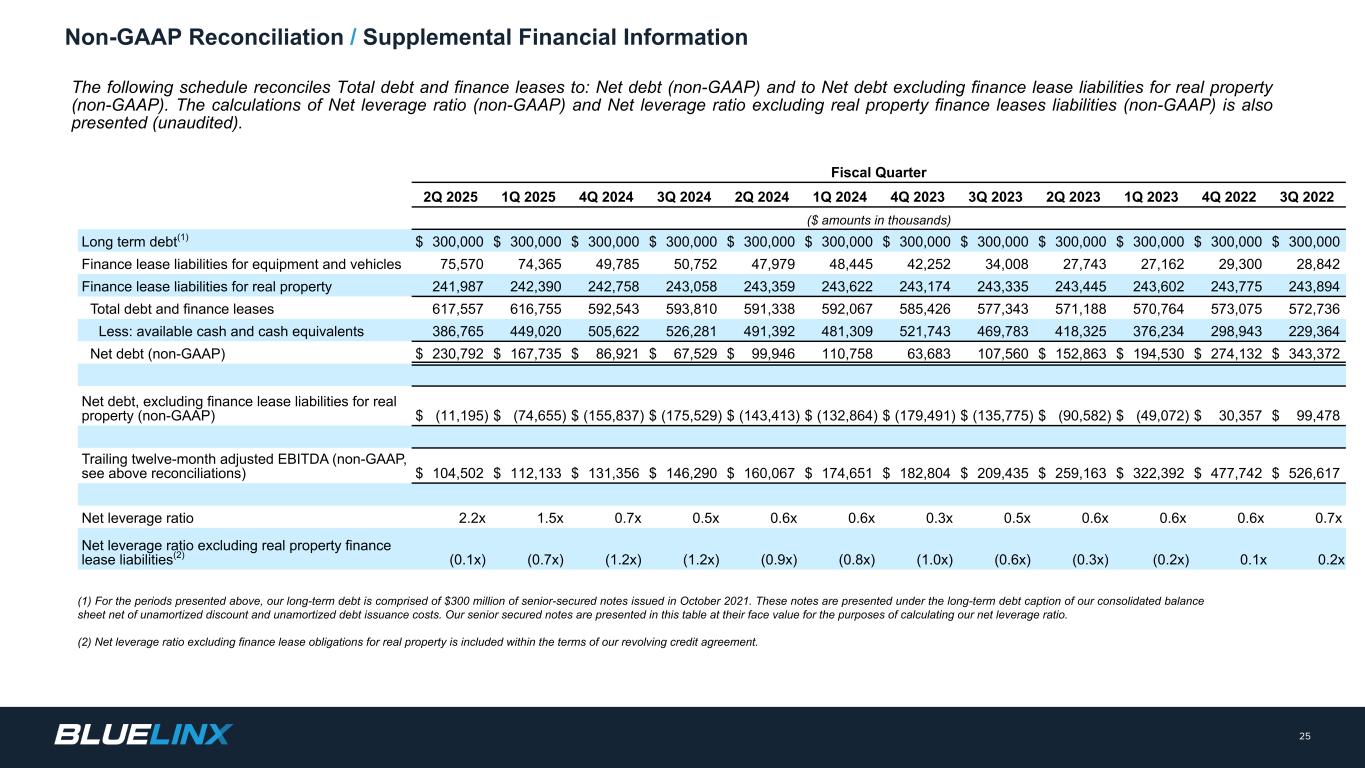
Fiscal Quarter 2Q 2025 1Q 2025 4Q 2024 3Q 2024 2Q 2024 1Q 2024 4Q 2023 3Q 2023 2Q 2023 1Q 2023 4Q 2022 3Q 2022 ($ amounts in thousands) Long term debt(1) $ 300,000 $ 300,000 $ 300,000 $ 300,000 $ 300,000 $ 300,000 $ 300,000 $ 300,000 $ 300,000 $ 300,000 $ 300,000 $ 300,000 Finance lease liabilities for equipment and vehicles 75,570 74,365 49,785 50,752 47,979 48,445 42,252 34,008 27,743 27,162 29,300 28,842 Finance lease liabilities for real property 241,987 242,390 242,758 243,058 243,359 243,622 243,174 243,335 243,445 243,602 243,775 243,894 Total debt and finance leases 617,557 616,755 592,543 593,810 591,338 592,067 585,426 577,343 571,188 570,764 573,075 572,736 Less: available cash and cash equivalents 386,765 449,020 505,622 526,281 491,392 481,309 521,743 469,783 418,325 376,234 298,943 229,364 Net debt (non-GAAP) $ 230,792 $ 167,735 $ 86,921 $ 67,529 $ 99,946 110,758 63,683 107,560 $ 152,863 $ 194,530 $ 274,132 $ 343,372 Net debt, excluding finance lease liabilities for real property (non-GAAP) $ (11,195) $ (74,655) $ (155,837) $ (175,529) $ (143,413) $ (132,864) $ (179,491) $ (135,775) $ (90,582) $ (49,072) $ 30,357 $ 99,478 Trailing twelve-month adjusted EBITDA (non-GAAP, see above reconciliations) $ 104,502 $ 112,133 $ 131,356 $ 146,290 $ 160,067 $ 174,651 $ 182,804 $ 209,435 $ 259,163 $ 322,392 $ 477,742 $ 526,617 Net leverage ratio 2.2x 1.5x 0.7x 0.5x 0.6x 0.6x 0.3x 0.5x 0.6x 0.6x 0.6x 0.7x Net leverage ratio excluding real property finance lease liabilities(2) (0.1x) (0.7x) (1.2x) (1.2x) (0.9x) (0.8x) (1.0x) (0.6x) (0.3x) (0.2x) 0.1x 0.2x Non-GAAP Reconciliation / Supplemental Financial Information The following schedule reconciles Total debt and finance leases to: Net debt (non-GAAP) and to Net debt excluding finance lease liabilities for real property (non-GAAP). The calculations of Net leverage ratio (non-GAAP) and Net leverage ratio excluding real property finance leases liabilities (non-GAAP) is also presented (unaudited). (1) For the periods presented above, our long-term debt is comprised of $300 million of senior-secured notes issued in October 2021. These notes are presented under the long-term debt caption of our consolidated balance sheet net of unamortized discount and unamortized debt issuance costs. Our senior secured notes are presented in this table at their face value for the purposes of calculating our net leverage ratio. (2) Net leverage ratio excluding finance lease obligations for real property is included within the terms of our revolving credit agreement. 25