UNITED STATES
SECURITIES AND EXCHANGE COMMISSION
WASHINGTON, D.C. 20549
FORM 20-F
(Mark One)
| ☐ | REGISTRATION STATEMENT PURSUANT TO SECTION 12(b) OR (g) OF THE SECURITIES EXCHANGE ACT OF 1934 |
OR
| ☒ | ANNUAL REPORT PURSUANT TO SECTION 13 OR 15(d) OF THE SECURITIES EXCHANGE ACT OF 1934 |
For the fiscal year ended 31 December 2018
OR
| ☐ | TRANSITION REPORT PURSUANT TO SECTION 13 OR 15(d) OF THE SECURITIES EXCHANGE ACT OF 1934 |
OR
| ☐ | SHELL COMPANY REPORT PURSUANT TO SECTION 13 OR 15(d) OF THE SECURITIES EXCHANGE ACT OF 1934 |
Date of event requiring this shell company report
For the transition period from to
Commission file number 001-38159
British American Tobacco p.l.c.
(Exact name of Registrant as specified in its charter)
(Translation of Registrant’s name into English)
England and Wales
(Jurisdiction of incorporation or organization)
Globe House, 4 Temple Place, London WC2R 2PG, United Kingdom
(Address of principal executive offices)
Paul McCrory, Company Secretary
Tel: +44 (0)20 7845 1000
Fax: +44 (0)20 7240 0555
Globe House, 4 Temple Place, London WC2R 2PG, United Kingdom
(Name, Telephone, E-mail and/or Facsimile number and Address of Company Contact Person)
Securities registered or to be registered pursuant to Section 12(b) of the Act.
| Title of each class |
Name of each exchange on which registered | |
| American Depositary Shares (evidenced by American Depositary Receipts) each representing one Ordinary Share | New York Stock Exchange | |
| Ordinary Shares, nominal value 25 pence per share | New York Stock Exchange* | |
| * | Application made for registration purposes only, not for trading, and only in connection with the registration of the American Depositary Shares pursuant to the requirements of the Securities and Exchange Commission. |
Securities registered or to be registered pursuant to Section 12(g) of the Act.
None
Securities for which there is a reporting obligation pursuant to Section 15(d) of the Act.
None
Indicate the number of outstanding shares of each of the issuer’s classes of capital or common stock as of the close of the period covered by the annual report.
2,456,415,884 Ordinary Shares
Indicate by check mark if the registrant is a well-known seasoned issuer, as defined in Rule 405 of the Securities Act. ☒ Yes ☐ No
If this report is an annual or transition report, indicate by check mark if the registrant is not required to file reports pursuant to Section 13 or 15(d) of the Securities Exchange Act of 1934. ☐ Yes ☒ No
Note – Checking the box above will not relieve any registrant required to file reports pursuant to Section 13 or 15(d) of the Securities Exchange Act of 1934 from their obligations under those Sections.
Indicate by check mark whether the registrant (1) has filed all reports required to be filed by Section 13 or 15(d) of the Securities Exchange Act of 1934 during the preceding 12 months (or for such shorter period that the registrant was required to file such reports), and (2) has been subject to such filing requirements for the past 90 days. ☒ Yes ☐ No
Indicate by check mark whether the registrant has submitted electronically every Interactive Data File required to be submitted pursuant to Rule 405 of Regulation S-T (§232.405 of this chapter) during the preceding 12 months (or for such shorter period that the registrant was required to submit such files). ☒ Yes ☐ No
Indicate by check mark whether the registrant is a large accelerated filer, an accelerated filer, a non-accelerated filer, or an emerging growth company. See definition of “large accelerated filer,” “accelerated filer,” and “emerging growth company” in Rule 12b-2 of the Exchange Act.
| Large accelerated filer | ☒ | Accelerated filer | ☐ | |||
| Non-accelerated filer | ☐ | Emerging growth company | ☐ | |||
If an emerging growth company that prepares its financial statements in accordance with U.S. GAAP, indicate by check mark if the registrant has elected not to use the extended transition period for complying with any new or revised financial accounting standards† provided pursuant to Section 13(a) of the Exchange Act. ☐
† The term “new or revised financial accounting standard” refers to any update issued by the Financial Accounting Standards Board to its Accounting Standards Codification after April 5, 2012.
Indicate by check mark which basis of accounting the registrant has used to prepare the financial statements included in this filing:
| U.S. GAAP ☐ | International Financial Reporting Standards as issued by the International Accounting Standards Board ☒ |
Other ☐ |
If “Other” has been checked in response to the previous question, indicate by check mark which financial statement item the registrant has elected to follow. ☐ Item 17 ☐ Item 18
If this is an annual report, indicate by check mark whether the registrant is a shell company (as defined in Rule 12b-2 of the Exchange Act). ☐ Yes ☒ No
Transforming
Tobacco
Annual Report and Form 20-F 2018
| www.bat.com/reporting www.bat.com/investors BAT IR app |
Strategic Report Governance Financial Statements Other Information British American Tobacco (BAT) is one of the world’s leading consumer goods companies, with nicotine and tobacco brands sold around the globe. We employ over 55,000 people, partner with over 90,000 farmers and have factories in 48 countries, with offices in even more. Transforming Tobacco At BAT, we have been satisfying adult consumers, delivering shareholder value and creating valued employment for over a century. Today we find ourselves in one of the most dynamic periods of change our industry has ever encountered. Rapid product innovation, along with advances in societal attitudes and public health awareness, has given us the opportunity to make a substantial leap forward in our long-held ambition to positively impact the lives of millions of our consumers by providing them with lower-risk tobacco and nicotine products. We call this ambition ‘transforming tobacco’ and we are fully committed to leading the transformation of our industry and our company.

In 2012, we articulated a clear vision that places adult consumers at the centre of our strategy. Our Transforming Tobacco ambition builds on this vision as we grow our business based on offering our consumers a broad range of outstanding products, informed consumer choice, and a drive towards a reduced-risk portfolio. More choice, more innovation, less risk. Empowering consumers through choice It is widely accepted that most of the harm associated with cigarettes is caused by inhaling the smoke produced by the combustion of tobacco, and that cigarette smoking is the most dangerous way of consuming tobacco. While smokers have historically had very few alternatives to combustible cigarettes, innovation is now providing adult consumers with a greater choice of tobacco and nicotine products that are potentially less risky than cigarettes. BAT is at the forefront of the development and sale of a whole range of potentially reduced-risk products that provide much of the enjoyment of smoking without burning tobacco. Our growing portfolio of potentially reduced-risk products (which we call PRRPs) includes vapour, tobacco heating products (THPs), modern oral products, as well as traditional oral products such as Swedish-style snus and American moist snuff. Our acquisition of Reynolds American has transformed us into one of the world’s leading vapour companies and has also allowed us to significantly increase the size of our oral tobacco and nicotine products range. Never before have so many of our consumers around the world had access to so many alternatives to combustible cigarettes. We continue to develop new and ever more innovative products to add to this range of potentially less risky choices.

Strategic Report Governance Financial Statements Other Information In addition to our commitment to developing and offering a range of high-quality alternative products, we are also committed to working with governments and other stakeholders around the world to develop supportive regulatory regimes. While we cannot be certain how many smokers will switch to our alternative products, we have already seen several countries dismantle barriers to these new products, which has given millions of additional adult consumers greater choice. …supported by pro-active external engagement We recognise that our ambition to ‘transform tobacco’ relies not only on our development and commercialisation of new products, but on the support of regulators and society as well. Greater consumer choice is at the heart of our strategy, but its effects require amplification from sensible regulations that allow adult consumers access to alternative choices, as well as from public health bodies and the media to drive informed consumer decision making. By working with key stakeholders around the world, we strive to maximise the potential for reduced-risk products: safer choices for our consumers, benefits for public health, and a more sustainable and profitable business for our shareholders.
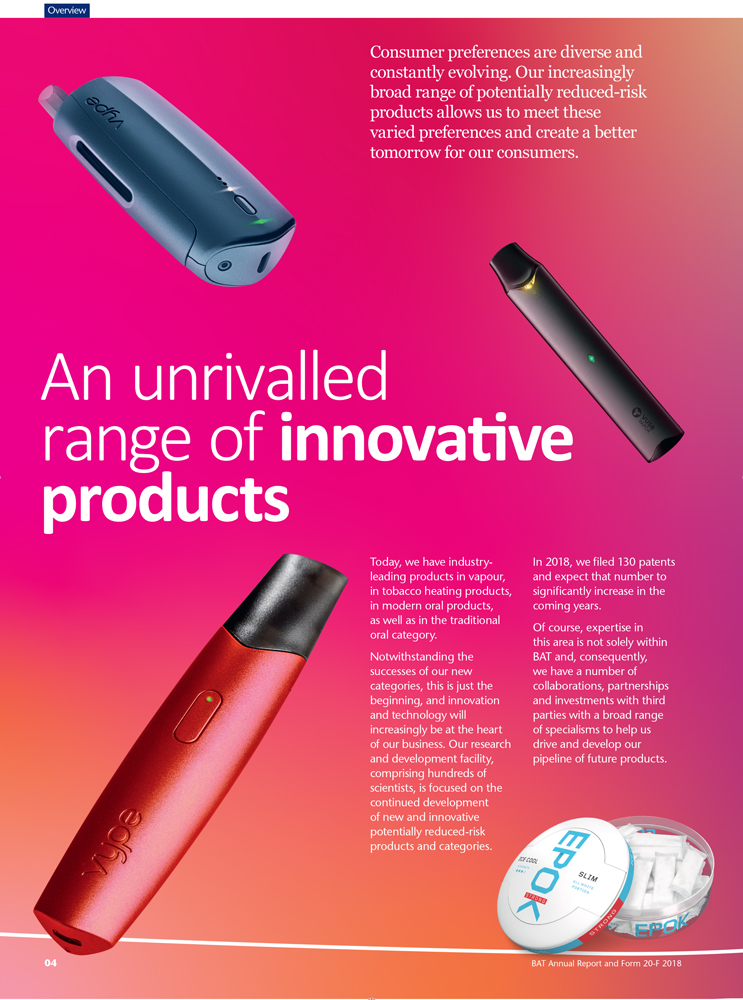
Consumer preferences are diverse and constantly evolving. Our increasingly broad range of potentially reduced-risk products allows us to meet these varied preferences and create a better tomorrow for our consumers. An unrivalled range of innovative products Today, we have industry-leading products in vapour, in tobacco heating products, in modern oral products, as well as in the traditional oral category. Notwithstanding the successes of our new categories, this is just the beginning, and innovation and technology will increasingly be at the heart of our business. Our research and development facility, comprising hundreds of scientists, is focused on the continued developme of new and innovative potentially reduced-ris products and categori In 2018, we filed 130 patents and expect that number to significantly increase in the coming years. Of course, expertise in this area is not solely within BAT and, consequently, we have a number of collaborations, partnerships and investments with third parties with a broad range of specialisms to help us drive and develop our pipeline of future products.
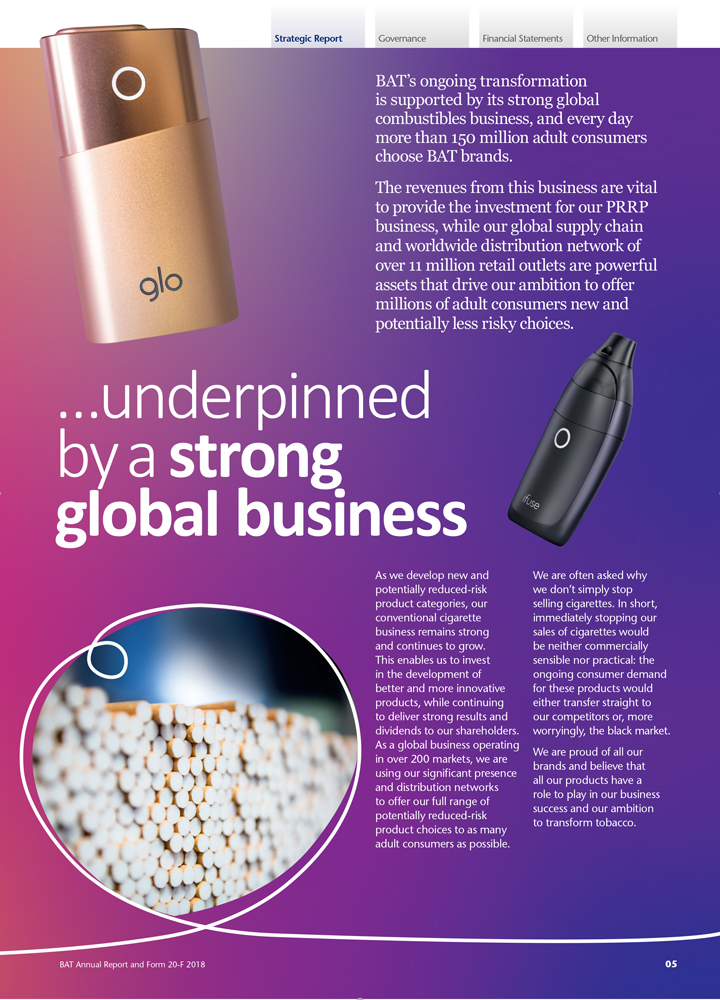
Strategic Report Governance Financial Statements Other Information BAT’s ongoing transformation is supported by its strong global combustibles business, and every day more than 150 million adult consumers choose BAT brands. The revenues from this business are vital to provide the investment for our PRRP business, while our global supply chain and worldwide distribution network of over 11 million retail outlets are powerful assets that drive our ambition to offer millions of adult consumers new and potentially less risky choices. …underpinned by a strong global business As we develop new and potentially reduced product categories, our conventional cigarette business remains strong and continues to grow. This enables us to invest in the development of better and more innovative products, while continuing to deliver strong results and dividends to our shareholders. As a global business operating in over 200 markets, we are using our significant presence and distribution networks to offer our full range of potentially reduced-risk product choices to as many adult consumers as possible. We are often asked why we don’t simply stop selling cigarettes. In short, immediately stopping our sales of cigarettes would be neither commercially sensible nor practical: the ongoing consumer demand for these products would either transfer straight to our competitors or, more worryingly, the black market. We are proud of all our brands and believe that all our products have a role to play in our business success and our ambition to transform tobacco.

Overview Our potentially reduced-risk product business has seen outstanding growth. Our tobacco heating, vapour, and modern oral products are now available in 29 markets and used by six million adult consumers around the world. However, this is just the beginning, and with a growing consumer base of over one billion smokers and nicotine users in the world, the opportunities presented by these new categories are huge. Another step on an exciting journey While we cannot be certain whether all smokers will switch to potentially reduced-risk products, we are committed to improving the lives of smokers by making a range of high-quality, innovative products as widely available as we practically can. We believe that by doing this, and working with regulators to establish supportive regulatory regimes, many millions of smokers will increasingly make the choice to switch. If we can all work successfully together, we can drive a scenario in which our consumers will have a range of potentially safer choices, our shareholders will own an even more sustainable and profitable business, and society could benefit from real progress in tobacco harm reduction.
|
Strategic Report
|
Governance
|
Financial Statements
|
Other Information
|

|
“I am very pleased to report another strong set of results with market share, revenue, and profit from operations all growing”
Richard Burrows Chairman |
| BAT Annual Report and Form 20-F 2018 | 07 | |
|
Overview
|
|
for transforming tobacco
Our strategy remains as relevant today to drive our transforming tobacco ambition as it was when it was first rolled out in 2012. It enables us to continue delivering value growth while driving the investment required to deliver our transformational agenda.
Our vision remains clear: while combustible tobacco products will remain at the core of our business for some time to come, we understand that long-term sustainability will be delivered by our transforming tobacco ambition.
|

| 08 | BAT Annual Report and Form 20-F 2018 | |
|
Strategic Report
|
Governance
|
Financial Statements
|
Other Information
|
Guiding Principles
Our Guiding Principles provide clarity about what we stand for.
They form the core of our culture and guide how we deliver our strategy.
| BAT Annual Report and Form 20-F 2018 | 09 | |
|
Overview
|
|
Group cigarette (and tobacco heating
Group market share of Key Markets
Strategic Cigarette and THP volume
Oral (snus) (no. pouches)
Vapour (units)
|
Revenue (£m)
Definition: Revenue recognised, net of duty, excise and other taxes.
In 2018, revenue includes £17,257 million of revenue from the Strategic Portfolio, an increase of 49% on 2017 (on a reported and representative basis).
Change in adjusted2 revenue
Definition: Change in revenue before the impact of adjusting items and the impact of fluctuations in foreign exchange rates.
Change in adjusted2 revenue from the
Definition: Change in revenue from the strategic portfolio before the impact of adjusting items and the impact of fluctuations in foreign exchange rates.
This measure was introduced in 2018, with no comparators provided.
|
Profit from operations (£m)
Definition: Profit for the year before the impact of net finance costs/income, share of post-tax results of associates and joint ventures and taxation on ordinary activities.
Change in adjusted2 profit from
Definition: Change in profit from operations before the impact of adjusting items and the impact of fluctuations in foreign exchange rates. | ||
|
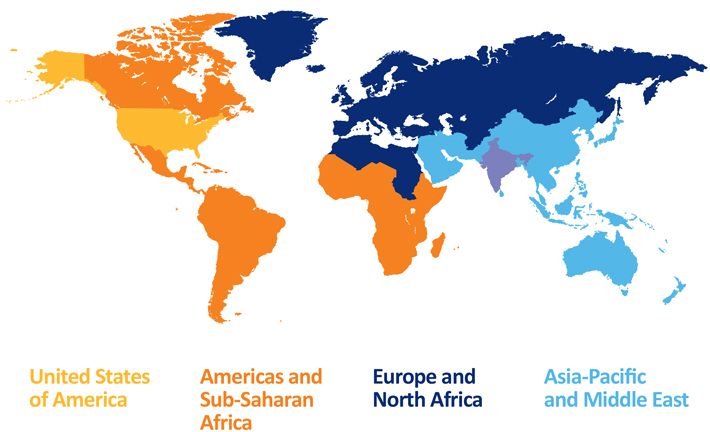
Changes in 2018 In 2018, the Group introduced a new measure called ‘adjusted revenue growth from the Strategic Portfolio’ as part of the continual assessment of the Group’s short- and long-term delivery of the strategic vision. This measure replaced the GDB and Key Strategic Brands volume growth metric as a key performance indicator in connection with the Group’s compensation plans. This Strategic Portfolio reflects the focus of the Group’s investment activity and includes the ‘Strategic Combustible Brands’ being Kent, Dunhill, Lucky Strike, Pall Mall, Rothmans, Camel (US), Newport (US) and Natural American Spirit (US) and our potentially reduced-risk products portfolio, which comprises our THP, vapour, modern oral and traditional oral businesses. In line with the above, and to reflect the development of the categories, the Group is also providing specific volume metrics for vapour and oral. | ||||
| 10 | BAT Annual Report and Form 20-F 2018 | |
|
Strategic Report
|
Governance
|
Financial Statements
|
Other Information
|
Notes: To supplement our results of operations presented in accordance with IFRS, the information presented also includes several non-GAAP measures used by management to monitor the Group’s performance. See the section Non-GAAP measures beginning on page 258 for information on these non-GAAP measures, including their definitions and reconciliations from the most directly comparable IFRS measure, where applicable. Certain of our measures are presented based on constant rates of exchange, on an adjusted basis, on a representative basis and on an organic basis.
| 1. | Where measures are presented ‘at constant rates’, the measures are calculated based on a re-translation, at the prior year’s exchange rates, of the current year results of the Group and, where applicable, its segments. See page 42 for the major foreign exchange rates used for Group reporting. |
| 2. | Where measures are presented as ‘adjusted’, they are presented before the impact of adjusting items. Adjusting items represent certain items of income and expense which the Group considers distinctive based on their size, nature or incidence. |
| 3. | Where measures are presented as ‘organic’ or ‘org’, they are presented before the impact of the contribution of brands and businesses acquired during the comparator period, including Reynolds American, Bulgartabac, Winnington and Fabrika Duhana Sarajevo in 2017. There were no material acquisitions or disposals in 2018. |
| 4. | Where measures are presented as ‘representative’, ‘rep’ or ‘on a representative basis’, they are presented inclusive of the acquired businesses in the 2017 comparator period as though those businesses had been included in the consolidated results for the whole of that comparator period and including certain additional adjusting items related to the acquired companies. |
|
Operating margin
Definition: Profit from operations as a percentage of revenue. |
Diluted earnings per share (EPS)
Definition: Profit attributable to owners of BAT p.l.c. over weighted average number of shares outstanding, including the effects of all dilutive potential ordinary shares. |
Net cash generated from operating activities (£m)
Definition: Movement in net cash and cash equivalents before the impact of net cash used in financing activities, net cash used in investing activities and differences on exchange.
| ||
|
Adjusted2 operating margin
Definition: Adjusted profit from operations as a percentage of adjusted revenue. |
Change in adjusted2 diluted EPS
Definition: Change in diluted earnings per share before the impact of adjusting items.
|
|||
|
Total shareholder return (TSR) of the The FMCG group comparison is based on three months’ average values
|
Change in adjusted2 diluted EPS
Definition: Change in diluted earnings per share before the impact of adjusting items and the impact of fluctuations in foreign exchange rates.
|
Cash conversion
Definition: Net cash generated from operating activities as a percentage of profit from operations. | ||
|
Total dividends per share
Definition: Dividend per share in respect of the financial year. Target: To increase dividend in sterling terms, based upon the Group’s policy to pay dividends of 65% of long-term sustainable earnings. |
| BAT Annual Report and Form 20-F 2018 | 11 | |
|
|
| 12 | BAT Annual Report and Form 20-F 2018 | |
|
Strategic Report
|
Governance
|
Financial Statements
|
Other Information
|
Jack Bowles
Chief Executive Designate
| BAT Annual Report and Form 20-F 2018 | 13 | |
|
Strategic Management
|
| “The Group again delivered growth across all key performance indicators”
Ben Stevens Finance Director |
|
| 14 | BAT Annual Report and Form 20-F 2018 | |
|
Strategic Report
|
Governance
|
Financial Statements
|
Other Information
|
Today’s total tobacco and nicotine market comprises a growing user
pool of over one billion individual adult consumers.
While the decline in combustible cigarette consumption is expected to continue, it is predicted to be, at least partially, offset by the increasing
consumption of PRRPs, in particular vapour, tobacco heating and modern oral products.
| BAT Annual Report and Form 20-F 2018 | 15 | |
|
Strategic Management
|
British American Tobacco is a leading, multi-category consumer goods company that provides tobacco and nicotine products to millions of consumers around the world.
Our portfolio reflects our commitment to meeting the preferences of today’s adult smokers while transforming tobacco with a choice of potentially reduced-risk products.
These include vapour, tobacco heating products, modern oral products including tobacco-free nicotine pouches, as well as traditional oral products such as snus and moist snuff.
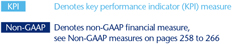
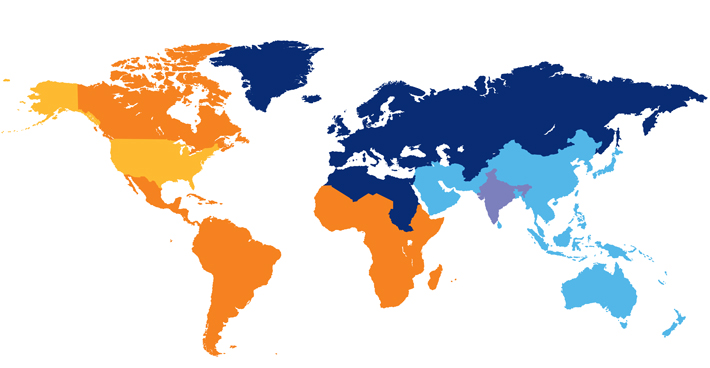
Our products are sold in over 200 markets with a balanced presence in high-growth emerging markets and highly profitable developed markets. Our business is divided into four regions across six continents.
| 16 | BAT Annual Report and Form 20-F 2018 | |
|
Strategic Report
|
Governance
|
Financial Statements
|
Other Information
|
Our Strategic Portfolio comprises our key brands in both the combustible and PRRP categories. This drives focus and investment on the brands and categories that will underpin the Group’s future growth.
We also have a portfolio of international and local brands which, while not the focus of our investment, contribute valuable returns across several key markets.
| * | Our vapour product Vuse, and oral products Grizzly, Camel Snus and Kodiak, which are only sold in the US, are subject to FDA regulation and no reduced-risk claims will be made as to these products without agency clearance. |
| BAT Annual Report and Form 20-F 2018 | 17 | |
|
Strategic Management
|
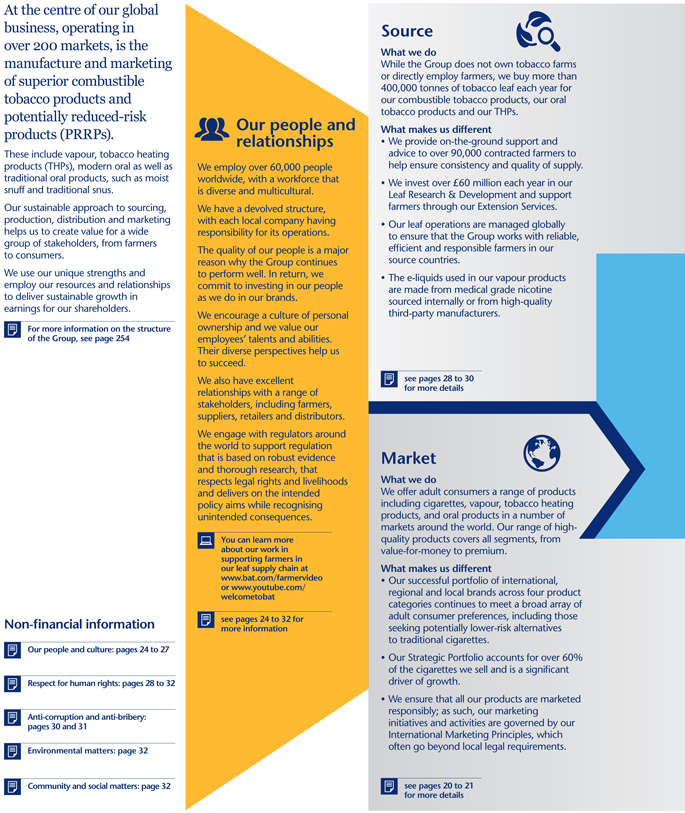
At the centre of our global business, operating in over 200 markets, is the manufacture and marketing of superior combustible tobacco products and
potentially reduced-risk products (PRRPs).
These include vapour, tobacco heating products (THPs), modern oral as well as traditional oral products, such as moist snuff and
traditional snus.
Our sustainable approach to sourcing, production, distribution and marketing helps us to create value for a wide group of stakeholders, from farmers to
consumers.
We use our unique strengths and employ our resources and relationships to deliver sustainable growth in earnings for our shareholders. For more information
on the structure of the Group, see page 254
Non-financial information
Our people and culture: pages 24 to 27
Respect for human rights: pages 28 to 32
Anti-corruption and anti-bribery:
pages 30 and 31
Environmental matters: page 32
Community and social matters: page 32
| 18 | BAT Annual Report and Form 20-F 2018 | |
|
Strategic Report
|
Governance
|
Financial Statements
|
Other Information
|
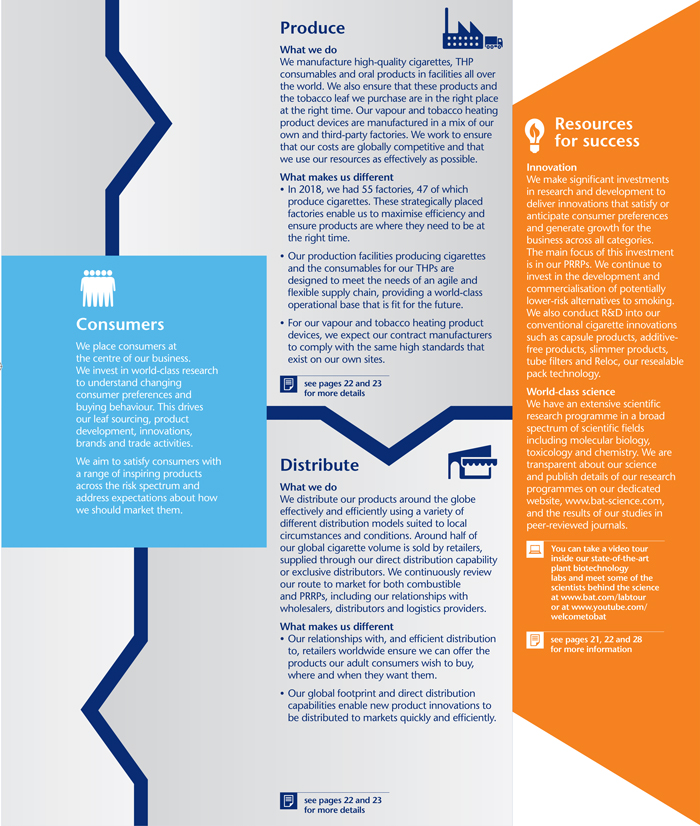
Consumers
We place consumers at the centre of our business. We invest
in world-class research to understand changing consumer preferences and buying behaviour. This drives our leaf sourcing, product development, innovations, brands and trade activities. We aim to satisfy consumers with a range of inspiring
products across the risk spectrum and address expectations about how we should market them.
Produce
What we do
We manufacture high-quality cigarettes, THP consumables and oral products in facilities all over the
world. We also ensure that these products and the tobacco leaf we purchase are in the right place at the right time. Our vapour and tobacco heating product devices are manufactured in a mix of our own and third-party factories. We work to ensure
that our costs are globally competitive and that we use our resources as effectively as possible.
What makes us different
• In 2018, we had 55 factories, 47 of which produce cigarettes. These strategically placed factories enable us to maximise efficiency and ensure products are where they need to be at
the right time.
• Our production facilities producing cigarettes and the consumables for our THPs are designed to meet the needs of an agile and flexible supply chain,
providing a world-class operational base that is fit for the future.
• For our vapour and tobacco heating product devices, we expect our contract manufacturers to
comply with the same high standards that exist on our own sites.
see pages 22 and 23 for more details
Distribute
What we do
We distribute
our products around the globe effectively and efficiently using a variety of different distribution models suited to local circumstances and conditions. Around half of our global cigarette volume is sold by retailers, supplied through our direct
distribution capability or exclusive distributors. We continuously review our route to market for both combustible and PRRPs, including our relationships with wholesalers, distributors and logistics providers.
What makes us different
• Our relationships with, and efficient distribution to, retailers worldwide ensure
we can offer the products our adult consumers wish to buy, where and when they want them.
• Our global footprint and direct distribution capabilities enable new product
innovations to be distributed to markets quickly and efficiently.
Resources for success
Innovation
We make significant investments in research and development to deliver innovations
that satisfy or anticipate consumer preferences and generate growth for the business across all categories. The main focus of this investment is in our PRRPs. We continue to invest in the development and commercialisation of potentially
lower-risk alternatives to smoking. We also conduct R&D into our conventional cigarette innovations such as capsule products, additive-free products, slimmer products, tube filters and Reloc, our resealable pack technology.
World-class science
We have an extensive scientific research programme in a broad spectrum of scientific fields
including molecular biology, toxicology and chemistry. We are transparent about our science and publish details of our research programmes on our dedicated website, www.bat-science.com, and the results of
our studies in peer-reviewed journals.
You can take a video tour inside our
state-of-the-art plant biotechnology labs and meet some of the scientists behind the science at www.bat.com/labtour or at
www.youtube.com/ welcometobat
see pages 21, 22 and 28 for more information
BAT Annual Report
and Form 20-F 2018
| BAT Annual Report and Form 20-F 2018 | 19 | |
|
Strategic Management
|
| 20 | BAT Annual Report and Form 20-F 2018 | |
|
Strategic Report
|
Governance
|
Financial Statements
|
Other Information
|
In addition to revenue and the other measures discussed in this Annual Report and Form 20-F, BAT management focuses on volume as a key measure to evaluate performance. Volume is an unaudited operating measure and is calculated as the total global cigarette, THP, vapour or oral volume of the Group’s brands sold by its subsidiaries. The Group believes that volume is a measure commonly used by analysts and investors in the industry. Accordingly, this information has been disclosed to permit a more complete analysis of the Group’s operating performance.
The Group also uses market share to evaluate its performance. The Group evaluates changes in its key market offtake share (as measured by retail audit agencies (including Nielsen), shipment share estimates and share of retail for the US business) for tobacco products, based on the latest available data from a number of internal and external sources. Key markets consist of approximately 40 territories across all geographical segments, and represent approximately 80% of the Group’s global volume. Growth in these markets is largely driven by the Strategic Portfolio. The Group also highlights drivers for change in specific markets (e.g., volume, market share or value share (being the customer sales price earned as a proportion of the industry total customer sales price)). For PRRPs, the Group monitors its performance in select countries (e.g., UK, France, Germany, Italy) based upon category retail market share, based on the latest available data from a number of internal and external sources.
In addition, the Group’s performance is affected by global pricing, which is impacted by discounts, terms of credit with customers, excise taxes and other competitive, market-driven and regulatory factors. In certain markets, the Group has experienced increases or decreases in average prices resulting from changes in product mix, also referred to as price mix. The Group believes that pricing and market share are measures commonly used by analysts and investors in the industry.
| BAT Annual Report and Form 20-F 2018 | 21 | |
|
Strategic Management
|
Delivering our strategy continued
| 22 | BAT Annual Report and Form 20-F 2018 | |
|
Strategic Report
|
Governance
|
Financial Statements
|
Other Information
|
| BAT Annual Report and Form 20-F 2018 | 23 | |
|
Strategic Management
|
Delivering our strategy continued
| 24 | BAT Annual Report and Form 20-F 2018 | |
|
Strategic Report
|
Governance
|
Financial Statements
|
Other Information
|
| Our policies and principles* |
Summary of areas covered |
Key stakeholder groups | ||
| Employment Principles | Employment practices, including commitments to diversity, reasonable working hours, family-friendly policies, employee wellbeing, talent, performance and equal opportunities, and fair, clear and competitive remuneration and benefits. | Group employees | ||
| Health and Safety Policy | Health, safety and welfare of all employees, other members of our workforce and third-party personnel. | Employees and contractors, suppliers, business partners, farmers | ||
| Standards of Business Conduct (SoBC) | Respect in the work place, including promoting equality and diversity, preventing harassment and bullying, and safeguarding employee wellbeing. | Employees and contractors | ||
| Group Data Privacy Policy | The manner in which BAT processes personal data about all individuals, including consumers, employees, contractors and employees of suppliers | Employees and contractors, suppliers, business partners, consumers | ||
| These policies and procedures are endorsed by our Board and support the effective identification, management and mitigation of risks and issues for our business in these and other areas. | ||||
| * | Further details of our Group policies and principles can be found at www.bat.com/principles. |
| BAT Annual Report and Form 20-F 2018 | 25 | |
|
Strategic Management
|
Delivering our strategy continued
| 26 | BAT Annual Report and Form 20-F 2018 | |
|
Strategic Report
|
Governance
|
Financial Statements
|
Other Information
|
| BAT Annual Report and Form 20-F 2018 | 27 | |
|
Strategic Management
|
| 28 | BAT Annual Report and Form 20-F 2018 | |
|
Strategic Report
|
Governance
|
Financial Statements
|
Other Information
|
| BAT Annual Report and Form 20-F 2018 | 29 | |
|
Strategic Management
|
Delivering our strategy continued
|
Sustainability: Our policies**
|
Summary of areas covered
|
Key stakeholder groups
| ||
| Standards of Business Conduct (SoBC) |
Anti-bribery and corruption, conflicts of interest, and entertainment and gifts. Respect for human rights, including prevention of child labour and exploitation of labour, and respect for freedom of association. Political contributions and charitable contributions. Financial integrity, accurate accounting and record-keeping, and information security. Anti-illicit trade, competition and anti-trust, anti-money laundering and sanctions compliance. Whistleblowing. |
Employees and contractors Governments and regulators Local communities and society | ||
| Environment Policy | Our commitments to carrying out our business in an environmentally responsible and sustainable way, including agricultural, manufacturing and distribution operations. | Employees and contractors Suppliers, business partners, and farmers Local communities and society | ||
| Principles for Engagement | Our internal standards guiding all engagement activities, underpinning our commitment to corporate transparency. | Employees and contractors Governments and regulators Local communities and society | ||
| Supplier Code of Conduct | Standards required of our suppliers worldwide, including business integrity, anti-bribery and corruption, environmental sustainability and respect for human rights (covering equal opportunities and fair treatment, health and safety, prevention of harassment and bullying, child labour and exploitation of labour, and freedom of association). | Suppliers and business partners Employees and contractors Local communities and society | ||
| Strategic Framework for Corporate Social Investment |
Sets out our Group corporate social investment strategy and a framework for our local operating companies to implement that strategy. | Local communities and society NGOs and development agencies | ||
| International Marketing Principles |
Our internal standards guiding all marketing activities across all product categories. | Employees and contractors Distributors, retailers, customers | ||
| These policies and procedures are endorsed by our Board and support the effective identification, management and mitigation of risks and issues for our business in these and other areas.
| ||||
| ** | Further details of our Group policies and principles can be found at www.bat.com/principles |
Further details of our Strategic Framework for Corporate Social Investment can be found at www.bat.com/csi
| 30 | BAT Annual Report and Form 20-F 2018 | |
|
Strategic Report
|
Governance
|
Financial Statements
|
Other Information
|
| BAT Annual Report and Form 20-F 2018 | 31 | |
|
Strategic Management
|
||||||||||||||
| Delivering our strategy continued
| ||||||||||||||
| * As we have expanded our Scope 3 reporting to fully align with the Greenhouse Gas (GHG) Protocol, consolidation and verification for 2018 data is ongoing and is not practical to report at this time. The consolidated and verified data will be reported in the 2019 Annual Report and Form 20-F. |
Emissions*
|
| ||||||||||
|
|
||||||||||||
| 2018 | 2017 | |||||||||||
|
|
||||||||||||
| Scope 1 CO2e emissions (’000 tonnes) | 415 | 427 | ||||||||||
| Scope 2 CO2e emissions (’000 tonnes) | 426 | 438 | ||||||||||
| Scope 3 CO2e emissions (’000 tonnes)* | n/a | 8,254 | ||||||||||
|
|
||||||||||||
| Total statutory emissions (Scope 1 and 2 in ’000 tonnes) | 841 | 864 | ||||||||||
|
|
||||||||||||
| Intensity (tonnes per £ million of revenue) | 32.6 | 34.7 | ||||||||||
|
|
||||||||||||
| 32 | BAT Annual Report and Form 20-F 2018 | |
|
|
Strategic Report
|
Governance
|
Financial Statements
|
Other Information
|
| “A good year of
progress in our key
Ben Stevens Finance Director |
|
Highlights
– Group revenue was up 25% or 3.5% on an adjusted, representative basis at constant rates of exchange;
– Profit from operations increased by 45% or 4.0% on an adjusted, representative basis at constant rates of exchange;
– Diluted earnings per share fell 86%. Adjusted diluted earnings per share up 5.2% or 11.8% at constant rates;
– Dividend per share up 4.0% at 203.0p;
– Net cash generated from operating activities up 93%;
– Cash conversion at 111%. |
Reconciliation of revenue to adjusted revenue at constant rates
| 2018 | 2017 | 2016 | ||||||||||||||||||||||
| £m | Change % | £m | £m | Change % | £m | |||||||||||||||||||
| (vs 2017 Rep)
|
Repres
|
Organic
|
(vs 2016 Org)
|
£m
|
||||||||||||||||||||
| Revenue | 24,492 | +25% | 19,564 | 19,564 | +39% | 14,130 | ||||||||||||||||||
|
Adjusting items |
(180 | ) | – | (258 | ) | (258 | ) | – | – | |||||||||||||||
|
Add/(subtract) impact of acquisition (for representative/organic calculation) |
– | – | 5,577 | (4,050 | ) | – | – | |||||||||||||||||
| Adjusted revenue | 24,312 | -2.3% | 24,883 | 15,256 | +8% | 14,130 | ||||||||||||||||||
|
Impact of exchange |
1,448 | – | (700 | ) | – | |||||||||||||||||||
| Adjusted revenue at constant rates | 25,760 | +3.5% | 14,556 | +3% | ||||||||||||||||||||
| BAT Annual Report and Form 20-F 2018 | 33 | |
|
Financial Review
|
| Adjusted revenue growth from the Strategic Portfolio
|

| |||
| Change in adjusted revenue from the | ||||
| Strategic Portfolio at constant rates (%) | ||||
|
| ||||
| Definition: Change in revenue from the Strategic Portfolio before the impact of adjusting items and the impact of fluctuations in foreign exchange rates.
This measure was introduced in 2018, with no comparators provided. |
Reconciliation of revenue to adjusted revenue at constant rates of exchange, by product category
| 2018 £m
|
Adjusting items £m
|
Impact of exchange £m
|
Adjusted at constant 2018 £m
|
Adjusted at constant vs 2017 %
|
Adjusted at constant vs 2017 repres %
|
2017 £m
|
Acquisitions £m
|
2017 repres £m
|
||||||||||||||||||||||||||||
| Strategic Portfolio comprises: | ||||||||||||||||||||||||||||||||||||
| Combustible portfolio | 15,457 | – | 816 | 16,273 | +50.1% | +5.7% | 10,842 | 4,553 | 15,395 | |||||||||||||||||||||||||||
| Potentially reduced-risk products (PRRPs) | ||||||||||||||||||||||||||||||||||||
| Vapour |
318 | – | 7 | 325 | +93.5% | +26.0% | 168 | 90 | 258 | |||||||||||||||||||||||||||
| THP |
565 | – | 11 | 576 | +185.1% | +183.7% | 202 | 1 | 203 | |||||||||||||||||||||||||||
| NGP |
883 | – | 18 | 901 | +143.5% | +95.4% | 370 | 91 | 461 | |||||||||||||||||||||||||||
| Modern Oral |
34 | – | 2 | 36 | +140.0% | +140.0% | 15 | – | 15 | |||||||||||||||||||||||||||
| Traditional Oral |
883 | – | 33 | 916 | +136.7% | +9.0% | 387 | 453 | 840 | |||||||||||||||||||||||||||
| Oral |
917 | – | 35 | 952 | +136.8% | +11.3% | 402 | 453 | 855 | |||||||||||||||||||||||||||
| Total PRRPs | 1,800 | – | 53 | 1,853 | +140.0% | +40.8% | 772 | 544 | 1,316 | |||||||||||||||||||||||||||
| Strategic Portfolio | 17,257 | – | 869 | 18,126 | +56.1% | +8.5% | 11,614 | 5,097 | 16,711 | |||||||||||||||||||||||||||
| Other | 7,235 | (180 | ) | 579 | 7,634 | -0.8% | -6.6% | 7,692 | 480 | 8,172 | ||||||||||||||||||||||||||
| Revenue | 24,492 | (180 | ) | 1,448 | 25,760 | +33.4% | +3.5% | 19,306 | 5,577 | 24,883 | ||||||||||||||||||||||||||
| 34 | BAT Annual Report and Form 20-F 2018 | |
|
Strategic Report
|
Governance
|
Financial Statements
|
Other Information
|
Analysis of profit from operations, net finance costs and results from associates and joint ventures
| 2018 | 2017 | |||||||||||||||||||||||||||||||||||||||||
| Reported £m |
Adjusting items £m |
Adjusted £m |
Impact of exchange £m |
Adjusted at CC £m |
Reported £m |
Adjusting items £m |
Adjusted £m |
Uplift to include acq £m |
Adjusted repres £m |
|||||||||||||||||||||||||||||||||
| Profit from operations | ||||||||||||||||||||||||||||||||||||||||||
| US | 4,006 | 505 | 4,511 | 175 | 4,686 | 1,165 | 763 | 1,928 | 2,502 | 4,430 | ||||||||||||||||||||||||||||||||
| APME | 1,858 | 90 | 1,948 | 151 | 2,099 | 1,902 | 147 | 2,049 | 25 | 2,074 | ||||||||||||||||||||||||||||||||
| AmSSA | 1,544 | 194 | 1,738 | 184 | 1,922 | 1,648 | 134 | 1,782 | 22 | 1,804 | ||||||||||||||||||||||||||||||||
| ENA | 1,905 | 245 | 2,150 | 67 | 2,217 | 1,697 | 473 | 2,170 | 29 | 2,199 | ||||||||||||||||||||||||||||||||
| Total regions | 9,313 | 1,034 | 10,347 | 577 | 10,924 | 6,412 | 1,517 | 7,929 | 2,578 | 10,507 | ||||||||||||||||||||||||||||||||
| Net finance costs | (1,381 | ) | (4 | ) | (1,385 | ) | (30 | ) | (1,415 | ) | (1,094 | ) | 205 | (889 | ) | |||||||||||||||||||||||||||
| Associates and joint ventures | 419 | (32 | ) | 387 | 33 | 420 | 24,209 | (23,197 | ) | 1,012 | ||||||||||||||||||||||||||||||||
| Profit before tax | 8,351 | 998 | 9,349 | 580 | 9,929 | 29,527 | (21,475 | ) | 8,052 | |||||||||||||||||||||||||||||||||
| BAT Annual Report and Form 20-F 2018 | 35 | |
|
Financial Review
|
Income statement continued
Analysis of profit from operations, net finance costs and results from associates and joint ventures
| 2017 | 2016 | |||||||||||||||||||||||||||||||||||||||||
| Reported £m |
Adjusting £m |
Adjusted £m |
Impact of exchange £m |
Adjusted at CC £m |
Impact of acquisitions £m |
Adjusted organic at CC £m |
Reported £m |
Adjusting items £m |
Adjusted £m |
|||||||||||||||||||||||||||||||||
| Profit from operations |
||||||||||||||||||||||||||||||||||||||||||
| US |
1,165 | 763 | 1,928 | (101 | ) | 1,827 | (1,827 | ) | – | – | – | – | ||||||||||||||||||||||||||||||
| APME |
1,902 | 147 | 2,049 | (87 | ) | 1,962 | (31 | ) | 1,931 | 1,774 | 198 | 1,972 | ||||||||||||||||||||||||||||||
| AmSSA |
1,648 | 134 | 1,782 | 17 | 1,799 | (27 | ) | 1,772 | 1,422 | 262 | 1,684 | |||||||||||||||||||||||||||||||
| ENA |
1,697 | 473 | 2,170 | (153 | ) | 2,017 | (36 | ) | 1,981 | 1,479 | 345 | 1,824 | ||||||||||||||||||||||||||||||
| Total regions |
6,412 | 1,517 | 7,929 | (324 | ) | 7,605 | (1,921 | ) | 5,684 | 4,675 | 805 | 5,480 | ||||||||||||||||||||||||||||||
| Non-tobacco litigation: |
||||||||||||||||||||||||||||||||||||||||||
| Fox River/Flintkote |
– | – | – | – | – | (20 | ) | 20 | – | |||||||||||||||||||||||||||||||||
| Profit from operations |
6,412 | 1,517 | 7,929 | (324 | ) | 7,605 | 4,655 | 825 | 5,480 | |||||||||||||||||||||||||||||||||
| Net finance (costs)/income |
(1,094 | ) | 205 | (889 | ) | 56 | (833 | ) | (637 | ) | 108 | (529 | ) | |||||||||||||||||||||||||||||
| Associates and joint ventures |
24,209 | (23,197 | ) | 1,012 | (61 | ) | 951 | 2,227 | (900 | ) | 1,327 | |||||||||||||||||||||||||||||||
| Profit before tax |
29,527 | (21,475 | ) | 8,052 | (329 | ) | 7,723 | 6,245 | 33 | 6,278 | ||||||||||||||||||||||||||||||||
| 36 | BAT Annual Report and Form 20-F 2018 | |
|
Strategic Report
|
Governance
|
Financial Statements
|
Other Information
|
| Where resolution is not possible, tax disputes may proceed to litigation. The Group seeks to establish strong technical tax positions. Where legislative uncertainty exists, resulting in differing interpretations, the Group seeks to establish that its position would be more likely than not to prevail. Transactions between Group subsidiaries are conducted on arm’s-length terms in accordance with appropriate transfer pricing rules and OECD principles.
The tax strategy outlined above is applicable to all Group companies, including the UK Group companies; reference to tax authorities includes HMRC. |
Deferred tax asset/(liability)
|
| ||||||||||||
| 2018 £m |
2017 £m |
2016 £m |
||||||||||||
| Opening balance | (16,796 | ) | (216 | ) | (237 | ) | ||||||||
| Difference on exchange | (1,011 | ) | 852 | (39 | ) | |||||||||
| Recognised on acquisition of RAI | – | (27,065 | ) | – | ||||||||||
| Impact of US tax reforms | – | 9,620 | – | |||||||||||
| Changes in tax rates | 70 | – | – | |||||||||||
| Other (charges)/credits to the income statement | 304 | 152 | (4 | ) | ||||||||||
| Other (charges)/credits to other comprehensive income | (7 | ) | (133 | ) | 70 | |||||||||
| Other movements | 8 | (6 | ) | (6 | ) | |||||||||
| Closing balance | (17,432 | ) | (16,796 | ) | (216 | ) | ||||||||
| BAT Annual Report and Form 20-F 2018 | 37 | |
|
Financial Review
|
| Income statement continued
| ||||||||||||||
| 38 | BAT Annual Report and Form 20-F 2018 | |
|
Strategic Report
|
Governance
|
Financial Statements
|
Other Information
|
| BAT Annual Report and Form 20-F 2018 | 39 | |
|
Financial Review
|
| 40 | BAT Annual Report and Form 20-F 2018 | |
|
Strategic Report
|
Governance
|
Financial Statements
|
Other Information
|
| Reconciliation of total borrowings to adjusted net debt
|
||||||||||||
|
2018 |
2017 |
2016 |
||||||||||
| £m
|
£m
|
£m
|
||||||||||
| Total borrowings |
47,509 | 49,450 | 19,495 | |||||||||
| Derivatives in respect of net debt: |
||||||||||||
| – assets |
(647 | ) | (640 | ) | (809 | ) | ||||||
| – liabilities |
269 | 117 | 300 | |||||||||
| Cash and cash equivalents |
(2,602 | ) | (3,291 | ) | (2,204 | ) | ||||||
| Current available for sale investments |
(178 | ) | (65 | ) | (15 | ) | ||||||
| Net debt |
44,351 | 45,571 | 16,767 | |||||||||
| Purchase price adjustment (PPA) to RAI debt |
(944 | ) | (947 | ) | – | |||||||
| Adjusted net debt |
43,407 | 44,624 | 16,767 | |||||||||
| BAT Annual Report and Form 20-F 2018 | 41 | |
|
Financial Review
|
Foreign exchange rates
|
Average
|
Closing
|
|||||||||||||||||||||||||
| 2018 | 2017 | 2016 | 2018 | 2017 | 2016 | |||||||||||||||||||||
| Australian dollar |
1.786 | 1.681 | 1.824 | 1.809 | 1.730 | 1.707 | ||||||||||||||||||||
| Brazilian real |
4.868 | 4.116 | 4.740 | 4.936 | 4.487 | 4.022 | ||||||||||||||||||||
| Canadian dollar |
1.730 | 1.672 | 1.795 | 1.739 | 1.695 | 1.657 | ||||||||||||||||||||
| Euro |
1.130 | 1.142 | 1.224 | 1.114 | 1.127 | 1.172 | ||||||||||||||||||||
| Indian rupee |
91.227 | 83.895 | 91.022 | 88.916 | 86.343 | 83.864 | ||||||||||||||||||||
| Japanese yen |
147.376 | 144.521 | 147.466 | 139.733 | 152.387 | 144.120 | ||||||||||||||||||||
| Russian rouble |
83.677 | 75.170 | 91.026 | 88.353 | 77.880 | 75.429 | ||||||||||||||||||||
| South African rand |
17.643 | 17.150 | 19.962 | 18.321 | 16.747 | 16.898 | ||||||||||||||||||||
| US dollar |
1.335 | 1.289 | 1.355 | 1.274 | 1.353 | 1.236 | ||||||||||||||||||||
| 42 | BAT Annual Report and Form 20-F 2018 | |
|
Strategic Report
|
Governance
|
Financial Statements
|
Other Information
|
| Variance | ||||||||||||||||||||||||||||||||||
| United States | Americas and Sub-Saharan Africa | |||||||||||||||||||||||||||||||||
| 2018 | 2018 vs 2017 | 2018 vs 2017 | 2017 vs 2016 | 2018 | 2018 vs 2017 | 2018 vs 2017 | 2017 vs 2016 | |||||||||||||||||||||||||||
| Variance | % | (rep) % |
% | % | (rep) % |
% | ||||||||||||||||||||||||||||
| Volume (bn) | 77 | +118% | -5.3% | n/a | 157 | -5.4% | -5.4% | -4.2% | ||||||||||||||||||||||||||
| Movement in market share (bps) | -20 bps | n/a | -20 bps | +10 bps | ||||||||||||||||||||||||||||||
| Revenue (£m) | 9,495 | +128% | n/a | 4,111 | -4.9% | +7.1% | ||||||||||||||||||||||||||||
| Adjusted revenue at constant rates (£m) | 9,838 | +137% | +1.5% | n/a | 4,560 | +5.6% | +5.6% | +8.1% | ||||||||||||||||||||||||||
| Profit from operations (£m) | 4,006 | +244% | n/a | 1,544 | -6.3% | +15.9% | ||||||||||||||||||||||||||||
| Adjusted profit from operations at constant rates (£m) | 4,686 | +143% | +5.8% | n/a | 1,922 | +7.9% | +6.5% | +5.2% | ||||||||||||||||||||||||||
| Adjusted organic profit from operations at constant rates (£m) | n/a | +5.2% | ||||||||||||||||||||||||||||||||
| Europe and North Africa | Asia-Pacific and Middle East | |||||||||||||||||||||||||||||||||
| 2018 | 2018 vs 2017 | 2018 vs 2017 | 2017 vs 2016 | 2018 | 2018 vs 2017 | 2018 vs 2017 | 2017 vs 2016 | |||||||||||||||||||||||||||
| Variance | % | (rep) % |
% | % | (rep) % |
% | ||||||||||||||||||||||||||||
| Volume (bn) | 246 | -4.7% | -5.3% | -1.9% | 228 | +0.7% | +0.7% | -1.0% | ||||||||||||||||||||||||||
| Movement in market share (bps) | FLAT | +20 bps | +110 bps | +50 bps | ||||||||||||||||||||||||||||||
| Revenue (£m) | 6,004 | -1.7% | +14.7% | 4,882 | -1.8% | +4.3% | ||||||||||||||||||||||||||||
| Adjusted revenue at constant rates (£m) | 6,112 | +4.5% | +3.5% | +3.4% | 5,250 | +5.7% | +5.7% | +0.2% | ||||||||||||||||||||||||||
| Profit from operations (£m) | 1,905 | +12.3% | +14.7% | 1,858 | -2.3% | +7.2% | ||||||||||||||||||||||||||||
| Adjusted profit from operations at constant rates (£m) | 2,217 | +2.2% | +0.8% | +10.6% | 2,099 | +2.4% | +1.2% | -0.5% | ||||||||||||||||||||||||||
| Adjusted organic profit from operations at constant rates (£m) | +8.6% | -0.5% | ||||||||||||||||||||||||||||||||
Effective 1 January 2018, the Group, excluding the Group’s associate undertakings, was organised into four regions: The United States (US – Reynolds American Inc.), Asia-Pacific and Middle East (APME), Americas and Sub-Saharan Africa (AmSSA) and Europe and North Africa (ENA). For presentation purposes within this Annual Report and Form 20-F, all prior periods have been revised to be consistent with the current reporting structure.
| BAT Annual Report and Form 20-F 2018 | 43 | |
|
Financial Review
|
| United States
“Pricing and value share growth in combustibles, as well as increased Vuse consumables volumes, has more than offset total volume declines”
Ricardo Oberlander President and CEO (RAI)
|
|
| 44 | BAT Annual Report and Form 20-F 2018 | |
|
Strategic Report
|
Governance
|
Financial Statements
|
Other Information
|
Americas and Sub-Saharan Africa
| “Growth was driven by pricing, which more than offset volume declines in a difficult environment”
Luciano Comin Regional Director
Key markets
Argentina, Brazil, Canada, Caribbean, Central America, Chile, Colombia, Kenya, Mexico, Nigeria, Paraguay, Peru, South Africa, Venezuela
|
| |
| BAT Annual Report and Form 20-F 2018 | 45 | |
|
Financial Review
|
Regional review continued
Europe and North Africa
| “PRRPs are gaining a strong foothold with THP now present in 12 markets, while oral volumes have grown 45%”
Johan Vandermeulen Regional Director
Key markets
Austria, Bulgaria, Czech Republic, Denmark, Finland, France, Germany, Greece, Hungary, Italy, Norway, Poland, Russia, Spain, Sweden, Switzerland, Turkey, Ukraine
|
|
| 46 | BAT Annual Report and Form 20-F 2018 | |
|
Strategic Report
|
Governance
|
Financial Statements
|
Other Information
|
Asia-Pacific and Middle East
| “Growth was driven by volume recovery in Pakistan as well as strong performance of glo in Japan”
Guy Meldrum Regional Director
Key markets
Australia, Bangladesh, Cambodia, China, Hong Kong, Indonesia, Japan, Korea, Malaysia, New Zealand, Pakistan, Sri Lanka, Taiwan, Vietnam
|
|
| BAT Annual Report and Form 20-F 2018 | 47 | |
|
|
| 48 | BAT Annual Report and Form 20-F 2018 | |
|
Strategic Report
|
Governance
|
Financial Statements
|
Other Information
|
Risks
|
Competition from illicit trade
| ||
|
Increased competition from illicit trade – either local duty evaded, smuggled illicit white cigarettes or counterfeits.
| ||
| Time frame |
Strategic impact |
|||
|
|
|
|||
|
Long term
|
Growth
|
|||
| Impact |
||||
| Erosion of brand equity, with lower volumes and reduced profits. |
||||
|
Reduced ability to take price increases. |
||||
|
Investment in trade marketing and distribution is undermined.
|
||||
|
Tobacco, nicotine and other regulation inhibits growth strategy
| ||||
|
The enactment of regulation that significantly impairs the Group’s ability to communicate, differentiate, market or launch its products.
| ||
| Time frame |
Strategic impact |
|||
|
|
|
|||
| Medium term
|
Growth and Sustainability
|
|||
| Impact |
||||
| Erosion of brand value through commoditisation, the inability to launch innovations, differentiate products, maintain or build brand equity and leverage price. |
||||
| Regulation in respect of menthol may adversely impact individual brand portfolios. |
||||
| Adverse impact on ability to compete within the legitimate tobacco or nicotine industry and also with increased illicit trade. |
||||
| Reduced consumer acceptability of new product specifications, leading to consumers seeking alternatives in illicit trade. |
||||
| Shocks to share price on the announcement or enactment of restrictive regulation. |
||||
| Reduced ability to compete in future product categories and make new market entries. |
||||
| Increased scope and severity of compliance regimes in new regulation leading to higher costs, greater complexity and potential reputational damage or fines for inadvertent breach. |
||||
| Proposed EU Directive on single-use plastics could result in increased operational costs and/or a decline in sales volume.
|
||||
|
|
Please refer to pages 285 to 288 for details of tobacco and nicotine regulatory regimes under which the Group’s businesses operate.
|
|
Market size reduction and consumer down-trading
| ||||
|
The Group is faced with steep excise-led price increases and, due in part to the continuing difficult economic and regulatory environment in many countries, market contraction and consumer down-trading is a risk.
| ||||
|
Time frame |
Strategic impact |
|||
|
|
|
|||
| Short/Medium term
|
Growth
|
|||
|
Impact Volume decline and portfolio mix erosion.
Funds to invest in growth opportunities are reduced. |
||||
| BAT Annual Report and Form 20-F 2018 | 49 | |
|
Business Environment
|
Principal Group risks continued
Risks continued
|
Litigation
| ||||
|
Product liability, regulatory or other significant cases may be lost or compromised resulting in a material loss or other consequence.
| ||
| Time frame |
Strategic impact |
|||
|
|
|
|||
| Long term
|
Growth
|
|||
|
Impact |
||||
| Damages and fines, negative impact on reputation, disruption and loss of focus on the business. |
||||
| Consolidated results of operations, cash flows and financial position could be materially affected, in a particular fiscal quarter or fiscal year, by region or country, by an unfavourable outcome or settlement of pending or future litigation. |
||||
| Inability to sell products as a result of a successful patent infringement action may restrict growth plans and competitiveness.
|
||||
|
|
Please refer to note 28 in the Notes on the Accounts for details of contingent liabilities applicable to the Group. |
|
Geopolitical tensions
| ||||
|
Geopolitical tensions, civil unrest, terrorism and organised crime have the potential to disrupt the Group’s business in multiple markets.
| ||
| Time frame |
Strategic impact |
|||
|
|
|
|||
| Medium term
|
Growth
|
|||
| Impact
|
||||
| Potential loss of life, loss of assets and disruption to normal business processes. |
||||
| Increased costs due to more complex supply chain arrangements and/or the cost of building new facilities or maintaining inefficient facilities. |
||||
| Lower volumes as a result of not being able to trade in a country. |
||||
|
Disputed taxes, interest and penalties
| ||
| The Group may face significant financial penalties, including the payment of interest in the event of an unfavourable ruling by a tax authority in a disputed area.
| ||
| Time frame |
Strategic impact |
|||
|
|
|
|||
| Short/Medium term
|
Productivity
|
|||
|
Impact |
||||
| Significant fines and potential legal penalties. |
||||
| Disruption and loss of focus on the business due to diversion of management time. |
||||
| Impact on profit and dividend. |
||||
| 50 | BAT Annual Report and Form 20-F 2018 | |
|
Strategic Report
|
Governance
|
Financial Statements
|
Other Information
|
|
Significant increases or structural changes in tobacco-related taxes
|
|
The Group is exposed to unexpected and/or significant increases or structural changes in tobacco-related taxes in key markets. | ||
|
Time frame
|
Strategic impact
|
|||
|
|
|
|||
| Long term
|
Growth
|
|||
|
Impact |
||||
| Consumers reject the Group’s legitimate tax-paid products for products from illicit sources or cheaper alternatives.
Reduced legal industry volumes.
Reduced sales volume and/or portfolio erosion.
Partial absorption of excise increases.
|
||||
|
Foreign exchange rate exposures
| ||
|
The Group faces translational and transactional foreign exchange (FX) rate exposure for earnings/cash flows from its global business. | ||
|
Time frame
|
Strategic impact
|
|||
|
|
|
|||
| Short/Medium term
|
Productivity
|
|||
|
Impact |
||||
| Fluctuations in FX rates of key currencies against sterling introduce volatility in reported Earnings per share (EPS), cash flow and the balance sheet driven by translation into sterling of our financial results and these exposures are not normally hedged.
The dividend may be impacted if the payout ratio is not adjusted.
Differences in translation between earnings and net debt may affect key ratios used by credit rating agencies.
Volatility and/or increased costs in our business, due to transactional FX, may adversely impact financial performance.
|
||||
|
Injury, illness or death in the work place
|
|
The risk of injury, death or ill health to employees and those who work with the business is a fundamental concern of the Group and can have a significant effect on its operations. | ||
|
Time frame
|
Strategic impact
|
|||
|
|
|
|||
| Short term
|
Sustainability
|
|||
|
Impact |
||||
| Serious injuries, ill health, disability or loss of life suffered by employees and the people who work with the Group.
Exposure to civil and criminal liability and the risk of prosecution from enforcement bodies and the cost of associated fines and/or penalties.
Interruption of Group operations if issues are not addressed immediately.
High staff turnover or difficulty recruiting employees if perceived to have a poor Environment, Health and Safety (EHS) record.
Reputational damage to the Group. |
||||
| BAT Annual Report and Form 20-F 2018 | 51 | |
|
Business Environment
|
Principal Group risks continued
Risks continued
|
Solvency and liquidity
|
|
Liquidity (access to cash and sources of finance) is essential to maintaining the Group as a going concern in the short term (liquidity) and medium term (solvency). | ||
|
Time frame
|
Strategic impact
|
|||
|
|
|
|||
| Short/Medium term
|
Productivity
|
|||
|
Impact |
||||
| Inability to fund the business under the current capital structure resulting in missed strategic opportunities or inability to respond to threats.
Decline in our creditworthiness and increased funding costs for the Group.
Requirement to issue equity or seek new sources of capital.
Reputational risk of failure to manage the financial risk profile of the business, resulting in an erosion of shareholder value reflected in an underperforming share price.
|
||||
|
Inability to develop, commercialise and roll-out Potentially Reduced-Risk Products
| ||
|
Risk of not capitalising on the opportunities in developing and commercialising successful and consumer-appealing innovations. | ||
|
Time frame
|
Strategic impact
|
|||
|
|
|
|||
| Long term
|
Growth
|
|||
|
Impact |
||||
| Failure to deliver Group strategic imperative and 2020 growth ambition.
Potentially missed opportunities, unrecoverable costs and/or erosion of brand.
Reputational damage and recall costs may arise in the event of defective product design or manufacture.
Loss of market share due to non-compliance of product portfolio with regulatory requirements.
|
||||
| The Strategic Report was approved by the Board of Directors on 27 February 2019 and signed on its behalf by Paul McCrory, Company Secretary. | ||
| 52 | BAT Annual Report and Form 20-F 2018 | |
| Directors’ Report |
Strategic Report
|
Governance
|
Financial Statements
|
Other Information
|
|
|
Introduction & Board
|
Audit Committee
|
Nominations Committee
|
Remuneration Committee
|
Responsibility of Directors
| |||||||||||||||||||||
| on Governance | ||||||||||||||||||||||||||

|
Richard Burrows Chairman
|
Index to key elements | ||||
| Directors’ Report | ||||||
|
| ||||||
| Chairman’s introduction | 53 | |||||
|
| ||||||
| Board of Directors | 54 | |||||
|
| ||||||
| Management Board | 56 | |||||
|
| ||||||
| Leadership and effectiveness | 57 | |||||
|
| ||||||
| Board activities in 2018 | 58 | |||||
|
| ||||||
| Board effectiveness | 60 | |||||
|
| ||||||
| Audit Committee | 64 | |||||
|
| ||||||
| Nominations Committee | 71 | |||||
|
| ||||||
| Remuneration Report | ||||||
|
| ||||||
| Annual Statement on Remuneration | 73 | |||||
|
| ||||||
|
|
90 | |||||
| BAT Annual Report and Form 20-F 2018 | 53 | |
|
Directors’ Report
|
Board of Directors as at 27 February 2019
| 54 | BAT Annual Report and Form 20-F 2018 | |
|
Strategic Report
|
Governance
|
Financial Statements
|
Other Information
|
| BAT Annual Report and Form 20-F 2018 | 55 | |
|
Directors’ Report
|
Management Board as at 27 February 2019
|
|
|
|
|
|||||||||||||||||
| Nationality: American |
Nationality: Italian/Brazillian |
Nationality: Italian/Argentinian |
Nationality: British |
|||||||||||||||||
| Jerry was appointed Director, Legal & External Affairs and General Counsel in May 2015, having joined the Management Board as Group Corporate & Regulatory Affairs Director in January 2015. |
Marina joined the Management Board as Director, Digital and Information on 1 January 2019.
|
Luciano joined the Management Board as Regional Director, Americas and Sub-Saharan Africa on 1 January 2019. | Alan joined the Management Board as Group Operations Director in March 2013. | |||||||||||||||||
|
|
|
|
|
|||||||||||||||||
| Nationality: Italian/American |
Nationality: Korean |
Nationality: Dutch |
Nationality: Brazilian |
|||||||||||||||||
| Giovanni joined the Management Board as Group Human Resources Director in June 2011. He will step down from the Management Board at the end of March 2019.
|
Hae In joined the Management Board as Director, Talent and Culture Designate on 1 January 2019. She will become Director, Talent and Culture on 1 April 2019, succeeding Giovanni Giordano. | Paul joined the Management Board as Director, New Categories on 1 January 2019. | Tadeu was appointed Director, Group Transformation on 1 January 2019. In addition to this role, Tadeu has been appointed as Deputy Finance Director with effect from 1 March 2019. He will succeed Ben Stevens as Finance Director on 5 August 2019 and will be appointed to the Board as an Executive Director on the same date. | |||||||||||||||||
|
|
||||||||||||||||||||
|
|
|
|
|
|||||||||||||||||
| Nationality: New Zealand |
Nationality: British |
Nationality: Brazilian |
Nationality: Australian/British |
|||||||||||||||||
| Guy joined the Management Board as Regional Director, Asia-Pacific and Middle East on 1 January 2019. |
David was appointed Director, Research and Science on 1 January 2019, having joined the Management Board as Group Scientific Director in 2012. | Ricardo was appointed President and CEO of Reynolds American Inc. on 1 January 2018, having joined the Management Board as Regional Director for the Americas in 2013. | Naresh was appointed Director, Business Development in December 2016. He joined the Management Board in 2012 and has held various roles. Naresh will step down from the Management Board at the end of March 2019. | |||||||||||||||||
|
|
||||||||||||||||||||
|
|
|
|||||||||||||||||||
| Nationality: Belgian |
Nationality: British |
|||||||||||||||||||
| Johan was appointed Regional Director, Europe and North Africa on 1 January 2019. He joined the Management Board in 2014 and has held various roles. |
Kingsley was appointed Chief Marketing Officer on 1 January 2019. He joined the Management Board in 2012 and has held various roles. | |||||||||||||||||||
|
|
||||||||||||||||||||

|
For full biographies of the Management Board see pages 255 and 256 | |||||||||||||||||||||
| 56 | BAT Annual Report and Form 20-F 2018 | |
|
Strategic Report
|
Governance
|
Financial Statements
|
Other Information
|
Governance framework
The Board
The Board is collectively responsible to shareholders of the Company for its performance and for the Group’s strategic direction, its values and its governance. The Board provides the leadership necessary for the Group to meet its performance objectives within a robust framework of internal controls.
| BAT Annual Report and Form 20-F 2018 | 57 | |
|
Directors’ Report
|
|
|
| |||
|
Growth remains our key strategic focus. Continued investment in, and development of, our strategic focus areas is central to the Board’s annual agenda. |
The Board pays close attention to the Group’s operational efficiency and our programmes are aimed at delivering a globally integrated enterprise with cost and capital effectiveness.
| |||
| Activities in 2018 | Activities in 2018 | |||
| Reviewing: | Reviewing: | |||
|
– the Group’s transforming tobacco strategy, its implementation in international business regions and in the US, and oversight of resource allocation activities to support strategy execution;
– the Group’s financial performance and current outlook throughout the year, and the Group’s half-year and year-end results;
– Group and regional operating performance against the Group’s key performance metrics and the key challenges faced and opportunities for growth in each region;
– the Group’s product portfolio performance in the context of the broader competitor landscape, and strategic focus areas for the Group;
– the Group’s PRRP portfolio and new product launches;
– the Company’s share price performance, factors impacting share price performance and investor perspectives;
– the continued significant impact of foreign exchange rates on the Group’s financial performance, including measures taken by management to mitigate foreign exchange risks; and
– the quarterly financial performance of the associates of the Group. |
– operating performance on a Group, regional and key market level across the product portfolio, including PRRPs;
– the Group’s cash flow performance, including monitoring the progress to realise opportunities and optimise the balance sheet, to ensure the Group is able to invest for the future whilst reducing the carrying value of debt;
– transactional arrangements to implement the offer to bond holders to exchange US$17.25 billion of bonds for SEC registered bonds and approving associated transaction documentation;
– the Group’s compliance with its financing principles, including in relation to Group liquidity, capital allocation, adjusted net debt/ adjusted EBITDA, the Group’s revolving credit facilities, planned refinancing and other treasury activities for the year ahead;
– progress in delivering expected synergies of over US$400 million by the end of 2020 from the integration of RAI Companies;
– SOx compliance governance structures and controls and updates on implementation of the Group’s SOx compliance programme;
– Group supply chain strategy and optimisation programmes; and
– business transformation programmes to implement operational efficiencies. |
| 58 | BAT Annual Report and Form 20-F 2018 | |
|
Strategic Report
|
Governance
|
Financial Statements
|
Other Information
|
| Introduction & Board
|
Audit Committee |
Nominations Committee |
Remuneration Committee |
Responsibility of Directors
|
|
|
| |||
|
The Board places considerable emphasis on the need for our business, strategy and product portfolio to be sustainable for the long term, to meet the expectations of our stakeholders and inform our commitments to society.
|
Setting the ‘tone from the top’ is an important part of the Board’s role, helping to foster a culture centred on our Guiding Principles which harnesses diversity. | |||
|
Activities in 2018 |
Activities in 2018 | |||
| Reviewing: | Reviewing: | |||
| – the Group’s regulatory engagement activities and evolving product regulation;
– the US FDA’s proposed new measures in relation to vapour products and its proposal to regulate or prohibit menthol in cigarettes in the US following its announcement in November 2018;
– the status of litigation proceedings involving Group companies, including updates on the class-actions in Quebec Province against Group subsidiary Imperial Tobacco Canada, the Fox River and Kalamazoo River proceedings, and claims brought by RAI dissenting shareholders following acquisition of the remaining shares in RAI;
– updates on compliance matters, including allegations of misconduct, and progress of the Group’s ‘Delivery with Integrity’ compliance programme;
– environment, health and safety performance for the preceding year and long-term targets and action plans;
– refreshed International Marketing Principles, updates to the Group Supplier Code of Conduct and the Group’s annual Modern Slavery Act statement, and approving these for adoption;
– the Group’s leaf sustainability performance and its leaf footprint;
– the Group’s Risk Register, considering the Group’s risk appetite in the context of its strategic objectives, and determining the Group’s viability for reporting purposes, taking account of the Company’s current position and principal risks; and
– the Group’s director and officer insurance cover. |
– Executive Director and Management Board succession planning, and monitoring the progress of Management Board development plans;
– the effectiveness and performance of the Directors and Management Board members;
– Non-Executive Director Board and Committee appointments;
– the composition of Board Committees and approving changes to the Committees’ terms of reference;
– proposed changes to the roles and responsibilities of the Management Board and approving new appointments;
– the proposed new Directors’ Remuneration Policy;
– internal governance processes and workforce engagement mechanisms, and approving revisions to align with the UK Corporate Governance Code 2018;
– the Group’s talent and diversity strategy, and the progress of initiatives supporting its objectives;
– the Group’s existing short- and long-term employee incentive schemes to integrate the participation of RAI Companies’ employees into those schemes;
– the funding positions relating to the Group’s retirement benefit schemes; and
– the revised Group Data Privacy Policy and approving the policy for adoption across the Group. | |||
| BAT Annual Report and Form 20-F 2018 | 59 | |
|
Directors’ Report
|
| 60 | BAT Annual Report and Form 20-F 2018 | |
|
Strategic Report
|
Governance
|
Financial Statements
|
Other Information
|
|
Introduction & Board
|
Audit Committee |
Nominations Committee |
Remuneration Committee |
Responsibility of Directors |
| Directors: information and advice
| ||||
|
Information: Board and Committees |
– Directors receive papers for review in good time ahead of each meeting;
– the Company Secretary ensures effective information flow within and between the Board and its Committees, and between the Non-Executive Directors and senior management; and
– the Company Secretary, in conjunction with external advisers where appropriate, advises the Board on all governance matters. | |||
|
Advice |
– all Directors have access to the advice and services of the Company Secretary;
– a procedure is in place for all Directors to take independent professional advice at the Company’s expense if required; and
– each of the three principal Committees of the Board may obtain independent legal or other professional advice, at the Company’s expense, and secure attendance at meetings of outsiders if needed. | |||
| BAT Annual Report and Form 20-F 2018 | 61 | |
|
Directors’ Report
|
Board effectiveness continued
Compliance statement
| Throughout the year ended 31 December 2018, we applied the Main Principles of the April 2016 version of the UK Corporate Governance Code as it applies to the year ended 31 December 2018. The Company was compliant with all provisions.
The Board considers that this Annual Report and Form 20-F, and notably this section, provides the information shareholders need to evaluate how we have complied with our current obligations under the Code. For ease of reference, we prepare a separate voluntary annual compliance report by reference to each provision of the Code, available at www.bat.com/governance.
From 1 January 2019, we have applied the Principles of the July 2018 version of the UK Corporate Governance Code and we will report on our application of those Principles in the Company’s Annual Report and Form 20-F for 2019. |
We comply with the Disclosure Guidance and Transparency Rules requirements for corporate governance statements by virtue of the information included in this section, together with the information contained in the Other Information section.
As a result of the listing of the Company’s American Depositary Shares (ADSs) on the NYSE, the Company is required to meet certain NYSE requirements relating to corporate governance matters. Certain exceptions to these requirements apply to the Company as a foreign private issuer. For a discussion of the significant differences between the NYSE requirements and the Company’s practices, please see page 293. |
| 62 | BAT Annual Report and Form 20-F 2018 | |
|
Strategic Report
|
Governance
|
Financial Statements
|
Other Information
|
|
Introduction & Board
|
Audit Committee
|
Nominations Committee
|
Remuneration Committee
|
Responsibility of Directors
|
| BAT Annual Report and Form 20-F 2018 | 63 | |
|
Directors’ Report
|
| 64 | BAT Annual Report and Form 20-F 2018 | |
|
Strategic Report
|
Governance
|
Financial Statements
|
Other Information
|
| BAT Annual Report and Form 20-F 2018 | 65 | |
|
Directors’s Report
|
Audit Committee continued
| 66 | BAT Annual Report and Form 20-F 2018 | |
|
Strategic Report
|
Governance
|
Financial Statements
|
Other Information
|
| BAT Annual Report and Form 20-F 2018 | 67 | |
|
Directors’ Report
|
||||||||||||||
| Audit Committee continued
| ||||||||||||||
| 68 | BAT Annual Report and Form 20-F 2018 | |
|
Strategic Report
|
Governance
|
Financial Statements
|
Other Information
|
|
Introduction & Board
|
Audit Committee
|
Nominations Committee
|
Remuneration Committee
|
Responsibility of Directors
|
| BAT Annual Report and Form 20-F 2018 | 69 | |
|
Directors’ Report
|
||||||||||||||
| Audit Committee continued | ||||||||||||||
| 70 | BAT Annual Report and Form 20-F 2018 | |
|
Strategic Report
|
Governance
|
Financial Statements
|
Other Information
|
| BAT Annual Report and Form 20-F 2018 | 71 | |
|
Directors’ Report
|
Nominations Committee continued
|
Board Diversity Policy progress update |
||
| Board objective
|
Progress in 2018
| |
| Considering all aspects of diversity when reviewing the composition of, and succession planning for, the Board and Management Board.
|
– The Nominations Committee has regard to diversity in its broadest sense, including gender, social and ethnic background, and cognitive and personal strengths, when undertaking these activities.
| |
| Considering a wider pool of candidates of both genders for appointment to the Board.
|
– Executive search firms are engaged to support Board and Management Board succession planning where applicable and are required to provide gender-balanced shortlists of candidates. Succession planning for Executive Directors and Management Board members takes into account potential internal candidates from across the Group and potential external candidates.
| |
| Maintaining at least 30% female Board representation, with the ambition of progressing towards further gender balance.
|
– The representation of women on the Board will be 30% as at 1 April 2019 (30% as at 31 December 2018).
| |
| Giving preference, where appropriate, to engagement of executive search firms accredited under the Standard and Enhanced Code of Conduct for Executive Search Firms, including on gender diversity.
|
– Only executive search firms accredited under the Standard and Enhanced Code of Conduct for Executive Search Firms were engaged to provided executive search services to support Board and Management Board succession planning in 2018.
| |
| Oversight of the development of a pipeline of diverse, high- performing potential Executive Directors, Management Board members and other senior managers.
|
– The representation of women on the Management Board will be 14.3% as at 1 April 2019 (nil as at 31 December 2018), indicating the success of our Diversity & Inclusion strategy in delivering steady but significant progress. Please refer to page 25 for information about our Diversity & Inclusion strategy.
|
| 72 | BAT Annual Report and Form 20-F 2018 | |
|
Strategic Report
|
Governance
|
Financial Statements
|
Other Information
|

|
Dimitri Panayotopoulos Chairman of the Remuneration Committee
|
Index to our Remuneration Report | ||||||
| Policy Report | 76 | |||||||
| 1. | Overview of what our Executive Directors earned in 2018 and why | 90 | ||||||
| 2. |
Executive Directors’ remuneration for the year ended 31 December 2018 | 91 | ||||||
| 3. | Executive Directors’ remuneration for the upcoming year | 97 | ||||||
| 4. |
Chairman and Non-Executive Directors’ remuneration for the year ended 31 December 2018 | 100 | ||||||
| 5. | Directors’ share interests | 101 | ||||||
| 6. |
Other disclosures | 104 | ||||||
| 7. | The Remuneration Committee and shareholder engagement | 106 | ||||||
| 8. | Summary of our Directors’ Remuneration Policy | 109 | ||||||
|
The following Annual Report on Remuneration has been prepared in accordance with the relevant provisions of the Companies Act 2006 and as prescribed in The Large and Medium-sized Companies and Group (Accounts and Reports) (Amendment) Regulations 2013 (the UK Directors’ Remuneration Report Regulations). Where required and for the purpose of the audit conducted in accordance with International Standards on Auditing (ISA) data has been audited by KPMG and this is indicated appropriately.
| ||||||||
| BAT Annual Report and Form 20-F 2018 | 73 | |
|
Remuneration Report
|
Annual Statement on Remuneration continued
| 74 | BAT Annual Report and Form 20-F 2018 | |
|
Strategic Report
|
Governance
|
Financial Statements
|
Other Information
|
|
Introduction & Board |
Audit Committee
|
Nominations Committee
|
Remuneration Committee
|
Responsibility of Directors
|
| BAT Annual Report and Form 20-F 2018 | 75 | |
|
Remuneration Report
|
Annual Statement on Remuneration continued
Introduction
This policy section of the Remuneration Report (the Policy Report) sets out a proposed new Remuneration Policy for the Executive Directors and the Non-Executive Directors.
This new Remuneration Policy, which is intended to replace the current remuneration policy approved by shareholders at the 2016 AGM, is subject to a binding vote by shareholders at the AGM on 25 April 2019 and, if approved, will come into effect from 26 April 2019. The new Remuneration Policy is set out in full on the following pages with changes from the current remuneration policy identified for reference.
Principles of remuneration
The Committee’s remuneration principles are to:
| – | reward, as an overriding objective, the delivery of the Group’s long-term strategy in a manner which is simple, straightforward and understandable and which is aligned with shareholders’ interests; |
| – | structure a remuneration package that is appropriately positioned relative to the market and comprises core fixed elements and performance-based variable elements; |
| – | design the fixed elements of pay (comprising base salary, pension and other benefits) to recognise the skills and experience of our Executive Directors and to ensure current and future market competitiveness in attracting talent; |
| – | design the variable elements of pay (provided via two performance-based incentive schemes: a short-term incentive scheme delivered through a combination of a cash element and a deferral element, and a long-term incentive scheme), to be both transparent and stretching and to support, motivate and reward the successful delivery of the Group’s long-term strategy and growth for shareholders on a sustainable basis; |
| – | ensure that reputational, behavioural and other risks that can arise from target-based incentive plans are identified and mitigated; |
| – | maintain an appropriate balance between fixed pay and the opportunity to earn performance-related remuneration with immediate and deferred elements: the performance-based elements form, at maximum opportunity, between 80% and 90% of the Executive Directors’ total remuneration packages; |
| – | ensure, through its annual review, that the Remuneration Policy is both rigorously applied and remains aligned with the Company’s purpose, values and strategy and the need to promote the long-term success of the Company; and |
| – | ensure that remuneration arrangements are transparent and promote effective engagement with shareholders and the workforce. |
Summary of key changes
The background and explanation of the proposed key changes from the current remuneration policy are given in the Annual Statement from the Chairman of the Remuneration Committee starting on page 73 of this Remuneration Report. Those key changes have been further explained in relevant sections of the Policy Report as summarised below:
|
Policy Element
|
Change in Policy |
Page Number
| ||
|
Pensions |
The rate of pension provision under the defined contribution arrangements has been reduced from 35% of base salary to 15% of base salary, to ensure alignment with the defined contribution arrangements in place for UK employees. |
78 | ||
| Short-Term Incentive Scheme (STI), annual bonus opportunity |
The previous individual performance multiplier, allowing a +20% adjustment to the outcome based on the corporate result, has been removed with effect from the 2019 performance year. |
79 | ||
| Short-Term Incentive Scheme (STI), good leaver provisions |
Post-cessation payments to ‘good leavers’ will no longer be paid pro rata and ‘on target’ at leave date and instead will operate on a ‘wait and see’ basis, being paid pro rata, by reference to full year results and paid at the normal time in March of the following year. |
86 | ||
| Long-Term Incentive Plan (LTIP), award quantum |
The limit on the levels of award to Executive Directors other than the Chief Executive, which has featured in previous remuneration policies, has been removed. It is not intended that this will lead to a change in the maximum opportunity for the current Finance Director, but is believed to be appropriate to give flexibility over the life of the Remuneration Policy, while maintaining an appropriate level of differentiation between the Chief Executive and other Executive Directors. |
81 | ||
| Long-Term Incentive Plan (LTIP), performance measures |
The TSR comparator group is expanded to include the Altria Group for awards made from 2019. |
80 | ||
| Dividend equivalent payments |
For awards made from 2019, dividend equivalent payments under the Deferred Share Bonus Scheme (DSBS) and the LTIP will be settled in shares, rather than cash. |
79, 80 | ||
| Shareholding requirements |
Post-employment shareholding requirements have been introduced for former Executive Directors to hold shares equivalent to 100% of current shareholding requirements for two full years following the date of their departure.
|
81 |
| 76 | BAT Annual Report and Form 20-F 2018 | |
|
Strategic Report
|
Governance
|
Financial Statements
|
Other Information
|
|
Introduction & Board |
Audit Committee
|
Nominations Committee
|
Remuneration Committee
|
Responsibility of Directors
|
Future Policy Table – Executive Directors
|
Base salary
|
||||||||||||
| How the element supports the Company’s strategic objectives | To attract and retain high calibre individuals to deliver the Group’s long-term strategy and to offer market-competitive levels of guaranteed cash to reflect an individual’s skills, experience and role within the Company.
| |||||||||||
| Operation of the element 2019 Policy: no change in policy | Base salary is normally paid in 12 equal monthly instalments during the year. Salaries are normally reviewed annually in February (with salary changes effective from April) or subject to an ad hoc review on a significant change of responsibilities.
| |||||||||||
| Salaries are reviewed taking into account factors including individual performance as well as appropriate market data including general UK pay trends and a company size and complexity model based on a Pay Comparator Group including UK companies, the constituents of which for 2019 are as follows:
| ||||||||||||
| Altria Group | Anheuser-Busch InBev | AstraZeneca | Bayer | |||||||||
| BP | Coca-Cola | Colgate-Palmolive | Danone | |||||||||
| Diageo | Estée Lauder | GlaxoSmithKline | Heineken | |||||||||
| Imperial Brands | Japan Tobacco | Johnson & Johnson | Kellogg | |||||||||
| Kraft Heinz | L’Oréal | LVMH | Mondelēz International | |||||||||
| Nestlé | PepsiCo | Pfizer | Philip Morris International | |||||||||
| Procter & Gamble | Reckitt Benckiser | Royal Dutch Shell | Unilever | |||||||||
| Vodafone | ||||||||||||
|
The Committee will continue to exercise its judgement to vary the constituents of the Pay Comparator Group over the life of this Remuneration Policy. | ||||||||||||
|
Only base salary is pensionable.
| ||||||||||||
| Maximum potential value 2019 Policy: no change in policy | Annual increases for Executive Directors’ base salaries in the normal course will generally be in the range of the increases in the base pay of other UK-based employees in the Group and will not exceed 10% per annum during the policy period.
| |||||||||||
| The salary of a recently appointed Executive Director as he or she progresses in a role may exceed the top of the range of the salary increases for UK-based employees where the Committee considers it appropriate to reflect the accrual of experience. A significant change in responsibilities or material change in role may be reflected in an above average increase (which may exceed 10%) in salary.
| ||||||||||||
|
Benefits
|
||||||||||||
| How the element supports the Company’s strategic objectives | To provide market-competitive benefits consistent with the role which:
– attract and retain high calibre individuals to deliver the Group’s long-term strategy; and | |||||||||||
|
– recognise that such talent is global in source and that the availability of certain benefits (e.g. relocation, repatriation, taxation compliance advice) will from time to time be necessary to avoid such factors being an inhibitor to accepting the role.
| ||||||||||||
| Operation of the element 2019 Policy: no change in policy | The Company currently offers the following contractual benefits to Executive Directors: a car or car allowance; the use of a car and driver for personal and business use; employment tax advice (including in instances where multi-jurisdictional tax authorities are involved); tax equalisation payments (where appropriate); private medical insurance, including general practitioner ‘walk-in’ medical services; personal life and accident insurance; and housing and education allowances or similar arrangements as appropriate to family circumstances (anticipated to be provided for Executive Directors who relocate internationally).
| |||||||||||
| Other benefits may include the Executive Directors ‘and their partners’ attendance at hospitality or similar functions, and the provision of services and benefits which may be treated as benefits for tax purposes, such as the provision of home security and the reimbursement of expenses incurred in connection with their duties.
| ||||||||||||
| Other benefits not identified above may be offered if, in the Committee’s view, these are necessary in order to remain aligned with market practice.
| ||||||||||||
| With the exception of the car or car allowance, in line with the UK market and the practice followed for all the Group’s other UK employees, it is also practice to pay the tax that may be due on benefits.
| ||||||||||||
| The Company provides Directors and Officers liability insurance (D&O) and an indemnity to Directors to cover costs and liabilities incurred in the execution of their duties.
| ||||||||||||
| BAT Annual Report and Form 20-F 2018 | 77 | |
|
Remuneration Report
|
Annual Statement on Remuneration continued
| Maximum potential value 2019 Policy: no change in policy |
The maximum potential values are based on market practice for individuals of this level of seniority, with any tax on benefits paid by the Company in addition. | |
| The maximum annual value (subject to periodic inflation-related increases where applicable) that can be offered for the following benefits is: | ||
| – car allowance: £20,000; | ||
| – use of a car and company driver for personal and business use: cost is dependent on the miles driven in any year; | ||
| – the cost of private medical insurance is dependent on an individual’s circumstances and is provided on a family basis; | ||
| – GP ‘walk-in’ medical services located close to the Group’s headquarters in London: £5,000; | ||
| – personal life and accident insurance designed to pay out at a multiple of four and five times base salary, respectively; | ||
| – employment tax advice as required, but not exceeding £30,000 and tax equalisation payments as agreed by the Committee from time to time; and | ||
| – housing and education allowances or other similar arrangements, as appropriate to the individual’s family circumstances. | ||
|
Pensions
|
||
| How the element supports the Company’s strategic objectives |
To provide competitive post-retirement benefit arrangements which recognise both the individual’s length of tenure with the Group and the external environment in the context of attracting and retaining senior high calibre individuals to deliver the Group’s long-term strategy.
| |
| Operation of the element 2019 Policy: The rate of pension provision under the defined contribution arrangements is to be reduced from 35% of base salary to 15% of base salary, to ensure alignment with the defined contribution arrangements in place for UK employees. This change will apply to the newly-appointed Chief Executive.
This Remuneration Policy continues to be subject to Executive Directors being permitted to participate in legacy defined benefit arrangements.
This change will apply from 1 May 2019, being the start of the first payroll month after this Remuneration Policy will come into effect.
Please refer to the Statement of the Chairman of the Remuneration Committee on page 73 for further detail. |
Defined contribution benefits
Subject to participation in legacy arrangements, and with effect from 1 May 2019, Executive Directors are eligible to receive a pension benefit equivalent to 15% of base salary, which the Committee may determine to provide as a contribution into the defined contribution section of the British American Tobacco UK Pension Fund (the Pension Fund) (or a similar defined contribution arrangement from time to time) or as a gross cash sum paid in lieu thereof.
The level of contribution in the defined contribution section of the Pension Fund is restricted to take into account the annual allowance, and the individual may elect to accumulate any balance in the unfunded unapproved retirement benefits scheme (UURBS) or receive the balance as a gross cash sum.
Legacy arrangements
Executive Directors may continue to participate in the defined benefit section of the Pension Fund where they were doing so before the section closed to new members. This is the case for the Finance Director and could also apply to future Executive Directors where they have legacy participation in the defined benefit section prior to appointment to the Board. In addition, the legacy pension provision of internal appointees may differ marginally from that outlined in this Remuneration Policy and such arrangements would ordinarily continue to apply.
Where an individual is entitled to benefits calculated on a base salary that exceeds a scheme-specific salary cap, these are accrued in the UURBS.
Operation
The pension arrangements operate in accordance with the rules of the applicable scheme, including in respect of the benefits payable in the event of death or on early retirement. Details of the Executive Directors’ accrued pension benefits are provided in the Annual Report on Remuneration on page 95. | |
| Maximum potential value |
With effect from 1 May 2019 the maximum annual contribution in the defined contribution section of the Pension Fund is 15% of base salary. Excess benefits (whether accrued in the UURBS or paid as a cash sum) are subject to this same limit.
The pension accrual rate in respect of legacy participation in the defined benefit section of the Pension Fund will not exceed the maximum one-fortieth of salary per annum.
| |
| 78 | BAT Annual Report and Form 20-F 2018 | |
|
Strategic Report
|
Governance
|
Financial Statements
|
Other Information
|
|
Introduction & Board |
Audit Committee
|
Nominations Committee
|
Remuneration Committee
|
Responsibility of Directors
|
|
Short-term incentives: International Executive Incentive Scheme (IEIS)
| ||
| How the element supports
the |
To incentivise the attainment of corporate targets aligned to the Group’s strategic objectives on an annual basis, with a deferred element to ensure alignment with shareholders’ interests. | |
| To ensure, overall, a market-competitive package to attract and retain high calibre individuals to deliver the Group’s long-term strategy. | ||
| Operation of the element 2019 Policy: the previous individual performance multiplier, allowing a +20% adjustment to the outcome based on the corporate result, has been removed with effect from the 2019 performance year.
For DSBS awards from 2019 onwards, the dividend equivalent cash payments have been replaced by delivery of quarterly interim dividend equivalent shares.
|
IEIS comprises an annual award referenced to base salary, 50% of which is paid immediately in cash and 50% of which is awarded in shares through the Deferred Share Bonus Scheme (DSBS).
The deferred shares normally vest after three years and no further performance conditions apply in that period. Deferred shares attract a dividend equivalent which is delivered in additional quarterly interim dividend equivalent shares, which are subject to the shareholding requirements such that they cannot be sold unless the requirements have been met.
Awards under the IEIS are not pensionable and no element of the bonus is guaranteed.
IEIS cash payments are subject to clawback provisions, and the deferred shares element of the IEIS is subject to malus and clawback provisions, as described on page 81. | |
| Performance assessment 2019 Policy: no change in policy |
The Committee sets the performance targets each year and is also able to amend the performance measures and vary the weighting of them from year to year.
The Committee reviews performance for the prior year in February each year and the Group’s external auditors perform certain specified procedures to assist the Committee’s assessment of the calculations used to determine the IEIS corporate bonus outcomes and future targets.
The total payout is determined by the Company’s performance under each measure relative to that measure’s performance target. The Committee may at its discretion adjust, whether positively or negatively, the payout in circumstances where it considers it is appropriate to do so to reflect the overall performance of the Company.
In cases of identified poor individual performance, the corporate result may be reduced by up to 50%. | |
| Performance measures and weighting 2019 Policy: no change in policy. The current KPIs for 2019 remain the same as for 2018, reflecting the inclusion of Adjusted revenue growth from the Strategic Portfolio, which replaces Global Drive Brands and Key Strategic Brands and is now included as this is a central value driver for the Group’s business from both current and longer-term strategic perspectives. |
The IEIS contains four corporate performance measures (KPIs) and weightings measured over the financial year. These KPIs are the same as those KPIs used to measure performance against the Group’s long-term strategy as outlined and explained from page 20 of the Strategic Report:
1. Adjusted profit from operations (APFO) (30%). APFO is the adjusted profit from operations at constant rates of exchange. Please refer to page 261 for the detailed description of APFO.
2. Group’s share of key markets (10%). The Group’s retail market share in its Key Markets accounts for around 80% of the volumes of the Group’s subsidiaries. The Group’s share is calculated from data supplied by retail and audit service providers and is rebased as and when the Group’s Key Markets change. When rebasing does occur, the Company will also restate historic data and provide fresh comparative data on the markets.
3. Adjusted revenue growth from the Strategic Portfolio (30%). The Strategic Portfolio reflects the focus of the Group’s investment activity, and is defined as Global Drive Brands (GDBs); strategic brands in the US Market; and potentially reduced-risk products portfolio (Vapour, THP, Traditional Oral and Modern Oral brands). This measure is assessed at constant rates of exchange. Please refer to page 260 for the detailed description of the Strategic Portfolio.
4. Adjusted Cash generated from operations (ACGFO) (30%). Adjusted CGFO is defined as the net cash generated from operating activities, before the impact of adjusting items, dividends paid to non-controlling interests and received from associates, net interest paid and net capital expenditure. Adjusted CGFO is measured at constant rates of exchange. | |
| Maximum potential value and payment and threshold 2019 Policy: no change in policy |
The maximum annual bonus opportunity for the Chief Executive is 250% of base salary and for other Executive Directors is 190% of base salary.
The annual ‘on-target’ bonus opportunity for the Chief Executive is 125% of base salary and for other Executive Directors is 95% of base salary. For a bonus to be paid in respect of any performance measure, the applicable threshold performance must be exceeded (such that no bonus is paid at threshold). | |
| BAT Annual Report and Form 20-F 2018 | 79 | |
|
Remuneration Report
|
Annual Statement on Remuneration continued
|
Long-term incentives: Long-Term Incentive Plan (LTIP)
| ||||||||||||
| How the element supports the Company’s strategic objectives |
To facilitate the appointment of senior high calibre individuals required to deliver the Group’s long-term strategy, and to promote the long-term success of the Company. | |||||||||||
| To put in place a combination of measures with appropriately stretching targets around the long-term plan that provides a balance relevant to the Company’s business and market conditions as well as providing alignment between Executive Directors’ and shareholders’ interests. | ||||||||||||
| Operation of the element 2019 Policy: for LTIP awards from 2019 onwards, the dividend equivalent cash payments have been replaced by delivery of dividend equivalent shares at vesting |
Discretionary annual awards over shares with vesting levels based on the achievement of appropriately stretching targets against performance measures that are aligned to the Group’s long-term strategy over a three-year performance period, and with a five-year vesting period to ensure longer-term alignment with shareholders’ interests.
LTIP awards vest only to the extent that:
1. the performance condition is satisfied at the end of the three-year performance period; and
2. an additional vesting period of two years from the date of the third anniversary of the date of grant has been completed – the LTIP Extended Vesting Period.
Participants may receive a dividend equivalent which is delivered in additional shares on vesting at the end of the LTIP Extended Vesting Period to the extent to which awards vest. Dividend equivalent shares are subject to the shareholding requirements such that they cannot be sold unless the requirements have been met.
LTIP awards may be delivered in any form provided under the LTIP rules as approved by shareholders. Awards are subject to malus and clawback provisions, as described on page 81. | |||||||||||
| Performance assessment 2019 Policy: no change in policy |
The Committee sets the performance targets for the applicable performance period each year, including determining the total shareholder return (TSR) comparator group. The Committee is also able to amend the measures and vary the weighting of them from year to year, but will generally only seek to make amendments to them following consultation with shareholders.
The Committee may at its discretion adjust, whether positively or negatively, the level of vesting in circumstances where it considers it is appropriate to do so to reflect the overall performance of the Company. | |||||||||||
| Performance measures and weighting 2019 Policy: the TSR comparator group is expanded to include the Altria Group |
Performance is measured against five measures.
1. Relative TSR (20%). This measures TSR compared with a comparator peer group of international FMCG companies as determined annually by the Committee. Full vesting of this element is at top quartile performance. Threshold vesting is at median performance, at which 3% of the award will vest.
2. Adjusted diluted EPS growth at current exchange rates (20%). This measures growth in adjusted diluted EPS measured at current rates of exchange. Full vesting is at a compound annual growth rate (CAGR) of 10%. Threshold vesting is at a CAGR of 5%, at which 3% of the award will vest.
3. Adjusted diluted EPS growth at constant exchange rates (20%). This measures growth in adjusted diluted EPS measured at constant rates of exchange. Full vesting is at a CAGR of 10%. Threshold vesting is at a CAGR of 5%, at which 3% of the award will vest.
4. Adjusted revenue growth (20%). This measures adjusted revenue growth measured at constant rates of exchange. Full vesting is at a CAGR of 5%. Threshold vesting is at a CAGR of 3%, at which 3% of the award will vest.
There is an underpin to the adjusted revenue growth measure: no vesting will occur unless the corresponding three-year constant CAGR of adjusted profit from operations (APFO) exceeds the CAGR of the threshold performance level for APFO as approved annually in the STI and approved by the Board.
5. Adjusted operating cash flow conversion ratio (20%). This measures operating cash flow, at current rates of exchange, as a percentage of adjusted operating profit. Full vesting is at a ratio of 95%. Threshold vesting is at a ratio of 85%, at which 3% of the award will vest.
The current constituents of the TSR comparator group, for awards to be granted in 2019 are:
| |||||||||||
| Altria Group | Anheuser-Busch InBev | Campbell Soup | Carlsberg | |||||||||
| Coca Cola | Colgate-Palmolive | Danone | Diageo | |||||||||
| Heineken | Imperial Brands | Japan Tobacco | Johnson & Johnson | |||||||||
| Kellogg | Kimberley-Clark | LVMH | Mondelez International | |||||||||
| Nestlé | PepsiCo | Pernod Ricard | Philip Morris International | |||||||||
| Procter & Gamble | Reckitt Benckiser | Unilever | ||||||||||
| 80 | BAT Annual Report and Form 20-F 2018 | |
|
Strategic Report
|
Governance
|
Financial Statements
|
Other Information
|
|
Introduction & Board |
Audit Committee
|
Nominations Committee
|
Remuneration Committee
|
Responsibility of Directors
|
| Maximum potential value and payment at threshold |
The maximum annual award of shares permitted under the rules of the LTIP, as approved by shareholders, is 500% of salary for Executive Directors. If the threshold performance level is attained in respect of all five measures, 15% of the award will vest. | |
| 2019 Policy: the limit on the levels of award to Executive Directors other than the Chief Executive, which was featured in previous remuneration policies, has been removed. It is not intended that this will lead to a change in the maximum opportunity for the current Finance Director, but is believed to be appropriate to give flexibility over the life of the Remuneration Policy, while maintaining an appropriate level of differentiation between the Chief Executive and other Executive Directors. |
||
|
All-employee share schemes
|
||
| How the element supports the Company’s strategic objectives |
Executive Directors are eligible to participate in the Company’s all-employee share schemes which are designed to incentivise employees by giving them an opportunity to build shareholdings in the Company. | |
| Operation of the element 2019 Policy: no change in policy |
The Company currently operates two all-employee share schemes: the Sharesave Scheme, an HM Revenue & Customs (HMRC) tax-advantaged savings-related share option scheme, and the Share Incentive Plan (SIP) – an HMRC tax-advantaged plan operated by the Company to allow eligible employees to purchase shares in the Company (the Partnership Plan) and to make an annual award of free shares of a level based on performance in the previous financial year (the Share Reward Scheme). | |
| Maximum potential value 2019 Policy: no change in policy |
Executive Directors are subject to the same limits on participation as other employees, as defined by the applicable statutory provisions. Currently, these limits are monthly savings under the Sharesave Scheme of £500 per month, and annual share purchases under the Partnership Plan of £1,800 and annual share awards under the Share Reward Scheme of £3,600. | |
|
Shareholding requirements
|
||
| How the element supports the Company’s strategic objectives |
To strengthen the alignment between the interests of the Executive Directors and those of the shareholders by requiring Executive Directors to build up a high level of personal shareholding in the Company.
To ensure long-term alignment between the interests of the Executive Directors and those of shareholders through the operation of post-employment shareholding requirements. | |
| Operation of the element and performance metrics used 2019 Policy: post-employment shareholding requirements are to be introduced with effect from the approval of this Remuneration Policy, to achieve a longer-term alignment with the Group’s strategy and shareholders’ interests. |
Executive Directors are required to hold shares in the Company:
– during service as a Director, equal to the value of the same multiple of salary at which LTIP awards are made to that Director (and therefore of 500% for the CEO); and
– after ceasing service as a Director during the period until the second anniversary of cessation of employment with the Group, of a value equal to 100% of the shareholding requirement that applied whilst a Director. In order to monitor and enforce the above provisions, former Executive Directors are required to hold their shares in a nominee account in respect of which a sale restriction applies to shares held to comply with the requirements.
Those Executive Directors who do not, at any point, meet the shareholding requirements, may generally sell a maximum of up to 50% of any shares vesting (after tax) under the Company’s share plans until the threshold for the shareholding requirements has been met. The estimated notional net-of-tax number of shares held subject to unvested awards under the DSBS element, and LTIP Awards during the LTIP Extended Vesting Period, will count towards the respective shareholding requirements.
A waiver of compliance with the shareholding requirements is permitted at the discretion of the Committee in circumstances which the Committee considers to be exceptional.
|
Additional notes to the Future Policy Table:
| 1. | The Committee reserves the right to make any remuneration payments where the terms were agreed prior to an individual being appointed an Executive Director of the Company or prior to the approval and implementation of the Remuneration Policy (including, for the avoidance of doubt, pursuant to the current Remuneration Policy). This includes the achievement of the applicable performance conditions for Executive Directors who are eligible to receive payment from any award made prior to the approval and implementation of the Remuneration Policy. |
| 2. | The Company recognises the opportunities and benefits that accrue to the Company and its Executive Directors who undertake non-executive roles. Consequently, an Executive Director may, with the permission of the Board, undertake a single external appointment and the Executive Director may retain the fees from such appointment. |
| 3. | Malus and clawback: Bonus amounts paid under the IEIS are subject to clawback provisions, and awards made under the DSBS and the LTIP are subject to malus and clawback provisions. In summary, these provisions may be applied if, within specified periods of payment/grant; (1) there has been a material misrepresentation in relation to the performance of any Group company, relevant business unit and/or the participant; or (2) an erroneous calculation was made in assessing the extent to which an award vested or bonus was paid, which in either case resulted in the value of the award or payment being more than it should have been. These provisions may also be applied where a participant is found to have committed, at any time prior to payment of a bonus or the vesting of an award, an act or omission which justified dismissal for misconduct. Where the Committee determines that these provisions are to be applied, the participant may be required to repay up to the excess value which was paid or vested. This repayment may also be effected by the number of shares subject to the award being reduced and/or by a reduction in other cash or share-based awards held by the participant. |
| BAT Annual Report and Form 20-F 2018 | 81 | |
|
Remuneration Report
|
||||||||||||||
| Annual Statement on Remuneration continued | ||||||||||||||
Illustrations of the application of the Remuneration Policy
The levels of remuneration to be received by Jack Bowles and Ben Stevens as Executive Directors for the first complete year in which the Remuneration Policy will apply are shown as the hypothetical values of their remuneration packages under different performance scenarios in the charts below.
Remuneration outcomes for varying levels of performance
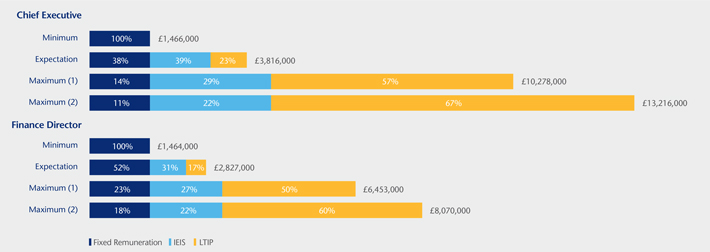
The following assumptions have been applied in the table above.
|
Maximum award opportunities (% of salary)
|
Chief Executive
|
Finance Director
| ||||
| STI (IEIS) | 250% | 190% | ||||
| LTI (LTIP) | 500% | 350% (current award level maintained for Ben Stevens) | ||||
| Minimum | Fixed salary, pension and benefits only: | No bonus payout; no vesting under LTIP | ||||
| Expectation | Fixed salary, pension and benefits, plus: | 50% of the maximum IEIS award; threshold vesting under the LTIP | ||||
| Maximum (1) | Fixed salary, pension and benefits, plus: | 100% payout of the IEIS; 100% vesting under the LTIP | ||||
| Maximum (2) | Fixed salary, pension and benefits, plus: | 100% payout of the IEIS; 100% vesting under the LTIP; 50% share price appreciation during the relevant performance period of LTIP | ||||
Notes:
| 1. | Benefits value for 2019: (1) comprises an estimated value of the car allowance, medical insurance, life assurance, tax advice and home security benefits, and associated tax costs, based where applicable on the values of the corresponding benefits in 2018, and for the Chief Executive taking into account an estimate of home security costs and an assumed value of tax advice based for these purposes on the policy maximum; (2) excludes any expenses incurred in connection with individual and/or accompanied attendance at certain business functions and/or corporate events; (3) excludes the cost of the car and driver provision as the cost of this benefit fluctuates annually depending on business need; and (4) in respect of all employee share plan participation, includes an assumed value of participation in the Share Reward Scheme based for these purposes on the plan maximum and excludes the value of any participation in the Sharesave Scheme or the Partnership Share Scheme. |
| 2. | Pension value for 2019: for the Chief Executive is based on the contribution rate of 15% of base salary that will apply under this Remuneration Policy with effect from 1 May 2019 and for the Finance Director represents an estimated value of his legacy arrangements based on the corresponding value in 2018. |
| 3. | No illustration is provided for Nicandro Durante, as he will cease to be an Executive Director from 1 April 2019, which is prior to the date on which this Remuneration Policy will (if approved by shareholders) come into force. |
| 82 | BAT Annual Report and Form 20-F 2018 | |
|
Strategic Report
|
Governance
|
Financial Statements
|
Other Information
|
|
Introduction & Board
|
Audit Committee
|
Nominations Committee
|
Remuneration Committee
|
Responsibility of Directors
|
| Other policy provisions in relation to Directors’ pay
| ||
| Flexibility, judgement and discretion
|
||
| As the Remuneration Policy needs to be capable of operating over a three-year period, the Committee has built in a degree of flexibility to enable the practical implementation of the Remuneration Policy over that prospective lifetime, including as set out in the Future Policy Table above. The key discretions and areas of flexibility and judgement are summarised as follows: | ||
| Salary |
To determine salary levels, including any annual salary increases. | |
| To review and change the pay comparator group to ensure that it remains appropriate. | ||
| Benefits |
To determine benefit provision. | |
| Pensions |
To determine the form and level of pension provision within the parameters set out in the policy. | |
| STI (cash and deferred shares) and LTIP |
To annually determine the targets for each STI performance measure, and to annually amend the performance measures and/or vary their weighting. | |
| To annually determine the targets for each LTIP performance measure, including to review and change the LTIP TSR comparator group. | ||
| To amend the LTIP performance measures and/or vary their weighting, although the Committee will generally only seek to make amendments following consultation with shareholders. | ||
| In respect of STI and LTIP: | ||
| – to adjust, whether positively or negatively, the level of payment/vesting in circumstances where the Committee considers it is appropriate to do so to reflect the overall performance of the Company. | ||
| – to alter performance conditions if events happen which cause the Committee to determine that the performance condition is no longer a fair measure of the Company’s performance, provided that the revised target is, in the opinion of the Committee, not materially less challenging than was intended in setting the original condition. | ||
| – to exercise the available discretions in connection with any termination of employment or a change of control or similar event. | ||
| – to determine whether awards under the LTIP are delivered as options or under any other form permitted under the LTIP rules as approved by shareholders and, in respect of operational matters not otherwise covered by the Policy, to operate the IEIS, DSBS and LTIP in accordance with their terms. | ||
| Other |
To determine (within the parameters set out in the Policy) appropriate contractual and remuneration arrangements in connection with the recruitment of a new Executive Director, and to determine, for an initial period only, to agree a contract of longer than a one-year rolling duration. | |
| Within the parameters set out in the Policy, to determine appropriate arrangements in connection with any termination of employment. | ||
| Within the parameters set out in the Policy, to agree a waiver of shareholding guidelines, whether during or after service. | ||
| To operate malus and clawback provisions.
| ||
| BAT Annual Report and Form 20-F 2018 | 83 | |
|
Remuneration Report
|
||||||||||||||
| Annual Statement on Remuneration continued | ||||||||||||||
| Approach to remuneration of Directors on recruitment
| ||
|
Principles
In making an Executive Director appointment (whether an internal promotion or external appointee) the Committee will follow these principles.
2019 Policy: no change in policy |
British American Tobacco seeks to appoint senior, high calibre managers. Many of its competitors for talent are based outside the UK.
To offer a package (both fixed salary, pension and performance-related remuneration) which is sufficiently competitive (but not excessively so) so that senior, high calibre candidates can be appointed, and which is designed to promote the long-term success of the Company. The Committee will consider the market, including the Pay Comparator Group, and by reference to other companies of equivalent size and complexity to ensure that it does not overpay.
Consideration will be given to relevant factors, such as the candidate’s skills, knowledge and experience and his or her current package and current location in determining the overall package. | |
| Internal pay relativities and the terms and conditions of employment of the new and existing Executive Directors will be considered to ensure fairness between Executive Directors.
| ||
|
External appointment to role of Executive Director – additional considerations
2019 Policy: no change in policy |
The Committee may exercise its discretion to award two or three-year contracts in the event that an Executive Director is recruited externally or from overseas; contracts with an initial period of longer than one year will then reduce to a one-year rolling contract after the expiry of the initial period.
The Committee will consider matching up to the maximum of the expected value of lost short or long-term incentive awards in order to facilitate the recruitment of that individual. | |
|
A replacement award would generally take the form of either a one-off award with a vesting period similar to the award given up (and, in the case of a replacement of a performance-based award, appropriate performance conditions) or a cash replacement payment in respect of an award that is within three months of vesting, although in either case the Committee may make other arrangements as it deems to be necessary. | ||
| Where appropriate, a replacement award will also be made subject to malus and clawback provisions. | ||
|
Relocation
British American Tobacco may provide appropriate relocation support. |
Relocation support of up to £200,000 may be provided in connection with recruitment. Examples of this support may include: shipment of goods; temporary accommodation; assistance to find accommodation; tax support services; and spouse or partner career counselling.
Inbound relocation and shipment expenses are subject to clawback provisions. | |
| 2019 Policy: no change in policy
|
||
| 84 | BAT Annual Report and Form 20-F 2018 | |
|
Strategic Report
|
Governance
|
Financial Statements
|
Other Information
|
|
Introduction & Board |
Audit Committee
|
Nominations Committee
|
Remuneration Committee
|
Responsibility of Directors
|
Service contracts – Executive Directors
The following table describes the provisions of the service contract of Jack Bowles. It is currently anticipated that service contracts for newly-appointed Executive Directors will not contain terms differing materially from these provisions (provided that other arrangements may be entered into in connection with the recruitment of Executive Directors, as described in the ‘Approach to remuneration of Directors on recruitment’ section on page 84).
|
Notice period
Employed on a permanent contract, terminable by either party on one-year’s notice. |
– A period of notice to be given by either the Executive Director or the Company of 12 months. | |||||
| – The Company may require the Executive Director to be on garden leave during all or any part of the period of notice (whether given by the Executive Director or the Company). | ||||||
| Contractual terms
The contract includes obligations which could give rise to, or impact upon, remuneration and/or payments for loss of office.
The provisions of the Company’s incentive arrangements applicable on a termination of employment are set out separately below. |
The primary obligations under the contract which may give rise to remuneration or payments for loss of office are as follows:
– to provide salary payment, contributions to applicable pension arrangements and benefits (whether in cash or in kind) as specified in the contract, and to reimburse reasonable expenses incurred by the Executive Director in performing his duties;
– to give the Executive Director eligibility to participate in annual and/or long-term incentive arrangements;
| |||||
| – to provide a company car and driver for personal and/or business use, and a car allowance; | ||||||
| – to provide 25 working days’ (plus public holidays) paid holiday per annum. On termination of employment the Company may at its discretion require the Executive Director to take all accrued holiday during any period of notice or pay him a sum in lieu; | ||||||
| – to provide sick pay at the Executive Director’s normal salary rate for up to 12 weeks during any rolling 12-month period, and thereafter at the Company’s discretion, subject to the Company’s Sick Pay Policy; | ||||||
| – to give the Executive Director eligibility to participate in a private medical expenses scheme and a personal accident scheme, and to provide life assurance benefits, subject to the terms and conditions of such schemes from time to time in force; | ||||||
| – to terminate the contract only on the expiry of 12 months’ written notice or to make a payment in lieu of notice in respect of all, or the unexpired part, of the 12 months’ notice calculated based on: (1) salary at then current base pay; and (2) the cost to the Company of providing private medical expenses insurance and personal accident insurance (or the Company may, at its option, continue those benefits for the unexpired period of the notice). In determining the value of a payment in lieu of notice the Company shall not be required to reward failure on the part of the Executive Director and shall have regard to corporate governance standards at the termination date. The Company may, at its reasonable discretion, make the payment in lieu of notice in phased monthly or quarterly instalments and may determine that it should be reduced in accordance with the duty on the part of the Executive Director to mitigate his loss; and | ||||||
| – to continue to pay the Executive Director’s salary and contractual benefits during any garden leave period. | ||||||
| In addition to the contractual rights to a payment on loss of office, the Executive Director may have statutory and/or common law rights to certain additional payments depending on the circumstances of the termination. | ||||||
| Legacy arrangements |
The contractual terms of the Finance Director, entered into prior to this Remuneration Policy coming into force, include the following provisions which are in addition to or differ from those described above: | |||||
| – the contractual entitlement to sick pay applies at the Executive Directors’ normal salary for a period of up to two months, and then half his normal salary for a period of up to one month, and thereafter at the Company’s discretion; | ||||||
| – any payment in lieu of notice is calculated based on: (1) salary at then current base pay; (2) car allowance; and (3) the cost to the Company of providing private medical expenses insurance, life assurance and personal accident insurance (or the Company may, at its option, continue any of those benefits for the unexpired period of the notice). Any payment in lieu of notice is payable in full on termination of employment; and | ||||||
| – for any time spent on garden leave, the assessment of the Executive Director’s performance under his relevant bonus scheme shall be at ‘target’ level.
| ||||||
|
Inspection of service contracts
Copies may be inspected at the Company’s registered office; these contracts are amended annually following the salary review.
|
The dates of the latest service contracts are shown below:
| |||||
| Executive Director | Execution date of current service contract | |||||
| Jack Bowles | 11 December 2018 (appointment as an Executive Director commenced 1 January 2019) | |||||
| Ben Stevens | 26 March 2008 (as amended by side letter dated 23 July 2010)
| |||||
| BAT Annual Report and Form 20-F 2018 | 85 | |
|
Remuneration Report
|
||||||||||||||
| Annual Statement on Remuneration continued | ||||||||||||||
| Policy on payment for loss of office
|
||||||||
|
Treatment of awards under the share incentive schemes: International Executive Incentive Scheme (IEIS)/Deferred Share Bonus Scheme (DSBS)
Long-Term Incentive Plan (LTIP) All-employee scheme
The release of awards is dependent on ‘leaver’ status and is at the discretion of the Committee. |
Plan |
‘Good leaver’ |
‘Other’ leaver scenarios | |||||
| IEIS and DSBS 2019 Policy: with effect from this Remuneration Policy coming into force, IEIS bonuses paid to good leavers are to be assessed on a ‘wait and see’ basis, by reference to full-year results, and paid at the normal time. |
‘Good leavers’ are eligible for a bonus pro-rated for the period of employment during the year.
Payments made during a notice period or after cessation may, at the discretion of the Committee, be made in cash only.
Bonuses are assessed based on actual full-year performance and paid at the normal time. Awards under the DSBS will vest upon termination of employment. |
No entitlement to a bonus but the Committee has the discretion to treat ‘other’ leavers in the same manner as ‘good leavers’; this discretion is not exercisable in the case of summary dismissal.
Awards under the DSBS will lapse unless the Committee, in its absolute discretion, decides otherwise. | ||||||
| LTIP 2019 Policy: no change in policy. |
Vesting occurs at the end of the LTIP Extended Vesting Period, subject to performance over the normal performance period and, where applicable, pro-rated for the period of employment during the performance period. | Unvested awards, including any awards which are still subject to the LTIP Extended Vesting Period, will lapse unless the Committee, in its absolute discretion, decides otherwise. | ||||||
| All-employee share schemes | Directors are treated in accordance with the scheme rules, in the same manner as applies to all employees. | |||||||
|
The Committee retains discretion in deciding ‘good leaver’ status other than in cases of automatic ‘good leavers’ as set out in the applicable provisions of the DSBS and LTIP rules. The discretionary powers are intended to provide flexibility as Executive Directors may leave employment for a broad variety of reasons which may not necessarily fall within the prescribed category of ‘good leaver’. The Committee exercises its discretion by reference to guidelines which set out its agreed relevant factors to assist in the determination of a leaver’s status. |
Guidelines |
|||||||
| Factors which may indicate that discretion may be exercised to treat as a ‘good leaver’
Resignation intending to cease work altogether.
Resignation intending to take up a different occupation, such as a portfolio career. Delayed resignation from the Company to accommodate the Company’s plans or the demands of his or her current workload.
Departure at the request of and/or with the agreement of the Company. |
Factors which may indicate that discretion may not be exercised
Resignation from the Company to work for a competitor or to undertake a role otherwise acting in conflict with the interests of the Company.
Resignation from the Company notwithstanding the Company’s plans and role demands.
Termination or resignation in any circumstance involving factors such as misconduct or poor performance. | |||||||
|
In exercising its discretion, the Committee will also take into account the individual’s overall performance as well as their contribution to the Company during their total period of employment.
| ||||||||
| 86 | BAT Annual Report and Form 20-F 2018 | |
|
Strategic Report
|
Governance
|
Financial Statements
|
Other Information
|
|
Introduction & Board |
Audit Committee
|
Nominations Committee
|
Remuneration Committee
|
Responsibility of Directors
|
|
Other |
Payment of legal fees incurred by an individual in connection with reviewing a settlement agreement on termination of employment.
Reimbursement of reasonable relocation costs of up to £200,000 where an Executive Director (and, where relevant, his or her family) had originally relocated to take up the appointment; this may include the shipment of personal goods and winding-up his or her affairs in the UK and the incidental costs incurred in doing so.
In certain circumstances, the Committee may approve new contractual arrangements with departing Executive Directors, potentially including (but not limited to) settlement, confidentiality, restrictive covenants and/or consultancy arrangements. These arrangements would only be entered into where the Committee believes that it is in the best interests of the Company and its shareholders to do so.
|
| BAT Annual Report and Form 20-F 2018 | 87 | |
|
Remuneration Report
|
||||||||||||||
| Annual Statement on Remuneration continued | ||||||||||||||
Statement of consideration of employment conditions elsewhere in the Company remuneration provisions applicable to the wider Group
Remuneration provisions applicable to the wider Group
The Group’s remuneration policies and practices are founded on a high degree of alignment and consistency across the organisation. Accordingly, remuneration for members of the Management Board and senior management is determined taking into account the remuneration principles that apply to the Executive Directors, and similar principles also form the basis of the remuneration arrangements for the wider workforce.
A globally consistent pay comparator group, derived from the peer group used by the Remuneration Committee for executive pay benchmarking, is utilised across all levels of the organisation for pay benchmarking purposes, with an appropriate level of flexibility provided to the other employing entities.
The approach to annual salary reviews is consistent across the Group, with consideration given to the scope of the role, level of individual experience, responsibility, individual performance and pay levels in the selected peer group.
All middle-to-senior managers are eligible to participate in a short-term incentive plan with the same metrics as Executive Directors. Other employees in corporate functions are eligible to participate in annual bonus plans, which mirror the Executive Directors’ performance objectives. Functional incentive schemes are offered to the Group’s employees in non-corporate positions such as sales force or manufacturing roles. Opportunities and metrics which apply to those schemes may vary by organisational level with functional performance indicators incorporated where appropriate.
Senior managers are eligible to participate in the long-term incentive programme (LTIP), with opportunities varying across levels with the most senior managers having a bigger portion of their pay delivered under the LTIP.
In the UK, all employees are encouraged to become shareholders by participating in all-employee share plans on the same terms as Executive Directors. Similar all-employee share schemes have been adopted for other jurisdictions with the goal of encouraging broader long-term employee ownership.
The key difference between Executive Directors’ remuneration and the wider employee population is the increased emphasis on long-term performance in respect of Executive Directors, with a greater percentage of their total remuneration being performance-related. This includes an additional two-year holding period on vested LTIPs, and post-employment shareholding requirements which do not apply to other employees. Under the LTIP, Executive Directors and Management Board members are subject to ’wait and see’ provisions requiring the full three-year performance measure to be assessed before vesting is determined.
Retirement benefits, typically in the form of a pension, are provided based on local market practice. Pension contribution rates for Executive Directors under the defined contribution scheme will be aligned with those available to the wider UK employee population. Other benefits provided to the wider employee population reflect local market practice and legislative requirements.
Process in setting Executive Directors’ remuneration
The Committee considers the budgeted salary increases for the UK-based employee population, the guidance given to managers on the range of salary increases and other remuneration arrangements and employment conditions for all UK-based employees when determining the remuneration for Executive Directors.
It is expected that future salary increases for Executive Directors will be in line with the range set out in the salary review guidelines for the general UK employee population, except in exceptional circumstances, such as where a recently-appointed Executive Director’s salary is increased to reflect his or her growth in the role over time or where significant additional responsibilities are added to the role.
As a key principle, management provides the Remuneration Committee with visibility of the potential impact of proposed changes to the Executive Directors’ Remuneration Policy on the wider employee population.
Workforce engagement
The Group has a range of well-established workforce engagement channels worldwide to ensure the Board, through updates provided by management, understands the views of the Group’s workforce across all jurisdictions in which the Group operates. Group engagement channels include works councils, meetings with the European Employee Council, town hall sessions, global, functional and regional webcasts, and CEO webcasts. Additionally, the Board undertakes a Group market or site visit on an annual basis, including meeting with local employees, and the Executive Directors regularly visit markets and local sites across the Group. A global employee opinion survey is conducted across the Group every two years. Questions on the Group’s pay arrangements are included in the survey and the outcomes are reviewed by the Remuneration Committee and the Board and then reported back across the Group. Regional and local Board Compensation Committees (covering our business units and global functions) are provided with the outcomes of remuneration policies and practices for the wider employee population and have visibility of key issues that may have an impact on competitiveness of remuneration elements.
From 1 January 2019, the Group has adopted an enhanced approach to workforce engagement worldwide, to ensure meaningful and regular dialogue is maintained between the Board and our workforce given its geographical spread, scale and diversity. In addition to the range of engagement channels above, which are implemented at market, business unit, functional and/or regional level as appropriate for the composition of the local workforce populations, the Group has implemented new reporting channels to enable regular reporting to the Board on workforce views on key topics at all levels across the Group, including pay and related policies. Board feedback and associated action planning, as appropriate, is cascaded back to the workforce and the Board is kept updated on progress against identified actions during the year.
The Remuneration Committee is regularly updated on the pay principles and practices in operation across the Group, in order to take these into account in setting the policy for Directors’ pay. Although employees are not specifically consulted on the policy for Directors’ pay as set out above, there continues to be an ongoing dialogue with employees, through a variety of channels, about the Company’s pay practices.
| 88 | BAT Annual Report and Form 20-F 2018 | |
|
Strategic Report
|
Governance
|
Financial Statements
|
Other Information
|
|
Introduction & Board
|
Audit Committee
|
Nominations Committee
|
Remuneration Committee
|
Responsibility of Directors
|
|
Chairman and Non-Executive Directors
| ||
| Fees 2019 Policy: no change in policy |
The Chairman receives a single all-inclusive fee. Other Non-Executive Directors receive a base fee and may also receive additional fees in respect of committee membership and/or chairmanship.
| |
| The Committee considers annually the fee payable to the Chairman and to the other Non- Executive Directors. This process may take into account factors including the breadth and demands of the relevant role as well as comparison with fees paid by the same comparator group of companies used for setting the base salary of Executive Directors. The annual review does not necessarily result in a change to the fees.
| ||
| It is anticipated that any future aggregate increase in fees for the Chairman and other Non- Executive Directors will generally be in the range of the increases in the base pay of UK-based employees in the Group and will not exceed 10% per annum during the policy period.1
| ||
| The Chairman and other Non-Executive Directors do not participate in any discussion on their own respective remuneration.
| ||
| Benefits, travel and related expenses 2019 Policy: no change in policy |
Non-Executive Directors may be reimbursed for the cost of travel, accommodation and related expenses incurred in connection with their duties and are eligible to use general practitioner ‘walk-in’ services. The Non-Executive Directors and their partners may attend hospitality or similar functions.
| |
| Benefits for the Chairman may also include: the use of a Company driver; private medical insurance and personal accident insurance benefits; the provision of home and personal security; and assistance in relation to personal tax matters.
| ||
| If necessary, the Company will pay for independent professional advice in connection with the performance of duties as Non-Executive Directors.
| ||
| The Company provides D&O insurance and an indemnity to the Non-Executive Directors to cover costs and liabilities incurred in the execution of their duties.
| ||
| In instances where any benefits, reimbursements or expenses are classified by HMRC as a benefit to the Non-Executive Directors, it is also the practice of the Company to pay any tax due on any such benefits.
| ||
| Other 2019 Policy: no change in policy |
There are no formal requirements or guidelines to hold shares in the Company. No Non- Executive Director is eligible to participate in the British American Tobacco share schemes, bonus schemes or incentive plans and no Non-Executive Director may be a member of any Group pension plan.
| |
Note:
| 1. | Aggregate fees limit: the total annual fees of the Chairman and other Non-Executive Directors are limited to the overall aggregate annual limit authorised by shareholders with reference to the Company’s Articles of Association (currently £2,500,000). |
Terms of Appointment for the Chairman and other Non-Executive Directors
Non-Executive Directors, including the Chairman, are appointed as officeholders, not employees. In any given year, the period of appointment runs from the close of the Company’s last AGM to the close of the Company’s next AGM.
The Chairman may terminate his or her appointment on one month’s written notice, and the Company may give a compensation payment in lieu of all or part of such notice. The Chairman may be removed by the Company prior to the expiry of his or her term of appointment by three months’ written notice or a compensation payment in lieu of all or part of such notice.
A Non-Executive Director may terminate his or her appointment at any time in accordance with the Company’s Articles of Association. Alternatively, a Non-Executive Director’s appointment will terminate if: (1) the Board requests that he or she not offer himself or herself for re-election at the next AGM; (2) the Non-Executive Director is not re-elected at the next AGM; (3) the Non-Executive Director is required to vacate office for any reason pursuant to any of the provisions of the Company’s Articles of Association; or (4) the Non-Executive Director is removed as Director or otherwise required to vacate office under any applicable law.
| BAT Annual Report and Form 20-F 2018 | 89 | |
|
Remuneration Report
|
1 Overview of what our Executive Directors earned in 2018 and why
What our Executive Directors earned in 2018
| Single figure for Executive |
Salary | Taxable benefits | Short-term incentives | Long-term incentives | Pension | Other emoluments | Total | |||||||||||||||||||||||||||||||||||||||||||||||||
| Directors | £’000 | £’000 | £’000 | £’000 | £’000 | £’000 | £’000 | |||||||||||||||||||||||||||||||||||||||||||||||||
| 2018 | 2017 | 2018 | 2017 | 2018 | 2017 | 2018 | 20171 | 2018 | 2017 | 2018 | 2017 | 2018 | 2017 | |||||||||||||||||||||||||||||||||||||||||||
| Nicandro |
1,295 | 1,235 | 295 | 218 | 3,275 | 3,039 | 3,510 | 5,411 | 430 | 307 | 32 | 34 | 8,837 | 10,244 | ||||||||||||||||||||||||||||||||||||||||||
| Durante |
||||||||||||||||||||||||||||||||||||||||||||||||||||||||
| Ben Stevens |
916 | 887 | 132 | 167 | 1,756 | 1,650 | 1,790 | 2,957 | 491 | 305 | 18 | 16 | 5,103 | 5,982 | ||||||||||||||||||||||||||||||||||||||||||
| Total |
2,211 | 2,122 | 427 | 385 | 5,031 | 4,689 | 5,300 | 8,368 | 921 | 612 | 50 | 50 | 13,940 | 16,226 | ||||||||||||||||||||||||||||||||||||||||||
Note:
| 1. | Long-term incentives shown for 2017: in accordance with the UK Directors’ Remuneration Report Regulations, estimates for the values of the vesting 2015 LTIP awards were given in the Annual Report on Remuneration 2017; these amounts have been re-presented to show the actual market value on the date of vesting in 2018. |
Further information in respect of this remuneration can be found in Section 2 on page 91.
How this aligns to performance
| Short-term incentives for the performance period ended in 2018 | ||
| Vesting at: | ||
| Chief Executive: corporate performance – 250% of salary; individual performance adjustment is not applicable | ||
| Finance Director: corporate performance – 190% of salary; individual performance adjustment is not applicable | ||
| Adjusted profit from operations (APFO) | Adjusted revenue growth from the Strategic Portfolio | |
| at constant rates of exchange +4% growth on a representative basis |
+8.5% growth on a representative basis | |
| Group share of Key Markets | Adjusted cash generated from operations (Adjusted CGFO) | |
| +40 bps | at constant rates of exchange Exceeded the maximum performance level set by the Remuneration Committee (equivalent to 112.2% operating cash flow conversion) | |
| Long-term incentives for the three year performance period ended in 2018 | ||
| Vesting at 70.5% | ||
| Total shareholder return (TSR) | 0% achievement | |
| 19 out of 23 in FMCG comparator group 2016–2018 | (0% of award vesting out of possible 20%) | |
| Adjusted diluted earnings per share (EPS) growth | 100% achievement | |
| 12.5% CAGR at current rates of exchange | (20% of award vesting out of possible 20%) | |
| Adjusted diluted earnings per share (EPS) growth | 100% achievement | |
| 10.7% CAGR at constant rates of exchange | (20% of award vesting out of possible 20%) | |
| Adjusted revenue growth | 52.5% achievement | |
| 3.9% CAGR at constant rates of exchange | (10.5% of award vesting out of possible 20%) | |
| Adjusted operating cash flow conversion ratio | 100% achievement | |
| 100.8% ratio over the performance period | (20% of award vesting out of possible 20%) | |
Non-GAAP measures
Adjusted profit from operations (APFO), adjusted cash generated from operations (Adjusted CGFO), adjusted diluted EPS, adjusted revenue and operating cash flow conversion ratio are non-GAAP measures used by the Remuneration Committee to assess performance. Please refer to pages 258 to 266 for definitions of these measures and a reconciliation of these measures to the most directly comparable IFRS measure where applicable.
For the purposes of the Remuneration Report in relation to STI and LTIP performance measures, APFO, Adjusted CGFO, Adjusted revenue and Adjusted operating cash flow conversion ratio for 2018 are measured on a representative basis to include the impact of acquisitions in 2017 as though they were acquired for the whole of that period.
| 90 | BAT Annual Report and Form 20-F 2018 | |
|
Strategic Report
|
Governance
|
Financial Statements
|
Other Information
|
|
Introduction & Board
|
Audit Committee
|
Nominations Committee
|
Remuneration Committee
|
Responsibility of Directors
|
2 Executive Directors’ remuneration for the year ended 31 December 2018
Total remuneration for the year ended 31 December 2018
| Nicandro Durante |
Ben Stevens | For further information |
||||||||||||||||||||
| 2018 | 2017 | 2018 | 2017 | |||||||||||||||||||
| £’000 | £’000 | £’000 | £’000 | |||||||||||||||||||
|
Salary |
1,295 | 1,235 | 916 | 887 | ||||||||||||||||||
| Taxable benefits1 |
||||||||||||||||||||||
| – car allowance |
16 | 16 | 14 | 14 | ||||||||||||||||||
| – health insurance |
7 | 6 | 10 | 9 | ||||||||||||||||||
| – tax advice |
62 | 6 | – | – | ||||||||||||||||||
| – use of Company driver |
83 | 64 | 100 | 80 | ||||||||||||||||||
| – home and personal security |
121 | 115 | 6 | 44 | ||||||||||||||||||
| – other expenses related to individual and/or accompanied attendance at Company functions/events |
6 | 11 | 2 | 20 | ||||||||||||||||||
| Total taxable benefits |
295 | 218 | 132 | 167 | ||||||||||||||||||
| Short-term incentives |
||||||||||||||||||||||
| STI vesting percentage (% of maximum) |
100% | 97.2% | 100% | 97.2% | ||||||||||||||||||
| STI: cash – Group performance element |
1,637.5 | 1,266 | 877.8 | 687.5 | ||||||||||||||||||
| STI: cash – Individual performance adjustment factor |
– | 507 | – | 275 | ||||||||||||||||||
| STI: DSBS – Group performance deferred element |
1,637.5 | 1,266 | 877.8 | 687.5 | ||||||||||||||||||
| Total short-term incentives |
3,275 | 3,039 | 1,756 | 1,650 | Page 92 | |||||||||||||||||
| Long-term incentives |
||||||||||||||||||||||
| LTIP vesting percentage (% of maximum) |
70.5% | 96.1% | 70.5% | 96.1% | ||||||||||||||||||
| LTIP value to vest |
3,001 | 2 | 4,833 | 3 | 1,531 | 2 | 2,641 | 3 | ||||||||||||||
| Dividend equivalent |
509 | 578 | 4 | 259 | 316 | 4 | ||||||||||||||||
| Total long-term incentives |
3,510 | 5,411 | 1,790 | 2,957 | Page 94 | |||||||||||||||||
| Total pension-related benefits |
430 | 307 | 491 | 305 | Page 95 | |||||||||||||||||
| Other emoluments |
||||||||||||||||||||||
| Life insurance |
29 | 26 | 15 | 12 | ||||||||||||||||||
| Share Reward Scheme (value of ordinary shares awarded) |
3 | 4 | 3 | 4 | ||||||||||||||||||
| Sharesave Scheme (face value of discount on options granted) |
– | 4 | 5 | – | – | |||||||||||||||||
| Total other emoluments |
32 | 34 | 18 | 16 | ||||||||||||||||||
| Total remuneration |
8,837 | 10,244 | 5,103 | 5,982 | ||||||||||||||||||
Notes:
| 1. | Taxable benefits: the figures shown are gross amounts as in line with the UK market; it is the normal practice of the Company to pay the tax which may be due on any benefits, with the exception of the car or car allowance. Ben Stevens’ home and personal security benefit in 2017 included costs associated with installation of a new home security system. Nicandro Durante’s tax advice cost in 2018 is net £28,371; the number presented above is inclusive of applicable VAT and income tax. |
| 2. | LTIP award shown for 2018: the 2016 LTIP award is due to vest on 12 May 2021 based on performance to 31 December 2018. The value shown is based on the average share price for the three-month period ended 31 December 2018 of 3,029.52p. |
| 3. | LTIP award shown for 2017: the values disclosed in the Annual Report on Remuneration for the year ended 31 December 2017 were estimated values as the award had not vested by the date of that report; these amounts have been re-presented based on the actual market value on the date of vesting of 27 March 2018 of 3,946p. |
| 4. | LTIP dividend equivalent payments: the dividend equivalent payment that will attach to the LTIP award that is included in the Single Figure Table is reported. The values for the year ended 31 December 2017 have been restated on this basis. |
| 5. | Sharesave Scheme: the value disclosed for the year ended 31 December 2017 represents the difference between the closing share price on the working day prior to the start of the invitation period (24 February 2017) of 5,070p and the option price of 4,056p. |
| BAT Annual Report and Form 20-F 2018 | 91 | |
|
Remuneration Report
|
||||||||||||||
| Annual Report on Remuneration continued | ||||||||||||||
Short-term incentives for the year ended 31 December 2018
Timing of disclosures
In previous years, publication of the STI targets has been deferred for one year on the basis of the commercially sensitive nature of those targets. Notwithstanding that the Remuneration Committee continues to consider that STI targets remain commercially sensitive, the Remuneration Committee has, on balance, decided that publication of STI targets will in future be published in the remuneration report following the end of the relevant performance year. Consequently, this year’s remuneration report sets out the targets relating to both the 2017 and 2018 performance years.
Disclosure of the specific targets for the STI in the year ended 31 December 2017, and the outcomes against those targets, are included on page 104.
| STI performance measures, weightings and results for year ended 31 December 2018
| ||||
| STI: performance measure and target 2018
|
Description of measure 2018
|
Actual performance 2018
| ||
| Adjusted profit from operations (APFO) (growth over prior year) Weighting: 30%
Threshold: 1% growth over 2017
Maximum: 3.7% growth over 2017
|
APFO is the adjusted profit from operations at constant rates of exchange for the year ended 31 December 2018. Please refer to page 261 for the detailed description of APFO. | APFO growth over the prior year of 4% on a representative basis.
Strategic Report: Delivering our strategy – Productivity | ||
|
Group’s share of Key Markets (growth over prior year) Weighting: 10%
Threshold: 0 bps growth over 2017
Maximum: 20 bps growth over 2017 |
The Group’s retail market share in its Key Markets accounts for around 80% of the volumes of the Group’s subsidiaries. The Group’s share is calculated from data supplied by retail audit service providers and is rebased as and when the Group’s Key Markets change. When rebasing does occur, the Company will also restate historic data and provide fresh comparative data on the markets. |
Global market share in key markets grew by 40 bps.
Strategic Report: Delivering our strategy – Growth | ||
|
Adjusted revenue growth from the Strategic Portfolio (growth over prior year) Weighting: 30%
Threshold: 2% growth over 2017
Maximum: 7.8% growth over 2017 |
The Strategic Portfolio reflects the focus of the Group’s investment activity, and is defined as Global Drive Brands (GDBs), strategic brands in the US Market, and PRAP brands (Vapour, THP, Traditional Oral and Modern Oral portfolio). This measure is assessed at constant rates of exchange. Please refer to page 260 for the detailed description of the Strategic Portfolio. |
Adjusted revenue from the Strategic Portfolio grew by 8.5% on an representative basis.
Strategic Report: Delivering our strategy – Growth
| ||
|
Adjusted cash generated from operations (Adjusted CGFO) (as against adjusted budget) Weighting: 30%
Threshold: Equivalent to 102.8% operating cash flow conversion
Maximum: Equivalent to 105.8% operating cash flow conversion |
Adjusted CGFO is defined as the net cash generated from operating activities, before the impact of adjusting items, dividends paid to non-controlling interests and received from associates, net interest paid and net capital expenditure.
Adjusted CGFO is measured at constant rates of exchange. |
Adjusted CGFO exceeded the maximum performance level set by the Remuneration Committee (equivalent to 112.2% operating cash flow conversion).
Strategic Report: Delivering our strategy – Productivity | ||
| 92 | BAT Annual Report and Form 20-F 2018 | |
|
Strategic Report
|
Governance
|
Financial Statements
|
Other Information
|
|
Introduction & Board
|
Audit Committee
|
Nominations Committee
|
Remuneration Committee
|
Responsibility of Directors
|
Consideration of individual performance adjustment factor
In addition to the Company-based STI corporate performance measures, the Remuneration Committee has also reviewed each Executive Director’s personal performance against a weighted set of operational and strategic measures. These were agreed as their specific individual objectives at the beginning of the year and depend on the priorities for each Director’s area of responsibility in the context of the delivery of Group strategy. Personal performance rated as ‘Outstanding’ can result in an adjustment factor of up to 20% to the corporate STI result but is subject to the applicable maximum award limit. Personal performance rated as ‘Requires Improvement’ results in any corporate STI result being reduced by 50%. No individual performance adjustment factor is applicable for the 2018 STI results.
STI outcome for year ended 31 December 2018
| Available STI award as % of base salary |
Group % result | Individual performance adjustment factor % |
STI award achieved % of base salary |
STI award achieved £’000 (Value shown in Single Figure Table) |
||||||||||||||||
| Nicandro Durante |
250% | 100% | n/a% | 250% | 3,275 | |||||||||||||||
| Ben Stevens |
190% | 100% | n/a% | 190% | 1,756 | |||||||||||||||
50% of the award in respect of the Group result will be paid in cash and 50% as an award under the DSBS.
Note:
| 1. | DSBS: awards made under the DSBS are in the form of free ordinary shares in the Company that normally vest after three years and no further performance conditions apply in that period. In certain circumstances, such as resigning before the end of the three-year period, participants may forfeit all of the shares. Malus-only provisions apply for DSBS awards made from 2014 and clawback provisions operate from 2016 STI cash awards. |
| BAT Annual Report and Form 20-F 2018 | 93 | |
|
Remuneration Report
|
||||||||||||||
| Annual Report on Remuneration continued
| ||||||||||||||
Long-term incentives (LTIP) for the year ended 31 December 2018
LTIP performance measures, weightings and results for the year ended 31 December 2018
| LTIP: performance measure
|
Description of measure and target for
2016 LTIP
|
Result achieved
|
Vesting percentage
| |||||
| Relative TSR1 Relative to a peer group of |
2016–2018 LTIP target |
Ranked 19 out of 23 |
0% (out of maximum of 20%) | |||||
|
| ||||||||
| international FMCG companies | Threshold | At median, 3% vests | ||||||
|
|
||||||||
| Weighting: 20% | Maximum | At upper quartile, 20% vests | ||||||
| EPS growth at current exchange rates | 12.5% CAGR | 20% (out of maximum of 20%) | ||||||
| Compound annual growth in adjusted diluted EPS measured at current rates of exchange |
2016–2018 LTIP target | |||||||
|
|
||||||||
| Threshold | At CAGR of 5%, 3% vests | |||||||
|
|
||||||||
| Maximum | At CAGR of 10%, 20% vests | |||||||
| Weighting: 20% | ||||||||
| EPS growth at constant exchange rates | 10.7% CAGR | 20% (out of maximum of 20%) | ||||||
| Compound annual growth in adjusted diluted EPS measured at constant rates of exchange |
2016–2018 LTIP target | |||||||
|
|
||||||||
| Threshold | At CAGR of 5%, 3% vests | |||||||
|
|
||||||||
| Maximum | At CAGR of 10%, 20% vests | |||||||
| Weighting: 20% | ||||||||
| Adjusted revenue growth2 | 3.9% CAGR | 10.5% (out of maximum of 20%) | ||||||
| Compound annual growth measured at constant rates of exchange | 2016–2018 LTIP target | |||||||
|
|
||||||||
| Threshold | At CAGR of 3%, 3% vests | |||||||
|
|
||||||||
| Maximum | At CAGR of 5%, 20% vests | |||||||
| Weighting: 20% | ||||||||
| Adjusted Operating cash flow conversion ratio | 100.8% ratio | 20% (out of maximum of 20%) | ||||||
| Ratio over the performance period at current exchange rates | 2016–2018 LTIP target | |||||||
|
|
||||||||
| Threshold | Ratio of 85%, 3% vests | |||||||
|
|
||||||||
| Maximum | Ratio of 95%, 20% vests | |||||||
| Weighting: 20% | ||||||||
| Total vesting level | 70.5% vesting | |||||||
Note:
| 1. | Relative TSR: the constituents of the FMCG peer group are listed on page 80. |
| 2. | The underpin for adjusted revenue growth measure: the adjusted revenue growth measure can only vest provided the corresponding three-year CAGR of APFO exceeds the CAGR of the threshold performance level for APFO as approved annually in the STI and approved by the Board. The underpin was exceeded with reference to the APFO STI outcomes for 2016, 2017 and 2018. |
Impact of the RAI acquisition on 2016 LTIP awards
Following the acquisition of the remaining shares of RAI which the Group did not already own on 25 July 2017, the Committee has taken time to consider how the impact of this major acquisition should be treated for the purposes of the 2017 performance year within the 2016 LTIP award. As a result of this review, the following treatments have been applied in respect of the RAI acquisition:
| – | relative TSR and EPS growth – no further adjustments were needed as the incremental costs and benefits associated with the acquisition are already factored into performance; and |
| – | adjusted revenue growth and underpin – the 2017 performance year was measured based on organic BAT performance (excluding the impact of RAI and other 2017 acquisitions) to allow for a like-for-like comparison. The 2018 performance year was measured on a representative basis; please refer to page 259 for further details. |
The Remuneration Committee believe this is the correct, fair and appropriate way to treat the acquisition of RAI.
LTIP outcome for year ended 31 December 2018
|
Number of ordinary shares award |
Vesting % achieved (based on 2016–2018 performance period) |
Number of ordinary to vest |
Value of ordinary shares to vest1 £’000 |
Dividend equivalent £’000 |
Total value to vest £’000 | |||||||||||||||||
| Nicandro Durante |
140,529 | 70.5% | 99,072 | 3,001 | 509 | 3,510 | ||||||||||||||||
| Ben Stevens |
71,669 | 70.5% | 50,526 | 1,531 | 259 | 1,790 | ||||||||||||||||
These LTIP awards are due to vest on 12 May 2021, and will become exercisable on that same date.
Notes:
| 1. | The value of ordinary shares to vest shown above is based on the average share price for the three-month period ended 31 December 2018 of 3,029.52p. |
| 2. | The dividend equivalent amount shown above that will become payable on vesting is the value of the dividend equivalents accrued on the proportion of the award that is due to vest. |
| 94 | BAT Annual Report and Form 20-F 2018 | |
|
Strategic Report
|
Governance
|
Financial Statements
|
Other Information
|
Executive Directors’ pension entitlements and accruals for the year ended 31 December 2018
Nicandro Durante
| Pension values | Accrued pension at year-end 31 Dec 2018 £’000 |
Additional value of pension on early retirement |
||||||
| UURBS (UK) |
168 | – | ||||||
| Total |
168 | – | ||||||
Nicandro Durante’s UURBS pension entitlements are derived as follows:
| – | effective from 1 March 2006 (being the date of his appointment as a member of the Management Board), an accrual of 0.65% for each year of service on a basic £ sterling salary comparable to that of a General Manager of Souza Cruz S.A. At retirement the pension will be based on a 12 month average and will be provided through the UURBS; and |
| – | with effect from 1 January 2011 (being the date of his appointment as Chief Executive Designate), Nicandro Durante commenced an accrual of 2.5% for each year of service on a basic salary in excess of that stated above. At retirement the pension is based on a 12 month average and will be provided through the UURBS. |
Total accrued pension is the amount of pension that would be paid annually on retirement based on service to the end of the year.
The pension-related benefits disclosed in the single figures for Executive Directors’ remuneration represent Nicandro Durante’s net accrual for the period, being the differential between his total pension entitlements as at 31 December 2017 (adjusted for inflation) and as at 31 December 2018, multiplied by 20 in accordance with the UK Directors’ Remuneration Report Regulations.
Nicandro Durante receives a pension in payment from the Fundação Albino Souza Cruz (FASC) from Souza Cruz S.A., a Brazilian registered wholly-owned subsidiary of the Group. This pension benefit has been in payment since April 2012 and currently amounts to approximately £445,905 per annum (after adjusting for currency exchange) S.A. reflecting his 31 years’ service at Souza Cruz.
Ben Stevens
| Pension values | Accrued pension £’000 |
Additional value of pension on early retirement |
||||||
| British American Tobacco UK Pension Fund |
101 | – | ||||||
| UURBS (UK) |
345 | – | ||||||
| Total |
446 | – | ||||||
Ben Stevens joined the UK Pension Fund after 1989, before the closure of its non-contributory defined benefit section to new members in April 2005. As a result, prior to 6 April 2006, he was subject to the HMRC cap on pensionable earnings (notionally £160,800 for the tax year 2018/19). In addition, he has an unfunded pension promise from the Company in respect of earnings above the cap on an equivalent basis to the benefits provided by the UK Pension Fund. This is provided through the UURBS. Further to the changes to the applicable tax regulations, Ben Stevens has reached his lifetime allowance of £1.8 million and therefore has ceased accrual in the Pension Fund with all future benefits being provided through membership of the UURBS. During the year, there has been no change to the overall pension entitlement of Ben Stevens.
Total accrued pension is the amount of pension that would be paid annually on retirement based on service to the end of the year.
The pension-related benefits disclosed in the single figures for Executive Directors’ remuneration represent Ben Stevens’ net accrual for the period, being the differential between his total pension entitlements as at 31 December 2017 (adjusted for inflation) and as at 31 December 2018, multiplied by 20 in accordance with the UK Directors’ Remuneration Report Regulations.
These commitments are included in note 12 in the Notes on the Accounts. UK Pension Fund members are entitled to receive increases in their pensions once in payment, in line with price inflation (as measured by the Retail Prices Index) and up to 6% per annum.
Notes:
| 1. | UK Pension Fund: this is non-contributory. Voluntary contributions paid by an Executive Director and resulting benefits are not shown. No excess retirement benefits have been paid to or are receivable by an Executive Director or past Executive Director. |
| 2. | Revised pension arrangements apply from 2019 for new Executive Directors as detailed further in the revised remuneration policy at page 78. |
| BAT Annual Report and Form 20-F 2018 | 95 | |
|
Remuneration Report
|
||||||||||||||
| Annual Report on Remuneration continued | ||||||||||||||
Other information relating to Chief Executives’ remuneration for the year ended 31 December 2018
Chief Executives’ pay – comparative figures 2009 to 2018
| Year | 2009 | 2010 | 2011 | 2012 | 2013 | 2014 | 2015 | 2016 | 2017 | 2018 | ||||||||||||||||||||||||||||||
| Chief Executives’ ‘single figure’ of total remuneration (£’000) | ||||||||||||||||||||||||||||||||||||||||
| Paul Adams1 (to 28 February 2011) |
7,713 | 8,858 | 5,961 | n/a | n/a | n/a | n/a | n/a | n/a | n/a | ||||||||||||||||||||||||||||||
| Nicandro Durante2 (from 1 March 2011) |
n/a | n/a | 5,589 | 6,340 | 6,674 | 3,617 | 4,543 | 8,313 | 10,244 | 3 | 8,837 | |||||||||||||||||||||||||||||
| Annual bonus (STI) paid against maximum opportunity (%) | ||||||||||||||||||||||||||||||||||||||||
| Paul Adams1 (to 28 February 2011) |
67.7 | 87.0 | 100 | n/a | n/a | n/a | n/a | n/a | n/a | n/a | ||||||||||||||||||||||||||||||
| Nicandro Durante2 (from 1 March 2011) |
n/a | n/a | 100 | 85.0 | 81.3 | 73.2 | 100 | 100 | 97.2 | 100 | ||||||||||||||||||||||||||||||
| Long-term incentive (LTIP) paid against maximum opportunity (%) | ||||||||||||||||||||||||||||||||||||||||
| Paul Adams1 (to 28 February 2011) |
100 | 100 | 100 | n/a | n/a | n/a | n/a | n/a | n/a | n/a | ||||||||||||||||||||||||||||||
| Nicandro Durante2 (from 1 March 2011) |
n/a | n/a | 100 | 87.1 | 49.2 | 0.0 | 8.7 | 46.0 | 96.1 | 70.5 | ||||||||||||||||||||||||||||||
Notes:
| 1. | Paul Adams: (a) historic data is taken from the Remuneration Reports for the relevant years and is recast (as appropriate) on the basis of the ‘single figure’ calculation as prescribed in the UK Directors’ Remuneration Report Regulations; and (b) he retired as Chief Executive on 28 February 2011 which affected his STI and LTIP as follows in accordance with the rules of those schemes: (i) his STI for the year ended 31 December 2010 was paid as a 100% cash bonus instead of 50% in cash and 50% in deferred ordinary shares; (ii) the outstanding LTIP awards of ordinary shares vested immediately on his retirement either in full (2008 award) or on a time-apportioned basis (2009 award and 2010 award); and (iii) the LTIP dividend equivalent payments for the LTIP awards which vested at his retirement were also paid in full and/or on a pro-rated time and performance basis. |
| 2. | Nicandro Durante: (a) historic data is taken from the Remuneration Reports for the relevant years and is recast (as appropriate) on the basis of the ‘single figure’ calculation as prescribed in the UK Directors’ Remuneration Report Regulations; and (b) he became Chief Executive on 1 March 2011 and his ‘single figure’ remuneration for the year ended 31 December 2011 has accordingly been time-apportioned. |
| 3. | Long-term incentives 2017: in accordance with the UK Directors’ Remuneration Report Regulations, estimates for the values of the vesting 2015 LTIP awards were given in the Annual Report on Remuneration 2017. These amounts have been re-presented to show the actual market value on the date of vesting in 2018. |
Total shareholder return (TSR) performance:1 1 January 2009 to 31 December 2018
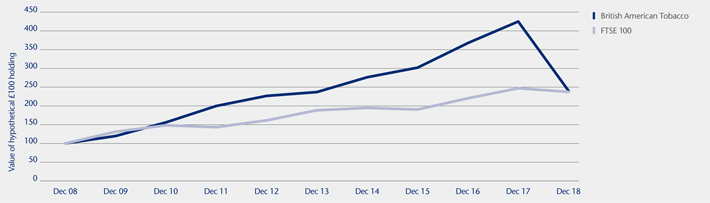
Note:
| 1. | Performance and pay chart: this shows the performance of a hypothetical investment of £100 in ordinary shares (as measured by the TSR for the Company) against a broad equity market index (the FTSE 100 Index) over a period of ten financial years starting from 1 January 2009 through to 31 December 2018 based on 30-trading-day average values. A local currency basis is used for the purposes of the TSR calculation making it consistent with the approach to TSR measurement for the LTIP. |
| 96 | BAT Annual Report and Form 20-F 2018 | |
|
Strategic Report
|
Governance
|
Financial Statements
|
Other Information
|
|
Introduction & Board
|
Audit Committee
|
Nominations Committee
|
Remuneration Committee
|
Responsibility of Directors
|
Percentage change in the Chief Executive’s remuneration
The following table shows the percentage change in the Chief Executive’s remuneration measured against a comparator group comprising the UK employee population on UK employment contracts (2018: 2,097 individuals; 2017: 2,202 individuals).1 This comparator group is considered to be the most appropriate group as Executive Directors are employed on UK contracts. Using a more widely-drawn group encompassing the worldwide nature of the Group’s business would also present practical difficulties in collation and a less relevant comparator, given the significant variations in employee pay across the Group, the differing economic conditions and wide variations in gross domestic product per capita.
| Base salary | Taxable benefits | Short-term incentives | ||||||||||||||||||||||||||||||||||||||||||
| Percentage | Percentage | Percentage | ||||||||||||||||||||||||||||||||||||||||||
| 2018 | 2017 | change | 2018 | 2017 | change | 2018 | 2017 | change | ||||||||||||||||||||||||||||||||||||
| £’000 | £’000 | % | £’000 | £’000 | % | £’000 | £’000 | % | ||||||||||||||||||||||||||||||||||||
| Nicandro Durante |
1,295 | 1,235 | 4.9 | 295 | 218 | 35.3 | 3,275 | 3,039 | 7.8 | |||||||||||||||||||||||||||||||||||
| (Chief Executive) |
||||||||||||||||||||||||||||||||||||||||||||
|
UK-based employees |
75 | 70 | 5.9 | 4 | 4 | 3.7 | 25 | 23 | 7.5 | |||||||||||||||||||||||||||||||||||
Notes: UK-based employees:
| 1. | The 5.9% increase to average base salary and the increase in short-term incentive awards for UK-based employees is due to an increase in the proportion of more senior staff within the population. UK-based employees were awarded performance-based pay increases in 2018 in the range 0% to 8% with an average of around 3%. |
| 2. | The data for the UK-based employees comparator group is made up as follows as at 31 December 2018: (1) the weighted average base salaries; (2) the average taxable benefits per grade; and (3) an estimated weighted average target bonus based on that population as at that date. |
3 Executive Directors’ remuneration for the upcoming year
Base salary for 2019
The Remuneration Committee has determined the following salaries for the Executive Directors.
| Base salary | Base salary | |||||||||||
| from | Percentage | from | ||||||||||
| 1 Apr 2019 | change | 1 Apr 2018 | ||||||||||
| Executive Directors – salaries | £ | % | £ | |||||||||
| Nicandro Durante |
n/a | n/a | 1,310,000 | |||||||||
| Ben Stevens1 |
924,000 | n/a | 924,000 | |||||||||
| Jack Bowles2 |
1,175,000 | n/a | n/a | |||||||||
The Remuneration Committee considered salary increases for Executive Directors in the context of the level of pay increases for UK employees. These ranged between 0% and 5% based on performance in the prior year, with an average increase of 2%.
Notes:
| 1. | The Remuneration Committee determined that Ben Stevens’ salary will remain unchanged at £924,000. |
| 2. | Jack Bowles’ salary will next be reviewed in April 2020. |
Benefits and pension
No changes have been made to the provision of benefits for 2019. Should the Policy be approved, Jack Bowles and other newly-appointed Executive Directors will participate in the Group’s Defined Contribution Pension Plan, equivalent to 15% of base salary.
| BAT Annual Report and Form 20-F 2018 | 97 | |
|
Remuneration Report
|
||||||||||||||
| Annual Report on Remuneration continued | ||||||||||||||
Short-term incentives for 2019 onwards
STI metrics and weightings will remain unchanged from 2018.
| 2019 STI metrics & weightings | ||||
| Group share of key markets |
10 | % | ||
| Adjusted revenue growth from the Strategic Portfolio1 |
30 | % | ||
| APFO |
30 | % | ||
| Adjusted CGFO |
30 | % | ||
| Total | 100 | % | ||
Note:
| 1. | The Strategic Portfolio is comprised of the following core strategic categories – both cigarette brands and PRRP brands – in our portfolio, please refer to page 260 for further details: |
| Strategic Portfolio Definition for STI from 2018 Cigarette brands: |
PRRP brands: | |
| 1. GDBs: Dunhill, Kent, Lucky Strike, Pall Mall, Rothmans | 1. Vapour Brands | |
| 2. RAI Companies Strategic Brands: Camel, Natural American Spirit, Newport | 2. THP Brands | |
| 3. Traditional Oral Brands | ||
| 4. Modern Oral Brands
| ||
Further detail is included in the description of the STI measures for the year ended 31 December 2018 on page 92.
| 98 | BAT Annual Report and Form 20-F 2018 | |
|
Strategic Report
|
Governance
|
Financial Statements
|
Other Information
|
|
Introduction & Board
|
Audit Committee
|
Nominations Committee
|
Remuneration Committee
|
Responsibility of Directors
|
Long-term incentives for 2019 onwards
The TSR comparator group has been expanded to include the Altria Group from the 2019 awards onwards. The performance measures and weightings for the LTIP award to be granted in 2019 will remain unchanged from those for 2018 awards. The measures and targets for 2019 LTIP awards are set out below.
| LTIP measures and performance ranges
|
% of award
|
% of award
|
||||||||||||||
| Relative TSR |
20 | 3 | ||||||||||||||
| Median performance vs. FMCG peer group to upper quartile. |
||||||||||||||||
| The current constituents of the FMCG peer group as at the date of this report are: |
||||||||||||||||
| Altria Group |
Colgate-Palmolive | Japan Tobacco | Mondelēz International |
Procter & Gamble | ||||||||||||
| Anheuser-Busch InBev |
Danone | Johnson & Johnson | Nestlé | Reckitt Benckiser | ||||||||||||
| Campbell Soup |
Diageo | Kellogg | PepsiCo | Unilever | ||||||||||||
| Carlsberg |
Heineken | Kimberly-Clark | Pernod Ricard | |||||||||||||
| Coca-Cola |
Imperial Brands | LVMH | Philip Morris International |
|||||||||||||
| EPS growth at current exchange rates | 20 | 3 | ||||||||||||||
| 5%–10% compound annual growth in adjusted diluted EPS over the performance period |
||||||||||||||||
| EPS growth at constant exchange rates | 20 | 3 | ||||||||||||||
| 5%–10% compound annual growth in adjusted diluted EPS over the performance period |
||||||||||||||||
| Adjusted revenue growth | 20 | 3 | ||||||||||||||
| 3%–5% compound annual growth over the performance period |
||||||||||||||||
| Adjusted Operating cash flow conversion ratio | 20 | 3 | ||||||||||||||
| Ratio of 85%–95% over the performance period at current exchange rates |
||||||||||||||||
| Total | 100 | 15 | ||||||||||||||
As explained in the Annual Statement from the Chairman of the Remuneration Committee on page 74, the Committee has decided to apply a downward adjustment to the 2019 LTIP award. The 2019 award will be made on the basis of the Group’s closing share price on 25 February 2019, increased by 15%, with a resulting share price of £33.28. In the event that the Group’s share price increases beyond this level at the award date in March 2019, the higher share price shall be used as the basis of the award.
| BAT Annual Report and Form 20-F 2018 | 99 | |
|
Remuneration Report
|
||||||||||||||
| Annual Report on Remuneration continued | ||||||||||||||
4 Chairman and Non-Executive Directors’ remuneration for the year ended 31 December 2018
The following table shows a single figure of remuneration for the Chairman and Non-Executive Directors in respect of qualifying services for the year ended 31 December 2018 together with comparative figures for 2017.
| Chair/Committee | ||||||||||||||||||||||||||||||||||||||
| Base fee5 | membership fees5 | Taxable benefits1 | Total remuneration | |||||||||||||||||||||||||||||||||||
| £’000
|
£’000
|
£’000
|
£’000
|
|||||||||||||||||||||||||||||||||||
|
2018
|
2017
|
2018
|
2017
|
2018
|
2017
|
2018
|
2017
|
|||||||||||||||||||||||||||||||
| Chairman |
||||||||||||||||||||||||||||||||||||||
| Richard Burrows |
680 | 660 | – | – | 116 | 129 | 796 | 789 | ||||||||||||||||||||||||||||||
| Non-Executive Directors |
||||||||||||||||||||||||||||||||||||||
| Sue Farr | 93 | 93 | 24 | 19 | 2 | 1 | 119 | 113 | ||||||||||||||||||||||||||||||
| Dr Marion Helmes | 93 | 93 | 24 | 19 | 12 | 12 | 129 | 124 | ||||||||||||||||||||||||||||||
| Luc Jobin2 (from 25 July 2017) | 93 | 40 | 24 | 6 | 41 | 18 | 158 | 64 | ||||||||||||||||||||||||||||||
| Holly Keller Koeppel3 (from 25 July 2017) | 93 | 40 | 24 | 6 | 94 | 20 | 211 | 66 | ||||||||||||||||||||||||||||||
| Savio Kwan | 93 | 93 | 24 | 19 | 42 | 51 | 159 | 163 | ||||||||||||||||||||||||||||||
| Dimitri Panayotopoulos | 93 | 93 | 50 | 44 | 17 | 24 | 160 | 161 | ||||||||||||||||||||||||||||||
| Kieran Poynter | 93 | 93 | 86 | 79 | – | 14 | 179 | 186 | ||||||||||||||||||||||||||||||
| Retired Non-Executive Directors |
||||||||||||||||||||||||||||||||||||||
| Ann Godbehere (to 25 April 2018) | 30 | 93 | 7 | 19 | 1 | 1 | 38 | 113 | ||||||||||||||||||||||||||||||
| Dr Pedro Malan (to 25 April 2018) | 30 | 93 | 7 | 19 | 15 | 49 | 52 | 161 | ||||||||||||||||||||||||||||||
| Gerry Murphy (to 26 April 2017) | – | 31 | – | 4 | – | – | – | 35 | ||||||||||||||||||||||||||||||
| Lionel Nowell, III3 (from 25 July 2017 to 12 December 2018) | 88 | 40 | 23 | 6 | 79 | 5 | 190 | 51 | ||||||||||||||||||||||||||||||
| Total | 1,479 | 1,462 | 293 | 240 | 419 | 324 | 2,191 | 2,026 | ||||||||||||||||||||||||||||||
Notes:
| 1. | Benefits: the Chairman’s benefits in 2018 comprised: health insurance and ‘walk-in’ medical services £15,000 (2017: £17,000); the use of a Company driver £81,000 (2017: £63,000); home and personal security in the UK and Ireland £4,000 (2017: £13,000); hotel accommodation and related expenses incurred in connection with individual and/or accompanied attendance at certain business functions and/or corporate events £3,000 (2017: £29,000); and commuting flights to London £13,000 (2017: £7,000). The benefits for the other Non-Executive Directors principally comprised travel-related expenses incurred in connection with individual and/or accompanied attendance at certain business functions and/or events and ‘walk-in’ medical services. The figures shown are grossed-up amounts (as appropriate) as, in line with the UK market, it is the normal practice of the Company to pay the tax that may be due on any benefits. |
| 2. | Pension: Luc Jobin receives a pension in respect of prior service to Imasco Limited (acquired in 2000 by the Group) and Imperial Tobacco Canada Limited, a subsidiary of BAT. In 2018 this amount was CAD$150,228.96 (£86,849.10) (2017: CAD$150,228.96 (£89,849.86) for the full year, however Luc Jobin was a Director from 25 July 2017). |
| 3. | Deferred Compensation Plan for Directors of RAI (DCP): as former outside directors of RAI, Holly Keller Koeppel and Lionel Nowell, III each participated in the DCP under which they could elect to defer payment of a portion of their RAI retainers and meeting attendance fees to an RAI stock account, a cash account, or a combination of both. Following the acquisition of RAI by BAT, amounts deferred to a stock account (Deferred Stock Units or DSUs) mirror the performance of, and receive dividend equivalents based on, BAT American Depository Shares (ADSs). Amounts deferred to a cash account earn quarterly interest at the prime rate as set by JPMorgan Chase Bank. The respective DSUs of Holly Keller Koeppel and Lionel Nowell, III are disclosed as a note to ‘Summary of Directors’ share interests’ below. The deferred cash account for Lionel Nowell, III showed a balance of US$125,879.62 at 12 December 2018 (31 December 2017: US$119,824). DSUs and cash deferred under the DCP will be paid in accordance with the terms of the DCP, section 409A of the US Internal Revenue Code of 1986, as amended, and the Director’s existing deferral elections. |
| 4. | Committee memberships: are shown, together with changes during the year, in the reports of the respective committees in the Governance sections of the Directors’ Report. |
| 5. | Non-Executive Directors’ fees structure 2018: is set out in the table below. |
|
Fees from
|
Fees
to
|
|||||||
| Base fee |
92,700 | 92,700 | ||||||
| Senior Independent Director – supplement |
37,100 | 36,000 | ||||||
| Audit Committee: Chairman |
39,200 | 36,000 | ||||||
| Audit Committee: Member |
13,500 | 11,000 | ||||||
| Nominations Committee: Chairman |
– | – | ||||||
| Nominations Committee: Member |
12,000 | 11,000 | ||||||
| Remuneration Committee: Chairman |
39,200 | 36,000 | ||||||
| Remuneration Committee: Member |
13,500 | 11,000 | ||||||
Chairman and Non-Executive Directors’ fees and remuneration for the upcoming year
As described in the Annual Report on Remuneration for the year ended 31 December 2017, the Chairman’s fee was increased from £665,000 to £685,000 from 1 April 2018. In keeping with the level of pay awards granted to UK employees based on a 2% increase in budget, the Remuneration Committee determined the Chairman’s fee will be £698,000 with effect from 1 April 2019 (+1.9%).
The fees for Non-Executive Directors are scheduled to be reviewed in April 2019 with any changes being effective from 1 May 2019.
| 100 | BAT Annual Report and Form 20-F 2018 | |
|
Strategic Report
|
Governance
|
Financial Statements
|
Other Information
|
Summary of Directors’ share interests
|
Outstanding scheme interests 31 Dec 2018
|
||||||||||||||||||||||||
| Ordinary shares held at 31 Dec 2018 |
Unvested awards subject to performance measures and continued employment (LTIP) |
Unvested awards subject to continued employment only (DSBS) |
Unvested interests (Sharesave) |
Total ordinary shares subject to outstanding scheme interests |
Total of all interests in ordinary shares at 31 Dec 2018 |
|||||||||||||||||||
| Executive Directors | ||||||||||||||||||||||||
| Nicandro Durante1,3 | 345,201 | 415,213 | 90,752 | 912 | 506,877 | 852,078 | ||||||||||||||||||
| Ben Stevens2,3 | 126,032 | 210,165 | 52,928 | 1,038 | 264,131 | 390,163 | ||||||||||||||||||
| Chairman | ||||||||||||||||||||||||
| Richard Burrows | 19,000 | 19,000 | ||||||||||||||||||||||
| Non-Executive Directors | ||||||||||||||||||||||||
| Sue Farr | – | – | ||||||||||||||||||||||
| Dr Marion Helmes | 4,500 | 4,500 | ||||||||||||||||||||||
| Luc Jobin4 | 45,236 | 45,236 | ||||||||||||||||||||||
| Holly Keller Koeppel4,5 | 8,416 | 8,416 | ||||||||||||||||||||||
| Savio Kwan3 | 6,616 | 6,616 | ||||||||||||||||||||||
| Dimitri Panayotopoulos | 3,300 | 3,300 | ||||||||||||||||||||||
| Kieran Poynter | 5,000 | 5,000 | ||||||||||||||||||||||
Notes:
| 1. | Nicandro Durante: ordinary shares held include 2,316 held by the trustees of the BAT Share Incentive Plan (SIP). |
| 2. | Ben Stevens: ordinary shares held include 669 held by the trustees of the SIP. |
| 3. | Changes from 31 December 2018: (a) Nicandro Durante: purchases of six ordinary shares on 2 January 2019 and six ordinary shares on 6 February 2019 under the SIP; acquisition of 41 ordinary shares on 7 February 2019 as a result of reinvestment of dividend income under the SIP; acquisition of 3,250 ordinary shares on 12 February 2019 as a result of reinvestment of dividend income; and acquisition of 2,741 ordinary shares on 12 February 2019 as a result of reinvestment of dividend income by Mrs Durante. (b) Ben Stevens: purchases of six ordinary shares on 2 January 2019 and six ordinary shares on 6 February 2019 under the SIP; and acquisition of 12 ordinary shares on 7 February 2019 as a result of reinvestment of dividend income under the SIP. (c) Savio Kwan: purchase of 115 ordinary shares as a result of the reinvestment of dividend income on 14 February 2019. There were no changes in the interests of the Chairman and the other Non-Executive Directors. |
| 4. | American Depositary Shares (ADSs): each of the interests in ordinary shares held by Luc Jobin and Holly Keller Koeppel consist of an equivalent number of BAT ADSs each of which represents one ordinary share in the Company. |
| 5. | Deferred Stock Units (DSUs): at the date of this report Holly Keller Koeppel, being a former director of RAI and a participant in the Deferred Compensation Plan for Directors of RAI (DCP), holds DSUs which were granted prior to becoming a Director of BAT – 21,842.98 DSUs (31 December 2018: 21,456.34 DSUs). Each DSU entitles the holder to receive a cash payment upon ceasing to be a Director equal to the value of one BAT ADS. The number of DSUs will increase on each dividend date by reference to the value of dividends declared on the ADSs underlying the DSUs. Lionel Nowell, III held 38,941.32 DSUs as at 12 December 2018. |
| 6. | Director changes during 2018: Ann Godbehere and Dr Pedro Malan retired on 25 April 2018; Lionel Nowell, III retired on 12 December 2018. Shares held at the date of retirement: (a) Ann Godbehere held 3,100 ADSs, each of which represented one ordinary share in the Company; (b) Dr Pedro Malan did not hold any shares in the Company; and (c) Lionel Nowell, III held 17,436 ADSs, each of which represented one ordinary share in the Company. |
Executive Directors’ shareholding guidelines
Executive Directors are encouraged to build up a high level of personal shareholding to ensure a continuing alignment of interests with shareholders. The shareholding guidelines require Executive Directors to hold ordinary shares equal to the value of a percentage of salary as set out in the table below.
| Shareholding requirements (% of base salary 31 Dec 2018) |
No. of eligible ordinary shares held at 31 Dec 2018 |
Value of eligible ordinary shares held at 31 Dec 20181 £m |
Actual percentage (%) of base salary at 31 Dec 2018 |
|||||||||||||
| Nicandro Durante |
500 | 433,637 | 10.8 | 827.6 | ||||||||||||
| Ben Stevens |
350 | 178,291 | 4.5 | 482.4 | ||||||||||||
Eligibility of shares: (a) unvested ordinary shares under the DSBS, which represent deferral of earned bonus, are eligible and count towards the requirement; (b) unvested ordinary shares under the LTIP are not eligible and do not count towards the requirement during the performance period, but the estimated notional net number of ordinary shares held during the LTIP Extended Vesting Period are eligible and will count towards the requirement; and (c) ordinary shares held in trust under the all-employee share ownership plan (SIP) are not eligible and do not count towards the shareholding requirement.
Notes:
| 1. | Value of ordinary shares shown above: this is based on the closing mid-market share price on 31 December 2018 of 2,500p. |
| 2. | Meeting the guidelines: if an Executive Director does not, at any time, meet the requirements of the shareholding guidelines, the individual may, generally, only sell a maximum of up to 50% of any ordinary shares vesting (after tax) under the Company share plans until the threshold required under the shareholding guidelines has been met. |
| 3. | Waiver of compliance with guidelines: this is permitted with the approval of the Remuneration Committee in circumstances where a restriction on a requested share sale could cause undue hardship. No such applications were received from the Executive Directors during 2018. |
Non-Executive Directors are not subject to any formal shareholding requirements although they are encouraged to build a small interest in ordinary shares during the term of their appointment.
| BAT Annual Report and Form 20-F 2018 | 101 | |
|
Remuneration Report
|
||||||||||||||
| Annual Report on Remuneration continued | ||||||||||||||
Executive Directors’ outstanding scheme interests
| Plan
|
At 1 Jan 2018
|
Awarded in
|
Lapsed in
|
Exercised/
|
At 31 Dec
|
Exercise price
|
End of
|
Date from which
|
||||||||||||||||||||||||||||
| Nicandro Durante | LTIP | 1 | 127,448 | 4,971 | 122,477 | – | 31 Dec 17 | 27 Mar 18 | ||||||||||||||||||||||||||||
| LTIP | 2 | 140,529 | 140,529 | 31 Dec 18 | 12 May 21 | |||||||||||||||||||||||||||||||
| LTIP | 3 | 114,181 | 114,181 | 31 Dec 19 | 27 Mar 22 | |||||||||||||||||||||||||||||||
| LTIP | 3 | 160,503 | 160,503 | 31 Dec 20 | 26 Mar 23 | |||||||||||||||||||||||||||||||
| DSBS | 19,419 | 19,419 | – | 27 Mar 18 | ||||||||||||||||||||||||||||||||
| DSBS | 29,690 | 29,690 | 29 Mar 19 | |||||||||||||||||||||||||||||||||
| DSBS | 28,545 | 28,545 | 27 Mar 20 | |||||||||||||||||||||||||||||||||
| DSBS | 32,517 | 32,517 | 26 Mar 21 | |||||||||||||||||||||||||||||||||
| Sharesave | 543 | 543 | 2,787 | 1 Oct 19 | ||||||||||||||||||||||||||||||||
| Sharesave | 369 | 369 | 4,056 | 1 May 22 | ||||||||||||||||||||||||||||||||
| Ben Stevens | LTIP | 1 | 69,641 | 2,716 | 66,925 | – | 31 Dec 17 | 27 Mar 18 | ||||||||||||||||||||||||||||
| LTIP | 2 | 71,669 | 71,669 | 31 Dec 18 | 12 May 21 | |||||||||||||||||||||||||||||||
| LTIP | 3 | 58,232 | 58,232 | 31 Dec 19 | 27 Mar 22 | |||||||||||||||||||||||||||||||
| LTIP | 3 | 80,264 | 80,264 | 31 Dec 20 | 26 Mar 23 | |||||||||||||||||||||||||||||||
| DSBS | 12,732 | 12,732 | – | 27 Mar 18 | ||||||||||||||||||||||||||||||||
| DSBS | 19,468 | 19,468 | 29 Mar 19 | |||||||||||||||||||||||||||||||||
| DSBS | 15,805 | 15,805 | 27 Mar 20 | |||||||||||||||||||||||||||||||||
| DSBS | 17,655 | 17,655 | 26 Mar 21 | |||||||||||||||||||||||||||||||||
| Sharesave | 543 | 543 | 2,787 | 1 Oct 19 | ||||||||||||||||||||||||||||||||
|
|
Sharesave
|
|
|
495
|
|
|
495
|
|
|
3,026
|
|
|
1 May 20
|
| ||||||||||||||||||||||
Notes:
| 1. | Details of the performance condition for the LTIP awards granted in 2015 (which vested during 2018), and of achievement against that condition in the period to 31 December 2017, was set out in the Annual Report on Remuneration for the year ended 31 December 2017. |
| 2. | Details of the performance condition attached to 2016 LTIP awards, and of achievement against that condition in the period to 31 December 2018, are set out on page 94. |
| 3. | Details of the performance condition attached to 2017 and 2018 LTIP awards are set out on page 103. |
Further details in relation to scheme interests granted during the year ended 31 December 2018
| Plan | Ordinary shares awarded |
Price per ordinary share at award1 |
Face value of £’000 |
Exercise price |
Proportion of performance (%) |
Performance period |
Date from which exercisable or shares released |
|||||||||||||||||||||||||
| Nicandro Durante | LTIP | 2 | 160,503 | 3,894p | 6,250 | n/a | 15 | 2018–2020 | 26 Mar 23 | |||||||||||||||||||||||
| DSBS | 3 | 32,517 | n/a | n/a | n/a | 26 Mar 21 | ||||||||||||||||||||||||||
| Ben Stevens | LTIP | 2 | 80,264 | 3,894p | 3,125 | n/a | 15 | 2018–2020 | 26 Mar 23 | |||||||||||||||||||||||
| DSBS | 3 | 17,655 | n/a | n/a | n/a | 26 Mar 21 | ||||||||||||||||||||||||||
Notes:
| 1. | The price per ordinary share is the price used to determine the number of ordinary shares subject to the awards, which is calculated as the average of the closing mid-market price of an ordinary share over the three dealing days preceding the date of grant. |
| 2. | Details of the performance condition attached to these LTIP awards are set out on page 103. |
| 3. | These DSBS awards were granted to deliver 50% of the annual bonus earned for the year ended 31 December 2017, details of which are set out on page 104. |
| 102 | BAT Annual Report and Form 20-F 2018 | |
|
Strategic Report
|
Governance
|
Financial Statements
|
Other Information
|
|
Introduction & Board
|
Audit Committee
|
Nominations Committee
|
Remuneration Committee
|
Responsibility of Directors
|
Further details in relation to performance conditions attaching to outstanding scheme interests
|
LTIP awards granted in 2017 |
LTIP awards granted in 2018 |
|||||||||||||||||||||||||
|
1 January 2017–31 December 2019 |
1 January 2018–31 December 2020 |
|||||||||||||||||||||||||
| Weighting | Threshold | Maximum | Weighting | Threshold | Maximum | |||||||||||||||||||||
| Relative TSR Ranking against a peer group of international FMCG companies |
20% | |
At median, 3% of award vests |
|
|
At upper quartile, 20% of award vests |
|
20% | |
At median, 3% of award vests |
|
|
At upper quartile, 20% |
| ||||||||||||
| EPS growth at current exchange rates Compound annual growth in adjusted diluted EPS measured at current rates of exchange |
20% | |
At 5% CAGR, 3% of award vests |
|
|
At 10% CAGR, 20% of award vests |
|
20% | |
At 5% CAGR, 3% of award vests |
|
|
At 10% CAGR, 20% of award vests |
| ||||||||||||
| EPS growth at constant exchange rates Compound annual growth in adjusted diluted EPS measured at constant rates of exchange |
20% | |
At 5% CAGR, 3% of award vests |
|
|
At 10% CAGR, 20% of award vests |
|
20% | |
At 5% CAGR, 3% of award vests |
|
|
At 10% CAGR, 20% of award vests |
| ||||||||||||
| Adjusted revenue growth Compound annual growth measured at constant rates of exchange |
20% | |
At 3% CAGR, 3% of award vests |
|
|
At 5% CAGR, 20% of award vests |
|
20% | |
At 3% CAGR, 3% of award vests |
|
|
At 5% CAGR, 20% of award vests |
| ||||||||||||
| Adjusted operating cash flow conversion ratio Measured at current rates of exchange, as a percentage of APFO |
20% | |
At 85%, 3% of award vests |
|
|
At 95%, 20% of award vests |
|
20% | |
At 85%, 3% of award vests |
|
|
At 95%, 20% of award vests |
| ||||||||||||
For LTIP awards granted from 2016 onwards, an additional vesting period of two years applies from the third anniversary of the date of grant.
Impact of the RAI acquisition on 2017 and 2018 LTIP awards
The Committee has taken time to consider how the impact of the RAI acquisition should be treated for the purposes of the 2017 and 2018 performance years. As a result of this review, the following treatments will apply:
| – | relative TSR and EPS growth – no further adjustments are needed as the incremental costs and benefits associated with the acquisition are already factored into performance; |
| – | adjusted revenue growth – the 2017 performance year has been measured based on organic BAT performance versus the 2016 base year to allow for a like-for-like comparison. The contribution of RAI (and other 2017 acquisitions) has been included from 2018 onwards, with the growth against 2017 being on a representative basis; and |
| – | operating cash flow conversion ratio – the 2017 performance year has been measured based on organic BAT performance, excluding RAI profit and cash, and any additional costs related to the acquisition. The contribution of RAI (and other 2017 acquisitions) has been included on a representative basis for the 2018 performance year. |
The Committee believes this is the correct, fair and appropriate way to treat the acquisition of RAI.
| BAT Annual Report and Form 20-F 2018 | 103 | |
|
Remuneration Report
|
Annual Report on Remuneration continued
STI targets and outcome for the year ended 31 December 2017
As explained on page 92, in previous years, publication of the STI targets has been deferred for one year on the basis of the commercially sensitive nature of those targets. Notwithstanding that the Remuneration Committee continues to consider that STI targets remain commercially sensitive, the Remuneration Committee has, on balance, decided that publication of STI targets will in future be published in the remuneration report following the end of the relevant performance year. Consequently, this year’s remuneration report sets out the targets relating to both the 2017 and 2018 performance years.
|
STI: performance measure
|
Description of measure and target 2017
|
Result achieved
|
Vesting percentage
| |||||
| Adjusted profit from operations (APFO) (growth over prior year)
Weighting: 40%
|
APFO is the adjusted profit from operations at constant rates of exchange for the year ended 31 December 2017 and is assessed on an organic basis. | Growth over 2016 of 4% on an organic basis | 21% (out of maximum of 40%) | |||||
| STI target 2017 | ||||||||
| Threshold | 2% growth over 2016 | |||||||
| Maximum | 5% growth over 2016 | |||||||
| Group’s share of Key Markets (growth over prior year)
Weighting: 20% |
The Group’s retail market share in its Key Markets accounts for around 80% of the volumes of the Group’s subsidiaries. The Group’s share is calculated from data supplied by retail audit service providers and is rebased as and when the Group’s Key Markets change. When rebasing does occur, the Company will also restate history and provide fresh comparative data on the markets. | Global market share in key markets grew over 2016 by 40 bps. | 20% (out of maximum of 20%) | |||||
| STI target 2017 | ||||||||
| Threshold | 5 bps growth over 2016 | |||||||
| Maximum | 15 bps growth over 2016 | |||||||
| Global Drive Brands (GDB) and Key Strategic Brands (KSB) volumes (growth over prior year)
Weighting: 20% |
GDB volumes comprise the cigarette volumes of Dunhill, Kent, Lucky Strike, Pall Mall and Rothmans, and include volumes of the Fine Cut variants of those brands sold in Western Europe.
KSB volumes comprise the cigarette volumes of State Express 555 and Shuang Xi associated with the joint venture with China National Tobacco Corporation in China.
GDB and KSB volumes are assessed on an organic basis. |
GDB and KSB volumes grew over 2016 by 7.5% on an organic basis. | 20% (out of maximum of 20%) | |||||
| STI target 2017 | ||||||||
| Threshold | 1% growth over 2016 | |||||||
| Maximum | 3% growth over 2016 | |||||||
| Adjusted cash generated from operations (Adjusted CGFO) (as against adjusted budget)
|
Adjusted CGFO is defined as net cash generated from operating activities, before the impact of adjusting items, dividends paid to non-controlling interests and received from associates, net interest paid and net capital expenditure. Adjusted CGFO is measured at constant rates of exchange. | Adjusted CGFO exceeded 2017 budget by 11% (equivalent to 94% operating cash flow conversion1) | 20% (out of maximum of 20%) | |||||
| STI target 2017 | ||||||||
| Weighting: 20% | Threshold | Equivalent to 85% operating cash flow conversation | ||||||
| Maximum | Equivalent to 95% operating cash flow conversation | |||||||
| Available STI award as % of base salary |
Corporate result % |
Individual % |
STI award achieved % of base salary |
STI award achieved £’000 (Value shown in |
||||||||||
| Nicandro Durante |
250 | 81% | 20% | 243.1% | 3,039 | |||||||||
| Ben Stevens |
190 | 81% | 20% | 184.8% | 1,650 | |||||||||
The STI awards shown above were paid as 50% in cash and 50% as an award under the DSBS granted in March 2018, the details of which are set out on page 102 above.
Note:
| 1. | In 2017 the operating cash flow conversion ratio is affected by the exclusion of results from RAI, post acquisition. The conversion ratio is also impacted by the application of IFRS 15 as detailed on page 264 which reduces the ratio from 96% (as reported in 2017) to 94%. |
Payments to former Directors and payments for loss of office: the Company did not make: (1) any payments of money or other assets to former Directors; or (2) any payments to Directors for loss of office during the year ended 31 December 2018.
External directorships: Nicandro Durante is a non-executive director of Reckitt Benckiser Group and he retains the fees for this appointment; 2018: £122,000 (2017: £120,000). Ben Stevens is a non-executive director of ISS A/S and he retains the fees for this appointment; 2018: DKK896,250 (£106,373) (2017: DKK892,500 (£105,080)).
| 104 | BAT Annual Report and Form 20-F 2018 | |
|
Strategic Report
|
Governance
|
Financial Statements
|
Other Information
|
|
Introduction & Board
|
Audit Committee
|
Nominations Committee
|
Remuneration Committee |
Responsibility of Directors
|
Relative importance of spend on pay
To illustrate the relative importance of the remuneration of the Directors in the context of the Group’s finances overall, the Remuneration Committee makes the following disclosure:
| Item
|
2018
|
2017
|
% change
|
|||||||||
| Remuneration of Group employees1 |
3,005 | 2,679 | 12.2 | |||||||||
|
Remuneration of Executive Directors |
14 | 16 | -14.1 | |||||||||
|
Remuneration of Chairman and Non-Executive Directors |
2 | 2 | 8.1 | |||||||||
|
Total dividends2 |
4,463 | 4,465 | – | |||||||||
Notes:
| 1. | Total remuneration of Group employees: this represents the total employee benefit costs for the Group, set out on page 138 within note 3a in the Notes on the Accounts. |
| 2. | Total dividends: this represents the total dividend declared in 2018, set out on page 247 within the Statement of Changes in Equity. |
Shareholder dilution – options and awards outstanding
|
Satisfaction of Company share plan awards in accordance with the |
New ordinary shares issued by the Company during the year ended 31 December 2018 | |
| – by the issue of new ordinary shares;
– ordinary shares issued from treasury only up to a maximum of 10% of the Company’s issued share capital in a rolling 10-year period;
– within this 10% limit, the Company can only issue (as newly issued ordinary shares or from treasury) 5% of its issued share capital to satisfy awards under discretionary or executive plans; and
– the rules of the Company’s Deferred Share Bonus Scheme (DSBS) do not allow for the satisfaction of awards by the issue of new ordinary shares. |
– 137,470 ordinary shares issued by the Company in relation to the Sharesave Scheme;
– a total of 765,277 Sharesave Scheme options over ordinary shares in the Company were outstanding at 31 December 2018, representing 0.03% of the Company’s issued share capital (excluding shares held in treasury); and
– options outstanding under the Sharesave Scheme are exercisable until the end of October 2023 at option prices ranging from 2,600p to 4,056p. |
| BAT Annual Report and Form 20-F 2018 | 105 | |
|
Remuneration Report
|
||||||||||||||
| Annual Report on Remuneration continued | ||||||||||||||
7 The Remuneration Committee and shareholder engagement
|
Remuneration Committee current members
|
|
Dimitri Panayotopoulos (Chairman) |
|
Sue Farr |
|
Dr Marion Helmes (from 14 January 2019) |
|
Savio Kwan |
Role
The Remuneration Committee is responsible for:
| – | determining and proposing the Directors’ Remuneration Policy (covering salary, benefits, performance-based variable rewards and pensions) for shareholder approval; |
| – | determining, within the terms of the approved Directors’ Remuneration Policy, the specific remuneration packages for the Chairman and the Executive Directors, on appointment, on review and, if appropriate, any compensation payment due on termination of appointment; |
| – | the setting of targets applicable for the Company’s performance-based variable reward scheme and determining achievement against those targets, exercising discretion where appropriate and as provided by the applicable scheme rules and the Directors’ Remuneration Policy; |
| – | setting remuneration for members of the Management Board and the Company Secretary; and |
| – | monitoring and advising the Board on any major changes to the policy on employee benefit structures for the Group. |
Remuneration Committee terms of reference
Revised Remuneration Committee terms of reference have been adopted by the Board to reflect revisions to internal governance processes to align with the requirements of the UK Corporate Governance Code 2018. The revised Remuneration Committee terms of reference incorporate:
| – | a requirement for any appointee as Committee Chairman to have served on a remuneration committee for at least 12 months prior to appointment; |
| – | the Committee’s responsibility for reviewing workforce remuneration and related policies, and the alignment of incentives and rewards with culture, and to take these into account when setting the policy for Executive Director remuneration; |
| – | the requirement for the Committee to maintain a formal policy for post-employment shareholding requirements for Executive Directors, encompassing both unvested and vested shares; and |
| – | responsibility for the Committee to determine the remuneration package for the Company Secretary (in addition to Management Board members) on appointment, review and termination. |
Attendance at meetings in 2018
| Name
|
Member
|
Attendance/
|
Attendance/
|
|||||||||
| Dimitri Panayotopoulos |
2015 | 4/4 | 3/3 | |||||||||
| Sue Farr1(b) |
2016 | 4/4 | 1/3 | |||||||||
| Ann Godbehere2(b) |
2011–2018 | 1/1 | 0/0 | |||||||||
| Luc Jobin1(c), 2(c) |
2017–2019 | 4/4 | 2/3 | |||||||||
| Savio Kwan |
2016 | 4/4 | 3/3 | |||||||||
Notes:
| 1. | Number of meetings in 2018: (a) the Committee held seven meetings in 2018, three of which were ad hoc and convened at short notice; (b) Sue Farr did not attend the ad hoc meetings in October and November due to prior commitments; and (c) Luc Jobin did not attend the ad hoc meeting in November due to prior commitments. |
| 2. | Membership: (a) all members of the Committee are independent Non-Executive Directors in accordance with the UK Corporate Governance Code 2016 Provision D.2.1. and applicable NYSE listing standards; (b) Ann Godbehere ceased to be a member of the Committee upon her retirement as a Non-Executive Director on 25 April 2018; and (c) Luc Jobin ceased to be a member of the Committee with effect from 14 January 2019. |
| 3. | Other attendees: the Chairman, the Chief Executive, the Chief Executive Designate, the Group Human Resources Director, the Talent and Culture Director Designate, the Group Head of Reward and other senior management, including the Company Secretary, may be consulted and provide advice, guidance and assistance to the Remuneration Committee. They may also attend Committee meetings (or parts thereof) by invitation. Neither the Chairman nor any Executive Director plays any part in determining their own respective remuneration. |
| 4. | Deloitte LLP: as the Remuneration Committee’s remuneration consultants, they may attend meetings of the Remuneration Committee. As a member of the Remuneration Consultants Group (RCG), Deloitte agrees to the RCG Code of Conduct which seeks to clarify the scope and conduct of the role of executive remuneration consultants when advising UK-listed companies. |
|
|
For the Remuneration Committee’s terms of reference see: www.bat.com/governance |
| 106 | BAT Annual Report and Form 20-F 2018 | |
|
Strategic Report
|
Governance
|
Financial Statements
|
Other Information
|
|
Introduction & Board
|
Audit Committee
|
Nominations Committee
|
Remuneration Committee
|
Responsibility of Directors
|
Remuneration Committee advisers during 2018
|
Independent
|
Services provided to the Remuneration Committee
|
Fees
|
Other services
provided
| |||
| Deloitte LLP | General advice on remuneration matters including: market trends and comparator group analysis; policy review and shareholder engagement perspectives; and independent measurement of the relative TSR performance conditions.
|
2018: £136,700 2017: £86,000 |
Tax, corporate finance and consulting services to Group companies worldwide. | |||
| Herbert Smith Freehills LLP | Advice in respect of share plan regulations is provided to the Company and is available to the Remuneration Committee. | Fees relate to advice given to the Company | General corporate legal and tax advice principally in the UK.
| |||
| Ernst & Young LLP | Provision of personal tax advice regarding Executive Directors’ international pension planning. | Fees relate to advice given to the Company | Tax, corporate finance and consulting services to Group companies worldwide.
| |||
| KPMG LLP | Specified procedures to assist in the assessment of the calculations of the STI bonus outcomes and future targets.
|
2018: £18,000 2017: £15,000
|
Audit and tax services and other non-audit services.
|
Regular work programme 2018
The Committee:
| – | reviewed salaries for the Executive Directors from 1 April 2018 taking into account both the Pay Comparator Group positioning and the pay and employment conditions elsewhere in the Group, particularly in the UK; |
| – | reviewed the Chairman’s fee from 1 April 2018 with specific reference to the level of pay awards granted to UK employees; |
| – | assessed the achievement against the targets for the 2017 STI award and set the STI targets for 2018; |
| – | assessed, and agreed to apply, an individual adjustment factor to the 2017 STI outcomes for Executive Directors; |
| – | assessed the achievement against the performance conditions for the vesting of the LTIP 2015 award, determined the contingent level of LTIP awards for May 2018 and confirmed the associated performance conditions; |
| – | assessed the achievement against the targets for the 2017 Share Reward Scheme and set the targets for the 2018 award; |
| – | monitored the continued application of the Company’s shareholding guidelines for the Executive Directors; |
| – | reviewed the Annual Statement and the Annual Report on Remuneration for the year ended 31 December 2017 prior to its approval by the Board and subsequent shareholder submission to the Company’s AGM on 25 April 2018; |
| – | analysed the 2018 AGM results on remuneration voting and reviewed market trends in the context of that annual general meeting season together with ongoing corporate governance trends; |
| – | reviewed the achievement against the performance measures for the six months to 30 June 2018 for the STI 2018 and the outstanding LTIP awards; and |
| – | reviewed the Remuneration Committee’s effectiveness following the Board evaluation process. |
Directors’ Remuneration Policy
The Committee considered amendments to the current Directors’ Remuneration Policy, taking into account shareholder feedback and the requirements of the UK Corporate Governance Code 2018 and applicable regulations, and determined the revised Directors’ Remuneration Policy to be proposed for shareholder approval at the Company’s AGM on 25 April 2019.
Other incentive matters 2018
The Committee:
| – | approved the remuneration package in respect of the appointment of Jack Bowles as an Executive Director with effect from 1 January 2019; |
| – | reviewed the terms of appointment and associated remuneration, and terms of termination of employment, in connection with Management Board changes during the year; |
| – | reviewed the alignment of Group workforce remuneration and related policies with the Directors’ Remuneration Policy; |
| – | approved changes to the constituents for the STI volume share metrics, based on market changes and reporting capabilities; |
| – | reviewed post-employment benefits arrangements across the Group; and |
| – | noted preliminary insights on UK gender pay reporting for 2018. |
| BAT Annual Report and Form 20-F 2018 | 107 | |
|
Remuneration Report
|
||||||||||||||
| Annual Report on Remuneration continued | ||||||||||||||
Voting on the Remuneration Report at the 2018 AGM and engagement with shareholders
At the 2018 AGM on 25 April, the shareholders considered and voted on the 2017 Directors’ Remuneration Report as set out on the table below. No other resolutions in respect of Directors’ remuneration and incentives were considered at the 2018 AGM. The Directors’ Remuneration Policy was approved by shareholders at the AGM on 27 April 2016. A summary of this Policy is on pages 109 to 113.
| Approval of Directors’ Remuneration Report 2017 |
Approval of Directors’ Remuneration Report 2018 |
|||||||
| Percentage for |
92.05 | 75.68 | ||||||
| Votes for (including discretionary) |
1,346,502,332 | 1,326,830,858 | ||||||
| Percentage against |
7.95 | 24.32 | ||||||
| Votes against |
116,220,156 | 426,315,629 | ||||||
| Total votes cast excluding votes withheld |
1,462,722,488 | 1,753,146,487 | ||||||
| Votes withheld1 |
13,100,905 | 30,934,018 | ||||||
| Total votes cast including votes withheld |
1,475,823,393 | 1,784,080,505 | ||||||
Note:
| 1. | Votes withheld: these are not included in the final proxy figures as they are not recognised as a vote in law. |
The Company acknowledges that a number of shareholders did not support the resolution regarding the 2017 Directors’ Remuneration Report. Following the Company’s 2018 AGM, the Company has undertaken an extensive programme of engagement with shareholders as part of a full review of the Company’s Directors’ Remuneration Policy to understand shareholder perspectives in depth. The Committee has carefully considered the feedback received and has taken this into account in revising the Company’s Directors’ Remuneration Policy, presented for shareholders’ consideration at pages 76 to 89.
| 108 | BAT Annual Report and Form 20-F 2018 | |
|
Strategic Report
|
Governance
|
Financial Statements
|
Other Information
|
|
Introduction & Board
|
Audit Committee
|
Nominations Committee
|
Remuneration Committee
|
Responsibility of Directors
|
8 Summary of our Directors’ Remuneration Policy
The Remuneration Policy, that sets the basis for remuneration in 2018, for the Executive Directors and the Non-Executive Directors was approved by shareholders at the AGM on 27 April 2016.
The full Directors’ Remuneration Policy is set out in the Remuneration Report 2015 contained in the Annual Report for the year ended 2015, which is available at www.bat.com.
To assist in reviewing our Annual Report on Remuneration, we have summarised the key elements of the Directors’ Remuneration Policy as it principally applies to remuneration paid during 2018.
Directors’ Remuneration Policy summary: our remuneration strategy
Our principles of remuneration – summary
The Remuneration Committee’s remuneration principles seek to reward the delivery of the Group’s strategy in a simple and straightforward manner which is aligned to shareholders’ long-term sustainable interests.
The remuneration structure comprises fixed and variable elements. These rewards are structured and designed to be both transparent and stretching while recognising the skills and experience of the Executive Directors and ensuring a market competitiveness for talent. The fixed elements comprise base salary, pension and other benefits. The variable elements are provided via two performance-based incentive schemes (a single short-term cash and share incentive annual bonus plan (STI), and a single long-term incentive plan (LTIP)).
In applying these principles, the Remuneration Committee maintains an appropriate balance between fixed pay and the opportunity to earn performance-related remuneration with the performance-based elements forming, at maximum opportunity, between 75% and 85% of the Executive Directors’ total remuneration. An annual review is conducted to ensure application and alignment of the Directors’ Remuneration Policy with the business needs to promote the long-term success of the Company.
| How each key element of our remuneration supports the strategic priorities
| ||
| Fixed remuneration: base salary pension benefits |
– attract and retain high calibre individuals to deliver the Company’s strategic plans by offering market-competitive levels of guaranteed cash to reflect an individual’s skills, experience and role within the Company;
– provide competitive post-retirement benefit arrangements which recognise both the individual’s length of tenure with the Group and the external environment in the context of attracting and retaining senior high calibre individuals to deliver the Group’s strategy; and
– provide market-competitive benefits consistent with the role which: (1) help to facilitate the attraction and retention of high calibre, senior individuals to deliver the Company’s strategic plans; and (2) recognise that such talent is global in source and that the availability of certain benefits (e.g. relocation, repatriation, taxation compliance advice) will from time to time be necessary to avoid such factors being an inhibitor to accepting the role. | |
| Variable remuneration: short-term incentives |
– incentivise the attainment of corporate targets aligned to the strategic objectives of the Company on an annual basis;
– performance-based award in the form of cash and deferred ordinary shares, so that the latter element ensures alignment with shareholders’ long-term interests;
– strong alignment and linkage between individual and corporate annual objectives via the application of an individual performance adjustment factor to the corporate result; and
– ensure, overall, a market-competitive package to attract and retain high calibre individuals to deliver the Group’s strategy. | |
| Variable remuneration: long-term incentives |
– incentivise long-term sustainable growth in total shareholder return (TSR), adjusted diluted earnings per share (EPS) and adjusted revenue growth, together with the achievement of a consistently high measure of operating profit conversion ratio over a three-year period; to facilitate the appointment of high calibre, senior individuals required to deliver the Company’s strategic plans; and to promote the long-term success of the Company; and
– to put in place a combination of measures with appropriately stretching targets around the long-term plan that provides a balance relevant to the Group’s business and market conditions, as well as providing alignment between Executive Directors and shareholders. In setting performance criteria and thresholds/targets, the Remuneration Committee takes account of the Group’s long-term plans and market expectations. | |
| BAT Annual Report and Form 20-F 2018 | 109 | |
|
Remuneration Report
|
||||||||||||||
| Annual Report on Remuneration continued | ||||||||||||||
Directors’ Remuneration Policy summary: elements of pay for the current Executive Directors
Base salary
Normally paid in 12 equal monthly instalments during the year and is pensionable.
Normally reviewed annually in February (with salary changes effective from April) or subject to an ad hoc review on a significant change of responsibilities.
Salaries are reviewed against appropriate market data, including general UK pay trends and a company size and complexity model based on UK companies, as well as a Pay Comparator Group.
Increases in salary will generally be in the range of the increases in the base pay of other UK-based employees in the Group.
Year-on-year increases for Executive Directors, currently in role, will not exceed 10% per annum during the policy period.
A significant change in responsibilities may be reflected in an above-average increase (which may exceed 10%) of salary.
Pensions
Pension Fund: non-contributory defined benefit section
Accrual rates differ according to individual circumstances but do not exceed 1/40th of pensionable salary for each year of pensionable service.
Retains a scheme-specific salary cap (currently £160,800 effective 1 April 2018).
Benefits in excess of the cap are accrued in the UURBS.
Pension Fund: defined contribution section
In place since April 2005.
Annual contribution up to the equivalent of 35% of base salary would be made.
Actual level of contribution paid to the Pension Fund is restricted to take account of the annual allowance and lifetime allowance.
Balance of contribution payable as a gross cash allowance or accumulated in the UURBS.
UURBS
Accrued defined benefits in the UURBS may be received on retirement either as a single lump sum or as an ongoing pension payment.
Pension accrual in the UURBS is at the same rate as in the Pension Fund (1/40th per annum).
Benefits
The Company currently offers the following range of contractual benefits to Executive Directors (on an individually specific basis) with maximum annual values (subject to periodic inflation-related increases where applicable):
| – | car or car allowance: £20,000; |
| – | use of a Company driver: variable maxima as the actual cost is dependent on the miles driven in any year; |
| – | variable maxima will apply to the cost of private medical insurance which is dependent on an individual’s circumstances and is provided on a family basis; |
| – | GP ‘walk-in’ medical services located close to the Group’s headquarters in London: £5,000; |
| – | personal life and accident insurance designed to pay out at a multiple of four and five times base salary respectively; |
| – | employment tax advice as required, but not exceeding £30,000 and tax equalisation payments as agreed by the Remuneration Committee from time to time; and |
| – | relocation and shipment expenses at the beginning and end of service as an Executive Director up to £200,000 and, in addition, housing and education allowances or other similar arrangements, as appropriate to the individual’s family circumstances. |
With the exception of the car or car allowance, in line with the UK market and the practice followed for all the Group’s other UK employees, it is also practice to pay the tax that may be due on these benefits.
| Short-term incentives – STI | ||||||||
| Chief Executive
|
Finance Director
|
|||||||
| STI opportunity (Group outcome |
Maximum | On-target | Maximum | On-target | ||||
| delivered 50% cash; 50% | 250% | 125% | 190% | 95% | ||||
| deferred ordinary shares, individual performance adjustment factor delivered in cash) | ||||||||
| Performance adjustment and clawback and malus | Individual performance adjustment factor: up to 20% uplift possible if individual performance is assessed as outstanding (up to the maximum opportunity) and paid in cash. Up to 50% reduction possible if individual performance is assessed as poor. | |||||||
| Clawback and malus: provisions are in place. | ||||||||
| Performance measures and weightings | The Remuneration Committee sets the performance targets each year at the beginning of the performance period and is able to vary the exact measures and the weighting of them from year to year. | |||||||
| The performance measures are detailed for 2018 on page 92 and for 2019 and on page 98. | ||||||||
| 110 | BAT Annual Report and Form 20-F 2018 | |
|
Strategic Report
|
Governance
|
Financial Statements
|
Other Information
|
|
Introduction & Board
|
Audit Committee
|
Nominations Committee
|
Remuneration Committee
|
Responsibility of Directors
|
| Long-term incentives – LTIP | ||||||||
| Chief Executive | Finance Director | |||||||
| LTIP opportunity |
Maximum | 500% | Maximum | 350% | ||||
| Performance measures and weightings | The Remuneration Committee may make revisions to the performance measures, their weightings, thresholds and target levels as permitted under the LTIP rules. The performance measures are detailed for the 2016 – 2018 performance period on page 94 and for the award to be granted in 2019 on page 99. | |||||||
| Dividend equivalent payment and clawback and malus | Dividend equivalent payment: on all vesting ordinary shares. Clawback and malus: provisions are in place. | |||||||
| LTIP extended vesting period | For awards granted in 2016 and subsequently, an additional vesting period of two years applies from the third anniversary of the date of grant. Where this applies, LTIP awards vest only to the extent that: – the performance conditions are satisfied at the end of the three-year performance period; and – an additional vesting period of two years from the third anniversary of grant is completed. | |||||||
Other elements of remuneration for the Executive Directors
All-employee share plans
Executive Directors are eligible to participate in the Company’s all-employee share schemes:
| – | Sharesave Scheme: a UK tax-advantaged approved scheme where eligible employees are granted savings-related share options to subscribe for ordinary shares in the Company. |
| – | Share Incentive Plan (SIP): a UK tax-advantaged plan incorporating: (1) Partnership Scheme; and (2) Share Reward Scheme. |
| Shareholding requirements
| ||||
| Chief Executive % of salary | Finance Director % of salary |
Ordinary shares awarded but not yet vested and for which performance conditions have already been met under the DSBS element of the STI are included in the calculation of the threshold for the shareholding guidelines for the Executive Directors.
The estimated notional net number of ordinary shares held by an Executive Director in the LTIP Extended Vesting Period will also count towards the respective shareholding requirements.
| ||
| 500% | 350%
| |||
External Board appointments
Each Executive Director is limited to one external appointment, with the permission of the Board. Any fees from such appointments are retained by the individual in recognition of the increased level of personal commitment required.
| BAT Annual Report and Form 20-F 2018 | 111 | |
|
Remuneration Report
|
||||||||||||||
| Annual Report on Remuneration continued | ||||||||||||||
Directors’ Remuneration Policy summary: other policy provisions in relation to Executive Directors
Service contracts
The current Executive Directors are employed on a one-year rolling contract, executed at the time of the original appointment.
The Remuneration Committee may exercise its discretion to award two- or three-year contracts in the event that the Executive Director is recruited externally or from overseas.
Contracts with an initial period of longer than one year will then reduce to a one-year rolling contract after the expiry of the initial period.
Policy on payment for loss of office
Principles
The principles on which the Remuneration Committee will approach the determination for payments on termination are as follows:
– compensation for loss of office in service contracts is limited to no more than 12 months’ salary and benefits excluding pension;
– in the event that the contract is terminated for cause (such as gross misconduct), the Company may terminate the contract with immediate effect and no compensation would be payable; and
– the service contracts of the Executive Directors are terminable on the expiry of 12 months’ notice from either the Director or the Company which means that, where an internal successor has not been identified, the Company would have sufficient time to replace the Executive Director through an orderly external recruitment process and ideally have a period of handover.
Treatment of awards under the share incentive schemes: STI/DSBS and LTIP; All-employee scheme: SRS
Executive Directors do not have contractual rights to the value inherent in any awards held under the share incentive schemes. The release of awards is dependent on ‘leaver’ status and is at the discretion of the Remuneration Committee.
The Remuneration Committee retains discretion in deciding ‘good leaver’ status other than in cases of automatic ‘good leavers’ as set out in the applicable provisions of the DSBS and LTIP rules. The discretionary powers are intended to provide flexibility as Executive Directors may leave employment for a broad variety of reasons which may not necessarily fall within the prescribed category of ‘good leaver’. The Remuneration Committee exercises its discretion by reference to guidelines which set out its agreed relevant factors to assist in the determination of a leaver’s status.
In exercising its discretion, the Remuneration Committee will also take into account the individual’s overall performance as well as their contribution to the Company during their total period of employment.
Details of how leavers are assessed as ‘good leavers’ are set out in the Remuneration Policy.
| 112 | BAT Annual Report and Form 20-F 2018 | |
|
Strategic Report
|
Governance
|
Financial Statements
|
Other Information
|
|
Introduction & Board
|
Audit Committee
|
Nominations Committee
|
Remuneration Committee
|
Responsibility of Directors
|
Directors’ Remuneration Policy summary: elements of pay for the current
Chairman and Non-Executive Directors
Fees – Chairman
Considered annually by the Remuneration Committee using data from the FTSE 30 companies and taking into account the breadth of that role, coupled with its associated levels of personal commitment and expertise in the overall context of international reach and the ‘ambassadorial’ aspect of the role. The Chairman does not participate in discussions on his level of remuneration.
It is anticipated that any future aggregate increase to any of the fees for the Chairman and Non-Executive Directors will be within the salary range which governs the Company’s annual salary reviews for UK-based staff and will not exceed the equivalent of 10% per annum in aggregate.
Benefits, travel and related expenses – Chairman
Reimbursed for the cost of travel and related expenses incurred by him in respect of attendance at Board, Committee and General Meetings including the cost of return airline tickets to London from his home in Ireland in connection with his duties as Chairman.
Entitled to: the use of a Company driver; private medical insurance and personal accident insurance benefits; the provision of home and personal security; and general practitioner ‘walk-in’ medical services based a short distance from the Company’s headquarters in London.
Richard Burrows’ spouse may, from time to time, accompany him to participate in a partners’ programme occasionally organised in conjunction with overseas or UK-based Board meetings and otherwise at hospitality functions during the year.
In instances where any reimbursements or expenses are classified by HMRC as a benefit to the Chairman, it is also the practice of the Company to pay any tax due on any such benefits.
Fees – Non-Executive Directors
Non-Executive Directors receive a base fee and an appropriate Board Committee Membership Fee.
The Chairs of the Audit and Remuneration Committees receive an additional supplement and an additional supplement is also paid to the Senior Independent Director.
The quantum and structure of Non-Executive Directors’ remuneration primarily are assessed against the same Pay Comparator Group of companies used for setting the remuneration of Executive Directors. The Board may also make reference to and take account of relevant research and analysis on Non-Executive Directors’ fees in FTSE 100 companies published by remuneration consultants from time to time.
Fees for the Non-Executive Directors are reviewed annually, usually in April. The review does not always result in an increase in the Board fees or Committee fees.
The Board as a whole considers the policy and structure for the Non-Executive Directors’ fees on the recommendation of the Chairman and the Chief Executive. Non-Executive Directors do not participate in discussions on their specific levels of remuneration.
It is anticipated that any future aggregate increase to any of the fees for the Chairman and Non-Executive Directors will be within the salary range which governs the Company’s annual salary reviews for UK-based staff and will not exceed the equivalent of 10% per annum in aggregate.
Benefits, travel and related expenses – Non-Executive Directors
Non-Executive Directors are generally reimbursed for the cost of travel and related expenses incurred by them in respect of attendance at Board, Committee and General Meetings.
It is Board policy that the partners of the Non-Executive Directors may, from time to time, accompany the Directors to participate in a partners’ programme occasionally organised in conjunction with overseas or UK-based Board meetings and otherwise at hospitality functions during the year.
Non-Executive Directors are also eligible for general practitioner ‘walk-in’ medical services based a short distance from the Company’s headquarters in London; Non-Executive Directors receive no other benefits.
In instances where any reimbursements or expenses are classified by HMRC as a benefit to the Director, it is also the practice of the Company to pay any tax due on any such benefits.
The Directors’ Remuneration Report has been approved by the Board on 27 February 2019 and signed on its behalf by:
Dimitri Panayotopoulos
Chairman, Remuneration Committee
27 February 2019
| BAT Annual Report and Form 20-F 2018 | 113 | |
|
Governance
|
|
Introduction & Board
|
Audit Committee
|
Nominations Committee
|
Remuneration Committee
|
Responsibility of Directors
|
[This page intentionally left blank]
| 114 | BAT Annual Report and Form 20-F 2018 | |
|
Strategic Report
|
Governance
|
|
Other Information
|
[This page intentionally left blank]
| BAT Annual Report and Form 20-F 2018 | 115 | |
|
Financial Statements
|
[This page intentionally left blank]
| 116 | BAT Annual Report and Form 20-F 2018 | |
|
Strategic Report
|
Governance
|
Financial Statements
|
Other Information
|
[This page intentionally left blank]
| BAT Annual Report and Form 20-F 2018 | 117 | |
|
Financial Statements
|
[This page intentionally left blank]
| 118 | BAT Annual Report and Form 20-F 2018 | |
|
Strategic Report
|
Governance
|
Financial Statements
|
Other Information
|
[This page intentionally left blank]
| BAT Annual Report and Form 20-F 2018 | 119 | |
|
Financial Statements
|
[This page intentionally left blank]
| 120 | BAT Annual Report and Form 20-F 2018 | |
|
Strategic Report
|
Governance
|
|
Other Information
|
Report of Independent Registered Public
Accounting Firm
to the Stockholders and Board of Directors of British American Tobacco p.l.c.
Opinions on the Consolidated Financial Statements and Internal Control Over Financial Reporting
We have audited the accompanying Group Balance Sheets of British American Tobacco and subsidiaries (the “Group”) as of December 31, 2018 and 2017, the related Group Income statement, Group Statement of Comprehensive Income, Group Statement of Changes in Equity, and Group Cash Flow Statement for each of the years in the three-year period ended December 31, 2018 and the related notes (collectively, the Group’s “consolidated financial statements”). We also have audited the Group’s internal control over financial reporting as of December 31, 2018, based on criteria established in Internal Control – Integrated Framework (2013) issued by the Committee of Sponsoring Organizations of the Treadway Commission.
In our opinion, the consolidated financial statements referred to above present fairly, in all material respects, the financial position of the Group as of December 31, 2018 and 2017, and the results of its operations and its cash flows for each of the years in the three-year period ended December 31, 2018, in conformity with International Financial Reporting Standards (IFRS) as issued by the International Accounting Standards Board and in conformity with IFRS as adopted by the European Union. Also in our opinion, the Group maintained, in all material respects, effective internal control over financial reporting as of December 31, 2018 based on criteria established in Internal Control – Integrated Framework (2013) issued by the Committee of Sponsoring Organizations of the Treadway Commission.
Basis for Opinions
The Group’s management is responsible for these consolidated financial statements, for maintaining effective internal control over financial reporting, and for its assessment of the effectiveness of internal control over financial reporting, included in the accompanying Management’s report on internal control over financial reporting. Our responsibility is to express an opinion on the Group’s consolidated financial statements and an opinion on the Group’s internal control over financial reporting based on our audits. We are a public accounting firm registered with the Public Company Accounting Oversight Board (United States) (PCAOB) and are required to be independent with respect to the Group in accordance with the U.S. federal securities laws and the applicable rules and regulations of the Securities and Exchange Commission and the PCAOB.
We conducted our audits in accordance with the standards of the PCAOB. Those standards require that we plan and perform the audits to obtain reasonable assurance about whether the consolidated financial statements are free of material misstatement, whether due to error or fraud, and whether effective internal control over financial reporting was maintained in all material respects.
Our audits of the consolidated financial statements included performing procedures to assess the risks of material misstatement of the consolidated financial statements, whether due to error or fraud, and performing procedures that respond to those risks. Such procedures included examining, on a test basis, evidence regarding the amounts and disclosures in the consolidated financial statements. Our audits also included evaluating the accounting principles used and significant estimates made by management, as well as evaluating the overall presentation of the consolidated financial statements. Our audit of internal control over financial reporting included obtaining an understanding of internal control over financial reporting, assessing the risk that a material weakness exists, and testing and evaluating the design and operating effectiveness of internal control based on the assessed risk. Our audits also included performing such other procedures as we considered necessary in the circumstances. We believe that our audits provide a reasonable basis for our opinions.
Definition and Limitations of Internal Control Over Financial Reporting
A company’s internal control over financial reporting is a process designed to provide reasonable assurance regarding the reliability of financial reporting and the preparation of financial statements for external purposes in accordance with generally accepted accounting principles. A company’s internal control over financial reporting includes those policies and procedures that (1) pertain to the maintenance of records that, in reasonable detail, accurately and fairly reflect the transactions and dispositions of the assets of the company; (2) provide reasonable assurance that transactions are recorded as necessary to permit preparation of financial statements in accordance with generally accepted accounting principles, and that receipts and expenditures of the company are being made only in accordance with authorizations of management and directors of the company; and (3) provide reasonable assurance regarding prevention or timely detection of unauthorized acquisition, use, or disposition of the company’s assets that could have a material effect on the financial statements.
Because of its inherent limitations, internal control over financial reporting may not prevent or detect misstatements. Also, projections of any evaluation of effectiveness to future periods are subject to the risk that controls may become inadequate because of changes in conditions, or that the degree of compliance with the policies or procedures may deteriorate.
We have served as the Group’s auditor since 2015.
KPMG LLP
London, United Kingdom
February 27, 2019
| BAT Annual Report and Form 20-F 2018 | 121 | |
|
Financial Statements
|
Group Income Statement
| For the years ended 31 December | ||||||||||||||||||||
| 2018 £m |
2017 £m |
2016 £m |
||||||||||||||||||
| Notes | Revised | Revised | ||||||||||||||||||
| Revenue1 | 2 | 24,492 | 19,564 | 14,130 | ||||||||||||||||
| Raw materials and consumables used | (4,664 | ) | (4,520 | ) | (3,777 | ) | ||||||||||||||
| Changes in inventories of finished goods and work in progress | 3(h) | 114 | (513 | ) | 44 | |||||||||||||||
| Employee benefit costs | 3(a),(e) | (3,005 | ) | (2,679 | ) | (2,274 | ) | |||||||||||||
| Depreciation, amortisation and impairment costs | 3(b),(e),(f),(h) | (1,038 | ) | (902 | ) | (607 | ) | |||||||||||||
| Other operating income | 3(e) | 85 | 144 | 176 | ||||||||||||||||
| Loss on reclassification from amortised cost to fair value | (3 | ) | – | – | ||||||||||||||||
| Other operating expenses | 3(c),(d),(e),(g),(h) | (6,668 | ) | (4,682 | ) | (3,037 | ) | |||||||||||||
| Profit from operations | 2 | 9,313 | 6,412 | 4,655 | ||||||||||||||||
| Net finance costs | 3(h),4 | (1,381 | ) | (1,094 | ) | (637 | ) | |||||||||||||
| Share of post-tax results of associates and joint ventures | 2, 5 | 419 | 24,209 | 2,227 | ||||||||||||||||
| Profit before taxation | 8,351 | 29,527 | 6,245 | |||||||||||||||||
| Taxation on ordinary activities | 6 | (2,141 | ) | 8,129 | (1,406 | ) | ||||||||||||||
| Profit for the year | 6,210 | 37,656 | 4,839 | |||||||||||||||||
| Attributable to: | ||||||||||||||||||||
| Owners of the parent | 6,032 | 37,485 | 4,648 | |||||||||||||||||
| Non-controlling interests | 178 | 171 | 191 | |||||||||||||||||
| 6,210 | 37,656 | 4,839 | ||||||||||||||||||
| Earnings per share | ||||||||||||||||||||
| Basic | 7 | 264.0 | p | 1,833.9 | p | 250.2 | p | |||||||||||||
| Diluted | 7 | 263.2 | p | 1,827.6 | p | 249.2 | p | |||||||||||||
| 1. | Revenue is net of duty, excise and other taxes of £38,553 million, £37,780 million and £32,136 million for the years ended 31 December 2018, 2017 and 2016, respectively. |
The accompanying notes are an integral part of these consolidated financial statements.
The results for the twelve-month period ended 31 December 2017 and 31 December 2016 have been revised as explained in notes 1 and 31.
| 122 | BAT Annual Report and Form 20-F 2018 | |
|
Strategic Report
|
Governance
|
Financial Statements
|
Other Information
|
Group Statement of Comprehensive Income
| For the years ended 31 December | ||||||||||||||||
| Notes |
2018 |
2017 £m |
2016 £m |
|||||||||||||
| Profit for the year | 6,210 | 37,656 | 4,839 | |||||||||||||
| Other comprehensive income/(expense) | ||||||||||||||||
| Items that may be reclassified subsequently to profit or loss: | 3,099 | (3,809 | ) | 1,760 | ||||||||||||
| Differences on exchange | 3,868 | (3,084 | ) | 1,270 | ||||||||||||
| Cash flow hedges | ||||||||||||||||
| – net fair value (losses)/gains | (58 | ) | (264 | ) | 29 | |||||||||||
| – reclassified and reported in profit for the year | 17 | 109 | 38 | |||||||||||||
| – reclassified and reported in total assets | – | (16 | ) | (12 | ) | |||||||||||
| Investments held at fair value | ||||||||||||||||
| – net fair value losses | – | (27 | ) | – | ||||||||||||
| Net investment hedges | ||||||||||||||||
| – net fair value (losses)/gains | (472 | ) | 425 | (837 | ) | |||||||||||
| – differences on exchange on borrowings | (236 | ) | (68 | ) | (124 | ) | ||||||||||
| Associates – share of OCI, net of tax | 5 | (38 | ) | (918 | ) | 1,415 | ||||||||||
| Tax on items that may be reclassified | 6(f) | 18 | 34 | (19 | ) | |||||||||||
| Items that will not be reclassified subsequently to profit or loss: | 115 | 681 | (173 | ) | ||||||||||||
| Retirement benefit schemes | ||||||||||||||||
| – net actuarial gains/(losses) | 12 | 138 | 833 | (228 | ) | |||||||||||
| – surplus recognition and minimum funding obligations | 12 | 4 | (6 | ) | (1 | ) | ||||||||||
| Associates – share of OCI, net of tax | 5 | 6 | 25 | 20 | ||||||||||||
| Tax on items that will not be reclassified | 6(f) | (33 | ) | (171 | ) | 36 | ||||||||||
| Total other comprehensive (expense)/income for the year, net of tax | 3,214 | (3,128 | ) | 1,587 | ||||||||||||
| Total comprehensive income for the year, net of tax | 9,424 | 34,528 | 6,426 | |||||||||||||
| Attributable to: | ||||||||||||||||
| Owners of the parent | 9,239 | 34,361 | 6,180 | |||||||||||||
| Non-controlling interests | 185 | 167 | 246 | |||||||||||||
| 9,424 | 34,528 | 6,426 | ||||||||||||||
The accompanying notes are an integral part of these consolidated financial statements.
The results for the twelve-month period ended 31 December 2017 have been revised as explained in notes 1 and 31.
| BAT Annual Report and Form 20-F 2018 | 123 | |
|
Financial Statements
|
Group Statement of Changes in Equity
|
Attributable to owners of the parent |
||||||||||||||||||||||||||||||||
| Notes | Share capital £m |
Share |
Other reserves £m |
Retained earnings £m |
Total attributable to owners of parent £m |
Non- controlling interests £m |
Total equity £m |
|||||||||||||||||||||||||
|
Balance at 31 December 2017 |
614 | 26,602 | (3,392 | ) | 36,935 | 60,759 | 222 | 60,981 | ||||||||||||||||||||||||
|
Accounting policy change (IFRS 9 see note 31) |
– | – | (9 | ) | (29 | ) | (38 | ) | – | (38 | ) | |||||||||||||||||||||
|
Revised balance at 1 January 2018 |
614 | 26,602 | (3,401 | ) | 36,906 | 60,721 | 222 | 60,943 | ||||||||||||||||||||||||
|
Total comprehensive income for the year comprising: |
– | – | 3,090 | 6,149 | 9,239 | 185 | 9,424 | |||||||||||||||||||||||||
|
Profit for the year |
– | – | – | 6,032 | 6,032 | 178 | 6,210 | |||||||||||||||||||||||||
|
Other comprehensive income for the year |
– | – | 3,090 | 117 | 3,207 | 7 | 3,214 | |||||||||||||||||||||||||
|
Cash flow hedges reclassified and reported in total assets |
– | – | (22 | ) | – | (22 | ) | – | (22 | ) | ||||||||||||||||||||||
|
Other changes in equity |
||||||||||||||||||||||||||||||||
|
Employee share options |
||||||||||||||||||||||||||||||||
|
– value of employee services |
25 | – | – | – | 121 | 121 | – | 121 | ||||||||||||||||||||||||
|
– proceeds from shares issued |
– | 4 | – | – | 4 | – | 4 | |||||||||||||||||||||||||
|
Dividends and other appropriations |
||||||||||||||||||||||||||||||||
|
– ordinary shares |
8 | – | – | – | (4,463 | ) | (4,463 | ) | – | (4,463 | ) | |||||||||||||||||||||
|
– to non-controlling interests |
– | – | – | – | – | (163 | ) | (163 | ) | |||||||||||||||||||||||
|
Purchase of own shares |
||||||||||||||||||||||||||||||||
|
– held in employee share ownership trusts |
– | – | – | (139 | ) | (139 | ) | – | (139 | ) | ||||||||||||||||||||||
|
Non-controlling interests – acquisitions |
24(c) | – | – | – | (11 | ) | (11 | ) | – | (11 | ) | |||||||||||||||||||||
|
Other movements |
– | – | – | (6 | ) | (6 | ) | – | (6 | ) | ||||||||||||||||||||||
| Balance at 31 December 2018 | 614 | 26,606 | (333 | ) | 38,557 | 65,444 | 244 | 65,688 | ||||||||||||||||||||||||
The accompanying notes are an integral part of these consolidated financial statements.
|
Attributable to owners of the parent |
||||||||||||||||||||||||||||||||
| Revised | Notes | Share capital £m |
Share |
Other reserves £m |
Retained earnings £m |
Total attributable to owners of parent £m |
Non- controlling interests £m |
Total equity £m |
||||||||||||||||||||||||
|
Balance at 1 January 2017 |
507 | 3,931 | 413 | 3,331 | 8,182 | 224 | 8,406 | |||||||||||||||||||||||||
|
Total comprehensive income for the year comprising: |
– | – | (3,805 | ) | 38,166 | 34,361 | 167 | 34,528 | ||||||||||||||||||||||||
|
Profit for the year |
– | – | – | 37,485 | 37,485 | 171 | 37,656 | |||||||||||||||||||||||||
|
Other comprehensive income for the year |
– | – | (3,805 | ) | 681 | (3,124 | ) | (4 | ) | (3,128 | ) | |||||||||||||||||||||
|
Other changes in equity |
||||||||||||||||||||||||||||||||
|
Employee share options |
||||||||||||||||||||||||||||||||
|
– value of employee services |
25 | – | – | – | 105 | 105 | – | 105 | ||||||||||||||||||||||||
|
– proceeds from shares issued |
– | 5 | – | – | 5 | – | 5 | |||||||||||||||||||||||||
|
Dividends and other appropriations |
||||||||||||||||||||||||||||||||
|
– ordinary shares |
– | – | – | (4,465 | ) | (4,465 | ) | – | (4,465 | ) | ||||||||||||||||||||||
|
– to non-controlling interests |
– | – | – | – | – | (169 | ) | (169 | ) | |||||||||||||||||||||||
|
Purchase of own shares |
||||||||||||||||||||||||||||||||
|
– held in employee share ownership trusts |
– | – | – | (205 | ) | (205 | ) | – | (205 | ) | ||||||||||||||||||||||
|
Shares issued – RAI acquisition |
24(a) | 107 | 22,666 | – | – | 22,773 | – | 22,773 | ||||||||||||||||||||||||
|
Other movements |
– | – | – | 3 | 3 | – | 3 | |||||||||||||||||||||||||
|
Balance at 31 December 2017 |
614 | 26,602 | (3,392 | ) | 36,935 | 60,759 | 222 | 60,981 | ||||||||||||||||||||||||
The accompanying notes are an integral part of these consolidated financial statements.
The results for the twelve-month period ended 31 December 2017 have been revised as explained in notes 1 and 31.
| 124 | BAT Annual Report and Form 20-F 2018 | |
|
Strategic Report
|
Governance
|
Financial Statements
|
Other Information
|
|
Attributable to owners of the parent |
||||||||||||||||||||||||||||||||
| Notes | Share capital £m |
Share |
Other reserves £m |
Retained earnings £m |
Total attributable to owners of parent £m |
Non- controlling interests £m |
Total equity £m |
|||||||||||||||||||||||||
|
Balance at 1 January 2016 |
507 | 3,927 | (1,294 | ) | 1,754 | 4,894 | 138 | 5,032 | ||||||||||||||||||||||||
|
Total comprehensive income for the year comprising: |
– | – | 1,707 | 4,473 | 6,180 | 246 | 6,426 | |||||||||||||||||||||||||
|
Profit for the year |
– | – | – | 4,648 | 4,648 | 191 | 4,839 | |||||||||||||||||||||||||
|
Other comprehensive income for the year |
– | – | 1,707 | (175 | ) | 1,532 | 55 | 1,587 | ||||||||||||||||||||||||
|
Other changes in equity |
||||||||||||||||||||||||||||||||
|
Employee share options |
||||||||||||||||||||||||||||||||
|
– value of employee services |
25 | – | – | – | 71 | 71 | – | 71 | ||||||||||||||||||||||||
|
– proceeds from shares issued |
– | 4 | – | – | 4 | – | 4 | |||||||||||||||||||||||||
|
Dividends and other appropriations |
||||||||||||||||||||||||||||||||
|
– ordinary shares |
– | – | – | (2,910 | ) | (2,910 | ) | – | (2,910 | ) | ||||||||||||||||||||||
|
– to non-controlling interests |
– | – | – | – | – | (156 | ) | (156 | ) | |||||||||||||||||||||||
|
Purchase of own shares |
||||||||||||||||||||||||||||||||
|
– held in employee share ownership trusts |
– | – | – | (64 | ) | (64 | ) | – | (64 | ) | ||||||||||||||||||||||
|
Non-controlling interests – acquisitions |
24(c) | – | – | – | 4 | 4 | (4 | ) | – | |||||||||||||||||||||||
|
Other movements |
– | – | – | 3 | 3 | – | 3 | |||||||||||||||||||||||||
|
Balance at 31 December 2016 |
507 | 3,931 | 413 | 3,331 | 8,182 | 224 | 8,406 | |||||||||||||||||||||||||
The accompanying notes are an integral part of these consolidated financial statements.
| BAT Annual Report and Form 20-F 2018 | 125 | |
|
Financial Statements
|
Group Balance Sheet
| At 31 December | ||||||||||||
| 2018 £m |
2017 £m |
|||||||||||
| Notes | Revised | |||||||||||
| Assets |
||||||||||||
| Intangible assets |
9 | 124,013 | 117,785 | |||||||||
| Property, plant and equipment |
10 | 5,166 | 4,882 | |||||||||
| Investments in associates and joint ventures |
11 | 1,737 | 1,577 | |||||||||
| Retirement benefit assets |
12 | 1,147 | 1,123 | |||||||||
| Deferred tax assets |
13 | 344 | 333 | |||||||||
| Trade and other receivables |
14 | 685 | 756 | |||||||||
| Investments held at fair value |
15 | 39 | 42 | |||||||||
| Derivative financial instruments |
16 | 556 | 590 | |||||||||
| Total non-current assets |
133,687 | 127,088 | ||||||||||
| Inventories |
17 | 6,029 | 5,864 | |||||||||
| Income tax receivable |
74 | 460 | ||||||||||
| Trade and other receivables |
14 | 3,588 | 4,053 | |||||||||
| Investments held at fair value |
15 | 178 | 65 | |||||||||
| Derivative financial instruments |
16 | 179 | 228 | |||||||||
| Cash and cash equivalents |
18 | 2,602 | 3,291 | |||||||||
| 12,650 | 13,961 | |||||||||||
| Assets classified as held-for-sale |
5 | 5 | ||||||||||
| Total current assets |
12,655 | 13,966 | ||||||||||
| Total assets |
146,342 | 141,054 | ||||||||||
| Equity – capital and reserves |
||||||||||||
| Share capital |
614 | 614 | ||||||||||
| Share premium, capital redemption and merger reserves |
26,606 | 26,602 | ||||||||||
| Other reserves |
(333 | ) | (3,392 | ) | ||||||||
| Retained earnings |
38,557 | 36,935 | ||||||||||
| Owners of the parent |
65,444 | 60,759 | ||||||||||
|
Non-controlling interests |
244 | 222 | ||||||||||
| Total equity |
19 | 65,688 | 60,981 | |||||||||
| Liabilities |
||||||||||||
| Borrowings |
20 | 43,284 | 44,027 | |||||||||
| Retirement benefit liabilities |
12 | 1,665 | 1,821 | |||||||||
| Deferred tax liabilities |
13 | 17,776 | 17,129 | |||||||||
| Other provisions for liabilities |
21 | 331 | 354 | |||||||||
| Trade and other payables |
22 | 1,055 | 1,058 | |||||||||
| Derivative financial instruments |
16 | 214 | 79 | |||||||||
| Total non-current liabilities |
64,325 | 64,468 | ||||||||||
| Borrowings |
20 | 4,225 | 5,423 | |||||||||
| Income tax payable |
853 | 720 | ||||||||||
| Other provisions for liabilities |
21 | 318 | 399 | |||||||||
| Trade and other payables |
22 | 10,631 | 8,908 | |||||||||
| Derivative financial instruments |
16 | 302 | 155 | |||||||||
| Total current liabilities |
16,329 | 15,605 | ||||||||||
| Total equity and liabilities |
146,342 | 141,054 | ||||||||||
The accompanying notes are an integral part of these consolidated financial statements.
The balance sheet as of 31 December 2017 has been revised as explained in notes 1 and 31.
On behalf of the Board
Richard Burrows
Chairman
27 February 2019
| 126 | BAT Annual Report and Form 20-F 2018 | |
|
Strategic Report
|
Governance
|
Financial Statements
|
Other Information
|
Group Cash Flow Statement
| For the years ended 31 December | ||||||||||||||||
| Notes | 2018 £m |
2017 £m |
2016 £m |
|||||||||||||
| Profit from operations | 9,313 | 6,412 | 4,655 | |||||||||||||
| Adjustments for | ||||||||||||||||
| – depreciation, amortisation and impairment costs | 3(b) | 1,038 | 902 | 607 | ||||||||||||
| – (increase)/decrease in inventories | (192 | ) | 1,409 | (638 | ) | |||||||||||
| – decrease/(increase) in trade and other receivables | 502 | (732 | ) | 87 | ||||||||||||
| – increase in amounts recoverable in respect of Quebec class action | 14 | – | (130 | ) | (242 | ) | ||||||||||
| – increase/(decrease) in provision for Master Settlement Agreement | 3(d) | 1,364 | (934 | ) | – | |||||||||||
| – increase/(decrease) in trade and other payables | 123 | (685 | ) | 428 | ||||||||||||
| – decrease in net retirement benefit liabilities | (100 | ) | (131 | ) | (145 | ) | ||||||||||
| – (decrease)/increase in other provisions for liabilities | (107 | ) | (78 | ) | 141 | |||||||||||
| – other non-cash items | 31 | 86 | – | |||||||||||||
| Cash generated from operations | 11,972 | 6,119 | 4,893 | |||||||||||||
| Dividends received from associates | 214 | 903 | 962 | |||||||||||||
| Tax paid | (1,891 | ) | (1,675 | ) | (1,245 | ) | ||||||||||
| Net cash generated from operating activities | 10,295 | 5,347 | 4,610 | |||||||||||||
| Cash flows from investing activities | ||||||||||||||||
| Interest received | 52 | 83 | 62 | |||||||||||||
| Purchases of property, plant and equipment | (758 | ) | (791 | ) | (586 | ) | ||||||||||
| Proceeds on disposal of property, plant and equipment | 38 | 95 | 93 | |||||||||||||
| Purchases of intangibles | (185 | ) | (187 | ) | (88 | ) | ||||||||||
| Purchases of investments | (320 | ) | (170 | ) | (109 | ) | ||||||||||
| Proceeds on disposals of investments | 167 | 160 | 22 | |||||||||||||
| Acquisition of Reynolds American Inc. net of cash acquired | – | (17,657 | ) | – | ||||||||||||
| Investment in associates and acquisitions of other subsidiaries net of cash acquired | (32 | ) | (77 | ) | (57 | ) | ||||||||||
| Proceeds on disposal of non-core business net of cash disposed | 17 | – | – | |||||||||||||
| Proceeds from associates’ share buy-backs |
– | – | 23 | |||||||||||||
| Net cash used in investing activities | (1,021 | ) | (18,544 | ) | (640 | ) | ||||||||||
| Cash flows from financing activities | ||||||||||||||||
| Interest paid | (1,559 | ) | (1,114 | ) | (641 | ) | ||||||||||
| Proceeds from increases in and new borrowings | 2,111 | 40,937 | 3,476 | |||||||||||||
| Inflows/(outflows) relating to derivative financial instruments | 49 | (406 | ) | (26 | ) | |||||||||||
| Purchases of own shares held in employee share ownership trusts | (139 | ) | (205 | ) | (64 | ) | ||||||||||
| Reductions in and repayments of borrowings | (5,596 | ) | (20,827 | ) | (3,840 | ) | ||||||||||
| Dividends paid to owners of the parent | 8 | (4,347 | ) | (3,465 | ) | (2,910 | ) | |||||||||
| Purchases of non-controlling interests | (11 | ) | – | (70 | ) | |||||||||||
| Dividends paid to non-controlling interests | (142 | ) | (167 | ) | (147 | ) | ||||||||||
| Other |
4 | 6 | (7 | ) | ||||||||||||
| Net cash (used in)/from financing activities | (9,630 | ) | 14,759 | (4,229 | ) | |||||||||||
| Net cash flows generated (used in)/from operating, investing and financing activities | (356 | ) | 1,562 | (259 | ) | |||||||||||
| Differences on exchange |
(138 | ) | (391 | ) | 180 | |||||||||||
| (Decrease)/increase in net cash and cash equivalents in the year | (494 | ) | 1,171 | (79 | ) | |||||||||||
| Net cash and cash equivalents at 1 January |
2,822 | 1,651 | 1,730 | |||||||||||||
| Net cash and cash equivalents at 31 December | 18 | 2,328 | 2,822 | 1,651 | ||||||||||||
The accompanying notes are an integral part of these consolidated financial statements.
Cash flow for the twelve-month period ended 31 December 2017 has been revised as explained in notes 1 and 31.
| BAT Annual Report and Form 20-F 2018 | 127 | |
|
Financial Statements
|
Notes on the Accounts
| 128 | BAT Annual Report and Form 20-F 2018 | |
|
Strategic Report
|
Governance
|
Financial Statements
|
Other Information
|
| BAT Annual Report and Form 20-F 2018 | 129 | |
| Financial Statements
|
||||||||||||||
| Notes on the Accounts continued | ||||||||||||||
| 130 | BAT Annual Report and Form 20-F 2018 | |
|
Strategic Report
|
Governance
|
Financial Statements
|
Other Information
|
| BAT Annual Report and Form 20-F 2018 | 131 | |
|
Financial Statements
|
Notes on the Accounts continued
| 132 | BAT Annual Report and Form 20-F 2018 | |
|
Strategic Report
|
Governance
|
Financial Statements
|
Other Information
|
| BAT Annual Report and Form 20-F 2018 | 133 | |
|
Financial Statements
|
Notes on the Accounts continued
2 Segmental analyses (revised)
With effect from 1 January 2018, the Group has adopted IFRS 15 Revenue from Contracts with Customers. The Group has fully restated (“revised”) prior periods, as explained in notes 1 and 31.
Due to the acquisition of RAI, the Group revised its organisational structure. RAI is reported as a separate region (United States). The markets which previously comprised EEMEA merged with the Americas, Western Europe and Asia-Pacific to form three new regions. The markets in the Middle East merged with Asia-Pacific to form the Asia-Pacific and Middle East region (APME). The markets in East and Central Africa, West Africa and Southern Africa merged with the Americas region to form the Americas and Sub-Saharan Africa region (AMSSA). The markets in Russia, Ukraine, Caucasus, Central Asia, Belarus, Turkey and North Africa merged with the Western Europe region to form the Europe and North Africa region (ENA). The segments disclosed below have been revised on this new basis.
As the chief operating decision maker, the Management Board reviews external adjusted revenues and adjusted profit from operations to evaluate segment performance and allocate resources to the overall business. The results of Next Generation Products are reported as part of the results of each geographic region and are not currently material to the Group. Consequently, it is not considered a reportable segment that requires separate disclosure under the requirements of IFRS 8 Operating Segments. Interest income, interest expense and taxation are centrally managed and accordingly such items are not presented by segment as they are excluded from the measure of segment profitability.
The four geographic regions are the reportable segments for the Group as they form the focus of the Group’s internal reporting systems and are the basis used by the Management Board for assessing performance and allocating resources. The Management Board reviews current and prior year adjusted segmental revenue, adjusted profit from operations of subsidiaries and joint operations, and adjusted post-tax results of associates and joint ventures at constant rates of exchange. The constant rate comparison provided for reporting segment information is based on a retranslation, at prior year exchange rates, of the current year results of the Group, including intercompany royalties payable in foreign currency to UK entities. However, the Group does not adjust for the normal transactional gains and losses in operations which are generated by movements in exchange rates.
In respect of the United States region, all financial statements and financial information provided by or with respect to the US business or RAI (and/or the RAI Group) are prepared on the basis of US GAAP and constitute the primary financial statements or financial information of the US business or RAI (and/or the RAI Group). Solely for the purpose of consolidation within the results of BAT p.l.c. and the BAT Group, this financial information is then converted to International Financial Reporting Standards as issued by the IASB and adopted by the European Union (IFRS). To the extent any such financial information provided in these financial statements relate to the US business or RAI (and/or the RAI Group) it is provided as an explanation of the US business’ or RAI’s (and/or the RAI Group’s) primary US GAAP based financial statements and information.
The following table shows 2018 revenue and adjusted revenue at current rates, and 2018 adjusted revenue translated using 2017 rates of exchange. The 2017 figures are stated at the 2017 rates of exchange.
|
2018
|
2017
|
|||||||||||||||||||||||||||||||||
|
Adjusted £m |
Translation exchange £m |
Adjusted £m |
Adjusting £m |
Revenue £m |
Adjusted Revenue £m |
Adjusting £m |
Revenue £m |
|||||||||||||||||||||||||||
| United States |
9,838 | (343 | ) | 9,495 | – | 9,495 | 4,160 | – | 4,160 | |||||||||||||||||||||||||
| APME |
5,250 | (368 | ) | 4,882 | – | 4,882 | 4,973 | – | 4,973 | |||||||||||||||||||||||||
| AMSSA |
4,560 | (449 | ) | 4,111 | – | 4,111 | 4,323 | – | 4,323 | |||||||||||||||||||||||||
| ENA |
6,112 | (288 | ) | 5,824 | 180 | 6,004 | 5,850 | 258 | 6,108 | |||||||||||||||||||||||||
| Revenue |
25,760 | (1,448 | ) | 24,312 | 180 | 24,492 | 19,306 | 258 | 19,564 | |||||||||||||||||||||||||
Note: adjusting items in revenue are in respect of excise included in goods acquired from a third party under short term arrangements and then
passed on to customers. This is deemed as adjusting due to the distorting nature to revenue and operating margin.
The following table shows 2017 revenue and adjusted revenue at current rates, and 2017 adjusted revenue translated using 2016 rates of exchange. The 2016 figures are stated at the 2016 rates of exchange.
|
2017
|
2016
|
|||||||||||||||||||||||||
|
Adjusted £m |
Translation exchange £m |
Adjusted £m |
Adjusting £m |
Revenue £m |
Revenue £m |
|||||||||||||||||||||
| United States |
3,958 | 202 | 4,160 | – | 4,160 | – | ||||||||||||||||||||
| APME |
4,776 | 197 | 4,973 | – | 4,973 | 4,769 | ||||||||||||||||||||
| AMSSA |
4,365 | (42 | ) | 4,323 | – | 4,323 | 4,038 | |||||||||||||||||||
| ENA |
5,507 | 343 | 5,850 | 258 | 6,108 | 5,323 | ||||||||||||||||||||
| Revenue |
18,606 | 700 | 19,306 | 258 | 19,564 | 14,130 | ||||||||||||||||||||
Note: adjusting items in revenue are in respect of excise included in goods acquired from a third party under short term arrangements and then passed on to customers. This is deemed as adjusting due to the distorting nature to revenue and operating margin.
| 134 | BAT Annual Report and Form 20-F 2018 | |
|
Strategic Report
|
Governance
|
Financial Statements
|
Other Information
|
2 Segmental analyses (revised) continued
The following table shows 2018 profit from operations and adjusted profit from operations at current rates, and 2018 adjusted profit from operations translated using 2017 rates of exchange. The 2017 figures are stated at the 2017 rates.
|
2018
|
2017
|
|||||||||||||||||||||||||||||||||
|
Adjusted* £m |
Translation exchange £m |
Adjusted* £m |
Adjusting* £m |
Segment £m |
Adjusted* £m |
Adjusting* £m |
Segment result £m |
|||||||||||||||||||||||||||
| United States |
4,686 | (175 | ) | 4,511 | (505) | 4,006 | 1,928 | (763) | 1,165 | |||||||||||||||||||||||||
| APME |
2,099 | (151 | ) | 1,948 | (90) | 1,858 | 2,049 | (147) | 1,902 | |||||||||||||||||||||||||
| AMSSA |
1,922 | (184 | ) | 1,738 | (194) | 1,544 | 1,782 | (134) | 1,648 | |||||||||||||||||||||||||
| ENA |
2,217 | (67 | ) | 2,150 | (245) | 1,905 | 2,170 | (473) | 1,697 | |||||||||||||||||||||||||
| Profit from operations |
10,924 | (577 | ) | 10,347 | (1,034) | 9,313 | 7,929 | (1,517) | 6,412 | |||||||||||||||||||||||||
| Net finance costs |
(1,415) | 30 | (1,385) | 4 | (1,381 | ) | (889) | (205) | (1,094 | ) | ||||||||||||||||||||||||
|
United States |
– | – | – | – | – | 624 | 23,195 | 23,819 | ||||||||||||||||||||||||||
| APME |
417 | (33 | ) | 384 | 32 | 416 | 384 | 29 | 413 | |||||||||||||||||||||||||
| ENA |
3 | – | 3 | – | 3 | 4 | (27) | (23 | ) | |||||||||||||||||||||||||
| Share of post-tax results of associates and joint ventures | 420 | (33 | ) | 387 | 32 | 419 | 1,012 | 23,197 | 24,209 | |||||||||||||||||||||||||
| Profit/(loss) before taxation |
9,929 | (580 | ) | 9,349 | (998) | 8,351 | 8,052 | 21,475 | 29,527 | |||||||||||||||||||||||||
| Taxation (charge)/credit on ordinary activities | (2,508) | 144 | (2,364) | 223 | (2,141 | ) | (2,091) | 10,220 | 8,129 | |||||||||||||||||||||||||
| Profit for the year |
6,210 | 37,656 | ||||||||||||||||||||||||||||||||
| * | The adjustments to profit from operations, net finance costs and the Group’s share of the post-tax results of associates and joint ventures are explained in notes 3(e) to 3(h), note 4(b), note 5(a), and note 6(b), 6(d) and 6(e), respectively. |
| BAT Annual Report and Form 20-F 2018 | 135 | |
|
Financial Statements
|
Notes on the Accounts continued
2 Segmental analyses (revised) continued
The following table shows 2017 profit from operations and adjusted profit from operations at current rates, and 2017 adjusted profit from operations translated using 2016 rates of exchange. The 2016 figures are stated at the 2016 rates of exchange.
|
2017
|
2016
|
|||||||||||||||||||||||||||||||||
|
Adjusted* £m |
Translation £m |
Adjusted* rates £m |
Adjusting* £m |
Segment £m |
Adjusted* £m |
Adjusting* £m |
Segment £m |
|||||||||||||||||||||||||||
| United States |
1,827 | 101 | 1,928 | (763) | 1,165 | – | – | – | ||||||||||||||||||||||||||
| APME |
1,962 | 87 | 2,049 | (147) | 1,902 | 1,972 | (198) | 1,774 | ||||||||||||||||||||||||||
| AMSSA |
1,799 | (17 | ) | 1,782 | (134) | 1,648 | 1,684 | (262) | 1,422 | |||||||||||||||||||||||||
| ENA |
2,017 | 153 | 2,170 | (473) | 1,697 | 1,824 | (345) | 1,479 | ||||||||||||||||||||||||||
| 7,605 | 324 | 7,929 | (1,517) | 6,412 | 5,480 | (805) | 4,675 | |||||||||||||||||||||||||||
| Fox River** |
– | – | (20) | (20 | ) | |||||||||||||||||||||||||||||
| Profit from operations |
7,605 | 324 | 7,929 | (1,517) | 6,412 | 5,480 | (825) | 4,655 | ||||||||||||||||||||||||||
| Net finance (costs)/income |
(833 | ) | (56 | ) | (889) | (205) | (1,094 | ) | (529) | (108) | (637 | ) | ||||||||||||||||||||||
| United States |
593 | 31 | 624 | 23,195 | 23,819 | 991 | 889 | 1,880 | ||||||||||||||||||||||||||
| APME |
354 | 30 | 384 | 29 | 413 | 333 | 11 | 344 | ||||||||||||||||||||||||||
| AMSSA |
– | – | – | – | – | – | – | – | ||||||||||||||||||||||||||
| ENA |
4 | – | 4 | (27) | (23 | ) | 3 | – | 3 | |||||||||||||||||||||||||
| Share of post-tax results of associates and joint ventures | 951 | 61 | 1,012 | 23,197 | 24,209 | 1,327 | 900 | 2,227 | ||||||||||||||||||||||||||
|
Profit/(loss) before taxation |
7,723 | 329 | 8,052 | 21,475 | 29,527 | 6,278 | (33) | 6,245 | ||||||||||||||||||||||||||
|
Taxation on ordinary activities |
(2,017) | (74 | ) | (2,091) | 10,220 | 8,129 | (1,473) | 67 | (1,406 | ) | ||||||||||||||||||||||||
|
Profit for the year
|
37,656 | 4,839 | ||||||||||||||||||||||||||||||||
| * | The adjustments to profit from operations, net finance (costs)/income and the Group’s share of the post-tax results of associates and joint ventures are explained in notes 3(e) to 3(h), note 4(b), note 5(a) and note 6(b), 6(d) and 6(e) respectively. |
| ** | The Fox River charge in 2016 (see note 3(g) and note 28) has not been allocated to any segment as it neither relates to current operations nor the tobacco business. It has been presented separately from the segmental reporting which is used to evaluate segment performance and to allocate resources, and is reported to the chief operating decision maker on this basis. |
| 136 | BAT Annual Report and Form 20-F 2018 | |
|
Strategic Report
|
Governance
|
Financial Statements
|
Other Information
|
2 Segmental analyses (revised) continued
Adjusted profit from operations at constant rates of £10,924 million (2017: £7,605 million; 2016: £5,197 million) excludes certain depreciation, amortisation and impairment charges as explained in notes 3(e),(3f) and (3h). These are excluded from segmental profit from operations at constant rates as follows:
|
2018
|
2017
|
|||||||||||||||||||||||||||||||||
|
Adjusted £m |
Translation exchange £m |
Adjusted £m |
Adjusting £m |
Depreciation, amortisation and impairment Current rates £m |
Adjusted depreciation, amortisation and impairment £m |
Adjusting £m |
Depreciation, amortisation and impairment £m |
|||||||||||||||||||||||||||
| United States |
158 | (4 | ) | 154 | 289 | 443 | 59 | 116 | 175 | |||||||||||||||||||||||||
| APME |
111 | (6 | ) | 105 | 22 | 127 | 111 | 24 | 135 | |||||||||||||||||||||||||
| AMSSA |
100 | 1 | 101 | 115 | 216 | 102 | 32 | 134 | ||||||||||||||||||||||||||
| ENA |
148 | (5 | ) | 143 | 109 | 252 | 162 | 296 | 458 | |||||||||||||||||||||||||
| 517 | (14 | ) | 503 | 535 | 1,038 | 434 | 468 | 902 | ||||||||||||||||||||||||||
|
|
2017
|
|
|
2016
|
| |||||||||||||||||||||||||||||
| Adjusted depreciation, amortisation and impairment Constant rates £m |
Translation exchange £m |
Adjusted depreciation, amortisation and impairment Current rates £m |
Adjusting £m |
Depreciation, amortisation and impairment Current rates £m |
Adjusted depreciation, amortisation and impairment £m |
Adjusting £m |
Depreciation, amortisation and impairment £m |
|||||||||||||||||||||||||||
| United States |
57 | 2 | 59 | 116 | 175 | – | – | – | ||||||||||||||||||||||||||
| APME |
109 | 2 | 111 | 24 | 135 | 114 | 52 | 166 | ||||||||||||||||||||||||||
| AMSSA |
99 | 3 | 102 | 32 | 134 | 121 | 48 | 169 | ||||||||||||||||||||||||||
| ENA |
153 | 9 | 162 | 296 | 458 | 160 | 112 | 272 | ||||||||||||||||||||||||||
| 418 | 16 | 434 | 468 | 902 | 395 | 212 | 607 | |||||||||||||||||||||||||||
External revenue and non-current assets other than financial instruments, deferred tax assets and retirement benefit assets are analysed between the UK and all foreign countries at current rates of exchange as follows:
|
United Kingdom
|
All foreign countries
|
Group
|
||||||||||||||||||||||||||||||||||||||
| Revenue is based on location of sale | 2018 £m |
2017 £m |
2016 £m |
2018 £m |
2017 £m |
2016 £m |
2018 £m |
2017 £m |
2016 £m |
|||||||||||||||||||||||||||||||
| External revenue |
184 | 203 | 266 | 24,308 | 19,361 | 13,864 | 24,492 | 19,564 | 14,130 | |||||||||||||||||||||||||||||||
|
United Kingdom
|
All foreign countries
|
Group
|
||||||||||||||||||||||||||
| 2018 £m |
2017 £m |
2018 £m |
2017 £m |
2018 £m |
2017 £m |
|||||||||||||||||||||||
| Intangible assets |
529 | 514 | 123,484 | 117,271 | 124,013 | 117,785 | ||||||||||||||||||||||
| Property, plant and equipment |
404 | 406 | 4,762 | 4,476 | 5,166 | 4,882 | ||||||||||||||||||||||
| Investments in associates and joint ventures | – | – | 1,737 | 1,577 | 1,737 | 1,577 | ||||||||||||||||||||||
The consolidated results of RAI companies operating in the United States met the criteria for separate disclosure under the requirements of IFRS 8 Operating Segments. Revenue arising from the operations of RAI in 2018 and in 2017 since the date of acquisition was £9,506 million and £4,160 million; respectively. Non-current assets attributable to the operations of RAI were £113,935 million (2017: £107,154 million).
The main acquisitions comprising the goodwill balance of £46,163 million (2017: £44,147 million), included in intangible assets, are provided in note 9. Included in investments in associates and joint ventures are amounts of £1,682 million (2017: £1,527 million) attributable to the investment in ITC Ltd. Further information is provided in notes 5 and 11.
| BAT Annual Report and Form 20-F 2018 | 137 | |
|
Financial Statements
|
Notes on the Accounts continued
3 Profit from operations
Enumerated below are movements in costs that have impacted profit from operations in 2018, 2017 and 2016. These include changes in our underlying business performance, as well as the impact of adjusting items, as defined in note 1, in profit from operations (note 3(d) to 3(h)).
(a) Employee benefit costs
| 2018 £m |
2017 £m |
2016 £m |
||||||||||||
| Wages and salaries | 2,463 | 2,131 | 1,882 | |||||||||||
| Social security costs | 207 | 216 | 207 | |||||||||||
| Other pension and retirement benefit costs (note 12) | 212 | 215 | 101 | |||||||||||
| Share-based payments – equity and cash-settled (note 25) | 123 | 117 | 84 | |||||||||||
| 3,005 | 2,679 | 2,274 | ||||||||||||
|
(b) Depreciation, amortisation and impairment costs
|
||||||||||||||
| 2018 £m |
2017 £m |
2016 £m |
||||||||||||
| Intangibles | – amortisation and impairment of trademarks and similar intangibles (note 3(f)) |
377 | 383 | 149 | ||||||||||
| – amortisation and impairment of other intangibles |
111 | 140 | 81 | |||||||||||
| Property, plant and equipment | – depreciation and impairment |
550 | 379 | 377 | ||||||||||
| 1,038 | 902 | 607 | ||||||||||||
|
Included within depreciation are gains and losses recognised on the sale of property, plant and equipment.
With effect from 1 January 2018, cigarette making machinery within property, plant and equipment is depreciated at 5% per annum
|
||||||||||||||
| (c) Other operating expenses include:
|
||||||||||||||
| 2018 £m |
2017 £m |
2016 £m |
||||||||||||
| Research and development expenses (excluding employee benefit costs and depreciation) | 105 | 80 | 53 | |||||||||||
| Exchange differences | (15 | ) | (6 | ) | (2 | ) | ||||||||
| Hedge ineffectiveness within operating profit | (8 | ) | – | – | ||||||||||
| Rent of plant and equipment (operating leases) | ||||||||||||||
| – minimum lease payments | 61 | 41 | 20 | |||||||||||
| Rent of property (operating leases) | ||||||||||||||
| – minimum lease payments | 110 | 85 | 51 | |||||||||||
| Auditor’s remuneration | ||||||||||||||
| Total expense for audit services pursuant to legislation: | ||||||||||||||
| – fees to KPMG LLP for Parent Company and Group audit | 6.3 | 6.3 | 2.0 | |||||||||||
| – fees to KPMG LLP firms and associates for local statutory and Group reporting audits | 8.8 | 11.3 | 7.2 | |||||||||||
| Total audit fees expense – KPMG LLP firms and associates | 15.1 | 17.6 | 9.2 | |||||||||||
| Audit fees expense to other firms | 0.2 | 0.2 | – | |||||||||||
| Total audit fees expense | 15.3 | 17.8 | 9.2 | |||||||||||
| Fees to KPMG LLP firms and associates for other services: | ||||||||||||||
| – audit-related assurance services | 9.4 | 8.0 | 0.2 | |||||||||||
| – other assurance services | 0.3 | 4.1 | 0.1 | |||||||||||
| – tax advisory services | – | – | 0.2 | |||||||||||
| – tax compliance | – | 0.2 | 0.3 | |||||||||||
| – audit of defined benefit schemes of the Company | 0.4 | – | – | |||||||||||
| – other non-audit services | – | – | 1.4 | |||||||||||
| 10.1 | 12.3 | 2.2 | ||||||||||||
The total auditor’s remuneration to KPMG firms and associates included above are £25.2 million (2017: £29.9 million; 2016: £11.4 million).
During 2018 the Group incurred expenditure of £8.7 million (2017: £nil million, 2016: £nil million) within audit-related assurance services associated with the controls attestation of the Group’s implementation of Sarbanes-Oxley Section 404 during 2018.
During 2017, the Group incurred additional expenditure with the Group’s auditor, as part of the acquisition of the remaining shares in RAI not previously owned. This was due to the Securities and Exchange Commission (SEC) listing requirements to re-audit 2015 and 2016 under Public Company Accounting Oversight Board (“PCAOB”) standards, to audit the purchase price allocation, to provide assurance services on the registration documents and to provide, amongst other things, assurance services with regards to the planned 2018 implementation of Sarbanes-Oxley Section 404.
| 138 | BAT Annual Report and Form 20-F 2018 | |
|
Strategic Report
|
Governance
|
Financial Statements
|
Other Information
|
3 Profit from operations continued
Accordingly, the following costs, related to the acquisition of RAI and treated as an adjusting item, were incurred within the respective categories: audit-related assurance service £7.7 million and within other assurance services £3.5 million.
Under SEC regulations, the remuneration to KPMG firms and associates of £25.2 million in 2018 (2017: £30.1 million; 2016: £11.4 million) is required to be presented as follows: audit fees £24.7 million (2017: £29.2 million; 2016: £9.2 million), audit-related fees £0.4 million (2017: £0.5 million; 2016: £0.2 million), tax fees £nil million (2017: £0.2 million; 2016: £0.5 million) and all other fees £0.1 million (2017: £0.2 million; 2016: £1.5 million).
Total research and development costs including employee benefit costs and depreciation are £258 million (2017: £191 million; 2016: £144 million).
(d) Master Settlement Agreement
In 1998, the major US cigarette manufacturers (including R.J. Reynolds Tobacco Company, Lorillard and Brown & Williamson, businesses which are now part of Reynolds American) entered into the Master Settlement Agreement (MSA) with attorneys general representing most US states and territories. The MSA imposes a perpetual stream of future payment obligations on the major US cigarette manufacturers. The amounts of money that the participating manufacturers are required to annually contribute are based upon, amongst other things, the volume of cigarettes sold and market share (based on cigarette shipments in that year).
During 2012, R.J. Reynolds Tobacco Company, Santa Fe Natural Tobacco Company (SFNTC), various other tobacco manufacturers, 17 states, the District of Columbia and Puerto Rico reached an agreement related to the Non-Participating Manufacturer (NPM) adjustment under the MSA and three more states joined the agreement in 2013. Under this agreement, R.J. Reynolds Tobacco Company will receive credits, currently estimated to be more than US$1 billion, in respect of its Non-Participating Manufacturer (NPM) Adjustment claims related to the period from 2003 to 2012. These credits have been and will be applied against the companies’ MSA payments over a period of five years from 2013, subject to, and dependent upon, meeting the various ongoing performance obligations. During 2014, two additional states agreed to settle NPM disputes related to claims for the period 2003 to 2012. It is estimated that R.J. Reynolds Tobacco Company will receive US$170 million in credits, which will be applied over a five-year period from 2014. During 2015, another state agreed to settle NPM disputes related to claims for the period 2004 to 2014. It is estimated that R.J. Reynolds Tobacco Company will receive US$285 million in credits, which will be applied over a four-year period from 2015. During 2016, no additional states agreed to settle NPM disputes. During 2017, two more states agreed to settle NPM disputes related to claims for the period 2004 to 2014. It is estimated that R.J. Reynolds Tobacco Company will receive US$61 million in credits, which will be applied over a five-year period from 2017. During 2018, nine more states agreed to settle NPM disputes related to claims for the period 2004 to 2019, with an option through 2022, subject to certain conditions. It is estimated that R.J. Reynolds Tobacco Company will receive US$182 million in credits for settled periods through 2017, which will be applied over a five-year period from 2018. Also in 2018, one additional state agreed to settle NPM disputes related to claims for the period 2004 to 2024, subject to certain conditions. It is estimated that R.J. Reynolds Tobacco Company will receive US$205 million in credits for settled periods through 2017, which will be applied over a five-year period from 2019. Credits in respect of future years’ payments and the NPM Adjustment claims would be accounted for in the applicable year and will not be treated as adjusting items. Only credits in respect of prior year payments are included as adjusting items.
The BAT Group is subject to substantial payment obligations under the MSA and the state settlement agreements with the states of Mississippi, Florida, Texas and Minnesota (such settlement agreements, collectively State Settlement Agreements). RAl’s operating subsidiaries’ expenses and payments under the MSA and the State Settlement Agreements for 2017 amounted to US$2,856 million in respect of settlement expenses and US$4,612 million in respect of settlement cash payments. RAl’s operating subsidiaries’ expenses and payments under the MSA and the State Settlement Agreements for 2018 amounted to US$2,741 million in respect of settlement expenses and US$917 million in respect of settlement cash payments.
(e) Restructuring and integration costs
Restructuring costs reflect the costs incurred as a result of initiatives to improve the effectiveness and the efficiency of the Group as a globally integrated enterprise, including the relevant operating costs of implementing the new operating model. These costs represent additional expenses incurred, which are not related to the normal business and day-to-day activities.
The new operating model is underpinned by a global single instance of SAP with full deployment occurring during 2016 with benefits already realised within the business and future savings expected in the years to come. The initiatives also include a review of the Group’s trade marketing and manufacturing operations, supply chain, overheads and indirect costs, organisational structure and systems and software used.
The costs of the Group’s initiatives together with the costs of integrating acquired businesses into existing operations, including acquisition costs, are included in profit from operations under the following headings:
|
2018
|
2017
|
2016
|
||||||||||
| Employee benefit costs | 176 | 193 | 240 | |||||||||
| Depreciation, amortisation and impairment costs | 48 | 85 | 64 | |||||||||
| Other operating expenses | 145 | 330 | 325 | |||||||||
| Other operating income | (6 | ) | (8 | ) | (26 | ) | ||||||
| 363 | 600 | 603 | ||||||||||
Restructuring and integration costs in 2018 include integration costs associated with the acquisition of RAI and ongoing costs of implementing the revisions to the Group’s operating model. This includes the cost of packages in respect of permanent headcount reductions and permanent employee benefit reductions in the Group. The costs also cover downsizing activities in Russia, Germany and APME, partially offset by the income from sale of certain assets that have become available as part of the downsizing activities.
| BAT Annual Report and Form 20-F 2018 | 139 | |
|
Financial Statements
|
Notes on the Accounts continued
3 Profit from operations continued
Restructuring and integration costs in 2017 include advisor fees and costs incurred related to the acquisition of the remaining shares in RAI not already owned by the Group, that completed on 25 July 2017 (note 24). It also includes the implementation of a new operating model and the cost of redundancy packages in respect of permanent headcount reductions and permanent employee benefit reductions in the Group. The costs also cover integration costs incurred as a result of the RAI acquisition, factory closure and downsizing activities in Germany and Malaysia, certain exit costs and asset write-offs related to the withdrawal from the Philippines.
Restructuring and integration costs in 2016 principally related to the restructuring initiatives directly related to implementation of a new operating model and the cost of initiatives in respect of permanent headcount reductions and permanent employee benefit reductions in the Group. The costs also covered factory closures and downsizing activities in Germany, Malaysia and Brazil, certain exit costs and asset write-offs related to the change in approach to the commercialisation of Voke, uncertainties surrounding regulatory changes and restructurings in Japan and Australia.
In 2018, other operating income includes gains from the sale of land and buildings in The Netherlands and in 2017, this included gains from the sale of land and buildings in Brazil. In 2016, this included gains from the sale of land and buildings in Malaysia.
(f) Amortisation and impairment of trademarks and similar intangibles
Acquisitions including RAI, TDR d.o.o. (TDR) and Skandinavisk Tobakskompagni (ST) in previous years, have resulted in the capitalisation of trademarks and similar intangibles which are amortised over their expected useful lives, which do not exceed 20 years. The amortisation and impairment charge of £377 million (2017: £383 million; 2016: £149 million) is included in depreciation, amortisation and impairment costs in profit from operations.
(g) Fox River
As explained in note 28, a Group subsidiary has certain liabilities in respect of indemnities given on the purchase and disposal of former businesses in the United States and in 2011, the subsidiary provided £274 million in respect of claims in relation to environmental clean-up costs of the Fox River.
On 30 September 2014, a Group subsidiary, NCR, Appvion and Windward Prospects entered into a Funding Agreement with regard to the costs for the clean-up of Fox River.
In January 2017, NCR and Appvion entered into a consent decree with the US Government to resolve how the remaining clean-up will be funded and to resolve further outstanding claims between them. The Consent Decree was approved by a US District Judge in August 2017 but is currently subject to appeal in the US Seventh Circuit Court of Appeals, refer to note 28 for further details.
In July 2016, the High Court ruled in a Group subsidiary’s favour that a dividend of €135 million paid by Windward to Sequana in May 2009 was a transaction made with the intention of putting assets beyond the reach of the Group subsidiary and of negatively impacting its interests. On 10 February 2017, further to a hearing in January 2017 to determine the relief due, the Court found in the Group subsidiary’s favour, ordering that Sequana must pay an amount up to the full value of the dividend plus interest which equates to around US$185 million, related to past and future clean-up costs. The Court granted all parties leave to appeal and Sequana a stay in respect of the above payments. In June 2018, the Court of Appeal heard arguments in the Sequana Claims Appeal (as defined in note 28). On 6 February 2019, the Court of Appeal gave judgment upholding the High Court’s findings, with one immaterial change to the method of calculating the damages awarded. Sequana therefore remains liable to pay the above mentioned dividend. Due to the uncertain outcome of the case no asset has been recognised in relation to this ruling. In February 2017, Sequana entered into a process in France seeking court protection (the “Sauvegarde”), exiting the Sauvegarde in June 2017. No payments have been received.
The provision is £108 million at 31 December 2018 (2017: £138 million). Based on this Funding Agreement, £30 million has been paid in 2018, which includes legal costs of £5 million (2017: £25 million, including legal costs of £7 million; 2016: £17 million, including legal costs of £11 million). In addition, in 2016 the devaluation of sterling against the US dollar led to a charge of £20 million.
(h) Other adjusting items
In 2018, the Group incurred £294 million of other adjusting items, including £178 million related to Engle progeny litigation offset by credits related to the Non-Participating Manufacturers settlement, which have been adjusted within ‘other operating expenses’.
In 2018, the European Securities and Markets Authority (ESMA) recognised the specific issues related to Venezuela and proposed that companies with exposure to Venezuela use an “estimated” exchange rate rather than the official exchange rate, as otherwise required under IAS 21. Accordingly, the Group has used an exchange rate calculated with reference to the estimated inflation since the latest dividend payment in 2010. In addition, the net assets of the Group’s Venezuelan operations are subject to accounting adjustments IAS 29 Financial Reporting in Hyperinflationary Economies, as they are revalued, for accounting purposes, from their acquisition date to the balance sheet date. However, management believes that such a revaluation is not reflective of the recoverable value of those assets and have incurred an impairment charge of £110 million. This charge has been treated as an adjusting item as it does not reflect the underlying performance of the Group. The Group has also recognised a gain of £45 million within net finance costs (note 4), being the partial counter-party to the above non-monetary asset movement, generating a monetary gain due to hyperinflation accounting under IAS 29.
In 2017, the release of the fair value acquisition accounting adjustments to finished goods inventories of £465 million on the RAI acquisition has been adjusted within ‘Changes in inventories of finished goods and work in progress’. Also included in 2017 is the impairment of certain assets of £69 million related to a third-party distributor (Agrokor) in Croatia, that has been adjusted within ‘other operating expenses’.
In 2016, the Board of Audit and Inspection of Korea (“BAI”) concluded its tax assessment in relation to the 2014 year-end tobacco inventory, and imposed additional sales tax (excise and VAT) and penalties. This resulted in the recognition of a £53 million charge by a Group subsidiary. Management deems the tax and penalties to be unfounded and has appealed to the tax tribunal against the assessment. Based on the legal opinion from a local law firm, management believes that this appeal will be successful, and that the findings of the BAI will be reversed. On grounds of materiality and the high likelihood of the tax and penalties being reversed in future, the Group has classified the tax and penalties charge as an adjusting item in 2016.
| 140 | BAT Annual Report and Form 20-F 2018 | |
|
Strategic Report
|
Governance
|
Financial Statements
|
Other Information
|
4 Net finance costs
(a) Net finance costs/(income)
|
2018
|
2017
|
2016
|
||||||||||
| Interest expense | 1,593 | 1,081 | 645 | |||||||||
|
Facility fees |
13 | 13 | 5 | |||||||||
|
Interest related to adjusting tax payables (note 4(b)) |
41 | 43 | 25 | |||||||||
|
Loss on bond redemption (note 4(b)) |
– | – | 101 | |||||||||
|
Acquisition of RAI (note 4(b)) |
– | 153 | – | |||||||||
|
Fair value changes on derivative financial instruments and hedged items |
(154 | ) | (149 | ) | (458 | ) | ||||||
|
Hedge ineffectiveness (note 4(b)) |
– | 9 | – | |||||||||
|
Venezuela hyperinflation (note 4 (b)) |
(45 | ) | – | – | ||||||||
|
Exchange differences on financial liabilities |
36 | 47 | 363 | |||||||||
|
Finance costs |
1,484 | 1,197 | 681 | |||||||||
|
Interest under the effective interest method |
(68 | ) | (83 | ) | (68 | ) | ||||||
| Dividend income
|
– | (1 | ) | – | ||||||||
| Hedge ineffectiveness (note 4(b))
|
– | – | (18 | ) | ||||||||
| Exchange differences on financial assets
|
(35 | ) | (19 | ) | 42 | |||||||
| Finance income
|
(103 | ) | (103 | ) | (44 | ) | ||||||
| Net finance costs | 1,381 | 1,094 | 637 | |||||||||
The Group manages foreign exchange gains and losses and fair value changes on a net basis excluding adjusting items, which are explained in note 4(b); and the derivatives that generate the fair value changes are in note 16.
Facility fees principally relate to the Group’s central banking facilities.
(b) Adjusting items included in net finance costs
Adjusting items are significant items in net finance costs which individually or, if of a similar type, in aggregate, are relevant to an understanding of the Group’s underlying financial performance.
In 2018, the Group incurred interest on adjusting tax payables of £41 million (2017: £43 million; 2016: £25 million). This included interest of £25 million (2017: £25 million; 2016: £25 million) in relation to the Franked Investment Income Group Litigation Order (FII GLO) (note 6(b)) and interest of £12 million in relation to retrospective guidance by a tax authority on overseas withholding tax.
Also in 2018, the Group recognised a monetary gain of £45 million related to the application of hyperinflationary accounting in Venezuela (note 3(h)).
In 2017, the Group incurred pre-financing costs related to the acquisition of RAI of £153 million.
Also in 2017, the Group realised a £9 million charge in relation to the reversal of a gain recognised in 2016, related to hedge ineffectiveness on external swaps following the referendum regarding “Brexit”. The gain in 2016 of £18 million was deemed to be adjusting as it is not representative of the underlying performance of the business and so the partial reversal has also been deemed as an adjusting item.
In 2016, the Group redeemed a US$700 million bond, prior to its original maturity date of 15 November 2018. This led to a loss of US$130 million (£101 million), which has been treated as an adjusting item.
| BAT Annual Report and Form 20-F 2018 | 141 | |
|
Financial Statements
|
Notes on the Accounts continued
5 Associates and joint ventures
|
2018 |
2017 |
2016 | ||||||||||||||||||||||||||
| Total £m
|
Group’s share £m
|
Total £m
|
Group’s share £m
|
Total £m
|
Group’s share £m
|
|||||||||||||||||||||||
| Revenue | 7,235 | 2,058 | 14,085 | 4,794 | 16,491 | 5,997 | ||||||||||||||||||||||
| Profit from operations* | 2,128 | 630 | 4,342 | 24,854 | 9,379 | 3,740 | ||||||||||||||||||||||
| Net finance costs | (8 | ) | (3 | ) | (279 | ) | (116 | ) | (477 | ) | (200 | ) | ||||||||||||||||
| Profit on ordinary activities before taxation | 2,120 | 627 | 4,063 | 24,738 | 8,902 | 3,540 | ||||||||||||||||||||||
| Taxation on ordinary activities | (678 | ) | (201 | ) | (1,441 | ) | (522 | ) | (3,280 | ) | (1,308 | ) | ||||||||||||||||
| Profit on ordinary activities after taxation | 1,442 | 426 | 2,622 | 24,216 | 5,622 | 2,232 | ||||||||||||||||||||||
| Non-controlling interests | (24 | ) | (7 | ) | (22 | ) | (7 | ) | (17 | ) | (5 | ) | ||||||||||||||||
| Post-tax results of associates and joint ventures | 1,418 | 419 | 2,600 | 24,209 | 5,605 | 2,227 | ||||||||||||||||||||||
| Comprised of: | ||||||||||||||||||||||||||||
| – adjusted share of post-tax results of associates and joint ventures |
1,308 | 387 | 2,785 | 1,012 | 3,461 | 1,327 | ||||||||||||||||||||||
| – issue of shares and change in shareholding |
75 | 22 | 98 | 29 | 36 | 11 | ||||||||||||||||||||||
| – gain on deemed divestment of RAI |
– | – | – | 23,288 | – | – | ||||||||||||||||||||||
| – gain on disposal of assets |
– | – | – | – | 2,231 | 941 | ||||||||||||||||||||||
|
– other |
35 | 10 | (283 | ) | (120 | ) | (123 | ) | (52 | ) | ||||||||||||||||||
| 1,418 | 419 | 2,600 | 24,209 | 5,605 | 2,227 | |||||||||||||||||||||||
| * | The gain on deemed divestment of RAI is recognised in the Group’s share of associates profit from operations. |
Enumerated below are movements that have impacted the post-tax results of associates and joint ventures in 2018, 2017 and 2016.
(a) Adjusting items
In 2018, the Group’s interest in ITC Ltd. (ITC) decreased from 29.71% to 29.57% (2017: 29.89% to 29.71%; 2016: 30.06% to 29.89%) as a result of ITC issuing ordinary shares under the ITC Employee Share Option Scheme. The issue of these shares and change in the Group’s share of ITC resulted in a gain of £22 million (2017: £29 million; 2016: £11 million), which is treated as a deemed partial disposal and included in the income statement. ITC has also recognised an adjusting gain in respect of the release of certain provisions related to a tax claim, the Group’s share of which was £10 million.
On 25 July 2017, the Group announced the completion of the acquisition of the 57.8% of RAI the Group did not already own. As at this date RAI ceased to be reported as an associate and has become a fully owned subsidiary. Accordingly, as at that date, the Group was deemed to divest its investment in RAI as an associate and consolidated RAI in accordance with IFRS 10 Consolidated Financial Statements. This resulted in a gain of £23,288 million that has been reported in the Group’s share of post-tax results of associates and joint ventures.
In 2017, due to a deterioration in the financial performance of Tisak d.d. (Tisak), linked to the financial difficulties associated with a third-party distributor (Agrokor) in Croatia, the Group impaired the carrying value of this investment. This resulted in a charge of £27 million to the income statement that has been reported as an “other” adjusting item.
In 2016, RAI recognised a gain in relation to the sale of the international rights to Natural American Spirit to the Japan Tobacco Group of companies (JT) of US$4,861 million. The Group’s share of this net gain amounted to £941 million (net of tax).
In 2017, RAI recognised, prior to acquisition by the Group, the following amounts in ‘other’: transaction costs associated with the acquisition by the Group of US$125 million, the Group’s share of which is £33 million (net of tax) (2016: £nil million), deferred tax charges in respect of temporary differences on trademarks of US$51 million, the Group’s share of which is £18 million (2016: £nil million), restructuring charges of US$79 million, the Group’s share of which is £14 million (net of tax) (2016: US$36 million, the Group’s share of which is £7 million) and costs in respect of a number of Engle progeny lawsuits and other tobacco litigation charges that amounted to US$162 million, the Group’s share of which is £32 million (net of tax) (2016: US$86 million, the Group’s share of which is £17 million (net of tax)). Additionally, there is income of US$17 million (2016: US$6 million) related to the Non-Participating Manufacturer (NPM) Adjustment claims of the states no longer challenging the findings of non-diligence entered against them by an Arbitration Panel, the Group’s share of which is £4 million (net of tax) (2016: £2 million). The remaining costs in 2016 includes income relating to the early termination of the Manufacturing Agreement between BATUS Japan Inc. and RJRT (note 27) of US$90 million, the Group’s share of which is £18 million (net of tax) and transaction costs of US$5 million and financing costs of US$243 million, connected with the acquisition of Lorillard, the Group’s share is £1 million (net of tax) and £47 million of financing costs.
(b) Master Settlement Agreement
For information on the Master Settlement Agreement applicable to RAI as an associate for the period up to and including 24 July 2017 (note 3(d)).
| 142 | BAT Annual Report and Form 20-F 2018 | |
|
Strategic Report
|
Governance
|
Financial Statements
|
Other Information
|
5 Associates and joint ventures continued
(c) Other financial information
The Group’s share of the results of associates and joint ventures is shown in the table below.
| 2018 | 2017 |
2016 |
||||||||||||||
| Group’s | Group’s | Group’s | ||||||||||||||
| share | share | share | ||||||||||||||
| £m | £m | £m | ||||||||||||||
| Profit on ordinary activities after taxation | ||||||||||||||||
| – attributable to owners of the Parent | 419 | 24,209 | 2,227 | |||||||||||||
| Other comprehensive income: | ||||||||||||||||
| Items that may be reclassified to profit & loss | (38 | ) | (918 | ) | 1,415 | |||||||||||
| Items that will not be reclassified to profit & loss | 6 | 25 | 20 | |||||||||||||
| Total comprehensive income | 387 | 23,316 | 3,662 | |||||||||||||
|
Summarised financial information of the Group’s associates and joint ventures is shown below.
|
| |||||||||||||||
|
2018 |
||||||||||||||||
| ITC | Others | Total | ||||||||||||||
| £m | £m | £m | ||||||||||||||
| Revenue | 5,072 | 2,163 | 7,235 | |||||||||||||
| Profit on ordinary activities before taxation | 2,059 | 61 | 2,120 | |||||||||||||
| Post-tax results of associates and joint ventures | 1,373 | 45 | 1,418 | |||||||||||||
| Other comprehensive income | (110 | ) | – | (110 | ) | |||||||||||
| Total comprehensive income | 1,263 | 45 | 1,308 | |||||||||||||
|
2017 |
||||||||||||||||
| RAI* | ITC | Others | Total | |||||||||||||
| £m | £m | £m | £m | |||||||||||||
| Revenue | 5,525 | 6,607 | 1,953 | 14,085 | ||||||||||||
| Profit on ordinary activities before taxation | 2,017 | 2,054 | (8 | ) | 4,063 | |||||||||||
| Post-tax results of associates and joint ventures | 1,261 | 1,362 | (23 | ) | 2,600 | |||||||||||
| Other comprehensive income | (595 | ) | (135 | ) | (8 | ) | (738 | ) | ||||||||
| Total comprehensive income | 666 | 1,227 | (31 | ) | 1,862 | |||||||||||
| * The information presented above for RAI is for the period from 1 January 2017 up to and including 24 July 2017 (see note 24).
|
| |||||||||||||||
|
2016 |
||||||||||||||||
| RAI | ITC | Others | Total | |||||||||||||
| £m | £m | £m | £m | |||||||||||||
| Revenue | 9,224 | 5,350 | 1,917 | 16,491 | ||||||||||||
| Profit on ordinary activities before taxation | 7,111 | 1,743 | 48 | 8,902 | ||||||||||||
| Post-tax results of associates and joint ventures | 4,457 | 1,114 | 34 | 5,605 | ||||||||||||
| Other comprehensive income | 3,125 | 712 | (178 | ) | 3,659 | |||||||||||
| Total comprehensive income | 7,582 | 1,826 | (144 | ) | 9,264 | |||||||||||
| BAT Annual Report and Form 20-F 2018 | 143 | |
|
Financial Statements
|
Notes on the Accounts continued
6 Taxation on ordinary activities
(a) Summary of taxation on ordinary activities
|
2018 £m |
2017 £m Revised |
2016 £m |
||||||||||
| UK corporation tax | 60 | 26 | 7 | |||||||||
| Comprising: | ||||||||||||
| – current year tax expense | 66 | 26 | 7 | |||||||||
| – adjustments in respect of prior periods | (6 | ) | – | – | ||||||||
| Overseas tax | 2,455 | 1,617 | 1,395 | |||||||||
| Comprising: | ||||||||||||
| – current year tax expense | 2,460 | 1,615 | 1,382 | |||||||||
| – adjustments in respect of prior periods | (5 | ) | 2 | 13 | ||||||||
| Total current tax | 2,515 | 1,643 | 1,402 | |||||||||
|
Deferred tax |
(374 | ) | (9,772 | ) | 4 | |||||||
| Comprising: | ||||||||||||
| – deferred tax relating to origination and reversal of temporary differences | (304 | ) | (152 | ) | 4 | |||||||
| – deferred tax relating to changes in tax rates | (70 | ) | (9,620 | ) | – | |||||||
| 2,141 | (8,129 | ) | 1,406 | |||||||||
With effect from 1 January 2018, the Group has adopted IFRS 15 Revenue from Contracts with Customers. The Group has revised 2017, as explained in notes 1 and 31.
(b) Franked Investment Income Group Litigation Order
The Group is the principal test claimant in an action in the United Kingdom against HM Revenue and Customs (HMRC) in the Franked Investment Income Group Litigation Order (FII GLO). There are 25 corporate groups in the FII GLO. The case concerns the treatment for UK corporate tax purposes of profits earned overseas and distributed to the UK.
The original claim was filed in 2003. The trial of the claim was split broadly into issues of liability and quantification. The main liability issues were heard by the High Court, Court of Appeal and Supreme Court in the UK and the European Court of Justice in the period to November 2012. The detailed technical issues of the quantification mechanics of the claim were heard by the High Court during May and June 2014 and the judgment handed down on 18 December 2014. The High Court determined that in respect of issues concerning the calculation of unlawfully charged corporation tax and advance corporation tax, the law of restitution including the defence on change of position and questions concerning the calculation of overpaid interest, the approach of the Group was broadly preferred. The conclusion reached by the High Court would, if upheld, produce an estimated receivable of £1.2 billion for the Group. Appeals on a majority of the issues were made to the Court of Appeal, which heard the arguments in June 2016. The Court of Appeal determined in November 2016 on the majority of issues that the conclusion reached by the High Court should be upheld. HMRC have sought permission to appeal to the Supreme Court on all issues. A decision on whether permission will be granted is anticipated in early 2019. If permission is granted the Supreme Court will not be expected to hand down its judgment until 2020. In July 2018, the Supreme Court handed down its judgment in the Prudential Assurance Company Ltd case, which is closely related to the FII GLO. Applying the Prudential judgment reduces the value of the FII claim to approximately £0.6 billion, mainly as the result of the application of simple interest.
During 2015, HMRC paid to the Group a gross amount of £1,224 million in two separate payments. The payments made by HMRC have been made without any admission of liability and are subject to refund were HMRC to succeed on appeal. The second payment in November 2015 followed the introduction of a new 45% tax on the interest component of restitution claims against HMRC. HMRC held back £261 million from the second payment contending that it represents the new 45% tax on that payment, leading to total cash received by the Group of £963 million. Actions challenging the legality of the withholding of the 45% tax have been lodged by the Group. The First Tier Tribunal found in favour of HMRC in July 2017 and the Group’s appeal to the Upper Tribunal was heard in July 2018 and judgment has not yet been handed down.
Due to the uncertainty of the amounts and eventual outcome the Group has not recognised any impact in the Income Statement in the current or prior period. The receipt, net of the deduction by HMRC, is held as deferred income as disclosed in note 22. Any future recognition as income will be treated as an adjusting item, due to the size of the amount, with interest of £25 million for the 12 months to 31 December 2018 (2017: £25 million; 2016: £25 million) accruing on the balance, which was also treated as an adjusting item.
| 144 | BAT Annual Report and Form 20-F 2018 | |
|
Strategic Report
|
Governance
|
Financial Statements
|
Other Information
|
6 Taxation on ordinary activities continued
(c) Factors affecting the taxation charge
The taxation charge differs from the standard 19% (2017: 19%; 2016: 20%) rate of corporation tax in the UK. The major causes of this difference are listed below:
|
2018 |
|
2017 |
|
2016 |
||||||||||||||||||||||||
| £m | % | £m | % | £m | % | |||||||||||||||||||||||
| Profit before tax | 8,351 | 29,527 | 6,245 | |||||||||||||||||||||||||
| Less: share of post-tax results of associates and joint ventures | ||||||||||||||||||||||||||||
| (see note 5) | (419 | ) | (24,209 | ) | (2,227 | ) | ||||||||||||||||||||||
| 7,932 | 5,318 | 4,018 | ||||||||||||||||||||||||||
|
Tax at 19% (2017: 19%; 2016: 20%) on the above |
1,507 | 19.0 | 1,010 | 19.0 | 804 | 20.0 | ||||||||||||||||||||||
| Factors affecting the tax rate: | ||||||||||||||||||||||||||||
| Tax at standard rates other than UK corporation tax rate | 384 | 4.8 | 389 | 7.3 | 93 | 2.3 | ||||||||||||||||||||||
| Other national tax charges | 204 | 2.6 | 119 | 2.2 | 74 | 1.9 | ||||||||||||||||||||||
| Permanent differences | 7 | 0.1 | 40 | 0.8 | 143 | 3.6 | ||||||||||||||||||||||
| Overseas tax on distributions | – | – | 25 | 0.5 | 41 | 1.0 | ||||||||||||||||||||||
| Overseas withholding taxes | 155 | 1.9 | 191 | 3.6 | 200 | 5.0 | ||||||||||||||||||||||
| Double taxation relief on UK profits | (35 | ) | (0.4 | ) | (29 | ) | (0.5 | ) | (8 | ) | (0.2 | ) | ||||||||||||||||
| (Utilised)/unutilised tax losses | 5 | 0.1 | (38 | ) | (0.7 | ) | 32 | 0.8 | ||||||||||||||||||||
| Adjustments in respect of prior periods | (11 | ) | (0.1 | ) | 2 | 0.0 | 13 | 0.3 | ||||||||||||||||||||
| Deferred tax relating to changes in tax rates | (70 | ) | (0.9 | ) | (9,620 | ) | (180.9 | ) | – | – | ||||||||||||||||||
| Deemed US repatriation tax | – | – | 34 | 0.6 | – | – | ||||||||||||||||||||||
| Release of deferred tax on unremitted earnings of associates | – | – | (180 | ) | (3.4 | ) | – | – | ||||||||||||||||||||
| Additional net deferred tax (credits)/charges | (5 | ) | (0.1 | ) | (72 | ) | (1.4 | ) | 14 | 0.3 | ||||||||||||||||||
| 2,141 | 27.0 | (8,129 | ) | (152.9 | ) | 1,406 | 35.0 | |||||||||||||||||||||
With effect from 1 January 2018, the Group has adopted IFRS 15 Revenue from Contracts with Customers. The Group has revised 2017, as explained in notes 1 and 31.
In 2016, permanent differences include non-tax deductible expenses for a number of items including expenditure relating to restructuring and integration costs such as factory rationalisation and the implementation of a new operating model and also included the net charge in respect of Fox River, South Korea sales tax assessment and uncertain items connected with the Group’s trading business.
(d) Adjusting items included in taxation
In 2018, adjusting items in taxation relate to a £79 million credit due to changes in US state tax rates in the period, relating to the revaluation of deferred tax liabilities arising on trademarks recognised in the RAI acquisition in 2017, and a £55 million charge related to retrospective guidance issued by a tax authority in the ENA region regarding the application of withholding tax (WHT) between 2015 and 2017.
On 22 December 2017, the United States Government enacted comprehensive tax legislation which, among other things, changed the Federal tax rate to 21% from 1 January 2018. This revised rate has been used to revalue net deferred tax liabilities in the United States, leading to a credit to the income statement of £9,620 million. The net deferred tax liabilities largely relate to the difference in tax value versus the fair market value of trademarks accounted for under IFRS as part of the RAI acquisition. The legislation also imposed a one-time deemed repatriation tax on accumulated foreign earnings. The impact of the repatriation tax, less foreign tax credits, was £34 million. IFRS also requires entities to provide deferred taxation on the undistributed earnings of associates and joint ventures. From the date of the acquisition of the remaining shares in RAI not already owned by the Group, the Group has consolidated the results of RAI as a wholly owned subsidiary and as such the deferred tax liability of £180 million on unremitted earnings of RAI as an associate was released to the income statement in 2017.
In 2016, the Group’s share of the gain on the divestiture of intangibles and other assets by RAI to Japan Tobacco International was £941 million. Given that the profit on this item was recognised as an adjusting item by the Group, the additional deferred tax charge of £61 million on the potential distribution of these undistributed earnings was also treated as adjusting.
| BAT Annual Report and Form 20-F 2018 | 145 | |
|
Financial Statements
|
Notes on the Accounts continued
6 Taxation on ordinary activities continued
(e) Tax on adjusting items
In addition, the tax on adjusting items, separated between the different categories, as per note 7, amounted to £199 million (2017: £454 million; 2016: £128 million). The adjustment to the adjusted earnings per share (note 7) also includes £6 million (2017: £4 million; 2016: £1 million) in respect of the non-controlling interests’ share of the adjusting items net of tax.
(f) Tax on items recognised directly in other comprehensive income
|
2018 |
2017 | 2016 | ||||||||||
| £m | £m | £m | ||||||||||
| Current tax | (8 | ) | (4 | ) | (53 | ) | ||||||
| Deferred tax | (7 | ) | (133 | ) | 70 | |||||||
| (Charged)/credited to other comprehensive income | (15 | ) | (137 | ) | 17 | |||||||
The tax relating to each component of other comprehensive income is disclosed in note 19.
7 Earnings per share
|
2018 |
2017 |
2016 | ||||||||||||||||||||||||||||||||||||||
|
Earnings £m |
Weighted average number of shares m |
Earnings per share pence |
Earnings £m Revised |
Weighted average number of shares m |
Earnings per share Revised |
Earnings £m |
Weighted average number of shares m |
Earnings per share pence |
||||||||||||||||||||||||||||||||
| Basic earnings per share | ||||||||||||||||||||||||||||||||||||||||
| (ordinary shares of 25p each) | 6,032 | 2,285 | 264.0 | 37,485 | 2,044 | 1,833.9 | 4,648 | 1,858 | 250.2 | |||||||||||||||||||||||||||||||
| Share options | – | 7 | (0.8 | ) | – | 7 | (6.3 | ) | – | 7 | (1.0 | ) | ||||||||||||||||||||||||||||
| Diluted earnings per share | 6,032 | 2,292 | 263.2 | 37,485 | 2,051 | 1,827.6 | 4,648 | 1,865 | 249.2 | |||||||||||||||||||||||||||||||
With effect from 1 January 2018, the Group has adopted IFRS 15 Revenue from Contracts with Customers. The Group has revised 2017, as explained in notes 1 and 31.
| 146 | BAT Annual Report and Form 20-F 2018 | |
|
Strategic Report
|
Governance
|
Financial Statements
|
Other Information
|
7 Earnings per share continued
Adjusted earnings per share calculation
Earnings have been affected by a number of adjusting items, which are described in notes 3 to 6. Adjusting items are significant items in the profit from operations, net finance costs, taxation and the Group’s share of the post-tax results of associates and joint ventures which individually or, if of a similar type, in aggregate, are relevant to an understanding of the Group’s underlying financial performance. The Group believes that these items are useful to users of the Group financial statements in helping them to understand the underlying business performance. To illustrate the impact of these items, an adjusted earnings per share calculation is shown below.
| Basic
|
||||||||||||||||||||||||||||||||
| 2018
|
|
2017
|
|
2016
|
||||||||||||||||||||||||||||
| Notes |
Earnings £m |
Earnings per share pence |
Earnings £m Revised |
Earnings per share pence Revised |
Earnings £m |
Earnings per share pence |
||||||||||||||||||||||||||
| Basic earnings per share | 6,032 | 264.0 | 37,485 | 1,833.9 | 4,648 | 250.2 | ||||||||||||||||||||||||||
| Effect of restructuring and integration costs | 3(e) | 363 | 15.9 | 600 | 29.4 | 603 | 32.4 | |||||||||||||||||||||||||
| Tax and non-controlling interests on restructuring and integration costs | (83 | ) | (3.6 | ) | (133 | ) | (6.5 | ) | (90 | ) | (4.9 | ) | ||||||||||||||||||||
| Effect of amortisation and impairment of trademarks and similar intangibles | 3(f) | 377 | 16.5 | 383 | 18.7 | 149 | 8.0 | |||||||||||||||||||||||||
| Tax on amortisation and impairment of trademarks and similar intangibles | (78 | ) | (3.4 | ) | (90 | ) | (4.4 | ) | (32 | ) | (1.7 | ) | ||||||||||||||||||||
| Effect of associates’ adjusting items net of tax | 5(a) | (32 | ) | (1.4 | ) | (23,197 | ) | (1,134.9 | ) | (900 | ) | (48.4 | ) | |||||||||||||||||||
| Effect of hyperinflation on Venezuela’s retained earnings | 3(h),4(b) | 65 | 2.8 | – | – | – | – | |||||||||||||||||||||||||
| Other adjusting items | 3(h) | 184 | 8.0 | 534 | 26.1 | 53 | 2.9 | |||||||||||||||||||||||||
| Tax effect on other adjusting items | (44 | ) | (1.9 | ) | (184 | ) | (8.9 | ) | (5 | ) | (0.3 | ) | ||||||||||||||||||||
| Deferred tax relating to changes in tax rates | 13 | (79 | ) | (3.5 | ) | (9,586 | ) | (469.0 | ) | – | – | |||||||||||||||||||||
| Release of deferred tax on unremitted earnings from associates | 6(d) | – | – | (180 | ) | (8.8 | ) | – | – | |||||||||||||||||||||||
| Effect of Fox River | 3(g) | – | – | – | – | 20 | 1.1 | |||||||||||||||||||||||||
| Effect of additional deferred tax charge from gain on divestiture of assets by associate (RAI) | 6(d) | – | – | – | – | 61 | 3.3 | |||||||||||||||||||||||||
| Effect of interest on FII GLO settlement and other | 4(b) | 41 | 1.8 | 43 | 2.1 | 25 | 1.3 | |||||||||||||||||||||||||
| Effect of retrospective guidance on WHT | 6(d) | 55 | 2.4 | – | – | – | – | |||||||||||||||||||||||||
| Effect of adjusting finance costs in relation to acquisition of RAI | 4(b) | – | – | 153 | 7.5 | – | – | |||||||||||||||||||||||||
| Tax Effect of adjusting finance costs in relation to acquisition of RAI | – | – | (49 | ) | (2.4 | ) | – | – | ||||||||||||||||||||||||
| Effect of hedge ineffectiveness | 4(b) | – | – | 9 | 0.4 | (18 | ) | (1.0 | ) | |||||||||||||||||||||||
| Tax effect on hedge ineffectiveness | – | – | (2 | ) | (0.1 | ) | – | – | ||||||||||||||||||||||||
| Effect of US bond buy back | 4(b) | – | – | – | – | 101 | 5.5 | |||||||||||||||||||||||||
| Adjusted earnings per share (basic) | 6,801 | 297.6 | 5,786 | 283.1 | 4,615 | 248.4 | ||||||||||||||||||||||||||
With effect from 1 January 2018, the Group has adopted IFRS 15 Revenue from Contracts with Customers. The Group has revised 2017, as explained in notes 1 and 31.
| BAT Annual Report and Form 20-F 2018 | 147 | |
|
Financial Statements
|
Notes on the Accounts continued
7 Earnings per share continued
|
Diluted |
||||||||||||||||||||||||||||||||||||||||
|
2018
|
2017
|
2016
|
||||||||||||||||||||||||||||||||||||||
| Earnings | Earnings |
Earnings |
Earnings | |||||||||||||||||||||||||||||||||||||
| Earnings | per share | £m | pence | Earnings | per share | |||||||||||||||||||||||||||||||||||
| Notes | £m | pence | Revised | Revised | £m | pence | ||||||||||||||||||||||||||||||||||
| Diluted earnings per share
|
6,032 | 263.2 | 37,485 | 1,827.6 | 4,648 | 249.2 | ||||||||||||||||||||||||||||||||||
| Effect of restructuring and integration costs
|
3(e) | 363 | 15.8 | 600 | 29.3 | 603 | 32.3 | |||||||||||||||||||||||||||||||||
| Tax and non-controlling interests on restructuring and integration costs
|
(83 | ) | (3.6 | ) | (133 | ) | (6.5 | ) | (90 | ) | (4.8 | ) | ||||||||||||||||||||||||||||
| Effect of amortisation and impairment of trademarks and similar intangibles
|
3(f) | 377 | 16.4 | 383 | 18.7 | 149 | 8.0 | |||||||||||||||||||||||||||||||||
| Tax on amortisation and impairment of trademarks and similar intangibles
|
(78 | ) | (3.4 | ) | (90 | ) | (4.4 | ) | (32 | ) | (1.7 | ) | ||||||||||||||||||||||||||||
| Effect of associates’ adjusting items net of tax
|
5(a) | (32 | ) | (1.4 | ) | (23,197 | ) | (1,131.0 | ) | (900 | ) | (48.3 | ) | |||||||||||||||||||||||||||
| Effect of hyperinflation on Venezuela’s retained earnings
|
3(h),4(b) | 65 | 2.8 | – | – | – | – | |||||||||||||||||||||||||||||||||
| Other adjusting items
|
3(h) | 184 | 8.0 | 534 | 26.0 | 53 | 2.9 | |||||||||||||||||||||||||||||||||
| Tax effect on other adjusting items
|
(44 | ) | (1.9 | ) | (184 | ) | (8.9 | ) | (5 | ) | (0.3 | ) | ||||||||||||||||||||||||||||
| Deferred tax relating to changes in tax rates
|
13 | (79 | ) | (3.4 | ) | (9,586 | ) | (467.4 | ) | – | – | |||||||||||||||||||||||||||||
| Release of deferred tax on unremitted earnings from associates
|
6(d) | – | – | (180 | ) | (8.8 | ) | – | – | |||||||||||||||||||||||||||||||
| Effect of Fox River
|
3(g) | – | – | – | – | 20 | 1.1 | |||||||||||||||||||||||||||||||||
| Effect of additional deferred tax charge from gain on divestiture of assets by associate (RAI)
|
6(d) | – | – | – | – | 61 | 3.3 | |||||||||||||||||||||||||||||||||
| Effect of interest on FII GLO settlement and other
|
4(b) | 41 | 1.8 | 43 | 2.1 | 25 | 1.3 | |||||||||||||||||||||||||||||||||
| Effect of retrospective guidance on WHT
|
6(d) | 55 | 2.4 | – | – | – | – | |||||||||||||||||||||||||||||||||
| Effect of adjusting finance costs in relation to acquisition of RAI
|
4(b) | – | – | 153 | 7.5 | – | – | |||||||||||||||||||||||||||||||||
| Tax Effect of adjusting finance costs in relation to acquisition of RAI
|
– | – | (49 | ) | (2.4 | ) | – | – | ||||||||||||||||||||||||||||||||
| Effect of hedge ineffectiveness
|
4(b) | – | – | 9 | 0.4 | (18 | ) | (1.0 | ) | |||||||||||||||||||||||||||||||
| Tax effect on hedge ineffectiveness
|
– | – | (2 | ) | (0.1 | ) | – | – | ||||||||||||||||||||||||||||||||
| Effect of US bond buy back | 4(b) | – | – | – | – | 101 | 5.5 | |||||||||||||||||||||||||||||||||
| Adjusted earnings per share (diluted) | 6,801 | 296.7 | 5,786 | 282.1 | 4,615 | 247.5 | ||||||||||||||||||||||||||||||||||
With effect from 1 January 2018, the Group has adopted IFRS 15 Revenue from Contracts with Customers. The Group has revised 2017, as explained in notes 1 and 31.
| 148 | BAT Annual Report and Form 20-F 2018 | |
|
Strategic Report
|
Governance
|
Financial Statements
|
Other Information
|
7 Earnings per share continued
Headline earnings per share as required by the JSE Limited
The presentation of headline earnings per share, as an alternative measure of earnings per share, is mandated under the JSE Listing Requirements. It is calculated in accordance with Circular 4/2018 ‘Headline Earnings’, as issued by the South African Institute of Chartered Accountants.
|
Basic
|
||||||||||||||||||||||||||||||||
|
2018
|
2017
|
2016
|
||||||||||||||||||||||||||||||
| Earnings
|
Earnings
|
Earnings
|
Earnings
|
Earnings
|
Earnings
|
|||||||||||||||||||||||||||
| Basic earnings per share
|
6,032 | 264.0 | 37,485 | 1,833.9 | 4,648 | 250.2 | ||||||||||||||||||||||||||
| Effect of impairment of intangibles, property, plant and equipment and assets held-for-sale
|
238 | 10.3 | 179 | 8.7 | 126 | 6.8 | ||||||||||||||||||||||||||
| Tax and non-controlling interests on impairment of intangibles and property, plant and equipment
|
(65 | ) | (2.8 | ) | (35 | ) | (1.7 | ) | (35 | ) | (1.9 | ) | ||||||||||||||||||||
| Effect of gains on disposal of property, plant and equipment and held-for-sale assets
|
(11 | ) | (0.5 | ) | (48 | ) | (2.3 | ) | (59 | ) | (3.2 | ) | ||||||||||||||||||||
| Tax and non-controlling interests on disposal of property, plant and equipment and held-for-sale assets
|
4 | 0.2 | 13 | 0.6 | 30 | 1.6 | ||||||||||||||||||||||||||
| Effect of gains on disposal of businesses, non-current investments and brands
|
(10 | ) | (0.4 | ) | – | – | – | – | ||||||||||||||||||||||||
| Tax on gains on disposal of businesses, non-current investments and brands
|
2 | 0.1 | – | – | – | – | ||||||||||||||||||||||||||
| Gain on deemed disposal of RAI associate
|
– | – | (23,288 | ) | (1,139.3 | ) | – | – | ||||||||||||||||||||||||
| Write-off of investment in associate
|
– | – | 27 | 1.3 | – | – | ||||||||||||||||||||||||||
| Share of associates’ gains on disposal of assets
|
– | – | – | – | (941 | ) | (50.6 | ) | ||||||||||||||||||||||||
| Tax effect of associates’ disposal of assets
|
– | – | – | – | 61 | 3.3 | ||||||||||||||||||||||||||
| Issue of shares and change in shareholding in associate | (22 | ) | (1.0 | ) | (29 | ) | (1.4 | ) | (11 | ) | (0.6 | ) | ||||||||||||||||||||
| Headline earnings per share (basic) | 6,168 | 269.9 | 14,304 | 699.8 | 3,819 | 205.6 | ||||||||||||||||||||||||||
With effect from 1 January 2018, the Group has adopted IFRS 15 Revenue from Contracts with Customers. The Group has revised 2017, as explained in notes 1 and 31.
|
Diluted
|
||||||||||||||||||||||||||||||||
|
2018
|
2017
|
2016
|
||||||||||||||||||||||||||||||
| Earnings
|
Earnings
|
Earnings
|
Earnings
|
Earnings
|
Earnings
|
|||||||||||||||||||||||||||
| Diluted earnings per share
|
6,032 | 263.2 | 37,485 | 1,827.6 | 4,648 | 249.2 | ||||||||||||||||||||||||||
| Effect of impairment of intangibles, property, plant and equipment and assets held-for-sale
|
238 | 10.3 | 179 | 8.6 | 126 | 6.8 | ||||||||||||||||||||||||||
| Tax and non-controlling interests on impairment of intangibles and property, plant and equipment
|
(65 | ) | (2.8 | ) | (35 | ) | (1.7 | ) | (35 | ) | (1.9 | ) | ||||||||||||||||||||
| Effect of gains on disposal of property, plant and equipment and held-for-sale assets
|
(11 | ) | (0.5 | ) | (48 | ) | (2.3 | ) | (59 | ) | (3.2 | ) | ||||||||||||||||||||
| Tax and non-controlling interests on disposal of property, plant and equipment and held-for-sale assets
|
4 | 0.2 | 13 | 0.6 | 30 | 1.6 | ||||||||||||||||||||||||||
| Effect of gains on disposal of businesses, non-current investments and brands
|
(10 | ) | (0.4 | ) | – | – | – | – | ||||||||||||||||||||||||
| Tax on gains on disposal of businesses, non-current investments and brands
|
2 | 0.1 | – | – | – | – | ||||||||||||||||||||||||||
| Gain on deemed disposal of RAI associate
|
– | – | (23,288 | ) | (1,135.4 | ) | – | – | ||||||||||||||||||||||||
| Write-off of investment in associate
|
– | – | 27 | 1.3 | – | – | ||||||||||||||||||||||||||
| Share of associates’ gains on disposal of assets
|
– | – | – | – | (941 | ) | (50.4 | ) | ||||||||||||||||||||||||
| Tax effect of associates’ disposal of assets
|
– | – | – | – | 61 | 3.3 | ||||||||||||||||||||||||||
| Issue of shares and change in shareholding in associate | (22 | ) | (1.0 | ) | (29 | ) | (1.4 | ) | (11 | ) | (0.6 | ) | ||||||||||||||||||||
| Headline earnings per share (diluted) | 6,168 | 269.1 | 14,304 | 697.3 | 3,819 | 204.8 | ||||||||||||||||||||||||||
With effect from 1 January 2018, the Group has adopted IFRS 15 Revenue from Contracts with Customers. The Group has revised 2017, as explained in notes 1 and 31.
| BAT Annual Report and Form 20-F 2018 | 149 | |
|
Financial Statements
|
Notes on the Accounts continued
8 Dividends and other appropriations
|
2018
|
2017
|
2016
|
||||||||||||||||||||||||||
| Dividends paid to owner of the parent |
Pence per share
|
£m
|
Pence per share
|
£m
|
Pence per share
|
£m
|
||||||||||||||||||||||
| Ordinary shares | ||||||||||||||||||||||||||||
| Interim | ||||||||||||||||||||||||||||
| 2018 paid 15 November 2018 | 48.8 | 1,114 | ||||||||||||||||||||||||||
| 2018 paid 8 August 2018 | 48.8 | 1,118 | ||||||||||||||||||||||||||
| 2018 paid 9 May 2018 | 48.8 | 1,111 | ||||||||||||||||||||||||||
| 2017 paid 8 February 2018 | 43.6 | 1,004 | ||||||||||||||||||||||||||
| 2017 paid 28 September 2017 | 56.5 | 1,284 | ||||||||||||||||||||||||||
| 2016 paid 28 September 2016 | 51.3 | 961 | ||||||||||||||||||||||||||
| Final | ||||||||||||||||||||||||||||
| 2016 paid 4 May 2017 | 118.1 | 2,181 | ||||||||||||||||||||||||||
| 2015 paid 5 May 2016 | 104.6 | 1,949 | ||||||||||||||||||||||||||
|
|
190.0
|
|
|
4,347
|
|
|
174.6
|
|
|
3,465
|
|
|
155.9
|
|
|
2,910
|
| |||||||||||
From 1 January 2018, the Group moved to four interim quarterly dividend payments of 48.8p per ordinary share. As part of the transition, and to ensure shareholders receive the equivalent amount of total cash payments in 2018 as they would have under the previous payment policy, an additional interim dividend of 43.6 pence per share was announced on 5 December 2017 which was paid on 8 February 2018.
The dividend declared in 2018 for payment on 9 May 2018, 8 August 2018, 15 November 2018 and 7 February 2019 was £1,117 million, £1,112 million, £1,115 million and £1,119 million respectively and is estimated based on the number of shares and the proportion of dividends to be paid in foreign currency using the applicable exchange rate. This takes the total dividend declared in respect of 2018 to £4,463 million.
9 Intangible assets
|
2018
|
||||||||||||||||||||
| Goodwill
|
Computer
|
Trademarks
|
Assets in the
|
Total £m
|
||||||||||||||||
| 1 January | ||||||||||||||||||||
| Cost | 44,147 | 1,119 | 74,136 | 71 | 119,473 | |||||||||||||||
| Accumulated amortisation and impairment | (672 | ) | (1,016 | ) | (1,688 | ) | ||||||||||||||
| Net book value at 1 January | 44,147 | 447 | 73,120 | 71 | 117,785 | |||||||||||||||
| Differences on exchange | 2,024 | – | 4,483 | 6,507 | ||||||||||||||||
| Additions | ||||||||||||||||||||
| – internal development | – | – | – | 120 | 120 | |||||||||||||||
| – acquisitions (note 24) | 14 | – | 13 | – | 27 | |||||||||||||||
| – separately acquired | – | – | 62 | – | 62 | |||||||||||||||
| Reallocations | (22 | ) | 58 | 30 | (66 | ) | – | |||||||||||||
| Amortisation charge | – | (102 | ) | (342 | ) | – | (444 | ) | ||||||||||||
| Impairment | – | – | (44 | ) | – | (44 | ) | |||||||||||||
| 31 December | ||||||||||||||||||||
| Cost | 46,163 | 1,101 | 78,736 | 125 | 126,125 | |||||||||||||||
| Accumulated amortisation and impairment | (698 | ) | (1,414 | ) | (2,112 | ) | ||||||||||||||
| Net book value at 31 December |
|
46,163
|
|
|
403
|
|
|
77,322
|
|
|
125
|
|
|
124,013
|
| |||||
| 150 | BAT Annual Report and Form 20-F 2018 | |
|
Strategic Report
|
Governance
|
Financial Statements
|
Other Information
|
9 Intangible assets continued
|
2017
|
||||||||||||||||||||
| Goodwill
|
Computer
|
Trademarks
|
Assets in the
|
Total £m
|
||||||||||||||||
| 1 January | ||||||||||||||||||||
| Cost | 11,023 | 1,054 | 1,255 | 60 | 13,392 | |||||||||||||||
| Accumulated amortisation and impairment | (616) | (659) | (1,275) | |||||||||||||||||
| Net book value at 1 January | 11,023 | 438 | 596 | 60 | 12,117 | |||||||||||||||
| Differences on exchange | (1,189) | (3) | (2,669) | – | (3,861) | |||||||||||||||
| Additions | ||||||||||||||||||||
| – internal development | – | – | – | 87 | 87 | |||||||||||||||
| – acquisitions (note 24) | 34,313 | 33 | 75,488 | 4 | 109,838 | |||||||||||||||
| – separately acquired | – | 29 | 98 | – | 127 | |||||||||||||||
| Reallocations | – | 80 | – | (80) | – | |||||||||||||||
| Amortisation charge | – | (88) | (268) | – | (356) | |||||||||||||||
| Impairment | – | (42) | (125) | – | (167) | |||||||||||||||
| 31 December | ||||||||||||||||||||
| Cost | 44,147 | 1,119 | 74,136 | 71 | 119,473 | |||||||||||||||
| Accumulated amortisation and impairment | (672) | (1,016) | (1,688) | |||||||||||||||||
| Net book value at 31 December | 44,147 | 447 | 73,120 | 71 | 117,785 | |||||||||||||||
Included in computer software and assets in the course of development are internally developed assets with a carrying value of £523 million (2017: £459 million). The costs of internally developed assets include capitalised expenses of employees working full time on software development projects, third-party consultants, and software licence fees from third-party suppliers.
The Group has £6 million future contractual commitments (2017: £16 million) related to intangible assets.
Trademarks and similar intangibles with indefinite lives
Included in the net book value of trademarks and similar intangibles are trademarks relating to the acquisition of RAI with indefinite lives amounting to £73,885 million (2017: £69,562 million).
The trademarks and similar intangibles have been tested for impairment in line with the following methodology. The recoverable amounts of trademarks and similar intangibles with indefinite lives have been determined on a value-in-use basis. The value-in-use calculations use cash flows based on detailed brand budgets prepared by management using projected sales volumes and projected brand profitability covering a five-year to 10-year horizon depending on the brand and, thereafter, grown into perpetuity. The brand budgets include an allocation for corporate costs based on volumes. The discount rate of 6.5% and long-term growth rates applied to the brand value-in-use calculations have been determined by local management based on experience, specific market and brand trends, pricing expectations and costs. The brand budgets are incorporated into the budget information used in the goodwill impairment review below. Following the application of a reasonable range of sensitivities, there was no indication of impairment.
Trademarks and similar intangibles with definite lives
Included in the net book value of trademarks and similar intangibles are trademarks relating to the acquisition of RAI £3,013 million
(2017: £3,097 million), Skandinavisk Tobakskompagni (ST) £209 million (2017: £230 million) and TDR d.o.o. £40 million (2017: £61 million).
During 2018, a purchase price allocation adjustment was recognised in respect of the provisional goodwill recognised as a result of the Group acquiring certain tobacco assets, including a distribution company, from Bulgartabac Holdings AD in Bulgaria. The provisional goodwill of £22 million was reclassified to trademarks and similar intangibles with definite lives.
Impairment testing for goodwill
Goodwill of £46,163 million (2017: £44,147 million) is included in intangible assets in the balance sheet of which the following are the significant acquisitions: RAI £35,117 million (2017: £33,062 million); Rothmans Group £4,856 million (2017: £4,834 million); Imperial Tobacco Canada £2,307 million (2017: £2,367 million); ETI (Italy) £1,478 million (2017: £1,462 million) and ST (principally Scandinavia) £1,111 million (2017: £1,102 million). The principal allocations of goodwill in the Rothmans’ acquisition are to the cash-generating units of Europe and South Africa, with the remainder mainly relating to operations in the domestic and export markets in the United Kingdom and operations in APME.
As a consequence of the Group’s new regional structure effective 1 January 2018, goodwill allocated to the Western Europe cash-generating unit (2017: £4,033 million and pre-tax discount rate of 7.3%) has been combined with the goodwill allocated to the Eastern Europe cash-generating unit (2017: £980 million and pre-tax discount rate of 8.1%) to create the new Europe cash-generating unit.
In 2018, goodwill was allocated for impairment testing purposes to 19 (2017: 19) individual cash-generating units – one in the United States (2017: one), five in APME (2017: five), six in AMSSA (2017: six) and seven in ENA (2017: seven).
| BAT Annual Report and Form 20-F 2018 | 151 | |
|
Financial Statements
|
||||||||||||||
| Notes on the Accounts continued | ||||||||||||||
9 Intangible assets continued
|
2018
|
2017
|
|||||||||||||||||
|
Carrying
|
Pre-tax discount rate %
|
Carrying
|
Pre-tax
|
|||||||||||||||
|
Cash Generating Unit
|
||||||||||||||||||
| RAI
|
35,117 | 7.7 | 33,062 | 7.7 | ||||||||||||||
| Canada
|
2,307 | 7.5 | 2,367 | 7.5 | ||||||||||||||
| Europe
|
5,069 | 7.5 | 5,013 | 7.3 / 8.1 | ||||||||||||||
| South Africa
|
605 | 10.6 | 661 | 9.6 | ||||||||||||||
| Australia
|
740 | 7.9 | 775 | 7.9 | ||||||||||||||
| Singapore
|
615 | 6.6 | 591 | 6.6 | ||||||||||||||
| Malaysia
|
448 | 8.2 | 431 | 8.3 | ||||||||||||||
| Other
|
1,262 | 1,247 | ||||||||||||||||
| Total | 46,163 | 44,147 | ||||||||||||||||
The recoverable amounts of all cash-generating units have been determined on a value-in-use basis. The key assumptions for the recoverable amounts of all units are the budgeted volumes, operating margins and long-term growth rates, which directly impact the cash flows, and the discount rates used in the calculation. The long-term growth rate is used purely for the impairment testing of goodwill under IAS 36 Impairment of Assets and does not reflect long-term planning assumptions used by the Group for investment proposals or for any other assessments.
Pre-tax discount rates of between 6.6% and 22.0% (2017: 6.6% and 19.2%) were used, based on the Group’s weighted average cost of capital, taking into account the cost of capital and borrowings, to which specific market-related premium adjustments are made. These adjustments are derived from external sources and are based on the spread between bonds (or credit default swaps, or similar indicators) issued by the US or comparable governments and by the local government, adjusted for the Group’s own credit market risk. For ease of use and consistency in application, these results are periodically calibrated into bands based on internationally recognised credit ratings. The long-term growth rates and discount rates have been applied to the budgeted cash flows of each cash-generating unit. These cash flows have been determined by local management based on experience, specific market and brand trends, pricing expectations and costs, and have been endorsed by Group management as part of the consolidated Group budget.
The value-in-use calculations use cash flows based on detailed financial budgets prepared by management covering a one-year period extrapolated over a 10-year horizon with growth of 4% in years 2 to 10, including 2% inflation (2017: 1% inflation), where after a total growth rate of 2% (2017: 2%) has been assumed. A 10-year horizon is considered appropriate based on the Group’s history of profit and cash growth, its well-balanced portfolio of brands and the industry in which it operates. In some instances, such as recent acquisitions, start-up ventures or in specific cases, the valuation is expanded to reflect the medium-term plan of the country or market management spanning five years or beyond. If discounted cash flows for cash-generating units should fall by 10%, or the discount rate was increased at a post-tax rate of 1%, there would be no impairment.
On 15th November 2018, the U.S. Food and Drug Administration (FDA) announced an intention to ban flavoured vaping products and menthol cigarettes. Market speculation in the days leading up to the announcement over the financial impact of a possible menthols ban had a significant negative impact on the share price of the Group.
However, the Group does not believe that there is an impairment trigger at this stage on either the Newport brand or the US goodwill for the following reasons:
– the multitude of procedures embedded in the comprehensive rule-making process;
– the possibility that any proposed regulation fails to withstand judicial review;
– the possibility that any proposed regulation would not apply to the US market for several years;
– the uncertainty surrounding how any potential regulation will affect the manufacture and marketing of Newport; and
– the lack of any other indicators of impairment in relation to the US business.
The Group will continue to monitor developments in relation to the proposed ban on flavoured vaping products and menthol cigarettes.
| 152 | BAT Annual Report and Form 20-F 2018 | |
|
Strategic Report
|
Governance
|
Financial Statements
|
Other Information
|
10 Property, plant and equipment
|
2018
|
||||||||||||||||||||
|
Freehold £m
|
Leasehold £m
|
Plant and equipment
|
Assets in the construction
|
Total £m
|
||||||||||||||||
|
1 January |
||||||||||||||||||||
|
Cost |
1,455 | 267 | 5,552 | 917 | 8,191 | |||||||||||||||
|
Accumulated depreciation and impairment |
|
(369
|
)
|
|
(124
|
)
|
|
(2,816
|
)
|
|
(3,309
|
)
| ||||||||
| Net book value at 1 January | 1,086 | 143 | 2,736 | 917 | 4,882 | |||||||||||||||
| Differences on exchange | 76 | 4 | 27 | (5 | ) | 102 | ||||||||||||||
|
Additions |
||||||||||||||||||||
|
– separately acquired |
5 | 1 | 41 | 722 | 769 | |||||||||||||||
|
Reallocations |
58 | 2 | 466 | (526 | ) | – | ||||||||||||||
|
Depreciation |
(34 | ) | (11 | ) | (318 | ) | (363 | ) | ||||||||||||
|
Impairment |
(74 | ) | – | (120 | ) | (194 | ) | |||||||||||||
|
Disposals |
(13 | ) | – | (17 | ) | (30 | ) | |||||||||||||
|
31 December |
||||||||||||||||||||
|
Cost |
1,515 | 268 | 5,763 | 1,108 | 8,654 | |||||||||||||||
|
Accumulated depreciation and impairment |
(411 | ) | (129 | ) | (2,948 | ) | (3,488 | ) | ||||||||||||
|
Net book value at 31 December |
1,104 | 139 | 2,815 | 1,108 | 5,166 | |||||||||||||||
| In 2018, the differences on exchange include £149 million of indexation in respect of the operations in Venezuela. However, management believes that such a revaluation is not reflective of the fair value of assets in Venezuela and an impairment charge of £110 million has been recognised, as explained in note 3(h). |
| |||||||||||||||||||
|
2017
|
||||||||||||||||||||
| Freehold
|
Leasehold
|
Plant and
|
Assets in the construction
|
Total £m
|
||||||||||||||||
| 1 January | ||||||||||||||||||||
|
Cost |
1,163 | 239 | 5,022 | 725 | 7,149 | |||||||||||||||
|
Accumulated depreciation and impairment
|
|
(360
|
)
|
|
(116
|
)
|
|
(2,991
|
)
|
|
(21
|
)
|
|
(3,488
|
)
| |||||
|
Net book value at 1 January |
803 | 123 | 2,031 | 704 | 3,661 | |||||||||||||||
| Differences on exchange | (33 | ) | (11 | ) | (117 | ) | (49 | ) | (210 | ) | ||||||||||
|
Additions |
||||||||||||||||||||
|
– acquisitions (note 24) |
349 | 4 | 626 | 62 | 1,041 | |||||||||||||||
|
– separately acquired |
23 | – | 47 | 753 | 823 | |||||||||||||||
|
Reallocations |
(5 | ) | 35 | 523 | (553 | ) | – | |||||||||||||
|
Depreciation |
(29 | ) | (7 | ) | (352 | ) | (388 | ) | ||||||||||||
|
Impairment |
(1 | ) | (1 | ) | (10 | ) | (12 | ) | ||||||||||||
|
Disposals |
(4 | ) | – | (12 | ) | (16 | ) | |||||||||||||
|
Net reclassifications as held-for-sale |
(17 | ) | – | – | (17 | ) | ||||||||||||||
|
31 December |
||||||||||||||||||||
|
Cost |
1,455 | 267 | 5,552 | 917 | 8,191 | |||||||||||||||
|
Accumulated depreciation and impairment |
(369 | ) | (124 | ) | (2,816 | ) | (3,309 | ) | ||||||||||||
|
Net book value at 31 December |
1,086 | 143 | 2,736 | 917 | 4,882 | |||||||||||||||
Net book value of assets held under finance leases for 2018 was £16 million (2017: £29 million).
The Group’s finance lease arrangements relate principally to the lease of tobacco vending machines by the Group’s subsidiary in Japan. In 2017, the Group’s finance lease arrangements related principally to the lease of tobacco vending machines and buildings in Japan and Peru respectively. Assets held under finance leases are secured under finance lease obligations included in note 20.
As explained in note 12, contributions to the British American Tobacco UK Pension Fund are secured by a charge over the Group’s Head Office (Globe House). Globe House is included in freehold property above with a carrying value of £185 million (2017: £187 million).
| BAT Annual Report and Form 20-F 2018 | 153 | |
|
Financial Statements
|
||||||||||||||
| Notes on the Accounts continued | ||||||||||||||
10 Property, plant and equipment continued
|
2018 £m
|
2017 £m
|
|||||||
|
Cost of freehold land within freehold property on which no depreciation is provided |
255 | 253 | ||||||
|
Leasehold property comprises |
||||||||
|
– net book value of long leasehold |
100 | 104 | ||||||
|
– net book value of short leasehold |
46 | 39 | ||||||
| 146 | 143 | |||||||
|
Contracts placed for future expenditure |
141 | 85 | ||||||
|
11 Investments in associates and joint ventures
|
||||||||
| 2018 £m |
2017 £m |
|||||||
|
1 January |
1,577 | 9,507 | ||||||
|
Total comprehensive income (note 5) |
387 | 23,316 | ||||||
|
Dividends |
(211 | ) | (688 | ) | ||||
|
Additions |
– | 13 | ||||||
|
Reclassification of Reynolds American Inc. (RAI) |
– | (30,521 | ) | |||||
|
Other equity movements |
(16 | ) | (50) | |||||
|
31 December |
1,737 | 1,577 | ||||||
|
Non-current assets |
1,225 | 1,127 | ||||||
|
Current assets |
953 | 1,019 | ||||||
|
Non-current liabilities |
(71 | ) | (67 | ) | ||||
|
Current liabilities |
(370 | ) | (502 | ) | ||||
| 1,737 | 1,577 | |||||||
|
ITC Ltd. (Group’s share of the market value is £11,465 million (2017: £11,036 million)) |
1,682 | 1,527 | ||||||
|
Other listed associates (Group’s share of the market value is £183 million (2017: £184 million)) |
20 | 18 | ||||||
|
Unlisted associates |
35 | 32 | ||||||
| 1,737 | 1,577 | |||||||
On 25 July 2017, the Group announced the completion of the acquisition of the remaining 57.8% of RAI the Group did not already own. As at that date, RAI ceased to be reported as an associate and has become a fully owned subsidiary. Accordingly, as at that date, RAI has been consolidated in accordance with IFRS 10 Consolidated Financial Statements. Included in the £30,521 million is the gain arising on the deemed disposal of RAI of £23,288 million. This gain includes amounts restated in accordance with IAS 21 The Effects of Changes in Foreign Exchange Rates (see note 19).
Prior to 25 July 2017, the Group accounted for RAI as an associate, having concluded that it did not have de facto control of RAI because of the operation of the governance agreement between the Group and RAI which ensured that the Group did not have the practical ability to direct relevant activities of RAI.
The Group’s investment in Tisak d.d. (Tisak) was acquired as part of the TDR transaction (note 24). During 2016, the Group entered into an agreement with Tisak’s parent Agrokor d.d. (Agrokor) to convert certain outstanding trading balances into long-term loans and an additional shareholding in Tisak. As part of the agreement, Agrokor had the right to reacquire the additional shareholding in Tisak. As a consequence of this, while the Group had legal ownership of the additional shareholding, it did not consider that the shares provided any additional equity interest and continued to account for 26% of the equity of Tisak. In 2017, due to the financial difficulties of Agrokor and Tisak, the Group fully impaired this investment. This resulted in a charge of £27 million to the income statement that has been reported as an adjusting item in note 5. In July 2018, Agrokor’s creditors approved a settlement plan proposed by Agrokor’s administrators that is expected to be implemented during 2019. In its current form, the settlement plan is unlikely to return any value to the Group on this investment.
Included within the dividends amount of £211 million (2017: £688 million) are £nil million (2017: £477 million) attributable to dividends declared by RAI and £204 million (2017: £204 million) attributable to dividends declared by ITC.
The principal associate undertaking of the Group is ITC Ltd. (ITC) as shown under associates undertakings and joint ventures.
| 154 | BAT Annual Report and Form 20-F 2018 | |
|
Strategic Report
|
Governance
|
Financial Statements
|
Other Information
|
11 Investments in associates and joint ventures continued
ITC Ltd.
ITC is an Indian conglomerate based in Kolkata and maintains a presence in cigarettes, hotels, paper and packaging, agri-business and other fast-moving goods (e.g. confectionery, IT, branded apparel, personal care, greetings cards and safety matches). BAT’s interest in ITC is 29.57%.
ITC prepares accounts on a quarterly basis with a 31 March year end. As permitted by IAS 28, results up to 30 September 2018 have been used in applying the equity method. This is driven by the availability of information at the half year, to be consistent with the treatment in the Group’s interim accounts. Any further information available after the date used for reporting purposes is reviewed and any material items adjusted for in the final results. The latest published information available is at 31 December 2018.
|
2018 £m
|
2017 £m
|
|||||||
| Non-current assets | 4,106 | 3,738 | ||||||
| Current assets | 2,823 | 3,089 | ||||||
| Non-current liabilities | (238 | ) | (240 | ) | ||||
| Current liabilities | (1,002 | ) | (1,446 | ) | ||||
| 5,689 | 5,141 | |||||||
|
Group’s share of ITC Ltd. (2018: 29.57%; 2017: 29.71%) |
1,682 | 1,527 | ||||||
12 Retirement benefit schemes
The Group’s subsidiary undertakings operate over 190 retirement benefit arrangements worldwide. The majority of scheme members belong to defined benefit schemes, most of which are funded externally and many of which are closed to new entrants. The Group also operates a number of defined contribution schemes.
The liabilities arising in the defined benefit schemes are determined in accordance with the advice of independent, professionally qualified actuaries, using the projected unit credit method. It is Group policy that all schemes are formally valued at least every three years.
The principal schemes are in the USA, UK, Germany, Canada, The Netherlands and Switzerland. Together, schemes in these territories account for over 85% of the total obligations of the Group’s defined benefit schemes. These obligations consist mainly of final salary pension schemes which provide benefits to members in the form of a guaranteed level of pension payable for life. The level of benefits provided depends on members’ length of service and their salary in the final years leading up to retirement.
In addition, the Group operates several healthcare benefit schemes, of which the most significant are in the USA and Canada. The liabilities in respect of healthcare benefits are also assessed by qualified independent actuaries, applying the projected unit credit method.
All of these arrangements, including funded schemes where formal trusts or equivalents are required, have been developed and are operated in accordance with local practices and regulations where applicable in the countries concerned. For example, in the USA, the main funded pension schemes are the Reynolds American Retirement Plan and the Retirement Income Plan for Certain RAI Affiliates, and the main funded healthcare scheme is the Brown & Williamson Tobacco Corporation Welfare & Fringe Benefit Plan, all of which are established with corporate trustees that are required to run the schemes in accordance with the Plan’s rules and to comply with all relevant legislation, including the Employee Retirement Income Security Act 1974 and US law. Similarly, in the UK, the main pension scheme is the British American Tobacco UK Pension Fund, which is established under trust law and has a corporate trustee that is required to run the scheme in accordance with the Fund’s Trust Deed and Rules and to comply with the Pension Scheme Act 1993, Pensions Act 1995, Pensions Act 2004 and all the relevant legislation.
Responsibility for the governance of the schemes across the Group, including investment decisions and contribution schedules, generally lies with the trustees. The trustees for each arrangement will usually consist of representatives appointed by both the sponsoring company and the beneficiaries. In the USA, the corporate trustees act as custodians with a committee of local management acting in a fiduciary capacity with regard to investment decisions, risk mitigation and administration of the arrangements.
The majority of schemes are subject to local regulations regarding funding requirements. Contributions to defined benefit schemes are determined after consultation with the respective trustees and actuaries of the individual externally funded schemes, and after taking into account regulatory requirements in each territory.
The Group’s contributions to funded retirement benefit schemes in 2019 are expected to be £88 million in total compared to £221 million in 2018.
Contributions to the various funded schemes in the USA are agreed with the relevant corporate Trustee, the named fiduciary, scheme actuaries and the committee of local management after taking account of statutory requirements including the Pensions Protection Act of 2006, as amended. Through its subsidiaries in the USA, the Group intends to make significant regular contributions, when required, with the aim of maintaining a funding status of at least 90%, and becoming fully funded long-term. The Group contributed £87 million to its funded pension plans and £40 million to its funded post-retirement plans in 2018. However, during 2019, the Group does not expect to contribute to its funded pension and post-retirement plans in the USA.
| BAT Annual Report and Form 20-F 2018 | 155 | |
|
Financial Statements
|
Notes on the Accounts continued
12 Retirement benefit schemes continued
Contributions to the British American Tobacco UK Pension Fund for 2017 and 2016 were agreed with the Trustee as part of a recovery plan to include £30 million a year to cover ongoing service costs, with additional contributions to eliminate a funding shortfall. Additional contributions were £78 million in both 2017 and 2016. These contributions were to be used to achieve the statutory funding objective and thereafter to support attaining a lower risk investment strategy (noted below). With effect from July 2018, the Group will pay £18 million a year to meet the cost of future benefit accruals. Additional annual contributions are payable until the Fund is valued to 115% on a Technical Provisions basis, and are expected to be £11 million in 2019.
Total contributions payable to the UK Pension Fund are secured by a charge over the Group’s Head Office (Globe House) up to a maximum of £150 million. The charge would be triggered in the event that the Group defaults on agreed contributions due to the Fund or if an insolvency event occurs with respect to the UK entity responsible for making the payments. The charge is due to be released in 2039 but may be released earlier by negotiation or if the assets of the Fund are sufficient to achieve certain funding levels. Under the rules of the scheme, any future surplus would be returnable to the Group by refund at the end of the life of the scheme. The funding commitment is therefore not considered onerous, and in accordance with IFRIC 14 no additional liabilities or surplus restriction have been recognised in respect of this commitment.
Payments made to pensioners by the operating companies in Germany, net of income on scheme assets, are deemed to be company contributions to the Contractual Trust Arrangements and are anticipated to be around £25 million in 2019 and ranging from £24 million per annum, decreasing to £21 million in 2023. Contributions to pension schemes in Canada, The Netherlands and Switzerland in total are anticipated to be around £25 million in 2019 and then around £10 million per annum for the four years after that.
The majority of benefit payments are from trustee administered funds, however, there are also a number of unfunded schemes where the sponsoring company meets the benefit payment obligation as it falls due. For unfunded schemes in the USA, UK and Canada, 41% of the liabilities reported at year end are expected to be settled by the Group within 10 years, 29% between 10 and 20 years, 17% between 20 and 30 years, and 13% thereafter.
The funded arrangements in the Group have policies on investment management, including strategies over a preferred long-term investment profile, and schemes in certain territories including Canada and The Netherlands manage their bond portfolios to match the weighted average duration of scheme liabilities. For funded schemes in the USA, the Group employs a risk mitigation strategy which seeks to balance pension plan returns with a reasonable level of funded status volatility. Based on this framework, the asset allocation has two primary components. The first component is the hedging portfolio, which uses extended duration fixed income holdings (typically US Government and investment grade corporate bonds) and to a lesser extent derivatives to match a portion of the interest rate risk associated with the benefit obligations, thereby reducing expected funded status volatility. The second component is the return seeking portfolio, which is designed to enhance portfolio returns. The return seeking portfolio is broadly diversified across asset classes. In addition, the main scheme in the UK had a target investment strategy such that, by 31 December 2018, the scheme would have moved to 20% return-seeking assets and 80% risk-reducing assets. This objective was achieved during the first quarter of 2018 and the Trustee has subsequently selected an investment strategy with a high-level target of broadly 10% return-seeking and 90% risk-reducing assets. Investments are diversified by type of investment, by investment sector, and where appropriate by country.
Through its defined benefit pension schemes and healthcare schemes, the Group is exposed to a number of risks, including:
Asset volatility:
The plan liabilities are calculated using discount rates set by reference to bond yields. If plan assets underperform this yield, e.g. due to stock market volatility, this will create a deficit. However, most schemes hold a proportion of assets which are expected to outperform bonds in the long term, and the majority of schemes by value are subject to local regulation regarding funding deficits.
Changes in bond yields:
A decrease in corporate bond yields will increase scheme liabilities, although this will be partially offset by an increase in the value of the schemes’ bond holdings or other hedging instruments.
Inflation risk:
Some of the Group’s pension obligations are linked to inflation and higher inflation will lead to higher liabilities, although in most cases, caps on the level of inflationary increases are in place in the scheme rules, while some assets and derivatives provide specific inflation protection.
Life expectancy:
The majority of the schemes’ obligations are to provide benefits for the life of the member, so increases in life expectancy will result in an increase in the plans’ liabilities. Assumptions regarding mortality and mortality improvements are regularly reviewed in line with actuarial tables and scheme specific experience.
| 156 | BAT Annual Report and Form 20-F 2018 | |
|
Strategic Report
|
Governance
|
Financial Statements
|
Other Information
|
12 Retirement benefit schemes continued
The amounts recognised in the balance sheet are determined as follows:
|
Pension schemes
|
Healthcare schemes
|
Total
|
||||||||||||||||||||||||||
|
2018 £m
|
2017 £m
|
2018 £m
|
2017 £m
|
2018 £m
|
2017 £m
|
|||||||||||||||||||||||
| Present value of funded scheme liabilities | (11,031 | ) | (11,542 | ) | (286 | ) | (326 | ) | (11,317 | ) | (11,868 | ) | ||||||||||||||||
|
Fair value of funded scheme assets |
11,747 | 12,157 | 178 | 193 | 11,925 | 12,350 | ||||||||||||||||||||||
| 716 | 615 | (108 | ) | (133 | ) | 608 | 482 | |||||||||||||||||||||
|
Unrecognised funded scheme surpluses |
(20 | ) | (23 | ) | – | – | (20 | ) | (23 | ) | ||||||||||||||||||
| 696 | 592 | (108 | ) | (133 | ) | 588 | 459 | |||||||||||||||||||||
|
Present value of unfunded scheme liabilities |
(531 | ) | (535 | ) | (575 | ) | (622 | ) | (1,106 | ) | (1,157 | ) | ||||||||||||||||
| 165 | 57 | (683 | ) | (755 | ) | (518 | ) | (698 | ) | |||||||||||||||||||
| The above net asset/(liability) is recognised in the balance sheet as follows:
|
|
|||||||||||||||||||||||||||
|
– retirement benefit scheme liabilities |
(982 | ) | (1,065 | ) | (683 | ) | (756 | ) | (1,665 | ) | (1,821 | ) | ||||||||||||||||
|
– retirement benefit scheme assets |
1,147 | 1,122 | – | 1 | 1,147 | 1,123 | ||||||||||||||||||||||
| 165 | 57 | (683 | ) | (755 | ) | (518 | ) | (698 | ) | |||||||||||||||||||
| The net liabilities of funded pension schemes by territory are as follows:
|
|
|||||||||||||||||||||||||||
|
Liabilities
|
Assets
|
Total
|
||||||||||||||||||||||||||
|
2018 £m
|
2017 £m
|
2018 £m
|
2017 £m
|
2018 £m
|
2017 £m
|
|||||||||||||||||||||||
| – USA | (4,835 | ) | (5,022 | ) | 4,464 | 4,640 | (371 | ) | (382 | ) | ||||||||||||||||||
| – UK | (2,962 | ) | (3,133 | ) | 4,016 | 4,119 | 1,054 | 986 | ||||||||||||||||||||
| – Germany | (949 | ) | (998 | ) | 948 | 945 | (1 | ) | (53 | ) | ||||||||||||||||||
| – Canada | (694 | ) | (782 | ) | 708 | 779 | 14 | (3 | ) | |||||||||||||||||||
| – The Netherlands | (782 | ) | (769 | ) | 793 | 819 | 11 | 50 | ||||||||||||||||||||
| – Switzerland | (326 | ) | (330 | ) | 283 | 285 | (43 | ) | (45 | ) | ||||||||||||||||||
| – Rest of the Group | (483 | ) | (508 | ) | 535 | 570 | 52 | 62 | ||||||||||||||||||||
| Funded schemes | (11,031 | ) | (11,542 | ) | 11,747 | 12,157 | 716 | 615 | ||||||||||||||||||||
|
Of the Group’s unfunded pension schemes 48% (2017: 47%) relate to arrangements in the UK and 32% (2017: 33%) relate to arrangements in the USA, while 87% (2017: 86%) of the Group’s unfunded healthcare arrangements relate to arrangements in the USA.
The amounts recognised in the income statement are as follows:
|
| |||||||||||||||||||||||||||
|
Pension schemes
|
Healthcare schemes
|
Total
|
||||||||||||||||||||||||||
|
2018 £m
|
2017 £m
|
2018 £m
|
2017 £m
|
2018 £m
|
2017 £m
|
|||||||||||||||||||||||
| Defined benefit schemes | ||||||||||||||||||||||||||||
| Service cost | ||||||||||||||||||||||||||||
| – current service cost | 95 | 104 | 2 | – | 97 | 104 | ||||||||||||||||||||||
| – past service cost/(credit), curtailments and settlements | – | 11 | (1 | ) | – | (1 | ) | 11 | ||||||||||||||||||||
| Net interest on the net defined benefit liability | ||||||||||||||||||||||||||||
| – interest on scheme liabilities | 364 | 291 | 33 | 19 | 397 | 310 | ||||||||||||||||||||||
| – interest on scheme assets | (362 | ) | (276 | ) | (8 | ) | (4 | ) | (370 | ) | (280 | ) | ||||||||||||||||
|
– interest on unrecognised funded scheme surpluses |
2 | 2 | – | – | 2 | 2 | ||||||||||||||||||||||
| 99 | 132 | 26 | 15 | 125 | 147 | |||||||||||||||||||||||
| Defined contribution schemes | 87 | 68 | – | – | 87 | 68 | ||||||||||||||||||||||
| Total amount recognised in the income statement (note 3(a)) | 186 | 200 | 26 | 15 | 212 | 215 | ||||||||||||||||||||||
The above charges are recognised within employee benefit costs in note 3(a) and include a charge of £3 million in 2018 (2017: £12 million charge) in respect of settlements, past service costs and defined contribution costs reported as part of the restructuring costs charged in arriving at profit from operations (note 3(e)). Included in current service costs in 2018 is £16 million (2017: £16 million) of administration costs.
| BAT Annual Report and Form 20-F 2018 | 157 | |
|
Financial Statements
|
||||||||||||||
| Notes on the Accounts continued | ||||||||||||||
12 Retirement benefit schemes continued
The movements in scheme liabilities are as follows:
|
Pension schemes
|
Healthcare schemes
|
Total
|
||||||||||||||||||||||||||
|
2018 £m
|
2017 £m
|
2018 £m
|
2017 £m
|
2018 £m
|
2017 £m
|
|||||||||||||||||||||||
| Present value at 1 January | 12,077 | 7,510 | 948 | 120 | 13,025 | 7,630 | ||||||||||||||||||||||
| Differences on exchange | 295 | (199 | ) | 43 | (35 | ) | 338 | (234 | ) | |||||||||||||||||||
| Current service cost | 95 | 105 | 2 | 2 | 97 | 107 | ||||||||||||||||||||||
| Past service cost/(credit) | – | 4 | – | – | – | 4 | ||||||||||||||||||||||
| Settlements | (10 | ) | 7 | (1 | ) | – | (11 | ) | 7 | |||||||||||||||||||
| Interest on scheme liabilities | 364 | 292 | 33 | 19 | 397 | 311 | ||||||||||||||||||||||
| Contributions by scheme members | 2 | 3 | – | – | 2 | 3 | ||||||||||||||||||||||
| Benefits paid | (694 | ) | (523 | ) | (62 | ) | (31 | ) | (756 | ) | (554 | ) | ||||||||||||||||
| Acquisition of subsidiaries | – | 5,211 | – | 882 | – | 6,093 | ||||||||||||||||||||||
| Actuarial (gains)/losses | ||||||||||||||||||||||||||||
| – arising from changes in demographic assumptions | (12 | ) | (418 | ) | (4 | ) | (8 | ) | (16 | ) | (426 | ) | ||||||||||||||||
| – arising from changes in financial assumptions | (547 | ) | 92 | (49 | ) | 9 | (596 | ) | 101 | |||||||||||||||||||
| Experience gains | (8 | ) | (7 | ) | (49 | ) | (10 | ) | (57 | ) | (17 | ) | ||||||||||||||||
| Present value at 31 December | 11,562 | 12,077 | 861 | 948 | 12,423 | 13,025 | ||||||||||||||||||||||
|
Changes in financial assumptions principally relate to discount rate movements in both years.
Scheme liabilities by scheme membership:
|
| |||||||||||||||||||||||||||
|
Pension schemes
|
Healthcare schemes
|
Total
|
||||||||||||||||||||||||||
|
2018 £m
|
2017 £m
|
2018 £m
|
2017 £m
|
2018 £m
|
2017 £m
|
|||||||||||||||||||||||
| Active members | 1,785 | 1,928 | 55 | 69 | 1,840 | 1,997 | ||||||||||||||||||||||
| Deferred members | 1,259 | 1,394 | 2 | 3 | 1,261 | 1,397 | ||||||||||||||||||||||
| Retired members | 8,518 | 8,755 | 804 | 876 | 9,322 | 9,631 | ||||||||||||||||||||||
| Present value at 31 December | 11,562 | 12,077 | 861 | 948 | 12,423 | 13,025 | ||||||||||||||||||||||
Approximately 95% of scheme liabilities in both years relate to guaranteed benefits.
| 158 | BAT Annual Report and Form 20-F 2018 | |
|
Strategic Report
|
Governance
|
Financial Statements
|
Other Information
|
12 Retirement benefit schemes continued
The movements in funded scheme assets are as follows:
|
Pension schemes
|
Healthcare schemes
|
Total
|
||||||||||||||||||||||||||
|
2018 £m
|
2017 £m
|
2018 £m
|
2017 £m |
2018 £m
|
2017 £m |
|||||||||||||||||||||||
| Fair value of scheme assets at 1 January | 12,157 | 7,264 | 193 | 14 | 12,350 | 7,278 | ||||||||||||||||||||||
| Differences on exchange | 262 | (170 | ) | 8 | (7 | ) | 270 | (177 | ) | |||||||||||||||||||
| Settlements | (10 | ) | (1 | ) | – | – | (10 | ) | (1 | ) | ||||||||||||||||||
| Interest on scheme assets | 362 | 277 | 8 | 4 | 370 | 281 | ||||||||||||||||||||||
| Company contributions | 176 | 232 | 45 | 22 | 221 | 254 | ||||||||||||||||||||||
| Contributions by scheme members | – | 4 | – | – | – | 4 | ||||||||||||||||||||||
| Benefits paid | (684 | ) | (509 | ) | (61 | ) | (25 | ) | (745 | ) | (534 | ) | ||||||||||||||||
| Acquisition of subsidiaries | – | 4,574 | – | 180 | – | 4,754 | ||||||||||||||||||||||
| Actuarial gains/(losses) | (516 | ) | 486 | (15 | ) | 5 | (531 | ) | 491 | |||||||||||||||||||
| Fair value of scheme assets at 31 December | 11,747 | 12,157 | 178 | 193 | 11,925 | 12,350 | ||||||||||||||||||||||
|
Pension schemes
|
Healthcare schemes
|
Total
|
||||||||||||||||||||||||||
|
2018 £m
|
2017 £m
|
2018 £m
|
2017 £m
|
2018 £m
|
2017 £m
|
|||||||||||||||||||||||
| Equities – listed | 1,133 | 2,444 | 5 | 6 | 1,138 | 2,450 | ||||||||||||||||||||||
| Equities – unlisted | 930 | 1,337 | 59 | 71 | 989 | 1,408 | ||||||||||||||||||||||
| Bonds – listed | 5,925 | 5,272 | 11 | 14 | 5,936 | 5,286 | ||||||||||||||||||||||
| Bonds – unlisted | 1,672 | 1,346 | 84 | 84 | 1,756 | 1,430 | ||||||||||||||||||||||
| Other assets – listed | 618 | 682 | 10 | 9 | 628 | 691 | ||||||||||||||||||||||
| Other assets – unlisted | 1,469 | 1,076 | 9 | 9 | 1,478 | 1,085 | ||||||||||||||||||||||
| Fair value of scheme assets at 31 December | 11,747 | 12,157 | 178 | 193 | 11,925 | 12,350 | ||||||||||||||||||||||
Scheme assets have been diversified into equities, bonds and other assets and are typically invested via fund investment managers into both pooled and segregated mandates of listed and unlisted equities and bonds.
In the USA, pension plan assets are invested using active investment strategies and multiple investment management firms. Managers within each asset class cover a range of investment styles and approaches. Allowable investment types include global equity, fixed income, real assets, private equity and absolute return. The range of allowable investment types utilised for pension assets provides enhanced returns and more widely diversifies the plan.
In addition, certain scheme assets, including a portion of the assets held in the main UK pension scheme, are further diversified by investing in equities listed on non-UK stock exchanges via investment funds. The main UK scheme also makes use of liability driven investment funds and inflation opportunity funds as part of its investment portfolio.
In the above analysis investments via equity-based investment funds are shown under listed equities, and investments via bond-based investment funds are shown under listed bonds. Other assets include cash and other deposits, derivatives and other hedges, recoverable taxes, reinsurance contracts, infrastructure investments and investment property.
The actuarial gains and losses in both years principally relate to movements in the fair values of scheme assets and actual returns are stated net of applicable taxes and fund management fees. The fair values of listed scheme assets were derived from observable data including quoted market prices and other market data, including market values of individual segregated investments and of pooled investment funds where quoted. The fair values of unlisted assets were derived from cash flow projections of estimated future income after taking into account the estimated recoverable value of these assets.
| BAT Annual Report and Form 20-F 2018 | 159 | |
|
Financial Statements
|
||||||||||||||
| Notes on the Accounts continued | ||||||||||||||
12 Retirement benefit schemes continued
The movements in the unrecognised scheme surpluses, recognised in other comprehensive income, are as follows:
|
Pension schemes
|
Healthcare schemes
|
Total
|
||||||||||||||||||||||||||||||||||||||
|
2018 £m
|
2017 £m
|
2016 £m
|
2018 £m
|
2017 £m
|
2016 £m
|
2018 £m
|
2017 £m
|
2016 £m
|
||||||||||||||||||||||||||||||||
| Unrecognised funded scheme surpluses at 1 January | (23 | ) | (18 | ) | (11 | ) | – | – | – | (23 | ) | (18 | ) | (11 | ) | |||||||||||||||||||||||||
| Differences on exchange | 1 | 3 | (4 | ) | – | – | – | 1 | 3 | (4 | ) | |||||||||||||||||||||||||||||
| Interest on unrecognised funded scheme surpluses | (2 | ) | (2 | ) | (2 | ) | – | – | – | (2 | ) | (2 | ) | (2 | ) | |||||||||||||||||||||||||
| Movement in year (note 19) | 4 | (6 | ) | (1 | ) | – | – | – | 4 | (6 | ) | (1 | ) | |||||||||||||||||||||||||||
| Unrecognised funded scheme surpluses at 31 December | (20 | ) | (23 | ) | (18 | ) | – | – | – | (20 | ) | (23 | ) | (18 | ) | |||||||||||||||||||||||||
The principal actuarial assumptions (weighted to reflect individual scheme differences) used in the following principal countries are shown below. In both years, discount rates are determined by reference to normal yields on high quality corporate bonds at the balance sheet date. For countries where there is not a deep market in such corporate bonds, the yield on government bonds is used.
|
2018
|
2017
|
|||||||||||||||||||||||||||||||||||||||||||||||||
| USA
|
UK
|
Germany
|
Canada
|
The Netherlands
|
Switzerland
|
USA
|
UK
|
Germany
|
Canada
|
The Netherlands
|
Switzerland
|
|||||||||||||||||||||||||||||||||||||||
| Rate of increase in salaries (%) | 3.9 | 3.2 | 1.7 | 3.0 | 2.1 | 1.3 | 3.9 | 3.2 | 2.5 | 3.0 | 2.0 | 1.3 | ||||||||||||||||||||||||||||||||||||||
| Rate of increase in pensions in payment (%) | 2.5 | 3.2 | 1.1 | Nil | 1.1 | Nil | 2.5 | 3.2 | 1.8 | Nil | 1.2 | Nil | ||||||||||||||||||||||||||||||||||||||
| Rate of increase in deferred pensions (%) | – | 2.2 | 1.1 | Nil | 1.1 | – | – | 2.2 | 1.8 | Nil | 1.2 | – | ||||||||||||||||||||||||||||||||||||||
| Discount rate (%) | 4.3 | 2.9 | 1.3 | 3.8 | 1.8 | 0.9 | 3.7 | 2.5 | 1.9 | 3.3 | 2.0 | 0.6 | ||||||||||||||||||||||||||||||||||||||
| General inflation (%) | 2.5 | 3.2 | 1.1 | 2.0 | 2.0 | 1.1 | 2.5 | 3.2 | 1.8 | 2.0 | 2.0 | 1.0 | ||||||||||||||||||||||||||||||||||||||
|
2018
|
2017
|
|||||||||||||||||||||||||||||||||||||||||||||||||
| USA
|
UK
|
Germany
|
Canada
|
The Netherlands
|
Switzerland
|
USA
|
UK
|
Germany
|
Canada
|
The Netherlands
|
Switzerland
|
|||||||||||||||||||||||||||||||||||||||
| Weighted average duration of liabilities (years) | 10.8 | 16.0 | 8.2 | 10.5 | 17.5 | 12.8 | 11.3 | 16.9 | 13.7 | 11.0 | 17.8 | 13.5 | ||||||||||||||||||||||||||||||||||||||
| 160 | BAT Annual Report and Form 20-F 2018 | |
|
Strategic Report
|
Governance
|
Financial Statements
|
Other Information
|
12 Retirement benefit schemes continued
For healthcare inflation in the USA, the assumption is 6.5% (2017: 7.0%) and in Canada, the assumption is 5.0% (2017: 5.0%).
Mortality assumptions are subject to regular review. The principal schemes used the following tables at year-end:
| USA | RP-2018 mortality tables without collar or amounts adjusted projected with MP-2018 generational projection (2017: RP-2017 and MP-2017)
| |
| UK | S2PA (YOB) with the CMI (2017) improvement model with a 1.25% long term improvement rate (2017: CMI (2016))
| |
| Germany | RT Heubeck 2018 G (2017: Heubeck 2005 G)
| |
| Canada | CPM-2014 Private Table (both years)
| |
| The Netherlands | AG Prognosetafel 2018 (2017: AG Prognosetafel 2016)
| |
| Switzerland | LPP/BVG 2015 base table with CMI projection factors for mortality improvements with a 1.5% long-term improvement rate (both years) |
Based on the above, the weighted average life expectancy, in years, for mortality tables used to determine benefit obligations is as follows:
| USA
|
UK
|
Germany
|
Canada
|
The Netherlands
|
Switzerland
|
|||||||||||||||||||||||||||||||||||||||||||||
|
Male
|
Female
|
Male
|
Female
|
Male
|
Female
|
Male
|
Female
|
Male
|
Female
|
Male
|
Female
|
|||||||||||||||||||||||||||||||||||||||
| 31 December 2018 | ||||||||||||||||||||||||||||||||||||||||||||||||||
| Member age 65 (current life expectancy) | 20.7 | 22.7 | 22.6 | 24.1 | 17.0 | 20.6 | 21.5 | 23.9 | 20.8 | 24.5 | 21.8 | 23.8 | ||||||||||||||||||||||||||||||||||||||
| Member age 45 (life expectancy at age 65) | 22.3 | 24.2 | 24.2 | 25.4 | 19.8 | 22.8 | 22.5 | 24.8 | 23.1 | 26.5 | 23.6 | 25.6 | ||||||||||||||||||||||||||||||||||||||
| 31 December 2017 | ||||||||||||||||||||||||||||||||||||||||||||||||||
| Member age 65 (current life expectancy) | 20.7 | 22.7 | 22.7 | 24.2 | 19.3 | 23.3 | 21.4 | 23.8 | 20.8 | 24.8 | 21.7 | 23.7 | ||||||||||||||||||||||||||||||||||||||
| Member age 45 (life expectancy at age 65) | 22.3 | 24.2 | 24.3 | 25.5 | 21.9 | 25.8 | 22.5 | 24.8 | 23.3 | 27.0 | 23.5 | 25.5 | ||||||||||||||||||||||||||||||||||||||
For the remaining territories, typical assumptions are that real salary increases will be from 0.5% to 6.3% (2017: 0.5% to 4.0%) per annum and discount rates will be from 0.6% to 7.6% (2017: 0.5% to 10.0%) above inflation. Pension increases, where allowed for, are generally assumed to be in line with inflation. Assumptions of life expectancy are in line with best practice in each territory.
The valuation of retirement benefit schemes involves judgements about uncertain future events. Sensitivities in respect of the key assumptions used to measure the principal pension schemes as at 31 December 2018 are set out below. These sensitivities show the hypothetical impact of a change in each of the listed assumptions in isolation, with the exception of the sensitivity to inflation which incorporates the impact of certain correlating assumptions such as salary increases. While each of these sensitivities holds all other assumptions constant, in practice such assumptions rarely change in isolation, while asset values also change, and the impacts may offset to some extent.
| 1
year
|
1
year
|
0.25
|
0.25
|
|||||||||||||
| Average life expectancy – increase/(decrease) of scheme liabilities
|
|
339
|
|
|
(340
|
)
|
||||||||||
| Rate of inflation – increase/(decrease) of scheme liabilities
|
|
169
|
|
|
(159
|
)
| ||||||||||
| Discount rate – (decrease)/increase of scheme liabilities
|
|
(267
|
)
|
|
286
|
| ||||||||||
A one percentage point increase in healthcare inflation would increase healthcare scheme liabilities by £42 million, and a one percentage point decrease would decrease liabilities by £36 million. The income statement effect of this change in assumption is not material.
| BAT Annual Report and Form 20-F 2018 | 161 | |
|
Financial Statements
|
||||||||||||||
| Notes on the Accounts continued | ||||||||||||||
13 Deferred tax
Net deferred tax assets/(liabilities) comprise:
|
Stock £m |
Excess of |
Tax |
Undistributed |
Retirement benefits £m |
Trademarks £m |
Other temporary differences £m |
Total £m |
|||||||||||||||||||||||||
| At 31 December 2017 | (91 | ) | (174 | ) | 113 | (241 | ) | 264 | (17,323 | ) | 656 | (16,796 | ) | |||||||||||||||||||
| Accounting policy change (IFRS 9) (note 31) | – | – | – | – | – | – | 7 | 7 | ||||||||||||||||||||||||
| At 1 January 2018 | (91 | ) | (174 | ) | 113 | (241 | ) | 264 | (17,323 | ) | 663 | (16,789 | ) | |||||||||||||||||||
| Differences on exchange | (7 | ) | (10 | ) | 4 | 6 | 15 | (1,066 | ) | 47 | (1,011 | ) | ||||||||||||||||||||
| Subsidiaries acquired (note 24) | – | – | – | – | – | (3 | ) | 4 | 1 | |||||||||||||||||||||||
| Credited/(charged) to the income statement | 27 | (16 | ) | (11 | ) | (46 | ) | (36 | ) | 67 | 319 | 304 | ||||||||||||||||||||
| Credited/(charged) relating to changes in tax rates | 1 | (10 | ) | (1 | ) | – | 4 | 79 | (3 | ) | 70 | |||||||||||||||||||||
| (Charged)/credited to other comprehensive income | – | – | – | – | (25 | ) | – | 18 | (7 | ) | ||||||||||||||||||||||
| At 31 December 2018 | (70 | ) | (210 | ) | 105 | (281 | ) | 222 | (18,246 | ) | 1,048 | (17,432 | ) | |||||||||||||||||||
| Revised | ||||||||||||||||||||||||||||||||
| At 1 January 2017 | 31 | (58 | ) | 89 | (392 | ) | 117 | (95 | ) | 92 | (216 | ) | ||||||||||||||||||||
| Differences on exchange | 2 | 15 | (6 | ) | 13 | (12 | ) | 862 | (22 | ) | 852 | |||||||||||||||||||||
| Subsidiaries acquired (note 24) | (375 | ) | (234 | ) | – | – | 514 | (28,091 | ) | 1,115 | (27,071 | ) | ||||||||||||||||||||
| Credited/(charged) to the income statement | 180 | 19 | 30 | 138 | 10 | 66 | (291 | ) | 152 | |||||||||||||||||||||||
| Credited/(charged) relating to changes in tax rates | 71 | 84 | – | – | (194 | ) | 9,935 | (276 | ) | 9,620 | ||||||||||||||||||||||
| (Charged)/credited to other comprehensive income | – | – | – | – | (171 | ) | – | 38 | (133 | ) | ||||||||||||||||||||||
| At 31 December 2017 | (91 | ) | (174 | ) | 113 | (241 | ) | 264 | (17,323 | ) | 656 | (16,796 | ) | |||||||||||||||||||
With effect from 1 January 2018, the Group has adopted IFRS 15 Revenue from Contracts with Customers. The Group has revised 2017, as explained in notes 1 and 31.
In 2017, as part of the acquisition of RAI, the Group had to account for the assets and liabilities of the RAI companies at fair market value at the acquisition date of 25 July 2017 (note 24). The increase in the net asset value versus the tax bases created net deferred tax liabilities, valued within the purchase price allocation process at the prevailing Federal and State corporation tax rate at the date of the acquisition. Subsequently on 22 December 2017, the Federal corporation tax rate was changed to 21% from 1 January 2018. This revised rate has been used to revalue the net deferred tax liabilities in the United States, reducing the liability leading to a credit in the income statement of £9,620 million.
The net deferred tax liabilities are reflected in the Group balance sheet as follows: deferred tax asset of £344 million and deferred tax liability of £17,776 million (2017: deferred tax asset of £333 million and deferred tax liability of £17,129 million), after offsetting assets and liabilities where there is a legally enforceable right to offset current tax assets and liabilities and where the deferred income taxes relate to the same fiscal authority.
At the balance sheet date, the Group has not recognised a deferred tax asset in respect of unused tax losses of £308 million (2017: £301 million) which have no expiry date and unused tax losses of £502 million (2017: £616 million) which will expire within the next 10 years.
At the balance sheet date, the Group has not recognised a deferred tax asset in respect of deductible temporary differences of £nil million (2017: £nil million), which have no expiry date and £184 million (2017: £140 million), which will expire within the next 10 years.
At the balance sheet date, the Group has unused tax credits of £80 million (2017: £80 million) which have no expiry date. No amount of deferred tax has been recognised in respect of these unused tax credits.
At the balance sheet date, the aggregate amount of undistributed earnings of subsidiaries which would be subject to dividend withholding tax and for which no withholding tax liability has been recognised was £0.7 billion (2017: £0.7 billion).
| 162 | BAT Annual Report and Form 20-F 2018 | |
|
Strategic Report
|
Governance
|
Financial Statements
|
Other Information
|
14 Trade and other receivables
|
2018
|
2017
|
|||||||
| Trade receivables | 2,868 | 3,306 | ||||||
| Loans and other receivables | 1,082 | 1,214 | ||||||
| Prepayments and accrued income | 323 | 289 | ||||||
| 4,273 | 4,809 | |||||||
| Current | 3,588 | 4,053 | ||||||
| Non-current | 685 | 756 | ||||||
| 4,273 | 4,809 | |||||||
In certain countries, the Group has entered into factoring arrangements and periodically sells certain trade receivables to banks and other financial institutions, without recourse, for cash. These trade receivables have been derecognised from the statement of financial position, because the Group has transferred substantially all of the risks and rewards of the receivables, including credit risk. The cash inflows have been recognised within operating cash flows. Typically in these arrangements, the Group also acts as a collection agent for the bank. At 31 December, the value of trade receivables derecognised through the factoring arrangements where the Group acts as a collection agent was £428 million and where the Group does not act as a collection agent was £40 million (2017: £139 million, £nil million respectively). Included in trade receivables above is £270 million (2017: £54 million) of trade debtor balances which were available for factoring under these arrangements.
Included in loans and other receivables are £553 million of litigation related deposits (2017: £603 million). The Group has determined that these payments are recoverable on conclusion of ongoing appeals and the deposits have not been discounted. Litigation related deposits include £436 million (2017: £449 million) in respect of payments made by a Group subsidiary in relation to the Quebec Class Action, as detailed in note 28. While there is uncertainty over the timeframe of the appeal process, it is estimated that had discounting been applied the carrying value of the asset would have been reduced by approximately £24 million (2017: £21 million). Amounts receivable from related parties including associated undertakings are shown in note 27.
Trade and other receivables have been reported in the balance sheet net of allowances as follows:
|
2018
|
2017
|
|||||||
| Trade receivables – gross | 2,898 | 3,345 | ||||||
| Trade receivables – allowance | (30 | ) | (39 | ) | ||||
| Loans and other receivables – gross | 1,092 | 1,260 | ||||||
| Loans and other receivables – allowance | (10 | ) | (46 | ) | ||||
| Prepayments and accrued income | 323 | 289 | ||||||
| Net trade and other receivables per balance sheet | 4,273 | 4,809 | ||||||
The movements in the allowance account are as follows:
|
Trade £m |
Loans and other 2018 £m |
Total £m |
Trade receivables £m |
Loans and other 2017 £m |
Total £m |
|||||||||||||||||||||
| 1 January | 39 | 46 | 85 | 87 | – | 87 | ||||||||||||||||||||
| Accounting policy change (IFRS 9) (notes 1 and 31) | 37 | 8 | 45 | – | – | – | ||||||||||||||||||||
| Revised 1 January | 76 | 54 | 130 | 87 | – | 87 | ||||||||||||||||||||
| Differences on exchange | 2 | – | 2 | 4 | – | 4 | ||||||||||||||||||||
| Provided in the year | 16 | 10 | 26 | – | 46 | 46 | ||||||||||||||||||||
| Released | (64 | ) | (54 | ) | (118 | ) | (52 | ) | – | (52 | ) | |||||||||||||||
| 31 December | 30 | 10 | 40 | 39 | 46 | 85 | ||||||||||||||||||||
As permitted by IFRS 9, the loss allowance on trade receivables arising from the recognition of revenue under IFRS 15 is initially measured at an amount equal to lifetime expected losses. Allowances in respect of loans and other receivables are initially recognised at an amount equal to 12-month expected credit losses. Allowances are measured at an amount equal to the lifetime expected credit losses where the credit risk on the receivables increases significantly after initial recognition.
Prior to the adoption of IFRS 9 on 1 January 2018, loans and receivables were stated net of allowances for estimated irrecoverable amounts due to the identification of a loss event (the incurred loss method).
The Group holds bank guarantees, other guarantees and credit insurance in respect of some of the past due debtor balances.
Trade and other receivables are predominantly denominated in the functional currencies of subsidiary undertakings apart from the following: US dollar: 3.5% (2017: 1.4%), UK sterling: 4.2% (2017: 4.3%), Euro: 1.6% (2017: 1.5%) and other currencies: 6.6% (2017: 9.6%).
| BAT Annual Report and Form 20-F 2018 | 163 | |
|
Financial Statements
|
Notes on the Accounts continued
14 Trade and other receivables continued
There is no material difference between the above amounts for trade and other receivables and their fair value due to the short-term duration of the majority of trade and other receivables as determined using discounted cash flow analysis. There is no concentration of credit risk with respect to trade receivables as the Group has a large number of internationally dispersed customers.
15 Investments held at fair value
|
Investments |
||||||||||||||||||||||||||
| Fair value through P&L |
Fair value through OCI |
Available-for- sale |
Total £m |
Available-for- £m |
||||||||||||||||||||||
| 31 December | 107 | 107 | 58 | |||||||||||||||||||||||
| Accounting policy change (IFRS 9) (note 31) | 237 | 16 | (107 | ) | 146 | – | ||||||||||||||||||||
| 1 January | 237 | 16 | – | 253 | 58 | |||||||||||||||||||||
| Differences on exchange | (53 | ) | – | – | (53 | ) | – | |||||||||||||||||||
| Additions | 278 | 4 | – | 282 | 90 | |||||||||||||||||||||
| Revaluations | 36 | – | – | 36 | (27 | ) | ||||||||||||||||||||
| Disposals | (285 | ) | (16 | ) | – | (301 | ) | (14 | ) | |||||||||||||||||
| 31 December | 213 | 4 | – | 217 | 107 | |||||||||||||||||||||
| Current | 178 | – | – | 178 | 65 | |||||||||||||||||||||
| Non-current | 35 | 4 | – | 39 | 42 | |||||||||||||||||||||
| 213 | 4 | – | 217 | 107 | ||||||||||||||||||||||
|
2018
|
2017
|
|||||||
| Functional currency | 212 | 107 | ||||||
| US dollar | – | – | ||||||
| Euro | – | – | ||||||
| Other currency | 5 | – | ||||||
| 217 | 107 | |||||||
The classification of these investments under the IFRS 13 fair value hierarchy is given in note 23.
There is no material difference between the maturity profile of investments in the table above and the maturity profile on a gross contractual basis where the values in each year include the investments maturing in that year together with forecast interest receipts on all investments which are due for all or part of that year.
Investments are all denominated in the functional currency of the subsidiary undertaking holding the investments.
Investments held at fair value through OCI relate to the Group’s strategic investments in China Materialia Fund II.
The Group’s investment in Landewyck Holdings s.a.r.l. was disposed of during the year.
| 164 | BAT Annual Report and Form 20-F 2018 | |
|
Strategic Report
|
Governance
|
Financial Statements
|
Other Information
|
16 Derivative financial instruments
The fair values of derivatives are determined based on market data (primarily yield curves, implied volatilities and exchange rates) to calculate the present value of all estimated flows associated with each derivative at the balance sheet date. In the absence of sufficient market data, fair values would be based on the quoted market price of similar derivatives. The classification of these derivative assets and liabilities under the IFRS 13 fair value hierarchy is given in note 23.
|
2018 |
2017 |
|||||||||||||||
|
Assets |
Liabilities |
Assets | Liabilities | |||||||||||||
| £m | £m | £m | £m | |||||||||||||
| Fair value hedges | ||||||||||||||||
| – interest rate swaps | 181 | 83 | 97 | 14 | ||||||||||||
| – cross-currency swaps | 282 | – | 263 | – | ||||||||||||
| Cash flow hedges | ||||||||||||||||
| – interest rate swaps | – | 98 | 1 | – | ||||||||||||
| – cross-currency swaps | 149 | 56 | 187 | – | ||||||||||||
| – forward foreign currency contracts | 61 | 42 | 82 | 73 | ||||||||||||
| Net investment hedges | ||||||||||||||||
| – forward foreign currency contracts | 10 | 174 | 85 | 39 | ||||||||||||
| Held-for-trading* | ||||||||||||||||
| – interest rate swaps | 6 | – | 68 | 77 | ||||||||||||
| – forward foreign currency contracts | 46 | 63 | 35 | 31 | ||||||||||||
| Total | 735 | 516 | 818 | 234 | ||||||||||||
| Current | 179 | 302 | 228 | 155 | ||||||||||||
| Non-current | 556 | 214 | 590 | 79 | ||||||||||||
| 735 | 516 | 818 | 234 | |||||||||||||
| Derivatives | ||||||||||||||||
| – in respect of net debt | 647 | 269 | 640 | 117 | ||||||||||||
| – other | 88 | 247 | 178 | 117 | ||||||||||||
| 735 | 516 | 818 | 234 | |||||||||||||
| * | Derivatives which do not meet the tests for hedge accounting under IFRS 9 (previously under IAS 39) or which are not designated as hedging instruments are referred to as “held-for-trading”. These derivatives principally consist of forward foreign currency contracts which have not been designated as hedges due to their value changes offsetting with other components of net finance costs relating to financial assets and financial liabilities. The Group do not use derivatives for speculative purposes. All derivatives are undertaken for risk management purposes. |
For cash flow hedges, the timing of expected cash flows is as follows: assets of £210 million (2017: £270 million) of which £59 million (2017: £73 million) is expected within one year and £149 million (2017: £165 million) beyond five years and liabilities of £196 million (2017: £73 million) of which £39 million (2017: £69 million) is expected within one year and £113 million (2017: £ nil) beyond five years.
The Group’s cash flow hedges are principally in respect of sales or purchases of inventory and certain debt instruments. A certain number of forward foreign currency contracts were used to manage the currency profile of external borrowings and are reflected in the currency table in note 20. Interest rate swaps have been used to manage the interest rate profile of external borrowings and are reflected in the re-pricing table in note 20.
| BAT Annual Report and Form 20-F 2018 | 165 | |
|
Financial Statements
|
Notes on the Accounts continued
16 Derivative financial instruments continued
The tables below set out the maturities of the Group’s derivative financial instruments on an undiscounted contractual basis, based on spot rates.
The maturity dates of all gross-settled derivative financial instruments are as follows:
| 2018
|
2017
|
|||||||||||||||||||||||||||||||||||||
| Assets | Liabilities
|
Assets
|
Liabilities
|
|||||||||||||||||||||||||||||||||||
| Inflow | Outflow | Inflow | Outflow | Inflow | Outflow | Inflow |
Outflow |
|||||||||||||||||||||||||||||||
| £m | £m | £m | £m | £m | £m | £m | £m | |||||||||||||||||||||||||||||||
| Within one year | ||||||||||||||||||||||||||||||||||||||
| – forward foreign currency contracts | 7,081 | (6,526 | ) | 9,876 | (9,749 | ) | 8,874 | (8,702 | ) | 5,929 | (6,059 | ) | ||||||||||||||||||||||||||
| – cross-currency swaps | 55 | (54 | ) | 33 | (92 | ) | 56 | (97 | ) | – | – | |||||||||||||||||||||||||||
| Between one and two years | ||||||||||||||||||||||||||||||||||||||
| – forward foreign currency contracts | 332 | (330 | ) | 449 | (441 | ) | 339 | (328 | ) | 229 | (230 | ) | ||||||||||||||||||||||||||
| – cross-currency swaps | 36 | (43 | ) | 20 | (73 | ) | 89 | (135 | ) | – | – | |||||||||||||||||||||||||||
| Between two and three years | ||||||||||||||||||||||||||||||||||||||
| – cross-currency swaps | 830 | (771 | ) | 1,008 | (1,075 | ) | 60 | (108 | ) | – | – | |||||||||||||||||||||||||||
| Between three and four years | ||||||||||||||||||||||||||||||||||||||
| – cross-currency swaps | 15 | (26 | ) | 17 | (38 | ) | 1,812 | (1,782 | ) | – | – | |||||||||||||||||||||||||||
| Between four and five years | ||||||||||||||||||||||||||||||||||||||
| – cross-currency swaps | 733 | (592 | ) | 690 | (730 | ) | 32 | (62 | ) | – | – | |||||||||||||||||||||||||||
| Beyond five years | ||||||||||||||||||||||||||||||||||||||
| – cross-currency swaps | 754 | (625 | ) | 469 | (490 | ) | 2,623 | (2,366 | ) | – | – | |||||||||||||||||||||||||||
| 9,836 | (8,967 | ) | 12,562 | (12,688 | ) | 13,885 | (13,580 | ) | 6,158 | (6,289 | ) | |||||||||||||||||||||||||||
The maturity dates of net-settled derivative financial instruments, which primarily relate to interest rate swaps, are as follows:
|
2018 |
|
2017 |
||||||||||||||||
|
Assets £m |
Liabilities £m |
Assets £m |
Liabilities £m |
|||||||||||||||
| Within one year | 53 | 40 | 44 | 18 | ||||||||||||||
| Between one and two years | 48 | 19 | 34 | 5 | ||||||||||||||
| Between two and three years | 45 | 15 | 28 | 6 | ||||||||||||||
| Between three and four years | 26 | 13 | 26 | 6 | ||||||||||||||
| Between four and five years | 23 | 15 | 12 | 7 | ||||||||||||||
| Beyond five years | 15 | 23 | 28 | 51 | ||||||||||||||
| 210 | 125 | 172 | 93 | |||||||||||||||
| 166 | BAT Annual Report and Form 20-F 2018 | |
|
Strategic Report
|
Governance
|
Financial Statements
|
Other Information
|
16 Derivative financial instruments continued
The items designated as hedging instruments are as follows:
| 2018 | ||||||||
| Nominal amount £m |
Changes in fair £m |
|||||||
| Interest rate risk exposure: | ||||||||
| Fair value hedges | ||||||||
| – interest rate swaps | 4,470 | 11 | ||||||
| – cross-currency swaps | 1,561 | 19 | ||||||
| Cash flow hedges | ||||||||
| – interest rate swaps | 2,715 | (98 | ) | |||||
| – cross-currency swaps | 2,856 | (91 | ) | |||||
| Foreign currency risk exposure: | ||||||||
| Cash flow hedges | ||||||||
| – forward foreign currency contracts | 3,574 | (4 | ) | |||||
| Net investment hedges (derivative related) | ||||||||
| – forward foreign currency contracts | 5,291 | (166 | ) | |||||
| Net investment hedges (non-derivative related) | ||||||||
| – debt (carrying value) in borrowings designated as net investment hedges of net assets | 4,647 | (226 | ) | |||||
| 17 Inventories | ||||||||
| 2018 £m |
2017 £m |
|||||||
| Raw materials and consumables | 3,049 | 3,027 | ||||||
| Finished goods and work in progress | 2,877 | 2,692 | ||||||
| Goods purchased for resale | 103 | 145 | ||||||
| 6,029 | 5,864 | |||||||
Inventories pledged as security for liabilities amount to £7 million (2017: £7 million). Write-offs taken to other operating expenses in the Group income statement comprise £148 million (2017: £114 million; 2016: £127 million), including amounts relating to restructuring costs. Goods purchased for resale include Group brands produced under third party contract manufacturing arrangements.
| BAT Annual Report and Form 20-F 2018 | 167 | |
|
Financial Statements
|
Notes on the Accounts continued
| 18 Cash and cash equivalents | ||||||||
| 2018 £m |
2017 £m |
|||||||
| Cash and bank balances | 2,069 | 1,967 | ||||||
| Cash equivalents | 533 | 1,324 | ||||||
| 2,602 | 3,291 | |||||||
The carrying value of cash and cash equivalents approximates their fair value.
Cash and cash equivalents are denominated in the functional currency of the subsidiary undertaking or other currencies as shown below:
| 2018 £m |
2017 £m |
|||||||
| Functional currency | 2,144 | 2,842 | ||||||
| US dollar | 158 | 161 | ||||||
| Euro | 174 | 159 | ||||||
| Other currency | 126 | 129 | ||||||
| 2,602 | 3,291 | |||||||
In the Group cash flow statement, net cash and cash equivalents are shown after deducting bank overdrafts and accrued interest where applicable, as follows:
| 2018 £m |
2017 £m |
|||||||
| Cash and cash equivalents as above | 2,602 | 3,291 | ||||||
| Less overdrafts and accrued interest | (274 | ) | (469 | ) | ||||
| Net cash and cash equivalents | 2,328 | 2,822 | ||||||
Cash and cash equivalents include restricted amounts of £170 million (2017: £160 million), principally due to exchange control regulations in certain countries.
Cash and cash equivalents also include £125 million (2017: £12 million) of cash that is held as a hedging instrument.
| 168 | BAT Annual Report and Form 20-F 2018 | |
|
Strategic Report
|
Governance
|
Financial Statements
|
Other Information
|
19 Capital and reserves – reconciliation of movement in total equity
| Attributable to owners of the parent
|
||||||||||||||||||||||||||||
| Share capital £m |
Share premium, capital redemption and merger reserves £m |
Other reserves £m |
Retained earnings £m |
Total to owners of the parent |
Non- controlling interests £m |
Total £m |
||||||||||||||||||||||
| 31 December 2017 | 614 | 26,602 | (3,392 | ) | 36,935 | 60,759 | 222 | 60,981 | ||||||||||||||||||||
| Accounting policy change (IFRS 9) (note 31) | – | – | (9 | ) | (29 | ) | (38 | ) | – | (38 | ) | |||||||||||||||||
| Revised 1 January 2018 | 614 | 26,602 | (3,401 | ) | 36,906 | 60,721 | 222 | 60,943 | ||||||||||||||||||||
| Comprehensive income and expense | ||||||||||||||||||||||||||||
| Profit for the year | – | – | – | 6,032 | 6,032 | 178 | 6,210 | |||||||||||||||||||||
| Differences on exchange | – | – | 3,861 | – | 3,861 | 7 | 3,868 | |||||||||||||||||||||
| Cash flow hedges | ||||||||||||||||||||||||||||
| – net fair value losses | – | – | (58 | ) | – | (58 | ) | – | (58 | ) | ||||||||||||||||||
| – reclassified and reported in profit for the year | – | – | 17 | – | 17 | – | 17 | |||||||||||||||||||||
| Investments held at fair value | ||||||||||||||||||||||||||||
| – reclassified and reported in retained earnings | – | – | (8 | ) | 8 | – | – | – | ||||||||||||||||||||
| Net investment hedges | ||||||||||||||||||||||||||||
| – net fair value losses | – | – | (472 | ) | – | (472 | ) | – | (472 | ) | ||||||||||||||||||
| – differences on exchange on borrowings | – | – | (236 | ) | – | (236 | ) | – | (236 | ) | ||||||||||||||||||
| Associates – share of OCI, net of tax (note 5) | – | – | (38 | ) | – | (38 | ) | – | (38 | ) | ||||||||||||||||||
| Tax on items recognised directly in other comprehensive income that may be reclassified subsequently to profit or loss (note 6(f)) | – | – | 18 | – | 18 | – | 18 | |||||||||||||||||||||
| Retirement benefit schemes | ||||||||||||||||||||||||||||
| – net actuarial gains (note 12) | – | – | – | 138 | 138 | – | 138 | |||||||||||||||||||||
| – surplus recognition and minimum funding obligations (note 12) | – | – | – | 4 | 4 | – | 4 | |||||||||||||||||||||
| Associates – share of OCI, net of tax (note 5) | – | – | 6 | – | 6 | – | 6 | |||||||||||||||||||||
| Tax on items recognised directly in other comprehensive income that will not be reclassified subsequently to profit or loss (note 6(f)) | – | – | – | (33 | ) | (33 | ) | – | (33 | ) | ||||||||||||||||||
| Cash flow hedges reclassified and reported in total assets | – | – | (22 | ) | – | (22 | ) | – | (22 | ) | ||||||||||||||||||
| Other changes in equity | ||||||||||||||||||||||||||||
| Employee share options | ||||||||||||||||||||||||||||
| – value of employee services | – | – | – | 121 | 121 | – | 121 | |||||||||||||||||||||
| – proceeds from shares issued | – | 4 | – | – | 4 | – | 4 | |||||||||||||||||||||
| Dividends and other appropriations | ||||||||||||||||||||||||||||
| – ordinary shares (note 8) | – | – | – | (4,463 | ) | (4,463 | ) | – | (4,463 | ) | ||||||||||||||||||
| – to non-controlling interests | – | – | – | – | – | (163 | ) | (163 | ) | |||||||||||||||||||
| Purchase of own shares | ||||||||||||||||||||||||||||
| – held in employee share ownership trusts | – | – | – | (139 | ) | (139 | ) | – | (139 | ) | ||||||||||||||||||
| Non-controlling interests – acquisitions (note 24(c)) | – | – | – | (11 | ) | (11 | ) | – | (11 | ) | ||||||||||||||||||
| Other movements | – | – | – | (6 | ) | (6 | ) | – | (6 | ) | ||||||||||||||||||
| 31 December 2018 | 614 | 26,606 | (333 | ) | 38,557 | 65,444 | 244 | 65,688 | ||||||||||||||||||||
| BAT Annual Report and Form 20-F 2018 | 169 | |
|
Financial Statements
|
Notes on the Accounts continued
19 Capital and reserves – reconciliation of movement in total equity continued
| Attributable to owners of the parent
|
||||||||||||||||||||||||||
| Revised | Share capital £m |
Share premium, capital redemption and merger reserves £m |
Other reserves £m |
Retained earnings £m |
Total to owners of the parent |
Non- controlling interests £m |
Total equity £m |
|||||||||||||||||||
| 1 January 2017 | 507 | 3,931 | 413 | 3,331 | 8,182 | 224 | 8,406 | |||||||||||||||||||
| Comprehensive income and expense | ||||||||||||||||||||||||||
| Profit for the year | – | – | – | 37,485 | 37,485 | 171 | 37,656 | |||||||||||||||||||
| Differences on exchange | – | – | (3,082 | ) | – | (3,082 | ) | (2 | ) | (3,084 | ) | |||||||||||||||
| Cash flow hedges | ||||||||||||||||||||||||||
| – net fair value losses | – | – | (263 | ) | – | (263 | ) | (1 | ) | (264 | ) | |||||||||||||||
| – reclassified and reported in profit for the year | – | – | 109 | – | 109 | – | 109 | |||||||||||||||||||
| – reclassified and reported in total assets | – | – | (16 | ) | – | (16 | ) | – | (16 | ) | ||||||||||||||||
| Investments held at fair value | ||||||||||||||||||||||||||
| – net fair value losses | – | – | (27 | ) | – | (27 | ) | – | (27 | ) | ||||||||||||||||
| Net investment hedges | ||||||||||||||||||||||||||
| – net fair value gains | – | – | 425 | – | 425 | – | 425 | |||||||||||||||||||
| – differences on exchange on borrowings | – | – | (67 | ) | – | (67 | ) | (1 | ) | (68 | ) | |||||||||||||||
| Associates – share of OCI, net of tax (note 5) | – | – | (918 | ) | – | (918 | ) | – | (918 | ) | ||||||||||||||||
| Tax on items recognised directly in other comprehensive income that may be reclassified subsequently to profit or loss (note 6(f)) | – | – | 34 | – | 34 | – | 34 | |||||||||||||||||||
| Retirement benefit schemes | – | – | ||||||||||||||||||||||||
| – net actuarial gains (note 12) | – | – | – | 832 | 832 | 1 | 833 | |||||||||||||||||||
| – surplus recognition and minimum funding obligations (note 12) | – | – | – | (5 | ) | (5 | ) | (1 | ) | (6 | ) | |||||||||||||||
| Associates – share of OCI, net of tax (note 5) | – | – | – | 25 | 25 | – | 25 | |||||||||||||||||||
| Tax on items recognised directly in other comprehensive income that will not be reclassified subsequently to profit or loss (note 6(f)) | – | – | – | (171 | ) | (171 | ) | – | (171 | ) | ||||||||||||||||
| Other changes in equity | ||||||||||||||||||||||||||
| Employee share options | ||||||||||||||||||||||||||
| – value of employee services | – | – | – | 105 | 105 | – | 105 | |||||||||||||||||||
| – proceeds from shares issued | – | 5 | – | – | 5 | – | 5 | |||||||||||||||||||
| Dividends and other appropriations | ||||||||||||||||||||||||||
| – ordinary shares | – | – | – | (4,465 | ) | (4,465 | ) | – | (4,465 | ) | ||||||||||||||||
| – to non-controlling interests | – | – | – | – | – | (169 | ) | (169 | ) | |||||||||||||||||
| Purchase of own shares | ||||||||||||||||||||||||||
| – held in employee share ownership trusts | – | – | – | (205 | ) | (205 | ) | – | (205 | ) | ||||||||||||||||
| Shares issued – RAI acquisition (note 24(a)) | 107 | 22,666 | – | – | 22,773 | – | 22,773 | |||||||||||||||||||
| Other movements | – | – | – | 3 | 3 | – | 3 | |||||||||||||||||||
| 31 December 2017 | 614 | 26,602 | (3,392 | ) | 36,935 | 60,759 | 222 | 60,981 | ||||||||||||||||||
With effect from 1 January 2018, the Group has adopted IFRS 15 Revenue from Contracts with Customers. The Group has revised 2017, as explained in notes 1 and 31.
Differences on exchange in respect of associates of £923 million, net fair value gains in respect of associates of £5 million and actuarial gains in respect of associates of £25 million have been reclassified to associates – share of OCI, net of tax.
| 170 | BAT Annual Report and Form 20-F 2018 | |
|
Strategic Report
|
Governance
|
Financial Statements
|
Other Information
|
19 Capital and reserves – reconciliation of movement in total equity continued
|
Attributable to owners of the parent |
||||||||||||||||||||||||||||
| Share capital £m |
Share premium, capital redemption and merger reserves £m |
Other reserves £m |
Retained earnings £m |
Total attributable to owners of the parent £m |
Non- controlling interests £m |
Total equity £m |
||||||||||||||||||||||
|
1 January 2016 |
|
507 |
|
|
3,927 |
|
|
(1,294 |
) |
|
1,754 |
|
|
4,894 |
|
|
138 |
|
|
5,032 |
| |||||||
| Comprehensive income and expense | ||||||||||||||||||||||||||||
| Profit for the year | – | – | – | 4,648 | 4,648 | 191 | 4,839 | |||||||||||||||||||||
| Differences on exchange | – | – | 1,218 | – | 1,218 | 52 | 1,270 | |||||||||||||||||||||
| Cash flow hedges | ||||||||||||||||||||||||||||
| – net fair value gains | – | – | 28 | – | 28 | 1 | 29 | |||||||||||||||||||||
| – reclassified and reported in profit for the year | – | – | 38 | – | 38 | – | 38 | |||||||||||||||||||||
| – reclassified and reported in total assets | – | – | (12 | ) | – | (12 | ) | – | (12 | ) | ||||||||||||||||||
| Net investment hedges | ||||||||||||||||||||||||||||
| – net fair value losses | – | – | (837 | ) | – | (837 | ) | – | (837 | ) | ||||||||||||||||||
| – differences on exchange on borrowings | – | – | (124 | ) | – | (124 | ) | – | (124 | ) | ||||||||||||||||||
| Associates – share of OCI, net of tax (note 5) | – | – | 1,415 | – | 1,415 | – | 1,415 | |||||||||||||||||||||
| Tax on items recognised directly in other comprehensive income that may be reclassified subsequently to profit or loss (note 6(f)) | – | – | (19 | ) | – | (19 | ) | – | (19 | ) | ||||||||||||||||||
| Retirement benefit schemes | ||||||||||||||||||||||||||||
| – net actuarial losses | – | – | – | (231 | ) | (231 | ) | 3 | (228 | ) | ||||||||||||||||||
| – surplus recognition and minimum funding obligations (note 12) | – | – | – | – | – | (1 | ) | (1 | ) | |||||||||||||||||||
| Associates – share of OCI, net of tax (note 5) | – | – | – | 20 | 20 | – | 20 | |||||||||||||||||||||
| Tax on items recognised directly in other comprehensive income that will not be reclassified subsequently to profit or loss (note 6(f)) | – | – | – | 36 | 36 | – | 36 | |||||||||||||||||||||
| Other changes in equity | ||||||||||||||||||||||||||||
| Employee share options | ||||||||||||||||||||||||||||
| – value of employee services | – | – | – | 71 | 71 | – | 71 | |||||||||||||||||||||
| – proceeds from shares issued | – | 4 | – | – | 4 | – | 4 | |||||||||||||||||||||
| Dividends and other appropriations | ||||||||||||||||||||||||||||
| – ordinary shares | – | – | – | (2,910 | ) | (2,910 | ) | – | (2,910 | ) | ||||||||||||||||||
| – to non-controlling interests | – | – | – | – | – | (156 | ) | (156 | ) | |||||||||||||||||||
| Purchase of own shares | ||||||||||||||||||||||||||||
| – held in employee share ownership trusts | – | – | – | (64 | ) | (64 | ) | – | (64 | ) | ||||||||||||||||||
| Non-controlling interests – acquisitions (note 24(c)) | – | – | – | 4 | 4 | (4 | ) | – | ||||||||||||||||||||
| Other movements
|
|
–
|
|
|
–
|
|
|
–
|
|
|
3
|
|
|
3
|
|
|
–
|
|
|
3
|
| |||||||
|
31 December 2016
|
|
507
|
|
|
3,931
|
|
|
413
|
|
|
3,331
|
|
|
8,182
|
|
|
224
|
|
|
8,406
|
| |||||||
Differences on exchange in respect of associates of £1,425 million, net fair value losses in respect of associates of £10 million and actuarial gains in respect of associates of £20 million have been reclassified to associates – share of OCI, net of tax.
| BAT Annual Report and Form 20-F 2018 | 171 | |
| Financial Statements
|
Notes on the Accounts continued
19 Capital and reserves – reconciliation of movement in total equity continued
(a) Share premium account, capital redemption reserves and merger reserves comprise:
|
Share |
Capital redemption reserves £m |
Merger reserves £m |
Total £m |
|||||||||||||
| 31 December 2018 | 91 | 101 | 26,414 | 26,606 | ||||||||||||
|
31 December 2017 |
|
87 |
|
|
101 |
|
|
26,414 |
|
|
26,602 |
| ||||
| 31 December 2016 | 82 | 101 | 3,748 | 3,931 | ||||||||||||
The share premium account includes the difference between the value of shares issued and their nominal value. The increase of £4 million (2017: £5 million; 2016: £4 million) relates solely to ordinary shares issued under the Company’s share option schemes.
On the purchase of own shares as part of the share buy-back programme for shares which are cancelled, a transfer is made from retained earnings to the capital redemption reserve equivalent to the nominal value of shares purchased. Purchased shares which are not cancelled are classified as treasury shares and presented as a deduction from total equity.
In 1999, shares were issued for the acquisition of the Rothmans International B.V. Group, and the difference between the fair value of shares issued and their nominal value of £3,748 million was credited to merger reserves.
On 25 July 2017, the Group announced the completion of the acquisition of the remaining 57.8% of RAI not already owned by the Group. Shares were issued for the acquisition and the difference between the fair value of shares issued and their nominal value of £22,666 million was credited to merger reserves.
Total equity attributable to owners of the parent is stated after deducting the cost of treasury shares which include £4,845 million
(2017: £4,845 million; 2016: £4,845 million) for shares repurchased and not cancelled and £397 million (2017: £350 million; 2016 £208 million) in respect of the cost of own shares held in employee share ownership trusts.
The share buy-back programme was suspended from 30 July 2014. As at 31 December 2018, treasury shares include 7,536,408
(2017: 6,750,597; 2016: 5,137,602) of shares held in trust and 162,645,590 (2017: 162,645,590; 2016: 162,645,590) of shares repurchased and not cancelled as part of the Company’s share buy-back programme.
Other movements in shareholders’ funds principally relate to the release of treasury shares as a result of the exercise of share options.
| Called up share capital
|
Ordinary shares of 25p each
|
£m
|
||||||
|
Allotted and fully paid |
||||||||
| 1 January 2018 | 2,456,278,414 | 614.06 | ||||||
| Changes during the year | ||||||||
| – share option schemes | 137,470 | 0.03 | ||||||
|
31 December 2018
|
|
2,456,415,884
|
|
|
614.09
|
| ||
| Allotted and fully paid 1 January 2017 |
2,027,019,508 | 506.75 | ||||||
| Changes during the year | ||||||||
| – share option schemes | 213,144 | 0.05 | ||||||
| – Issue of shares RAI acquisition | 429,045,762 | 107.26 | ||||||
| 31 December 2017 | 2,456,278,414 | 614.06 | ||||||
| Allotted and fully paid 1 January 2016 |
2,026,866,724 | 506.71 | ||||||
| Changes during the year | ||||||||
| – share option schemes | 152,784 | 0.04 | ||||||
| 31 December 2016 | 2,027,019,508 | 506.75 | ||||||
(b) Information on the principal components of non-controlling interests is provided in note 29.
| 172 | BAT Annual Report and Form 20-F 2018 | |
|
Strategic Report
|
Governance
|
Financial Statements
|
Other Information
|
19 Capital and reserves – reconciliation of movement in total equity continued
Movements in other reserves and retained earnings (which are after deducting treasury shares) shown above comprise:
|
Retained earnings |
||||||||||||||||||||||||||||||||
| Translation reserve £m |
Hedging reserve £m |
Fair value reserve £m |
Revaluation reserve £m |
Other £m |
Total other reserves £m |
Treasury shares £m |
Other £m |
|||||||||||||||||||||||||
|
31 December 2017 |
(4,029 | ) | (132 | ) | 17 | 179 | 573 | (3,392 | ) | (5,195 | ) | 42,130 | ||||||||||||||||||||
| Accounting policy change (IFRS 9) (note 31) | – | – | (9 | ) | – | – | (9 | ) | – | (29 | ) | |||||||||||||||||||||
| 1 January 2018 | (4,029 | ) | (132 | ) | 8 | 179 | 573 | (3,401 | ) | (5,195 | ) | 42,101 | ||||||||||||||||||||
| Comprehensive income and expense | ||||||||||||||||||||||||||||||||
| Profit for the year | – | – | – | – | – | – | – | 6,032 | ||||||||||||||||||||||||
| Differences on exchange | 3,861 | – | – | – | – | 3,861 | – | – | ||||||||||||||||||||||||
| Cash flow hedges | ||||||||||||||||||||||||||||||||
| – net fair value losses | – | (58 | ) | – | – | – | (58 | ) | – | – | ||||||||||||||||||||||
| – reclassified and reported in profit for the year | – | 17 | – | – | – | 17 | – | – | ||||||||||||||||||||||||
| Investments held at fair value | ||||||||||||||||||||||||||||||||
| – reclassified and reported in retained earnings | – | – | (8 | ) | – | – | (8 | ) | – | 8 | ||||||||||||||||||||||
| Net investment hedges | ||||||||||||||||||||||||||||||||
| – net fair value losses | (472 | ) | – | – | – | – | (472 | ) | – | – | ||||||||||||||||||||||
| – differences on exchange on borrowings | (236 | ) | – | – | – | – | (236 | ) | – | – | ||||||||||||||||||||||
| Associates – share of OCI, net of tax (note 5) | (38 | ) | – | – | – | – | (38 | ) | – | – | ||||||||||||||||||||||
| Tax on items recognised directly in other comprehensive income that may be reclassified subsequently to profit or loss (note 6(f)) | – | 18 | – | – | – | 18 | – | – | ||||||||||||||||||||||||
| Retirement benefit schemes | ||||||||||||||||||||||||||||||||
| – net actuarial gains (note 12) | – | – | – | – | – | – | – | 138 | ||||||||||||||||||||||||
| – surplus recognition and minimum funding obligations (note 12) | – | – | – | – | – | – | – | 4 | ||||||||||||||||||||||||
| Associates – share of OCI, net of tax (note 5) | – | – | 6 | – | – | 6 | – | – | ||||||||||||||||||||||||
| Tax on items recognised directly in other comprehensive income that will not be reclassified subsequently to profit or loss (note 6(f)) | – | – | – | – | – | – | – | (33 | ) | |||||||||||||||||||||||
| Cash flow hedges reclassified and reported in total assets | – | (22 | ) | – | – | – | (22 | ) | – | – | ||||||||||||||||||||||
| Other changes in equity | ||||||||||||||||||||||||||||||||
| Employee share options | ||||||||||||||||||||||||||||||||
| – value of employee services | – | – | – | – | – | – | – | 121 | ||||||||||||||||||||||||
| Dividends and other appropriations | ||||||||||||||||||||||||||||||||
| – ordinary shares (note 8) | – | – | – | – | – | – | – | (4,463 | ) | |||||||||||||||||||||||
| Purchase of own shares | ||||||||||||||||||||||||||||||||
| – held in employee share ownership trusts | – | – | – | – | – | – | (139 | ) | – | |||||||||||||||||||||||
| Non-controlling interests – acquisitions (note 24(c)) | – | – | – | – | – | – | – | (11 | ) | |||||||||||||||||||||||
| Other movements
|
– | – | – | – | – | – | 92 | (98 | ) | |||||||||||||||||||||||
|
31 December 2018 |
|
(914 |
) |
|
(177 |
) |
|
6 |
|
|
179 |
|
|
573 |
|
|
(333 |
) |
|
(5,242 |
) |
|
43,799 |
| ||||||||
With effect from 1 January 2018, the Group has adopted IFRS 15 Revenue from Contracts with Customers. The Group has revised 2017, as explained in notes 1 and 31.
In 2018, within the translation reserve differences on exchange, a gain of £107 million has been recognised in relation to the application of hyperinflationary accounting in Venezuela as explained in note 3 (h).
| BAT Annual Report and Form 20-F 2018 | 173 | |
|
Financial Statements
|
Notes on the Accounts continued
19 Capital and reserves – reconciliation of movement in total equity continued
|
Retained earnings
|
||||||||||||||||||||||||||||||||
| Revised
|
Translation
|
Hedging £m
|
Available-
|
Revaluation £m
|
Other
|
Total other
|
Treasury £m
|
Other
|
||||||||||||||||||||||||
| 1 January 2017 | (382 | ) | 4 | 39 | 179 | 573 | 413 | (5,053 | ) | 8,384 | ||||||||||||||||||||||
| Comprehensive income and expense | ||||||||||||||||||||||||||||||||
| Profit for the year | – | – | – | – | – | – | – | 37,485 | ||||||||||||||||||||||||
| Differences on exchange | (3,082 | ) | – | – | – | – | (3,082 | ) | – | – | ||||||||||||||||||||||
| Cash flow hedges | ||||||||||||||||||||||||||||||||
| – net fair value losses | – | (263 | ) | – | – | – | (263 | ) | – | – | ||||||||||||||||||||||
| – reclassified and reported in profit for the year | – | 109 | – | – | – | 109 | – | – | ||||||||||||||||||||||||
| – reclassified and reported in total assets | – | (16 | ) | – | – | – | (16 | ) | – | – | ||||||||||||||||||||||
| Investments held at fair value | ||||||||||||||||||||||||||||||||
| – net fair value losses | – | – | (27 | ) | – | – | (27 | ) | – | – | ||||||||||||||||||||||
| Net investment hedges | ||||||||||||||||||||||||||||||||
| – net fair value gains | 425 | – | – | – | – | 425 | – | – | ||||||||||||||||||||||||
| – differences on exchange on borrowings | (67 | ) | – | – | – | – | (67 | ) | – | – | ||||||||||||||||||||||
| Associates – share of OCI, net of tax (note 5) | (923 | ) | – | 5 | – | – | (918 | ) | – | – | ||||||||||||||||||||||
| Tax on items recognised directly in other comprehensive income that may be reclassified subsequently to profit or loss (note 6(f)) | – | 34 | – | – | – | 34 | – | – | ||||||||||||||||||||||||
| Retirement benefit schemes | ||||||||||||||||||||||||||||||||
| – net actuarial gains (note 12) | – | – | – | – | – | – | – | 832 | ||||||||||||||||||||||||
| – surplus recognition and minimum funding obligations (note 12) | – | – | – | – | – | – | – | (5 | ) | |||||||||||||||||||||||
| Associates – share of OCI, net of tax (note 5) | – | – | – | – | – | – | – | 25 | ||||||||||||||||||||||||
| Tax on items recognised directly in other comprehensive income that will not be reclassified subsequently to profit or loss (note 6(f)) |
– | – | – | – | – | – | – | (171 | ) | |||||||||||||||||||||||
| Other changes in equity | ||||||||||||||||||||||||||||||||
| Employee share options | ||||||||||||||||||||||||||||||||
| – value of employee services | – | – | – | – | – | – | – | 105 | ||||||||||||||||||||||||
| Dividends and other appropriations | ||||||||||||||||||||||||||||||||
| – ordinary shares | – | – | – | – | – | – | – | (4,465 | ) | |||||||||||||||||||||||
| Purchase of own shares | ||||||||||||||||||||||||||||||||
| – held in employee share ownership trusts | – | – | – | – | – | – | (205 | ) | 0 | |||||||||||||||||||||||
| Other movements | – | – | – | – | – | – | 63 | (60 | ) | |||||||||||||||||||||||
| 31 December 2017 | (4,029 | ) | (132 | ) | 17 | 179 | 573 | (3,392 | ) | (5,195 | ) | 42,130 | ||||||||||||||||||||
| 174 | BAT Annual Report and Form 20-F 2018 | |
|
Strategic Report
|
Governance
|
Financial Statements
|
Other Information
|
19 Capital and reserves – reconciliation of movement in total equity continued
|
Retained earnings
|
||||||||||||||||||||||||||||||||
| Translation
|
Hedging
|
Available-
|
Revaluation £m
|
Other
|
Total other
|
Treasury £m
|
Other
|
|||||||||||||||||||||||||
| 1 January 2016 | (2,062 | ) | (33 | ) | 49 | 179 | 573 | (1,294 | ) | (5,049 | ) | 6,803 | ||||||||||||||||||||
| Comprehensive income and expense | ||||||||||||||||||||||||||||||||
| Profit for the year | – | – | – | – | – | – | – | 4,648 | ||||||||||||||||||||||||
| Differences on exchange | 1,218 | – | – | – | – | 1,218 | – | – | ||||||||||||||||||||||||
| Cash flow hedges | ||||||||||||||||||||||||||||||||
| – net fair value gains | – | 28 | – | – | – | 28 | – | – | ||||||||||||||||||||||||
| – reclassified and reported in profit for the year | – | 38 | – | – | – | 38 | – | – | ||||||||||||||||||||||||
| – reclassified and reported in total assets | – | (12 | ) | – | – | – | (12 | ) | – | – | ||||||||||||||||||||||
| Net investment hedges | ||||||||||||||||||||||||||||||||
| – net fair value losses | (837 | ) | – | – | – | – | (837 | ) | – | – | ||||||||||||||||||||||
| – differences on exchange on borrowings | (124 | ) | – | – | – | – | (124 | ) | – | – | ||||||||||||||||||||||
| Associates – share of OCI, net of tax (note 5) | 1,425 | – | (10 | ) | – | – | 1,415 | – | – | |||||||||||||||||||||||
| Tax on items recognised directly in other comprehensive income that may be reclassified subsequently to profit or loss (note 6(f)) | (2 | ) | (17 | ) | – | – | – | (19 | ) | – | – | |||||||||||||||||||||
| Retirement benefit schemes | ||||||||||||||||||||||||||||||||
| – net actuarial losses | – | – | – | – | – | – | – | (231 | ) | |||||||||||||||||||||||
| Associates – share of OCI, net of tax (note 5) | – | – | – | – | – | – | – | 20 | ||||||||||||||||||||||||
| Tax on items recognised directly in other comprehensive income that will not be reclassified subsequently to profit or loss (note 6(f)) | – | – | – | – | – | – | – | 36 | ||||||||||||||||||||||||
| Other changes in equity | ||||||||||||||||||||||||||||||||
| Employee share options | ||||||||||||||||||||||||||||||||
| – value of employee services | – | – | – | – | – | – | – | 71 | ||||||||||||||||||||||||
| Dividends and other appropriations | ||||||||||||||||||||||||||||||||
| – ordinary shares | – | – | – | – | – | – | – | (2,910 | ) | |||||||||||||||||||||||
| Purchase of own shares | ||||||||||||||||||||||||||||||||
| – held in employee share ownership trusts | – | – | – | – | – | – | (64 | ) | – | |||||||||||||||||||||||
| Non-controlling interests – acquisitions (note 24(c)) | – | – | – | – | – | – | – | 4 | ||||||||||||||||||||||||
| Other movements | – | – | – | – | – | – | 60 | (57 | ) | |||||||||||||||||||||||
| 31 December 2016 | (382 | ) | 4 | 39 | 179 | 573 | 413 | (5,053 | ) | 8,384 | ||||||||||||||||||||||
The translation reserve (applicable to 2017 and 2016) and the fair value reserve is explained in the accounting policy on foreign currencies in note 1. The hedging reserve and the available-for-sale reserve are explained in the accounting policy on financial instruments in note 1. The revaluation reserve relates to the acquisition of the cigarette and snus business of ST in 2008.
Of the amounts released from the hedging reserve during the year, a gain of £15 million (2017: £52 million gain; 2016: £142 million loss) and a gain of £23 million (2017: £27 million loss; 2016: £2 million loss) were reported within revenue and raw materials and consumables respectively, together with a loss of £7 million (2017: £4 million gain; 2016: £6 million loss) reported in other operating expenses, £nil million (2017: £nil million; 2016: £9 million gain) reported in other operating income and a loss of £14 million (2017: £80 million gain; 2016: £93 million gain) reported within net finance costs.
In 2017, included within the £923 million of differences on exchange in respect of associates is a debit of £545 million in respect of foreign exchange recycled from reserves as a result of the divestment of the RAI associate. This has been reported in the Group’s share of post-tax results of associates and joint ventures.
Other reserves comprise:
(a) £483 million which arose in 1998 from merger accounting in a Scheme of Arrangement and Reconstruction whereby British American Tobacco p.l.c. acquired the entire share capital of B.A.T Industries p.l.c. and the share capital of that company’s principal financial services subsidiaries was distributed, so effectively demerging them; and
(b) In the Rothmans transaction, convertible redeemable preference shares were issued as part of the consideration. The discount on these shares was amortised by crediting other reserves and charging retained earnings. The £90 million balance in other reserves comprises the accumulated balance in respect of the preference shares converted during 2004.
| BAT Annual Report and Form 20-F 2018 | 175 | |
|
Financial Statements
|
Notes on the Accounts continued
19 Capital and reserves – reconciliation of movement in total equity continued
The tax attributable to components of other comprehensive income is as follows:
|
2018 |
2017 |
2016 |
||||||||||
| Translation reserve | ||||||||||||
| Net investment hedges | ||||||||||||
| – net fair value gains/(losses) | – | – | (2 | ) | ||||||||
| – | – | (2 | ) | |||||||||
| Hedging reserve | ||||||||||||
| Cash flow hedges | ||||||||||||
| – net fair value losses/(gains) | 18 | 34 | (11 | ) | ||||||||
| – reclassified and reported in profit for the year | – | – | (6 | ) | ||||||||
| 18 | 34 | (17 | ) | |||||||||
| Retained earnings | ||||||||||||
| – actuarial (gains)/losses in respect of subsidiaries | (33 | ) | (171 | ) | 36 | |||||||
| (33 | ) | (171 | ) | 36 | ||||||||
| Owners of the parent | (15 | ) | (137 | ) | 17 | |||||||
| Non-controlling interests | – | – | – | |||||||||
| Total tax recognised in other comprehensive income for the year (note 6(f)) | (15 | ) | (137 | ) | 17 | |||||||
| 176 | BAT Annual Report and Form 20-F 2018 | |
|
Strategic Report
|
Governance
|
Financial Statements
|
Other Information
|
20 Borrowings
| Currency
|
Maturity dates
|
Interest rates
|
2018 £m
|
2017 £m
|
||||||||||||||||||||||
| Eurobonds | Euro | 2019 to 2045 | 0.4% to 4.9% | 8,717 | 8,585 | |||||||||||||||||||||
| Euro | 2021 | 3m EURIBOR +50bps | 986 | 1,326 | ||||||||||||||||||||||
| UK sterling | 2019 to 2055 | 1.8% to 7.3% | 4,671 | 4,680 | ||||||||||||||||||||||
| US dollar | 2019 | 1.6% | 512 | 482 | ||||||||||||||||||||||
| Swiss franc | 2021 to 2026 | 0.6% to 1.4% | 523 | 498 | ||||||||||||||||||||||
| Bonds issued pursuant to Rules under the US Securities Act (as amended) | US dollar | 2019 to 2047 | 2.3% to 8.1% | 25,428 | 25,545 | |||||||||||||||||||||
| USD 3m LIBOR + | ||||||||||||||||||||||||||
| US dollar | 2020 to 2022 | 59bps to 88bps | 1,381 | 1,665 | ||||||||||||||||||||||
| Bonds and notes | 42,218 | 42,781 | ||||||||||||||||||||||||
| Commercial paper | 536 | 1,200 | ||||||||||||||||||||||||
| Other loans | 3,859 | 4,466 | ||||||||||||||||||||||||
| Bank loans | 608 | 512 | ||||||||||||||||||||||||
| Bank overdrafts | 274 | 469 | ||||||||||||||||||||||||
| Finance leases | 14 | 22 | ||||||||||||||||||||||||
| 47,509 | 49,450 | |||||||||||||||||||||||||
The interest on the commercial paper referred to in the table above is based on USD LIBOR plus a margin ranging between 22 and 65 basis points and EURIBOR plus a margin ranging between 8 and 15 basis points (2017: USD LIBOR plus a margin ranging between 19 and 38 basis points and EURIBOR plus a margin ranging between 10 and 24 basis points).
Current borrowings per the balance sheet include interest payable of £470 million at 31 December 2018 (2017: £445 million). Included within borrowings are £6,245 million (2017: £6,690 million) of borrowings subject to fair value hedges where their amortised cost has been increased by £179 million (2017: £208 million) in the table above.
The fair value of borrowings is estimated to be £44,457 million (2017: £50,449 million). £39,169 million (2017: £43,780 million) has been calculated using quoted market prices and is within level 1 of the fair value hierarchy. £5,288 million (2017: £6,669 million) has been calculated based on discounted cash flow analysis and is within level 3 of the fair value hierarchy.
The amounts secured on Group assets as at 31 December 2018 is £75 million (2017: £159 million), including finance leases of £14 million (2017: £20 million) and amounts secured on certain inventory of the Group (note 17).
Borrowings are repayable as follows:
| Per balance sheet
|
Contractual gross maturities
|
|||||||||||||||
|
2018 £m
|
2017 £m
|
2018 £m
|
2017 £m
|
|||||||||||||
| Within one year | 4,225 | 5,423 | 5,636 | 6,381 | ||||||||||||
| Between one and two years | 7,261 | 2,344 | 8,471 | 3,609 | ||||||||||||
| Between two and three years | 2,958 | 7,011 | 4,086 | 8,141 | ||||||||||||
| Between three and four years | 7,095 | 2,913 | 8,131 | 4,034 | ||||||||||||
| Between four and five years | 2,580 | 6,857 | 3,462 | 7,836 | ||||||||||||
| Beyond five years | 23,390 | 24,902 | 32,712 | 34,842 | ||||||||||||
| 47,509 | 49,450 | 62,498 | 64,843 | |||||||||||||
The contractual gross maturities in each year include the borrowings maturing in that year together with forecast interest payments on all borrowings which are outstanding for all or part of that year.
| BAT Annual Report and Form 20-F 2018 | 177 | |
|
Financial Statements
|
Notes on the Accounts continued
20 Borrowings continued
Borrowings are denominated in the functional currency of the subsidiary undertaking or other currencies as shown below:
|
Functional
|
US dollar £m
|
UK
|
Euro £m
|
Canadian £m
|
Other
|
Total £m
|
||||||||||||||||||||||
| 31 December 2018 | ||||||||||||||||||||||||||||
| Total borrowings | 32,612 | 3,803 | 450 | 10,089 | – | 555 | 47,509 | |||||||||||||||||||||
| Effect of derivative financial instruments | ||||||||||||||||||||||||||||
| – cross-currency swaps | 4,029 | 17 | (450 | ) | (3,653 | ) | – | (256 | ) | (313 | ) | |||||||||||||||||
| – forward foreign currency contracts | (1,905 | ) | 1,961 | – | (389 | ) | – | 321 | (12 | ) | ||||||||||||||||||
| 34,736 | 5,781 | – | 6,047 | – | 620 | 47,184 | ||||||||||||||||||||||
| 31 December 2017 | ||||||||||||||||||||||||||||
| Total borrowings | 32,580 | 4,789 | 450 | 10,837 | – | 794 | 49,450 | |||||||||||||||||||||
| Effect of derivative financial instruments | ||||||||||||||||||||||||||||
| – cross-currency swaps | 3,903 | 16 | (450 | ) | (3,613 | ) | – | (243 | ) | (387 | ) | |||||||||||||||||
| – forward foreign currency contracts | (1,142 | ) | 922 | – | (388 | ) | 215 | 388 | (5 | ) | ||||||||||||||||||
| 35,341 | 5,727 | – | 6,836 | 215 | 939 | 49,058 | ||||||||||||||||||||||
|
The exposure to interest rate changes when borrowings are re-priced is as follows: |
| |||||||||||||||||||||||||||
|
Within £m
|
Between
|
Between
|
Between
|
Between
|
Beyond £m
|
Total
|
||||||||||||||||||||||
| 31 December 2018 | ||||||||||||||||||||||||||||
| Total borrowings | 10,384 | 4,540 | 1,967 | 4,577 | 2,585 | 23,456 | 47,509 | |||||||||||||||||||||
| Effect of derivative financial instruments | ||||||||||||||||||||||||||||
| – interest rate swaps | 3,069 | (589 | ) | (539 | ) | (236 | ) | – | (1,705 | ) | – | |||||||||||||||||
| – cross-currency swaps | 1,318 | – | (793 | ) | – | (700 | ) | (138 | ) | (313 | ) | |||||||||||||||||
| 14,771 | 3,951 | 635 | 4,341 | 1,885 | 21,613 | 47,196 | ||||||||||||||||||||||
| 31 December 2017 | ||||||||||||||||||||||||||||
| Total borrowings | 12,516 | 2,325 | 4,321 | 1,941 | 4,332 | 24,015 | 49,450 | |||||||||||||||||||||
| Effect of derivative financial instruments | ||||||||||||||||||||||||||||
| – interest rate swaps | 2,995 | – | (554 | ) | (533 | ) | (222 | ) | (1,686 | ) | – | |||||||||||||||||
| – cross-currency swaps | 1,287 | (17 | ) | – | (775 | ) | – | (882 | ) | (387 | ) | |||||||||||||||||
| 16,798 | 2,308 | 3,767 | 633 | 4,110 | 21,447 | 49,063 | ||||||||||||||||||||||
Finance lease liabilities per the balance sheet and on a contractual gross maturity basis are payable as follows: £7 million (2017: £10 million) repayable within one year and £7 million (2017: £12 million) repayable between one and five years. There is no material difference between the repayable principal and the total gross cash flows shown above.
The Group’s undrawn committed borrowing facilities (note 23) total £6,000 million (2017: £5,400 million) with £3,000 million (2017: £2,400 million) maturing within one year and with £3,000 million expiring between two and three years (2017: £3,000 million expiring between three and four years).
| 178 | BAT Annual Report and Form 20-F 2018 | |
|
Strategic Report
|
Governance
|
Financial Statements
|
Other Information
|
20 Borrowings continued
The Group defines net debt as follows:
| 2018 £m |
2017 £m |
|||||||
| Borrowings* | 47,509 | 49,450 | ||||||
| Derivatives in respect of net debt: | ||||||||
| – assets (note 16) | (647 | ) | (640 | ) | ||||
| – liabilities (note 16) | 269 | 117 | ||||||
| Cash and cash equivalents (note 18) | (2,602 | ) | (3,291 | ) | ||||
| Current investments held at fair value (note 15) | (178 | ) | (65 | ) | ||||
| 44,351 | 45,571 | |||||||
| * | Borrowings as at 31 December 2018 include £944 million (2017: £947 million) in respect of the purchase price adjustments relating to the acquisition of Reynolds. |
The movements in net debt are presented below:
| 2018 £m |
||||||||||||||||||||||||||||
| Opening
|
Accounting
|
Revised
|
Subsidiaries
|
Cash flow
|
Foreign
|
Closing
|
||||||||||||||||||||||
| Borrowings | 49,450 | – | 49,450 | – | (3,671 | ) | 1,730 | 47,509 | ||||||||||||||||||||
| Derivatives in respect of net debt: | ||||||||||||||||||||||||||||
| – assets (note 16) | (640 | ) | – | (640 | ) | – | 109 | (116 | ) | (647 | ) | |||||||||||||||||
| – liabilities (note 16) | 117 | – | 117 | – | (6 | ) | 158 | 269 | ||||||||||||||||||||
| Cash and cash equivalents (note 18) | (3,291 | ) | – | (3,291 | ) | (1 | ) | 563 | 127 | (2,602 | ) | |||||||||||||||||
| Current investments held at fair value (note 15) | (65 | ) | (144 | ) | (209 | ) | – | 9 | 22 | (178 | ) | |||||||||||||||||
| 45,571 | (144 | ) | 45,427 | (1 | ) | (2,996 | ) | 1,921 | 44,351 | |||||||||||||||||||
| 2017 £m |
||||||||||||||||||||
|
Opening
|
Subsidiaries
|
Cash flow
|
Foreign
|
Closing
|
||||||||||||||||
| Borrowings | 19,495 | 11,203 | 20,024 | (1,272 | ) | 49,450 | ||||||||||||||
| Derivatives in respect of net debt: | ||||||||||||||||||||
| – assets (note 16) | (809 | ) | – | 106 | 63 | (640 | ) | |||||||||||||
| – liabilities (note 16) | 300 | – | (380 | ) | 197 | 117 | ||||||||||||||
| Cash and cash equivalents (note 18) | (2,204 | ) | (1,288 | ) | 57 | 144 | (3,291 | ) | ||||||||||||
| Current investments held at fair value (note 15) | (15 | ) | – | (44 | ) | (6 | ) | (65 | ) | |||||||||||
| 16,767 | 9,915 | 19,763 | (874 | ) | 45,571 | |||||||||||||||
| BAT Annual Report and Form 20-F 2018 | 179 | |
|
Financial Statements
|
||||||||||||||
| Notes on the Accounts continued | ||||||||||||||
21 Provisions for liabilities
|
Restructuring £m
|
Employee- £m
|
Fox River
|
Other
|
Total
|
||||||||||||||||
| 1 January 2018 | 158 | 40 | 138 | 417 | 753 | |||||||||||||||
| Differences on exchange |
– | (3 | ) | – | (15 | ) | (18 | ) | ||||||||||||
| Provided in respect of the year |
41 | 10 | – | 50 | 101 | |||||||||||||||
| Utilised during the year |
(72 | ) | (14 | ) | (30 | ) | (71 | ) | (187 | ) | ||||||||||
| 31 December 2018 | 127 | 33 | 108 | 381 | 649 | |||||||||||||||
| Analysed on the balance sheet as: | ||||||||||||||||||||
| – current | 74 | 17 | 19 | 208 | 318 | |||||||||||||||
| – non-current | 53 | 16 | 89 | 173 | 331 | |||||||||||||||
| 127 | 33 | 108 | 381 | 649 | ||||||||||||||||
|
Restructuring
|
Employee-
|
Fox River
|
Other
|
Total
|
||||||||||||||||
| 1 January 2017 | 190 | 40 | 163 | 400 | 793 | |||||||||||||||
| Differences on exchange | 4 | (3 | ) | – | (22 | ) | (21 | ) | ||||||||||||
| Subsidiaries acquired | – | – | – | 42 | 42 | |||||||||||||||
| Provided in respect of the year | 172 | 15 | – | 95 | 282 | |||||||||||||||
| Utilised during the year | (208 | ) | (12 | ) | (25 | ) | (98 | ) | (343 | ) | ||||||||||
| 31 December 2017 | 158 | 40 | 138 | 417 | 753 | |||||||||||||||
| Analysed on the balance sheet as: | ||||||||||||||||||||
| – current | 87 | 24 | 22 | 266 | 399 | |||||||||||||||
| – non– current | 71 | 16 | 116 | 151 | 354 | |||||||||||||||
| 158 | 40 | 138 | 417 | 753 | ||||||||||||||||
The restructuring provisions relate to the restructuring and integration costs incurred and reported as adjusting items in the income statement. The principal restructuring activities in 2018 and 2017 are as described in note 3(e). While some elements of the non-current provisions of £53 million will unwind over several years, as termination payments are made over extended periods in some countries, it is estimated that approximately 30% will unwind within five years.
Employee-related benefits mainly relate to employee benefits other than post-employment benefits. The principal components of these provisions are gratuity and termination awards, and ‘jubilee’ payments due after a certain service period. It is estimated that approximately 30% of the non-current provisions of £16 million will unwind within five years.
A provision of £274 million was made in 2011 for a potential claim under a 1998 settlement agreement entered into by a Group subsidiary in respect of the clean-up of sediment in the Fox River. On 30 September 2014, the Group, NCR, Appvion and Windward Prospects entered into a funding agreement; the details of this agreement are explained in note 28. This agreement led to payments of £25 million in 2018 (2017: £18 million). In addition, the Group incurred legal costs of £5 million (2017: £7 million), which were also charged against the provision. It is expected that the non-current provision will unwind within five years.
On 10 February 2017, a decision was delivered on the further hearing related to a payment of dividends by Windward to Sequana in May 2009. Further details are provided in note 28.
Other provisions comprise balances set up in the ordinary course of general business that cannot be classified within the other categories, such as sales returns and onerous contracts, together with amounts in respect of supplier, excise and other disputes. The nature of the amounts provided in respect of disputes is such that the extent and timing of cash flows are difficult to estimate and the ultimate liability may vary from the amounts provided.
Amounts provided above are shown net of reversals of unused provisions which include reversals of £12 million (2017: £7 million) for restructuring of existing businesses, £4 million (2017: £5 million) for employee benefits and £111 million (2017: £49 million) for other provisions, of which £56 million was reclassified to trade and other payables.
| 180 | BAT Annual Report and Form 20-F 2018 | |
|
Strategic Report
|
Governance
|
Financial Statements
|
Other Information
|
22 Trade and other payables
|
2018 |
2017 £m
|
|||||||
| Trade payables | 3,557 | 2,298 | ||||||
| Duty, excise and other taxes | 3,519 | 3,577 | ||||||
| Accrued charges and deferred income | 2,038 | 1,807 | ||||||
| FII GLO deferred income (note 6(b)) | 963 | 963 | ||||||
| Social security and other taxation | 55 | 50 | ||||||
| Sundry payables | 1,554 | 1,271 | ||||||
| 11,686 | 9,966 | |||||||
| Current | 10,631 | 8,908 | ||||||
| Non-current | 1,055 | 1,058 | ||||||
| 11,686 | 9,966 | |||||||
With effect from 1 January 2018, the Group has adopted IFRS 15 Revenue from Contracts with Customers. The Group has revised 2017, as explained in notes 1 and 31.
As explained in note 14, the Group acts as a collection agent for banks in certain debt factoring arrangements. The cash collected in respect of these arrangements that has not yet been remitted amounts to £118 million (2017: £108 million) and is included in trade and other payables.
The Group has Supply Chain Financing (SCF) arrangements in place. The principal purpose of these arrangements is to provide the supplier with the option to access liquidity earlier through the sale of its receivables due from the Group to a third party bank prior to their due date. The invoice due date, from the Group’s perspective, remains unaltered. At 31 December 2018, the value of invoices sold under the SCF programmes was £45 million (2017: £45 million).
Accrued charges and deferred income include £5 million of deferred income (2017: £8 million) and £51 million (2017: £16 million) in respect of interest payable mainly related to tax matters. FII GLO deferred income of £963 million relates to receipts in 2015, in respect of the Franked Investment Income Government Litigation Order (note 6(b)). Amounts payable to related parties including associated undertakings are shown in note 27.
There is no material difference between the above amounts for trade and other payables and their fair value due to the short-term duration of the majority of trade and other payables, as determined using discounted cash flow analysis.
Trade and other payables are predominantly denominated in the functional currencies of subsidiary undertakings with less than 5% in other currencies (2017: less than 5%).
23 Financial instruments and risk management
Management of financial risks
One of the principal responsibilities of Treasury is to manage the financial risks arising from the Group’s underlying operations. Specifically, Treasury manages, within an overall policy framework set by the Group’s Main Board and Corporate Finance Committee (CFC), the Group’s exposure to funding and liquidity, interest rate, foreign exchange and counterparty risks. The Group’s treasury position is monitored by the CFC which meets regularly throughout the year and is chaired by the Group Finance Director. The approach is one of risk reduction within an overall framework of delivering total shareholder return.
The Group defines capital as net debt (note 20) and equity (note 19). The only externally imposed capital requirement for the Group is interest cover as described under interest rate risk below. The Group assesses its financial capacity by reference to cash flow, net debt and interest cover. Group policies include a set of financing principles and key performance indicators including the monitoring of credit ratings, interest cover and liquidity. These provide a framework within which the Group’s capital base is managed and, in particular, the policies on dividends (as a percentage of long-term sustainable earnings) and share buy-back are decided. The key objective of the financing principles is to appropriately balance the interests of equity and debt holders in driving an efficient financing mix for the Group. The Group’s average cost of debt in 2018 is 3.0% (2017: 3.3%).
The Group manages its financial risks in line with the classification of its financial assets and liabilities in the Group’s balance sheet and related notes. The Group’s management of specific risks is dealt with as follows:
Liquidity risk
It is the policy of the Group to maximise financial flexibility and minimise refinancing risk by issuing debt with a range of maturities, generally matching the projected cash flows of the Group and obtaining this financing from a wide range of sources. The Group has a target average centrally managed debt maturity of at least five years with no more than 20% of centrally managed debt maturing in a single rolling year. As at 31 December 2018, the average centrally managed debt maturity was 8.8 years (2017: 9.2 years) and the highest proportion of centrally managed debt maturing in a single rolling year was 18.4% (2017: 13.2%).
It is Group policy that short-term sources of funds (including drawings under both the Group US$4 billion US commercial paper (US CP) programme and the Group £3 billion euro commercial paper (ECP) programme) are backed by undrawn committed lines of credit and cash. Commercial paper is issued by B.A.T. International Finance p.l.c. and B.A.T Capital Corporation and guaranteed by British American Tobacco p.l.c At 31 December 2018, commercial paper of £536 million was outstanding (2017: £1,200 million).
| BAT Annual Report and Form 20-F 2018 | 181 | |
|
Financial Statements
|
Notes on the Accounts continued
| 23 | Financial instruments and risk management continued |
| 182 | BAT Annual Report and Form 20-F 2018 | |
|
Strategic Report
|
Governance
|
Financial Statements
|
Other Information
|
| 23 | Financial instruments and risk management continued |
| BAT Annual Report and Form 20-F 2018 | 183 | |
|
Financial Statements
|
Notes on the Accounts continued
23 Financial instruments and risk management continued
Fair value hierarchy
The following table presents the Group’s financial assets and liabilities that are measured at fair value in accordance with IFRS 13 classification hierarchy:
|
2018
|
2017
|
|||||||||||||||||||||||||||||||||
|
Level 1
|
Level 2
|
Level 3
|
Total
|
Level 1
|
Level 2
|
Level 3
|
Total
|
|||||||||||||||||||||||||||
|
Assets at fair value |
||||||||||||||||||||||||||||||||||
| Investment held at fair value (note 15) |
141 | – | 76 | 217 | 91 | – | 16 | 107 | ||||||||||||||||||||||||||
| Derivatives relating to |
||||||||||||||||||||||||||||||||||
| – interest rate swaps (note 16) | – | 187 | – | 187 | – | 166 | – | 166 | ||||||||||||||||||||||||||
| – cross-currency swaps (note 16) | – | 431 | – | 431 | – | 450 | – | 450 | ||||||||||||||||||||||||||
| – forward foreign currency contracts (note 16) | – | 117 | – | 117 | – | 202 | – | 202 | ||||||||||||||||||||||||||
| Assets at fair value | 141 | 735 | 76 | 952 | 91 | 818 | 16 | 925 | ||||||||||||||||||||||||||
| Liabilities at fair value | ||||||||||||||||||||||||||||||||||
| Derivatives relating to |
||||||||||||||||||||||||||||||||||
| – interest rate swaps (note 16) | – | 181 | – | 181 | – | 91 | – | 91 | ||||||||||||||||||||||||||
| – cross-currency swaps (note 16) | – | 56 | – | 56 | – | – | – | – | ||||||||||||||||||||||||||
| – forward foreign currency contracts (note 16) | – | 279 | – | 279 | – | 143 | – | 143 | ||||||||||||||||||||||||||
| Liabilities at fair value | – | 516 | – | 516 | – | 234 | – | 234 | ||||||||||||||||||||||||||
Level 2 financial instruments are not traded in an active market, but the fair values are based on quoted market prices, broker/dealer quotations, or alternative pricing sources with reasonable levels of price transparency. The Group’s level 2 financial instruments include OTC derivatives.
Netting arrangements of derivative financial instruments
The gross fair value of derivative financial instruments as presented in the Group balance sheet, together with the Group’s rights of offset associated with recognised financial assets and recognised financial liabilities subject to enforceable master netting arrangements and similar agreements, is summarised as follows:
|
2018
|
2017
|
|||||||||||||||||||||||||
|
|
Amount presented in the Group balance sheet £m
|
*
|
|
Related amounts not £m
|
|
|
Net amount £m
|
|
|
Amount presented in the Group balance sheet £m
|
*
|
|
Related amounts not offset in the Group £m
|
|
|
Net amount £m
|
| |||||||||
| Financial Assets | ||||||||||||||||||||||||||
| – Derivative Financial Instruments (note 16) | 735 | (295 | ) | 440 | 818 | (211 | ) | 607 | ||||||||||||||||||
| Financial Liabilities | ||||||||||||||||||||||||||
| – Derivative Financial Instruments (note 16) | (516 | ) | 295 | (221 | ) | (234 | ) | 211 | (23 | ) | ||||||||||||||||
| 219 | – | 219 | 584 | – | 584 | |||||||||||||||||||||
| * | No financial instruments have been offset in the Group balance sheet. |
The Group is subject to master netting arrangements in force with financial counterparties with whom the Group trades derivatives.
The master netting arrangements determine the proceedings should either party default on their obligations. In case of any event of default: the non-defaulting party will calculate the sum of the replacement cost of outstanding transactions and amounts owed to it by the defaulting party. If that sum exceeds the amounts owed to the defaulting party, the defaulting party will pay the balance to the non-defaulting party. If the sum is less than the amounts owed to the defaulting party, the non-defaulting party will pay the balance to the defaulting party.
| 184 | BAT Annual Report and Form 20-F 2018 | |
|
Strategic Report
|
Governance
|
Financial Statements
|
Other Information
|
23 Financial instruments and risk management continued
The hedged items by risk category are presented below:
|
2018
|
||||||||||||||||||||
|
Carrying £m
|
Accumulated Liabilities £m
|
Line item in the
|
Changes in fair £m
|
Cash
|
||||||||||||||||
| Fair value hedges | ||||||||||||||||||||
| Interest rate risk | ||||||||||||||||||||
| – borrowings | 6,424 | 179 | Borrowings | (32 | ) | |||||||||||||||
| Cash flow hedges | ||||||||||||||||||||
| Interest rate risk | ||||||||||||||||||||
| – borrowings
|
2,819 | Borrowings | 189 | (146 | ) | |||||||||||||||
The change in the value used for calculating hedge ineffectiveness for hedged items designated under net investment hedge relationship is £226 million.
As at 31 December 2018, the total balance of the cash flow hedge reserve was a loss of £177 million including a £146 million loss in relation to interest rate exposure and foreign currency exposure arising from borrowings held by the Group, a £98 million loss in relation to interest rate exposure on forecasted borrowings, and a £48 million gain in relation to deferred tax arising from cash flow hedges. The remainder related to the Group’s foreign currency exposure on forecasted transactions.
| BAT Annual Report and Form 20-F 2018 | 185 | |
|
Financial Statements
|
Notes on the Accounts continued
24 Business combinations, disposals and other changes in the Group
| 186 | BAT Annual Report and Form 20-F 2018 | |
|
Strategic Report
|
Governance
|
Financial Statements
|
Other Information
|
24 Business combinations, disposals and other changes in the Group continued
(d) Other transactions
On 21 December 2017, the Group signed an agreement to acquire 100% of the share capital of Twisp Propriety Limited, a South African e-cigarette/nicotine vapour company, conditional upon, amongst other things, anti-trust approval. The proposed acquisition continues to be subject to a South African Competition Tribunal process, with a decision expected in 2019.
On 10 January 2019, the Group acquired a minority stake in AYR Limited, a vapour technology company based in the UK, for £8 million, with the potential to increase this in the future. The investment terms also provide for BAT and AYR to agree a commercial collaboration agreement under which BAT and AYR will jointly develop future vaping products.
25 Share-based payments
The Group operates a number of share-based payment arrangements of which the two principal ones are:
Long-Term Incentive Plan (LTIP)
Nil-cost options exercisable after three years from date of grant with a contractual life of ten years. Payout is subject to performance conditions based on earnings per share (40% of grant), operating cash flow (20% of grant), total shareholder return (20% of grant) and net turnover (20% of grant) in 2016, 2017 and 2018. Total shareholder return combines the share price and dividend performance of the Company by reference to one comparator group. Participants are not entitled to dividends prior to the exercise of the options. A cash equivalent dividend accrues through the vesting period and is paid on vesting. Both equity and cash-settled LTIP awards were granted in March of 2018 (2017: March; 2016: May).
Following the acquisition of RAI on 25 July 2017, underlying RAI shares for LTIPs were replaced with B.A.T American Depositary Shares (ADS). LTIP awards for ADSs are measured against the performance conditions of RAI at the maximum of 150% at the vesting date. Equity settled LTIPs were granted by RAI in March of 2018 (2017: March) with options exercisable after 3 years from the date of grant with the payment made no later than 90 days from date of vesting. Participants are not entitled to dividends prior to exercise of the options.
Deferred Share Bonus Scheme (DSBS)
Free ordinary shares released three years from date of grant and may be subject to forfeit if a participant leaves employment before the end of the three-year holding period. Participants receive a separate payment equivalent to a proportion of the dividend payment during the holding period. Both equity and cash-settled deferred shares are granted in March each year.
The Group also has a number of other arrangements which are not material for the Group and these are as follows:
Sharesave Scheme (SAYE)
Options granted in March each year from 2011 onwards (previously November until 2009 and no options were granted during 2010) by invitation at a 20% discount to the market price. Options to this equity-settled scheme are exercisable at the end of a three year or five year savings contract. Participants are not entitled to dividends prior to the exercise of the options. The maximum amount that can be saved by a participant in this way is £6,000 in any tax year.
Share Reward Scheme (SRS) and International Share Reward Scheme (ISRS)
Free shares granted in April each year (maximum £3,600 in any year) under the equity-settled schemes are subject to a three- year holding period. Participants receive dividends during the holding period which are reinvested to buy further shares.
Partnership Share Scheme
Open to all eligible employees, where employees can allocate part of their pre-tax salary to purchase shares in British American Tobacco p.l.c The maximum amount that can be allocated in this way to any individual is £1,800 in any tax year. The shares purchased are held in a UK-based trust and are normally capable of transfer to participants tax free after a five-year holding period.
Share-based payment expense
The amounts recognised in the income statement in respect of share-based payments were as follows:
|
2018
|
2017
|
2016
|
||||||||||||||||||||||||||
|
Equity-settled
|
Cash-settled
|
Equity-settled
|
Cash-settled
|
Equity-settled
|
Cash-settled
|
|||||||||||||||||||||||
| LTIP (note (a)) | 70 | – | 56 | 3 | 25 | 6 | ||||||||||||||||||||||
|
DSBS (note (b)) |
44 | 2 | 42 | 9 | 40 | 7 | ||||||||||||||||||||||
|
Other schemes |
7 | – | 7 | – | 6 | – | ||||||||||||||||||||||
| Total recognised in the income statement (note 3(a)) | 121 | 2 | 105 | 12 | 71 | 13 | ||||||||||||||||||||||
| BAT Annual Report and Form 20-F 2018 | 187 | |
|
Financial Statements
|
Notes on the Accounts continued
25 Share-based payments continued
Share-based payment liability
The Group issues to certain employees cash-settled share-based payments that require the Group to pay the intrinsic value of these share-based payments to the employee at the date of exercise. The Group has recorded liabilities in respect of vested and unvested grants at the end of 2018 and 2017:
|
2018
|
2017 | |||||||||||||||||
|
Vested £m
|
Unvested
|
Vested
|
Unvested
|
|||||||||||||||
| LTIP | 0.5 | 2.6 | 0.3 | 9.1 | ||||||||||||||
| DSBS | 0.2 | 6.1 | 0.3 | 11.6 | ||||||||||||||
| Total liability | 0.7 | 8.7 | 0.6 | 20.7 | ||||||||||||||
|
(a) Long-Term Incentive Plan
Details of the movements for the equity- and cash-settled LTIP scheme during the years ended 31 December 2018 and 31 December 2017, were as follows:
|
| |||||||||||||||||
|
2018
|
2017
|
|||||||||||||||||
|
Equity-
|
Cash-settled
|
Equity-
|
Cash-settled
|
|||||||||||||||
| Outstanding at start of year | 6,030 | 378 | 5,337 | 407 | ||||||||||||||
| Granted during the period | 3,067 | 66 | 1,690 | 152 | ||||||||||||||
| Acquired from RAI | – | – | 904 | – | ||||||||||||||
| Exercised during the period | (1,739 | ) | (102 | ) | (746 | ) | (65 | ) | ||||||||||
| Forfeited during the period | (450 | ) | (36 | ) | (1,155 | ) | (116 | ) | ||||||||||
| Outstanding at end of year | 6,908 | 306 | 6,030 | 378 | ||||||||||||||
| Exercisable at end of year | 676 | 22 | 653 | 7 | ||||||||||||||
As at 31 December 2018, the Group has 6,908,000 shares (2017: 6,030,000 shares) outstanding which includes 1,208,129 shares (2017: 891,677 shares) which are related to RAI LTIP awards from which 72,033 shares (2017: 327,463 shares) are exercisable at the end of the year.
The weighted average British American Tobacco p.l.c. share price at the date of exercise for share options exercised during the period was £38.90 (2017: £51.95; 2016: £45.80) for equity-settled and £40.62 (2017: £52.08; 2016: £47.00) for cash-settled options.
The weighted average British American Tobacco p.l.c. share price for ADS on the New York Stock Exchange at the date of exercise for share options exercised during the period relating to equity-settled RAI LTIP awards was US$51.43 (2017: US$62.67).
The outstanding shares for the year ended 31 December 2018 had a weighted average remaining contractual life of 8.1 years (2017: 8.1 years; 2016: 8.2 years) for the equity-settled scheme, 1.91 years for RAI equity-settled scheme (2017: 2.17 years) and 8.1 years (2017: 8.3 years; 2016: 7.9 years) for the cash-settled share-based payment arrangements.
(b) Deferred Share Bonus Scheme
Details of the movements for the equity- and cash-settled DSBS scheme during the years ended 31 December 2018 and 31 December 2017, were as follows:
|
2018
|
2017
|
|||||||||||||||||
|
Equity-
|
Cash-settled
|
Equity-
|
Cash-settled
|
|||||||||||||||
| Outstanding at start of year | 2,962 | 382 | 3,225 | 423 | ||||||||||||||
| Granted during the period |
1,262 | 66 | 1,079 | 136 | ||||||||||||||
| Exercised during the period |
(940 | ) | (145 | ) | (1,267 | ) | (165 | ) | ||||||||||
| Forfeited during the period |
(36 | ) | (22 | ) | (75 | ) | (12 | ) | ||||||||||
| Outstanding at end of year | 3,248 | 281 | 2,962 | 382 | ||||||||||||||
| Exercisable at end of year | 79 | 5 | 61 | 5 | ||||||||||||||
The weighted average British American Tobacco p.l.c. share price at the date of exercise for share options exercised during the financial year was £40.00 (2017: £52.52; 2016: £42.26) for equity-settled and £40.51 (2017: £52.50; 2016: £41.97) for cash-settled options.
The outstanding shares for the year ended 31 December 2018 had a weighted average remaining contractual life of 1.3 years (2017: 1.3 years; 2016: 1.3 years) for the equity-settled scheme and 1.1 years (2017: 1.2 years; 2016: 1.2 years) for the cash-settled scheme.
| 188 | BAT Annual Report and Form 20-F 2018 | |
|
Strategic Report
|
Governance
|
Financial Statements
|
Other Information
|
25 Share-based payments continued
Valuation assumptions
Assumptions used in the Black-Scholes models to determine the fair value of share options at grant date were as follows:
|
2018 |
2017 | |||||||||||||||||
|
LTIP |
DSBS | LTIP | DSBS | |||||||||||||||
| Expected volatility (%) | 18 | 18 | 18 | 18 | ||||||||||||||
| Average expected term to exercise (years) | 3.5 | 3.0 | 3.5 | 3.0 | ||||||||||||||
| Risk-free rate (%) | 1.0 | 1.0 | 0.3 | 0.3 | ||||||||||||||
| Expected dividend yield (%) | 5.0 | 5.0 | 3.2 | 3.2 | ||||||||||||||
| Share price at date of grant (£) | 38.94 | 38.94 | 52.11 | 52.11 | ||||||||||||||
| Fair value at grant date (£) | 29.39 | 33.50 | 41.04 | 47.27 | ||||||||||||||
Market condition features were incorporated into the Monte-Carlo models for the total shareholder return elements of the LTIP, in determining fair value at grant date. Assumptions used in these models were as follows:
|
2018 |
2017 | |||||||||
|
LTIP |
LTIP | |||||||||
| Average share price volatility FMCG comparator group (%) | 18 | 19 | ||||||||
| Average correlation FMCG comparator group (%) | 31 | 31 | ||||||||
|
Fair values determined from the Black-Scholes and Monte-Carlo models use assumptions revised at the end of each reporting period for cash-settled share-based payment arrangements.
The expected British American Tobacco p.l.c. share price volatility was determined taking account of the return index (the share price index plus the dividend reinvested) over a five-year period. The FMCG share price volatility and correlation was also determined over the same periods. The average expected term to exercise used in the models has been adjusted, based on management’s best estimate, for the effects of non-transferability, exercise restrictions and behavioural conditions, forfeiture and historical experience.
The risk-free rate has been determined from market yield curves for government gilts with outstanding terms equal to the average expected term to exercise for each relevant grant. The expected dividend yield was determined by calculating the yield from the last two declared dividends divided by the grant share price.
In addition to these valuation assumptions, LTIP awards contain earnings per share performance conditions. As these are non-market performance conditions they are not included in the determination of fair value of share options at the grant date, however they are used to estimate the number of awards expected to vest. This pay-out calculation is based on expectations published in analysts’ forecasts.
26 Group employees
The average number of persons employed by the Group and its associates during the year, including Directors, was 95,239 (2017: 91,402).
|
| |||||||||
|
2018 |
2017 Number |
|||||||||
| United States | 5,066 | 2,168 | ||||||||
| APME | 15,074 | 14,075 | ||||||||
| AMSSA | 19,351 | 19,158 | ||||||||
| ENA | 26,102 | 25,192 | ||||||||
| Subsidiary undertakings | 65,593 | 60,593 | ||||||||
| Associates | 29,646 | 30,809 | ||||||||
| 95,239 | 91,402 | |||||||||
Included within the employee numbers for ENA are certain employees in the UK in respect of central functions. Some of the costs of these employees are allocated or charged to the various regions and markets in the Group.
| BAT Annual Report and Form 20-F 2018 | 189 | |
|
Financial Statements
|
Notes on the Accounts continued
27 Related party disclosures
The Group has a number of transactions and relationships with related parties, as defined in IAS 24 Related Party Disclosures, all of which are undertaken in the normal course of business. Transactions with CTBAT International Limited (a joint operation) are not included in these disclosures as the results are immaterial to the Group.
Transactions and balances with associates relate mainly to the sale and purchase of cigarettes and tobacco leaf. Amounts receivable from associates in respect of dividends included in the table below were £nil million (2017: £nil million; 2016: £221 million). The Group’s share of dividends from associates, included in other net income in the table below, was £211 million (2017: £688 million; 2016: £1,024 million).
|
2018 £m |
2017 £m |
2016 £m |
||||||||||
|
Transactions |
||||||||||||
| – revenue | 473 | 366 | 370 | |||||||||
| – purchases | (101 | ) | (218 | ) | (298 | ) | ||||||
| – other net income | 216 | 699 | 1,023 | |||||||||
| Amounts receivable at 31 December | 26 | 40 | 270 | |||||||||
| Amounts payable at 31 December | (1 | ) | (1 | ) | (2 | ) | ||||||
As explained in note 24, in 2017, the Group completed the acquisition of the remaining 57.8% of RAI not already owned. This transaction has not been included in the table above.
On 17 December 2012, a wholly owned subsidiary of the Group, BATUS Japan Inc. (BATUSJ), entered into an Amendment and Extension Agreement (referred to as the Amendment) with a wholly owned subsidiary of RAI, R.J. Reynolds Tobacco Company (referred to as RJRTC). The Amendment modifies the American-blend Cigarette Manufacturing Agreement (referred to as the 2010 Agreement), effective as of
1 January 2010.
Prior to the Amendment, the term of the 2010 Agreement was scheduled to expire on 31 December 2014, subject to early termination and extension provisions. Pursuant to the Amendment, the Manufacturing Agreement would remain in effect beyond 31 December 2014, provided that either RJRTC or BATUSJ may terminate the Manufacturing Agreement by furnishing three years’ notice to the other party. Such notice was given in January 2016. As a result of early termination of this agreement the Group agreed to a compensation payment of US$90 million of which US$7 million were paid to RJRTC on 22 September 2016, with the Group recognising the full expense of US$90 million as required by IFRS in 2016. The balance was paid in March 2017.
During 2018, the Group acquired a further 44% interest in British American Tobacco Myanmar Limited and a further 11% interest in British American Tobacco Vranje.
During 2017, the Group acquired the remaining 49% interest in IPRESS d.o.o. and a further 0.01% interest in British American Tobacco Chile Operaciones S.A. The combined costs are less than £1 million.
During 2016, the Group received proceeds of £23 million in respect of its participation in the share buy-back programme conducted by RAI. This programme ceased in the fourth quarter of 2016.
During 2016, the Group acquired the remaining 1% interest in Souza Cruz at a cost of £70 million. This transaction is shown as a £4 million increase in reserves attributable to the owners of the parent and a £4 million reduction in reserves attributable to non-controlling interests in note 19.
As explained in note 12, contributions to the British American Tobacco UK Pension Fund are secured by a charge over the Group’s Head Office (Globe House) up to a maximum of £150 million.
The key management personnel of British American Tobacco consist of the members of the Board of Directors of British American Tobacco p.l.c. and the members of the Management Board. No such person had any material interest during the year in a contract of significance (other than a service contract) with the Company or any subsidiary company. The term key management personnel in this context includes their close family members.
|
2018 |
2017 £m |
2016 £m |
||||||||||
|
The total compensation for key management personnel, including Directors, was:
|
||||||||||||
| – salaries and other short-term employee benefits
|
|
21
|
|
|
24
|
|
|
18
|
| |||
| – post-employment benefits
|
|
4
|
|
|
5
|
|
|
3
|
| |||
| – share-based payments
|
|
18
|
|
|
16
|
|
|
12
|
| |||
| 43 | 45 | 33 | ||||||||||
| 190 | BAT Annual Report and Form 20-F 2018 | |
|
Strategic Report
|
Governance
|
Financial Statements
|
Other Information
|
27 Related party disclosures continued
The following table, which is not part of IAS24 disclosures, shows the aggregate emoluments of the Directors of the Company.
| Executive Directors
|
Chairman
|
Non-Executive Directors
|
Total
|
|||||||||||||||||||||||||||||||||||||||||||||||||||
|
2018
|
2017
|
2016
|
2018
|
2017
|
2016
|
2018
|
2017
|
2016
|
2018
|
2017
|
2016
|
|||||||||||||||||||||||||||||||||||||||||||
| Salary; fees; benefits; incentives | ||||||||||||||||||||||||||||||||||||||||||||||||||||||
| – salary | 2,211 | 2,122 | 2,057 | – | – | – | – | – | – | 2,211 | 2,122 | 2,057 | ||||||||||||||||||||||||||||||||||||||||||
| – fees | – | – | – | 680 | 660 | 645 | 1,092 | 1,042 | 1,051 | 1,772 | 1,702 | 1,696 | ||||||||||||||||||||||||||||||||||||||||||
| – taxable benefits | 427 | 385 | 335 | 116 | 129 | 106 | 303 | 195 | 122 | 846 | 709 | 563 | ||||||||||||||||||||||||||||||||||||||||||
| – short-term incentives | 5,031 | 4,689 | 4,622 | – | – | – | – | – | – | 5,031 | 4,689 | 4,622 | ||||||||||||||||||||||||||||||||||||||||||
| – long-term incentives | 5,300 | 10,192 | 4,483 | – | – | – | – | – | – | 5,300 | 10,192 | 4,483 | ||||||||||||||||||||||||||||||||||||||||||
| Sub-total | 12,969 | 17,388 | 11,497 | 796 | 789 | 751 | 1,395 | 1,237 | 1,173 | 15,160 | 19,414 | 13,421 | ||||||||||||||||||||||||||||||||||||||||||
| Pension; other emoluments |
||||||||||||||||||||||||||||||||||||||||||||||||||||||
| – pension | 921 | 612 | 634 | – | – | – | – | – | – | 921 | 612 | 634 | ||||||||||||||||||||||||||||||||||||||||||
| – other emoluments | 50 | 50 | 44 | – | – | – | – | – | – | 50 | 50 | 44 | ||||||||||||||||||||||||||||||||||||||||||
| Sub-total | 971 | 662 | 678 | – | – | – | – | – | – | 971 | 662 | 678 | ||||||||||||||||||||||||||||||||||||||||||
| Total emoluments | 13,940 | 18,050 | 12,175 | 796 | 789 | 751 | 1,395 | 1,237 | 1,173 | 16,131 | 20,076 | 14,099 | ||||||||||||||||||||||||||||||||||||||||||
Aggregate gains on LTIP shares exercised in the year
| Award date | Exercised LTIP shares |
Exercise date | Price per share (£) |
Aggregate (£) |
||||||||||||||||
|
Nicandro Durante |
27 Mar 2015 | 122,477 | 27 Mar 2018 | 39.46 | 4,832,942 | |||||||||||||||
| Ben Stevens | 27 Mar 2015 | 66,925 | 27 Mar 2018 | 39.46 | 2,640,861 | |||||||||||||||
LTIP – Value of awards 2015
| Shares | |
Price per share (£ |
)1 |
|
Face value (£) |
| ||||||
| Nicandro Durante | 127,448 | 36.25 | 4,619,990 | |||||||||
| Ben Stevens | 69,641 | 36.25 | 2,524,486 | |||||||||
| 1. | For information only as awards are made as nil cost options. |
In 2018, no Sharesave were exercised by Executive Directors.
| BAT Annual Report and Form 20-F 2018 | 191 | |
|
Financial Statements
|
Notes on the Accounts continued
| 28 | Contingent liabilities and financial commitments |
| 192 | BAT Annual Report and Form 20-F 2018 | |
|
Strategic Report
|
Governance
|
Financial Statements
|
Other Information
|
28 Contingent liabilities and financial commitments continued
| Case Type
|
Case Numbers as at
|
Case Numbers as at
|
Change in Number
|
|||||||||
| US tobacco related actions | ||||||||||||
| Medical reimbursement cases (note 2) | 2 | 2 | No change | |||||||||
| Class actions (note 3) | 20 | 24 | (4 | ) | ||||||||
| Individual smoking and health cases (note 4) | 111 | 99 | 12 | |||||||||
| West Virginia IPIC (note 5) | 1 | 1 | No change | |||||||||
| Engle progeny cases (note 6) | 2,268 | 2,569 | (301 | ) | ||||||||
| Broin II cases (note 7) | 1,406 | 2,321 | (915 | ) | ||||||||
| Filter cases (note 8) | 58 | 71 | (13 | ) | ||||||||
| State Settlement Agreements – Enforcement and Validity (note 9) | 3 | 2 | 1 | |||||||||
| Non-US tobacco related actions | ||||||||||||
| Medical reimbursement cases | 19 | 19 | No change | |||||||||
| Class actions (note 10) | 13 | 14 | (1 | ) | ||||||||
| Individual smoking and health cases (note 11) | 107 | 120 | (13 | ) | ||||||||
(Note 1) This includes cases to which the RAI group companies were a party at such date.
(Note 2) This category of cases includes the Department of Justice action. See note 28, paragraphs 20-24 and the list of Closed Litigation Matters.
(Note 3) See note 28, paragraphs 25-39.
(Note 4) This category of cases includes smoking and health cases alleging personal injuries caused by tobacco use or exposure brought by or on behalf of individual plaintiffs based on theories of negligence, strict liability, breach of express or implied warranty and violations of state deceptive trade practices or consumer protection statutes. The plaintiffs seek to recover compensatory damages, attorneys’ fees and costs and punitive damages. Out of the 111 active individual smoking and health cases, five judgments have been returned in the plaintiffs’ favour, awarding damages totalling US$209.4 million (approximately £164.4 million), all of which are on appeal. For a further description of these cases, see note 28, paragraph 40.
(Note 5) The West Virginia IPIC cases are a series of roughly 1,200 cases, filed in West Virginia beginning in 1999, asserting claims against PM USA, Lorillard Tobacco, RJRT, B&W and The American Tobacco Company. These cases were brought in consolidated proceedings in West Virginia alleging personal injuries. The one claim upon which plaintiffs prevailed was a limited failure to instruct claim covering a narrow window of time. Only 30 plaintiffs qualified to pursue that narrow claim. In 2017, the court dismissed all claims of those 30 plaintiffs with prejudice pursuant to an agreement providing that each plaintiff who submits a release within one year will receive US$7,000 (approximately £5,496). In addition to the foregoing claims, various plaintiffs in 1999 and 2000 asserted claims against retailers and distributors (which have not been pursued in light of the result in the Phase I trial in defendants’ favour), as well as smokeless claims against various defendants including RJRT, Lorillard, American Snuff and B&W. 41 plaintiffs sought to pursue their smokeless claims in 2017. In April 2017, the court dismissed the claims of those 41 smokeless plaintiffs with prejudice. For a further discussion of the related plaintiffs’ claims, see note 28, paragraph 41.
(Note 6) In July 1998, trial began in Engle v R.J. Reynolds Tobacco Co., a then-certified class action filed in Circuit Court, Miami-Dade County, Florida, against US cigarette manufacturers, including RJRT, Lorillard Tobacco and B&W. In July 2000, the jury in Phase II awarded the class a total of approximately US$145 billion (approximately £114 billion) in punitive damages, apportioned US$36.3 billion (approximately £28.5 billion) to RJRT, US$17.6 billion (approximately £13.8 billion) to B&W, and US$16.3 billion (approximately £12.8 billion) to Lorillard Tobacco. This decision was appealed and ultimately resulted in the Florida Supreme Court in December 2006 decertifying the class and allowing judgments entered for only two of the three Engle class representatives to stand and setting aside the punitive damages award. Putative Engle class members were permitted to file individual lawsuits, deemed “Engle progeny cases”, against the Engle defendants, within one year of the Supreme Court’s decision (subsequently extended to 11 January 2008). Between the period 1 January 2016 and 31 December 2018, 46 judgments have been returned in the plaintiffs’ favour, awarding damages totalling approximately US$341.7 million (approximately £268.3 million). Certain of these judgments have been appealed by RJRT and in certain other cases, RJRT still had time to appeal, as of 31 December 2018. For a further description of the Engle progeny cases, see note 28, paragraphs 30-39.
(Note 7) Broin v Philip Morris, Inc. was a class action filed in Circuit Court in Miami-Dade County, Florida in 1991 and brought on behalf of flight attendants alleged to have suffered from diseases or ailments caused by exposure to Environmental Tobacco Smoke (ETS) in airplane cabins. Group companies and other cigarette manufacturer defendants settled Broin, agreeing to pay a total of US$300 million (approximately £236 million) to fund research on the detection and cure of tobacco- related diseases and US$49 million (approximately £38.5 million) in plaintiffs’ counsel’s fees and expenses. Group companies’ share of these payments totalled US$223 million (approximately £175 million). Broin II cases refer to individual cases by class members. There have been no Broin II trials since 2007. For a further description of the Broin II cases, see note 28, paragraph 41.
(Note 8) Includes claims brought against Lorillard Tobacco and Lorillard by individuals who seek damages resulting from their alleged exposure to asbestos fibres that were incorporated into filter material used in one brand of cigarettes manufactured by a predecessor to Lorillard Tobacco for a limited period of time ending more than 50 years ago. Since 1 January 2016, Lorillard Tobacco and RJRT have paid, or have reached agreement to pay, a total of approximately US$30.2 million (approximately £23.7 million) in settlements to resolve 137 Filter Cases. See note 28, paragraph 41.
| BAT Annual Report and Form 20-F 2018 | 193 | |
|
Financial Statements
|
Notes on the Accounts continued
| 28 | Contingent liabilities and financial commitments continued |
| 194 | BAT Annual Report and Form 20-F 2018 | |
|
Strategic Report
|
Governance
|
Financial Statements
|
Other Information
|
| 28 | Contingent liabilities and financial commitments continued |
| BAT Annual Report and Form 20-F 2018 | 195 | |
|
Financial Statements
|
Notes on the Accounts continued
| 28 | Contingent liabilities and financial commitments continued |
| 196 | BAT Annual Report and Form 20-F 2018 | |
|
Strategic Report
|
Governance
|
Financial Statements
|
Other Information
|
28 Contingent liabilities and financial commitments continued
| 34. | As at 31 December 2018, there were approximately 2,268 Engle progeny cases pending in which RJRT, Lorillard Tobacco and/or B&W have been named as defendants and served. These cases include claims by or on behalf of 2,841 plaintiffs. (In addition, as 31 December 2018, RJRT was aware of nine additional Engle progeny cases that have been filed but not served.) The number of pending cases fluctuates for a variety of reasons, including voluntary and involuntary dismissals. Voluntary dismissals include cases in which a plaintiff accepts an “offer of judgment”, from RJRT, Lorillard Tobacco and/or RJRT’s affiliates and indemnitees. An offer of judgment, if rejected by the plaintiff, preserves RJRT’s and Lorillard Tobacco’s right to recover attorneys’ fees under Florida law in the event of a verdict favourable to RJRT or Lorillard Tobacco, or affiliates of such entities. Such offers are sometimes made through court-ordered mediations. |
| 35. | 109 Engle progeny cases have been tried in Florida state and federal courts against RJRT, Lorillard Tobacco and/or B&W since the beginning of 2016 through 31 December 2018, and additional state court trials are scheduled for 2019. |
| 36. | The following chart identifies the number of trials in Engle progeny cases as at 31 December 2018 and additional information about the adverse judgments entered: |
Phase three trials/verdicts/judgments of individual Engle progeny cases 1 January 2016 to 31 December 2018:
| Total number of trials | 109 | |||
| Number of trials resulting in plaintiffs’ verdicts | 46** | |||
| Total damages awarded in final judgments against RJRT | US$341,698,989 (approximately £270 million) | |||
| Amount of overall damages comprising ‘compensatory damages’ (approximately) | US$159,145,914 (of overall US$341,698,989) | |||
| (approximately £125 million of £268 million) | ||||
| Amount of overall damages comprising ‘punitive damages’ (approximately) | US$182,553,075 (of overall US$341,698,989) | |||
| (approximately £143 million of £268 million) | ||||
| ** Of the 46 trials resulting in plaintiffs’ verdicts 1 January 2016 to 31 December 2018: |
| Number of adverse judgments appealed by RJRT | 38 (note 12) | |||
| Number of adverse judgments (not yet appealed), in which RJRT still has time to file an appeal | 3 (note 13) | |||
| Number of adverse judgments in which no appeal was, and can no longer be, sought | 5 | |||
| Appeals of individual Engle progeny cases 1 January 2016 to 31 December 2018: | ||||
| Number of adverse judgments appealed by RJRT | 45 (note 14) |
Note 12: Of the 38 adverse judgments appealed by RJRT as a result of judgments arising in the period 1 January 2016 to 31 December 2018:
a. 20 appeals remain undecided in the District Courts of Appeal, two additional cases were affirmed, but the time for filing a post-opinion motion is pending so they are not final, there is one case that was reversed for reinstatement of full compensatory amount, but the time for filing a post-opinion motion is pending so it is not final, and there is one case that was reversed to reduce the compensatory damages amount by the comparative fault found by the jury, but the time for filing a post-opinion motion is pending so it is not final; and
b. 14 were decided and/or closed. Of these 14 appeals, 12 were affirmed in favour of the plaintiff (further review of the U.S. Supreme Court remains pending in 3, 1 is pending review of the U.S. Supreme Court, 1 is pending review of the Florida Supreme Court), 1 was reversed for new trial, however the judgments were paid, 1 in which there was an appeal of the judgment which was subsequently dismissed. The total damages award may vary depending on the outcome of the pending appeals.
Note 13: One case (Bessent-Dixon) is not included as the case proceeded to a new punitive-only trial, while the compensatory judgment was stayed. RJRT still has time to file an appeal.
Note 14: Of the 45 adverse judgments appealed by RJRT:
a. 20 appeals remain undecided in the District Courts of Appeal, two additional cases were affirmed, but the time for filing a post-opinion motion is pending so they are not final, there is one case that was reversed for reinstatement of full compensatory amount, but the time for filing a post opinion motion is pending so it is not final, and there is one case that was reversed to reduce the compensatory damages amount by the comparative fault found by the jury, but the time for filing a post-opinion motion is pending so it is not final;
b. 21 were decided and/or closed in the District Courts of Appeal. Of these 21 appeals, 15 were affirmed in favour of plaintiff (review of Florida Supreme Court sought in one case, review of the US Supreme Court has been sought in one case, and further review of the US Supreme Court remains pending in three cases). One had the liability findings affirmed but was reversed for reinstatement of full compensatory damages amount, however the judgment was paid, one was affirmed as to compensatory damages, but reversed for Plaintiff to seek punitive damages on negligence and strict liability claims, one was reversed for new trial, however the judgments were paid, two in which there was an appeal of the judgment which was subsequently dismissed and the judgment paid, and one was affirmed on compensatory damages but reversed on punitive damages and on retrial, a directed verdict was entered in favour of RJRT on punitive damages. RJRT has paid damages to plaintiffs in five cases that were not appealed that are now closed. The total damages award may vary depending on the outcome of the pending appeals; and
c. Includes appeals of six adverse judgements rendered prior to 1 January 2016 that were appealed by RJRT in the period from 1 January 2016 to 31 December 2018.
| 37. | By statute, Florida applies a US$200 million (approximately £157 million) bond cap to all Engle progeny cases in the aggregate. Individual bond caps for any given Engle progeny case vary depending on the number of judgments in effect at a given time. Judicial attempts by several plaintiffs in the Engle progeny cases to challenge the bond cap as violating the Florida Constitution have failed. |
| BAT Annual Report and Form 20-F 2018 | 197 | |
|
Financial Statements
|
Notes on the Accounts continued
28 Contingent liabilities and financial commitments continued
| In addition, bills have been introduced in sessions of the Florida legislature that would eliminate the Engle progeny bond cap, but those bills have not been enacted as of 31 December 2018. |
| 38. | In 2018, RJRT or Lorillard Tobacco has paid judgments in 33 Engle progeny cases. Those payments totalled US$333 million (approximately £261 million) in compensatory or punitive damages. Additional costs were paid in respect of attorneys’ fees and statutory interest. |
| 39. | In addition, accruals for damages and attorneys’ fees and statutory interest for 8 cases (Starr-Blundell v R. J. Reynolds Tobacco Co., Odom v. R. J. Reynolds Tobacco Co., Nally v. R. J. Reynolds Tobacco Co., Johnston v. R. J. Reynolds Tobacco Co., Searcy v. R. J. Reynolds Tobacco Co., Fox v. R. J. Reynolds Tobacco Co., Lima v. R. J. Reynolds Tobacco Co and Pardue v. R. J. Reynolds Tobacco Co.) were recorded in RAI’s consolidated balance sheet as of 31 December 2018 to the value of US$104,902,981.61 (approximately £82,367,291). |
(c) Individual Cases
| 40. | As of 31 December 2018, 111 individual cases were pending in the United States against RJRT, Lorillard Tobacco and/or B&W. This category of cases includes smoking and health cases alleging personal injuries caused by tobacco use or exposure brought by or on behalf of individual plaintiffs based on theories of negligence, strict liability, breach of express or implied warranty, and violations of state deceptive trade practices or consumer protection statutes. The plaintiffs seek to recover compensatory damages, attorneys’ fees and costs, and punitive damages. The category does not include the West Virginia personal injury cases (“West Virginia IPIC”) cases, Engle progeny cases, Broin II cases, and Filter Cases discussed above and below. One of the individual cases is brought by or on behalf of an individual or his/her survivors alleging personal injury as a result of exposure to ETS. |
| 41. | The following chart identifies the number of individual cases pending as of 31 December 2018 as against the number pending as of 31 December 2017, along with the number of West Virginia IPIC cases, Engle progeny cases, Broin II cases, and Filter Cases, which are discussed further below. |
| Case Type
|
US Case Numbers
|
US Case
Numbers
|
Change in Number
|
|||||||||
| US tobacco related actions | ||||||||||||
| Individual Smoking and Health Cases (note 15) | 111 | 99 | 12 | |||||||||
| West Virginia IPIC (Number of Plaintiffs) (note 16) | 1 (1) | 1 (564) | No change/(563) | |||||||||
| Engle Progeny Cases (Number of Plaintiffs) (note 17) | 2,268 (2,841) | 2,569 (3,276) | (301) (435) | |||||||||
| Broin II Cases (note 18) | 1,406 | 2,321 | (915) | |||||||||
| Filter Cases (note 19) | 58 | 71 | (13) | |||||||||
(Note 15) Out of the 111 pending individual smoking and health cases, five have received adverse verdicts in the court of first instance or on appeal, and the total amount of those verdicts is US$209.4 million (approximately £164.4 million).
(Note 16) The West Virginia IPIC cases are a series of roughly 1,200 cases, filed in West Virginia beginning in 1999, asserting claims against PM USA, Lorillard Tobacco, RJRT, B&W and The American Tobacco Company. These cases were brought in consolidated proceedings in West Virginia alleging personal injuries, where the first phase of the trial began on 15 April 2013 and on 15 May 2013 the jury returned a verdict for defendants on all but one of plaintiffs’ claims (the verdict was affirmed on appeal). The one claim upon which plaintiffs prevailed was a limited failure to instruct claim covering a narrow window of time. Only 30 plaintiffs qualified to pursue that narrow claim. In 2017, those 30 plaintiffs agreed to resolve their claims for US$7,000 (approximately £5,496) per case. All of those failure to instruct claims have been dismissed with prejudice, with the agreement that each plaintiff who submits a release within one year will receive the agreed payment of US$7,000 (approximately £5,496) from either PM USA or RJRT, as appropriate. Three of the 30 plaintiffs have submitted releases to date. In addition to the foregoing failure to instruct claims, various plaintiffs in 1999 and 2000 asserted claims against retailers and distributors (which have not been pursued in light of the result in the Phase I trial in defendants’ favour), as well as smokeless claims against various defendants including RJRT, Lorillard, American Snuff and B&W. In 2017, 41 plaintiffs were permitted to pursue their smokeless claims over defendants’ objections. On 27 April 2018, the court dismissed the claims of those 41 plaintiffs with prejudice. In the final weeks of the case in the trial court, one plaintiff sought to pursue a roll-your-own claim that had long been dormant. The trial court denied that request and that one plaintiff appealed to the West Virginia Supreme Court on 8 May 2018. That appeal has been fully briefed and is awaiting decision.
(Note 17) The number of Engle progeny cases will fluctuate as cases are dismissed or if any of the dismissed cases are appealed. Please see earlier table in paragraph 36.
(Note 18) Broin v Philip Morris, Inc. was a class action filed in Circuit Court in Miami-Dade County, Florida in 1991 and brought on behalf of flight attendants alleged to have suffered from diseases or ailments caused by exposure to ETS in airplane cabins. In October 1997, RJRT, Lorillard Tobacco, B&W and other cigarette manufacturer defendants settled Broin, agreeing to pay a total of US$300 million (approximately £236 million) in three annual US$100 million (approximately £79 million) instalments, allocated among the companies by market share, to fund research on the early detection and cure of diseases associated with tobacco smoke. It also required those companies to pay a total of US$49 million (approximately £38.5 million) for the plaintiffs’ counsel’s fees and expenses. RJRT’s portion of these payments was approximately US$86 million (approximately £68 million); Lorillard Tobacco’s was approximately US$57 million (approximately £45 million); and B&W’s was approximately US$31 million (approximately £24.3 million). The settlement agreement, among other things, limits the types of claims class members may bring and eliminates claims for punitive damages. The settlement agreement also provides that, in individual cases by class members that are referred to as Broin II lawsuits, the defendants will bear the burden of proof with respect to whether ETS can cause certain specifically enumerated diseases, referred to as “general causation”. With respect to all other liability issues, including whether an individual plaintiff’s disease was caused by his or her exposure to ETS in airplane cabins, referred to as “specific causation”, individual plaintiffs will bear the burden of proof. On 7 September 1999, the Florida Supreme Court approved the settlement. There have been no Broin II trials since 2007. There have been periodic efforts to activate cases and the Group expects this to continue over time.
| 198 | BAT Annual Report and Form 20-F 2018 | |
|
Strategic Report
|
Governance
|
Financial Statements
|
Other Information
|
28 Contingent liabilities and financial commitments continued
(Note 19) Includes claims brought against Lorillard Tobacco and Lorillard by individuals who seek damages resulting from their alleged exposure to asbestos fibres that were incorporated into filter material used in one brand of cigarettes manufactured by a predecessor to Lorillard Tobacco for a limited period of time ending more than 50 years ago. Pursuant to the terms of a 1952 agreement between P. Lorillard Company and H&V Specialties Co., Inc. (the manufacturer of the filter material), Lorillard Tobacco is required to indemnify Hollingsworth & Vose for legal fees, expenses, judgments and resolutions in cases and claims alleging injury from finished products sold by P. Lorillard Company that contained the filter material. As of 31 December 2018, Lorillard Tobacco and/or Lorillard was a defendant in 58 Filter cases. Since 1 January 2016, Lorillard Tobacco and RJRT have paid, or have reached agreement to pay, a total of approximately US$30.2 million (approximately £24 million) in settlements to resolve 137 Filter Cases.
(d) State Settlement Agreements
| 42. | In November 1998, the major US cigarette manufacturers, including RJRT, B&W and Lorillard Tobacco, entered into the Master Settlement Agreement (“MSA”) with attorneys general representing 46 US states, the District of Columbia and certain US territories and possessions. These cigarette manufacturers previously settled four other cases, brought on behalf of Mississippi, Florida, Texas and Minnesota, by separate agreements with each state (collectively and with the MSA, the “State Settlement Agreements”). |
| 43. | These State Settlement Agreements settled all health-care cost recovery actions brought by, or on behalf of, the settling jurisdictions; released the defending major US cigarette manufacturers from various additional present and potential future claims; imposed future payment obligations in perpetuity on RJRT, B&W, Lorillard Tobacco and other major US cigarette manufacturers; and placed significant restrictions on their ability to market and sell cigarettes and smokeless tobacco products. In accordance with the MSA, various tobacco companies agreed to fund a US$5.2 billion (approximately £5 billion) trust fund to be used to address the possible adverse economic impact of the MSA on tobacco growers. |
| 44. | RJRT and SFNTC are subject to the substantial payment obligations under the State Settlement Agreements. Payments under the State Settlement Agreements are subject to various adjustments for, among other things, the volume of cigarettes sold, relative market share, operating profit and inflation. RAI’s operating subsidiaries’ expenses and payments under the State Settlement Agreements for 2016, 2017, 2018 and the projected expenses and payments for 2019 onwards are set forth below (in millions of US dollars)*: |
| 2016 | 2017 | 2018 | 2019 and thereafter | |||||||||||||
| Settlement expenses | $2,727 | $2,856 | $2,741 | |||||||||||||
| Settlement cash payments | $3,042 | $4,612 | $917 | |||||||||||||
| Projected settlement expenses | $>2,800 | |||||||||||||||
| Projected settlement cash payments | $>2,800 | |||||||||||||||
* Subject to adjustments for changes in sales volume, inflation, operating profit and other factors. Payments are allocated among the companies on the basis of relative market share or other methods.
| 45. | The State Settlement Agreements have materially adversely affected RJRT’s shipment volumes. RAI believes that these settlement obligations may materially adversely affect the results of operations, cash flows or financial position of RAI and RJRT in future periods. The degree of the adverse impact will depend, among other things, on the rate of decline in US cigarette sales in the premium and value categories, RJRT’s share of the domestic premium and value cigarette categories, and the effect of any resulting cost advantage of manufacturers not subject to the State Settlement Agreements. |
| 46. | In addition, the MSA includes an adjustment that potentially reduces the annual payment obligations of RJRT, Lorillard Tobacco and the other signatories to the MSA, known as “Participating Manufacturers” (“PMs”). Certain requirements, collectively referred to as the “Adjustment Requirements”, must be satisfied before the Non-Participating Manufacturers (“NPM”) Adjustment for a given year is available: (i) an Independent Auditor must determine that the PMs have experienced a market share loss, beyond a triggering threshold, to those manufacturers that do not participate in the MSA (such non-participating manufacturers being referred to as “NPMs”); and (ii) in a binding arbitration proceeding, a firm of independent economic consultants must find that the disadvantages of the MSA were a significant factor contributing to the loss of market share. This finding is known as a significant factor determination. |
| 47. | When the Adjustment Requirements are satisfied, the MSA provides that the NPM Adjustment applies to reduce the annual payment obligation of the PMs. However, an individual settling state may avoid its share of the NPM Adjustment if it had in place and diligently enforced during the entirety of the relevant year a “Qualifying Statute” that imposes escrow obligations on NPMs that are comparable to what the NPMs would have owed if they had joined the MSA. In such event, the state’s share of the NPM Adjustment is reallocated to other settling states, if any, that did not have in place and diligently enforce a Qualifying Statute. |
| 48. | RJRT and Lorillard Tobacco are or were involved in NPM Adjustment proceedings concerning the years 2003 to 2017. In 2012, RJRT, Lorillard Tobacco, and SFNTC entered into an agreement (the “Term Sheet”) with certain settling states that resolved accrued and potential NPM adjustments for the years 2003 through 2012 and, as a result, RJRT and SFNTC collectively received, or are to receive, more than US$1.1 billion (approximately £863 million) in credits that, in substantial part, were applied to MSA payments in 2014 through 2017. After an arbitration panel ruled in September 2013 that six states had not diligently enforced their qualifying statutes in the year 2003, additional states joined the Term Sheet. RJRT executed the NPM Adjustment Settlement Agreement on 25 September 2017 (which incorporated the Term Sheet). Since the NPM Adjustment Settlement Agreement was executed, an additional 10 states have joined. NPM proceedings are ongoing and could result in further reductions of the companies’ MSA-related payments. |
| 49. | On 18 January 2017, the State of Florida filed a motion to join Imperial Tobacco Group, PLC (“ITG”) as a defendant and to enforce the Florida State Settlement Agreement, which motion seeks payment under the Florida State Settlement Agreement of approximately US$45 million (approximately £35.3 million) with respect to the four brands (Winston, Salem, Kool and Maverick) that were sold to ITG in the divestiture of certain assets, on 12 June 2015, by subsidiaries or affiliates of RAI and Lorillard, together with the transfer of certain employees and certain liabilities, to a wholly owned subsidiary of Imperial Brands plc (the “Divestiture”), referred to as the Acquired Brands. |
| BAT Annual Report and Form 20-F 2018 | 199 | |
|
Financial Statements
|
Notes on the Accounts continued
28 Contingent liabilities and financial commitments continued
| 200 | BAT Annual Report and Form 20-F 2018 | |
|
Strategic Report
|
Governance
|
Financial Statements
|
Other Information
|
28 Contingent liabilities and financial commitments continued
| BAT Annual Report and Form 20-F 2018 | 201 | |
|
Financial Statements
|
Notes on the Accounts continued
28 Contingent liabilities and financial commitments continued
| Canadian province
|
Act pursuant to which
|
Companies named as Defendants
|
Current stage
| |||
| British Columbia | Tobacco Damages and Health Care Costs Recovery Act 2000 | Imperial Investments Industries Carreras Rothmans Limited RJR Companies Other former Rothmans Group companies All have been served. |
The defences of Imperial, Investments, Industries, Carreras Rothmans Limited and the RJR Companies have been filed, and document production and discoveries are ongoing. On 13 February 2017 the province delivered an expert report dated October 2016, quantifying its damages in the amount of CAD$118 billion (approximately £68 billion or US$ 86.3 billion). No trial date has been set. The federal government is seeking CAD$5 million (approximately £2.9 million or US$3.7 million) jointly from all the defendants in respect of costs pertaining to the third-party claim, now dismissed.
| |||
|
New Brunswick |
Tobacco Damages and Health Care Costs Recovery Act 2006 |
Imperial, the UK Companies and RJR Companies have all been named as defendants and served. |
The defences of Imperial, the UK Companies and the RJR Companies have been filed and document production and discoveries are substantially complete. The most recent expert report filed by the Province estimates a range of damages between CAD$11.1 billion (approximately £6.4 billion or US$8.1 billion) – CAD$23.2 billion (approximately £13.4 billion or US$17 billion), including expected future costs. Following a motion to set a trial date, the court ordered that the trial commence on 4 November 2019.
| |||
|
Ontario |
Tobacco Damages and Health Care Costs Recovery Act 2009 |
Imperial, the UK Companies and RJR Companies have all been named as defendants and served. |
The defences of Imperial, the UK Companies and the RJR Companies have been filed. The parties completed significant document production in summer of 2017 and discoveries commenced in the fall of 2018. On 15 June 2018, the province delivered an expert report quantifying its damages in the range of CAD$280 billion (approximately £161 billion or US$205 billion) – CAD$630 billion (approximately £362 billion or US$ 461 billion) in 2016/2017 dollars for the period 1954 – 2060, and the Province has amended the damages sought in its Statement of Claim to CAD$330 billion (approximately £190 billion or US$242 billion). On 31 January 2019, the Province delivered a further expert report claiming an additional CAD$9.4 billion (approximately £5.4 billion or US$6.9 billion) – CAD$10.9 billion in damages (approximately £6.3 billion or US$7.9 billion) in respect of environmental tobacco smoke. No trial date has been set.
| |||
|
Newfoundland and Labrador |
Tobacco Health Care Costs Recovery Act 2001 |
Imperial, the UK Companies and the RJR Companies have all been named as defendants and served. |
The case is at an early case management stage. The defences of Imperial, the UK Companies and the RJR Companies have been filed and the province began its document production in March 2018. Damages have not been quantified by the province. No trial date has been set.
| |||
|
Saskatchewan |
Tobacco Damages and Health Care Costs Recovery Act 2007 |
Imperial, the UK Companies and the RJR Companies have all been named as defendants and served. |
This case is at an early case management stage. The defences of Imperial, the UK Companies and the RJR Companies have been filed and the province has delivered a test shipment of documents. Damages have not been quantified by the province. No trial date has been set.
| |||
|
Manitoba |
Tobacco Damages Health Care Costs Recovery Act 2006 |
Imperial, the UK Companies and RJR Companies have all been named as defendants and served. |
This case is at an early case management stage. The defences of Imperial, the UK Companies and the RJR Companies have been filed and document production is underway. Damages have not been quantified by the province. No trial date has been set.
| |||
|
Alberta |
Crown’s Right of Recovery Act 2009 |
Imperial, the UK Companies and RJR Companies have all been named as defendants and served. |
This case is at an early case management stage. The defences of Imperial, the UK Companies and the RJR Companies have been filed and document production is underway. The province has stated its claim to be worth CAD$10 billion (approximately £5.7 billion or US$7.3 billion). No trial date has been set.
| |||
|
Quebec |
Tobacco Related Damages and Health Care Costs Recovery Act 2009 |
Imperial, Investments, Industries, the RJR Companies and Carreras Rothmans Limited have been named as defendants and served. |
The case is at an early case management stage. The defences of Imperial, Investments, Industries, Carreras Rothmans Limited and the RJR Companies have been filed. Motions over admissibility of documents and damages discovery have been filed but not heard. The province is seeking CAD$60 billion (approximately £34.4 billion or US$44 billion). No trial date has been set.
| |||
| 202 | BAT Annual Report and Form 20-F 2018 | |
|
Strategic Report
|
Governance
|
Financial Statements
|
Other Information
|
28 Contingent liabilities and financial commitments continued
|
Prince Edward Island |
Tobacco Damages and Health Care Costs Recovery Act 2009 |
Imperial, the UK Companies and RJR Companies have all been named as defendants and served. |
This case is at an early case management stage. The defences of Imperial, the UK Companies and the RJR Companies have been filed and the next step will be document production, which the parties have deferred for the time being. Damages have not been quantified by the province. No trial date has been set.
| |||
|
Nova Scotia |
Tobacco Health Care Costs Recovery Act 2005 |
Imperial, the UK Companies and RJR Companies have all been named as defendants and served. |
This case is at an early case management stage. The defences of Imperial, the UK Companies and the RJR Companies have been filed. The province provided a test document production in March 2018. Damages have not been quantified by the province. No trial date has been set.
|
Nigeria
| 61. | British American Tobacco (Nigeria) Limited (“BAT Nigeria”), the Company and Investments have been named as defendants in a medical reimbursement action by the federal government of Nigeria, filed on 6 November 2007 in the Federal High Court, and in similar actions filed by the Nigerian states of Kano (9 May 2007), Oyo (30 May 2007), Lagos (13 March 2008), Ogun (26 February 2008), and Gombe (17 October 2008) commenced in their respective High Courts. In the five cases that remain active, the plaintiffs seek a total of approximately 10.6 trillion Nigerian naira (approximately £22.9 billion or US$29.1 billion) in damages, including special, anticipatory and punitive damages, restitution and disgorgement of profits, as well as declaratory and injunctive relief. |
| 62. | The suits claim that the state and federal government plaintiffs incurred costs related to the treatment of smoking-related illnesses resulting from allegedly tortious conduct by the defendants in the manufacture, marketing, and sale of tobacco products in Nigeria, and assert that the plaintiffs are entitled to reimbursement for such costs. The plaintiffs assert causes of action for negligence, negligent design, fraud and deceit, fraudulent concealment, breach of express and implied warranty, public nuisance, conspiracy, strict liability, indemnity, restitution, unjust enrichment, voluntary assumption of a special undertaking, and performance of another’s duty to the public. |
| 63. | The Company and Investments have made a number of challenges to the jurisdiction of the Nigerian courts. Such challenges are still pending (on appeal) against the federal government and the states of Lagos, Kano, Gombe and Ogun. The underlying cases are stayed or adjourned pending the final outcome of these jurisdictional challenges. In the state of Oyo, on 13 November 2015, and 24 February 2017, respectively, the Company’s and Investments’ jurisdictional challenges were successful in the Court of Appeal and the issuance of the writ of summons was set aside. |
South Korea
| 64. | In April 2014, Korea’s National Health Insurance Service (“NHIS”) filed a healthcare recoupment action against KT&G (a Korean tobacco company), PM Korea and BAT Korea (including BAT Korea Manufacturing). The NHIS is seeking damages of roughly 54 billion Korean Won (approximately £38 million or US$ 48.2 million) in respect of health care costs allegedly incurred by the NHIS treating patients with lung (small cell and squamous cell) and laryngeal (squamous cell) cancer between 2003 and 2012. Court hearings in the case, which constitute the trial, commenced in September 2014 and remain ongoing. |
(b) Class Actions
Brazil
| 65. | There are currently two class actions being brought in Brazil. One is also a medical reimbursement claim (Săo Paulo Public Prosecutor’s Office), and is therefore discussed at paragraph 58 above. |
| 66. | In 1995, the Associaçăo de Defesa da Saúde do Fumante (“ADESF”) class action was filed against Souza Cruz and Philip Morris in the Săo Paulo Lower Civil Court alleging that the defendants are liable to a class of smokers and former smokers for failing to warn of cigarette addiction. The case was stayed in 2004 pending the defendants’ appeal from a decision issued by the Lower Civil Court that held that the defendants had not met their burden of proving that cigarette smoking was not addictive or harmful to health. |
| 67. | On 12 November 2008, the Săo Paulo Court of Appeals overturned the lower court’s unfavourable decision of 2004, returning the case to the lower court for production of evidence and a new judgment. Following production of evidence, on 16 May 2011, the lower court granted Souza Cruz’s motion to dismiss the action in its entirety on the merits. The plaintiffs’ appeal to the Sao Paolo Court of Appeals was unsuccessful. The plaintiffs then filed a Special Appeal to the Superior Court of Justice, which was rejected under procedural grounds on 20 February 2017. The plaintiffs filed an appeal of the rejection in the Superior Court of Justice on 15 March 2017. |
Canada
| 68. | There are 11 class actions being brought in Canada against Group companies. |
| 69. | Knight Class Action: The Supreme Court of British Columbia certified a class of all consumers who purchased Imperial cigarettes in British Columbia bearing ‘light’ or ‘mild’ descriptors since 1974. The plaintiff is seeking compensation for amounts spent on ‘light and mild’ products and a disgorgement of profits from Imperial on the basis that the marketing of light and mild cigarettes was deceptive because it conveyed a false and misleading message that those cigarettes are less harmful than regular cigarettes. |
| 70. | On appeal, the appellate court confirmed the certification of the class, but limited any financial liability, if proven, to 1997 onward. Imperial’s third party claim against the federal government was dismissed by the Supreme Court of Canada. The federal government is seeking a cost order of CAD$5 million (approximately £2.9 million or US$3.7 million) from Imperial relating to its now dismissed third party claim. After being dormant for several years, the plaintiff delivered a Notice of Intention to Proceed, and Imperial delivered an application to dismiss the action for delay. The application was heard on 23 June 2017 and was dismissed on 23 August 2017. Notice to class members of certification was provided on 14 February 2018. The next steps include discovery-related ones. |
| BAT Annual Report and Form 20-F 2018 | 203 | |
|
Financial Statements
|
Notes on the Accounts continued
28 Contingent liabilities and financial commitments continued
| 204 | BAT Annual Report and Form 20-F 2018 | |
|
Strategic Report
|
Governance
|
Financial Statements
|
Other Information
|
28 Contingent liabilities and financial commitments continued
| BAT Annual Report and Form 20-F 2018 | 205 | |
|
Financial Statements
|
Notes on the Accounts continued
28 Contingent liabilities and financial commitments continued
| 206 | BAT Annual Report and Form 20-F 2018 | |
|
Strategic Report
|
Governance
|
Financial Statements
|
Other Information
|
28 Contingent liabilities and financial commitments continued
| BAT Annual Report and Form 20-F 2018 | 207 | |
|
Financial Statements
|
Notes on the Accounts continued
28 Contingent liabilities and financial commitments continued
| 208 | BAT Annual Report and Form 20-F 2018 | |
|
Strategic Report
|
Governance
|
Financial Statements
|
Other Information
|
| 28 | Contingent liabilities and financial commitments continued |
| 118. | The outcomes of these matters will be decided by the relevant authorities or, if necessary, the courts. It is too early to predict the outcomes, but these could include the prosecution of individuals and/or of a Group company or companies. Accordingly, the potential for fines, penalties or other consequences cannot currently be assessed. As the investigation is ongoing, it is not yet possible to identify the timescale in which these matters might be resolved. |
Closed litigation matters
| 119. | The following matters on which the Company reported in the contingent liabilities and financial commitments note 28 to the Company’s 2017 financial statements have been dismissed, concluded or resolved as noted below: |
| Matter
|
Jurisdiction
|
Companies named as Defendants
|
Description
|
Disposition
| ||||
| Fontem | USA | R.J. Reynolds Vapor Company | Alleged patent infringement | Settlement agreed on confidential terms | ||||
| Codacons | Italy | BAT Italia | Smoking and health class action | Supreme Court decision | ||||
| Investments Indemnity | Japan | British American Tobacco (Investments) Limited | Alleged patent infringement | Settlement agreed on confidential terms | ||||
| Lights Class Actions | USA | RJRT and B&W | Four Lights class actions | Court ordered dismissal | ||||
| Parsons Class Action | USA | RJRT and B&W | Smoking and health class action
|
Court ordered dismissal | ||||
General Litigation Conclusion
| 120. | While it is impossible to be certain of the outcome of any particular case or of the amount of any possible adverse verdict, the Group believes that the defences of the Group’s companies to all these various claims are meritorious on both the law and the facts, and a vigorous defence is being made everywhere. |
| 121. | An adverse judgment was entered against one Group company, Imperial, in the Quebec class actions and an appeal has been made. The decision in that appeal is expected to be released on 1 March 2019. As at 27 February 2019, no judgment has been made available by the Court of Appeal, there is no indication of the outcome and, as such, there is no change to the management’s assessment of the outcome of the appeal. The Group continues to recognise the value of the Order for Security as a receivable and with the outcome of the appeal against the substantive decision included as a contingent liability. Subject to the outcome of the judgment, the Group will assess its response and will provide further guidance. If further adverse judgments are entered against any of the Group’s companies in any case, avenues of appeal will be pursued. Such appeals could require the appellants to post appeal bonds or substitute security (as has been necessary in Quebec) in amounts which could in some cases equal or exceed the amount of the judgment. At least in the aggregate, and despite the quality of defences available to the Group, it is not impossible that the Group’s results of operations or cash flows in particular quarterly or annual periods could be materially adversely affected by the impact of a significant increase in litigation, difficulties in obtaining the bonding required to stay execution of judgments on appeal, or any final outcome of any particular litigation. |
| 122. | Having regard to all these matters, with the exception of Fox River and certain Engle progeny cases identified above the Group does not consider it appropriate to make any provision in respect of any pending litigation because the likelihood of any resulting material loss, on an individual case basis, is not considered probable and/or the amount of any such loss cannot be reasonably estimated. The Group does not believe that the ultimate outcome of this litigation will significantly impair the Group’s financial condition. If the facts and circumstances change, then there could be a material impact on the financial statements of the Group. |
Other contingencies
| 123. | JTI Indemnities. By a purchase agreement dated 9 March 1999, amended and restated as of 11 May 1999, referred to as the 1999 Purchase Agreement, R.J. Reynolds Tobacco Holdings, Inc. (“RJR”) and RJRT sold their international tobacco business to JTI. Under the 1999 Purchase Agreement, RJR and RJRT retained certain liabilities relating to the international tobacco business sold to JTI, and agreed to indemnify JTI against: (i) any liabilities, costs and expenses arising out of the imposition or assessment of any tax with respect to the international tobacco business arising prior to the sale, other than as reflected on the closing balance sheet; (ii) any liabilities, costs and expenses that JTI or any of its affiliates, including the acquired entities, may incur after the sale with respect to any of RJR’s or RJRT’s employee benefit and welfare plans; and (iii) any liabilities, costs and expenses incurred by JTI or any of its affiliates arising out of certain activities of Northern Brands. |
| 124. | RJRT has received claims for indemnification from JTI, and several of these have been resolved. Although RJR and RJRT recognise that, under certain circumstances, they may have other unresolved indemnification obligations to JTI under the 1999 Purchase Agreement, RJR and RJRT disagree what circumstances described in such claims give rise to any indemnification obligations by RJR and RJRT and the nature and extent of any such obligation. RJR and RJRT have conveyed their position to JTI, and the parties have agreed to resolve their differences at a later date. |
| 125. | ITG Indemnity. In the Divestiture, RAI agreed to defend and indemnify, subject to certain conditions and limitations, ITG in connection with claims relating to the purchase or use of one or more of the Winston, Kool, Salem or Maverick cigarette brands on or before 12 June 2015, as well as in actions filed before 13 June 2023, relating to the purchase or use of one or more of the Winston, Kool, Salem or Maverick cigarette brands. In the purchase agreement relating to the Divestiture, ITG agreed to defend and indemnify, subject to certain conditions and limitations, RAI and its affiliates in connection with claims relating to the purchase or use of “blu” brand e-cigarettes. ITG also agreed to defend and indemnify, subject to certain conditions and limitations, RAI and its affiliates in actions filed after 12 June 2023, relating to the purchase or use of one or more of the Winston, Kool, Salem or Maverick cigarette brands after 12 June 2015. ITG has tendered a number of actions to RAI under the terms of this indemnity, and RAI has, subject to a reservation of rights, agreed to defend and indemnify ITG pursuant to the terms of the indemnity. These claims are substantially similar in nature and extent to claims asserted directly against RJRT in similar actions. |
| BAT Annual Report and Form 20-F 2018 | 209 | |
|
Financial Statements
|
Notes on the Accounts continued
| 28 | Contingent liabilities and financial commitments continued |
| 210 | BAT Annual Report and Form 20-F 2018 | |
|
Strategic Report
|
Governance
|
Financial Statements
|
Other Information
|
28 Contingent liabilities and financial commitments continued
The Netherlands
The Dutch tax authority has issued a number of assessments on various issues across the years 2003-2016 in relation to various intra-group transactions. The assessments amount to an aggregate net liability across these periods of £902 million covering tax, interest and penalties. The Group has appealed against the assessments in full.
The Group believes that its companies have meritorious defences in law and fact in each of the above matters and intends to pursue each dispute through the judicial system as necessary. The Group does not consider it appropriate to make provision for these amounts nor for any potential further amounts which may be assessed in relation to these matters in subsequent years.
While the amounts that may be payable or receivable in relation to tax disputes could be material to the results or cash flows of the Group in the period in which they are recognised, the Board does not expect these amounts to have a material effect on the Group’s financial condition.
VAT and duty disputes
Bangladesh
On 25 July 2018, the Appellate Division of the Supreme Court of Bangladesh has reversed the decision of the High Court Division against BAT Bangladesh in respect of the retrospective demands for VAT and Supplementary Duty amounting to approximately £170 million. The Attorney General’s Office has 30 days from receipt of the certified Court Order, which remains to be issued, in which to seek a review of this decision.
Egypt
British American Tobacco Egypt LLC is subject to two ongoing civil cases concerning the imposition of sales tax on low price category brands brought by the Egyptian tax authority for approximately £102 million.
Management believes that the tax claims are unfounded and has appealed the tax claims. These cases are under review by the Council of State and hearings are scheduled for 27 March 2019 and 24 April 2019 respectively.
Operating leases
Total future minimum lease payments under non-cancellable operating leases comprise leases where payments fall due:
|
2018 £m |
2017 £m |
|||||||
| Property | ||||||||
| Within one year | 111 | 75 | ||||||
| Between one and five years | 269 | 183 | ||||||
| Beyond five years | 137 | 117 | ||||||
| 517 | 375 | |||||||
| Plant and equipment and other | ||||||||
| Within one year | 66 | 32 | ||||||
| Between one and five years | 107 | 38 | ||||||
| 173 | 70 | |||||||
| Total operating lease commitments (note 31) | 690 | 445 | ||||||
Performance guarantees
As part of the acquisition of TDR in 2015, the Group has committed to keeping the manufacturing facility in Kanfanar, Croatia operational for at least five years following completion of the acquisition. A similar commitment for four years following completion was given in respect of the packaging plant in Rovinj, Croatia, which was disposed of in December 2018. The maximum exposure under these guarantees is £46 million (2017: £46 million) of which £1 million relates to the Rovinj plant.
| BAT Annual Report and Form 20-F 2018 | 211 | |
|
Financial Statements
|
Notes on the Accounts continued
29 Interests in subsidiaries
Subsidiaries with material non-controlling interests
Non-controlling interests principally arise from the Group’s listed investment in Malaysia (British American Tobacco (Malaysia) Berhad), where the Group held 50% of the listed holding company in 2018, 2017 and 2016. The Group has assessed that it exercises de facto control over Malaysia as it has the practical ability to direct the business through effective control of the company’s board as a result of the Group controlling the largest shareholding block in comparison to other shareholdings which are widely dispersed. Summarised financial information for Malaysia is shown below as required by IFRS 12. As part of the Group’s reporting processes, Malaysia report consolidated financial information for the Malaysia group which has been adjusted to comply with Group accounting policies which may differ to local accounting practice. Goodwill in respect of Malaysia, which arose as a result of the acquisition of the Rothmans group referred to in note 9, has not been included as part of the net assets below. In addition, no adjustments have been made to the information below for the elimination of intercompany transactions and balances with the rest of the Group.
| Summarised financial information
|
2018 £m
|
2017 £m Revised
|
2016 £m Revised
|
|||||||||
| Revenue | 231 | 237 | 317 | |||||||||
| Profit for the year | 87 | 89 | 129 | |||||||||
| – Attributable to non-controlling interests | 43 | 44 | 64 | |||||||||
| Total comprehensive income | 87 | 87 | 146 | |||||||||
| – Attributable to non-controlling interests | 43 | 43 | 73 | |||||||||
| Dividends paid to non-controlling interests | (40 | ) | (64 | ) | (59 | ) | ||||||
| Summary net assets: | ||||||||||||
| Non-current assets | 16 | 18 | 31 | |||||||||
| Current assets | 116 | 101 | 103 | |||||||||
| Non-current liabilities | – | (5 | ) | (4 | ) | |||||||
| Current liabilities | (129 | ) | (120 | ) | (94 | ) | ||||||
| Total equity at the end of the year | 3 | (6 | ) | 36 | ||||||||
| – Attributable to non-controlling interests | 1 | (3 | ) | 18 | ||||||||
| Net cash generated from operating activities | 86 | 67 | 108 | |||||||||
| Net cash generated in investing activities | (2 | ) | 14 | 45 | ||||||||
| Net cash used in financing activities | (77 | ) | (86 | ) | (151 | ) | ||||||
| Differences on exchange | 1 | (1 | ) | 1 | ||||||||
| Increase/(decrease) in net cash and cash equivalents | 8 | (6 | ) | 3 | ||||||||
| Net cash and cash equivalents at 1 January | 2 | 8 | 5 | |||||||||
| Net cash and cash equivalents at 31 December | 10 | 2 | 8 | |||||||||
With effect from 1 January 2018, the Group has adopted IFRS 15 Revenue from Contracts with Customers. The Group has revised 2017, as explained in notes 1 and 31.
Other shareholdings
The Group holds 92% of the equity shares of PT Bentoel Internasional Investama Tbk (“Bentoel”). In 2011, the Group sold 984 million shares, representing approximately 14% of Bentoel’s share capital, for the purposes of fulfilling certain obligations pursuant to Bapepam LK (Indonesia) takeover regulations. The Group simultaneously entered into a total return swap on 971 million of the shares. In June 2016, the Group and other investors participated in a rights issue by Bentoel, increasing its stake in Bentoel to 92%. Simultaneously, the Group amended the total return swap to take account of an addition 1,684 million shares. The shares subject to the total return swap now represent 7% of Bentoel’s issued capital. While the Group does not have legal ownership of these shares, it retains the risks and rewards associated with them which results in the Group continuing to recognise an effective interest in 99% of Bentoel’s net assets and results.
Refer to note 11 for information on the Group’s 42% investment in Tisak d.d.
| 212 | BAT Annual Report and Form 20-F 2018 | |
|
Strategic Report
|
Governance
|
Financial Statements
|
Other Information
|
30 Condensed consolidating financial information
The following consolidating financial information is required by the rules of the Securities and Exchange Commission and has been prepared as a requirement of the Regulation S-X 3-10.
The following condensed consolidating financial information relates to the guarantees of:
| – | US$11 billion RAI unsecured notes; |
| – | US$231 million of Lorillard unsecured notes; and |
| – | US$17.2 billion of bonds representing the registered portion (99.7%) of a total US$17.25 billion of bonds issued by BATCAP in connection with the acquisition of RAI. |
The condensed consolidating financial information has been prepared as a requirement of the Regulation S-X 3-10. All financial statements and financial information provided by or with respect to the US business or RAI (and/or the RAI Group) are prepared on the basis of US GAAP and constitute the primary financial statements or financial information of the US business or RAI (and/or the RAI Group). Solely for the purpose of consolidation within the results of BAT p.l.c. and the BAT Group, this financial information is then converted to International Financial Reporting Standards as issued by the IASB and adopted by the European Union (IFRS). To the extent any such financial information provided in these financial statements relates to the US business or RAI (and/or the RAI Group) it is provided as an explanation of the US business’ or RAI’s (and/or the RAI Group’s) primary US GAAP-based financial statements and information.
With effect from 1 January 2018, the Group has adopted IFRS 15 Revenue from Contracts with Customers. The Group has revised the results for the twelve-month period ended 31 December 2017 and 31 December 2016, as explained in note 31.
(a) RAI and Lorillard unsecured notes
The following condensed consolidating financial information relates to the guarantees of: US$11 billion (2017: US$12.2 billion) RAI unsecured notes (referred to as “RB” below) and US$231 million of Lorillard unsecured notes (referred to as “LB” below). The subsidiaries disclosed below are wholly owned and the guarantees provided are full and unconditional, and joint and several.
The following condensed consolidating financial information includes the accounts and activities of:
| a. | British American Tobacco p.l.c. (parent guarantor of RB and LB), referred to as “BAT p.l.c.” in financials below; |
| b. | R.J. Reynolds Tobacco Company (issuer of LB), referred to as “RJRT” in financials below; |
| c. | Reynolds American Inc. (issuer of RB, subsidiary guarantor of LB), referred to as “RAI” in financials below; |
| d. | R.J. Reynolds Tobacco Holdings Inc. (subsidiary guarantor of RB and LB), referred to as “RJRTH” in financials below; |
| e. | other direct and indirect subsidiaries of the BAT Group that are not guarantors; |
| f. | elimination entries necessary to consolidate the parent with the issuer, the subsidiary guarantors and non-guarantor subsidiaries; and |
| g. | the BAT Group on a consolidated basis. |
| BAT Annual Report and Form 20-F 2018 | 213 | |
|
Financial Statements |
Notes on the Accounts continued
30 Condensed consolidating financial information continued
|
Condensed Consolidated Income Statement |
||||||||||||||||||||||||||||
|
For the year ended 31 December 2018 £m
|
||||||||||||||||||||||||||||
| BAT p.l.c. | RJRT | RAI | RJRTH |
All other |
BAT Group | |||||||||||||||||||||||
| Parent guarantor |
Issuer (LB) |
Issuer (RB) |
Subsidiary (LB & RB) |
Non-guarantor subsidiaries |
Eliminations | Consolidated | ||||||||||||||||||||||
| Revenue | – | 7,752 | – | – | 16,959 | (219 | ) | 24,492 | ||||||||||||||||||||
| Raw materials and consumables used | – | (662 | ) | – | – | (4,161 | ) | 159 | (4,664 | ) | ||||||||||||||||||
| Changes in inventories of finished goods and work in progress | – | (4 | ) | – | – | 118 | – | 114 | ||||||||||||||||||||
| Employee benefit costs | (5 | ) | (169 | ) | (13 | ) | – | (2,822 | ) | 4 | (3,005 | ) | ||||||||||||||||
| Depreciation, amortisation and impairment costs | – | (91 | ) | – | – | (947 | ) | – | (1,038 | ) | ||||||||||||||||||
| Other operating income | – | 3 | 22 | – | 3,847 | (3,787 | ) | 85 | ||||||||||||||||||||
| Loss on reclassification from amortised cost to fair value | – | – | – | – | (3 | ) | – | (3 | ) | |||||||||||||||||||
| Other operating expenses | (124 | ) | (6,579 | ) | (17 | ) | – | (3,819 | ) | 3,871 | (6,668 | ) | ||||||||||||||||
| (Loss)/profit from operations | (129 | ) | 250 | (8 | ) | – | 9,172 | 28 | 9,313 | |||||||||||||||||||
| Net finance income/(costs) | 95 | 9 | (421 | ) | 3 | (947 | ) | (120 | ) | (1,381 | ) | |||||||||||||||||
| Share of post-tax results of associates and joint ventures | – | – | – | – | 419 | – | 419 | |||||||||||||||||||||
| Profit before taxation | (34 | ) | 259 | (429 | ) | 3 | 8,644 | (92 | ) | 8,351 | ||||||||||||||||||
| Taxation on ordinary activities | – | (100 | ) | 93 | 1 | (2,135 | ) | – | (2,141 | ) | ||||||||||||||||||
| Equity income from subsidiaries | 6,210 | 2,569 | 3,436 | 2,755 | – | (14,970 | ) | – | ||||||||||||||||||||
| Profit for the year | 6,176 | 2,728 | 3,100 | 2,759 | 6,509 | (15,062 | ) | 6,210 | ||||||||||||||||||||
| Attributable to: | ||||||||||||||||||||||||||||
| Owners of the parent | 6,176 | 2,728 | 3,100 | 2,759 | 6,331 | (15,062 | ) | 6,032 | ||||||||||||||||||||
| Non-controlling interests | – | – | – | – | 178 | – | 178 | |||||||||||||||||||||
| 6,176 | 2,728 | 3,100 | 2,759 | 6,509 | (15,062 | ) | 6,210 | |||||||||||||||||||||
| 214 | BAT Annual Report and Form 20-F 2018 | |
|
Strategic Report
|
Governance
|
Financial Statements
|
Other Information
|
| 30 | Condensed consolidating financial information continued |
|
Condensed Consolidated Income Statement |
||||||||||||||||||||||||||||
|
For the year ended 31 December 2017 £m Revised |
||||||||||||||||||||||||||||
| BAT p.l.c. | RJRT | RAI | RJRTH |
All other |
BAT Group | |||||||||||||||||||||||
| Parent guarantor
|
Issuer (LB) |
Issuer (RB) |
Subsidiary (LB & RB) |
Non-guarantor subsidiaries |
Eliminations | Consolidated | ||||||||||||||||||||||
| Revenue | – | 3,459 | – | – | 16,243 | (138 | ) | 19,564 | ||||||||||||||||||||
| Raw materials and consumables used | – | (346 | ) | – | – | (4,286 | ) | 112 | (4,520 | ) | ||||||||||||||||||
| Changes in inventories of finished goods and work in progress | – | (7 | ) | – | – | (507 | ) | 1 | (513 | ) | ||||||||||||||||||
| Employee benefit costs | (8 | ) | (117 | ) | (35 | ) | (2 | ) | (2,525 | ) | 8 | (2,679 | ) | |||||||||||||||
| Depreciation, amortisation and impairment costs | – | (28 | ) | – | – | (874 | ) | – | (902 | ) | ||||||||||||||||||
| Other operating income | – | 7 | 34 | – | 1,859 | (1,756 | ) | 144 | ||||||||||||||||||||
| Other operating expenses | (101 | ) | (2,889 | ) | (6 | ) | – | (3,499 | ) | 1,813 | (4,682 | ) | ||||||||||||||||
| (Loss)/profit from operations | (109 | ) | 79 | (7 | ) | (2 | ) | 6,411 | 40 | 6,412 | ||||||||||||||||||
| Net finance income/(costs) | 3 | 11 | (190 | ) | 9 | (908 | ) | (19 | ) | (1,094 | ) | |||||||||||||||||
| Share of post-tax results of associates and joint ventures | – | – | – | – | 24,209 | – | 24,209 | |||||||||||||||||||||
| Profit before taxation | (106 | ) | 90 | (197 | ) | 7 | 29,712 | 21 | 29,527 | |||||||||||||||||||
| Taxation on ordinary activities | – | (240 | ) | 61 | (3 | ) | 8,311 | – | 8,129 | |||||||||||||||||||
| Equity income from subsidiaries | 37,656 | 3,870 | 4,259 | 3,893 | – | (49,678 | ) | – | ||||||||||||||||||||
| Profit for the year | 37,550 | 3,720 | 4,123 | 3,897 | 38,023 | (49,657 | ) | 37,656 | ||||||||||||||||||||
| Attributable to: | ||||||||||||||||||||||||||||
| Owners of the parent | 37,550 | 3,720 | 4,123 | 3,897 | 37,852 | (49,657 | ) | 37,485 | ||||||||||||||||||||
| Non-controlling interests | – | – | – | – | 171 | – | 171 | |||||||||||||||||||||
| 37,550 | 3,720 | 4,123 | 3,897 | 38,023 | (49,657 | ) | 37,656 | |||||||||||||||||||||
| BAT Annual Report and Form 20-F 2018 | 215 | |
|
Financial Statements
|
Notes on the Accounts continued
| 30 | Condensed consolidating financial information continued |
| Condensed Consolidated Income Statement | ||||||||||||||||||||||||||||
| For the year ended 31 December 2016 £m Revised |
||||||||||||||||||||||||||||
| BAT p.l.c. | RJRT | RAI | RJRTH | All other companies |
BAT Group | |||||||||||||||||||||||
| Parent guarantor | Issuer (LB) | Issuer (RB) Subsidiary guarantor (LB) |
Subsidiary guarantor (LB & RB) |
Non-guarantor subsidiaries |
Eliminations | Consolidated | ||||||||||||||||||||||
| Revenue | – | – | – | – | 14,130 | – | 14,130 | |||||||||||||||||||||
| Raw materials and consumables used | – | – | – | – | (3,777 | ) | – | (3,777 | ) | |||||||||||||||||||
| Changes in inventories of finished goods and work in progress | – | – | – | – | 44 | – | 44 | |||||||||||||||||||||
| Employee benefit costs | (7 | ) | – | – | – | (2,274 | ) | 7 | (2,274 | ) | ||||||||||||||||||
| Depreciation, amortisation and impairment costs | – | – | – | – | (607 | ) | – | (607 | ) | |||||||||||||||||||
| Other operating income | – | – | – | – | 176 | – | 176 | |||||||||||||||||||||
| Other operating expenses | (75 | ) | – | – | – | (3,037 | ) | 75 | (3,037 | ) | ||||||||||||||||||
| (Loss)/profit from operations | (82 | ) | – | – | – | 4,655 | 82 | 4,655 | ||||||||||||||||||||
| Net finance (costs)/income | (54 | ) | – | – | – | (637 | ) | 54 | (637 | ) | ||||||||||||||||||
| Share of post-tax results of associates and joint ventures | – | – | – | – | 2,227 | – | 2,227 | |||||||||||||||||||||
| Profit before taxation | (136 | ) | – | – | – | 6,245 | 136 | 6,245 | ||||||||||||||||||||
| Taxation on ordinary activities | – | – | – | – | (1,406 | ) | – | (1,406 | ) | |||||||||||||||||||
| Equity income from subsidiaries | 4,839 | – | – | – | – | (4,839 | ) | – | ||||||||||||||||||||
| Profit for the year | 4,703 | – | – | – | 4,839 | (4,703 | ) | 4,839 | ||||||||||||||||||||
| Attributable to: | ||||||||||||||||||||||||||||
| Owners of the parent | 4,703 | – | – | – | 4,648 | (4,703 | ) | 4,648 | ||||||||||||||||||||
| Non-controlling interests | – | – | – | – | 191 | – | 191 | |||||||||||||||||||||
| 4,703 | – | – | – | 4,839 | (4,703 | ) | 4,839 | |||||||||||||||||||||
| 216 | BAT Annual Report and Form 20-F 2018 | |
|
Strategic Report
|
Governance
|
Financial Statements
|
Other Information
|
| 30 | Condensed consolidating financial information continued |
|
Condensed Consolidated Statement of Comprehensive Income |
||||||||||||||||||||||||||||
| For the year ended 31 December 2018 £m
|
||||||||||||||||||||||||||||
| BAT p.l.c. | RJRT | RAI | RJRTH | All other companies |
BAT Group | |||||||||||||||||||||||
| Parent guarantor | Issuer (LB) | Issuer (RB) Subsidiary guarantor (LB) |
Subsidiary guarantor (LB & RB) |
Non-guarantor subsidiaries |
Eliminations | Consolidated | ||||||||||||||||||||||
| Profit for the year | 6,176 | 2,728 | 3,100 | 2,759 | 6,509 | (15,062 | ) | 6,210 | ||||||||||||||||||||
| Other comprehensive income/(expense) Items that may be reclassified subsequently to profit or loss: | – | – | – | – | 3,099 | – | 3,099 | |||||||||||||||||||||
| Differences on exchange
|
– | – | – | – | 3,868 | – | 3,868 | |||||||||||||||||||||
| Cash flow hedges
|
– | – | – | – | (41 | ) | – | (41 | ) | |||||||||||||||||||
| Net investment hedges
|
– | – | – | – | (708 | ) | – | (708 | ) | |||||||||||||||||||
| Associates–share of OCI, net of tax
|
– | – | – | – | (38 | ) | – | (38 | ) | |||||||||||||||||||
| Tax on items that may be reclassified | – | – | – | – | 18 | – | 18 | |||||||||||||||||||||
| Items that will not be reclassified subsequently to profit or loss: | – | – | – | – | 115 | – | 115 | |||||||||||||||||||||
| Retirement benefit schemes
|
– | – | – | – | 142 | – | 142 | |||||||||||||||||||||
| Associates – share of OCI, net of tax
|
– | – | – | – | 6 | – | 6 | |||||||||||||||||||||
| Tax on items that will not be reclassified | – | – | – | – | (33 | ) | – | (33 | ) | |||||||||||||||||||
| Total other comprehensive income for the year, net of tax | – | – | – | – | 3,214 | – | 3,214 | |||||||||||||||||||||
|
Share of subsidiaries OCI (other reserves)
|
115 | – | – | – | – | (115 | ) | – | ||||||||||||||||||||
| Share of subsidiaries OCI (retained earnings) | 3,099 | – | – | – | – | (3,099 | ) | – | ||||||||||||||||||||
| Total comprehensive income/ (expense) for the year, net of tax | 9,390 | 2,728 | 3,100 | 2,759 | 9,723 | (18,276 | ) | 9,424 | ||||||||||||||||||||
| Attributable to:
|
||||||||||||||||||||||||||||
| Owners of the parent
|
9,390 | 2,728 | 3,100 | 2,759 | 9,538 | (18,276 | ) | 9,239 | ||||||||||||||||||||
| Non-controlling interests | – | – | – | – | 185 | – | 185 | |||||||||||||||||||||
| 9,390 | 2,728 | 3,100 | 2,759 | 9,723 | (18,276 | ) | 9,424 | |||||||||||||||||||||
| BAT Annual Report and Form 20-F 2018 | 217 | |
|
Financial Statements
|
Notes on the Accounts continued
30 Condensed consolidating financial information continued
|
Condensed Consolidated Statement of Comprehensive Income |
||||||||||||||||||||||||||||
| For the year ended 31 December 2017 £m Revised |
||||||||||||||||||||||||||||
| BAT p.l.c. | RJRT | RAI | RJRTH | All other companies |
BAT Group | |||||||||||||||||||||||
| Parent guarantor | Issuer (LB) | Issuer (RB) Subsidiary guarantor (LB) |
Subsidiary guarantor (LB & RB) |
Non-guarantor subsidiaries |
Eliminations | Consolidated | ||||||||||||||||||||||
| Profit for the year | 37,550 | 3,720 | 4,123 | 3,897 | 38,023 | (49,657 | ) | 37,656 | ||||||||||||||||||||
| Other comprehensive income/(expense) Items that may be reclassified subsequently to profit or loss: | – | – | – | – | (3,809 | ) | – | (3,809 | ) | |||||||||||||||||||
| Differences on exchange
|
– | – | – | – | (3,084 | ) | – | (3,084 | ) | |||||||||||||||||||
| Cash flow hedges
|
– | – | – | – | (171 | ) | – | (171 | ) | |||||||||||||||||||
| Investments held at fair value
|
– | – | – | – | (27 | ) | – | (27 | ) | |||||||||||||||||||
| Net investment hedges
|
– | – | – | – | 357 | – | 357 | |||||||||||||||||||||
| Associates – share of OCI, net of tax
|
– | – | – | – | (918 | ) | – | (918 | ) | |||||||||||||||||||
| Tax on items that may be reclassified | – | – | – | – | 34 | – | 34 | |||||||||||||||||||||
| Items that will not be reclassified subsequently to profit or loss: | – | – | – | – | 681 | – | 681 | |||||||||||||||||||||
| Retirement benefit schemes
|
– | – | – | – | 827 | – | 827 | |||||||||||||||||||||
| Associates–share of OCI, net of tax
|
– | – | – | – | 25 | – | 25 | |||||||||||||||||||||
| Tax on items that will not be reclassified | – | – | – | – | (171 | ) | – | (171 | ) | |||||||||||||||||||
| Total other comprehensive expense for the year, net of tax | – | – | – | – | (3,128 | ) | – | (3,128 | ) | |||||||||||||||||||
| Share of subsidiaries OCI (other reserves)
|
681 | – | – | – | – | (681 | ) | – | ||||||||||||||||||||
| Share of subsidiaries OCI (retained earnings) | (3,809 | ) | – | – | – | – | 3,809 | – | ||||||||||||||||||||
| Total comprehensive income/ (expense) for the year, net of tax | 34,422 | 3,720 | 4,123 | 3,897 | 34,895 | (46,529 | ) | 34,528 | ||||||||||||||||||||
| Attributable to:
|
||||||||||||||||||||||||||||
| Owners of the parent
|
34,422 | 3,720 | 4,123 | 3,897 | 34,728 | (46,529 | ) | 34,361 | ||||||||||||||||||||
| Non-controlling interests | – | – | – | – | 167 | – | 167 | |||||||||||||||||||||
| 34,422 | 3,720 | 4,123 | 3,897 | 34,895 | (46,529 | ) | 34,528 | |||||||||||||||||||||
| 218 | BAT Annual Report and Form 20-F 2018 | |
|
Strategic Report
|
Governance
|
Financial Statements
|
Other Information
|
30 Condensed consolidating financial information continued
|
Condensed Consolidated Statement of Comprehensive Income
|
||||||||||||||||||||||||||||
| For the year ended 31 December 2016 £m
|
||||||||||||||||||||||||||||
| BAT p.l.c. | RJRT | RAI | RJRTH |
All other |
BAT Group | |||||||||||||||||||||||
| Parent guarantor | Issuer (LB) | Issuer (RB) Subsidiary guarantor (LB) |
Subsidiary guarantor (LB & RB) |
Non-guarantor subsidiaries |
Eliminations | Consolidated | ||||||||||||||||||||||
| Profit for the year | 4,703 | – | – | – | 4,839 | (4,703 | ) | 4,839 | ||||||||||||||||||||
| Other comprehensive income/(expense) Items that may be reclassified subsequently to profit or loss: | – | – | – | – | 1,760 | – | 1,760 | |||||||||||||||||||||
| Differences on exchange
|
– | – | – | – | 1,270 | – | 1,270 | |||||||||||||||||||||
| Cash flow hedges
|
– | – | – | – | 55 | – | 55 | |||||||||||||||||||||
| Net investment hedges
|
– | – | – | – | (961 | ) | – | (961 | ) | |||||||||||||||||||
| Associates – share of OCI, net of tax
|
– | – | – | – | 1,415 | – | 1,415 | |||||||||||||||||||||
| Tax on items that may be reclassified | – | – | – | – | (19 | ) | – | (19 | ) | |||||||||||||||||||
| Items that will not be reclassified subsequently to profit or loss: | – | – | – | – | (173 | ) | – | (173 | ) | |||||||||||||||||||
| Retirement benefit schemes
|
– | – | – | – | (229 | ) | – | (229 | ) | |||||||||||||||||||
| Associates–share of OCI, net of tax
|
– | – | – | – | 20 | – | 20 | |||||||||||||||||||||
| Tax on items that will not be reclassified | – | – | – | – | 36 | – | 36 | |||||||||||||||||||||
| Total other comprehensive income for the year, net of tax | – | – | – | – | 1,587 | – | 1,587 | |||||||||||||||||||||
| Share of subsidiaries OCI (other reserves) |
(173 | ) | – | – | – | – | 173 | – | ||||||||||||||||||||
|
Share of
subsidiaries OCI |
1,760 | – | – | – | – | (1,760 | ) | – | ||||||||||||||||||||
| Total comprehensive income/ (expense) for the year, net of tax | 6,290 | – | – | – | 6,426 | (6,290 | ) | 6,426 | ||||||||||||||||||||
| Attributable to:
|
||||||||||||||||||||||||||||
| Owners of the parent
|
6,290 | – | – | – | 6,180 | (6,290 | ) | 6,180 | ||||||||||||||||||||
| Non-controlling interests | – | – | – | – | 246 | – | 246 | |||||||||||||||||||||
| 6,290 | – | – | – | 6,426 | (6,290 | ) | 6,426 | |||||||||||||||||||||
| BAT Annual Report and Form 20-F 2018 | 219 | |
|
Financial Statements
|
Notes on the Accounts continued
30 Condensed consolidating financial information continued
| Condensed Consolidated Balance Sheet | ||||||||||||||||||||||||||||
| As at 31 December 2018 £m
|
||||||||||||||||||||||||||||
| BAT p.l.c. | RJRT | RAI | RJRTH |
All other |
BAT Group | |||||||||||||||||||||||
| Parent guarantor |
Issuer (LB) | Issuer (RB) Subsidiary guarantor (LB) |
Subsidiary guarantor (LB & RB) |
Non- guarantor subsidiaries |
Eliminations | Consolidated | ||||||||||||||||||||||
| Assets
|
||||||||||||||||||||||||||||
| Intangible assets
|
– | 2,935 | – | 7,737 | 113,342 | (1 | ) | 124,013 | ||||||||||||||||||||
| Property, plant and equipment
|
– | 763 | 1 | – | 4,402 | – | 5,166 | |||||||||||||||||||||
| Investments in subsidiaries
|
32,543 | 21,368 | 30,625 | 19,636 | – | (104,172 | ) | – | ||||||||||||||||||||
| Investments in associates and joint ventures
|
– | – | – | – | 1,737 | – | 1,737 | |||||||||||||||||||||
| Retirement benefit assets
|
– | – | – | – | 1,147 | – | 1,147 | |||||||||||||||||||||
| Deferred tax assets
|
– | 521 | 17 | 4 | (198 | ) | – | 344 | ||||||||||||||||||||
| Trade and other receivables
|
– | 5 | 464 | 32 | 762 | (578 | ) | 685 | ||||||||||||||||||||
| Investments held at fair value
|
– | – | – | – | 39 | – | 39 | |||||||||||||||||||||
| Derivative financial instruments | – | – | – | – | 556 | – | 556 | |||||||||||||||||||||
| Total non-current assets
|
32,543 | 25,592 | 31,107 | 27,409 | 121,787 | (104,751 | ) | 133,687 | ||||||||||||||||||||
| Inventories
|
– | 711 | – | – | 5,319 | (1 | ) | 6,029 | ||||||||||||||||||||
| Income tax receivable
|
– | – | – | – | 74 | – | 74 | |||||||||||||||||||||
| Trade and other receivables
|
7,306 | 1,102 | 820 | 59 | 4,431 | (10,130 | ) | 3,588 | ||||||||||||||||||||
| Investments held at fair value
|
– | – | – | – | 178 | – | 178 | |||||||||||||||||||||
| Derivative financial instruments
|
– | – | – | – | 179 | – | 179 | |||||||||||||||||||||
| Cash and cash equivalents | 6 | – | – | – | 2,602 | (6 | ) | 2,602 | ||||||||||||||||||||
| 7,312 | 1,813 | 820 | 59 | 12,783 | (10,137 | ) | 12,650 | |||||||||||||||||||||
| Assets classified as held-for-sale
|
– | – | – | – | 5 | – | 5 | |||||||||||||||||||||
| Total current assets
|
7,312 | 1,813 | 820 | 59 | 12,788 | (10,137 | ) | 12,655 | ||||||||||||||||||||
| Total assets
|
39,855 | 27,405 | 31,927 | 27,468 | 134,575 | (114,888 | ) | 146,342 | ||||||||||||||||||||
| Equity – capital and reserves
|
||||||||||||||||||||||||||||
| Share capital
|
614 | 14,948 | 14,348 | 22,586 | 1,921 | (53,803 | ) | 614 | ||||||||||||||||||||
| Share premium, capital redemption and merger reserves
|
22,854 | – | – | – | 28,755 | (25,003 | ) | 26,606 | ||||||||||||||||||||
| Other reserves
|
204 | (46 | ) | (44 | ) | (46 | ) | (335 | ) | (66 | ) | (333 | ) | |||||||||||||||
| Retained earnings
|
11,291 | 8,420 | 6,853 | 4,888 | 36,974 | (29,869 | ) | 38,557 | ||||||||||||||||||||
| Owners of the parent
|
34,963 | 23,322 | 21,157 | 27,428 | 67,315 | (108,741 | ) | 65,444 | ||||||||||||||||||||
| Non-controlling interests
|
– | – | – | – | 244 | – | 244 | |||||||||||||||||||||
| Total equity
|
34,963 | 23,322 | 21,157 | 27,428 | 67,559 | (108,741 | ) | 65,688 | ||||||||||||||||||||
| Liabilities
|
||||||||||||||||||||||||||||
| Borrowings
|
1,571 | 126 | 8,140 | – | 35,018 | (1,571 | ) | 43,284 | ||||||||||||||||||||
| Retirement benefit liabilities
|
– | 853 | 53 | 18 | 741 | – | 1,665 | |||||||||||||||||||||
| Deferred tax liabilities
|
– | – | – | – | 17,776 | – | 17,776 | |||||||||||||||||||||
| Other provisions for liabilities
|
1 | 1 | – | – | 330 | (1 | ) | 331 | ||||||||||||||||||||
| Trade and other payables
|
8 | 15 | 89 | – | 1,529 | (586 | ) | 1,055 | ||||||||||||||||||||
| Derivative financial instruments
|
– | – | – | – | 214 | – | 214 | |||||||||||||||||||||
| Total non-current liabilities
|
1,580 | 995 | 8,282 | 18 | 55,608 | (2,158 | ) | 64,325 | ||||||||||||||||||||
| Borrowings
|
2,062 | 98 | 1,573 | – | 3,497 | (3,005 | ) | 4,225 | ||||||||||||||||||||
| Income tax payable
|
– | 8 | 133 | – | 712 | – | 853 | |||||||||||||||||||||
| Other provisions for liabilities
|
– | 20 | – | – | 298 | – | 318 | |||||||||||||||||||||
| Trade and other payables
|
1,248 | 2,962 | 782 | 22 | 6,599 | (982 | ) | 10,631 | ||||||||||||||||||||
| Derivative financial instruments
|
2 | – | – | – | 302 | (2 | ) | 302 | ||||||||||||||||||||
| Total current liabilities
|
3,312 | 3,088 | 2,488 | 22 | 11,408 | (3,989 | ) | 16,329 | ||||||||||||||||||||
| Total equity and liabilities
|
39,855 | 27,405 | 31,927 | 27,468 | 134,575 | (114,888 | ) | 146,342 | ||||||||||||||||||||
| 220 | BAT Annual Report and Form 20-F 2018 | |
|
Strategic Report
|
Governance
|
Financial Statements
|
Other Information
|
30 Condensed consolidating financial information continued
| Condensed Consolidated Balance Sheet
|
||||||||||||||||||||||||||||
| As at 31 December 2017 £m Revised |
||||||||||||||||||||||||||||
| BAT p.l.c. | RJRT | RAI | RJRTH | All other companies |
BAT Group | |||||||||||||||||||||||
| Parent guarantor |
Issuer (LB) | Issuer (RB) Subsidiary guarantor (LB) |
Subsidiary guarantor (LB & RB) |
Non- guarantor subsidiaries |
Eliminations | Consolidated | ||||||||||||||||||||||
| Assets
|
||||||||||||||||||||||||||||
| Intangible assets
|
– | 2,780 | – | 7,284 | 107,722 | (1 | ) | 117,785 | ||||||||||||||||||||
| Property, plant and equipment
|
– | 677 | 2 | – | 4,203 | – | 4,882 | |||||||||||||||||||||
| Investments in subsidiaries
|
58,255 | 17,217 | 29,165 | 18,972 | – | (123,609 | ) | – | ||||||||||||||||||||
| Investments in associates and joint ventures
|
– | – | – | – | 1,577 | – | 1,577 | |||||||||||||||||||||
| Retirement benefit assets
|
– | – | – | – | 1,123 | – | 1,123 | |||||||||||||||||||||
| Deferred tax assets
|
– | 320 | 16 | 4 | (7 | ) | – | 333 | ||||||||||||||||||||
| Trade and other receivables
|
– | 23 | 860 | 42 | 826 | (995 | ) | 756 | ||||||||||||||||||||
| Investments held at fair value
|
– | – | – | – | 42 | – | 42 | |||||||||||||||||||||
| Derivative financial instruments
|
– | – | – | – | 590 | – | 590 | |||||||||||||||||||||
| Total non-current assets
|
58,255 | 21,017 | 30,043 | 26,302 | 116,076 | (124,605 | ) | 127,088 | ||||||||||||||||||||
|
Inventories
|
– | 721 | – | – | 5,144 | (1 | ) | 5,864 | ||||||||||||||||||||
| Income tax receivable
|
– | – | 339 | – | 121 | – | 460 | |||||||||||||||||||||
| Trade and other receivables
|
7,365 | – | 571 | 9 | 5,725 | (9,617 | ) | 4,053 | ||||||||||||||||||||
| Investments held at fair value
|
– | – | – | – | 65 | – | 65 | |||||||||||||||||||||
| Derivative financial instruments
|
– | – | – | – | 228 | – | 228 | |||||||||||||||||||||
| Cash and cash equivalents | 5 | 2 | 2 | – | 3,287 | (5 | ) | 3,291 | ||||||||||||||||||||
| 7,370 | 723 | 912 | 9 | 14,570 | (9,623 | ) | 13,961 | |||||||||||||||||||||
| Assets classified as held-for-sale | – | – | – | – | 5 | – | 5 | |||||||||||||||||||||
| Total current assets | 7,370 | 723 | 912 | 9 | 14,575 | (9,623 | ) | 13,966 | ||||||||||||||||||||
| Total assets | 65,625 | 21,740 | 30,955 | 26,311 | 130,651 | (134,228 | ) | 141,054 | ||||||||||||||||||||
| Equity – capital and reserves
|
||||||||||||||||||||||||||||
| Share capital
|
614 | 14,070 | 13,509 | 21,260 | 1,297 | (50,136 | ) | 614 | ||||||||||||||||||||
| Share premium, capital redemption and merger reserves
|
22,939 | – | – | – | 26,602 | (22,939 | ) | 26,602 | ||||||||||||||||||||
| Other reserves
|
805 | (25 | ) | (24 | ) | (24 | ) | (3,392 | ) | (732 | ) | (3,392 | ) | |||||||||||||||
| Retained earnings
|
36,511 | 5,128 | 6,276 | 5,055 | 37,434 | (53,469 | ) | 36,935 | ||||||||||||||||||||
| Owners of the parent
|
60,869 | 19,173 | 19,761 | 26,291 | 61,941 | (127,276 | ) | 60,759 | ||||||||||||||||||||
| Non-controlling interests
|
– | – | – | – | 222 | – | 222 | |||||||||||||||||||||
| Total equity
|
60,869 | 19,173 | 19,761 | 26,291 | 62,163 | (127,276 | ) | 60,981 | ||||||||||||||||||||
| Liabilities
|
||||||||||||||||||||||||||||
| Borrowings
|
1,571 | 186 | 8,212 | – | 35,629 | (1,571 | ) | 44,027 | ||||||||||||||||||||
| Retirement benefit liabilities
|
– | 926 | 42 | 20 | 833 | – | 1,821 | |||||||||||||||||||||
| Deferred tax liabilities
|
– | – | – | – | 17,129 | – | 17,129 | |||||||||||||||||||||
| Other provisions for liabilities
|
– | 1 | – | – | 353 | – | 354 | |||||||||||||||||||||
| Trade and other payables
|
8 | 18 | 102 | – | 1,933 | (1,003 | ) | 1,058 | ||||||||||||||||||||
| Derivative financial instruments
|
– | – | – | – | 79 | – | 79 | |||||||||||||||||||||
| Total non-current liabilities
|
1,579 | 1,131 | 8,356 | 20 | 55,956 | (2,574 | ) | 64,468 | ||||||||||||||||||||
|
Borrowings
|
2,058 | 40 | 1,009 | – | 4,374 | (2,058 | ) | 5,423 | ||||||||||||||||||||
| Income tax payable
|
– | 23 | – | – | 697 | – | 720 | |||||||||||||||||||||
| Other provisions for liabilities
|
– | 4 | – | – | 395 | – | 399 | |||||||||||||||||||||
| Trade and other payables
|
1,119 | 1,369 | 1,829 | – | 6,911 | (2,320 | ) | 8,908 | ||||||||||||||||||||
| Derivative financial instruments | – | – | – | – | 155 | – | 155 | |||||||||||||||||||||
| Total current liabilities
|
3,177 | 1,436 | 2,838 | – | 12,532 | (4,378 | ) | 15,605 | ||||||||||||||||||||
| Total equity and liabilities
|
65,625 | 21,740 | 30,955 | 26,311 | 130,651 | (134,228 | ) | 141,054 | ||||||||||||||||||||
| BAT Annual Report and Form 20-F 2018 | 221 | |
|
Financial Statements
|
Notes on the Accounts continued
30 Condensed consolidating financial information continued
| Condensed Consolidated Cash Flow Statement | ||||||||||||||||||||||||||||
| Year ended 31 December 2018 £m |
||||||||||||||||||||||||||||
| BAT p.l.c. | RJRT | RAI | RJRTH | All other companies |
BAT Group | |||||||||||||||||||||||
| Parent guarantor |
Issuer (LB) | Issuer (RB) Subsidiary guarantor (LB) |
Subsidiary guarantor (LB & RB) |
Non- guarantor |
Eliminations | Consolidated | ||||||||||||||||||||||
| Net cash (used in)/generated from operating activities | (45 | ) | 1,670 | 349 | (7 | ) | 8,249 | 79 | 10,295 | |||||||||||||||||||
| Net cash generated from/(used in) investing activities | 187 | 3,039 | 4,280 | 3,366 | (877 | ) | (11,016 | ) | (1,021 | ) | ||||||||||||||||||
| Net cash (used in)/generated from financing activities | (140 | ) | (4,711 | ) | (4,631 | ) | (3,359 | ) | (11,391 | ) | 14,602 | (9,630 | ) | |||||||||||||||
| Net cash flows generated from/(used in) operating, investing and financing activities | 2 | (2 | ) | (2 | ) | – | (4,019 | ) | 3,665 | (356 | ) | |||||||||||||||||
| Differences on exchange | (1 | ) | – | – | – | (138 | ) | 1 | (138 | ) | ||||||||||||||||||
| Increase/(decrease) in net cash and cash equivalents in the year | 1 | (2 | ) | (2 | ) | – | (4,157 | ) | 3,666 | (494 | ) | |||||||||||||||||
| Net cash and cash equivalents at 1 January* | 5 | 2 | 2 | – | 2,813 | – | 2,822 | |||||||||||||||||||||
| Net cash and cash equivalents at 31 December | 6 | – | – | – | (1,344 | ) | 3,666 | 2,328 | ||||||||||||||||||||
| Condensed Consolidated Cash Flow Statement | ||||||||||||||||||||||||||||
| Year ended 31 December 2017 £m |
||||||||||||||||||||||||||||
| BAT p.l.c. | RJRT | RAI | RJRTH | All other companies |
BAT Group | |||||||||||||||||||||||
| Parent guarantor |
Issuer (LB) | Issuer (RB) Subsidiary guarantor (LB) |
Subsidiary guarantor (LB & RB) |
Non- guarantor subsidiaries |
Eliminations | Consolidated | ||||||||||||||||||||||
| Net cash (used in)/generated from operating activities | (12 | ) | (1,860 | ) | (270 | ) | (11 | ) | 7,488 | 12 | 5,347 | |||||||||||||||||
| Net cash generated from/(used in) investing activities | 2 | (88 | ) | 1,116 | 1 | (19,512 | ) | (63 | ) | (18,544 | ) | |||||||||||||||||
| Net cash generated from/(used in) financing activities | 10 | 1,950 | (844 | ) | 10 | 21,030 | (7,397 | ) | 14,759 | |||||||||||||||||||
| Net cash flows generated from/(used in) operating, investing and financing activities | – | 2 | 2 | – | 9,006 | (7,448 | ) | 1,562 | ||||||||||||||||||||
| Differences on exchange | – | – | – | – | (391 | ) | – | (391 | ) | |||||||||||||||||||
| Increase/(decrease) in net cash and cash equivalents in the year | – | 2 | 2 | – | 8,615 | (7,448 | ) | 1,171 | ||||||||||||||||||||
| Net cash and cash equivalents at 1 January* | 5 | – | – | – | 1,646 | – | 1,651 | |||||||||||||||||||||
| Net cash and cash equivalents at 31 December | 5 | 2 | 2 | – | 10,261 | (7,448 | ) | 2,822 | ||||||||||||||||||||
| 222 | BAT Annual Report and Form 20-F 2018 | |
|
Strategic Report
|
Governance
|
Financial Statements
|
Other Information
|
30 Condensed consolidating financial information continued
|
Condensed Consolidated Cash Flow Statement |
||||||||||||||||||||||||||||
| Year ended 31 December 2016 £m |
||||||||||||||||||||||||||||
| BAT p.l.c. | RJRT | RAI | RJRTH | All other companies |
BAT Group | |||||||||||||||||||||||
| Parent guarantor £m |
Issuer (LB) £m |
Issuer (RB) (LB) £m |
Subsidiary £m |
Non- guarantor subsidiaries £m |
Eliminations £m |
Consolidated £m |
||||||||||||||||||||||
| Net cash (used in)/generated from operating activities | (23 | ) | – | – | – | 4,610 | 23 | 4,610 | ||||||||||||||||||||
| Net cash generated from/(used in) investing activities | 24 | – | – | – | (571 | ) | (93 | ) | (640 | ) | ||||||||||||||||||
| Net cash generated from/(used in) financing activities | – | – | – | – | 1,746 | (5,975 | ) | (4,229 | ) | |||||||||||||||||||
| Net cash flows generated from/(used in) operating, investing and financing activities | 1 | – | – | – | 5,785 | (6,045 | ) | (259 | ) | |||||||||||||||||||
| Differences on exchange | 1 | – | – | – | 179 | – | 180 | |||||||||||||||||||||
| Increase/(decrease) in net cash and cash equivalents in the year | 2 | – | – | – | 5,964 | (6,045 | ) | (79 | ) | |||||||||||||||||||
| Net cash and cash equivalents at 1 January* | 3 | – | – | – | 1,727 | – | 1,730 | |||||||||||||||||||||
| Net cash and cash equivalents at 31 December | 5 | – | – | – | 7,691 | (6,045 | ) | 1,651 | ||||||||||||||||||||
| * | The opening balance of net cash and cash equivalents represents external cash held by the parent guarantor, issuers, subsidiary guarantors and non-guarantor subsidiaries. |
(b) BATCAP bonds
The following condensed consolidating financial information is in respect of US$17.2 billion of bonds representing the registered portion (99.7%) of a total US$17.25 billion principal amount of bonds issued by BATCAP in connection with the exchange offer required by the registration rights agreement entered into in connection with the bond offering related to the acquisition of RAI.
The following condensed consolidating financial information includes the accounts and activities of:
| a. | British American Tobacco p.l.c. (parent guarantor), referred to as “BAT p.l.c.” in financials below; |
| b. | B.A.T Capital Corporation (issuer), referred to as “BATCAP” in financials below; |
| c. | B.A.T. International Finance p.l.c. (subsidiary guarantor), referred to as “BATIF” in the financials below; |
| d. | British American Tobacco Holdings (The Netherlands) B.V. (subsidiary guarantor), referred to as “BATHTN” in the financials below; |
| e. | B.A.T. Netherlands Finance B.V. and Reynolds American Inc. (subsidiary guarantors), referred to as “BATNF” and “RAI” respectively in the financials below; |
| f. | other direct and indirect subsidiaries of the BAT Group that are not guarantors; |
| g. | elimination entries necessary to consolidate the parent with the issuer, the subsidiary guarantors and non-guarantor subsidiaries; and |
| h. | the BAT Group on a consolidated basis. |
The information presented is based on the results for the twelve-month period ended 31 December 2018, and the revised results for the twelve-month period ended 31 December 2017 and 31 December 2016 as explained in notes 1 and 31.
| BAT Annual Report and Form 20-F 2018 | 223 | |
|
Financial Statements
|
Notes on the Accounts continued
30 Condensed consolidating financial information continued
| Condensed Consolidated Income Statement | ||||||||||||||||||||||||||||||||
| Year ended 31 December 2018 £m |
||||||||||||||||||||||||||||||||
| BAT p.l.c. | BATCAP | BATIF | BATHTN | BATNF and RAI |
All other companies |
BAT Group | ||||||||||||||||||||||||||
| Parent guarantor |
Issuer | Subsidiary guarantor |
Subsidiary guarantor |
Subsidiary guarantors |
Non- guarantor subsidiaries |
Eliminations | Consolidated | |||||||||||||||||||||||||
| Revenue | – | – | – | – | – | 24,492 | – | 24,492 | ||||||||||||||||||||||||
| Raw materials and consumables used | – | – | – | – | – | (4,664 | ) | – | (4,664 | ) | ||||||||||||||||||||||
| Changes in inventories of finished goods and work in progress | – | – | – | – | – | 114 | – | 114 | ||||||||||||||||||||||||
| Employee benefit costs | (5 | ) | – | – | (2 | ) | (13 | ) | (2,990 | ) | 5 | (3,005 | ) | |||||||||||||||||||
| Depreciation, amortisation and impairment costs | – | – | – | – | – | (1,038 | ) | – | (1,038 | ) | ||||||||||||||||||||||
| Other operating income | – | – | – | – | 22 | 63 | – | 85 | ||||||||||||||||||||||||
| Loss on reclassification from amortised cost to fair value | – | – | – | – | – | (3 | ) | – | (3 | ) | ||||||||||||||||||||||
| Other operating expenses | (124 | ) | (3 | ) | (1 | ) | (4 | ) | (17 | ) | (6,643 | ) | 124 | (6,668 | ) | |||||||||||||||||
| (Loss)/profit from operations | (129 | ) | (3 | ) | (1 | ) | (6 | ) | (8 | ) | 9,331 | 129 | 9,313 | |||||||||||||||||||
| Net finance income/(costs) | 95 | 239 | 96 | 248 | (421 | ) | (599 | ) | (1,039 | ) | (1,381 | ) | ||||||||||||||||||||
| Share of post-tax results of associates and joint ventures | – | – | – | – | – | 419 | – | 419 | ||||||||||||||||||||||||
| Profit before taxation | (34 | ) | 236 | 95 | 242 | (429 | ) | 9,151 | (910 | ) | 8,351 | |||||||||||||||||||||
| Taxation on ordinary activities | – | (79 | ) | 7 | 1 | 93 | (2,163 | ) | – | (2,141 | ) | |||||||||||||||||||||
| Equity income from subsidiaries | 6,210 | – | – | – | 3,436 | – | (9,646 | ) | – | |||||||||||||||||||||||
| Profit for the year | 6,176 | 157 | 102 | 243 | 3,100 | 6,988 | (10,556 | ) | 6,210 | |||||||||||||||||||||||
| Attributable to: | ||||||||||||||||||||||||||||||||
| Owners of the parent | 6,176 | 157 | 102 | 243 | 3,100 | 6,810 | (10,556 | ) | 6,032 | |||||||||||||||||||||||
| Non-controlling interests | – | – | – | – | – | 178 | – | 178 | ||||||||||||||||||||||||
| 6,176 | 157 | 102 | 243 | 3,100 | 6,988 | (10,556 | ) | 6,210 | ||||||||||||||||||||||||
| 224 | BAT Annual Report and Form 20-F 2018 | |
|
Strategic Report
|
Governance
|
Financial Statements
|
Other Information
|
30 Condensed consolidating financial information continued
|
Condensed Consolidated Income Statement |
||||||||||||||||||||||||||||||||
| Year ended 31 December 2017 £m |
||||||||||||||||||||||||||||||||
| BAT p.l.c. | BATCAP | BATIF | BATHTN | BATNF and RAI |
All other companies |
BAT Group | ||||||||||||||||||||||||||
| Parent guarantor |
Issuer | Subsidiary guarantor |
Subsidiary guarantor |
Subsidiary guarantors |
Non-guarantor subsidiaries |
Eliminations | Consolidated | |||||||||||||||||||||||||
| Revenue | – | – | – | – | – | 19,564 | – | 19,564 | ||||||||||||||||||||||||
| Raw materials and consumables used | – | – | – | – | – | (4,520 | ) | – | (4,520 | ) | ||||||||||||||||||||||
| Changes in inventories of finished goods and work in progress | – | – | – | – | – | (513 | ) | – | (513 | ) | ||||||||||||||||||||||
| Employee benefit costs | (8 | ) | – | – | (3 | ) | (35 | ) | (2,641 | ) | 8 | (2,679 | ) | |||||||||||||||||||
| Depreciation, amortisation and impairment costs | – | – | – | – | – | (902 | ) | – | (902 | ) | ||||||||||||||||||||||
| Other operating income |
– | 1 | – | 1 | 33 | 109 | – | 144 | ||||||||||||||||||||||||
| Other operating expenses | (101 | ) | (1 | ) | (1 | ) | (2 | ) | (7 | ) | (4,671 | ) | 101 | (4,682 | ) | |||||||||||||||||
| (Loss)/profit from operations | (109 | ) | – | (1 | ) | (4 | ) | (9 | ) | 6,426 | 109 | 6,412 | ||||||||||||||||||||
| Net finance income/(costs) | 3 | (62 | ) | (22 | ) | 636 | (191 | ) | (1,403 | ) | (55 | ) | (1,094 | ) | ||||||||||||||||||
| Share of post-tax results of associates and joint ventures | – | – | – | – | – | 24,209 | – | 24,209 | ||||||||||||||||||||||||
| Profit before taxation | (106 | ) | (62 | ) | (23 | ) | 632 | (200 | ) | 29,232 | 54 | 29,527 | ||||||||||||||||||||
| Taxation on ordinary activities | – | 10 | (40 | ) | 4 | 61 | 8,094 | – | 8,129 | |||||||||||||||||||||||
| Equity income from subsidiaries | 37,656 | – | – | – | 4,259 | – | (41,915 | ) | – | |||||||||||||||||||||||
| Profit for the year | 37,550 | (52 | ) | (63 | ) | 636 | 4,120 | 37,326 | (41,861 | ) | 37,656 | |||||||||||||||||||||
| Attributable to: | ||||||||||||||||||||||||||||||||
| Owners of the parent | 37,550 | (52 | ) | (63 | ) | 636 | 4,120 | 37,155 | (41,861 | ) | 37,485 | |||||||||||||||||||||
| Non-controlling interests | – | – | – | – | – | 171 | – | 171 | ||||||||||||||||||||||||
| 37,550 | (52 | ) | (63 | ) | 636 | 4,120 | 37,326 | (41,861 | ) | 37,656 | ||||||||||||||||||||||
| BAT Annual Report and Form 20-F 2018 | 225 | |
|
Financial Statements
|
Notes on the Accounts continued
| 30 | Condensed consolidating financial information continued |
| Condensed Consolidated Income Statement | ||||||||||||||||||||||||||||||||
| Year ended 31 December 2016 £m |
||||||||||||||||||||||||||||||||
| BAT p.l.c. | BATCAP | BATIF | BATHTN | BATNF and RAI |
All other companies |
BAT Group | ||||||||||||||||||||||||||
| Parent guarantor |
Issuer | Subsidiary guarantor |
Subsidiary guarantor |
Subsidiary guarantors |
Non-guarantor subsidiaries |
Eliminations | Consolidated | |||||||||||||||||||||||||
| Revenue | – | – | – | – | – | 14,130 | – | 14,130 | ||||||||||||||||||||||||
| Raw materials and consumables used | – | – | – | – | – | (3,777 | ) | – | (3,777 | ) | ||||||||||||||||||||||
| Changes in inventories of finished goods and work in progress | – | – | – | – | – | 44 | – | 44 | ||||||||||||||||||||||||
| Employee benefit costs | (7 | ) | – | – | (3 | ) | – | (2,271 | ) | 7 | (2,274 | ) | ||||||||||||||||||||
| Depreciation, amortisation and impairment costs | – | – | – | – | – | (607 | ) | – | (607 | ) | ||||||||||||||||||||||
| Other operating income | – | – | – | – | – | 176 | – | 176 | ||||||||||||||||||||||||
| Other operating expenses | (75 | ) | – | (4 | ) | – | – | (3,033 | ) | 75 | (3,037 | ) | ||||||||||||||||||||
| (Loss)/profit from operations | (82 | ) | – | (4 | ) | (3 | ) | – | 4,662 | 82 | 4,655 | |||||||||||||||||||||
| Net finance (costs)/income | (54 | ) | – | 1,006 | (412 | ) | – | (1,231 | ) | 54 | (637 | ) | ||||||||||||||||||||
| Share of post-tax results of associates and joint ventures | – | – | – | – | – | 2,227 | – | 2,227 | ||||||||||||||||||||||||
| Profit before taxation | (136 | ) | – | 1,002 | (415 | ) | – | 5,658 | 136 | 6,245 | ||||||||||||||||||||||
| Taxation on ordinary activities | – | – | (2 | ) | 65 | – | (1,469 | ) | – | (1,406 | ) | |||||||||||||||||||||
| Equity income from subsidiaries | 4,839 | – | – | – | – | – | (4,839 | ) | – | |||||||||||||||||||||||
| Profit for the year | 4,703 | – | 1,000 | (350 | ) | – | 4,189 | (4,703 | ) | 4,839 | ||||||||||||||||||||||
| Attributable to: | ||||||||||||||||||||||||||||||||
| Owners of the parent | 4,703 | – | 1,000 | (350 | ) | – | 3,998 | (4,703 | ) | 4,648 | ||||||||||||||||||||||
| Non-controlling interests | – | – | – | – | – | 191 | – | 191 | ||||||||||||||||||||||||
| 4,703 | – | 1,000 | (350 | ) | – | 4,189 | (4,703 | ) | 4,839 | |||||||||||||||||||||||
| 226 | BAT Annual Report and Form 20-F 2018 | |
|
Strategic Report
|
Governance
|
Financial Statements
|
Other Information
|
| 30 | Condensed consolidating financial information continued |
| Condensed Consolidated Statement of Comprehensive Income
|
||||||||||||||||||||||||||||||||
|
Year ended 31 December 2018 £m |
||||||||||||||||||||||||||||||||
| BAT p.l.c. | BATCAP | BATIF | BATHTN | BATNF and RAI |
All other companies |
BAT Group | ||||||||||||||||||||||||||
| Parent
|
Issuer
|
Subsidiary
|
Subsidiary
|
Subsidiary
|
Non-
|
Eliminations
|
Consolidated
|
|||||||||||||||||||||||||
| Profit for the year | 6,176 | 157 | 102 | 243 | 3,100 | 6,988 | (10,556 | ) | 6,210 | |||||||||||||||||||||||
| Other comprehensive income/ (expense) | ||||||||||||||||||||||||||||||||
| Items that may be reclassified subsequently to profit or loss: | – | (101 | ) | 15 | – | – | 3,185 | – | 3,099 | |||||||||||||||||||||||
| Differences on exchange | – | – | – | – | – | 3,868 | – | 3,868 | ||||||||||||||||||||||||
| Cash flow hedges | – | (101 | ) | 15 | – | – | 45 | – | (41 | ) | ||||||||||||||||||||||
| Net investment hedges | – | – | – | – | – | (708 | ) | – | (708 | ) | ||||||||||||||||||||||
| Associates–share of OCI, net of tax | – | – | – | – | – | (38 | ) | – | (38 | ) | ||||||||||||||||||||||
| Tax on items that may be reclassified | – | – | – | – | – | 18 | – | 18 | ||||||||||||||||||||||||
| Items that will not be reclassified subsequently to profit or loss: | – | – | – | – | – | 115 | – | 115 | ||||||||||||||||||||||||
| Retirement benefit schemes | – | – | – | – | – | 142 | – | 142 | ||||||||||||||||||||||||
| Associates–share of OCI, net of tax | – | – | – | – | – | 6 | – | 6 | ||||||||||||||||||||||||
| Tax on items that will not be reclassified | – | – | – | – | – | (33 | ) | – | (33 | ) | ||||||||||||||||||||||
| Total other comprehensive (expense)/income for the year, net of tax | – | (101 | ) | 15 | – | – | 3,300 | – | 3,214 | |||||||||||||||||||||||
| Share of subsidiaries OCI (other reserves) | 115 | – | – | – | – | – | (115 | ) | – | |||||||||||||||||||||||
| Share of subsidiaries OCI (retained earnings) | 3,099 | – | – | – | – | – | (3,099 | ) | – | |||||||||||||||||||||||
| Total comprehensive income/ (expense) for the year, net of tax | 9,390 | 56 | 117 | 243 | 3,100 | 10,288 | (13,770 | ) | 9,424 | |||||||||||||||||||||||
| Attributable to: | ||||||||||||||||||||||||||||||||
| Owners of the parent | 9,390 | 56 | 117 | 243 | 3,100 | 10,103 | (13,770 | ) | 9,239 | |||||||||||||||||||||||
| Non-controlling interests | – | – | – | – | – | 185 | – | 185 | ||||||||||||||||||||||||
| 9,390 | 56 | 117 | 243 | 3,100 | 10,288 | (13,770 | ) | 9,424 | ||||||||||||||||||||||||
| BAT Annual Report and Form 20-F 2018 | 227 | |
|
Financial Statements
|
Notes on the Accounts continued
30 Condensed consolidating financial information continued
|
Condensed Consolidated Statement of Comprehensive Income
|
||||||||||||||||||||||||||||||||
|
Year ended 31 December 2017 £m |
||||||||||||||||||||||||||||||||
| BAT p.l.c. | BATCAP | BATIF | BATHTN | BATNF and RAI |
All other companies |
BAT Group | ||||||||||||||||||||||||||
| Parent
|
Issuer
|
Subsidiary
|
Subsidiary
|
Subsidiary
|
Non-guarantor
|
Eliminations
|
Consolidated
|
|||||||||||||||||||||||||
| Profit for the year | 37,550 | (52 | ) | (63 | ) | 636 | 4,120 | 37,326 | (41,861 | ) | 37,656 | |||||||||||||||||||||
| Other comprehensive income/(expense) Items that may be reclassified subsequently to profit or loss: | – | (242 | ) | (21 | ) | – | – | (3,546 | ) | – | (3,809 | ) | ||||||||||||||||||||
| Differences on exchange | – | – | – | – | – | (3,084 | ) | – | (3,084 | ) | ||||||||||||||||||||||
| Cash flow hedges | – | (242 | ) | (10 | ) | – | – | 81 | – | (171 | ) | |||||||||||||||||||||
| Investments held at fair value | – | – | – | – | – | (27 | ) | – | (27 | ) | ||||||||||||||||||||||
| Net investment hedges | – | – | (11 | ) | – | – | 368 | – | 357 | |||||||||||||||||||||||
| Associates–share of OCI, net of tax | – | – | – | – | – | (918 | ) | – | (918 | ) | ||||||||||||||||||||||
| Tax on items that may be reclassified | – | – | – | – | – | 34 | – | 34 | ||||||||||||||||||||||||
| Items that will not be reclassified subsequently to profit or loss: | – | – | – | – | – | 681 | – | 681 | ||||||||||||||||||||||||
| Retirement benefit schemes | – | – | – | – | – | 827 | – | 827 | ||||||||||||||||||||||||
| Associates–share of OCI, net of tax | – | – | – | – | – | 25 | – | 25 | ||||||||||||||||||||||||
| Tax on items that will not be reclassified | – | – | – | – | – | (171 | ) | – | (171 | ) | ||||||||||||||||||||||
| Total other comprehensive (expense)/income for the year, net of tax | – | (242 | ) | (21 | ) | – | – | (2,865 | ) | – | (3,128 | ) | ||||||||||||||||||||
| Share of subsidiaries OCI (other reserves) | 681 | – | – | – | – | – | (681 | ) | – | |||||||||||||||||||||||
| Share of subsidiaries OCI (retained earnings) | (3,809 | ) | – | – | – | – | – | 3,809 | – | |||||||||||||||||||||||
| Total comprehensive income/(expense) for the year, net of tax | 34,422 | (294 | ) | (84 | ) | 636 | 4,120 | 34,461 | (38,733 | ) | 34,528 | |||||||||||||||||||||
| Attributable to: | ||||||||||||||||||||||||||||||||
| Owners of the parent | 34,422 | (294 | ) | (84 | ) | 636 | 4,120 | 34,294 | (38,733 | ) | 34,361 | |||||||||||||||||||||
| Non-controlling interests | – | – | – | – | – | 167 | – | 167 | ||||||||||||||||||||||||
| 34,422 | (294 | ) | (84 | ) | 636 | 4,120 | 34,461 | (38,733 | ) | 34,528 | ||||||||||||||||||||||
| 228 | BAT Annual Report and Form 20-F 2018 | |
|
Strategic Report
|
Governance
|
Financial Statements
|
Other Information
|
30 Condensed consolidating financial information continued
| Condensed Consolidated Statement of Comprehensive Income | ||||||||||||||||||||||||||||||||
| Year ended 31 December 2016 £m |
||||||||||||||||||||||||||||||||
| BAT p.l.c. | BATCAP | BATIF | BATHTN | BATNF and RAI |
All other companies |
BAT Group | ||||||||||||||||||||||||||
| Parent guarantor |
Issuer | Subsidiary guarantor |
Subsidiary guarantor |
Subsidiary guarantors |
Non-guarantor subsidiaries |
Eliminations | Consolidated | |||||||||||||||||||||||||
| Profit for the year | 4,703 | – | 1,000 | (350 | ) | – | 4,189 | (4,703 | ) | 4,839 | ||||||||||||||||||||||
| Other comprehensive income/(expense) | ||||||||||||||||||||||||||||||||
| Items that may be reclassified subsequently to profit or loss: | – | – | (397 | ) | – | – | 2,157 | – | 1,760 | |||||||||||||||||||||||
| Differences on exchange | – | – | – | – | – | 1,270 | – | 1,270 | ||||||||||||||||||||||||
| Cash flow hedges | – | – | 5 | – | – | 50 | – | 55 | ||||||||||||||||||||||||
| Net investment hedges | – | – | (402 | ) | – | – | (559 | ) | – | (961 | ) | |||||||||||||||||||||
| Associates–share of OCI, net of tax | – | – | – | – | – | 1,415 | – | 1,415 | ||||||||||||||||||||||||
| Tax on items that may be reclassified | – | – | – | – | – | (19 | ) | – | (19 | ) | ||||||||||||||||||||||
| Items that will not be reclassified subsequently to profit or loss: | – | – | – | – | – | (173 | ) | – | (173 | ) | ||||||||||||||||||||||
| Retirement benefit schemes | – | – | – | – | – | (229 | ) | – | (229 | ) | ||||||||||||||||||||||
| Associates–share of OCI, net of tax | – | – | – | – | – | 20 | – | 20 | ||||||||||||||||||||||||
| Tax on items that will not be reclassified | – | – | – | – | – | 36 | – | 36 | ||||||||||||||||||||||||
| Total other comprehensive (expense)/income for the year, net of tax | – | – | (397 | ) | – | – | 1,984 | – | 1,587 | |||||||||||||||||||||||
| Share of subsidiaries OCI (other reserves) |
(173 | ) | – | – | – | – | – | 173 | – | |||||||||||||||||||||||
| Share of subsidiaries OCI (retained earnings) |
1,760 | – | – | – | – | – | (1,760 | ) | – | |||||||||||||||||||||||
| Total comprehensive income/ (expense) for the year, net of tax | 6,290 | – | 603 | (350 | ) | – | 6,173 | (6,290 | ) | 6,426 | ||||||||||||||||||||||
| Attributable to: | ||||||||||||||||||||||||||||||||
| Owners of the parent | 6,290 | – | 603 | (350 | ) | – | 5,927 | (6,290 | ) | 6,180 | ||||||||||||||||||||||
| Non-controlling interests | – | – | – | – | – | 246 | – | 246 | ||||||||||||||||||||||||
| 6,290 | – | 603 | (350 | ) | – | 6,173 | (6,290 | ) | 6,426 | |||||||||||||||||||||||
| BAT Annual Report and Form 20-F 2018 | 229 | |
|
Financial Statements
|
Notes on the Accounts continued
30 Condensed consolidating financial information continued
|
Condensed Consolidated Balance Sheet
|
||||||||||||||||||||||||||||||||
| As at 31 December 2018 £m |
||||||||||||||||||||||||||||||||
| BAT p.l.c. | BATCAP | BATIF | BATHTN | BATNF and RAI |
All other companies |
BAT Group | ||||||||||||||||||||||||||
| Parent guarantor |
Issuer | Subsidiary guarantor |
Subsidiary guarantor |
Subsidiary guarantors |
Non- guarantor subsidiaries |
Eliminations | Consolidated | |||||||||||||||||||||||||
| Assets | ||||||||||||||||||||||||||||||||
| Intangible assets | – | – | – | – | – | 124,013 | – | 124,013 | ||||||||||||||||||||||||
| Property, plant and equipment | – | – | – | – | 1 | 5,165 | – | 5,166 | ||||||||||||||||||||||||
| Investments in subsidiaries | 32,543 | – | 718 | 3,732 | 30,625 | – | (67,618 | ) | – | |||||||||||||||||||||||
| Investments in associates and joint ventures | – | – | – | – | – | 1,737 | – | 1,737 | ||||||||||||||||||||||||
| Retirement benefit assets | – | – | – | 15 | – | 1,132 | – | 1,147 | ||||||||||||||||||||||||
| Deferred tax assets | – | 74 | – | – | 17 | 253 | – | 344 | ||||||||||||||||||||||||
| Trade and other receivables | – | 15,707 | 21,911 | – | 464 | (38,343 | ) | 946 | 685 | |||||||||||||||||||||||
| Investments held at fair value | – | – | – | – | – | 39 | – | 39 | ||||||||||||||||||||||||
| Derivative financial instruments | – | – | 708 | – | – | (7 | ) | (145 | ) | 556 | ||||||||||||||||||||||
| Total non-current assets | 32,543 | 15,781 | 23,337 | 3,747 | 31,107 | 93,989 | (66,817 | ) | 133,687 | |||||||||||||||||||||||
| Inventories | – | – | – | – | – | 6,029 | – | 6,029 | ||||||||||||||||||||||||
| Income tax receivable | – | – | – | – | – | 74 | – | 74 | ||||||||||||||||||||||||
| Trade and other receivables | 7,306 | 2,567 | 19,576 | 15 | 820 | (13,626 | ) | (13,070 | ) | 3,588 | ||||||||||||||||||||||
| Investments held at fair value | – | – | – | – | – | 178 | – | 178 | ||||||||||||||||||||||||
| Derivative financial instruments | – | – | 405 | – | – | (215 | ) | (11 | ) | 179 | ||||||||||||||||||||||
| Cash and cash equivalents | 6 | 9 | 56 | – | – | 2,537 | (6 | ) | 2,602 | |||||||||||||||||||||||
| 7,312 | 2,576 | 20,037 | 15 | 820 | (5,023 | ) | (13,087 | ) | 12,650 | |||||||||||||||||||||||
| Assets classified as held-for-sale | – | – | – | – | – | 5 | – | 5 | ||||||||||||||||||||||||
| Total current assets | 7,312 | 2,576 | 20,037 | 15 | 820 | (5,018 | ) | (13,087 | ) | 12,655 | ||||||||||||||||||||||
| Total assets | 39,855 | 18,357 | 43,374 | 3,762 | 31,927 | 88,971 | (79,904 | ) | 146,342 | |||||||||||||||||||||||
| Equity – capital and reserves | ||||||||||||||||||||||||||||||||
| Share capital | 614 | – | 231 | 91 | 14,348 | 614 | (15,284 | ) | 614 | |||||||||||||||||||||||
| Share premium, capital redemption and merger reserves | 22,854 | 30 | – | 3,401 | – | 33,562 | (33,241 | ) | 26,606 | |||||||||||||||||||||||
| Other reserves | 204 | (195 | ) | (1,091 | ) | 363 | (44 | ) | (333 | ) | 763 | (333 | ) | |||||||||||||||||||
| Retained earnings | 11,291 | 105 | 2,841 | (100 | ) | 6,853 | 38,557 | (20,990 | ) | 38,557 | ||||||||||||||||||||||
| Owners of the parent | 34,963 | (60 | ) | 1,981 | 3,755 | 21,157 | 72,400 | (68,752 | ) | 65,444 | ||||||||||||||||||||||
| Non-controlling interests | – | – | – | – | – | 244 | – | 244 | ||||||||||||||||||||||||
| Total equity | 34,963 | (60 | ) | 1,981 | 3,755 | 21,157 | 72,644 | (68,752 | ) | 65,688 | ||||||||||||||||||||||
| Liabilities | ||||||||||||||||||||||||||||||||
| Borrowings | 1,571 | 15,599 | 18,450 | – | 8,140 | (1,422 | ) | 946 | 43,284 | |||||||||||||||||||||||
| Retirement benefit liabilities | – | – | – | – | 53 | 1,612 | – | 1,665 | ||||||||||||||||||||||||
| Deferred tax liabilities | – | – | 30 | 4 | – | 17,742 | – | 17,776 | ||||||||||||||||||||||||
| Other provisions for liabilities | 1 | – | – | – | – | 331 | (1 | ) | 331 | |||||||||||||||||||||||
| Trade and other payables | 8 | – | 4 | – | 89 | 962 | (8 | ) | 1,055 | |||||||||||||||||||||||
| Derivative financial instruments | – | 145 | 217 | – | – | (3 | ) | (145 | ) | 214 | ||||||||||||||||||||||
| Total non-current liabilities | 1,580 | 15,744 | 18,701 | 4 | 8,282 | 19,222 | 792 | 64,325 | ||||||||||||||||||||||||
| Borrowings | 2,062 | 2,637 | 22,293 | 1 | 1,573 | (12,519 | ) | (11,822 | ) | 4,225 | ||||||||||||||||||||||
| Income tax payable | – | 2 | – | – | 133 | 718 | – | 853 | ||||||||||||||||||||||||
| Other provisions for liabilities | – | – | – | – | – | 318 | – | 318 | ||||||||||||||||||||||||
| Trade and other payables | 1,248 | 25 | 30 | 2 | 782 | 8,677 | (133 | ) | 10,631 | |||||||||||||||||||||||
| Derivative financial instruments | 2 | 9 | 369 | – | – | (89 | ) | 11 | 302 | |||||||||||||||||||||||
| Total current liabilities | 3,312 | 2,673 | 22,692 | 3 | 2,488 | (2,895 | ) | (11,944 | ) | 16,329 | ||||||||||||||||||||||
| Total equity and liabilities | 39,855 | 18,357 | 43,374 | 3,762 | 31,927 | 88,971 | (79,904 | ) | 146,342 | |||||||||||||||||||||||
| 230 | BAT Annual Report and Form 20-F 2018 | |
|
Strategic Report
|
Governance
|
Financial Statements
|
Other Information
|
30 Condensed consolidating financial information continued
| Condensed Consolidated Balance Sheet | ||||||||||||||||||||||||||||||||
| As at 31 December 2017 £m |
||||||||||||||||||||||||||||||||
| BAT p.l.c. | BATCAP | BATIF | BATHTN | BATNF and RAI |
All other companies |
BAT Group | ||||||||||||||||||||||||||
| Parent guarantor |
Issuer | Subsidiary guarantor |
Subsidiary guarantor |
Subsidiary guarantors |
Non- guarantor subsidiaries |
Eliminations | Consolidated | |||||||||||||||||||||||||
| Assets | ||||||||||||||||||||||||||||||||
| Intangible assets | – | – | – | – | – | 117,785 | – | 117,785 | ||||||||||||||||||||||||
| Property, plant and equipment | – | – | – | – | 2 | 4,880 | – | 4,882 | ||||||||||||||||||||||||
| Investments in subsidiaries | 58,255 | – | 718 | 3,687 | 29,165 | – | (91,825 | ) | – | |||||||||||||||||||||||
| Investments in associates and joint ventures | – | – | – | – | – | 1,577 | – | 1,577 | ||||||||||||||||||||||||
| Retirement benefit assets | – | – | – | 52 | – | 1,071 | – | 1,123 | ||||||||||||||||||||||||
| Deferred tax assets | – | 49 | – | – | 16 | 268 | – | 333 | ||||||||||||||||||||||||
| Trade and other receivables | – | 14,787 | 12,333 | – | 860 | (27,699 | ) | 475 | 756 | |||||||||||||||||||||||
| Investments held at fair value | – | – | – | – | – | 42 | – | 42 | ||||||||||||||||||||||||
| Derivative financial instruments | – | 68 | 594 | – | – | (4 | ) | (68 | ) | 590 | ||||||||||||||||||||||
| Total non-current assets | 58,255 | 14,904 | 13,645 | 3,739 | 30,043 | 97,920 | (91,418 | ) | 127,088 | |||||||||||||||||||||||
| Inventories | – | – | – | – | – | 5,864 | – | 5,864 | ||||||||||||||||||||||||
| Income tax receivable | – | – | – | – | 339 | 121 | – | 460 | ||||||||||||||||||||||||
| Trade and other receivables | 7,365 | 56 | 30,789 | 24 | 569 | (25,490 | ) | (9,260 | ) | 4,053 | ||||||||||||||||||||||
| Investments held at fair value | – | – | – | – | – | 65 | – | 65 | ||||||||||||||||||||||||
| Derivative financial instruments | – | – | 339 | – | – | (111 | ) | – | 228 | |||||||||||||||||||||||
| Cash and cash equivalents | 5 | 122 | 750 | – | 2 | 2,417 | (5 | ) | 3,291 | |||||||||||||||||||||||
| 7,370 | 178 | 31,878 | 24 | 910 | (17,134 | ) | (9,265 | ) | 13,961 | |||||||||||||||||||||||
| Assets classified as held-for-sale | – | – | – | – | – | 5 | – | 5 | ||||||||||||||||||||||||
| Total current assets | 7,370 | 178 | 31,878 | 24 | 910 | (17,129 | ) | (9,265 | ) | 13,966 | ||||||||||||||||||||||
| Total assets | 65,625 | 15,082 | 45,523 | 3,763 | 30,953 | 80,791 | (100,683 | ) | 141,054 | |||||||||||||||||||||||
| Equity – capital and reserves | ||||||||||||||||||||||||||||||||
| Share capital | 614 | – | 231 | 91 | 13,509 | 614 | (14,445 | ) | 614 | |||||||||||||||||||||||
| Share premium, capital redemption and merger reserves | 22,939 | 258 | – | 3,401 | – | 22,943 | (22,939 | ) | 26,602 | |||||||||||||||||||||||
| Other reserves | 805 | (129 | ) | (1,106 | ) | 322 | (25 | ) | (3,427 | ) | 168 | (3,392 | ) | |||||||||||||||||||
| Retained earnings | 36,511 | (52 | ) | 2,741 | (75 | ) | 6,275 | 46,032 | (54,497 | ) | 36,935 | |||||||||||||||||||||
| Owners of the parent | 60,869 | 77 | 1,866 | 3,739 | 19,759 | 66,162 | (91,713 | ) | 60,759 | |||||||||||||||||||||||
| Non-controlling interests | – | – | – | – | – | 222 | – | 222 | ||||||||||||||||||||||||
| Total equity | 60,869 | 77 | 1,866 | 3,739 | 19,759 | 66,384 | (91,713 | ) | 60,981 | |||||||||||||||||||||||
| Liabilities | ||||||||||||||||||||||||||||||||
| Borrowings | 1,571 | 14,783 | 19,873 | – | 8,212 | (1,364 | ) | 952 | 44,027 | |||||||||||||||||||||||
| Retirement benefit liabilities | – | – | – | – | 42 | 1,779 | – | 1,821 | ||||||||||||||||||||||||
| Deferred tax liabilities | – | – | 38 | 13 | – | 17,078 | – | 17,129 | ||||||||||||||||||||||||
| Other provisions for liabilities | – | – | – | – | – | 354 | – | 354 | ||||||||||||||||||||||||
| Trade and other payables | 8 | – | 4 | – | 102 | 952 | (8 | ) | 1,058 | |||||||||||||||||||||||
| Derivative financial instruments | – | – | 158 | – | – | (11 | ) | (68 | ) | 79 | ||||||||||||||||||||||
| Total non-current liabilities | 1,579 | 14,783 | 20,073 | 13 | 8,356 | 18,788 | 876 | 64,468 | ||||||||||||||||||||||||
| Borrowings | 2,058 | 160 | 23,290 | 1 | 1,009 | (11,408 | ) | (9,687 | ) | 5,423 | ||||||||||||||||||||||
| Income tax payable | – | 2 | – | 7 | – | 711 | – | 720 | ||||||||||||||||||||||||
| Other provisions for liabilities | – | – | – | 1 | – | 398 | – | 399 | ||||||||||||||||||||||||
| Trade and other payables | 1,119 | 54 | 8 | 2 | 1,829 | 6,049 | (153 | ) | 8,908 | |||||||||||||||||||||||
| Derivative financial instruments | – | 6 | 286 | – | – | (131 | ) | (6 | ) | 155 | ||||||||||||||||||||||
| Total current liabilities | 3,177 | 222 | 23,584 | 11 | 2,838 | (4,381 | ) | (9,846 | ) | 15,605 | ||||||||||||||||||||||
| Total equity and liabilities | 65,625 | 15,082 | 45,523 | 3,763 | 30,953 | 80,791 | (100,683 | ) | 141,054 | |||||||||||||||||||||||
| BAT Annual Report and Form 20-F 2018 | 231 | |
|
Financial Statements
|
Notes on the Accounts continued
30 Condensed consolidating financial information continued
|
Condensed Consolidated Cash Flow Statement
|
||||||||||||||||||||||||||||||||
|
Year ended 31 December 2018 £m
|
||||||||||||||||||||||||||||||||
| BAT p.l.c. | BATCAP | BATIF | BATHTN | BATNF and RAI |
All other companies |
BAT Group | ||||||||||||||||||||||||||
| Parent guarantor |
Issuer | Subsidiary guarantor |
Subsidiary guarantor |
Subsidiary guarantors |
Non- guarantor subsidiaries |
Eliminations | Consolidated | |||||||||||||||||||||||||
| Net cash (used in)/generated from operating activities | (45 | ) | (81 | ) | 19 | (13 | ) | 349 | 10,025 | 41 | 10,295 | |||||||||||||||||||||
| Net cash generated from/(used in) investing activities | 187 | 946 | 709 | 2 | 4,280 | (6,853 | ) | (292 | ) | (1,021 | ) | |||||||||||||||||||||
| Net cash (used in)/generated from financing activities | (140 | ) | (980 | ) | (1,355 | ) | 11 | (4,631 | ) | (3,663 | ) | 1,128 | (9,630 | ) | ||||||||||||||||||
| Net cash flows generated from/(used in) operating, investing and financing activities | 2 | (115 | ) | (627 | ) | – | (2 | ) | (491 | ) | 877 | (356 | ) | |||||||||||||||||||
| Differences on exchange | (1 | ) | 2 | 34 | – | – | (173 | ) | – | (138 | ) | |||||||||||||||||||||
| Increase/(decrease) in net cash and cash equivalents in the year | 1 | (113 | ) | (593 | ) | – | (2 | ) | (664 | ) | 877 | (494 | ) | |||||||||||||||||||
| Net cash and cash equivalents at 1 January* | 5 | 122 | 558 | – | 2 | 2,135 | – | 2,822 | ||||||||||||||||||||||||
| Net cash and cash equivalents at 31 December | 6 | 9 | (35 | ) | – | – | 1,471 | 877 | 2,328 | |||||||||||||||||||||||
|
Condensed Consolidated Cash Flow Statement
|
||||||||||||||||||||||||||||||||
|
Year ended 31 December 2017 £m
|
||||||||||||||||||||||||||||||||
| BAT p.l.c. | BATCAP | BATIF | BATHTN | BATNF and RAI |
All other companies |
BAT Group | ||||||||||||||||||||||||||
| Parent guarantor |
Issuer | Subsidiary guarantor |
Subsidiary guarantor |
Subsidiary guarantors |
Non- guarantor subsidiaries |
Eliminations | Consolidated | |||||||||||||||||||||||||
| Net cash (used in)/generated from operating activities | (12 | ) | 67 | 10 | 69 | (270 | ) | 5,470 | 13 | 5,347 | ||||||||||||||||||||||
| Net cash generated from/(used in) investing activities | 2 | 113 | 350 | – | 1,116 | (20,020 | ) | (105 | ) | (18,544 | ) | |||||||||||||||||||||
| Net cash generated from/(used in) financing activities | 10 | (52 | ) | 237 | (69 | ) | (844 | ) | 22,772 | (7,295 | ) | 14,759 | ||||||||||||||||||||
| Net cash flows generated from/(used in) operating, investing and financing activities | – | 128 | 597 | – | 2 | 8,222 | (7,387 | ) | 1,562 | |||||||||||||||||||||||
| Differences on exchange | – | (6 | ) | 15 | – | – | (400 | ) | – | (391 | ) | |||||||||||||||||||||
| Increase/(decrease) in net cash and cash equivalents in the year | – | 122 | 612 | – | 2 | 7,822 | (7,387 | ) | 1,171 | |||||||||||||||||||||||
| Net cash and cash equivalents at 1 January* | 5 | – | (56 | ) | – | – | 1,702 | – | 1,651 | |||||||||||||||||||||||
| Net cash and cash equivalents at 31 December | 5 | 122 | 556 | – | 2 | 9,524 | (7,387 | ) | 2,822 | |||||||||||||||||||||||
|
Condensed Consolidated Cash Flow Statement
|
||||||||||||||||||||||||||||||||
|
Year ended 31 December 2016 £m
|
||||||||||||||||||||||||||||||||
| BAT p.l.c. | BATCAP | BATIF | BATHTN | BATNF and RAI |
All other companies |
BAT Group | ||||||||||||||||||||||||||
| Parent guarantor |
Issuer | Subsidiary guarantor |
Subsidiary guarantor |
Subsidiary guarantors |
Non- guarantor subsidiaries |
Eliminations | Consolidated | |||||||||||||||||||||||||
| Net cash (used in)/generated from operating activities | (23 | ) | – | (8 | ) | 20 | – | 4,598 | 23 | 4,610 | ||||||||||||||||||||||
| Net cash generated from/(used in) investing activities | 24 | – | 406 | 2,811 | – | (3,788 | ) | (93 | ) | (640 | ) | |||||||||||||||||||||
| Net cash generated from/(used in) financing activities | – | – | 2,073 | (2,813 | ) | – | 2,486 | (5,975 | ) | (4,229 | ) | |||||||||||||||||||||
| Net cash flows generated from/(used in) operating, investing and financing activities | 1 | – | 2,471 | 18 | – | 3,296 | (6,045 | ) | (259 | ) | ||||||||||||||||||||||
| Differences on exchange | 1 | – | (42 | ) | – | – | 221 | – | 180 | |||||||||||||||||||||||
| Increase/(decrease) in net cash and cash equivalents in the year | 2 | – | 2,429 | 18 | – | 3,517 | (6,045 | ) | (79 | ) | ||||||||||||||||||||||
| Net cash and cash equivalents at 1 January* | 3 | – | 261 | – | – | 1,466 | – | 1,730 | ||||||||||||||||||||||||
| Net cash and cash equivalents at 31 December | 5 | – | 2,690 | 18 | – | 4,983 | (6,045 | ) | 1,651 | |||||||||||||||||||||||
| * | The opening balance of net cash and cash equivalents represents external cash held by the parent guarantor, issuers, subsidiary guarantors and non-guarantor subsidiaries. |
| 232 | BAT Annual Report and Form 20-F 2018 | |
|
Strategic Report
|
Governance
|
Financial Statements
|
Other Information
|
31 Accounting policy changes and regional restructure
Revisions to previously issued consolidated financial statements
Adoption of IFRS 15
With effect from 1 January 2018, the Group has adopted IFRS 15 Revenue from Contracts with Customers. In the 2018 financial statements the Group has fully revised prior periods, as permitted by the Standard, to ensure comparability of the income statement across prior periods. This standard requires certain payments to indirect customers, previously shown as marketing expenses, to be shown as deductions from revenue. This has reduced previously reported revenue for the year ended 31 December 2017 by £664 million (2016: £621 million), with a corresponding reduction in operating costs. In addition, due to the timing of the recognition of certain payments to indirect customers, previously reported revenue and operating profit for the twelve months ended 31 December 2017 has been reduced by a further £64 million (2016: £nil million). The impact on the Group Balance Sheet is disclosed below. In addition the above has also had an incidental impact on revenue policy included in note 1, note 2, note 6, note 7, note 13, note 19, note 22, note 29 and note 30(a).
Segment revision
In connection with the acquisition of RAI, the Group has revised its organisational structure. RAI is reported as a separate region (United States). The markets which previously comprised EEMEA merged with the Americas, Western Europe and Asia-Pacific to form three new regions. The markets in the Middle East merged with Asia-Pacific to form the Asia-Pacific and Middle East region (APME). The markets in East and Central Africa, West Africa and Southern Africa merged with the Americas region to form the Americas and Sub-Saharan Africa region (AMSSA). The markets in Russia, Ukraine, Caucasus, Central Asia, Belarus, Turkey and North Africa merged with the Western Europe region to form the Europe and North Africa region (ENA).
Accordingly the following disclosures have been revised in these consolidated financials:
| – | Note 2 Segmental analyses |
| – | Note 9 Intangible assets |
| – | Note 26 Group employees |
Adoption of new accounting standards effective 1 January 2018
Adoption of IFRS 9
In addition, with effect from 1 January 2018, the Group has adopted IFRS 9 Financial Instruments with no restatement of prior periods, as permitted by the Standard.
The cumulative impact of adopting the Standard, including the effect of tax entries, has been recognised as a restatement of opening reserves in 2018, and is £38 million, arising from the impairment of financial assets under the expected loss model. A simplified “lifetime expected loss model” is available for balances arising as a result of revenue recognition, by applying a standard rate of provision on initial recognition of trade debtors based upon the Group’s historical experience of credit loss modified by expectations of the future, and increasing this provision to take account of overdue receivables. Applying the requirements of IFRS 9 has resulted in a decrease of trade and other debtors of £45 million as at 1 January 2018.
IFRS 9 also changes the classification and measurement of financial assets. The category of available-for-sale investments (where fair value changes were deferred in reserves until disposal of the investment) has been replaced with the category of financial assets at Fair Value through Profit and Loss (for most investments) and the category of financial assets at Fair Value through Other Comprehensive Income (for qualifying equity investments), and the available-for-sale reserve at 1 January 2018 has been reclassified into retained earnings. In addition, certain loans and receivables which do not meet the measurement tests for amortised cost classification under IFRS 9 have been reclassified as financial assets at Fair Value through Profit and Loss at the same date. The Group has used the term “investments held at fair value” to refer to all of these financial assets both pre- and post- the adoption of IFRS 9.
| BAT Annual Report and Form 20-F 2018 | 233 | |
|
Financial Statements
|
Notes on the Accounts continued
31 Accounting policy changes and regional restructure continued
| 31 December 2017 | Impact of IFRS 9 | 01 Jan 2018 | ||||||||||||||||||||||||||
| Reported £m |
Adoption of £m |
Revised £m |
Financial assets reclass £m |
Expected loss impairment £m |
Revised for £m |
|||||||||||||||||||||||
| Assets | ||||||||||||||||||||||||||||
| Non-current assets | ||||||||||||||||||||||||||||
| Deferred tax assets | 317 | 16 | 333 | – | 7 | 340 | ||||||||||||||||||||||
| Trade and other receivables | 756 | – | 756 | (2 | ) | – | 754 | |||||||||||||||||||||
| Investments held at fair value | 42 | – | 42 | 2 | – | 44 | ||||||||||||||||||||||
| Other | 125,957 | – | 125,957 | – | – | 125,957 | ||||||||||||||||||||||
| Total non-current assets | 127,072 | 16 | 127,088 | – | 7 | 127,095 | ||||||||||||||||||||||
| Current assets | ||||||||||||||||||||||||||||
| Trade and other receivables | 4,053 | – | 4,053 | (144 | ) | (45 | ) | 3,864 | ||||||||||||||||||||
| Investments held at fair value | 65 | – | 65 | 144 | – | 209 | ||||||||||||||||||||||
| Other | 9,848 | – | 9,848 | – | – | 9,848 | ||||||||||||||||||||||
| Total current assets | 13,966 | – | 13,966 | – | (45 | ) | 13,921 | |||||||||||||||||||||
| Total assets | 141,038 | 16 | 141,054 | – | (38 | ) | 141,016 | |||||||||||||||||||||
| Equity | ||||||||||||||||||||||||||||
| Capital and reserves | ||||||||||||||||||||||||||||
| Share capital | 614 | – | 614 | – | – | 614 | ||||||||||||||||||||||
| Share premium, capital redemption and merger reserves | 26,602 | – | 26,602 | – | – | 26,602 | ||||||||||||||||||||||
| Other reserves | (3,395 | ) | 3 | (3,392 | ) | (9 | ) | – | (3,401 | ) | ||||||||||||||||||
| Retained earnings | 36,983 | (48 | ) | 36,935 | 9 | (38 | ) | 36,906 | ||||||||||||||||||||
| Owners of the parent | 60,804 | (45 | ) | 60,759 | – | (38 | ) | 60,721 | ||||||||||||||||||||
| Non-controlling interests | 222 | – | 222 | – | – | 222 | ||||||||||||||||||||||
| Total equity | 61,026 | (45 | ) | 60,981 | – | (38 | ) | 60,943 | ||||||||||||||||||||
| Liabilities | ||||||||||||||||||||||||||||
| Non-current liabilities | ||||||||||||||||||||||||||||
| Other | 64,468 | – | 64,468 | – | – | 64,468 | ||||||||||||||||||||||
| Total non-current liabilities | 64,468 | – | 64,468 | – | – | 64,468 | ||||||||||||||||||||||
| Current liabilities | ||||||||||||||||||||||||||||
| Trade and other payables | 8,847 | 61 | 8,908 | – | – | 8,908 | ||||||||||||||||||||||
| Other | 6,697 | – | 6,697 | – | – | 6,697 | ||||||||||||||||||||||
| Total current liabilities | 15,544 | 61 | 15,605 | – | – | 15,605 | ||||||||||||||||||||||
| Total equity and liabilities | 141,038 | 16 | 141,054 | – | (38 | ) | 141,016 | |||||||||||||||||||||
Adoption of new accounting standards effective 1 January 2019
Adoption of IFRS 16
As set out in note 1, IFRS 16 Leases has mandatory effective date of implementation of 1 January 2019. The distinction between operating leases and finance leases is removed with the effect that virtually all leasing arrangements will be brought on to the balance sheet as financial obligations and ‘right-to-use’ assets.
In adopting IFRS 16, the Group will apply the modified retrospective approach consistently across the Group, with no restatement of prior periods, as permitted by the Standard. On the initial implementation of the Standard, previously recognised operating leases will be capitalised as right-to-use assets and financial liabilities will be recognised at the same initial value. The Group will take advantage of certain practical expedients available under the Standard including:
| – | “grandfathering” previously recognised lease arrangements; |
| – | applying a single discount rate to a portfolio of leases with reasonably similar characteristics; |
| – | assessing whether a lease is onerous prior to applying the Standard; |
| – | applying hindsight in determining the lease term if the contract contains options to extend or terminate the lease; and |
| – | not applying the capitalisation requirements of the Standard to leases for which the lease term ends within 12 months of the date of initial application. |
| 234 | BAT Annual Report and Form 20-F 2018 | |
|
Strategic Report
|
Governance
|
Financial Statements
|
Other Information
|
31 Accounting policy changes and regional restructure continued
Going forward, the Group will also adopt several practical expedients under the Standard including:
| – | not applying the requirements of IFRS 16 to leases of intangible assets; |
| – | applying the portfolio approach where appropriate to do so; |
| – | not applying the recognition and measurement requirements of IFRS 16 to short-term leases and to leases of low-value assets; and |
| – | not separating non-lease components from lease components (except in the case of property-related leases). |
The anticipated impact of the new Standard to the Group’s balance sheet at 1 January 2019, and a reconciliation to reported leasing commitments in note 28, is shown below:
| £m
|
||||
| Minimum lease commitments as disclosed in note 28 | 690 | |||
| Additional commitments on the exercise of options | 28 | |||
| Low value leases and short-term leases excluded | (24 | ) | ||
| Discounted to present value | (132 | ) | ||
| To be capitalised as lease liabilities at 1 January 2019 | 562 | |||
| Prepaid leases reclassified from receivables | 3 | |||
| To be capitalised as right-to-use assets at 1 January 2019 | 565 | |||
The weighted average incremental borrowing rate applied in discounting lease commitments was 5.76%.
| BAT Annual Report and Form 20-F 2018 | 235 | |
|
Financial Statements
|
Group companies and undertakings
This disclosure is made in accordance with Section 409 of the Companies Act 2006 and The Large and Medium-sized Companies and Groups (Accounts and Reports) Regulations 2008, as amended by The Companies, Partnerships and Groups (Accounts and Reports) Regulations 2015. A full list of subsidiary undertakings, associates and joint ventures and joint operations as defined by IFRS (showing the country of incorporation, effective percentage of equity shares held and full registered office addresses) as at 31 December 2018 is disclosed below.
The subsidiary undertakings that are held directly by British American Tobacco p.l.c. (the ultimate parent company) are indicated thus*; all others are held by sub-holding companies.
Unless otherwise stated, the equity shares held are in the form of ordinary shares or common stock, except for those indicated thus#, which include preference shares. The effective percentage of equity shares held in subsidiary undertakings is 100% unless otherwise stated. Further, where the effective percentage of equity shares held by the sub-holding company is different from that held by British American Tobacco p.l.c., the percentage of equity shares held by British American Tobacco p.l.c. is indicated thus^ and is shown after the percentage interest held by the sub-holding company.
The results of a number of these subsidiary undertakings principally affect the financial statements of the Group. These principal subsidiary undertakings are highlighted in grey and are considered to be the main corporate entities in those countries which, in aggregate, contributed over 76% of the Group revenue and 95% of profit from operations.
| 236 | BAT Annual Report and Form 20-F 2018 | |
|
Strategic Report
|
Governance
|
Financial Statements
|
Other Information
|
| BAT Annual Report and Form 20-F 2018 | 237 | |
|
Financial Statements
|
Group companies and undertakings continued
| 238 | BAT Annual Report and Form 20-F 2018 | |
|
Strategic Report
|
Governance
|
Financial Statements
|
Other Information
|
| BAT Annual Report and Form 20-F 2018 | 239 | |
|
Financial Statements
|
Group companies and undertakings continued
| 240 | BAT Annual Report and Form 20-F 2018 | |
|
Strategic Report
|
Governance
|
Financial Statements
|
Other Information
|
| BAT Annual Report and Form 20-F 2018 | 241 | |
|
Financial Statements
|
Group companies and undertakings continued
| 242 | BAT Annual Report and Form 20-F 2018 | |
|
Strategic Report
|
Governance
|
Financial Statements
|
Other Information
|
| BAT Annual Report and Form 20-F 2018 | 243 | |
| Financial Statements
|
Group companies and undertakings continued
| 244 | BAT Annual Report and Form 20-F 2018 | |
|
Strategic Report
|
Governance
|
Financial Statements
|
Other Information
|
| BAT Annual Report and Form 20-F 2018 | 245 | |
| Financial Statements
|
[This page intentionally left blank]
| 246 | BAT Annual Report and Form 20-F 2018 | |
|
Strategic Report
|
Governance
|
Financial Statements
|
Other Information
|
[This page intentionally left blank]
| BAT Annual Report and Form 20-F 2018 | 247 | |
| Financial Statements
|
[This page intentionally left blank]
| 248 | BAT Annual Report and Form 20-F 2018 | |
|
Strategic Report
|
Governance
|
Financial Statements
|
Other Information
|
[This page intentionally left blank]
| BAT Annual Report and Form 20-F 2018 | 249 | |
| Financial Statements
|
[This page intentionally left blank]
| 250 | BAT Annual Report and Form 20-F 2018 | |
|
Strategic Report
|
Governance
|
Financial Statements
|
Other Information
|
[This Page Left Intentionally Blank]
| BAT Annual Report and Form 20-F 2018 | 251 | |
| Financial Statements
|
[This page intentionally left blank]
| 252 | BAT Annual Report and Form 20-F 2018 | |
|
|
Strategic Report
|
Governance
|
Financial Statements
|
Other Information
|
| BAT Annual Report and Form 20-F 2018 | 253 | |
|
Additional disclosures
|
| 254 | BAT Annual Report and Form 20-F 2018 | |
|
Strategic Report
|
Governance
|
Financial Statements
|
Other Information
|
The Management Board, chaired by the Chief Executive, is responsible for overseeing the implementation of the Group’s strategy and policies set by the Board, and for creating the framework for the day-to-day operation of the Group’s operating subsidiaries. As at 27 February 2019, its members comprise the Executive Directors (as set out on page 54) and 14 senior Group executives, whose names and roles are described below.
Jerome Abelman
Director, Legal & External Affairs and General Counsel (55)
Jerry was appointed Director, Legal & External Affairs and General Counsel in May 2015, having joined the Management Board as Group Corporate & Regulatory Affairs Director in January 2015. Jerry was Regional General Counsel, Asia-Pacific from 2010 to 2014, before becoming Assistant General Counsel – Corporate & Commercial. He was a member of the Board of RAI from February 2016 until the RAI acquisition in July 2017.
Marina Bellini
Director, Digital and Information (45)
Marina was appointed Director, Digital and Information on 1 January 2019. This role is responsible for driving digital transformation across the Group and further enhancing the Group’s digital consumer experience capabilities. Marina joined the Group as Chief Information Officer (CIO) in 2018, having previously served as Global CIO and Global Business Services SVP at Anheuser-Busch InBev, where she was responsible for information technology transformation, including consumer digital marketing.
Luciano Comin
Regional Director, Americas and Sub-Saharan Africa (49)
Luciano was appointed Regional Director, Americas and Sub-Saharan Africa on 1 January 2019. He joined the Group in 1992 and has gained broad experience in a wide range of roles, including Marketing Director in Venezuela, Marketing Director in Mexico and General Manager of BAT Mexico. Luciano was also Regional Marketing Manager for Western Europe and then Regional Head of Marketing, Americas and Sub-Saharan Africa before his appointment to the Management Board.
Alan Davy
Director, Operations (55)
Alan was appointed as Group Operations Director in March 2013. He joined the Group in 1988 and has held various roles in manufacturing, supply chain and general management. Alan previously held the position of Group Head of Supply Chain.
Giovanni Giordano
Director, Group Human Resources (53)
Giovanni was appointed as Group Human Resources Director in June 2011. He is an international human resources executive with wide experience from senior roles at Procter & Gamble and Ferrero, where he was Chief Corporate Officer. As part of Management Board changes announced in December 2018, Giovanni will step down from the Management Board at the end of March 2019 and will be succeeded by Hae In Kim.
Hae In Kim
Director, Talent and Culture Designate (45)
Hae In was appointed Director, Talent and Culture Designate on 1 January 2019 and will succeed Giovanni Giordano, currently Director, Group Human Resources, on 1 April 2019. She was previously Group Head of Talent and Organisational Effectiveness and has held several other senior HR roles in British American Tobacco, including Regional HR Director, Asia-Pacific, and HR Director, Japan and North Asia. Prior to joining the Group in 2008, Hae In gained experience at Samsung, IBM Consulting Services and PricewaterhouseCoopers. Hae In has been a Non-Executive Director of Pakistan Tobacco Company Limited since April 2015.
Paul Lageweg
Director, New Categories (49)
Paul was appointed Director, New Categories on 1 January 2019. This role, reporting directly to the Chief Marketing Officer, has end-to-end accountability for driving growth, innovation, world-class brand building and consumer insights for the Group’s potentially reduced-risk products. Paul has been with the Group for 13 years in various senior roles, including: Regional Marketing Manager, Asia-Pacific and Middle East; Area Director, East Asia; and Global Head of Marketing Futures.
Tadeu Marroco
Director, Group Transformation (52)
Tadeu was appointed Director, Group Transformation on 1 January 2019, working closely with the Chief Executive Designate to further simplify structure and processes. In addition to this role, Tadeu has been appointed as Deputy Finance Director with effect from 1 March 2019 and will succeed Ben Stevens as Finance Director on 5 August 2019. Tadeu joined the Management Board as Director, Business Development, in September 2014, was appointed Regional Director, Western Europe in December 2016, then Regional Director, Europe and North Africa in January 2018. Tadeu joined the Group in Brazil in 1992. He has held various senior finance positions including Regional Finance Controller, EEMEA, and Group Finance Controller.
| BAT Annual Report and Form 20-F 2018 | 255 | |
|
Additional disclosures
|
Management Board biographies continued
Guy Meldrum
Regional Director, Asia-Pacific and Middle East (47)
Guy was appointed Regional Director, Asia-Pacific and Middle East on 1 January 2019. Previously Area Director, Australasia Area, Guy joined BAT in 1992 and has held several senior roles in the Group including Area Director, North Asia Area and Marketing Director, Russia.
Dr David O’Reilly
Director, Research and Science (52)
David was appointed Director, Research and Science on 1 January 2019, focusing on scientific research and engagement to support continued transformation of our product portfolio. David joined the Management Board in January 2012 as Group Scientific Director, leading R&D’s focus on potentially reduced-risk products. He has been with the Group for more than 20 years and was previously Head of International Public Health and Scientific Affairs, responsible for engagement with scientific, medical and public health communities.
Ricardo Oberlander
President and CEO, Reynolds American Inc. (55)
Ricardo was appointed President and CEO of Reynolds American Inc. on 1 January 2018. Appointed to the Management Board as Regional Director for the Americas in 2013, previous roles include Marketing Director of the Malaysian business, Regional Marketing Manager for the Americas, General Manager in France and Global Consumer Director. He was Chairman of Souza Cruz S.A. from 2013 until it became a wholly-owned subsidiary of BAT in 2016 and an RAI Board member from 2014 until the acquisition. Ricardo is a member of the Chief Marketing Officer Council North America Advisory Board and was appointed as an Advisory Board member of Coast Capital LLC in November 2018.
Naresh Sethi
Director, Business Development (52)
Naresh was appointed Director, Business Development in December 2016. He joined the Management Board as Director, Group Business Development in 2012, then Regional Director for Western Europe from January 2013. He has over 20 years of experience in the tobacco industry, having held various roles in the Group including Marketing Director and General Manager in Japan and then Group Head of Strategy and Planning. As part of Management Board changes announced in December 2018, Naresh will step down from the Management Board at the end of March 2019 when his role will cease to exist. His responsibilities will move to the roles of Director, Digital and Information, and Director, Group Transformation.
Johan Vandermeulen
Regional Director, Europe and North Africa (51)
Johan was appointed Regional Director, Europe and North Africa on 1 January 2019. He joined the Management Board as Regional Director for Eastern Europe, Middle East and Africa in September 2014, then Regional Director, Asia-Pacific and Middle East in January 2018. He has been with the Group for more than 25 years and his previous roles include General Manager in Russia, General Manager in Turkey and Global Brand Director for the Kent brand.
Kingsley Wheaton
Chief Marketing Officer (46)
Kingsley was appointed Chief Marketing Officer on 1 January 2019. He joined the Group in 1996 and held positions in marketing, including, Marketing Director in Nigeria and Russia, prior to being General Manager in Russia and then the Global Brand Director for the Kent and Vogue brands. He joined the Management Board in 2012 as Corporate and Regulatory Affairs Director. In January 2015 he was appointed Managing Director, Next Generation Products, and was then appointed Regional Director, Americas and Sub-Saharan Africa in January 2018.
| 256 | BAT Annual Report and Form 20-F 2018 | |
|
Strategic Report
|
Governance
|
Financial Statements
|
Other Information
|
Selected financial information
This information set out below has been derived from, in part, the audited consolidated financial statements of the Group commencing on page 122. This selected financial information should be read in conjunction with the consolidated financial statements and the Strategic Report.
| As of and for the Year Ended 31 December1
|
||||||||||||||||||||
| All items shown in £m except per share information | 2018
|
2017
|
2016
|
2015
|
2014
|
|||||||||||||||
| Income statement data | ||||||||||||||||||||
| Revenue2 | 24,492 | 19,564 | 14,130 | 12,536 | 13,355 | |||||||||||||||
| Raw materials and consumables used | (4,664 | ) | (4,520 | ) | (3,777 | ) | (3,217 | ) | (3,088 | ) | ||||||||||
| Changes in inventories of finished goods and work in progress | 114 | (513 | ) | 44 | 184 | 58 | ||||||||||||||
| Employee benefit costs | (3,005 | ) | (2,679 | ) | (2,274 | ) | (2,039 | ) | (2,194 | ) | ||||||||||
| Depreciation, amortisation and impairment costs | (1,038 | ) | (902 | ) | (607 | ) | (428 | ) | (523 | ) | ||||||||||
| Other operating income | 85 | 144 | 176 | 225 | 178 | |||||||||||||||
| Loss on reclassification from amortised cost to fair value | (3 | ) | – | – | – | – | ||||||||||||||
| Other operating expenses | (6,668 | ) | (4,682 | ) | (3,037 | ) | (2,704 | ) | (3,240 | ) | ||||||||||
| Profit from operations | 9,313 | 6,412 | 4,655 | 4,557 | 4,546 | |||||||||||||||
| Net finance (costs)/income | (1,381 | ) | (1,094 | ) | (637 | ) | 62 | (417 | ) | |||||||||||
| Share of post-tax results of associates and joint ventures | 419 | 24,209 | 2,227 | 1,236 | 719 | |||||||||||||||
| Profit before taxation | 8,351 | 29,527 | 6,245 | 5,855 | 4,848 | |||||||||||||||
| Taxation on ordinary activities | (2,141 | ) | 8,129 | (1,406 | ) | (1,333 | ) | (1,455 | ) | |||||||||||
| Profit for the year | 6,210 | 37,656 | 4,839 | 4,522 | 3,393 | |||||||||||||||
| Per share data | ||||||||||||||||||||
| Basic weighted average number of ordinary shares, in millions | 2,285 | 2,044 | 1,858 | 1,858 | 1,864 | |||||||||||||||
| Diluted weighted average number of ordinary shares, in millions | 2,292 | 2,051 | 1,865 | 1,863 | 1,870 | |||||||||||||||
| Earnings per share-basic (pence) | 264.0p | 1,833.9p | 250.2p | 230.9p | 167.1p | |||||||||||||||
| Earnings per share-diluted (pence) | 263.2p | 1,827.6p | 249.2p | 230.3p | 166.6p | |||||||||||||||
| Dividends per share (pence)3 | 203.0p | 195.2p | 169.4p | 154.0p | 148.1p | |||||||||||||||
| Dividends per share (US dollars)3 | $2.71 | $2.54 | $2.30 | $2.35 | $2.44 | |||||||||||||||
| Balance sheet data | ||||||||||||||||||||
| Assets | ||||||||||||||||||||
| Non-current assets | 133,687 | 127,088 | 27,414 | 21,701 | 17,035 | |||||||||||||||
| Current assets | 12,655 | 13,966 | 12,359 | 9,814 | 9,132 | |||||||||||||||
| Total assets | 146,342 | 141,054 | 39,773 | 31,515 | 26,167 | |||||||||||||||
| Liabilities | ||||||||||||||||||||
| Non-current liabilities | 64,325 | 64,468 | 19,511 | 17,477 | 11,584 | |||||||||||||||
| Current liabilities | 16,329 | 15,605 | 11,856 | 9,006 | 8,769 | |||||||||||||||
| Total borrowings | 47,509 | 49,450 | 19,495 | 17,001 | 12,258 | |||||||||||||||
| Equity | ||||||||||||||||||||
| Share capital | 614 | 614 | 507 | 507 | 507 | |||||||||||||||
| Total equity | 65,688 | 60,981 | 8,406 | 5,032 | 5,814 | |||||||||||||||
| Cash flow data | ||||||||||||||||||||
| Net cash generated from operating activities | 10,295 | 5,347 | 4,610 | 4,720 | 3,716 | |||||||||||||||
| Net cash used in investing activities | (1,021 | ) | (18,544 | ) | (640 | ) | (3,991 | ) | (470 | ) | ||||||||||
| Net cash used in financing activities |
|
(9,630
|
)
|
|
14,759
|
|
|
(4,229
|
)
|
|
(219
|
)
|
|
(3,467
|
)
| |||||
Notes:
| 1. | All of the information above is in respect of continuing operations, revised for the fully retrospective adoption of IFRS 15. The historical financial data for 2014 is unaudited. |
| 2. | Revenue is net of duty, excise and other taxes of £38,553 million, £37,780 million, £32,136 million, £27,896 million and £28,535 million for the years ended 31 December 2018, 2017, 2016, 2015 and 2014, respectively. |
| 3. | In February 2019, the BAT directors declared an interim dividend of 203.0 pence per ordinary share of 25p, payable in four equal quarterly instalments of 50.75 pence per ordinary share. This will be paid in May 2019, August 2019, November 2019 and February 2020. The equivalent quarterly dividends receivable by holders of ADSs in US dollars will be calculated based on the exchange rate on the applicable payment date. The BAT Directors recommended, and the BAT shareholders approved at the 2018 Annual General Meeting, an interim dividend of 195.2 pence per share for the year ended 31 December 2017, payable in four equal instalments of 48.8 pence per ordinary share. The interim dividend was paid to BAT shareholders in May 2018, August 2018, November 2018 and February 2019. On 5 December 2017, the Directors also declared, as part of the transition to quarterly dividends, a second interim dividend of 43.6p (equivalent to 25% of the cash dividend paid in 2017) which was paid on 8 February 2018. |
| BAT Annual Report and Form 20-F 2018 | 257 | |
|
Additional disclosures
|
To supplement the presentation of the Group’s results of operations and financial condition in accordance with IFRS, we also present several non-GAAP measures used by management to monitor the Group’s performance. The Group’s management regularly reviews the measures used to assess and present the financial performance of the Group and, as relevant, its geographic segments.
Changes to non-GAAP measures in 2018
Due to the significant impact of the acquisition of Reynolds American (and other businesses in 2017) and to demonstrate the performance of the enlarged Group in 2018 with reference to 2017, several non-GAAP measures for the year ended 31 December 2017 have been presented as though the Group had owned those acquisitions from 1 January 2017. This provides a “representative basis” against which the Group will assess the performance of 2018. This is different to the 2017 measure of “organic” performance which seeks to remove the impact from acquisitions in the period. Results on a representative basis seek to provide a comparator period inclusive of the acquisitions for the whole of the comparator period, including the performance of the acquisitions in the period prior to purchase. Results on a representative basis are not deemed to be equivalent to pro forma financial information as they are derived from adjusted measures, which will exclude the adjusting items, that may arise in the context of a pro forma presentation due to the requirements of such areas as purchase price allocation adjustments (to inventory, amortisation of the fair value adjustment to debt and the amortisation of trademarks).
The Group also introduced a new non-GAAP measure called ‘Growth in Adjusted Revenue from the Strategic Portfolio’. The strategic portfolio comprises the strategic combustible brands (Kent, Dunhill, Lucky Strike, Pall Mall and Rothmans (previously collectively referred to as the Global Drive Brands, or GDBs), Camel (US), Newport (US) and Natural American Spirit (US)) and our potentially reduced-risk products portfolio, including our NGP business of THP and vapour, as well as the traditional oral and modern oral brands.
The Group also included adjusted net debt to adjusted EBITDA to assess its financial capacity and the Group’s ability to meet its borrowing obligations.
Results on a representative basis
Definition – the performance of the business including the results of acquisitions for the whole of the immediately preceding comparator period.
The acquisitions undertaken during 2017 impact the understanding of the Group’s results in 2018, as, in the year of acquisition, the results include less than a full year’s contribution from the acquired entities. To supplement BAT’s results presented in accordance with IFRS, the Group’s Management Board, as the chief operating decision maker, reviews certain of its results, including volume, revenue, profit from operations, and non-GAAP measures including adjusted revenue, adjusted revenue growth from the Strategic Portfolio and adjusted profit from operations, against the prior year as though the Group had owned the acquisitions made in 2017 for the whole of that year, and for profit from operations including an estimated £250 million of additional adjusting items related to the acquired companies, primarily related to Engle Progeny and transaction costs. Although the Group does not believe that these measures are a substitute for IFRS measures, the Group does believe that such results provide additional useful information to investors regarding the underlying performance of the business on a comparable (or ‘representative’) basis. Accordingly, the financial measures on a representative basis appearing in this document should be read in conjunction with the Group’s results as reported under IFRS. The table below reconciles the Group’s revenue in 2018 to adjusted revenue at constant rates based on a re-translation of adjusted revenue in 2018 at 2017’s exchange rates, and also reconciles 2017 revenue to adjusted revenue on a representative basis.
| Revenue | For the year ended 31 December (£m) | |||||||||||||||||||||||||||||||||||||||
| 2018 | 2017 | |||||||||||||||||||||||||||||||||||||||
| Reported
£m |
Adjusting items
£m |
Adjusted
£m |
Impact of exchange
£m |
Adjusted at
£m |
Reported
£m |
Adjusting
£m |
Adjusted
£m |
Include
£m |
Adjusted
£m |
|||||||||||||||||||||||||||||||
| US | 9,495 | – | 9,495 | 343 | 9,838 | 4,160 | – | 4,160 | 5,531 | 9,691 | ||||||||||||||||||||||||||||||
| APME | 4,882 | – | 4,882 | 368 | 5,250 | 4,973 | – | 4,973 | (4 | ) | 4,969 | |||||||||||||||||||||||||||||
| AmSSA | 4,111 | – | 4,111 | 449 | 4,560 | 4,323 | – | 4,323 | (3 | ) | 4,320 | |||||||||||||||||||||||||||||
| ENA | 6,004 | (180 | ) | 5,824 | 288 | 6,112 | 6,108 | (258 | ) | 5,850 | 53 | 5,903 | ||||||||||||||||||||||||||||
| 24,492 | (180 | ) | 24,312 | 1,448 | 25,760 | 19,564 | (258 | ) | 19,306 | 5,577 | 24,883 | |||||||||||||||||||||||||||||
The table below reconciles the Group’s profit from operations in 2018 to adjusted profit from operations at constant rates based on a retranslation of adjusted profit from operations in 2018 at 2017’s exchange rates, and also reconciles 2017 profit from operations to adjusted profit from operations on a representative basis.
| Profit from operations | For the year ended 31 December (£m) | |||||||||||||||||||||||||||||||||||||||
| 2018 | 2017 | |||||||||||||||||||||||||||||||||||||||
| Reported
£m |
Adjusting
£m |
Adjusted
£m |
Impact of
£m |
Adjusted at CC
£m |
Reported
£m |
Adjusting
£m |
Adjusted
£m |
Include
£m |
Adjusted
£m |
|||||||||||||||||||||||||||||||
| US | 4,006 | 505 | 4,511 | 175 | 4,686 | 1,165 | 763 | 1,928 | 2,502 | 4,430 | ||||||||||||||||||||||||||||||
| APME | 1,858 | 90 | 1,948 | 151 | 2,099 | 1,902 | 147 | 2,049 | 25 | 2,074 | ||||||||||||||||||||||||||||||
| AmSSA | 1,544 | 194 | 1,738 | 184 | 1,922 | 1,648 | 134 | 1,782 | 22 | 1,804 | ||||||||||||||||||||||||||||||
| ENA | 1,905 | 245 | 2,150 | 67 | 2,217 | 1,697 | 473 | 2,170 | 29 | 2,199 | ||||||||||||||||||||||||||||||
| 9,313 | 1,034 | 10,347 | 577 | 10,924 | 6,412 | 1,517 | 7,929 | 2,578 | 10,507 | |||||||||||||||||||||||||||||||
| * | Refer to page 259 for further details on the adjusting items. |
| 258 | BAT Annual Report and Form 20-F 2018 | |
|
Strategic Report
|
Governance
|
Financial Statements
|
Other Information
|
Results on an organic basis
Definition – the performance of the business before inclusion of acquired entities.
The acquisition of Reynolds American Inc. and Winnington, and the business and certain tobacco assets of Bulgartabac, and Fabrika Duhana Sarajevo impacted the Group’s results in 2017. To supplement BAT’s results presented in accordance with IFRS, the Group’s Management Board, as the chief operating decision maker, reviews certain of its results, including volume, revenue, profit from operations, and non-GAAP measures including adjusted revenue and adjusted profit from operations, prior to the impact of acquisitions. Although the Group does not believe that these measures are a substitute for IFRS measures, the Group does believe that such results excluding the impact of acquisitions provide additional useful information to investors regarding the underlying performance of the business on a comparable basis. Accordingly, the organic financial measures appearing in this document should be read in conjunction with the Group’s results as reported under IFRS.
We also present the growth in organic adjusted operating margin in 2017 compared to adjusted operating margin in 2016; 2017 organic adjusted operating margin represents the ratio of profit from operations before adjusting items and the impact of 2017 acquisitions to revenue before adjusting items and the impact of 2017 acquisitions. Please see the following reconciliations of revenue to adjusted revenue and profit from operations to adjusted profit from operations.
Adjusted revenue
Definition – revenue before the impact of adjusting items.
To supplement BAT’s revenue presented in accordance with IFRS, the Group’s Management Board, as the chief operating decision maker, reviews adjusted revenue to evaluate the underlying business performance of the Group and its geographic segments. The Group’s Management Board defines adjusted revenue as revenue before the impact of adjusting items, specifically the excise on bought-in goods that the Group will acquire and sell, for a limited period, will be recorded in accordance with IFRS as a cost of sale and within revenue, with a dilutive effect on operating margin. Once the short-term arrangements cease, the goods will be manufactured by the Group, and the excise, in accordance with Group policy, will not be included in cost of sales or revenue – leading to a reduction in revenue and improvement in operating margin that does not represent the underlying performance of the Group. As such, the excise on bought-in goods meets the Group’s definition of an adjusting item, as defined in note 1 in the Notes on the Accounts.
The Group’s Management Board also believes that adjusted revenue provides information that enables investors to better compare the Group’s business performance across periods. Adjusted revenue has limitations as an analytical tool. The most directly comparable IFRS measure to adjusted revenue is revenue. Adjusted revenue is not a presentation made in accordance with IFRS, is not a measure of financial condition or liquidity and should not be considered as an alternative to revenue as determined in accordance with IFRS. Adjusted revenue is not necessarily comparable to similarly titled measures used by other companies. As a result, you should not consider this performance measure in isolation from, or as a substitute analysis for, BAT’s results as determined in accordance with IFRS.
The table below reconciles the Group’s revenue to adjusted revenue for the periods presented and to adjusted revenue at constant rates based on a re-translation of adjusted revenue for each year at the previous year’s exchange rates. Refer to note 2 in the Notes on the Accounts for further discussion of the segmental results and for the reconciliation of adjusted revenue at current and constant rates of exchange to segmental revenue and to Group revenue for the years ended 31 December 2018, 2017 and 2016.
| For the year ended 31 December (£m)
|
||||||||||||||||||||
|
2018
|
2017
|
2016
|
2015
|
2014
|
||||||||||||||||
| Revenue | 24,492 | 19,564 | 14,130 | 12,536 | 13,355 | |||||||||||||||
| Less: Excise on goods bought-in on short-term arrangements | (180 | ) | (258 | ) | – | – | – | |||||||||||||
| Adjusted revenue | 24,312 | 19,306 | 14,130 | 12,536 | 13,355 | |||||||||||||||
| Impact of translational foreign exchange | 1,448 | (700 | ) | (687 | ) | 1,545 | 1,635 | |||||||||||||
| 2018 adjusted revenue re-translated at 2017 exchange rates | 25,760 | |||||||||||||||||||
| 2017 adjusted revenue re-translated at 2016 exchange rates | 18,606 | |||||||||||||||||||
| 2016 adjusted revenue re-translated at 2015 exchange rates | 13,443 | |||||||||||||||||||
| 2015 adjusted revenue re-translated at 2014 exchange rates | 14,081 | |||||||||||||||||||
| 2014 adjusted revenue re-translated at 2013 exchange rates | 14,990 | |||||||||||||||||||
| Change in adjusted revenue at prior year’s exchange rates (constant rates) | +33.4% | +31.7% | +7.2% | +5.4% | +2.8% | |||||||||||||||
| BAT Annual Report and Form 20-F 2018 | 259 | |
|
Additional disclosures
|
Non-GAAP measures continued
Adjusted revenue growth from the Strategic Portfolio, at constant rates of exchange
Definition – change in revenue before the impact of adjusting items and at the prior year’s prevailing exchange rate, derived from Kent, Dunhill, Lucky Strike, Pall Mall, Rothmans, Camel (US), Newport, Natural American Spirit (US) and the Group’s brands within the potentially reduced-risk products portfolio.
To supplement BAT’s revenue presented in accordance with IFRS, the Group’s Management Board, as the chief operating decision maker, reviews adjusted revenue growth from the Strategic Portfolio to evaluate the underlying business performance of the Group reflecting the focus of the Group’s investment activity. The Group’s Management Board defines the growth in adjusted revenue from the Strategic Portfolio, at constant rates of exchange, as revenue before the impact of adjusting items and translated to the Group’s reporting currency at the prior periods prevailing exchange rate, derived from the Group’s Strategic Combustible portfolio (Kent, Dunhill, Lucky Strike, Pall Mall, Rothmans, Camel (US), Newport (US) , Natural American Spirit (US)) and the potentially reduced-risk products portfolio, being vapour, THP, modern oral and traditional oral categories.
The Group’s Management Board also believes that the adjusted revenue growth from the Strategic Portfolio at constant rates of exchange provides information that enables investors to better compare the Group’s business performance across periods and by reference to the Group’s investment activity. Adjusted revenue growth from the Strategic Portfolio has limitations as an analytical tool. The most directly comparable IFRS measure to adjusted revenue growth from the Strategic Portfolio is revenue. Adjusted revenue growth from the Strategic Portfolio at constant rates of exchange is not a presentation made in accordance with IFRS, is not a measure of financial condition or liquidity and should not be considered as an alternative to revenue as determined in accordance with IFRS. Adjusted revenue growth from the Stratetgic Portfolio is not necessarily comparable to similarly titled measures used by other companies. As a result, you should not consider this performance measure in isolation from, or as a substitute analysis for, BAT’s results as determined in accordance with IFRS.
This metric was introduced for the period commencing 1 January 2018. Comparative data for 2017 has been provided to determine the growth in 2018. No comparator data is provided for the periods prior to 2017.
Reconciliation of revenue to adjusted revenue from the strategic portfolio at constant rates of exchange
| 2018 £m |
Adjusting £m |
Impact of exchange £m |
Adjusted at £m |
Adjusted at % |
Adjusted at % |
2017 £m |
Uplift for acquisitions £m |
2017 repres £m |
||||||||||||||||||||||||||||
| Strategic portfolio comprises: | ||||||||||||||||||||||||||||||||||||
| Combustible portfolio | 15,457 | – | 816 | 16,273 | +50.1% | +5.7% | 10,842 | 4,553 | 15,395 | |||||||||||||||||||||||||||
| Potentially reduced-risk products (PRRPs) | ||||||||||||||||||||||||||||||||||||
| Vapour | 318 | – | 7 | 325 | +93.5% | +26.0% | 168 | 90 | 258 | |||||||||||||||||||||||||||
| THP | 565 | – | 11 | 576 | +185.1% | +183.7% | 202 | 1 | 203 | |||||||||||||||||||||||||||
| NGP | 883 | – | 18 | 901 | +143.5% | +95.4% | 370 | 91 | 461 | |||||||||||||||||||||||||||
| Modern oral | 34 | – | 2 | 36 | +140.0% | +140.0% | 15 | – | 15 | |||||||||||||||||||||||||||
| Traditional oral | 883 | – | 33 | 916 | +136.7% | +9.0% | 387 | 453 | 840 | |||||||||||||||||||||||||||
| Oral | 917 | – | 35 | 952 | +136.8% | +11.3% | 402 | 453 | 855 | |||||||||||||||||||||||||||
| Total PRRPs | 1,800 | – | 53 | 1,853 | +140.0% | +40.8% | 772 | 544 | 1,316 | |||||||||||||||||||||||||||
| Strategic Portfolio | 17,257 | – | 869 | 18,126 | +56.1% | +8.5% | 11,614 | 5,097 | 16,711 | |||||||||||||||||||||||||||
| Other | 7,235 | (180 | ) | 579 | 7,634 | -0.8% | -6.6% | 7,692 | 480 | 8,172 | ||||||||||||||||||||||||||
| Revenue | 24,492 | (180 | ) | 1,448 | 25,760 | +33.4% | +3.5% | 19,306 | 5,577 | 24,883 | ||||||||||||||||||||||||||
There were no adjusting items in revenue recognised by RAI or the other acquired businesses that impact the uplift to the 2017 representative base.
| 260 | BAT Annual Report and Form 20-F 2018 | |
|
Strategic Report
|
Governance
|
Financial Statements
|
Other Information
|
Adjusted profit from operations and adjusted operating margin
Definition – profit from operations before the impact of adjusting items and adjusted profit from operations as a percentage of adjusted revenue.
To supplement BAT’s results from operations presented in accordance with IFRS, the Group’s Management Board, as the chief operating decision maker, reviews adjusted profit from operations to evaluate the underlying business performance of the Group and its geographic segments, to allocate resources to the overall business and to communicate financial performance to investors. The Group also presents adjusted operating margin, which is defined as adjusted profit from operations as a percentage of adjusted revenue, as defined previously. Adjusted profit from operations and adjusted operating margin are not measures defined by IFRS. The most directly comparable IFRS measure to adjusted profit from operations is profit from operations.
Adjusting items, as identified in accordance with the Group’s accounting policies, represent certain items of income and expense which the Group considers distinctive based on their size, nature or incidence. In identifying and quantifying adjusting items, the Group consistently applies a policy that defines criteria that are required to be met for an item to be classified as adjusting and provides details of items that are specifically excluded from being classified as adjusting items. Adjusting items in profit from operations include restructuring and integration costs, amortisation of trademarks and similar intangibles, the fair value movement in stock on acquisition, a gain on deemed partial disposal of a trademark and certain litigation. The definition of adjusting items is explained in note 1 in the Notes on the Accounts.
The Group’s Management Board believes that these additional measures are useful to investors and are used by the Group management board as described above, because they exclude the impact of adjusting items in profit from operations, which have less bearing on the routine operating activities of the Group, thereby enhancing users’ understanding of underlying business performance. The Group’s Management Board also believes that adjusted profit from operations provides information that enables investors to better compare the Group’s business performance across periods. Additionally, the Group’s Management Board believes that similar measures are frequently used by securities analysts, investors and other interested parties in their evaluation of companies comparable to the Group, many of which present an adjusted operating profit-related performance measure when reporting their results. Adjusted profit from operations and adjusted operating margin have limitations as analytical tools. They are not presentations made in accordance with IFRS, are not measures of financial condition or liquidity and should not be considered as alternatives to profit for the year, profit from operations or operating margin as determined in accordance with IFRS. Adjusted profit from operations and adjusted operating margin are not necessarily comparable to similarly titled measures used by other companies. As a result, you should not consider these performance measures in isolation from, or as a substitute analysis for, BAT’s results of operations as determined in accordance with IFRS.
The table below reconciles the Group’s profit from operations to adjusted profit from operations, and to adjusted profit from operations at constant rates based on a re-translation of adjusted profit from operations for each year, at the previous year’s exchange rates, and presents adjusted operating margin for the periods presented. Refer to note 2 in the Notes on the Accounts for further discussion of the segmental results and for the reconciliation of adjusted profit from operations at current and constant rates of exchange to segmental profit from operations and to Group profit for the years ended 31 December 2018, 2017 and 2016.
|
For the year ended 31 December (£m)
|
||||||||||||||||||||
|
2018
|
2017
|
2016
|
2015
|
2014
|
||||||||||||||||
| Profit from operations | 9,313 | 6,412 | 4,655 | 4,557 | 4,546 | |||||||||||||||
| Add: | ||||||||||||||||||||
| Restructuring and integration costs | 363 | 600 | 603 | 367 | 452 | |||||||||||||||
| Amortisation of trademarks and similar intangibles | 377 | 383 | 149 | 65 | 58 | |||||||||||||||
| Fair value movement in stock on acquisition | – | 465 | – | – | – | |||||||||||||||
| Fixed asset impairment (hyperinflation) | 110 | – | – | – | – | |||||||||||||||
| Fox River | – | – | 20 | – | (27 | ) | ||||||||||||||
| Flintkote | – | – | – | 3 | 374 | |||||||||||||||
| Other | 184 | 69 | 53 | – | – | |||||||||||||||
| Adjusted profit from operations | 10,347 | 7,929 | 5,480 | 4,992 | 5,403 | |||||||||||||||
| Operating margin | 38.0% | 32.8% | 32.9% | 36.4% | 34.0% | |||||||||||||||
| Adjusted operating margin* | 42.6% | 41.1% | 38.8% | 39.8% | 40.5% | |||||||||||||||
| Impact of translational foreign exchange | 577 | (324 | ) | (283 | ) | 628 | 672 | |||||||||||||
| 2018 adjusted profit from operations re-translated at 2017 exchange rates | 10,924 | |||||||||||||||||||
| 2017 adjusted profit from operations re-translated at 2016 exchange rates | 7,605 | |||||||||||||||||||
| 2016 adjusted profit from operations re-translated at 2015 exchange rates | 5,197 | |||||||||||||||||||
| 2015 adjusted profit from operations re-translated at 2014 exchange rates | 5,620 | |||||||||||||||||||
| 2014 adjusted profit from operations re-translated at 2013 exchange rates | 6,075 | |||||||||||||||||||
| Change in adjusted profit from operations at prior year’s exchange rates (constant rates) | +37.8% | +38.8% | +4.1% | +4.0% | +4.4% | |||||||||||||||
| * | Adjusted profit from operations as a percentage of adjusted revenue. |
| BAT Annual Report and Form 20-F 2018 | 261 | |
|
Additional disclosures
|
||||||||||||||
| Non-GAAP measures continued | ||||||||||||||
Adjusted share of post-tax results of associates and joint ventures
Definition – share of post-tax results of associates and joint ventures before the impact of adjusting items.
To supplement BAT’s performance presented in accordance with IFRS, the Group’s share of post-tax results of associates and joint ventures is also presented before adjusting items as defined in note 1 in the Notes on the Accounts. The Group’s Management Board believes that adjusted share of post-tax results of associates and joint ventures provides information that enables investors to better compare the Group’s business performance across periods. The Group’s Management Board uses adjusted share of post-tax results from associates and joint ventures as part of the total assessment of the underlying performance of all the Group’s business interests. Adjusted share of post-tax results of associates and joint ventures has limitations as an analytical tool. It is not a presentation made in accordance with IFRS, is not a measure of financial condition or liquidity and should not be considered as an alternative to the Group’s share of post-tax results of associates and joint ventures as determined in accordance with IFRS. Adjusted share of post-tax results of associates and joint ventures is not necessarily comparable to similarly titled measures used by other companies. As a result, you should not consider this performance measure in isolation from, or as a substitute analysis for, BAT’s results of operations as determined in accordance with IFRS.
The most directly comparable IFRS measure to adjusted share of post-tax results of associates and joint ventures is share of post-tax results of associates and joint ventures. A reconciliation is provided on page 142 within note 5 in the Notes on the Accounts.
Underlying tax rate
Definition – Tax rate incurred before the impact of adjusting items and to adjust for the inclusion of the Group’s share of post-tax results of associates and joint ventures within the Group’s pre-tax results.
BAT management monitors the Group’s underlying tax rate to assess the tax rate applicable to the Group’s underlying operations, excluding the Group’s share of post-tax results of associates and joint ventures in BAT’s pre-tax results and adjusting items as defined in note 1 in the Notes on the Accounts. Underlying tax rate is not a measure defined by IFRS. The most directly comparable IFRS measure to underlying tax rate is the effective tax rate based upon profit before tax. The Group’s Management Board believes that this additional measure is useful to investors, and is used by BAT management as described above, because it excludes the contribution from the Group’s associates, recognised after tax but within the Group’s pre-tax profits, and adjusting items, thereby enhancing users’ understanding of underlying business performance.
Underlying tax rate has limitations as an analytical tool. It is not a presentation made in accordance with IFRS and should not be considered as an alternative to the effective tax rate as determined in accordance with IFRS. Underlying tax rate is not necessarily comparable to similarly titled measures used by other companies. As a result, you should not consider this measure in isolation from, or as a substitute analysis for, the Group’s effective tax rate as determined in accordance with IFRS. The table below reconciles the Group’s effective tax rate as determined in accordance with IFRS with underlying tax rate for the periods presented.
|
For the year ended 31 December (%)
|
||||||||||||||||||||
|
2018 |
2017 |
2016 |
2015 |
2014 |
||||||||||||||||
| Profit before taxation | 8,351 | 29,527 | 6,245 | 5,855 | 4,848 | |||||||||||||||
|
Less: Share of post-tax results of associates and joint ventures |
(419 | ) | (24,209 | ) | (2,227 | ) | (1,236 | ) | (719 | ) | ||||||||||
|
Adjusting items within profit from operations |
1,034 | 1,517 | 825 | 435 | 857 | |||||||||||||||
|
Adjusting items within finance costs/(income) |
(4 | ) | 205 | 108 | (489 | ) | – | |||||||||||||
| Adjusted profit before taxation, excluding associates and joint ventures | 8,962 | 7,040 | 4,951 | 4,565 | 4,986 | |||||||||||||||
| Taxation on ordinary activities | (2,141 | ) | 8,129 | (1,406 | ) | (1,333 | ) | (1,455 | ) | |||||||||||
|
Adjusting items in taxation |
(24 | ) | (9,766 | ) | 61 | 22 | – | |||||||||||||
|
Taxation on adjusting items |
(199 | ) | (454 | ) | (128 | ) | (80 | ) | (69 | ) | ||||||||||
|
Adjusted taxation |
(2,364 | ) | (2,091 | ) | (1,473 | ) | (1,391 | ) | (1,524 | ) | ||||||||||
|
Underlying tax rate |
26.4% | 29.7% | 29.8% | 30.5% | 30.6% | |||||||||||||||
Adjusted diluted earnings per share
Definition – diluted earnings per share before the impact of adjusting items.
BAT management monitors adjusted diluted earnings per share, a measure which removes the impact of adjusting items, as defined in note 1 in the Notes on the Accounts, from diluted earnings per share. Adjusted diluted earnings per share is used by management within the Group’s incentive schemes, as reported within the remuneration report beginning on page 73 and reported in note 7 in the Notes on the Accounts. The Group’s Management Board believes that this additional measure is useful to investors, and is used by BAT management as described above, as an indicator of diluted earnings per share before adjusting items. Adjusted diluted earnings per share has limitations as an analytical tool and should not be used in isolation from, or as a substitute for, diluted earnings per share as determined in accordance with IFRS. The most directly comparable IFRS measure to adjusted diluted earnings per share is diluted earnings per share and a reconciliation is provided in note 7 in the Notes on the Accounts. The definition of adjusting items is provided in note 1 in the Notes on the Accounts.
| 262 | BAT Annual Report and Form 20-F 2018 | |
|
Strategic Report
|
Governance
|
Financial Statements
|
Other Information
|
Results on a constant translational currency basis
Movements in foreign exchange rates have impacted the Group’s financial results. The Group’s Management Board reviews certain of its results, including adjusted revenue, adjusted revenue growth from the strategic portfolio, adjusted profit from operations and adjusted diluted earnings per share, at constant rates of exchange. The Group calculates these financial measures at constant rates of exchange based on a re-translation, at prior year exchange rates, of the current year’s results of the Group and, where applicable, its geographic segments. The Group does not adjust for the normal transactional gains and losses in profit from operations that are generated by exchange movements. Although the Group does not believe that these measures are a substitute for IFRS measures, the Group’s Management Board does believe that such results excluding the impact of currency fluctuations year-on-year provide additional useful information to investors regarding the Group’s operating performance on a local currency basis. Accordingly, the constant rates of exchange financial measures appearing in the discussion of the Group results of operations (beginning on page 33) should be read in conjunction with the information provided in note 2 in the Notes on the Accounts.
In 2018, 2017 and 2016, results were affected by translational exchange rate movements. In 2018, at the prevailing exchange rates, adjusted revenue increased by 25.9%, adjusted revenue growth from the strategic portfolio increased by 48.6% and adjusted profit from operations increased by 30.5% versus 2017. At constant rates of exchange, adjusted revenue would have increased by 33.4%, adjusted revenue growth from the strategic portfolio would have increased by 56.1% and adjusted profit from operations would have increased by 37.8%. This lower growth rate at prevailing exchange rates reflects the negative translational impact as a result on the relative strengthening of the pound sterling. In 2017, at the prevailing exchange rates, adjusted revenue increased by 36.6% and adjusted profit from operations increased by 44.7% versus 2016. At constant rates of exchange, adjusted revenue would have increased by 31.7% and adjusted profit from operations would have increased by 38.8%. This higher growth rate at prevailing exchange rates reflects the translational benefit as a result of the relative weakness of the pound sterling.
In 2018, 2017 and 2016, adjusted diluted earnings per share was affected by translational exchange rate movements. In 2018, the adjusted diluted earnings per share of 296.7p, an increase of 5.2%, would, when translated at 2017 exchange rates, have been 315.5p, an increase of 11.8%. This lower growth rate, in 2018, at prevailing exchange rates, reflects the negative translational impact as a result of the relative strength of the pound sterling. In 2017, the adjusted diluted earnings per share of 282.1p, an increase of 14.0%, would, when translated at 2016 exchange rates, have been 269.9p, an increase of 9.1%. This higher growth rate, in 2017, at prevailing exchange rates, reflects the translational benefit as a result of the relative weakness of the pound sterling. In 2016, adjusted diluted earnings per share of 247.5p, an increase of 18.8%, would, when translated at 2015 exchange rates, have been 230.0p, an increase of 10.4%. This higher growth rate, in 2016, at prevailing exchange rates reflects the translational benefit as a result of the relative weakness of the pound sterling.
Operating cash flow conversion ratio
Definition – net cash generated from operating activities before the impact of adjusting items and dividends from associates and excluding trading loans to third parties, pension short fall funding, taxes paid and net capital expenditure, as a proportion of adjusted profit from operations.
| BAT Annual Report and Form 20-F 2018 | 263 | |
|
Additional disclosures
|
||||||||||||||
| Non-GAAP measures continued | ||||||||||||||
In 2017, as described on page 40, the Group brought foward the MSA payment (£1,397 million) which impacted operating cash conversion in that year.
Adjusted cash generated from operations (adjusted CGFO)
Definition – net cash generated from operating activities before the impact of adjusting items (including FII GLO) and trading loans provided to a third party, excluding dividends received from associates, and after dividends paid to non-controlling interests, net interest paid and net capital expenditure.
| 264 | BAT Annual Report and Form 20-F 2018 | |
|
Strategic Report
|
Governance
|
Financial Statements
|
Other Information
|
Net debt
Definition – total borrowings, including related derivatives, less cash and cash equivalents and current available-for-sale investments.
The Group uses net debt to assess its financial capacity. Net debt is not a measure defined by IFRS. The most directly comparable IFRS measure to net debt is total borrowings. The Group’s Management Board believes that this additional measure, which is used internally to assess the Group’s financial capacity, is useful to the users of the financial statements in helping them to see how business financing has changed over the year. Net debt has limitations as an analytical tool. It is not a presentation made in accordance with IFRS and should not be considered as an alternative to total borrowings or total liabilities determined in accordance with IFRS. Net debt is not necessarily comparable to similarly titled measures used by other companies. As a result, you should not consider this measure in isolation from, or as a substitute analysis for, the Group’s measures of financial position or liquidity as determined in accordance with IFRS. A reconciliation of borrowings to net debt is provided in note 20 in the Notes on the Accounts.
| BAT Annual Report and Form 20-F 2018 | 265 | |
|
Additional disclosures
|
||||||||||||||
| Non-GAAP measures continued | ||||||||||||||
Adjusted net debt to adjusted earnings before interest, tax, depreciation and amortisation (adjusted EBITDA)
Definition – net debt excluding the impact of the revaluation of RAI acquired debt arising as part of the purchase price allocation process adjusted net debt), as a proportion of profit for the year (earnings) before net finance costs/income, taxation on ordinary activities, depreciation, amortisation, impairment costs, the Group’s share of post-tax results of associates and joint ventures, and other adjusting items
To supplement BAT’s total borrowings as presented in accordance with IFRS, the Group’s Management Board, as the chief operating decision maker, reviews adjusted net debt to adjusted EBITDA to assess its level of net debt in comparison to the underlying earnings generated by the Group to evaluate the underlying business performance of the Group and its geographic segments. This is deemed by the Group’s Management Board to reflect the Group’s ability to service and repay borrowings.
For the purposes of this ratio, adjusted net debt is net debt, as discussed and reconciled on page 265, adjusted for the uplift arising on the RAI debt as part of the purchase price allocation, as such an uplift in value is not reflective of the repayment value of the debt.
Adjusted EBITDA is not a measure defined by IFRS. The most directly comparable IFRS measure to adjusted EBITDA is profit for the year. The Group’s Management Board believes that this additional measure, which is used internally to assess the Group’s financial capacity, is useful to the users of the financial statements in helping them to see how the Group’s financial capacity has changed over the year. Adjusted EBITDA has limitations as an analytical tool. It is not a presentation made in accordance with IFRS and should not be considered as an alternative to profit from operations as determined in accordance with IFRS.
Adjusted net debt to adjusted EBITDA is not necessarily comparable to similarly titled measures used by other companies. As a result, you should not consider this measure in isolation from, or as a substitute analysis for, the Group’s measures of financial position or liquidity as determined in accordance with IFRS. The table below reconciles both total borrowings to adjusted net debt and profit from operations to adjusted EBITDA for the periods presented.
|
As of the year ended 31 December (£m)
|
||||||||||||||||||||
|
2018
|
2017
|
2016
|
2015
|
2014
|
||||||||||||||||
| Total borrowings | 47,509 | 49,450 | 19,495 | 17,001 | 12,258 | |||||||||||||||
| Derivatives in respect of net debt: | ||||||||||||||||||||
| – assets | (647 | ) | (640 | ) | (809 | ) | (373 | ) | (362 | ) | ||||||||||
| – liabilities | 269 | 117 | 300 | 164 | 137 | |||||||||||||||
| Cash and cash equivalents | (2,602 | ) | (3,291 | ) | (2,204 | ) | (1,963 | ) | (1,818 | ) | ||||||||||
| Current available-for-sale investments | (178 | ) | (65 | ) | (15 | ) | (35 | ) | (50 | ) | ||||||||||
| Purchase price allocation adjustment to RAI debt | (944 | ) | (947 | ) | – | – | – | |||||||||||||
| Adjusted net debt | 43,407 | 44,624 | 16,767 | 14,794 | 10,165 | |||||||||||||||
| Profit for the year | 6,210 | 37,656 | 4,839 | 4,522 | 3,393 | |||||||||||||||
| Taxation on ordinary activities | 2,141 | (8,129 | ) | 1,406 | 1,333 | 1,455 | ||||||||||||||
| Net finance costs/(income) | 1,381 | 1,094 | 637 | (62 | ) | 417 | ||||||||||||||
| Depreciation, amortisation and impairment costs | 1,038 | 902 | 607 | 428 | 523 | |||||||||||||||
| Share of post-tax results of associates and joint ventures | (419 | ) | (24,209 | ) | (2,227 | ) | (1,236 | ) | (719 | ) | ||||||||||
| Other adjusting items (not related to depreciation, amortisation and impairment costs) | 499 | 1,049 | 612 | 344 | 730 | |||||||||||||||
| Adjusted EBITDA | 10,850 | 8,363 | 5,874 | 5,329 | 5,799 | |||||||||||||||
| Adjusted net debt to adjusted EBITDA | 4.0x | 5.3x | 2.9x | 2.8x | 1.8x | |||||||||||||||
| Impact of translational foreign exchange on adjusted net debt | (1,694 | ) | ||||||||||||||||||
| Adjusted net debt at constant rates of exchange | 41,713 | |||||||||||||||||||
| Impact of translational foreign exchange on adjusted EBITDA | 590 | |||||||||||||||||||
| Adjusted EBITDA at constant rates of exchange | 11,440 | |||||||||||||||||||
| Adjusted net debt to adjusted EBITDA at constant rates of exchange | 3.6x | |||||||||||||||||||
| 266 | BAT Annual Report and Form 20-F 2018 | |
|
Strategic Report
|
Governance
|
Financial Statements
|
Other Information
|
liquidity and capital resources
The Group’s cash inflows derive principally from its operating activities. They are supplemented when required by cash flows from financing activities, typically to support acquisitions. The principal sources of liquidity for the Group are cash flows generated from the operating business and proceeds from issuances of debt securities described below under ‘capital resources’.
The Board reviews and agrees the overall treasury policies and procedures, delegating appropriate oversight to the Finance Director and the treasury function. The treasury policies include a set of financing principles and key performance indicators. The Group’s treasury position is monitored by a Corporate Finance Committee chaired by the Finance Director. Treasury operations are subject to periodic independent reviews and audits, both internal and external.
In 2018, 2017 and 2016, all contractual borrowing covenants were met and none are expected to inhibit the Group’s operations or funding plans.
Capital expenditure
Gross capital expenditures include purchases of property, plant and equipment and purchases of certain intangibles. The Group’s gross capital expenditures for 2018, 2017 and 2016 were £883 million, £862 million and £652 million, respectively, representing investment in the Group’s global operational infrastructure (including, but not limited to, the manufacturing network, trade marketing and IT systems). The Group expects gross capital expenditures in 2019 of approximately £872 million, representing the ongoing investment in the Group’s operational infrastructure, including the continued investment into PRRPs. This is expected to be funded by the Group’s cash flows and existing facilities.
Hedging instruments
As discussed in note 23 in the Notes on the Accounts, the Group hedges its exposure to interest rate movements and currency movements. BAT’s cash flow hedges are principally in respect of sales or purchases of inventory and certain debt instruments. A certain number of forward foreign currency contracts were used to manage the currency profile of external borrowings. Interest rate swaps have been used to manage the interest rate profile of external borrowings, while cross-currency swaps have been used to manage the currency profile of external borrowings.
Capital resources
Policy
The Group utilises cash pooling and zero balancing bank account structures in addition to intercompany loans and borrowings to ensure that there is the maximum mobilisation of cash within the Group. The key objectives of treasury in respect of cash and cash equivalents are to protect the principal value of the Group’s cash and cash equivalents, to concentrate cash at the centre to minimise the required long-term debt issuance and to optimise the yield earned. The amount of debt the Group issues is determined by forecasting the net debt requirement after the mobilisation of cash.
Subsidiary companies are funded by share capital and retained earnings, loans from the central finance companies on commercial terms or through local borrowings by the subsidiaries in appropriate currencies. All contractual borrowing covenants have been met and none are expected to inhibit the Group’s operations or funding plans.
Borrowings
The following table sets out the Group’s long- and short-term borrowings as of the dates indicated:
|
As of 31 December (£m)1
|
||||||||||||||||||
|
Currency
|
Maturity dates
|
Interest rates at 31 December 2018
|
2018
|
2017
|
2016
|
|||||||||||||
| Eurobonds3 | Euro | 2019 to 2045 | 0.4% to 4.9% | 8,717 | 8,585 | 7,704 | ||||||||||||
| Euro | 2021 | 3m EURIBOR +50bps | 986 | 1,326 | 341 | |||||||||||||
| UK pound sterling | 2019 to 2055 | 1.8% to 7.3% | 4,671 | 4,680 | 4,241 | |||||||||||||
| US dollar | 2019 | 1.6% | 512 | 482 | 527 | |||||||||||||
| Swiss franc | 2021 to 2026 | 0.6% to 1.4% | 523 | 498 | 526 | |||||||||||||
| Bonds issued pursuant to Rules under the US Securities Act (as amended)3 |
US dollar | 2019 to 2047 | 2.3% to 8.1% | 25,428 | 25,545 | 4,472 | ||||||||||||
| US dollar | 2020 to 2022 | USD 3m LIBOR +59bps to 88bps | 1,381 | 1,665 | 405 | |||||||||||||
| Commercial Paper2,3 | 536 | 1,200 | 254 | |||||||||||||||
| Other loans | 3,859 | 4,466 | 110 | |||||||||||||||
| Bank loans | 608 | 512 | 336 | |||||||||||||||
| Bank overdrafts | 274 | 469 | 553 | |||||||||||||||
| Finance leases | 14 | 22 | 26 | |||||||||||||||
| Total | 47,509 | 49,450 | 19,495 | |||||||||||||||
Notes:
| 1. | The financial data above has been extracted from the Group’s consolidated financial statements. |
| 2. | The interest on the commercial paper referred to in the table above is based on US$ LIBOR plus a margin ranging between 22 and 65 basis points (2017: between 19 and 38 basis points, 2016: between 22 and 77 basis points) and EURIBOR plus a margin ranging between 8 and 15 basis point (2017: ranging between 10 and 24 basis points, 2016: ranging between 20 and 29 basis points) |
| 3. | The issuers of these debt securities are B.A.T. International Finance p.l.c., B.A.T Capital Corporation, Reynolds American Inc., or R.J. Reynolds Tobacco Company, as applicable. British American Tobacco p.l.c. is the ultimate guarantor in each case. |
| BAT Annual Report and Form 20-F 2018 | 267 | |
|
Additional disclosures
|
||||||||||||||
| Additional disclosures on liquidity and capital resources continued | ||||||||||||||
Off-balance sheet arrangements and contractual obligations
Except for operating leases, the Group has no significant off-balance sheet arrangements. The Group has contractual obligations to make future payments on debt agreements. In the normal course of business, the Group enters into contractual arrangements where the Group commits to future purchases of services from unaffiliated parties and related parties.
The Group’s undiscounted contractual obligations as of 31 December 2018 were as follows:
|
Payments due by period (£m)
|
||||||||||||||||||||
| Total
|
Less than
|
1–3 Years
|
3–5 Years
|
Thereafter
|
||||||||||||||||
|
Long-term notes and other borrowings, exclusive of interest1 |
47,025 | 3,747 | 10,214 | 9,674 | 23,390 | |||||||||||||||
| Interest payments related to long-term notes1 | 470 | 470 | – | – | – | |||||||||||||||
| Finance lease obligations | 14 | 8 | 5 | 1 | – | |||||||||||||||
| Operating lease obligations2 | 687 | 175 | 243 | 134 | 135 | |||||||||||||||
| Purchase obligations3 | 1,332 | 1,181 | 111 | 40 | – | |||||||||||||||
| Total cash obligations | 49,528 | 5,581 | 10,573 | 9,849 | 23,525 | |||||||||||||||
Notes:
| 1. | For more information about the Group’s long-term debt, see note 20 in the Notes on the Accounts. |
| 2. | Operating lease obligations represent estimated lease payments primarily related to vehicles, office space, warehouse space and equipment. See note 28 in the Notes on the Accounts. |
| 3. | Purchase obligations primarily include commitments to acquire tobacco leaf. Purchase orders for the purchase of other raw materials and other goods and services are not included in the table, as the Group’s operating subsidiaries are not able to determine the aggregate amount of such purchase orders that represent contractual obligations, as purchase orders typically represent authorisations to purchase rather than binding agreements. |
The table above does not include any amounts that the Group may pay to fund its retirement benefit plans as the timing and amount of any such future funding are unknown and dependent on, among other things, the future performance of defined benefit pension plan assets, interest rate assumptions and other factors. The net retirement benefit scheme liabilities totalled £518 million as of 31 December 2018, which is net of pension assets of £11,925 million. The Group expects to be required to contribute £168 million to its defined benefit plans during 2019. See note 12 in the Notes on the Accounts for further information.
US$ exchange rate
The following table sets forth the high and low noon buying rates of each month of the last six months, as certified for customs purposes by the Federal Reserve Bank of New York, for the pound sterling expressed in US dollars per pound sterling.
|
High
|
Low
|
|||||||
|
August 2018 |
1.3120 | 1.2685 | ||||||
| September 2018 | 1.3237 | 1.2833 | ||||||
| October 2018 | 1.3210 | 1.2731 | ||||||
| November 2018 | 1.3144 | 1.2729 | ||||||
| December 2018 | 1.2777 | 1.2524 | ||||||
| January 2019 | 1.3176 | 1.2598 | ||||||
The following table sets forth for each year the average of the noon buying rates on the last business day of each month of that year, as certified for customs purposes by the Federal Reserve Bank of New York, for the pound sterling expressed in US dollars per pound sterling for each of the five most recent fiscal years.
|
Average
|
||||
| Year ended 31 December 2014
|
1.6461 | |||
| Year ended 31 December 2015 | 1.5250 | |||
| Year ended 31 December 2016 | 1.3444 | |||
| Year ended 31 December 2017 | 1.3016 | |||
| Year ended 31 December 2018 | 1.3309 | |||
On 22 February 2019, the latest practicable date prior to this filing, the noon buying rate was £1.00 = US$1.3067.
The rates presented above may differ from the actual rates used in preparation of financial information appearing in this Annual Report and Form 20-F. The presentation of such rates is not meant to suggest that the US dollar amounts actually represent the pound sterling amounts or that such amounts could have been converted to US dollars at any particular rate.
| 268 | BAT Annual Report and Form 20-F 2018 | |
|
Strategic Report
|
Governance
|
Financial Statements
|
Other Information
|
As at 31 December 2018, the number of persons permanently employed by the Group was 63,877 worldwide. The Group believes that its labour relations are good.
Certain temporary employees are included in the below figures. The number of such temporary employees is approximately 2,900 and largely relates to seasonal workers within operations.
The following table sets forth the number of Group employees by region in 2018, 2017 and 2016.
|
As of 31 December
|
||||||||||||
| Region (number of employees worldwide) |
2018
|
2017
|
2016
|
|||||||||
| US1 | 5,019 | 5,201 | – | |||||||||
| APME | 15,077 | 14,730 | 17,213 | |||||||||
| AmSSA | 17,372 | 17,962 | 18,617 | |||||||||
| ENA2 | 26,409 | 24,377 | 21,232 | |||||||||
| Total employees | 63,877 | 62,270 | 57,062 | |||||||||
Notes:
| 1. | Total number of employees increased to 62,270 as of 31 December 2017 from 57,062 as of 31 December 2016 partly due to the addition of 5,201 employees following the acquisition of RAI. |
| 2. | Included within the employee numbers for ENA are certain employees in different locations in respect of central functions. Some of the costs of these employees are allocated or charged to the various regions and markets in the Group. |
| BAT Annual Report and Form 20-F 2018 | 269 | |
|
Additional disclosures
|
Business execution and supply chain risks
Risk: Competition from illicit trade.
Description
Illicit trade and tobacco trafficking in the form of counterfeit products, smuggled genuine products and locally manufactured products on which applicable taxes are evaded represent a significant and growing threat to the legitimate tobacco industry. Factors such as increasing levels of taxation, price increases, economic downturn, lack of law enforcement, appropriate penalties and weak border control are encouraging more adult tobacco consumers to switch to illegal cheaper tobacco products and providing greater rewards for counterfeiters and smugglers. Regulatory restrictions such as plain packaging or graphic health warnings, display bans, taste or ingredient restrictions and increased compliance costs further disadvantage legitimate industry participants by providing competitive advantages to illicit manufacturers and distributors of illicit tobacco products.
Impact
Illicit trade can have an adverse effect on the Group’s overall sales volume and may restrict the ability to increase selling prices. Illicit trade can also damage brand equity and reputation, which could undermine the Group’s investment in trade marketing and distribution. These factors in turn could reduce profits and have an adverse effect on the Group’s results of operations and financial conditions.
Risk: Geopolitical tensions that have the potential to disrupt the Group’s business in multiple markets.
Description
The Group’s operations and financial condition are influenced by the economic and political situations in the markets and regions in which it has operations, which are often unpredictable and outside of its control. Some markets in which the Group operates face the threat of civil unrest and can be subject to frequent changes in regime. In others, there is a risk of terrorism, conflict, war, organised crime or other criminal activity. The Group is also exposed to economic policy changes in jurisdictions in which it operates. In addition, some markets maintain trade barriers or adopt policies that favour domestic producers, preventing or restricting the Group’s sales.
Impact
Deterioration of socio-economic or political conditions could potentially lead to loss of life or loss of assets that limit or eliminate the Group’s access to particular markets or may disrupt the Group’s operations, such as its supply chain, or manufacturing or distribution capabilities. Such disruption may result in increased costs due to the need for more complex supply chain arrangements, to build new facilities or to maintain inefficient facilities, or in a reduction of the Group’s sales volume.
Risk: Disruption to the Group’s data and information technology systems, including by cyber-attack or the malicious manipulation or disclosure of confidential information.
Description
The Group increasingly relies on data and information technology systems for its internal communications, controls, reporting and relations with customers and suppliers. Some of these systems are managed by third-party service providers. A significant disruption of the Group’s systems, including those managed by third-party service providers, due to computer viruses, cyber threats, malicious intrusions or unintended or malicious behaviour by employees, contractors or services providers could affect the Group’s communications and operations. In addition, such disruption may compromise the integrity of information and result in the inappropriate disclosure of confidential information, or may lead to false or misleading statements being made about the Group.
Impact
Any disruption to technology systems related to the Group’s operations could adversely affect its business, results of operation, financial condition and reputation.
Security breaches and the loss of data or operational capacity may disrupt relationships throughout the supply chain, expose the Group to liability and lead to increased costs.
The disclosure of trade secrets or other commercially sensitive information may provide competitors with a competitive advantage resulting in competitive or operational damage to the Group. The disclosure of confidential information about the Group’s employees, customers, suppliers or other third parties could also expose the Group to liability.
Failure to effectively prevent or respond to a major breach or cyber-attack may also subject the Group to significant reputational damage.
| 270 | BAT Annual Report and Form 20-F 2018 | |
|
Strategic Report
|
Governance
|
Financial Statements
|
Other Information
|
Risk: Failure to meet current or future PRRPs demand due to supply chain failures.
Description
The PRRPs supply chain is a multi-tiered and complex environment with reliance on multiple factors, such as third-party suppliers’ ability to upscale production in order to meet demand while maintaining product quality, dependency on single suppliers at various points in the chain and the Group’s ability to build adequate consumables production capacity in line with product demand. Given the developing nature of the PRRPs portfolio, there is also an enhanced risk that some products may not meet product quality standards or may be subject to regulatory changes, leading to product recalls, which we have experienced in the past. In addition, the PRRPs supply chain may be vulnerable to changes in local legislation related to liquid nicotine that could increase import duties. Furthermore, the PRRPs supply chain includes the development of sensitive trade secrets jointly with external design partners, which carries the risk of exposure of innovations to competitors.
Impact
Vulnerabilities in the PRRPs supply chain may impact the Group’s ability to maintain supply and meet the current and future demand requirements across the PRRPs portfolio, potentially resulting in significant reputational harm and financial impact that may negatively affect the Group’s results of operations and financial condition. The design of PRRPs devices may also prevent the scaling of commercial manufacturing, which will either restrict supply or increase the costs of production.
In addition, changes in local legislation related to liquid nicotine import duties may increase PRRPs production costs, which may increase end market pricing. Furthermore, the exposure of sensitive trade secrets can lead to competitive disadvantages and further negatively impact the Group’s results of operations and financial condition.
Risk: Financial counterparty risks.
Description
The Group relies on transactions with a variety of financial counterparties to manage the Group’s business and financial risks. In the event that any of these counterparties fails, payments due from such counterparty, such as under hedging or insurance contracts, may not be recovered. In addition, failure of a transactional banking party may lead to the loss of cash balances and disruption to payment systems involving such counterparty.
Impact
The inability to recover payments due from one or more failed financial counterparties or the loss of cash balances may cause significant financial loss and have an adverse effect on the Group’s results of operations, financial condition and financial risk profile. In addition, the loss of cash balances or a disruption to payment systems may cause disruption to the Group’s ongoing operations and ability to pay its creditors and suppliers.
Risk: Exposure to unavailability of and price volatility in raw materials and increased costs of employment.
Description
The availability and price of various commodities required in the manufacture of the Group’s products fluctuate. Raw materials and other inputs used in the Group’s business, such as wood pulp and energy, are commodities that are subject to price volatility caused by numerous factors, including political influence, market fluctuations and natural disasters.
Similarly, the Group is exposed to the risk of an increase above inflation in employment costs, including due to governmental action to introduce or increase minimum wages. Employment and health care law changes may also increase the cost of provided health care and other employment benefits expenses.
Impact
Restricted availability and price volatility of commodities may result in supply shortages and unexpected increases in costs for raw materials and packaging for the Group’s products, which may affect the Group’s results of operations and financial condition.
Similarly, the Group’s profitability may be affected by increases in overall employment costs.
The Group may not be able to increase prices to offset increased costs without suffering reduced sales volume and revenue. In the absence of compensating for increased costs through pricing, significant increases in raw material, packaging and employment costs above inflation will impact product margins, leading to lower profits and negatively affecting the Group’s results of operations and financial condition.
| BAT Annual Report and Form 20-F 2018 | 271 | |
|
Additional disclosures
|
Group risk factors continued
Business Execution and Supply Chain Risks continued
Risk: Failure to retain key personnel or to attract and retain skilled talent.
Description
The Group relies on a number of highly experienced employees with detailed knowledge of the tobacco industry and the Group’s business. Similarly, the Group is dependent on its ability to identify, attract, develop and retain such qualified personnel in the future.
Furthermore, broader economic trends may impact the Group’s ability to retain key employees and may increase competition for highly talented employees, potentially resulting in the loss of experienced employees.
Impact
If the Group is unable to retain its existing key employees or to attract and retain skilled talent in the future, critical positions may be left vacant, which could adversely impact the delivery of strategic objectives, which could ultimately impact the Group’s results of operations and financial condition.
High voluntary employee turnover may also reduce organisational performance and productivity, which may have a further adverse impact on the Group’s results of operations and financial condition.
Risk: Disruption to the supply chain and distribution channels.
Description
The Group has an increasingly global approach to managing its supply chain and distribution channels and is exposed to the risk of disruption to any aspect of the Group’s supply chain, to suppliers’ operations or to distribution channels, and the deterioration in the financial condition of a trading partner.
Such disruption may be caused by a major fire, violent weather conditions or other natural disasters that affect manufacturing or other facilities of the Group’s operating subsidiaries or those of their suppliers and distributors. Although the Group seeks to maintain insurance coverage against damage resulting from natural disasters, in certain of the geographic areas where the Group operates such coverage may not be obtainable on commercially reasonable terms, if at all. Coverage may be subject to limitations or the Group may be unable to recover damages from its insurers.
Disruption may also be caused by a deterioration in labour or union relations, disputes or work stoppages or other labour-related developments within the Group or its suppliers and distributors.
In addition, the Group’s operating subsidiaries may not be able to establish or maintain relationships on favourable commercial terms with their suppliers and distributors. In some markets, distribution of the Group’s products is through third-party monopoly channels, often licensed by governments. The Group may be unable to renew these third-party supplier and distribution agreements on satisfactory terms for numerous reasons, including government regulations.
Furthermore, there are some product categories for which the Group does not have spare production capacity or where substitution between different production plants is very difficult. Consolidation of global suppliers and certain distributors that control large geographies may reduce the Group’s availability of alternatives and negatively impact the Group’s negotiating power with key suppliers and distributors.
These risks are particularly relevant in jurisdictions where the Group’s manufacturing facilities are more concentrated or for certain product categories where production is more centralised.
Impact
Any disruption to the Group’s supply chain and distribution channels could have an adverse effect on the results of operations and financial conditions of the Group through failures to meet shipment demand, contract disputes, increased costs and loss of market share.
| 272 | BAT Annual Report and Form 20-F 2018 | |
|
Strategic Report
|
Governance
|
Financial Statements
|
Other Information
|
Risk: Exposure to product contamination.
Description
The Group may experience product contamination, whether by accident or deliberate malicious intent, during supply chain or manufacturing processes, or may otherwise fail to comply with the Group’s quality standards.
Impact
Product contamination may expose the Group to significant costs associated with recalling products from the market or temporarily ceasing production. In addition, adult tobacco consumers may lose confidence in the specific brand affected by the contamination, resulting in reputational damage and a loss of sales volume and market share. In addition, the Group could be subject to liability and costs associated with civil and criminal actions as well as regulatory sanctions brought in connection with a contamination of the Group’s products. Each of these results may in turn have an adverse effect on the Group’s results of operations and financial condition.
Risk: Inability to obtain adequate supplies of tobacco leaf.
Description
The Group purchases significant volumes of packed leaf each year. Tobacco leaf supplies are impacted by a variety of factors, including weather conditions, drought, flood and other natural disasters, growing conditions, diseases causing crop failure, climate change and local planting decisions. Tobacco production in certain countries is also subject to a variety of controls, including regulation affecting farming and production control programmes, and to competition for land use from other agriculture products. Such controls and competition can further constrain the production of tobacco leaf, raising prices and reducing supply.
Impact
Restricted availability of tobacco leaf may impact the quality of the Group’s products to a level that may be perceptible by consumers and impact the Group’s ability to deliver on consumer needs. Accordingly, the reduction of tobacco leaf supply may impact supply and demand of the Group’s products and have a negative impact on results of operations. Higher tobacco leaf prices may also increase the Group’s costs for raw materials, which may have an adverse effect on its results of operations and financial condition.
Risk: Failure to successfully design, implement and sustain an integrated operating model.
Description
The Group aims to improve profitability and productivity through supply chain improvements and the implementation of an integrated operating model and organisational structure, including standardisation of processes and centralised back-office services.
Impact
Failure by the Group to successfully design, implement and sustain the integrated operating model and organisational structure could lead to the failure to realise anticipated benefits, increased costs, disruption to operations, decreased trading performance and reduced market share. These results could in turn reduce profitability and funds available for investment by the Group in long-term growth opportunities.
| BAT Annual Report and Form 20-F 2018 | 273 | |
|
Additional disclosures
|
Group risk factors continued
Legal, regulatory and compliance risks
Risk: Exposure to increasing tobacco control and regulation affecting the Group’s products, prices, sales and marketing.
Description
The advertising, sale and consumption of tobacco products have been, and continue to be, subject to increasingly stringent restrictions, introduced by both regulation, including tax increases, and voluntary agreements.
Most regulations or potential regulatory initiatives can be categorised as follows:
| – | Place: including regulations restricting smoking in private, public and work places (e.g., public place smoking and vaping bans); |
| – | Product: including regulations on the use of, or costly testing and measuring requirements for, ingredients, product design and attributes (e.g., ceilings regarding tar, nicotine and carbon monoxide yields, as well as restrictions on flavours, including menthol); product safety regulations, electrical safety regulations and reduced cigarette ignition propensity; |
| – | Packaging and labelling: including regulations on health warnings and other government-mandated messages (e.g., in respect of content, positioning, size and rotation); restrictions on the use of certain descriptors and brand names; product disclosure requirements (e.g., in relation to ingredients and emissions); requirements on pack shape, size, weight and colour and mandatory plain packaging; |
| – | Sponsorship, promotion and advertising: including partial or total bans on advertising, marketing, promotions and sponsorship and restrictions on brand sharing and using tobacco branding on non-tobacco products (so called “stretching”); |
| – | Purchase: including regulations on the manner in which products are sold, such as type of outlet (e.g., supermarkets and vending machines) and how they are sold (e.g., above the counter versus beneath the counter); and |
| – | Price: including regulations which have implications on the prices that manufacturers can charge for their tobacco products (e.g., excise taxes and minimum prices). |
The Group believes that further tobacco-control regulation is inevitable over the medium term in many of the Group’s markets, and is driven by tobacco control activities undertaken by national governments and non-governmental organisations, as well as guidelines and protocols derived from the World Health Organization’s Framework Convention on Tobacco Control (“FCTC”). The FCTC has led to increased efforts by tobacco control advocates and public health organisations to reduce the supply of, and demand for, tobacco products, particularly those containing menthol and other flavours, and to encourage governments to further regulate the tobacco industry. Many of the measures outlined in the FCTC have been or are being implemented by means of national legislation in many markets in which the Group operates. For example, the EU has adopted the revised Tobacco and Related Products Directive (“TPD2”), which, among other things, bans the use of characterising flavours, including menthol, in cigarettes from 2020, in line with numerous other jurisdictions banning or restricting the use of menthol in tobacco products. In March 2018, the FDA published its Advanced Notice of Proposed Rulemaking (“ANPRM”) entitled “Regulation of Flavors in Tobacco Products” to seek public comment on the role that flavours (including menthol) in tobacco products play in attracting youth. In November 2018, the FDA announced the acceleration of proposed rulemaking to seek a ban on menthol in combustible tobacco products, including cigarettes. Bans or restrictions on the use of flavoured tobacco products and menthol have also been introduced, and may be introduced in the future, at a municipal or state level in the US without undergoing federal rulemaking procedures.
Furthermore, various national or international regulatory regimes may seek to require the reduction of nicotine levels in tobacco products. In March 2018, the FDA published its ANPRM titled “Tobacco Product Standard for Nicotine Level of Combusted Cigarettes” and invited interested parties to submit comments on, among other issues, maximum nicotine limits and whether any maximum nicotine level should apply to combustible tobacco products.
Several countries, including France, Belgium and Pakistan, have sought or are seeking to prohibit certain brands and brand variants or prohibit messaging on cigarette packaging that promotes a brand or usage.
Please refer to pages 285 to 288 for details of tobacco and nicotine regulatory regimes under which the Group’s businesses operate.
Impact
Existing and future tobacco control and regulation could adversely affect volume and profits as a result of restrictions on the Group’s ability to sell its existing products or brands, including due to the loss of provisional sales approvals for newer existing products, such as PRRPs. Impediments to maintaining or building brand equity, could also adversely impact volume and profits. In addition, new regulation could lead to greater complexity and higher production and compliance costs. New product specifications may have a negative impact on sales volumes as consumers seek alternatives in illicit trade. All these effects may have an adverse effect on the Group’s results of operations and financial conditions. The Group’s share price has also experienced, and could in the future experience, shocks on the announcement or enactment of restrictive regulation.
In particular, through the acquisition of RAI, the Group acquired the Newport brand, the leading menthol cigarette brand in the US, the Group’s largest single market. The sales of Newport, together with the other menthol brands of the Group’s operating subsidiaries, represent a significant portion of the Group’s total net sales. Any action by the FDA or any other governmental authority banning or materially restricting the use of menthol in tobacco products could have a significant negative impact on sales volumes of the Newport brand and the Group’s other menthol products, which would in turn have an adverse effect on the results of operations and financial position of the Group. Similarly, regulations on nicotine levels in cigarettes and in other products that are being considered in a number of jurisdictions in which the Group operates could have a negative impact on sales volumes of the Group’s products in the relevant jurisdictions.
In addition, taking into account the significant number of regulations that may apply to the Group’s businesses across the world, the Group is and may in the future be subject to claims for breach of such regulations. Even when proven untrue, there are often financial costs and reputational impacts in defending against such claims.
| 274 | BAT Annual Report and Form 20-F 2018 | |
|
Strategic Report
|
Governance
|
Financial Statements
|
Other Information
|
Risk: Significant and/or unexpected increases or structural changes in tobacco-related taxes.
Description
Tobacco products are subject to high levels of taxation, including excise taxes, sales taxes, import duties and levies in most markets in which the Group operates. In many of these markets, taxes are generally increasing, but the rate of increase varies between markets and between different types of tobacco products. Increases in, or the introduction of new, tobacco-related taxes may be caused by a number of factors, including fiscal pressures, health policy objectives and increased lobbying pressure from anti-tobacco advocates.
Impact
Significant or unexpected increases in, or the introduction of new, tobacco-related taxes or minimum retail selling prices, changes in relative tax rates for different tobacco products or adjustments to excise may result in the need for the Group to absorb such tax increases due to limits in its ability to increase prices, an alteration in the sales mix in favour of value-for-money brands or products, or growth in illicit trade, each of which could impact pricing, sales volume and profit for the Group’s products.
Risk: Failure to comply with health and safety and environmental laws.
Description
The Group is subject to a variety of laws, regulations and operational standards relating to health and safety and the environment. The Group may fail to assess certain risks and implement the right level of control measures or to maintain adequate standards of health and safety or environmental compliance, which could cause injury, ill health, disability or loss of life to employees, contractors or members of the public, or harm to the natural environment and local communities in which the Group operates. Insufficient information, instruction and training in the relevant areas and a lack of knowledge of the existence and/or requirements of relevant regulations, or a failure to monitor, assess and implement the requirements of new or modified legislation, may increase these risks.
Impact
Any failure by the Group to comply with applicable health and safety or environmental laws, or the exposure to the consequences of a perceived failure, could result in business disruption, reputational damage, difficulties in recruiting and retaining staff, increased insurance costs, consequential losses, the obligation to install or upgrade costly pollution control equipment, loss of value of the Group’s assets, remedial costs and damages, fines and penalties as well as civil or criminal liability. Each of these results could in turn adversely impact the Group’s results of operations and financial condition.
Risk: Exposure to unfavourable tax rulings.
Description
The Group is subject to tax laws in a variety of jurisdictions. The Group‘s interpretation and application of the tax laws could differ from those of the relevant tax authority, which may subject the Group to claims for breach of such laws, including for late or incorrect filings or for misinterpretation of rules. Tax authorities in a variety of jurisdictions have assessed, and may in the future assess, the Group for historical tax claims, including interest and penalties, arising from disputed areas of tax law. The Group is currently party to tax disputes in a number of jurisdictions, some of which involve claims for amounts in the hundreds of millions of pounds sterling.
Please refer to note 28 in the Notes on the Accounts for details of contingent liabilities applicable to the Group.
Impact
The Group’s failure to comply with the relevant tax authority’s interpretation and application of the tax laws could result in significant financial and legal penalties, including the payment of additional taxes, fines and interest in the event of an unfavourable ruling by a tax authority in a disputed area, as well as the payment of dispute costs. Disruption to the business could occur as a result of management’s time being diverted away from business matters. Each of these results could negatively affect the Group’s results of operations and financial condition.
| BAT Annual Report and Form 20-F 2018 | 275 | |
|
Additional disclosures
|
Group risk factors continued
Legal, regulatory and compliance risks continued
Risk: Adverse implications of proposed EU legislation on single-use plastics that would restrict the use of tobacco filters and plastic components in the Group’s products.
Description
The EU is in the final stages of adopting a Directive on single-use plastics which, among other products, will target tobacco filters containing plastic.
Under the Directive, the Group may become subject to:
| – | Extended Producer Responsibility (EPR) schemes, requiring the Group to cover the costs of collecting, transporting, treating and clean-up of cigarette filters; |
| – | Obligations to finance consumer awareness campaigns; and |
| – | Products marking requirements. |
The Directive could affect the Group’s FMC, roll-your-own, Fine Cut and THP product categories.
It is expected that the final text of the Directive will be published by 30 June 2019. In addition, the EU Commission may issue guidelines for the EPR schemes prior to the anticipated implementation deadline on 5 January 2023 and adopt an Implementing Act stipulating the dimensions, position and content of required product markings in the first half of 2020. When implementing the Directive, member states may further expand its scope under their respective laws, which may subject the Group to additional regulation and financial obligations.
Impact
The financial implications of the proposed EPR schemes and financing obligations for consumer awareness programmes may have an adverse effect on the Group’s financial condition and results of operation. In addition, new product marking requirements may increase production costs and have an adverse effect on the Group’s results of operations and financial condition. If significant space is appropriated on the packaging of some of the Group’s products, this may also be an impediment to maintaining or building brand equity of the Group’s products, which may in turn have a negative impact on the Group’s sales volume.
Risk: Exposure to tobacco-related and other litigation.
Description
The Group is involved in litigation related to its tobacco products, including legal and regulatory actions, proceedings and claims, brought against it in a number of jurisdictions. Claims brought against the Group may be based on personal injury (both individual claims and class-actions), economic loss arising from the treatment of smoking and health-related diseases (such as medical recoupment claims brought by local governments), negligence, strict liability in tort, design defect, failure to warn, fraud, misrepresentation, deceptive and unfair trade practices, conspiracy, medical monitoring and violations of antitrust and racketeering laws. Certain actions, such as certain of those in the US and Canada, involve claims in the tens or hundreds of billions of pounds sterling.
The Group is also involved in proceedings that are not directly related to its tobacco products, including proceedings based on environmental pollution claims.
Additional legal and regulatory actions, proceedings and claims may be brought against the Group in the future.
Impact
The Group’s consolidated results of operations and financial position could be materially affected by any unfavourable outcome of certain pending or future litigation. The Group could be exposed to substantial liability, which may take the form of ongoing payments. Whether successful or not, the costs of the Group’s involvement in litigation could materially increase due to costs associated with bringing proceedings and defending claims, which may also cause operational and strategic disruption by diverting management time away from business matters. Liabilities and costs in connection with litigation could result in bankruptcy of one or more Group entities, which, in turn, could cause a material reduction in the Group’s sales volume and profits. Any negative publicity resulting from these claims may also adversely affect the Group’s reputation.
Please refer to note 28 in the Notes on the Accounts for details of contingent liabilities applicable to the Group.
Risk: Unexpected legislative changes to corporate income tax laws.
Description
The Group is subject to corporate income tax laws in the jurisdictions in which it operates. These laws frequently change on a prospective or retroactive basis.
Impact
Legislative changes to corporate income tax laws and regulations may have an adverse impact on the Group’s corporate income tax liabilities and may lead to a material increase of the Group’s overall tax rate. This could in turn negatively affect the Group’s results of operations and financial condition.
| 276 | BAT Annual Report and Form 20-F 2018 | |
|
Strategic Report
|
Governance
|
Financial Statements
|
Other Information
|
Risk: Exposure to potential liability under competition or antitrust laws.
Description
According to the Group’s internal estimates, the Group is a market leader by volume in a number of countries in which it operates and is one of a small number of tobacco companies in certain other markets in which it operates. As a result, the Group may fail to comply with competition or antitrust laws and may be subject to investigation for alleged abuse of its position in markets in which it has significant market share or for alleged collusion with other market participants.
Impact
Failure by the Group to comply with competition or antitrust laws and investigations for violation of such laws may result in significant legal liability, fines, penalties and/or damages actions, criminal sanctions against the Group, its officers and employees, increased costs, prohibitions on conduct of the Group’s business, forced divestment of brands and businesses (or parts of businesses) to competitors, director disqualifications and commercial agreements being held void. The Group may face increased public scrutiny and the investigation or imposition of sanctions by antitrust regulation agencies for violations of competition regimes which may subject the Group to reputational damage and loss of goodwill.
Risk: Failure to establish and maintain adequate controls and procedures to comply with applicable securities, corporate governance and compliance regulations.
Description
The Group’s operations are subject to a range of rules and regulations around the world. These include US securities, corporate governance and compliance laws and regulations such as the Sarbanes-Oxley Act of 2002 and the US Foreign Corrupt Practices Act of 1977, which applies to the Group’s worldwide activities. While the Group continuously seeks to improve its systems of internal controls and to remedy any weaknesses identified, there can be no assurance that the policies and procedures will be followed at all times or effectively detect and prevent violations of applicable laws. In addition, the Group is subject to increasingly stringent reporting obligations under the UK regulations and the UK’s Financial Reporting Council’s new reporting regime.
Impact
The increased scope and complexity of applicable regulations to which the Group is subject may lead to higher costs for compliance. Failure to comply with laws and regulations may result in significant legal liability, fines, penalties, and/or damages actions, criminal sanctions against the Group, its officers and employees, and damage to the Group’s reputation. Non-compliance with such regulations could also lead to a loss of the Group’s listing on one or more stock exchanges.
Risk: Loss of confidential information, including through manipulation of data by employees, and failure to comply with the European General Data Protection Regulation and other privacy laws.
Description
Unintended or malicious behaviour by employees, contractors, service providers and others using or managing the Group’s confidential information may affect the Group’s communications and operations and result in the disclosure of such information. The lack of infrastructure or application resilience, slow or insufficient disaster recovery service levels or the installation of new systems may increase the possibility that data, including confidential, personal or other sensitive information, stored or communicated by IT systems may be corrupted, lost or disclosed.
Various privacy laws, particularly the European General Data Protection Regulation (“GDPR”), forbid the disclosure of confidential information and, among other things, impose on the Group an obligation to notify the supervisory authority of a breach of confidential information. Fraudulent abuse of data and the inappropriate disclosure of confidential information may cause the Group to fail to meet statutory or regulatory requirements regarding data protection, such as the GDPR. The enforcement of regulations like the GDPR may also encourage compliance regimes and authorities in other jurisdictions in which the Group operates to enact similar regulations which would further increase these risks.
Impact
The loss of confidential information may result in civil or criminal legal liability and prosecution by enforcement bodies, which may subject the Group to the imposition of material fines and/or penalties and the costs associated with defending these claims. In addition, failure to comply with the GDPR or other privacy laws may result in the relevant regulator ordering the Group to cease processing activities, which would result in a significant operational disruption.
Inappropriate disclosure of confidential information or violation of the GDPR or other privacy laws may also result in significant reputational harm and public scrutiny, a loss of investor confidence and reduced third-party reliance on the Group’s information technology systems. In addition, restoration and remediation of disclosed confidential information may be costly, difficult or even impossible. These consequences may adversely impact the Group’s results of operations and financial condition.
| BAT Annual Report and Form 20-F 2018 | 277 | |
|
Additional disclosures
|
Group risk factors continued
Legal, regulatory and compliance risks continued
Risk: Failure to comply with product regulations due to uncertainty surrounding the proper interpretation and application of those regulations.
Description
The interpretation and application of regulations concerning the Group’s products, such as TPD2, may be subject to debate and uncertainty. This includes uncertainty over product classifications and restrictions on advertising. In particular with respect to the developing category of PRRPs, which has grown in size and complexity in a relatively short period of time, a consensus framework for the interpretation and application of existing regulation, such as the rules concerning nicotine-containing liquids used in vapour products, has yet to emerge.
The continuously changing and evolving landscape of regulation concerning the Group’s products contributes to the uncertainty surrounding interpretation and application and creates a risk that the Group may misinterpret or fail to comply with developing regulations in the various jurisdictions in which it operates, or becomes subject to enforcement actions from regulators. With the continuous changing of product cycle plans, expansion to new markets and innovations, there is a risk that such changes and launches fail to comply with the relevant regulations, including pre-approval and/or pre-registration requirements. For example, some governments have intentionally banned or are seeking to ban novel tobacco products and products containing nicotine, while others would need to amend their existing legislation to permit their sale. Even in countries where the sale of such products is currently permitted, some governments have adopted, or are seeking to adopt, bans on PRRPs or restrictions on certain flavours.
Impact
The significant number of emerging regulations and the uncertainty surrounding their interpretation and application may subject the Group to claims for breach of such regulations. Financial costs of such enforcement actions include financial penalties, product recalls and litigation costs, and entail a significant risk of adverse publicity and damage to the Group’s reputation and goodwill.
Risk: Failure to uphold high standards of corporate behaviour, including under anti-bribery and anti-corruption laws.
Description
The Group expects its employees to uphold a high standard of corporate behaviour and is subject to various anti-corruption laws and regulations (“Anti-Corruption Laws”) that generally prohibit its employees, suppliers, distributors and agents from engaging in certain activities to obtain or retain business or to influence a person working in an official capacity. The Group’s employees may fail to meet this standard or may violate applicable Anti-Corruption Laws.
For example, the Group is investigating, through external legal advisers, allegations of misconduct and is liaising with the UK Serious Fraud Office (“SFO”) and other relevant authorities. It was announced in August 2017 that the SFO had opened an investigation in relation to the Company, its subsidiaries and associated persons. The Group continues to cooperate with the SFO’s investigation and a sub-Committee of the Board has oversight of these matters. The outcomes will be decided by the relevant authorities or, if necessary, the courts. It is too early to predict the outcomes, but these could include the prosecution of individuals and/or of a Group company or companies. Accordingly, the potential for fines, penalties or other consequences cannot currently be assessed. As the investigation is ongoing, it is not yet possible to identify the timescale in which these matters might be resolved.
Impact
Failure of the Group to comply with Anti-Corruption Laws or to deploy and maintain robust internal processes and policies could result in significant fines and penalties, criminal sanctions against the Group and its officers and employees, increased costs, prohibitions or other limitations on the conduct of the Group’s business and reputational harm and may subject the Group to claims for breach of such regulations.
Even when proven untrue, there are often financial costs, time demands and reputational impacts associated with investigating and defending against such claims, in particular accusations disseminated broadly through social media.
| 278 | BAT Annual Report and Form 20-F 2018 | |
|
Strategic Report
|
Governance
|
Financial Statements
|
Other Information
|
Risk: Imposition of sanctions under sanctions regimes or similar international, regional or national measures.
Description
National and international sanctions regimes or similar international, regional or national measures may affect jurisdictions in which the Group operates or third parties with which it may have commercial relationships.
In particular, the Group has operations in a number of countries that are subject to various sanctions, including Iran, Sudan and Syria. Operations in these countries expose the Group to the risk of significant financial costs and disruption in operations that may be difficult or impossible to predict or avoid or the activities could become commercially and/or operationally unviable.
National and international sanctions regimes may also affect third parties with which the Group has commercial relationships and could lead to supply and payment chain disruptions.
Impact
As a result of the limitations imposed by sanctions, it may become commercially and/or operationally unviable for the Group to operate in certain jurisdictions and the Group may be required to exit existing operations in such jurisdictions. The Group may also experience difficulty in sourcing materials or importing products and be exposed to increased costs. In addition, the costs of complying with sanctions may increase as a result of changes to existing sanctions regimes.
Any failure to comply with sanctions regimes or similar international, regional or national measures may result in significant legal liability, fines and/or penalties, criminal sanctions against the Group, its officers and employees, damage to commercial relationships and reputational harm. Reputational harm may result regardless of whether the Group complies with imposed sanctions.
| BAT Annual Report and Form 20-F 2018 | 279 | |
|
Additional disclosures
|
Group risk factors continued
Economic and financial risks
Risk: Foreign exchange rate exposures.
Description
The Group’s reporting currency is the pound sterling. The Group is exposed to the risk of fluctuations in exchange rates affecting the translation of net assets and earned profits of overseas subsidiaries into the Group’s reporting currency. These translational exposures are not normally hedged.
Exposures also arise from the foreign currency denominated trading transactions undertaken by subsidiaries and dividend flows. Where not offset by opposing flows, these exposures are generally hedged according to internal policies, but hedging of exposure to certain currencies might not be possible due to exchange controls, limited currency availability or prohibitive costs, and errors in hedging may occur. Fiscal policy divergence in relation to interest rates between key markets may also increase these risks.
Impact
During periods of exchange rate volatility, the impact of exchange rates on the Group’s results of operations and financial condition can be significant. Fluctuations in exchange rates of key currencies against the pound sterling may result in volatility in the Group’s reported earnings per share, cash flow and balance sheet. Furthermore, the dividend paid by the Group may be impacted if the payout ratio is not adjusted. Differences in translation between earnings and net debt may also affect key ratios used by credit rating agencies, which may have an adverse effect on the Group’s credit ratings.
In addition, volatility and/or increased costs in the Group’s business due to transactional foreign exchange rate exposures may adversely affect operating margins and profitability and attempts to increase prices to offset such increases could adversely impact sales volumes.
Risk: Inability to obtain price increases and exposure to risks from excessive price increases and value chain erosion.
Description
Annual manufacturers’ price increases are among the key drivers in increasing market profitability. However, the Group has in the past been, and may in the future be, unable to obtain such price increases as a result of: increased regulation; increased competition from illicit trade; stretched consumer affordability arising from deteriorating political and economic conditions and rising prices; sharp increases or changes in excise structures; and competitors’ pricing.
As the PRRP market continues to develop, the Group may face erosion in the value chain for PRRPs through lower market prices, excise taxes, high retail trade margins or high production costs that make PRRPs less competitive versus combustible tobacco products.
In addition, the Group faces the risk that price increases it has conducted in the past, and may conduct in the future, may be excessive and not find adequate adult tobacco consumer acceptance.
Impact
If the Group is unable to obtain price increases or adversely affected by impacts of excessive price increases, it may be unable to achieve its strategic growth metrics, have fewer funds to invest in growth opportunities, and, in the case of excessive price increases, be faced with quicker reductions in sales volumes than anticipated due to accelerated market decline, down-trading (switching to a cheaper brand) and increased illicit trade. These in turn impact the Group’s market share, results of operations and financial condition.
In addition, erosion in the value chain for PRRPs could have a negative impact on the Group’s sales volume or pricing for these products. High excise could dampen demand for PRRPs or result in lower profit margins. Lower market prices, high retail trade margins or increases in production costs could also negatively impact profit margins or lead to uncompetitive pricing.
| 280 | BAT Annual Report and Form 20-F 2018 | |
|
Strategic Report
|
Governance
|
Financial Statements
|
Other Information
|
Risk: Effects of declining consumption of legitimate tobacco products and a tough competitive environment.
Description
Evidence of market contraction and the growth of illicit trade of tobacco products is apparent in several key global markets in which the Group operates. This decline is due to multiple factors, including increases in excise taxes leading to continued above-inflation price rises, changes in the regulatory environment, the continuing difficult economic environment in many countries impacting consumers’ disposable incomes, the increase in the trade of illicit tobacco products, health concerns, a decline in the social acceptability of smoking and an increase in PRRP uptake.
The Group competes on the basis of product quality, brand recognition, brand loyalty, taste, innovation, packaging, service, marketing, advertising and price. The Group is subject to highly competitive conditions in all aspects of its business. The competitive environment and the Group’s competitive position can be significantly influenced by the prevailing economic climate, consumers’ disposable income, regulation, competitors’ introduction of lower-price or innovative products, higher tobacco product taxes, higher absolute prices, governmental action to increase minimum wages, employment costs, interest rates and increase in raw material costs.
Furthermore, the Group is subject to substantial payment obligations under the State Settlement Agreements, which adversely affect the ability of the Group to compete in the US with manufacturers of deep-discount cigarettes that are not subject to such substantial obligations.
Impact
Any future decline in the demand for legitimate tobacco products could have an adverse effect on the Group’s results of operations and financial conditions.
In a tough competitive environment, factors such as market size reduction, customer down-trading, illicit trade and competitors aggressively taking market share through price re-positioning or price wars generally reduce the overall profit pool of the market and may impact the Group’s profits. These risks may also lead to a decline in sales volume of the Group, loss of market share, erosion of its portfolio mix and reduction of funds available to it for investment in growth opportunities.
Risk: Funding, liquidity and interest rate risks.
Description
The Group cannot be certain that it will have access to bank financing or to the debt and equity capital markets at all times and is therefore subject to funding and liquidity risks. In addition, the Group’s access to funding may be affected by restrictive covenants to which it is subject under some of its credit facilities.
The Group is also exposed to increases in interest rates in connection with both existing floating rate debt and future debt refinancings. The current economic environment, with historically low interest rates, increases the likelihood of higher interest rates in the future.
Furthermore, the Group operates in several markets closely regulated by governmental bodies that intervene in foreign exchange markets by imposing limitations on the ability to transfer local currency into foreign currency and introducing other currency controls that expose cash balances to devaluation risks or that increase costs to obtain hard currency. As a result, the Group’s operational entities in these markets may be restricted from using end market cash resources to pay for imported goods, dividend remittances, interest payments and royalties. The inability to access end market cash resources in certain markets contributes to the Group’s funding and liquidity risks.
Impact
Adverse developments in the Group’s funding, liquidity and interest rate environment may lead to shortages of cash and cash equivalents needed to operate the Group’s business and to refinance its existing debt. Inability to fund the business under the Group’s current capital structure, failure to access funding and foreign exchange or increases in interest rates may also have an adverse effect on the Group’s credit rating, which would in turn result in further increased funding costs and may require the Group to issue equity or seek new sources of capital. Non-compliance with the Group’s covenants under certain credit facilities could lead to an acceleration of its debt. All these factors may have material adverse effects on the Group’s results of operations and financial conditions. These conditions could also lead to underperforming bond prices and increased yields.
In the case of funding or liquidity constraints, the Group may also suffer reputational damage due to its perceived failure to manage the financial risk profile of its business, which may result in an erosion of shareholder value reflected in an underperforming share price, and/or underperforming bond prices and higher yields. In addition, the Group’s ability to finance strategic opportunities or respond to threats may be impacted by limited access to funds.
| BAT Annual Report and Form 20-F 2018 | 281 |
|
Additional disclosures
|
Group risk factors continued
Economic and Financial Risks continued
Risk: Failure to achieve growth through mergers, acquisitions and joint ventures.
Description
The Group’s growth strategy includes a combination of organic growth as well as mergers, acquisitions and joint ventures. The Group may be unable to acquire attractive businesses on favourable terms and may inappropriately value or otherwise fail to identify or capitalise on growth opportunities. The Group may not be able to deliver strategic objectives and revenue improvements from business combinations, successfully integrate businesses it acquires or establishes, or obtain appropriate regulatory approvals for business combinations. Risks from integration of businesses also include the risk that the integration may divert the Group’s focus and resources from its other strategic goals.
Additionally, the Group could be exposed to financial, legal or reputational risks if it fails to appropriately consider any compliance or antitrust aspects of a transaction. Further, the Group has certain uncapped indemnification obligations in connection with divestitures and could incur similar obligations in the future.
Impact
Any of the foregoing risks could result in increased costs, decreased revenues or a loss of opportunities and have an adverse effect on the Group’s results of operations and financial condition, and in the case of a breach of compliance or antitrust regulation, could lead to reputational damage, fines and potentially criminal sanctions.
The Group may become liable for claims arising in respect of conduct prior to any merger or acquisition of businesses if deemed to be a successor to the liabilities of the acquired company or indemnification claims relating to divestitures, and any resulting adverse judgment against the Group may adversely affect its results of operations and financial condition.
Please refer to note 28 in the Notes on the Accounts for details of contingent liabilities applicable to the Group.
Risk: Unforeseen underperformance in key global markets.
Description
A substantial majority of the Group’s profit from operations is based on its operations in certain key markets, including the US. A number of these markets, are declining for a variety of factors, including price increases, restrictions on advertising and promotions, smoking prevention campaigns, increased pressure from anti-tobacco groups, migration to smokeless products and private businesses adopting policies that prohibit or restrict, or are intended to discourage, smoking and tobacco use.
Economic and political factors affecting the Group’s key markets include the prevailing economic climate, governmental austerity measures, levels of employment, inflation, governmental action to increase minimum wages, employment costs, interest rates, raw material costs, consumer confidence and consumer pricing.
Impact
Any change to the economic and political factors in any of the key markets in which the Group operates could affect consumer behaviour and have an impact on the Group’s results of operations and financial condition.
| 282 | BAT Annual Report and Form 20-F 2018 | |
|
Strategic Report
|
Governance
|
Financial Statements
|
Other Information
|
Risk: Increases in net liabilities under the Group’s retirement benefit schemes.
Description
The Group currently maintains and contributes to defined benefit pension plans and other post-retirement benefit plans that cover various categories of employees and retirees worldwide. The Group’s obligations to make contributions under these arrangements may increase in the case of increases in pension liabilities, decreases in asset returns, salary increases, inflation, decreases in long-term interest rates, increases in life expectancies, changes in population trends and other actuarial assumptions.
Please refer to the information under the caption “Retirement benefit schemes” on page 155 and to note 12 in the Notes on the Accounts for details of the Group’s retirement benefit schemes.
Impact
Higher contributions to the Group’s retirement benefit schemes could have an adverse impact on the Group’s results of operations, financial condition and ability to raise funds.
Risk: Adverse consequences of the UK’s potential exit from the EU.
Description
The consequences of the UK’s potential exit from the EU are uncertain, but could include reductions in the size of the UK market, down-trading as a result of affordability pressure/weakening economy in the UK, an increased cost of doing business in the UK, higher cost of capital in the UK and both transactional and translational foreign exchange impacts, disruption to supply of materials due to changed customs procedures or duties, increased complexity and scrutiny on tax-related activities, or other changes to UK law. In addition, the UK’s exit from the EU may impose restrictions on employment and cross-border movements.
Impact
Any of the consequences of the UK’s exit from the EU may have a negative effect on the Group’s results of operations and financial conditions. In addition, any restrictions on employment and cross-border movements may result in additional employment and hiring costs and reduce the Group’s ability to attract and retain highly talented individuals from the EU in the UK.
| BAT Annual Report and Form 20-F 2018 | 283 |
|
Additional disclosures
|
Group risk factors continued
Product pipeline, commercialisation and IP risks
Risk: Inability to predict consumers’ changing behaviours and launch innovative products that offer adult tobacco consumers meaningful value-added differentiation.
Description
The Group focuses its research and development activities on both creating new products, including PRRPs, and maintaining and improving the quality of its existing products. In a competitive market, the Group believes that innovation is key to growth. The Group considers that one of its key challenges in the medium and long term is to provide adult tobacco consumers with high-quality products that take into account their changing preferences and expectations, while complying with evolving regulation.
The Group is in the early stages of development and roll-out of its PRRP portfolio, which requires significant initial investment. The Group may be unsuccessful in developing and launching innovative products or maintaining and improving the quality of existing products across both combustibles and PRRPs that offer consumers meaningful value-added differentiation. The Group may fail to keep pace with innovation in its sector or changes in consumer expectations. Competitors may be more successful in predicting changing consumer and developing and rolling out consumer relevant products than the Group and may be able to do so more quickly and at lower costs than the Group.
In addition, the Group devotes considerable resources to the research and development of innovative products, in particular certain PRRPs that may have the potential to reduce the risks of smoking-related diseases. The complex nature of research and development programmes necessary to satisfy emerging regulatory and scientific requirements creates a substantial risk that these programmes will fail to demonstrate health-related claims regarding PRRPs or to achieve adult tobacco consumer, regulatory and scientific acceptance.
Furthermore, the regulatory environment impacting non-combustible tobacco products, vapour products and other non-tobacco nicotine products, including classification of products for regulatory and excise purposes, is still developing and it cannot be predicted whether regulations will permit the marketing of such PRRPs in any given market in the future. Categorisation as medicines, for example, and restrictions on advertising could stifle innovation, increase complexity and costs and significantly undermine the commercial viability of these products. Alternatively, categorisation of any PRRPs as tobacco products for instance, could result in the application of onerous regulation, which could further stifle uptake.
Impact
The inability to timely develop and roll out innovations or products in line with consumer demand, including any failure to predict changes in adult tobacco consumer and societal behaviour and expectations and to fill gaps in the product portfolio, as well as the risk of poor product quality, could lead to missed opportunities, under- or over-supply, loss of competitive advantage, unrecoverable costs and/or the erosion of the Group’s consumer base or brand equity.
Restrictions on packaging and labelling or on promotion and advertising could impact the Group’s ability to communicate its innovations and product differences to adult tobacco consumers, leading to unsuccessful product launches. An inability to provide robust scientific results sufficient to substantiate health-related product claims poses a significant threat to the ability to launch innovative products and comply with emerging regulatory and legal regimes.
The occurrence of any of the above effects could in turn have an adverse effect on the Group’s results of operations and financial condition and cause the Group to fail to deliver on its strategic growth plans.
Risk: Exposure to risks associated with intellectual property rights, including the failure to identify, protect and prevent infringement of the Group’s intellectual property rights and potential infringement of, or the failure to retain licences to use, third-party intellectual property rights.
Description
The Group relies on trademarks, patents, registered designs, copyrights and trade secrets. The brand names under which the Group’s products are sold are key assets of its business. The protection and maintenance of the reputation of these brands is important to the Group’s success. Protection of intellectual property rights is also important in connection with the Group’s innovative products, including PRRPs.
The Group is exposed to the risk of infringements of its intellectual property rights by third parties due to limitations in judicial protection, failure to identify, protect and register its innovations and/or inadequate enforceability of these rights in some markets in which the Group operates.
Some brands and trademarks under which the Group’s products are sold are licensed for a fixed period of time in certain markets. If any of these licences is terminated or not renewed after the end of the applicable term, the Group would no longer have the right to use, and to sell products under, those brand(s) and trademark(s).
In addition, as third-party rights are not always identifiable, the Group may be subject to claims for infringement of third-party intellectual property rights.
Impact
Any erosion in the value of the Group’s brands, or failure to obtain or maintain adequate protection of intellectual property rights for any reason, or the loss of brands or trademarks under licence to Group companies, may have a material adverse effect on the Group’s market share, results of operations and financial condition. Any inability to appropriately protect the Group’s products and key innovations will also limit its growth and affect competitiveness and return on innovation investment.
Any infringement of third-party intellectual property rights could result in interim injunctions, product recalls, legal liability and the payment of damages, any of which may disrupt operations, negatively impact the Group’s reputation and have an adverse effect on its results of operations and financial condition.
| 284 | BAT Annual Report and Form 20-F 2018 | |
|
Strategic Report
|
Governance
|
Financial Statements
|
Other Information
|
Regulation of the Group’s business
Overview
The Group’s businesses operate under increasingly stringent regulatory regimes worldwide. The tobacco industry is one of the most highly-regulated in the world, with manufacturers required to comply with a variety of different regulatory regimes across the globe. The Group continues to respond to these regimes and engages with governments and other regulatory bodies to find solutions to changing regulatory landscapes. Restrictions on the manufacture, sale, marketing and packaging of tobacco products are in place in nearly all countries and markets.
Regulation can typically be categorised as follows:
– Place: including regulations restricting smoking in private, public and work places (e.g., public place smoking bans);
– Product: including: regulations on the use of ingredients, product design and attributes (e.g., ceilings regarding tar, nicotine and carbon monoxide yields, as well as restrictions on flavours); product safety regulations (e.g., General Product Safety Directive (2001/95/EC), electrical safety regulations and reduced cigarette ignition propensity standards); and regulatory product disclosure requirements (e.g., in relation to ingredients and emissions);
– Packaging and labelling: including regulations on health warnings and other government-mandated messages (e.g., in respect of content, positioning, size and rotation); restrictions on the use of certain descriptors and brand names; requirements on pack shape, size, weight and colour and mandatory plain packaging;
– Sponsorship, promotion and advertising: including partial or total bans on tobacco advertising, marketing, promotions and sponsorship and restrictions on brand sharing and stretching (the latter refers to the creation of an association between a tobacco product and a non-tobacco product by the use of tobacco branding on the non-tobacco product);
– Purchase: including regulations on the manner in which tobacco products are sold, such as type of outlet (e.g., supermarkets and vending machines) and how they are sold (e.g., above-the-counter versus beneath-the-counter); and
– Price: including regulations which have implications for the prices that manufacturers can charge for their tobacco products (e.g., excise taxes and minimum prices).
In addition, the Group operates a number of global policies, and in some cases its businesses have also entered into voluntary agreements, which may impose more onerous obligations or standards than those imposed by local legislation.
World Health Organization Framework Convention on Tobacco Control
Much of the recent development in regulation at a global level has been driven by the World Health Organization Framework Convention on Tobacco Control (FCTC). The FCTC came into force in 2005 and contains provisions aimed at, among other things, reducing tobacco consumption and toxicity. The original treaty is supplemented by protocols and guidelines. While these guidelines are not legally binding, they provide a framework of recommendations for parties to the guidelines.
To date, the FCTC has been ratified by 181 countries, not including the US. The FCTC has led to increased efforts by tobacco-control advocates and public health organisations to reduce the supply of and demand for tobacco products, and to encourage governments to further regulate the tobacco industry. As national regulations increasingly reflect global influences, the scope of areas regulated will likely further expand. The guidelines on advertising, promotion and sponsorship, for example, seek to broaden the definition of tobacco advertising to include product display, the use of vending machines as well as the design of the pack itself. Where adopted by contracting parties, a number of the measures referred to in the guidelines may result in either additional costs for the tobacco industry or restrictions on a manufacturer’s ability to differentiate its products and communicate those differences to adult smokers. For example, a change in the number and size of on-pack health warnings requires new printing cylinders to be commissioned, while the implementation of new plant protection product standards, product testing and the submission of ingredients information to national governments require extensive resources, time and material.
EU Tobacco and Related Products Directive (2014/40/EU)
Other developments in regulation have been driven by tobacco control activities undertaken outside the FCTC process. For example, the EU Tobacco Products Directive (2001/37/EC), referred to as TPD1, was adopted by the EU in May 2001 for transposition into EU member states’ laws by September 2002. TPD1 included provisions that set maximum tar, nicotine and carbon monoxide yields, introduced larger health warnings and banned descriptors such as ‘light’ and ‘mild’.
A revised TPD1, the EU Tobacco and Related Products Directive (2014/40/EU), referred to as the TPD2, was adopted in April 2014 for transposition into EU member states’ law by May 2016. Provisions of the TPD2 include: larger combined pictorial and textual health warnings covering 65% of the two main pack surfaces (front and back) for cigarettes; restrictions on pack shape and size, including minimum pack sizes of 20 sticks for cigarettes and 30g for roll-your-own and make-your-own tobacco; increased ingredients reporting; ‘tracking and tracing’ requirements; and for e-cigarettes: nicotine limits, pre-market notification, ingredients reporting and advertising bans. Among other things, the TPD2 bans the sale of cigarettes and roll-your-own tobacco with a characterising flavour. Menthol-flavoured cigarettes are exempt from the ban until May 2020. (See ‘The US’ for information pertaining to the regulation of menthol in that market.)
The TPD2 also purports to leave open to EU member states the possibility of further standardising the packaging of tobacco products and to apply its provisions in different ways. For example, it provides, among other things, that the labelling, packaging and the tobacco product itself shall not include any element or feature that suggests that a particular tobacco product has vitalising, energetic, healing, rejuvenating, natural or organic properties or has other health or lifestyle benefits. On 1 February 2017, the French government applied its laws transposing these provisions into French national law to prohibit the sale of all variants of Vogue cigarettes from February 2018, as well as the use of certain other tobacco brand and brand variant names. The law was subsequently annulled, but France may seek to reintroduce it. Belgium is considering adopting a similar approach.
| BAT Annual Report and Form 20-F 2018 | 285 | |
|
Additional disclosures
|
Regulation of the Group’s business continued
Single-use plastics
Following a series of negotiations between the EU institutions, a provisional agreement has been reached on the Single-Use Plastics Directive. Once the text is formally adopted, which is expected in the coming months, the Directive will require the tobacco industry to cover the costs of Consumer Awareness campaigns and Extended Producer Responsibility (EPR) schemes tackling the clean-up, collection, transport and treatment of tobacco filter waste. Member states will be required to ensure EPR schemes are in place by 5 January 2023. The industry will also be required to apply two environmental markings on the pack by the end of Q2 2021, the detail and content of which will be set out in secondary legislation by the European Commission.
Restrictions on smoking in private, public and work places
The Group operates in a number of markets which have in place restrictions on smoking in certain private, public and work places, including restaurants, bars and nightclubs. While these restrictions vary in scope and severity, extensive public and work place smoking bans have been enacted in markets including the US, Canada, the UK, Spain, New Zealand and Australia. Restrictions on smoking in private have also been adopted or proposed, and typically take the form of prohibitions on smoking in cars or residential homes when children are present, or smoking within a certain distance from specified public places (such as primary schools).
Regulation of ingredients, including flavoured tobacco products
A number of countries have restricted and others are seeking to restrict or ban the use of certain flavours or ingredients in cigarettes and other tobacco products, on the basis that such products are alleged to appeal disproportionally to minors, act as a catalyst for young people taking up smoking and/or increase the addictiveness or toxicity of the relevant product.
In Canada, the manufacture and sale of cigarettes, little cigars and blunt wraps with characterising flavours are banned. While the Canadian ingredient ban currently exempts menthol at the federal level, most Canadian provinces have adopted or are in the process of adopting menthol bans. The Canadian federal government has also recently published draft regulations that would prohibit menthol in cigarettes. In Australia, the majority of the states have banned flavours in cigarettes that give an ‘overtly’ fruit-flavoured taste and the government is currently considering further regulatory options. The TPD2 similarly bans the manufacture and sale of cigarettes and roll-your-own tobacco with a characterising flavour other than tobacco, subject to an exemption until May 2020 for menthol cigarettes.
An ingredients ban in Brazil, which would ban the use of certain ingredients with flavouring or aromatic properties, including menthol, is not currently in force due to ongoing legal challenges. In Turkey, a ban on the use of menthol in cigarettes will apply from 20 May 2020. A number of the above regulations are subject to ongoing legal challenges. (See ‘The US’ for information pertaining to the regulation of menthol in that market).
Further legislation on ingredients is to be expected. In particular, the EU Commission is required to prepare a report by no later than 20 May 2021 in respect of, among other things, the benefits of establishing a single list of permitted ingredients at the EU level by reference to available scientific evidence on the toxic and addictive effects of different ingredients. Similarly, the Conference of Parties to the FCTC has tasked a working group to further elaborate the partial guidelines on the regulation of the contents of tobacco products and tobacco product disclosures.
Plain and standardised packaging
Plain (or ‘standardised’) packaging generally refers to a ban on the use of trademarks, logos and colours on packaging other than the use of a single colour and the presentation of brand name and variant in a specified font and location(s). The presentation of individual cigarettes may be similarly restricted.
Plain packaging is particularly high on the agenda of tobacco control groups, and the FCTC guidelines recommend that contracting parties consider introducing plain packaging. To date, fifteen countries (including Australia, Canada, France, New Zealand, Saudi Arabia, Turkey, and the UK) have adopted plain packaging legislation, although in the majority of those countries the legislation has not yet been fully implemented. Countries, territories and states that are currently considering adopting plain packaging legislation include, but are not limited to, Belgium, Brazil, Chile, the Netherlands, Singapore and South Africa. Others, such as Hong Kong, are considering implementing large graphic health warnings.
Product display bans at point of sale and licensing regimes
Product display bans at point of sale and licensing regimes have been in place in a number of countries for several years and have been implemented both at national and state levels. Ireland was the first EU member state to introduce a point-of-sale display ban, which became effective in July 2009, with Norway, Iceland, Finland, New Zealand, Thailand, Canada, Australia, the UK and a number of other countries implementing or passing similar legislation banning tobacco displays. A number of countries, such as Hungary, have also sought to restrict the supply of tobacco products, including through the adoption of licensing regimes limiting the number of retail outlets from which it is possible to purchase tobacco products and/or by prohibiting the sale of tobacco products within a certain distance of specified public places.
Illicit trade
The illegal market for tobacco products is an increasingly important issue for governments and the industry across the world.
Euromonitor International estimates that approximately 456 billion cigarettes per year are smuggled, manufactured illegally or counterfeited. A number of governments, regulators and organisations have or are considering adopting regulation to support anti-illicit trade activities. Among other forms, such regulation may comprise mandatory ‘tracking and tracing’ requirements, enabling regulators to identify the point at which any seized product left the legal supply chain, security features to combat counterfeiting and inspection and authentication obligations in respect of seized product. The TPD2, for example, requires that all unit packets of tobacco are marked with a unique and irremovable identifier, which when scanned provides various information about that product’s route to market.
In November 2012, the FCTC adopted the Protocol to Eliminate Illicit Trade in Tobacco Products which includes a raft of supply chain control measures, including the implementation of ‘tracking and tracing’ technologies. The Protocol entered into force on 25 September 2018 and was considered at the first session of the Meeting of the Parties to the Protocol in October 2018. As at 1 January 2019, 48 parties have ratified the Protocol.
| 286 | BAT Annual Report and Form 20-F 2018 | |
|
Strategic Report
|
Governance
|
Financial Statements
|
Other Information
|
Vapour products
More recently, significant debate has been generated regarding the appropriate regulation of vapour products, including regulation of the nicotine liquids used in them. As the nascent vapour category has grown in size and complexity in a relatively short period of time, a consensus framework for regulation and taxation has yet to emerge. The TPD2, for example, establishes frameworks for the regulation of novel tobacco products and e-cigarettes, introducing nicotine limits, health warnings requirements, advertising bans and pre-market notification and post-market disclosure obligations. Conversely, some governments have intentionally banned or are seeking to ban novel tobacco products and products containing nicotine, while others would need to amend their existing legislation in order to permit their sale. For example, in Australia nicotine is classified as poison, meaning that the importation of vaping products or nicotine refill liquids is illegal in every state and territory, as is the possession and use of these products. Even in countries where the sale of vapour products is permitted, some governments have adopted, or are seeking to adopt, bans on vaping in public places.
The US
Through the RAI subsidiaries, the Group is subject to US federal, state and local laws and regulations. In 2009, President Obama signed into law the Family Smoking Prevention and Tobacco Control Act (FSPTCA), which grants the US Food & Drug Administration (FDA) broad authority over the manufacture, sale, marketing and packaging of tobacco products. Key elements of the FSPTCA include: filing of facility registrations, product listing, constituent testing and ingredient information; obtaining FDA clearance for all new products or product modifications; banning all characterising flavours other than tobacco or menthol in cigarettes; establishing ‘user fees’ to fund the FDA’s regulation of tobacco products; increasing the health warning size on cigarette packs with the option to introduce pictorial health warnings; implementing good manufacturing practices; revising the labelling and advertising requirements for smokeless tobacco products; and requiring the study of menthol. The US Congress did limit the FDA’s authority in two areas, prohibiting it from:
– banning categories of tobacco products; and
– requiring the reduction of nicotine yields of a tobacco product to zero.
On 10 May 2016, the FDA issued a final regulation, referred to as the Final Rule, deeming all products that meet the FSPTCA’s definition of ‘tobacco product’ to be subject to the FDA’s regulatory authority under the FSPTCA. The Final Rule became effective as of 8 August 2016, though each requirement of the Final Rule has its own compliance date. Such newly ‘deemed’ tobacco products subject to the FSPTCA include, among others, electronic nicotine delivery systems (including e-cigarettes, e-hookah, e-cigars, vape pens, advanced refillable personal vapourisers, electronic pipes and e-liquids mixed in vape shops), certain dissolvable tobacco products, cigars and pipe tobacco.
The ‘grandfather’ date under the Final Rule for newly deemed products remains the same as the ‘grandfather’ date for those tobacco products already subject to the FSPTCA – 15 February 2007. Any tobacco product that was not legally marketed as of 15 February 2007 will be considered a new tobacco product subject to pre-market review by the FDA. The FDA has recognised that few, if any, e-cigarettes were on the market as of 15 February 2007, but thousands of such products (including R.J. Reynolds Vapor’s Vuse Digital Vapor Cigarette) subsequently have entered into commerce. To address this issue, the FDA established a compliance policy regarding the pre-market review requirements for all newly deemed tobacco products that are not grandfathered products, but were on the market as of 8 August 2016. The FDA will allow such products to remain on the market so long as the manufacturer has filed the appropriate Premarket Tobacco Application (PMTA) by a specific deadline.
The Final Rule established staggered initial compliance periods based on the expected complexity of the applications to be submitted. On 28 July 2017, as part of the FDA’s announcement of a comprehensive regulatory plan for nicotine and tobacco, the FDA extended the deadline for submission of PMTAs for newly deemed products by several years. PMTAs for non-combustible products, such as e-cigarettes, must be submitted by 8 August 2022. R.J. Reynolds Vapor intends to file a PMTA with respect to Vuse. Based on the FDA’s draft guidance setting forth the type of evidence that must be included within a pre-market review application, R.J. Reynolds Vapor expects the costs of preparing a PMTA to be significant.
On 12 September 2018, FDA Commissioner Gottlieb put into question the timing that would be allowed for the filing of e-cigarette PMTAs as well as the future sale of flavoured closed system e-cigarette products. Specifically, the FDA announced the issuance of more than 1,100 warning letters to retailers found to have sold e-cigarette products to minors as part of a government surveillance operation. Additionally, the FDA issued letters to five manufacturers of closed system e-cigarette products, including RAI, giving the companies 60 days to offer written plans to mitigate youth usage. RAI filed its plan with FDA on 9 November 2018.
On 15 November 2018, FDA Commissioner Gottlieb announced the results of the 2018 National Youth Tobacco Survey that showed a significant increase in the rates of youth e-cigarette use. As a result of this data, the FDA stated that it would issue guidance limiting the sale of flavoured e-cigarette products (other than tobacco, mint or menthol) to age-restricted venues and, if sold online, subject such products to heightened age verification requirements. Moreover, the FDA announced an intention to issue Notices of Proposed Rule-Making to ban menthol in cigarettes and flavours in cigars.
Comprehensive plan for tobacco and nicotine regulation
On 28 July 2017, the FDA announced its intent to develop a comprehensive plan for tobacco and nicotine regulation that recognises the continuum of risk for nicotine delivery. As part of that plan, the FDA planned to publish an Advance Notice of Proposed Rulemaking (ANPRM) to seek public input regarding the potential health benefits and possible adverse effects of lowering the level of nicotine in combustible cigarettes. The ANPRM would request comments from interested stakeholders regarding the potential impact of a nicotine product standard on, among other things:
– the likelihood that existing users of tobacco products will stop using cigarettes;
– the likelihood that those who do not use tobacco products will start using such products; and
– the illicit trade of cigarettes containing nicotine at levels higher than a non-addictive nicotine threshold.
| BAT Annual Report and Form 20-F 2018 | 287 | |
|
Additional disclosures
|
Regulation of the Group’s business continued
In addition, the Center for Tobacco Products (CTP), which was established within the FDA in 2009, will coordinate with the FDA Center for Drug Evaluation and Research regarding medicinal nicotine and other therapeutic products as part of an agency-wide nicotine framework. As part of the comprehensive plan, the FDA also announced its intent to issue ANPRMs requesting public stakeholder input on the impact of flavours (including menthol) in increased initiation among youth and young adults as well as assisting adult smokers to switch to potentially less harmful forms of nicotine delivery, and the patterns of use and public health impact of premium cigars. This follows on from the FDA’s decision to issue its own preliminary scientific evaluation regarding menthol cigarettes in 2013, which concluded that menthol cigarettes adversely affect initiation, addiction and cessation compared to non-menthol cigarettes.
In 2018, the FDA took several steps to further this plan. Firstly, in January 2018, the FDA held a public hearing to obtain input from a broad group of stakeholders on ways to streamline the regulatory process for the issuance of therapeutic claims for nicotine products. Secondly, in March 2018, the agency issued three ANPRMs, seeking information on (1) the lowering of nicotine levels to non-addictive or minimally addictive levels, (2) the impact of flavours (including menthol) in increased initiation among youth and young adults as well as assisting adult smokers to switch to potentially less harmful forms of nicotine delivery, and (3) the patterns of use and public health impact of premium cigars.
Additional regulation
In addition to the ANPRMs on reduced nicotine products and flavours, the FDA has submitted to the Office of Management and Budget for review a proposed rule on the format and content of substantial equivalence applications. This follows on the FDA’s previous statements regarding developing foundational rules so as to provide clarity and predictability to the tobacco product submission process, including not only substantial equivalence applications but new product applications as well as MRTP applications.
Under the FSPTCA, for a manufacturer to launch a new tobacco product or modify an existing tobacco product after 22 March 2011, the manufacturer must obtain an order from the CTP allowing the new or modified product to be marketed. Similarly, a manufacturer that introduced a product between 15 February 2007 and 22 March 2011 was required to file a substantial equivalence report with the CTP demonstrating either (1) that the new or modified product had the same characteristics as a product commercially available as at 15 February 2007, referred to as a predicate product, or (2) if the new or modified product had different characteristics than the predicate product, that it did not raise different questions of public health. A product subject to such report is referred to as a provisional product. A manufacturer may continue to market a provisional product unless and until the CTP issues an order that the provisional product is not substantially equivalent (NSE), in which case the FDA could then require the manufacturer to remove the provisional product from the market. Substantially, all RAI subsidiaries’ products currently on the market are provisional products. At present, there is substantial uncertainty over the approaches that the FDA and CTP will take to determining RAI subsidiaries’ MRTP applications, PMTAs and substantial equivalence reports.
In January 2017, the FDA issued its first proposed product standard just prior to President Trump’s inauguration whereby the agency would require the reduction, over a three-year period, of the levels of N-nitrosonornicotine (‘NNN’) contained in smokeless tobacco products. Since issuing this proposal, the agency has simply stated that it is evaluating submitted comments. It is not known whether or when this proposed rule will be adopted, and, if adopted, whether the final rule will be the same as or similar to the proposed rule.
On 18 December 2017, the CTP accepted for review MRTP applications for six Camel Snus smokeless tobacco products. In 2018, the CTP began its review of these applications which included facility inspections and a meeting on 13-14 September 2018 before the Tobacco Product Scientific Advisory Committee for its review and recommendation. The FDA is completing its independent review of the applications with no announced deadline for the agency to complete its review.
Cigarettes and other tobacco products are subject to substantial taxes in the US. All states and the District of Columbia currently impose cigarette excise taxes. Certain city and county governments, such as New York, Philadelphia and Chicago, also impose substantial excise taxes on cigarettes sold in those jurisdictions. Also, all states and the District of Columbia currently subject smokeless tobacco products to excise taxes. Various states and the District of Columbia impose a tax on vapour products, such as e-cigarettes, and many other states have proposed taxes on vapour products. Currently, there is no federal tax on vapour products, such as e-cigarettes.
State and local governments also consider and implement other legislation and regulation regarding the sale of tobacco products. Measures include, among others, limiting or prohibiting the sale of flavours in tobacco products, restricting where tobacco products may be sold and increasing the minimum age to purchase tobacco products.
The Group believes that, as a responsible business, it can contribute through information, ideas and practical steps, to help regulators address the key issues regarding its products, including underage access, illicit trade, product information, product design, involuntary exposure to smoke and the development of potentially less harmful products, while maintaining a competitive market that accommodates the significant percentage of adults who choose to be tobacco consumers. The Group is committed to working with national governments and multilateral organisations and welcomes opportunities to participate in good faith to achieve sensible and balanced regulation of traditional tobacco and potentially reduced-risk products.
| 288 | BAT Annual Report and Form 20-F 2018 | |
|
Strategic Report
|
Governance
|
Financial Statements
|
Other Information
|
Disclosure pursuant to Section 219 of the Iran Threat Reduction and Syria Human Rights Act of 2012 (ITRA)
Section 219 of the Iran Threat Reduction and Syria Human Rights Act of 2012 added Section 13(r) to the Exchange Act. Section 13(r) requires an issuer to disclose in its annual or quarterly reports, as applicable, whether it or any of its affiliates knowingly engaged in certain activities, transactions or dealings relating to Iran or with designated natural persons or entities sanctioned under programmes relating to terrorism or the proliferation of weapons of mass destruction. Disclosure is required even where the activities, transactions or dealings are conducted outside the US by non-US affiliates in compliance with applicable law, and whether or not the activities are sanctionable under US law.
As of the date of this report, BAT is not aware of any activity, transaction or dealing by the Group or any of its affiliates during the financial year ended 31 December 2018 that is disclosable under Section 219 of the Iran Threat Reduction and Syria Human Rights Act of 2012 and Section 13(r) of the Exchange Act, except as set forth below. This information is to the best of BAT’s knowledge.
BAT has a local operation in Iran, established on 18 October 2003, through its wholly-owned non-US subsidiary, B.A.T. Pars Company (Private Joint Stock) (BAT Pars). BAT Pars produces its products, which include Kent, Pall Mall and Montana brands, in its own factory in Eshtehard, which is in the Alborz province of Iran. BAT Pars distributes its product via 81 sub-agents with national and provincial distribution licenses, who sell products to wholesalers and retailers with the support of BAT Pars’ sales representatives. BAT Pars has 315 direct employees and an additional 1,100 contract workers supplied by a private company.
Concerning the business of BAT Pars, various elements such as income tax, payroll, social security, other taxes, excise, monopoly fees, duties and other fees, including for utilities, licences and judicial fees to commence litigation, are payable to the Government of Iran and affiliated entities regarding BAT Pars’ operation. BAT Pars maintains bank accounts in Iran with various banks to facilitate its operations in the country and to make any required payments, as described above, to the Government of Iran and affiliated entities regarding its operations.
During the year ended 31 December 2018, BAT did not have any gross revenues or net profits derived from transactions with the Government of Iran or affiliated entities.
BAT believes, and maintains policies and procedures designed to ensure, that its activities in Iran and elsewhere comply in all material aspects with the applicable and relevant trade sanctions laws and regulations, including US and other international trade sanctions and/or embargoes. BAT’s sanctions policies and procedures have been designed to be as robust as possible. However, there can be no absolute assurance that these policies and procedures will be effective. While we believe the imposition of penalties or sanctions against BAT for its activities in Iran by the relevant authorities would be an unlikely event, the impact of such penalties or sanctions, if imposed, could be material. To the extent permitted under applicable law, BAT Pars’ activities in Iran are expected to continue.
Securities paying agent information
On 19 July 2018, each of R.J. Reynolds Tobacco Company (RJRT) and Reynolds American Inc. (RAI) entered into an Agreement of Resignation, Appointment and Acceptance whereby, among other things, Citibank, N.A. was appointed paying agent and security registrar with respect to each respective series of outstanding registered notes issued under each of RJRT’s indenture dated 23 June 2009 and RAI’s indenture dated 31 May 2006. The registered office of Citibank, N.A. in such capacities is:
Citibank, N.A
388 Greenwich Street
New York, NY 10013
| BAT Annual Report and Form 20-F 2018 | 289 | |
|
Additional disclosures
|
The Master Settlement Agreement & State Settlement Agreements
In 1998, the major US cigarette manufacturers (including R.J. Reynolds Tobacco Company, Lorillard and Brown & Williamson, businesses which are now part of Reynolds American) entered into the Master Settlement Agreement (MSA) with attorneys general representing most US states and territories. The MSA imposes a perpetual stream of future payment obligations on the major US cigarette manufacturers. The amounts of money that the participating manufacturers are required to annually contribute are based upon, among other things, the volume of cigarettes sold and market share (based on cigarette shipments in that year).
During 2012, R.J. Reynolds Tobacco Company, various other tobacco manufacturers, 17 states, the District of Columbia and Puerto Rico reached a final agreement related to Reynolds American’s 2003 MSA activities, and three more states joined the agreement in 2013. Under this agreement R.J. Reynolds Tobacco Company will receive credits, currently estimated to be more than US$1 billion, in respect of its Non-Participating Manufacturer (NPM) Adjustment claims related to the period from 2003 to 2012. These credits have been and will be applied against the company’s MSA payments over a period of five years from 2013, subject to, and dependent upon, meeting the various ongoing performance obligations. During 2014, two additional states agreed to settle NPM disputes related to claims for the period 2003 to 2012. It is estimated that R.J. Reynolds Tobacco Company will receive US$170 million in credits, which will be applied over a five-year period from 2014. During 2015, another state agreed to settle NPM disputes related to claims for the period 2004 to 2014. It is estimated that R.J. Reynolds Tobacco Company will receive US$285 million in credits, which will be applied over a four-year period from 2015. During 2016, no additional states agreed to settle NPM disputes. During 2017, two more states agreed to settle NPM disputes related to claims for the period 2004 to 2014. It is estimated that R.J. Reynolds Tobacco Company will receive US$61 million in credits, which will be applied over a five-year period from 2017. During 2018, nine more states agreed to settle NPM disputes related to claims for the period 2004 to 2019, with an option through 2022, subject to certain conditions. It is estimated that R.J. Reynolds Tobacco Company will receive US$182 million in credits for settled periods through 2017, which will be applied over a five-year period from 2018. Also in 2018, one additional state agreed to settle NPM disputes related to claims for the period 2004 to 2024, subject to certain conditions. It is estimated that R.J. Reynolds Tobacco Company will receive US$205 million in credits for settled periods through 2017, which will be applied over a five-year period from 2019. Credits in respect of future years’ payments and the NPM Adjustment claims would be accounted for in the applicable year and will not be treated as adjusting items. Only credits in respect of prior year payments are included as adjusting items.
The BAT Group is subject to substantial payment obligations under the MSA and the state settlement agreements with the states of Mississippi, Florida, Texas and Minnesota (such settlement agreements, collectively State Settlement Agreements). RAl’s operating subsidiaries’ expenses and payments under the MSA and the State Settlement Agreements for 2018 amounted to US$2,741 million in respect of settlement expenses and US$917 million in respect of settlement cash payments. RAl’s operating subsidiaries’ expenses and payments under the MSA and the State Settlement Agreements for 2017 amounted to US$2,856 million in respect of settlement expenses and US$4,612 million in respect of settlement cash payments.
Change of control provisions as at 31 December 2018
Significant agreements
|
Nature of agreement
|
Key provisions
| |
| The revolving credit facilities agreement effective 25 July 2017 and entered into between the Company, B.A.T. International Finance p.l.c., B.A.T. Netherlands Finance B.V., British American Tobacco Holdings (The Netherlands) B.V. and B.A.T Capital Corporation (as borrowers and, in the case of the Company, as a guarantor) and HSBC Bank plc (as agent) and certain financial institutions (as lenders), pursuant to which the lenders agreed to make available to the borrowers £6 billion for general corporate purposes (the Facility).
|
– should a borrower (other than the Company) cease to be a direct or indirect subsidiary of the Company, such borrower shall immediately repay any outstanding advances made to it; and
– where there is a change of control in respect of the Company, the lenders can require all amounts outstanding under the Facility to be repaid. | |
| Term loan facilities agreement dated 16 January 2017: B.A.T. International Finance p.l.c. and B.A.T Capital Corporation (as borrowers ), the Company, (as guarantor) and HSBC Bank plc (as agent) and certain financial institutions (as lenders) pursuant to which the lenders agreed to make available to the borrowers US$25 billion for the acquisition of RAI. Facilities A and B have been repaid and facilities C and D, totalling the sterling equivalent of US$5 billion, are still outstanding.
|
– should a borrower cease to be a direct or indirect subsidiary of the Company, such borrower shall immediately repay any outstanding advances made to it; and
– where there is a change of control in respect of the Company, the lenders can require all amounts outstanding under the term loan facilities to be repaid. | |
| Packaging Materials Agreement dated 8 April 2015, between Souza Cruz S.A. and Amcor Group GmbH for the production and supply of packaging for a value of R$1.5 billion.
|
– that either party may terminate the agreement in the event of any direct or indirect acquisition of at least 25% of the voting shares of the supplier and/or its affiliates by directly or indirectly a competitor of Souza Cruz S.A., importer or distributor.
|
| 290 | BAT Annual Report and Form 20-F 2018 | |
|
Strategic Report
|
Governance
|
Financial Statements
|
Other Information
|
|
Nature of agreement
|
Key provisions
| |
| On 25 July 2017, the Company acceded as a guarantor under the indenture of its indirect, wholly-owned subsidiary RAI. The securities issued under the indenture include approximately US$11 billion aggregate principal amount of unsecured RAI debt securities. |
– with respect to each series of debt securities issued under the indenture, upon a change of control event, combined with a credit ratings downgrade of the series to below investment-grade level (such downgrade occurring on any date from the date of the public notice of an arrangement that could result in a change of control event until the end of the 60-day period following public notice of the occurrence of a change of control event), RAI is obligated to make an offer to repurchase all debt securities from each holder of debt securities. As a guarantor under the indenture, the Company guarantees such payments.
| |
| LTIPs
|
||
|
The rules of the long-term incentive plans 2007 and 2016 (the LTIPs). |
– in the event of a change of control of the Company as a result of a takeover, reconstruction or winding-up of the Company (not being an internal reorganisation), LTIP awards will become exercisable for a limited period based on the period of time that has elapsed since the date of the award and the achievement of the performance conditions at that date, unless the Remuneration Committee determines this not to be appropriate in the circumstances; and
– the rules of the LTIPs allow (as an alternative to early release) that participants may, if permitted, exchange their LTIP awards for new awards of shares in the acquiring company on a comparable basis. | |
| BAT Annual Report and Form 20-F 2018 | 291 | |
|
Additional disclosures
|
The Group uses a combination of in-house and contract manufacturers to manufacture its products.
BAT-owned tobacco manufacturing facilities1
|
United States
|
APME
|
AmSSA
|
ENA
|
Total
|
||||||||||||||||
| Fully integrated manufacturing | 2 | 17 | 15 | 13 | 47 | |||||||||||||||
| Sites processing tobacco only | 1 | 7 | 9 | 2 | 19 | |||||||||||||||
| Site manufacturing other tobacco products only | 3 | – | – | 5 | 8 | |||||||||||||||
| R&D facilities | 1 | 1 | 3 | 2 | 7 | |||||||||||||||
| Total | 7 | 25 | 27 | 22 | 81 | |||||||||||||||
Note:
1. As of 31 December 2018.
The plants and properties owned or leased and operated by the Group’s subsidiaries are maintained in good condition and are believed to be suitable and adequate for the Group’s present needs.
The technology employed in the Group’s factories is sophisticated, especially in the area of cigarette making and packing where throughputs can reach between 500 and 1,000 packs per minute. The Group can produce many different pack formats (e.g., the number of cigarettes per packet) and configurations (e.g., bevel edge, round corner, international) to suit marketing and consumer requirements. New technology machines are sourced from the leading machinery suppliers to the industry. Close cooperation with these organisations helps the Group support its marketing strategy by driving its product innovations, which are brought to the market on a regular basis.
The Group utilises quality standards, processes and procedures covering the entire end-to-end value chain to help to ensure quality products are provided to its customers and adult tobacco consumers according to the Group’s requirements and end market regulatory requirements.
The Group has several improvement initiatives which it is currently managing. For example, the Group is continuing to realise the benefits of its Integrated Work System Programme launched in 2014, which is centrally led with an aim to improve the performance of the Group’s factories globally by focusing on manufacturing standards, continuous improvement, assessment and benchmarking and organisational development. The Group also utilises a survey process in the factories with an aim to improve factory productivity and reduce costs in the manufacturing environment. This process, known as ‘Bulls Eye’, has been in existence for a number of years and highlights productivity opportunities by benchmarking.
In 2018, the Group manufactured cigarettes in 47 cigarette factories in 44 countries. These plants and properties are owned or leased and operated by the Group’s subsidiaries. The Group’s factory outputs and establishments vary significantly in size and production capacity.
In 2018, the Group used third-party manufacturers to manufacture the components required, including the devices, related to PRRPs. The Group also used third-party manufacturers to supplement the Group’s own production facilities in the US and Poland to bottle the liquids used in the vapour products.
For more information on property, plant and equipment, see note 10 in the Notes on the Accounts.
| 292 | BAT Annual Report and Form 20-F 2018 | |
|
Strategic Report
|
Governance
|
Financial Statements
|
Other Information
|
US corporate governance practices
Principles
In the US, ADSs of the Company are listed on the New York Stock Exchange (NYSE). The significant differences between the Company’s corporate governance practices as a UK company and those required by NYSE listing standards for US companies are discussed below.
The Company has applied a robust set of board governance principles, which reflect the UK Corporate Governance Code 2016 and its principles-based approach to corporate governance. NYSE rules require US companies to adopt and disclose on their websites corporate governance guidelines. The Company complies with UK requirements, including a statement in this report of how the Company has applied the principles of the UK Corporate Governance Code 2016 and that the Company has complied with the best practice provisions of the UK Corporate Governance Code 2016. From 1 January 2019, the Company has applied the Principles of the UK Corporate Governance Code 2018 and will report on its application of those Principles in the Company’s Annual Report and Form 20-F for 2019.
Independence
The Company’s Board governance principles require that all Non-Executive Directors be determined by the Board to be independent in character and judgement and be free from any business or other relationships that could interfere materially with, or appear to affect, their judgement. The Board also has formal procedures for managing conflicts of interest. The Board has determined that, in its judgement, all of the Non-Executive Directors are independent. In doing so, the Board has taken into consideration the independence requirements outlined in the NYSE’s listing standards and considers these to be met by the Chairman and all of its Non-Executive Directors.
Committees
The Company has a number of Board Committees that are broadly comparable in purpose and composition to those required by NYSE rules for domestic US companies. For instance, the Company has a Nominations (rather than nominating/corporate governance) Committee and a Remuneration (rather than compensation) Committee. The Company also has an Audit Committee, which NYSE rules require for both US companies and foreign private issuers.
These Committees are composed solely of Non-Executive Directors and, in the case of the Nominations Committee, the Chairman whom the Board has determined to be independent, in the manner described above.
Each Board Committee has its own terms of reference, which prescribe the composition, main tasks and requirements of each of the Committees (see the Board Committee reports on pages 64, 71 and 106).
Under US securities law and the listing standards of the NYSE, the Company is required to have an audit committee that satisfies the requirements of Rule 10A-3 under the Exchange Act and Section 303A.06 of the NYSE Listed Company Manual. The Company’s Audit Committee complies with these requirements. The Company’s Audit Committee does not have direct responsibility for the appointment, reappointment or removal of the independent auditors. Instead, it follows the UK Companies Act 2006 by making recommendations to the Board on these matters for it to put forward for shareholder approval at the AGM.
One of the NYSE’s additional requirements for the audit committee states that at least one member of the audit committee is to have ‘accounting or related financial management expertise’. The Board has determined that Luc Jobin, Holly Keller Koeppel and Kieran Poynter possess such expertise and also possess the financial and audit committee experiences set forth in both the UK Corporate Governance Code 2016 and SEC rules (see the Audit Committee report on page 64). Mr Jobin, Ms Keller Koeppel and Mr Poynter have also each been designated as an Audit Committee financial expert as defined in Item 16.A. of Form 20-F.
In accordance with the requirements of applicable US federal securities laws and NYSE listing standards, the Board determined that Dr Marion Helmes’ service on audit committees external to the Company did not impair her ability to effectively serve on the Company’s Audit Committee.
Shareholder approval of equity compensation plans
The NYSE rules for US companies require that shareholders must be given the opportunity to vote on all equity-compensation plans and material revisions to those plans. The Company complies with UK requirements that are similar to the NYSE rules. The Board, however, does not explicitly take into consideration the NYSE’s detailed definition of what are considered ‘material revisions’.
Codes of business conduct and ethics
The NYSE rules require US companies to adopt and disclose a code of business conduct and ethics for all directors, officers and employees and promptly disclose any waivers of the code for directors or executive officers. The Group Standards of Business Conduct (SoBC) described on pages 30 to 31 apply to all staff in the Group, including senior management and the Board, and satisfy the NYSE requirements. All Group companies have adopted the SoBC (or localised versions). The SoBC also set out the Group’s whistleblowing policy, enabling staff, in confidence and anonymously, to raise concerns without fear of reprisal, including concerns regarding questionable accounting or auditing matters. The SoBC is available at www.bat.com/sobc.
The Company has also adopted a code of ethics for its Chief Executive, Finance Director, Group Financial Controller and Group Chief Accountant as required by the provisions of Section 406 of the Sarbanes-Oxley Act of 2002 and the rules issued by the SEC. There have been no waivers from the code of ethics relating to any officers. The Company considers that these codes and policies address the matters specified in the NYSE rules for US companies.
Independent director contact
Interested parties may communicate directly with the independent directors, individually or as a group, by sending written correspondence addressed to the independent director(s) to the attention of the Company Secretary at the following address: c/o Paul McCrory, Company Secretary, British American Tobacco p.l.c., Globe House, 4 Temple Place, London WC2R 2PG.
| BAT Annual Report and Form 20-F 2018 | 293 | |
|
Additional disclosures
|
Evaluation of disclosure controls and procedures
Disclosure controls and procedures
The Group maintains ‘disclosure controls and procedures’ (as such term is defined in Exchange Act Rule 13a-15(e)), that are designed to ensure that information required to be disclosed in reports the Group files or submits under the Exchange Act is recorded, processed, summarised and reported within the time periods specified in the SEC rules and forms, and that such information is accumulated and communicated to management, including the Chief Executive and Finance Director, as appropriate, to allow timely decisions regarding required disclosure.
In designing and evaluating our disclosure controls and procedures, our management, including the Chief Executive and Finance Director, recognise that any controls and procedures, no matter how well designed and operated, can provide only reasonable, not absolute, assurance that the objectives of the disclosure controls and procedures are met. Due to the inherent limitations in all control systems, no evaluation of controls can provide absolute assurance that all control issues and instances of fraud, if any, within the Group have been detected. The Group’s disclosure controls and procedures have been designed to meet, and management believes that they meet, reasonable assurance standards.
Management, with the participation of the Chief Executive and Finance Director, has evaluated the effectiveness of the Group disclosure controls and procedures pursuant to Exchange Act Rule 13a-15(b) as of the end of the period covered by this annual report. Based on that evaluation, the Chief Executive and Finance Director have concluded that the Group disclosure controls and procedures were effective at a reasonable assurance level.
Management’s report on internal control over financial reporting
Management, under the oversight of the Chief Executive and the Finance Director, is responsible for establishing and maintaining adequate internal control over financial reporting for the Group. The Group’s internal control over financial reporting consists of processes which are designed to: provide reasonable assurance regarding the reliability of financial reporting and the preparation of the Group’s financial statements for external reporting purposes in accordance with IFRS as adopted by the EU and IFRS as issued by the IASB; provide reasonable assurance that receipts and expenditure are made only in accordance with the authorisation of management; and provide reasonable assurance regarding the prevention or timely detection of any unauthorised acquisition, use or disposal of assets that could have a material effect on the consolidated financial statements.
As required by Section 404 of the Sarbanes-Oxley Act of 2002, management has assessed the effectiveness of the internal control over financial reporting (as defined in Rules 13(a)-13(f) and 15(d)-15(f) under the US Securities Exchange Act of 1934) based on the updated Internal Control-Integrated Framework issued by the Committee of Sponsoring Organisations of the Treadway Commission (COSO) (2013). Based on that assessment, management has determined that the Group’s internal control over financial reporting was effective as at 31 December 2018.
Any internal control framework, no matter how well designed, has inherent limitations, including the possibility of human error and the circumvention or overriding of controls and procedures and may not prevent or detect misstatements. Also, projections of any evaluation of effectiveness to future periods are subject to the risk that controls may become inadequate because of changes in conditions or because the degree of compliance with the policies or procedures may deteriorate.
KPMG LLP, an independent registered public accounting firm, who also audit the Group’s consolidated financial statements, has audited the effectiveness of the Group’s internal control over financial reporting as at 31 December 2018 and has issued an unqualified report thereon, which is included in this document.
Changes in internal control over financial reporting
During the period covered by this report, there were no changes in the Group’s internal control over financial reporting that have materially affected or are reasonably likely to materially affect the effectiveness of internal control over financial reporting.
Statements regarding competitive position
Statements referring to the competitive position of BAT and its subsidiaries are based on the Group’s belief and best estimates. In certain cases, such statements and figures rely on a range of sources, including investment analyst reports, independent market surveys, and the Group’s own internal assessments of market share.
| 294 | BAT Annual Report and Form 20-F 2018 | |
|
Strategic Report
|
Governance
|
Financial Statements
|
Other Information
|
This Other Information section of the British American Tobacco Annual Report and Form 20-F, which includes Additional disclosures and Shareholder information, forms part of, and includes certain disclosures which are required by law to be included in, the Directors’ Report.
Strategic Report disclosures
|
Section 414C(11) of the Companies Act 2006 allows the Board to include in the Strategic Report information that it considers to be of strategic importance that would otherwise need to be disclosed in the Directors’ Report. The Board has chosen to take advantage of this provision and accordingly, the information set out below, which would otherwise be required to be contained in the Directors’ Report, has been included in the Strategic Report. | ||
| Information required in the Directors’ Report |
Section in the Strategic Report | |
| Information on dividends |
Financial review | |
| Certain risk information about the use of financial instruments |
Financial review | |
| An indication of likely future developments in the business of the Group |
Delivering our strategy | |
| An indication of the activities of the Group in the field of research and development |
Our business model | |
| A statement describing the Group’s policy regarding the hiring, continuing employment and training, career development and promotion of disabled persons |
Delivering our strategy: Winning organisation | |
| Details of employee engagement: information, consultation, share scheme participation and the achievement of a common awareness of the financial and economic factors affecting the performance of the Group |
Delivering our strategy: Winning organisation | |
| Details of charitable donations |
Delivering our strategy: Sustainability | |
| Disclosures concerning greenhouse gas emissions |
Delivering our strategy: Sustainability | |
| Shareholder information disclosures | ||
| Information required in the Directors’ Report |
Section in Other Information | |
| Change of control provisions |
Material contracts | |
| Information on dividends |
Dividends | |
| Share capital – structure and voting rights; restrictions on transfers of shares |
Articles of Association | |
| Major shareholders |
Share capital and security ownership | |
| Directors – appointment and retirement |
Articles of Association | |
| Amendment of Articles of Association |
Articles of Association | |
| Directors – share buyback powers |
Purchases of shares | |
| Listing Rules (LRs) disclosures | ||
| For the purpose of LR 9.8.4C R the applicable information required to be disclosed by LR 9.8.4 R |
Section in Other Information | |
| Section (12) – shareholder waivers of dividends
|
Group Employee Trust
| |
| Section (13) – shareholder waivers of future dividends
|
Group Employee Trust
| |
Directors: interests and indemnities
| Contracts and letters of appointment |
– details of Directors’ contracts and letters of appointment, remuneration and emoluments, and their interests in the Company’s shares (including share options and deferred shares) as at 31 December 2018 are given in the Remuneration Report; and
– no Director had any material interest in a contract of significance (other than a service contract) with the Company or any subsidiary company during the year. | |
|
Insurance |
– appropriate cover provided in the event of legal action against the Company’s Directors. | |
| Indemnities |
– provision of indemnities to Directors in accordance with the Company’s Articles of Association and to the maximum extent permitted by law; and
– as at the date of this report, such indemnities are in force covering any costs, charges, expenses or liabilities that they may incur in or about the execution of their duties to the Company or to any entity which is an associated company (as defined in Section 256 of the Companies Act 2006), or as a result of duties performed by them on behalf of the Company or any such associated company.
| |
|
Directors’ Report approval and signature | ||
| The Directors’ Report comprises the information on pages 53 to 72 and pages 253 to 321. The Directors’ Report was approved by the Board of Directors on 27 February 2019 and signed on its behalf by Paul McCrory, Company Secretary. | ||
| BAT Annual Report and Form 20-F 2018 | 295 | |
|
Additional disclosures
|
This document contains certain forward-looking statements, including “forward-looking” statements made within the meaning of Section 21E of the United States Securities Exchange Act of 1934. These statements are often, but not always, made through the use of words or phrases such as “believe,” “anticipate,” “could,” “may,” “would,” “should,” “intend,” “plan,” “potential,” “predict,” “will,” “expect,” “estimate,” “project,” “positioned,” “strategy,” “outlook”, “target” and similar expressions. These include statements regarding our intentions, beliefs or current expectations concerning, amongst other things, our results of operations, financial condition, liquidity, prospects, growth, strategies and the economic and business circumstances occurring from time to time in the countries and markets in which the Group operates. In particular, among other statements: (i) certain statements in the Overview section (pages 1 to 7), including the Chairman’s introduction; (ii) certain statements in the Strategic management section (pages 12 to 32), including the Chief Executive’s review, Finance Director’s overview and Global market overview; (iii) certain statements in the Treasury and cash flow section (pages 39 to 42), including the treasury, liquidity and capital structure and going concern discussions; and (iv) certain statements in the Other Information section (pages 253 to 323), including the Additional disclosures and Shareholder information sections.
All such forward-looking statements involve estimates and assumptions that are subject to risks, uncertainties and other factors that could cause actual future financial condition, performance and results to differ materially from the plans, goals, expectations and results expressed in the forward-looking statements and other financial and/or statistical data within this document. Among the key factors that could cause actual results to differ materially from those projected in the forward-looking statements are uncertainties related to the following: the impact of competition from illicit trade; the impact of adverse domestic or international legislation and regulation; changes in domestic or international tax laws and rates; adverse litigation and dispute outcomes and the effect of such outcomes on the Group’s financial condition; changes or differences in domestic or international economic or political conditions; adverse decisions by domestic or international regulatory bodies; the impact of market size reduction and consumer down-trading; translational and transactional foreign exchange rate exposure; the impact of serious injury, illness or death in the work place; the ability to maintain credit ratings and to fund the business under the current capital structure; the inability to develop, commercialise and roll out Potentially Reduced-Risk Products; and changes in the market position, businesses, financial condition, results of operations or prospects of the Group. Further details on the principal risks that may affect the Group can be found in the ‘Principal Group risks’ section of the Strategic Report on pages 48 to 52 of this document. A summary of all the risk factors (including the principal risks) which are monitored by the Board through the Group’s risk register is set out in the Additional disclosures section under the heading ‘Group risk factors’ on pages 270 to 284.
It is believed that the expectations reflected in this document are reasonable but they may be affected by a wide range of variables that could cause actual results to differ materially from those currently anticipated. Past performance is no guide to future performance and persons needing advice should consult an independent financial adviser. The forward-looking statements reflect knowledge and information available at the date of preparation of this document and the Group undertakes no obligation to update or revise these forward-looking statements, whether as a result of new information, future events or otherwise. Readers are cautioned not to place undue reliance on such forward-looking statements.
No statement in this document is intended to be a profit forecast and no statement in this document should be interpreted to mean that earnings per share of BAT for the current or future financial years would necessarily match or exceed the historical published earnings per share of BAT.
| 296 | BAT Annual Report and Form 20-F 2018 | |
|
|
Strategic Report
|
Governance
|
Financial Statements
|
Other Information
|
Premium listing – London Stock Exchange (LSE)
The primary market for BAT’s ordinary shares is the LSE (Share Code: BATS; ISIN: GB0002875804). BAT’s ordinary shares have been listed on the LSE main market since 8 September 1998 and are a constituent element of the Financial Times Stock Exchange (FTSE) 100 Index.
Secondary listing – Johannesburg Stock Exchange (JSE Limited), South Africa
BAT’s ordinary shares have a secondary listing and are traded in South African rand on the Main Board of the JSE in South Africa (Abbreviated name: BATS; Trading code: BTI). BAT’s ordinary shares have been listed on the JSE since 28 October 2008 and are a constituent element of the JSE Top 40 Index.
American Depositary Shares (ADSs) – New York Stock Exchange (NYSE)
BAT ordinary shares trade in the form of BAT ADSs in the United States under the symbol BTI (CUSIP Number: 110448107). The BAT ADSs have been listed on the NYSE since 25 July 2017 as a Sponsored Level III ADS programme for which Citibank, N.A. is the depositary (the Depositary) and transfer agent. Each ADS represents one ordinary share. ADSs are evidenced by American depositary receipts (ADRs).
Share prices
The high and low prices at which the Company’s ordinary shares and ADSs are recorded as having traded during the year on each of the LSE, JSE and NYSE are as follows:
| High | Low | |||||||
| LSE | £51.00 | £24.63 | ||||||
| JSE | R855.00 | R453.00 | ||||||
| NYSE | US$71.36 | US$31.33 | ||||||
| BAT Annual Report and Form 20-F 2018 | 297 | |
|
|
Policy
The Group’s policy is to pay dividends of 65% of long-term sustainable earnings, calculated with reference to adjusted diluted earnings per share, as defined on page 262, and reconciled from earnings per share in note 7 in the Notes on the Accounts. Please see page 38 of this Annual Report and Form 20-F 2018 for further discussion on the Group’s dividend.
Currencies and exchange rates
Details of foreign exchange rates are set out in the Financial Review section of the Strategic Report on page 42 of this Annual Report and Form 20-F 2018. There are currently no UK foreign exchange controls or restrictions on remittance of dividends on the ordinary shares or on the conduct of the Company’s operations, other than restrictions applicable to certain countries and persons subject to EU economic sanctions or those sanctions adopted by the UK Government which implement resolutions of the Security Council of the United Nations.
American Depositary Shares – Dividends
The following table shows the dividends paid by British American Tobacco p.l.c. in the years ended 31 December 2014 to 31 December 2018 inclusive.
| Announcement Year |
Payment | Dividend period | Dividend per BAT ordinary share GBP |
Dividend per BAT ADS1 ADS ratio 2:1 USD2 | ||||
| 2014 | May | Final 2013 | 0.974 | 3.2997170 | ||||
| September/October | Interim 2014 | 0.475 | 1.5403300 | |||||
| Total
|
1.449
|
4.8400470
| ||||||
| 2015 | May | Final 2014 | 1.006 | 3.0616600 | ||||
| September/October | Interim 2015 | 0.494 | 1.4928680 | |||||
| Total
|
1.500
|
4.5545280
| ||||||
| 2016 | May | Final 2015 | 1.046 | 3.0292160 | ||||
| September/October | Interim 2016 | 0.513 | 1.3324660 | |||||
| Total
|
1.559
|
4.3616820
| ||||||
| Year | Payment | Dividend Period | Dividend Per BAT Ordinary Share GBP |
Dividend Per BAT ADS1 ADS ratio 1:1 USD2 | ||||
| 2017 | May | Final 2016 | 1.181 | 1.5239380 | ||||
| September/October | Interim 2017 | 0.565 | 0.7585690 | |||||
| February 2018 | Second Interim 2017 | 0.436 | 0.6068680 | |||||
| Total
|
2.182
|
2.8893750
| ||||||
| 2018 | May | Quarterly Interim 2018 | 0.488 | 0.6611420 | ||||
| August | Quarterly Interim 2018 | 0.488 | 0.6281530 | |||||
| November | Quarterly Interim 2018 | 0.488 | 0.6217120 | |||||
| February 2019 | Quarterly Interim 2018 | 0.488 | 0.6324960 | |||||
| Total | 1.952 | 2.5435030 | ||||||
Notes:
| 1. | ADS ratio change: prior to 14 February 2017, each BAT ADS represented two BAT ordinary shares; from 14 February 2017, each BAT ADS represents one BAT ordinary share. |
| 2. | Holders of BAT ADSs: dividends are receivable in US dollars based on the £ sterling/US dollar exchange rate on the applicable ADS payment date, being three business days after the payment date for the BAT ordinary shares. |
| 298 | BAT Annual Report and Form 20-F 2018 | |
|
Strategic Report
|
Governance
|
Financial Statements
|
Other Information
|
Quarterly Dividends for the year ended 31 December 2018
On 26 April 2017, the Group announced its move to quarterly dividends with effect from 1 January 2018.
The Board has declared an interim dividend of 203.0p per ordinary share of 25p which is payable in four equal quarterly instalments of 50.75p per ordinary share in May 2019, August 2019, November 2019 and February 2020. This represents an increase of 4.0% on 2017 (2017: 195.2p per share), and a payout ratio, on 2018 adjusted diluted earnings per share, of 68.4%.
The quarterly dividends will be paid to shareholders registered on either the UK main register or the South Africa branch register and to ADS holders, each on the applicable record dates set out under the heading ‘Key dates’ below.
Holders of American Depositary Shares (ADSs)
For holders of ADSs listed on the NYSE, the record dates and payment dates are set out below. The equivalent quarterly dividends receivable by holders of ADSs in US dollars will be calculated based on the exchange rate on the applicable payment date.
South Africa branch register
In accordance with the JSE Listing Requirements, the finalisation information relating to shareholders registered on the South Africa branch register (comprising the amount of the dividend in South African rand, the exchange rate and the associated conversion date) will be published on the dates stated below, together with South Africa dividends tax information.
The quarterly dividends are regarded as ‘foreign dividends’ for the purposes of the South Africa Dividends Tax. For the purposes of South Africa Dividends Tax reporting, the source of income for the payment of the quarterly dividends is the United Kingdom.
|
Key dates In compliance with the requirements of the LSE, the NYSE and Strate, the electronic settlement and custody system used by the JSE, the following are the salient dates for the quarterly dividend payments. All dates are 2019 unless otherwise stated.
| ||||||||
|
Event |
Payment No. 1 |
Payment No. 2 |
Payment No. 3 |
Payment No. 4 | ||||
| Preliminary announcement (includes declaration data required for JSE purposes)
|
28 February 2019 | |||||||
| Publication of finalisation information (JSE)
|
11 March | 18 June | 23 September | 12 December | ||||
| No removal requests (in either direction) permitted between the UK main register and the South Africa branch register
|
11 March– 22 March (inclusive) |
18 June– 28 June (inclusive) |
23 September– 4 October (inclusive) |
12 December– 27 December (inclusive) | ||||
| Last day to trade (LDT) cum-dividend (JSE)
|
18 March | 25 June | 1 October | 20 December | ||||
| Shares commence trading ex-dividend (JSE)
|
19 March | 26 June | 2 October | 23 December | ||||
| No transfers permitted between the UK main register and the South Africa branch register
|
19 March– 22 March (inclusive) |
26 June– 28 June (inclusive) |
2 October– 4 October (inclusive) |
23 December– 27 December (inclusive) | ||||
| No shares to be dematerialised or rematerialised on the South Africa branch register
|
19 March– 22 March (inclusive) |
26 June– 28 June (inclusive) |
2 October– 4 October (inclusive) |
23 December– 27 December (inclusive) | ||||
| Shares commence trading ex-dividend (LSE)
|
21 March | 27 June | 3 October | 24 December | ||||
| Shares commence trading ex-dividend (NYSE)
|
21 March | 27 June | 3 October | 26 December | ||||
| Record date (LSE, JSE and NYSE)
|
22 March | 28 June | 4 October | 27 December | ||||
| Last date for receipt of Dividend Reinvestment Plan (DRIP) elections (LSE)
|
12 April | 18 July | 24 October | 16 January 2020 | ||||
| Payment date (LSE and JSE)
|
8 May | 8 August | 14 November | 6 February 2020 | ||||
| ADS payment date (NYSE)
|
13 May | 13 August | 19 November | 11 February 2020 | ||||
Note:
Further details of the total amounts of dividends paid in 2018 (with 2017 comparatives) are given in note 8 in the Notes on the Accounts.
| BAT Annual Report and Form 20-F 2018 | 299 | |
|
Shareholder information
|
Shareholder taxation information
The following discussion summarises material US federal income tax consequences and UK taxation consequences to US holders of owning and disposing of ordinary shares or ADSs. This discussion does not address any tax consequences arising under the laws of any state, local or foreign jurisdiction or under any US federal laws other than those pertaining to income tax. This discussion is based upon the US Internal Revenue Code of 1986 (the US Tax Code), the Treasury regulations promulgated under the US Tax Code and court and administrative rulings and decisions, all as in effect on the date hereof. These laws may change, possibly retroactively, and any change could affect the accuracy of the statements and conclusions set forth in this discussion.
This discussion addresses only those US holders of ordinary shares or ADSs who hold such equity interests as capital assets within the meaning of Section 1221 of the US Tax Code. Further, this discussion does not address all aspects of US federal income taxation that may be relevant to US holders in light of their particular circumstances or that may be applicable to them if they are subject to special treatment under the US federal income tax laws, including, without limitation:
The determination of the actual tax consequences to a US holder will depend on the US holder’s specific situation. US holders of ordinary shares or ADSs should consult their own tax advisers as to the tax consequences of owning and disposing of ordinary shares or ADSs, in each case, including the applicability and effect of the alternative minimum tax and any state, local, foreign or other tax laws and of changes in those laws.
For purposes of this discussion, the term US holder means a beneficial owner of ordinary shares or ADSs (as the case may be) that:
| – | is for US federal income tax purposes: (i) an individual citizen or resident of the United States; (ii) a corporation, including any entity treated as a corporation for US federal income tax purposes, created or organised in or under the laws of the United States, any state thereof or the District of Columbia; (iii) a trust if a US court is able to exercise primary supervision over the trust’s administration and one or more US persons are authorised to control all substantial decisions of the trust or it has a valid election in effect under applicable Treasury regulations to be treated as a US person; or (iv) an estate that is subject to US federal income tax on its income regardless of its source; and |
| – | is not resident in the UK for UK tax purposes. |
The US federal income tax consequences to a partner in an entity or arrangement treated as a partnership for US federal income tax purposes that holds ordinary shares or ADSs generally will depend on the status of the partner and the activities of the partnership. Partners in a partnership holding any such equity interest should consult their own tax advisers.
Material US federal income tax consequences relating to the ownership and disposition of ordinary shares or ADSs
The following is a discussion of the material US federal income tax consequences of the ownership and disposition by US holders of ordinary shares or ADSs. This discussion assumes that BAT is not, and will not become, a passive foreign investment company for US federal income tax purposes, as described below.
ADSs
A US holder of ADSs, for US federal income tax purposes, generally will be treated as the owner of the underlying ordinary shares that are represented by such ADSs. Accordingly, deposits or withdrawals of ordinary shares for or from ADSs will not be subject to US federal income tax.
Taxation of Dividends
The gross amount of distributions on the ordinary shares or ADSs will be taxable as dividends to the extent paid out of BAT’s current or accumulated earnings and profits, as determined under US federal income tax principles. Such income will be includable in a US holder’s gross income as ordinary income on the day actually or constructively received by the US holder. Such dividends will be treated as foreign source income and will not be eligible for the dividends received deduction allowed to corporations under the US Tax Code.
| 300 | BAT Annual Report and Form 20-F 2018 | |
|
Strategic Report
|
Governance
|
Financial Statements
|
Other Information
|
With respect to non-corporate US investors, certain dividends received from a qualified foreign corporation may be subject to reduced rates of taxation. A qualified foreign corporation includes a foreign corporation that is eligible for the benefits of a comprehensive income tax treaty with the United States that the Treasury determines to be satisfactory for these purposes and that includes an exchange of information provision. The Treasury has determined that the treaty between the United States and the United Kingdom meets these requirements, and BAT believes that it is eligible for the benefits of the treaty. However, non-corporate holders that do not meet a minimum holding period requirement during which they are not protected from the risk of loss or that elect to treat the dividend income as ‘investment income’ pursuant to Section 163(d)(4) of the US Tax Code will not be eligible for the reduced rates of taxation. In addition, the rate reduction will not apply to dividends if the recipient of a dividend is obligated to make related payments with respect to positions in substantially similar or related property. This disallowance applies even if the minimum holding period has been met. US holders should consult their own tax advisers regarding the application of these rules to their particular circumstances.
The amount of any dividend paid by BAT in £ sterling (including any such amount in respect of ADSs that is converted into US dollars by the depositary bank) will equal the US dollar value of the £ sterling actually or constructively received, calculated by reference to the exchange rate in effect on the date the dividend is so received by the US holder, regardless of whether the £ sterling are converted into US dollars. If the £ sterling received as a dividend are converted into US dollars on the date received, the US holder generally will not be required to recognise foreign currency exchange gain or loss in respect of the dividend income. If the £ sterling received as a dividend are not converted into US dollars on the date of receipt, the US holder will have a basis in £ sterling equal to their US dollar value on the date of receipt. Any gain or loss realised on a subsequent conversion or other disposition of £ sterling will be treated as US source ordinary income or loss. US holders of ADSs should consult their own tax advisers regarding the application of these rules to the amount of any dividend paid by BAT in £ sterling that is converted into US dollars by the depositary bank.
To the extent that the amount of any distribution exceeds BAT’s current and accumulated earnings and profits for a taxable year, as determined under US federal income tax principles, the distribution will first be treated as a tax-free return of capital, causing a reduction in the US holder’s adjusted basis of the ordinary shares or ADSs, and to the extent the amount of the distribution exceeds the US holder’s tax basis, the excess will be taxed as capital gain recognised on a sale or exchange, as described below. BAT does not expect to determine earnings and profits in accordance with US federal income tax principles. Therefore, notwithstanding the foregoing, US holders should expect that distributions generally will be reported as dividend income for US information reporting purposes.
Distributions by BAT of additional ordinary shares (which may be distributed by the depositary bank to a holder of ADSs in the form of ADSs) to a US holder that is made as part of a pro rata distribution to all holders of ordinary shares and ADSs in respect of their ordinary shares or ADSs, and for which there is no option to receive other property (not including ADSs), generally will not be subject to US federal income tax. The basis of any new ordinary shares (or ADSs representing new ordinary shares) so received will be determined by allocating the US holder’s basis in the previously held ordinary shares or ADSs between the previously held ordinary shares or ADSs and the new ordinary shares or ADSs, based on their relative fair market values on the date of distribution.
Passive foreign investment company
A passive foreign investment company (PFIC), is any foreign corporation if, after the application of certain ‘look-through’ rules: (1) at least 75% of its gross income is ‘passive income’ as that term is defined in the relevant provisions of the US Tax Code; or (2) at least 50% of the average value of its assets produce ‘passive income’ or are held for the production of ‘passive income.’ The determination as to PFIC status is made annually.
BAT does not believe that it is, for US federal income tax purposes, a PFIC, and BAT expects to operate in such a manner so as not to become a PFIC. If, however, BAT is or becomes a PFIC, US holders could be subject to additional US federal income taxes on gain recognised with respect to the ordinary shares or ADSs and on certain distributions, plus an interest charge on certain taxes treated as having been deferred under the PFIC rules. Non-corporate US holders will not be eligible for reduced rates of taxation on any dividends received from BAT if it is a PFIC in the taxable year in which such dividends are paid or in the preceding taxable year. BAT’s US counsel expresses no opinion with respect to BAT’s PFIC status.
Taxation of capital gains
Upon a sale, exchange or other taxable disposition of ordinary shares or ADSs, a US holder will generally recognise capital gain or loss for US federal income tax purposes in an amount equal to the difference between the US dollar value of the amount realised on the disposition and the US holder’s adjusted tax basis in the ordinary shares or ADSs as determined in US dollars. Such gain or loss generally will be US source gain or loss, and will be long-term capital gain or loss if the US holder has held the ordinary shares or ADSs for more than one year. Certain non-corporate US holders may be eligible for preferential rates of US federal income tax in respect of net long-term capital gains. The deductibility of capital losses is subject to limitations.
The amount realised on a sale, exchange or other taxable disposition of ordinary shares for an amount in foreign currency will be the US dollar value of that amount on the date of sale or disposition. On the settlement date, the US holder will recognise US source foreign currency exchange gain or loss (taxable as ordinary income or loss) equal to the difference (if any) between the US dollar value of the amount received based on the exchange rates in effect on the date of sale, exchange or other disposition and the settlement date. However, in the case of ordinary shares traded on an established securities market that are sold by a cash-basis US holder (or an accrual-basis US holder that so elects), the amount realised will be based on the exchange rate in effect on the settlement date for the sale, and no foreign currency exchange gain or loss will be recognised at that time.
A US holder’s tax basis in ordinary shares or ADSs will generally equal the US dollar cost of the ordinary shares or ADSs. The US dollar cost of ordinary shares purchased with foreign currency will generally be the US dollar value of the purchase price on the date of purchase, or the settlement date for the purchase in the case of ordinary shares traded on an established securities market that are purchased by a cash-basis US holder (or an accrual-basis US holder that so elects).
| BAT Annual Report and Form 20-F 2018 | 301 | |
|
Shareholder information
|
Shareholder taxation information continued
Information with respect to foreign financial assets
Individuals and certain entities that own ‘specified foreign financial assets’ with an aggregate value in excess of US$50,000 are generally required to file information reports with respect to such assets with their US federal income tax returns. Depending on the individual’s circumstances, higher threshold amounts may apply. Specified foreign financial assets include any financial accounts maintained by foreign financial institutions, as well as any of the following, but only if they are not held in accounts maintained by financial institutions: (1) stocks and securities issued by non-US persons; (2) financial instruments and contracts held for investment that have non-US issuers or counterparties; and (3) interests in non-US entities. If a US holder is subject to this information reporting regime, the failure to file information reports may subject the US holder to penalties. US holders are urged to consult their own tax advisers regarding their obligations to file information reports with respect to ordinary shares or ADSs.
Medicare net investment tax
Certain persons who are individuals (other than non-resident aliens), estates or trusts are required to pay an additional 3.8% tax on the lesser of (1) their ‘net investment income’ (in the case of individuals) or ‘undistributed net investment income’ (in the case of estates and trusts) (which includes dividend income in respect of, and gain recognised on the disposition of, ordinary shares or ADSs) for the relevant taxable year; and (2) the excess of their modified adjusted gross income (in the case of individuals) or adjusted gross income (in the case of estates and trusts) for the taxable year over specified dollar amounts. US holders are urged to consult their tax advisers regarding the applicability of this provision to their ownership of ordinary shares or ADSs.
Credits or deductions for UK taxes
As indicated under ‘Material UK tax consequences’ below, dividends in respect of, and gains on the disposition of, ordinary shares or ADSs may be subject to UK taxation in certain circumstances. A US holder may be eligible to claim a credit or deduction in respect of UK taxes attributable to such income or gain for purposes of computing the US holder’s US federal income tax liability, subject to certain limitations. The US foreign tax credit rules are complex, and US holders should consult their own tax advisers regarding the availability of US foreign tax credits and the application of the US foreign tax credit rules to their particular situation.
Information reporting and backup withholding
Information reporting and backup withholding may apply to dividend payments and proceeds from the sale, exchange or other taxable disposition of ordinary shares or ADSs. Backup withholding will not apply, however, to a US holder that: (1) furnishes a correct taxpayer identification number (TIN), certifies that such holder is not subject to backup withholding on Internal Revenue Service Form W-9 (or appropriate successor form) and otherwise complies with all applicable requirements of the backup withholding rules; or (2) provides proof that such holder is otherwise exempt from backup withholding. Backup withholding is not an additional tax, and any amounts withheld under the backup withholding rules may be refunded or credited against a holder’s US federal income tax liability, if any, provided that such holder furnishes the required information to the Internal Revenue Service in a timely manner. The Internal Revenue Service may impose a penalty upon any taxpayer that fails to provide the correct TIN.
This summary of material US federal income tax consequences is not tax advice. The determination of the actual tax consequences for a US holder will depend on the US holder’s specific situation. US holders of ordinary shares or ADSs, in each case, should consult their own tax advisers as to the tax consequences of owning and disposing of ordinary shares or ADSs, including the applicability and effect of the alternative minimum tax and any state, local, foreign or other tax laws and of changes in those laws.
Material UK tax consequences
The following paragraphs summarise material aspects of the UK tax treatment of US holders of ordinary shares or ADSs and do not purport to be either a complete analysis of all tax considerations relating to holding ordinary shares or ADSs or an analysis of the tax position of BAT. They are based on current UK legislation and what is understood to be current HMRC practice, both of which are subject to change, possibly with retrospective effect.
The comments are intended as a general guide and (otherwise than where expressly stated to the contrary) apply only to US holders of ordinary shares or ADSs (other than under a personal equity plan or individual savings account) and who are the absolute beneficial owners of such shares. These comments do not deal with certain types of shareholders such as charities, dealers in securities, persons holding or acquiring shares in the course of a trade, persons who have or could be treated for tax purposes as having acquired their ordinary shares or ADSs by reason of their employment, collective investment schemes, persons subject to UK tax on the remittance basis and insurance companies. You are encouraged to consult an appropriate independent professional tax adviser with respect to your tax position.
Tax on chargeable gains as a result of disposals of ordinary shares or ADSs
Subject to the below, US holders will not generally be subject to UK tax on chargeable gains on a disposal of ordinary shares or ADSs provided that they do not carry on a trade, profession or vocation in the United Kingdom through a branch, agency or permanent establishment in connection with which the ordinary shares or ADSs are held.
A US holder who is an individual, who has ceased to be resident for tax purposes in the United Kingdom for a period of less than five years and who disposes of ordinary shares or ADSs during that period may be liable for UK tax on capital gains (in the absence of any available exemptions or reliefs). If applicable, the tax charge will arise in the tax year that the individual returns to the United Kingdom.
| 302 | BAT Annual Report and Form 20-F 2018 | |
|
Strategic Report
|
Governance
|
Financial Statements
|
Other Information
|
Tax on dividends
BAT is not required to withhold UK tax at source from dividends paid on ordinary shares or ADSs.
US holders will not generally be subject to UK tax on dividends received from BAT provided that they do not carry on a trade, profession or vocation in the United Kingdom through a branch, agency or permanent establishment in connection with which the ordinary shares or ADSs are held.
Stamp duty and stamp duty reserve tax (SDRT)
Based on current published HMRC practice and recent case law, transfers of ADSs should not be subject to SDRT or stamp duty provided that any instrument of transfer is executed and remains outside the UK. The transfer of an underlying ordinary share to the ADS holder in exchange for the cancellation of an ADS should also not give rise to a stamp duty or SDRT charge.
Transfers of ordinary shares outside of the depositary bank, including the repurchase of ordinary shares by BAT, will generally be subject to stamp duty or SDRT at the rate of 0.5% of the amount or value of the consideration given, except as described above in connection with the cancellation of an ADS. If ordinary shares are redeposited into a clearance service or depositary system, the redeposit will attract stamp duty or SDRT at the higher rate of 1.5%.
The purchaser or the transferee of the ordinary shares or ADSs will generally be responsible for paying any stamp duty or SDRT payable. Where stamp duty or SDRT is payable, it is payable regardless of the residence position of the purchaser.
Inheritance tax
A gift or settlement of ordinary shares or ADSs by, or on the death of, an individual shareholder may give rise to a liability to UK inheritance tax even if the shareholder is not a resident of, or domiciled in, the United Kingdom.
A charge to inheritance tax may arise in certain circumstances where ordinary shares or ADSs are held by close companies and trustees of settlements.
However, pursuant to the Estate and Gift Tax Treaty 1980 (the Treaty) entered into between the United Kingdom and the United States, a gift or settlement of ordinary shares or ADSs by shareholders who are domiciled in the United States for the purposes of the Treaty may be exempt from any liability to UK inheritance tax.
| BAT Annual Report and Form 20-F 2018 | 303 | |
|
Shareholder information
|
Share capital and security ownership
| 304 | BAT Annual Report and Form 20-F 2018 | |
|
Strategic Report
|
Governance
|
Financial Statements
|
Other Information
|
All shares held by the significant shareholders represent the Company’s ordinary shares. These significant shareholders have no special voting rights compared with other holders of the Company’s ordinary shares.
Additional significant shareholding disclosure
Capital Research Global Investors, a division of Capital Research and Management Company, filed with the SEC a statement on Schedule 13G under the Exchange Act on 14 February 2019 disclosing that, as of 31 December 2018, it beneficially owned 165,127,740 ordinary shares, including 20,646,872 ordinary shares represented by ADSs. This represents approximately 7.1% of the Company’s ordinary shares outstanding as of 31 December 2018. The notifications regarding the holdings by The Capital Group Companies, Inc., listed below, indicate that Capital Research and Management Company is part of a chain of controlled undertakings with The Capital Group Companies, Inc.
In accordance with the DTRs, shareholders must notify the Company if their shareholding reaches, exceeds or falls below 3% of total voting rights and each 1% threshold thereafter. The notifications received by the Company during the past three years to the best of the Company’s knowledge are set out below.
The Capital Group Companies, Inc. notified the Company on 3 March 2016 that its interest had increased above 5% to 94,321,111 ordinary shares on 2 March 2016.
Reinet Investments S.C.A. notified the Company on 6 October 2017 that its interest had decreased below the notifiable threshold of 3% to 68,053,670 ordinary shares on 25 July 2017.
The Capital Group Companies, Inc. notified the Company on 15 March 2018 that its interest had increased above 10% to 229,777,471 ordinary shares on 14 March 2018.
The Capital Group Companies, Inc. notified the Company on 16 October 2018 that its interest had increased above 11% to 252,733,863 ordinary shares on 12 October 2018.
The Capital Group Companies, Inc. notified the Company on 14 January 2019 that its interest had decreased below 11% to 249,831,584 ordinary shares on 11 January 2019.
To the extent known by BAT, BAT is not directly or indirectly owned or controlled by another corporation, any foreign government or by any other natural or legal person, severally or jointly. BAT is not aware of any arrangements, the operation of which may at a subsequent date result in a change of control of the Group.
Security ownership of the Board of Directors and the Management Board
The following table presents information regarding the total amount of ordinary shares beneficially owned (outright, by their family or by connected persons) by each current Director of BAT, each member of the Management Board and all Directors and the Management Board as a group, as of 25 February 2019. Unless otherwise indicated, the address for each Director and member of the Management Board listed is: c/o British American Tobacco p.l.c., Globe House, 4 Temple Place, London, WC2R 2PG, United Kingdom. The address for Guy Meldrum is Level 30, Three Pacific Place, 1 Queen’s Road East, Hong Kong. The address for Ricardo Oberlander is 401 North Main Street, Winston-Salem, NC 27101, United States of America.
| Number of Ordinary Shares | Percentage of Class9 | |||||||
| Directors | ||||||||
| Richard Burrows | 19,000 | 0.0008 | ||||||
| Nicandro Durante1,2 | 380,935 | 0.0166 | ||||||
| Jack Bowles | 162,733 | 0.0071 | ||||||
| Ben Stevens1,2 | 145,524 | 0.0063 | ||||||
| Sue Farr | – | – | ||||||
| Dr Marion Helmes | 4,500 | 0.0002 | ||||||
| Luc Jobin3 | 45,236 | 0.0020 | ||||||
| Holly Keller Koeppel3,4 | 8,416 | 0.0004 | ||||||
| Savio Kwan | 6,731 | 0.0003 | ||||||
| Dimitri Panayotopoulos | 3,300 | 0.0001 | ||||||
| Kieran Poynter | 5,000 | 0.0002 | ||||||
| BAT Annual Report and Form 20-F 2018 | 305 | |
|
Shareholder information
|
Share capital and security ownership continued
|
Number of Ordinary Shares
|
Percentage of Class9
|
|||||||
| Management Board | ||||||||
| Jerome Abelman5,7 | 58,650 | 0.0026 | ||||||
| Marina Bellini | – | – | ||||||
| Luciano Comin5,7 | 15,419 | 0.0007 | ||||||
| Alan Davy5,7 | 70,818 | 0.0031 | ||||||
| Giovanni Giordano5,7,8 | 63,852 | 0.0028 | ||||||
| Hae In Kim5,6,7 | 6,901 | 0.0003 | ||||||
| Paul Lageweg5,6,7,8 | 107,385 | 0.0047 | ||||||
| Tadeu Marroco5,7 | 33,237 | 0.0014 | ||||||
| Guy Meldrum5,7 | 3,853 | 0.0002 | ||||||
| David O’Reilly5,7 | 42,079 | 0.0018 | ||||||
| Ricardo Oberlander5,7 | 75,243 | 0.0033 | ||||||
| Naresh Sethi5,7 | 69,154 | 0.0030 | ||||||
| Johan Vandermeulen5,7 | 36,568 | 0.0016 | ||||||
| Kingsley Wheaton5,7 | 29,809 | 0.0013 | ||||||
| All Directors and Management Board as a group (25 persons) | 1,394,346 | 0.0608 | ||||||
Notes:
| 1. | The number of ordinary shares beneficially owned by the Executive Directors include ordinary shares awarded and required to be held for a period of at least three years in a UK-based trust under the SIP. Ordinary shares cannot be sold or transferred out of the trust until the end of the three-year holding period. The amounts next to the corresponding Executive Director include the following ordinary shares held in the trust under the SIP: (a) 2,369 ordinary shares for Mr Durante, of which 508 have been held for less than three years; (b) 519 ordinary shares for Mr Bowles, of which 266 have been held for less than three years; and (c) 693 ordinary shares for Mr Stevens, of which 306 have been held for less than three years. In all cases, the beneficial owner of ordinary shares under the SIP may direct the trust to exercise its voting rights in accordance with his instructions. See footnote (5) to the table below under the heading ‘Outstanding Share-based Awards and Options-based Awards of the Board of Directors and the Management Board’ for additional details regarding the SIP and the ordinary shares held thereunder. |
| 2. | The number of ordinary shares beneficially owned by the Executive Directors include the following number of awards of restricted ordinary shares granted under the DSBS that are scheduled to vest within 60 days of 25 February 2019: (a) 29,690 ordinary shares for Mr Durante; (b) 11,473 ordinary shares for Mr Bowles; and (c) 19,468 ordinary shares for Mr Stevens. Until awards of ordinary shares under the DSBS vest, they are held in trust and the recipient of such award does not have the ability to transfer, sell or direct the voting of the applicable ordinary shares. See footnote (4) to the table below under the heading ‘Outstanding Share-based Awards and Options-based Awards of the Board of Directors and the Management Board’ for additional details regarding the DSBS. |
| 3. | The ordinary shares beneficially owned by Mr Jobin and Ms Koeppel are represented by ADSs, each of which represents one ordinary share. |
| 4. | Ms Koeppel holds 21,842.98 DSUs which were granted prior to becoming a Director of BAT. Each DSU entitles the holder to receive a cash payment upon ceasing to be a Director equal to the value of one BAT ADS. The number of DSUs will increase on each dividend payment date by reference to the value of dividends declared on the ADSs underlying the DSUs. |
| 5. | The number of ordinary shares beneficially owned by the members of the Management Board include ordinary shares awarded and required to be held for a period of at least three years in a UK-based trust under the SIP. Ordinary shares cannot be sold or transferred out of the trust until the end of the three-year holding period. The amounts next to the corresponding Management Board member include the following ordinary shares held in the trust under the SIP: (a) 489 ordinary shares for Mr Abelman, of which 268 have been held for less than three years; (b) 506 ordinary shares for Mr Comin, of which 270 have been held for less than three years; (c) 603 ordinary shares for Mr Davy, of which 290 have been held for less than three years; (d) 905 ordinary shares for Mr Giordano, of which 322 have been held for less than three years; (e) 228 ordinary shares for Ms Kim, of which 228 have been held for less than three years; (f) 263 ordinary shares for Mr Lageweg, of which 233 have been held for less than three years; (g) 628 ordinary shares for Mr Marroco, of which 285 have been held for less than three years; (h) 225 ordinary shares for Mr Meldrum, of which 225 have been held for less than three years; (i) 1,757 ordinary shares for Dr O’Reilly, of which 439 have been held for less than three years; (j) 479 ordinary shares for Mr Oberlander, of which 272 have been held for less than three years; (k) 1,469 ordinary shares for Mr Sethi, of which 393 have been held for less than three years; (l) 486 ordinary shares for Mr Vandermeulen, of which 264 have been held for less than three years; and (m) 743 ordinary shares for Mr Wheaton, of which 309 have been held for less than three years. In all cases, the beneficial owner of ordinary shares under the SIP may direct the trust to exercise its voting rights in accordance with his instructions. See footnote (5) to the table below under the heading ‘Outstanding Share-based Awards and Options-based Awards of the Board of Directors and the Management Board’ for additional details regarding the SIP and the ordinary shares held thereunder. |
| 6. | The number of ordinary shares beneficially owned by the members of the Management Board include the following number of options granted under the LTIP that are scheduled to vest and may be exercised within 60 days of 25 February 2019: (a) 4,121 options under the LTIP for Ms Kim; and (b) 13,494 options under the LTIP for Mr Lageweg. Each option is convertible into one ordinary share upon exercise. See footnote (1) to the table below under the heading ‘Outstanding Share-based Awards and Options-based Awards of the Board of Directors and the Management Board’ for additional details regarding the LTIP. |
| 7. | The number of ordinary shares beneficially owned by the members of the Management Board include the following number of awards of restricted ordinary shares granted under the DSBS that are scheduled to vest within 60 days of 25 February 2019: (a) 8,164 ordinary shares for Mr Abelman; (b) 3,307 ordinary shares for Mr Comin; (c) 8,270 ordinary shares for Mr Davy; (d) 10,815 ordinary shares for Mr Giordano; (e) 1,701 ordinary shares for Ms Kim; (f) 4,056 ordinary shares for Mr Lageweg; (g) 7,655 ordinary shares for Mr Marroco; (h) 3,574 ordinary shares for Mr Meldrum; (i) 7,655 ordinary shares for Dr O’Reilly; (j) 9,522 ordinary shares for Mr Oberlander; (k) 9,341 ordinary shares for Mr Sethi; (l) 9,013 ordinary shares for Mr Vandermeulen; and (m) 9,066 ordinary shares for Mr Wheaton. Until awards of ordinary shares under the DSBS vest, they are held in trust and the recipient of such award does not have the ability to transfer, sell or direct the voting of the applicable ordinary shares. See footnote (4) to the table below under the heading ‘Outstanding Share-based Awards and Options-based Awards of the Board of Directors and the Management Board’ for additional details regarding the DSBS. |
| 8. | The number of ordinary shares beneficially owned by the members of the Management Board include the following ADSs, each of which represents one ordinary share: (a) 8,000 ADSs for Mr Giordano; and (b) 83,416 ADSs for Mr Lageweg. |
| 9. | The information in this column is based on 2,293,771,080 ordinary shares outstanding (excluding treasury shares) as of 25 February 2019. Any securities not outstanding subject to options, warrants, rights or conversion privileges that give the beneficial owner the right to acquire the securities within 60 days are deemed to be outstanding for the purpose of computing the percentage of outstanding securities of the class owned by such person but are not deemed to be outstanding for the purpose of computing the percentage of the class by any other person. |
| 306 | BAT Annual Report and Form 20-F 2018 | |
|
Strategic Report
|
Governance
|
Financial Statements
|
Other Information
|
Outstanding Share-based Awards and Options-based Awards of the Board of Directors and the Management Board
The following table presents information regarding the options and the restricted share awards held by the Directors and the Management Board as of 25 February 2019. The following Directors (being the Chairman and the Non-Executive Directors) have not been granted share-based Awards or Options-based Awards over ordinary shares: Mr Burrows, Ms Farr, Dr Helmes, Mr Jobin, Ms Koeppel, Mr Kwan, Mr Panayotopoulos and Mr Poynter.
| Number of Options Held |
Date of Grant/Award |
Options Exercise Price £ |
Market Price £ |
Number of Shares Awarded |
Exercisable (LTIP/Sharesave) Vesting (DSBS/SIP) |
|||||||||||||||||||
| Directors | ||||||||||||||||||||||||
| Nicandro Durante | ||||||||||||||||||||||||
| LTIP1 | 140,529 | 12 May 2016 | 0.00 | 42.34 | – | 12 May 2021–11 May 2026 | ||||||||||||||||||
| 114,181 | 27 Mar 2017 | 0.00 | 52.11 | – | 27 Mar 2022–26 Mar 2027 | |||||||||||||||||||
| 160,503 | 26 Mar 2018 | 0.00 | 38.94 | – | 26 Mar 2023–25 Mar 2028 | |||||||||||||||||||
| Sharesave2 | 543 | 26 Aug 2014 | 27.87 | 34.83 | – | 1 Oct 2019–31 Mar 2020 | ||||||||||||||||||
| 369 | 24 Mar 2017 | 40.56 | 50.70 | – | 1 May 2022–31 Oct 2022 | |||||||||||||||||||
| Total Options3 | 416,125 | |||||||||||||||||||||||
| DSBS4 | – | 29 Mar 2016 | – | – | 29,690 | 29 Mar 2019 | ||||||||||||||||||
| – | 27 Mar 2017 | – | – | 28,545 | 27 Mar 2020 | |||||||||||||||||||
| – | 26 Mar 2018 | – | – | 32,517 | 26 Mar 2021 | |||||||||||||||||||
| SIP5 | – | 1 Apr 2016 | – | – | 88 | 1 Apr 2019 | ||||||||||||||||||
| – | 9 May 2016 | – | – | 43 | 9 May 2019 | |||||||||||||||||||
| – | 28 Sep 2016 | – | – | 20 | 28 Sep 2019 | |||||||||||||||||||
| – | 3 Apr 2017 | – | – | 67 | 3 Apr 2020 | |||||||||||||||||||
| – | 4 May 2017 | – | – | 43 | 4 May 2020 | |||||||||||||||||||
| – | 28 Sep 2017 | – | – | 25 | 28 Sep 2020 | |||||||||||||||||||
| – | 8 Feb 2018 | – | – | 20 | 8 Feb 2021 | |||||||||||||||||||
| – | 3 Apr 2018 | – | – | 70 | 3 Apr 2021 | |||||||||||||||||||
| – | 9 May 2018 | – | – | 27 | 9 May 2021 | |||||||||||||||||||
| – | 8 Aug 2018 | – | – | 26 | 8 Aug 2021 | |||||||||||||||||||
| – | 15 Nov 2018 | – | – | 38 | 15 Nov 2021 | |||||||||||||||||||
| – | 7 Feb 2019 | – | – | 41 | 7 Feb 2022 | |||||||||||||||||||
| Total Restricted Share Awards6 |
|
91,260 | ||||||||||||||||||||||
| Jack Bowles | ||||||||||||||||||||||||
| LTIP1 | 31,943 | 12 May 2016 | 0.00 | 42.34 | – | 12 May 2019–11 May 2026 | ||||||||||||||||||
| 26,463 | 27 Mar 2017 | 0.00 | 52.11 | – | 27 Mar 2020–26 Mar 2027 | |||||||||||||||||||
| 43,785 | 26 Mar 2018 | 0.00 | 38.94 | – | 26 Mar 2021–25 Mar 2028 | |||||||||||||||||||
| Total Options3 | 102,191 | |||||||||||||||||||||||
| DSBS4 | – | 29 Mar 2016 | – | – | 11,473 | 29 Mar 2019 | ||||||||||||||||||
| – | 27 Mar 2017 | – | – | 8,997 | 27 Mar 2020 | |||||||||||||||||||
| – | 26 Mar 2018 | – | – | 12,064 | 26 Mar 2021 | |||||||||||||||||||
| SIP5 | – | 1 Apr 2016 | – | – | 88 | 1 Apr 2019 | ||||||||||||||||||
| – | 9 May 2016 | – | – | 6 | 9 May 2019 | |||||||||||||||||||
| – | 28 Sep 2016 | – | – | 3 | 28 Sep 2019 | |||||||||||||||||||
| – | 3 Apr 2017 | – | – | 67 | 3 Apr 2020 | |||||||||||||||||||
| – | 4 May 2017 | – | – | 6 | 4 May 2020 | |||||||||||||||||||
| – | 28 Sep 2017 | – | – | 3 | 28 Sep 2020 | |||||||||||||||||||
| – | 8 Feb 2018 | – | – | 3 | 8 Feb 2021 | |||||||||||||||||||
| – | 3 Apr 2018 | – | – | 70 | 3 Apr 2021 | |||||||||||||||||||
| – | 9 May 2018 | – | – | 3 | 9 May 2021 | |||||||||||||||||||
| – | 8 Aug 2018 | – | – | 4 | 8 Aug 2021 | |||||||||||||||||||
| – | 15 Nov 2018 | – | – | 6 | 15 Nov 2021 | |||||||||||||||||||
| – | 7 Feb 2019 | – | – | 7 | 7 Feb 2022 | |||||||||||||||||||
| Total Restricted Share Awards6 |
|
32,800 | ||||||||||||||||||||||
| BAT Annual Report and Form 20-F 2018 | 307 | |
|
Shareholder information
|
Share capital and security ownership continued
| Number of Options Held |
Date of Grant/Award |
Options £ |
Market Price £ |
Number of Shares Awarded |
Exercisable (LTIP/Sharesave) Vesting (DSBS/SIP) |
|||||||||||||||||||
| Ben Stevens | ||||||||||||||||||||||||
| LTIP1 | 71,669 | 12 May 2016 | 0.00 | 42.34 | – | 12 May 2021–11 May 2026 | ||||||||||||||||||
| 58,232 | 27 Mar 2017 | 0.00 | 52.11 | – | 27 Mar 2022–26 Mar 2027 | |||||||||||||||||||
| 80,264 | 26 Mar 2018 | 0.00 | 38.94 | – | 26 Mar 2023–25 Mar 2028 | |||||||||||||||||||
| Sharesave2 | 543 | 26 Aug 2014 | 27.87 | 34.83 | – | 1 Oct 2019–31 Mar 2020 | ||||||||||||||||||
| 495 | 23 Mar 2015 | 30.26 | 37.82 | – | 1 May 2020–31 Oct 2020 | |||||||||||||||||||
| Total Options3 | 211,203 | |||||||||||||||||||||||
| DSBS4 | – | 29 Mar 2016 | – | – | 19,468 | 29 Mar 2019 | ||||||||||||||||||
| – | 27 Mar 2017 | – | – | 15,805 | 27 Mar 2020 | |||||||||||||||||||
| – | 26 Mar 2018 | – | – | 17,655 | 26 Mar 2021 | |||||||||||||||||||
| SIP5 | – | 1 Apr 2016 | – | – | 88 | 1 Apr 2019 | ||||||||||||||||||
| – | 9 May 2016 | – | – | 13 | 9 May 2019 | |||||||||||||||||||
| – | 28 Sep 2016 | – | – | 6 | 28 Sep 2019 | |||||||||||||||||||
| – | 3 Apr 2017 | – | – | 67 | 3 Apr 2020 | |||||||||||||||||||
| – | 4 May 2017 | – | – | 12 | 4 May 2020 | |||||||||||||||||||
| – | 28 Sep 2017 | – | – | 7 | 28 Sep 2020 | |||||||||||||||||||
| – | 8 Feb 2018 | – | – | 5 | 8 Feb 2021 | |||||||||||||||||||
| – | 3 Apr 2018 | – | – | 70 | 3 Apr 2021 | |||||||||||||||||||
| – | 9 May 2018 | – | – | 7 | 9 May 2021 | |||||||||||||||||||
| – | 8 Aug 2018 | – | – | 7 | 8 Aug 2021 | |||||||||||||||||||
| – | 15 Nov 2018 | – | – | 12 | 15 Nov 2021 | |||||||||||||||||||
| – | 7 Feb 2019 | – | – | 12 | 7 Feb 2022 | |||||||||||||||||||
| Total Restricted Share Awards6 |
|
53,234 | ||||||||||||||||||||||
| Management Board | ||||||||||||||||||||||||
| Jerome Abelman | ||||||||||||||||||||||||
| LTIP1 | 22,732 | 12 May 2016 | 0.00 | 42.34 | – | 12 May 2019–11 May 2026 | ||||||||||||||||||
| 19,583 | 27 Mar 2017 | 0.00 | 52.11 | – | 27 Mar 2020–26 Mar 2027 | |||||||||||||||||||
| 32,100 | 26 Mar 2018 | 0.00 | 38.94 | – | 26 Mar 2021–25 Mar 2028 | |||||||||||||||||||
| Sharesave2 | 991 | 23 Mar 2015 | 30.26 | 37.82 | – | 1 May 2020–31 Oct 2020 | ||||||||||||||||||
| Total Options3 | 75,406 | |||||||||||||||||||||||
| DSBS4 | – | 29 Mar 2016 | – | – | 8,164 | 29 Mar 2019 | ||||||||||||||||||
| – | 27 Mar 2017 | – | – | 6,658 | 27 Mar 2020 | |||||||||||||||||||
| – | 26 Mar 2018 | – | – | 8,844 | 26 Mar 2021 | |||||||||||||||||||
| SIP5 | – | 1 Apr 2016 | – | – | 88 | 1 Apr 2019 | ||||||||||||||||||
| – | 9 May 2016 | – | – | 3 | 9 May 2019 | |||||||||||||||||||
| – | 28 Sep 2016 | – | – | 2 | 28 Sep 2019 | |||||||||||||||||||
| – | 3 Apr 2017 | – | – | 67 | 3 Apr 2020 | |||||||||||||||||||
| – | 4 May 2017 | – | – | 5 | 4 May 2020 | |||||||||||||||||||
| – | 28 Sep 2017 | – | – | 4 | 28 Sep 2020 | |||||||||||||||||||
| – | 8 Feb 2018 | – | – | 3 | 8 Feb 2021 | |||||||||||||||||||
| – | 3 Apr 2018 | – | – | 70 | 3 Apr 2021 | |||||||||||||||||||
| – | 9 May 2018 | – | – | 4 | 9 May 2021 | |||||||||||||||||||
| – | 8 Aug 2018 | – | – | 5 | 8 Aug 2021 | |||||||||||||||||||
| – | 15 Nov 2018 | – | – | 8 | 15 Nov 2021 | |||||||||||||||||||
| – | 7 Feb 2019 | – | – | 9 | 7 Feb 2022 | |||||||||||||||||||
| Total Restricted Share Awards6 |
|
23,934 | ||||||||||||||||||||||
| 308 | BAT Annual Report and Form 20-F 2018 | |
|
Strategic Report
|
Governance
|
Financial Statements
|
Other Information
|
| Number of Options Held |
Date of Grant/Award |
Options £ |
Market Price £ |
Number of Shares Awarded |
Exercisable (LTIP/Sharesave) Vesting (DSBS/SIP) |
|||||||||||||||||||
| Marina Bellini | ||||||||||||||||||||||||
| LTIP1 | – | – | – | – | ||||||||||||||||||||
| Sharesave2 | – | – | – | – | ||||||||||||||||||||
| Total Options3 | – | |||||||||||||||||||||||
| DSBS4 | – | – | – | – | ||||||||||||||||||||
| SIP5 | – | – | – | – | ||||||||||||||||||||
| Total Restricted Share Awards6 |
|
– | ||||||||||||||||||||||
| Luciano Comin | ||||||||||||||||||||||||
| LTIP1 | 7,589 | 12 May 2016 | 0.00 | 42.34 | – | 12 May 2019–11 May 2026 | ||||||||||||||||||
| 7,482 | 27 Mar 2017 | 0.00 | 52.11 | – | 27 Mar 2020–26 Mar 2027 | |||||||||||||||||||
| 10,313 | 26 Mar 2018 | 0.00 | 38.94 | – | 26 Mar 2021–25 Mar 2028 | |||||||||||||||||||
| Sharesave2 | 533 | 28 Mar 2018 | 33.76 | 42.20 | – | 1 May 2021–31 Oct 2021 | ||||||||||||||||||
| Total Options3 | 25,917 | |||||||||||||||||||||||
| DSBS4 | – | 29 Mar 2016 | – | – | 3,307 | 29 Mar 2019 | ||||||||||||||||||
| – | 27 Mar 2017 | – | – | 2,866 | 27 Mar 2020 | |||||||||||||||||||
| – | 26 Mar 2018 | – | – | 3,464 | 26 Mar 2021 | |||||||||||||||||||
| SIP5 | – | 1 Apr 2016 | – | – | 88 | 1 Apr 2019 | ||||||||||||||||||
| – | 5 May 2016 | – | – | 3 | 5 May 2019 | |||||||||||||||||||
| – | 28 Sep 2016 | – | – | 3 | 28 Sep 2019 | |||||||||||||||||||
| – | 3 Apr 2017 | – | – | 67 | 3 Apr 2019 | |||||||||||||||||||
| – | 4 May 2017 | – | – | 5 | 4 May 2020 | |||||||||||||||||||
| – | 28 Sep 2017 | – | – | 4 | 28 Sep 2020 | |||||||||||||||||||
| – | 8 Feb 2018 | – | – | 3 | 8 Feb 2021 | |||||||||||||||||||
| – | 3 Apr 2018 | – | – | 70 | 3 Apr 2021 | |||||||||||||||||||
| – | 9 May 2018 | – | – | 5 | 9 May 2021 | |||||||||||||||||||
| – | 8 Aug 2018 | – | – | 5 | 8 Aug 2021 | |||||||||||||||||||
| – | 15 Nov 2018 | – | – | 9 | 15 Nov 2021 | |||||||||||||||||||
| – | 7 Feb 2019 | – | – | 8 | 7 Feb 2022 | |||||||||||||||||||
| Total Restricted Share Awards6 |
|
9,907 | ||||||||||||||||||||||
| BAT Annual Report and Form 20-F 2018 | 309 | |
|
Shareholder information
|
Share capital and security ownership continued
| Number of Options Held |
Date of Grant/Award |
Options £ |
Market Price £ |
Number of Shares Awarded |
Exercisable (LTIP/Sharesave) Vesting (DSBS/SIP) |
|||||||||||||||||||
| Alan Davy | ||||||||||||||||||||||||
| LTIP1 | 23,027 | 12 May 2016 | 0.00 | 42.34 | – | 12 May 2019–11 May 2026 | ||||||||||||||||||
| 19,099 | 27 Mar 2017 | 0.00 | 52.11 | – | 27 Mar 2020–26 Mar 2027 | |||||||||||||||||||
| 26,579 | 26 Mar 2018 | 0.00 | 38.94 | – | 26 Mar 2021–25 Mar 2028 | |||||||||||||||||||
| Sharesave2 | 543 | 26 Aug 2014 | 27.87 | 34.83 | – | 1 Oct 2019–31 Mar 2020 | ||||||||||||||||||
| 221 | 24 Mar 2017 | 40.56 | 50.70 | – | 1 May 2020–31 Oct 2020 | |||||||||||||||||||
| Total Options3 | 69,469 | |||||||||||||||||||||||
| DSBS4 | – | 29 Mar 2016 | – | – | 8,270 | 29 Mar 2019 | ||||||||||||||||||
| – | 27 Mar 2017 | – | – | 6,493 | 27 Mar 2020 | |||||||||||||||||||
| – | 26 Mar 2018 | – | – | 7,323 | 26 Mar 2021 | |||||||||||||||||||
| SIP5 | – | 1 Apr 2016 | – | – | 88 | 1 Apr 2019 | ||||||||||||||||||
| – | 9 May 2016 | – | – | 7 | 9 May 2019 | |||||||||||||||||||
| – | 28 Sep 2016 | – | – | 4 | 28 Sep 2019 | |||||||||||||||||||
| – | 3 Apr 2017 | – | – | 67 | 3 Apr 2020 | |||||||||||||||||||
| – | 4 May 2017 | – | – | 10 | 4 May 2020 | |||||||||||||||||||
| – | 28 Sep 2017 | – | – | 6 | 28 Sep 2020 | |||||||||||||||||||
| – | 8 Feb 2018 | – | – | 4 | 8 Feb 2021 | |||||||||||||||||||
| – | 3 Apr 2018 | – | – | 70 | 3 Apr 2021 | |||||||||||||||||||
| – | 9 May 2018 | – | – | 7 | 9 May 2021 | |||||||||||||||||||
| – | 8 Aug 2018 | – | – | 7 | 8 Aug 2021 | |||||||||||||||||||
| – | 15 Nov 2018 | – | – | 9 | 15 Nov 2021 | |||||||||||||||||||
| – | 7 Feb 2019 | – | – | 11 | 7 Feb 2022 | |||||||||||||||||||
| Total Restricted Share Awards6 |
|
22,376 | ||||||||||||||||||||||
| Giovanni Giordano | ||||||||||||||||||||||||
| LTIP1 | 30,113 | 12 May 2016 | 0.00 | 42.34 | – | 12 May 2019–11 May 2026 | ||||||||||||||||||
| 24,966 | 27 Mar 2017 | 0.00 | 52.11 | – | 27 Mar 2020–26 Mar 2027 | |||||||||||||||||||
| 34,411 | 26 Mar 2018 | 0.00 | 38.94 | – | 26 Mar 2021–25 Mar 2028 | |||||||||||||||||||
| Sharesave2 | 88 | 24 Mar 2017 | 40.56 | 50.70 | – | 1 May 2020–31 Oct 2020 | ||||||||||||||||||
| Total Options3 | 89,578 | |||||||||||||||||||||||
| DSBS4 | – | 29 Mar 2016 | – | – | 10,815 | 29 Mar 2019 | ||||||||||||||||||
| – | 27 Mar 2017 | – | – | 8,488 | 27 Mar 2020 | |||||||||||||||||||
| – | 26 Mar 2018 | – | – | 9,481 | 26 Mar 2021 | |||||||||||||||||||
| SIP5 | – | 1 Apr 2016 | – | – | 88 | 1 Apr 2019 | ||||||||||||||||||
| – | 9 May 2016 | – | – | 12 | 9 May 2019 | |||||||||||||||||||
| – | 28 Sep 2016 | – | – | 6 | 28 Sep 2019 | |||||||||||||||||||
| – | 3 Apr 2017 | – | – | 67 | 3 Apr 2020 | |||||||||||||||||||
| – | 4 May 2017 | – | – | 14 | 4 May 2020 | |||||||||||||||||||
| – | 28 Sep 2017 | – | – | 9 | 28 Sep 2020 | |||||||||||||||||||
| – | 8 Feb 2018 | – | – | 7 | 8 Feb 2021 | |||||||||||||||||||
| – | 3 Apr 2018 | – | – | 70 | 3 Apr 2021 | |||||||||||||||||||
| – | 9 May 2018 | – | – | 9 | 9 May 2021 | |||||||||||||||||||
| – | 8 Aug 2018 | – | – | 10 | 8 Aug 2021 | |||||||||||||||||||
| – | 15 Nov 2018 | – | – | 15 | 15 Nov 2021 | |||||||||||||||||||
| – | 7 Feb 2019 | – | – | 15 | 7 Feb 2022 | |||||||||||||||||||
| Total Restricted Share Awards6 |
|
29,106 | ||||||||||||||||||||||
| 310 | BAT Annual Report and Form 20-F 2018 | |
|
Strategic Report
|
Governance
|
Financial Statements
|
Other Information
|
| Number of
|
Date of
|
Options
|
Market Price £
|
Number of
|
Exercisable (LTIP/Sharesave)
|
|||||||||||||||||||
| Hae In Kim | ||||||||||||||||||||||||
| LTIP1 | 4,121 |
|
27 Mar 2015 |
|
0.00 | 36.25 | – | 27 Mar 2018–26 Mar 2025 | ||||||||||||||||
| 4,026 |
|
12 May 2016 |
|
0.00 | 42.34 | – | 12 May 2019–11 May 2026 | |||||||||||||||||
| 4,010 |
|
27 Mar 2017 |
|
0.00 | 52.11 | – | 27 Mar 2020–26 Mar 2027 | |||||||||||||||||
| 6,497 |
|
26 Mar 2018 |
|
0.00 | 38.94 | – | 26 Mar 2021–25 Mar 2028 | |||||||||||||||||
| Sharesave2 | 533 |
|
28 Mar 2018 |
|
33.76 | 42.20 | – | 1 May 2021–31 Oct 2021 | ||||||||||||||||
| Total Options3 |
|
19,187 |
|
|||||||||||||||||||||
| DSBS4 | – |
|
29 Mar 2016 |
|
– | – | 1,701 | 29 Mar 2019 | ||||||||||||||||
| – |
|
27 Mar 2017 |
|
– | – | 1,373 | 27 Mar 2020 | |||||||||||||||||
| – |
|
26 Mar 2018 |
|
– | – | 1,863 | 26 Mar 2021 | |||||||||||||||||
| SIP5 | – |
|
1 Apr 2016 |
|
– | – | 88 | 1 Apr 2019 | ||||||||||||||||
| – |
|
3 Apr 2017 |
|
– | – | 67 | 3 Apr 2020 | |||||||||||||||||
| – |
|
3 Apr 2018 |
|
– | – | 70 | 3 Apr 2021 | |||||||||||||||||
| – |
|
15 Nov 2018 |
|
– | – | 2 | 15 Nov 2021 | |||||||||||||||||
| – |
|
7 Feb 2019 |
|
– | – | 1 | 7 Feb 2022 | |||||||||||||||||
|
Total Restricted Share Awards6 |
|
5,165 | ||||||||||||||||||||||
| Paul Lageweg | ||||||||||||||||||||||||
| LTIP1 | 4,540 |
|
28 Mar 2014 |
|
0.00 | 32.58 | – | 28 Mar 2017–27 Mar 2024 | ||||||||||||||||
| 8,954 |
|
27 Mar 2015 |
|
0.00 | 36.25 | – | 27 Mar 2018–26 Mar 2025 | |||||||||||||||||
| 8,377 |
|
12 May 2016 |
|
0.00 | 42.34 | – | 12 May 2019–11 May 2026 | |||||||||||||||||
| 8,234 |
|
27 Mar 2017 |
|
0.00 | 52.11 | – | 27 Mar 2020–26 Mar 2027 | |||||||||||||||||
| 11,471 |
|
26 Mar 2018 |
|
0.00 | 38.94 | – | 26 Mar 2021–25 Mar 2028 | |||||||||||||||||
| Total Options3 |
|
41,576 |
|
|||||||||||||||||||||
| DSBS4 | – |
|
29 Mar 2016 |
|
– | – | 4,056 | 29 Mar 2019 | ||||||||||||||||
| – |
|
27 Mar 2017 |
|
– | – | 3,048 | 27 Mar 2020 | |||||||||||||||||
| – |
|
26 Mar 2018 |
|
– | – | 2,039 | 26 Mar 2021 | |||||||||||||||||
| SIP5 | – |
|
1 Apr 2016 |
|
– | – | 88 | 1 Apr 2019 | ||||||||||||||||
| – |
|
5 May 2016 |
|
– | – | 4 | 5 May 2019 | |||||||||||||||||
| – |
|
3 Apr 2017 |
|
– | – | 67 | 3 Apr 2020 | |||||||||||||||||
| – |
|
4 May 2017 |
|
– | – | 1 | 4 May 2020 | |||||||||||||||||
| – |
|
3 Apr 2018 |
|
– | – | 70 | 3 Apr 2021 | |||||||||||||||||
| – |
|
9 May 2018 |
|
– | – | 1 | 9 May 2021 | |||||||||||||||||
| – |
|
15 Nov 2018 |
|
– | – | 1 | 15 Nov 2021 | |||||||||||||||||
| – |
|
7 Feb 2019 |
|
– | – | 1 | 7 Feb 2022 | |||||||||||||||||
|
Total Restricted Share Awards6 |
|
9,376 | ||||||||||||||||||||||
| BAT Annual Report and Form 20-F 2018 | 311 | |
|
Shareholder information
|
Share capital and security ownership continued
| Number of Options Held |
Date of Grant/Award |
Options £ |
Market Price £ |
Number of Shares Awarded |
Exercisable (LTIP/Sharesave) Vesting (DSBS/SIP) |
|||||||||||||||||||
| Tadeu Marroco | ||||||||||||||||||||||||
| LTIP1 | 21,315 | 12 May 2016 | 0.00 | 42.34 | – | 12 May 2019–11 May 2026 | ||||||||||||||||||
| 21,109 | 27 Mar 2017 | 0.00 | 52.11 | – | 27 Mar 2020–26 Mar 2027 | |||||||||||||||||||
| 28,248 | 26 Mar 2018 | 0.00 | 38.94 | – | 26 Mar 2021–25 Mar 2028 | |||||||||||||||||||
| Sharesave2 | 495 | 23 Mar 2015 | 30.26 | 37.82 | – | 1 May 2020–31 Oct 2020 | ||||||||||||||||||
| 266 | 28 Mar 2018 | 33.76 | 42.20 | – | 1 May 2021–31 Oct 2021 | |||||||||||||||||||
| Total Options3 | 71,433 | |||||||||||||||||||||||
| DSBS4 | – | 29 Mar 2016 | – | – | 7,655 | 29 Mar 2019 | ||||||||||||||||||
| – | 27 Mar 2017 | – | – | 7,177 | 27 Mar 2020 | |||||||||||||||||||
| – | 26 Mar 2018 | – | – | 7,783 | 26 Mar 2021 | |||||||||||||||||||
| SIP5 | – | 1 Apr 2016 | – | – | 88 | 1 Apr 2019 | ||||||||||||||||||
| – | 9 May 2016 | – | – | 5 | 9 May 2019 | |||||||||||||||||||
| – | 28 Sep 2016 | – | – | 3 | 28 Sep 2019 | |||||||||||||||||||
| – | 3 Apr 2017 | – | – | 67 | 3 Apr 2020 | |||||||||||||||||||
| – | 4 May 2017 | – | – | 8 | 4 May 2020 | |||||||||||||||||||
| – | 28 Sep 2017 | – | – | 6 | 28 Sep 2020 | |||||||||||||||||||
| – | 8 Feb 2018 | – | – | 4 | 8 Feb 2021 | |||||||||||||||||||
| – | 3 Apr 2018 | – | – | 70 | 3 Apr 2021 | |||||||||||||||||||
| – | 9 May 2018 | – | – | 6 | 9 May 2021 | |||||||||||||||||||
| – | 8 Aug 2018 | – | – | 7 | 8 Aug 2021 | |||||||||||||||||||
| – | 15 Nov 2018 | – | – | 10 | 15 Nov 2021 | |||||||||||||||||||
| – | 7 Feb 2019 | – | – | 11 | 7 Feb 2022 | |||||||||||||||||||
| Total Restricted Share Awards6 |
|
22,900 | ||||||||||||||||||||||
| Guy Meldrum | ||||||||||||||||||||||||
| LTIP1 | 8,502 | 12 May 2016 | 0.00 | 42.34 | – | 12 May 2019–11 May 2026 | ||||||||||||||||||
| 8,059 | 27 Mar 2017 | 0.00 | 52.11 | – | 27 Mar 2020–26 Mar 2027 | |||||||||||||||||||
| 11,066 | 26 Mar 2018 | 0.00 | 38.94 | – | 26 Mar 2021–25 Mar 2028 | |||||||||||||||||||
| Total Options3 | 27,627 | |||||||||||||||||||||||
| DSBS4 | – | 29 Mar 2016 | – | – | 3,574 | 29 Mar 2019 | ||||||||||||||||||
| – | 27 Mar 2017 | – | – | 2,751 | 27 Mar 2020 | |||||||||||||||||||
| – | 26 Mar 2018 | – | – | 3,796 | 26 Mar 2021 | |||||||||||||||||||
| SIP5 | – | 1 Apr 2016 | – | – | 88 | 1 Apr 2019 | ||||||||||||||||||
| – | 3 Apr 2017 | – | – | 67 | 3 Apr 2020 | |||||||||||||||||||
| – | 3 Apr 2018 | – | – | 70 | 3 Apr 2021 | |||||||||||||||||||
| Total Restricted Share Awards6 |
|
10,346 | ||||||||||||||||||||||
| 312 | BAT Annual Report and Form 20-F 2018 | |
|
Strategic Report
|
Governance
|
Financial Statements
|
Other Information
|
| Number of Options Held |
Date of Grant/Award |
Options £ |
Market Price £ |
Number of Shares Awarded |
Exercisable (LTIP/Sharesave) Vesting (DSBS/SIP) |
|||||||||||||||||||
| Dr David O’Reilly | ||||||||||||||||||||||||
| LTIP1 | 21,315 | 12 May 2016 | 0.00 | 42.34 | – | 12 May 2019–11 May 2026 | ||||||||||||||||||
| 17,674 | 27 Mar 2017 | 0.00 | 52.11 | – | 27 Mar 2020–26 Mar 2027 | |||||||||||||||||||
| 24,364 | 26 Mar 2018 | 0.00 | 38.94 | – | 26 Mar 2021–25 Mar 2028 | |||||||||||||||||||
| Total Options(3) | 63,353 | |||||||||||||||||||||||
| DSBS4 | – | 29 Mar 2016 | – | – | 7,655 | 29 Mar 2019 | ||||||||||||||||||
| – | 27 Mar 2017 | – | – | 6,009 | 27 Mar 2020 | |||||||||||||||||||
| – | 26 Mar 2018 | – | – | 6,713 | 26 Mar 2021 | |||||||||||||||||||
| SIP5 | – | 1 Apr 2016 | – | – | 88 | 1 Apr 2019 | ||||||||||||||||||
| – | 9 May 2016 | – | – | 33 | 9 May 2019 | |||||||||||||||||||
| – | 28 Sep 2016 | – | – | 15 | 28 Sep 2019 | |||||||||||||||||||
| – | 3 Apr 2017 | – | – | 67 | 3 Apr 2020 | |||||||||||||||||||
| – | 4 May 2017 | – | – | 32 | 4 May 2020 | |||||||||||||||||||
| – | 28 Sep 2017 | – | – | 19 | 28 Sep 2020 | |||||||||||||||||||
| – | 8 Feb 2018 | – | – | 15 | 8 Feb 2021 | |||||||||||||||||||
| – | 3 Apr 2018 | – | – | 70 | 3 Apr 2021 | |||||||||||||||||||
| – | 9 May 2018 | – | – | 21 | 9 May 2021 | |||||||||||||||||||
| – | 8 Aug 2018 | – | – | 19 | 8 Aug 2021 | |||||||||||||||||||
| – | 15 Nov 2018 | – | – | 29 | 15 Nov 2021 | |||||||||||||||||||
| – | 7 Feb 2019 | – | – | 31 | 7 Feb 2022 | |||||||||||||||||||
| Total Restricted Share Awards6 | 20,816 | |||||||||||||||||||||||
| Ricardo Oberlander | ||||||||||||||||||||||||
| LTIP1 | 26,511 | 12 May 2016 | 0.00 | 42.34 | – | 12 May 2019–11 May 2026 | ||||||||||||||||||
| 21,996 | 27 Mar 2017 | 0.00 | 52.11 | – | 27 Mar 2020–26 Mar 2027 | |||||||||||||||||||
| 38,520 | 26 Mar 2018 | 0.00 | 38.94 | – | 26 Mar 2021–25 Mar 2028 | |||||||||||||||||||
| Sharesave2 | 495 | 23 Mar 2015 | 30.26 | 37.82 | – | 1 May 2020–31 Oct 2020 | ||||||||||||||||||
| Total Options3 | 87,522 | |||||||||||||||||||||||
| DSBS4 | – | 29 Mar 2016 | – | – | 9,522 | 29 Mar 2019 | ||||||||||||||||||
| – | 27 Mar 2017 | – | – | 7,478 | 27 Mar 2020 | |||||||||||||||||||
| – | 26 Mar 2018 | – | – | 8,438 | 26 Mar 2021 | |||||||||||||||||||
| SIP5 | – | 1 Apr 2016 | – | – | 88 | 1 Apr 2019 | ||||||||||||||||||
| – | 9 May 2016 | – | – | 5 | 9 May 2019 | |||||||||||||||||||
| – | 28 Sep 2016 | – | – | 3 | 28 Sep 2019 | |||||||||||||||||||
| – | 3 Apr 2017 | – | – | 67 | 3 Apr 2020 | |||||||||||||||||||
| – | 4 May 2017 | – | – | 7 | 4 May 2020 | |||||||||||||||||||
| – | 28 Sep 2017 | – | – | 5 | 28 Sep 2020 | |||||||||||||||||||
| – | 8 Feb 2018 | – | – | 3 | 8 Feb 2021 | |||||||||||||||||||
| – | 3 Apr 2018 | – | – | 70 | 3 Apr 2021 | |||||||||||||||||||
| – | 9 May 2018 | – | – | 6 | 9 May 2021 | |||||||||||||||||||
| – | 8 Aug 2018 | – | – | 4 | 8 Aug 2021 | |||||||||||||||||||
| – | 15 Nov 2018 | – | – | 7 | 15 Nov 2021 | |||||||||||||||||||
| – | 7 Feb 2019 | – | – | 7 | 7 Feb 2022 | |||||||||||||||||||
| Total Restricted Share Awards6 | 25,710 | |||||||||||||||||||||||
| BAT Annual Report and Form 20-F 2018 | 313 | |
|
Shareholder information
|
Share capital and security ownership continued
| Number of Options Held |
Date of Grant/Award |
Options £ |
Market Price £ |
Number of Shares Awarded |
Exercisable (LTIP/Sharesave) Vesting (DSBS/SIP) |
|||||||||||||||||||
| Naresh Sethi | ||||||||||||||||||||||||
| LTIP1 | 26,009 | 12 May 2016 | 0.00 | 42.34 | – | 12 May 2019–11 May 2026 | ||||||||||||||||||
| 21,545 | 27 Mar 2017 | 0.00 | 52.11 | – | 27 Mar 2020–26 Mar 2027 | |||||||||||||||||||
| 29,693 | 26 Mar 2018 | 0.00 | 38.94 | – | 26 Mar 2021–25 Mar 2028 | |||||||||||||||||||
| Sharesave2 | 369 | 24 Mar 2017 | 40.56 | 50.70 | – | 1 May 2022–31 Oct 2022 | ||||||||||||||||||
| 444 | 28 Mar 2018 | 33.76 | 42.50 | – | 1 May 2023–31 Oct 2023 | |||||||||||||||||||
| Total Options3 | 78,060 | |||||||||||||||||||||||
| DSBS4 | – | 29 Mar 2016 | – | – | 9,341 | 29 Mar 2019 | ||||||||||||||||||
| – | 27 Mar 2017 | – | – | 7,325 | 27 Mar 2020 | |||||||||||||||||||
| – | 26 Mar 2018 | – | – | 8,181 | 26 Mar 2021 | |||||||||||||||||||
| SIP5 | – | 1 Apr 2016 | – | – | 88 | 1 Apr 2019 | ||||||||||||||||||
| – | 9 May 2016 | – | – | 24 | 9 May 2019 | |||||||||||||||||||
| – | 28 Sep 2016 | – | – | 11 | 28 Sep 2019 | |||||||||||||||||||
| – | 3 Apr 2017 | – | – | 67 | 3 Apr 2020 | |||||||||||||||||||
| – | 4 May 2017 | – | – | 25 | 4 May 2020 | |||||||||||||||||||
| – | 28 Sep 2017 | – | – | 15 | 28 Sep 2020 | |||||||||||||||||||
| – | 8 Feb 2018 | – | – | 12 | 8 Feb 2021 | |||||||||||||||||||
| – | 3 Apr 2018 | – | – | 70 | 3 Apr 2021 | |||||||||||||||||||
| – | 9 May 2018 | – | – | 16 | 9 May 2021 | |||||||||||||||||||
| – | 8 Aug 2018 | – | – | 16 | 8 Aug 2021 | |||||||||||||||||||
| – | 15 Nov 2018 | – | – | 24 | 15 Nov 2021 | |||||||||||||||||||
| – | 7 Feb 2019 | – | – | 25 | 7 Feb 2022 | |||||||||||||||||||
| Total Restricted Share Awards6 |
|
25,240 | ||||||||||||||||||||||
| Johan Vandermeulen | ||||||||||||||||||||||||
| LTIP1 | 25,094 | 12 May 2016 | 0.00 | 42.34 | – | 12 May 2019–11 May 2026 | ||||||||||||||||||
| 21,195 | 27 Mar 2017 | 0.00 | 52.11 | – | 27 Mar 2020–26 Mar 2027 | |||||||||||||||||||
| 30,335 | 26 Mar 2018 | 0.00 | 38.94 | – | 26 Mar 2021–25 Mar 2028 | |||||||||||||||||||
| Sharesave2 | 991 | 23 Mar 2015 | 30.26 | 37.82 | – | 1 May 2020–31 Oct 2020 | ||||||||||||||||||
| Total Options3 | 77,615 | |||||||||||||||||||||||
| DSBS4 | – | 29 Mar 2016 | – | – | 9,013 | 29 Mar 2019 | ||||||||||||||||||
| – | 27 Mar 2017 | – | – | 7,206 | 27 Mar 2020 | |||||||||||||||||||
| – | 26 Mar 2018 | – | – | 8,358 | 26 Mar 2021 | |||||||||||||||||||
| SIP5 | – | 1 Apr 2016 | – | – | 88 | 1 Apr 2019 | ||||||||||||||||||
| – | 9 May 2016 | – | – | 2 | 9 May 2019 | |||||||||||||||||||
| – | 28 Sep 2016 | – | – | 2 | 28 Sep 2019 | |||||||||||||||||||
| – | 3 Apr 2017 | – | – | 67 | 3 Apr 2020 | |||||||||||||||||||
| – | 4 May 2017 | – | – | 4 | 4 May 2020 | |||||||||||||||||||
| – | 28 Sep 2017 | – | – | 4 | 28 Sep 2020 | |||||||||||||||||||
| – | 8 Feb 2018 | – | – | 3 | 8 Feb 2021 | |||||||||||||||||||
| – | 3 Apr 2018 | – | – | 70 | 3 Apr 2021 | |||||||||||||||||||
| – | 9 May 2018 | – | – | 4 | 9 May 2021 | |||||||||||||||||||
| – | 8 Aug 2018 | – | – | 5 | 8 Aug 2021 | |||||||||||||||||||
| – | 15 Nov 2018 | – | – | 7 | 15 Nov 2021 | |||||||||||||||||||
| – | 7 Feb 2019 | – | – | 8 | 7 Feb 2022 | |||||||||||||||||||
| Total Restricted Share Awards6 |
|
24,841 | ||||||||||||||||||||||
| 314 | BAT Annual Report and Form 20-F 2018 | |
|
Strategic Report
|
Governance
|
Financial Statements
|
Other Information
|
| Number of Options Held |
Date of Grant/Award |
Options £ |
Market Price £ |
Number of Shares Awarded |
Exercisable (LTIP/Sharesave) Vesting (DSBS/SIP) |
|||||||||||||||||||
| Kingsley Wheaton | ||||||||||||||||||||||||
| LTIP1 | 25,242 | 12 May 2016 | 0.00 | 42.34 | – | 12 May 2019–11 May 2026 | ||||||||||||||||||
| 21,382 | 27 Mar 2017 | 0.00 | 52.11 | – | 27 Mar 2020–26 Mar 2027 | |||||||||||||||||||
| 32,100 | 26 Mar 2018 | 0.00 | 38.94 | – | 26 Mar 2021–25 Mar 2028 | |||||||||||||||||||
| Total Options3 | 78,724 | |||||||||||||||||||||||
| DSBS4 | – | 29 Mar 2016 | – | – | 9,066 | 29 Mar 2019 | ||||||||||||||||||
| – | 27 Mar 2017 | – | – | 7,270 | 27 Mar 2020 | |||||||||||||||||||
| – | 26 Mar 2018 | – | – | 8,358 | 26 Mar 2021 | |||||||||||||||||||
| SIP5 | – | 1 Apr 2016 | – | – | 88 | 1 Apr 2019 | ||||||||||||||||||
| – | 9 May 2016 | – | – | 11 | 9 May 2019 | |||||||||||||||||||
| – | 28 Sep 2016 | – | – | 5 | 28 Sep 2019 | |||||||||||||||||||
| – | 3 Apr 2017 | – | – | 67 | 3 Apr 2020 | |||||||||||||||||||
| – | 4 May 2017 | – | – | 12 | 4 May 2020 | |||||||||||||||||||
| – | 28 Sep 2017 | – | – | 8 | 28 Sep 2020 | |||||||||||||||||||
| – | 8 Feb 2018 | – | – | 6 | 8 Feb 2021 | |||||||||||||||||||
| – | 3 Apr 2018 | – | – | 70 | 3 Apr 2021 | |||||||||||||||||||
| – | 9 May 2018 | – | – | 8 | 9 May 2021 | |||||||||||||||||||
| – | 8 Aug 2018 | – | – | 8 | 8 Aug 2021 | |||||||||||||||||||
| – | 15 Nov 2018 | – | – | 13 | 15 Nov 2021 | |||||||||||||||||||
| – | 7 Feb 2019 | – | – | 13 | 7 Feb 2022 | |||||||||||||||||||
| Total Restricted Share Awards6 |
|
25,003 | ||||||||||||||||||||||
Notes:
Options
| 1. | LTIP: grants or awards of ordinary shares under the LTIP are for nil consideration. The number of options shown is the maximum that may be exercised subject to the completion of the applicable performance period and conditions under the rules of the LTIP. The number of options which may vest and become exercisable may be less than the number of ordinary shares shown in the table. |
| 2. | Sharesave Scheme: grants of options under the Sharesave Scheme are: (a) normally granted at a discount of 20% to the market price of ordinary shares at the time of invitation, as permitted by the rules of the Sharesave Scheme; and (b) are exercisable at the end of a three-year or five-year savings contract up to a monthly limit of £500. |
| 3. | Each of the LTIP and Sharesave Scheme contains provisions which permit the Board of Directors or a duly authorised committee of the Board of Directors to establish further plans for the benefit of overseas employees based on the relevant share plan but modified as necessary or desirable to take account of overseas tax, exchange control or applicable securities laws. Any new ordinary shares issued under such plans would not count towards any applicable plan limits under the LTIP or the Sharesave Scheme. |
Restricted Share Awards
| 4. | DSBS: awards of deferred shares are made through the DSBS and comprise free ordinary shares normally held in trust for three years and no further performance conditions apply in that period. The ordinary shares carry no rights to vote in that period. |
| 5. | SIP: the SIP is an all-employee plan which includes the SRS under which eligible employees receive an award of ordinary shares (Free Shares) in April of each year in which the plan operates in respect of performance in the previous financial year. The Free Shares are held in a UK-based trust from the date of the award for a minimum period of three years. During that time the SIP participant is entitled to receive dividends on those ordinary shares which are re-invested by such trust to buy further ordinary shares (Dividend Shares) on behalf of the SIP participant. The Dividend Shares are also held in the trust from the date of acquisition for a minimum period of three years. During the three-year holding periods, the SIP participant may not remove the Free Shares or the Dividend Shares from the trust, but may direct the trust to exercise its voting rights in accordance with his or her instructions. In addition to the Free Shares and Dividend Shares, participants in the SIP are also eligible to purchase additional ordinary shares from their pre-tax salary up to an annual statutory limit (Partnership Shares). The SIP also provides that BAT has the right to offer additional ordinary shares to a participant at no cost for each Partnership Share the participant purchases, at a ratio of two such ordinary shares for each Partnership Share purchased (Matching Shares). BAT does not currently provide any Matching Shares. |
| 6. | BAT has established similar plans to the SIP for non-UK employees and specific plans for employees in Germany, Belgium and the Netherlands. Each of these plans has been modified to take account of overseas tax, exchange control and applicable securities laws. |
| BAT Annual Report and Form 20-F 2018 | 315 | |
|
Shareholder information
|
The Company is incorporated under the name of British American Tobacco p.l.c. and is registered in England and Wales under registered number 3407696. Under the Companies Act 2006 (Companies Act), the Company’s objects are unrestricted. The following descriptions summarise certain provisions of the Company’s current Articles of Association (Articles) (as adopted by special resolution at the AGM on 28 April 2010), applicable English and Welsh law and the Companies Act. This summary is qualified in its entirety by reference to the Companies Act and the Articles, available on www.bat.com. The Articles may be altered or added to, or completely new articles may be adopted by, a special resolution of the shareholders of the Company, subject to the provisions of the Companies Act.
Additional reference should be made to the sections entitled ‘Description of BAT Ordinary Shares’ and ‘Comparison of Shareholder Rights – BAT’ in BAT’s Amendment No.3 to the Registration Statement on Form F-4 (Reg. No. 333-217939) filed with the SEC on 9 June 2017, which sections are incorporated by reference.
|
Share capital – structure
|
| Ordinary shares |
| – all of the Company’s ordinary shares are fully paid |
| – no further contribution of capital may be required by the Company from the holders of such shares |
| Alteration of share capital – the Company by ordinary resolution may: |
| – consolidate and divide all or any of its shares into shares of a larger amount than its existing shares |
| – divide or sub-divide any of its shares into shares of smaller amount than its existing shares |
| – determine that, as between the shares resulting from such a sub-division, any of them may have any preference or advantage as compared with the others |
| Alteration of share capital – the Company, subject to the provisions of the Companies Act, may: |
| – reduce its share capital, its capital redemption reserve and any share premium account in any way |
| – purchase its own shares, including redeemable shares, and may hold such shares as treasury shares or cancel them |
| Dividend rights |
| – shareholders may, by ordinary resolution, declare dividends but not in excess of the amount recommended by the Directors |
| – the Directors may pay interim dividends out of distributable profits |
| – no dividend shall be paid otherwise than out of the profits available for distribution as specified under the provisions of the Companies Act |
| – the Directors may, with the authority of an ordinary resolution of the shareholders, pay scrip dividends or satisfy the payment of a dividend by the distribution of specific assets |
| – unclaimed dividends for a period of 12 years may be forfeited and cease to be owed by the Company |
| – specific provisions enable the Directors to elect to pay dividends by bank or electronic transfer only |
|
|
|
Share capital – voting rights
|
| Voting at general meetings |
| – by a show of hands, unless a poll is demanded, and on a show of hands, every shareholder who is present in person at a general meeting has one vote regardless of the number of shares held by the shareholder |
| – every proxy appointed by a shareholder and present at a general meeting has one vote except that if the proxy has been duly appointed by more than one shareholder entitled to vote on the resolution and is instructed by one or more of those shareholders to vote for the resolution and by one or more others to vote against it, or is instructed by one or more of those shareholders to vote in one way and is given discretion as to how to vote by one or more others (and wishes to use that discretion to vote in the other way), he has one vote for and one vote against the resolution |
| – on a poll, every shareholder who is present in person or by proxy has one vote for every share held by the shareholder |
| – a shareholder (or his duly appointed proxy) entitled to more than one vote need not use all his votes or cast all the votes he uses in the same way |
| – a poll may be demanded by any of the following: (1) the Chairman of the meeting; (2) the Directors; (3) not less than five shareholders having the right to vote at the meeting; (4) a shareholder or shareholders representing not less than one-tenth of the total voting rights of all shareholders having the right to vote at the meeting (excluding any voting rights attached to treasury shares); or (5) a shareholder or shareholders holding shares which confer a right to vote on the resolution at the meeting being shares on which an aggregate sum has been paid up equal to not less than one-tenth of the total sum paid up on all shares conferring that right (excluding any voting rights attached to treasury shares) |
| Matters transacted at general meetings |
| – ordinary resolutions can include resolutions for the appointment, reappointment and removal of Directors, the receiving of the Annual Report, the declaration of final dividends, the appointment and reappointment of the external auditor, the authority for the Company to purchase its own shares and the grant of authority to allot shares |
| – an ordinary resolution is passed when a simple majority of the votes cast at a meeting at which there is a quorum vote in favour of the resolution |
| – special resolutions can include resolutions amending the Company’s Articles and resolutions relating to certain matters concerning a winding-up of the Company |
| – a special resolution is passed when not less than three-quarters of the votes cast at a meeting at which there is a quorum vote in favour of the resolution |
| – quorum for a meeting of the Company is a minimum of two shareholders present in person or by proxy or by a duly authorised representative(s) of a corporation which is a shareholder and entitled to vote |
| – convening a meeting: the Company may specify a time not more than 48 hours before the time of the meeting (excluding any part of a day that is not a working day) by which a person must be entered on the register of members in order to have the right to attend or vote at the meeting |
| 316 | BAT Annual Report and Form 20-F 2018 | |
|
Strategic Report
|
Governance
|
Financial Statements
|
Other Information
|
|
Share capital – pre-emptive rights and new issues of shares
|
| – holders of ordinary shares have no pre-emptive rights under the Articles – the ability of the Directors to cause the Company to issue shares, securities convertible into shares or rights to shares, otherwise than pursuant to an employee share scheme, is restricted |
| – under the Companies Act, the Directors of a company are, with certain exceptions, unable to allot any equity securities without express authorisation, which may be contained in a company’s articles of association or given by its shareholders in a general meeting, but which in either event cannot last for more than five years |
| – under the Companies Act, a company may also not allot shares for cash (otherwise than pursuant to an employee share scheme) without first making an offer to existing shareholders to allot such shares to them on the same or more favourable terms in proportion to their respective shareholdings, unless this requirement is waived by a special resolution of the shareholders |
|
Restrictions on transfers of shares
|
| – Directors can, in their absolute discretion, refuse to register the transfer of a share in certificated form which is not fully paid, provided that such a refusal would not prevent dealings in shares in certificated form which are not fully paid from taking place on a proper basis |
| – The Directors may also refuse to register a transfer of a share in certificated form (whether fully paid or not) unless the instrument of transfer: (1) is lodged, duly stamped, and is deposited at the registered office of the Company or such other place as the Directors may appoint and is accompanied by a certificate for the shares to which it relates and such other evidence as the Directors may reasonably require to show the right of the transferor to make the transfer; (2) is in respect of only one class of share; and (3) is in favour of not more than four transferees |
| – for uncertificated shares, transfers shall be registered only in accordance with the terms of the Uncertificated Securities Regulations 2001 so that Directors may refuse to register a transfer which would require shares to be held jointly by more than four persons |
| – if the Directors refuse to register a share transfer, they must give the transferee notice of this refusal as soon as practicable and in any event within two months of the instrument of transfer being lodged with the Company |
|
Repurchase of shares
|
| – subject to authorisation by shareholder resolution, the Company may purchase its own shares in accordance with the Companies Act |
| – any shares which have been bought back may be held as treasury shares or, if not so held, must be cancelled immediately upon completion of the purchase, thereby reducing the amount of the Company’s issued share capital |
|
Directors
|
| Appointment and retirement |
| – a Board of Directors of not fewer than five Directors and not subject to any maximum (unless otherwise determined by ordinary resolution of shareholders) |
| – Directors and the Company (by ordinary resolution) may appoint a person who is willing to act as a Director |
| – the Articles govern the minimum number of Directors who must be subject to retirement at each AGM and who may seek re-election |
| – notwithstanding the Articles, all of the Directors of the Company will be subject to re-election at the forthcoming AGM to be held on 25 April 2019 in accordance with the UK Corporate Governance Code |
| – fees for Non-Executive Directors and the Chairman are determined by the Directors but cannot currently exceed in aggregate an annual sum of £2,500,000, unless determined otherwise by ordinary resolution of the shareholders |
| – the remuneration of the Executive Directors is determined by the Remuneration Committee, which comprises independent Non-Executive Directors |
| Disclosure of interests |
| – specific provisions apply to the regulation and management of the disclosure of Directors’ interests in transactions and any conflicts of interest that may occur in such situations including those which may arise as a result of the Director’s office or employment or persons connected with him or her |
| Meetings and voting |
| – the quorum for a meeting of Directors is two Directors |
| – the Directors may delegate any of their powers to a person or a committee |
| – the Articles place a general prohibition on a Director voting at a Board meeting on any matter in which he has an interest other than by virtue of his interest in shares in the Company |
| – specific provisions apply to a Director’s ability to vote in relation to: the giving of guarantees; the provision of indemnities; insurance proposals; retirement benefits; and transactions or arrangements with a company in which the Director may have an interest |
| Borrowing powers |
| – the Directors may exercise all the powers of the Company to borrow money and to mortgage or charge its undertaking, property, assets (present and future) and uncalled capital |
| – the Directors may also issue debentures, debenture stock and other securities |
| BAT Annual Report and Form 20-F 2018 | 317 | |
|
Shareholder information
|
Renewal of authority for Company to purchase own shares
| Current authority to purchase shares |
– this authority (granted at the 2018 AGM) will expire at the 2019 AGM; the share buy-back programme was suspended with effect from 30 July 2014; and
– renewed authority to purchase the Company’s ordinary shares in order that the appropriate mechanisms are in place to enable the share buy-back programme to be reinstated at any time and authority would be exercised when, in the opinion of the Directors, the exercise of the authority would result in an increase in the Company’s earnings per share and would be in the interest of its shareholders generally. | |
| Proposed authority to purchase shares |
– the minimum price that may be paid for such shares is 25p, and the maximum price is the higher of: (i) an amount equal to 105% of the average of the middle-market prices shown in the quotation for an ordinary share as derived from the LSE Daily Official List for the five business days immediately preceding the day on which the ordinary share is contracted to be purchased and (ii) the higher of the price of the last independent trade and the highest current independent bid for an ordinary share in the Company on the trading venues where the market purchases by the Company will be carried out;
– in the absence of the necessary practical arrangements, the proposed authority has not been extended to enable BAT to purchase its own ordinary shares on the JSE in South Africa or the NYSE in the form of ADSs; and
– further details are set out in the Notice of Annual General Meeting 2019 which is made available to all shareholders and is published on www.bat.com. | |
| Treasury shares |
– in accordance with the Company’s policy, any repurchased shares are expected to be held as treasury shares; at 31 December 2018, the number of treasury shares was 162,645,590 (2017: 162,645,590); no dividends are paid on treasury shares; treasury shares have no voting rights; and treasury shares may be resold at a later date.
|
Purchases of equity securities by the issuer and affiliated purchasers
At the AGM on 25 April 2018, authorisation was given to the Company to repurchase up to 229.3 million ordinary shares for the period until the next AGM in 2019. This authorisation is renewed annually at the AGM. No ordinary shares were repurchased by the Company during 2018. The following table provides details of ordinary share purchases made by the trustees of employee share ownership plans (ESOPs) and other purchases of ordinary shares and ADSs made to satisfy the commitments to deliver shares under certain employee share-based payment plans.
|
Total number of
|
Average price
|
Total number of
|
Average price ADS USD
|
Total number of part of a publicly
|
Maximum number of yet be purchased as
|
|||||||||||||||||||
| 2018 | ||||||||||||||||||||||||
| 3 January | 2,006 | 49.11000 | – | – | – | – | ||||||||||||||||||
| 7 February | 2,218 | 45.47500 | – | – | – | – | ||||||||||||||||||
| 8 February | – | – | 50,000 | 62.99440 | – | – | ||||||||||||||||||
| 7 March | 2,405 | 42.22000 | – | – | – | – | ||||||||||||||||||
| 22 March | – | – | 100,000 | 54.61970 | – | – | ||||||||||||||||||
| 28 March–5 April | 2,600,000 | 41.04001 | – | – | – | – | ||||||||||||||||||
| 4 April | 134,718 | 41.91953 | – | – | – | – | ||||||||||||||||||
| 4 April | 2,479 | 42.03500 | – | – | – | – | ||||||||||||||||||
| 5 April | 18,233 | 42.67502 | – | – | – | – | ||||||||||||||||||
| 5 April | 1,132 | * | 41.50000 | – | – | – | – | |||||||||||||||||
| 17 April | 84,157 | 40.12680 | – | – | – | – | ||||||||||||||||||
| 2 May | 2,478 | 39.37500 | – | – | – | – | ||||||||||||||||||
| 6 June | 2,911 | 37.13000 | – | – | – | – | ||||||||||||||||||
| 4 July | 2,438 | 39.51500 | – | – | – | – | ||||||||||||||||||
| 1 August | 2,421 | 41.87000 | – | – | – | – | ||||||||||||||||||
| 28 August | – | – | 120,000 | 50.27640 | – | – | ||||||||||||||||||
| 5 September | 2,676 | 37.10551 | – | – | – | – | ||||||||||||||||||
| 3 October | 2,731 | 35.81500 | – | – | – | – | ||||||||||||||||||
| 7 November | 2,863 | 34.20000 | – | – | – | – | ||||||||||||||||||
| 5 December | 3,703 | 27.14500 | – | – | – | – | ||||||||||||||||||
| 2,869,569 | 39.89746 | 270,000 | 55.96350 | – | – | |||||||||||||||||||
Notes:
| 1. | There was no publicly announced plan for BAT to purchase its own ordinary shares or ADSs during the year ended 31 December 2018. |
| 2. | All the purchases of ordinary shares and/or ADSs were made on open market transactions except for the purchase marked * which was made by way of an arm’s-length private treaty arrangement between BAT and the relevant trustee. |
| 318 | BAT Annual Report and Form 20-F 2018 | |
|
Strategic Report
|
Governance
|
Financial Statements
|
Other Information
|
|
The British American Tobacco Group Employee Trust (BATGET)
| ||||||||
| Function | – used to satisfy the vesting and exercise of awards of ordinary shares under the BAT Deferred Share Bonus Scheme and Long-Term Incentive Plans; and
– a committee of senior management reporting to the Board’s Share Schemes Committee monitors the number of ordinary shares held in BATGET to satisfy outstanding awards. | |||||||
| Funding | – funded by interest-free loan facilities from the Company totalling £1 billion;
– this enables BATGET to facilitate the purchase of ordinary shares to satisfy the future vesting or exercise of options and awards;
– loan to BATGET: £681.43 million at 31 December 2018 (2017: £562.4 million);
– the loan is either repaid from the proceeds of the exercise of options or, in the case of ordinary shares acquired by BATGET to satisfy the vesting and exercise of awards, the Company will subsequently waive the loan provided over the life of the awards; and
– if any options lapse, ordinary shares may be sold by BATGET to cover the loan repayment. | |||||||
| Ordinary shares held in BATGET |
1 Jan 2018 | 31 Dec 2018 | ||||||
| Number of ordinary shares
|
6,750,597 | 7,312,975 | ||||||
| Market value of ordinary shares
|
£338.7m | £182.8m | ||||||
| % of issued share capital of Company | 0.27 | 0.30 | ||||||
| Dividends paid in 2018 | – BATGET currently waives dividends on the ordinary shares held by it;
– second interim dividend 2017: £2.9 million in February 2018; and
– quarterly interim dividends 2018: £10.54 million across 2018. |
|||||||
| Voting rights | – the trustee does not exercise any voting rights while ordinary shares are held in BATGET; and
– share scheme participants may exercise the voting rights attaching to those ordinary shares once the ordinary shares have been transferred out of BATGET. | |||||||
Notes:
| 1. | Company share – based payment arrangements: details of the material equity share-based and cash-settled share-based arrangements are set out in note 25 in the Notes on the accounts. |
| 2. | The values of ordinary shares shown are based on the closing mid-market share price on 31 December 2018: 2,500p (29 December 2017 (being the last trading day of 2017): 5,018p). |
| 3. | In addition to the ordinary shares held in BATGET, the trust held the following American Depositary Shares (ADSs) which relate to the vesting and exercise of certain employee stock awards formerly granted by RAI over RAI common stock and which were assumed by BAT to be satisfied by the delivery of ADSs following the merger with RAI on 25 July 2017. |
| 1 Jan 2018 | 31 Dec 2018 | |||||||
| Number of ADSs | 19,908 |
|
75,267
|
| ||||
| Market value of ADSs(a) | US$1.3m |
|
US$2.4m
|
| ||||
| % of issued share capital | 0.001 | 0.003 | ||||||
Note:
| (a) | The value of the ADSs shown is based on the closing price of ADSs on 31 December 2018 of US$31.86. |
| BAT Annual Report and Form 20-F 2018 | 319 | |
|
Shareholder information
|
Fees and charges payable by ADS holders
Citibank, N.A. (Citibank) was appointed as the depositary bank (the Depositary) for BAT’s ADS programme pursuant to the Amended and Restated Deposit Agreement dated 1 December 2008 and amended as of 14 February 2017 and 14 June 2017 between BAT, the Depositary and the owners and holders of ADSs (the Deposit Agreement). Citibank was reappointed as the Depositary pursuant to the Second Amended and Restated Deposit Agreement dated 26 November 2018 (the Restated Deposit Agreement).
The Restated Deposit Agreement provides that ADS holders may be required to pay various fees to the Depositary, and the Depositary may refuse to provide any service for which a fee is assessed until the applicable fee has been paid.
|
Service
|
Fees
| |
| Issuance of ADSs upon deposit of ordinary shares (excluding issuances as a result of distributions of shares described below)
|
Up to US$0.05 per ADS issued1 | |
| Cancellation of ADSs
|
Up to US$0.05 per ADS surrendered1 | |
| Distribution of cash dividends or other cash distributions (i.e. sale of rights and other entitlements)
|
Up to US$0.05 per ADS held2 | |
| Distribution of ADSs pursuant to: (1) stock dividends or other free stock distributions; or (2) exercise of rights to purchase additional BAT ADSs
|
Up to US$0.05 per ADS held | |
| Distribution of securities other than ADSs or rights to purchase additional ADSs (i.e. spinoff shares)
|
Up to US$0.05 per ADS held | |
| Depositary bank services
|
Up to US$0.05 per ADS held | |
Notes:
| 1. | Under the terms of a separate agreement between BAT and the Depositary, the Depositary has agreed to waive the fees that would otherwise be payable in connection with the issuance of ADSs upon deposit of ordinary shares and the cancellation of ADSs and corresponding withdrawal of ordinary shares, in each case by BAT or any of its affiliates, officers, directors or employees. The terms of this separate agreement may be amended at any time by BAT and the Depositary. |
| 2. | While under the Restated Deposit Agreement cash dividends paid in respect of ADSs are subject to a fee of up to US$0.05 per ADS payable to the Depositary, under the terms of the separate agreement between BAT and the Depositary referred to above, such dividends are instead subject to a fee of up to US$0.02 per ADS per year (a fee of US$0.005 per dividend based on the distribution of four quarterly cash dividends per year). Under the separate agreement, this dividend fee may not be varied by the Depositary without the consent of BAT. |
Contact details for Citibank Shareholder Services are on page 321.
In addition, ADS holders may be required under the Restated Deposit Agreement to pay the Depositary: (a) taxes (including applicable interest and penalties) and other governmental charges; (b) registration fees; (c) certain cable, telex and facsimile transmission and delivery expenses; (d) the expenses and charges incurred by the Depositary in the conversion of foreign currency; (e) such fees and expenses as are incurred by the Depositary in connection with compliance with applicable exchange control regulations and other regulatory requirements; and (f) the fees and expenses incurred by the Depositary, the custodian or any nominee in connection with the servicing or delivery of deposited securities. The Depositary may: (a) withhold dividends or other distributions or sell for the account of any ADS holder any or all of the shares underlying the ADSs in order to satisfy any tax or governmental charge; and (b) deduct from any cash distribution the applicable fees and charges of, and expenses incurred by, the Depositary and any taxes, duties or other governmental charges on account.
Fees and payments made by the Depositary to BAT
Under the terms of the contractual arrangements set out in the separate agreement between BAT and the Depositary referred to above, BAT received a total of approximately US$2.9 million from the Depositary, comprising fees charged in respect of dividends and a fixed contribution to BAT’s ADS programme administration costs for the year ended 31 December 2018.
In 2018, these programme administration costs principally included those associated with AGM proxy mailings, exchange listing and regulatory fees, foreign private issuer analysis, legal fees, share registration fees and other expenses incurred by BAT in relation to the ADS programme.
Under these contractual arrangements, the Depositary has also agreed to waive certain standard fees associated with the administration of the ADS programme.
| 320 | BAT Annual Report and Form 20-F 2018 | |
|
Strategic Report
|
Governance
|
Financial Statements
|
Other Information
|
Shareholding administration and services
| BAT Annual Report and Form 20-F 2018 | 321 | |
|
Shareholder information
|
The following documents are filed in the SEC EDGAR system, as part of this Annual Report on Form 20-F, and can be viewed on the SEC’s website, www.sec.gov:
| 322 | BAT Annual Report and Form 20-F 2018 | |
|
Strategic Report
|
Governance
|
Financial Statements
|
Other Information
|
Notes:
| 1. | Incorporated by reference to Exhibit 3.1 to BAT’s Registration Statement on Form F-4 (Reg. No. 333-217939) filed on 12 May 2017. |
| 2. | Incorporated by reference to Exhibit (a)(i) to BAT’s Post-Effective Amendment to Registration Statement on Form F-6 (Reg. No. 333-221983) filed on 23 October 2018. |
| 3. | Incorporated by reference to Exhibit 2.4 to BAT’s Annual Report on Form 20-F for the year ended 31 December 2017 filed on 15 March 2018. |
| 4. | Incorporated by reference to Exhibit 4.2 to BAT’s Registration Statement on Form F-4 (Reg. No. 333-227658) filed on 2 October 2018. |
| 5. | Incorporated by reference to Exhibit 4.4 to BAT’s Registration Statement on Form F-4 (Reg. No. 333-227658) filed on 2 October 2018. |
| 6. | Incorporated by reference to BAT’s Amendment No. 4 to Schedule 13D filed on 17 January 2017. |
| 7. | Incorporated by reference to Exhibit 4.5 to BAT’s Registration Statement on Form F-4 (Reg. No. 333-217939) filed on 12 May 2017. |
| 8. | Incorporated by reference to Exhibit 10.6 to BAT’s Registration Statement on Form F-4 (Reg. No. 333-217939) filed on 12 May 2017. |
| 9. | Incorporated by reference to Exhibit 10.8 to BAT’s Registration Statement on Form F-4 (Reg. No. 333-217939) filed on 12 May 2017. |
| 10. | Incorporated by reference to Exhibit 10.43 to Reynolds American Inc.’s Annual Report on Form 10-K for the fiscal year ended 31 December 2007 filed on 27 February 2008. |
| 11. | Incorporated by reference to Exhibit 10.9 to BAT’s Registration Statement on Form F-4 (Reg. No. 333-217939) filed on 12 May 2017. |
| 12. | Incorporated by reference to Exhibit 10.10 to BAT’s Registration Statement on Form F-4 (Reg. No. 333-217939) filed on 12 May 2017. |
| 13. | Incorporated by reference to Exhibit 10.11 to BAT’s Registration Statement on Form F-4 (Reg. No. 333-217939) filed on 12 May 2017. |
| 14. | Incorporated by reference to Exhibit 4 to R.J. Reynolds Tobacco Holdings, Inc.’s Form 8-K dated 24 November 1998. |
| 15. | Incorporated by reference to Exhibit 2 to R.J. Reynolds Tobacco Holdings, Inc.’s Form 8-K dated 5 September 1997. |
| 16. | Incorporated by reference to Exhibit 2 to R.J. Reynolds Tobacco Holdings, Inc.’s Form 8-K dated 27 January 1998. |
| 17. | Incorporated by reference to Exhibit 99.1 to R.J. Reynolds Tobacco Holdings, Inc.’s Quarterly Report on Form 10-Q for the quarter ended 30 March 1998 filed on 15 May 1998. |
| 18. | Incorporated by reference to Exhibit 99.2 to R.J. Reynolds Tobacco Holdings, Inc.’s Quarterly Report on Form 10-Q for the quarter ended 30 March 1998 filed on 15 May 1998. |
| 19. | Incorporated by reference to Exhibit 99.3 to R.J. Reynolds Tobacco Holdings, Inc.’s Quarterly Report on Form 10-Q for the quarter ended 30 March 1998 filed on 15 May 1998. |
| 20. | Incorporated by reference to Exhibit 99.2 to R.J. Reynolds Tobacco Holdings, Inc.’s Quarterly Report on Form 10-Q for the quarter ended 30 June 1998 filed on 14 August 1998. |
| 21. | Incorporated by reference to Exhibit 99.4 to R.J. Reynolds Tobacco Holdings, Inc.’s Quarterly Report on Form 10-Q for the quarter ended 30 June 1998 filed on 14 August 1998. |
| 22. | Incorporated by reference to Exhibit 99.1 to R.J. Reynolds Tobacco Holdings, Inc.’s Quarterly Report on Form 10-Q for the quarter ended 30 September 1998 filed on 12 November 1998. |
| 23. | Incorporated by reference to Exhibit 10.1 to Reynolds American Inc.’s Form 8-K dated 12 March 2013. |
| 24. | Incorporated by reference to Exhibit 11 to BAT’s Annual Report on Form 20-F for the year ended 31 December 2017 filed on 15 March 2018. |
| 25. | These certifications are furnished only and are not filed as part of BAT’s Annual Report on Form 20-F for the year ended 31 December 2018. |
Certain instruments which define the rights of holders of long-term debt issued by BAT and its subsidiaries are not being filed because the total amount of securities authorised under each such instrument does not exceed 10% of the total consolidated assets of BAT and its subsidiaries. BAT agrees to furnish copies of any or all such instruments to the SEC on request.
| BAT Annual Report and Form 20-F 2018 | 323 | |
|
|
| 324 | BAT Annual Report and Form 20-F 2018 | |
|
Strategic Report
|
Governance
|
Financial Statements
|
Other Information
|
| Item
|
Form 20-F caption
|
Location in this document
| ||||
| 1 | Identity of Directors, Senior Management and Advisers | N/A | ||||
| 2 | Offer Statistics and Expected Timetable | N/A | ||||
| 3 | Key Information | |||||
| A | Selected financial data | 257 | ||||
| B | Capitalisation and indebtedness | N/A | ||||
| C | Reasons for the offer and use of proceeds | N/A | ||||
| D | Risk factors | 48–52, 270-284 | ||||
| 4 | Information on the Company | |||||
| A | History and development of the company | 22-23, 39, 43, 142-143,154-155, 186-187, 254, 267, 321, inside back cover | ||||
| B | Business overview | 1-21, 22-23, 28, 30, 32-38, 43-47, 59, 254, 285-288, 290, 291, 294 | ||||
| C | Organisational structure | 236-245, 254 | ||||
| D | Property, plants and equipment | 22-23, 153-154, 292 | ||||
| 4a | Unresolved staff comments | N/A | ||||
| 5 | Operating and Financial Review and Prospects | |||||
| A | Operating results | 10-12, 14-15, 20-23, 33-47, 51, 165-168, 181-185, 258-266, 267, 285-288 | ||||
| B | Liquidity and capital resources | 39-42, 52, 127, 165-168, 177-179, 181-185, 267-268, 281 | ||||
| C | Research and development, patent and licences | 4, 19, 28, 35 | ||||
| D | Trend information | 1-9, 12-15, 20-21, 33-52, 270-284, 285-288 | ||||
| E | Off-balance sheet arrangements | 41, 211, 268 | ||||
| F | Tabular disclosure of contractual commitments | 268 | ||||
| G | Safe harbour | 296 | ||||
| 6 | Directors, Senior Management and Employees | |||||
| A | Directors and senior management | 54-56, 60, 72, 255-256, Material and Other Subsequent Events page» | ||||
| B | Compensation | 73-113, 155-161, 190-191, 305-315 | ||||
| C | Board practices | 54-57, 64-69, 72, 85-87, 106, 112-113, 255-256, 317 | ||||
| D | Employees | 189, 269 | ||||
| E | Share ownership | 26, 81, 88, 101, 187-189, 305-315 | ||||
| 7 | Major Shareholders and Related Party Transactions | |||||
| A | Major shareholders | 304-305, Material and Other Subsequent Events page» | ||||
| B | Related party transactions | 190-191 | ||||
| C | Interests of experts and counsel | N/A | ||||
| 8 | Financial Information | |||||
| A | Consolidated statements and other financial information | 121-235, 298-299 | ||||
| B | Significant changes | Material and Other Subsequent Events page» | ||||
| 9 | The Offer and Listing | |||||
| A | Offer and listing details | 297 | ||||
| B | Plan of distribution | N/A | ||||
| C | Markets | 297 | ||||
| D | Selling shareholders | N/A | ||||
| E | Dilution | N/A | ||||
| F | Expenses of the issue | N/A | ||||
| 10 | Additional Information | |||||
| A | Share capital | N/A | ||||
| B | Memorandum and Articles of Association | 89, 316-317 | ||||
| C | Material contracts | 199-201, 290-291 | ||||
| D | Exchange controls | 298 | ||||
| E | Taxation | 300-303 | ||||
| F | Dividends and paying agents | N/A | ||||
| G | Statements by experts | N/A | ||||
| H | Documents on display | 321 | ||||
| I | Subsidiary information | N/A | ||||
| 11 | Quantitative and Qualitative Disclosures about Market Risk | 181-185 | ||||
| BAT Annual Report and Form 20-F 2018 | 325 | |
| Other Information
|
Cross-reference to Form 20-F continued
|
Item
|
Form 20-F caption
|
Location in this document
| ||||
| 12 | Description of Securities Other Than Equity Securities | |||||
| A | Debt securities | N/A | ||||
| B | Warrants and rights | N/A | ||||
| C | Other securities | N/A | ||||
| D | American Depositary Shares | 320 | ||||
| 13 | Defaults, Dividend Arrearages and Delinquencies | N/A | ||||
| 14 | Material Modifications to the Rights of Security Holders and Use of Proceeds | 289 | ||||
| 15 | Controls and Procedures | 294 | ||||
| 16A | Audit Committee Financial Expert | 64, 293 | ||||
| 16B | Code of Ethics | 70, 293 | ||||
| 16C | Principal Accountant Fees and Services | 66-67, 138-139 | ||||
| 16D | Exemptions from the Listing Standards for Audit Committees | N/A | ||||
| 16E | Purchases of Equity Securities by the Issuer and Affiliated Purchasers | 318 | ||||
| 16F | Change in Registrant’s Certifying Accountant | N/A | ||||
| 16G | Corporate Governance | 293 | ||||
| 16H | Mine Safety Disclosure | N/A | ||||
| 17 | Financial Statements | N/A | ||||
| 18 | Financial Statements | 121-235 | ||||
| 19 | Exhibits | 322-323 | ||||
| 326 | BAT Annual Report and Form 20-F 2018 | |

Go online Explore the story of our year Featuring downloadable versions of this Report, Along with our Sustainability Summary Report And other content – all accessible on desktop, Tablet and mobile. www.bat.com/reporting www.bat.com @BATPress Flickr.com/welcometobat Youtube.com/welcometobat
Material and Other Subsequent Events »
Subsequent to the approval of the Annual Report 2018 by the Board of the Company on 27 February 2019 and the date of British American Tobacco p.l.c.’s consolidated financial statements for the years ended 31 December 2018, 2017 and 2016, the material and other subsequent events set out below have been notified by the Company.
Quebec Class Actions: Quebec Court of Appeal Judgment
On 1 March 2019, the judgment in the two Quebec Class Action lawsuits against a Group subsidiary, Imperial Tobacco Canada Limited (ITCAN), and two other Canadian tobacco companies was publicly issued by the Quebec Court of Appeal in Montreal. The Court of Appeal upheld the Superior Court’s decision of May 2015, whilst reducing the overall judgment against the defendants from a maximum of CAD$15.6 billion (approximately £8.9 billion) to a maximum of CAD$13.6 billion (approximately £7.7 billion), and included the previously stated requirements for the defendants to deposit approximately CAD$1.1 billion (approximately £0.6 billion) into an escrow account. See note 28 in the Notes on the Accounts for further information on the Quebec class actions.
British American Tobacco p.l.c. was not a party to the Quebec class actions proceedings and is not a party to the judgment.
On 12 March 2019, ITCAN informed the Company that it had obtained an Initial Order from the Ontario Superior Court of Justice granting it protection under the Companies’ Creditors Arrangement Act (“CCAA”). This has the effect of staying all current tobacco litigation in Canada against ITCAN and other BAT Group companies.
Across Canada, other tobacco plaintiffs and provincial governments are collectively seeking significant damages which substantially exceed ITCAN’s total assets. In seeking protection under the CCAA, ITCAN will look to resolve not only the Quebec case but also all other tobacco litigation in Canada under an efficient and court supervised process, while continuing to trade in the normal course.
Accounting treatment
As part of the 2015 judgment, ITCAN was required to place CAD$758 million (approximately £436 million) in escrow – the final payment of which was made in 2017. This deposit was held as an asset on the Group’s balance sheet at the 31 December 2018 year-end. The Group also disclosed a contingent liability in relation to the Quebec class actions in note 28 in the Notes on the Accounts.
Following the 1 March 2019 judgment, the Group will recognise a charge in the income statement in 2019 of approximately £436 million, equivalent to the value of the deposit recognised on the Group’s balance sheet and which the Group considers, based upon the judgment, reflects the most reliable estimate of any future loss. In accordance with BAT’s accounting policies, this will be treated as an adjusting expense.
The Group will continue to consolidate the results of ITCAN as the CCAA process progresses, whilst the requirements of IFRS 10 Consolidated Financial Statements are met.
As at 31 December 2018, the Group held £2.3 billion of goodwill relating to ITCAN on the balance sheet, which will continue to be reviewed on a regular basis in line with IAS 36 Impairment of Assets. The value of goodwill represents approximately 1.5% of the Group’s total assets. Any future impairment, arising as the CCAA process progresses, would result in a non-cash charge to the income statement.
Board of Directors
Holly Keller Koeppel
Non-Executive Director
Ms Keller Koeppel was appointed as a Director of Arch Coal, Inc. on 1 March 2019.
Significant Shareholding Disclosure
The Capital Group Companies, Inc. notified the Company on 11 March 2019 that its interest had increased above 11% to 253,390,697 ordinary shares on 7 March 2019.
SIGNATURE
The registrant hereby certifies that it meets all of the requirements for filing on Form 20-F and that it has duly caused and authorized the undersigned to sign this annual report on its behalf.
Date: 15 March 2019
British American Tobacco p.l.c.
(Registrant)
| By: | /s/ Paul McCrory | |
| Paul McCrory Company Secretary |

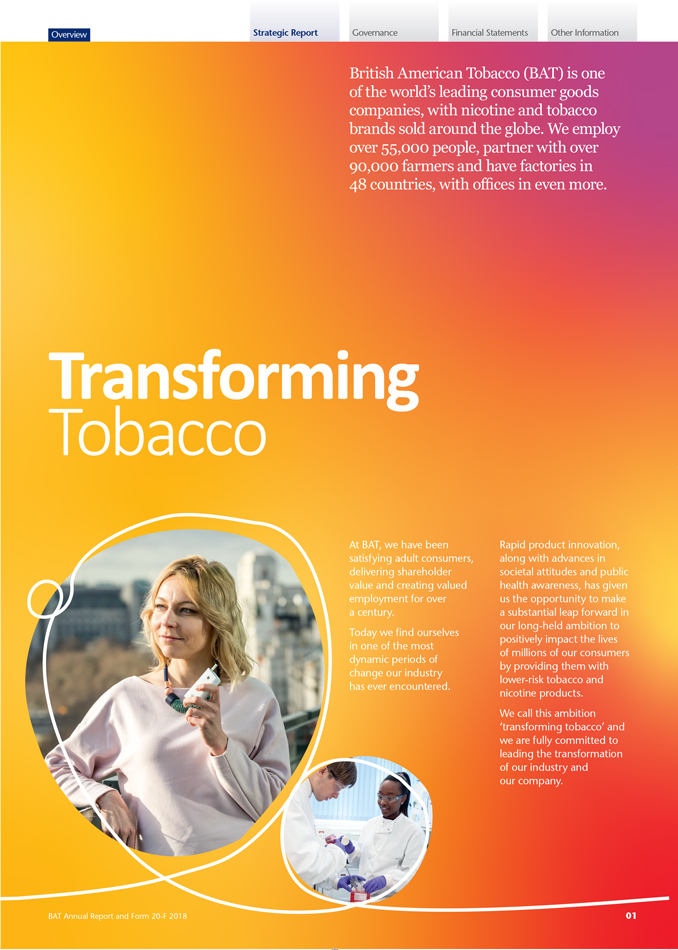


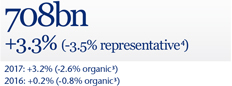

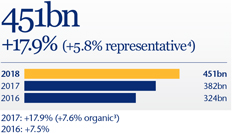
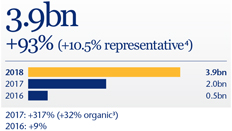
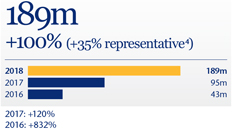
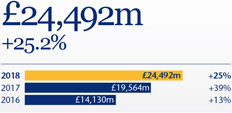
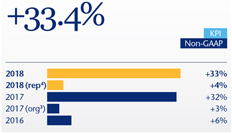
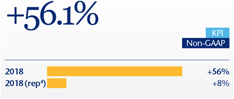


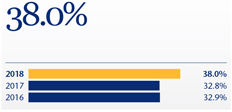
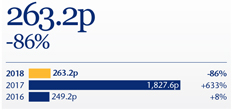
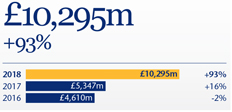
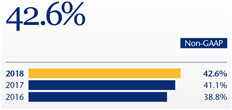
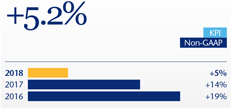

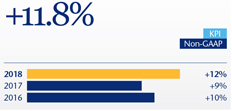
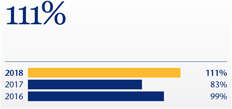
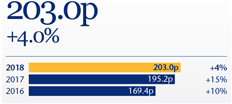


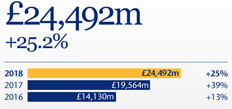

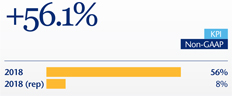
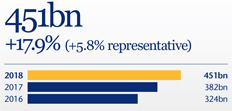

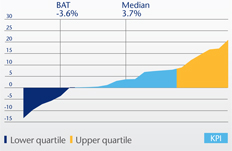

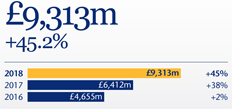
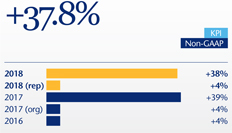
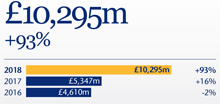
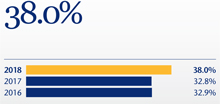
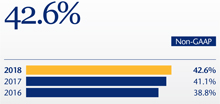


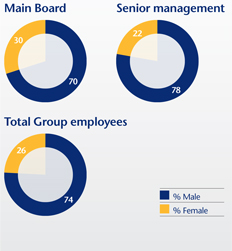
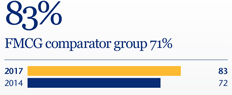


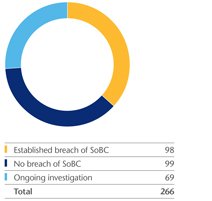
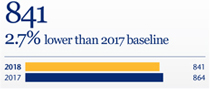
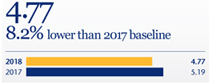
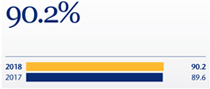


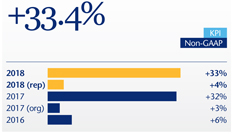
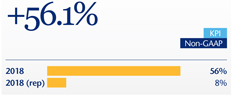

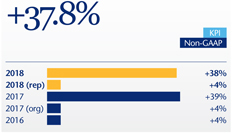
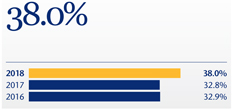
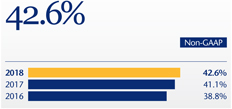
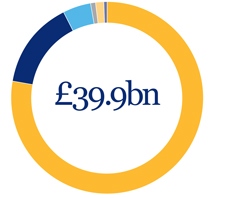
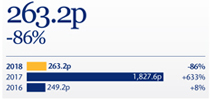
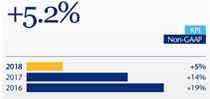
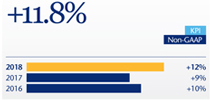

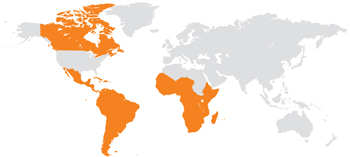
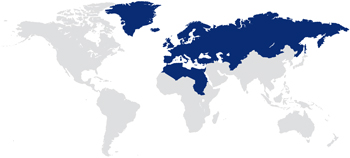


 Growth
 Productivity
 Sustainability
 Winning organisation