BAT Building the Enterprise of the Future Annual Report and Form 20-F 2020 BAT A BETTER TOMORROW
UNITED STATES
SECURITIES AND EXCHANGE COMMISSION
WASHINGTON, D.C. 20549
FORM 20-F
(Mark One)
| ☐ | REGISTRATION STATEMENT PURSUANT TO SECTION 12(b) OR (g) OF THE SECURITIES EXCHANGE ACT OF 1934 |
OR
| ☒ | ANNUAL REPORT PURSUANT TO SECTION 13 OR 15(d) OF THE SECURITIES EXCHANGE ACT OF 1934 |
For the fiscal year ended December 31, 2020
OR
| ☐ | TRANSITION REPORT PURSUANT TO SECTION 13 OR 15(d) OF THE SECURITIES EXCHANGE ACT OF 1934 |
OR
| ☐ | SHELL COMPANY REPORT PURSUANT TO SECTION 13 OR 15(d) OF THE SECURITIES EXCHANGE ACT OF 1934 |
Date of event requiring this shell company report
For the transition period from to
Commission file number 001-38159
British American Tobacco p.l.c.
(Exact name of Registrant as specified in its charter)
(Translation of Registrant’s name into English)
England and Wales
(Jurisdiction of incorporation or organization)
Globe House, 4 Temple Place, London WC2R 2PG, United Kingdom
(Address of principal executive offices)
Paul McCrory, Company Secretary Tel: +44 (0)20 7845 1000
Fax: +44 (0)20 7240 0555
Globe House, 4 Temple Place, London WC2R 2PG, United Kingdom
(Name, Telephone, E-mail and/or Facsimile number and Address of Company Contact Person)
Securities registered or to be registered pursuant to Section 12(b) of the Act.
| Title of each class |
Trading symbol(s) |
Name of each exchange on which registered | ||
| American Depositary Shares (evidenced by American Depositary Receipts) | BTI | New York Stock Exchange | ||
| each representing one ordinary share | ||||
| Ordinary shares, nominal value 25 pence per share | BTI | New York Stock Exchange* | ||
| 1.668% Notes due 2026 | BTI26A | New York Stock Exchange | ||
| 2.259% Notes due 2028 | BTI28 | New York Stock Exchange | ||
| 2.726% Notes due 2031 | BTI31 | New York Stock Exchange | ||
| 3.734% Notes due 2040 | BTI40 | New York Stock Exchange | ||
| 3.984% Notes due 2050 | BTI50A | New York Stock Exchange | ||
| 4.700% Notes due 2027 | BTI27A | New York Stock Exchange | ||
| 4.906% Notes due 2030 | BTI30 | New York Stock Exchange | ||
| 5.282% Notes due 2050 | BTI50 | New York Stock Exchange | ||
| 2.789% Notes due 2024 | BTI24 | New York Stock Exchange | ||
| 3.215% Notes due 2026 | BTI26 | New York Stock Exchange | ||
| 3.462% Notes due 2029 | BTI29 | New York Stock Exchange | ||
| 4.758% Notes due 2049 | BTI49 | New York Stock Exchange | ||
| 2.764% Notes due 2022 | BTI22 | New York Stock Exchange | ||
| 3.222% Notes due 2024 | BTI24A | New York Stock Exchange | ||
| 3.557% Notes due 2027 | BTI27 | New York Stock Exchange | ||
| 4.390% Notes due 2037 | BTI37 | New York Stock Exchange | ||
| 4.540% Notes due 2047 | BTI47 | New York Stock Exchange | ||
| Floating Rate Notes due 2022 | BTI22A | New York Stock Exchange |
| * | Application made for registration purposes only, not for trading, and only in connection with the registration of the American Depositary Shares pursuant to the requirements of the Securities and Exchange Commission. |
Securities registered or to be registered pursuant to Section 12(g) of the Act.
None
Securities for which there is a reporting obligation pursuant to Section 15(d) of the Act.
None
Indicate the number of outstanding shares of each of the issuer’s classes of capital or common stock as of the close of the period covered by the Annual Report.
2,456,591,597 ordinary shares
Indicate by check mark if the registrant is a well-known seasoned issuer, as defined in Rule 405 of the Securities Act. ☒ Yes ☐ No
If this report is an annual or transition report, indicate by check mark if the registrant is not required to file reports pursuant to Section 13 or 15(d) of the Securities Exchange Act of 1934. ☐ Yes ☒ No
Note – Checking the box above will not relieve any registrant required to file reports pursuant to Section 13 or 15(d) of the Securities Exchange Act of 1934 from their obligations under those Sections.
Indicate by check mark whether the registrant (1) has filed all reports required to be filed by Section 13 or 15(d) of the Securities Exchange Act of 1934 during the preceding 12 months (or for such shorter period that the registrant was required to file such reports), and (2) has been subject to such filing requirements for the past 90 days. ☒ Yes ☐ No
Indicate by check mark whether the registrant has submitted electronically every Interactive Data File required to be submitted pursuant to Rule 405 of Regulation S-T (§232.405 of this chapter) during the preceding 12 months (or for such shorter period that the registrant was required to submit such files). ☒ Yes ☐ No
Indicate by check mark whether the registrant is a large accelerated filer, an accelerated filer, a non-accelerated filer, or an emerging growth company. See definition of “large accelerated filer,” “accelerated filer,” and “emerging growth company” in Rule 12b-2 of the Exchange Act.
| Large accelerated filer | ☒ | Accelerated filer | ☐ | |||
| Non-accelerated filer | ☐ | Emerging growth company | ☐ | |||
If an emerging growth company that prepares its financial statements in accordance with US GAAP, indicate
by check mark if the registrant has elected not to use the extended transition period for complying with any new or revised financial accounting standards† provided pursuant to Section 13
(a) of the Exchange Act. ☐
| † | The term “new or revised financial accounting standard” refers to any update issued by the Financial Accounting Standards Board to its Accounting Standards Codification after April 5, 2012. |
Indicate by check mark whether the registrant has filed a report on and attestation to its management’s assessment of the effectiveness of its internal control over financial reporting under Section 404(b) of the Sarbanes-Oxley Act (15 U.S.C. 7262(b)) by the registered public accounting firm that prepared or issued its audit report. ☒
Indicate by check mark which basis of accounting the registrant has used to prepare the financial statements included in this filing:
| US GAAP ☐ | International Financial Reporting Standards as issued by the International Accounting Standards Board ☒ | Other ☐ |
If “Other” has been checked in response to the previous question, indicate by check mark which financial statement item the registrant has elected to follow. ☐ Item 17 ☐ Item 18
If this is an annual report, indicate by check mark whether the registrant is a shell company (as defined in Rule 12b-2 of the Exchange Act). ☐ Yes ☒ No
For the forward-looking non-GAAP information contained in this Annual Report on Form 20-F, no comparable GAAP or IFRS information is available on a forward-looking basis, as the effect of adjusting items and rates of exchange, which could be significant, may be highly variable and cannot be estimated with reasonable certainty. In addition, other components of the Group’s results, including the revenue generated from combustibles, cannot be estimated with reasonable certainty due to, among other things, the impact of foreign exchange, pricing and volume, which could be significant, being highly variable. As such, no reconciliations for this forward-looking non-GAAP information are available and we are unable to: present revenue before New Category revenue.
BAT Building the Enterprise of the Future Annual Report and Form 20-F 2020 BAT A BETTER TOMORROW
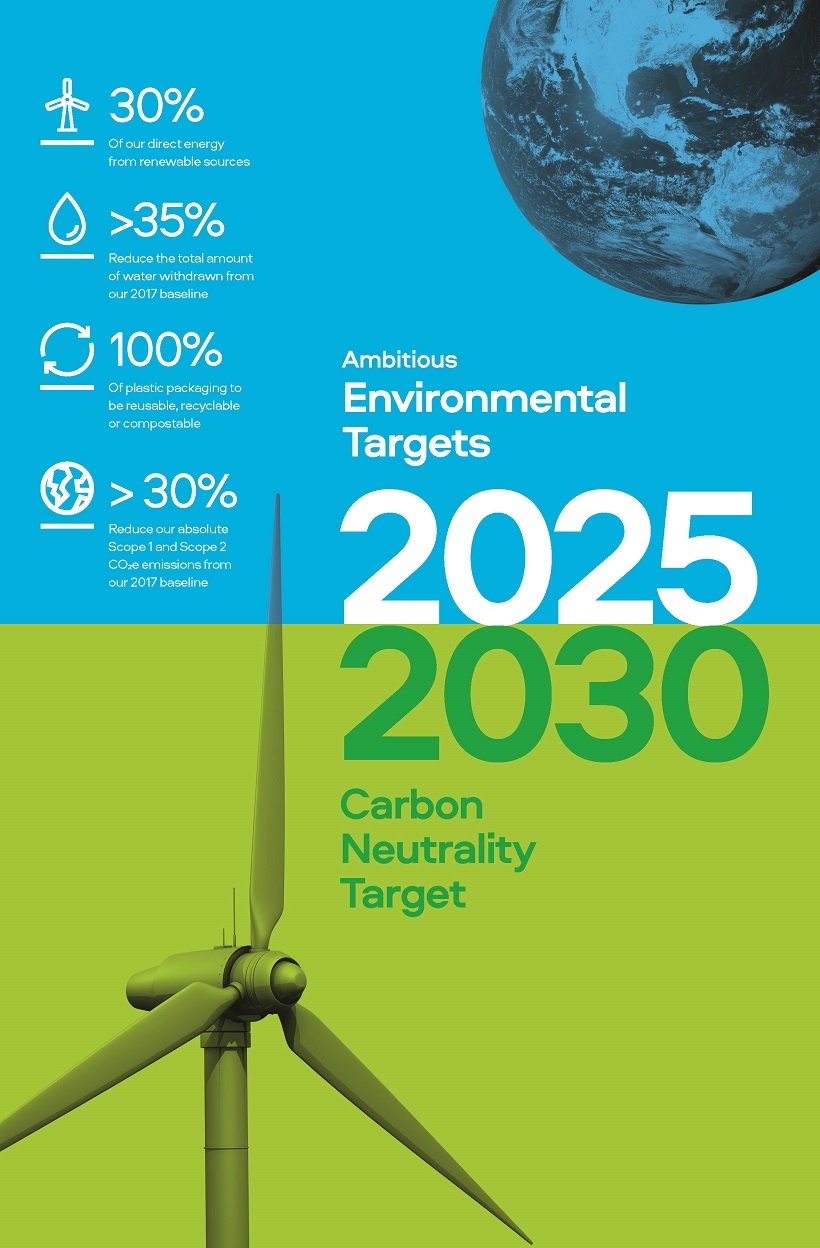
30% Of our direct energy from renewable sources >35% Reduce the total amount of water withdrawn from our 2017 baseline 100% Of plastic packaging to be reusable, recyclable or compostable > 30% Reduce our absolute Scope 1 and Scope 2 CO2e emissions from our 2017 baseline Ambitious Environmental Targets 2025 2030 Carbon Neutrality Target
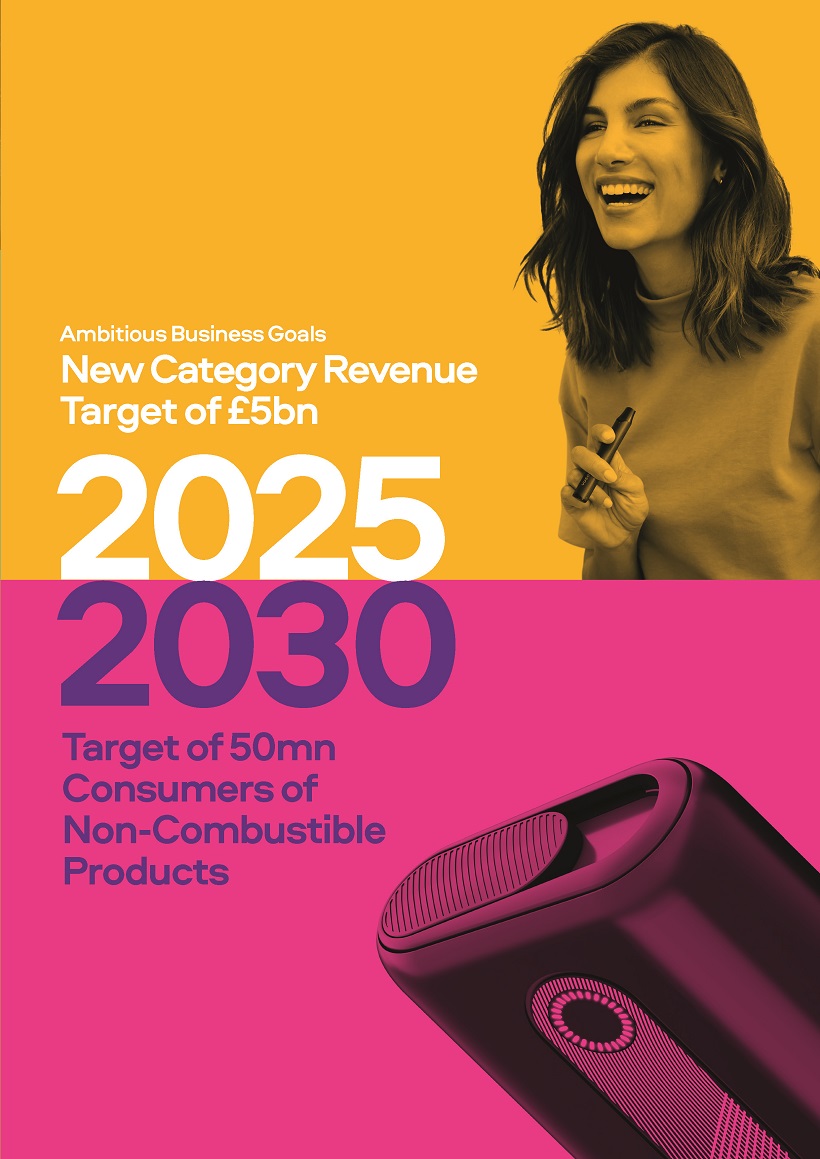
Ambitious Business Goals New Category Revenue 2025 Target of £5bn 2030 Target of 50mn Consumers of Non-Combustible Products
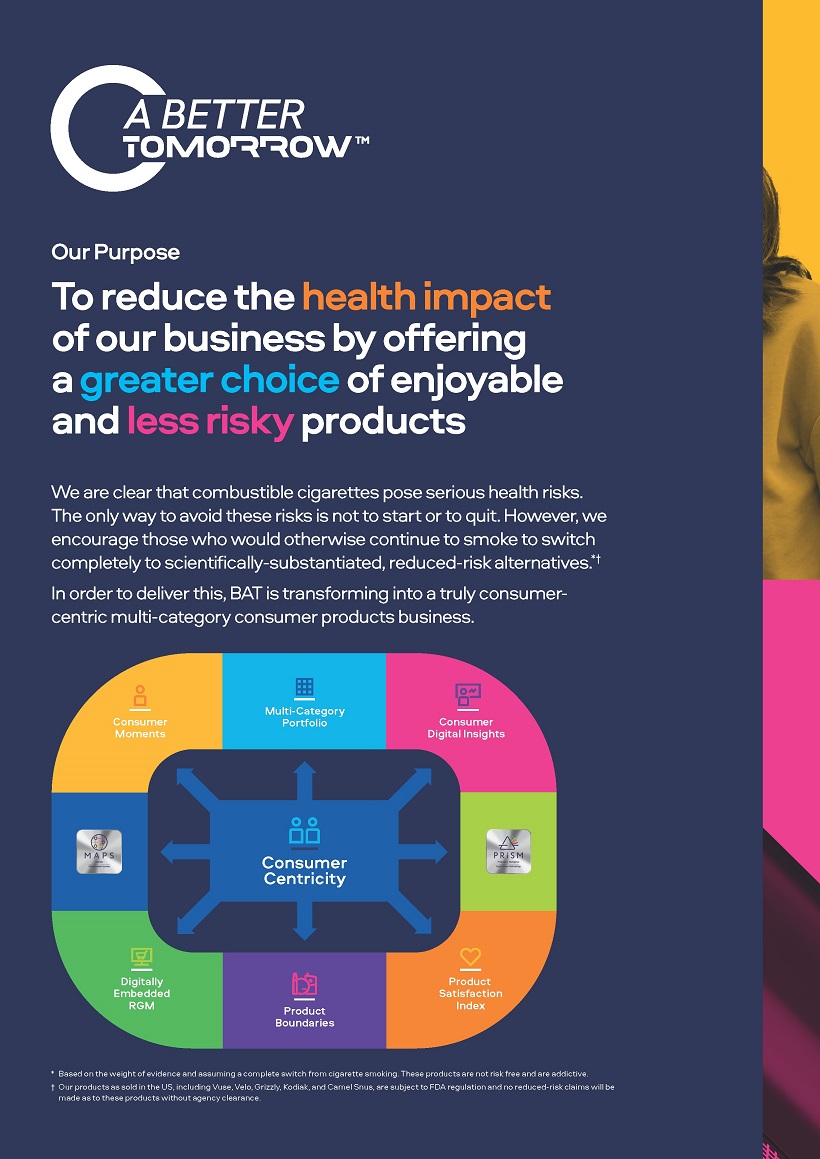
Our Purpose To reduce the health impact of our business by offering a greater choice of enjoyable and less risky products for our consumers. We are clear that combustible cigarettes pose serious health risks. The only way to avoid these risks is not to start or to quit. However, we encourage those who would otherwise continue to smoke to switch completely to scientifically-substantiated, reduced-risk alternatives.* In order to deliver this, BAT is transforming into a truly consumer-centric multi-category consumer products business. Multi-Category Consumer Moments Portfolio Digital Consumer Insights Consumer Centricity Embedded Digitally Satisfaction Product RGM Product Index Boundaries * Based on the weight of evidence and assuming a complete switch from cigarette smoking. These products are not risk free and are addictive. Our products as sold in the US, including Vuse, Velo, Grizzly, Kodiak, and Camel Snus, are subject to FDA regulation and no reduced-risk claims will be made as to these products without Part agency clearance.
| 0 2 | BAT Annual Report and Form 20-F 2020 | |||
A Strong Operational Performance
During Challenging Times
|
|
during challenging times.
|

| The Group’s response to the global COVID-19 pandemic continues to evolve and we expect the actions we take to develop over time as the needs of our people, our customers and society as a whole change.
We are steadfastly committed to supporting all our stakeholders throughout the COVID-19 pandemic, whether that be our workforce, customers, partners or suppliers. |
||||
| Keeping the Group Operating in a Time of Crisis
The Group continues to navigate the challenges and impacts of COVID-19, with effective crisis management and risk management processes in place, and remains a financially resilient business.
Our Board has maintained close oversight of the Group’s response to the impact of COVID-19 throughout this period.
The Group remains financially robust. This demonstrates the confidence in the Group’s ability to continue to navigate COVID-19 with the associated macro and socio-economic challenges and uncertainty this international crisis brings.
We are committed to supporting all our stakeholders throughout the COVID-19 pandemic, whether that be our workforce, customers, partners or suppliers. We have not furloughed any staff or utilised any government schemes (or subsidies) due to the pandemic, other than in respect of the deferral of tax instalment payments within the calendar year.
|
Vaccine Development
BAT’s US bio-tech subsidiary, Kentucky BioProcessing (KBP), is developing a potential vaccine for COVID-19. Its Initial New Drug application was approved by the US Food and Drug Administration (FDA) in December 2020 and we are progressing through the first Phase I study of KBP’s COVID-19 vaccine candidate.
This move to human trials is the first phase of development that would, if successful, form part of the full-scale development programme that would aim to fully assess the safety and efficacy of the candidate vaccine.
KBP is a world leader in using plants to express, extract and purify proteins for use as vaccines and other pharmaceuticals.
The candidate vaccine’s unique use of innovative fast-growing plant-based technology means rapid production of the vaccine’s active ingredients in around six weeks compared to several months using conventional methods. The vaccine also has the potential to be stable at room temperature, which could be a significant advantage for healthcare systems.
Testing and Logistical Support
We have continued to evolve the forms of direct support we have deployed to address the global impact of COVID-19.
In addition to the COVID-19 vaccine candidate that is in development by our US bio-tech subsidiary, KBP, we have:
– Loaned testing equipment to the UK government;
– Provided access to 3D printers to help produce protective face shields;
– Manufactured and distributed medical and hygiene equipment to vulnerable communities; and
– Donated to many funds around the world focusing on supporting local COVID-19 responses. |
Supporting our Suppliers and Communities
Our response to COVID-19 has been developed to incorporate the needs of wider stakeholder groups, including our smaller suppliers and those living in tobacco growing communities.
Some tobacco growing communities may be particularly vulnerable to both the virus and the economic implications of a global pandemic. We are taking great care that we don’t increase the immediate vulnerability of these communities and are committed to supporting them during the inevitable economic recovery that will follow.
We are working to support our smaller suppliers across the globe who may be struggling with cash flow issues by ensuring that, where needed, they are paid earlier than existing payment terms require or by extending payment terms to those customers who have expressed concerns.
Looking After our People
The Group’s management is doing all that it can to make sure that employees working from home feel connected.
Most importantly, we are working to ensure that the health, safety and wellbeing of employees who are unable to work from home, and those in countries where lockdown restrictions are not in place, are protected in their workplace.
For all employees, we are making sure they are aware of the extensive wellbeing support available to them, including:
– Online medical consultations;
– Counselling services; and
– Mental health support. | ||
| 0 4 | BAT Annual Report and Form 20-F 2020 | |||
Overview
Building A Better TomorrowTM and Delivering
Growth in a Challenging Environment
|
|
choosing our non-combustible
products.
|
|
Strategic Report |
Governance Report | Financial Statements | Other Information | BAT Annual Report and Form 20-F 2020 | 0 5 | |||||
|
|
| 06 | BAT Annual Report and Form 20-F 2020 |
Overview
Chief Executive’s Review
Continued
|
Strategic Report |
Governance Report | Financial Statements | Other Information | BAT Annual Report and Form 20-F 2020 | 07 | |||||
|
|
Financial Review
Director’s Overview
|
|
|
| 08 | BAT Annual Report and Form 20-F 2020 |
Financial Review
Finance and Transformation
Director’s Overview Continued
|
Strategic Report |
Governance Report | Financial Statements | Other Information | BAT Annual Report and Form 20-F 2020 | 09 | |||||
|
|
| Our performance metrics | Target / Ambition | 2020 | % | 2019 | % | 2018 |

|

|

| |||||||||||||||||||||
|
| ||||||||||||||||||||||||||||||
| Consumer | ||||||||||||||||||||||||||||||
| Number of Non-Combustible Product Consumers |
50 million consumers by 2030 | 13.5m | 10.5m | 8m | ||||||||||||||||||||||||||
|
| ||||||||||||||||||||||||||||||
| Market share | ||||||||||||||||||||||||||||||
| Cigarette and THP volume share growth (bps) | Grow by 0-10 bps (2020) | +30 bps | +20 bps | +40 bps | ● | |||||||||||||||||||||||||
| Cigarette and THP value share growth (bps) | +20 bps | +30 bps | +40 bps | |||||||||||||||||||||||||||
|
| ||||||||||||||||||||||||||||||
| Volume | ||||||||||||||||||||||||||||||
| Cigarettes (bn sticks) | 638 | -5% | 668 | -5% | 701 | |||||||||||||||||||||||||
|
| ||||||||||||||||||||||||||||||
| Other Tobacco Products (bn stick equivalents) | 20 | -2% | 21 | -7% | 22 | |||||||||||||||||||||||||
|
| ||||||||||||||||||||||||||||||
| Vapour (mn 10ml units / pods) | 344 | +52% | 226 | +19% | 189 | |||||||||||||||||||||||||
|
| ||||||||||||||||||||||||||||||
| THP (bn sticks) | 11 | +19% | 9 | +32% | 7 | |||||||||||||||||||||||||
|
| ||||||||||||||||||||||||||||||
| Modern Oral (mn pouches) | 1,934 | +62% | 1,194 | +188% | 414 | |||||||||||||||||||||||||
|
| ||||||||||||||||||||||||||||||
| Traditional Oral (bn stick equivalents) | 8 | -1% | 8 | -1% | 8n | |||||||||||||||||||||||||
|
| ||||||||||||||||||||||||||||||
| Financial | ||||||||||||||||||||||||||||||
| Revenue (£m) | 25,776 | -0.4% | 25,877 | +5.7% | 24,492 | ● | ||||||||||||||||||||||||
|
| ||||||||||||||||||||||||||||||
| Change in Adjusted Revenue at cc (%) | +3.3% | +5.6% | ● | ● | ||||||||||||||||||||||||||
|
| ||||||||||||||||||||||||||||||
| Change in Revenue from Strategic Portfolio at cc (%)* | Increase 3-6% (2020) | +7.0% | +7.3% | ● | ● | |||||||||||||||||||||||||
|
| ||||||||||||||||||||||||||||||
| Revenue from New Categories (£m) | £5 billion by 2025 | 1,443 | +14.9% | 1,255 | +36.9% | 917 | ● | |||||||||||||||||||||||
|
| ||||||||||||||||||||||||||||||
| Change in Revenue from New Categories at cc (%)* | +15.4% | +32.4% | ● | |||||||||||||||||||||||||||
|
| ||||||||||||||||||||||||||||||
| Profit from Operations (£m) | 9,962 | +10.5% | 9,016 | -3.2% | 9,313 | ● | ||||||||||||||||||||||||
|
| ||||||||||||||||||||||||||||||
| Change in Adjusted Profit from Operations at cc (%) | Increase 4.0% to 6.5% (2020) | +4.8% | +6.6% | ● | ● | |||||||||||||||||||||||||
|
| ||||||||||||||||||||||||||||||
| Operating Margin (%) | 38.6% | 34.8% | 38.0% | ● | ||||||||||||||||||||||||||
|
| ||||||||||||||||||||||||||||||
| Adjusted Operating Margin (%) | 44.1% | 43.1% | 42.6% | ● | ||||||||||||||||||||||||||
|
| ||||||||||||||||||||||||||||||
| Diluted Earnings per Share (p) | 278.9 | +12.0% | 249.0 | -5.4% | 263.2 | ● | ||||||||||||||||||||||||
|
| ||||||||||||||||||||||||||||||
| Adjusted Diluted Earnings per Share (p) | 331.7 | +2.4% | 323.8 | +9.1% | 296.7 | ● | ● | |||||||||||||||||||||||
|
| ||||||||||||||||||||||||||||||
| Change in Adjusted Diluted Earnings per Share at cc (%) | +5.5% | +8.4% | ● | ● | ||||||||||||||||||||||||||
|
| ||||||||||||||||||||||||||||||
| Dividends per Share (p) | 215.6 | +2.5% | 210.4 | +3.6% | 203.0 | |||||||||||||||||||||||||
|
| ||||||||||||||||||||||||||||||
| Dividend Pay-Out Ratio (%) | 65% | 65% | 68% | |||||||||||||||||||||||||||
|
| ||||||||||||||||||||||||||||||
| Net Cash Generated from Operating Activities (£m) | 9,786 | +8.8% | 8,996 | -12.6% | 10,295 | ● | ||||||||||||||||||||||||
|
| ||||||||||||||||||||||||||||||
|
| ||||||||||||||||||||||||||||||
| Cash Conversion (%) | 98% | 100% | 111% | ● | ||||||||||||||||||||||||||
|
| ||||||||||||||||||||||||||||||
|
| ||||||||||||||||||||||||||||||
| Borrowings, including Lease Liabilities (£m) | 43,968 | -3.1% | 45,366 | -4.5% | 47,509 | ● | ||||||||||||||||||||||||
|
| ||||||||||||||||||||||||||||||
|
| ||||||||||||||||||||||||||||||
|
| ||||||||||||||||||||||||||||||
| Total Shareholder Return (rank) | 20 of 23 | 21 of 23 | 19 of 23 | ● | ||||||||||||||||||||||||||
|
| ||||||||||||||||||||||||||||||
| ESG | ||||||||||||||||||||||||||||||
| Total Scope 1 and 2 CO2e emissions (‘000 tonnes) | |
Carbon neutral by 2030 for our own business activities |
|
541 | -30.9% | 782 | -7.0% | 874 | ||||||||||||||||||||||
|
| ||||||||||||||||||||||||||||||
| Water Withdrawn (mn metres3) | Reduce water withdrawn by | 4.03 | -10.8% | 4.51 | -5.3% | 4.77 | ||||||||||||||||||||||||
| |
35% by 2025 to 3.38 against 2017 baseline |
|
22.5% | 13.1% | 8.2% | |||||||||||||||||||||||||
|
| ||||||||||||||||||||||||||||||
| Recycling (% of Waste Recycled Annually) | Recycle min 95% of waste | 90.7% | 90.5% | 90.2% | ||||||||||||||||||||||||||
|
| ||||||||||||||||||||||||||||||
Please refer to pages 276 to 284 for definitions of the Non-GAAP measures. See the section ‘Non-Financial KPIs’ on page 274 for more information on these non-financial KPIs.
| * | From 2021, Change in Revenue from Strategic Portfolio at cc will cease to be a KPI, being replaced as a KPI by Revenue from New Categories at cc. |
| 1. | Where measures are presented ‘at constant rates’ or ‘at cc’, the measures are calculated based on a re-translation, at the prior year’s exchange rates, of the current year results of the Group and, where applicable, its segments. See page 73 for the major foreign exchange rates used for Group reporting. |
| 2. | Where measures are presented as ‘adjusted’, they are presented before the impact of adjusting items. Adjusting items represent certain items of income and expense which the Group considers distinctive based on their size, nature or incidence. |
| 10 | BAT Annual Report and Form 20-F 2020 |
Overview
| Transformation Driving Sustainable Growth
Delivering growth by reducing harm and expanding our portfolio
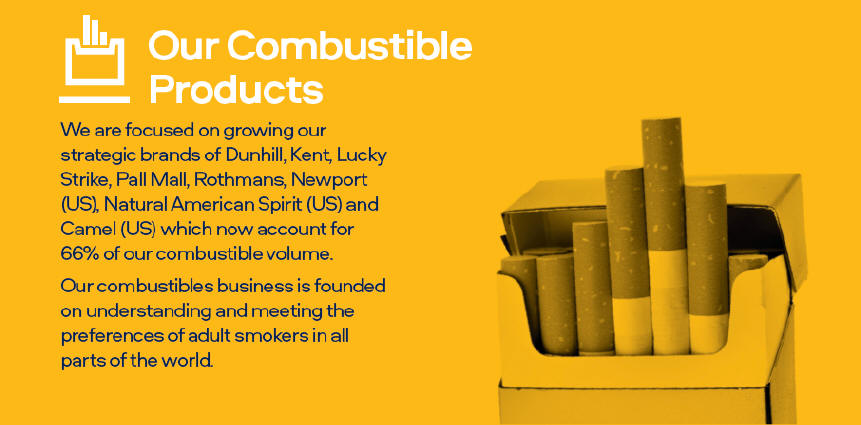
Our corporate purpose is to build A Better TomorrowTM. Reducing the health impact of our business, by encouraging those smokers who would otherwise continue to smoke to switch completely to scientifically-substantiated, reduced-risk alternatives, is the greatest contribution we can make to society.*† This means growing our New Category business and increasing the proportion of our revenue coming from New Category products as fast as possible.
Revenue growth in the global nicotine industry is accelerating through the development of New Categories, which offer reduced-risk alternatives to combustible products.*† To capitalise on this growth, our well-embedded consumer-centric, multi-category strategy is activated on a global scale, leveraging our insights on consumer satisfaction, innovation needs and taste. We are building the brands of the future – strong, global brands, specifically positioned in each target consumer segment.
We have set ourselves ambitious targets to reach 50 million consumers of our non-combustible products by 2030, and more than triple our revenue from New Categories from £1.3 billion in 2019 to £5 billion by 2025. These ambitions will be met through the delivery of our three clear strategic priorities:
– to drive a step change in New Categories, to accelerate growth supported by increased investment;
– to generate value through Combustibles, to provide the capabilities and funding; and
– to simplify the Group, to create a stronger, faster, more agile organisation.
|
Reducing the Health and Environmental Impact of our Business
Creating value for all our stakeholders
Our work to reduce the health and environmental impact of the business will drive growth and create shared value, delivering results that simultaneously benefit shareholders and wider society.
We will continue to create a stronger BAT by:
– focusing on excellence in environmental management;
– delivering a positive social impact; and
– adhering to robust corporate governance.
This builds on our strong ESG foundations including our status as:
– the first tobacco company to produce a Sustainability Report in 2001;
– named in the Dow Jones Sustainability Indices for 19 consecutive years; and
– a member of CDP Climate A List.
Our commitments are anchored in challenging targets, against which we will track and share the progress of our transformation.
Meanwhile, our ‘delivery with integrity’ programme is focused on ensuring that our ethical standards are never compromised for the sake of results. | |||||||||
|
50mn Non-Combustible product consumers targeted by 2030
£5bn New Categories revenue targeted by 2025
|
1.1bn consumers in global combustibles market to convert to reduced- risk products*†
10% Group revenue from Non-Combustibles |
A-List member of CDP Climate A-List
Carbon Neutral operations by 2030
|
19th consecutive year in the Dow-Jones Sustainability Indices
100% of plastic packaging to be reuseable, recyclable or compostable by 2025 | |||||||
| * | Based on the weight of evidence and assuming a complete switch from cigarette smoking. These products are not risk free and are addictive. |
| † | Our products as sold in the US, including Vuse, Velo, Grizzly, Kodiak, and Camel Snus, are subject to FDA regulation and no reduced-risk claims will be made as to these products without agency clearance. |
|
Strategic Report |
Governance Report | Financial Statements | Other Information | BAT Annual Report and Form 20-F 2020 | 11 | |||||
|
|
| Unrivalled Global Capabilities
Leveraging proven expertise and developing new capabilities to deliver our ambitions
Our New Category portfolio benefits from decades of insights and expertise that have driven our No.1 global revenue position in combustibles (excl. China). This combined with increased investment behind new capabilities gives us confidence that we can deliver our medium to long-term ambitions.
Our three global New Category brands leverage the benefits of our world-class R&D and our manufacturing, distribution, marketing and brand building capabilities, which are supported by our unrivalled global footprint across 180 markets, with 11 million points of sale, reaching 150 million consumers daily.
Together with our long-standing experience operating within complex regulatory, legal and fiscal frameworks, these provide BAT with a compelling competitive advantage to drive portfolio growth and transformation within the wider tobacco industry.
Through Project Quantum, our ongoing business simplification and efficiency programme, we aim to achieve a minimum of £1 billion of annualised savings by the end of 2022 to invest in new capabilities in areas such as:
– data analytics;
– enhanced consumer insight;
– IP and innovation;
– design and technology; and
– e-commerce, enabling our ongoing digital transformation.
We are attracting new senior talent from a diverse range of industries globally to further enhance our current and future capabilities, which will enable us to deliver on our growth ambitions over the medium to long term.
|
||||||||||
|
1,500+ dedicated scientists and engineers
>£1bn annualised savings by 2022
|
>11m points of sale
>180 markets in which we operate
>150mn daily consumer interactions |
|
7% dividend CAGR over 10 years | |||||||
| 12 | BAT Annual Report and Form 20-F 2020 |
We are a global business, operating at scale, in a fast-paced world. To be sustainable we must anticipate, detect and adapt to major social, environmental, economic, political and technological shifts. Mega trends are important indicators, representing significant movements, patterns or trends shaping the macroenvironment. In the context of our industry, we see four megatrends as being likely to have substantial impact on the way we conduct our business.
| Mega trend
Reduced Risk & Beyond
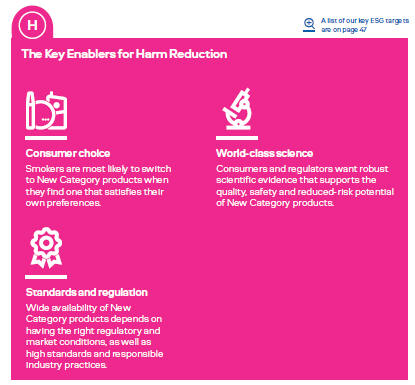
Consumer Choice
It is widely accepted that most of the harm associated with tobacco is caused by inhaling the smoke produced by its combustion. Around the world, consumers now have increasingly high expectations beyond combustible products and nicotine. Many consumers are seeking out new products that deliver nicotine, with potentially reduced risk, as well as other ingredients from a wellbeing perspective – so-called ‘new active’ products.
World-Class Science
There is broad agreement among policy makers and the public health community: We need to develop a robust science base to inform policies and educate consumers about potentially reduced-risk products. The science associated with tobacco harm reduction plays a core role within the industry and society. World-class science can establish whether products are safer, or less risky, compared with cigarette smoking. It can also help build consumer trust in reduced-risk products.*†
Regulation and Standards
The regulatory environment around tobacco harm reduction and ‘new active’ products is evolving. Science increasingly points to the likely benefit of reduced-risk products as an alternative to smoking.*† This means we are seeing policy and regulatory shifts in several markets. Some countries have greater restrictions in place. Others, like the UK, view tobacco harm reduction within a regulated framework, encouraging smokers to use potentially reduced-risk nicotine products.
|
Mega trend
Digital Technology
Smart Technology
Smart electronic devices and social media have increasingly become integral to people’s lives and daily routines. They have enabled greater access to new platforms and have enhanced the way people consume news, make connections and shop.
E-commerce platforms, available on the go, have led to social media platforms being used by brands to sell their products. Social e-commerce is increasingly viewed as a mainstream retail channel, on a par with other platforms, like websites and offline stores. This trend is only accelerating as greater numbers of social networks introduce pro-selling features like shoppable posts.
Online Sales During COVID-19
A major impact of the pandemic has been the implementation of city-wide, regional and national lockdowns. Many non-essential businesses have been ordered to close. As a result, many customers are generally avoiding public places. While the crisis is continually evolving, it has increasingly limited shopping for all but necessary essentials. Brands are having to adapt. Now, e-commerce is expanding to include new businesses, customers and product types.
Today, customers already have access to a wide variety of products from the convenience and safety of their homes. Firms have still been able to operate, despite contact restrictions and other confinement measures. | |||||||||
|
* Based on the weight of evidence and assuming a complete switch from cigarette smoking. These products are not risk free and are addictive.
† Our products as sold in the US, including Vuse, Velo, Grizzly, Kodiak, and Camel Snus, are subject to FDA regulation and no reduced-risk claims will be made as to these products without agency clearance. |
|

| ||||||||
|
Strategic Report |
Governance Report | Financial Statements | Other Information | BAT Annual Report and Form 20-F 2020 | 13 | |||||
|
|
| Mega trend
Climate Change
Population Migration
Climate change can re-shape patterns of migration and population displacement. This is driven by shoreline erosion, coastal flooding and agricultural disruption.
Various analysts have attempted to forecast future flows of climate migrants. These people are moving within their countries or across borders, on a permanent or temporary basis. The most widely repeated prediction is 200 million by 2050.
The impacts of climate migration on regional security, labour patterns and consumer habits will have wide-ranging effects on businesses across the globe.
Farming
Agricultural crops, such as tobacco, need suitable soil, water, sunlight and heat to grow. The length of the growing season in large parts of Europe, for example, has already been impacted by warmer air temperatures. Some crops are now experiencing harvest and flowering dates several days earlier in the season. Many regions are expected to see this trend continue.
Shifts in temperatures and growing seasons may also impact the production and spread of some species (i.e. insects), invasive weeds, or diseases, with crop yields potentially affected. Yield losses could be offset by different farming practices, such as: Crop rotation to match water availability, adjusting sowing dates to rainfall and temperature patterns and using crop varieties suited to new conditions.
|
Mega trend
Waste and Recycling
Manufacturing Resource Reduction
Reducing the resources needed for manufacturing – often referred to within the circular economy – is a key trend. This includes reducing waste and pollution by continuously re-using materials and products.
Many factors have brought this into focus. Resource prices have become more volatile and are expected to rise over the long term. Consumer demand is increasing. Meanwhile, easy-access, high-grade stocks of key commodities are reducing. Governments are also considering new restrictions on pollution and waste that apply for entire product lifecycles.
Recycling and Packaging
Today, businesses are expected to go further and recycle more. It is possible for most plastics used in packaging to be mechanically recycled with little loss of quality. However, current estimates place global uptake at less than 15%. Why?
One of the most important reasons is the lack of global standards. Proliferating materials, formats and labelling requirements mean many types of packaging are produced in quantities too small for recyclers to achieve economies of scale and profitability. There are also variations in collection methods and processing systems. This means the recyclability of a product in one city may not be compatible with another. As packaging changes, local waste-collection and recycling programmes are struggling to keep pace.
|
| 14 | BAT Annual Report and Form 20-F 2020 |
Strategic Management
Global Industry Overview**
Continued
Today, the tobacco and nicotine market serves a growing base of more than one billion adult consumers. Generational differences and shifts in taste are continuing to emerge, as health and wellness become ever-more important. We anticipate growth in new categories of products, including – and beyond – tobacco and nicotine. Consumers expect these to provide stimulation and pleasure, in ways previously associated with cigarettes. We believe such growth will offset the predicted decline in cigarette consumption.

|
Strategic Report |
Governance Report | Financial Statements | Other Information | BAT Annual Report and Form 20-F 2020 | 15 | |||||
|
|
| 16 | BAT Annual Report and Form 20-F 2020 | |||
Strategic Management
our Evolved Strategy
We are committed to providing A Better TomorrowTM for all our
stakeholders. Our ambition is to deliver long-term sustainable
growth with a range of innovative and less harmful products that
stimulate the senses of new adult generations.
|
Strategic Report |
Governance Report | Financial Statements | Other Information | BAT Annual Report and Form 20-F 2020 | 17 | |||||
|
|
||||||||||
| 18 | BAT Annual Report and Form 20-F 2020 | |||
Strategic Management
Accelerated Growth
As a leading consumer-centric, multi-category consumer goods business, we are dedicated to stimulating the senses of adult consumers worldwide. We aim to generate an increasingly greater proportion of our revenues from products other than combustibles, thereby reducing the health impact of our business.
This will deliver A Better TomorrowTM for our consumers who will have a range of enjoyable and less risky*† choices for every mood and moment; for society through reducing the overall health and environmental impacts of our business; for our employees by creating a dynamic and purposeful place to work; and for our shareholders by delivering sustainable superior returns.

| Our Mission
Stimulating the Senses of New Adult Generations
Today, we see opportunities to capture consumer moments which have, over time, become limited by societal and regulatory shifts, and to satisfy evolving consumer needs and preferences.
Our mission is to anticipate and satisfy this ever-evolving consumer: provide pleasure, reduce risk, increase choice and stimulate the senses of adult consumers worldwide.
* Based on the weight of evidence and assuming a complete switch from cigarette smoking. These products are not risk free and are addictive.
† Our products as sold in the US, including Vuse, Velo, Grizzly, Kodiak, and Camel Snus, are subject to FDA regulation and no reduced-risk claims will be made as to these products without agency clearance |
Must Wins
High Growth Segments
Driven by our unique and data-driven consumer insight platform (PRISM), we will focus on product categories and consumer segments across our global business that have the best potential for long-term sustainable growth.
Priority Markets
By relying on a rigorous market prioritisation system (MAPS), we will focus the strengths of our unparalleled retail and marketing reach, as well as our regulatory and scientific expertise, on those markets and marketplaces with the greatest opportunities for growth.
How We Win
Inspirational Foresights
As one of the most long-standing and established consumer goods businesses in the world, we have a unique view of the consumer across all of our product categories, which is increasingly driven by powerful data and analytics.
These insights ensure that the development and responsible marketing of our products is fit to satisfy consumer needs. |
Remarkable Innovation
As consumer preferences and technology evolve rapidly, we rely on our growing global network of digital hubs, innovation super centres, world-class R&D laboratories, external partnerships and our corporate venturing initiative to stay ahead of the curve.
Powerful Brands
For over a century, we have built trusted and powerful brands that satisfy our consumers and serve as a promise for quality and enjoyment. We will build the brands of the future by focusing on fewer, stronger and global brands across all our product categories, delivered through our deep understanding and segmenting of our consumers.
Connected
Few companies can claim over 150 million daily consumer interactions, over 11 million retail points of sale and a global network of expert employees around the world. Cultivating an ecosystem that directly connects us with consumers and stakeholders, especially through the power of digital technology, ensures we can build the brands of the future, deliver access to markets and foster innovations that offer sensorial enjoyment and satisfy consumer needs. |
|
Strategic Report |
Governance Report | Financial Statements | Other Information | BAT Annual Report and Form 20-F 2020 | 19 | |||||
|
|
||||||||||

|
Our ambition is to build the brands of the future.
| |||
| Kingsley Wheaton Chief Marketing Officer |

| 20 | BAT Annual Report and Form 20-F 2020 | |||
Strategic Management
Multi-Category Portfolio
BAT is a leading consumer-centric, multi-category consumer goods business dedicated to stimulating the senses of adult consumers worldwide. Our portfolio reflects our commitment to meeting the evolving and varied needs of today’s consumer who seeks sensorial enjoyment for different moods and moments.
|
Strategic Report |
Governance Report | Financial Statements | Other Information | BAT Annual Report and Form 20-F 2020 | 21 | |||||
|
|
| 22 | BAT Annual Report and Form 20-F 2020 |
Strategic Management
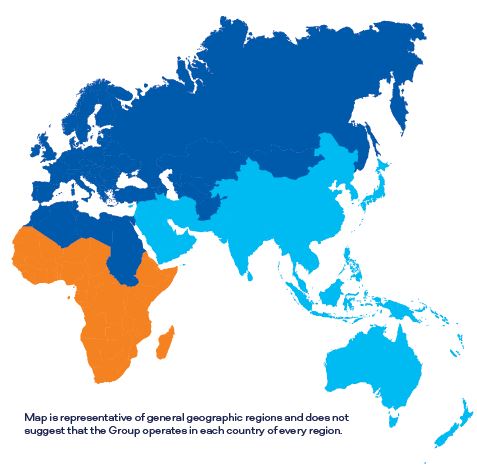
To build A Better TomorrowTM, our marketplace analysis delivers insights regarding consumer trends and segmentation, which ultimately facilitates our geographic brand prioritisation across over 180 markets. Our business is divided into four, complementary regions with a balanced presence in both high-growth emerging markets and highly profitable developed markets.
|
United States |
USA
|
Americas and |
AmSSA
| |||||
| of America
|
Sub-Saharan Africa
|
 Our cutting edge technologies turn consumer insights into innovative and outstanding products that meet their needs.

|
The US business is transforming into a New Categories-oriented business, fuelled by reinvestments from the consistently industry- leading value growth in the tobacco categories.
|
Building A Better Tomorrow is crucial for the Group and the excellent performance of New Categories across AmSSA is proof of the leading role the region is playing.
| ||||||||
| Paul Lageweg Director, New Categories |

|
Guy Meldrum President and CEO (Reynolds American Inc.) |
|
Luciano Comin Regional Director, AmSSA |
| |||||
|
Strategic Report |
Governance Report | Financial Statements | Other Information | BAT Annual Report and Form 20-F 2020 | 23 | |||||
|
|

|
Zafar Khan Director, Operations |
| Europe and
|
ENA
|
Asia-Pacific and |
APME
|

|
180+
markets | |||||
| North Africa | Middle East | |||||||||
|

|
150mn
consumers | ||||||||

|
13.5mn
non-combustible product consumers | |||||||||

|
55,000+
employees | |||||||||

|
139
nationalities | |||||||||

|
40+
toxicologists | |||||||||

|
1,500+
R&D specialists | |||||||||
|
We had a strong year across ENA, with revenue growth in all New Categories and remain resolute in our pursuit of A Better Tomorrow.
|
glo Hyper accelerated THP volume across APME and we have ambitious plans for 2021 and beyond.
|
I am very proud of our global team of world-class scientists and the research they are doing to assess and ensure the performance, efficacy and safety of our products.
| ||||||||
| Johan Vandermeulen Regional Director, ENA |

|
Michael (Mihovil) Dijanosic Regional Director, APME |

|
Dr. David O’Reilly Director, Scientific Research |

| |||||
| 24 | BAT Annual Report and Form 20-F 2020 |
Strategic Management
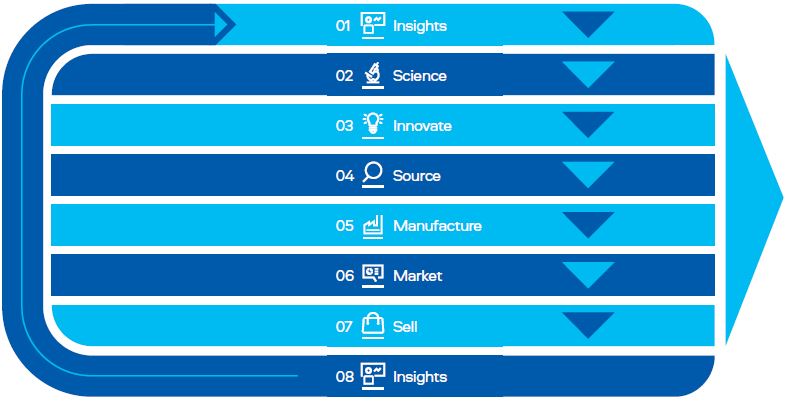
Our global business understands our diverse consumers, develops products to satisfy their preferences and ultimately distributes them across over 180 markets.
Six key enablers support us in turning powerful insights into products that provide enjoyment to our consumers, while engagement helps our key stakeholders benefit from our sustainable growth.
| IP / Technology
|
|
Environmental
|
Manufacturing
| |||||
|
|
|
| ||||||
| £300mn+ R&D expenditure
7 R&D / Product centre sites |
370,000tn of leaf
2,568 GWh energy consumed
4.03m cubic metres of water withdrawn |
79 BAT-owned manufacturing facilities
45 cigarette factories |
| Social
|
|
Financial
|
|
Human
| ||||||||
|
|
|
| ||||||||||
| 84,000+ contracted farmers
c30,000 Suppliers
180+ Markets |
£600mn+ annual capital expenditure
£426mn additional investment in New Categories
BBB+/Baa2 credit rating |
55,000+ employees globally
1,500+ R&D specialists |
A credit rating is not a recommendation to buy, sell or hold securities. A credit rating may be subject to withdrawal or revision at any time. Each rating should be evaluated separately of any other rating.
|
Strategic Report |
Governance Report | Financial Statements | Other Information | BAT Annual Report and Form 20-F 2020 | 25 | |||||
|
|
| 26 | BAT Annual Report and Form 20-F 2020 |
Strategic Management
of the Future
Building the Enterprise of the Future is about ensuring we have the organisational flexibility to implement and operationalise our growth strategy – simplifying the business and speeding up decision-making. Quest is an organisational transformation programme, built around five pillars, designed to deliver the Enterprise of the Future at enhanced speed.

|
Strategic Report |
Governance Report | Financial Statements | Other Information | BAT Annual Report and Form 20-F 2020 | 27 | |||||
|
|


| 28 | BAT Annual Report and Form 20-F 2020 |
Strategic Management
Short-Term Deliverables to Fuel A Better TomorrowTM
Our purpose is to build A Better TomorrowTM by reducing the health impact of our business through offering a greater choice of enjoyable and less risky products* for our consumers. To accelerate this, we must become a stronger, simpler and faster organisation, which will be achieved through the delivery of three short-term priorities.

|
Ensure a Step Change in New Categories Performance |

|
Drive Value From Combustibles |

|
Simplify the Business | |||||
|
Over the years, consumer moments that used to be satisfied by cigarettes have been replaced by other products.
With our unique cross-category consumer understanding, we are clear there is a huge opportunity to recapture these moments with a broader portfolio of products that are less risky than combustible products.*†
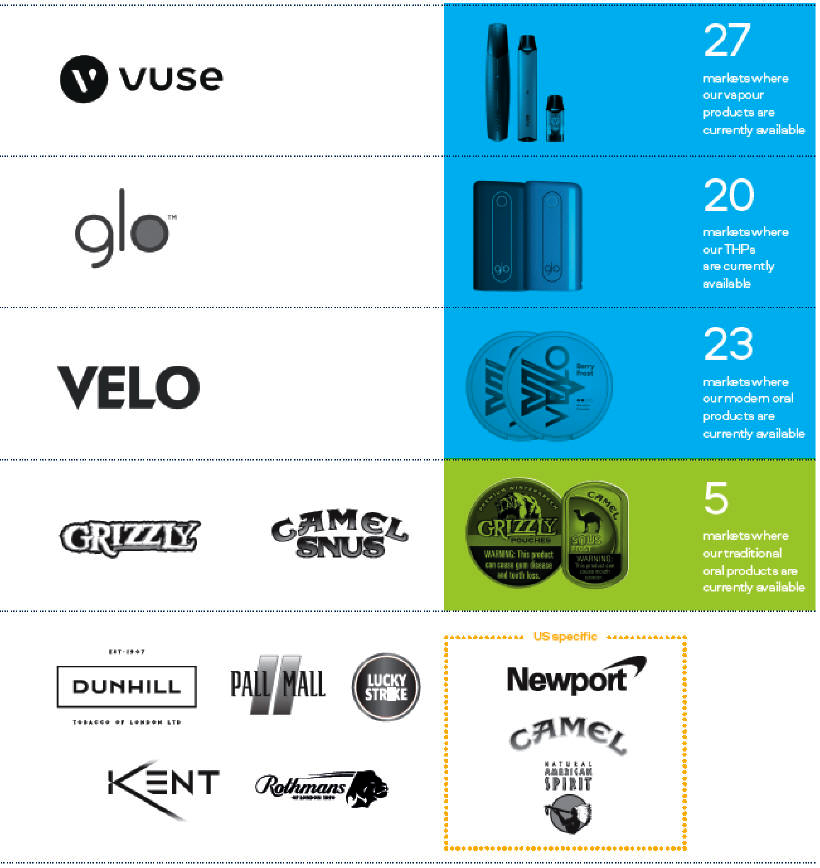
We are clear that any portfolio expansion will leverage our strengths. We will maximise and seek to constantly improve our delivery platforms in Vapour, THP and Modern Oral, reducing the health impact and making a positive environmental contribution.
We aim to increase our non-combustible consumers from 11 million (2019) to 50 million by 2030, driving revenue from New Categories to at least £5 billion by 2025.
We are building new capabilities around the world focused on science, innovation, and digital information. Consumer preferences and technology are evolving rapidly, and we are staying ahead of the curve with our digital hubs, the creation of innovation super centres, and further development of our world-class R&D laboratories. We are also leveraging the expertise of our external partners, and are looking forward to exciting results from our venturing initiative. |

Our ambition is to increasingly transition our revenues from cigarettes to New Categories over time.
In order to fund the development of our New Categories, we will continue to focus on generating value from our Combustibles business, driving sustainable increases in revenue, with volume share and value share growth.
Our performance is a direct function of the strength of our brand portfolio. We will continue to develop and invest in our brands for equity and future value, by offering winning brand and product propositions, enabled by purposeful innovation.
Revenue growth management is a critical enabler to unlock future value and our resource allocation will be focused and prioritised to deliver better results with fewer initiatives.
We will further consolidate our portfolio of strategic brands and deliver efficiencies through a much leaner portfolio, with far fewer stock-keeping units designed to a margin. |
Our ongoing simplification programme, Project Quantum, is expected to realise £1 billion of savings through simplification and efficiencies by 2022.
Through Quantum we will fundamentally re-evaluate how we are organised and reduce management layers to eliminate duplication and entrenched accountability.
We will create new capabilities and release valuable funds for further investment in our growth ambition, ensuring the Group is stronger, faster and more agile.
We will be steadfast in realising operational efficiencies, supply chain productivity and a focus on excellence in our route-to-market.
* Based on the weight of evidence and assuming a complete switch from cigarette smoking. These products are not risk free and are addictive.
† Our products as sold in the US, including Vuse, Velo, Grizzly, Kodiak, and Camel Snus, are subject to FDA regulation and no reduced-risk claims will be made as to these products without agency clearance | ||||||||
| 30 | BAT Annual Report and Form 20-F 2020 |
Strategic Management
Tobacco harm reduction is a public health strategy to minimise the negative health impact of conventional cigarettes. It recognises the important role that alternative sources of nicotine with lower health risks offer to smokers who may not otherwise want or choose to give up. We’re clear that our business is shifting towards a reduced-risk portfolio*†, built on outstanding products, informed consumer choice, and underpinned by world-class science.
|
Understanding the Products and Risks
It’s widely accepted that most of the harm associated with tobacco is caused by inhaling the smoke produced by combustion.
Products that contain nicotine but don’t involve burning tobacco are likely to emit far fewer – and lower levels of – toxicants, compared to conventional cigarettes. This means they have the potential to be significantly less harmful to health.*†
For decades, nicotine has been used in licensed medicinal products. However, for harm reduction to be more effective, we must create alternatives to cigarettes that smokers want to use. Additionally, and despite a growing body of scientific evidence regarding the benefits of reduced-risk products* †, more research is required.
Assessing the Reduced- Risk Potential of our Products*
To achieve tobacco harm reduction, reduced-risk assessments need to be supported by robust science. That’s why we created our leading scientific research programme – and openly share its findings.
Most non-combustible products remain relatively new to the market. This means they lack the epidemiological data required to establish harm reduction potential over decades of use.
Instead, it’s necessary to take a weight-of-evidence approach, based on the emissions, exposure and risk levels of each product.
* Our products as sold in the US, including Vuse, Velo, Grizzly, Kodiak, and Camel Snus, are subject to FDA regulation and no reduced-risk claims will be made as to these products without agency clearance. |
Note: 1. Substantially reduced toxicants is not sufficient alone to determine reduced risk.
We use the term Potentially Reduced Risk Products (PRRPs) to cover tobacco and nicotine products that, based on available science, have been shown to be reduced-risk; are likely to be reduced-risk; or have the potential to be reduced-risk, in each case if switched to exclusively as compared to continuing to smoke cigarettes.
Our multi-disciplinary risk assessment framework
|
|
Strategic Report |
Governance Report | Financial Statements | Other Information | BAT Annual Report and Form 20-F 2020 | 31 | |||||
|
|
| World-Class Science for A Better TomorrowTM
For more than 60 years, research and development has been a critical part of our business. The table to the right highlights how we aim to create A Better TomorrowTM through world-class science.
We invest in R&D to deliver innovations that satisfy or anticipate consumer preferences. This helps us generate business growth across all our categories. But the main focus of our investment is in reduced-risk products.* † |
Product development
using scientific advances and new technologies to satisfy evolving consumer needs and preferences. |
|
Scientific evaluation
to support evidence-based regulation and provide consumers with the information they need to make informed decisions. |
|||||||||
|
Product
to ensure quality and consumer safety based on robust science and toxicological risk assessments. |
Collaborative
to ensure a consistent approach to product quality and safety across the industry and build consumer confidence.
|
| New Categories Delivering Consumer Choice
For tobacco harm reduction to succeed, smokers need access to products that deliver nicotine and an enjoyable experience, with reduced risks compared to smoking.* †
That’s why we’re developing and commercialising alternative tobacco and nicotine products: Our New Categories. These don’t burn tobacco, while delivering nicotine to the user.
|
Hand-held battery powered electronic devices which heat a liquid formulation (an e-liquid or sometimes called ‘juice’) – often containing nicotine – to create a vapour which can be inhaled. They don’t contain tobacco. |
Tobacco Heating Products (THP) are hand-held devices which heat tobacco. All THPs contain tobacco – this is a key difference from vapour products. However, like vapour products, no burning takes place, resulting in lower toxicant levels. |
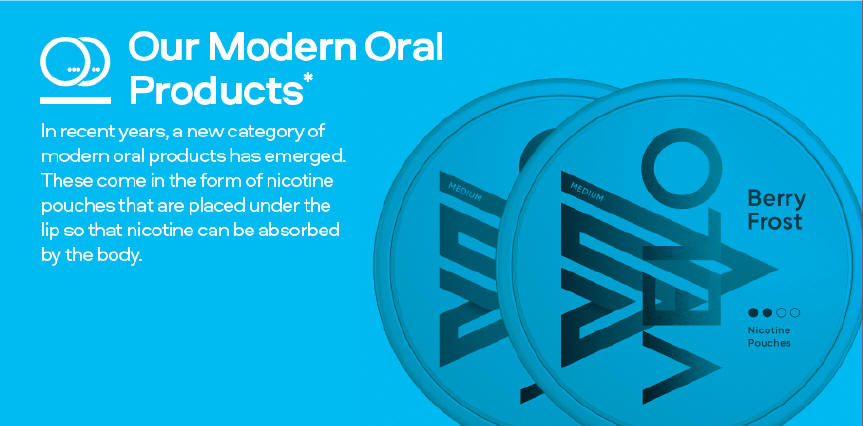
Modern oral products, available both with and without tobacco, are similar in appearance and use to snus, an oral smokeless tobacco product that has been widely used in Sweden since the 1800s. There are decades of research (including epidemiology) on snus, with evidence demonstrating it is a reduced-risk product compared to using traditional cigarettes. |

|
60+ years of R&D |

|
100+ scientists |

|
95% fewer toxicants |

|
1,500 R&D specialists | |||||||
| an important part of BAT for more than 60 years |
designers, engineers and tobacco specialists helped design our THP | emitted by our Vype product, compared to cigarettes** | who predominantly focus on New Category products |
| ** | This product is not risk-free and contains nicotine, an addictive substance. Comparison of smoke from a scientific standard reference cigarette (approximately 9 mg tar) and vapour from Vype ePen3 in terms of the average of the nine harmful components the World Health Organization (WHO) recommends to reduce in cigarette smoke. |
| † | Based on the weight of evidence and assuming a complete switch from cigarette smoking. These products are not risk free and are addictive. |
| 32 | BAT Annual Report and Form 20-F 2020 |
Strategic Management
Unlocking Commercial Value
Digital Transformation across BAT is about leveraging technology to deliver value for consumers, customers, employees, shareholders and society. Technology and data are key enablers of A Better TomorrowTM, and their exponential value is achieved as we ensure the organisation has the skills, ways of working and culture to fully exploit them.

|
our digital transformation even faster.
| |
| Marina Bellini Director, Digital and Information |
| Consumers and Customers | Manufacturing and Supply Chain | Finance, HR and Legal | ||||||||||

|

|

| ||||||||||
| 4.3mn | 5,000+ | 100%+ | ||||||||||
| engagements on social media, improving our New Categories brands performance in digital channels – an increase of 100%+ vs 2019 | SKUs enabled through end-to-end automation, compressing reaction times in a multi-category business | increase in hours saved through digital bots and automation of back-office activities | ||||||||||
|
100+ |
30%+ | 70%+ | 2,900+ | |||
| people newly recruited in data analytics, digital marketing technology, cyber, and new exponential technologies |
Agile delivery of technology solutions across our organisation |
senior leaders who have experienced our new digital immersion programme | new joiners across the organisation remotely on-boarded | |||
|
Strategic Report |
Governance Report | Financial Statements | Other Information | BAT Annual Report and Form 20-F 2020 | 33 | |||||
|
|
Unlocking the Value of Technology and Data to Grow
| Few companies can claim over 150 million daily consumer interactions and over 11 million retail points of sale. Staying connected to all of them, especially through digital, ensures better consumer engagement with brands, innovations and services that can stimulate the senses of new adult generations. | ||||

|
| Decision-making supported by Big Data & Analytics
Significant investments in our Marketing Technology has delivered new capabilities within Social Listening, Social Activation, and Integrated Data Platforms.
|
– Across the organisation, we now have access to 90TB of consumer and other relevant value chain data sources, spanning more than 25 markets.
– Over 1,000 users can now leverage over 30 machine learning models and dashboards to aid decision-making on consumer engagement. |
– Advanced analytics and CRM capabilities are providing unprecedented opportunities to develop consumer journey mapping through industry-leading marketing automation systems.
– Personalised communications delivered to the right consumer at the right time have enabled the growth of consumers in New Categories. This has contributed to 480,000 new THP consumers in Japan. |
9.8m consumers in our database (2019: 7mn) |
| Best-in-class commercial digital experience
Our integrated consumer marketing technology stack provides us with a Single Consumer View which captures all interactions in one place.
|
– A key focus has been creating a mobile-first, consistent e-commerce user experience, and launching a subscriptions capability to increase Consumer Lifetime Value.
– Our Direct-to-Consumer business has been accelerated through the deployment of owned e-commerce sites – taking the number up to over 40 e-commerce store fronts worldwide.
– Owned-Retail stores are being transformed to offer a seamless digital experience. |
– This has been achieved through global Content Management Systems, digital touch points, integrated e-commerce, and CRM.
– Our new subscription services capability has grown by 5x.
– Our powerful business-to-business technology platform now enables over 6 million engagements a month, with fast deployment of best practices for better results for our trade partners. |
| Operational excellence powered by digital
New technologies have enabled the business to respond with greater agility and resilience to the complexity of our growing portfolio in New Categories and the COVID-19 pandemic. |
– We have invested in new cloud-based digital platforms to transform our supply chain which support improved visibility and prediction of demand and allows us to plan concurrently across multiple supply chain nodes.
– By leveraging artificial intelligence and machine learning, we pro-actively manage to our stock-holding policies, sourcing, production, and logistics plans and quickly adapt to changes in the environment. |
– Cloud technology has been leveraged as an accelerator for over 55% of our processes.
– Our Cyber Security team use industry-leading tools and technology. Rapid cyber risk reduction exercises are conducted regularly with advanced internal, and external testing followed by immediate remediations. A strong cyber culture is established within the organisation, supported by cyber simulations, awareness campaigns and customised training programmes. |
200,000 test phishing emails sent across the whole organisation to increase cyber resilience |
|
Strategic Report |
Governance Report | Financial Statements | Other Information | BAT Annual Report and Form 20-F 2020 | 35 | |||||
|
|
| 36 | BAT Annual Report and Form 20-F 2020 |
Strategic Management
Short-Term Deliverables to Fuel A Better TomorrowTM
|
|
Ensure a Step Change in New Categories Performance |

|
Strategic Report |
Governance Report | Financial Statements | Other Information | BAT Annual Report and Form 20-F 2020 | 37 | |||||
|
|
| 38 | BAT Annual Report and Form 20-F 2020 |
Strategic Management
Short-Term Deliverables to Fuel A Better TomorrowTM
|
|
Ensure a Step Change in New Categories Performance
|
|
Strategic Report |
Governance Report | Financial Statements | Other Information | BAT Annual Report and Form 20-F 2020 | 39 | |||||
|
|
| 40 | BAT Annual Report and Form 20-F 2020 |
Strategic Management

|
Strategic Report |
Governance Report | Financial Statements | Other Information | BAT Annual Report and Form 20-F 2020 | 41 | |||||
|
|
Strategic management
Short-Term Deliverables to Fuel A Better TomorrowTM
|
|
Drive Value From Combustibles
|
| 42 | BAT Annual Report and Form 20-F 2020 |
Strategic Management
Short-Term Deliverables to Fuel A Better TomorrowTM
|
|
Drive Value From Combustibles |
|
Strategic Report |
Governance Report | Financial Statements | Other Information | BAT Annual Report and Form 20-F 2020 | 43 | |||||
|
|
Short-Term Deliverables to Fuel A Better TomorrowTM
|
|
Simplify the Business
|
44 BAT Annual Report and Form 20-F 2020 for society and the environment By moving from a business where sustainability has always been important to one where it is front and centre, in all that we do. We are committed to a step-change in our sustainability ambition. We have a number of stretching targets, which we are confident will deliver A Better TomorrowTM for all our stakeholders. These include: increasing our number of non-combustible product consumers from 11 million in 2019 to 50 million by 2030; achieving carbon neutrality by 2030 for our own business activities, and accelerating our existing environmental targets to 2025; and eliminating unnecessary single-use plastic and making all plastic packaging reusable, recyclable or compostable by 2025.A BETTER TOMORROW TM
|
Strategic Report |
Governance Report | Financial Statements | Other Information | BAT Annual Report and Form 20-F 2020 | 45 | |||||
|
|
Our sustainability efforts and commitment to high standards have
received notable independent recognition over the years, including
the following.
| Investor Ratings
Dow Jones Sustainability Indices (DJSI)
We are the only company in our industry listed in the prestigious World Index, representing the world’s top 10% ESG performers. We have achieved inclusion in the indices for 19 consecutive years.
MSCI
We achieved a ‘BBB’ rating in the most recent MSCI ESG Ratings, which help investors identify and understand financially material ESG portfolio risks.
Best-in-class ISS Score
We achieved the highest rating for the ISS Social Disclosures QualityScore, which identifies best-in-class sustainability disclosure practices.
Sustainalytics
We achieved a score of 27.8 in the most recent Sustainalytics ESG Risk Ratings, which give investors insights into financially material ESG risks in their portfolios.
Vigeo Eiris
We scored 47% (up by 5pp from 2019) in the most recent Vigeo Eiris rating. Vigeo Eiris, a rating and research agency, evaluates organisations’ integration of ESG factors into their strategies, operations and management.
CDP Climate A-List
Our A-List inclusion for the second year recognises our actions to cut emissions, mitigate climate risks and contribute to a low-carbon economy. We are also proud to have achieved A- in CDP Water, and to be included in Supplier Engagement Leaderboard. |
Awards and Recognition
Gold Class Sustainability Award
In 2021, we were awarded Gold Class in RobecoSAM’s Sustainability Yearbook, which showcases the best performing companies in terms of financially material ESG metrics.
Vype UK Product of the Year Award
In early 2020, our Vype ePod won in the e-cigarette category at the UK Product of the Year awards – the UK’s largest consumer survey of product innovation.
Global Top Employer
We have been recognised as a Global Top Employer for four consecutive years, acknowledging our commitment to best-in-class working environments and career opportunities.
Financial Times Diversity Leaders Report
We have ranked in the top 10% for two consecutive years. The report recognises organisations that have achieved a diverse and inclusive workforce.
CRRA Reporting Awards – Openness and Honesty
We won the ‘Openness and Honesty’ award for our 2018 Sustainability Report at the 2020 Corporate Register Reporting (CRR) Awards – a testament to our approach to transparently reporting on key ESG challenges.
Disability Confident Committed
We achieved certification in 2020 as a Disability Confident Committed employer under the UK Government’s accreditation scheme.
|
| 46 | BAT Annual Report and Form 20-F 2020 |
Strategic Management
ESG Enablers
As we evolve our Group strategy, we are also evolving our Sustainability Agenda. We are moving ourselves from a business where sustainability has always been important, to one where it is front and centre in all that we do.

H Reducing the HEALTH impact of our business Consumer choice World science -class and Standards regulation
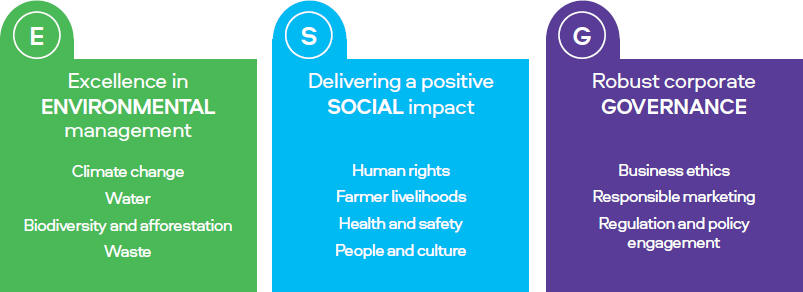
Excellence in Delivering a positive Robust corporate ENVIRONMENTAL SOCIAL impact GOVERNANCE management Climate change Human rights Business ethics Water Farmer livelihoods Responsible marketing Biodiversity and afforestation Health and safety Regulation and policy People and culture engagement Waste

Creating shared value for Consumers Society Employees Shareholders
|
Strategic Report |
Governance Report | Financial Statements | Other Information | BAT Annual Report and Form 20-F 2020 | 47 | |||||
|
|
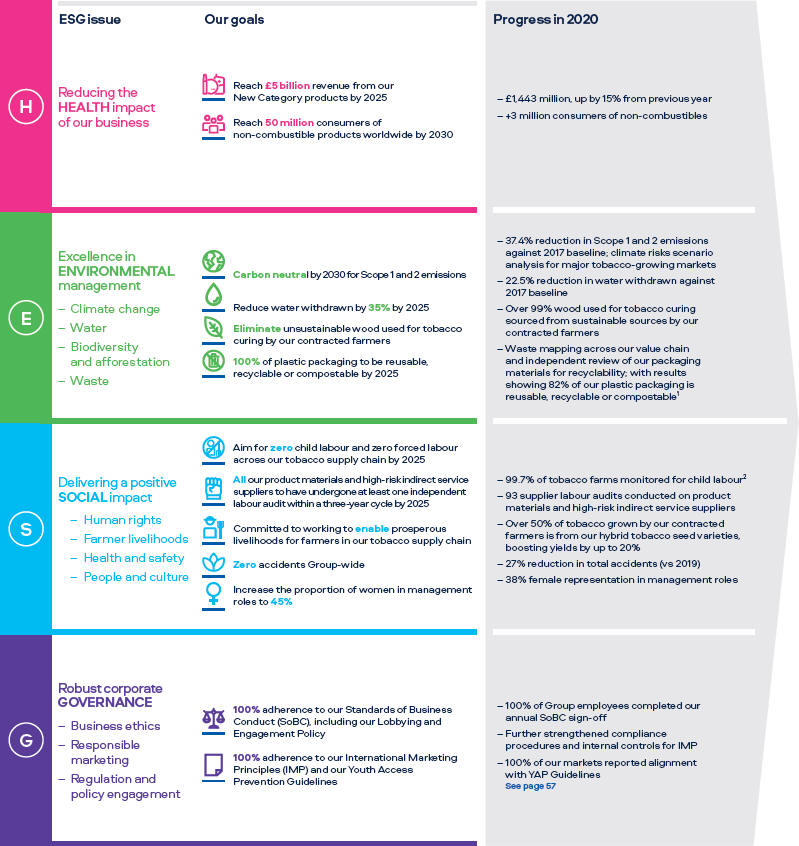
In 2020, we launched our evolved Group strategy focused on building A Better TomorrowTM for all of our stakeholders. As we set about future proofing our business, we have developed a set of ambitious targets that will act as a catalyst for a decade of action.
Our roadmap to A Better Tomorrow™
| 1. | Theoretical ability to be recycled externally assessed. Actual recycling rates may vary across geographies based on local infrastructure. |
| 2. | Reported via our Thrive assessments covering BAT contracted farmers and farmers contracted to our strategic third-party suppliers, representing more than 80% of our total tobacco leaf purchases in 2020. |
| 48 | BAT Annual Report and Form 20-F 2020 |
Strategic Management
We have a comprehensive suite of policies, principles and standards that underpin our commitment to high standards of corporate responsibility and driving excellence in ESG.
| Sustainability: Our policies1 | Summary of areas covered | Stakeholder groups | ||
| Employment Principles | Employment practices, including commitments to diversity, reasonable working hours, family-friendly policies, employee wellbeing, talent, performance and equal opportunities, and fair, clear and competitive remuneration and benefits. |
 Our People
 | ||
| Standards of Business Conduct (SoBC) | Speak Up, conflicts of interest, anti-bribery and anti-corruption, gifts and entertainment, respect in the work place, human rights, lobbying and engagement, political and charitable contributions, corporate assets and financial integrity, competition and anti-trust, anti-money laundering and tax evasion, anti-illicit trade, data privacy and information security. |
| ||
| Environmental Policy | Our commitments to following high standards of environmental protection, adhering to the principles of sustainable development and protecting biodiversity covering our direct operations and supply chain, including agricultural, manufacturing and distribution operations. |
| ||
| Health and Safety Policy | Our commitments to applying the highest standards of health and safety. |
Our People | ||
| Supplier Code of Conduct | Standards required of our suppliers worldwide, including business integrity, anti-bribery and anti-corruption, environmental sustainability, anti-illicit trade and respect for human rights (covering equal opportunities and fair treatment, health and safety, prevention of harassment and bullying, child labour and modern slavery, conflict minerals and freedom of association). |
| ||
| Strategic Framework for Corporate Social Investment (CSI)2 |
Sets out our Group CSI strategy and how we expect our local operating companies to develop, deliver and monitor community investment programmes within two themes: Sustainable Agriculture and Rural Communities; and Empowerment. |
 Governments and Wider Society
 | ||
| International Marketing Principles |
The standards that govern marketing across all our product categories and including the requirement for all our marketing to be targeted at adult consumers only. |
| ||
| Group Data Privacy Policy | The manner in which BAT processes personal data about all individuals, including consumers, employees, contractors and employees of suppliers. | |||
| These policies and principles are endorsed by our Board, apply to all Group companies and support the effective identification, management and mitigation of risks and issues for our business in these and other areas. | ||||
Notes:
1. Further details of our Group policies and principles can be found at www.bat.com/principles
2. Further details of our Strategic Framework for Corporate Social Investment can be found at www.bat.com/csi
|
Strategic Report |
Governance Report | Financial Statements | Other Information | BAT Annual Report and Form 20-F 2020 | 49 | |||||
|
|
Reducing the Health Impact of Our Business
At BAT, we have a clear purpose to build A Better TomorrowTM
by reducing the health impact of our business.
|
World-class science | |||
|
The reduced-risk potential of New Category products needs to be supported by sound science. We conduct cutting-edge research to substantiate the reduced risk potential of our New Category products.
We are gaining significant momentum with our consumers, as satisfying consumer needs effectively is a key indicator of how rapidly we can achieve A Better TomorrowTM.
| ||||

|
Read more about tobacco harm reduction on pages 30 to 31 | |||
| Over the last decade, we have built a team of the best scientific talent. Today, we have over 1,500 dedicated scientists and engineers, generating world-class science and demonstrating the reduced-risk profile of our New Category products compared to smoking.*†
We openly share our science on bat-science.com. To date, we have published over 90 peer-reviewed research papers on our New Category products and the results indicate they have the potential to be significantly less risky than cigarettes. We are continuing to establish more evidence to support this.
| ||||
| * | Based on the weight of evidence and assuming a complete switch from cigarette smoking. These products are not risk free and are addictive. |
| † | Our products as sold in the US, including Vuse, Velo, Grizzly, Kodiak, and Camel Snus, are subject to FDA regulation and no reduced-risk claims will be made as to these products without agency clearance |
| 50 | BAT Annual Report and Form 20-F 2020 |
Strategic Management
Reducing the Health Impact of Our Business
Continued
How we think New Category products
should be regulated

|
Strategic Report |
Governance Report | Financial Statements | Other Information | BAT Annual Report and Form 20-F 2020 | 51 | |||||
|
|
||||||||||
Management
We have a global footprint and rely on natural resources to run our business.
Securing resources in a climate-resilient supply chain is key to delivering our business
strategy. We are driving environmental excellence for a greener tomorrow.
Notes:
| 4. | Data reported includes energy from the combustion of fuel and the operation of any facility. Of the total figure reported for the Group, 10 million kWh is from the UK-based activities. |
| 5. | Group data reported includes electricity purchased and consumed at our factories and offices, purchased steam and hot water. Our UK-based facilities only purchase electricity and do not purchase heat, steam or cooling. Of the total figure reported for the Group, 17 million kWh is from the UK-based activities. |
| 52 | BAT Annual Report and Form 20-F 2020 |
Strategic Management
Excellence in Environmental
Management Continued
|
Strategic Report |
Governance Report | Financial Statements | Other Information | BAT Annual Report and Form 20-F 2020 | 53 | |||||
|
|
| 54 | BAT Annual Report and Form 20-F 2020 |
Strategic Management
Delivering a Positive Societal Impact
Reducing the harm associated with smoking and the opportunity to have a positive impact on public health is the most material issue for our business, but as one of the world’s most international businesses, we also have a larger role to play in delivering a positive societal impact.
|
Strategic Report |
Governance Report | Financial Statements | Other Information | BAT Annual Report and Form 20-F 2020 | 55 | |||||
|
|
| 56 | BAT Annual Report and Form 20-F 2020 |
Strategic Management
Robust governance is key to our sustainable long-term growth. We are
committed to achieving our business objectives in an honest, transparent and
accountable way, and sustaining a culture of integrity in everything we do.
|
|
Delivery with Integrity
Our Delivery with Integrity programme provides a global compliance framework, empowering our people to act in a responsible way.
This programme is led by our Business Conduct & Compliance Department, reporting directly to the Director, Legal & External Affairs and General Counsel.
It provides employees with ways to raise concerns without fear of retaliation and assurance that investigations will be fair and objective.
The Programme drives a consistent approach to the mitigation of key compliance risk areas such as bribery and corruption, money laundering, tax evasion, competition law, sanctions, and data protection through tools and guidance for Group company employees and business units.
Read more about our Group risk factors related to corporate behaviour and compliance with sanctions regimes and competition laws on pages 290 and 300
We monitor regulatory developments to ensure the continued evolution of our Delivery with Integrity programme.
Mitigating third-party risk is a key component of our compliance programme. We do this for example through our Third-Party Anti-Bribery and Corruption Procedure (the ABAC Procedure) which assists business units in identifying and mitigating bribery and corruption risks.
The ABAC Procedure mandates consistent methodology for due diligence of third parties, complemented by mandatory mitigation packages for third parties assessed as medium and high risk.
In 2020, we began a major project to develop a more integrated, automated IT solution for the management of third party-related risks. This project is progressing well and will be implemented by Group companies throughout 2021.
We also launched a new M&A Transactions Compliance Procedure which formalises and strengthens our approach to risk mitigation in the context of corporate acquisitions, disposals and the formation of joint ventures and also a new Gifts and Entertainment (G&E) Procedure which enables the automation of the G&E approval and record-keeping requirements set out in our SoBC. | |||
| Business Ethics
Our actions and behaviours impact all areas of our business, which is why corporate governance is such an important focus for us.
Our commitment to responsible corporate behaviour is underpinned by our SoBC which mandate high standards of integrity and require every Group company, joint venture which the Group controls and all staff worldwide, including senior management and the Board, to act with a high degree of business integrity, comply with applicable laws and regulations and ensure our standards are not compromised for the sake of results. We expect our contractors, secondees, trainees, agents and consultants to act in a way consistent with our SoBC and to apply similar standards within their own organisations. |
Our SoBC comprise our global policies referenced on page 62 and are available in 14 languages. SoBC awareness and understanding is promoted through regular training and communications. Our SoBC are fully aligned with the provisions of applicable laws including the UK Bribery Act, the US Foreign Corrupt Practices Act and the UK Criminal Finances Act.
Corrupt practices are illegal, cause distortion in markets and harm economic, social and political development, particularly in developing countries. Our SoBC make it clear that it is wholly unacceptable for Group companies, our employees or our business partners to be involved or implicated in any way in corrupt practices. We keep our SoBC under regular review to maintain best practice and to take employee and stakeholder feedback into account. Our Board approved a revised version of the SoBC in 2019, which came into effect on 1 January 2020, supported by a global awareness campaign across the Group.
| |||
|
Strategic Report |
Governance Report | Financial Statements | Other Information | BAT Annual Report and Form 20-F 2020 | 57 | |||||
|
|
for employees By having a diverse range of excellent We enable growth by having a people, engaged teams and being a winning and agile organisation. Empowering our people to feel great place to work. they belong and be their best and authentic selves will help enable us to transform the business. We inspire diverse teams of committed and engaged people by: investing in our people; creating a diverse and inclusive culture; developing high-performing leaders; and offering a fulfilling, rewarding and responsible work environment.
|
Strategic Report |
Governance Report | Financial Statements | Other Information | BAT Annual Report and Form 20-F 2020 | 59 | |||||
|
|
Our purpose is to build A Better TomorrowTM by reducing the health impact of our business through offering a greater choice of enjoyable and less-risky products for our consumers.
A key driver to delivering this is our Ethos, which guides our culture and behaviours across the entire Group. Developed with significant input from our employees, it ensures an organisation that is future fit for sustainable growth. These five key principles – bold, fast, empowered, diverse, responsible – underpin how we deliver on both our purpose and our strategy.
|
|
|
|
|
| ||||
| We are | We are | We are | We are | We are | ||||
| Bold | Fast | Empowered | Responsible | Diverse | ||||
| – Dream big – with innovative ideas – Make tough decisions quickly and proudly stand accountable for them – Resilient and fearless to compete |
– Speed matters. Set clear direction and move fast – Keep it simple. Focus on outcomes – Learn quickly and share learnings |
– Set the context for our teams and trust their expertise – Challenge each other. Once in agreement, we commit collectively – Collaborate and hold each other accountable to deliver |
– Take action to reduce the health impact of our business – Ensure the best quality products for our consumers, the best place to work for our people, and the best results for shareholders – Act with integrity, never compromising our standards and ethics |
– Value different perspectives – Build on each others’ ideas, knowledge and experiences – Challenge ourselves to be open-minded recognising unconscious bias | ||||
|
|
 BAT has been exceptionally resilient in what has been an unusually challenging year. This is down to the grit and determination of our colleagues and our culture of high performance and engagement. We believe that our
Ethos is crucial to our success and a key part of this is our diversity and inclusion agenda that has always been very important to us at BAT. Having a supportive, engaging and inclusive culture where everyone is treated equally is fundamental
to
BAT has been exceptionally resilient in what has been an unusually challenging year. This is down to the grit and determination of our colleagues and our culture of high performance and engagement. We believe that our
Ethos is crucial to our success and a key part of this is our diversity and inclusion agenda that has always been very important to us at BAT. Having a supportive, engaging and inclusive culture where everyone is treated equally is fundamental
to | |||
| the continued success of our business. |

| |||
|
Hae In Kim Director, Talent, Culture and Inclusion |
||||
| 60 | BAT Annual Report and Form 20-F 2020 |
Strategic Management
Diversity matters to the Group because it makes good commercial sense.
Having a diverse workforce means we are better able to understand and
meet the varied preferences of our global consumers. We are proud of our
diversity and inclusion (D&I) strategy, which is built on the following three
pillars and underpinned by an inclusive culture.
| Pillar 1 | Pillar 2 |
Pillar 3 | ||||||
| Driving ownership and accountability | Building diverse talent pipelines | Creating enablers | ||||||
|
Ensuring ownership of, and accountability for, our D&I strategy across all business areas and leadership teams is key to driving progress and achieving our 2025 ambitions.
Our Director for Talent, Culture and Inclusion has overall responsibility for all employee and human resources matters, while our Management Board oversees the development and management of talent within the Group’s regions and functions.
In 2020, we realigned our D&I governance structure to ensure clear accountability for our business leaders and leadership teams for achieving our 2025 ambitions. This included developing a new D&I dashboard and introducing quarterly reviews by our Management Board to ensure close monitoring of progress and plans. Diversity also remains fully embedded in our talent review processes and meetings across all levels of the Group.
Our ‘Diversity Champions’ continue to be key in driving D&I action plans and initiatives throughout the organisation. In 2020, we launched a new D&I e-learning module to help further empower our people and increase their awareness. |
We focus on building diverse talent pipelines at all levels of the organisation through recruiting, developing and retaining the best diverse talent.
Inclusivity is embedded throughout our recruitment process and we require all agencies we work with to provide gender-balanced longlists of candidates.
Today, we have 33% female representation on our Board, 15% on our Management Board and 27% on our senior leadership teams across the Group. We also have 139 different nationalities, from a wide range of ethnic backgrounds, in management roles across the Group.
In 2020, we set new D&I ambitions to achieve by 2025, including:
– Increasing the proportion of women in senior leadership teams to 40%;
– Increasing the proportion of women in management roles to 45%; and
– Achieving a 50% spread of distinct nationalities within key leadership teams.
Read about our Global Graduate Programme at www.bat-careers.com/graduates |
To realise our diversity ambitions, we know we must have enablers in place that provide a supportive environment for people to thrive and realise their full potential.
We provide women and diverse groups with an opportunity to connect, engage and share experiences. Currently, we have 19 affinity networks across all levels of the Group, including our Women in BAT UK and our B-United LGBT+ communities. During the COVID-19 pandemic, these networks had an even more important role to play in keeping our people connected and supporting one another.
We work to continually raise awareness of diversity issues through campaigns and events that showcase best practice and provide platforms for role models to amplify their profiles across the Group. For example, our International Women’s Day (IWD) campaigns have been recognised as best practice by the IWD Association for two consecutive years. | ||||||
|
Strategic Report |
Governance Report | Financial Statements | Other Information | BAT Annual Report and Form 20-F 2020 | 61 | |||||
|
|
| 62 | BAT Annual Report and Form 20-F 2020 |
Strategic Management
People and Culture
Continued
Our policies and principles*
| Summary of areas covered | Stakeholder groups | |||||
| Employment Principles | Employment practices, including commitments to diversity, reasonable working hours, family-friendly policies, employee wellbeing, talent, performance and equal opportunities, and fair, clear and competitive remuneration and benefits. |
|
||||
| Health and Safety Policy | Health, safety and welfare of all employees, other members of our workforce and third-party personnel. |
| ||||
| Standards of Business Conduct (SoBC) | Respect in the work place, including promoting equality and diversity, preventing harassment and bullying, and safeguarding employee wellbeing.
|

|
||||
| Group Data Privacy Policy | The manner in which BAT processes personal data about all individuals, including consumers, employees, contractors and employees of suppliers. |
| ||||
| These policies and principles are endorsed by our Board, apply to all Group companies and support the effective identification, management and mitigation of risks and issues for our business in these and other areas. | ||||||
* Further details of our Group policies and principles can be found at www.bat.com/principles
|
Strategic Report |
Governance Report | Financial Statements | Other Information | BAT Annual Report and Form 20-F 2020 | 63 | |||||
|
|
Our inclusive recruitment process

|
|
|

| |||
|
Step 1
Online application
– We use a global online recruitments platform for all applications.
– Candidates undergo an initial online assessment managed by an independent provider. |
Step 2
CV screening and video interview
– Unbiased CV screening with factors such as ethnicity, age and gender excluded.
– Video interview with standardised questions and time frame to give all candidates an equal edge. |
Step 3
Face-to-face assessment and interview
– Every candidate is assessed twice, by different BAT managers, and the scores are then calibrated.
– Interviews are conducted according to clear guidelines for fairness and inclusivity. |
Step 4
Hiring and contracting
– Final decision to hire made by at least two BAT managers against clear criteria.
– Robust pre-employment checks and easy-to-understand contracts. |
64 BAT Annual Report and Form 20-F 2020for shareholders By delivering sustainable @We are confident in our growth and superior returns. outlook and have a proven record of performance, whatever the external environment. We aim to deliver: 3-5% revenue growth over the medium term (post COVID-19); high-single digit adjusted EPS growth at constant rates of exchange (post COVID-19), over the medium term; 65% dividend payout ratio; and deleveraging the balance sheet to around 3x adjusted net debt/ adjusted EBITDA by the end of 2021@. 64 BAT Annual Report and Form 20-F 2020 A BETTER TINIRRIW TN for shareholders By delivering sustainable and superior returns
|
Strategic Report |
Governance Report | Financial Statements | Other Information | BAT Annual Report and Form 20-F 2020 | 65 | |||||
|
|
Summary
| – | Revenue growth, driven by New Categories and Combustibles despite the COVID-19 challenges, was offset by currency headwinds; |
| – | Profit from operations was up 10.5% or 4.8% excluding adjusting items and at constant rates of exchange despite increase in New Category investment of £426 million; |
| – | Diluted earnings per share increased 12.0%. Adjusted diluted earnings per share was up 2.4%, or 5.5% at constant rates; |
| – | Strong cash generation drove continued deleveraging; and |
| – | Dividend per share was up 2.5% at 215.6p. |
Reconciliation of revenue to adjusted revenue at constant rates
| 2020 | 2019 | 2018 | ||||||||||||||||||
| £m | Change % (vs 2019) |
£m | Change % (vs 2018) |
£m | ||||||||||||||||
| Revenue |
25,776 | -0.4 | % | 25,877 | +5.7 | % | 24,492 | |||||||||||||
| Adjusting items |
– | – | (50 | ) | – | (180 | ) | |||||||||||||
| Adjusted revenue |
25,776 | -0.2 | % | 25,827 | +6.2 | % | 24,312 | |||||||||||||
| Impact of exchange |
894 | – | (144 | ) | – | – | ||||||||||||||
| Adjusted revenue at constant rates |
26,670 | +3.3 | % | 25,683 | +5.6 | % | 24,312 | |||||||||||||
| 66 | BAT Annual Report and Form 20-F 2020 |
Financial Review
Financial Performance Summary
Continued
Analysis of profit from operations, net finance costs and results from associates and joint ventures
| 2020 | 2019 | |||||||||||||||||||||||||||||||
| Reported £m |
Adjusting items £m |
Adjusted £m |
Impact of exchange £m |
Adjusted at CC £m |
Reported £m |
Adjusting items £m |
Adjusted £m |
|||||||||||||||||||||||||
| Profit from operations |
||||||||||||||||||||||||||||||||
| US |
4,975 | 809 | 5,784 | 32 | 5,816 | 4,410 | 626 | 5,036 | ||||||||||||||||||||||||
| APME |
1,472 | 381 | 1,853 | 56 | 1,909 | 1,753 | 306 | 2,059 | ||||||||||||||||||||||||
| AmSSA |
1,553 | 65 | 1,618 | 178 | 1,796 | 1,204 | 638 | 1,842 | ||||||||||||||||||||||||
| ENA |
1,962 | 148 | 2,110 | 30 | 2,140 | 1,649 | 544 | 2,193 | ||||||||||||||||||||||||
| Total regions |
9,962 | 1,403 | 11,365 | 296 | 11,661 | 9,016 | 2,114 | 11,130 | ||||||||||||||||||||||||
| Net finance (costs)/income |
(1,745 | ) | 153 | (1,592 | ) | (20 | ) | (1,612 | ) | (1,602 | ) | 80 | (1,522 | ) | ||||||||||||||||||
| Associates and joint ventures |
455 | (13 | ) | 442 | 26 | 468 | 498 | (25 | ) | 473 | ||||||||||||||||||||||
| Profit before tax |
8,672 | 1,543 | 10,215 | 302 | 10,517 | 7,912 | 2,169 | 10,081 | ||||||||||||||||||||||||
|
Strategic Report |
Governance Report | Financial Statements | Other Information | BAT Annual Report and Form 20-F 2020 | 67 | |||||
|
|
Analysis of profit from operations, net finance costs and results from associates and joint ventures
| 2019 | 2018 | |||||||||||||||||||||||||||||||
| Reported £m |
Adjusting items £m |
Adjusted £m |
Impact of exchange £m |
Adjusted at CC £m |
Reported £m |
Adjusting items £m |
Adjusted £m |
|||||||||||||||||||||||||
| Profit from operations |
||||||||||||||||||||||||||||||||
| US |
4,410 | 626 | 5,036 | (238 | ) | 4,798 | 4,006 | 505 | 4,511 | |||||||||||||||||||||||
| APME |
1,753 | 306 | 2,059 | 43 | 2,102 | 1,858 | 90 | 1,948 | ||||||||||||||||||||||||
| AmSSA |
1,204 | 638 | 1,842 | 70 | 1,912 | 1,544 | 194 | 1,738 | ||||||||||||||||||||||||
| ENA |
1,649 | 544 | 2,193 | 27 | 2,220 | 1,905 | 245 | 2,150 | ||||||||||||||||||||||||
| Total regions |
9,016 | 2,114 | 11,130 | (98 | ) | 11,032 | 9,313 | 1,034 | 10,347 | |||||||||||||||||||||||
| Net finance (costs)/income |
(1,602 | ) | 80 | (1,522 | ) | 56 | (1,466 | ) | (1,381 | ) | (4 | ) | (1,385 | ) | ||||||||||||||||||
| Associates and joint ventures |
498 | (25 | ) | 473 | (7 | ) | 466 | 419 | (32 | ) | 387 | |||||||||||||||||||||
| Profit before tax |
7,912 | 2,169 | 10,081 | (49 | ) | 10,032 | 8,351 | 998 | 9,349 | |||||||||||||||||||||||
| 68 | BAT Annual Report and Form 20-F 2020 |
Financial Review
Financial Performance Summary
Continued
| Deferred tax asset/(liability) | ||||||||||||
| 2020 £m |
2019 £m |
2018 £m |
||||||||||
| Opening balance |
(16,626 | ) | (17,432 | ) | (16,796 | ) | ||||||
| Difference on exchange |
506 | 680 | (1,011 | ) | ||||||||
| Changes in tax rates |
133 | 47 | 70 | |||||||||
| Other credits/(charges) to the income statement |
184 | (55 | ) | 304 | ||||||||
| Other credits/(charges) to other comprehensive income |
23 | 138 | (7 | ) | ||||||||
| Other movements |
– | (4 | ) | 8 | ||||||||
| Closing balance |
(15,780 | ) | (16,626 | ) | (17,432 | ) | ||||||
|
Strategic Report |
Governance Report | Financial Statements | Other Information | BAT Annual Report and Form 20-F 2020 | 69 | |||||
|
|
|
The discussion of 2018 results that are not necessary to an understanding of the Group’s financial condition, changes in financial condition and results of operations is excluded from this Financial Review in accordance with applicable US Securities laws. Discussion of such 2018 metrics is contained in the Group’s Annual Report on Form 20-F 2019, which is available at bat.com/annualreport and has been filed with the SEC. Information contained in pages 34 to 37, pages 43 to the first column on page 50 and from the heading ‘Retirement benefit schemes’ on page 50 to page 51 of the Annual Report on Form 20-F 2019 are accordingly incorporated by reference into this Annual Report on Form 20-F 2020 only to the extent such information pertains to the Group’s financial condition and results of operations for the fiscal year ended 31 December 2018.
|
|
Strategic Report |
Governance Report | Financial Statements | Other Information | BAT Annual Report and Form 20-F 2020 | 71 | |||||
|
|
| 72 | BAT Annual Report and Form 20-F 2020 |
|
Strategic Report |
Governance Report | Financial Statements | Other Information | BAT Annual Report and Form 20-F 2020 | 73 | |||||
|
|
| Foreign exchange rates
|
||||||||||||||||||||||||
| Average | Closing | |||||||||||||||||||||||
| 2020 | 2019 | 2018 | 2020 | 2019 | 2018 | |||||||||||||||||||
| Australian dollar |
1.862 | 1.836 | 1.786 | 1.771 | 1.885 | 1.809 | ||||||||||||||||||
| Brazilian real |
6.616 | 5.035 | 4.868 | 7.100 | 5.329 | 4.936 | ||||||||||||||||||
| Canadian dollar |
1.720 | 1.694 | 1.730 | 1.741 | 1.718 | 1.739 | ||||||||||||||||||
| Euro |
1.125 | 1.140 | 1.130 | 1.117 | 1.180 | 1.114 | ||||||||||||||||||
| Indian rupee |
95.097 | 89.898 | 91.227 | 99.880 | 94.558 | 88.916 | ||||||||||||||||||
| Japanese yen |
137.017 | 139.234 | 147.376 | 141.131 | 143.967 | 139.733 | ||||||||||||||||||
| Russian rouble |
92.844 | 82.623 | 83.677 | 101.106 | 82.282 | 88.353 | ||||||||||||||||||
| South African rand |
21.099 | 18.437 | 17.643 | 20.079 | 18.525 | 18.321 | ||||||||||||||||||
| US dollar |
1.284 | 1.277 | 1.335 | 1.367 | 1.325 | 1.274 | ||||||||||||||||||
| 74 | BAT Annual Report and Form 20-F 2020 |
|
Strategic Report |
Governance Report | Financial Statements | Other Information | BAT Annual Report and Form 20-F 2020 | 75 | |||||
|
|
|
Delivering on our New Categories
The US business is transforming into a New Categories-oriented business, fuelled by reinvestments from the consistent, industry-leading value growth in the tobacco categories. This involves a major brand-building effort focused on the two global brands, Vuse in Vapour and Velo in Modern Oral, improved trade execution at the point of sale and accelerated development of digital capabilities. This is underpinned by R&D and scientific expertise which, as well as ensuring product quality and stewardship, have enabled us to comply with the extensive FDA PMTA requirements in 2020 and establish a future product pipeline.
The acquisition of certain Dryft Modern Oral assets, completed in Q4 2020, enables a significant expansion of the Velo product range into the high-growth >6mg nicotine segment, and into multiple new flavours – the next step in the transformation journey.
|
|
Our Strategy in Action
Vuse in the US
Vuse has achieved very strong growth in 2020, with consumable volume up 70%, achieved despite the decline in the vapour industry, which has recovered only gradually since its major decline in Q4 2019 following the EVALI crisis.
Vuse growth has been particularly strong since June, following the amelioration of COVID-19 related supply constraints earlier in the year. Since June, Vuse has been by far the fastest growing brand in vapour, both in devices (achieving >60% volume share in Q4 2020) and in cartridges, with value share growth in the second half of the year of 500 bps.
With cartridge volume and value share growing strongly, Vuse is the market leader (by value) in 15 States. The drive to continue and build on this growth is ongoing while also meeting the extensive FDA PMTA requirements.
In this environment, new Vuse Single pod and Quad pods were launched in December 2020, together with progressive improvements in digital and e-commerce capabilities.
|
| 76 | BAT Annual Report and Form 20-F 2020 |
|
Strategic Report |
Governance Report | Financial Statements | Other Information | BAT Annual Report and Form 20-F 2020 | 77 | |||||
|
|
|
Delivering on our New Categories
Exceptional performance in New Categories is due to a focus on a high-performance vapour device platform (ePod) combined with a consumer calibrated portfolio of unique flavours.
Our performance is enabled by bespoke technology and creative execution via a series of limited-edition devices that resonate with consumers seeking personal expression.
Excellence in execution drove sales primarily through own channels (online/retail) supported by exclusive availability on digital platforms which sustained demand in the pandemic when traditional retail was temporarily suspended.
Underpinning this is transformation of our capabilities in managing own retail, building own e-commerce with relevant consumer benefits while constantly screening new avenues to reach adult consumers directly via other partners’ solutions.
|
|
Our Strategy in Action
Vapour in Canada
The rise of Vype/Vuse to the number 1 vapour brand in Canada in less than three years demonstrates an offer that resonates with the consumer. The migration to Vuse fuelled this with the introduction of award-winning iconic pack expression that set Vuse apart on the shelf and conveyed the breadth of flavours on offer.
Meeting consumers’ growing demand for new sensorial experiences saw the deployment of a pipeline of unique flavours brought to life via creative technologies.
Our retail presence provided a foundation for scale to developing direct consumer engagement / offers, while our e-commerce revenue growth is attributed to going beyond a transactional relationship by offering subscription, delivery and personalisation. Faced with constant regulatory changes, we have responded with speed and agility to ensure consumer retention.
|
| 78 | BAT Annual Report and Form 20-F 2020 |
|
Strategic Report |
Governance Report | Financial Statements | Other Information | BAT Annual Report and Form 20-F 2020 | 79 | |||||
|
|
|
Delivering on our
We are resolute in our pursuit of the opportunities in New Categories in ENA.
In 2020, we are the leader in Vapour in ENA. Vype is the number one closed systems brand in the key markets of the UK, France, Germany and Poland. This was fuelled by strong performances of both product platforms, Vype ePen3 and Vype ePod. The Vype-to-Vuse migration is under way and is planned to be completed in 2021.
Also in 2020, we introduced glo Hyper in Russia, the second largest THP market in the world, expanding to more than 150 of the largest cities in Russia in the second half of the year. This has been delivered by highly differentiated digital and direct to consumer activation, with excellent results across the major cities.
During 2020, new product launches across innovative flavours and packaging solutions have consolidated our leadership position in 14 out of the 17 Modern Oral markets where we are present, with the fastest growing brand in the remaining three markets.
|
|
Our Strategy in Action
United Kingdom
Just five years after launching Vype in the UK, we have achieved value share leadership in the category. A third of our revenue in the UK is now coming from Vapour products.
Vype increased its value share of closed systems to 26% (2019: 20%), driven by the successful launch of ePod and continued success of ePen as the market transitions following the menthol ban.
Our ambitions are driven by:
– the continued development of closed systems; and
– success in e-commerce, which emerged during 2020. This benefited from an overhaul of the user experience and introduction of a subscription model, ensuring we provide a range of offers that are attractive to both our consumers and the Group.
| ||||
| 80 | BAT Annual Report and Form 20-F 2020 |
|
Strategic Report |
Governance Report | Financial Statements | Other Information | BAT Annual Report and Form 20-F 2020 | 81 | |||||
|
|
|
Delivering on our
Acceleration of the learning agenda in APME has taken place through the roll-out of a digital pilot model which enables in-depth, real-time consumer insights generation and development of the optimal marketing mix. This has recently been deployed successfully with the launch of Velo in Indonesia.
We have ambitious expansion plans for 2021 and beyond, prioritising consumer and commercial opportunities, to support the Group’s ambition to deliver a step change in New Categories with category leadership within Modern Oral across APME. This is supported by a regulatory engagement roadmap to unlock opportunity markets.
|
|
Our Strategy in Action
Digital Transformation
Marketing Technology capabilities were enhanced to broaden and deepen our understanding of consumers, enabling detailed consumer profiling, personalised consumer journeys and improved conversion – leading to the acquisition of c.250k new consumers into glo.
Real-time performance tracking has also been integrated within the digital ecosystem, which has enabled faster and more agile insight-led decision-making. The digital-first approach has accelerated the e-commerce agenda which has so far seen significant improvement in e-commerce traffic (up 290%), device sales (up 225%) and revenue contribution (up 320%) in 2020.
|
||||
| 82 | BAT Annual Report and Form 20-F 2020 |
Engaging With Our Stakeholders
Engaging With
Our Stakeholders

|
which we operate.
Jerry Abelman Director, Legal & External Affairs and General Counsel |
|
|
Consumers
|
|
Shareholders/ Bondholders
|
|
Our people
| |||||||||
|
Why
this
|
As preferences and attitudes change in an evolving industry, understanding our consumers is essential to both successful portfolio and business growth. |
It is essential that we maintain the support of our shareholders and bondholders to maintain access to capital. This allows us to implement our strategy and achieve our business objectives. |
The quality of our people is a major reason why our Group continues to perform well. We understand the value of listening and responding to feedback from our people to maintain a fulfilling, rewarding and responsible work environment. | |||||||||||
|
|
|
| ||||||||||||
|
Examples of how we engaged in 2020 |
– Consumer panels, focus groups and interviews
– Product testing
– Consumer care helplines
– Responsible advertising and marketing
– Pack inserts/product leaflets
– Real-time digital platforms
– Clinical trials
|
– Annual General Meeting
– Investor relations programme
– Institutional shareholder meetings
– Capital Markets Days
– Investor roadshows
– Results announcements
– Annual Report & Form 20-F
– ESG Report
– Stock exchange announcements
– Shareholder information on website
|
– Director market and site visits
– Virtual forums
– Employee town halls
– Global and regional webcasts
– ‘Your Voice’ employee survey
– Works councils and European Employee Council meetings
– Graduate and management trainee events
– Individual performance reviews
– Speak Up channels
| |||||||||||
|
|
Read more pages 29 to 43 and 98 |
|
Read more pages 97, 117 to 119 |
|
Read more pages 62, 63, 98 and 122 | |||||||||
|
|
|
| ||||||||||||
|
What matters to our stakeholders |
– Product harm, addiction and social considerations
– Product quality
– Affordability and price
– Ingredients/nicotine levels
– Plastics/post-consumption product waste
– COVID-19 impacts |
– Business performance
– ESG Agenda
– Corporate governance
– Strength of Group leadership
– Board succession planning |
– Reward
– Career development
– Diversity and inclusion
– Corporate responsibility
– Health and safety
– Business ethics | |||||||||||
|
|
|
| ||||||||||||
|
How we respond |
– Development of innovative products
– Product stewardship, quality and safety standards
– Clear and accurate product information
– International Marketing Principles
– Circular economy strategy |
– Regular dialogue and communications with shareholders
– Robust corporate governance
– Enhanced ESG reporting
– Continual improvement of our Delivery with Integrity programme
– Our range of enjoyable and innovative products
– Product quality and safety standards
– International Marketing Principles |
– Extensive communications and virtual engagement with employees worldwide during the pandemic
– Board review of and feedback on workforce engagement
– Training and development programme
– Diversity & Inclusion Strategy
– Delivery with Integrity programme | |||||||||||
| Strategic impact |

|
|

| |||||||||||
|
Principal risk impact |
– Market size reduction / consumer downtrading
– Inability to develop, commercialise and deliver New Categories
– Significant excise increases |
– Solvency and liquidity
– Foreign exchange rate exposures
– Disputed taxes, interest and penalties
– Litigation
– Market size reduction/ consumer downtrading |
– Injury, illness or death in the work place
– Geopolitical tensions | |||||||||||
|
Strategic Report |
Governance Report | Financial Statements | Other Information | BAT Annual Report and Form 20-F 2020 | 83 | |||||
|
|
|
Strategic Report |
Governance Report | Financial Statements | Other Information | BAT Annual Report and Form 20-F 2020 | 85 | |||||
|
|
Risks
Competition from illicit trade
Increased competition from illicit trade and illegal products – either local duty evaded, smuggled, counterfeits, or non-regulatory compliant.
| Time frame | Strategic impact
|
Key Stakeholders
|
||||
|
Short/Long-term |

|

|
||||
| Impact | ||||||
| Erosion of goodwill, with lower volumes and reduced profits.
Reduced ability to take price increases.
Investment in trade marketing and distribution is undermined.
Counterfeit New Categories products and other illicit products could harm consumers, damaging goodwill, and/or the category (with lower volumes and reduced profits), potentially leading to misplaced claims against BAT and further regulation. |
. | |||||
| Tobacco, New Categories and other regulation interrupts growth strategy | ||||||
| The enactment of regulation that significantly impairs the Group’s ability to communicate, differentiate, market or launch its products. | ||||||
| Time frame | Strategic impact
|
Key Stakeholders
|
||||
|
Medium-term |
|
|
||||
| Impact
Erosion of brand value through commoditisation and the inability to launch innovations, differentiate products, maintain or build brand equity and leverage price.
Regulation in respect of menthol, nicotine levels and New Categories may adversely impact individual brand portfolios.
Adverse impact on ability to compete within the legitimate tobacco, nicotine or New Categories industry and with illicit traders.
Reduced consumer acceptability of new product specifications, leading to consumers seeking alternatives in illicit markets.
Shocks to share price on the announcement or enactment of restrictive regulation.
Reduced ability to compete in future product categories and make new market entries.
Increased scope and severity of compliance regimes in new regulation leading to higher costs, greater complexity and potential reputational damage or fines for inadvertent breach.
EU Directive on single-use plastics could result in increased operational costs and/or adverse impact on sales volume and profit. |
||||||
|
|
Please refer to pages 307 to 310 for details of tobacco and nicotine regulatory regimes under which the Group’s businesses operate. |
| 86 | BAT Annual Report and Form 20-F 2020 |
Group Principal Risks
Group Principal Risks
Continued
Inability to develop, commercialise and deliver the New Categories strategy
Risk of not capitalising on the opportunities in developing and commercialising successful, safe and consumer-appealing innovations.
| Time frame
|
Strategic impact
|
Key Stakeholders
|
||||
|
Long-term |

|
|
||||
| Impact | ||||||
| Failure to deliver Group strategic imperative, 2025 growth ambition (previously 2024) and 2030 consumer targets.
Potentially missed opportunities, unrecoverable costs and/or erosion of brand, with lower volumes and reduced profits.
Reputational damage and recall costs may arise in the event of defective product design or manufacture.
Loss of market share due to non-compliance of product portfolio with regulatory requirements.
|
||||||
| Market size reduction and consumer down-trading | ||||||
| The Group is faced with steep excise-led price increases and, due in part to the continuing difficult economic and regulatory environment in many countries, market contraction and consumer down-trading is a risk. | ||||||
| Time frame |
Strategic impact
|
Key Stakeholders
|
||||
|
Short/Medium-term |

|
|
||||
| Impact
Volume decline and portfolio mix erosion leading to lower profitability.
Funds to invest in growth opportunities are reduced. |
||||||
| Litigation | ||||||
| Product liability, regulatory or other significant cases (including investigations) may be lost or settled resulting in a material loss or other consequence. | ||||||
| Time frame | Strategic impact
|
Key Stakeholders
|
||||
|
Long-term |
|
|
||||
| Impact
Damages and fines, negative impact on reputation, disruption and loss of focus on the business.
Consolidated results of operations, cash flows and financial position could be materially affected, in a particular fiscal quarter or fiscal year, by region or country, by an unfavourable outcome or settlement of pending or future litigation, criminal prosecution or other contentious action.
Inability to sell products as a result of patent infringement action may restrict growth plans and competitiveness. |
||||||
|
|
Please refer to note 27 in the Notes on the Accounts for details of contingent liabilities applicable to the Group. |
|
Strategic Report |
Governance Report | Financial Statements | Other Information | BAT Annual Report and Form 20-F 2020 | 87 | |||||
|
|
Significant increases or structural changes in tobacco, nicotine and New Categories related taxes
The Group is exposed to unexpected and/or significant increases or structural changes in tobacco, nicotine and New Categories related taxes in key markets.
| Time frame |
Strategic impact
|
Key Stakeholders
|
||||
|
Long-term |
|

|
||||
| Impact | ||||||
| Consumers reject the Group’s legitimate tax-paid products for products from illicit sources or cheaper alternatives.
Reduced legal industry volumes.
Reduced sales volume and/or portfolio erosion.
Partial absorption of excise increases leading to lower profitability. |
||||||
| Foreign exchange rate exposures | ||||||
| The Group faces translational and transactional foreign exchange (FX) rate exposure for earnings/cash flows from its global businesses. | ||||||
| Time frame |
Strategic impact
|
Key Stakeholders
|
||||
|
Short/Medium-term |
|

|
||||
| Impact
Fluctuations in FX rates of key currencies against sterling introduce volatility in reported earnings per share (EPS), cash flow and the balance sheet driven by translation into sterling of our financial results and these exposures are not normally hedged.
The dividend may be impacted if the payout ratio is not adjusted.
Differences in translation between earnings and net debt may affect key ratios used by credit rating agencies.
Volatility and/or increased costs in our business, due to transactional FX, may adversely impact financial performance. |
||||||
| Geopolitical tensions | ||||||
| Geopolitical tensions, civil unrest, economic policy changes, global health crises, terrorism and organised crime have the potential to disrupt the Group’s business in multiple markets. | ||||||
| Time frame |
Strategic impact
|
Key Stakeholders
|
||||
|
Medium-term |
|

|
||||
| Impact
Potential loss of life, loss of assets and disruption to supply chains and normal business processes.
Increased costs due to more complex supply chain arrangements and/or the cost of building new facilities or maintaining inefficient facilities.
Lower volumes as a result of not being able to trade in a country.
Higher taxes or other costs of doing business as a foreign company or the loss of assets as a result of nationalisation. |
||||||
| 88 | BAT Annual Report and Form 20-F 2020 |
Group Principal Risks
Group Principal Risks
Continued
Solvency and liquidity
Liquidity (access to cash and sources of finance) is essential to maintaining the Group as a going concern in the short term (liquidity) and medium term (solvency).
| Time frame |
Strategic impact
|
Key Stakeholders
|
||||
|
Short/Medium-term |

|
|
||||
| Impact | ||||||
| Inability to fund the business under the current capital structure resulting in missed strategic opportunities or inability to respond to threats.
Decline in our creditworthiness and increased funding costs for the Group.
Requirement to issue equity or seek new sources of capital.
Reputational risk of failure to manage the financial risk profile of the business, resulting in an erosion of shareholder value reflected in an underperforming share price. |
||||||
| Injury, illness or death in the workplace | ||||||
| The risk of injury, death or ill health to employees and those who work with the business is a fundamental concern of the Group and can have a significant effect on its operations. | ||||||
| Time frame |
Strategic impact
|
Key Stakeholders
|
||||
|
Short-term |
|
|
||||
| Impact
Serious injuries, ill health, disability or loss of life suffered by employees and the people who work with the Group.
Exposure to civil and criminal liability and the risk of prosecution from enforcement bodies and the cost of associated legal costs, fines and/or penalties.
Interruption of Group operations if issues are not addressed immediately.
High staff turnover or difficulty recruiting employees if perceived to have a poor Environment, Health and Safety (EHS) record.
Reputational damage to the Group. |
||||||
| Disputed taxes, interest and penalties | ||||||
| The Group may face significant financial penalties, including the payment of interest, in the event of an unfavourable ruling by a tax authority in a disputed area. | ||||||
| Time frame |
Strategic impact
|
Key Stakeholders
|
||||
|
Short/Medium-term |
|

|
||||
| Impact
Significant fines and potential legal penalties.
Disruption and loss of focus on the business due to diversion of management time.
Impact on profit and dividend. |
||||||
|
|
Please refer to note 27 in the Notes on the Accounts for details of contingent liabilities applicable to the Group. |
|
The Strategic Report was approved by the Board of Directors on 16 February 2021 and signed on its behalf by Paul McCrory, Company Secretary.
|
| 90 | BAT Annual Report and Form 20-F 2020 |
Governance
Chairman’s Introduction on Governance
Continued
| 92 | BAT Annual Report and Form 20-F 2020 |
Governance
As at 16 February 2021
|
Appointed: Chairman since November 2009; Non-Executive Director since September 2009.
Experience: Richard was Chief Executive of Irish Distillers, Co-Chief Executive of Pernod Ricard, Governor of the Bank of Ireland and is a Fellow of the Institute of Chartered Accountants of Ireland. Prior to joining the Board, Richard was Governor of the Bank of Ireland. Richard previously served as Chairman of the National Development Corporation, President of the Irish Business and Employers Confederation, Chairman of the Scotch Whisky Association, Chairman of Craven House Capital plc and as Senior Independent Director of Rentokil Initial plc.
Relevant skills and contribution to the Board: Richard has considerable consumer goods, international business and financial experience, ranging from leading successful branded manufacturing and service businesses to banking and financial services roles. He is an experienced non-executive director and brings a variety of perspectives.
External appointments: Supervisory Board member and Chairman of the Remuneration Committee at Carlsberg A/S. |
Appointed: Chairman Designate from 1 March 2021; Non-Executive Director since July 2017.
Experience: Luc was President and Chief Executive Officer of Canadian National Railway Company from July 2016 until March 2018, having served as Executive Vice President and Chief Financial Officer since 2009. Previously, he was Executive Vice President of Power Corporation of Canada (an international financial services company) from 2005 to 2009. Luc was Chief Executive Officer of Imperial Tobacco Canada from 2003 to 2005 and Executive Vice President and Chief Financial Officer from 1998 to 2003. Luc previously served as an independent Non-Executive Director of Reynolds American Inc. from 2008 until its acquisition by the Group.
Relevant skills and contribution to the Board: Luc brings significant financial, regulatory and M&A experience to the Board, together with extensive North American knowledge and experience of enterprise transformation and consumer and customer businesses.
External appointments: Independent Director of Hydro-Quebec and Gildan Activewear Inc. |
Appointed: Chief Executive since April 2019; Executive Director since January 2019.
Experience: Jack joined the Group in 2004 and was appointed as Chairman of British American Tobacco France in 2005, before becoming Managing Director of British American Tobacco Malaysia in 2007. He joined the Management Board as Regional Director for Western Europe in 2009, becoming Regional Director for the Americas in 2011, then Regional Director for Asia-Pacific in 2013. He became Chief Operating Officer in 2017 and Chief Executive Designate in November 2018, before being appointed to the Board in January 2019.
Relevant skills and contribution to the Board: Jack brings significant management, innovation, and strategic leadership to the Board, developed through his previous roles across many of the Group’s key geographies and areas of business. This enables him to effectively lead the Group and deliver our ambition to build A Better TomorrowTM.
External appointments: No external appointments. |
Appointed: August 2019
Experience: Tadeu joined the Group in Brazil in 1992 and joined the Management Board as Director, Business Development in 2014, later becoming Regional Director, Western Europe in 2016, then Regional Director, Europe and North Africa in January 2018. He was appointed Director, Group Transformation in January 2019 and, in addition to this role, he was appointed Deputy Finance Director in March 2019, before joining the Board as Finance Director in August 2019. As Finance and Transformation Director, Tadeu’s role includes leadership of the design and delivery of the Group’s QUEST transformation programme to accelerate delivery of Group strategy.
Relevant skills and contribution to the Board: Tadeu brings broad experience gained in various national, regional and global finance and general leadership roles, through his previous roles across the Group. These experiences make Tadeu particularly well-placed to contribute to the Group’s transformation and broader strategic agenda.
External appointments: No external appointments. | |||
|
Appointed: February 2015
Experience: Sue’s extensive career includes Director, Strategic and Business Development of Chime Group and a number of senior marketing and communications positions, including: Director of Marketing BBC, Corporate Affairs Director of Thames Television and Director of Communications of Vauxhall Motors. Sue is a former Chairwoman of both the Marketing Society and the Marketing Group of Great Britain.
Relevant skills and contribution to the Board: Sue contributes considerable expertise in relation to marketing, branding and consumer issues, which are key areas of focus for the Board.
External appointments: Non-Executive Director and Chair of the Remuneration Committee of Accsys Technologies PLC; Non-Executive Director of Helical plc; and Non-Executive Director of Unlimited Group. |
Appointed: September 2019
Experience: Jerry is Chairman of Primo Water Corporation (‘Primo’) (formerly Cott Corporation), a US pure-play water solutions provider, having been CEO from 2009 until December 2018. Prior to joining Primo, Jerry held a variety of executive roles, including: CEO of Auto Trader Group; a number of roles at AB InBev, including CEO of Bass Breweries in the UK, Global Chief Operating Officer and European President; Executive Director of The Rank Group; and CEO of the Beverage Division at the Hero Group.
Relevant skills and contribution to the Board: Jerry brings extensive experience in leadership and strategic transformation to the Board and contributes considerable insight in relation to US operational issues, an important market for the Group.
External appointments: Chairman of Primo; Non-Executive Director and Chair of the Compensation and Human Resources Committee of Constellation Brands, Inc. |
Appointed: September 2020
Experience: Karen has held a variety of executive roles, including President and Director General of Colgate Palmolive France, and Chairman and Managing Director of Colgate Palmolive UK Limited. She was formerly a Non-Executive Director of Electrocomponents p.l.c., Davide Campari-Milano S.p.A, Paysafe PLC, Inchcape PLC, Samlerhuset BV and Swedish Match AB.
Relevant skills and contribution to the Board: Karen brings valuable international experience, particularly in marketing, sales and consumer goods insight to the Board.
External appointments: Non-Executive Director of Amcor p.l.c. |
Appointed: August 2016
Experience: Marion’s extensive career includes Chief Financial Officer positions at Celesio, Q-Cells and ThyssenKrupp Elevator Technology and, more recently, she has served as a member of a variety of supervisory boards.
Relevant skills and contribution to the Board: Marion brings significant financial expertise and operational experience gained at an international level, having spent her working life managing businesses across Europe, the Americas and Asia. Her experience as a member of various supervisory boards enables Marion to bring a range of insights to the Board’s discussions.
External appointments: Vice Chairwoman of the Supervisory Board and Co-Chairwoman of the Presiding and Nomination Committee of ProSiebenSat.1 Media SE; Supervisory Board member and Chairman of the Audit Committee of Heineken N.V. and Supervisory Board member of Siemens Healthineers AG. | |||
|
Strategic Report |
Governance Report | Financial Statements | Other Information | BAT Annual Report and Form 20-F 2020 | 93 | |||||
|
|

| ||||||
|
Appointed: July 2017
Experience: Up until April 2018, Holly was a Senior Advisor to Corsair Capital LLC, where she had previously served as Managing Partner and Co-Head of Infrastructure from 2015 until her retirement in 2017. From 2010 to 2015, she served as Co-Head of Citi Infrastructure Investors and prior to 2010 she held financial and executive management roles with American Electric Power Company, Inc. and Consolidated Natural Gas Company. Holly previously served as an independent Non-Executive Director of Reynolds American Inc. from 2008 until its acquisition by the Group.
Relevant skills and contribution to the Board: Holly’s extensive international operational and financial management experience in a range of industry sectors enables her to make important contributions to the Board.
External appointments: Non-Executive Director of Vesuvius plc; Director and Chair of the Governance Committee of AES Corporation; Director of Arch Coal Inc.
|
Appointed: January 2014
Experience: During his extensive career Savio has worked broadly in technology for General Electric, BTR plc and Alibaba Group, China’s largest internet business, where he was both Chief Operating Officer and, later, a Non-Executive Director.
Relevant skills and contribution to the Board: Savio brings significant business leadership experience to the Board, together with a deep knowledge of Greater China and Asia, an important region for the Group.
External appointments: Co-Founder and CEO of A&K Consulting Co Ltd, advising entrepreneurs and their start-up businesses in China; Member of the Governing Body of the London Business School; Non-Executive Director of the Alibaba Hong Kong Entrepreneur Fund and Crossborder Innovative Ventures International Limited; and Non-Executive Director and Advisory Board member of Homaer Financial. . |
Appointed: Senior Independent Director since April 2020; Non-Executive Director since February 2015.
Experience: Dimitri was Vice Chairman and Adviser to the Chairman and CEO of Procter & Gamble (P&G), where he started his career in 1977. During his time at P&G, Dimitri led on significant breakthrough innovations and continued to focus on this, speed-to-market and scale across all of P&G’s businesses while Vice Chairman of all the Global Business Units.
Relevant skills and contribution to the Board: Dimitri has extensive general management and international sales and brand building expertise, which enables him to make valuable contributions to Board discussions on these important topics.
External appointments: Senior Adviser at The Boston Consulting Group; Advisory Board member of JBS USA; Board Member of IRI; Board Member of North Atlantic Acquisition Corporation.
|
Appointed: December 2020
Experience: Darrell is currently Vice President and Treasurer for Harley-Davidson, Inc., having previously held several senior finance positions including Interim Chief Financial Officer for Harley-Davidson, Inc., Chief Financial Officer for Harley-Davidson Financial Services, Inc. and Vice President and Assistant Treasurer, PepsiCo, Inc. Prior to joining PepsiCo, Inc. Darrell had a 19-year career in banking with Commerzbank Securities, Swiss Re New Markets, ABN Amro Bank and Citicorp/Citibank where he held various capital markets and corporate finance roles.
Relevant skills and contribution to the Board: Darrell brings extensive US, financial and regulatory experience to the Board.
External appointments: Vice President and Treasurer for Harley-Davidson, Inc.; Board member of Sojourner Family Peace Center, Inc.
| |||
Attendance at Board meetings in 20201
| Attended/Eligible to attend | ||||||||||||
| Name | Director since | Scheduled4 | Ad hoc | |||||||||
|
Richard Burrows |
2009 | 6/6 | 4/4 | |||||||||
| Jack Bowles |
2019 | 6/6 | 4/4 | |||||||||
| Tadeu Marroco |
2019 | 6/6 | 4/4 | |||||||||
| Sue Farr2(a) |
2015 | 6/6 | 3/4 | |||||||||
| Jerry Fowden |
2019 | 6/6 | 4/4 | |||||||||
| Karen Guerra3(a) |
2020 | 2/2 | 1/1 | |||||||||
| Dr Marion Helmes |
2016 | 6/6 | 4/4 | |||||||||
| Luc Jobin2(b) |
2017 | 5/6 | 3/3 | |||||||||
| Holly Keller Koeppel |
2017 | 6/6 | 4/4 | |||||||||
| Savio Kwan2(c) |
2014 | 6/6 | 3/4 | |||||||||
| Dimitri Panayotopoulos |
2015 | 6/6 | 4/4 | |||||||||
| Darrell Thomas3(b) |
2020 | 0/0 | 0/0 | |||||||||
| Kieran Poynter3(c) |
2010-2020 | 2/2 | 2/2 | |||||||||
|
Notes:
1. Number of meetings in 2020: The Board held 10 meetings in 2020, four of which were ad hoc and convened at short notice, to review: (1) revolving credit facilities; (2) filing of the Company’s Annual Report and Form 20-F with the US SEC; (3) the Group’s response to the impact of COVID-19 and other topics; and (4) succession planning for the role of Chairman.
2. (a) Sue Farr did not attend the second ad hoc meeting in March due to prior commitments; (b) Luc Jobin did not attend the meeting in April due to prior commitments and was recused from the ad hoc meeting in October which discussed succession planning for the role of Chairman; and (c) Savio Kwan did not attend the first ad hoc meeting in March due to prior commitments. Directors that are unable to attend Board or Committee meetings have the opportunity to provide their comments to the Chairman in advance of the meeting.
3. Composition: The Board of Directors is shown as at the date of this Annual Report and Form 20-F; (a) Karen Guerra joined the Board on her appointment as a Non-Executive Director on 14 September 2020; (b) Darrell Thomas joined the Board on his appointment as a Non-Executive Director on 7 December 2020. There were no scheduled or ad hoc meetings following his appointment during the remainder of 2020; and (c) Kieran Poynter retired as a Non-Executive Director at the conclusion of the Company’s Annual General Meeting on 30 April 2020.
4. Number of meetings in 2021: Six Board meetings are scheduled for 2021. |
| |||||||||||
| 94 | BAT Annual Report and Form 20-F 2020 |
Governance
As at 16 February 2021

|

|

|

| |||
|
Nationality: American
Jerry was appointed Director, Legal & External Affairs and General Counsel in May 2015, having joined the Management Board as Group Corporate & Regulatory Affairs Director in January 2015. Jerry was Regional General Counsel, Asia-Pacific from 2010 to 2014, before becoming Assistant General Counsel – Corporate & Commercial. He was a member of the Board of Reynolds American Inc. from February 2016 until July 2017. |
Nationality: Italian/Brazilian
Marina joined the Management Board as Director, Digital and Information in January 2019. She joined the Group as Chief Information Officer (CIO) in 2018, having previously served as Global CIO and Global Business Services SVP at Anheuser-Busch InBev, where she was responsible for information technology transformation, including consumer digital marketing. |
Nationality: Italian/Argentinian
Luciano joined the Management Board as Regional Director, Americas and Sub-Saharan Africa in January 2019. He joined the Group in 1992 and has held a wide range of roles, including Marketing Director in Venezuela, Marketing Director in Mexico and General Manager of BAT Mexico. Luciano was also Regional Marketing Manager for Western Europe and then Regional Head of Marketing, Americas and Sub-Saharan Africa before his appointment to the Management Board. | ||||

|

|

|

| |||
|
Nationality: Australian
Michael was appointed Regional Director for Asia-Pacific and Middle East in September 2020 and joined the Management Board at the same time. Previously, he was Area Director for Asia-Pacific and Global Travel Retail. Michael joined BAT in 1999 and has held several senior roles in the Group including General Manager (Papua New Guinea and Cambodia) and Regional Manager, Asia-Pacific. |
Nationality: Pakistani
Zafar was appointed Director, Operations in February 2021 and became a member of the Management Board at the same time. Previously, he was Group Head of New Categories Operations where he was responsible for successfully embedding an end-to-end supply chain for our New Category products to support their accelerated growth across the world. Zafar joined BAT in 1996 and has held several senior roles in the Group including Regional Head of Operations Asia Pacific & Middle East, Group Head of Plan, Service & Logistics, Regional Head of Plan and Service for Western Europe and Head of Operations, Bangladesh. |
Nationality: Korean
Hae In joined the Management Board as Director, Talent and Culture Designate in January 2019 and became Director, Talent and Culture in April 2019. Her role title changed to Director, Talent, Culture and Inclusion in November 2020. She was previously Group Head of Talent and Organisational Effectiveness and has held several other senior HR roles in the Group, including Regional HR Director, Asia-Pacific, and HR Director, Japan and North Asia. Prior to joining the Group in 2008, she gained experience at Samsung, IBM Consulting Services and PricewaterhouseCoopers. |
Nationality: Dutch
Paul joined the Management Board as Director, New Categories in January 2019. He has been with the Group for 14 years in various senior roles, including Regional Marketing Manager, Asia-Pacific and Middle East, Area Director, East Asia and Global Head of Marketing Futures. | |||

|

|

|

| |||
|
Nationality: New Zealand
Guy was appointed President and CEO of Reynolds American Inc. in September 2020, having joined the Management Board as Regional Director, Asia-Pacific and Middle East in January 2019. Previously he was Area Director, Australasia Area. Guy joined the Group in 1993 and has held several senior roles in the Group including Area Director, North Asia Area and Marketing Director, Russia. |
Nationality: British
David was appointed Director, Research and Science in January 2019, having joined the Management Board as Group Scientific Director in 2012, leading R&D’s focus on potentially reduced-risk products. He has been with the Group for more than 20 years and was previously Head of International Public Health and Scientific Affairs, responsible for engagement with scientific, medical and public health communities. |
Nationality: Belgian
Johan was appointed Regional Director, Europe and North Africa in January 2019. He joined the Management Board in 2014 as Regional Director for Eastern Europe, Middle East and Africa, then became Regional Director, Asia-Pacific and Middle East in January 2018. He has been with the Group for more than 25 years and his previous roles include General Manager in Russia, General Manager in Turkey and Global Brand Director for the Kent brand. |
Nationality: British
Kingsley was appointed Chief Marketing Officer in January 2019. He joined the Group in 1996 and held various senior marketing positions prior to being General Manager in Russia. He was appointed to the Management Board as Corporate and Regulatory Affairs Director in 2012. In January 2015, he was appointed Managing Director, Next Generation Products and then as Regional Director, Americas and Sub-Saharan Africa in January 2018. | |||
|
Strategic Report |
Governance Report | Financial Statements | Other Information | BAT Annual Report and Form 20-F 2020 | 95 | |||||
|
|
Leadership and Purpose
|
Our Board
Our Board is collectively responsible to our shareholders for the long-term sustainable success of the Company and for the Group’s strategic direction, purpose, values and governance. Our Board provides the leadership necessary for the Group to meet its business objectives within a robust framework of internal controls.
Primary Board responsibilities include:
– Group strategy and ensuring resources are in place to meet objectives
– Setting Group performance objectives and monitoring performance
– Significant corporate activities
– Group budget
– Risk management and internal control
– Board, Management Board and Company Secretary appointments and succession
– Periodic financial reporting
– Annual Report & Accounts and Form 20-F approval
– Dividend policy
– Corporate governance
– Group policies
– Effective engagement with shareholders, our workforce and wider stakeholders
– Assessing and monitoring culture and its alignment with Group purpose, values and strategy
– Ensuring workplace policies and practices align with values and support sustainable success
– Review of Speak Up channels and reports arising therefrom
|
Board programme and activities
The Board has a comprehensive annual programme of meetings to monitor and review the Group’s strategy across all the elements of the Group’s business model. The Chairman sets a carefully structured agenda for each meeting in consultation with the Chief Executive and the Company Secretary.
The key activities of the Board in 2020 are set out on pages 100 to 101. These are discussed under the Group’s strategic priorities of Driving Value from Combustibles, Step Change in New Categories and Simplifying the Business, and in the areas of Financial and Risk, ESG and People.
The Board’s strategic priorities for 2020 are identified within the key performance indicators set out on page 9. During 2020, oversight of the impact of COVID-19 and the Group’s response was also a key activity for the Board.
The Board considers stakeholder interests in its decision-making on an ongoing basis. Examples of how the Board considers the long-term consequences of decisions, stakeholder interests, the impact of our operations on the environment, and corporate reputation (amongst other factors) are discussed on pages 100 to 101.
During the year, the Board also devotes considerable attention to Group corporate governance, including internal control and compliance matters.
How our governance framework supports our strategy
As part of our internal controls framework, the Board has delegated certain authorities to executive management through the Group Statement of Delegated Authorities to enable effective delivery of Group strategy.
The Board’s approach to delegation of authorities is discussed further on page 96. |

|
The statement of matters reserved for the Board is available at bat.com/governance |

|
Board oversight of M&A transactions See page 272 |
|
Strategic Report |
Governance Report | Financial Statements | Other Information | BAT Annual Report and Form 20-F 2020 | 97 | |||||
|
|
With Stakeholders
Investor relations calendar 2020
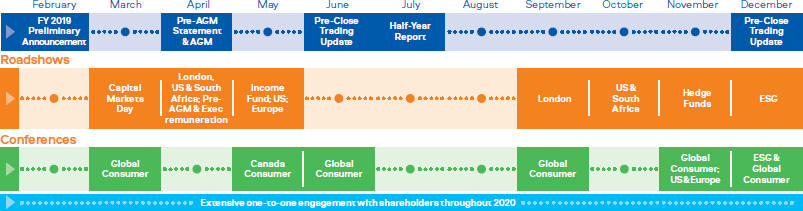
|
Update on 2020 AGM voting results
All resolutions were passed at the Company’s AGM held on 30 April 2020 with the requisite majority of votes. However, we acknowledge the minority vote against received in relation to the 2019 Directors’ Remuneration Report and the resolution to renew the Directors’ authority to allot shares.
Directors’ Remuneration Report
We have engaged with a number of shareholders that voted against this resolution to understand their position and perspectives on the management of executive pay and, in particular, within the evolving market context. The Remuneration Committee has discussed the feedback in detail and the matters raised by shareholders remain under active consideration in 2021.
|
|
Renewal of Directors’ Authority to Allot Shares
Whist we recognise that some shareholders are unable to support an allotment authority at the level sought, this level of authority continues to be supported by the majority of our shareholders and is in line with prevailing UK market practice and the UK Investment Association’s share capital management guidelines.
Although there is no present intention to exercise this authority, the Board continues to consider that this level of authority is appropriate to maintain flexibility for the Company.
We will maintain dialogue with shareholders for which this authority continues to present concerns and will keep market practice in this area under review.
|
| 98 | BAT Annual Report and Form 20-F 2020 |
Leadership and Purpose
Board Engagement With Stakeholders
Continued
|
Strategic Report |
Governance Report | Financial Statements | Other Information | BAT Annual Report and Form 20-F 2020 | 99 | |||||
|
|
| Sustainability Stakeholder Panel
To enhance its understanding of what matters to our stakeholders, the Board maintains annual Non-Executive Director participation in meetings with our Sustainability Stakeholder Panel.
The Panel is formed of key opinion leaders in the areas of tobacco harm reduction, environment, human rights and business ethics. It was established in 2016 to provide independent and objective feedback on our ESG agenda, priorities and our ESG Report.
In November 2020, Richard Burrows, Luc Jobin and Savio Kwan, with members of senior management, held a virtual conference with the Panel to review key business and strategic developments in relation to our corporate purpose and sustainability agenda, insights on evolving ESG issues that could impact our wider stakeholders, and approach to accelerating delivery of our ESG agenda. |

| |
| 100 | BAT Annual Report and Form 20-F 2020 |
Leadership and Purpose
in 2020

|
Step Change in New Categories Performance |

|
Drive Value From Combustibles |

|
Simplify the Business | |||||
| Continued investment and development of New Categories to accelerate growth is a strategic focus of the Board’s agenda. | Driving value from combustibles is a core priority for the Board, to deliver today and build A Better TomorrowTM. | The Board understands our business is enabled by simplifying our structures, embracing digital transformation, and rigorous cost management. | ||||||||
| Activities in 2020
– reviewing Group strategy to accelerate New Category growth and its implementation across the Group;
– reviewing New Categories product performance, trading environment and competitor landscape;
– reviewing New Categories product portfolios, innovation pipeline and roll-out plans, including roll-out plan adaptation in response to COVID-19;
– reviewing the impact of COVID-19 on the New Categories supply chain and steps taken to deliver continuity of supply;
– reviewing key aspects of the Group’s nicotine supply chain, leaf strategy and sourcing footprint to support a step change in New Categories;
– reviewing the Group’s approach to product stewardship and science underpinning development of New Categories products;
– reviewing the New Categories product environment, with particular focus on evolving product regulation in the US; and
– oversight of the structure, resources and key objectives for the Group’s corporate venture capital unit, ‘BTomorrow Ventures’, established to enhance value creation in New Categories through innovative and agile relationships with venture capital partners. |
Activities in 2020
– reviewing Group strategy to drive value from combustibles and its implementation across the Group;
– reviewing Group combustible product performance, trading environment, competitor landscape and the impact of COVID-19 and national lock-downs on performance across the Group;
– reviewing combustible product portfolios, innovation pipeline and roll-out plans, including to respond to the impact of COVID-19;
– reviewing the impact of COVID-19 on the Group’s combustible products supply chain, the Group’s factory operations and steps taken to deliver continuity of supply; and
– reviewing the Group’s leaf strategy to source leaf and tobacco components to deliver sustainable value and superior products, and the Group’s tobacco sourcing footprint and key supplier partnerships. |
Activities in 2020
– reviewing implementation of the first phase of the Quantum transformation project, and the design and objectives of a further phase of the Quantum project to deliver operational efficiencies, route-to-market focus and supply chain productivity, enabling release of funds for reinvestment;
– assessing the accelerators required to deliver the Group’s 2025 ambition and evolve a future fit, interconnected organisation;
– reviewing the Group’s digital strategy, including progress of the Group’s digital transformation agenda, risk management and cyber security; and
– oversight of progress across the Group to transition certain Modern Oral product brands to Velo and certain vapour product brands to Vuse, as part of the Group’s focus on fewer, stronger and global brands across all product categories. | ||||||||
Examples of how the Board considered stakeholders, the environment,
corporate reputation, and the long-term impact of decisions
|
A Better TomorrowTM
The Board reviewed and endorsed the evolution of the Group’s strategy, presented at pages 18 to 19, with sustainability front and centre, and a clear corporate purpose to build A Better TomorrowTM for the Group’s stakeholders. The evolution of the Group’s strategy reflects the Board’s understanding of the global impact of our business, stakeholder perspectives, our evolving societal responsibilities, and the importance of high standards of integrity. |
|
Digital strategy
The Board endorsed the Group’s digital strategy, to accelerate digital capabilities across the organisation. The strategy focuses on efficient ways of working, agile supply chains and enhanced consumer and customer connections, including through innovation in product activation and e-commerce, while maintaining a stable, effective and secure technology environment and continuing to respond to the impact of COVID-19. |
|
|
Strategic Report |
Governance Report | Financial Statements | Other Information | BAT Annual Report and Form 20-F 2020 | 101 | |||||
|
|

|
Financial and Risk |

|
Environmental, Social and Governance |

|
People | |||||
| The Board pays close attention to Group performance and financial matters, internal control, and integrity of reporting and risk management. | The Board emphasises that our strategy, business, and product portfolio be sustainable for the long term and meet our evolving societal responsibilities. | The Board shapes and oversees the Group’s culture and ethos. Setting the ‘tone from the top’ is an important part of the Board’s role. | ||||||||
| Activities in 2020
– approval of Group budget and oversight of resource allocation activities, to support strategy execution;
– reviewing Group financial performance against key performance metrics, current outlook and COVID-19 impact throughout the year, key challenges and opportunities for growth in each region;
– reviewing Group half-year results, trading updates, year-end results and the Annual Report and Form 20-F;
– determining Group viability for reporting purposes taking into account current position and principal risks;
– reviewing compliance with Group financing principles, including liquidity, capital allocation and adjusted net debt/ EBITDA;
– reviewing the Group’s revolving credit facilities, planned refinancings and the Group’s debt issuance programmes;
– reviewing Group cash flow performance and opportunities to optimise the balance sheet to enable ongoing investment while reducing the carrying value of debt;
– reviewing the Group Risk Register, Group risk appetite in the context of its strategic objectives, emerging risks to the Group, and Group insurance coverage;
– reviewing the impact of foreign exchange on financial performance and measures taken to mitigate foreign exchange risks;
– reviewing share price performance and investor and broker perspectives; and
– reviewing financial performance of the associates of the Group periodically. |
Activities in 2020
– reviewing the evolution of Group strategy, placing ESG front and centre of Group activities, approving new ESG targets and reviewing performance;
– assessing the impact of COVID-19 on Group operations, Group business continuity structures and plans to manage the Group’s response;
– reviewing Group stakeholders, engagement methods, stakeholders’ perspectives, and the Group’s response;
– reviewing Group regulatory engagement activities and evolving global product regulation;
– reviewing health and safety performance for the preceding year, targets for the coming year and action plans;
– approving the annual Modern Slavery Act statement and the Company’s first conflict minerals report;
– reviewing updates on compliance matters, including investigations, allegations of misconduct, reports from Speak Up channels, and progress of the Group’s ‘Delivery with Integrity’ programme; and
– reviewing the status of litigation proceedings involving Group companies, including updates on the Canadian Companies’ Creditors Arrangement Act (CCAA) process in relation to Group subsidiary Imperial Tobacco Canada, Fox River and Kalamazoo River proceedings, and claims brought by Reynolds American dissenting shareholders following acquisition of the remaining shares in Reynolds American. |
Activities in 2020
– approving the appointment of Luc Jobin as Chairman Designate and then to succeed Richard Burrows as Chairman of the Board, the appointment of two new Non-Executive Directors, and changes to Management Board composition, on the recommendation of the Nominations Committee;
– monitoring corporate culture and its alignment with the Group’s purpose, ethos and strategy;
– reviewing the Group’s talent strategy, diversity and inclusion agenda, and progress against their objectives;
– considering the impact of COVID-19 on the Group’s workforce and reviewing strategies for securing safe on-site environments, effective connectivity for remote working, and for supporting staff wellbeing;
– considering feedback from the Group’s workforce engagement mechanisms;
– reviewing Speak Up mechanisms and the reports arising from them;
– determining the independence of Non-Executive Directors prior to proposing them for re-appointment (or appointment for the first time) at the Company’s AGM;
– approving revisions to Non-Executive Director fees;
– reviewing the funding positions relating to the Group’s retirement benefit schemes; and
– reviewing the outcomes of the evaluation of the effectiveness of the Board and its Committees in 2020. | ||||||||
|
Budget and resource allocation
The Board approved the 2021 budget, weighing the balance between long-term corporate and consumer benefits of New Categories investment and continued portfolio development with our commitment to significant deleveraging. The budget design enables evolution of our growth model through development of our portfolios in tobacco, nicotine and beyond to meet evolving consumer preferences and encompasses our commitment to robust product stewardship, research and collaborative innovation to meet those needs. |
|
New ESG targets
The Board approved new ESG targets to: have 50 million consumers of non-combustible products by 2030; achieve carbon neutrality by 2030; and to bring forward existing 2030 environmental targets to 2025, together reflecting the Board’s commitment to reducing the health and environmental impacts of our business. These targets take into account the emphasis placed by our external stakeholders on the importance of addressing the health impacts of smoking, responding to climate change, and maintaining high standards of environmental management. |
|
| 102 | BAT Annual Report and Form 20-F 2020 |
Governance
| This section sets out the roles, and effective division of responsibilities, between the Chairman, Executive Directors and Non-Executive Directors, and outlines the support the Directors receive to assist them in meeting their responsibilities under the UK Corporate Governance Code and discharging their directors’ duties, both individually and collectively. |

|
The responsibilities of the Chairman, Executive Directors and Senior Independent Director are available at www.bat.com |
| Chairman
– Leadership of the Board
– Ensures Board effectiveness
– Facilitates Directors’ contributions
– Sets the Board agenda
– Interfaces with shareholders
– Ensures effective shareholder engagement
– Representational duties on behalf of the Company |
Non-Executive Directors
– Oversee Group strategy and resource allocation
– Scrutinise and hold to account performance against objectives
– Monitor Group performance
– Oversee systems of control and risk management
– Review management proposals and provide strategic guidance
– Bring external perspective and effective challenge to management |
Senior Independent Director (SID)
– Leads review of the Chairman’s performance
– Presides at Board meetings in the Chairman’s absence
– Chairs the Nominations Committee when Chairman succession considered
– Sounding board for the Chairman
– Intermediary for other Directors
– Available to meet with shareholders | ||||||
| Chief Executive
– Overall responsibility for Group performance
– Leadership of the Group
– Enables planning and execution of Group objectives and strategies
– Stewardship of Group assets
– Drives the cultural tone of the organisation |
Finance and Transformation Director
– Leadership of the Group in respect of financial matters
– Enables planning and execution of Group financial objectives and strategies
– Leadership of the design and delivery of the Group’s QUEST transformation programme to accelerate delivery of Group strategy
| |||
|
Non-Executive Director meetings
– The Non-Executive Directors, led by the Chairman, meet prior to or following Board meetings on a regular basis. Additional meetings led by the Chairman are scheduled in the Board calendar without the Executive Directors present.
– The Executive and the Non-Executive Directors also meet annually, led by the Senior Independent Director and without the Chairman present, to discuss the Chairman’s performance.
Directors information and advice
– Directors receive papers for review in good time ahead of each Board and Committee meeting.
– Papers and presentations to the Board and its Committees include discussion of specific stakeholder considerations as applicable.
– The Company Secretary ensures effective information flow within and between the Board and its Committees, and between the Non-Executive Directors and senior management.
– The Company Secretary, in conjunction with external advisers where appropriate, advises the Board on all governance matters.
– All Directors have access to the advice and services of the Company Secretary. The appointment and replacement of the Company Secretary is a matter for the Board.
– A procedure is in place for all Directors to take independent professional advice at the Company’s expense if required.
– Each of the three principal Committees of the Board may obtain independent legal or other professional advice, at the Company’s expense, and secure attendance at meetings of outsiders if needed.
|
|
Strategic Report |
Governance Report | Financial Statements | Other Information | BAT Annual Report and Form 20-F 2020 | 103 | |||||
|
|
| 104 | BAT Annual Report and Form 20-F 2020 |
Composition, succession, evaluation
|
2020 Evaluation: Outcomes and Actions
The Board considers
that it, its Committees and its Directors, continue to | ||
|
Leadership and culture
The Board recognised the outstanding effort of the Executive Directors throughout the challenges presented by COVID-19. Directors appreciated the regularity of frontline feedback to the Board as the pandemic unfolded. The Executive Directors are recognised as being open and participative with both the investment community and the Board, and are acknowledged to have fostered a cultural shift to a more dynamic tone of communication across the organisation.
The range of grassroots feedback from employee engagement provided to the Board is considered to have facilitated its oversight of organisational culture, in response to the action identified in the 2019 evaluation.
Action for 2021
– Board review of Nominations Committee analysis of strategic profile and capabilities required of future Non-Executive Directors in the context of Group strategy.
Strategy
The Board regarded the communication of the evolved Group strategy to be well articulated by the Executive Directors. The Executive Directors’ energy in driving the Group’s purpose and ethos throughout the organisation was considered by the Board to be unifying and to set the stage for execution.
The 2020 Board strategy sessions were well received and seen as a key forum for Non-Executive Directors to contribute to the development of Group strategy.
In response to actions identified in the 2019 evaluation, the Board looked at industry trends as part of its review of the Group’s digital strategy. The Remuneration Committee also continued its review of the reward strategy to support its ongoing effectiveness, including management pay comparator group benchmarking.
Action for 2021
– Additional time to be reserved on the Board agenda for deep dives on strategic objectives and review of major initiatives. |
Risk management
The Board’s monitoring of key risks and oversight of compliance is considered to be effective. In response to actions identified in the 2019 evaluation, the Board reviewed Group business continuity planning and management structures in the context of monitoring the Group’s response to COVID-19. The Audit Committee also conducted detailed reviews of technology and risk topics.
Action for 2021
– Further enhance the Board’s understanding of strategic opportunities and risks presented by evolving technologies.
Dynamics and information
Board and Committee meetings are considered to be chaired effectively, with Company Secretariat support well regarded. In response to actions identified in last year’s evaluation, and to enable effective virtual Board meetings in a COVID-19 context, a greater emphasis was placed on focused pre-read and presentation materials. The fully virtual meeting format is viewed to have worked well for the Board given the operational constraints.
Action for 2021
– Further emphasis in the Board agenda on market analysis, competititor performance, and emerging issues.
Composition and succession
Overall diversity, skills, and experience of Board composition was viewed to have progressed well in 2020, despite disruption caused by COVID-19, with potential for Board expertise to be augmented further in strategic capabilities such as digital.
The Chairman succession process was considered to have been full and inclusive, involving all Board members. Nominations Committee oversight of executive talent management is well regarded and considered effective.
Action for 2021
– Strategic analysis of the profile, skills and experience required of Non-Executive Directors for future Board succession planning to be conducted by the Nominations Committee.
| |
| 106 | BAT Annual Report and Form 20-F 2020 |
Composition, Succession, Evaluation
Notes:
| 1. | Spencer Stuart & Associates Limited is an independent executive search consultancy compliant with the Standard and Enhanced Code of Conduct for Executive Search Firms. Spencer Stuart has no connections with the Company or its Directors other than in respect of provision of executive search services. |
| 2. | Korn Ferry (UK) Limited is an independent executive search consultancy compliant with the Standard and Enhanced Code of Conduct for Executive Search Firms. Korn Ferry has no connections with the Company or its Directors, other than in respect of the provision of executive search and other human resources advisory and consulting services. |
|
Strategic Report |
Governance Report | Financial Statements | Other Information | BAT Annual Report and Form 20-F 2020 | 107 | |||||
|
|
Nominations Committee
Continued
| 108 | BAT Annual Report and Form 20-F 2020 |
Composition, Succession, Evaluation
Nominations Committee
Continued
Balance at 31 December 2020
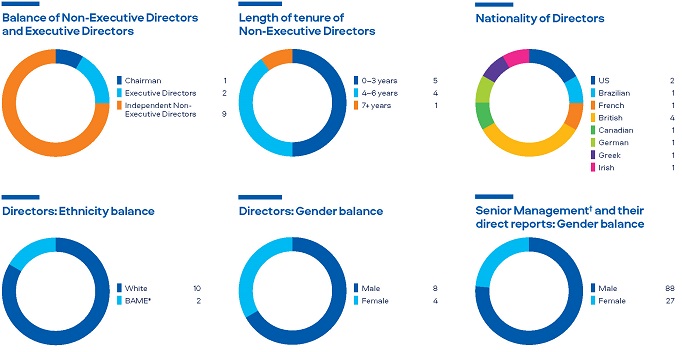
| * | Applying the Parker Report guidelines. |
| † | Senior Management comprises the Management Board and Company Secretary in accordance with the UK Corporate Governance Code. |
|
Strategic Report |
Governance Report | Financial Statements | Other Information | BAT Annual Report and Form 20-F 2020 | 109 | |||||
|
|
| Objective | Progress in 2020 | |
| Considering all aspects of diversity when reviewing the composition of, and succession planning for, the Board and Management Board. | – The Nominations Committee has regard to diversity in its broadest sense, including attributes such as gender, race, ethnicity, cultural and social backgrounds, and other personal attributes, when undertaking these activities.
| |
| Considering a wide pool of candidates across genders for appointment to the Board. | – Executive search firms are engaged to support Board and Management Board succession planning where applicable and are required to provide gender-balanced shortlists of candidates. Succession planning for Executive Directors and Management Board members takes into account potential internal candidates from across the Group and potential external candidates.
| |
| Maintaining at least 30% female Board representation, with the ambition of progressing towards further gender balance. | – The representation of women on the Board was 33.3% as at 31 December 2020 (2019: 27.3%) and remains so currently. Non-Executive Director succession planning takes into account the Board’s ambition to further improve gender diversity.
| |
| Giving preference, where appropriate, to engagement of executive search firms accredited under the Standard and Enhanced Codes of Conduct for Executive Search Firms. | – The executive search firms engaged to provide executive search services to support Board succession planning in 2020 were accredited under the Standard and Enhanced Codes of Conduct for Executive Search Firms. | |
| Oversight of the development of a pipeline of diverse, high-performing potential Executive Directors, Management Board members and other senior managers. | – The representation of women on the Management Board was 15.4% as at 31 December 2020 (2019: 15.4%) and remains so currently. Management Board succession planning takes into account the ambition to progress towards improved gender diversity.
– Emphasis is placed on building diverse talent pools at all levels of the organisation through recruiting, developing and retaining diverse and high-performing talent.
– In 2020, 43% of the Group’s external management recruits were women (2019: 45%), including 30% into senior leadership roles (2019: 24%), supporting continued introduction of strategic capabilities to drive business transformation. The Women in Leadership programme has been supporting the development of female employees across the Group for the last seven years. The Group also participates in various external initiatives to support diversity of high-potential managers.
– Please refer to pages 58 to 63 for further information about the Group’s Diversity and Inclusion agenda.
| |
|
Strategic Report |
Governance Report | Financial Statements | Other Information | BAT Annual Report and Form 20-F 2020 | 111 | |||||||
|
|
| 112 | BAT Annual Report and Form 20-F 2020 |
Audit, Risk, Internal Control
Audit Committee
Continued
|
Strategic Report |
Governance Report | Financial Statements | Other Information | BAT Annual Report and Form 20-F 2020 | 113 | |||||||
|
|
| 114 | BAT Annual Report and Form 20-F 2020 |
Audit, Risk, Internal Control
Audit Committee
Continued
|
Strategic Report |
Governance Report | Financial Statements | Other Information | BAT Annual Report and Form 20-F 2020 | 115 | |||||
|
|
| 116 | BAT Annual Report and Form 20-F 2020 |
Audit, Risk, Internal Control
Audit Committee
Continued
| 118 | BAT Annual Report and Form 20-F 2020 |
Remuneration Report
Annual Statement on Remuneration
Continued
|
Strategic Report |
Governance Report | Financial Statements | Other Information | BAT Annual Report and Form 20-F 2020 | 119 | |||||
|
|
| 120 | BAT Annual Report and Form 20-F 2020 |
Remuneration Report
Annual Statement on Remuneration
Continued
1 Summary of our Directors’ Remuneration Policy
The Remuneration Policy for the Executive Directors and the Non-Executive Directors was approved by shareholders at the AGM on 25 April 2019.
The full Directors’ Remuneration Policy is set out in the Remuneration Report 2018 contained in the Annual Report for the year ended
31 December 2018, which is available at bat.com.
To assist in reviewing our Annual Report on Remuneration, we have summarised the key elements of the Directors’ Remuneration Policy as it principally applies to remuneration paid during 2020.
Directors’ Remuneration Policy summary: our remuneration strategy
The Committee’s remuneration principles seek to reward the delivery of the Group’s strategy in a simple and straightforward manner which is aligned to shareholders’ long-term sustainable interests.
The remuneration structure comprises fixed and variable elements. These rewards are structured and designed to be both transparent and stretching while recognising the skills and experience of the Executive Directors and ensuring rewards are competitive in the global marketplace. The fixed elements comprise base salary, pension and other benefits. The variable elements are provided via two performance-based incentive schemes (a single short-term cash and share incentive annual bonus plan (STI), and a single Long-Term Incentive Plan (LTIP)).
In applying these principles, the Remuneration Committee maintains an appropriate balance between fixed pay and the opportunity to earn performance-related remuneration with the performance-based elements forming, at maximum opportunity, between 80% and 90% of the Executive Directors’ total remuneration. The Directors’ Remuneration Policy is kept under regular review to ensure alignment with business strategy and to promote the long-term success of the Group.
| Strategic Purpose | Key Features | |
| Salary | ||
| To attract and retain high-calibre individuals to deliver the Group’s long-term strategy and to offer market-competitive levels of guaranteed cash to reflect an individual’s skills, experience and role within the Group. | – Normally paid in 12 equal monthly instalments during the year;
– Reviewed annually in February (changes effective from April) or subject to ad-hoc review on significant change of responsibilities;
– Reviewed taking into consideration several factors including individual performance and appropriate market data based on a Pay Comparator Group;
– Annual increases will generally be in the range of the increases in the base pay of other UK-based employees in the Group and will not exceed 10% per annum; and
– Recently appointed Executive Directors’ base salaries may exceed the top of the range of the salary increases for UK-based employees where the Remuneration Committee considers it appropriate to reflect the accrual of experience. | |
| Benefits | ||
| To provide market-competitive benefits consistent with the role which:
– attract and retain high calibre individuals to deliver the Group’s long-term strategic plans; and
– recognise that such talent is global in source and that the availability of certain benefits (e.g. relocation, repatriation, taxation compliance advice) will from time to time be necessary to avoid such factors being an inhibitor to accepting the role. |
The Company offers the following contractual benefits to Executive Directors:
– A car or car allowance (maximum annual value £20,000);
– Use of a car and driver for personal and business use;
– Employment tax advice (as required but not exceeding £30,000 per annum);
– Tax equalisation payments (where appropriate);
– Private medical insurance, including general practitioner ‘walk in’ medical services;
– Personal life and accident insurance (designed to pay out at a multiple of four and five times base salary, respectively);
– Housing, education allowances or similar arrangements as appropriate to family circumstances; and
– Other benefits may include Executive Directors and their partners’ attendance at hospitality or similar functions, and the provision of benefits which may be treated as benefits for tax purposes, such as the provision of home security and reimbursement of expenses incurred in connection with their duties. | |
| Pension |
||
| To provide competitive post-retirement benefit arrangements which recognise the external environment in the context of attracting and retaining senior high calibre individuals to deliver the Group’s long-term strategy. | – Only base salary is pensionable.
– Defined Contribution (“DC”) benefits – Executive Directors are eligible to receive a pension benefit equivalent to a maximum of 15% of base salary as a contribution into the British American Tobacco UK Pension Plan or, as alternative provision, they can opt for either a cash allowance or accrual in a DC unfunded arrangement. The Company contribution rate is aligned with the benefit available to our wider UK population where the default contribution rate is 15%, comprising of a core 10% contribution rate and an additional 5% contribution on a matching basis to an employee’s pension contribution. | |
|
Strategic Report |
Governance Report | Financial Statements | Other Information | BAT Annual Report and Form 20-F 2020 | 121 | |||||
|
|
| Short-term incentives (STI) | ||
| – To incentivise the attainment of corporate targets aligned to the Group’s strategic objectives on an annual basis, with a deferred element to ensure alignment with shareholders’ interests.
– To ensure, overall, a market-competitive remuneration to attract and retain high calibre individuals to deliver the Group’s long-term strategy. |
Opportunity
– Chief Executive – Maximum 250%; on-target 125%.
– Finance and Transformation Director – Maximum 190%; on-target 95%.
Operation
– 50% of the incentive delivered as cash; 50% as deferred shares (DSBS) which vest after three years. Deferred shares attract a dividend equivalent which is delivered in additional quarterly interim dividend equivalent shares;
– The Remuneration Committee sets the performance targets each year at the beginning of the performance period and is able to vary the exact measures and the weighting of them from year to year;
– Performance measures for 2020 can be found on page 126 and for 2021 on page 131;
– The Remuneration Committee has discretion to adjust outcomes in circumstances where it considers it is appropriate to do so to reflect the overall performance of the Company;
– In cases of identified poor individual performance, the corporate result may be reduced by up to 50%; and
– Clawback and malus provisions are in place. | |
| Long-term incentives (LTIP) | ||
| – To put in place a combination of measures with appropriately stretching targets around the long-term strategy delivery that provides a balance relevant to the Company’s business and market conditions as well as alignment between Executive Directors’ and shareholders’ interests.
– To facilitate the appointment of senior high calibre individuals required to deliver the Groups’ long-term strategy, and to promote the long-term success of the Company. |
Opportunity
– Maximum annual award of shares of 500% of salary for all Executive Directors.
– Normal annual grants of 500% of salary for the Chief Executive and 400% of salary for the Finance and Transformation Director.
Operation
– LTIP awards vest only to the extent that:
– the performance conditions are satisfied at the end of the three-year performance period; and
– an additional vesting period of two years from the third anniversary of the date of grant has been completed;
– Dividend equivalent shares are awarded at the end of the extended vesting period to the extent that the awards vest;
– The Remuneration Committee sets the performance targets for the applicable performance period each year;
– Vesting levels are based on the achievement of appropriately stretching targets against performance measures aligned to the Group’s long-term strategy;
– Performance measures for the 2018-2020 performance period are detailed on page 127 and for the awards to be granted in 2021 are detailed on page 132;
– The Remuneration Committee has discretion to adjust the level of vesting in circumstances where it considers it is appropriate to do so to reflect the overall performance of the Company; and
– Clawback and malus provisions are in place. | |
| Shareholding requirements | ||
| – To strengthen the alignment between the interests of the Executive Directors and those of shareholders by requiring Executive Directors to build up a high level of personal shareholding in the Company.
– To ensure long-term alignment between the interests of the Executive Directors and those of shareholders through the operation of post-employment shareholding requirements. |
Executive Directors are required to hold shares in the Company:
– during service as a Director, equal to the value of the same multiple of salary at which LTIP awards are made to that Director (currently, 500% for the Chief Executive and 400% for the Finance and Transformation Director from 2020 onwards); and
– after ceasing service as a Director, equal to the value of 100% of the shareholding requirement that applied while a Director for a period until the second anniversary of cessation of employment with the Group. | |
| 122 | BAT Annual Report and Form 20-F 2020 |
Remuneration Report
Annual Statement on Remuneration
Continued
| All-employee share plans | ||
| Executive Directors are eligible to participate in the Company’s all-employee share schemes which are designed to incentivise employees by giving them an opportunity to build shareholdings in the Company. | – All-employee share schemes are the Partnership Share Scheme, the Sharesave Scheme and the Share Incentive Plan (SIP); and
– Executive Directors are subject to the same limits on participation as other employees, as defined by the applicable statutory provisions. | |
How the Policy Addresses the Factors Set Out in the UK Corporate Governance Code 2018:
Our remuneration principles and the key elements of the Directors’ Remuneration Policy align with the UK Corporate Governance Code 2018 requirements, as follows:
Clarity and simplicity
Our policy provides an overall remuneration package that is transparent for our Executive Directors and shareholders alike; its simple structure has a clear and straightforward link to the delivery of the Group’s long-term strategy. Principles driving fixed remuneration (salary, benefits, pension) are closely aligned with the wider workforce and variable remuneration (STI and LTI) rewards delivery of financial and strategic objectives both in the short and long-term.
Risk
The combination of performance target setting for the STI and LTI, the inclusion of provisions for discretionary adjustments and malus and clawback provisions ensure that we remunerate our Executive Directors in accordance with high standards of governance while mitigating, as far as possible, reputational and other risks arising from remuneration that are not proportionate to outcomes.
Predictability and proportionality
There is a clear link between the operation of our short and long-term incentive plan awards and the delivery of our strategy and long-term performance. Variable remuneration at the Company accounts for between 80%-90% of an Executive Director’s total remuneration, ensuring that poor performance is not rewarded. Further detail on short and long-term incentive plan awards are detailed on pages 126 and 127.
Alignment to culture
The Remuneration Committee has worked extensively to develop a policy that aligns the Executive Directors closely to the wider workforce and rewards long-term sustainable performance. The Remuneration Committee continually reviews the Policy, taking into account any feedback received from engagement with the wider workforce and shareholders, to ensure it is aligned to the Company’s purpose and values, and promotes the long-term success of the Company.
Summary of All-Employee Rewards at BAT: Principles of Remuneration for Our Wider Workforce
The Group’s remuneration policies and practices are founded on a high degree of alignment and consistency across the organisation. Accordingly, remuneration for senior management is determined taking into account the remuneration principles that apply to the Executive Directors, and similar principles also form the basis of the remuneration arrangements for the wider workforce.
The Remuneration Committee is regularly updated on the pay principles and practices in operation across the Group, and considers them in relation to the implementation of the Directors’ Remuneration Policy, and in ensuring there is an appropriate degree of alignment throughout the Group. The Board’s approach to engagement with the Group’s workforce worldwide is set out on pages 62, 63, 82 and 98. Engagement methods available to the Group’s workforce include mechanisms for feedback and dialogue on the Group’s pay policies and practices. The Remuneration Committee receives updates from management on feedback received during the year where relevant to remuneration matters considered by the Remuneration Committee, and the Remuneration Committee takes feedback into account as applicable in determining executive remuneration.
The reward strategy for all employees is built around the following four strategic pillars and comprises fixed and variable remuneration elements:
| Competitive yet sustainable |
Equitably differentiated | |
| – Competitive remuneration, able to attract and retain talent.
– Agility to meet changing generational needs.
– Responsible cost structure to support profit delivery. |
– Differentiated on clear and objective criteria – level, performance and experience.
– Supported by unbiased processes and tools. | |
| Transparent |
Aligned to shareholder interests | |
| – Clear policies, openly communicated.
– Individual total reward package statements form part of regular annual cycle. |
– Competitive employment cost base and incentives that align the interests of employees with those of shareholders. | |
|
Strategic Report |
Governance Report | Financial Statements | Other Information | BAT Annual Report and Form 20-F 2020 | 123 | |||||
|
|
Fixed remuneration
Salary
| – | Salary is a key element of total remuneration for all employees. |
| – | Salary ranges for each grade are set by reference to external market data, and individual positioning within the set salary ranges will depend on level of experience, responsibility and individual performance. |
| – | Annual salary reviews typically take place in April each year. |
In several markets Collective Labour Agreements (CLAs) exist covering some employees, therefore, some of the above principles may not apply.
Benefits and recognition
| – | Benefits provided to employees reflect local market practice and legislative requirements. |
| – | The benefits architecture for the Group includes core benefits (such as medical insurance and life insurance) and local statutory benefits and may be delivered as a combination of benefits in kind, cash allowance and flexible benefits. |
| – | Additional financial and non-financial rewards can be made for outstanding contributions to the business in exceptional circumstances. |
Pension
| – | Retirement benefits are provided to employees based on local market practice. |
| – | Under the UK Defined Contribution arrangements, the Company contributions for all UK employees is 10% of base salary rising to a maximum of 15% on a matching basis. For managers in senior management roles, the total contribution to the British American Tobacco UK Pension Plan (“Plan”) is automatically restricted to £4,000 per annum in line with the UK government’s Tapered Annual Allowance (where the £4,000 per annum restriction was effective from April 2020 having reduced from £10,000 per annum). The balance of any Company contributions due above this £4,000 limit is paid as a cash allowance or, alternatively, paid into the Defined Contribution Unapproved Unfunded Retirement Benefits Scheme. Employees can choose to opt out of the restriction and have all the Company contribution paid into the Plan. |
Variable remuneration
Short-term incentives
Short-term incentive schemes are designed to reward employees across the business for the delivery of financial, strategic and operational targets. The Group operates various short-term incentive arrangements, as set out below, with participation dependent on role.
International Executive Incentive Scheme (IEIS) – globally aligned scheme for all managers in senior management roles (c. 1,700 employees), including Executive Directors.
| – | Incentive opportunities for the IEIS participants are defined globally for each eligible grade. |
| – | A portion of any award receivable is deferred in BAT shares for three years, with the remaining portion paid in cash during the following year. |
| – | Dividend-equivalent payments on all unvested deferred shares are paid quarterly in cash via payroll. |
Corporate annual bonus plans – in operation for employees in corporate functions who are not eligible to participate in the IEIS.
– Designed to mirror the basic construct of the IEIS with opportunity levels set locally.
– Performance metrics aligned to those of the IEIS.
Functional incentive schemes – in operation for employees in non-corporate functions, examples include trade marketing or factory incentive schemes.
| – | Opportunity levels are set locally and vary by grade. |
| – | Functional performance measures are incorporated into each scheme to ensure line of sight for participants. |
Long-term incentives
Long-term incentive schemes are designed to reward and retain our senior talent while aligning the interests of leaders with those of our shareholders. From 2020, we have moved from a single LTI plan to a segmented approach by grade as set out below.
Restricted Share Plan (RSP) – globally aligned plan for managers at eligible grades in senior management roles (c. 575), excluding Executive Directors. Aligns scheme participants with the success of the Group through its share price.
| – | Opportunity levels are defined globally for each eligible grade. |
| – | No performance conditions apply to awards. |
| – | Awards are typically granted in March of each year, and vest in full following the end of the three-year vesting period provided the participant remains an employee of the Group on the vesting date. |
| – | Dividend-equivalent payments are paid on shares vesting. |
Performance Share Plan (PSP) – discretionary plan for our most senior managers (c. 170), including Executive Directors, which rewards their contribution to the long-term global performance of the Company.
| – | Opportunity levels are defined globally for each eligible grade. |
| – | Awards vest only to the extent that the performance conditions are satisfied at the end of the three-year performance period. |
| – | Awards are typically granted in March of each year, and vest following the end of a three-year performance period. |
| – | Dividend-equivalent payments are paid on any shares vesting. |
All-employee share schemes
| – | In the UK, all employees are eligible to participate in the Company’s all-employee share schemes – the Partnership Share Scheme, the Sharesave Scheme and the Share Incentive Plan – all of which are HMRC-approved plans, which are designed to incentivise employees by giving them an opportunity to build shareholdings in the Company. |
| 124 | BAT Annual Report and Form 20-F 2020 |
Remuneration Report
Annual Statement on Remuneration
Continued
2 Overview of What Our Executive Directors Earned in 2020 and Why
What our Executive Directors earned in 2020
| Single figure for Executive Directors |
Jack Bowles | Tadeu Marroco1 | ||||||||||||||
|
2020 £’000 |
2019 £’000 |
2020 £’000 |
2019 £’000 |
|||||||||||||
|
Fixed Pay |
| |||||||||||||||
| Salary |
1,259 | 1,175 | 775 | 301 | ||||||||||||
| Taxable benefits |
592 | 277 | 152 | 80 | ||||||||||||
|
Pension |
189 | 216 | 116 | 46 | ||||||||||||
| Total Fixed Pay |
2,040 | 1,668 | 1,043 | 427 | ||||||||||||
| Variable Pay |
||||||||||||||||
| Short-term incentives |
2,238 | 2,824 | 1,046 | 560 | ||||||||||||
| Long-term incentives2,3 |
786 | 642 | 508 | 512 | ||||||||||||
| Other emoluments4 |
3 | 4 | 18 | – | ||||||||||||
| Total Variable Pay |
3,027 | 3,470 | 1,572 | 1,072 | ||||||||||||
| Total Remuneration |
5,067 | 5,138 | 2,615 | 1,499 | ||||||||||||
Notes:
| 1. | Tadeu Marroco was appointed Finance Director on 5 August 2019 and was appointed as an Executive Director on the same date. The amounts shown in the table above for 2019 reflect remuneration received while an Executive Director of the Company. |
| 2. | The 2018 LTIP award is due to vest on 26 March 2021 for Jack Bowles and Tadeu Marroco based on completion of the three-year performance period on 31 December 2020. The value shown is based on the average share price for the three-month period ended 31 December 2020 of 2,701p. Given the share price performance since the date of grant of awards, none of the value shown in the table above is attributable to share price appreciation. |
| 3. | Long-term incentives shown for 2019: in accordance with the UK Directors’ Remuneration Report Regulations, estimates for the values of the vesting 2017 LTIP awards were given in the Annual Report on Remuneration for the year ended 31 December 2019; these amounts have been re-presented to show the actual market value on the date of vesting in 2020. |
| 4. | In the Annual Report on Remuneration for the year ended 31 December 2019, life insurance was included within the ‘Other emoluments’ remuneration item in the single figure table. For the Annual Report on Remuneration for the year ended 31 December 2020, life insurance has been included within the ‘Taxable benefits’ remuneration item. The figures for 2019 in the table above have been restated to reflect this change. |
Further information in respect of this remuneration can be found in Section 3 on page 125.
How this aligns to performance
| Short-term incentives for the performance period ended in 2020 | ||
|
Performance summary:
| ||
| Chief Executive: corporate performance – 177.8% of salary
| ||
| Finance and Transformation Director: corporate performance – 135.1% of salary
| ||
|
Group share of Key Markets
|
Adjusted profit from operations (APFO)
| |
| +33 bps growth over 2019
|
at constant rates of exchange +4.8% growth
| |
|
Adjusted revenue growth from the Strategic Portfolio at
+7.0% growth
|
Deleveraging (excluding foreign exchange)
0.33x at constant rates of exchange | |
| Long-term incentives for the three-year performance period ended in 2020 | ||
|
Vesting at 52.6%
|
||
| Total shareholder return (TSR)
|
0% achievement
| |
| 20 out of 23 in FMCG comparator group 2018–2020
|
(0% of award vesting out of possible 20%)
| |
|
Adjusted diluted earnings per share (EPS) growth
|
25% achievement
| |
| 5.5% CAGR at current rates of exchange
|
(4.9% of award vesting out of possible 20%)
| |
|
Adjusted diluted earnings per share (EPS) growth
|
75% achievement
| |
| 8.5% CAGR at constant rates of exchange
|
(15.0% of award vesting out of possible 20%)
| |
|
Adjusted revenue growth
|
64% achievement
| |
| 4.1% CAGR at constant rates of exchange
|
(12.7% of award vesting out of possible 20%)
| |
|
Adjusted operating cash flow conversion ratio
|
100% achievement
| |
| 104.2% ratio over the performance period
|
(20% of award vesting out of possible 20%)
| |
Non-GAAP measures
Adjusted profit from operations (APFO), deleveraging (excluding foreign exchange), adjusted revenue growth from Strategic Portfolio at constant rates of exchange, adjusted diluted EPS, adjusted revenue and adjusted operating cash flow conversion ratio are non-GAAP measures used by the Remuneration Committee to assess performance. Please refer to pages 276 to 285 for definitions of these measures.
|
Strategic Report |
Governance Report | Financial Statements | Other Information | BAT Annual Report and Form 20-F 2020 | 125 | |||||
|
|
3 Executive Directors’ Remuneration for the Year Ended 31 December 2020
Total remuneration for the year ended 31 December 2020
| Jack Bowles | Tadeu Marroco1 | |||||||||||||||
| 2020 | 2019 | 2020 | 2019 | |||||||||||||
| £’000 | £’000 | £’000 | £’000 | |||||||||||||
|
Salary |
1,259 | 1,175 | 775 | 301 | ||||||||||||
| Taxable benefits2 |
||||||||||||||||
| – car allowance |
20 | 20 | 20 | 8 | ||||||||||||
| – health insurance |
15 | 13 | 13 | 5 | ||||||||||||
| – life insurance3 |
19 | 15 | 8 | 1 | ||||||||||||
| – tax advice |
65 | 30 | 30 | 34 | ||||||||||||
| – use of Company driver |
85 | 61 | 55 | 30 | ||||||||||||
| – home and personal security4 |
155 | 6 | 14 | – | ||||||||||||
| – tax & social security5 |
220 | 122 | - | – | ||||||||||||
| – other expenses related to individual and/or accompanied attendance at Company functions/events |
13 | 10 | 12 | 2 | ||||||||||||
| Total taxable benefits |
592 | 277 | 152 | 80 | ||||||||||||
| Short-term incentives |
||||||||||||||||
| STI vesting percentage (% of maximum) |
71.1% | 96% | 71.1% | 96% | ||||||||||||
| STI: cash – Group performance cash element |
1,119 | 1,412 | 523 | 280 | ||||||||||||
| STI: DSBS – Group performance deferred element |
1,119 | 1,412 | 523 | 280 | ||||||||||||
| Total short-term incentives (page 126) |
2,238 | 2,824 | 1,046 | 560 | ||||||||||||
| Long-term incentives6,7 |
||||||||||||||||
| LTIP vesting percentage (% of maximum) |
54.2% | 69.9% | 54.2% | 69.9% | ||||||||||||
| LTIP value to vest |
641 | 540 | 414 | 431 | ||||||||||||
| Dividend equivalent8 |
145 | 102 | 94 | 81 | ||||||||||||
| Total long-term incentives (page 127) |
786 | 642 | 508 | 512 | ||||||||||||
| Total pension-related benefits (page 128) |
189 | 216 | 116 | 46 | ||||||||||||
| Other emoluments3 |
||||||||||||||||
| Share Reward Scheme (value of ordinary shares awarded) |
3 | 4 | 3 | – | ||||||||||||
| Sharesave Scheme (face value of discount on options granted) |
– | – | 15 | – | ||||||||||||
| Total other emoluments |
3 | 4 | 18 | – | ||||||||||||
| Total remuneration |
5,067 | 5,138 | 2,615 | 1,499 | ||||||||||||
Notes:
| 1. | Tadeu Marroco was appointed Finance Director on 5 August 2019 and was appointed as an Executive Director on the same date. The amounts shown in the table above for 2019 reflect remuneration received while an Executive Director of the Company. |
| 2. | Taxable benefits: the figures shown are gross amounts as, in line with the UK market, it is the normal practice for the Company to pay the tax which may be due on any benefits, with the exception of the car or car allowance. The numbers presented above for tax advice are inclusive of applicable VAT and income tax. |
| 3. | In the Annual Report on Remuneration 2019, life insurance was included within the ‘Other emoluments’ remuneration item in the single figure table. For the Annual Report on Remuneration 2020, life insurance has been included within the ‘Taxable benefits’ remuneration item. The figures for 2019 in the table above have been restated to reflect this change. |
| 4. | Figure for home and personal security for Jack Bowles for 2020 relates to necessary security improvements to his residence. As noted in point 2 above, this amount has been grossed up for UK tax purposes. |
| 5. | Amount for Jack Bowles relates to tax equalisation payments made during the year ended 31 December 2020. |
| 6. | The 2018 LTIP award is due to vest on 26 March 2021 based on completion of the three-year performance period on 31 December 2020. The value shown is based on the average share price for the three-month period ended 31 December 2020 of 2,701p. The LTIP vesting figures above reflect awards made to Jack Bowles and Tadeu Marroco prior to being appointed as Executive Directors. |
| 7. | LTIP award shown for 2019: the values disclosed in the Annual Report on Remuneration for the year ended 31 December 2019 were estimated values as the award had not vested by the date of that report; these amounts have been re-presented based on the actual market value on the date of vesting of 27 March 2020 of 2,734p. |
| 8. | LTIP dividend equivalent payments: the dividend equivalent payment that will attach to the LTIP award that is included in the Single Figure Table is reported. The values for the year ended 31 December 2019 have been restated on this basis. |
| 126 | BAT Annual Report and Form 20-F 2020 |
Remuneration Report
Annual Statement on Remuneration
Continued
Short-Term Incentives for the Year Ended 31 December 2020
STI performance measures, weightings and results for year ended 31 December 2020
| STI: performance measure and target 2020 | Description of measure 2020 | Actual performance 2020 | Payout (maximum) | |||
| Group’s share of Key Markets
Threshold: 0 bps growth over 2019
Maximum: 10 bps growth over 2019 |
The Group’s volume share in its Key Markets accounts for around 80% of the volume of the Group’s subsidiaries. The Group’s share is calculated from data as independently measured by retail audit agencies and scanner sales to consumers, or from estimated shipment share. The Group’s volume share is re-based as and when the Group’s Key Markets change or when retail audit agency product improvements result in the re-statement of data. When re-basing does occur, the Company will also restate historical data and provide fresh comparative data on the markets.
|
Global volume share in key markets grew by 33 bps.
Strategic Report: Delivering our strategy – A Better Tomorrow for Consumers |
10% (10%) | |||
| Adjusted revenue growth from the Strategic Portfolio
Threshold: 3% growth over 2019
Maximum: 6% growth over 2019 |
The Strategic Portfolio reflects the focus of the Group’s investment activity, and is defined as Strategic Combustibles and Strategic Traditional Oral products, and New Category products. This measure is assessed at constant rates of exchange. Please refer to page 278 for the detailed description of the Strategic Portfolio. | Adjusted revenue from the Strategic Portfolio grew by 7.0%.
Strategic Report: Delivering our strategy – A Better Tomorrow for Shareholders |
30% (30%) | |||
| Adjusted profit from operations (APFO) (growth over prior year) Weighting: 30%
Threshold: 4.0% growth over 2019
Maximum: 6.5% growth over 2019
|
APFO is the adjusted profit from operations at constant rates of exchange for the year ended 31 December 2020. Please refer to page 279 for the detailed description of APFO.
|
APFO growth over the prior year of 4.8%.
Strategic Report: Delivering our strategy – A Better Tomorrow for Shareholders |
11.6% (30%) | |||
| Deleveraging (excluding foreign exchange) Weighting: 30%
Threshold: 0.20x reduction versus 2019
Maximum: 0.40x reduction versus 2019
|
Deleveraging (excluding foreign exchange) refers to the reduction in Adjusted Net Debt to Adjusted EDITDA during the year ended 31 December 2020, assessed at constant rates of exchange. | Deleveraging (excluding foreign exchange) was 0.33x.
Strategic Report: Delivering our strategy – A Better Tomorrow for Shareholders |
19.5% (30%) | |||
| 71.1% (100%) | ||||||
STI outcome for year ended 31 December 2020
| Available STI award as % of base salary |
STI award achieved as % of maximum opportunity |
STI award achieved % of base salary |
STI award achieved £’000 (Value shown in Single Figure Table)1 |
|||||||||||||
| Jack Bowles | 250% | 71.1% | 177.8% | 2,238 | ||||||||||||
| Tadeu Marroco |
190% | 71.1% | 135.1% | 1,046 | ||||||||||||
Notes:
| 1. | Malus and clawback provisions apply. |
| 2. | 50% of the STI award will be paid in cash and 50% as an award under the DSBS. Awards made under the DSBS are in the form of free ordinary shares in the Company that normally vest after three years and no further performance conditions apply in that period. In certain circumstances, such as resigning before the end of the three-year period, participants may forfeit all of the shares. |
|
Strategic Report |
Governance Report | Financial Statements | Other Information | BAT Annual Report and Form 20-F 2020 | 127 | |||||
|
|
Long-Term Incentives (LTIP) for the Year Ended 31 December 2020
LTIP performance measures, weightings and results for the year ended 31 December 2020
| LTIP: performance measure | Description of measure and target for 2018 LTIP Performance period 1 January 2018 – 31 December 2020 |
Result achieved | Vesting percentage | |||||
| Relative TSR1 | Ranked 20 | 0% | ||||||
|
Relative to a peer group of international FMCG companies |
2018–2020 LTIP target | out of 23 | (out of maximum of 20%) | |||||
| Threshold | At median, 3% vests | |||||||
|
Weighting: 20% |
Maximum | At upper quartile, 20% vests
|
||||||
| EPS growth at current rates of exchange |
5.5% CAGR | 4.9% | ||||||
| 2018–2020 LTIP target | (out of maximum of 20%) | |||||||
| Compound annual growth in adjusted diluted EPS measured at current rates of exchange | Threshold | At CAGR of 5%, 3% vests | ||||||
| Maximum | At CAGR of 10%, 20% vests | |||||||
| Weighting: 20% | ||||||||
| EPS growth at constant rates | 8.5% CAGR | 15.0% | ||||||
| of exchange | 2018–2020 LTIP target | (out of maximum of 20%) | ||||||
| Compound annual growth in adjusted diluted EPS measured at constant rates of exchange | Threshold | At CAGR of 5%, 3% vests | ||||||
| Maximum | At CAGR of 10%, 20% vests | |||||||
| Weighting: 20% | ||||||||
| Adjusted revenue2 | 4.1% CAGR | 12.7% | ||||||
| Compound annual growth measured at constant rates of exchange | 2018–2020 LTIP target | (out of maximum of 20%) | ||||||
| Threshold | At CAGR of 3%, 3% vests | |||||||
| Maximum | At CAGR of 5%, 20% vests | |||||||
| Weighting: 20% | ||||||||
| Adjusted Operating cash flow | 104.2% ratio | 20% | ||||||
| conversion ratio | 2018–2020 LTIP target | (out of maximum of 20%) | ||||||
|
Ratio over the performance period at current rates of exchange |
Threshold | Ratio of 85%, 3% vests | ||||||
| Maximum | Ratio of 95%, 20% vests | |||||||
| Weighting: 20% | ||||||||
| Total vesting level as a percentage of maximum opportunity | 52.6% | |||||||
Notes:
| 1. | Relative TSR: the constituents of the FMCG peer group are listed on page 132. |
| 2. | The underpin for adjusted revenue growth measure: the adjusted revenue growth measure can only vest provided the corresponding three-year CAGR of APFO exceeds the CAGR of the threshold performance level for APFO as approved annually in the STI and approved by the Board. The underpin was exceeded with reference to the APFO STI outcomes for 2018, 2019 and 2020. |
LTIP outcome for year ended 31 December 2020
| Number of ordinary shares subject to award |
Vesting % achieved (based on 2018–2020 performance period) |
Number of ordinary shares to vest |
Value of ordinary shares to vest1 £’000 |
Dividend equivalent payment on vesting2 £’000 |
Total value to vest £’000 (Value shown in Single Figure Table) |
|||||||||||||||||||
| Jack Bowles3 | 43,785 | 54.2% | 23,731 | 641 | 145 | 786 | ||||||||||||||||||
| Tadeu Marroco3 |
28,248 | 54.2% | 15,310 | 414 | 94 | 508 | ||||||||||||||||||
The 2018 LTIP awards granted to Jack Bowles and Tadeu Marroco were made prior to their appointments as Executive Directors, therefore the vesting date is 26 March 2021 and the shares will become exercisable on that same date.
Notes:
| 1. | The value of ordinary shares to vest shown above is based on the average share price for the three-month period ended 31 December 2020 of 2,701p. |
| 2. | The dividend equivalent amount shown above that will become payable on vesting is the value of the dividend equivalents accrued on the proportion of the award that is due to vest. |
| 3. | The number of shares subject to awards made to Jack Bowles and Tadeu Marroco reflect the award opportunities available to them at the time of the award, prior to being appointed as Executive Directors. |
| 128 | BAT Annual Report and Form 20-F 2020 |
Remuneration Report
Annual Statement on Remuneration
Continued
Executive Directors’ pension entitlements and accruals for the year ended 31 December 2020
| Total Defined Contribution (DC) fund value
as at year-end 31 December 2020 £’000 |
||||||||
| Pension values | Defined Contribution (DC) Unapproved Unfunded Retirement Benefit Scheme (UURBS)1 |
British American Tobacco UK Pension Plan |
||||||
| Jack Bowles | 884 | 351 | ||||||
| Tadeu Marroco | 636 | 181 | ||||||
|
Total |
1,520 | 532 | ||||||
Note:
| 1. | The DC UURBS credit accrued over the year is increased in line with the Company’s Weighted Average Cost of Debt (WACD) over the year. For the year ended 31 December 2020, a WACD of 3.6% has been used. |
Jack Bowles
The total Company contribution to the DC arrangements over the period 1 January to 31 December 2020 was £189,034. Of this, £4,171 was paid to the British American Tobacco UK Pension Plan and £184,863 was credited to the DC UURBS. These total amounts are based on a Company contribution rate of 15% of salary per annum.
Tadeu Marroco
The total Company contribution paid to the DC arrangements over the period 1 January to 31 December 2020 was £116,374. Of this, £4,171 was paid to the funded British American Tobacco UK Pension Plan and £112,203 was credited to the DC UURBS. These total amounts are based on a Company contribution rate of 15% of salary per annum.
Notes:
| 1. | No excess retirement benefits have been paid to or are receivable by an Executive Director or former Executive Director. |
|
Strategic Report |
Governance Report | Financial Statements | Other Information | BAT Annual Report and Form 20-F 2020 | 129 | |||||
|
|
Other Information Relating to Chief Executives’ Remuneration for the year Ended 31 December 2020
Chief Executives’ pay – comparative figures 2011 to 2020
| Year | 2011 | 2012 | 2013 | 2014 | 2015 | 2016 | 2017 | 2018 | 2019 | 2020 | ||||||||||||||||||||||||||||||
| Chief Executives’
Paul Adams1 |
5,961 | n/a | n/a | n/a | n/a | n/a | n/a | n/a | n/a | n/a | ||||||||||||||||||||||||||||||
| Nicandro Durante2 (to 1 April 2019) |
5,589 | 6,340 | 6,674 | 3,617 | 4,543 | 8,313 | 10,244 | 8,651 | 3,054 | n/a | ||||||||||||||||||||||||||||||
| Jack Bowles (from 1 April 2019) |
n/a | n/a | n/a | n/a | n/a | n/a | n/a | n/a | 3,512 | 5,067 | ||||||||||||||||||||||||||||||
| Annual bonus (STI) paid against maximum opportunity (%)
Paul Adams1 (to 28 February 2011) |
100 | n/a | n/a | n/a | n/a | n/a | n/a | n/a | n/a | n/a | ||||||||||||||||||||||||||||||
| Nicandro Durante2 (to 1 April 2019) |
100 | 85.0 | 81.3 | 73.2 | 100 | 100 | 97.2 | 100 | 50 | n/a | ||||||||||||||||||||||||||||||
| Jack Bowles (from 1 April 2019) |
n/a | n/a | n/a | n/a | n/a | n/a | n/a | n/a | 96 | 71.1 | ||||||||||||||||||||||||||||||
| Long-term incentive (LTIP) paid against maximum opportunity (%) | ||||||||||||||||||||||||||||||||||||||||
|
Paul Adams1 (to 28 February 2011) |
100 | n/a | n/a | n/a | n/a | n/a | n/a | n/a | n/a | n/a | ||||||||||||||||||||||||||||||
| Nicandro Durante2 (to 1 April 2019) |
100 | 87.1 | 49.2 | 0.0 | 8.7 | 46.0 | 96.1 | 70.5 | 69.3 | n/a | ||||||||||||||||||||||||||||||
| Jack Bowles (from 1 April 2019) |
n/a | n/a | n/a | n/a | n/a | n/a | n/a | n/a | 69.9 | 54.2 | ||||||||||||||||||||||||||||||
Notes:
| 1. | Paul Adams retired as Chief Executive on 28 February 2011. Historical data are taken from the Directors’ Remuneration Reports for the relevant years and is recast (as appropriate) on the basis of the ‘single figure’ calculation as prescribed in the UK Directors’ Remuneration Report Regulations. |
| 2. | Nicandro Durante retired as Chief Executive on 1 April 2019. Historical data are taken from the Directors’ Remuneration Reports for the relevant years and is recast (as appropriate) on the basis of the ‘single figure’ calculation as prescribed in the UK Directors’ Remuneration Report Regulations. His ‘single figure’ remuneration for the years ended 31 December 2011 and 31 December 2019 have been time-apportioned to reflect the period he was Chief Executive. |
Total shareholder return (TSR) performance:1 1 January 2011 to 31 December 2020
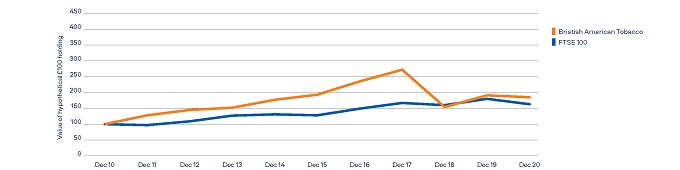
Note:
| 1. | Performance and pay chart: this shows the performance of a hypothetical investment of £100 in ordinary shares (as measured by the TSR for the Company) against a broad equity market index (the FTSE 100 Index) over a period of 10 financial years starting from 1 January 2011 through to 31 December 2020 based on 30-trading-day average values. A local currency basis is used for the purposes of the TSR calculation making it consistent with the approach to TSR measurement for the LTIP. |
| 130 | BAT Annual Report and Form 20-F 2020 |
Remuneration Report
Annual Statement on Remuneration
Continued
Annual change in remuneration of Directors’ and employees
The following table shows the percentage change in the Directors’ remuneration measured against a comparator group comprising the UK employee population across all UK entities (2020: 2,764 individuals; 2019: 2,980 individuals). This comparator group is considered to be the most appropriate group due to the limited number of employees employed under BAT plc contracts outside of the Director group. In addition, using a more widely-drawn group encompassing the worldwide nature of the Group’s business would also present practical difficulties in collation and a less relevant comparator, given the significant variations in employee pay across the Group, the differing economic conditions and wide variations in gross domestic product per capita.
| Year-on-year percentage change in pay | ||||||||||||||||||||||||||||||||||||||||||||||||||||
| Executive Directors | Non-Executive Directors | |||||||||||||||||||||||||||||||||||||||||||||||||||
| Average UK-based Employee |
Chief Executive2 |
Finance and Transformation Director3 |
Sue Farr |
Dr Marion Helmes |
Jerry Fowden4 |
Luc Jobin |
Holly Koeppel |
Savio Kwan |
Dimitri Panayotopoulos5 |
Kieran Poynter6 |
Karen Guerra7 |
Darrell Thomas8 |
||||||||||||||||||||||||||||||||||||||||
| Salary/ Fees | 3% | 4% | (9%) | 2% | 2% | 198% | 2% | 3% | 2% | 21% | (66% | ) | n/a | n/a | ||||||||||||||||||||||||||||||||||||||
| Taxable Benefits9 | 1% | 66% | (19%) | (100% | ) | (77% | ) | 240% | (79% | ) | (82% | ) | (84% | ) | (88% | ) | (100% | ) | n/a | n/a | ||||||||||||||||||||||||||||||||
| Short- term Incentive | (5% | ) | (11% | ) | (33%) | – | – | – | – | – | – | – | – | – | – | |||||||||||||||||||||||||||||||||||||
Notes:
| 1. | The data for the UK-based employees comparator group are made up as follows as at 1 November 2020: (1) the weighted average base salaries; (2) the average taxable benefits per grade; and (3) the weighted average bonus result based on that population as at that date. |
| 2. | The Chief Executive figures for salary, taxable benefits and short-term incentives for 2019 are calculated based on Nicandro Durante’s remuneration for the period 1 January to 31 March 2019 and Jack Bowles’ remuneration for the period 1 April to 31 December 2019. The increase in taxable benefits relates to security and tax equalisation payments made in the year ended 31 December 2020. |
| 3. | The Finance and Transformation Director figures for salary, taxable benefits and short-term incentives for 2019 are calculated based on Ben Stevens’ remuneration for the period 1 January to 4 August 2019 and Tadeu Marroco’s remuneration for the period 5 August to 31 December 2019. |
| 4. | Increase in fees for Jerry Fowden is due to the 2019 fee figure representing the period 1 September 2019 to 31 December 2019 only. |
| 5. | From May 2020 Dimitri Panayotopoulos started receiving the Senior Independent Director fee resulting in the fee increase displayed in the table above. |
| 6. | The decrease in fees and taxable benefits for Kieran Poynter is a result of the figures for 2020 representing the period 1 January 2020 to 30 April 2020 only. |
| 7. | Karen Guerra was appointed as a Non-Executive Director effective 1 September 2020, therefore no percentage change in fees and taxable benefits is displayed. |
| 8. | Darrell Thomas was appointed as a Non-Executive Director effective 7 December 2020, therefore no percentage change in fees and taxable benefits is displayed. |
| 9. | Decrease in taxable benefits for Finance and Transformation Director is related to reduction in use of Company driver in 2020. Decreases in taxable benefits for Non-Executive Directors is reflective of the significant reduction in travel and attendance of business functions due to COVID-related restrictions. |
Chief Executive Pay Ratio Disclosure
The below table reflects the Chief Executive pay ratio when compared to employees at the 25th, median and 75th percentile of the Group’s UK workforce for years 2019 and 2020. The table also includes the salary and total remuneration figures for the employees at each percentile for 2020.
| Year | Method | 25th percentile pay ratio | Median pay ratio | 75th percentile pay ratio | ||||||||||||
| 20192,3 |
Option A | 144:1 | 86:1 | 36:1 | ||||||||||||
| 20204,5 |
Option A | 103:1 | 66:1 | 29:1 | ||||||||||||
| Employees remuneration for 2020 | 25th percentile | Median | 75th percentile | |||||||||||||
| Salary |
£33,905 | £53,087 | £91,773 | |||||||||||||
| Total Remuneration |
£49,345 | £76,702 | £176,272 | |||||||||||||
| Notes: | |
| 1. | Option A uses the total full-time equivalent remuneration for all UK employees for the financial year ended 31 December 2020 and has been used to calculate the ratio as this is viewed to be the most robust and comprehensive means of assessment and is also reflective of shareholder preferences. |
| 2. | Total pay and benefits for 2019 are based on the workforce as at 1 December 2019 and include the annualised income for the earnings period 1 January 2019 to 31 December 2019. |
| 3. | Total pay and benefits for the Chief Executive for 2019 are based on the single figure calculation on page 97 of the 2019 Annual Report. The Chief Executive single figure used in the calculation is a combination of remuneration data for both Nicandro Durante and Jack Bowles, recognising the transition in the Group’s leadership which took place in 2019. |
| 4. | Total pay and benefits are based on the workforce as at 1 November 2020 and include the annualised income for the earnings period 1 January 2020 to 31 December 2020. |
| 5. | Total pay and benefits for the Chief Executive are based on the single figure calculation on page 124. |
| 6. | Total pay and benefits for the workforce is calculated as far as possible on the same basis as the Chief Executive single figure calculation. This includes salary, taxable benefits, short-term incentive, long-term incentive, dividends, pension benefits and any other remuneration receivable. For the purposes of this analysis, the following has been assumed: |
| – | For all employees that are eligible for a car benefit, the applicable car allowance amounts have been used; |
| – | For all employees that participate in the global International Executive Incentive Scheme or equivalent corporate incentive scheme, incentive pay-outs are calculated based on the same metrics; and |
| – | For all employees that participate in the UK DC scheme, Company contributions of 15% of salary have been used. |
| 7. | For the calculation of the total pay and benefits for employees, employees on international assignment into and out of the UK have been included; however, assignment benefits, such as housing support, education support, home leave allowance or relocation costs, have not been included as these are not consistent with the benefits included in the Chief Executive single figure calculation. |
| 8. | For hourly paid employees who are not full time, total pay and benefits have been pro-rated based on full-time employee hours. |
| 9. | For employees who have joined part way through the year, pro rata income has been used to provide a full year figure. |
The figures above show that there has been a significant reduction in the Chief Executive pay ratio across all quartiles from 2019 to 2020.
|
Strategic Report |
Governance Report | Financial Statements | Other Information | BAT Annual Report and Form 20-F 2020 | 131 | |||||
|
|
The reduction is primarily a consequence of three elements of the Chief Executive remuneration package reducing from 2019 to 2020 and these are pension, short-term incentive and long-term incentive. It should also be noted that the 2019 pay ratio was calculated based on a blended figure combining the remuneration of Nicandro Durante and Jack Bowles for their respective periods in the role.
Pension – the 2019 Chief Executive pension figure included the cost of Nicandro Durante’s defined benefit pension plan. Jack Bowles’ pension contribution is 15% of annual salary in line with the wider UK workforce.
Short-term incentive – the outcome for the 2019 short-term incentive plan was 96.1% which has reduced to 71.1% for 2020.
Long-term incentive – the outcome for the 2016 LTIP award, for which the performance period ended 31 December 2019, was 69.9% which has reduced to 54.2% for the 2018 LTIP award which completed the three year performance period on 31 December 2020. Furthermore, the figure for 2019 included income from awards made to Nicandro Durante at Chief Executive award levels. The figure for 2020 includes only income from awards made to Jack Bowles prior to his appointment to Executive Director.
The Company believes the median pay ratio for 2020 reflects the diversity of our business footprint and employee population across the UK. The Group’s remuneration policies and practices are founded on a high degree of alignment and consistency, with total remuneration at all levels providing competitive compensation that enables the attraction and retention of talent while also providing equitable differentiated remuneration based on grade, performance and experience. Further details on all-employee rewards at BAT can be found on pages 122 and 123.
4 Executive Directors’ Remuneration for the Upcoming Year
Base salary for 2021
The Remuneration Committee has determined the following salaries for the Executive Directors.
| Executive Directors – salaries |
Base £ |
Percentage % |
Base salary from 1 Apr 2020 £ |
|||||||||
| Jack Bowles |
1,325,610 | 3% | 1,287,000 | |||||||||
| Tadeu Marroco1 |
803,400 | 4% | 772,500 | |||||||||
Notes:
1. The 4% base salary increase for Tadeu Marroco was effective from 1 October 2020 (see page 119 for further details).
Benefits and pension
No changes have been made to the provision of benefits or pension for 2021.
Short-term incentives for 2021
STI opportunity levels for Executive Directors will be in line with those set out in our Directors’ Remuneration Policy. STI metrics and weightings are as follows:
| 2021 STI metrics & weightings | ||||
| Group share of key markets1 |
15% | |||
| New Categories revenue2 |
20% | |||
| Adjusted profit from operations |
30% | |||
| Deleveraging excluding foreign exchange |
35% | |||
|
Total |
100% | |||
Notes:
1. Group share of key markets will include THP performance for all major markets (markets included are Japan, South Korea, Italy, Czech Republic, Ukraine and Russia). A description of the metric can be found on page 274.
2. Further details of the metric can be found on page 277.
Further detail is included in the description of the STI measures for the year ended 31 December 2020 on page 126.
| 132 | BAT Annual Report and Form 20-F 2020 |
Remuneration Report
Annual Statement on Remuneration
Continued
Long-term incentives for 2021
The Chief Executive and Finance and Transformation Director will be granted an LTIP award equal to a maximum of 500% of salary and 400% of salary, respectively. The performance measures and weightings for the LTIP award to be granted in 2021 will remain unchanged from those for 2020 awards. The measures and targets for 2021 LTIP awards are set out below.
| LTIP measures and performance ranges | % of award vesting at maximum |
% of award vesting at threshold |
||||||||||||||
| Relative TSR | 20 | 3 | ||||||||||||||
| Median performance vs. FMCG peer group to upper quartile. |
|
|||||||||||||||
| The current constituents of the FMCG peer group as at the date of this report are: |
||||||||||||||||
| Altria Group |
Colgate-Palmolive | Japan Tobacco | Mondelēz International | Procter & Gamble | ||||||||||||
| Anheuser-Busch InBev |
Danone | Johnson & Johnson | Nestlé | Reckitt Benckiser | ||||||||||||
| Campbell Soup |
Diageo | Kellogg | PepsiCo | Unilever | ||||||||||||
| Carlsberg |
Heineken | Kimberly-Clark | Pernod Ricard | |||||||||||||
| Coca-Cola |
Imperial Brands | LVMH | Philip Morris International | |||||||||||||
| EPS growth at current rates of exchange |
20 | 3 | ||||||||||||||
| 5%–10% compound annual growth in adjusted diluted EPS over the performance period |
| |||||||||||||||
| EPS growth at constant rates of exchange |
20 | 3 | ||||||||||||||
| 5%–10% compound annual growth in adjusted diluted EPS over the performance period |
| |||||||||||||||
| Adjusted revenue growth |
20 | 3 | ||||||||||||||
| 3%–5% compound annual growth over the performance period |
||||||||||||||||
| Adjusted operating cash flow conversion ratio |
20 | 3 | ||||||||||||||
| Ratio of 85%–95% over the performance period at current rates of exchange |
| |||||||||||||||
|
Total |
100 | 15 | ||||||||||||||
5 Chairman and Non-Executive Directors’ Remuneration for the Year Ended 31 December 2020
The following table shows a single figure of remuneration for the Chairman and Non-Executive Directors in respect of qualifying services for the year ended 31 December 2020 together with comparative figures for 2019.
| Base fee1 £’000 |
Chair/Committee membership fees1 £’000 |
Taxable benefits2 £’000 |
Total remuneration £’000 |
|||||||||||||||||||||||||||||
| 2020 | 2019 | 2020 | 2019 | 2020 | 2019 | 2020 | 2019 | |||||||||||||||||||||||||
| Chairman |
||||||||||||||||||||||||||||||||
| Richard Burrows |
714 | 695 | – | – | 77 | 137 | 791 | 832 | ||||||||||||||||||||||||
| Non-Executive Directors |
||||||||||||||||||||||||||||||||
| Sue Farr |
96 | 94 | 26 | 26 | – | 4 | 122 | 124 | ||||||||||||||||||||||||
| Dr Marion Helmes |
96 | 94 | 26 | 26 | 3 | 13 | 125 | 133 | ||||||||||||||||||||||||
| Jerry Fowden |
96 | 32 | 26 | 9 | 17 | 5 | 139 | 45 | ||||||||||||||||||||||||
| Luc Jobin3 |
96 | 94 | 26 | 26 | 16 | 77 | 138 | 197 | ||||||||||||||||||||||||
| Holly Keller Koeppel4 |
96 | 94 | 53 | 51 | 23 | 125 | 172 | 270 | ||||||||||||||||||||||||
| Savio Kwan |
96 | 94 | 26 | 26 | 10 | 61 | 132 | 181 | ||||||||||||||||||||||||
| Karen Guerra (from 14 September 2020) |
29 | – | 8 | – | – | – | 37 | – | ||||||||||||||||||||||||
| Darrell Thomas (from 7 December 2020) |
– | – | – | – | – | – | – | – | ||||||||||||||||||||||||
| Dimitri Panayotopoulos |
124 | 94 | 53 | 52 | 3 | 24 | 180 | 170 | ||||||||||||||||||||||||
| Kieran Poynter (up to 30 April 2020) |
44 | 94 | 9 | 64 | – | 1 | 53 | 159 | ||||||||||||||||||||||||
|
Total |
1,487 | 1,384 | 253 | 280 | 149 | 447 | 1,889 | 2,111 | ||||||||||||||||||||||||
Notes:
| 1. | Committee memberships: are shown, together with changes during the year, in the reports of the respective committees in the Governance sections of the Directors’ Report. |
| 2. | Benefits: the Chairman’s benefits in 2020 comprised: health insurance and ‘walk-in’ medical services £16,000 (2019: £15,000); the use of a Company driver £48,000 (2019: £81,000); home and personal security in the UK and Ireland £11,000 (2019: £14,000); and commuting flights to London £2,000 (2019: £23,000). The benefits for the other Non-Executive Directors principally comprised travel-related expenses incurred in connection with individual and/or accompanied attendance at certain business functions and/or events and ‘walk-in’ medical services. The figures shown are grossed-up amounts (as appropriate) as, in line with the UK market, it is the normal practice for the Company to pay the tax that may be due on any benefits. |
| 3. | Pension: Luc Jobin receives a pension in respect of prior service to Imasco Limited (acquired in 2000 by the Group) and Imperial Tobacco Canada Limited, a subsidiary of BAT. In 2020 this amount was CAD$151,395.00 (£86,112.85) (2019: CAD$150,228.96 (£87,450.72)). |
| 4. | Deferred Compensation Plan for Directors of Reynolds American Inc. (DCP): as a former outside director of Reynolds American Inc. Holly Keller Koeppel participated in the DCP under which she elected to defer payment of a portion of her Reynolds American retainers and meeting attendance fees to a Reynolds American stock account. Following the acquisition of Reynolds American by BAT, amounts deferred to a stock account (Deferred Stock Units or DSUs) mirror the performance of, and receive dividend equivalents based on, BAT American Depository Shares (ADSs). The DSUs of Holly Keller Koeppel are disclosed as a note to ‘Summary of Directors’ share interests’ below. DSUs deferred under the DCP will be paid in accordance with the terms of the DCP, section 409A of the US Internal Revenue Code of 1986, as amended, and the Director’s existing deferral elections. |
| 5. | The Non-Executive Directors’ fees structure 2020 is set out in the table overleaf. |
|
Strategic Report |
Governance Report | Financial Statements | Other Information | BAT Annual Report and Form 20-F 2020 | 133 | |||||
|
|
| Fees from 1 May 2020 £ |
Fees to 30 April 2020 £ |
|||||||
| Base fee |
96,850 | 94,500 | ||||||
| Senior Independent Director – supplement |
41,500 | 37,800 | ||||||
| Audit Committee: Chairman |
40,950 | 39,950 | ||||||
| Audit Committee: Member |
14,100 | 13,750 | ||||||
| Nominations Committee: Chairman |
– | – | ||||||
| Nominations Committee: Member |
12,500 | 12,200 | ||||||
| Remuneration Committee: Chairman |
40,950 | 39,950 | ||||||
| Remuneration Committee: Member |
14,100 | 13,750 | ||||||
Chairman and Non-Executive Directors’ fees and remuneration for the upcoming year
As described in the Annual Report on Remuneration for the year ended 31 December 2019, the Chairman’s fee was increased from £698,000 to £718,940 from 1 April 2020.
With effect from 28 April 2021, Luc Jobin’s fee as Chairman will be £670,000.
The fees for Non-Executive Directors are scheduled to be reviewed in April 2021 with any changes being effective from 1 May 2021.
|
|
| |||||||||||||||||||||||
| Summary of Directors’ share interests |
|
|||||||||||||||||||||||
| Outstanding scheme interests 31 Dec 2020 | ||||||||||||||||||||||||
| Ordinary shares held at 31 Dec 2020 |
Unvested awards subject to performance measures and continued employment (LTIP) |
Unvested awards |
Unvested interests (Sharesave) |
Total ordinary shares subject to outstanding scheme interests |
Total of all interests in ordinary shares at 31 Dec 2020 |
|||||||||||||||||||
| Executive Directors |
||||||||||||||||||||||||
| Jack Bowles1,3 |
217,518 | 443,446 | 91,874 | – | 535,320 | 752,838 | ||||||||||||||||||
| Tadeu Marroco2,3 |
54,360 | 178,243 | 45,404 | 890 | 224,537 | 278,897 | ||||||||||||||||||
| Chairman |
||||||||||||||||||||||||
| Richard Burrows |
19,000 | 19,000 | ||||||||||||||||||||||
| Non-Executive Directors |
||||||||||||||||||||||||
| Sue Farr |
– | – | ||||||||||||||||||||||
| Jerry Fowden4 |
10,000 | 10,000 | ||||||||||||||||||||||
| Dr Marion Helmes |
4,500 | 4,500 | ||||||||||||||||||||||
| Luc Jobin4 |
45,236 | 45,236 | ||||||||||||||||||||||
| Holly Keller Koeppel4,5 |
8,416 | 8,416 | ||||||||||||||||||||||
| Savio Kwan3 |
7,455 | 7,455 | ||||||||||||||||||||||
| Dimitri Panayotopoulos |
3,300 | 3,300 | ||||||||||||||||||||||
| Darrell Thomas4 |
2,000 | 2,000 | ||||||||||||||||||||||
| Karen Guerra |
2,478 | 2,478 | ||||||||||||||||||||||
Notes:
| 1. | Jack Bowles: ordinary shares held include 685 held by the trustees of the BAT Share Incentive Plan (SIP). |
| 2. | Tadeu Marroco: ordinary shares held include 1,114 held by the trustees of the SIP. |
| 3. | Changes from 31 December 2020: (a) Jack Bowles: acquisition of 13 ordinary shares on 5 February 2021 as a result of reinvestment of dividend income under the SIP; acquisition of 69 ordinary shares on 5 February 2021 as a result of reinvestment of dividend income under the Share Plan Account (SPA); and acquisition of 437 ordinary shares on 5 February 2021 as a result of reinvestment of dividend income under the Deferred Shares Bonus Scheme (DSBS). (b) Tadeu Marroco: purchases of five ordinary shares on 8 January 2021 and five ordinary shares on 5 February 2021 under the SIP; acquisition of 21 ordinary shares on 5 February 2021 as a result of reinvestment of dividend income under the SIP; acquisition of 21 ordinary shares on 5 February 2021 as a result of reinvestment of dividend income under the SPA; and acquisition of 134 ordinary shares on 5 February 2021 as a result of reinvestment of dividend income under the DSBS. There were no changes in the interests of the Chairman and the other Non-Executive Directors. |
| 4. | American Depositary Shares (ADSs): each of the interests in ordinary shares held by Jerry Fowden, Luc Jobin, Holly Keller Koeppel and Darrell Thomas consists of an equivalent number of BAT ADSs each of which represents one ordinary share in the Company. |
| 5. | Deferred Stock Units (DSUs): at the date of this report Holly Keller Koeppel, being a former director of Reynolds American Inc. and a participant in the Deferred Compensation Plan for Directors of Reynolds American (DCP), holds DSUs which were granted prior to becoming a Director of BAT. Each DSU entitles the holder to receive a cash payment upon ceasing to be a Director equal to the value of one BAT ADS. The number of DSUs increases on each dividend date by reference to the value of dividends declared on the ADSs underlying the DSUs. Ms Koeppel currently holds 25,125.91 DSUs (31 December 2020: 24,653.11 DSUs). |
| 134 | BAT Annual Report and Form 20-F 2020 |
Remuneration Report
Annual Statement on Remuneration
Continued
Executive Directors’ shareholding guidelines
Executive Directors are encouraged to build up a high level of personal shareholding to ensure a continuing alignment of interests with shareholders. The shareholding guidelines require Executive Directors to hold ordinary shares equal to the value of a percentage of salary as set out in the table below.
| No. of eligible ordinary shares held at 31 Dec 2020 |
Value of eligible ordinary shares held at 31 Dec 20201 £m |
Actual percentage (%) of base salary at 31 Dec 2020 |
Shareholding requirements (% of base salary 31 Dec 2020) |
Compliant with shareholding requirement |
||||||||||||||||
| Jack Bowles |
265,539 | 7.2 | 558.7 | 500% | Yes | |||||||||||||||
| Tadeu Marroco |
77,341 | 2.1 | 260.7 | 400%2 | See note 2 | |||||||||||||||
In accordance with the UK Corporate Governance Code 2018, the Remuneration Committee introduced from 2019 a new post-employment shareholding requirement whereby Executive Directors are required to hold shares equivalent to 100% of current shareholding requirements for two full years following the date of their departure with a sale restriction mechanism in place for this period. The Directors’ Remuneration Policy came into effect on 26 April 2019, following approval by shareholders at our AGM.
Ben Stevens is compliant with the post-employment shareholding requirement for the year ended 31 December 2020.
Eligibility of shares: (a) unvested ordinary shares under the DSBS, which represent deferral of earned bonus, are eligible and count towards the requirement on a net-of-tax basis; (b) unvested ordinary shares under the LTIP are not eligible and do not count towards the requirement during the performance period, but the estimated notional net number of ordinary shares held during the LTIP Extended Vesting Period are eligible and will count towards the requirement; and (c) ordinary shares held in trust under the all-employee share ownership plan (SIP) are not eligible and do not count towards the shareholding requirement.
Non-Executive Directors are not subject to any formal shareholding requirements although they are encouraged to build a small interest in ordinary shares during the term of their appointment.
Notes:
| 1. | Value of ordinary shares shown above: this is based on the closing mid-market share price on 31 December 2020 of 2,708p. |
| 2. | Tadeu Marroco was appointed as an Executive Director on 5 August 2019, prior to which the shareholding requirement for Mr Marroco was set at a lower percentage of salary with Mr Marroco being compliant with required percentage. Under the Directors’ Remuneration Policy, Executive Directors may generally sell a maximum of up to 50% of any shares vesting (after tax) under the Company’s share plans until the threshold for shareholding requirements has been met and Mr Marroco is compliant with this policy requirement. In line with the Directors’ Remuneration Policy, the shareholding requirement is equal to the value of the same multiple of salary at which LTIP awards are made to that Director, as such the shareholding requirement for Mr Marroco increased to 400% in 2020. |
| 3. | Meeting the guidelines: if an Executive Director does not at any time, meet the requirements of the shareholding guidelines, the individual may, generally, only sell a maximum of up to 50% of any ordinary shares vesting (after tax) under the Company share plans until the threshold required under the shareholding guidelines has been met. |
| 4. | Waiver of compliance with guidelines: this is permitted with the approval of the Remuneration Committee in circumstances where a restriction on a requested share sale could cause undue hardship. No such applications were received from the Executive Directors during 2020. |
|
Strategic Report |
Governance Report | Financial Statements | Other Information | BAT Annual Report and Form 20-F 2020 | 135 | |||||
|
|
| Executive Directors’ outstanding scheme interests
|
|
|||||||||||||||||||||||||||||||||||
| Plan | At 1 Jan 2020 | Awarded in 2020 |
Lapsed in 2020 |
Exercised/ released in 2020 |
At 31 Dec 2020 |
Exercise (p) |
End of performance period |
Date from which exercisable or shares released |
||||||||||||||||||||||||||||
| Jack Bowles |
LTIP | 1 | 26,463 | – | 7,966 | 18,497 | – | 2,689.50 | 31 Dec 19 | 27 Mar 20 | ||||||||||||||||||||||||||
| LTIP | 2 | 43,785 | – | – | – | 43,785 | – | 31 Dec 20 | 26 Mar 21 | |||||||||||||||||||||||||||
| LTIP | 3 | 176,532 | – | – | – | 176,532 | – | 31 Dec 21 | 28 Mar 24 | |||||||||||||||||||||||||||
| LTIP | 3 | – | 223,129 | – | – | 223,129 | – | 31 Dec 22 | 30 Mar 25 | |||||||||||||||||||||||||||
| DSBS | 8,997 | – | – | 8,997 | – | – | 31 Dec 19 | 27 Mar 20 | ||||||||||||||||||||||||||||
| DSBS | 12,064 | – | – | – | 12,064 | – | 31 Dec 20 | 26 Mar 21 | ||||||||||||||||||||||||||||
| DSBS | 26,192 | – | – | – | 26,192 | – | 31 Dec 21 | 28 Mar 22 | ||||||||||||||||||||||||||||
| DSBS | – | 53,618 | – | – | 53,618 | – | 31 Dec 22 | 30 Mar 23 | ||||||||||||||||||||||||||||
| Sharesave | – | – | – | – | – | – | – | – | ||||||||||||||||||||||||||||
| Sharesave | – | – | – | – | – | – | – | – | ||||||||||||||||||||||||||||
| Tadeu Marroco |
LTIP | 1 | 21,109 | – | 6,354 | 14,755 | – | 3,003.00 | 31 Dec 19 | 27 Mar 20 | ||||||||||||||||||||||||||
| LTIP | 2 | 28,248 | – | – | – | 28,248 | – | 31 Dec 20 | 26 Mar 21 | |||||||||||||||||||||||||||
| LTIP | 3 | 36,057 | – | – | – | 36,057 | – | 31 Dec 21 | 28 Mar 22 | |||||||||||||||||||||||||||
| LTIP | 3 | – | 113,938 | – | – | 113,938 | – | 31 Dec 22 | 30 Mar 25 | |||||||||||||||||||||||||||
| DSBS | 7,177 | – | – | 7,177 | – | – | 31 Dec 19 | 27 Mar 20 | ||||||||||||||||||||||||||||
| DSBS | 7,783 | – | – | – | 7,783 | – | 31 Dec 20 | 26 Mar 21 | ||||||||||||||||||||||||||||
| DSBS | 13,233 | – | – | – | 13,233 | – | 31 Dec 21 | 28 Mar 22 | ||||||||||||||||||||||||||||
| DSBS | – | 24,388 | – | – | 24,388 | – | 31 Dec 22 | 30 Mar 23 | ||||||||||||||||||||||||||||
| Sharesave | 495 | – | – | 495 | – | 3,026.00 | 1 May 20 | 1 May 20 | ||||||||||||||||||||||||||||
| Sharesave | 266 | – | – | – | 266 | – | 1 May 21 | 1 May 21 | ||||||||||||||||||||||||||||
| Sharesave | – | 624 | – | – | 624 | – | 1 May 25 | 1 May 25 | ||||||||||||||||||||||||||||
Notes:
| 1. | Details of the performance condition for the LTIP awards granted in 2017 (which vested during 2020), and of achievement against that condition in the period to 31 December 2019, were set out in the Annual Report on Remuneration for the year ended 31 December 2019. |
| 2. | Details of the performance condition attached to 2018 LTIP awards, and of achievement against that condition in the period to 31 December 2020, are set out on page 127. |
| 3. | Details of the performance condition attached to 2019 and 2020 LTIP awards are set out on page 136. |
Further details in relation to scheme interests granted during the year ended 31 December 2020
| Plan | Ordinary shares awarded |
Price per ordinary share at award1 |
Face value of award £’000 |
Proportion of award vesting for threshold performance (%) |
Performance period |
Date from which exercisable or shares released |
||||||||||||||||||||||
| Jack Bowles |
LTIP | 2 | 223,129 | 2,633p | 5,875 | 15 | 2020-2022 | 30 Mar 25 | ||||||||||||||||||||
| DSBS | 53,618 | n/a | n/a | 30 Mar 23 | ||||||||||||||||||||||||
| Tadeu Marroco |
LTIP | 2 | 113,938 | 2,633p | 3,000 | 15 | 2020-2022 | 30 Mar 25 | ||||||||||||||||||||
| DSBS | 24,388 | n/a | n/a | 30 Mar 23 | ||||||||||||||||||||||||
Notes:
| 1. | The price per ordinary share is the price used to determine the number of ordinary shares subject to the awards, which is calculated as the average of the closing mid-market price of an ordinary share over the three dealing days preceding the date of grant. |
| 2. | Details of the performance condition attached to these LTIP awards are set out below. |
| 136 | BAT Annual Report and Form 20-F 2020 |
Remuneration Report
Annual Statement on Remuneration
Continued
Further details in relation to performance conditions attaching to outstanding scheme interests
| LTIP awards granted in 2019 | LTIP awards granted in 2020 | |||||||||||||||||||||||||||
| 1 January 2019–31 December 2021 | 1 January 2020–31 December 2022 | |||||||||||||||||||||||||||
| Weighting | Threshold | Maximum | Weighting | Threshold | Maximum | |||||||||||||||||||||||
| Relative TSR
Ranking against a peer group of international FMCG companies |
20% | |
At median, 3% of award vests |
|
|
At upper quartile, 20% of award vests |
|
20% | |
At median, 3% of award vests |
|
|
At upper quartile, 20% of award vests |
| ||||||||||||||
| EPS growth at current rates of exchange
Compound annual growth in adjusted diluted EPS measured at current rates of exchange |
20% | |
At 5% CAGR, 3% of award vests |
|
|
At 10% CAGR, 20% of award vests |
|
20% | |
At 5% CAGR, 3% of award vests |
|
|
At 10% CAGR, 20% of award vests |
| ||||||||||||||
| EPS growth at constant rates of exchange
Compound annual growth in adjusted diluted EPS measured at constant rates of exchange |
20% | |
At 5% CAGR, 3% of award vests |
|
|
At 10% CAGR, 20% of award vests |
|
20% | |
At 5% CAGR, 3% of award vests |
|
|
At 10% CAGR, 20% of award vests |
| ||||||||||||||
| Adjusted revenue growth
Compound annual growth measured at constant rates of exchange |
20% | |
At 3% CAGR, 3% of award vests |
|
|
At 5% CAGR, 20% of award vests |
|
20% | |
At 3% CAGR, 3% of award vests |
|
|
At 5% CAGR, 20% of award vests |
| ||||||||||||||
| Adjusted operating cash flow conversion ratio
Measured at current rates of exchange, as a percentage of APFO |
20% | |
At 85%, 3% of award vests |
|
|
At 95%, 20% of award vests |
|
20% | |
At 85%, 3% of award vests |
|
|
At 95%, 20% of award vests |
| ||||||||||||||
There were no payments to past Directors or for loss of office.
Relative importance of spend on pay
To illustrate the relative importance of the remuneration of the Directors in the context of the Group’s finances overall, the Remuneration Committee makes the following disclosure:
| Item | 2020 £m |
2019 £m |
% change | |||||||||
| Remuneration of Group employees1 |
2,744 | 3,221 | -14.8 | |||||||||
| Remuneration of Executive Directors |
8 | 13 | -38.5 | |||||||||
| Remuneration of Chairman and Non-Executive Directors |
2 | 2 | 0 | |||||||||
| Total dividends2 |
4,745 | 4,598 | 3.2 | |||||||||
Notes:
| 1. | Total remuneration of Group employees: this represents the total employee remuneration costs for the Group, set out on page 166 within note 3(a) in the Notes on the Accounts. |
| 2. | Total dividends: this represents the total dividends paid in 2020. For further details please refer to page 71. |
Shareholder dilution – options and awards outstanding
|
Satisfaction of Company share plan awards in accordance with the Investment Association’s Principles of Remuneration |
New ordinary shares issued by the Company during the year ended 31 December 2020 | |
|
– by the issue of new ordinary shares;
– ordinary shares issued from treasury only up to a maximum of 10% of the Company’s issued share capital in a rolling 10-year period;
– within this 10% limit, the Company can only issue (as newly issued ordinary shares or from treasury) 5% of its issued share capital to satisfy awards under discretionary or executive plans; and
– the rules of the Company’s Deferred Share Bonus Scheme do not allow for the satisfaction of awards by the issue of new ordinary shares. |
– 70,859 ordinary shares issued by the Company in relation to the Sharesave Scheme;
– a total of 936,103 Sharesave Scheme options over ordinary shares in the Company were outstanding at 31 December 2020, representing 0.04% of the Company’s issued share capital (excluding shares held in treasury); and
– options outstanding under the Sharesave Scheme are exercisable until the end of October 2025 at option prices ranging from 2,291p to 4,056p. | |
|
Strategic Report |
Governance Report | Financial Statements | Other Information | BAT Annual Report and Form 20-F 2020 | 137 | |||||
|
|
8 The Remuneration Committee and Shareholder Engagement
| Remuneration Committee current members |
| Dimitri Panayotopoulos (Chairman) |
| Sue Farr |
| Karen Guerra |
| Dr Marion Helmes |
| Savio Kwan |
Role
As set out in the Terms of Reference, the Remuneration Committee is responsible for:
| – | determining and proposing the Directors’ Remuneration Policy (covering salary, benefits, performance-based variable rewards and retirement benefits) for shareholder approval; |
| – | determining, within the terms of the approved Directors’ Remuneration Policy, the specific remuneration packages for the Chairman and the Executive Directors, on appointment, on review and, if appropriate, any compensation payment due on termination of appointment; |
| – | the setting of targets applicable for the Company’s performance-based variable reward schemes and determining achievement against those targets, exercising discretion where appropriate and as provided by the applicable scheme rules and the Directors’ Remuneration Policy; |
| – | reviewing Group workforce remuneration and related policies, and the alignment of incentives and rewards with Group culture, taking these into account when setting the policy for Executive Director remuneration. Providing feedback to the Board on workforce reward, incentives and conditions applicable across the Group and supporting the Board’s monitoring of the Group’s culture and its alignment with the Group’s purpose, values and strategy; |
| – | setting remuneration for members of the Management Board and the Company Secretary; and |
| – | monitoring and advising the Board on any major changes to the policy on employee benefit structures for the Group. |
Remuneration Committee terms of reference
The Committee’s terms of reference align with the requirements of the UK Corporate Governance Code 2018. No changes were made to the Remuneration Committee’s terms of reference in 2020.
|
|
For the Remuneration Committee’s terms of reference see: | |
| www.bat.com/governance |
Attendance at meetings in 20201
| Name | Member since |
Attendance/ Eligible to attend Scheduled |
Attendance/ Eligible to attend Ad Hoc |
|||||||||
| Dimitri Panayotopoulos |
2015 | 4/4 | 2/2 | |||||||||
| Sue Farr |
2016 | 4/4 | 2/2 | |||||||||
| Karen Guerra2(b) |
2020 | 2/2 | 1/1 | |||||||||
| Marion Helmes |
2019 | 4/4 | 2/2 | |||||||||
| Savio Kwan |
2016 | 4/4 | 2/2 | |||||||||
Notes:
| 1. | Number of meetings in 2020: the Committee held six meetings in 2020, two of which were ad hoc. |
| 2. | Membership: (a) all members of the Committee are independent Non-Executive Directors in accordance with the UK Corporate Governance Code 2018 Provisions 10 and 32 and applicable NYSE listing standards; and (b) Karen Guerra became a member of the Committee on 14 September 2020 on her appointment as a Non-Executive Director. |
| 3. | Other attendees: the Chairman, the Chief Executive, the Director, Talent, Culture and Inclusion, the Group Head of Reward and other senior management, including the Company Secretary, may be consulted and provide advice, guidance and assistance to the Remuneration Committee. They may also attend Committee meetings (or parts thereof) by invitation. Neither the Chairman, any Executive Director nor member of senior management plays any part in determining their own respective remuneration. |
| 4. | PwC LLP: as one of the Remuneration Committee’s remuneration consultants appointed in January 2020, they attended meetings of the Remuneration Committee in 2020. As one of the founding members of the Remuneration Consultants Group (RCG), PwC LLP agrees to the RCG Code of Conduct which seeks to clarify the scope and conduct of the role of executive remuneration consultants when advising UK listed companies. |
| 5. | Meridian: as one of the Remuneration Committee’s remuneration consultants appointed in January 2020, they attended meetings of the Remuneration Committee in 2020. |
| 6. | Deloitte: provided general advice on remuneration up to 1 February 2020 but did not attend any meetings of the Remuneration Committee in 2020. |
| 138 | BAT Annual Report and Form 20-F 2020 |
Remuneration Report
Annual Statement on Remuneration
Continued
Remuneration Committee advisers during 2020
| Independent external advisers |
Services provided to the Remuneration Committee | Fees | Other services provided to the Company | |||
| Deloitte LLP | General advice on remuneration matters up to 1 February 2020. | 2020: £9,500 2019: £76,000 |
Tax, corporate finance and consulting services to Group companies worldwide.
| |||
| PwC LLP1 | General advice on remuneration matters including: market trends and comparator group analysis; policy review and shareholder engagement perspectives; and independent measurement of the relative TSR performance conditions.
|
2020: £126,013 | Tax, corporate finance and consulting services to Group companies worldwide excluding the US.
| |||
| Meridian | General advice on remuneration matters including market trends, shareholder engagement perspectives and comparator group analysis.
|
2020: $49,537 | Consulting services to Group companies in the US. | |||
| Herbert Smith Freehills LLP
|
Advice in respect of share plan regulations is provided to the Company and is available to the Remuneration Committee.
|
Fees relate to advice given to the Company.
|
General corporate legal and tax advice principally in the UK.
| |||
| KPMG LLP | Specified procedures to assist in the assessment of the calculations of the STI bonus and LTI outcomes and future targets.
|
2020: £28,000 2019: £28,000
|
Audit and tax services and other non-audit services.
| |||
Note:
| 1. | PwC LLP also provides other international services and international tax advice such as tax return services including for certain globally mobile directors. The Remuneration Committee advisory team is not involved in any other services PwC provides to the Group. |
Regular work programme 2020
The Remuneration Committee:
| – | reviewed the Chairman’s fee from 1 April 2020 with specific reference to the level of salary increases awarded to UK employees; |
| – | reviewed salaries for the Executive Directors to take effect from 1 April 2020, taking into account market positioning and the level of salary increases awarded to UK employees. The Remuneration Committee Chairman has led a programme of shareholder engagement in relation to these matters; |
| – | reviewed salaries for members of the Management Board and the Company Secretary from 1 April 2020, taking into account market positioning and the level of salary increases awarded to UK employees; |
| – | assessed the achievement against the targets for the 2019 STI award and set the STI targets for 2020; |
| – | reviewed updates on achievement against the performance measures, including for the six months ended 30 June 2020 for the STI 2020 and for outstanding LTIP awards; |
| – | assessed the achievement against the performance conditions for the vesting of the LTIP 2017 award, determined the contingent level of LTIP awards for March 2020 and reviewed the associated performance conditions; |
| – | reviewed the STI performance measures and targets for 2021; |
| – | assessed the achievement against the targets for the 2019 Share Reward Scheme and set the targets for the 2020 award; |
| – | reviewed the Annual Statement and the Annual Report on Remuneration for the year ended 31 December 2019 prior to its approval by the Board and subsequent proposal to shareholders at the Company’s AGM on 30 April 2020; |
| – | analysed the 2020 AGM voting results relating to remuneration resolutions and reviewed market trends in the context of that annual general meeting season and corporate governance developments in the UK and the US; |
| – | monitored the continued application of the Company’s shareholding guidelines for the Executive Directors and members of the Management Board; and |
| – | reviewed the Remuneration Committee’s effectiveness following the Board and Committee evaluation process, discussed further on page 104. |
|
Strategic Report |
Governance Report | Financial Statements | Other Information | BAT Annual Report and Form 20-F 2020 | 139 | |||||
|
|
Other activities in 2020
The Remuneration Committee:
| – | approved the remuneration package in respect of the appointment of Luc Jobin as Chairman Designate from 1 March 2021 and then as Chairman from the conclusion of the Company’s 2021 AGM, with specific consideration of market positioning; |
| – | reviewed the terms of appointment and associated remuneration, and terms of termination of employment, in connection with Management Board changes during the year; |
| – | completed a detailed review of the Group’s legacy defined pension arrangements in the UK. Consultation with impacted employees in respect of proposals to close UK defined benefit arrangements to future accrual concluded in March 2020 and the Group’s legacy defined pension arrangements in the UK were closed to future accrual with effect from 30 June 2020; |
| – | reviewed elements of the Group’s workforce remuneration strategy and their alignment with Executive Directors’ remuneration and, more broadly, their alignment with the Group’s culture, with specific focus on pay comparator groups for Executive Directors, the Management Board and management grade employees across the Group; |
| – | approved changes to the methodology for calculating the share of market read for the STI volume share metrics in a limited number of markets, based on market changes and reporting capabilities; and |
| – | reviewed the UK gender pay report for 2019 for applicable UK Group companies prior to publication in March 2020. |
Voting on Remuneration and Engagement With Shareholders
At the AGM on 30 April 2020, shareholders considered and voted on the 2019 Directors’ Remuneration Report as set out on the table below. No other resolutions in respect of Directors’ remuneration or incentives were considered at the 2020 AGM. Further information regarding shareholder engagement in relation to remuneration matters is set out in the Annual Statement on Remuneration on page 118 and in the discussion of Board engagement with shareholders on page 97.
Approval of Directors’ Remuneration Report¹
| 2020 AGM | ||||
|
Percentage for
|
|
61.94
|
| |
|
Votes for (including discretionary)
|
|
1,081,334,586
|
| |
|
Percentage against
|
|
38.06
|
| |
|
Votes against
|
|
664,416,231
|
| |
|
Total votes cast excluding votes withheld
|
|
1,745,750,817
|
| |
|
Votes withheld³
|
|
3,859,408
|
| |
|
Total votes cast including votes withheld
|
|
1,749,610,225
|
| |
The Directors’ Remuneration Policy was approved by shareholders at the 2019 AGM. A summary of this Policy is on pages 120 to 123 of this Remuneration Report 2020.
Approval of Directors’ Remuneration Policy²
| 2019 AGM | ||||
|
Percentage for
|
|
92.63
|
| |
|
Votes for (including discretionary)
|
|
1,641,331,721
|
| |
|
Percentage against
|
|
7.37
|
| |
|
Votes against
|
|
130,661,885
|
| |
|
Total votes cast excluding votes withheld
|
|
1,771,993,606
|
| |
|
Votes withheld³
|
|
1,820,757
|
| |
|
Total votes cast including votes withheld
|
|
1,773,814,363
|
| |
Notes:
| 1. | Directors’ Remuneration Report: does not include the part of the Remuneration Report containing the Remuneration Policy (see note 2 below). |
| 2. | Directors’ Remuneration Policy: was approved by shareholders at the 2019 AGM held on 25 April 2019 and is set out in full in the 2018 Annual Report on Remuneration. |
| 3. | Votes withheld: these are not included in the final proxy figures as they are not recognised as a vote in law. |
The Directors’ Remuneration Report has been approved by the Board on 16 February 2021 and signed on its behalf by:
Dimitri Panayotopoulos
Chairman, Remuneration Committee
16 February 2021
|
Strategic Report |
Governance Report | Financial Statements | Other Information | BAT Annual Report and Form 20-F 2020 | 141 | |||||
|
|
This page is intentionally left blank
| 142 | BAT Annual Report and Form 20-F 2020 |
This page is intentionally left blank
|
Strategic Report |
Governance Report | Financial Statements | Other Information | BAT Annual Report and Form 20-F 2020 | 143 | |||||
|
|
This page is intentionally left blank
| 144 | BAT Annual Report and Form 20-F 2020 |
This page is intentionally left blank
|
Strategic Report |
Governance Report | Financial Statements | Other Information | BAT Annual Report and Form 20-F 2020 | 145 | |||||
|
|
This page is intentionally left blank
| 146 | BAT Annual Report and Form 20-F 2020 |
This page is intentionally left blank
|
Strategic Report |
Governance Report | Financial Statements | Other Information | BAT Annual Report and Form 20-F 2020 | 147 | |||||
|
|
This page is intentionally left blank
| 148 | BAT Annual Report and Form 20-F 2020 |
Report of Independent Registered
Public Accounting Firm
To the Shareholders and Board of Directors
British American Tobacco p.l.c.
Opinions on the Consolidated Financial Statements and Internal Control Over Financial Reporting
We have audited the accompanying Group Balance Sheet of British American Tobacco p.l.c. and subsidiaries (the ”Group”) as of December 31, 2020 and 2019, the related Group Income Statement, Group Statement of Comprehensive Income, Group Statement of Changes in Equity, and Group Cash Flow Statement for each of the years in the three-year period ended December 31, 2020, and the related notes (collectively, the consolidated financial statements). We also have audited the Group’s internal control over financial reporting as of December 31, 2020, based on criteria established in Internal Control – Integrated Framework (2013) issued by the Committee of Sponsoring Organizations of the Treadway Commission.
In our opinion, the consolidated financial statements referred to above present fairly, in all material respects, the financial position of the Group as of December 31, 2020 and 2019, and the results of its operations and its cash flows for each of the years in the three-year period ended December 31, 2020, in conformity with International Financial Reporting Standards (IFRS) as issued by International Accounting Standards Board. Also in our opinion, the Group maintained, in all material respects, effective internal control over financial reporting as of December 31, 2020 based on criteria established in Internal Control – Integrated Framework (2013) issued by the Committee of Sponsoring Organizations of the Treadway Commission.
Basis for Opinions
The Group’s management is responsible for these consolidated financial statements, for maintaining effective internal control over financial reporting, and for its assessment of the effectiveness of internal control over financial reporting, included in the accompanying Management’s report on internal control over financial reporting. Our responsibility is to express an opinion on the Group’s consolidated financial statements and an opinion on the Group’s internal control over financial reporting based on our audits. We are a public accounting firm registered with the Public Company Accounting Oversight Board (United States) (PCAOB) and are required to be independent with respect to the Group in accordance with the U.S. federal securities laws and the applicable rules and regulations of the Securities and Exchange Commission and the PCAOB.
We conducted our audits in accordance with the standards of the PCAOB. Those standards require that we plan and perform the audits to obtain reasonable assurance about whether the consolidated financial statements are free of material misstatement, whether due to error or fraud, and whether effective internal control over financial reporting was maintained in all material respects.
Our audits of the consolidated financial statements included performing procedures to assess the risks of material misstatement of the consolidated financial statements, whether due to error or fraud, and performing procedures that respond to those risks. Such procedures included examining, on a test basis, evidence regarding the amounts and disclosures in the consolidated financial statements. Our audits also included evaluating the accounting principles used and significant estimates made by management, as well as evaluating the overall presentation of the consolidated financial statements. Our audit of internal control over financial reporting included obtaining an understanding of internal control over financial reporting, assessing the risk that a material weakness exists, and testing and evaluating the design and operating effectiveness of internal control based on the assessed risk. Our audits also included performing such other procedures as we considered necessary in the circumstances. We believe that our audits provide a reasonable basis for our opinions.
Definition and Limitations of Internal Control Over Financial Reporting
A company’s internal control over financial reporting is a process designed to provide reasonable assurance regarding the reliability of financial reporting and the preparation of financial statements for external purposes in accordance with generally accepted accounting principles. A company’s internal control over financial reporting includes those policies and procedures that (1) pertain to the maintenance of records that, in reasonable detail, accurately and fairly reflect the transactions and dispositions of the assets of the company; (2) provide reasonable assurance that transactions are recorded as necessary to permit preparation of financial statements in accordance with generally accepted accounting principles, and that receipts and expenditures of the company are being made only in accordance with authorizations of management and directors of the company; and (3) provide reasonable assurance regarding prevention or timely detection of unauthorized acquisition, use, or disposition of the company’s assets that could have a material effect on the financial statements.
Because of its inherent limitations, internal control over financial reporting may not prevent or detect misstatements. Also, projections of any evaluation of effectiveness to future periods are subject to the risk that controls may become inadequate because of changes in conditions, or that the degree of compliance with the policies or procedures may deteriorate.
Critical Audit Matters
The critical audit matters communicated below are matters arising from the current period audit of the consolidated financial statements that were communicated or required to be communicated to the audit committee and that: (1) relate to accounts or disclosures that are material to the consolidated financial statements and (2) involved our especially challenging, subjective, or complex judgments. The communication of critical audit matters does not alter in any way our opinion on the consolidated financial statements, taken as a whole, and we are not, by communicating the critical audit matters below, providing separate opinions on the critical audit matters or on the accounts or disclosures to which they relate.
|
Strategic Report |
Governance Report | Financial Statements | Other Information | BAT Annual Report and Form 20-F 2020 | 149 | |||||
|
|
Impairment analysis of goodwill and trademarks with indefinite lives arising from the 2017 acquisition of Reynolds American Inc. (Reynolds American)
As discussed in Note 8 to the consolidated financial statements, the Group, as at December 31, 2020, has goodwill and trademarks with indefinite lives of £32,719 million and £68,839 million, respectively, arising from the 2017 acquisition of Reynolds American.
We identified the evaluation of the impairment analysis of goodwill and trademarks with indefinite lives arising from the 2017 acquisition of Reynolds American as a critical audit matter. There is a high degree of auditor judgement involved in evaluating : (i) the budgeted revenue used in the analysis of the recoverability of trademarks with indefinite lives and goodwill; and (ii) any impact of the potential menthol ban on budgeted revenue or the discount rate for the Newport indefinite lived trademark and the goodwill allocated to the Reynolds American cash-generating unit.
The following are the primary procedures we performed to address this critical audit matter. We evaluated the design and tested the operating effectiveness of certain internal controls related to the goodwill and other intangible assets testing process including controls related to the development of the budgeted revenue and assessment of the impact of the potential menthol ban on the assumptions listed above. In addition, we assessed the impairment analysis by:
| – | analyzing Reynolds American’s budgeted revenue by examining externally derived publicly and privately available data, including, broker and analyst reports, industry reports, media reports, macro-economic assumptions, academic and scientific studies, and regulatory changes other than a potential federal menthol ban; |
| – | challenging the budgeted revenue by comparing the historical projections to actual results to assess the Group’s ability to accurately forecast; |
| – | performing sensitivity analysis on the budgeted revenue to assess its impact on the Group’s determination that the fair value of the Reynolds American goodwill and trademarks with indefinite lives exceed their carrying value; and |
| – | specifically for the potential menthol ban, critically assessing the Group’s assertion that this does not significantly impact the related cash flow forecast or the discount rate, by examining broker and analyst reports, industry reports, media reports, academic and scientific studies, and regulatory changes proposed in the U.S. Food and Drug Administration agenda and the U.S. government agendas. |
Canadian legal proceedings
As discussed in Note 27 to the consolidated financial statements, the Group’s operating company in Canada, Imperial Tobacco Canada (“Imperial”), has received an unfavorable judgment on the smoking and health class actions certified by the Quebec Superior Court. As a result of this judgment, Imperial has filed for creditor protection under the Companies’ Creditors Arrangement Act (the “CCAA”) and has asked the Ontario Superior Court to stay all pending or contemplated litigation against Imperial in order to resolve all of the outstanding litigation across the country.
We identified the evaluation of the Canadian legal proceedings as a critical audit matter because complex and subjective auditor judgment was required in evaluating the Group’s assessment of the relevant law, historical and pending court rulings, and the Group’s ability to estimate the likelihood and extent of any future economic outflow arising from the ultimate resolution of the Canadian litigation.
The following are the primary procedures we performed to address this critical audit matter. We evaluated the design and tested the operating effectiveness of certain internal controls related to the legal exposure process including controls related to the interpretation of relevant law and related court rulings and estimation of the likelihood and extent of any future economic outflow arising from the ultimate resolution of the Canadian litigation. In addition, we assessed the Canadian legal proceedings by:
| – | reading letters received directly from the Group’s external and internal legal counsel that evaluated the current status of the Canadian legal proceedings. We further inquired of internal legal counsel to evaluate their basis for conclusions in their letter; and |
| – | assessing relevant historical and recent judgments passed by the judicial court authorities in relation to the Canadian litigation and read the related Canadian court rulings in order to challenge Imperial’s interpretation of the Canadian legal proceedings. |
We have served as the Group’s auditor since 2015.
/s/ KPMG LLP
London, United Kingdom
February 16, 2021
| 150 | BAT Annual Report and Form 20-F 2020 |
Financial Statements
Group Income Statement
| For the years ended 31 December | ||||||||||||||
| Notes |
2020 £m |
2019 £m |
2018 £m |
|||||||||||
|
Revenue1 |
2 | 25,776 | 25,877 | 24,492 | ||||||||||
| Raw materials and consumables used |
(4,583 | ) | (4,599 | ) | (4,664 | ) | ||||||||
| Changes in inventories of finished goods and work in progress |
445 | 162 | 114 | |||||||||||
| Employee benefit costs |
3(a),(e) | (2,744 | ) | (3,221 | ) | (3,005 | ) | |||||||
| Depreciation, amortisation and impairment costs |
3(b),(e),(f),(h) | (1,450 | ) | (1,512 | ) | (1,038 | ) | |||||||
| Other operating income |
3(e),(i) | 188 | 163 | 85 | ||||||||||
| Loss on reclassification from amortised cost to fair value |
(3 | ) | (3 | ) | (3 | ) | ||||||||
| Other operating expenses |
3(c),(d),(e),(g),(h) | (7,667 | ) | (7,851 | ) | (6,668 | ) | |||||||
| Profit from operations |
2 | 9,962 | 9,016 | 9,313 | ||||||||||
| Net finance costs |
4 | (1,745 | ) | (1,602 | ) | (1,381 | ) | |||||||
| Share of post-tax results of associates and joint ventures |
2, 5 | 455 | 498 | 419 | ||||||||||
| Profit before taxation |
8,672 | 7,912 | 8,351 | |||||||||||
| Taxation on ordinary activities |
6 | (2,108 | ) | (2,063 | ) | (2,141 | ) | |||||||
| Profit for the year |
6,564 | 5,849 | 6,210 | |||||||||||
| Attributable to: |
||||||||||||||
| Owners of the parent |
6,400 | 5,704 | 6,032 | |||||||||||
| Non-controlling interests |
164 | 145 | 178 | |||||||||||
| 6,564 | 5,849 | 6,210 | ||||||||||||
| Earnings per share |
||||||||||||||
| Basic |
7 | 280.0p | 249.7p | 264.0p | ||||||||||
|
Diluted |
7 | 278.9p | 249.0p | 263.2p | ||||||||||
Note:
| 1. | Revenue is net of duty, excise and other taxes of £39,172 million, £39,826 million and £38,553 million for the years ended 31 December 2020, 2019 and 2018, respectively. |
The accompanying notes are an integral part of these consolidated financial statements.
|
Strategic Report |
Governance Report | Financial Statements | Other Information | BAT Annual Report and Form 20-F 2020 | 151 | |||||
|
|
Group Statement of
Comprehensive Income
| For the years ended 31 December | ||||||||||||||
| Notes |
2020 £m |
2019 £m |
2018 £m |
|||||||||||
| Profit for the year |
6,564 | 5,849 | 6,210 | |||||||||||
| Other comprehensive (expense)/income |
||||||||||||||
| Items that may be reclassified subsequently to profit or loss: |
(2,997 | ) | (3,216 | ) | 3,099 | |||||||||
|
Differences on exchange |
(2,597 | ) | (2,967 | ) | 3,868 | |||||||||
| Cash flow hedges |
||||||||||||||
| – net fair value losses |
(257 | ) | (246 | ) | (58 | ) | ||||||||
| – reclassified and reported in profit for the year |
90 | 53 | 17 | |||||||||||
| Net investment hedges |
||||||||||||||
| – net fair value (losses)/gains |
(16 | ) | 21 | (472 | ) | |||||||||
| – differences on exchange on borrowings |
(163 | ) | (18 | ) | (236 | ) | ||||||||
|
Associates – share of OCI, net of tax |
5 | (98 | ) | (115 | ) | (38 | ) | |||||||
|
Tax on items that may be reclassified |
6(f) | 44 | 56 | 18 | ||||||||||
| Items that will not be reclassified subsequently to profit or loss: |
55 | (507 | ) | 115 | ||||||||||
|
Retirement benefit schemes |
||||||||||||||
| – net actuarial gains/(losses) |
11 | 105 | (582 | ) | 138 | |||||||||
| – surplus recognition |
11 | 10 | (7 | ) | 4 | |||||||||
|
Associates – share of OCI, net of tax |
5 | (34 | ) | 7 | 6 | |||||||||
|
Tax on items that will not be reclassified |
6(f) | (26 | ) | 75 | (33 | ) | ||||||||
| Total other comprehensive (expense)/income for the year, net of tax |
(2,942 | ) | (3,723 | ) | 3,214 | |||||||||
| Total comprehensive income for the year, net of tax |
3,622 | 2,126 | 9,424 | |||||||||||
| Attributable to: |
||||||||||||||
| Owners of the parent |
3,474 | 2,000 | 9,239 | |||||||||||
| Non-controlling interests |
148 | 126 | 185 | |||||||||||
| 3,622 | 2,126 | 9,424 | ||||||||||||
The accompanying notes are an integral part of these consolidated financial statements.
| 152 | BAT Annual Report and Form 20-F 2020 |
Financial Statements
Group Statement
of Changes in Equity
| Attributable to owners of the parent | ||||||||||||||||||||||||||||||
| Notes | Share capital £m |
Share premium, capital redemption and merger reserves £m |
Other reserves £m |
Retained earnings £m |
Total attributable to owners of parent £m |
Non- controlling interests £m |
Total equity £m |
|||||||||||||||||||||||
| Balance at 1 January 2020 |
614 | 26,609 | (3,555 | ) | 40,234 | 63,902 | 258 | 64,160 | ||||||||||||||||||||||
| Total comprehensive (expense)/income for the year comprising: |
– | – | (3,012 | ) | 6,486 | 3,474 | 148 | 3,622 | ||||||||||||||||||||||
| Profit for the year |
– | – | – | 6,400 | 6,400 | 164 | 6,564 | |||||||||||||||||||||||
|
Other comprehensive (expense)/income for the year |
– | – | (3,012 | ) | 86 | (2,926 | ) | (16 | ) | (2,942 | ) | |||||||||||||||||||
| Other changes in equity |
||||||||||||||||||||||||||||||
| Cash flow hedges reclassified and reported in total assets |
– | – | (33 | ) | – | (33 | ) | – | (33 | ) | ||||||||||||||||||||
| Employee share options |
||||||||||||||||||||||||||||||
| – value of employee services |
24 | – | – | – | 88 | 88 | – | 88 | ||||||||||||||||||||||
| – proceeds from new shares issued |
– | 2 | – | – | 2 | – | 2 | |||||||||||||||||||||||
| – treasury shares used for share option schemes |
– | 7 | – | (7 | ) | – | – | – | ||||||||||||||||||||||
| Dividends and other appropriations |
||||||||||||||||||||||||||||||
| – ordinary shares |
18(e) | – | – | – | (4,747 | ) | (4,747 | ) | – | (4,747 | ) | |||||||||||||||||||
| – to non-controlling interests |
– | – | – | – | – | (141 | ) | (141 | ) | |||||||||||||||||||||
| Purchase of own shares |
||||||||||||||||||||||||||||||
| – held in employee share ownership trusts |
– | – | – | (17 | ) | (17 | ) | – | (17 | ) | ||||||||||||||||||||
| Other movements non-controlling interests |
23 | – | – | – | – | – | 17 | 17 | ||||||||||||||||||||||
| Other movements |
– | – | – | 4 | 4 | – | 4 | |||||||||||||||||||||||
| Balance at 31 December 2020 |
614 | 26,618 | (6,600 | ) | 42,041 | 62,673 | 282 | 62,955 | ||||||||||||||||||||||
| The accompanying notes are an integral part of these consolidated financial statements. |
| |||||||||||||||||||||||||||||
| Attributable to owners of the parent | ||||||||||||||||||||||||||||||
| Notes | Share capital £m |
Share premium, capital redemption and merger reserves £m |
Other reserves £m |
Retained earnings £m |
Total attributable to owners of parent £m |
Non- controlling interests £m |
Total equity £m |
|||||||||||||||||||||||
| Balance at 1 January 2019 |
614 | 26,606 | (333 | ) | 38,557 | 65,444 | 244 | 65,688 | ||||||||||||||||||||||
| Total comprehensive (expense)/income for the year comprising: |
– | – | (3,190 | ) | 5,190 | 2,000 | 126 | 2,126 | ||||||||||||||||||||||
| Profit for the year |
– | – | – | 5,704 | 5,704 | 145 | 5,849 | |||||||||||||||||||||||
| Other comprehensive expense for the year |
– | – | (3,190 | ) | (514 | ) | (3,704 | ) | (19 | ) | (3,723 | ) | ||||||||||||||||||
| Other changes in equity |
||||||||||||||||||||||||||||||
| Cash flow hedges reclassified and reported in total assets |
– | – | (32 | ) | – | (32 | ) | – | (32 | ) | ||||||||||||||||||||
| Employee share options |
||||||||||||||||||||||||||||||
| – value of employee services |
24 | – | – | – | 115 | 115 | – | 115 | ||||||||||||||||||||||
| – proceeds from shares issued |
– | 3 | – | – | 3 | – | 3 | |||||||||||||||||||||||
| Dividends and other appropriations |
||||||||||||||||||||||||||||||
| – ordinary shares |
18(e) | – | – | – | (3,476 | ) | (3,476 | ) | – | (3,476 | ) | |||||||||||||||||||
| – to non-controlling interests |
– | – | – | – | – | (148 | ) | (148 | ) | |||||||||||||||||||||
| Purchase of own shares |
||||||||||||||||||||||||||||||
| – held in employee share ownership trusts |
– | – | – | (117 | ) | (117 | ) | – | (117 | ) | ||||||||||||||||||||
| Other movements non-controlling interests |
23 | – | – | – | – | – | 36 | 36 | ||||||||||||||||||||||
| Other movements |
– | – | – | (35 | ) | (35 | ) | – | (35 | ) | ||||||||||||||||||||
| Balance at 31 December 2019 |
614 | 26,609 | (3,555 | ) | 40,234 | 63,902 | 258 | 64,160 | ||||||||||||||||||||||
The accompanying notes are an integral part of these consolidated financial statements.
|
Strategic Report |
Governance Report | Financial Statements | Other Information | BAT Annual Report and Form 20-F 2020 | 153 | |||||
|
|
| Attributable to owners of the parent | ||||||||||||||||||||||||||||||
| Notes | Share capital £m |
Share premium, capital redemption and merger reserves £m |
Other reserves £m |
Retained earnings £m |
Total attributable to owners of parent £m |
Non- controlling interests £m |
Total £m |
|||||||||||||||||||||||
| Balance at 31 December 2017 |
614 | 26,602 | (3,392 | ) | 36,935 | 60,759 | 222 | 60,981 | ||||||||||||||||||||||
| Accounting policy change (IFRS 9) (note 30) | – | – | (9 | ) | (29 | ) | (38 | ) | – | (38 | ) | |||||||||||||||||||
| Revised balance at 1 January 2018 |
614 | 26,602 | (3,401 | ) | 36,906 | 60,721 | 222 | 60,943 | ||||||||||||||||||||||
| Total comprehensive income for the year comprising: |
– | – | 3,090 | 6,149 | 9,239 | 185 | 9,424 | |||||||||||||||||||||||
| Profit for the year |
– | – | – | 6,032 | 6,032 | 178 | 6,210 | |||||||||||||||||||||||
|
Other comprehensive income for the year |
– | – | 3,090 | 117 | 3,207 | 7 | 3,214 | |||||||||||||||||||||||
| Other changes in equity |
||||||||||||||||||||||||||||||
| Cash flow hedges reclassified and reported in total assets |
– | – | (22 | ) | – | (22 | ) | – | (22 | ) | ||||||||||||||||||||
| Employee share options |
||||||||||||||||||||||||||||||
| – value of employee services |
24 | – | – | – | 121 | 121 | – | 121 | ||||||||||||||||||||||
| – proceeds from shares issued |
– | 4 | – | – | 4 | – | 4 | |||||||||||||||||||||||
| Dividends and other appropriations |
||||||||||||||||||||||||||||||
| – ordinary shares |
– | – | – | (4,463 | ) | (4,463 | ) | – | (4,463 | ) | ||||||||||||||||||||
| – to non-controlling interests |
– | – | – | – | – | (163 | ) | (163 | ) | |||||||||||||||||||||
| Purchase of own shares |
||||||||||||||||||||||||||||||
| – held in employee share ownership trusts |
– | – | – | (139 | ) | (139 | ) | – | (139 | ) | ||||||||||||||||||||
| Non-controlling interests – acquisitions |
– | – | – | (11 | ) | (11 | ) | – | (11 | ) | ||||||||||||||||||||
| Other movements |
– | – | – | (6 | ) | (6 | ) | – | (6 | ) | ||||||||||||||||||||
| Balance at 31 December 2018 |
614 | 26,606 | (333 | ) | 38,557 | 65,444 | 244 | 65,688 | ||||||||||||||||||||||
The accompanying notes are an integral part of these consolidated financial statements.
| 154 | BAT Annual Report and Form 20-F 2020 |
Financial Statements
Group Balance Sheet
| 31 December | ||||||||||
| Notes | 2020 £m |
2019 £m |
||||||||
| Assets |
||||||||||
| Intangible assets |
8 | 115,343 | 118,787 | |||||||
| Property, plant and equipment |
9 | 5,060 | 5,518 | |||||||
| Investments in associates and joint ventures |
10 | 1,796 | 1,860 | |||||||
| Retirement benefit assets |
11 | 714 | 430 | |||||||
| Deferred tax assets |
12 | 534 | 424 | |||||||
| Trade and other receivables |
13 | 242 | 248 | |||||||
| Investments held at fair value |
14 | 22 | 12 | |||||||
| Derivative financial instruments |
15 | 367 | 452 | |||||||
| Total non-current assets |
124,078 | 127,731 | ||||||||
| Inventories |
16 | 5,998 | 6,094 | |||||||
| Income tax receivable |
79 | 122 | ||||||||
| Trade and other receivables |
13 | 3,721 | 4,093 | |||||||
| Investments held at fair value |
14 | 242 | 123 | |||||||
| Derivative financial instruments |
15 | 430 | 313 | |||||||
| Cash and cash equivalents |
17 | 3,139 | 2,526 | |||||||
| 13,609 | 13,271 | |||||||||
| Assets classified as held-for-sale |
3 | 3 | ||||||||
| Total current assets |
13,612 | 13,274 | ||||||||
| Total assets |
137,690 | 141,005 | ||||||||
| Equity – capital and reserves |
||||||||||
| Share capital |
18(a) | 614 | 614 | |||||||
| Share premium, capital redemption and merger reserves |
18(b) | 26,618 | 26,609 | |||||||
| Other reserves |
18(c) | (6,600 | ) | (3,555 | ) | |||||
| Retained earnings |
18(c) | 42,041 | 40,234 | |||||||
| Owners of the parent |
62,673 | 63,902 | ||||||||
| Non-controlling interests |
18(d) | 282 | 258 | |||||||
| Total equity |
62,955 | 64,160 | ||||||||
| Liabilities |
||||||||||
| Borrowings |
19 | 39,927 | 37,804 | |||||||
| Retirement benefit liabilities |
11 | 1,524 | 1,459 | |||||||
| Deferred tax liabilities |
12 | 16,314 | 17,050 | |||||||
| Other provisions for liabilities |
20 | 387 | 388 | |||||||
| Trade and other payables |
21 | 1,064 | 1,034 | |||||||
| Derivative financial instruments |
15 | 41 | 287 | |||||||
| Total non-current liabilities |
59,257 | 58,022 | ||||||||
| Borrowings |
19 | 4,041 | 7,562 | |||||||
| Income tax payable |
868 | 683 | ||||||||
| Other provisions for liabilities |
20 | 598 | 670 | |||||||
| Trade and other payables |
21 | 9,693 | 9,727 | |||||||
| Derivative financial instruments |
15 | 278 | 181 | |||||||
| Total current liabilities |
15,478 | 18,823 | ||||||||
| Total equity and liabilities |
137,690 | 141,005 | ||||||||
The accompanying notes are an integral part of these consolidated financial statements.
On behalf of the Board
Richard Burrows
Chairman
16 February 2021
|
Strategic Report |
Governance Report | Financial Statements | Other Information | BAT Annual Report and Form 20-F 2020 | 155 | |||||
|
|
Group Cash Flow Statement
| For the years ended 31 December | ||||||||||||||
| Notes | 2020 £m |
2019 £m |
2018 £m |
|||||||||||
| Profit from operations |
9,962 | 9,016 | 9,313 | |||||||||||
|
Adjustments for |
||||||||||||||
| – depreciation, amortisation and impairment costs |
3(b) | 1,450 | 1,512 | 1,038 | ||||||||||
| – increase in inventories |
(144 | ) | (371 | ) | (192 | ) | ||||||||
| – decrease/(increase) in trade and other receivables |
300 | (699 | ) | 502 | ||||||||||
| – decrease in receivables related to the charge in respect of the Quebec Class Actions |
13 | – | 436 | – | ||||||||||
| – increase/(decrease) in Master Settlement Agreement payable |
3(d) | 369 | (124 | ) | 1,364 | |||||||||
| – (decrease)/increase in trade and other payables |
(320 | ) | 730 | 123 | ||||||||||
| – decrease in net retirement benefit liabilities |
(96 | ) | (40 | ) | (100 | ) | ||||||||
| – increase/(decrease) in other provisions for liabilities |
– | 382 | (107 | ) | ||||||||||
|
– other non-cash items |
46 | 106 | 31 | |||||||||||
| Cash generated from operating activities |
11,567 | 10,948 | 11,972 | |||||||||||
| Dividends received from associates |
351 | 252 | 214 | |||||||||||
| Tax paid |
(2,132 | ) | (2,204 | ) | (1,891 | ) | ||||||||
| Net cash generated from operating activities |
9,786 | 8,996 | 10,295 | |||||||||||
| Cash flows from investing activities |
||||||||||||||
| Interest received |
48 | 80 | 52 | |||||||||||
| Purchases of property, plant and equipment |
(511 | ) | (664 | ) | (758 | ) | ||||||||
| Proceeds on disposal of property, plant and equipment |
44 | 34 | 38 | |||||||||||
| Purchases of intangibles |
(244 | ) | (151 | ) | (185 | ) | ||||||||
| Purchases of investments |
(343 | ) | (191 | ) | (320 | ) | ||||||||
| Proceeds on disposals of investments |
184 | 339 | 167 | |||||||||||
| Investment in associates and acquisitions of other subsidiaries net of cash acquired |
39 | (86 | ) | (32 | ) | |||||||||
| Proceeds on disposal of non-core business net of cash disposed |
– | – | 17 | |||||||||||
| Net cash used in investing activities |
(783 | ) | (639 | ) | (1,021 | ) | ||||||||
| Cash flows from financing activities |
||||||||||||||
| Interest paid |
(1,737 | ) | (1,601 | ) | (1,557 | ) | ||||||||
| Interest element of lease liabilities |
(26 | ) | (32 | ) | (2 | ) | ||||||||
| Capital element of lease liabilities |
(164 | ) | (154 | ) | (10 | ) | ||||||||
| Proceeds from increases in and new borrowings |
9,826 | 4,247 | 2,111 | |||||||||||
| (Outflows)/inflows relating to derivative financial instruments |
(283 | ) | (564 | ) | 49 | |||||||||
| Purchases of own shares held in employee share ownership trusts |
(18 | ) | (117 | ) | (139 | ) | ||||||||
| Reductions in and repayments of borrowings |
(10,633 | ) | (5,640 | ) | (5,586 | ) | ||||||||
| Dividends paid to owners of the parent |
(4,745 | ) | (4,598 | ) | (4,347 | ) | ||||||||
| Capital injection from/(purchases of) non-controlling interests |
17 | 20 | (11 | ) | ||||||||||
| Dividends paid to non-controlling interests |
(136 | ) | (157 | ) | (142 | ) | ||||||||
| Other |
2 | 3 | 4 | |||||||||||
| Net cash used in financing activities |
(7,897 | ) | (8,593 | ) | (9,630 | ) | ||||||||
| Net cash flows generated from/(used in) operating, investing and financing activities |
1,106 | (236 | ) | (356 | ) | |||||||||
| Differences on exchange |
(253 | ) | (57 | ) | (138 | ) | ||||||||
| Increase/(decrease) in net cash and cash equivalents in the year |
853 | (293 | ) | (494 | ) | |||||||||
| Net cash and cash equivalents at 1 January |
2,035 | 2,328 | 2,822 | |||||||||||
| Net cash and cash equivalents at 31 December |
17 | 2,888 | 2,035 | 2,328 | ||||||||||
The accompanying notes are an integral part of these consolidated financial statements.
| 156 | BAT Annual Report and Form 20-F 2020 |
Financial Statements
Notes on Accounts
1 Accounting Policies
|
Strategic Report |
Governance Report | Financial Statements | Other Information | BAT Annual Report and Form 20-F 2020 | 157 | |||||
|
|
1 Accounting Policies Continued
| 158 | BAT Annual Report and Form 20-F 2020 |
Financial Statements
Notes on Accounts
Continued
1 Accounting Policies Continued
|
Strategic Report |
Governance Report | Financial Statements | Other Information | BAT Annual Report and Form 20-F 2020 | 159 | |||||
|
|
1 Accounting Policies Continued
| 160 | BAT Annual Report and Form 20-F 2020 |
Financial Statements
Notes on Accounts
Continued
1 Accounting Policies Continued
|
Strategic Report |
Governance Report | Financial Statements | Other Information | BAT Annual Report and Form 20-F 2020 | 161 | |||||
|
|
1 Accounting Policies Continued
| 162 | BAT Annual Report and Form 20-F 2020 |
Financial Statements
Notes on Accounts
Continued
2 Segmental Analyses
The chief operating decision maker, the Management Board, reviews adjusted profit from operations at constant currencies to evaluate segment performance and allocate resources to the overall business. The Management Board also reviews at constant currencies external adjusted revenues, which are included within adjusted profit from operations. The results of New Categories (comprising Tobacco Heating Products, Vapour products and Modern Oral products) are reported to the Management Board as part of the results of each geographic region. However, additional information has been provided based on product category. Interest income, interest expense and taxation are centrally managed and accordingly such items are not presented by segment as they are excluded from the measure of segment profitability.
The four geographic regions are the reportable segments for the Group as they form the focus of the Group’s internal reporting systems and are the basis used by the Management Board for assessing performance and allocating resources. Transactions between Group subsidiaries are conducted on arm’s length terms in accordance with appropriate transfer pricing rules and Organisation for Economic Cooperation & Development (OECD) principles. The Management Board reviews current and prior year adjusted segmental revenue, adjusted profit from operations of subsidiaries and joint operations, and adjusted post-tax results of associates and joint ventures at constant rates of exchange. The constant rate comparison provided for reporting segment information is based on a retranslation, at prior year exchange rates, of the current year results of the Group, including intercompany royalties payable in foreign currency to UK entities. However, the Group does not adjust for the normal transactional gains and losses in operations which are generated by movements in exchange rates.
In respect of the United States region, all financial statements and financial information provided by or with respect to the US business or RAI (and/or RAI and its subsidiaries (collectively, the ‘Reynolds Group’)) are prepared on the basis of US GAAP and constitute the primary financial statements or financial information of the US business or RAI (and/or the Reynolds Group). Solely for the purpose of consolidation within the results of BAT p.l.c. and the BAT Group, this financial information is then converted to IFRS. To the extent any such financial information provided in these financial statements relates to the US business or RAI (and/or the Reynolds Group), it is provided as an explanation of the US business’s or RAI’s (and/or the Reynolds Group’s) primary US GAAP based financial statements and information.
The following table shows 2020 revenue and adjusted revenue at current rates, and 2020 revenue translated using 2019 rates of exchange. The 2019 figures are stated at the 2019 rates of exchange.
| 2020 | 2019 | |||||||||||||||||||||||||||||||
|
Adjusted £m |
Translation exchange £m |
Adjusted £m |
Adjusting £m |
Revenue £m |
Adjusted Revenue £m |
Adjusting £m |
Revenue £m |
|||||||||||||||||||||||||
| United States |
11,536 | (63 | ) | 11,473 | – | 11,473 | 10,373 | – | 10,373 | |||||||||||||||||||||||
| APME |
4,644 | (107 | ) | 4,537 | – | 4,537 | 5,153 | – | 5,153 | |||||||||||||||||||||||
| AMSSA |
4,321 | (549 | ) | 3,772 | – | 3,772 | 4,261 | – | 4,261 | |||||||||||||||||||||||
| ENA |
6,169 | (175 | ) | 5,994 | – | 5,994 | 6,040 | 50 | 6,090 | |||||||||||||||||||||||
|
Revenue |
26,670 | (894 | ) | 25,776 | – | 25,776 | 25,827 | 50 | 25,877 | |||||||||||||||||||||||
Note: adjusting items in revenue are in respect of excise included in goods acquired from a third party under short-term arrangements and then passed on to customers. This is deemed as adjusting due to the distorting nature to revenue and operating margin. From 2020 onwards, such arrangements have been discontinued or are immaterial such that no adjustments have been made in 2020.
In 2020, the translation exchange in AMSSA was driven by the depreciation of key currencies against the pound sterling including the
Brazilian real.
|
Strategic Report |
Governance Report | Financial Statements | Other Information | BAT Annual Report and Form 20-F 2020 | 163 | |||||
|
|
2 Segmental Analyses Continued
The following table shows 2019 revenue and adjusted revenue at current rates, and 2019 adjusted revenue translated using 2018 rates of exchange. The 2018 figures are stated at the 2018 rates of exchange.
| 2019 | 2018 | |||||||||||||||||||||||||||||||
|
Adjusted Revenue rates £m |
Translation £m |
Adjusted Revenue £m |
Adjusting £m |
Revenue £m |
Adjusted £m |
Adjusting £m |
Revenue £m |
|||||||||||||||||||||||||
| United States |
9,917 | 456 | 10,373 | – | 10,373 | 9,495 | – | 9,495 | ||||||||||||||||||||||||
| APME |
5,157 | (4 | ) | 5,153 | – | 5,153 | 4,882 | – | 4,882 | |||||||||||||||||||||||
| AMSSA |
4,491 | (230 | ) | 4,261 | – | 4,261 | 4,111 | – | 4,111 | |||||||||||||||||||||||
| ENA |
6,118 | (78 | ) | 6,040 | 50 | 6,090 | 5,824 | 180 | 6,004 | |||||||||||||||||||||||
|
Revenue |
25,683 | 144 | 25,827 | 50 | 25,877 | 24,312 | 180 | 24,492 | ||||||||||||||||||||||||
|
Note: adjusting items in revenue are in respect of excise included in goods acquired from a third party under short-term arrangements and then passed on to customers. This is deemed as adjusting due to the distorting nature to revenue and operating margin.
The following table shows 2020 profit from operations and adjusted profit from operations at current rates, and 2020 adjusted profit from operations translated using 2019 rates of exchange. The 2019 figures are stated at the 2019 rates of exchange.
|
| |||||||||||||||||||||||||||||||
| 2020 | 2019 | |||||||||||||||||||||||||||||||
| |
Adjusted segment £m |
*
|
|
Translation exchange £m |
|
|
Adjusted segment £m |
*
|
|
Adjusting items £m |
*
|
|
Segment result Current rates £m |
|
|
Adjusted segment £m |
*
|
|
Adjusting items £m |
*
|
|
Segment result £m |
| |||||||||
| United States |
5,816 | (32 | ) | 5,784 | (809 | ) | 4,975 | 5,036 | (626 | ) | 4,410 | |||||||||||||||||||||
| APME |
1,909 | (56 | ) | 1,853 | (381 | ) | 1,472 | 2,059 | (306 | ) | 1,753 | |||||||||||||||||||||
| AMSSA |
1,796 | (178 | ) | 1,618 | (65 | ) | 1,553 | 1,842 | (638 | ) | 1,204 | |||||||||||||||||||||
| ENA |
2,140 | (30 | ) | 2,110 | (148 | ) | 1,962 | 2,193 | (544 | ) | 1,649 | |||||||||||||||||||||
| Profit from operations |
11,661 | (296 | ) | 11,365 | (1,403 | ) | 9,962 | 11,130 | (2,114 | ) | 9,016 | |||||||||||||||||||||
| Net finance costs |
(1,612 | ) | 20 | (1,592 | ) | (153 | ) | (1,745 | ) | (1,522 | ) | (80 | ) | (1,602 | ) | |||||||||||||||||
| APME |
465 | (26 | ) | 439 | 13 | 452 | 470 | 25 | 495 | |||||||||||||||||||||||
| ENA |
3 | – | 3 | – | 3 | 3 | – | 3 | ||||||||||||||||||||||||
| Share of post-tax results of associates and joint ventures |
468 | (26 | ) | 442 | 13 | 455 | 473 | 25 | 498 | |||||||||||||||||||||||
| Profit/(loss) before taxation |
10,517 | (302 | ) | 10,215 | (1,543 | ) | 8,672 | 10,081 | (2,169 | ) | 7,912 | |||||||||||||||||||||
| Taxation (charge)/credit on ordinary activities |
(2,493 | ) | 63 | (2,430 | ) | 322 | (2,108 | ) | (2,501 | ) | 438 | (2,063 | ) | |||||||||||||||||||
| Profit for the year |
6,564 | 5,849 | ||||||||||||||||||||||||||||||
| * | The adjustments to profit from operations, net finance costs, the Group’s share of the post-tax results of associates and joint ventures and taxation are explained in notes 3(e) to 3(h), note 4(b), note 5(a), and note 6(b), 6(d) and 6(e), respectively. |
| 164 | BAT Annual Report and Form 20-F 2020 |
Financial Statements
Notes on Accounts
Continued
2 Segmental Analyses Continued
The following table shows 2019 profit from operations and adjusted profit from operations at current rates, and 2019 adjusted profit from operations translated using 2018 rates of exchange. The 2018 figures are stated at the 2018 rates of exchange.
| 2019 | 2018 | |||||||||||||||||||||||||||||||
| |
Adjusted segment result Constant rates £m |
*
|
|
Translation exchange £m |
|
|
Adjusted segment result Current rates £m |
*
|
|
Adjusting items £m |
*
|
|
Segment result Current rates £m |
|
|
Adjusted segment result £m |
*
|
|
Adjusting items £m |
*
|
|
Segment result £m |
| |||||||||
| United States |
4,798 | 238 | 5,036 | (626 | ) | 4,410 | 4,511 | (505 | ) | 4,006 | ||||||||||||||||||||||
| APME |
2,102 | (43 | ) | 2,059 | (306 | ) | 1,753 | 1,948 | (90 | ) | 1,858 | |||||||||||||||||||||
| AMSSA |
1,912 | (70 | ) | 1,842 | (638 | ) | 1,204 | 1,738 | (194 | ) | 1,544 | |||||||||||||||||||||
| ENA |
2,220 | (27 | ) | 2,193 | (544 | ) | 1,649 | 2,150 | (245 | ) | 1,905 | |||||||||||||||||||||
| Profit from operations |
11,032 | 98 | 11,130 | (2,114 | ) | 9,016 | 10,347 | (1,034 | ) | 9,313 | ||||||||||||||||||||||
| Net finance costs |
(1,466 | ) | (56 | ) | (1,522 | ) | (80 | ) | (1,602 | ) | (1,385 | ) | 4 | (1,381 | ) | |||||||||||||||||
| APME |
463 | 7 | 470 | 25 | 495 | 384 | 32 | 416 | ||||||||||||||||||||||||
| ENA |
3 | – | 3 | – | 3 | 3 | – | 3 | ||||||||||||||||||||||||
| Share of post-tax results of associates and joint ventures | 466 | 7 | 473 | 25 | 498 | 387 | 32 | 419 | ||||||||||||||||||||||||
| Profit/(loss) before taxation |
10,032 | 49 | 10,081 | (2,169 | ) | 7,912 | 9,349 | (998 | ) | 8,351 | ||||||||||||||||||||||
| Taxation (charge)/credit on ordinary activities |
(2,498 | ) | (3 | ) | (2,501 | ) | 438 | (2,063 | ) | (2,364 | ) | 223 | (2,141 | ) | ||||||||||||||||||
| Profit for the year |
5,849 | 6,210 | ||||||||||||||||||||||||||||||
| * | The adjustments to profit from operations, net finance costs, the Group’s share of the post-tax results of associates and joint ventures and taxation are explained in notes 3(e) to 3(h), note 4(b), note 5(a), and note 6(b), 6(d) and 6(e), respectively. |
Adjusted profit from operations at constant rates of £11,661 million (2019: £11,032 million; 2018: £10,924 million) excludes certain depreciation, amortisation and impairment charges as explained in notes 3(e), 3(f) and 3(h). These are excluded from segmental profit from operations at constant rates as follows:
| 2020 | 2019 | |||||||||||||||||||||||||||||||
|
Adjusted depreciation, amortisation and impairment Constant rates £m |
Translation exchange £m |
Adjusted depreciation, amortisation and impairment Current rates £m |
Adjusting items £m |
Depreciation, amortisation and impairment Current rates £m |
Adjusted depreciation, amortisation and impairment £m |
Adjusting £m |
Depreciation, amortisation and impairment £m |
|||||||||||||||||||||||||
| United States |
205 | (1 | ) | 204 | 272 | 476 | 258 | 391 | 649 | |||||||||||||||||||||||
| APME |
170 | (3 | ) | 167 | 274 | 441 | 163 | 182 | 345 | |||||||||||||||||||||||
| AMSSA |
137 | (16 | ) | 121 | 34 | 155 | 137 | 35 | 172 | |||||||||||||||||||||||
| ENA |
266 | (7 | ) | 259 | 119 | 378 | 216 | 130 | 346 | |||||||||||||||||||||||
| 778 | (27 | ) | 751 | 699 | 1,450 | 774 | 738 | 1,512 | ||||||||||||||||||||||||
| 2019 | 2018 | |||||||||||||||||||||||||||||||
| Adjusted depreciation, amortisation and impairment Constant rates £m |
Translation exchange £m |
Adjusted depreciation, amortisation and impairment Current rates £m |
Adjusting items £m |
Depreciation, amortisation and impairment Current rates impairment £m |
Adjusted depreciation, amortisation and impairment £m |
Adjusting £m |
Depreciation, amortisation and impairment £m |
|||||||||||||||||||||||||
| United States |
249 | 9 | 258 | 391 | 649 | 154 | 289 | 443 | ||||||||||||||||||||||||
| APME |
162 | 1 | 163 | 182 | 345 | 105 | 22 | 127 | ||||||||||||||||||||||||
| AMSSA |
140 | (3 | ) | 137 | 35 | 172 | 101 | 115 | 216 | |||||||||||||||||||||||
| ENA |
218 | (2 | ) | 216 | 130 | 346 | 143 | 109 | 252 | |||||||||||||||||||||||
| 769 | 5 | 774 | 738 | 1,512 | 503 | 535 | 1,038 | |||||||||||||||||||||||||
|
Strategic Report |
Governance Report | Financial Statements | Other Information | BAT Annual Report and Form 20-F 2020 | 165 | |||||
|
|
2 Segmental Analyses Continued
Additional information by product category
Although the Group’s operations are managed on a Regional basis, additional information for revenue is provided based on product category as follows:
| 2020 | 2019 | |||||||||||||||||||||||||||||||
|
Adjusted Revenue Constant rates £m |
Translation exchange £m |
Adjusted Revenue Current rates £m |
Adjusting items Current rates £m |
Revenue Current rates £m |
Adjusted Revenue £m |
Adjusting items £m |
Revenue £m |
|||||||||||||||||||||||||
| Combustibles |
23,594 | (842 | ) | 22,752 | – | 22,752 | 22,951 | 50 | 23,001 | |||||||||||||||||||||||
| New Categories |
1,449 | (6 | ) | 1,443 | – | 1,443 | 1,255 | – | 1,255 | |||||||||||||||||||||||
| Vapour |
615 | (4 | ) | 611 | – | 611 | 401 | – | 401 | |||||||||||||||||||||||
| THP |
636 | (2 | ) | 634 | – | 634 | 728 | – | 728 | |||||||||||||||||||||||
| Modern Oral |
198 | – | 198 | – | 198 | 126 | – | 126 | ||||||||||||||||||||||||
| Traditional Oral |
1,165 | (5 | ) | 1,160 | – | 1,160 | 1,081 | – | 1,081 | |||||||||||||||||||||||
| Other |
462 | (41 | ) | 421 | – | 421 | 540 | – | 540 | |||||||||||||||||||||||
|
Revenue |
26,670 | (894 | ) | 25,776 | – | 25,776 | 25,827 | 50 | 25,877 | |||||||||||||||||||||||
| 2019 | 2018 | |||||||||||||||||||||||||||||||
| Adjusted Revenue Constant rates £m |
Translation exchange £m |
Adjusted Revenue Current rates £m |
Adjusting items Current rates £m |
Revenue Current rates £m |
Adjusted Revenue £m |
Adjusting items £m |
Revenue £m |
|||||||||||||||||||||||||
| Combustibles |
22,892 | 59 | 22,951 | 50 | 23,001 | 21,892 | 180 | 22,072 | ||||||||||||||||||||||||
| New Categories |
1,214 | 41 | 1,255 | – | 1,255 | 917 | – | 917 | ||||||||||||||||||||||||
| Vapour |
392 | 9 | 401 | – | 401 | 318 | – | 318 | ||||||||||||||||||||||||
| THP |
693 | 35 | 728 | – | 728 | 565 | – | 565 | ||||||||||||||||||||||||
| Modern Oral |
129 | (3 | ) | 126 | – | 126 | 34 | – | 34 | |||||||||||||||||||||||
| Traditional Oral |
1,036 | 45 | 1,081 | – | 1,081 | 941 | – | 941 | ||||||||||||||||||||||||
| Other |
541 | (1 | ) | 540 | – | 540 | 562 | – | 562 | |||||||||||||||||||||||
|
Revenue |
25,683 | 144 | 25,827 | 50 | 25,877 | 24,312 | 180 | 24,492 | ||||||||||||||||||||||||
External revenue and non-current assets other than financial instruments, deferred tax assets and retirement benefit assets are analysed between the UK and all foreign countries at current rates of exchange as follows:
| United Kingdom | All foreign countries | Group | ||||||||||||||||||||||||||||||||||
| Revenue is based on location of sale | 2020 £m |
2019 £m |
2018 £m |
2020 £m |
2019 £m |
2018 £m |
2020 £m |
2019 £m |
2018 £m |
|||||||||||||||||||||||||||
| External revenue |
188 | 178 | 184 | 25,588 | 25,699 | 24,308 | 25,776 | 25,877 | 24,492 | |||||||||||||||||||||||||||
| United Kingdom | All foreign countries | Group | ||||||||||||||||||||||
| 2020 £m | 2019 £m | 2020 £m |
2019 £m |
2020 £m |
2019 £m |
|||||||||||||||||||
| Intangible assets |
487 | 492 | 114,856 | 118,295 | 115,343 | 118,787 | ||||||||||||||||||
| Property, plant and equipment |
344 | 333 | 4,716 | 5,185 | 5,060 | 5,518 | ||||||||||||||||||
| Investments in associates and joint ventures |
8 | 8 | 1,788 | 1,852 | 1,796 | 1,860 | ||||||||||||||||||
The consolidated results of the Reynolds Group operating in the United States met the criteria for separate disclosure under the requirements of IFRS 8 Operating Segments. Revenue arising from the operations of the Reynolds Group, inclusive of the sales made to fellow Group companies, in 2020, 2019 and 2018 was £11,481 million, £10,417 million and £9,506 million, respectively. The majority of sales are to customers based in the US. Non-current assets attributable to the operations of the Reynolds Group were £105,549 million (2019: £109,186 million).
The main acquisitions comprising the goodwill balance of £43,319 million (2019: £44,316 million), included in intangible assets, are provided in note 8. Included in investments in associates and joint ventures are amounts of £1,724 million (2019: £1,794 million) attributable to the investment in ITC Ltd. Further information is provided in notes 5 and 10.
| 166 | BAT Annual Report and Form 20-F 2020 |
Financial Statements
Notes on Accounts
Continued
3 Profit From Operations
Enumerated below are movements in costs that have impacted profit from operations in 2020, 2019 and 2018. These include changes in our underlying business performance, as well as the impact of adjusting items, as defined in note 1, in profit from operations (note 3(e) to 3(h)).
(a) Employee benefit costs
| 2020 £m |
2019 £m |
2018 £m |
||||||||||
| Wages and salaries |
2,277 | 2,651 | 2,463 | |||||||||
| Social security costs |
194 | 223 | 207 | |||||||||
| Other pension and retirement benefit costs (note 11) |
182 | 227 | 212 | |||||||||
| Share-based payments – equity and cash-settled (note 24) |
91 | 120 | 123 | |||||||||
| 2,744 | 3,221 | 3,005 | ||||||||||
(b) Depreciation, amortisation and impairment costs
| 2020 £m |
2019 £m |
2018 £m |
||||||||||||
| Intangibles |
– amortisation and impairment of trademarks and similar intangibles |
360 | 508 | 377 | ||||||||||
| – amortisation and impairment of computer software |
129 | 108 | 111 | |||||||||||
| – impairment of goodwill (note 3(h)) |
209 | 194 | – | |||||||||||
|
Property, plant and equipment – depreciation and impairment |
752 | 702 | 550 | |||||||||||
| 1,450 | 1,512 | 1,038 | ||||||||||||
Intangibles – amortisation and impairment
The acquisition of businesses has resulted in the capitalisation of certain trademarks and similar intangibles. The amortisation and impairment of these acquired trademarks and similar intangibles are charged to the income statement as adjusting, as explained in note 3(f).
Property, plant and equipment – depreciation and impairment
Gains and losses recognised on disposal of property, plant and equipment are included within depreciation and impairment of property, plant and equipment.
Additionally, impairment costs resulting from obsolete machines in relation to downsizing and factory rationalisation as mentioned in note 3(e) are reported as part of depreciation and impairment of property, plant and equipment.
In 2018, the Group recognised an impairment charge of £110 million in respect of the operations in Venezuela mentioned in note 3(h).
|
Strategic Report |
Governance Report | Financial Statements | Other Information | BAT Annual Report and Form 20-F 2020 | 167 | |||||
|
|
3 Profit From Operations Continued
(c) Other operating expenses include:
| 2020 £m |
2019 £m |
2018 £m |
||||||||||
| Research and development expenses (excluding employee benefit costs and depreciation) |
121 | 126 | 105 | |||||||||
| Exchange differences |
(29 | ) | 22 | (15 | ) | |||||||
| Hedge ineffectiveness within operating profit |
(3 | ) | (5 | ) | (8 | ) | ||||||
| Expense relating to short-term leases |
10 | 16 | – | |||||||||
| Expenses relating to leases of low-value assets |
1 | 1 | – | |||||||||
| Gains arising from sale and leaseback transactions |
(1 | ) | – | – | ||||||||
| Rent of plant and equipment (operating leases) – minimum lease payments |
– | – | 61 | |||||||||
| Rent of property (operating leases) – minimum lease payments |
– | – | 110 | |||||||||
| Auditor’s remuneration |
||||||||||||
| Total expense for audit services pursuant to legislation: |
||||||||||||
| – fees to KPMG LLP for Parent Company and Group audit |
8.7 | 6.8 | 6.3 | |||||||||
| – fees to KPMG LLP firms and associates for local statutory and Group reporting audits |
9.9 | 9.0 | 8.8 | |||||||||
| Total audit fees expense – KPMG LLP firms and associates |
18.6 | 15.8 | 15.1 | |||||||||
| Audit fees expense to other firms |
0.2 | 0.1 | 0.2 | |||||||||
| Total audit fees expense |
18.8 | 15.9 | 15.3 | |||||||||
| Fees to KPMG LLP firms and associates for other services: |
||||||||||||
| – audit-related assurance services |
8.5 | 8.5 | 9.4 | |||||||||
| – other assurance services |
0.5 | 0.5 | 0.3 | |||||||||
| – tax advisory services |
– | – | – | |||||||||
| – tax compliance |
– | – | – | |||||||||
| – audit of defined benefit schemes of the Company |
0.5 | 0.4 | 0.4 | |||||||||
| – other non-audit services |
– | – | – | |||||||||
| 9.5 | 9.4 | 10.1 | ||||||||||
The total auditor’s remuneration to KPMG firms and associates included above are £28.1 million (2019: £25.2 million; 2018: £25.2 million).
Under SEC regulations, the remuneration to KPMG firms and associates of £28.1 million in 2020 (2019: £25.1 million; 2018: £25.2 million) is required to be presented as follows: audit fees £27.5 million (2019: £24.7 million; 2018: £24.7 million), audit-related fees £0.5 million (2019: £0.4 million; 2018: £0.4 million), tax fees £nil million (2019: £nil million; 2018: £nil million) and all other fees £0.1 million (2019: £0.1 million; 2018: £0.1 million). Audit related fees are in respect of services provided to associated pension schemes. All other fees are in respect of other assurance services provided over information derived from the financial information systems subject to audit or over the controls over those systems.
| 168 | BAT Annual Report and Form 20-F 2020 |
Financial Statements
Notes on Accounts
Continued
3 Profit From Operations Continued
Total research and development costs including employee benefit costs and depreciation are £307 million (2019: £376 million; 2018: £258 million). Included in the 2019 research and development costs is £65 million of costs primarily related to packages in respect of employee benefit reductions as part of the Group’s 2019 restructuring initiative (Quantum), as discussed in note 3(e).
(d) Master Settlement Agreement
In 1998, the major US cigarette manufacturers (including the R.J. Reynolds Tobacco Company, Lorillard and Brown & Williamson, businesses which are now part of the Reynolds Group) entered into the Master Settlement Agreement (MSA) with attorneys general representing most US states and territories. The MSA imposes a perpetual stream of future payment obligations on the major US cigarette manufacturers. The amounts of money that the participating manufacturers are required to annually contribute are based upon, amongst other things, the volume of cigarettes sold and market share (based on cigarette shipments in that year).
During 2012, R.J. Reynolds Tobacco Company, Santa Fe Natural Tobacco Company (SFNTC), various other tobacco manufacturers, 17 states, the District of Columbia and Puerto Rico reached an agreement related to the Non-Participating Manufacturer (NPM) adjustment under the MSA and three more states joined the agreement in 2013. Under this agreement, R.J. Reynolds Tobacco Company has received credits of more than US$1 billion, in respect of its Non-Participating Manufacturer (NPM) Adjustment claims related to the period from 2003 to 2012. These credits have been applied against the companies’ MSA payments over a period of five years from 2013, subject to, and dependent upon, meeting the various ongoing performance obligations. During 2014, two additional states agreed to settle NPM disputes related to claims for the period 2003 to 2012. R.J. Reynolds Tobacco Company has received US$170 million in credits, which has been applied over a five-year period from 2014. During 2015, another state agreed to settle NPM disputes related to claims for the period 2004 to 2014 and included a method to determine future adjustments from 2015 forward. R.J. Reynolds Tobacco Company has received US$285 million in credits, which was applied over a four-year period from 2016. During 2016, no additional states agreed to settle NPM disputes. During 2017, two more states agreed to settle NPM disputes related to claims for the period 2004 to 2014. It is estimated that R.J. Reynolds Tobacco Company will receive US$61 million in credits, which will be applied over a five-year period from 2017. During 2018, nine more states agreed to settle NPM disputes related to claims for the period 2004 to 2019, with an option through 2022, subject to certain conditions. It is estimated that R.J. Reynolds Tobacco Company will receive US$182 million in credits for settled periods through 2017, which will be applied over a five-year period from 2018. Also, in 2018, one additional state agreed to settle NPM disputes related to claims for the period 2004 to 2024, subject to certain conditions. It is estimated that R.J. Reynolds Tobacco Company will receive US$205 million in credits for settled periods through 2017, which will be applied over a five-year period from 2019. In the first quarter of 2020, certain conditions set forth in the 2017 and 2018 agreements were met for those 10 states. In addition, in August 2020, 24 states, the District of Columbia and Puerto Rico agreed to settle NPM disputes related to claims for the period 2018-2022. Credits in respect of future years’ payments and the NPM Adjustment claims would be accounted for in the applicable year and will not be treated as adjusting items. Only credits in respect of prior year payments are included as adjusting items.
The BAT Group is subject to substantial payment obligations under the MSA and the state settlement agreements with the states of Mississippi, Florida, Texas and Minnesota (such settlement agreements, collectively State Settlement Agreements). Reynolds Group’s operating subsidiaries’ expenses and payments under the MSA and the State Settlement Agreements for 2020 amounted to US$3,572 million (2019: US$2,762 million; 2018: US$2,741 million) in respect of settlement expenses and US$2,848 million (2019: US$2,918 million; 2018: US$917 million) in respect of settlement cash payments. In 2020, R.J. Reynolds Tobacco Company recognised additional expenses, included above, under the state settlement agreements in the states of Mississippi, Florida, Texas and Minnesota. R.J. Reynolds Tobacco Company recognised US$241 million of expense for payment obligations to the State of Florida for the ITG Brands, LLC acquired brands from the date of divestiture, June 12, 2015, as a result of an unfavourable judgment. In addition, R.J. Reynolds Tobacco Company recognised US$264 million related to the resolution of claims against it in the States of Texas, Minnesota and Mississippi for payment obligations to those states for the ITG Brands, LLC acquired brands from the date of divestiture. Finally, R.J. Reynolds Tobacco Company settled certain related claims with Phillip Morris USA under the state settlement agreements in the states of Mississippi, Texas and Minnesota for US$8 million. Additional information related to the resolution of these claims is included in note 27.
(e) Restructuring and integration costs
Restructuring costs reflect the costs incurred as a result of initiatives to improve the effectiveness and the efficiency of the Group as a globally integrated enterprise. These costs represent additional expenses incurred that are not related to the normal business and day-to-day activities. These initiatives include a review of the Group’s manufacturing operations, and the costs associated with Quantum, being a review of the Group’s organisational structure announced in 2019 to simplify the business and create a more efficient, agile and focused company.
|
Strategic Report |
Governance Report | Financial Statements | Other Information | BAT Annual Report and Form 20-F 2020 | 169 | |||||
|
|
3 Profit From Operations Continued
The costs of the Group’s initiatives together with the costs of integrating acquired businesses into existing operations, including acquisition costs, are included in profit from operations under the following headings:
| 2020 £m |
2019 £m |
2018 £m |
||||||||||
| Employee benefit costs |
91 | 364 | 176 | |||||||||
| Depreciation, amortisation and impairment costs |
151 | 63 | 48 | |||||||||
| Other operating expenses |
166 | 145 | 145 | |||||||||
| Other operating income |
– | (7 | ) | (6 | ) | |||||||
| 408 | 565 | 363 | ||||||||||
The adjusting charge in 2020 relates to the ongoing restructuring costs associated with the implementation of revisions to the Group’s operating model, mainly in relation to Quantum. This includes the cost of packages in respect of permanent headcount reduction and permanent employee benefit reductions in the Group. The costs also cover the downsizing and factory rationalisation activities in the Netherlands, Hungary, Russia and APME.
Also, in 2020, as a consequence of a reduction in volumes due to the significant increase in excise in Indonesia, the Group has announced a restructuring programme which includes the partial closure of the factory operations in Indonesia. As a result of this decision, a £69 million impairment has been recognised in respect of machinery. This impairment charge relates to some of the machinery in use as well machinery held for future use which, following the significant recent changes in consumer preferences, is not expected to be brought in to manufacturing in the future.
The adjusting charge in 2019 relates to the ongoing restructuring costs associated with the implementation of revisions to the Group’s operating model, mainly in relation to Quantum. This includes the cost of packages in respect of permanent headcount reduction and permanent employee benefit reductions in the Group. The costs also cover the downsizing and factory rationalisation activities in Germany, Russia and APME. Included in other operating income are amounts related to cash and reversal of deferred consideration associated with the acquisition of TDR d.o.o. (TDR) (note 23).
Restructuring and integration costs in 2018 include integration costs associated with the acquisition of Reynolds American and ongoing costs of implementing the revisions to the Group’s operating model. This includes the cost of packages in respect of permanent headcount reductions and permanent employee benefit reductions in the Group. The costs also cover downsizing activities in Russia, Germany and APME. Included in other operating income are gains from the sale of land and buildings in the Netherlands.
(f) Amortisation and impairment of trademarks and similar intangibles
Acquisitions in previous years have resulted in the capitalisation of trademarks and similar intangibles, including those which are amortised over their expected useful lives, which do not exceed 20 years. The amortisation and impairment charge of £339 million (2019: £481 million; 2018: £377 million) is charged as adjusting and included in depreciation, amortisation and impairment costs in the income statement. In 2019, the Group incurred an impairment charge of £129 million, which included the partial impairment of the Kodiak brand, as explained in note 8(c).
(g) Fox River
As explained in note 27, a Group subsidiary has certain liabilities in respect of indemnities given on the purchase and disposal of former businesses in the United States and, in 2011, the subsidiary provided £274 million in respect of claims in relation to environmental clean-up costs of the Fox River.
On 30 September 2014, a Group subsidiary, NCR, Appvion and Windward Prospects entered into a Funding Agreement with regard to the costs for the clean-up of Fox River.
In January 2017, NCR and Appvion entered into a consent decree with the US Government to resolve how the remaining clean-up will be funded and to resolve further outstanding claims between them. The Consent Decree was approved by a US District Judge in August 2017. The US Government enforcement action against NCR was terminated as a result of that order and contribution claims from the Potentially Responsible Parties (‘PRPs’) against NCR were dismissed. On 4 January 2019, the US Government, P. H. Glatfelter and Georgia-Pacific (the remaining Fox River PRPs) sought approval for a separate Consent Decree to bring an end to all litigation concerning the Fox River clean-up. This Consent Decree was approved by the District Court of the Eastern District of Wisconsin on 14 March 2019 and concludes all existing litigation on the Fox River.
In July 2016, the High Court ruled in a Group subsidiary’s favour that a dividend of €135 million paid by Windward to Sequana in May 2009 was a transaction made with the intention of putting assets beyond the reach of the Group subsidiary and of negatively impacting its interests. On 10 February 2017, further to a hearing in January 2017 to determine the relief due, the Court found in the Group subsidiary’s favour, ordering that Sequana must pay an amount up to the full value of the dividend plus interest which equates to around US$185 million, related to past and future clean-up costs.
| 170 | BAT Annual Report and Form 20-F 2020 |
Financial Statements
Notes on Accounts
Continued
3 Profit From Operations Continued
The Court granted all parties leave to appeal and Sequana a stay in respect of the above payments. In June 2018, the Court of Appeal heard arguments in the Sequana Claims Appeal (as defined in note 27). On 6 February 2019, the Court of Appeal gave judgment upholding the High Court’s findings, with one immaterial change to the method of calculating the damages awarded. Sequana therefore remains liable to pay the above mentioned dividend. Due to the uncertain outcome of the case no asset has been recognised in relation to this ruling. In February 2017, Sequana entered into a process in France seeking court protection (the ‘Sauvegarde’), exiting the Sauvegarde in June 2017. On 7 March 2019, Sequana announced that it was unable to pay its debts and that it had applied to convert the Sauvegarde into ‘redressement judiciaire’, a form of insolvent receivership. On 15 May 2019, the Nanterre Commercial Court made an order placing Sequana into formal liquidation proceedings (‘liquidation judiciaire’). No payments have been received.
The provision is £70 million at 31 December 2020 (2019: £73 million). Based on the Funding Agreement, £3 million has been paid in 2020, which includes legal costs of £1 million (2019: £35 million, including legal costs of £3 million; 2018: £30 million, including legal costs of £5 million).
(h) Other adjusting items
Included within ‘other operating expenses’
In 2020, the Group incurred £447 million (2019: £874 million; 2018: £294 million) of other adjusting items which have been adjusted within ‘other operating expenses’.
The charge in 2020 primarily includes £487 million (2019: £236 million; 2018: £178 million) of litigation costs. In 2020, this was largely in respect of charges following the development in cases regarding payment obligations under the state settlement agreements with Florida, Texas, Minnesota and Mississippi for brands previously sold to a third party. The Group recognised a charge of £188 million in the period for a final judgment of a case in the Florida court. The Group continues to pursue indemnification remedies in a Delaware court for payments made to Florida as a result of this judgment, as explained in note 27. During 2020, the Group also recognised a provision of £212 million related to the settlement discussions with other manufacturers and the states of Texas, Minnesota and Mississippi for payment obligations related to these brands in prior years. In 2020, the charge also includes £87 million predominantly related to other litigation costs including Engle progeny litigation.
Also included in 2020, is a credit of £40 million recognised in relation to the prior year charge associated with the excise dispute in Russia, of which, £14 million is offset in the adjusting items included in taxation (note 6(d)).
In August 2019, the Russian tax authority issued a final audit report to JSC British American Tobacco-SPb (BAT SpB) related to the application of legislation introduced in 2017 that prospectively limited the amount of production that could take place prior to excise tax increases, without being subject to higher excise tax rates. The Final audit report sought to retrospectively apply the legislation to the years 2015 to 2017. BAT SpB submitted an appeal to the Federal Tax Services (FTS) objecting to the findings. The FTS accepted some of BAT SpB’s arguments and, on 27 January 2020, a final claim was issued by the FTS. As a consequence, the Group recognised a charge of £202 million included in other adjusting items in 2019. The Group also recognised an interest charge of £50 million (note 4(b)).
Also, in 2019, a charge of £436 million was incurred in respect of the Quebec class actions as explained in note 27.
Included within ‘depreciation, amortisation and impairment’
During 2020, the Group impaired the goodwill arising from Malaysia amounting to £197 million, goodwill arising from the acquisition of Twisp of £11 million and goodwill arising from the acquisition of Blue Nile of £1 million, as explained in note 8(e).
During 2019, the Group impaired the goodwill arising from the Bentoel acquisition, amounting to £172 million, goodwill arising from the VapeWild acquisition of £12 million and goodwill arising from the Highendsmoke acquisition of £10 million as explained in note 8(e).
In 2018, the European Securities and Markets Authority (ESMA) recognised the specific issues related to Venezuela and proposed that companies with exposure to Venezuela use an ‘estimated’ exchange rate rather than the official exchange rate, as otherwise required under IAS 21. Accordingly, the Group has used an exchange rate calculated with reference to the estimated inflation since the latest dividend payment in 2010. In addition, the net assets of the Group’s Venezuelan operations are subject to accounting adjustments IAS 29 Financial Reporting in Hyperinflationary Economies, as they are revalued, for accounting purposes, from their acquisition date to the balance sheet date. However, management believes that such a revaluation is not reflective of the recoverable value of those assets and have incurred an impairment charge of £110 million. This charge has been treated as an adjusting item as it does not reflect the underlying performance of the Group. The Group has also recognised a monetary gain due to hyperinflation accounting under IAS 29 of £45 million within net finance costs (note 4(b)).
(i) Other operating income
Other operating income comprises income that is associated with the Group’s normal activities, but which falls outside the definition of turnover and includes one-off capital profits on property sales and one-off disposals of fixed assets.
As explained in note 27, the Group recognised £58 million (2019: £86 million; 2018: £nil) in respect of a tax case in Brazil. In 2019 and 2018, as discussed in note 3(e) above, certain items of operating income have been incurred as part of the Group’s restructuring and integration activities.
|
Strategic Report |
Governance Report | Financial Statements | Other Information | BAT Annual Report and Form 20-F 2020 | 171 | |||||
|
|
4 Net Finance Costs
(a) Net finance costs/(income)
| 2020 £m |
2019 £m |
2018 £m |
||||||||||
| Interest expense |
1,605 | 1,676 | 1,592 | |||||||||
| Interest expense on lease liabilities |
26 | 32 | 1 | |||||||||
| Facility fees |
23 | 10 | 13 | |||||||||
| Interest and fair value related to early repurchase of bonds (note 4(b)) |
142 | – | – | |||||||||
| Interest related to adjusting tax payables (note 4(b)) |
11 | 80 | 41 | |||||||||
| Venezuela hyperinflation (note 4(b)) |
– | – | (45 | ) | ||||||||
| Fair value changes on derivative financial instruments and hedged items |
(217 | ) | 367 | (154 | ) | |||||||
| Exchange differences |
205 | (479 | ) | 1 | ||||||||
| Finance costs |
1,795 | 1,686 | 1,449 | |||||||||
| Interest under the effective interest method |
(50 | ) | (84 | ) | (68 | ) | ||||||
| Finance income |
(50 | ) | (84 | ) | (68 | ) | ||||||
| Net finance costs |
1,745 | 1,602 | 1,381 | |||||||||
The Group manages foreign exchange gains and losses and fair value changes on a net basis excluding adjusting items, which are explained in note 4(b). The derivatives that generate the fair value changes are explained in note 15.
Facility fees principally relate to the Group’s central banking facilities.
In October 2020, the Group completed a tender offer to repurchase sterling-equivalent £2,653 million of bonds, including £24 million of accrued interest. Following this, in November 2020, the Group also completed a ‘make-whole’ bond redemption exercise of sterling-equivalent £462 million of bonds, including £6 million of accrued interest. Further details on the tender offer and ‘make-whole’ redemption exercise are provided in note 22. Other costs directly associated with the early repurchase of bonds, including the premium paid, have been treated as adjusting items, as detailed in note 4(b).
(b) Adjusting items included in net finance costs
Adjusting items are significant items in net finance costs which individually or, if of a similar type, in aggregate, are relevant to an understanding of the Group’s underlying financial performance.
In 2020, the Group incurred additional interest costs of £157 million and fair value gains of £15 million in relation to the early repurchase of bonds.
In addition, the Group recognised interest on adjusting tax payables of £11 million (2019: £80 million; 2018: £41 million), which included interest of £21 million (2019: £28 million; 2018: £25 million) in relation to the Franked Investment Income Group Litigation Order (FII GLO) (note 6(b)) and a net credit of £10 million (2019: charge of £50 million, 2018: charge of £12 million) in respect of the excise dispute (note 3(h)) and withholding tax in Russia.
In 2018, the Group recognised a monetary gain of £45 million related to the application of hyperinflationary accounting in Venezuela (note 3(h)).
| 172 | BAT Annual Report and Form 20-F 2020 |
Financial Statements
Notes on Accounts
Continued
5 Associates and Joint Ventures
| 2020 | 2019 | 2018 | ||||||||||||||||||||||
|
Total £m |
Group’s £m |
Total £m |
Group’s £m |
Total £m |
Group’s £m |
|||||||||||||||||||
|
Revenue |
7,001 | 1,983 | 7,581 | 2,158 | 7,235 | 2,058 | ||||||||||||||||||
| Profit from operations |
2,006 | 591 | 2,386 | 704 | 2,128 | 630 | ||||||||||||||||||
| Net finance costs |
(6 | ) | (2 | ) | (7 | ) | (2 | ) | (8 | ) | (3 | ) | ||||||||||||
| Profit on ordinary activities before taxation |
2,000 | 589 | 2,379 | 702 | 2,120 | 627 | ||||||||||||||||||
| Taxation on ordinary activities |
(421 | ) | (125 | ) | (666 | ) | (196 | ) | (678 | ) | (201 | ) | ||||||||||||
| Profit on ordinary activities after taxation |
1,579 | 464 | 1,713 | 506 | 1,442 | 426 | ||||||||||||||||||
| Non-controlling interests |
(30 | ) | (9 | ) | (27 | ) | (8 | ) | (24 | ) | (7 | ) | ||||||||||||
| Post-tax results of associates and joint ventures |
1,549 | 455 | 1,686 | 498 | 1,418 | 419 | ||||||||||||||||||
Enumerated below are movements that have impacted the post-tax results of associates and joint ventures in 2020, 2019 and 2018.
(a) Adjusting items
In 2020, the Group’s interest in ITC Ltd. (ITC) decreased from 29.46% to 29.42% (2019: 29.57% to 29.46%; 2018: 29.71% to 29.57%) as a result of ITC issuing ordinary shares under the ITC Employee Share Option Scheme. The issue of these shares and change in the Group’s share of ITC resulted in a gain of £17 million (2019: £25 million; 2018: £22 million), which is treated as a deemed partial disposal and included in the income statement.
In 2020, ITC recognised a charge in respect of the cost of leaf tobacco stocks destroyed in a third-party warehouse fire, the Group’s share of which was £4 million.
In 2018, ITC also recognised an adjusting gain in respect of the release of certain provisions related to a tax claim, the Group’s share of which was £10 million.
(b) Other financial information
The Group’s share of the results of associates and joint ventures is shown in the table below.
| 2020 | 2019 | 2018 | ||||||||||
|
Group’s share £m |
Group’s £m |
Group’s £m |
||||||||||
| Profit on ordinary activities after taxation |
||||||||||||
| – attributable to owners of the Parent |
455 | 498 | 419 | |||||||||
| Other comprehensive income: |
||||||||||||
| Items that may be reclassified to profit & loss |
(98 | ) | (115 | ) | (38 | ) | ||||||
| Items that will not be reclassified to profit & loss |
(34 | ) | 7 | 6 | ||||||||
| Total comprehensive income |
323 | 390 | 387 | |||||||||
|
Strategic Report |
Governance Report | Financial Statements | Other Information | BAT Annual Report and Form 20-F 2020 | 173 | |||||
|
|
5 Associates and Joint Ventures Continued
Summarised financial information of the Group’s associates and joint ventures is shown below.
| 2020 | ||||||||||||
|
ITC £m |
Others £m |
Total £m |
||||||||||
|
Revenue |
4,892 | 2,109 | 7,001 | |||||||||
| Profit on ordinary activities before taxation |
1,930 | 70 | 2,000 | |||||||||
| Post-tax results of associates and joint ventures |
1,495 | 54 | 1,549 | |||||||||
| Other comprehensive income |
(450 | ) | – | (450 | ) | |||||||
| Total comprehensive income |
1,045 | 54 | 1,099 | |||||||||
| 2019 | ||||||||||||
| ITC £m |
Others £m |
Total £m |
||||||||||
|
Revenue |
5,556 | 2,025 | 7,581 | |||||||||
| Profit on ordinary activities before taxation |
2,322 | 57 | 2,379 | |||||||||
| Post-tax results of associates and joint ventures |
1,646 | 40 | 1,686 | |||||||||
| Other comprehensive income |
(365 | ) | – | (365 | ) | |||||||
| Total comprehensive income |
1,281 | 40 | 1,321 | |||||||||
| 2018 | ||||||||||||
| ITC £m |
Others £m |
Total £m |
||||||||||
|
Revenue |
5,072 | 2,163 | 7,235 | |||||||||
| Profit on ordinary activities before taxation |
2,059 | 61 | 2,120 | |||||||||
| Post-tax results of associates and joint ventures |
1,373 | 45 | 1,418 | |||||||||
| Other comprehensive income |
(110 | ) | – | (110 | ) | |||||||
| Total comprehensive income |
1,263 | 45 | 1,308 | |||||||||
| 174 | BAT Annual Report and Form 20-F 2020 |
Financial Statements
Notes on Accounts
Continued
6 Taxation on Ordinary Activities
(a) Summary of taxation on ordinary activities
| 2020 £m |
2019 £m |
2018 £m |
||||||||||
| UK corporation tax |
38 | 8 | 60 | |||||||||
|
Comprising: |
||||||||||||
| – current year tax expense |
38 | 41 | 66 | |||||||||
|
– adjustments in respect of prior periods |
– | (33 | ) | (6 | ) | |||||||
| Overseas tax |
2,387 | 2,047 | 2,455 | |||||||||
|
Comprising: |
||||||||||||
| – current year tax expense |
2,369 | 2,074 | 2,460 | |||||||||
|
– adjustments in respect of prior periods |
18 | (27 | ) | (5 | ) | |||||||
| Total current tax |
2,425 | 2,055 | 2,515 | |||||||||
| Deferred tax |
(317 | ) | 8 | (374 | ) | |||||||
|
Comprising: |
||||||||||||
| – deferred tax relating to origination and reversal of temporary differences |
(184 | ) | 55 | (304 | ) | |||||||
|
– deferred tax relating to changes in tax rates |
(133 | ) | (47 | ) | (70 | ) | ||||||
| 2,108 | 2,063 | 2,141 | ||||||||||
(b) Franked Investment Income Group Litigation Order
The Group is the principal test claimant in an action in the United Kingdom against HM Revenue and Customs (HMRC) in the Franked Investment Income Group Litigation Order (FII GLO). There are 23 corporate groups in the FII GLO. The case concerns the treatment for UK corporate tax purposes of profits earned overseas and distributed to the UK.
The original claim was filed in 2003. The trial of the claim was split broadly into issues of liability and quantification. The main liability issues were heard by the High Court, Court of Appeal and Supreme Court in the UK and the European Court of Justice in the period to November 2012. The detailed technical issues of the quantification mechanics of the claim were heard by the High Court during May and June 2014 and the judgment handed down on 18 December 2014. The High Court determined that in respect of issues concerning the calculation of unlawfully charged corporation tax and advance corporation tax, the law of restitution including the defence on change of position and questions concerning the calculation of overpaid interest, the approach of the Group was broadly preferred. The conclusion reached by the High Court would, if upheld, produce an estimated receivable of £1.2 billion for the Group. Appeals on a majority of the issues were made to the Court of Appeal, which heard the arguments in June 2016. The Court of Appeal determined in November 2016 on the majority of issues that the conclusion reached by the High Court should be upheld. The Supreme Court gave permission for a number of issues to be appealed in two separate hearings. The first, in February 2020, concerned the time limit for bringing claims. HMRC sought to challenge existing case law. In November 2020 the Supreme Court handed down its judgment. The Supreme Court agreed to partially overturn existing case law but introduced a new test for determining whether claims of this type are in time. The case has been remitted to the High Court to apply that new test to the facts. The second hearing was heard in December 2020 and concerned issues relating to the type of claims BAT is entitled to bring. Judgment following the second December hearing is expected in 2021. In July 2018, the Supreme Court handed down its judgment in the Prudential Assurance Company Ltd case, which is closely related to the FII GLO. Applying the Prudential judgment reduces the value of the FII claim to approximately £0.6 billion, mainly as the result of the application of simple interest.
During 2015, HMRC paid to the Group a gross amount of £1,224 million in two separate payments. The payments made by HMRC have been made without any admission of liability and are subject to refund were HMRC to succeed on appeal. The second payment in November 2015 followed the introduction of a new 45% tax on the interest component of restitution claims against HMRC. HMRC held back £261 million from the second payment contending that it represents the new 45% tax on that payment, leading to total cash received by the Group of £963 million. Actions challenging the legality of the withholding of the 45% tax have been lodged by the Group. The First Tier Tribunal found in favour of HMRC in July 2017 and the Group’s appeal to the Upper Tribunal was heard in July 2018 and judgment has not yet been handed down.
The net £0.9 billion held by the Group is higher than the current value of the claim referred to above. Due to the uncertainty of the amounts and eventual outcome the Group has not recognised any impact in the Income Statement in the current or prior period. The receipt, net of the deduction by HMRC, is held as deferred income as disclosed in note 21. Any future recognition as income will be treated as an adjusting item, due to the size of the amount, with interest of £21 million for the 12 months to 31 December 2020 (2019: £28 million; 2018: £25 million) accruing on the balance, which was also treated as an adjusting item.
|
Strategic Report |
Governance Report | Financial Statements | Other Information | BAT Annual Report and Form 20-F 2020 | 175 | |||||
|
|
6 Taxation on Ordinary Activities Continued
(c) Factors affecting the taxation charge
The taxation charge differs from the standard 19% (2019: 19%; 2018: 19%) rate of corporation tax in the UK. The major causes of this difference are listed below:
| 2020 | 2019 | 2018 | ||||||||||||||||||||||
| £m | % | £m | % | £m | % | |||||||||||||||||||
| Profit before tax |
8,672 | 7,912 | 8,351 | |||||||||||||||||||||
| Less: share of post-tax results of associates and joint ventures (see note 5) |
(455 | ) | (498 | ) | (419 | ) | ||||||||||||||||||
| 8,217 | 7,414 | 7,932 | ||||||||||||||||||||||
| Tax at 19% (2019 and 2018: 19%) on the above |
1,561 | 19.0 | 1,409 | 19.0 | 1,507 | 19.0 | ||||||||||||||||||
| Factors affecting the tax rate: |
||||||||||||||||||||||||
| Tax at standard rates other than UK corporation tax rate |
368 | 4.5 | 353 | 4.8 | 384 | 4.8 | ||||||||||||||||||
| Other national tax charges |
142 | 1.7 | 147 | 2.0 | 204 | 2.6 | ||||||||||||||||||
| Permanent differences |
20 | 0.3 | 122 | 1.6 | 7 | 0.1 | ||||||||||||||||||
| Overseas withholding taxes |
155 | 1.9 | 106 | 1.4 | 155 | 1.9 | ||||||||||||||||||
| Double taxation relief on UK profits |
(22 | ) | (0.3 | ) | (29 | ) | (0.4 | ) | (35 | ) | (0.4 | ) | ||||||||||||
| Unutilised/utilised tax losses |
5 | 0.1 | 16 | 0.2 | 5 | 0.1 | ||||||||||||||||||
| Adjustments in respect of prior periods |
18 | 0.2 | (60 | ) | (0.8 | ) | (11 | ) | (0.1 | ) | ||||||||||||||
| Deferred tax relating to changes in tax rates |
(133 | ) | (1.6 | ) | (47 | ) | (0.6 | ) | (70 | ) | (0.9 | ) | ||||||||||||
| Additional net deferred tax (credits)/charges |
(6 | ) | (0.1 | ) | 46 | 0.6 | (5 | ) | (0.1 | ) | ||||||||||||||
| 2,108 | 25.7 | 2,063 | 27.8 | 2,141 | 27.0 | |||||||||||||||||||
(d) Adjusting items included in taxation
In 2020, adjusting items in taxation included a net credit of £35 million mainly relating to the release of a provision regarding the application of overseas withholding tax, the revaluation of deferred tax liabilities arising on trademarks recognised in the Reynolds American acquisition in 2017 due to changes in US state tax rates and the excise dispute in Russia (note 3(h)).
In 2019, adjusting items in taxation total a credit of £65 million relating primarily to changes in US state tax rates, relating to the revaluation of deferred tax liabilities arising on trademarks recognised in the Reynolds American acquisition in 2017.
In 2018, adjusting items in taxation relate to a £79 million credit due to changes in US state tax rates in the period, relating to the revaluation of deferred tax liabilities arising on trademarks recognised in the Reynolds American acquisition in 2017, and a £55 million charge related to retrospective guidance issued by a tax authority in the ENA region regarding the application of withholding tax (WHT) between 2015 and 2017.
(e) Tax on adjusting items
In addition, the tax on adjusting items, separated between the different categories, as per note 7, amounted to £287 million (2019: £373 million; 2018: £199 million). The adjustment to the adjusted earnings per share (note 7) also includes £8 million (2019: £17 million; 2018: £6 million) in respect of the non-controlling interests’ share of the adjusting items net of tax.
(f) Tax on items recognised directly in other comprehensive income
| 2020 £m |
2019 £m |
2018 £m |
||||||||||
| Current tax |
(5 | ) | (7 | ) | (8 | ) | ||||||
| Deferred tax |
23 | 138 | (7 | ) | ||||||||
| Credited/(charged) to other comprehensive income |
18 | 131 | (15 | ) | ||||||||
The tax relating to each component of other comprehensive income is disclosed in note 18.
| 176 | BAT Annual Report and Form 20-F 2020 |
Financial Statements
Notes on Accounts
Continued
7 Earnings Per Share
| 2020 | 2019 | 2018 | ||||||||||||||||||||||||||||||||||
| Earnings £m |
Weighted m |
Earnings per share pence |
Earnings £m |
Weighted m |
Earnings per share pence |
Earnings £m |
Weighted m |
Earnings per share pence |
||||||||||||||||||||||||||||
| Basic earnings per share (ordinary shares of 25p each) | 6,400 | 2,286 | 280.0 | 5,704 | 2,284 | 249.7 | 6,032 | 2,285 | 264.0 | |||||||||||||||||||||||||||
| Share options |
– | 9 | (1.1 | ) | – | 7 | (0.7 | ) | – | 7 | (0.8 | ) | ||||||||||||||||||||||||
| Diluted earnings per share |
6,400 | 2,295 | 278.9 | 5,704 | 2,291 | 249.0 | 6,032 | 2,292 | 263.2 | |||||||||||||||||||||||||||
Adjusted earnings per share calculation
Earnings have been affected by a number of adjusting items, which are described in notes 3 to 6. Adjusting items are significant items in the profit from operations, net finance costs, taxation and the Group’s share of the post-tax results of associates and joint ventures which individually or, if of a similar type, in aggregate, are relevant to an understanding of the Group’s underlying financial performance. The Group believes that these items are useful to users of the Group financial statements in helping them to understand the underlying business performance. To illustrate the impact of these items, an adjusted earnings per share calculation is shown below.
| Basic | ||||||||||||||||||||||||||||
| 2020 | 2019 | 2018 | ||||||||||||||||||||||||||
| Notes | Earnings £m |
Earnings per share pence |
Earnings £m |
Earnings per share pence |
Earnings £m |
Earnings per share pence |
||||||||||||||||||||||
| Basic earnings per share | 6,400 | 280.0 | 5,704 | 249.7 | 6,032 | 264.0 | ||||||||||||||||||||||
| Effect of restructuring and integration costs | 3(e) | 408 | 17.8 | 565 | 24.7 | 363 | 15.9 | |||||||||||||||||||||
| Tax and non-controlling interests on restructuring and integration costs | (64 | ) | (2.8 | ) | (101 | ) | (4.4 | ) | (83 | ) | (3.6 | ) | ||||||||||||||||
| Effect of amortisation and impairment of goodwill, trademarks and similar intangibles | 3(f),(h) | 548 | 24.0 | 675 | 29.6 | 377 | 16.5 | |||||||||||||||||||||
| Tax and non-controlling interests on amortisation and impairment of goodwill, trademarks and similar intangibles | (77 | ) | (3.4 | ) | (115 | ) | (5.0 | ) | (78 | ) | (3.4 | ) | ||||||||||||||||
| Effect of associates’ adjusting items net of tax | 5(a) | (13 | ) | (0.6 | ) | (25 | ) | (1.1 | ) | (32 | ) | (1.4 | ) | |||||||||||||||
| Effect of Quebec class action | 3(h) | – | – | 436 | 19.1 | – | – | |||||||||||||||||||||
| Tax on Quebec class action | – | – | (124 | ) | (5.4 | ) | – | – | ||||||||||||||||||||
| Effect of Russia excise dispute | 3(h) | (40 | ) | (1.7 | ) | 202 | 8.9 | – | – | |||||||||||||||||||
| Tax on Russia excise dispute | 6(d) | 14 | 0.6 | (16 | ) | (0.7 | ) | – | – | |||||||||||||||||||
| Effect of hyperinflation on Venezuela retained earnings | 3(h),4(b) | – | – | – | – | 65 | 2.8 | |||||||||||||||||||||
| Other adjusting items | 3(h) | 487 | 21.2 | 236 | 10.3 | 184 | 8.0 | |||||||||||||||||||||
| Tax effect on other adjusting items | (104 | ) | (4.5 | ) | (50 | ) | (2.2 | ) | (44 | ) | (1.9 | ) | ||||||||||||||||
| Deferred tax relating to changes in tax rates | 6 | (21 | ) | (0.9 | ) | (49 | ) | (2.2 | ) | (79 | ) | (3.5 | ) | |||||||||||||||
| Effect of early repurchase of bonds | 4(b) | 142 | 6.2 | – | – | – | – | |||||||||||||||||||||
| Tax effect of early repurchase of bonds | (32 | ) | (1.4 | ) | – | – | – | – | ||||||||||||||||||||
| Effect of interest on FII GLO settlement and other | 4(b) | 11 | 0.5 | 80 | 3.5 | 41 | 1.8 | |||||||||||||||||||||
| Tax effect of interest on FII GLO settlement and other | (4 | ) | (0.2 | ) | – | – | – | – | ||||||||||||||||||||
| Effect of retrospective guidance on WHT | 6(d) | (42 | ) | (1.8 | ) | – | – | 55.0 | 2.4 | |||||||||||||||||||
| Adjusted earnings per share (basic) |
7,613 | 333.0 | 7,418 | 324.8 | 6,801 | 297.6 | ||||||||||||||||||||||
|
Strategic Report |
Governance Report | Financial Statements | Other Information | BAT Annual Report and Form 20-F 2020 | 177 | |||||
|
|
7 Earnings Per Share Continued
| Diluted | ||||||||||||||||||||||||||||
| 2020 | 2019 | 2018 | ||||||||||||||||||||||||||
| Notes | Earnings £m |
Earnings per share pence |
Earnings £m |
Earnings per share pence |
Earnings £m |
Earnings per share pence |
||||||||||||||||||||||
| Diluted earnings per share | 6,400 | 278.9 | 5,704 | 249.0 | 6,032 | 263.2 | ||||||||||||||||||||||
| Effect of restructuring and integration costs | 3(e) | 408 | 17.7 | 565 | 24.7 | 363 | 15.8 | |||||||||||||||||||||
| Tax and non-controlling interests on restructuring and integration costs | (64 | ) | (2.8 | ) | (101 | ) | (4.4 | ) | (83 | ) | (3.6 | ) | ||||||||||||||||
| Effect of amortisation and impairment of goodwill, trademarks and similar intangibles | 3(f),(h) | 548 | 23.9 | 675 | 29.5 | 377 | 16.4 | |||||||||||||||||||||
| Tax and non-controlling interests on amortisation and impairment of goodwill, trademarks and similar intangibles | (77 | ) | (3.4 | ) | (115 | ) | (5.0 | ) | (78 | ) | (3.4 | ) | ||||||||||||||||
| Effect of associates’ adjusting items net of tax | 5(a) | (13 | ) | (0.6 | ) | (25 | ) | (1.1 | ) | (32 | ) | (1.4 | ) | |||||||||||||||
| Effect of Quebec class action | 3(h) | – | – | 436 | 19.0 | – | – | |||||||||||||||||||||
| Tax on Quebec class action | – | – | (124 | ) | (5.4 | ) | – | – | ||||||||||||||||||||
| Effect of Russia excise dispute | 3(h) | (40 | ) | (1.7 | ) | 202 | 8.8 | – | – | |||||||||||||||||||
| Tax on Russia excise dispute | 6(d) | 14 | 0.6 | (16 | ) | (0.7 | ) | – | – | |||||||||||||||||||
| Effect of hyperinflation on Venezuela retained earnings | 3(h),4(b) | – | – | – | – | 65 | 2.8 | |||||||||||||||||||||
| Other adjusting items | 3(h) | 487 | 21.2 | 236 | 10.3 | 184 | 8.0 | |||||||||||||||||||||
| Tax effect on other adjusting items | (104 | ) | (4.5 | ) | (50 | ) | (2.2 | ) | (44 | ) | (1.9 | ) | ||||||||||||||||
| Deferred tax relating to changes in tax rates | 6 | (21 | ) | (0.9 | ) | (49 | ) | (2.2 | ) | (79 | ) | (3.4 | ) | |||||||||||||||
| Effect of early repurchase of bonds | 4(b) | 142 | 6.2 | – | – | – | – | |||||||||||||||||||||
| Tax effect of early repurchase of bonds | (32 | ) | (1.4 | ) | – | – | – | – | ||||||||||||||||||||
| Effect of interest on FII GLO settlement and other | 4(b) | 11 | 0.5 | 80 | 3.5 | 41 | 1.8 | |||||||||||||||||||||
| Tax effect of interest on FII GLO settlement and other | (4 | ) | (0.2 | ) | – | – | – | – | ||||||||||||||||||||
| Effect of retrospective guidance on WHT | 6(d) | (42 | ) | (1.8 | ) | – | – | 55 | 2.4 | |||||||||||||||||||
| Adjusted earnings per share (diluted) |
7,613 | 331.7 | 7,418 | 323.8 | 6,801 | 296.7 | ||||||||||||||||||||||
| 178 | BAT Annual Report and Form 20-F 2020 |
Financial Statements
Notes on Accounts
Continued
7 Earnings Per Share Continued
Headline earnings per share as required by the JSE Limited
The presentation of headline earnings per share, as an alternative measure of earnings per share, is mandated under the JSE Listing Requirements. It is calculated in accordance with Circular 1/2019 ‘Headline Earnings’, as issued by the South African Institute of Chartered Accountants.
| Basic | ||||||||||||||||||||||||
| 2020 | 2019 | 2018 | ||||||||||||||||||||||
| Earnings £m |
Earnings per share pence |
Earnings £m |
Earnings per share pence |
Earnings £m |
Earnings per share pence |
|||||||||||||||||||
| Basic earnings per share | 6,400 | 280.0 | 5,704 | 249.7 | 6,032 | 264.0 | ||||||||||||||||||
| Effect of impairment of intangibles, property, plant and equipment and assets held-for-sale | 465 | 20.3 | 518 | 22.7 | 238 | 10.3 | ||||||||||||||||||
| Tax and non-controlling interests on impairment of intangibles and property, plant and equipment | (74 | ) | (3.3 | ) | (79 | ) | (3.5 | ) | (65 | ) | (2.8 | ) | ||||||||||||
| Effect of (gains)/losses on disposal of property, plant and equipment, held-for-sale assets, partial/full termination of IFRS 16 leases, and sale and leaseback | (26 | ) | (1.1 | ) | 7 | 0.3 | (11 | ) | (0.5 | ) | ||||||||||||||
| Tax and non-controlling interests on disposal of property, plant and equipment, held-for-sale assets, partial/full termination of IFRS 16 leases, and sale and leaseback | 8 | 0.3 | (1 | ) | – | 4 | 0.2 | |||||||||||||||||
| Effect of gains on disposal of businesses, non-current investments and brands | – | – | – | – | (10 | ) | (0.4 | ) | ||||||||||||||||
| Tax on gains on disposal of businesses, non-current investments and brands | – | – | – | – | 2 | 0.1 | ||||||||||||||||||
| Issue of shares and change in shareholding in associate | (17 | ) | (0.7 | ) | (25 | ) | (1.1 | ) | (22 | ) | (1.0 | ) | ||||||||||||
| Headline earnings per share (basic) |
6,756 | 295.5 | 6,124 | 268.1 | 6,168 | 269.9 | ||||||||||||||||||
| Diluted | ||||||||||||||||||||||||
| 2020 | 2019 | 2018 | ||||||||||||||||||||||
| Earnings £m |
Earnings per share pence |
Earnings £m |
Earnings per share pence |
Earnings £m |
Earnings per share pence |
|||||||||||||||||||
| Diluted earnings per share | 6,400 | 278.9 | 5,704 | 249.0 | 6,032 | 263.2 | ||||||||||||||||||
| Effect of impairment of intangibles, property, plant and equipment and assets held-for-sale | 465 | 20.3 | 518 | 22.5 | 238 | 10.3 | ||||||||||||||||||
| Tax and non-controlling interests on impairment of intangibles and property, plant and equipment | (74 | ) | (3.3 | ) | (79 | ) | (3.4 | ) | (65 | ) | (2.8 | ) | ||||||||||||
| Effect of (gains)/losses on disposal of property, plant and equipment, held-for-sale assets, partial/full termination of IFRS 16 leases, and sale and leaseback | (26 | ) | (1.1 | ) | 7 | 0.3 | (11 | ) | (0.5 | ) | ||||||||||||||
| Tax and non-controlling interests on disposal of property, plant and equipment, held-for-sale assets, partial/full termination of IFRS 16 leases, and sale and leaseback | 8 | 0.3 | (1 | ) | – | 4 | 0.2 | |||||||||||||||||
| Effect of gains on disposal of businesses, non-current investments and brands | – | – | – | – | (10 | ) | (0.4 | ) | ||||||||||||||||
| Tax on gains on disposal of businesses, non-current investments and brands | – | – | – | – | 2 | 0.1 | ||||||||||||||||||
| Issue of shares and change in shareholding in associate | (17 | ) | (0.7 | ) | (25 | ) | (1.1 | ) | (22 | ) | (1.0 | ) | ||||||||||||
| Headline earnings per share (diluted) |
6,756 | 294.4 | 6,124 | 267.3 | 6,168 | 269.1 | ||||||||||||||||||
|
Strategic Report |
Governance Report | Financial Statements | Other Information | BAT Annual Report and Form 20-F 2020 | 179 | |||||
|
|
8 Intangible Assets
(a) Overview of intangible assets
| 2020 | ||||||||||||||||||||
|
Goodwill £m |
Computer software £m |
Trademarks and similar £m |
Assets
in development £m |
Total £m |
||||||||||||||||
| 1 January |
||||||||||||||||||||
| Cost |
44,316 | 1,207 | 75,726 | 115 | 121,364 | |||||||||||||||
| Accumulated amortisation and impairment |
(780 | ) | (1,797 | ) | (2,577 | ) | ||||||||||||||
| Net book value at 1 January |
44,316 | 427 | 73,929 | 115 | 118,787 | |||||||||||||||
| Differences on exchange |
(824 | ) | (3 | ) | (2,252 | ) | – | (3,079 | ) | |||||||||||
| Additions |
||||||||||||||||||||
| – internal development |
– | – | – | 142 | 142 | |||||||||||||||
| – acquisitions (note 23) |
36 | – | 39 | – | 75 | |||||||||||||||
| – separately acquired |
– | – | 103 | 13 | 116 | |||||||||||||||
| Reallocations |
– | 127 | 23 | (150 | ) | – | ||||||||||||||
| Amortisation charge |
– | (121 | ) | (338 | ) | – | (459 | ) | ||||||||||||
| Impairment |
(209 | ) | (8 | ) | (22 | ) | – | (239 | ) | |||||||||||
| 31 December |
||||||||||||||||||||
| Cost |
43,319 | 1,307 | 73,598 | 120 | 118,344 | |||||||||||||||
| Accumulated amortisation and impairment |
(885 | ) | (2,116 | ) | (3,001 | ) | ||||||||||||||
| Net book value at 31 December |
43,319 | 422 | 71,482 | 120 | 115,343 | |||||||||||||||
| 2019 | ||||||||||||||||||||
|
Goodwill £m |
Computer software £m |
Trademarks and similar £m |
Assets
in development £m |
Total £m |
||||||||||||||||
| 1 January |
||||||||||||||||||||
| Cost |
46,163 | 1,101 | 78,736 | 125 | 126,125 | |||||||||||||||
| Accumulated amortisation and impairment |
(698 | ) | (1,414 | ) | (2,112 | ) | ||||||||||||||
| Net book value at 1 January |
46,163 | 403 | 77,322 | 125 | 124,013 | |||||||||||||||
| Differences on exchange |
(1,676 | ) | (2 | ) | (2,976 | ) | – | (4,654 | ) | |||||||||||
| Additions |
||||||||||||||||||||
| – internal development |
– | – | – | 148 | 148 | |||||||||||||||
| – acquisitions (note 23) |
23 | – | 54 | – | 77 | |||||||||||||||
| – separately acquired |
– | – | 7 | 6 | 13 | |||||||||||||||
| Reallocations |
– | 134 | 30 | (164 | ) | – | ||||||||||||||
| Amortisation charge |
– | (105 | ) | (361 | ) | – | (466 | ) | ||||||||||||
| Impairment |
(194 | ) | (3 | ) | (147 | ) | – | (344 | ) | |||||||||||
| 31 December |
||||||||||||||||||||
| Cost |
44,316 | 1,207 | 75,726 | 115 | 121,364 | |||||||||||||||
| Accumulated amortisation and impairment |
(780 | ) | (1,797 | ) | (2,577 | ) | ||||||||||||||
| Net book value at 31 December |
44,316 | 427 | 73,929 | 115 | 118,787 | |||||||||||||||
(b) Goodwill
Goodwill of £43,319 million (2019: £44,316 million) is included in intangible assets in the balance sheet of which the following are the significant acquisitions: Reynolds American £32,719 million (2019: £33,761 million); Rothmans Group £4,591 million (2019: £4,704 million); Imperial Tobacco Canada £2,304 million (2019: £2,335 million); ETI (Italy) £1,474 million (2019: £1,396 million) and ST (principally Scandinavia) £1,111 million (2019: £1,048 million). The principal allocations of goodwill in the Rothmans’ acquisition are to the cash-generating units of Europe and South Africa, with the remainder mainly relating to operations in APME.
During 2020, the Group recognised a goodwill impairment charge of £209 million (2019: £194 million) as explained in note 8(e)(iv) below.
| 180 | BAT Annual Report and Form 20-F 2020 |
Financial Statements
Notes on Accounts
Continued
8 Intangible Assets Continued
(c) Trademarks and similar intangibles
Trademarks and similar intangibles with indefinite lives
Included in the net book value of trademarks and similar intangibles are trademarks relating to the acquisition of Reynolds American with indefinite lives amounting to £68,839 million (2019: £71,032 million). These trademarks, including Newport, Camel, Natural American Spirit, Grizzly and Pall Mall, all of which are part of the Group’s Strategic Portfolio of key brands, form the core focus of the US business and receive significant support in the form of dedicated internal resources, forecasting and, where appropriate, marketing investment. These trademarks have significant market share and positive cashflow growth expectations. There are no regulatory or contractual restrictions on the use of the trademarks, and there are no plans by management to significantly redirect resources elsewhere. Consequently, in the view of management, these trademarks do not have a foreseeable and definite end to their ability to generate future cash flows and hence are not amortised.
Trademarks and similar intangibles with definite lives
Included in the net book value of trademarks and similar intangibles are trademarks relating to the acquisition of Reynolds American £2,260 million (2019: £2,590 million). On 20 October 2020, the Group acquired the formulations, brands, associated know-how and other relevant assets owned by Dryft Sciences, LLC, relating to its white nicotine pouch products, these have been accounted as trademarks with a value of £103 million (see note 23).
In 2020, due to the migration to Vuse and difficult trading conditions in South Africa and the delisting of certain brands in Belize, the Group recognised an impairment charge of £18 million.
In 2019, as a result of declining volumes, the Group recognised a partial impairment of the Kodiak brand of £63 million. In addition, as a result of the regulatory uncertainty in the US vaping market, the Group did not submit Premarket Tobacco Applications (PMTA) for the vaping e-liquids purchased as part of the VapeWild acquisition (note 23). As a consequence, the Group recognised an impairment charge of £37 million in respect of the brands acquired as part of the acquisition. The Group withdrew the VapeWild products from the market in September 2020. Also, in 2019, the Group announced that it was simplifying its New Category product portfolio, with vapour products to be branded Vuse, modern oral products to be branded Velo and tobacco heating products continuing to be branded glo. As a result, the carrying values of trademarks and similar intangible assets acquired as part of the Chic, Must Have Limited and Quantus/Highendsmoke business combinations (see note 23), amounting to £29 million in total, have been fully impaired, as the acquired trademarks will no longer generate future economic benefits.
(d) Computer software and assets in the course of development
Included in computer software and assets in the course of development are internally developed assets with a carrying value of £513 million (2019: £516 million). The costs of internally developed assets include capitalised expenses of employees working full time on software development projects, third-party consultants, and software licence fees from third-party suppliers.
The Group has £6 million of future contractual commitments (2019: £4 million) related to intangible assets.
(e) Impairment testing
(i) Estimation uncertainty
As described in note 1, the critical accounting estimates used in the preparation of the consolidated financial statements include the review of asset values, especially indefinite life assets such as goodwill and certain trademarks and similar intangibles.
There is significant judgement with regard to assumptions and estimates involved in the forecasting of future cash flows, which form the basis of the assessment of the recoverability of these assets, with the effect that the value-in-use of calculations incorporate estimation uncertainty, particularly for certain assets held in relation to the Canada, US, Malaysia, Peru and South Africa markets and the Global Travel Retail (GTR) business.
(ii) Impairment testing – Trademarks and similar intangibles with indefinite lives (brands)
The trademarks and similar intangibles have been tested for impairment in line with the following methodology. The recoverable amounts of trademarks and similar intangibles with indefinite lives have been determined on a value-in-use basis. The value-in-use calculations use cash flows based on detailed brand budgets prepared by management using projected sales volumes, revenues and projected brand profitability covering a five-year horizon and, thereafter, grown into perpetuity. Corporate costs are allocated to the brand budgets based on either specific allocations, where appropriate, or based on volumes. The pre-tax discount rates, ranging between 8.29% and 9.01%, and long-term growth rates of 1%, applied to the brand value-in-use calculations have been determined by local management based on experience, specific market and brand trends and pricing and cost expectations. Following the application of a reasonable range of sensitivities, there was no indication of impairment.
Refer to note 8(e)(v) for further information on the Newport brand impairment testing. As the trademarks and similar intangibles with indefinite lives relate to the acquisition of Reynolds American, the brand budgets used in the value-in-use calculations have been incorporated into the budget information used in the impairment testing of the Reynolds American goodwill.
|
Strategic Report |
Governance Report | Financial Statements | Other Information | BAT Annual Report and Form 20-F 2020 | 181 | |||||
|
|
8 Intangible Assets Continued
(iii) Cash-generating units and information on goodwill impairment testing
In 2020, goodwill was allocated for impairment testing purposes to 19 (2019: 21) individual cash-generating units – one in the United States (2019: two), six in APME (2019: five), seven in AMSSA (2019: seven) and five in ENA (2019: seven).
Due to initiatives to simplify the business and improve the effectiveness and the efficiency of the Group as a globally integrated enterprise, £555 million of goodwill arising from the Rothmans acquisition allocated to the UK Exports cash-generating unit has been transferred to the Europe cash-generating unit and a portion of goodwill amounting to £235 million has been transferred from the Singapore cash-generating unit to a newly created Global Travel and Retail (GTR) cash-generating unit. The effective date for both transfers was 1 January 2020. The transfer of the UK Exports cash-generating unit and the 2019 impairment of goodwill arising from the Quantus/Highendsmoke acquisition (refer to note 8(e)(iv)) resulted in the ENA cash-generating units reducing to five. The number of cash-generating units in APME increased to six with the addition of the newly created GTR and Eastern Tobacco (note 23(a)) cash-generating units and the removal of Indonesia as a cash-generating unit due to the 2019 impairment (note 8(e)(iv)). In addition, the cash-generating units in the United States have reduced by one as a result of the impairment of goodwill in VapeWild (note 8(e)(iv)).
| 2020 | 2019 | |||||||||||||||
|
Carrying amount £m |
Pre-tax discount rate % |
Carrying amount £m |
Pre-tax discount rate % |
|||||||||||||
| Cash-generating unit |
||||||||||||||||
| Reynolds American |
32,719 | 7.6 | 33,761 | 7.3 | ||||||||||||
| Canada |
2,304 | 19.1 | 2,335 | 19.1 | ||||||||||||
| Europe |
5,639 | 6.2 | 4,809 | 6.2 | ||||||||||||
| South Africa |
552 | 11.5 | 598 | 9.3 | ||||||||||||
| Australia |
756 | 7.9 | 711 | 6.7 | ||||||||||||
| Singapore |
356 | 9.6 | 599 | 6.4 | ||||||||||||
| Malaysia |
232 | 10.3 | 435 | 7.5 | ||||||||||||
| Other |
761 | 7.4 | 1,068 | 6.8 | ||||||||||||
|
Total |
43,319 | 44,316 | ||||||||||||||
Included within ‘Other’ above is goodwill arising on various acquisitions that have been allocated to multiple cash-generating units which are insignificant. The pre-tax discount rate represents the weighted average pre-tax discount rate.
The recoverable amounts of all cash-generating units have been determined on a value-in-use basis. The key assumptions for the recoverable amounts of all units are the budgeted volumes, revenues, operating margins and long-term growth rates, which directly impact the cash flows, and the discount rates used in the calculation. The long-term growth rate is used purely for the impairment testing of goodwill under IAS 36 Impairment of Assets and does not reflect long-term planning assumptions used by the Group for investment proposals or for any other assessments.
Pre-tax discount rates, as shown above, were used in the impairment testing, based on the Group’s weighted average cost of capital, taking into account the cost of capital and borrowings, to which specific market-related premium adjustments are made. These adjustments are derived from external sources and are based on the spread between bonds (or credit default swaps, or similar indicators) issued by the US or comparable governments and by the relevant local government, adjusted for the Group’s own credit market risk. For ease of use and consistency in application, these results are periodically calibrated into bands based on internationally recognised credit ratings. The long-term growth rates and discount rates have been applied to the budgeted cash flows of each cash-generating unit. These cash flows have been determined by local management based on experience, specific market and brand trends as well as pricing and cost expectations. These have been endorsed by Group management as part of the consolidated Group’s budget.
(iv) Impairment testing – Goodwill (excluding Reynolds American and Canada)
The value-in-use calculations use cash flows based on detailed financial budgets prepared by management covering a one-year period extrapolated over a 10-year horizon with growth of 3% (2019: 4%) in years 2 to 10, including 1% inflation (2019: 2% inflation), after which a total growth rate of 1% (2019: 2%) has been assumed as the long-term volume decline is more than offset by pricing to drive revenue growth. A 10-year horizon is considered appropriate based on the Group’s history of profit and cash growth, its well-balanced portfolio of brands and the industry in which it operates. For recent acquisitions and start-up ventures the detailed financial budget is expanded to reflect the medium-term plan of the country or market management spanning five years or beyond.
| 182 | BAT Annual Report and Form 20-F 2020 |
Financial Statements
Notes on Accounts
Continued
8 Intangible Assets Continued
As a result of difficult trading conditions, the above assumptions were amended to reflect the short to medium-term plans of the country or area management spanning up to a period of five years for the South Africa, GTR, Peru and Malaysia cash-generating units.
In South Africa, where there was a five-month sales ban, the forecast cash flows were reduced to reflect the recovery after the ban was lifted and the growth rate was reduced from 1% to -1%. Following the application of a reasonable range of sensitivities, there was no indication of impairment. For the South Africa cash-generating unit headroom to reduce to £nil, the forecast cash flows would need to reduce by a further 20% in each forecast year or the pre-tax discount rate would need to increase by 4%. Management believe that the post-ban recovery will continue in South Africa and therefore both scenarios are not considered by management, at this stage, to be reasonably possible.
For GTR, due to difficult trading conditions as a consequence of the COVID-19 pandemic, the growth rate was reduced from 1% to 0%. Following the application of a reasonable range of sensitivities, there was no indication of impairment. For the GTR cash-generating unit headroom to reduce to £nil, the forecast cash flows would need to reduce by a further 44% in each forecast year or the pre-tax discount rate would need to increase by 5.1%. Management believes that the duty free business will recover and therefore both scenarios are not considered, at this stage, to be reasonably possible.
In Peru, due to difficult trading conditions as a consequence of the COVID-19 pandemic, the growth rate was reduced from 1% to 0%. As a result, the Peru cash-generating unit is sensitive to reasonable possible changes in assumptions as outlined in the table below.
As a result of the merger with Rothmans in 1999, the Group recognised goodwill attributable to the business in Malaysia, measured at MYR2,357 million (approximately £429 million) under IFRS. Difficult trading conditions, including high incidence of illicit trade and downtrading, are now expected to negatively impact forecast operating cash flows and have resulted in the Group recognising an impairment charge of £197 million in 2020. This partial impairment reduces the carrying value of goodwill to £232 million.
In addition, during the year, the Group has impaired in full the goodwill arising from the acquisitions of Twisp in South Africa and Blue Nile in Sudan due to difficult trading conditions in these markets. This has resulted in the recognition of impairment charges of £11 million and £1 million, respectively.
The table below shows the headroom and the impairment charge that would be recognised if the assumptions used in the value-in-use calculation were changed:
| |
Carrying amount of CGU £m |
|
|
Headroom £m |
|
|
Increase in discount rate £m |
1,2
|
|
Decrease in cash flows £m |
1,2
|
|
1% increase in terminal decline £m |
| ||||||
| Impairment charge | ||||||||||||||||||||
| Cash-generating unit |
||||||||||||||||||||
| Malaysia1 |
278 | – | (28 | ) | (28 | ) | (20 | ) | ||||||||||||
| Peru2 |
185 | 12 | (15 | ) | (28 | ) | (15 | ) | ||||||||||||
Notes:
| 1. | Malaysia: reasonably possible changes in key assumptions that would result in additional impairment would be a 1.4% increase in the pre-tax discount rate, a 10% decrease each year in forecast cash flows or a 1% increase in terminal decline. |
| 2. | Peru: reasonably possible changes in key assumptions that would result in impairment would be a 1.4% increase in the pre-tax discount rate, a 20% decrease in forecast cash flows reflecting a permanent loss in volumes arising from the COVID-19 pandemic or a 1% increase in terminal decline. |
With the exception of the Malaysia and Peru cash-generating units, following the application of a reasonable range of sensitivities to all the cash-generating units, and after reflecting the impairments above, there was no indication of any further impairment.
In 2009, the Group acquired Bentoel and the goodwill arising from this acquisition was assigned to the Indonesia cash-generating unit. During 2019, the Indonesian government announced a significant increase in excise effective 1 January 2020. The recoverable amount of the Indonesia cash-generating unit had been determined on a value-in-use basis using a 10-year forecast with cash flows after year 10 extrapolated as described above. The 10-year forecast had been prepared to take into account the expected decline in revenue and the impact this would have on net revenue, operating profit and cash flows. The extent of the significant increase in excise was such that the forecast cash flows did not support the carrying value of goodwill and therefore the goodwill of £172 million was fully impaired in 2019. The other assets held by the Indonesian cash-generating unit were assessed for impairment and based on the recoverable amounts, no impairment charges were recognised at that time. However, as explained in note 3(e), in 2020, a £69 million impairment has been recognised in respect of machinery held by the Indonesian business.
As explained in note 8(c) above, in addition to the impairment of trademarks and similar intangibles, in 2019 the goodwill associated with the acquisitions of VapeWild and Quantus/Highendsmoke (note 23) was fully impaired amounting to £12 million and £10 million, respectively.
|
Strategic Report |
Governance Report | Financial Statements | Other Information | BAT Annual Report and Form 20-F 2020 | 183 | |||||
|
|
8 Intangible Assets Continued
(v) Impairment testing – Reynolds American
Goodwill relating to Reynolds American and the Newport trademark
On 15 November 2018, the US Food and Drug Administration (FDA) announced an intention to ban flavoured vaping products and menthol cigarettes. Management recognise that the FDA announcement in 2018 does not itself constitute a ban on menthol in cigarettes, and any proposed regulation of menthol in cigarettes would need to be introduced through the established US comprehensive rule-making process, the timetable and outcome for which was, and remains, uncertain. In addition, it is unclear how any such potential US regulation might affect the manufacture and marketing of Group combustible brands containing menthol.
During 2020, the FDA issued the Unified Agenda that did not progress the potential regulations with regards to menthol in tobacco products or restrictions on nicotine in tobacco products. The Group continues to monitor the regulatory developments but does not believe there is any significant impact of such restrictions on the Group’s operations at this time. The Group has a long-standing track record of managing regulatory shifts and in the event of regulatory change the Group remains confident in its ability to navigate that environment successfully.
Since 2018, having considered the combination of the risk of implementation and impact of any change in regulations, the Group has not recognised any impairment on either the Newport brand or the Reynolds American goodwill, as management concluded that there would not be a significant impact to the value-in-use. The base case scenario used in the impairment model therefore does not include any potential impact of changes in regulation in relation to menthol flavourings in combustibles.
The carrying amounts for Reynolds American goodwill and Newport were £32,719 million and £29,248 million, respectively (2019: £33,761 million and £30,179 million). The value-in-use calculations for brands, as described in note 8(e)(ii) above, have been incorporated in the base case scenario used in the Reynolds American goodwill model. The value-in-use calculations have been prepared based on a five-year cash flow forecast which assumes long-term volume decline of cigarettes. This decline is more than offset by pricing. After this forecast, a growth rate of 1% has been assumed for Reynolds American goodwill and 1% for Newport and a pre-tax discount rate of 7.6% (2019: 7.3%) and 8.3% (2019: 8.6%), respectively.
The excess of value-in-use earnings over the carrying values (headroom) of the Reynolds American goodwill and the Newport brand would be reduced to nil if the following individual changes, none of which are considered reasonably possible by management, were made to the key assumptions used in the impairment model.
|
Reynolds American goodwill % |
Newport % |
|||||||
| Assumptions |
||||||||
| Decrease in revenue by |
5.6 | 16.2 | ||||||
| Increase in pre-tax discount rate by |
1.1 | 2.4 | ||||||
For Reynolds American goodwill, the change in revenue assumption is based on combustibles revenue in the five-year forecast reducing by 5.6% in each year and assumes that other assumptions are not changed. Due to the increased risk of uncertainty around the long-term implications of the COVID-19 pandemic several cash flow forecasts were prepared. The Group, for the purposes of preparing the impairment analysis, used conservative pricing assumptions and reduced the terminal value growth rate from 2% in 2019 to 1%. Such assumptions have been used for the purposes of impairment analysis only and do not reflect management’s assessment of the potential performance of the Reynolds American cash-generating unit, which is expected to substantially exceed such assumptions. However, by using these conservative assumptions (including the reduction in terminal value growth compared to 2019), revenue would have to underperform the Group’s impairment model by 5.6% per annum (2019: 13.4%). This is not deemed by management, due to the pricing potential, to be a reasonably possible scenario.
For Newport, the change in revenue assumption is based on the Newport revenue in the five-year forecast reducing by 16.2% in each year and assumes that other assumptions are not changed.
(vi) Impairment testing – Canada
Goodwill relating to Imperial Tobacco Canada Ltd (ITCAN)
In March 2019, ITCAN obtained an Initial Order from the Ontario Superior Court of Justice granting it protection under the Companies’ Creditors Arrangement Act (CCAA). If the CCAA bankruptcy protection were to end, significant liabilities might crystallise. As a consequence, to reflect the risk to future operating cash flows, the value-in-use calculations have been prepared based on a five-year cash flow forecast, after which a growth rate of -2.3% and a pre-tax discount rate of 19.1% (2019: 19.1%) have been assumed. Further information on the Quebec Class Actions and CCAA can be found in note 27.
In addition to the increase in discount rate, a reasonable range of sensitivities was applied to the value-in-use calculation and there was no indication of impairment.
The excess of value-in-use earnings over the carrying values (headroom) of the ITCAN goodwill would be reduced to nil if the following individual changes, none of which are considered reasonably possible by management, were made to the key assumptions used in the impairment model. The change in revenue assumption is based on combustibles revenue in the five-year forecast reducing by 20.5% in each year and assumes that other assumptions are not changed.
| 184 | BAT Annual Report and Form 20-F 2020 |
Financial Statements
Notes on Accounts
Continued
8 Intangible Assets Continued
| Canada goodwill % |
||||
| Assumptions |
||||
| Decrease in revenue by |
20.5 | |||
| Increase in pre-tax discount rate by |
10.1 | |||
The £2,304 million of goodwill relating to ITCAN on the Group’s balance sheet at 31 December 2020 will continue to be reviewed on a regular basis. Any future impairment charge would result in a non-cash charge to the income statement that will be treated as an adjusting item.
9 Property, Plant and Equipment
(a) Overview of property, plant and equipment, including right-of-use assets
| 2020 | ||||||||||||||||||||||||
|
Freehold property £m |
Leasehold property £m |
Plant, equipment and other owned £m |
Plant, equipment and other leased £m |
Assets in the course of construction £m |
Total £m |
|||||||||||||||||||
| 1 January |
||||||||||||||||||||||||
| Cost |
1,503 | 785 | 5,795 | 215 | 921 | 9,219 | ||||||||||||||||||
| Accumulated depreciation and impairment |
(427 | ) | (229 | ) | (2,974 | ) | (71 | ) | – | (3,701 | ) | |||||||||||||
| Net book value at 1 January |
1,076 | 556 | 2,821 | 144 | 921 | 5,518 | ||||||||||||||||||
| Differences on exchange |
(38 | ) | (25 | ) | (150 | ) | (4 | ) | (55 | ) | (272 | ) | ||||||||||||
| Additions |
||||||||||||||||||||||||
| – right-of-use assets |
– | 67 | – | 36 | 103 | |||||||||||||||||||
| – separately acquired |
2 | – | 40 | – | 459 | 501 | ||||||||||||||||||
| – acquisition of subsidiaries (note 23) |
– | 1 | – | – | – | 1 | ||||||||||||||||||
| Reallocations |
84 | 14 | 427 | – | (525 | ) | – | |||||||||||||||||
| Depreciation |
(38 | ) | (118 | ) | (313 | ) | (62 | ) | – | (531 | ) | |||||||||||||
| Impairment |
(5 | ) | (1 | ) | (184 | ) | – | (36 | ) | (226 | ) | |||||||||||||
| Right-of-use assets – reassessments, modifications and terminations |
– | (11 | ) | – | (7 | ) | – | (18 | ) | |||||||||||||||
| Disposals |
(7 | ) | – | (9 | ) | – | – | (16 | ) | |||||||||||||||
| Net reclassifications as held-for-sale |
– | – | – | – | – | – | ||||||||||||||||||
| 31 December |
||||||||||||||||||||||||
| Cost |
1,518 | 798 | 5,807 | 217 | 764 | 9,104 | ||||||||||||||||||
| Accumulated depreciation and impairment |
(444 | ) | (315 | ) | (3,175 | ) | (110 | ) | – | (4,044 | ) | |||||||||||||
| Net book value at 31 December |
1,074 | 483 | 2,632 | 107 | 764 | 5,060 | ||||||||||||||||||
|
Strategic Report |
Governance Report | Financial Statements | Other Information | BAT Annual Report and Form 20-F 2020 | 185 | |||||
|
|
9 Property, Plant and Equipment Continued
| 2019 | ||||||||||||||||||||||||
|
Freehold property £m |
Leasehold property £m |
Plant, equipment and other owned £m |
Plant, equipment and other leased £m |
Assets in the course of construction £m |
Total £m |
|||||||||||||||||||
| 31 December |
||||||||||||||||||||||||
| Cost |
1,515 | 268 | 5,730 | 33 | 1,108 | 8,654 | ||||||||||||||||||
| Accumulated depreciation and impairment |
(411 | ) | (129 | ) | (2,931 | ) | (17 | ) | (3,488 | ) | ||||||||||||||
| Net book value at 31 December |
1,104 | 139 | 2,799 | 16 | 1,108 | 5,166 | ||||||||||||||||||
| Accounting policy change (IFRS 16) (note 30) |
470 | 140 | 610 | |||||||||||||||||||||
| Net book value at 1 January |
1,104 | 609 | 2,799 | 156 | 1,108 | 5,776 | ||||||||||||||||||
| Differences on exchange |
(56 | ) | (30 | ) | (136 | ) | (9 | ) | (51 | ) | (282 | ) | ||||||||||||
| Additions |
||||||||||||||||||||||||
| – right-of-use assets |
– | 85 | – | 77 | 162 | |||||||||||||||||||
| – separately acquired |
3 | 1 | 46 | – | 566 | 616 | ||||||||||||||||||
| – acquisition of subsidiaries (note 23) |
– | 4 | 2 | – | – | 6 | ||||||||||||||||||
| Reallocations |
73 | 12 | 610 | – | (695 | ) | – | |||||||||||||||||
| Depreciation |
(37 | ) | (114 | ) | (308 | ) | (62 | ) | (521 | ) | ||||||||||||||
| Impairment |
(6 | ) | (2 | ) | (159 | ) | – | (7 | ) | (174 | ) | |||||||||||||
| Right-of-use assets – reassessments, modifications and terminations |
– | (9 | ) | – | (18 | ) | (27 | ) | ||||||||||||||||
| Disposals |
(5 | ) | – | (27 | ) | – | (32 | ) | ||||||||||||||||
| Net reclassifications as held-for-sale |
– | – | (6 | ) | – | (6 | ) | |||||||||||||||||
| 31 December |
||||||||||||||||||||||||
| Cost |
1,503 | 785 | 5,795 | 215 | 921 | 9,219 | ||||||||||||||||||
| Accumulated depreciation and impairment |
(427 | ) | (229 | ) | (2,974 | ) | (71 | ) | – | (3,701 | ) | |||||||||||||
| Net book value at 31 December |
1,076 | 556 | 2,821 | 144 | 921 | 5,518 | ||||||||||||||||||
Refer to notes 3(b) and 3(e) for more information on property, plant and equipment impairments.
As of 31 December 2020, the Group owns freehold property amounting to £1,074 million (2019: £1,076 million), representing factories, warehouses and office buildings together with adjoining land, mainly in the US, UK, Bangladesh, Indonesia and South Korea.
Upon adoption of IFRS 16 Leases prospectively from 1 January 2019, the right-of-use assets related to leased properties have been included in the asset class ‘Leasehold Property’ and other right-of-use assets have been reported under ‘Plant, equipment and other leased’. A further breakdown of leasehold property is given in note 9(c).
| 186 | BAT Annual Report and Form 20-F 2020 |
Financial Statements
Notes on Accounts
Continued
9 Property, Plant and Equipment Continued
| 2020 £m |
2019 £m |
|||||||
| Cost of freehold land within freehold property on which no depreciation is provided |
251 | 261 | ||||||
| Contracts placed for future expenditure |
110 | 133 | ||||||
(b) Right-of-use assets
The Group leases various offices, warehouses, retail spaces, equipment and vehicles through its subsidiaries across the globe. Arrangements are entered into in the course of ordinary business, and lease terms are negotiated on an individual basis and contain a wide range of different terms and conditions reflecting local commercial practice. The lease agreements do not impose any covenants other than the security interests in the leased assets that are held by the lessor. Leased assets may not be used as security for borrowing purposes.
Assets representing ‘leasehold property’ relate to leases in respect of offices, retail space, warehouses and manufacturing facilities occupied by Group subsidiaries and include property leases with lease terms of more than five years in Japan, Brazil, Germany, Romania and Poland, amongst other countries. In addition, capitalised expenditure representing leasehold improvements is included in this category.
Assets representing ‘plant, equipment and other’ relate to leases of various assets including tobacco vending machines, industrial equipment and distribution vehicles in Japan, Russia, Romania, Brazil and other countries.
(c) Leasehold property
As of 31 December 2020, the Group holds £132 million (2019: £135 million) of leasehold properties acquired and another £351 million (2019: £421 million) of right-of-use leased properties.
| 2020 £m |
2019 £m |
|||||||||||||||||||||||
| Leasehold land and property comprises |
||||||||||||||||||||||||
| – net book value of long leasehold |
17 | 83 | ||||||||||||||||||||||
| – net book value of short leasehold |
466 | 473 | ||||||||||||||||||||||
| 483 | 556 | |||||||||||||||||||||||
| 2020 | ||||||||||||||||||||||||
| Leasehold property net book value movements for the year ended 31 December 2020 |
|
Net book value at 1 January £m |
|
|
Differences on exchange £m |
|
|
Depreciation and impairment £m |
|
|
Other net movements £m |
*
|
|
Net book value at 31 December £m |
| |||||||||
| – Property acquired (IAS16) |
135 | (6 | ) | (11 | ) | 14 | 132 | |||||||||||||||||
| – Right-of-use properties (IFRS16) |
421 | (19 | ) | (108 | ) | 57 | 351 | |||||||||||||||||
| 556 | (25 | ) | (119 | ) | 71 | 483 | ||||||||||||||||||
| 2019 | ||||||||||||||||||||||||
| Leasehold property net book value movements for the year ended 31 December 2019 |
|
Net book value at 1 January £m |
|
|
Accounting policy changes IFRS16 £m |
|
|
Differences on exchange £m |
|
|
Depreciation and impairment £m |
|
|
Other net movements £m |
*
|
|
Net book value at 31 December £m |
| ||||||
| – Property acquired (IAS16) |
139 | – | (7 | ) | (10 | ) | 13 | 135 | ||||||||||||||||
| – Right-of-use properties (IFRS16) |
– | 470 | (23 | ) | (106 | ) | 80 | 421 | ||||||||||||||||
| 139 | 470 | (30 | ) | (116 | ) | 93 | 556 | |||||||||||||||||
| * | Property acquired (IAS 16) other net movements represent additions (directly acquired and/or transferred from assets in the course of construction) net of disposals, whereas the right-of-use properties (IFRS 16) other net movements relates to new leases net of reassessments, modifications and terminations as reported in the Property, plant and equipment movement table in note 9(a). Other net movements also includes £1 million (2019: £4 million) in relation to acquired companies. |
|
Strategic Report |
Governance Report | Financial Statements | Other Information | BAT Annual Report and Form 20-F 2020 | 187 | |||||
|
|
10 Investments in Associates and Joint Ventures
| 2020 £m |
2019 £m |
|||||||
| 1 January |
1,860 | 1,737 | ||||||
| Total comprehensive income (note 5) |
323 | 390 | ||||||
| Dividends |
(394 | ) | (239 | ) | ||||
| Additions (note 23) |
5 | 8 | ||||||
| Other equity movements |
2 | (36 | ) | |||||
|
31 December |
1,796 | 1,860 | ||||||
| Non-current assets |
1,021 | 1,237 | ||||||
| Current assets |
1,155 | 1,085 | ||||||
| Non-current liabilities |
(61 | ) | (74 | ) | ||||
| Current liabilities |
(319 | ) | (388 | ) | ||||
| 1,796 | 1,860 | |||||||
| ITC Ltd. (Group’s share of the market value is £7,574 million (2019: £9,099 million)) |
1,724 | 1,794 | ||||||
| Other listed associates (Group’s share of the market value is £184 million (2019: £221 million)) |
26 | 22 | ||||||
| Unlisted associates |
46 | 44 | ||||||
| 1,796 | 1,860 | |||||||
The Group’s investment in Tisak d.d. (Tisak) was acquired as part of the TDR transaction (note 23). During 2016, the Group entered into an agreement with Tisak’s parent Agrokor d.d. (Agrokor) to convert certain outstanding trading balances into long-term loans and an additional shareholding in Tisak. As part of the agreement, Agrokor had the right to reacquire the additional shareholding in Tisak. As a consequence of this, while the Group had legal ownership of the additional shareholding, it did not consider that the shares provided any additional equity interest and continued to account for 26% of the equity of Tisak. In 2017, due to the financial difficulties of Agrokor and Tisak, the Group fully impaired this investment resulting in a charge of £27 million to the income statement in that year that was reported as an adjusting item. In July 2018, Agrokor’s creditors approved a settlement plan proposed by Agrokor’s administrators. The settlement plan has not returned any value to the Group and Tisak is expected to be liquidated in 2021.
The principal associate undertaking of the Group is ITC Ltd. (ITC). Included within the dividends amount of £394 million (2019: £239 million) are £386 million (2019: £231 million) attributable to dividends declared by ITC.
ITC Ltd.
ITC is an Indian conglomerate based in Kolkata and maintains a presence in cigarettes, hotels, paper and packaging, agri-business and other fast-moving goods (e.g. confectionery, branded apparel, personal care, stationery and safety matches). BAT’s interest in ITC is 29.42%.
ITC prepares accounts on a quarterly basis with a 31 March year-end. As permitted by IAS 28, results up to 30 September 2020 have been used in applying the equity method. This is driven by the availability of information at the half-year, to be consistent with the treatment in the Group’s interim accounts. Any further information available after the date used for reporting purposes is reviewed and any material items adjusted for in the final results. The latest published information available is at 31 December 2020.
| 2020 £m |
2019 £m |
|||||||
| Non-current assets |
3,399 | 4,124 | ||||||
| Current assets |
3,513 | 3,234 | ||||||
| Non-current liabilities |
(194 | ) | (237 | ) | ||||
| Current liabilities |
(858 | ) | (1,031 | ) | ||||
| 5,860 | 6,090 | |||||||
|
|
||||||||
| Group’s share of ITC Ltd. (2020: 29.42%; 2019: 29.46%) |
1,724 | 1,794 | ||||||
| 188 | BAT Annual Report and Form 20-F 2020 |
Financial Statements
Notes on Accounts
Continued
11 Retirement Benefit Schemes
The Group’s subsidiary undertakings operate defined benefit and defined contribution schemes including post-retirement healthcare schemes. Benefits provided through defined contribution schemes are charged as an expense as payments fall due.
The liabilities arising in respect of defined benefit schemes are determined in accordance with the advice of independent, professionally qualified actuaries, using the projected unit credit method. It is Group policy that all schemes are formally valued at least every three years.
The principal schemes are in the US, UK, Germany, Canada, Netherlands and Switzerland. Together, schemes in these territories account for around 95% of the total underlying obligations of the Group’s defined benefit pension arrangements. These obligations consist mainly of final salary pension schemes which provide benefits to members in the form of a guaranteed level of pension payable for life. The level of benefits provided depends on members’ length of service and their salary in the final years leading up to retirement. In addition, the Group operates several healthcare benefits schemes, of which the most significant are in the US and Canada. The liabilities in respect of healthcare benefits are also assessed by qualified independent actuaries, applying the projected unit credit method.
All of these arrangements, including funded schemes where formal trusts or equivalents are required, have been developed and are operated in accordance with local practices and regulations where applicable in the countries concerned. For example, in the US, the main funded pension plans are the Reynolds American Retirement Plan (‘PEP’) and the Retirement Income Plan for Certain RAI Affiliates (‘Affiliates’), and the only funded healthcare scheme is the Brown & Williamson Tobacco Corporation Welfare & Fringe Benefit Plan, all of which are established with corporate trustees that are required to run the plans in accordance with the plan’s rules and to comply with all relevant legislation, including the Employee Retirement Income Security Act of 1974. Similarly, in the UK, the main pension arrangement is the British American Tobacco UK Pension Fund (UK Fund), which is established under trust law and has a corporate trustee that is required to run the scheme in accordance with the Fund’s Trust Deed and Rules and to comply with the Pension Scheme Act 1993, Pensions Act 1995, Pensions Act 2004 and all other relevant legislation. With effect from 1 July 2020, the UK Fund was closed to further accrual of benefits with all active members becoming deferred members of the fund. No incentives or compensation was provided to affected employees. A past service credit was recognised on the difference between the salary increase assumption for active members and the inflation assumption for deferred members at the date of the plan amendment and curtailment of benefits.
Responsibility for the governance of the schemes across the Group, including investment decisions and contribution schedules, generally lies with the trustees. The trustees for each arrangement will usually consist of representatives appointed by both the sponsoring company and the beneficiaries. In the US, the corporate trustees act as custodians with a committee of local management acting in a fiduciary capacity with regard to investment decisions, risk mitigation and administration of the arrangements.
The majority of schemes are subject to local regulations regarding funding requirements. Contributions to defined benefit schemes are determined after consultation with the respective trustees and actuaries of the individual externally funded schemes, and after taking into account regulatory requirements in each territory. The Group’s contributions to funded retirement benefit schemes in 2021 in total are expected to be £81 million compared to £103 million in 2020.
Contributions to the various funded plans in the US are agreed with the named fiduciary, scheme actuaries and the committee of local management after taking account of statutory requirements including the Pension Protection Act of 2006, as amended. Through its US subsidiaries, the Group may make significant contributions, either as required by statutory requirements or at the discretion of the Group, with the aim of maintaining a funding status of at least 90% and becoming fully funded long-term. During 2020, the Group did not contribute to its funded pension and post-retirement plans in the US and does not expect to do so in 2021. By the end of 2020, the PEP and Affiliates plans referred to above were each reporting a surplus under IAS 19 (£113 million and £119 million, respectively). Under the rules of these plans, any surplus would be returnable to the Group in the event of a termination or could otherwise be repurposed for other existing or replacement benefit plans and accordingly no surplus restrictions have been recognised.
With effect from July 2018, contributions to the UK Fund, as agreed with the Trustee to meet the cost of future benefit accrual, were £18 million per annum. Additional annual contributions to cover funding shortfalls were payable as required until the Fund was valued to 110% on a Technical Provisions basis. These were £12 million in 2020, and £12 million in each of 2019 and 2018. Total contributions payable to the UK Fund were secured by a charge over the Group’s Head Office (Globe House) up to a maximum of £150 million. Following the completion of the 2020 triennial valuation noted below, the Trustee agreed to release the charge over Globe House. The UK Fund closed to future accrual for current employees with effect from 1 July 2020. Consequently, the Trustee and the Group agreed to reduce the 2020 contribution payment for future service from £18 million to £9 million to reflect this. An interim Schedule of Contributions dated 15 July 2020 was put in place in order to give effect to this until the formal valuation of the Fund had been completed.
The formal triennial actuarial valuation of the Fund was carried out with an effective date of 31 March 2020. This showed that the Fund had a surplus of £139 million on a Technical Provisions basis, in accordance with the statutory funding objective. The Trustee also has a Long-Term Funding Target to be fully funded on a Solvency Liabilities basis by 2026, and on this basis the Fund had a surplus of £7 million at the valuation date. The Trustee and the Group agreed a new Schedule of Contributions with an effective date of 5 October 2020 such that the Group will pay £12 million per annum from July 2021 until July 2023. Under the rules of the scheme, any future surplus would be returnable to the Group by refund at the end of the life of the scheme. The funding commitment is therefore not considered onerous, and in accordance with IFRIC 14 no additional liabilities or surplus restrictions have been recognised in respect of these commitments.
Payments made to pensioners by the operating companies in Germany, net of income on scheme assets, are deemed to be company contributions to the Contractual Trust Arrangements and are anticipated to be around £33 million in 2021 and the same amount for the four years after that. Contributions to pension schemes in Canada, Netherlands and Switzerland in total are anticipated to be around £20 million in 2021 and then around £10 million per annum for the four years after that.
|
Strategic Report |
Governance Report | Financial Statements | Other Information | BAT Annual Report and Form 20-F 2020 | 189 | |||||
|
|
11 Retirement Benefit Schemes Continued
The majority of benefit payments are from trustee administered funds, however, there are also a number of unfunded schemes where the sponsoring company meets the benefit payment obligation as it falls due, including UK based Defined Benefit and Defined Contribution Unapproved Unfunded Retirement Benefit Schemes (DB UURBS and DC UURBS respectively). The DC UURBS credits accrued in the year are increased in line with the Company’s Weighted Average Cost of Debt and the scheme is therefore treated as a defined benefit scheme under IAS 19. For unfunded schemes in the US, UK and Canada, 39% of the liabilities reported at year-end are expected to be settled by the Group within 10 years, 28% between 10 and 20 years, 18% between 20 and 30 years, and 15% thereafter.
The funded arrangements in the Group have policies on investment management, including strategies over a preferred long-term investment profile, and schemes in certain territories including Canada and Netherlands manage their bond portfolios to match the weighted average duration of scheme liabilities.
For funded plans in the US, the Group employs a risk mitigation strategy which seeks to balance pension plan returns with a reasonable level of funded status volatility. Based on this framework, the asset allocation has two primary components. The first component is the hedging portfolio, which uses extended duration fixed income holdings (typically US Government and investment grade corporate bonds) and, to a lesser extent, derivatives to match a portion of the interest rate risk associated with the benefit obligations, thereby reducing expected funded status volatility. The second component is the return-seeking portfolio, which is designed to enhance portfolio returns. The return-seeking portfolio is broadly diversified across asset classes.
On 31 May 2019, the Trustee of the UK Fund entered into an agreement with Pension Insurance Corporation plc (PIC) to acquire an insurance policy that operates as a UK Fund investment asset, with the intent of matching a specific part of the UK Fund’s future cash flow arising from the accrued pension liabilities of retired and deferred members. Such an arrangement, commonly referred to as a ‘buy-in’, has reduced the UK Fund’s value at risk in relation to key risks associated with improved longevity, inflation and interest rate movements while improving the security to the UK Fund and its members. On an IAS 19 basis, the fair value of the insurance policy matches the present value of the liabilities being insured. On completion of the transaction, a loss of £691 million was recognised through the statement of other comprehensive income on the revaluation of the insurance asset.
For the residual assets in the UK Fund, the current allocation is broadly split as 75% in risk reducing assets and 25% in return seeking assets. The return seeking portfolio is invested in illiquid assets which, in the normal course of events, will wind down naturally over time, with their value being realised as the investments mature. This is consistent with the Trustee’s ultimate target which is to be 100% invested in risk reducing assets or matching assets. Given the strong funding position of the UK Fund as shown in the 31 March 2020 Actuarial valuation, the Trustee will continue to review the investment strategy and may look to increase the proportion of risk-reducing or matching assets, commensurate with their ultimate target to further reduce the UK Fund’s exposure to the key risk above.
Through its defined benefit pension schemes and healthcare benefit schemes, the Group is exposed to a number of risks, including:
Asset volatility:
The plan liabilities are calculated using discount rates set by reference to bond yields. If plan assets underperform this yield, e.g. due to stock market volatility, this will create a deficit. However, most schemes hold a proportion of assets which are expected to outperform bonds in the long term, and the majority of schemes by value are subject to local regulation regarding funding deficits.
Changes in bond yields:
A decrease in corporate bond yields will increase scheme liabilities, although this will be partially offset by an increase in the value of the schemes’ bond holdings or other hedging instruments.
Inflation risk:
Some of the Group’s pension obligations are linked to inflation and higher inflation will lead to higher liabilities, although in most cases, caps on the level of inflationary increases are in place in the scheme rules, while some assets and derivatives provide specific inflation protection.
Life expectancy:
The majority of the schemes’ obligations are to provide benefits for the life of the member, so increases in life expectancy will result in an increase in the plans’ liabilities. Assumptions regarding mortality and mortality improvements are regularly reviewed in line with actuarial tables and scheme specific experience.
| 190 | BAT Annual Report and Form 20-F 2020 |
Financial Statements
Notes on Accounts
Continued
11 Retirement Benefit Schemes Continued
The amounts recognised in the balance sheet are determined as follows:
| Pension schemes | Healthcare schemes | Total | ||||||||||||||||||||||
|
2020 £m |
2019 £m |
2020 £m |
2019 £m |
2020 £m |
2019 £m |
|||||||||||||||||||
| Present value of funded scheme liabilities |
(11,970 | ) | (11,454 | ) | (253 | ) | (272 | ) | (12,223 | ) | (11,726 | ) | ||||||||||||
| Fair value of funded scheme assets |
12,403 | 11,682 | 173 | 178 | 12,576 | 11,860 | ||||||||||||||||||
| 433 | 228 | (80 | ) | (94 | ) | 353 | 134 | |||||||||||||||||
| Unrecognised funded scheme surpluses |
(16 | ) | (28 | ) | – | – | (16 | ) | (28 | ) | ||||||||||||||
| 417 | 200 | (80 | ) | (94 | ) | 337 | 106 | |||||||||||||||||
| Present value of unfunded scheme liabilities |
(602 | ) | (578 | ) | (545 | ) | (557 | ) | (1,147 | ) | (1,135 | ) | ||||||||||||
| (185 | ) | (378 | ) | (625 | ) | (651 | ) | (810 | ) | (1,029 | ) | |||||||||||||
| The above net (liability)/asset is recognised in the balance sheet as follows: |
|
|||||||||||||||||||||||
| – retirement benefit scheme liabilities |
(897 | ) | (807 | ) | (627 | ) | (652 | ) | (1,524 | ) | (1,459 | ) | ||||||||||||
| – retirement benefit scheme assets |
712 | 429 | 2 | 1 | 714 | 430 | ||||||||||||||||||
| (185 | ) | (378 | ) | (625 | ) | (651 | ) | (810 | ) | (1,029 | ) | |||||||||||||
| The net liabilities of funded pension schemes by territory are as follows:
|
| |||||||||||||||||||||||
| Liabilities | Assets | Total | ||||||||||||||||||||||
| 2020 £m |
2019 £m |
2020 £m |
2019 £m |
2020 £m |
2019 £m |
|||||||||||||||||||
| – US |
(5,012 | ) | (4,945 | ) | 5,144 | 4,818 | 132 | (127 | ) | |||||||||||||||
| – UK |
(3,485 | ) | (3,214 | ) | 3,866 | 3,533 | 381 | 319 | ||||||||||||||||
| – Germany |
(1,035 | ) | (958 | ) | 918 | 928 | (117 | ) | (30 | ) | ||||||||||||||
| – Canada |
(756 | ) | (738 | ) | 758 | 747 | 2 | 9 | ||||||||||||||||
| – Netherlands |
(873 | ) | (778 | ) | 893 | 814 | 20 | 36 | ||||||||||||||||
| – Switzerland |
(348 | ) | (333 | ) | 312 | 294 | (36 | ) | (39 | ) | ||||||||||||||
| – Rest of Group |
(461 | ) | (488 | ) | 512 | 548 | 51 | 60 | ||||||||||||||||
| Funded schemes |
(11,970 | ) | (11,454 | ) | 12,403 | 11,682 | 433 | 228 | ||||||||||||||||
|
Of the Group’s unfunded pension schemes 54% (2019: 50%) relate to arrangements in the UK and 32% (2019: 32%) relate to arrangements in the US, while 85% (2019: 86%) of the Group’s unfunded healthcare arrangements relate to arrangements in the US.
The amounts recognised in the income statement are as follows:
|
| |||||||||||||||||||||||
| Pension schemes | Healthcare schemes | Total | ||||||||||||||||||||||
| 2020 £m |
2019 £m |
2020 £m |
2019 £m |
2020 £m |
2019 £m |
|||||||||||||||||||
| Defined benefit schemes |
||||||||||||||||||||||||
| Service cost |
||||||||||||||||||||||||
| – current service cost |
72 | 92 | 2 | 2 | 74 | 94 | ||||||||||||||||||
| – past service (credit)/cost, curtailments and settlements |
(12 | ) | 7 | – | – | (12 | ) | 7 | ||||||||||||||||
| Net interest on the net defined benefit liability |
||||||||||||||||||||||||
| – interest on scheme liabilities |
300 | 391 | 27 | 34 | 327 | 425 | ||||||||||||||||||
| – interest on scheme assets |
(289 | ) | (388 | ) | (7 | ) | (8 | ) | (296 | ) | (396 | ) | ||||||||||||
| – interest on unrecognised funded scheme surpluses |
1 | – | – | – | 1 | – | ||||||||||||||||||
| 72 | 102 | 22 | 28 | 94 | 130 | |||||||||||||||||||
| Defined contribution schemes |
88 | 97 | – | – | 88 | 97 | ||||||||||||||||||
| Total amount recognised in the income statement (note 3(a)) |
160 | 199 | 22 | 28 | 182 | 227 | ||||||||||||||||||
The above charges are recognised within employee benefit costs in note 3(a) and include a charge of £10 million in 2020 (2019: £16 million) in respect of settlements, past service costs and defined contribution costs reported as part of the restructuring costs charged in arriving at profit from operations (note 3(e)). Included in current service cost in 2020 is £16 million (2019: £21 million) of administration costs. Current service cost is stated after netting employee contributions, where applicable.
|
Strategic Report |
Governance Report | Financial Statements | Other Information | BAT Annual Report and Form 20-F 2020 | 191 | |||||
|
|
11 Retirement Benefit Schemes Continued
The movements in scheme liabilities are as follows:
| Pension schemes | Healthcare schemes | Total | ||||||||||||||||||||||
| |
2020 £m |
|
|
2019 £m |
|
|
2020 £m |
|
|
2019 £m |
|
|
2020 £m |
|
|
2019 £m |
| |||||||
| Present value at 1 January |
12,032 | 11,562 | 829 | 861 | 12,861 | 12,423 | ||||||||||||||||||
| Differences on exchange |
(106 | ) | (343 | ) | (23 | ) | (30 | ) | (129 | ) | (373 | ) | ||||||||||||
| Current service cost |
72 | 94 | 2 | 2 | 74 | 96 | ||||||||||||||||||
| Past service cost/(credit) & settlements |
(58 | ) | 7 | – | – | (58 | ) | 7 | ||||||||||||||||
| Interest on scheme liabilities |
300 | 391 | 27 | 34 | 327 | 425 | ||||||||||||||||||
| Contributions by scheme members |
1 | – | – | – | 1 | – | ||||||||||||||||||
| Benefits paid |
(737 | ) | (743 | ) | (58 | ) | (63 | ) | (795 | ) | (806 | ) | ||||||||||||
| Actuarial (gains)/losses |
||||||||||||||||||||||||
| – arising from changes in demographic assumptions |
26 | (84 | ) | (7 | ) | (10 | ) | 19 | (94 | ) | ||||||||||||||
| – arising from changes in financial assumptions |
1,032 | 1,105 | 59 | 70 | 1,091 | 1,175 | ||||||||||||||||||
| Experience gains |
10 | 43 | (31 | ) | (35 | ) | (21 | ) | 8 | |||||||||||||||
| Present value at 31 December |
12,572 | 12,032 | 798 | 829 | 13,370 | 12,861 | ||||||||||||||||||
|
Changes in financial assumptions principally relate to discount rate movements in both years.
Scheme liabilities by scheme membership:
|
| |||||||||||||||||||||||
| Pension schemes | Healthcare schemes | Total | ||||||||||||||||||||||
| 2020 £m |
2019 £m |
2020 £m |
2019 £m |
2020 £m |
2019 £m |
|||||||||||||||||||
| Active members |
1,305 | 1,895 | 54 | 59 | 1,359 | 1,954 | ||||||||||||||||||
| Deferred members |
1,897 | 1,308 | 2 | 2 | 1,899 | 1,310 | ||||||||||||||||||
| Retired members |
9,370 | 8,829 | 742 | 768 | 10,112 | 9,597 | ||||||||||||||||||
| Present value at 31 December |
12,572 | 12,032 | 798 | 829 | 13,370 | 12,861 | ||||||||||||||||||
|
Approximately 95% of scheme liabilities in both years relate to guaranteed benefits.
The movements in funded scheme assets are as follows:
|
| |||||||||||||||||||||||
| Pension schemes | Healthcare schemes | Total | ||||||||||||||||||||||
| 2020 £m |
2019 £m |
2020 £m |
2019 £m |
2020 £m |
2019 £m |
|||||||||||||||||||
| Fair value of scheme assets at 1 January |
11,682 | 11,747 | 178 | 178 | 11,860 | 11,925 | ||||||||||||||||||
| Differences on exchange |
(117 | ) | (326 | ) | (7 | ) | (6 | ) | (124 | ) | (332 | ) | ||||||||||||
| Settlements |
(45 | ) | – | – | – | (45 | ) | – | ||||||||||||||||
| Interest on scheme assets |
289 | 388 | 7 | 8 | 296 | 396 | ||||||||||||||||||
| Company contributions |
103 | 82 | – | – | 103 | 82 | ||||||||||||||||||
| Contributions by scheme members |
3 | 3 | – | – | 3 | 3 | ||||||||||||||||||
| Benefits paid |
(696 | ) | (704 | ) | (15 | ) | (17 | ) | (711 | ) | (721 | ) | ||||||||||||
| Actuarial gains/(losses) |
1,184 | 492 | 10 | 15 | 1,194 | 507 | ||||||||||||||||||
| Fair value of scheme assets at 31 December |
12,403 | 11,682 | 173 | 178 | 12,576 | 11,860 | ||||||||||||||||||
| Pension schemes | Healthcare schemes | Total | ||||||||||||||||||||||
| 2020 £m |
2019 £m |
2020 £m |
2019 £m |
2020 £m |
2019 £m |
|||||||||||||||||||
| Equities – listed |
1,259 | 1,221 | 5 | 7 | 1,264 | 1,228 | ||||||||||||||||||
| Equities – unlisted |
992 | 1,025 | 68 | 68 | 1,060 | 1,093 | ||||||||||||||||||
| Bonds – listed |
2,432 | 2,739 | 5 | 7 | 2,437 | 2,746 | ||||||||||||||||||
| Bonds – unlisted |
3,163 | 2,417 | 73 | 74 | 3,236 | 2,491 | ||||||||||||||||||
| Other assets – listed |
202 | 549 | 13 | 13 | 215 | 562 | ||||||||||||||||||
| Other assets – unlisted |
4,355 | 3,731 | 9 | 9 | 4,364 | 3,740 | ||||||||||||||||||
| Fair value of scheme assets at 31 December |
12,403 | 11,682 | 173 | 178 | 12,576 | 11,860 | ||||||||||||||||||
Scheme assets have been diversified into equities, bonds and other assets and are typically invested via fund investment managers into both pooled and segregated mandates of listed and unlisted equities and bonds.
| 192 | BAT Annual Report and Form 20-F 2020 |
Financial Statements
Notes on Accounts
Continued
11 Retirement Benefit Schemes Continued
In the above analysis investments via equity-based investment funds are shown under listed equities, and investments via bond-based investment funds are shown under listed bonds. Other assets include insurance contracts, cash and other deposits, derivatives and other hedges, recoverable taxes, infrastructure investments and investment property.
In the US, pension plan assets are invested using active investment strategies and multiple investment management firms.
Managers within each asset class cover a range of investment styles and approaches. Allowable investment types include global equity, fixed income, real assets, private equity and absolute return. The range of allowable investment types utilised for pension assets provides enhanced returns and more widely diversifies the plan.
The UK Fund historically has diversified a portion of the assets held by investing in equities listed on non-UK stock exchanges via investment funds, and by making use of liability driven investment funds and inflation opportunity funds as part of its investment portfolio. As noted above, during 2019 the Trustee acquired an insurance policy that operates as a UK Fund investment asset in a ‘buy-in’ transaction. The residual assets now predominantly consist of liability driven investments and absolute return funds as well as a proportion of illiquid investments, such as private equity and infrastructure investments.
The actuarial gains and losses in both years principally relate to movements in the fair values of scheme assets and actual returns are stated net of applicable taxes and fund management fees. The fair values of listed scheme assets were derived from observable data including quoted market prices and other market data, including market values of individual segregated investments and of pooled investment funds where quoted. The fair values of unlisted assets were derived from cash flow projections of estimated future income after taking into account the estimated recoverable value of these assets.
The movements in the unrecognised scheme surpluses, recognised in other comprehensive income, are as follows:
| Pension schemes | Healthcare schemes | Total | ||||||||||||||||||||||||||||||||||
|
2020 £m |
2019 £m |
2018 £m |
2020 £m |
2019 £m |
2018 £m |
2020 £m |
2019 £m |
2018 £m |
||||||||||||||||||||||||||||
| Unrecognised funded scheme surpluses at 1 January | (28 | ) | (20 | ) | (23 | ) | – | – | – | (28 | ) | (20 | ) | (23 | ) | |||||||||||||||||||||
| Differences on exchange | 3 | (1 | ) | 1 | – | – | – | 3 | (1 | ) | 1 | |||||||||||||||||||||||||
| Interest on unrecognised funded scheme surpluses | (1 | ) | – | (2 | ) | – | – | – | (1 | ) | – | (2 | ) | |||||||||||||||||||||||
| Movement in year (note 18) | 10 | (7 | ) | 4 | – | – | – | 10 | (7 | ) | 4 | |||||||||||||||||||||||||
| Unrecognised funded scheme surpluses at 31 December | (16 | ) | (28 | ) | (20 | ) | – | – | – | (16 | ) | (28 | ) | (20 | ) | |||||||||||||||||||||
The principal actuarial assumptions (weighted to reflect individual scheme differences) used in the following territories are shown below. In both years, discount rates are determined by reference to normal yields on high quality corporate bonds at the balance sheet date.
| 2020 | 2019 | |||||||||||||||||||||||||||||||||||||||||||||||
| US | UK | Germany | Canada | Netherlands | Switzerland | US | UK | Germany | Canada | Netherlands | Switzerland | |||||||||||||||||||||||||||||||||||||
| Rate of increase in salaries (%) | 3.4 | – | 2.5 | 3.0 | 2.1 | 1.1 | 3.4 | 3.0 | 0.6 | 3.0 | 2.1 | 1.3 | ||||||||||||||||||||||||||||||||||||
| Rate of increase in pensions in payment (%) | 2.5 | 3.0 | 1.5 | Nil | 0.9 | Nil | 2.5 | 3.0 | 0.4 | Nil | 0.9 | Nil | ||||||||||||||||||||||||||||||||||||
| Rate of increase in deferred pensions (%) | – | 2.2 | 1.5 | Nil | 0.9 | – | – | 2.2 | 0.4 | Nil | 0.9 | – | ||||||||||||||||||||||||||||||||||||
| Discount rate (%) | 2.6 | 1.4 | 0.9 | 2.3 | 0.5 | – | 3.3 | 2.0 | 0.3 | 3.0 | 1.1 | 0.1 | ||||||||||||||||||||||||||||||||||||
| General inflation (%) | 2.5 | 3.0 | 1.5 | 2.0 | 2.0 | 0.9 | 2.5 | 3.0 | 0.4 | 2.0 | 2.0 | 1.1 | ||||||||||||||||||||||||||||||||||||
| 2020 | 2019 | |||||||||||||||||||||||||||||||||||||||||||||||
| US | UK | Germany | Canada | Netherlands | Switzerland | US | UK | Germany | Canada | Netherlands | Switzerland | |||||||||||||||||||||||||||||||||||||
| Weighted average duration of liabilities (years) | 11.6 | 17.0 | 14.0 | 11.0 | 18.0 | 13.4 | 11.4 | 16.1 | 14.0 | 11.0 | 17.8 | 13.9 | ||||||||||||||||||||||||||||||||||||
For healthcare inflation in the US, the assumption is 6.0% for 2020 (2019: 6.5%) and in Canada, the assumption is 5.0% for both years.
|
Strategic Report |
Governance Report | Financial Statements | Other Information | BAT Annual Report and Form 20-F 2020 | 193 | |||||
|
|
11 Retirement Benefit Schemes Continued
Mortality assumptions are subject to regular review. The principal schemes used the following tables:
| US | PRI-2012 mortality tables without collar or amount, projected with MP-2020 generational projection (2019: RP-2019 and MP-2019) | |
| UK | S2PA (YOB) with the CMI (2019) improvement model with a 1.25% long-term improvement rate (2019: CMI (2018)) | |
| Germany | RT Heubeck 2018 G (both years) | |
| Canada | CPM-2014 Private Table (both years) | |
| Netherlands | AG Prognosetafel 2020 (2019: AG Prognosetafel 2018) | |
| Switzerland | LPP/BVG 2015 base table with CMI projection factors for mortality improvements with a 1.5% long-term improvement rate (both years) | |
Based on the above, the weighted average life expectancy, in years, for mortality tables used to determine benefit obligations is as follows:
| US | UK | Germany | Canada | Netherlands | Switzerland | |||||||||||||||||||||||||||||||||||||||||||
| Male | Female | Male | Female | Male | Female | Male | Female | Male | Female | Male | Female | |||||||||||||||||||||||||||||||||||||
| 31 December 2020 | ||||||||||||||||||||||||||||||||||||||||||||||||
| Member age 65 (current life expectancy) | 20.4 | 22.4 | 22.8 | 24.1 | 18.3 | 23.8 | 21.6 | 24.0 | 20.6 | 24.0 | 21.9 | 23.9 | ||||||||||||||||||||||||||||||||||||
| Member age 45 (life expectancy at age 65) | 21.9 | 23.8 | 24.5 | 25.9 | 23.1 | 26.0 | 22.6 | 24.9 | 22.7 | 25.7 | 23.8 | 25.8 | ||||||||||||||||||||||||||||||||||||
| 31 December 2019 | ||||||||||||||||||||||||||||||||||||||||||||||||
| Member age 65 (current life expectancy) | 20.6 | 22.6 | 22.4 | 23.9 | 20.2 | 23.7 | 21.6 | 23.9 | 21.0 | 24.3 | 21.8 | 23.8 | ||||||||||||||||||||||||||||||||||||
| Member age 45 (life expectancy at age 65) | 22.2 | 24.1 | 24.0 | 25.2 | 23.0 | 25.9 | 22.6 | 24.9 | 23.4 | 26.3 | 23.7 | 25.7 | ||||||||||||||||||||||||||||||||||||
For the remaining territories, typical assumptions are that real salary increases will be from 0% to 9.0% (2019: 0% to 5.0%) per annum and discount rates will be from 0% to 12.0% (2019: 0% to 11.7%) above inflation. Pension increases, where allowed for, are generally assumed to be in line with inflation. Assumptions of life expectancy are in line with best practice in each territory. For countries where there is not a deep market in such corporate bonds, the yield on government bonds is used.
The valuation of retirement benefit schemes involves judgements about uncertain future events. Sensitivities in respect of the key assumptions used to measure the principal pension schemes as at 31 December 2020 are set out below. These sensitivities show the hypothetical impact of a change in each of the listed assumptions in isolation, with the exception of the sensitivity to inflation which incorporates the impact of certain correlating assumptions such as salary increases. While each of these sensitivities holds all other assumptions constant, in practice such assumptions rarely change in isolation, while asset values also change, and the impacts may offset to some extent.
| 1 year increase £m |
1 year decrease £m |
0.25 percentage point increase £m |
0.25 decrease £m |
|||||||||||||
| Average life expectancy – increase/(decrease) of scheme liabilities |
343 | (339 | ) | |||||||||||||
| Rate of inflation – increase/(decrease) of scheme liabilities |
209 | (196 | ) | |||||||||||||
| Discount rate – (decrease)/increase of scheme liabilities |
(388 | ) | 411 | |||||||||||||
A one percentage point increase in healthcare inflation would increase healthcare scheme liabilities by £41 million, and a one percentage point decrease would decrease liabilities by £32 million. The income statement effect of this change in assumption is not material.
| 194 | BAT Annual Report and Form 20-F 2020 |
Financial Statements
Notes on Accounts
Continued
12 Deferred Tax
Net deferred tax (liabilities)/assets comprise:
| Stock relief £m |
Excess of capital allowances over depreciation £m |
Tax losses £m |
Undistributed earnings of associates and subsidiaries £m |
Retirement benefits £m |
Trademarks £m |
Other temporary differences £m |
Total £m |
|||||||||||||||||||||||||
| 1 January 2020 | (45 | ) | (208 | ) | 79 | (318 | ) | 279 | (17,408 | ) | 995 | (16,626 | ) | |||||||||||||||||||
| Differences on exchange | 4 | 13 | (3 | ) | 8 | – | 528 | (44 | ) | 506 | ||||||||||||||||||||||
| Credited/(charged) to the income statement | 28 | (6 | ) | (21 | ) | (18 | ) | (12 | ) | 75 | 138 | 184 | ||||||||||||||||||||
| Credited relating to changes in tax rates | – | 12 | 3 | 97 | – | 21 | – | 133 | ||||||||||||||||||||||||
| Credited to other comprehensive income | – | – | – | – | (21 | ) | – | 44 | 23 | |||||||||||||||||||||||
| 31 December 2020 | (13 | ) | (189 | ) | 58 | (231 | ) | 246 | (16,784 | ) | 1,133 | (15,780 | ) | |||||||||||||||||||
| 1 January 2019 | (70 | ) | (210 | ) | 105 | (281 | ) | 222 | (18,246 | ) | 1,048 | (17,432 | ) | |||||||||||||||||||
| Differences on exchange | 4 | 11 | (2 | ) | 15 | (9 | ) | 701 | (40 | ) | 680 | |||||||||||||||||||||
| Subsidiaries acquired (note 23) | – | – | – | – | – | (4 | ) | – | (4 | ) | ||||||||||||||||||||||
| Credited/(charged) to the income statement | 21 | (9 | ) | (24 | ) | (52 | ) | (15 | ) | 92 | (68 | ) | (55 | ) | ||||||||||||||||||
| (Charged)/credited relating to changes in tax rates | – | – | – | – | (1 | ) | 49 | (1 | ) | 47 | ||||||||||||||||||||||
| Credited to other comprehensive income | – | – | – | – | 82 | – | 56 | 138 | ||||||||||||||||||||||||
| 31 December 2019 | (45 | ) | (208 | ) | 79 | (318 | ) | 279 | (17,408 | ) | 995 | (16,626 | ) | |||||||||||||||||||
The net deferred tax liabilities are reflected in the Group balance sheet as follows: deferred tax asset of £534 million and deferred tax liability of £16,314 million (2019: deferred tax asset of £424 million and deferred tax liability of £17,050 million), after offsetting assets and liabilities where there is a legally enforceable right to offset current tax assets and liabilities and where the deferred income taxes relate to the same fiscal authority.
At the balance sheet date, the Group has not recognised a deferred tax asset in respect of unused tax losses of £342 million (2019: £342 million) which have no expiry date and unused tax losses of £458 million (2019: £208 million) which will expire within the next 20 years.
In 2020 and 2019 the Group has not recognised any deferred tax asset in respect of deductible temporary differences which have no expiry date and has not recognised £173 million (2019: £92 million) in respect of deductible temporary differences which will expire within the next 10 years.
At the balance sheet date, the Group has unused tax credits of £80 million (2019: £80 million) which have no expiry date. No amount of deferred tax has been recognised in respect of these unused tax credits.
At the balance sheet date, the aggregate amount of undistributed earnings of subsidiaries which would be subject to dividend withholding tax and for which no withholding tax liability has been recognised was £0.6 billion (2019: £0.6 billion).
|
Strategic Report |
Governance Report | Financial Statements | Other Information | BAT Annual Report and Form 20-F 2020 | 195 | |||||
|
|
13 Trade and Other Receivables
| 2020 £m |
2019 £m |
|||||||
| Trade receivables |
2,763 | 3,369 | ||||||
| Loans and other receivables |
696 | 629 | ||||||
| Prepayments and accrued income |
504 | 343 | ||||||
| 3,963 | 4,341 | |||||||
| Current |
3,721 | 4,093 | ||||||
| Non-current |
242 | 248 | ||||||
| 3,963 | 4,341 | |||||||
The majority of receivables are held in order to collect contractual cash flows, in accordance with the Group’s business model for managing financial assets, and hence are measured at amortised cost. In certain countries, however, the Group has entered into factoring arrangements and periodically sells certain trade receivables to banks and other financial institutions, without recourse, for cash. These trade receivables have been derecognised from the statement of financial position to reflect the transfer by the Group of substantially all of the risks and rewards of the receivables, including credit risk. Consequently, the cash inflows have been recognised within operating cash flows. Typically in these arrangements, the Group also acts as a collection agent for the bank. At 31 December 2020, the value of trade receivables derecognised through the factoring arrangements where the Group acts as a collection agent was £600 million (2019: £572 million) and where the Group does not act as a collection agent was £25 million (2019: £26 million). Included in trade receivables above is £205 million (2019: £295 million) of trade debtor balances which were available for factoring under these arrangements.
Included in loans and other receivables are £78 million of litigation related deposits (2019: £110 million). Management has determined that these payments represent a resource controlled by the entity, as a result of past events and from which future economic benefits are expected to flow to the entity either by being recoverable on conclusion of ongoing appeal processes or by reducing amounts payable on recognition of liabilities which have yet to be determined should the appeal process fail. These deposits are held at the fair value of consideration transferred less impairment, if applicable. The effect of discounting would be immaterial.
Prepayments and accrued income include £8 million (2019: £5 million) of accrued income primarily in relation to rebates.
Amounts receivable from related parties including associated undertakings are shown in note 26.
Trade and other receivables have been reported in the balance sheet net of allowances as follows:
| 2020 £m |
2019 £m |
|||||||
| Trade receivables – gross |
2,804 | 3,396 | ||||||
| Trade receivables – allowance |
(41 | ) | (27 | ) | ||||
| Loans and other receivables – gross |
696 | 639 | ||||||
| Loans and other receivables – allowance |
– | (10 | ) | |||||
| Prepayments and accrued income |
504 | 343 | ||||||
| Net trade and other receivables per balance sheet |
3,963 | 4,341 | ||||||
| 196 | BAT Annual Report and Form 20-F 2020 |
Financial Statements
Notes on Accounts
Continued
13 Trade and Other Receivables Continued
The movements in the allowance account are as follows:
| 2020 | 2019 | |||||||||||||||||||||||||
| Trade receivables £m |
Loans and other receivables £m |
Total £m |
Trade receivables £m |
Loans and other |
Total £m |
|||||||||||||||||||||
| 1 January |
27 | 10 | 37 | 30 | 10 | 40 | ||||||||||||||||||||
| Differences on exchange |
(2 | ) | – | (2 | ) | (2 | ) | – | (2 | ) | ||||||||||||||||
| Provided in the year |
31 | – | 31 | 24 | – | 24 | ||||||||||||||||||||
| Released |
(15 | ) | (10 | ) | (25 | ) | (25 | ) | – | (25 | ) | |||||||||||||||
|
31 December |
41 | – | 41 | 27 | 10 | 37 | ||||||||||||||||||||
As permitted by IFRS 9, the loss allowance on trade receivables arising from the recognition of revenue under IFRS 15 is initially measured at an amount equal to lifetime expected losses. Allowances in respect of loans and other receivables are initially recognised at an amount equal to 12-month expected credit losses. Allowances are measured at an amount equal to the lifetime expected credit losses where the credit risk on the receivables increases significantly after initial recognition.
The Group holds bank guarantees, other guarantees and credit insurance in respect of some of the past due debtor balances.
Trade and other receivables are predominantly denominated in the functional currencies of subsidiary undertakings apart from the following: US dollar: 2.6% (2019: 4.2%), UK sterling: 0.1% (2019: 0.2%), Euro: 0.4% (2019: 1.1%) and other currencies: 1.7% (2019: 11.2%).
There is no material difference between the above amounts for trade and other receivables and their fair value due to the short-term duration of the majority of trade and other receivables as determined using discounted cash flow analysis. There is no concentration of credit risk with respect to trade receivables as the Group has a large number of internationally dispersed customers.
14 Investments Held at Fair Value
| 2020 £m |
2019 £m |
|||||||
| Investments |
||||||||
| Fair value through P&L |
255 | 127 | ||||||
| Fair value through OCI |
9 | 8 | ||||||
| 264 | 135 | |||||||
| Current |
242 | 123 | ||||||
| Non-current |
22 | 12 | ||||||
| 264 | 135 | |||||||
Investments held at fair value through other comprehensive income (OCI) relate to the Group’s corporate venturing partnerships with various start-up businesses which are held for their strategic value.
| 2020 £m |
2019 £m |
|||||||
| Functional currency |
260 | 131 | ||||||
| US dollar |
4 | 4 | ||||||
| 264 | 135 | |||||||
The classification of these investments under the IFRS 13 fair value hierarchy is given in note 22.
There is no material difference between the investments held at fair value and their gross contractual values.
|
Strategic Report |
Governance Report | Financial Statements | Other Information | BAT Annual Report and Form 20-F 2020 | 197 | |||||
|
|
15 Derivative Financial Instruments
The fair values of derivatives are determined based on market data (primarily yield curves, implied volatilities and exchange rates) to calculate the present value of all estimated flows associated with each derivative at the balance sheet date. In the absence of sufficient market data, fair values would be based on the quoted market price of similar derivatives. The classification of these derivative assets and liabilities under the IFRS 13 fair value hierarchy is given in note 22.
| 2020 | 2019 | |||||||||||||||
|
Assets £m |
Liabilities £m |
Assets £m |
Liabilities £m |
|||||||||||||
| Fair value hedges |
||||||||||||||||
| – interest rate swaps |
20 | – | 177 | 62 | ||||||||||||
| – cross-currency swaps |
255 | – | 191 | – | ||||||||||||
| Cash flow hedges |
||||||||||||||||
| – interest rate swaps |
– | – | – | 187 | ||||||||||||
| – cross-currency swaps |
189 | – | 114 | 84 | ||||||||||||
| – forward foreign currency contracts |
62 | 100 | 57 | 50 | ||||||||||||
| Net investment hedges |
||||||||||||||||
| – forward foreign currency contracts |
211 | 43 | 178 | 19 | ||||||||||||
| Held-for-trading* |
||||||||||||||||
| – interest rate swaps |
45 | 53 | 3 | 6 | ||||||||||||
| – forward foreign currency contracts |
15 | 123 | 45 | 60 | ||||||||||||
|
Total |
797 | 319 | 765 | 468 | ||||||||||||
| Current |
430 | 278 | 313 | 181 | ||||||||||||
| Non-current |
367 | 41 | 452 | 287 | ||||||||||||
| 797 | 319 | 765 | 468 | |||||||||||||
| Derivatives |
||||||||||||||||
| – in respect of net debt** |
518 | 172 | 527 | 384 | ||||||||||||
| – other |
279 | 147 | 238 | 84 | ||||||||||||
| 797 | 319 | 765 | 468 | |||||||||||||
| * | Derivatives which do not meet the tests for hedge accounting under IFRS 9 or which are not designated as hedging instruments are referred to as ‘held-for-trading’. These derivatives principally consist of interest rate swaps and forward foreign currency contracts which have not been designated as hedges due to their value changes offsetting with other components of net finance costs relating to financial assets and financial liabilities. The Group does not use derivatives for speculative purposes. All derivatives are undertaken for risk management purposes. |
| ** | Derivatives in respect of net debt are in a net asset position of £346 million as at 31 December 2020 (2019: net asset position of £143 million). The Group’s net debt is presented in note 19. |
For cash flow hedges, the timing of expected cash flows is as follows: assets of £251 million (2019: £171 million) of which £98 million (2019: £51 million) is expected within one year and £143 million (2019: £114 million) beyond five years and liabilities of £100 million (2019: £321 million) of which £94 million (2019: £75 million) is expected within one year and £nil (2019: £163 million) beyond five years.
The Group’s cash flow hedges are principally in respect of sales or purchases of inventory and certain debt instruments. A certain number of forward foreign currency contracts were used to manage the currency profile of external borrowings and are reflected in the currency table in note 19. Interest rate swaps have been used to manage the interest rate profile of external borrowings and are reflected in the re-pricing table in note 19.
| 198 | BAT Annual Report and Form 20-F 2020 |
Financial Statements
Notes on Accounts
Continued
15 Derivative Financial Instruments Continued
The tables below set out the maturities of the Group’s derivative financial instruments on an undiscounted contractual basis, based on spot rates.
The maturity dates of all gross-settled derivative financial instruments are as follows:
| 2020 | 2019 | |||||||||||||||||||||||||||||||
| Assets | Liabilities | Assets | Liabilities | |||||||||||||||||||||||||||||
| Inflow £m |
Outflow £m |
Inflow £m |
Outflow £m |
Inflow £m |
Outflow £m |
Inflow £m |
Outflow £m |
|||||||||||||||||||||||||
| Within one year |
||||||||||||||||||||||||||||||||
| – forward foreign currency contracts |
7,345 | (6,567 | ) | 10,661 | (10,185 | ) | 10,168 | (9,367 | ) | 8,534 | (8,069 | ) | ||||||||||||||||||||
| – cross-currency swaps |
1,756 | (1,655 | ) | – | – | 35 | (38 | ) | 18 | (62 | ) | |||||||||||||||||||||
| Between one and two years |
||||||||||||||||||||||||||||||||
| – forward foreign currency contracts |
522 | (498 | ) | 285 | (266 | ) | 548 | (524 | ) | 278 | (263 | ) | ||||||||||||||||||||
| – cross-currency swaps |
33 | (54 | ) | – | – | 811 | (765 | ) | 969 | (1,012 | ) | |||||||||||||||||||||
| Between two and three years |
||||||||||||||||||||||||||||||||
| – cross-currency swaps |
1,446 | (1,261 | ) | – | – | 15 | (23 | ) | 17 | (36 | ) | |||||||||||||||||||||
| Between three and four years |
||||||||||||||||||||||||||||||||
| – cross-currency swaps |
19 | (29 | ) | – | – | 725 | (590 | ) | 683 | (679 | ) | |||||||||||||||||||||
| Between four and five years |
||||||||||||||||||||||||||||||||
| – cross-currency swaps |
469 | (451 | ) | – | – | 9 | (15 | ) | 10 | (15 | ) | |||||||||||||||||||||
| Beyond five years |
||||||||||||||||||||||||||||||||
| – cross-currency swaps |
767 | (594 | ) | – | – | 762 | (609 | ) | 460 | (435 | ) | |||||||||||||||||||||
| 12,357 | (11,109 | ) | 10,946 | (10,451 | ) | 13,073 | (11,931 | ) | 10,969 | (10,571 | ) | |||||||||||||||||||||
| The maturity dates of net-settled derivative financial instruments, which primarily relate to interest rate swaps, are as follows:
|
| |||||||||||||||||||||||||||||||
| 2020 | 2019 | |||||||||||||||||||||||||||||||
|
Assets £m |
Liabilities Outflow £m |
Assets £m |
Liabilities Outflow £m |
|||||||||||||||||||||||||||||
| Within one year |
296 | 263 | 44 | 44 | ||||||||||||||||||||||||||||
| Between one and two years |
26 | 21 | 25 | 39 | ||||||||||||||||||||||||||||
| Between two and three years |
16 | 18 | 25 | 39 | ||||||||||||||||||||||||||||
| Between three and four years |
– | – | 10 | 21 | ||||||||||||||||||||||||||||
| Between four and five years |
– | – | 43 | 63 | ||||||||||||||||||||||||||||
| Beyond five years |
– | – | 182 | 263 | ||||||||||||||||||||||||||||
| 338 | 302 | 329 | 469 | |||||||||||||||||||||||||||||
|
Strategic Report |
Governance Report | Financial Statements | Other Information | BAT Annual Report and Form 20-F 2020 | 199 | |||||
|
|
15 Derivative Financial Instruments Continued
The items designated as hedging instruments are as follows:
| 2020 | 2019 | |||||||||||||||
|
Nominal amount of hedging instrument £m |
Changes in fair value used for calculating hedge ineffectiveness £m |
Nominal amount £m |
Changes in fair |
|||||||||||||
| Interest rate risk exposure: |
||||||||||||||||
| Fair value hedges |
||||||||||||||||
| – interest rate swaps |
757 | (5 | ) | 3,065 | 73 | |||||||||||
| – cross-currency swaps |
1,428 | 66 | 1,436 | (72 | ) | |||||||||||
| Cash flow hedges |
||||||||||||||||
| – interest rate swaps |
– | – | 4,068 | (103 | ) | |||||||||||
| – cross-currency swaps |
2,822 | (155 | ) | 2,695 | (61 | ) | ||||||||||
| Foreign currency risk exposure: |
||||||||||||||||
| Cash flow hedges |
||||||||||||||||
| – forward foreign currency contracts |
3,279 | (36 | ) | 3,827 | (3 | ) | ||||||||||
| Net investment hedges (derivative related) |
||||||||||||||||
| – forward foreign currency contracts |
5,922 | 156 | 5,274 | 161 | ||||||||||||
| Net investment hedges (non-derivative related) |
||||||||||||||||
| – debt (carrying value) in borrowings designated as net investment hedges of net assets |
392 | 21 | 372 | 22 | ||||||||||||
16 Inventories
| 2020 £m |
2019 £m |
|||||||
| Raw materials and consumables |
2,362 | 2,750 | ||||||
| Finished goods and work in progress |
3,549 | 3,258 | ||||||
| Goods purchased for resale |
87 | 86 | ||||||
| 5,998 | 6,094 | |||||||
Inventories pledged as security for liabilities amount to £2 million (2019: £7 million). Write-offs taken to other operating expenses in the Group income statement were £309 million (2019: £255 million; 2018: £148 million). In 2020, this included £24 million in relation to the restructuring in Indonesia (refer to note 3(e)) and £47 million as a result of the decision to withdraw glo Sens from Japan. Goods purchased for resale include Group brands produced under third-party contract manufacturing arrangements.
| 200 | BAT Annual Report and Form 20-F 2020 |
Financial Statements
Notes on Accounts
Continued
17 Cash and Cash Equivalents
| 2020 £m |
2019 £m |
|||||||
| Cash and bank balances |
2,940 | 2,256 | ||||||
| Cash equivalents |
199 | 270 | ||||||
| 3,139 | 2,526 | |||||||
The carrying value of cash and cash equivalents approximates their fair value.
Cash and cash equivalents are denominated in the functional currency of the subsidiary undertaking or other currencies as shown below:
| 2020 £m |
2019 £m |
|||||||
| Functional currency |
2,597 | 2,199 | ||||||
| US dollar |
197 | 127 | ||||||
| Euro |
170 | 64 | ||||||
| Other currencies |
175 | 136 | ||||||
| 3,139 | 2,526 | |||||||
In the Group cash flow statement, net cash and cash equivalents are shown after deducting bank overdrafts and accrued interest where applicable, as follows:
| 2020 £m |
2019 £m |
|||||||
| Cash and cash equivalents as above |
3,139 | 2,526 | ||||||
| Less overdrafts and accrued interest |
(251 | ) | (491 | ) | ||||
| Net cash and cash equivalents |
2,888 | 2,035 | ||||||
Cash and cash equivalents include restricted amounts of £878 million (2019: £445 million) due to subsidiaries in CCAA protection (note 28), as well as £455 million (2019: £182 million) principally due to exchange control restrictions, including amounts of £141 million (2019: £nil) where the underlying restrictions are expected to be short-term in nature.
Cash and cash equivalents also include £48 million (2019: £14 million) of cash that is held as a hedging instrument.
|
Strategic Report |
Governance Report | Financial Statements | Other Information | BAT Annual Report and Form 20-F 2020 | 201 | |||||
|
|
18 Capital and Reserves
(a) Share capital
| Ordinary shares of 25p each Number of shares |
£m | |||||||
| Allotted and fully paid |
||||||||
| 1 January 2020 |
2,456,520,738 | 614.12 | ||||||
| Changes during the year |
||||||||
| – share option schemes |
70,859 | 0.02 | ||||||
| 31 December 2020 |
2,456,591,597 | 614.14 | ||||||
| Allotted and fully paid |
||||||||
| 1 January 2019 |
2,456,415,884 | 614.09 | ||||||
| Changes during the year |
||||||||
| – share option schemes |
104,854 | 0.03 | ||||||
| 31 December 2019 |
2,456,520,738 | 614.12 | ||||||
| Allotted and fully paid |
||||||||
| 1 January 2018 |
2,456,278,414 | 614.06 | ||||||
| Changes during the year |
||||||||
| – share option schemes |
137,470 | 0.03 | ||||||
| 31 December 2018 |
2,456,415,884 | 614.09 | ||||||
(b) Share premium account, capital redemption reserves and merger reserves comprise:
| Share premium account £m |
Capital redemption reserves £m |
Merger reserves £m |
Total £m |
|||||||||||||
| 31 December 2020 |
103 | 101 | 26,414 | 26,618 | ||||||||||||
| 31 December 2019 |
94 | 101 | 26,414 | 26,609 | ||||||||||||
| 31 December 2018 |
91 | 101 | 26,414 | 26,606 | ||||||||||||
Share premium account
The share premium account includes the difference between the value of shares issued and their nominal value. The share premium increase includes £2 million (2019: £3 million; 2018: £4 million) in respect of ordinary shares issued under the Company’s share option schemes. A further £7 million (2019: £nil; 2018: £nil) increase in share premium is related to shares repurchased and not cancelled that have been transferred from the Company to other Group undertakings, to be granted to certain employees on vesting of awards, and represents the excess of transfer price of the share over the original weighted average cost of shares.
Capital redemption account
On the purchase of own shares as part of the share buy-back programme for shares which are cancelled, a transfer is made from retained earnings to the capital redemption reserve equivalent to the nominal value of shares purchased. Purchased shares which are not cancelled are classified as treasury shares and presented as a deduction from total equity.
| 202 | BAT Annual Report and Form 20-F 2020 |
Financial Statements
Notes on Accounts
Continued
18 Capital and Reserves Continued
Merger reserve account
The merger reserve comprises:
| a. | In 1999, shares were issued for the acquisition of the Rothmans International B.V. Group and the difference between the fair value of shares issued and their nominal value of £3,748 million was credited to merger reserves; and |
| b. | On 25 July 2017, the Group announced the completion of the acquisition of the remaining 57.8% of RAI not already owned by the Group. Shares were issued for the acquisition and the difference between the fair value of shares issued and their nominal value of £22,666 million was credited to merger reserves. |
| (c) | Equity attributed to owners of the parent – movements in other reserves and retained earnings (which are after deducting treasury shares) comprise: |
| Retained earnings | ||||||||||||||||||||||||||||||||
|
Translation reserve (i) £m |
Hedging reserve (ii) £m |
Fair value reserve £m |
Revaluation (iv) £m |
Other |
Total other |
Treasury £m |
Other £m |
|||||||||||||||||||||||||
| 1 January 2020 |
(3,974 | ) | (346 | ) | 13 | 179 | 573 | (3,555 | ) | (5,261 | ) | 45,495 | ||||||||||||||||||||
| Comprehensive income and expense |
||||||||||||||||||||||||||||||||
| Profit for the year |
– | – | – | – | – | – | – | 6,400 | ||||||||||||||||||||||||
| Differences on exchange |
(2,582 | ) | – | – | – | – | (2,582 | ) | – | – | ||||||||||||||||||||||
| Cash flow hedges |
||||||||||||||||||||||||||||||||
| – net fair value losses |
– | (256 | ) | – | – | – | (256 | ) | – | – | ||||||||||||||||||||||
| – reclassified and reported in profit for the year |
– | 90 | – | – | – | 90 | – | – | ||||||||||||||||||||||||
| Net investment hedges |
||||||||||||||||||||||||||||||||
| – net fair value losses |
(16 | ) | – | – | – | – | (16 | ) | – | – | ||||||||||||||||||||||
| – differences on exchange on borrowings |
(163 | ) | – | – | – | – | (163 | ) | – | – | ||||||||||||||||||||||
| Associates – share of OCI, net of tax (note 5) |
(95 | ) | (3 | ) | – | – | – | (98 | ) | – | – | |||||||||||||||||||||
| Tax on items recognised directly in other comprehensive income that may be reclassified subsequently to profit or loss (note 6(f)) | – | 44 | – | – | – | 44 | – | – | ||||||||||||||||||||||||
| Retirement benefit schemes |
||||||||||||||||||||||||||||||||
| – net actuarial gains (note 11) |
– | – | – | – | – | – | – | 105 | ||||||||||||||||||||||||
| – surplus recognition (note 11) |
– | – | – | – | – | – | – | 10 | ||||||||||||||||||||||||
| Associates – share of OCI, net of tax (note 5) |
– | – | (31 | ) | – | – | (31 | ) | – | (3 | ) | |||||||||||||||||||||
| Tax on items recognised directly in other comprehensive income that will not be reclassified subsequently to profit or loss (note 6(f)) | – | – | – | – | – | – | – | (26 | ) | |||||||||||||||||||||||
| Other changes in equity |
||||||||||||||||||||||||||||||||
| Cash flow hedges reclassified and reported in total assets | – | (33 | ) | – | – | – | (33 | ) | – | – | ||||||||||||||||||||||
| Employee share options |
||||||||||||||||||||||||||||||||
| – value of employee services |
– | – | – | – | – | – | – | 88 | ||||||||||||||||||||||||
| – treasury shares used for share option schemes |
– | – | – | – | – | – | 9 | (16 | ) | |||||||||||||||||||||||
| Dividends and other appropriations |
||||||||||||||||||||||||||||||||
| – ordinary shares |
– | – | – | – | – | – | – | (4,747 | ) | |||||||||||||||||||||||
| Purchase of own shares |
||||||||||||||||||||||||||||||||
| – held in employee share ownership trusts |
– | – | – | – | – | – | (17 | ) | – | |||||||||||||||||||||||
| Other movements |
– | – | – | – | – | – | 119 | (115 | ) | |||||||||||||||||||||||
| 31 December 2020 |
(6,830 | ) | (504 | ) | (18 | ) | 179 | 573 | (6,600 | ) | (5,150 | ) | 47,191 | |||||||||||||||||||
|
Strategic Report |
Governance Report | Financial Statements | Other Information | BAT Annual Report and Form 20-F 2020 | 203 | |||||
|
|
18 Capital and Reserves Continued
| Retained earnings | ||||||||||||||||||||||||||||||||
| Translation reserve (i) £m |
Hedging reserve (ii) £m |
Fair value reserve (iii) £m |
Revaluation reserve (iv) £m |
Other (v) £m |
Total other reserves £m |
Treasury shares (vi) £m |
Other £m |
|||||||||||||||||||||||||
| 1 January 2019 |
(914 | ) | (177 | ) | 6 | 179 | 573 | (333 | ) | (5,242 | ) | 43,799 | ||||||||||||||||||||
| Comprehensive income and expense |
||||||||||||||||||||||||||||||||
| Profit for the year |
– | – | – | – | – | – | – | 5,704 | ||||||||||||||||||||||||
| Differences on exchange |
(2,948 | ) | – | – | – | – | (2,948 | ) | – | – | ||||||||||||||||||||||
| Cash flow hedges |
||||||||||||||||||||||||||||||||
| – net fair value losses |
– | (246 | ) | – | – | – | (246 | ) | – | – | ||||||||||||||||||||||
| – reclassified and reported in profit for the year |
– | 53 | – | – | – | 53 | – | – | ||||||||||||||||||||||||
| Net investment hedges |
||||||||||||||||||||||||||||||||
| – net fair value gains |
21 | – | – | – | – | 21 | – | – | ||||||||||||||||||||||||
| – differences on exchange on borrowings |
(18 | ) | – | – | – | – | (18 | ) | – | – | ||||||||||||||||||||||
| Associates – share of OCI, net of tax (note 5) |
(115 | ) | – | – | – | – | (115 | ) | – | – | ||||||||||||||||||||||
| Tax on items recognised directly in other comprehensive income that may be reclassified subsequently to profit or loss (note 6(f)) | – | 56 | – | – | – | 56 | – | – | ||||||||||||||||||||||||
| Retirement benefit schemes |
||||||||||||||||||||||||||||||||
| – net actuarial losses (note 11) |
– | – | – | – | – | – | – | (582 | ) | |||||||||||||||||||||||
| – surplus recognition (note 11) |
– | – | – | – | – | – | – | (7 | ) | |||||||||||||||||||||||
| Associates – share of OCI, net of tax (note 5) |
– | – | 7 | – | – | 7 | – | – | ||||||||||||||||||||||||
| Tax on items recognised directly in other comprehensive income that will not be reclassified subsequently to profit or loss (note 6(f)) |
– | – | – | – | – | – | – | 75 | ||||||||||||||||||||||||
| Other changes in equity |
||||||||||||||||||||||||||||||||
| Cash flow hedges reclassified and reported in total assets | – | (32 | ) | – | – | – | (32 | ) | – | – | ||||||||||||||||||||||
| Employee share options |
||||||||||||||||||||||||||||||||
| – value of employee services |
– | – | – | – | – | – | – | 115 | ||||||||||||||||||||||||
| Dividends and other appropriations |
||||||||||||||||||||||||||||||||
| – ordinary shares |
– | – | – | – | – | – | – | (3,476 | ) | |||||||||||||||||||||||
| Purchase of own shares |
||||||||||||||||||||||||||||||||
| – held in employee share ownership trusts |
– | – | – | – | – | – | (117 | ) | – | |||||||||||||||||||||||
| Other movements |
– | – | – | – | – | – | 98 | (133 | ) | |||||||||||||||||||||||
| 31 December 2019 |
(3,974 | ) | (346 | ) | 13 | 179 | 573 | (3,555 | ) | (5,261 | ) | 45,495 | ||||||||||||||||||||
| 204 | BAT Annual Report and Form 20-F 2020 |
Financial Statements
Notes on Accounts
Continued
18 Capital and Reserves Continued
| Retained earnings | ||||||||||||||||||||||||||||||||
| Translation reserve (i) £m |
Hedging reserve (ii) £m |
Fair value reserve (iii) £m |
Revaluation reserve (iv) £m |
Other (v) £m |
Total other reserves £m |
Treasury shares (vi) £m |
Other £m |
|||||||||||||||||||||||||
| 31 December 2017 |
(4,029 | ) | (132 | ) | 17 | 179 | 573 | (3,392 | ) | (5,195 | ) | 42,130 | ||||||||||||||||||||
| Accounting policy change (IFRS 9) (note 30) |
– | – | (9 | ) | – | – | (9 | ) | – | (29 | ) | |||||||||||||||||||||
| 1 January 2018 |
(4,029 | ) | (132 | ) | 8 | 179 | 573 | (3,401 | ) | (5,195 | ) | 42,101 | ||||||||||||||||||||
| Comprehensive income and expense |
||||||||||||||||||||||||||||||||
| Profit for the year |
– | – | – | – | – | – | – | 6,032 | ||||||||||||||||||||||||
| Differences on exchange |
3,861 | – | – | – | – | 3,861 | – | – | ||||||||||||||||||||||||
| Cash flow hedges |
||||||||||||||||||||||||||||||||
| – net fair value losses |
– | (58 | ) | – | – | – | (58 | ) | – | – | ||||||||||||||||||||||
| – reclassified and reported in profit for the year |
– | 17 | – | – | – | 17 | – | – | ||||||||||||||||||||||||
| Investments held at fair value |
||||||||||||||||||||||||||||||||
| – reclassified and reported in retained earnings |
– | – | (8 | ) | – | – | (8 | ) | – | 8 | ||||||||||||||||||||||
| Net investment hedges |
||||||||||||||||||||||||||||||||
| – net fair value losses |
(472 | ) | – | – | – | – | (472 | ) | – | – | ||||||||||||||||||||||
| – differences on exchange on borrowings |
(236 | ) | – | – | – | – | (236 | ) | – | – | ||||||||||||||||||||||
| Associates – share of OCI, net of tax (note 5) |
(38 | ) | – | – | – | – | (38 | ) | – | – | ||||||||||||||||||||||
| Tax on items recognised directly in other comprehensive income that may be reclassified subsequently to profit or loss (note 6(f)) |
– | 18 | – | – | – | 18 | – | – | ||||||||||||||||||||||||
| Retirement benefit schemes |
||||||||||||||||||||||||||||||||
| – net actuarial gains |
– | – | – | – | – | – | – | 138 | ||||||||||||||||||||||||
| – surplus recognition |
– | – | – | – | – | – | – | 4 | ||||||||||||||||||||||||
| Associates – share of OCI, net of tax (note 5) |
– | – | 6 | – | – | 6 | – | – | ||||||||||||||||||||||||
| Tax on items recognised directly in other comprehensive income that will not be reclassified subsequently to profit or loss (note 6(f)) |
– | – | – | – | – | – | – | (33 | ) | |||||||||||||||||||||||
| Other changes in equity |
||||||||||||||||||||||||||||||||
| Cash flow hedges reclassified and reported in total assets | – | (22 | ) | – | – | – | (22 | ) | – | – | ||||||||||||||||||||||
| Employee share options |
||||||||||||||||||||||||||||||||
| – value of employee services |
– | – | – | – | – | – | – | 121 | ||||||||||||||||||||||||
| Dividends and other appropriations |
||||||||||||||||||||||||||||||||
| – ordinary shares |
– | – | – | – | – | – | – | (4,463 | ) | |||||||||||||||||||||||
| Purchase of own shares |
||||||||||||||||||||||||||||||||
| – held in employee share ownership trusts |
– | – | – | – | – | – | (139 | ) | – | |||||||||||||||||||||||
| Non-controlling interests – acquisitions |
– | – | – | – | – | – | – | (11 | ) | |||||||||||||||||||||||
| Other movements |
– | – | – | – | – | – | 92 | (98 | ) | |||||||||||||||||||||||
| 31 December 2018 |
(914 | ) | (177 | ) | 6 | 179 | 573 | (333 | ) | (5,242 | ) | 43,799 | ||||||||||||||||||||
|
Strategic Report |
Governance Report | Financial Statements | Other Information | BAT Annual Report and Form 20-F 2020 | 205 | |||||
|
|
18 Capital and Reserves Continued
i. Translation reserve:
The translation reserve is explained in the accounting policy on foreign currencies in note 1.
In 2018, within the translation reserve differences on exchange, a gain of £107 million has been recognised in relation to the application of hyperinflationary accounting in Venezuela as explained in note 3(h).
ii. Hedging reserve:
The hedging reserve is explained in the accounting policy on financial instruments in note 1.
Of the amounts reclassified from the hedging reserve and reported in profit for the year, a gain of £16 million (2019: £12 million gain; 2018: £15 million gain) and a gain of £19 million (2019: £3 million gain; 2018: £23 million gain) were reported within revenue and raw materials and consumables, respectively, together with a loss of £2 million (2019: £11 million gain; 2018: £7 million loss) reported in other operating expenses and a gain of £57 million (2019: £27 million gain; 2018: £14 million loss) reported within net finance costs.
The Group hedges certain foreign currency denominated borrowings with cross-currency interest rate swaps. As permitted by IFRS 9 Financial Instruments, the foreign currency basis spreads have been separated from the hedging instrument and are recognised in reserves as a ‘cost of hedging’ and are reclassified to the income statement in the same period in which profit and loss is affected by the hedged expected cashflows as a component of the associated interest expense. The basis spreads are disclosed within hedging reserves as they are not material. Included within the balance of hedging reserves at 31 December 2020 is an accumulated gain of £9 million (2019: £14 million; 2018: £20 million) in respect of the cost of hedging.
iii. Fair value reserve:
The fair value reserve is explained in the accounting policy on financial instruments in note 1. Fair value gains and losses arising from investments held at fair value through other comprehensive income are recognised in this reserve.
iv. Revaluation reserve:
The revaluation reserve relates to the acquisition of the cigarette and snus business of ST in 2008.
v. Other reserves:
Other reserves comprise:
| (a) | £483 million which arose in 1998 from merger accounting in a Scheme of Arrangement and Reconstruction whereby British American Tobacco p.l.c. acquired the entire share capital of B.A.T Industries p.l.c. and the share capital of that company’s principal financial services subsidiaries was distributed, so effectively demerging them; and |
| (b) | In the 1999 Rothmans transaction, convertible redeemable preference shares were issued as part of the consideration. The discount on these shares was amortised by crediting other reserves and charging retained earnings. The £90 million balance in other reserves comprises the accumulated balance in respect of the preference shares converted during 2004. |
vi. Treasury shares:
Total equity attributable to owners of the parent is stated after deducting the cost of treasury shares which include £4,836 million (2019: £4,845 million; 2018: £4,845 million) for shares repurchased and not cancelled and £314 million (2019: £416 million; 2018: £397 million) in respect of the cost of own shares held in employee share ownership trusts. The reduction in the shares repurchased and not cancelled is primarily due to shares reissued to satisfy the vesting of US share options.
The share buy-back programme was suspended from 30 July 2014. As at 31 December 2020, treasury shares include 6,053,158 (2019: 8,275,677; 2018: 7,536,408) shares held in trust and 162,347,246 (2019: 162,645,590; 2018: 162,645,590) shares repurchased and not cancelled as part of the Company’s share buy-back programme. From March 2020 the Company has utilised shares acquired in the share buy-back programme to satisfy shared-based payment awards made to certain employees.
Taxation in equity
The tax attributable to components of other comprehensive income is as follows:
| 2020 £m |
2019 £m |
2018 £m |
||||||||||
| Hedging reserve |
||||||||||||
| Cash flow hedges – net fair value losses |
44 | 56 | 18 | |||||||||
| 44 | 56 | 18 | ||||||||||
| Retained earnings |
||||||||||||
| – actuarial (gains)/losses in respect of subsidiaries |
(26 | ) | 75 | (33 | ) | |||||||
| (26 | ) | 75 | (33 | ) | ||||||||
| Owners of the parent |
18 | 131 | (15 | ) | ||||||||
| Non-controlling interests |
– | – | – | |||||||||
| Total tax recognised in other comprehensive income for the year (note 6(f)) |
18 | 131 | (15 | ) | ||||||||
| 206 | BAT Annual Report and Form 20-F 2020 |
Financial Statements
Notes on Accounts
Continued
18 Capital and Reserves Continued
(d) Non-controlling interests
Movements in non-controlling interests primarily relate to profit for the year and dividends (reported as a movement in retained earnings) and differences on exchange arising from the translation into sterling (reported as a movement in other reserves). Information on subsidiaries with material non-controlling interests is provided in note 28.
(e) Dividends and other appropriations
With effect from 1 January 2018, the Company pays interim dividends on a quarterly basis. The interim quarterly dividend payment for the year ended 31 December 2019 of 210.4p per ordinary share (31 December 2018: 203.0p per ordinary share) was payable in four equal instalments: amounts payable in May 2020 of £1,185 million (May 2019: £1,157 million), August 2020 of £1,195 million (August 2019: £1,159 million), November 2020 of £1,206 million (November 2019: £1,160 million) and £1,203 million in February 2021 (February 2020: £1,161 million) respectively. The total dividends recognised as an appropriation from reserves in 2020 was £4,747 million (2019: £3,476 million).
As described in last year’s annual report, the Group revised in 2019 the recognition of the dividend. From 2019, the Group recognises interim dividends as a liability in the Group’s financial statements in the period in which they are paid. Prior to this, interim dividends were recognised when confirmed by the Directors of the Company.
The Board has declared an interim dividend of 215.6p per ordinary share of 25p, for the year ended 31 December 2020, payable in four equal quarterly instalments of 53.9p per ordinary share in May 2021, August 2021, November 2021 and February 2022. These payments will be recognised as appropriations from reserves in 2021 and 2022. The total amount payable is estimated to be £4,946 million based on the number of shares outstanding at the date of these accounts.
19 Borrowings
| Currency | Maturity dates | Interest rates | 2020 £m |
2019 £m |
||||||||||
| Eurobonds | Euro | 2021 to 2045 | 0.9% to 4.9% | 8,875 | 7,591 | |||||||||
| Euro | 2021 | 3m EURIBOR +50bps | 984 | 931 | ||||||||||
| UK sterling | 2021 to 2055 | 1.8% to 7.3% | 4,590 | 4,161 | ||||||||||
| Swiss franc | 2021 to 2026 | 0.6% to 1.4% | 540 | 510 | ||||||||||
| Bonds issued pursuant to Rules under the US Securities Act (as amended) | US dollar | 2022 to 2050 | 1.7% to 8.1% | 25,461 | 23,805 | |||||||||
| US dollar | 2022 | USD 3m LIBOR + 88bps | 548 | 1,325 | ||||||||||
| Bonds and notes |
40,998 | 38,323 | ||||||||||||
| Commercial paper |
– | 1,056 | ||||||||||||
| Other loans |
1,929 | 4,624 | ||||||||||||
| Bank loans |
317 | 293 | ||||||||||||
| Bank overdrafts |
249 | 491 | ||||||||||||
| Lease liabilities |
475 | 579 | ||||||||||||
| 43,968 | 45,366 | |||||||||||||
Other loans primarily comprise £1,929 million (2019: £3,859 million) relating to a term loan maturing in January 2022 and £nil (2019: £745 million) relating to bilateral facilities. Commercial paper is issued at competitive rates to meet short-term borrowing requirements as and when needed.
Current borrowings per the balance sheet include interest payable of £499 million at 31 December 2020 (2019: £474 million).
Included within borrowings are £5,356 million (2019: £5,136 million) of borrowings subject to fair value hedges where their amortised cost has been increased by £173 million (2019: £210 million) in the table above.
The fair value of borrowings is estimated to be £47,029 million (2019: £45,674 million) of which £44,059 million (2019: £38,631 million) has been calculated using quoted market prices and is within level 1 of the fair value hierarchy and £2,970 million (2019: £7,043 million) has been calculated based on discounted cash flow analysis and is within level 3 of the fair value hierarchy.
Amounts secured on Group assets including property, plant and equipment, inventory and receivables as at 31 December 2020 are £21 million (2019: £88 million). The majority of lease liabilities are also secured against the associated assets.
|
Strategic Report |
Governance Report | Financial Statements | Other Information | BAT Annual Report and Form 20-F 2020 | 207 | |||||
|
|
19 Borrowings Continued
Borrowings are repayable as follows:
| Per balance sheet | Contractual gross maturities | |||||||||||||||||
| 2020 £m |
2019 £m |
2020 £m |
2019 £m |
|||||||||||||||
| Within one year |
4,041 | 7,562 | 4,901 | 8,926 | ||||||||||||||
| Between one and two years |
4,049 | 2,947 | 5,355 | 4,181 | ||||||||||||||
| Between two and three years |
2,587 | 6,992 | 3,829 | 8,215 | ||||||||||||||
| Between three and four years |
3,854 | 2,505 | 5,095 | 3,529 | ||||||||||||||
| Between four and five years |
4,108 | 3,173 | 5,025 | 3,871 | ||||||||||||||
| Beyond five years |
25,329 | 22,187 | 35,848 | 32,176 | ||||||||||||||
| 43,968 | 45,366 | 60,053 | 60,898 | |||||||||||||||
The contractual gross maturities in each year include the borrowings maturing in that year together with forecast interest payments on all borrowings which are outstanding for all or part of that year.
Borrowings are denominated in the functional currency of the subsidiary undertaking or other currencies as shown below:
| Functional currency £m |
US dollar £m |
UK sterling £m |
Euro £m |
Other currencies £m |
Total £m |
|||||||||||||||||||
| 31 December 2020 |
||||||||||||||||||||||||
| Total borrowings |
32,000 | 2,700 | 452 | 8,221 | 595 | 43,968 | ||||||||||||||||||
| Effect of derivative financial instruments |
||||||||||||||||||||||||
| – cross-currency swaps |
3,795 | – | (450 | ) | (3,536 | ) | (265 | ) | (456 | ) | ||||||||||||||
| – forward foreign currency contracts |
593 | (460 | ) | – | (520 | ) | 394 | 7 | ||||||||||||||||
| 36,388 | 2,240 | 2 | 4,165 | 724 | 43,519 | |||||||||||||||||||
| 31 December 2019 |
||||||||||||||||||||||||
| Total borrowings |
32,536 | 2,772 | 451 | 8,919 | 688 | 45,366 | ||||||||||||||||||
| Effect of derivative financial instruments |
||||||||||||||||||||||||
| – cross-currency swaps |
3,946 | – | (450 | ) | (3,432 | ) | (249 | ) | (185 | ) | ||||||||||||||
| – forward foreign currency contracts |
(610 | ) | (213 | ) | – | 440 | 372 | (11 | ) | |||||||||||||||
| 35,872 | 2,559 | 1 | 5,927 | 811 | 45,170 | |||||||||||||||||||
The exposure to interest rate changes when borrowings are re-priced is as follows:
| Within 1 year £m |
Between 1-2 years £m |
Between 2-3 years £m |
Between 3-4 years £m |
Between 4-5 years £m |
Beyond 5 years £m |
Total £m |
||||||||||||||||||||||
| 31 December 2020 |
||||||||||||||||||||||||||||
| Total borrowings |
6,519 | 1,568 | 2,594 | 3,855 | 4,108 | 25,324 | 43,968 | |||||||||||||||||||||
| Effect of derivative financial instruments |
||||||||||||||||||||||||||||
| – interest rate swaps |
219 | (219 | ) | – | – | – | – | – | ||||||||||||||||||||
| – cross-currency swaps |
454 | – | (744 | ) | – | (23 | ) | (143 | ) | (456 | ) | |||||||||||||||||
| 7,192 | 1,349 | 1,850 | 3,855 | 4,085 | 25,181 | 43,512 | ||||||||||||||||||||||
| 31 December 2019 |
||||||||||||||||||||||||||||
| Total borrowings |
11,145 | 1,888 | 4,432 | 2,451 | 3,161 | 22,289 | 45,366 | |||||||||||||||||||||
| Effect of derivative financial instruments |
||||||||||||||||||||||||||||
| – interest rate swaps |
1,794 | (508 | ) | (226 | ) | – | – | (1,060 | ) | – | ||||||||||||||||||
| – cross-currency swaps |
1,335 | (758 | ) | – | (649 | ) | – | (115 | ) | (187 | ) | |||||||||||||||||
| 14,274 | 622 | 4,206 | 1,802 | 3,161 | 21,114 | 45,179 | ||||||||||||||||||||||
| 208 | BAT Annual Report and Form 20-F 2020 |
Financial Statements
Notes on Accounts
Continued
19 Borrowings Continued
Lease liabilities are repayable as follows:
| Per balance sheet | Contractual gross maturities | |||||||||||||||
| 2020 £m |
2019 £m |
2020 £m |
2019 £m |
|||||||||||||
| Within one year |
137 | 154 | 156 | 178 | ||||||||||||
| Between one and two years |
98 | 120 | 114 | 138 | ||||||||||||
| Between two and three years |
71 | 92 | 80 | 100 | ||||||||||||
| Between three and four years |
47 | 64 | 55 | 72 | ||||||||||||
| Between four and five years |
35 | 43 | 41 | 51 | ||||||||||||
| Beyond five years |
87 | 106 | 104 | 135 | ||||||||||||
| 475 | 579 | 550 | 674 | |||||||||||||
For more information on leasing arrangements refer to note 9(b).
The Group’s undrawn committed borrowing facilities (note 22) amount to £9,366 million (2019: £6,000 million) with £6,366 million maturing within one year (2019: £3,000 million maturing within one year) and with £3,000 million maturing between four and five years (2019: £3,000 million maturing between one and two years).
The Group defines net debt as follows:
| 2020 £m |
2019 £m |
|||||||
| Borrowings (excluding lease liabilities)* |
43,493 | 44,787 | ||||||
| Lease liabilities |
475 | 579 | ||||||
| Derivatives in respect of net debt (note 15) |
(346 | ) | (143 | ) | ||||
| Cash and cash equivalents (note 17) |
(3,139 | ) | (2,526 | ) | ||||
| Current investments held at fair value (note 14) |
(242 | ) | (123 | ) | ||||
| 40,241 | 42,574 | |||||||
* Borrowings as at 31 December 2020 include £790 million (2019: £848 million) in respect of the purchase price adjustments relating to the acquisition of Reynolds American.
The movements in net debt are presented below along with a reconciliation to the financing activities in the Group Cash Flow Statement:
| 2020 £m |
||||||||||||||||||||||||
| Opening balance |
Subsidiaries acquired |
Cash flow | Foreign exchange |
Fair value, accrued interest and other |
Closing balance |
|||||||||||||||||||
| Borrowings (excluding lease liabilities) |
44,787 | – | (1,049 | ) | (195 | ) | (50 | ) | 43,493 | |||||||||||||||
| Lease liabilities |
579 | 1 | (164 | ) | (24 | ) | 83 | 475 | ||||||||||||||||
| Derivatives in respect of net debt (note 15) |
(143 | ) | – | (240 | ) | (134 | ) | 171 | (346 | ) | ||||||||||||||
| Cash and cash equivalents (note 17) |
(2,526 | ) | (96 | ) | (768 | ) | 264 | (13 | ) | (3,139 | ) | |||||||||||||
| Current investments held at fair value (note 14) |
(123 | ) | – | (119 | ) | 20 | (20 | ) | (242 | ) | ||||||||||||||
| 42,574 | (95 | ) | (2,340 | ) | (69 | ) | 171 | 40,241 | ||||||||||||||||
|
Strategic Report |
Governance Report | Financial Statements | Other Information | BAT Annual Report and Form 20-F 2020 | 209 | |||||
|
|
19 Borrowings Continued
| 2019 £m |
||||||||||||||||||||||||||||
| Opening balance |
Accounting policy change (IFRS 16) (note 30) |
Subsidiaries acquired |
Cash flow | Foreign exchange |
Fair value, accrued interest and other |
Closing balance |
||||||||||||||||||||||
| Borrowings (excluding lease liabilities) |
47,495 | – | – | (1,176 | ) | (1,536 | ) | 4 | 44,787 | |||||||||||||||||||
| Lease liabilities |
14 | 607 | 3 | (154 | ) | (30 | ) | 139 | 579 | |||||||||||||||||||
| Derivatives in respect of net debt (note 15) |
(378 | ) | – | – | (391 | ) | 598 | 28 | (143 | ) | ||||||||||||||||||
| Cash and cash equivalents (note 17) |
(2,602 | ) | – | – | 17 | 57 | 2 | (2,526 | ) | |||||||||||||||||||
| Current investments held at fair value (note 14) |
(178 | ) | – | – | 95 | 38 | (78 | ) | (123 | ) | ||||||||||||||||||
| 44,351 | 607 | 3 | (1,609 | ) | (873 | ) | 95 | 42,574 | ||||||||||||||||||||
‘Fair value, accrued interest and other’ movements in lease liabilities in 2020 mainly comprise additions of £85 million (2019: £135 million) (net of reassessments, modifications and terminations), see note 9(a). The £20 million movement (2019: £78 million increase) in current investments held at fair value represents the fair value gains for these investments.
| 2020 £m |
2019 £m |
|||||||
| Cash flows per net debt statement |
(2,340 | ) | (1,609 | ) | ||||
| Non-financing cash flows included in net debt |
1,129 | (329 | ) | |||||
| Interest paid |
(1,737 | ) | (1,601 | ) | ||||
| Interest element of lease liabilities |
(26 | ) | (32 | ) | ||||
| Remaining cash flows relating to derivative financial instruments |
(43 | ) | (173 | ) | ||||
| Purchases of own shares held in employee share ownership trusts |
(18 | ) | (117 | ) | ||||
| Dividends paid to owners of the parent |
(4,745 | ) | (4,598 | ) | ||||
| Capital injection from non-controlling interests |
17 | 20 | ||||||
| Dividends paid to non-controlling interests |
(136 | ) | (157 | ) | ||||
| Other |
2 | 3 | ||||||
| Net cash used in financing activities per cash flow statement |
(7,897 | ) | (8,593 | ) | ||||
| 210 | BAT Annual Report and Form 20-F 2020 |
Financial Statements
Notes on Accounts
Continued
20 Provisions for Liabilities
|
Restructuring of existing businesses £m |
Employee- related benefits £m |
Fox River £m |
Other provisions £m |
Total £m |
||||||||||||||||
| 1 January 2020 |
298 | 28 | 73 | 659 | 1,058 | |||||||||||||||
| Differences on exchange |
5 | (2 | ) | – | (57 | ) | (54 | ) | ||||||||||||
| Subsidiaries acquired |
– | – | – | 6 | 6 | |||||||||||||||
| Provided in respect of the year |
60 | 19 | – | 312 | 391 | |||||||||||||||
| – in respect of MSA litigation (Texas, Minnesota, Mississippi) |
– | – | – | 212 | 212 | |||||||||||||||
|
– in respect of other |
60 | 19 | – | 100 | 179 | |||||||||||||||
| Utilised during the year |
(122 | ) | (7 | ) | (3 | ) | (284 | ) | (416 | ) | ||||||||||
| – in respect of excise dispute in Russia |
– | – | – | (226 | ) | (226 | ) | |||||||||||||
|
– in respect of other |
(122 | ) | (7 | ) | (3 | ) | (58 | ) | (190 | ) | ||||||||||
| 31 December 2020 |
241 | 38 | 70 | 636 | 985 | |||||||||||||||
| Analysed on the balance sheet as |
||||||||||||||||||||
| – current |
165 | 23 | 1 | 409 | 598 | |||||||||||||||
| – non-current |
76 | 15 | 69 | 227 | 387 | |||||||||||||||
| 241 | 38 | 70 | 636 | 985 | ||||||||||||||||
| Restructuring of existing businesses £m |
Employee- related benefits £m |
Fox River £m |
Other provisions £m |
Total £m |
||||||||||||||||
| 1 January 2019 |
127 | 33 | 108 | 381 | 649 | |||||||||||||||
| Differences on exchange |
(11 | ) | (1 | ) | – | (17 | ) | (29 | ) | |||||||||||
| Provided in respect of the year |
235 | 9 | – | 793 | 1,037 | |||||||||||||||
| – in respect of Quebec Class Action |
– | – | – | 436 | 436 | |||||||||||||||
| – in respect of excise dispute in Russia |
– | – | – | 252 | 252 | |||||||||||||||
|
– in respect of other |
235 | 9 | – | 105 | 349 | |||||||||||||||
| Utilised during the year |
(53 | ) | (13 | ) | (35 | ) | (498 | ) | (599 | ) | ||||||||||
| – in respect of Quebec Class Action |
– | – | – | (436 | ) | (436 | ) | |||||||||||||
|
– in respect of other |
(53 | ) | (13 | ) | (35 | ) | (62 | ) | (163 | ) | ||||||||||
| 31 December 2019 |
298 | 28 | 73 | 659 | 1,058 | |||||||||||||||
| Analysed on the balance sheet as |
||||||||||||||||||||
| – current |
203 | 14 | 6 | 447 | 670 | |||||||||||||||
| – non-current |
95 | 14 | 67 | 212 | 388 | |||||||||||||||
| 298 | 28 | 73 | 659 | 1,058 | ||||||||||||||||
The restructuring provisions relate to the restructuring and integration costs incurred and are reported as adjusting items. The principal restructuring activities in 2020 and 2019 are as described in note 3(e). While some elements of the non-current provisions of £76 million will unwind over several years, as termination payments are made over extended periods in some countries, it is estimated that approximately 88% of these non-current provisions will unwind within five years.
Employee-related benefits mainly relate to employee benefits other than post-employment benefits. The principal components of these provisions are gratuity and termination awards, and ‘jubilee’ payments due after a certain service period. It is estimated that approximately 61% of the non-current provisions of £15 million will unwind within five years.
A provision of £274 million was made in 2011 for a potential claim under a 1998 settlement agreement entered into by a Group subsidiary in respect of the clean-up of sediment in the Fox River. On 30 September 2014, the Group, NCR, Appvion and Windward Prospects entered into a funding agreement; the details of this agreement are explained in note 27. This agreement led to payments of £2 million in 2020 (2019: £32 million). In addition, the Group incurred legal costs of £1 million (2019: £3 million), which were also charged against the provision. It is expected that the non-current provision will unwind within five years.
|
Strategic Report |
Governance Report | Financial Statements | Other Information | BAT Annual Report and Form 20-F 2020 | 211 | |||||
|
|
20 Provisions for Liabilities Continued
Other provisions comprise balances set up in the ordinary course of general business that cannot be classified within the other categories, such as sales returns and onerous contracts, together with amounts in respect of supplier, excise and other disputes.
The nature of the amounts provided in respect of disputes is such that the extent and timing of cash flows are difficult to estimate and the ultimate liability may vary from the amounts provided. Other provisions also include a provision for interest of £129 million in relation to the Franked Investment Income Group Litigation Order (FII GLO), as mentioned in notes 4(b) and 6(b).
In 2020, the Group recognised a provision of US$272 million (£212 million) in relation to the ITG MSA litigation agreements with the states of Texas, Minnesota and Mississippi. Further details are provided in note 27.
On 1 March 2019, the Quebec Court of Appeal in Montreal upheld the Superior Court’s decision of May 2015 (reducing ITCAN’s share of the judgment due to a change in interest computation to a maximum of CAD$9.2 billion). The Court of Appeal also upheld the previously stated requirements for the defendants to deposit CAD$1.1 billion into an escrow account. The Board of Directors of ITCAN reassessed the recoverability of the litigation related deposit and, accordingly, the Group recognised a charge against the income statement of CAD$758 million (£436 million) in 2019, reflecting the amount of the judgment that is considered to be probable and estimable in line with IAS 37 Provisions, Contingent Liabilities and Contingent Assets. Consequently, the Group utilised the litigation related deposit which was shown as a receivable at 31 December 2018 (within trade and other receivables) against the current estimate of the liability and both the provision and litigation related deposit were reduced accordingly. Further details are provided in note 27.
In 2019, the Group recognised a provision of £252 million in relation to the Russia excise dispute. The provision was utilised in January 2020, when the tax claim was paid.
Amounts provided above are shown net of reversals of unused provisions which include reversals of £72 million (2019: £18 million) for restructuring of existing businesses, £4 million (2019: £3 million) for employee benefits and £125 million (2019: £97 million) for other provisions, of which £4 million (2019: £10 million) was reclassified to trade and other payables.
21 Trade and Other Payables
| 2020 £m |
2019 £m |
|||||||
| Trade payables |
3,722 | 3,453 | ||||||
| Duty, excise and other taxes |
3,410 | 3,852 | ||||||
| Accrued charges and deferred income |
2,228 | 2,037 | ||||||
| FII GLO deferred income (note 6(b)) |
963 | 963 | ||||||
| Social security and other taxation |
53 | 51 | ||||||
| Sundry payables |
381 | 405 | ||||||
| 10,757 | 10,761 | |||||||
| Current |
9,693 | 9,727 | ||||||
| Non-current |
1,064 | 1,034 | ||||||
| 10,757 | 10,761 | |||||||
As explained in note 13, the Group acts as a collection agent for banks and other financial institutions in certain debt factoring arrangements. The cash collected in respect of these arrangements that has not yet been remitted amounts to £128 million (2019: £115 million) and is included in sundry payables.
In addition, the Group has certain Supply Chain Financing (SCF) or ‘reverse factoring’ arrangements in place. The principal purpose of these arrangements is to provide the supplier with the option to access liquidity earlier through the sale of its receivables due from the Group to a bank or other financial institution prior to their due date. Management has determined that the Group’s payables to these suppliers have neither been extinguished nor have the liabilities been significantly modified by these arrangements. The value of amounts payable, invoice due dates and other terms and conditions applicable, from the Group’s perspective, remain unaltered, with only the ultimate payee being changed. At 31 December 2020, the value of amounts payable under the SCF programmes was £48 million (2019: £71 million). The cash outflows in respect of these arrangements have been recognised within operating cash flows.
Accrued charges and deferred income include £nil of deferred income (2019: £4 million) and £55 million (2019: £61 million) in respect of interest payable mainly related to tax matters. FII GLO deferred income of £963 million relates to receipts in 2015, in respect of the Franked Investment Income Government Litigation Order (note 6(b)). Amounts payable to related parties including associated undertakings are shown in note 26.
There is no material difference between the above amounts for trade and other payables and their fair value due to the short-term duration of the majority of trade and other payables, as determined using discounted cash flow analysis.
Trade and other payables are predominantly denominated in the functional currencies of subsidiary undertakings with less than 5% in other currencies (2019: less than 6% in other currencies).
| 212 | BAT Annual Report and Form 20-F 2020 |
Financial Statements
Notes on Accounts
Continued
22 Financial Instruments and Risk Management
|
Strategic Report |
Governance Report | Financial Statements | Other Information | BAT Annual Report and Form 20-F 2020 | 213 | |||||
|
|
22 Financial Instruments and Risk Management Continued
| 214 | BAT Annual Report and Form 20-F 2020 |
Financial Statements
Notes on Accounts
Continued
22 Financial Instruments and Risk Management Continued
|
Strategic Report |
Governance Report | Financial Statements | Other Information | BAT Annual Report and Form 20-F 2020 | 215 | |||||
|
|
22 Financial Instruments and Risk Management Continued
Price risk
The Group is exposed to price risk on investments held by the Group, which are included in investments held at fair value on the consolidated balance sheet, but the quantum of such is not material.
Hedge accounting
In order to qualify for hedge accounting, the Group is required to document prospectively the economic relationship between the item being hedged and the hedging instrument. The Group is also required to demonstrate an assessment of the economic relationship between the hedged item and the hedging instrument, which shows that the hedge will be highly effective on an ongoing basis. This effectiveness testing is repeated periodically to ensure that the hedge has remained, and is expected to remain, highly effective. The prospective effectiveness testing determines that an economic relationship between the hedged item and the hedging instrument exists.
In accordance with the Group Treasury Policy, the exact hedge ratios and profile of a hedge relationship will depend on several factors, including the desired degree of certainty and reduced volatility of net interest costs and market conditions, trends and expectations in the relevant markets. The sources of ineffectiveness include spot and forward differences, impact of time value and timing differences between periods in the hedged item and hedging instrument.
The Group’s risk management strategy has been explained in further detail under the interest rate risk and currency risk sections of this note.
Fair value estimation
The fair values of financial assets and liabilities with maturities of less than one year, other than derivatives, are assumed to approximate their book values. For other financial instruments which are measured at fair value in the balance sheet, the basis for fair values is described below.
Fair value hierarchy
The following table presents the Group’s financial assets and liabilities that are measured at fair value in accordance with IFRS 13 classification hierarchy:
| 2020 | 2019 | |||||||||||||||||||||||||||||||
| Level 1 £m |
Level 2 £m |
Level 3 £m |
Total £m |
Level 1 £m |
Level 2 £m |
Level 3 £m |
Total £m |
|||||||||||||||||||||||||
| Assets at fair value |
||||||||||||||||||||||||||||||||
| Investment held at fair value (note 14) |
171 | – | 93 | 264 | 78 | – | 57 | 135 | ||||||||||||||||||||||||
| Derivatives relating to |
||||||||||||||||||||||||||||||||
| – interest rate swaps (note 15) |
– | 65 | – | 65 | – | 180 | – | 180 | ||||||||||||||||||||||||
| – cross-currency swaps (note 15) |
– | 444 | – | 444 | – | 305 | – | 305 | ||||||||||||||||||||||||
| – forward foreign currency contracts (note 15) |
– | 288 | – | 288 | – | 280 | – | 280 | ||||||||||||||||||||||||
| Assets at fair value |
171 | 797 | 93 | 1,061 | 78 | 765 | 57 | 900 | ||||||||||||||||||||||||
| Liabilities at fair value |
||||||||||||||||||||||||||||||||
| Derivatives relating to |
||||||||||||||||||||||||||||||||
| – interest rate swaps (note 15) |
– | 53 | – | 53 | – | 255 | – | 255 | ||||||||||||||||||||||||
| – cross-currency swaps (note 15) |
– | – | – | – | – | 84 | – | 84 | ||||||||||||||||||||||||
| – forward foreign currency contracts (note 15) |
– | 266 | – | 266 | – | 129 | – | 129 | ||||||||||||||||||||||||
| Liabilities at fair value |
– | 319 | – | 319 | – | 468 | – | 468 | ||||||||||||||||||||||||
Level 2 financial instruments are not traded in an active market, but the fair values are based on quoted market prices, broker/dealer quotations, or alternative pricing sources with reasonable levels of price transparency. The Group’s level 2 financial instruments include OTC derivatives.
| 216 | BAT Annual Report and Form 20-F 2020 |
Financial Statements
Notes on Accounts
Continued
22 Financial Instruments and Risk Management Continued
Netting arrangements of derivative financial instruments
The gross fair value of derivative financial instruments as presented in the Group balance sheet, together with the Group’s rights of offset associated with recognised financial assets and recognised financial liabilities subject to enforceable master netting arrangements and similar agreements, is summarised as follows:
| 2020 |
2019 | |||||||||||||||||||||||||||
| Amount presented in the Group balance sheet* £m |
Related amounts not offset in the Group balance sheet £m |
Net amount £m |
Amount presented in the Group balance sheet* £m |
Related amounts not offset in the Group balance sheet £m |
Net amount £m |
|||||||||||||||||||||||
| Financial assets |
||||||||||||||||||||||||||||
| – Derivative financial instruments (note 15) |
797 | (237 | ) | 560 | 765 | (291 | ) | 474 | ||||||||||||||||||||
| Financial liabilities |
||||||||||||||||||||||||||||
| – Derivative financial instruments (note 15) |
(319) | 237 | (82 | ) | (468) | 291 | (177 | ) | ||||||||||||||||||||
| 478 | – | 478 | 297 | – | 297 | |||||||||||||||||||||||
| * | No financial instruments have been offset in the Group balance sheet. |
The Group is subject to master netting arrangements in force with financial counterparties with whom the Group trades derivatives.
The master netting arrangements determine the proceedings should either party default on their obligations. In case of any event of default: the non-defaulting party will calculate the sum of the replacement cost of outstanding transactions and amounts owed to it by the defaulting party. If that sum exceeds the amounts owed to the defaulting party, the defaulting party will pay the balance to the non-defaulting party. If the sum is less than the amounts owed to the defaulting party, the non-defaulting party will pay the balance to the defaulting party.
The hedged items by risk category are presented below:
| 2020 | ||||||||||||||||||||
|
Carrying amount £m |
Accumulated £m |
Line item in the
|
Changes in fair value used for calculating hedge ineffectiveness £m |
Cash flow hedge reserve (gross of tax) £m |
||||||||||||||||
| Fair value hedges |
||||||||||||||||||||
| Interest rate risk |
||||||||||||||||||||
| – borrowings (liabilities) |
5,356 | 173 | Borrowings | (57 | ) | |||||||||||||||
| Cash flow hedges |
||||||||||||||||||||
| Interest rate risk |
||||||||||||||||||||
| – borrowings (liabilities) |
2,816 | Borrowings | 155 | |
(628 |
) | ||||||||||||||
|
Strategic Report |
Governance Report | Financial Statements | Other Information | BAT Annual Report and Form 20-F 2020 | 217 | |||||
|
|
22 Financial Instruments and Risk Management Continued
| 2019 | ||||||||||||||||||||
|
Carrying amount £m |
Accumulated amount of fair value hedge adjustments on the hedged item included in the carrying amount of the hedged item £m |
Line item in the statement of financial item is included
|
Changes in fair value used for calculating hedge ineffectiveness £m |
Cash flow hedge reserve (gross of tax) £m |
||||||||||||||||
| Fair value hedges |
||||||||||||||||||||
| Interest rate risk |
||||||||||||||||||||
| – borrowings (liabilities) |
5,136 | 210 | Borrowings | (9 | ) | |||||||||||||||
| Cash flow hedges |
||||||||||||||||||||
| Interest rate risk |
||||||||||||||||||||
| – borrowings (liabilities) |
4,013 | Borrowings | 163 | (308 | ) | |||||||||||||||
| – derivative financial instruments (assets)* |
2 | |
Derivative financial instruments |
|
– | – | ||||||||||||||
| – derivative financial instruments (liabilities)* |
(49 | ) | |
Derivative financial instruments |
|
1 | (1 | ) | ||||||||||||
| * | In 2019, the carrying value reported for derivative financial instruments represents the aggregated exposure as at the balance sheet date. For assets, the gross nominal value amounted to £226 million and for liabilities, the gross nominal value amounted to £932 million. |
£392 million (2019: £372 million) of the Group’s borrowings are designated as net investment hedge instruments of the Group’s net investments in foreign operations. In line with the Group’s risk management policies, the net investment hedge relationships are reviewed periodically. A number of these relationships had matured in 2019. The change in the value used for calculating hedge ineffectiveness for hedged items designated under net investment hedge relationships is £21 million (2019: £22 million).
As at 31 December 2020, the total balance of the cash flow hedge reserve was a loss of £504 million (2019: loss of £346 million) including a loss of £628 million (2019: loss of £309 million) in relation to interest rate exposure and foreign currency exposure arising from borrowings held by the Group, £nil (2019: loss of £160 million) in relation to interest rate exposure on forecasted borrowings, and a gain of £139 million (2019: gain of £105 million) in relation to deferred tax arising from cash flow hedges. The remainder related to the Group’s foreign currency exposure on forecasted transactions, and cost of hedging (note 18(c)(ii)).
23 Business Combinations, Disposals and Other Changes in the Group
(a) Acquisitions
The Group acquired certain businesses and other tobacco assets as noted below. The financial impact of these transactions to the Group were immaterial individually and in aggregate. Except as noted, there were no material differences between the fair value and book values of net assets acquired in business combinations.
On 12 November 2020, the Group acquired 100% of the share capital in Eastern Tobacco Company for Trading, formerly known as Rafique Mohammed Sudki Jad Establishment for Trading when acting as BAT’s distributor in Saudi Arabia (KSA), for £50 million (SAR 246 million). Goodwill of £36 million, representing anticipated synergies, and trademarks and similar intangibles of £39 million, as well as £96 million of cash and cash equivalents, were recognised on acquisition. The transaction is expected to enable the Group to take ownership of its route to market in KSA.
On 21 December 2017, the Group signed an agreement to acquire 100% of the share capital of Twisp Proprietary Limited, a South African e-cigarette/nicotine vapour company with a market share of circa 70% within South Africa and a leading presence in shopping malls via its branded kiosks outlets. Completion of the proposed acquisition was conditional upon South African anti-trust clearance, which was given in the second half of 2019 and BAT acquired control on 30 September 2019 for a purchase price of £25 million of which £6 million is deferred and contingent upon future performance in the market. Goodwill of £12 million, representing a strategic premium to enter this segment of the South African vapour market, and trademarks and similar intangibles of £15 million were recognised on acquisition. Due to difficult trading conditions, the goodwill was fully impaired in 2020 and deferred consideration adjusted by £3 million.
On 8 April 2019, the Group via its US subsidiary R.J. Reynolds Vapor Company (RJR Vapor), acquired a 45% stake in VapeWild Holdings LLC, a vertically integrated vapour manufacturer and retailer with 13 branded vape shops and an e-commerce platform focused on its own branded liquids, for US$40 million. This was followed by a further acquisition of 15% on 24 June 2019 for US$8 million, giving the Group a 60% interest in the target for US$48 million (£36 million). The Group has accounted for these investments as a single transaction and has consolidated VapeWild as a subsidiary from the date of the first investment. Goodwill of £11 million, representing a strategic premium to enter this segment of the US vapour market, and trademarks and similar intangibles of £39 million were recognised on acquisition. Following the announcements with regards to flavours in vapour in the US, goodwill was impaired in full in 2019. The business was subsequently discontinued and liquidation proceedings commenced in December 2020.
| 218 | BAT Annual Report and Form 20-F 2020 |
Financial Statements
Notes on Accounts
Continued
23 Business Combinations, Disposals and Other Changes in the Group Continued
On 22 November 2018, the Group completed the acquisition of Quantus Beteiligungs-und Beratungsgesellschaft mbH, Germany’s leading vapour retail chain trading as ‘Highendsmoke’, from a private shareholder. The fair value of consideration payable was £21 million. Goodwill of £11 million, representing a strategic premium to enter the German vapour retail market, and trademarks and similar intangibles of £13 million were recognised on acquisition. As explained in note 8, at the end of 2019, acquired goodwill and intangibles were fully impaired.
On 26 September 2018, as part of an agreement to acquire an additional 44% stake in the Myanmar business, the Group acquired the business and individual assets of a local distributor, Star Way Limited, from IMU Enterprises Limited for £6 million. Goodwill of £3 million, representing anticipated synergies, was recognised on acquisition.
On 5 May 2017, the Group acquired certain tobacco assets, including a distribution company, Express Logistic and Distribution EOOD (ELD), from Bulgartabac Holding AD in Bulgaria. The assets acquired, including brands and other intangibles of £117 million, were purchased for a total consideration of £110 million, of which £28 million was contingent upon future performance in the market. £14 million of this was paid during 2018 and £13 million of this was paid during 2019. Subsequently, ELD was disposed of in 2019 at carrying value.
On 4 January 2017, the Group completed the acquisition of 100% of Winnington Holding AB, a Swedish manufacturer of ‘white’ snus, for a purchase price of £31 million. Goodwill of £8 million and brands and similar intangibles of £28 million were recognised. £8 million of the consideration was contingent on post-acquisition targets being met and was substantially settled in January 2019.
On 30 December 2015, the Group acquired 100% of the CHIC Group from private shareholders. The fair value of the consideration payable was £82 million, of which £30 million was contingent on achievement of certain post-acquisition targets. £6 million of this was paid during 2016, £13 million during 2017 and £1 million in final settlement in 2018.
On 17 November 2015, the Group acquired 100% of Blue Nile Cigarette Company Limited from a private shareholder. The fair value of the consideration payable was £45 million of which £8 million was contingent on achievement of certain post-acquisition targets. Subsequent payments in respect of this were £1 million in 2016, £5 million in 2017, £1 million in 2018 and £1 million in 2019.
On 30 September 2015, the Group acquired TDR and other tobacco and retail assets from Adris Grupa d.d. (Adris) for a total enterprise value of €550 million. Part of the consideration was contingent upon certain targets being met post-acquisition, and £5 million of this was paid in January 2017. In 2019, the Group reached an agreement with Adris regarding the level of contingent consideration such that any remaining amounts would not be paid by the Group and the Group received €3 million in full and final settlement of all claims between Adris and the Group. Consequently, €9 million of cash and deferred consideration was recognised as other income (note 3(e)).
(b) Non-controlling interests
In 2020, the Group made a capital contribution to Brascuba Cigarrillos S.A. at a cost of £17 million (2019: £20 million). This contribution was in proportion to a capital contribution made by the non-controlling interest to the company and as such, the Group’s shareholding remains unchanged.
In 2018, included in the acquisition of non-controlling interests are the purchases of the remaining shares in British American Tobacco Vranje a.d. in Serbia and an additional 44% stake in British American Tobacco Myanmar Limited. The financial impact of these transactions to the Group is immaterial individually and in aggregate.
(c) Other transactions
On 20 October 2020, the Group acquired the formulations, brands, associated know-how and other relevant assets owned by Dryft Sciences, LLC (DSL) relating to its white nicotine pouch products for consideration of up to US$150 million payable in accordance with the achievement of certain milestones. The transaction has been accounted for as an asset acquisition, rather than as a business combination, as the intellectual property and associated assets acquired do not represent an integrated set of activities required by IFRS for business combination accounting. Consequently, the consideration payable has been assigned to the acquired assets by relative fair value.
During 2020, the Group increased its ownership of a wholesale producer and distributor operating in the agriculture sector based in Uzbekistan, FE “Samfruit” JSC to 38.63%, for £5 million.
On 10 January 2019, the Group acquired a minority stake in AYR Limited, a vapour technology company based in the UK, for £8 million, with the potential to increase this in the future. The investment terms also provide for the Group and AYR to agree a commercial collaboration agreement under which the Group and AYR will jointly develop future vaping products.
|
Strategic Report |
Governance Report | Financial Statements | Other Information | BAT Annual Report and Form 20-F 2020 | 219 | |||||
|
|
24 Share-Based Payments
The Group operates a number of share-based payment arrangements of which the two principal ones are:
Long-Term Incentive Plan (LTIP)
Awards granted in 2020 under the Long-Term Incentive Plan are the Performance Share Plan and the Restricted Share Plan with the following conditions:
Performance Share Plan (PSP): nil-cost options released three years from date of grant. Payout is subject to performance conditions based on earnings per share (40% of grant), operating cash flow (20% of grant), total shareholder return (20% of grant) and net turnover (20% of grant) in 2020, 2019 and 2018. Total shareholder return combines the share price and dividend performance of the Company by reference to one comparator group. Participants are not entitled to dividends prior to the exercise of the options. A cash equivalent dividend accrues through the vesting period and is paid on vesting. Both equity and cash-settled PSP awards are granted in March each year.
Restricted Share Plan (RSP): Nil-cost options released three years from date of grant and may be subject to forfeit if a participant leaves employment before the end of the three-year holding period. Participants are not entitled to dividends prior to the exercise of the options. A cash equivalent dividend accrues through the vesting period and is paid on vesting. Both equity and cash-settled RSP awards were granted in March.
Awards granted in 2018 and 2019 are nil-cost options exercisable after three years from date of grant with a contractual life of 10 years. The performance conditions and the dividend entitlement attached to these awards are identical to the PSP award mentioned above. Both equity and cash-settled LTIP awards were granted in March.
Following the acquisition of Reynolds American on 25 July 2017, underlying Reynolds American shares for LTIPs were replaced with BAT American Depositary Shares (ADS). LTIP awards for ADSs are measured against the performance conditions of Reynolds American at the maximum of 150% at the vesting date. Equity-settled LTIPs were granted by Reynolds American in March each year with options exercisable after three years from the date of grant with the payment made no later than 90 days from date of vesting. Participants are not entitled to dividends prior to exercise of the options.
Deferred Share Bonus Scheme (DSBS)
Free ordinary shares released three years from date of grant and may be subject to forfeit if a participant leaves employment before the end of the three-year holding period. Participants receive a separate payment equivalent to a proportion of the dividend payment during the holding period. Both equity and cash-settled deferred shares are granted in March each year.
The Group also has a number of other arrangements which are not material for the Group and these are as follows:
Sharesave Scheme (SAYE)
Options granted in March each year from 2011 onwards (previously November until 2009 and no options were granted during 2010) by invitation at a 20% discount to the market price. Options to this equity-settled scheme are exercisable at the end of a three-year or five-year savings contract. Participants are not entitled to dividends prior to the exercise of the options. The maximum amount that can be saved by a participant in this way is £6,000 in any tax year.
Share Reward Scheme (SRS) and International Share Reward Scheme (ISRS)
Free shares granted in April each year (maximum £3,600 in any year) under the equity-settled schemes are subject to a three-year holding period. Participants receive dividends during the holding period which are reinvested to buy further shares.
Partnership Share Scheme
Open to all eligible employees, where employees can allocate part of their pre-tax salary to purchase shares in British American Tobacco p.l.c.. The maximum amount that can be allocated in this way to any individual is £1,800 in any tax year. The shares purchased are held in a UK-based trust and are normally capable of transfer to participants tax-free after a five-year holding period.
Share-based payment expense
The amounts recognised in the income statement in respect of share-based payments were as follows:
| 2020 | 2019 | 2018 | ||||||||||||||||||||||
|
Equity- £m |
Cash- £m |
Equity- £m |
Cash- £m |
Equity- £m |
Cash- £m |
|||||||||||||||||||
| LTIP (note (a)) |
36 | – | 58 | 1 | 70 | – | ||||||||||||||||||
| DSBS (note (b)) |
44 | 3 | 50 | 4 | 44 | 2 | ||||||||||||||||||
| Other schemes |
8 | – | 7 | – | 7 | – | ||||||||||||||||||
| Total recognised in the income statement (note 3(a)) |
88 | 3 | 115 | 5 | 121 | 2 | ||||||||||||||||||
| 220 | BAT Annual Report and Form 20-F 2020 |
Financial Statements
Notes on Accounts
Continued
24 Share-Based Payments Continued
Share-based payment liability
The Group issues to certain employees cash-settled share-based payments that require the Group to pay the intrinsic value of these share-based payments to the employee at the date of exercise. The Group has recorded liabilities in respect of vested and unvested grants at the end of 2020 and 2019:
| 2020 |
2019 |
|||||||||||||||||||
| Vested £m |
Unvested £m |
Vested £m |
Unvested £m |
|||||||||||||||||
| LTIP |
0.3 | 1.5 | 0.5 | 2.8 | ||||||||||||||||
| DSBS |
0.2 | 5.7 | 0.3 | 6.2 | ||||||||||||||||
| Total liability |
0.5 | 7.2 | 0.8 | 9.0 | ||||||||||||||||
(a) Long-Term incentive Plan
Details of the movements for the equity- and cash-settled LTIP scheme during the years ended 31 December 2020 and 31 December 2019, were as follows:
| 2020 |
2019 |
|||||||||||||||||||
| Equity- settled Number of options in thousands |
Cash- settled Number of options in thousands |
Equity- settled Number of options in thousands |
Cash- settled Number of options in thousands |
|||||||||||||||||
| Outstanding at start of year |
9,193 | 318 | 6,908 | 306 | ||||||||||||||||
| Granted during the period |
3,856 | 109 | 4,552 | 202 | ||||||||||||||||
| Exercised during the period |
(1,590 | ) | (63 | ) | (1,045 | ) | (129 | ) | ||||||||||||
| Forfeited during the period |
(1,459 | ) | (90 | ) | (1,222 | ) | (61 | ) | ||||||||||||
| Outstanding at end of year |
10,000 | 274 | 9,193 | 318 | ||||||||||||||||
| Exercisable at end of year |
690 | 27 | 739 | 25 | ||||||||||||||||
As at 31 December 2020, the Group has 10,000,000 shares (2019: 9,193,000 shares) outstanding which includes 2,876,738 shares (2019: 2,479,057 shares) which are related to Reynolds American LTIP awards from which nil shares (2019: 43,924 shares) are exercisable at the end of the year.
The weighted average British American Tobacco p.l.c. share price at the date of exercise for share options exercised during the period was £29.37 (2019: £28.31; 2018: £38.90) for equity-settled and £28.68 (2019: £30.87; 2018: £40.62) for cash-settled options.
The weighted average British American Tobacco p.l.c. share price for ADS on the New York Stock Exchange at the date of exercise for share options exercised during the period relating to equity-settled Reynolds American LTIP awards was US$40.04 (2019: US$36.35; 2018: US$51.43).
The outstanding shares for the year ended 31 December 2020 had a weighted average remaining contractual life of 8.1 years (2019: 8.2 years; 2018: 8.1 years) for the equity-settled scheme, 1.72 years for Reynolds American equity-settled scheme (2019: 1.93 years; 2018: 1.91 years) and 8.1 years (2019: 8.3 years; 2018: 8.1 years) for the cash-settled share-based payment arrangements.
(b) Deferred Share Bonus Scheme
Details of the movements for the equity- and cash-settled DSBS scheme during the years ended 31 December 2020 and 31 December 2019, were as follows:
| 2020 |
2019 |
|||||||||||||||||||
| Equity- settled Number of options in thousands |
Cash- settled Number of options in thousands |
Equity- settled Number of options in thousands |
Cash- settled Number of options in thousands |
|||||||||||||||||
| Outstanding at start of year |
3,748 | 282 | 3,248 | 281 | ||||||||||||||||
| Granted during the period |
1,829 | 109 | 2,097 | 202 | ||||||||||||||||
| Exercised during the period |
(1,368 | ) | (175 | ) | (1,500 | ) | (184 | ) | ||||||||||||
| Forfeited during the period |
(68 | ) | (16 | ) | (97 | ) | (17 | ) | ||||||||||||
| Outstanding at end of year |
4,141 | 200 | 3,748 | 282 | ||||||||||||||||
| Exercisable at end of year |
91 | 4 | 90 | 6 | ||||||||||||||||
|
Strategic Report |
Governance Report | Financial Statements | Other Information | BAT Annual Report and Form 20-F 2020 | 221 | |||||
|
|
24 Share-Based Payments Continued
The weighted average British American Tobacco p.l.c. share price at the date of exercise for share options exercised during the financial year was £28.08 (2019: £28.40; 2018: £40.00) for equity-settled and £28.06 (2019: £30.06; 2018: £40.51) for cash-settled options.
The outstanding shares for the year ended 31 December 2020 had a weighted average remaining contractual life of 1.4 years (2019: 1.5 years; 2018: 1.3 years) for the equity-settled scheme and 1.4 years (2019: 1.5 years; 2018: 1.1 years) for the cash-settled scheme.
Valuation assumptions
Assumptions used in the Black-Scholes models to determine the fair value of share options at grant date were as follows:
| 2020 | 2019 | |||||||||||||||
| LTIP | DSBS | LTIP | DSBS | |||||||||||||
| Expected volatility (%) |
25.0 | 25.0 | 22.0 | 22.0 | ||||||||||||
| Average expected term to exercise (years)* |
3.5 /3.0 | 3.0 | 3.5 | 3.0 | ||||||||||||
| Risk-free rate (%) |
0.2 | 0.2 | 0.7 | 0.7 | ||||||||||||
| Expected dividend yield (%) |
7.9 | 7.9 | 6.5 | 6.5 | ||||||||||||
| Expected dividend yield (%) – Management Board |
7.9 | 7.9 | 6.0 | 6.0 | ||||||||||||
| Share price at date of grant (£) |
26.33 | 26.33 | 30.83 | 30.83 | ||||||||||||
| Share price at date of grant (£) – Management Board |
26.33 | 26.33 | 33.28 | 33.28 | ||||||||||||
| Fair value at grant date (£)* |
21.23 / 20.76 | 20.76 | 21.93 | 25.35 | ||||||||||||
| Fair value at grant date (£) – Management Board* |
21.23 / 20.76 | 20.76 | 24.03 | 25.35 | ||||||||||||
| * | Where two figures have been quoted for the Long Term Incentive Plan, the numbers relate to PSP and RSP awards, respectively. |
Market condition features were incorporated into the Monte-Carlo models for the total shareholder return elements of the LTIP, in determining fair value at grant date. Assumptions used in these models were as follows:
| 2020 LTIP (PSP) |
2019 LTIP |
|||||||
| Average share price volatility FMCG comparator group (%) |
21 | 18 | ||||||
| Average correlation FMCG comparator group (%) |
31 | 28 | ||||||
Fair values determined from the Black-Scholes and Monte-Carlo models use assumptions revised at the end of each reporting period for cash-settled share-based payment arrangements.
The expected British American Tobacco p.l.c. share price volatility was determined taking account of the return index (the share price index plus the dividend reinvested) over a five-year period. The FMCG share price volatility and correlation was also determined over the same periods. The average expected term to exercise used in the models has been adjusted, based on management’s best estimate, for the effects of non-transferability, exercise restrictions and behavioural conditions, forfeiture and historical experience.
The risk-free rate has been determined from market yield curves for government gilts with outstanding terms equal to the average expected term to exercise for each relevant grant. The expected dividend yield was determined by calculating the yield from the last two declared dividends divided by the grant share price.
In addition to these valuation assumptions, LTIP awards, excluding RSP, contain earnings per share performance conditions. As these are non-market performance conditions they are not included in the determination of fair value of share options at the grant date, however they are used to estimate the number of awards expected to vest. This pay-out calculation is based on expectations published in analysts’ forecasts.
| 222 | BAT Annual Report and Form 20-F 2020 |
Financial Statements
Notes on Accounts
Continued
25 Group Employees
The average number of persons employed by the Group and its associates during the year, including Directors, was 89,182 (2019: 94,846).
| 2020 Number |
2019 Number |
|||||||
| United States |
4,914 | 5,046 | ||||||
| APME |
12,703 | 14,910 | ||||||
| AMSSA |
17,869 | 18,638 | ||||||
| ENA |
23,957 | 25,505 | ||||||
| Subsidiary undertakings |
59,443 | 64,099 | ||||||
|
Associates |
29,739 | 30,747 | ||||||
| 89,182 | 94,846 | |||||||
Included within the employee numbers for ENA are certain employees in the UK in respect of central functions. Some of the costs of these employees are allocated or charged to the various regions and markets in the Group.
26 Related Party Disclosures
The Group has a number of transactions and relationships with related parties, as defined in IAS 24 Related Party Disclosures, all of which are undertaken in the normal course of business. Transactions with CTBAT International Limited (a joint operation) are not included in these disclosures as the results are immaterial to the Group.
Transactions and balances with associates relate mainly to the sale and purchase of cigarettes and tobacco leaf. The Group’s share of dividends from associates, included in other net income in the table below, was £394 million (2019: £239 million; 2018: £211 million).
| 2020 £m |
2019 £m |
2018 £m |
||||||||||
| Transactions |
||||||||||||
| – revenue |
495 | 511 | 473 | |||||||||
| – purchases |
(80 | ) | (79 | ) | (101 | ) | ||||||
| – other net income |
388 | 248 | 216 | |||||||||
| Amounts receivable at 31 December |
33 | 42 | 26 | |||||||||
| Amounts payable at 31 December |
(5 | ) | (2 | ) | (1 | ) | ||||||
During 2020, the Group made a capital contribution in Brascuba Cigarrillos S.A. at a cost of £17 million (2019: £20 million) and increased its ownership of FE “Samfruit” JSC to 38.63% for £5 million.
During 2020, there was a capital reduction in CTBAT International Limited of approximately US$171 million with funds due to be remitted prorate to investors in 2021.
During 2019, the Group acquired 60% of VapeWild Holdings LLC and a minority stake in AYR Limited.
During 2018, the Group acquired a further 44% interest in British American Tobacco Myanmar Limited and a further 11% interest in British American Tobacco Vranje.
The key management personnel of British American Tobacco consist of the members of the Board of Directors of British American Tobacco p.l.c. and the members of the Management Board. No such person had any material interest during the year in a contract of significance (other than a service contract) with the Company or any subsidiary company. The term key management personnel in this context includes their close family members.
| 2020 £m |
2019 £m |
2018 £m |
||||||||||
| The total compensation for key management personnel, including Directors, was: |
||||||||||||
| – salaries and other short-term employee benefits |
17 | 26 | 21 | |||||||||
| – post-employment benefits |
2 | 4 | 4 | |||||||||
|
– share-based payments |
13 | 23 | 18 | |||||||||
| 32 | 53 | 43 | ||||||||||
|
Strategic Report |
Governance Report | Financial Statements | Other Information | BAT Annual Report and Form 20-F 2020 | 223 | |||||
|
|
26 Related Party Disclosures Continued
The following table, which is not part of IAS 24 disclosures, shows the aggregate emoluments of the Directors of the Company.
| Executive Directors | Chairman | Non-Executive Directors | Total | |||||||||||||||||||||||||||||||||||||||||||||
| 2020 £’000 |
2019 £’000 |
2018 £’000 |
2020 £’000 |
2019 £’000 |
2018 £’000 |
2020 £’000 |
2019 £’000 |
2018 £’000 |
2020 £’000 |
2019 £’000 |
2018 £’000 |
|||||||||||||||||||||||||||||||||||||
| Salary; fees; benefits; incentives |
||||||||||||||||||||||||||||||||||||||||||||||||
| – salary |
2,026 | 2,356 | 2,211 | 2,026 | 2,356 | 2,211 | ||||||||||||||||||||||||||||||||||||||||||
| – fees |
714 | 695 | 680 | 1,028 | 969 | 1,092 | 1,742 | 1,664 | 1,772 | |||||||||||||||||||||||||||||||||||||||
| – taxable benefits |
744 | 608 | 427 | 77 | 137 | 116 | 72 | 310 | 303 | 893 | 1,055 | 846 | ||||||||||||||||||||||||||||||||||||
| – short-term incentives |
3,274 | 4,791 | 5,031 | 3,274 | 4,791 | 5,031 | ||||||||||||||||||||||||||||||||||||||||||
|
– long-term incentives |
1,294 | 4,420 | 5,300 | 1,294 | 4,420 | 5,300 | ||||||||||||||||||||||||||||||||||||||||||
| Sub-total |
7,338 | 12,175 | 12,969 | 791 | 832 | 796 | 1,100 | 1,279 | 1,395 | 9,229 | 14,286 | 15,160 | ||||||||||||||||||||||||||||||||||||
| Pension; other emoluments |
||||||||||||||||||||||||||||||||||||||||||||||||
| – pension |
304 | 686 | 921 | 304 | 686 | 921 | ||||||||||||||||||||||||||||||||||||||||||
| – other emoluments |
20 | 47 | 50 | 20 | 47 | 50 | ||||||||||||||||||||||||||||||||||||||||||
| Sub-total |
324 | 733 | 971 | 324 | 733 | 971 | ||||||||||||||||||||||||||||||||||||||||||
| Total emoluments |
7,662 | 12,908 | 13,940 | 791 | 832 | 796 | 1,100 | 1,279 | 1,395 | 9,553 | 15,019 | 16,131 | ||||||||||||||||||||||||||||||||||||
Aggregate gains on LTIP shares exercised in the year
| Award | Exercised LTIP shares |
Exercise date | Price per share (£) | Aggregate gain (£) | ||||||||||
| Jack Bowles |
27 March 2017 | 18,497 | 06 April 2020 | 29.62 | 547,881 | |||||||||
| Tadeu Marroco |
27 March 2017 | 14,755 | 08 June 2020 | 31.23 | 460,799 | |||||||||
LTIP – Value of awards 2017
| Shares |
Price per share (£)1 |
Face value (£) | ||||||||||
| Jack Bowles |
26,463 | 52.11 | 1,378,987 | |||||||||
| Tadeu Marroco |
21,109 | 52.11 | 1,099,990 | |||||||||
Note:
1. For information only as awards are made as nil-cost options.
Sharesave – Aggregate Gains 2020
| Award date | Shares | Exercise date | Price per share (£) | Aggregate gain (£) | ||||||||||||
| Tadeu Marroco |
23 March 2015 | 495 | 09 June 2020 | 30.26 | 0 | |||||||||||
Sharesave – Value of award 2015
| Shares | Price per share (£) | Face value (£) | ||||||||||
| Tadeu Marroco |
495 | 30.26 | 14,979 | |||||||||
| 224 | BAT Annual Report and Form 20-F 2020 |
Financial Statements
Notes on Accounts
Continued
27 Contingent Liabilities and Financial Commitments
|
Strategic Report |
Governance Report | Financial Statements | Other Information | BAT Annual Report and Form 20-F 2020 | 225 | |||||
|
|
27 Contingent Liabilities and Financial Commitments Continued
| Case Type | Case Numbers as at 31 December 2020 |
Case Numbers as at 31 December 2019 (note 1) |
Change in Number Increase/(decrease) |
|||||||||
| US tobacco-related actions |
||||||||||||
| Medical reimbursement cases (note 2) |
2 | 2 | No change | |||||||||
| Class actions (note 3) |
20 | 19 | 1 | |||||||||
| Individual smoking and health cases (note 4) |
189 | 135 | 54 | |||||||||
| Engle Progeny Cases (note 5) |
1,400 | 1,773 | (373 | ) | ||||||||
| Broin II Cases (note 6) |
1,227 | 1,228 | (1 | ) | ||||||||
| Filter Cases (note 7) |
48 | 51 | (3 | ) | ||||||||
| State Settlement Agreements – Enforcement and Validity (note 8) |
4 | 4 | No change | |||||||||
| Non-US tobacco-related actions |
||||||||||||
| Medical reimbursement cases |
19 | 18 | 1 | |||||||||
| Class actions (note 9) |
12 | 13 | (1 | ) | ||||||||
| Individual smoking and health cases (note 10) |
68 | 81 | (13 | ) | ||||||||
(Note 1) This includes cases to which the Reynolds American Inc. (Reynolds American) group companies were a party at such date.
(Note 2) This category of cases includes the Department of Justice action. See note 27, paragraphs 20-24.
(Note 3) See note 27, paragraphs 25-38.
(Note 4) This category of cases includes smoking and health cases alleging personal injuries caused by tobacco use or exposure brought by or on behalf of individual plaintiffs based on theories of negligence, strict liability, breach of express or implied warranty and violations of state deceptive trade practices or consumer protection statutes. The plaintiffs seek to recover compensatory damages, attorneys’ fees and costs and punitive damages. Out of the 189 active individual smoking and health cases, four judgments have been returned in the plaintiffs’ favour, awarding damages totalling approximately US$147 million (approximately £108 million), which are pending post-trial in trial courts or on appeal. For a further description of these cases, see note 27, paragraphs 39-40.
(Note 5) In July 1998, trial began in Engle v. R.J. Reynolds Tobacco Co., a then-certified class action filed in Circuit Court, Miami-Dade County, Florida, against US cigarette manufacturers, including R. J. Reynolds Tobacco Co. (RJRT) (individually, and as successor by merger to Lorillard Tobacco Company (Lorillard Tobacco)) and Brown & Williamson Holdings, Inc. (formerly Brown & Williamson Tobacco Corporation) (B&W). In July 2000, the jury in Phase II awarded the class a total of approximately US$145 billion (approximately £106 billion) in punitive damages, apportioned US$36.3 billion (approximately £26.6 billion) to RJRT, US$17.6 billion (approximately £12.9 billion) to B&W, and US$16.3 billion (approximately £11.9 billion) to Lorillard Tobacco. This decision was appealed and ultimately resulted in the Florida Supreme Court in December 2006 decertifying the class and allowing judgments entered for only two of the three Engle class representatives to stand and setting aside the punitive damages award. Putative Engle class members were permitted to file individual lawsuits, deemed ‘Engle progeny cases’, against the Engle defendants, within one year of the Supreme Court’s decision (subsequently extended to 11 January 2008). Between the period 1 January 2018 and 31 December 2020, 33 judgments have been returned in the plaintiffs’ favour, awarding damages totalling approximately US$332.2 million (approximately £243 million). Certain of these judgments have been appealed by RJRT and in certain other cases, RJRT still had time to appeal, as of 31 December 2020. For a further description of the Engle progeny cases, see note 27, paragraphs 29-38 seq.
(Note 6) Broin v. Philip Morris, Inc. was a class action filed in Circuit Court in Miami-Dade County, Florida in 1991 and brought on behalf of flight attendants alleged to have suffered from diseases or ailments caused by exposure to Environmental Tobacco Smoke (ETS) in airplane cabins. Group companies and other cigarette manufacturer defendants settled Broin, agreeing to pay a total of US$300 million (approximately £219.5 million) to fund research on the detection and cure of tobacco-related diseases and US$49 million (approximately £35.8 million) in plaintiffs’ counsel’s fees and expenses. Group companies’ share of these payments totalled US$174 million (approximately £127.3 million). Broin II cases refer to individual cases by class members. There have been no Broin II trials since 2007. For a further description of the Broin II cases, see note 16 to paragraph 40.
(Note 7) Includes claims brought against Lorillard Tobacco and Lorillard Inc. by individuals who seek damages resulting from their alleged exposure to asbestos fibres that were incorporated into filter material used in one brand of cigarettes manufactured by a predecessor to Lorillard Tobacco for a limited period of time ending more than 50 years ago. Since 1 January 2018, Lorillard Tobacco and RJRT have paid, or have reached agreement to pay, a total of approximately US$31.3 million (approximately £22.9 million) in settlements to resolve 124 Filter Cases. See note 17 to paragraph 40.
(Note 8) Group companies’ expenses and payments under the State Settlement Agreements for 2020 amounted to approximately US$3.6 billion (approximately £2.6 billion) in respect of settlement expenses and US$2.9 billion (approximately £2.1 billion) in respect of settlement cash payments. See note 27, paragraph 43. The pending cases referred to above relate to the enforcement, validity or interpretation of the State Settlement Agreements in which RJRT, B&W or Lorillard Tobacco is a party. See note 27, paragraphs 41-53.
| 226 | BAT Annual Report and Form 20-F 2020 |
Financial Statements
Notes on Accounts
Continued
27 Contingent Liabilities and Financial Commitments Continued
|
Strategic Report |
Governance Report | Financial Statements | Other Information | BAT Annual Report and Form 20-F 2020 | 227 | |||||
|
|
27 Contingent Liabilities and Financial Commitments Continued
| 228 | BAT Annual Report and Form 20-F 2020 |
Financial Statements
Notes on Accounts
Continued
27 Contingent Liabilities and Financial Commitments Continued
|
Strategic Report |
Governance Report | Financial Statements | Other Information | BAT Annual Report and Form 20-F 2020 | 229 | |||||
|
|
27 Contingent Liabilities and Financial Commitments Continued
| 33. | As at 31 December 2020, there were approximately 1,400 Engle progeny cases pending in which RJRT, B&W and/or Lorillard Tobacco have all been named as defendants and served. These cases include claims by or on behalf of 1,725 plaintiffs. In addition, as of 31 December 2020, RJRT was aware of seven additional Engle progeny cases that have been filed but not served. The number of pending cases fluctuates for a variety of reasons, including voluntary and involuntary dismissals. Voluntary dismissals include cases in which a plaintiff accepts an ‘offer of judgment’ from RJRT, Lorillard Tobacco and/or RJRT’s affiliates and indemnitees. An offer of judgment, if rejected by the plaintiff, preserves RJRT’s and Lorillard Tobacco’s right to recover attorneys’ fees under Florida law in the event of a verdict favourable to RJRT or Lorillard Tobacco, or affiliates of such entities. Such offers are sometimes made through court-ordered mediations. |
| 34. | 71 trials occurred in Engle progeny cases in Florida state and federal courts against RJRT, B&W and/or Lorillard Tobacco from 1 January 2018 through 31 December 2020, and additional state court trials are scheduled for 2021. |
| 35. | The following chart identifies the number of trials in Engle progeny cases as at 31 December 2020 and additional information about the adverse judgments entered: |
Trials/verdicts/judgments of individual Engle progeny cases from 1 January 2018 through 31 December 2020:
| Total number of trials |
71 | |
| Number of trials resulting in plaintiffs’ verdicts |
33** | |
| Total damages awarded in final judgments against RJRT |
US$332,210,000 (approximately £243 million) | |
| Amount of overall damages comprising ‘compensatory damages’ (approximately) |
US$107,621,000 (of overall US$332,210,000) (approximately £78.7 million of £243 million) | |
| Amount of overall damages comprising ‘punitive damages’ (approximately) |
US$224,589,000 (of overall US$332,210,000) (approximately £164.3 million of £243 million) | |
** Of the 33 trials resulting in plaintiffs’ verdicts 1 January 2018 to 31 December 2020 (note 11):
| Number of adverse judgments appealed by RJRT |
24 (note 12) | |
| Number of adverse judgments, in which RJRT still has time to file an appeal |
0 | |
| Number of adverse judgments in which an appeal was not, and can no longer be, sought |
8 | |
| Appeals of individual Engle progeny cases 1 January 2018 to 31 December 2020: |
||
| Number of adverse judgments appealed by RJRT |
26 (note 13) | |
Note 11: the 33 trials include two cases that were tried twice (Gloger v. R.J. Reynolds Tobacco Co. and Bessent-Dixon v. R.J. Reynolds Tobacco Co.) and one case (Robert Miller v. R.J. Reynolds Tobacco Co.) where plaintiff moved for a mistrial following a plaintiff’s verdict where the jury awarded no compensatory or punitive damages, and an adverse judgment has not yet been entered.
Note 12: of the 24 adverse judgments appealed by RJRT as a result of judgments arising in the period 1 January 2018 to 31 December 2020:
| a. | 10 appeals remain undecided in the District Courts of Appeal; and one case has been affirmed but the rehearing time is pending; |
| b. | 12 appeals were decided and/or closed in the District Court of Appeals. Of these 12 appeals, seven were affirmed in favour of plaintiff. One was reversed for a new trial, one was voluntarily dismissed and judgment paid, one was involuntarily dismissed, and one was affirmed in part, reversed in part, for additur or a new trial, one was reversed in part for reinstatement of jury’s punitive damages verdict and entry of amended final judgment. |
Note 13: of the 26 adverse judgments appealed by RJRT (during the period 1 January 2018 to 31 December 2020):
| a. | 10 appeals remain undecided in the District Courts of Appeal and one case affirmed but rehearing time pending; |
| b. | 15 were decided and/or closed in the District Courts of Appeal. Of these appeals, nine were affirmed in favour of plaintiff, one was reversed for a new trial, one was voluntarily dismissed and judgment paid, one was involuntarily dismissed, one was affirmed in part, reversed in part, for additur or a new trial, one reversed in part for reinstatement of jury’s punitive damages verdict and entry of amended final judgment. Note that one appeal was reversed in the Eleventh Circuit for entry of order granting Defendants’ motion for judgment in accordance with the verdict; and |
| c. | does not include two cases that were appealed prior to the relevant time period but which remain pending before the Florida Supreme Court. |
| 36. | By statute, Florida applies a US$200 million (approximately £146.3 million) bond cap to all Engle progeny cases in the aggregate. Individual bond caps for any given Engle progeny case vary depending on the number of judgments in effect at a given time. Judicial attempts by several plaintiffs in the Engle progeny cases to challenge the bond cap as violating the Florida Constitution have failed. In addition, bills have been introduced in sessions of the Florida legislature that would eliminate the Engle progeny bond cap, but those bills have not been enacted as of 31 December 2020. |
| 37. | In 2020, RJRT or Lorillard Tobacco paid judgments in eight Engle progeny cases. Those payments totalled US$73.7 million (approximately £53.9 million) in compensatory or punitive damages. Additional costs were paid in respect of attorneys’ fees and statutory interest. |
| 38. | In addition, accruals for damages and attorneys’ fees and statutory interest for one case (Starr-Blundell v. R. J. Reynolds Tobacco Co.) was recorded in Reynolds American’s consolidated balance sheet as of 31 December 2020 to the value of US$69,200 (approximately £50,621). |
| 230 | BAT Annual Report and Form 20-F 2020 |
Financial Statements
Notes on Accounts
Continued
27 Contingent Liabilities and Financial Commitments Continued
(c) Individual Cases
| 39. | As of 31 December 2020, 189 individual cases were pending in the United States against RJRT, B&W and/or Lorillard Tobacco. This category of cases includes smoking and health cases alleging personal injuries caused by tobacco use or exposure brought by or on behalf of individual plaintiffs based on theories of negligence, strict liability, breach of express or implied warranty, and violations of state deceptive trade practices or consumer protection statutes. The plaintiffs seek to recover compensatory damages, attorneys’ fees and costs, and punitive damages. The category does not include the Engle progeny cases, Broin II cases, and Filter Cases discussed above and below. One of the individual cases is brought by or on behalf of an individual or his/her survivors alleging personal injury as a result of exposure to ETS. |
| 40. | The following chart identifies the number of individual cases pending as of 31 December 2020 as against the number pending as of 31 December 2019, along with the number of Engle progeny cases, Broin II cases, and Filter Cases, which are discussed further below. |
| US Case Numbers | US Case Numbers | Change in Number | ||||||||||
| Case Type | 31 December 2020 | 31 December 2019 | Increase/(Decrease) | |||||||||
| Individual Smoking and Health Cases (note 14) |
189 | 135 | 54 | |||||||||
| Engle Progeny Cases (Number of Plaintiffs) (note 15) |
1,400 (1,725) | 1,773 (2,228) | (373) (503) | |||||||||
| Broin II Cases (note 16) |
1,227 | 1,228 | (1) | |||||||||
| Filter Cases (note 17) |
48 | 51 | (3) | |||||||||
(Note 14) Out of the 189 pending individual smoking and health cases, four have received adverse verdicts or judgments in the court of first instance or on appeal, and the total amount of those verdicts or judgments is approximately US$147 million (approximately £108 million).
(Note 15) The number of Engle progeny cases will fluctuate as cases are dismissed or if any of the dismissed cases are appealed. Please see earlier table in paragraph 35.
(Note 16) Broin v. Philip Morris, Inc. was a class action filed in Circuit Court in Miami-Dade County, Florida in 1991 and brought on behalf of flight attendants alleged to have suffered from diseases or ailments caused by exposure to ETS in airplane cabins. In October 1997, RJRT, B&W, Lorillard Tobacco and other cigarette manufacturer defendants settled Broin, agreeing to pay a total of US$300 million (approximately £220 million) in three annual US$100 million (approximately £73 million) instalments, allocated among the companies by market share, to fund research on the early detection and cure of diseases associated with tobacco smoke. It also required those companies to pay a total of US$49 million (approximately £36 million) for the plaintiffs’ counsel’s fees and expenses. RJRT’s portion of these payments was approximately US$86 million (approximately £63 million); B&W’s was approximately US$57 million (approximately £41 million); and Lorillard Tobacco’s was approximately US$31 million (approximately £23 million). The settlement agreement, among other things, limits the types of claims class members may bring and eliminates claims for punitive damages. The settlement agreement also provides that, in individual cases by class members that are referred to as Broin II lawsuits, the defendants will bear the burden of proof with respect to whether ETS can cause certain specifically enumerated diseases, referred to as ‘general causation’. With respect to all other liability issues, including whether an individual plaintiff’s disease was caused by his or her exposure to ETS in airplane cabins, referred to as ‘specific causation’, individual plaintiffs will bear the burden of proof. On 7 September 1999, the Florida Supreme Court approved the settlement. There have been no Broin II trials since 2007. There have been periodic efforts to activate cases and the Group expects this to continue over time.
(Note 17) Includes claims brought against Lorillard Tobacco and Lorillard Inc. by individuals who seek damages resulting from their alleged exposure to asbestos fibres that were incorporated into filter material used in one brand of cigarettes manufactured by a predecessor to Lorillard Tobacco for a limited period of time ending more than 50 years ago. Pursuant to the terms of a 1952 agreement between P. Lorillard Company and H&V Specialties Co., Inc. (the manufacturer of the filter material), Lorillard Tobacco is required to indemnify Hollingsworth & Vose for legal fees, expenses, judgments and resolutions in cases and claims alleging injury from finished products sold by P. Lorillard Company that contained the filter material. As of 31 December 2020, Lorillard Tobacco and/or Lorillard Inc. was a defendant in 48 Filter Cases. Since 1 January 2018, Lorillard Tobacco and RJRT have paid, or have reached agreement to pay, a total of approximately US$31.3 million (approximately £22.8 million) in settlements to resolve 124 Filter Cases.
(d) State Settlement Agreements
| 41. | In November 1998, the major US cigarette manufacturers, including RJRT, B&W and Lorillard Tobacco, entered into the Master Settlement Agreement (MSA) with attorneys general representing 46 US states, the District of Columbia and certain US territories and possessions. These cigarette manufacturers previously settled four other cases, brought on behalf of Mississippi, Florida, Texas and Minnesota, by separate agreements with each state (collectively and with the MSA, the ‘State Settlement Agreements’). |
| 42. | These State Settlement Agreements settled all health care cost recovery actions brought by, or on behalf of, the settling jurisdictions; released the defending major US cigarette manufacturers from various additional present and potential future claims; imposed future payment obligations in perpetuity on RJRT, B&W, Lorillard Tobacco and other major US cigarette manufacturers; and placed significant restrictions on their ability to market and sell cigarettes and smokeless tobacco products. In accordance with the MSA, various tobacco companies agreed to fund a US$5.2 billion (approximately £3.8 billion) trust fund to be used to address the possible adverse economic impact of the MSA on tobacco growers. |
|
Strategic Report |
Governance Report | Financial Statements | Other Information | BAT Annual Report and Form 20-F 2020 | 231 | |||||
|
|
27 Contingent Liabilities and Financial Commitments Continued
| 43. | RJRT and SFNTC are subject to the substantial payment obligations under the State Settlement Agreements. Payments under the State Settlement Agreements are subject to various adjustments for, among other things, the volume of cigarettes sold, relative market share, operating profit and inflation. Reynolds American‘s operating subsidiaries’ expenses and payments under the State Settlement Agreements for 2017, 2018, 2019 and 2020 and the projected expenses and payments for 2021 and 2022 onwards are set forth below (in millions of US dollars)*: |
| 2022 and | ||||||||||||||||||||||||
| 2017 | 2018 | 2019 | 2020 | 2021 | thereafter | |||||||||||||||||||
| Settlement expenses |
$ | 2,856 | $ | 2,741 | $ | 2,762 | $ | 3,572 | ||||||||||||||||
| Settlement cash payments |
$ | 4,612 | $917 | $ | 2,918 | $ | 2,848 | |||||||||||||||||
| Projected settlement expenses |
$ | >3,300 | $ | >3,300 | ||||||||||||||||||||
| Projected settlement cash payments |
$ | >3,600 | $ | >3,300 | ||||||||||||||||||||
| * | Subject to adjustments for changes in sales volume, inflation, operating profit and other factors. Payments are allocated among the companies on the basis of relative market share or other methods. |
| 44. | The State Settlement Agreements have materially adversely affected RJRT’s shipment volumes. Reynolds American believes that these settlement obligations may materially adversely affect the results of operations, cash flows or financial position of Reynolds American and RJRT in future periods. The degree of the adverse impact will depend, among other things, on the rate of decline in US cigarette sales in the premium and value categories, RJRT’s share of the domestic premium and value cigarette categories, and the effect of any resulting cost advantage of manufacturers not subject to the State Settlement Agreements. |
| 45. | In addition, the MSA includes an adjustment that potentially reduces the annual payment obligations of RJRT, Lorillard Tobacco and the other signatories to the MSA, known as ‘Participating Manufacturers’ (PMs). Certain requirements, collectively referred to as the ‘Adjustment Requirements’, must be satisfied before the Non-Participating Manufacturers (NPM) Adjustment for a given year is available: (i) an Independent Auditor must determine that the PMs have experienced a market share loss, beyond a triggering threshold, to those manufacturers that do not participate in the MSA (such non-participating manufacturers being referred to as NPMs); and (ii) in a binding arbitration proceeding, a firm of independent economic consultants must find that the disadvantages of the MSA were a significant factor contributing to the loss of market share. This finding is known as a significant factor determination. |
| 46. | When the Adjustment Requirements are satisfied, the MSA provides that the NPM Adjustment applies to reduce the annual payment obligation of the PMs. However, an individual settling state may avoid its share of the NPM Adjustment if it had in place and diligently enforced during the entirety of the relevant year a ‘Qualifying Statute’ that imposes escrow obligations on NPMs that are comparable to what the NPMs would have owed if they had joined the MSA. In such event, the state’s share of the NPM Adjustment is reallocated to other settling states, if any, that did not have in place and diligently enforce a Qualifying Statute. |
| 47. | RJRT and Lorillard Tobacco are or were involved in NPM Adjustment proceedings concerning the years 2003 to 2019. In 2012, RJRT, Lorillard Tobacco, and SFNTC entered into an agreement (the Term Sheet) with certain settling states that resolved accrued and potential NPM adjustments for the years 2003 through 2012 and, as a result, RJRT and SFNTC collectively received, or are to receive, more than US$1.1 billion (approximately £804 million) in credits that, in substantial part, were applied to MSA payments in 2014 through 2017. After an arbitration panel ruled in September 2013 that six states had not diligently enforced their qualifying statutes in the year 2003, additional states joined the Term Sheet. RJRT executed the NPM Adjustment Settlement Agreement on 25 September 2017 (which incorporated the Term Sheet). Since the NPM Adjustment Settlement Agreement was executed, an additional 10 states have joined. NPM proceedings are ongoing and could result in further reductions of the companies’ MSA-related payments. |
| 48. | On 18 January 2017, the State of Florida filed a motion to join Imperial Tobacco Group, PLC (ITG) as a defendant and to enforce the Florida State Settlement Agreement, which motion sought payment under the Florida State Settlement Agreement of approximately US$45 million (approximately £33 million) with respect to the four brands (Winston, Salem, Kool and Maverick) that were sold to ITG in the divestiture of certain assets, on 12 June 2015, by subsidiaries or affiliates of Reynolds American and Lorillard, together with the transfer of certain employees and certain liabilities, to a wholly-owned subsidiary of Imperial Brands plc (the Divestiture), referred to as the ‘Acquired Brands’. The motion also claimed future annual losses of approximately US$30 million per year (approximately £22 million) absent the court’s enforcement of the Florida State Settlement Agreement. The State’s motion sought, among other things, an order declaring that RJRT and ITG are in breach of the Florida Settlement Agreement and are required, jointly and severally, to make annual payments to the State under the Florida State Settlement Agreement with respect to the Acquired Brands. In addition, on 18 January 2017, PM USA filed a motion to enforce the Florida State Settlement Agreement, asserting among other things that RJRT and ITG breached that agreement by failing to make settlement payments as to the Acquired Brands, which PM USA asserts has improperly shifted settlement payment obligations to PM USA. On 27 January 2017, RJRT sought leave to file a supplemental pleading for breach by ITG of its obligations regarding joinder into the Florida State Settlement Agreement. The Florida court, on 30 March 2017, ruled that ITG should be joined into the enforcement action. |
| 232 | BAT Annual Report and Form 20-F 2020 |
Financial Statements
Notes on Accounts
Continued
27 Contingent Liabilities and Financial Commitments Continued
|
Strategic Report |
Governance Report | Financial Statements | Other Information | BAT Annual Report and Form 20-F 2020 | 233 | |||||
|
|
27 Contingent Liabilities and Financial Commitments Continued
| 234 | BAT Annual Report and Form 20-F 2020 |
Financial Statements
Notes on Accounts
Continued
27 Contingent Liabilities and Financial Commitments Continued
|
Strategic Report |
Governance Report | Financial Statements | Other Information | BAT Annual Report and Form 20-F 2020 | 235 | |||||
|
|
27 Contingent Liabilities and Financial Commitments Continued
| Act pursuant to which | Companies named as | |||||
| Canadian province | Claim was brought | Defendants | Current stage | |||
| British Columbia | Tobacco Damages and Health Care Costs Recovery Act 2000 | Imperial
Investments Industries
Carreras Rothmans Limited
RJR Companies
Other former Rothmans Group companies
All have been served.
|
The defences of Imperial, Investments, Industries, Carreras Rothmans Limited and the RJR Companies have been filed, and document production and discoveries were ongoing. On 13 February 2017 the province delivered an expert report dated October 2016, quantifying its damages in the amount of CAD$118 billion (approximately £67 billion). No trial date has been set. The federal government is seeking CAD$5 million (approximately £3 million) jointly from all the defendants in respect of costs pertaining to the third-party claim, now dismissed. | |||
| New Brunswick | Tobacco Damages and Health Care Costs Recovery Act 2006 | Imperial, the UK Companies and RJR Companies have all been named as defendants and served. | The defences of Imperial, the UK Companies and the RJR Companies have been filed and document production and discoveries are substantially complete. The most recent expert report filed by the Province estimated a range of damages between CAD $11.1 billion (approximately £6.3 billion) and CAD $23.2 billion (approximately £13.3 billion), including expected future costs. Following a motion to set a trial date, the New Brunswick Court of Queen’s Bench ordered that the trial commence on 4 November 2019. On 7 March 2019, the New Brunswick Court of Queen’s Bench released a decision which requires the Province to produce a substantial amount of additional documentation and data to the defendants. As a result, the original trial date of 4 November 2019 would have been delayed. No new trial date has been set. | |||
| Ontario | Tobacco Damages and Health Care Costs Recovery Act 2009 | Imperial, the UK Companies and the RJR Companies have all been named as defendants and served. | The defences of Imperial, the UK Companies and the RJR Companies have been filed. The parties completed significant document production in the summer of 2017 and discoveries commenced in the autumn of 2018. On 15 June 2018, the province delivered an expert report quantifying its damages in the range of CAD$280 billion (approximately £161 billion) – CAD$630 billion (approximately £362 billion) in 2016/2017 dollars for the period 1954 – 2060, and the Province amended the damages sought in its Statement of Claim to CAD$330 billion (approximately £190 billion). On 31 January 2019, the Province delivered a further expert report claiming an additional amount between CAD $9.4 billion (approximately £5.4 billion) and CAD$10.9 billion in damages (approximately £6.3 billion) in respect of ETS. No trial date has been set. | |||
| Newfoundland and Labrador | Tobacco Health Care Costs Recovery Act 2001 | Imperial, the UK Companies and the RJR Companies have all been named as defendants and served. | The case is at an early case management stage. The defences of Imperial, the UK Companies and the RJR Companies have been filed and the province began its document production in March 2018. Damages have not been quantified by the province. No trial date has been set. | |||
| Saskatchewan | Tobacco Damages and Health Care Costs Recovery Act 2007 | Imperial, the UK Companies and the RJR Companies have all been named as defendants and served. | This case is at an early case management stage. The defences of Imperial, the UK Companies and the RJR Companies have been filed and the province has delivered a test shipment of documents. Damages have not been quantified by the province. No trial date has been set. | |||
| Manitoba | Tobacco Damages Health Care Costs Recovery Act 2006 | Imperial, the UK Companies and RJR Companies have all been named as defendants and served. | This case is at an early case management stage. The defences of Imperial, the UK Companies and the RJR Companies have been filed and document production commenced. Damages have not been quantified by the province. No trial date has been set. | |||
| Alberta | Crown’s Right of Recovery Act 2009 | Imperial, the UK Companies and RJR Companies have all been named as defendants and served. | This case is at an early case management stage. The defences of Imperial, the UK Companies and the RJR Companies have been filed and the province commenced its document production. The province has stated its claim to be worth CAD$10 billion (approximately £5.7 billion). No trial date has been set. | |||
| 236 | BAT Annual Report and Form 20-F 2020 |
Financial Statements
Notes on Accounts
Continued
27 Contingent Liabilities and Financial Commitments Continued
| Canadian province | Act pursuant to which Claim was brought |
Companies named as Defendants |
Current stage | |||
| Quebec | Tobacco Related Damages and Health Care Costs Recovery Act 2009 | Imperial, Investments, Industries, the RJR Companies and Carreras Rothmans Limited have been named as defendants and served. | The case is at an early case management stage. The defences of Imperial, Investments, Industries, Carreras Rothmans Limited and the RJR Companies have been filed. Motions over admissibility of documents and damages discovery have been filed but not heard. The province is seeking CAD$60 billion (approximately £34.5 billion). No trial date has been set. | |||
| Prince Edward Island | Tobacco Damages and Health Care Costs Recovery Act 2009 | Imperial, the UK Companies and RJR Companies have all been named as defendants and served. | This case is at an early case management stage. The defences of Imperial, the UK Companies and the RJR Companies have been filed and the next step was expected to be document production, which the parties deferred for the time being. Damages have not been quantified by the province. No trial date has been set. | |||
| Nova Scotia | Tobacco Health Care Costs Recovery Act 2005 | Imperial, the UK Companies and RJR Companies have all been named as defendants and served. | This case is at an early case management stage. The defences of Imperial, the UK Companies and the RJR Companies have been filed. The province provided a test document production in March 2018. Damages have not been quantified by the province. No trial date has been set. | |||
Nigeria
| 62. | British American Tobacco (Nigeria) Limited (BAT Nigeria), the Company and Investments have been named as defendants in a medical reimbursement action by the federal government of Nigeria, filed on 6 November 2007 in the Federal High Court, and in similar actions filed by the Nigerian states of Kano (9 May 2007), Oyo (30 May 2007), Lagos (13 March 2008), Ogun (26 February 2008), and Gombe (17 October 2008) commenced in their respective High Courts. In the five cases that remain active, the plaintiffs seek a total of approximately 10.6 trillion Nigerian naira (approximately £18.5 billion) in damages, including special, anticipatory and punitive damages, restitution and disgorgement of profits, as well as declaratory and injunctive relief. |
| 63. | The suits claim that the state and federal government plaintiffs incurred costs related to the treatment of smoking-related illnesses resulting from allegedly tortious conduct by the defendants in the manufacture, marketing, and sale of tobacco products in Nigeria, and assert that the plaintiffs are entitled to reimbursement for such costs. The plaintiffs assert causes of action for negligence, negligent design, fraud and deceit, fraudulent concealment, breach of express and implied warranty, public nuisance, conspiracy, strict liability, indemnity, restitution, unjust enrichment, voluntary assumption of a special undertaking, and performance of another’s duty to the public. |
| 64. | The Company and Investments have made a number of challenges to the jurisdiction of the Nigerian courts. Such challenges are still pending (on appeal) against the federal government and the states of Lagos, Kano, Gombe and Ogun. The underlying cases are stayed or adjourned pending the final outcome of these jurisdictional challenges. In the state of Oyo, on 13 November 2015, and 24 February 2017, respectively, the Company’s and Investments’ jurisdictional challenges were successful in the Court of Appeal and the issuance of the writ of summons was set aside. |
South Korea
| 65. | In April 2014, Korea’s National Health Insurance Service (NHIS) filed a healthcare recoupment action against KT&G (a Korean tobacco company), PM Korea and BAT Korea (including BAT Korea Manufacturing). The NHIS is seeking damages of roughly 54 billion Korean Won (approximately £36.3 million) in respect of health care costs allegedly incurred by the NHIS treating patients with lung (small cell and squamous cell) and laryngeal (squamous cell) cancer between 2003 and 2012. Court hearings in the case, which constitute the trial, commenced in September 2014. On 20 November 2020, the court issued a judgment in favour of the defendants and dismissing all of the plaintiff’s claims. The NHIS filed an appeal of the judgment on 11 December 2020. |
Brazil
| 66. | On 21 May 2019, the Federal Attorney’s Office (AGU) in Brazil filed an action in the Federal Court of Rio Grande do Sul against the Company, the BAT Group’s Brazilian subsidiary Souza Cruz LTDA (Souza Cruz), Philip Morris International, Philip Morris Brazil Indústria e Comércio LTDA and Philip Morris Brasil S/A, asserting claims for medical reimbursement for funds allegedly expended by the federal government as public health care expenses to treat 26 tobacco-related diseases over the last five years and that will be expended in perpetuity during future years, including diseases allegedly caused both by cigarette smoking and exposure to ETS. The action includes a claim for moral damages allegedly suffered by Brazilian society to be paid into a public welfare fund. The action is for an unspecified amount of monetary compensation, as the AGU seeks a bifurcated action in which liability would be determined in the first phase followed by an evidentiary phase to ascertain damages. |
| 67. | On 19 July 2019, the trial court ordered that service of the action on the Company be effected via service on Souza Cruz. On 6 August 2019, Souza Cruz refused to receive service on behalf of the Company due to Souza Cruz’s lack of power to receive the summons on behalf of the Company and such refusal was attached to the case files on 9 August 2019. On 7 August 2019, Souza Cruz was served with the complaint by the AGU and Souza Cruz’s acknowledgement of service was attached to the case files on 12 August 2019. |
|
Strategic Report |
Governance Report | Financial Statements | Other Information | BAT Annual Report and Form 20-F 2020 | 237 | |||||
|
|
27 Contingent Liabilities and Financial Commitments Continued
| 238 | BAT Annual Report and Form 20-F 2020 |
Financial Statements
Notes on Accounts
Continued
27 Contingent Liabilities and Financial Commitments Continued
|
Strategic Report |
Governance Report | Financial Statements | Other Information | BAT Annual Report and Form 20-F 2020 | 239 | |||||
|
|
27 Contingent Liabilities and Financial Commitments Continued
| 240 | BAT Annual Report and Form 20-F 2020 |
Financial Statements
Notes on Accounts
Continued
27 Contingent Liabilities and Financial Commitments Continued
Croatian Distributor Dispute
|
Strategic Report |
Governance Report | Financial Statements | Other Information | BAT Annual Report and Form 20-F 2020 | 241 | |||||
|
|
27 Contingent Liabilities and Financial Commitments Continued
| 242 | BAT Annual Report and Form 20-F 2020 |
Financial Statements
Notes on Accounts
Continued
27 Contingent Liabilities and Financial Commitments Continued
Qatar Customs Authority Claims
|
Strategic Report |
Governance Report | Financial Statements | Other Information | BAT Annual Report and Form 20-F 2020 | 243 | |||||
|
|
27 Contingent Liabilities and Financial Commitments Continued
| 244 | BAT Annual Report and Form 20-F 2020 |
Financial Statements
Notes on Accounts
Continued
27 Contingent Liabilities and Financial Commitments Continued
|
Strategic Report |
Governance Report | Financial Statements | Other Information | BAT Annual Report and Form 20-F 2020 | 245 | |||||
|
|
27 Contingent Liabilities and Financial Commitments Continued
Closed litigation matters
| 133. | The following matters on which the Company reported in the contingent liabilities and financial commitments note 27 to the Company’s 2019 financial statements have been dismissed, concluded or resolved as noted below: |
| Matter |
Jurisdiction | Companies named as Defendants | Description | Disposition | ||||
| Vuse Litigation (Whatcom County) |
USA | Reynolds American, RJR Vapor, the Company, Lorillard LLC and LOEC Inc. | Public Nuisance | Voluntary dismissal by plaintiff | ||||
| Cyprus competition investigation |
Cyprus | B.A.T. (Cyprus) Ltd | Investigation | Investigation ended without liability to B.A.T. (Cyprus) Ltd | ||||
General Litigation Conclusion
| 134. | While it is impossible to be certain of the outcome of any particular case or of the amount of any possible adverse verdict, the Group believes that the defences of the Group’s companies to all these various claims are meritorious on both the law and the facts, and a vigorous defence is being made everywhere. |
| 135. | As indicated above, on 1 March 2019 the Quebec Court of Appeal released its appeal judgment. The trial judgment was largely upheld by a unanimous decision of the five-member panel including the requirement that the defendants deposit the initial deposits in their solicitors’ trust accounts within 60 days. This is the only executory aspect of the judgment. In these circumstances we are of the view that it is more likely than not that there will be an outlay and it is reasonably estimable at CAD $758 million (approximately £436 million), the amount of the initial deposit paid into court. If further adverse judgments are entered against any of the Group’s companies in any case, avenues of appeal will be pursued. Such appeals could require the appellants to post appeal bonds or substitute security (as has been necessary in Quebec) in amounts which could in some cases equal or exceed the amount of the judgment. At least in the aggregate, and despite the quality of defences available to the Group, it is not impossible that the Group’s results of operations or cash flows in any particular period could be materially adversely affected by the impact of a significant increase in litigation, difficulties in obtaining the bonding required to stay execution of judgments on appeal, or any final outcome of any particular litigation. |
| 136. | Having regard to all these matters, with the exception of the Quebec Class Actions, Fox River and certain Engle progeny cases identified above, the Group does not consider it appropriate to make any provision in respect of any pending litigation because the likelihood of any resulting material loss, on an individual case basis, is not considered probable and/or the amount of any such loss cannot be reasonably estimated. Notwithstanding the negative decision in the Quebec Class Actions, the Group does not believe that the ultimate outcome of this litigation will significantly impair the Group’s financial condition. If the facts and circumstances change and result in further unfavourable outcomes in the pending litigation, then there could be a material impact on the financial statements of the Group. |
Other contingencies
| 137. | JTI Indemnities. By a purchase agreement dated 9 March 1999, amended and restated as of 11 May 1999, referred to as the 1999 Purchase Agreement, R.J. Reynolds Tobacco Holdings, Inc. (RJR) and RJRT sold their international tobacco business to JTI. Under the 1999 Purchase Agreement, RJR and RJRT retained certain liabilities relating to the international tobacco business sold to JTI, and agreed to indemnify JTI against: (i) any liabilities, costs and expenses arising out of the imposition or assessment of any tax with respect to the international tobacco business arising prior to the sale, other than as reflected on the closing balance sheet; (ii) any liabilities, costs and expenses that JTI or any of its affiliates, including the acquired entities, may incur after the sale with respect to any of RJR’s or RJRT’s employee benefit and welfare plans; and (iii) any liabilities, costs and expenses incurred by JTI or any of its affiliates arising out of certain activities of Northern Brands. |
| 138. | RJRT has received claims for indemnification from JTI, and several of these have been resolved. Although RJR and RJRT recognise that, under certain circumstances, they may have other unresolved indemnification obligations to JTI under the 1999 Purchase Agreement, RJR and RJRT disagree what circumstances described in such claims give rise to any indemnification obligations by RJR and RJRT and the nature and extent of any such obligation. RJR and RJRT have conveyed their position to JTI, and the parties have agreed to resolve their differences at a later date. |
| 139. | ITG Indemnity. In the Divestiture, Reynolds American agreed to defend and indemnify, subject to certain conditions and limitations, ITG in connection with claims relating to the purchase or use of one or more of the Winston, Kool, Salem or Maverick cigarette brands on or before 12 June 2015, as well as in actions filed before 13 June 2023, relating to the purchase or use of one or more of the Winston, Kool, Salem or Maverick cigarette brands. In the purchase agreement relating to the Divestiture, ITG agreed to defend and indemnify, subject to certain conditions and limitations, Reynolds American and its affiliates in connection with claims relating to the purchase or use of ‘blu’ brand e-cigarettes. ITG also agreed to defend and indemnify, subject to certain conditions and limitations, Reynolds American and its affiliates in actions filed after 12 June 2023, relating to the purchase or use of one or more of the Winston, Kool, Salem or Maverick cigarette brands after 12 June 2015. ITG has tendered a number of actions to Reynolds American under the terms of this indemnity, and Reynolds American has, subject to a reservation of rights, agreed to defend and indemnify ITG pursuant to the terms of the indemnity. Reynolds American has tendered an action to ITG under the terms of this indemnity, and ITG has, subject to a reservation of rights, agreed to defend and indemnify Reynolds American and its affiliates pursuant to the terms of the indemnity. These claims are substantially similar in nature and extent to claims asserted directly against RJRT in similar actions. |
| 246 | BAT Annual Report and Form 20-F 2020 |
Financial Statements
Notes on Accounts
Continued
27 Contingent Liabilities and Financial Commitments Continued
|
Strategic Report |
Governance Report | Financial Statements | Other Information | BAT Annual Report and Form 20-F 2020 | 247 | |||||
|
|
27 Contingent Liabilities and Financial Commitments Continued
Netherlands
The Dutch tax authority has issued a number of assessments on various issues across the years 2003-2016 in relation to various intra-group transactions. The assessments amount to an aggregate net liability across these periods of £1,220 million covering tax, interest and penalties. The Group has appealed against the assessments in full.
The Group believes that its companies have meritorious defences in law and fact in each of the above matters and intends to pursue each dispute through the judicial system as necessary. The Group does not consider it appropriate to make provision for these amounts nor for any potential further amounts which may be assessed in relation to these matters in subsequent years.
Indirect and other taxes
Bangladesh
On 25 July 2018, the Appellate Division of the Supreme Court of Bangladesh has reversed the decision of the High Court Division against BAT Bangladesh in respect of the retrospective demands for VAT and Supplementary Duty amounting to approximately £154 million. On 3 February 2020, the certified Court Order was received. The Government filed a Review Petition on 25 March 2020 in the Appellate Division of the Supreme Court of Bangladesh against the judgment. The matter is yet to be taken up for hearing.
Egypt
British American Tobacco Egypt LLC is subject to two ongoing civil cases concerning the imposition of sales tax on low-price category brands brought by the Egyptian tax authority for £122 million. Management believes that the tax claims are unfounded and has appealed the tax claims. These cases are under review by the Council of State. During hearings in August 2020, the courts decided, in both cases, to transfer the files to court appointed experts but these sessions have not yet been scheduled. Progress on the case, and further hearings, have been delayed due to COVID-19.
South Korea
In 2016, the Board of Audit and Inspection of Korea (BAI) concluded its tax assessment in relation to the 2014 year-end tobacco inventory, and imposed additional national excise, local excise, VAT taxes and penalties. This resulted in the recognition of a KRW 80.7 billion (approximately £54 million) charge by Group subsidiaries, BAT Korea Ltd., Rothmans Far East B.V. Korea Branch Office and BAT Korea Manufacturing Ltd. Management deems the tax and penalties to be unfounded and has appealed to the tax tribunal against the assessment. On grounds of materiality and the high likelihood of the tax and penalties being reversed in future, the Group classified the tax and penalties charge as an adjusting item in 2016.
On 23 August 2019, the trial court ruled in favour of Rothmans Far East B.V. Korea Branch Office on KRW 6.7 billion (approximately £5 million), the VAT portion of the assessment; appeals on the other elements of the assessment are still pending at trial court. The Korean government appealed the ruling on 16 September 2019. Management expects the final ruling by the Supreme Court by 2022. Due to the uncertain outcome of the case no asset has been recognised in relation to this ruling.
Turkey
British American Tobacco Tutun Mamulleri Sanayi ve Ticaret Anonim Sirketi (BAT Tutun) has been subject to tax audits on inventory movements for the years 2015, 2016 and 2019. In November 2020, BAT Tutun received a tax assessment amounting to £100 million comprising principal, penalty and interest for the years 2015 and 2016. The Group is not, at the date of this announcement, aware of any assessment in relation to 2019. Management is engaging with the tax authorities on the matter but believes that the tax claims are unfounded.
Brazil
On 15 March 2017, the Brazilian Supreme Court ruled that for all taxpayers VAT (ICMS) should not be included in the calculation of social contribution taxes (PIS/Cofins) which are levied based on revenue. However, the retrospective application of the basis of calculation is subject to an extraordinary appeal and the final decision is expected by 2022.
The Group’s Brazilian subsidiary, Souza Cruz, had filed an individual lawsuit to establish that it had overpaid taxes to the government. Based on favourable court decisions in 2020 and 2019 the Group has recognised £58 million (2019: £86 million) in other income representing management’s best estimate of the amounts likely to be recovered at this time with the potential for further amounts in future periods.
If the ruling were to be enacted retrospectively for a period of five years, the potential asset is estimated to be around £507 million.
| 248 | BAT Annual Report and Form 20-F 2020 |
Financial Statements
Notes on Accounts
Continued
27 Contingent Liabilities and Financial Commitments Continued
Commitments in relation to service contracts, non-capitalised leases
The total future minimum payments under non-cancellable service contracts based on when payments fall due:
| 2020 £m |
2019 £m |
|||||||
| Service contracts |
||||||||
| Within one year |
63 | 15 | ||||||
| Between one and five years |
17 | 20 | ||||||
| Beyond five years |
6 | – | ||||||
| 86 | 35 | |||||||
Financial commitments arising from short-term leases and leases of low-value assets that are not capitalised under IFRS 16 Leases are £6 million (2019: £10 million) for property and £3 million (2019: £2 million) for plant, equipment and other assets.
Performance guarantees
As part of the acquisition of TDR in 2015, the Group has committed to keeping the manufacturing facility in Kanfanar, Croatia operational for at least five years following completion of the acquisition. The maximum exposure under this guarantee was £42 million at 31 December 2019. These commitments expired during 2020.
28 Interests in Subsidiaries
Subsidiaries with material non-controlling interests
Non-controlling interests principally arise from the Group’s listed investment in Malaysia (British American Tobacco (Malaysia) Berhad), where the Group held 50% of the listed holding company in 2020, 2019 and 2018. The Group has assessed that it exercises de facto control over Malaysia as it has the practical ability to direct the business through effective control of the Company’s Board as a result of the Group controlling the largest shareholding block in comparison to other shareholdings which are widely dispersed. Summarised financial information for Malaysia is shown below as required by IFRS 12. As part of the Group’s reporting processes, Malaysia report consolidated financial information for the Malaysia group which has been adjusted to comply with Group accounting policies which may differ to local accounting practice. Goodwill in respect of Malaysia, which arose as a result of the acquisition of the Rothmans group referred to in note 8, has not been included as part of the net assets below. In addition, no adjustments have been made to the information below for the elimination of intercompany transactions and balances with the rest of the Group.
| Summarised financial information | 2020 £m |
2019 £m |
2018 £m |
|||||||||
| Revenue |
162 | 191 | 231 | |||||||||
| Profit for the year |
45 | 65 | 87 | |||||||||
| – Attributable to non-controlling interests |
22 | 33 | 43 | |||||||||
| Total comprehensive income |
46 | 65 | 87 | |||||||||
| – Attributable to non-controlling interests |
23 | 33 | 43 | |||||||||
| Dividends paid to non-controlling interests |
(24 | ) | (36 | ) | (40 | ) | ||||||
| Summary net assets: |
||||||||||||
| Non-current assets |
14 | 20 | 16 | |||||||||
| Current assets |
120 | 97 | 116 | |||||||||
| Non-current liabilities |
(5 | ) | (4 | ) | – | |||||||
| Current liabilities |
(137 | ) | (117 | ) | (129 | ) | ||||||
| Total equity at the end of the year |
(8 | ) | (4 | ) | 3 | |||||||
| – Attributable to non-controlling interests |
(4 | ) | (2 | ) | 1 | |||||||
| Net cash generated from operating activities |
40 | 61 | 86 | |||||||||
| Net cash used in investing activities |
– | – | (2 | ) | ||||||||
| Net cash used in financing activities |
(35 | ) | (73 | ) | (77 | ) | ||||||
| Differences on exchange |
– | – | 1 | |||||||||
| Increase/(decrease) in net cash and cash equivalents |
5 | (12 | ) | 8 | ||||||||
| Net cash and cash equivalents at 1 January |
(2 | ) | 10 | 2 | ||||||||
| Net cash and cash equivalents at 31 December |
3 | (2 | ) | 10 | ||||||||
|
Strategic Report |
Governance Report | Financial Statements | Other Information | BAT Annual Report and Form 20-F 2020 | 249 | |||||
|
|
28 Interests in Subsidiaries Continued
Subsidiaries subject to restrictions:
As a result of the Group’s Canadian subsidiary, Imperial Tobacco Canada (ITCAN), entering CCAA protection, the assets of ITCAN are subject to restrictions. The table below summarises the assets and liabilities of ITCAN:
| Summarised financial information | 2020 £m |
2019 £m |
||||||
| Non-current assets |
2,354 | 2,403 | ||||||
| Current assets |
1,251 | 768 | ||||||
| Non-current liabilities |
(132 | ) | (131 | ) | ||||
| Current liabilities |
(528 | ) | (447 | ) | ||||
| 2,945 | 2,593 | |||||||
Under the terms of CCAA, the court has appointed FTI Consulting Canada Inc. to act as a monitor. This monitor has no operational input and is not involved in the management of the business. The Group considers that ITCAN continues to meet the requirements of IFRS 10 Consolidated Financial Statements, and, until such requirements are not met, the Group will continue to consolidate the results of ITCAN.
Whilst the Group continues to control the operations of its Canadian subsidiary, there are restrictions over the ability to access or use certain assets including the ability to remit dividends. Included in current assets are cash and cash equivalents of £992 million, of which £878 million is restricted (2019: £595 million, £445 million of which was restricted) (note 17) and inventories of £114 million (2019: £117 million). Included in non-current assets for 2020 and 2019 is goodwill of £2.3 billion subject to impairment reviews (note 8). Included in current liabilities are trade and other payables of £284 million (2019: £310 million), the majority of which are amounts payable in respect of duties and excise. Refer to note 27 for information on the Quebec Class Actions.
Other shareholdings
The Group holds 92% of the equity shares of PT Bentoel Internasional Investama Tbk (Bentoel). In 2011, the Group sold 984 million shares, representing approximately 14% of Bentoel’s share capital, for the purposes of fulfilling certain obligations pursuant to Bapepam LK (Indonesia) takeover regulations. The Group simultaneously entered into a total return swap on 971 million of the shares. In June 2016, the Group and other investors participated in a rights issue by Bentoel, with the Group increasing its stake in Bentoel to 92%. Simultaneously, the Group amended the total return swap to take account of an additional 1,684 million shares. The shares subject to the total return swap now represent 7% of Bentoel’s issued capital. While the Group does not have legal ownership of these shares, it retains the risks and rewards associated with them which results in the Group continuing to recognise an effective interest in 99% of Bentoel’s net assets and results.
Refer to note 10 for information on the Group’s 42% investment in Tisak d.d..
| 250 | BAT Annual Report and Form 20-F 2020 |
Financial Statements
Notes on Accounts
Continued
29 Summarised Financial Information
The following summarised financial information is required by the rules of the Securities and Exchange Commission and has been prepared as a requirement of the Regulation S-X 3-10 in respect of the guarantees of:
The financial information relates to the guarantees of:
| – | US$12.35 billion of outstanding bonds issued by B.A.T Capital Corporation (BATCAP) in connection with the acquisition of Reynolds, including registered bonds issued in exchange for the initially issued bonds (the 2017 Bonds); |
| – | US$10.65 billion of outstanding bonds issued by BATCAP pursuant to the Shelf Registration Statement on Form F-3 filed on July 17, 2019, pursuant to which BATCAP or BATIF may issue an indefinite amount of debt securities; and |
| – | US$1.50 billion of outstanding bonds issued by BATIF pursuant to the Shelf Registration Statement on Form F-3 filed on July 17, 2019, pursuant to which BATCAP or BATIF may issue an indefinite amount of debt securities. |
As of July 28, 2020, all relevant Group entities suspended their reporting obligations with respect to the US$7.7 billion (2019: US$10.3 billion) of Reynolds unsecured notes and US$40.9 million (2019: US$149.5 million) of Lorillard unsecured notes. As such, no summarised financial information is provided with respect to these securities.
As described below, Reynolds American Inc. (Reynolds American) is a subsidiary guarantor of all outstanding series of BATCAP and BATIF bonds. Under the terms of the indentures governing such notes, any subsidiary guarantor (including Reynolds American) other than BATCAP or BATIF, as applicable, BATNF and BATHTN, will automatically and unconditionally be released from all obligations under its guarantee, and such guarantee shall thereupon terminate and be discharged and of no further force or effect, in the event that (1) its guarantee of all then outstanding notes issued under the Group’s EMTN Programme is released or (2) at substantially the same time its guarantee of the debt securities is terminated, such subsidiary guarantor is released from all obligations in respect of indebtedness for borrowed money for which such subsidiary guarantor is an obligor (as a guarantor or borrower). Under the EMTN Programme, Reynolds American’s guarantee is released if at any time the aggregate amount of indebtedness for borrowed money, subject to certain exceptions, for which Reynolds American is an obligor does not exceed 10% of the outstanding long-term debt of BAT as reflected in the balance sheet included in BAT’s most recent publicly released interim or annual consolidated financial statements.
Reynolds American’s guarantee may be released notwithstanding Reynolds guaranteeing other indebtedness, provided Reynolds American’s guarantee of outstanding notes issued under the EMTN Programme is released. If Reynolds American’s guarantee is released, BAT is not required to replace such guarantee, and the debt securities will have the benefit of fewer subsidiary guarantees for the remaining maturity of the debt securities.
Note: The following summarised financial information report the unconsolidated contribution of each applicable company to the Group’s consolidated results and not the separate financial statements for each applicable company as local financial statements are prepared in accordance with local legislative requirements and may differ from the financial information provided below. In particular, in respect of the United States region, all financial statements and financial information provided by or with respect to the US business or RAI (and/ or RAI and its subsidiaries (collectively, the Reynolds Group)) are prepared on the basis of US GAAP and constitute the primary financial statements or financial information of the US business or RAI (and/or the Reynolds Group). Solely for the purpose of consolidation within the results of BAT p.l.c. and the BAT Group, this financial information is then converted to IFRS. To the extent any such financial information provided in these financial statements relates to the US business or RAI (and/or the Reynolds Group), it is provided as an explanation of the US business’s or RAI’s (and/or the Reynolds Group’s) primary US GAAP based financial statements and information.
The subsidiaries disclosed below are wholly-owned and the guarantees provided are full and unconditional, and joint and several:
| – | British American Tobacco p.l.c. (as the parent guarantor), referred to as ‘BAT p.l.c.’ in the financials below; |
| – | B.A.T Capital Corporation (as an issuer or a subsidiary guarantor, as the case may be), referred to as ‘BATCAP’ in the financials below; |
| – | B.A.T. International Finance p.l.c. (as an issuer or a subsidiary guarantor, as the case may be), referred to as ‘BATIF’ in the financials below; |
| – | B.A.T. Netherlands Finance B.V. (as a subsidiary guarantor), referred to as ‘BATNF’ in the financials below; |
| – | Reynolds American Inc. (as a subsidiary guarantor), referred to as ‘RAI’ in the financials below; and |
| – | British American Tobacco Holdings (The Netherlands) B.V. (as a subsidiary guarantor of the 2017 Bonds only), referred to as ‘BATHTN’ in the financials below. |
|
Strategic Report |
Governance Report | Financial Statements | Other Information | BAT Annual Report and Form 20-F 2020 | 251 | |||||
|
|
29 Summarised Financial Information Continued
In accordance with Regulation S-X 13-01, information in respect of investments in subsidiaries that are not issuers or guarantors has been excluded from non-current assets as shown in the balance sheet table below. The “BATHTN” column in the summarised financial information is only applicable in the context of the 2017 Bonds. British American Tobacco Holdings (The Netherlands) B.V. (‘BATHTN’) is not an issuer nor guarantor of any of the other securities referenced in this note. None of the issuers or other guarantors has material balances with or an investment in BATHTN. Investments in subsidiaries represents share capital acquired in relation to or issued by subsidiary undertakings.
| Summarised Financial Information | ||||||||||||||||||||||||
| Year ended 31 December 2020 | BAT p.l.c. £m |
BATCAP £m |
BATIF £m |
BATNF £m |
RAI £m |
BATHTN £m |
||||||||||||||||||
| Income Statement |
||||||||||||||||||||||||
| Revenue |
– | – | – | – | – | – | ||||||||||||||||||
| (Loss)/profit from operations |
(112 | ) | (1 | ) | (2 | ) | – | (5 | ) | – | ||||||||||||||
| Dividend income |
5,050 | – | – | – | 4,845 | 224 | ||||||||||||||||||
| Net finance income/(costs) |
131 | 417 | 174 | – | (758 | ) | 1 | |||||||||||||||||
| Profit/(loss) before taxation |
5,069 | 416 | 172 | – | 4,082 | 225 | ||||||||||||||||||
| Taxation on ordinary activities |
(14 | ) | (101 | ) | 4 | – | 170 | – | ||||||||||||||||
| Profit/(loss) for the year |
5,055 | 315 | 176 | – | 4,252 | 225 | ||||||||||||||||||
| Intercompany Transactions – Income Statement |
||||||||||||||||||||||||
| Transactions with non-issuer/non-guarantor subsidiaries income/(expense) | (118 | ) | (1 | ) | 4 | – | 22 | – | ||||||||||||||||
| Transactions with non-issuer/non-guarantor subsidiaries net finance income/(cost) | 5 | 996 | 747 | – | 32 | – | ||||||||||||||||||
| Dividend income from non-issuer/non-guarantor subsidiaries |
5,050 | – | – | – | 4,845 | 224 | ||||||||||||||||||
| Summarised Financial Information | ||||||||||||||||||||||||
| Year ended 31 December 2019 |
BAT p.l.c. £m |
BATCAP £m |
BATIF £m |
BATNF £m |
RAI £m |
BATHTN £m |
||||||||||||||||||
| Income Statement |
||||||||||||||||||||||||
| Revenue |
– | – | – | – | – | – | ||||||||||||||||||
| Loss from operations |
(125 | ) | (2 | ) | (5 | ) | – | (2 | ) | (5 | ) | |||||||||||||
| Dividend income |
6,090 | – | – | – | 3,993 | 195 | ||||||||||||||||||
| Net finance income/(costs) |
121 | 154 | 195 | – | (497 | ) | 1 | |||||||||||||||||
| Profit/(loss) before taxation |
6,086 | 152 | 190 | – | 3,494 | 191 | ||||||||||||||||||
| Taxation on ordinary activities |
– | (35 | ) | 8 | – | 125 | 1 | |||||||||||||||||
| Profit/(loss) for the year |
6,086 | 117 | 198 | – | 3,619 | 192 | ||||||||||||||||||
| Intercompany Transactions – Income Statement |
||||||||||||||||||||||||
| Transactions with non-issuer/non-guarantor subsidiaries (expense)/income | (125 | ) | (2 | ) | (5 | ) | – | 19 | – | |||||||||||||||
| Transactions with non-issuer/non-guarantor subsidiaries net finance income/(cost) | 12 | 773 | 563 | – | 33 | – | ||||||||||||||||||
| Dividend income from non-issuer/non-guarantor subsidiaries |
6,090 | – | – | – | 3,993 | 195 | ||||||||||||||||||
| 252 | BAT Annual Report and Form 20-F 2020 |
Financial Statements
Notes on Accounts
Continued
29 Summarised Financial Information Continued
| Summarised Financial Information | ||||||||||||||||||||||||
| As at 31 December 2020 |
BAT p.l.c. £m |
BATCAP £m |
BATIF £m |
BATNF £m |
RAI £m |
BATHTN £m |
||||||||||||||||||
| Balance Sheet |
||||||||||||||||||||||||
| Non-current assets |
236 | 18,991 | 10,332 | 1,509 | 402 | 26 | ||||||||||||||||||
| Current assets |
7,070 | 3,404 | 30,601 | 22 | 268 | 15 | ||||||||||||||||||
| Non-current liabilities |
1,580 | 17,867 | 15,326 | 1,509 | 8,885 | 6 | ||||||||||||||||||
| Non-current borrowings |
1,571 | 17,867 | 15,243 | 1,509 | 8,823 | – | ||||||||||||||||||
|
Other non-current liabilities |
9 | – | 83 | – | 62 | 6 | ||||||||||||||||||
| Current liabilities |
52 | 4,444 | 24,038 | 22 | 972 | 2 | ||||||||||||||||||
| Current borrowings |
9 | 4,329 | 23,478 | 22 | 200 | 1 | ||||||||||||||||||
|
Other current liabilities |
43 | 115 | 560 | – | 772 | 1 | ||||||||||||||||||
| Intercompany Transactions – Balance Sheet |
||||||||||||||||||||||||
| Amounts due from non-issuer/non-guarantor subsidiaries |
7,031 | 16,088 | 38,761 | – | 620 | 15 | ||||||||||||||||||
| Amounts due to non-issuer/non-guarantor subsidiaries |
3 | 3,139 | 19,550 | – | 62 | 1 | ||||||||||||||||||
| Investment in subsidiaries (that are not issuers or guarantors) |
27,234 | – | 718 | – | 23,820 | 1,580 | ||||||||||||||||||
|
|
Summarised Financial Information |
| ||||||||||||||||||||||
| As at 31 December 2019 |
BAT p.l.c. £m |
BATCAP £m |
BATIF £m |
BATNF £m |
RAI £m |
BATHTN £m |
||||||||||||||||||
| Balance Sheet |
||||||||||||||||||||||||
| Non-current assets |
236 | 12,722 | 16,188 | – | 439 | 39 | ||||||||||||||||||
| Current assets |
6,732 | 6,379 | 25,441 | – | 749 | 16 | ||||||||||||||||||
| Non-current liabilities |
1,580 | 15,405 | 14,918 | – | 6,864 | 10 | ||||||||||||||||||
| Non-current borrowings |
1,571 | 15,168 | 14,590 | – | 6,741 | – | ||||||||||||||||||
|
Other non-current liabilities |
9 | 237 | 328 | – | 123 | 10 | ||||||||||||||||||
| Current liabilities |
139 | 3,800 | 25,273 | – | 3,590 | 3 | ||||||||||||||||||
| Current borrowings |
13 | 3,706 | 24,816 | – | 2,979 | 1 | ||||||||||||||||||
|
Other current liabilities |
126 | 94 | 457 | – | 611 | 2 | ||||||||||||||||||
| Intercompany Transactions – Balance Sheet |
||||||||||||||||||||||||
| Amounts due from non-issuer/non-guarantor subsidiaries |
6,690 | 15,415 | 38,851 | – | 1,160 | 16 | ||||||||||||||||||
| Amounts due to non-issuer/non-guarantor subsidiaries |
101 | 2,773 | 19,190 | – | 81 | 1 | ||||||||||||||||||
| Investment in subsidiaries (that are not issuers or guarantors) |
27,234 | – | 718 | – | 24,012 | 1,419 | ||||||||||||||||||
|
Strategic Report |
Governance Report | Financial Statements | Other Information | BAT Annual Report and Form 20-F 2020 | 253 | |||||
|
|
30 Accounting Policy Changes
Adoption of new accounting standards effective 1 January 2019: Adoption of IFRS 16
Adoption of IFRS 16
With effect from 1 January 2019, the Group adopted IFRS 16 Leases with no revision of prior periods, as permitted by the Standard. In accordance with IFRS 16, the distinction between operating leases and finance leases for lessees has been removed.
On the initial implementation of the Standard, previously recognised operating leases were capitalised as right-of-use assets and financial liabilities were recognised at the same initial value. The Group took advantage of certain practical expedients available under the Standard including:
| – | ‘grandfathering’ previously recognised lease arrangements; |
| – | applying a single discount rate to a portfolio of leases with reasonably similar characteristics; |
| – | assessing whether a lease is onerous prior to applying the Standard; |
| – | applying hindsight in determining the lease term if the contract contains options to extend or terminate the lease; and |
| – | not applying the capitalisation requirements of the Standard to leases for which the lease term ends within 12 months of the date of initial application. |
The impact of IFRS 16 to the Group’s balance sheet at 1 January 2019 was the capitalisation of £610 million of right-of-use assets and lease liabilities of £607 million. The weighted average incremental borrowing rate applied in discounting lease commitments at that date was 5.60%. The impact of IFRS 16 to the Group’s results and equity in 2019 was not material.
Adoption of new accounting standards effective 1 January 2018: Adoption of IFRS 9
Adoption of IFRS 9
With effect from 1 January 2018, the Group adopted IFRS 9 Financial Instruments with no restatement of prior periods, as permitted by the Standard. The cumulative impact of adopting the Standard, including the effect of tax entries, was recognised as a restatement of opening reserves in 2018, and was £38 million, arising from the impairment of financial assets under the expected loss model.
| 254 | BAT Annual Report and Form 20-F 2020 |
and Undertakings
This disclosure is made in accordance with Section 409 of the Companies Act 2006 and The Large and Medium-sized Companies and Groups (Accounts and Reports) Regulations 2008, as amended by The Companies, Partnerships and Groups (Accounts and Reports) Regulations 2015. A full list of subsidiary undertakings, associates and joint ventures and joint operations as defined by IFRS (showing the country of incorporation, effective percentage of equity shares held and full registered office addresses) as at 31 December 2020 is disclosed below.
The subsidiary undertakings that are held directly by British American Tobacco p.l.c. (the ultimate Parent Company) are indicated thus*; all others are held by sub-holding companies.
Unless otherwise stated, the equity shares held are in the form of ordinary shares or common stock, except for those indicated thus#, which include preference shares. The effective percentage of equity shares held in subsidiary undertakings is 100% unless otherwise stated. Further, where the effective percentage of equity shares held by the sub-holding company is different from that held by British American Tobacco p.l.c., the percentage of equity shares held by British American Tobacco p.l.c. is indicated thus^ and is shown after the percentage interest held by the sub-holding company.
The results of a number of these subsidiary undertakings principally affect the financial statements of the Group. These principal subsidiary undertakings are highlighted in grey and are considered to be the main corporate entities in those countries which, in aggregate, contributed 99% of the Group revenue and 100% of profit from operations.
Subsidiary Undertakings
|
Strategic Report |
Governance Report | Financial Statements | Other Information | BAT Annual Report and Form 20-F 2020 | 255 | |||||
|
|
| 256 | BAT Annual Report and Form 20-F 2020 |
Financial Statements
Group Companies and Undertakings
Continued
|
Strategic Report |
Governance Report | Financial Statements | Other Information | BAT Annual Report and Form 20-F 2020 | 257 | |||||
|
|
| 258 | BAT Annual Report and Form 20-F 2020 |
Financial Statements
Group Companies and Undertakings
Continued
|
Strategic Report |
Governance Report | Financial Statements | Other Information | BAT Annual Report and Form 20-F 2020 | 259 | |||||
|
|
| 260 | BAT Annual Report and Form 20-F 2020 |
Financial Statements
Group Companies and Undertakings
Continued
|
Strategic Report |
Governance Report | Financial Statements | Other Information | BAT Annual Report and Form 20-F 2020 | 261 | |||||
|
|
| 262 | BAT Annual Report and Form 20-F 2020 |
Financial Statements
Group Companies and Undertakings
Continued
|
Strategic Report |
Governance Report | Financial Statements | Other Information | BAT Annual Report and Form 20-F 2020 | 263 | |||||
|
|
|
Strategic Report |
Governance Report | Financial Statements | Other Information | BAT Annual Report and Form 20-F 2020 | 265 | |||||
|
|
This page is intentionally left blank
| 266 | BAT Annual Report and Form 20-F 2020 |
Financial Statements
This page is intentionally left blank
|
Strategic Report |
Governance Report | Financial Statements | Other Information | BAT Annual Report and Form 20-F 2020 | 267 | |||||
|
|
This page is intentionally left blank
| 268 | BAT Annual Report and Form 20-F 2020 |
Financial Statements
This page is intentionally left blank
|
Strategic Report |
Governance Report | Financial Statements | Other Information | BAT Annual Report and Form 20-F 2020 | 269 | |||||
|
|
This page is intentionally left blank
| 270 | BAT Annual Report and Form 20-F 2020 |
Financial Statements
This page is intentionally left blank
|
Strategic Report |
Governance Report | Financial Statements | Other Information | BAT Annual Report and Form 20-F 2020 | 273 | |||||
|
|
Information
This information set out below has been derived from, in part, the audited consolidated financial statements of the Group commencing on page 150. This selected financial information should be read in conjunction with the consolidated financial statements and the Strategic Report.
| As of and for the Year Ended 31 December | ||||||||||||||||||||
| All items shown in £m except per share information | 2020 | 2019 | 2018 | 2017 | 2016 | |||||||||||||||
| Income statement data |
||||||||||||||||||||
| Revenue2 |
25,776 | 25,877 | 24,492 | 19,564 | 14,130 | |||||||||||||||
| Raw materials and consumables used |
(4,583 | ) | (4,599 | ) | (4,664 | ) | (4,520 | ) | (3,777 | ) | ||||||||||
| Changes in inventories of finished goods and work in progress |
445 | 162 | 114 | (513 | ) | 44 | ||||||||||||||
| Employee benefit costs |
(2,744 | ) | (3,221 | ) | (3,005 | ) | (2,679 | ) | (2,274 | ) | ||||||||||
| Depreciation, amortisation and impairment costs |
(1,450 | ) | (1,512 | ) | (1,038 | ) | (902 | ) | (607 | ) | ||||||||||
| Other operating income |
188 | 163 | 85 | 144 | 176 | |||||||||||||||
| Loss on reclassification from amortised cost to fair value |
(3 | ) | (3 | ) | (3 | ) | – | – | ||||||||||||
| Other operating expenses |
(7,667 | ) | (7,851 | ) | (6,668 | ) | (4,682 | ) | (3,037 | ) | ||||||||||
| Profit from operations |
9,962 | 9,016 | 9,313 | 6,412 | 4,655 | |||||||||||||||
| Net finance costs |
(1,745 | ) | (1,602 | ) | (1,381 | ) | (1,094 | ) | (637 | ) | ||||||||||
| Share of post-tax results of associates and joint ventures |
455 | 498 | 419 | 24,209 | 2,227 | |||||||||||||||
| Profit before taxation |
8,672 | 7,912 | 8,351 | 29,527 | 6,245 | |||||||||||||||
| Taxation on ordinary activities |
(2,108 | ) | (2,063 | ) | (2,141 | ) | 8,129 | (1,406 | ) | |||||||||||
| Profit for the year |
6,564 | 5,849 | 6,210 | 37,656 | 4,839 | |||||||||||||||
| Per share data |
||||||||||||||||||||
| Basic weighted average number of ordinary shares, in millions |
2,286 | 2,284 | 2,285 | 2,044 | 1,858 | |||||||||||||||
| Diluted weighted average number of ordinary shares, in millions |
2,295 | 2,291 | 2,292 | 2,051 | 1,865 | |||||||||||||||
| Earnings per share-basic (pence) |
280.0p | 249.7p | 264.0p | 1,833.9p | 250.2p | |||||||||||||||
| Earnings per share-diluted (pence) |
278.9p | 249.0p | 263.2p | 1,827.6p | 249.2p | |||||||||||||||
| Dividends per share (pence)3 |
215.6p | 210.4p | 203.0p | 195.2p | 169.4p | |||||||||||||||
| Dividends per share (US dollars)3 |
$2.99 | $2.69 | $2.71 | $2.54 | $2.30 | |||||||||||||||
| Balance sheet data |
||||||||||||||||||||
| Assets |
||||||||||||||||||||
| Non-current assets |
124,078 | 127,731 | 133,687 | 127,088 | 27,414 | |||||||||||||||
| Current assets |
13,612 | 13,274 | 12,655 | 13,966 | 12,359 | |||||||||||||||
| Total assets |
137,690 | 141,005 | 146,342 | 141,054 | 39,773 | |||||||||||||||
| Liabilities |
||||||||||||||||||||
| Non-current liabilities |
59,257 | 58,022 | 64,325 | 64,468 | 19,511 | |||||||||||||||
| Current liabilities |
15,478 | 18,823 | 16,329 | 15,605 | 11,856 | |||||||||||||||
| Total borrowings |
43,968 | 45,366 | 47,509 | 49,450 | 19,495 | |||||||||||||||
| Equity |
||||||||||||||||||||
| Share capital |
614 | 614 | 614 | 614 | 507 | |||||||||||||||
| Total equity |
62,955 | 64,160 | 65,688 | 60,981 | 8,406 | |||||||||||||||
| Cash flow data |
||||||||||||||||||||
| Net cash generated from operating activities |
9,786 | 8,996 | 10,295 | 5,347 | 4,610 | |||||||||||||||
| Net cash used in investing activities |
(783 | ) | (639 | ) | (1,021 | ) | (18,544 | ) | (640 | ) | ||||||||||
| Net cash (used in)/generated from financing activities |
(7,897 | ) | (8,593 | ) | (9,630 | ) | 14,759 | (4,229 | ) | |||||||||||
Notes:
| 1. | All of the information above is in respect of continuing operations, revised for the fully retrospective adoption of IFRS 15. |
| 2. | Revenue is net of duty, excise and other taxes of £39,172 million, £39,826 million, £38,553 million, £37,780 million and £32,136 million for the years ended 31 December 2020, 2019, 2018, 2017 and 2016, respectively. |
| 3. | In February 2021, the BAT Directors declared an interim dividend of 215.6 pence per share for the year ended 31 December 2020, payable in four equal instalments of 53.9 pence per ordinary share. The interim dividend will be paid to BAT shareholders in May 2021, August 2021, November 2021 and February 2022. In February 2020, the BAT directors declared an interim dividend of 210.4 pence per ordinary share of 25p, payable in four equal quarterly instalments of 52.6 pence per ordinary share. This was paid in May 2020, August 2020, November 2020 and February 2021. The equivalent quarterly dividends receivable by holders of ADSs in US dollars will be calculated based on the exchange rate on the applicable payment date. |
| 274 | BAT Annual Report and Form 20-F 2020 |
Other Information
Volume
Volume is defined as the number of units sold. Units may vary between categories. This can be summarised for the principal metrics as follows:
| – | Factory made cigarettes (FMC) – sticks, regardless of weight or dimensions; |
| – |
Roll-Your-Own/Make-Your-Own – kilos, converted to a stick equivalent based upon 0.8 grams (per stick equivalent) for Roll-Your-Own and between 0.5 and 0.7 grams (per stick equivalent) for Make-Your-Own; |
| – | Traditional oral – pouches (being 1:1 conversion to stick equivalent) and kilos, converted to a stick equivalent based upon 2.8 grams (per stick equivalent) for Moist Snuff, 2.0 grams (per stick equivalent) for Dry Snuff and 7.1 grams (per stick equivalent) for other oral; |
| – | Modern Oral – pouches, being 1:1 conversion to stick equivalent; |
| – | Tobacco Heat sticks – sticks, being 1:1 conversion to stick equivalent; and |
| – | Vapour - pods and 10 millilitre bottles. There is no conversion to a stick equivalent. |
Volume is recognised in line with IFRS 15 Revenue from Contracts with Customers, based upon transfer of control. It is assumed that there is no material difference, in line with the Group’s recognition of revenue, between the transfer of control and shipment date.
Volume is used by management and investors to assess the relative performance of the Group and its brands within categories, given volume is a principal determinant of revenue.
Volume Share
Volume share is the number of units bought by consumers of a specific brand or combination of brands, as a proportion of the total units bought by consumers in the industry, category or other sub-categorisation. Sub-categories include, but are not limited to, the total nicotine category, modern oral, vapour, traditional oral, total oral or cigarette.
Where possible, the Group utilises data provided by third-party organisations, including AC Nielsen, based upon retail audit of sales to consumers. In certain markets, where such data is not available, other measures are employed which assess volume share based upon other movements within the supply chain, such as sales to retailers. This may depend on the provision of data to the industry by the customers including distributors/wholesalers.
Volume share is used by management to assess the relative performance to the Group and its brands against the performance of its competitors in the categories and geographies in which the Group operates. This measure is also useful to understand the Group’s performance when seeking to grow scale within a market or category from which future financial returns can be realised. The Group’s management believes that this measure is useful to investors to understand the relative performance of the Group and its brands against the performance of its competitors in the categories and geographies in which the Group operates.
Volume share in each year compares the average volume share in the year with the average volume share in the prior year. This is a more robust measure of performance, removing short-term volatility that may arise at a point in time.
However, in certain circumstances, related to periods of introduction to a market, in order to illustrate the latest performance, data may be provided as at the end of the period rather than the average in that period. In these instances the Group states these are at a specific date (for instance, December 2020).
Value Share
Value share is the retail value of units bought by consumers of a particular brand or combination of brands, as a proportion of the total retail value of units bought by consumers in the industry, category or other sub-categorisation in discussion.
Where possible, the Group utilises data provided by third-party organisations, including AC Nielsen, based upon retail audit of sales to consumers. In certain markets, where such data is not available, other measures are employed which assess value share based upon other movements within the supply chain, such as sales to retailers. This may depend on the provision of data to the industry by the customers (including distributors and wholesalers).
Value share is used by management to assess the relative performance of the Group and its brands against the performance of its competitors in the categories and geographies in which the Group operates, specifically indicating the Group’s ability to realise value relative to the market. The measure is particularly useful when the Group’s products and/or the relevant category in the market in which they are sold has developed or achieved scale from which value can be realised. The Group’s management believes that this measure is useful to investors to apprehend the relative performance of the Group and its brands against the performance of its competitors in the categories and geographies in which the Group operates, specifically indicating the Group’s ability to realise value relative to the market.
Value share in each year compares the average value share in the year with the average value share in the prior period. This is a more robust measure of performance, removing short-term volatility that may arise at a point of time. However, in certain circumstances, related to periods of introduction to a market, in order to illustrate the latest performance, data may be provided that is as at the end of the period rather than the average in that period. In these instances the Group states these are at a specific date (for instance, December 2020).
|
Strategic Report |
Governance Report | Financial Statements | Other Information | BAT Annual Report and Form 20-F 2020 | 275 | |||||
|
|
Price Mix
Price mix is a term used by management and investors to explain the movement in revenue between periods. Revenue is affected by the volume (how many units are sold) and the value (how much is each unit sold for). Price mix is used to explain the value component of the sales as the Group sells each unit for a value (price) but may also achieve a movement in revenue due to the relative proportions of higher value volume sold compared to lower value volume sold (mix).
This term is used to explain the Group’s relative performance between periods only. It is calculated as the difference between the movement in revenue (between periods) and volume (between periods). For instance, the growth in combustibles revenue (excluding translational foreign exchange movements) of 2.8% in 2020, with a decline in combustibles volume of 4.5% in 2020, leads to a price mix of 7.3% in 2020. No assumptions underlie this metric as it utilises the Group’s own data.
Non-Combustible Consumers
The number of consumers of Non-Combustible products is defined as the estimated number of Legal Age (minimum 18 years) consumers of the Group’s Non-Combustible products. In markets where regular consumer tracking is in place, this estimate is obtained from adult consumer tracking studies conducted by third parties (including Kantar). In markets where regular consumer tracking is not in place, the number of consumers of Non-Combustible products is derived from volume sales of consumables and devices in such markets, using consumption patterns obtained from other similar markets with consumer tracking (utilising studies conducted by third parties including Kantar).
The number of Non-Combustible products consumers is used by management to assess the number of consumers regularly using the Group’s New Categories products as the increase in Non-Combustible products is a key pillar of the Group’s ESG Ambition and is integral to the sustainability of our business.
The Group’s management believes that this measure is useful to investors given the Group’s ESG ambition and alignment to the sustainability of the business with respect to the Non-Combustibles portfolio.
| 276 | BAT Annual Report and Form 20-F 2020 |
Other Information
To supplement the presentation of the Group’s results of operations and financial condition in accordance with IFRS, we also present several non-GAAP measures used by management to monitor the Group’s performance. The Group’s management regularly reviews the measures used to assess and present the financial performance of the Group and, as relevant, its geographic segments.
Adjusted Revenue
Definition – revenue before the impact of adjusting items.
To supplement BAT’s revenue presented in accordance with IFRS, the Group’s Management Board, as the chief operating decision-maker, reviews adjusted revenue to evaluate the underlying business performance of the Group and its geographic segments. The Group’s Management Board defines adjusted revenue as revenue before the impact of adjusting items, specifically the excise on bought-in goods that the Group acquired and sold which, for the period 2017 to 2019, has been recorded in accordance with IFRS as a cost of sale and within revenue, with a dilutive effect on operating margin. In 2020, as the short-term arrangements ceased or were immaterial, the goods are manufactured by the Group, and the excise, in accordance with Group policy, is not included in cost of sales or revenue. For the 2017 to 2019 period, this excise included in revenue led to a reduction in revenue and improvement in operating margin that did not represent the underlying performance of the Group. As such, the excise on bought-in goods in 2019, 2018 and 2017 met the Group’s definition of an adjusting item, as defined in note 1 in the Notes on the Accounts.
The Group’s Management Board also believes that adjusted revenue provides information that enables investors to better compare the Group’s business performance across periods. Adjusted revenue has limitations as an analytical tool. The most directly comparable IFRS measure to adjusted revenue is revenue. Adjusted revenue is not a presentation made in accordance with IFRS, and is not a measure of financial condition or liquidity and should not be considered as an alternative to revenue as determined in accordance with IFRS. Adjusted revenue is not necessarily comparable to similarly titled measures used by other companies. As a result, you should not consider this performance measure in isolation from, or as a substitute analysis for, BAT’s results as determined in accordance with IFRS.
The table below reconciles the Group’s revenue to adjusted revenue for the periods presented and to adjusted revenue at constant rates based on a re-translation of adjusted revenue for each year at the previous year’s exchange rates. Refer to note 2 in the Notes on the Accounts for further discussion of the segmental results and for the reconciliation of adjusted revenue at current and constant rates of exchange to segmental revenue and to Group revenue for the years ended 31 December 2020, 2019 and 2018.
| For the year ended 31 December (£m) |
||||||||||||||||||||
| 2020 | 2019 | 2018 | 2017 | 2016 | ||||||||||||||||
| Revenue |
25,776 | 25,877 | 24,492 | 19,564 | 14,130 | |||||||||||||||
| Less: Excise on goods bought-in on short-term arrangements |
– | (50 | ) | (180 | ) | (258 | ) | – | ||||||||||||
| Adjusted revenue |
25,776 | 25,827 | 24,312 | 19,306 | 14,130 | |||||||||||||||
| Impact of translational foreign exchange |
894 | (144 | ) | 1,448 | (700 | ) | (687 | ) | ||||||||||||
| 2020 adjusted revenue re-translated at 2019 exchange rates |
26,670 | |||||||||||||||||||
| 2019 adjusted revenue re-translated at 2018 exchange rates |
25,683 | |||||||||||||||||||
| 2018 adjusted revenue re-translated at 2017 exchange rates |
25,760 | |||||||||||||||||||
| 2017 adjusted revenue re-translated at 2016 exchange rates |
18,606 | |||||||||||||||||||
| 2016 adjusted revenue re-translated at 2015 exchange rates |
13,443 | |||||||||||||||||||
| Change in adjusted revenue at prior year’s exchange rates (constant rates) |
+3.3% | +5.6% | +33.4% | +31.7% | +7.2% | |||||||||||||||
|
Strategic Report |
Governance Report | Financial Statements | Other Information | BAT Annual Report and Form 20-F 2020 | 277 | |||||
|
|
Adjusted Revenue by Product Category or Geographic Segment – Including Revenue From New Categories
Definition – revenue by product category, before the impact of adjusting items and at the prior year’s prevailing exchange rate, derived from the principal product categories of Combustibles, New Categories (being comprised of revenue from Vapour, THP and Modern Oral), and Traditional Oral, including by the geographic segments of the United States, Europe and North Africa, Americas and Sub-Saharan Africa and Asia-Pacific and Middle East.
To supplement BAT’s revenue presented in accordance with IFRS, the Group’s Management Board, as the chief operating decision-maker, reviews adjusted revenue growth from the principal product categories of combustibles, New Categories and Traditional Oral, including from the geographic segments of the United States, Europe and North Africa, Americas and Sub-Saharan Africa and Asia-Pacific and Middle East, to evaluate the underlying business performance of the Group reflecting the focus of the Group’s investment activity. The Group’s Management Board assesses adjusted revenue by product category, including by geographic segment, at constant rates of exchange, as revenue before the impact of adjusting items and translated to the Group’s reporting currency at the prior period’s prevailing exchange rate, derived from the Group’s combustible portfolio (including but not limited to Kent, Dunhill, Lucky Strike, Pall Mall, Rothmans, Camel (US), Newport (US), Natural American Spirit (US)), the Group’s New Category portfolio (being Vapour, THP and Modern Oral) and the Group’s Traditional Oral portfolio and the Group’s operations in the United States, Europe and North Africa, Americas and Sub-Saharan Africa and Asia-Pacific and Middle East.
The Group’s Management Board also believes that the adjusted revenue performance by product category, including by geographic segment provides information that enables investors to better compare the Group’s business performance across periods and by reference to the Group’s investment activity. Adjusted revenue by product category, including by geographic segment have limitations as analytical tools. The most directly comparable IFRS measure to adjusted revenue by product category, including by geographic segment, is revenue. Adjusted revenue by product category, including by geographic segment, are not presentations made in accordance with IFRS, are not measures of financial condition or liquidity and should not be considered as alternatives to revenue as determined in accordance with IFRS. Adjusted revenue by product category, including by geographic segment, are not necessarily comparable to similarly titled measures used by other companies. As a result, you should not consider these performance measures in isolation from, or as a substitute analysis for, BAT’s results as determined in accordance with IFRS.
Reconciliation of revenue by product category to adjusted revenue by product category at constant rates of exchange – 2020- 2019
| 2020 | 2019 | |||||||||||||||||||||||||||||||||||
| Adjusted | ||||||||||||||||||||||||||||||||||||
| Adjusting | Impact of | Adjusted | at constant | Adjusting | ||||||||||||||||||||||||||||||||
| Reported | vs 2019 | items | exchange | at constant | vs 2019 | Reported | items | Adjusted | ||||||||||||||||||||||||||||
| £m | % | £m | £m | £m | % | £m | £m | £m | ||||||||||||||||||||||||||||
| Combustible |
22,752 | -1.1% | – | 842 | 23,594 | +2.8% | 23,001 | (50 | ) | 22,951 | ||||||||||||||||||||||||||
| Vapour |
611 | +52.3% | – | 4 | 615 | +53.4% | 401 | – | 401 | |||||||||||||||||||||||||||
| THP |
634 | -12.9% | – | 2 | 636 | -12.7% | 728 | – | 728 | |||||||||||||||||||||||||||
| Modern Oral |
198 | +57.1% | – | – | 198 | +57.1% | 126 | – | 126 | |||||||||||||||||||||||||||
| New Categories |
1,443 | +14.9% | – | 6 | 1,449 | +15.4% | 1,255 | – | 1,255 | |||||||||||||||||||||||||||
| Traditional Oral |
1,160 | +7.2% | – | 5 | 1,165 | +7.7% | 1,081 | – | 1,081 | |||||||||||||||||||||||||||
| Other |
421 | -21.7% | – | 41 | 462 | -14.4% | 540 | – | 540 | |||||||||||||||||||||||||||
|
Revenue |
25,776 | -0.4% | – | 894 | 26,670 | +3.3% | 25,877 | (50 | ) | 25,827 | ||||||||||||||||||||||||||
Reconciliation of revenue by product category to adjusted revenue by product category at constant rates of exchange – 2019- 2018
| 2019 | 2018 | |||||||||||||||||||||||||||||||||||
| Adjusted | ||||||||||||||||||||||||||||||||||||
| Adjusting | Impact of | Adjusted | at constant | Adjusting | ||||||||||||||||||||||||||||||||
| Reported | vs 2018 | items | exchange | at constant | vs 2018 | Reported | items | Adjusted | ||||||||||||||||||||||||||||
| £m | % | £m | £m | £m | % | £m | £m | £m | ||||||||||||||||||||||||||||
| Combustible |
23,001 | +4.2% | (50 | ) | (59 | ) | 22,892 | +4.6% | 22,072 | (180 | ) | 21,892 | ||||||||||||||||||||||||
| Vapour |
401 | +26.1% | – | (9 | ) | 392 | +23.4% | 318 | – | 318 | ||||||||||||||||||||||||||
| THP |
728 | +28.9% | – | (35 | ) | 693 | +22.7% | 565 | – | 565 | ||||||||||||||||||||||||||
| Modern Oral |
126 | +267% | – | 3 | 129 | +273% | 34 | – | 34 | |||||||||||||||||||||||||||
| New Categories |
1,255 | +36.9% | – | (41 | ) | 1,214 | +32.4% | 917 | – | 917 | ||||||||||||||||||||||||||
| Traditional Oral |
1,081 | +15.0% | – | (45 | ) | 1,036 | +10.2% | 941 | – | 941 | ||||||||||||||||||||||||||
| Other |
540 | -4.0% | – | 1 | 541 | -3.8% | 562 | – | 562 | |||||||||||||||||||||||||||
|
Revenue |
25,877 | +5.7% | (50 | ) | (144 | ) | 25,683 | +5.6% | 24,492 | (180 | ) | 24,312 | ||||||||||||||||||||||||
| 278 | BAT Annual Report and Form 20-F 2020 |
Other Information
Non-GAAP Measures
Continued
Adjusted Revenue From the Strategic Portfolio, at Constant Rates of Exchange
Definition – revenue before the impact of adjusting items and at the prior year’s prevailing exchange rate, derived from Kent, Dunhill, Lucky Strike, Pall Mall, Rothmans, Camel (US), Newport (US), Natural American Spirit (US), the Group’s New Category portfolio and certain brands within Traditional Oral.
To supplement BAT’s revenue presented in accordance with IFRS, the Group’s Management Board, as the chief operating decision-maker, reviews adjusted revenue from the Strategic Portfolio (at constant rates of exchange) to evaluate the underlying business performance of the Group reflecting the focus of the Group’s investment activity. The Group’s Management Board defines adjusted revenue from the Strategic Portfolio, at constant rates of exchange, as revenue before the impact of adjusting items and translated to the Group’s reporting currency at the prior periods prevailing exchange rate, derived from the Group’s Strategic Combustible portfolio (Kent, Dunhill, Lucky Strike, Pall Mall, Rothmans, Camel (US), Newport (US), Natural American Spirit (US)), the Group’s New Category portfolio (being vapour, THP and Modern Oral) and certain brands within Traditional Oral (particularly Grizzly).
The Group’s Management Board also believes that the adjusted revenue from the Strategic Portfolio at constant rates of exchange provides information that enables investors to better compare the Group’s business performance across periods and by reference to the Group’s investment activity. Adjusted revenue from the Strategic Portfolio has limitations as an analytical tool. The most directly comparable IFRS measure to adjusted revenue from the Strategic Portfolio is revenue. Adjusted revenue from the Strategic Portfolio at constant rates of exchange is not a presentation made in accordance with IFRS, is not a measure of financial condition or liquidity and should not be considered as an alternative to revenue as determined in accordance with IFRS. Adjusted revenue growth from the Strategic Portfolio is not necessarily comparable to similarly titled measures used by other companies. As a result, you should not consider this performance measure in isolation from, or as a substitute analysis for, BAT’s results as determined in accordance with IFRS.
Reconciliation of revenue to adjusted revenue from the Strategic Portfolio at constant rates of exchange – 2020-2019
| Adjusted | Adjusted at | |||||||||||||||||||||||||||||||
| Adjusting | Impact | at constant | constant vs | Adjusting | Adjusted | |||||||||||||||||||||||||||
| 2020 | items | of exchange | 2020 | 2019 | 2019 | items | 2019 | |||||||||||||||||||||||||
| £m | £m | £m | £m | % | £m | £m | £m | |||||||||||||||||||||||||
| Strategic Portfolio comprises: |
||||||||||||||||||||||||||||||||
| Combustible portfolio |
16,992 | – | 559 | 17,551 | +6.3% | 16,515 | – | 16,515 | ||||||||||||||||||||||||
| New Categories products |
||||||||||||||||||||||||||||||||
| Vapour |
611 | – | 4 | 615 | +53.4% | 401 | – | 401 | ||||||||||||||||||||||||
| THP |
634 | – | 2 | 636 | -12.7% | 728 | – | 728 | ||||||||||||||||||||||||
| Modern Oral |
198 | – | – | 198 | +57.1% | 126 | – | 126 | ||||||||||||||||||||||||
| New Categories |
1,443 | – | 6 | 1,449 | +15.4% | 1,255 | – | 1,255 | ||||||||||||||||||||||||
| Traditional Oral |
1,100 | – | 6 | 1,106 | +8.1% | 1,023 | – | 1,023 | ||||||||||||||||||||||||
| Total New Categories and Traditional Oral |
2,543 | – | 12 | 2,555 | +12.2% | 2,278 | – | 2,278 | ||||||||||||||||||||||||
| Strategic Portfolio |
19,535 | – | 571 | 20,106 | +7.0% | 18,793 | – | 18,793 | ||||||||||||||||||||||||
| Non-strategic |
6,241 | – | 323 | 6,564 | -6.7% | 7,084 | (50 | ) | 7,034 | |||||||||||||||||||||||
|
Revenue |
25,776 | – | 894 | 26,670 | +3.3% | 25,877 | (50 | ) | 25,827 | |||||||||||||||||||||||
Reconciliation of revenue to adjusted revenue from the Strategic Portfolio at constant rates of exchange – 2019-2018
| Adjusted | Adjusted at | |||||||||||||||||||||||||||||||
| Adjusting | Impact | at constant | constant vs | Adjusting | Adjusted | |||||||||||||||||||||||||||
| 2019 | items | of exchange | 2019 | 2018 | 2018 | items | 2018 | |||||||||||||||||||||||||
| £m | £m | £m | £m | % | £m | £m | £m | |||||||||||||||||||||||||
| Strategic Portfolio comprises: |
||||||||||||||||||||||||||||||||
| Combustible portfolio |
16,515 | – | (200 | ) | 16,315 | +5.6% | 15,457 | – | 15,457 | |||||||||||||||||||||||
| New Categories products |
||||||||||||||||||||||||||||||||
| Vapour |
401 | – | (9 | ) | 392 | +23.4% | 318 | – | 318 | |||||||||||||||||||||||
| THP |
728 | – | (35 | ) | 693 | +22.7% | 565 | – | 565 | |||||||||||||||||||||||
| Modern Oral |
126 | – | 3 | 129 | +273.1% | 34 | – | 34 | ||||||||||||||||||||||||
| New Categories |
1,255 | – | (41 | ) | 1,214 | +32.4% | 917 | – | 917 | |||||||||||||||||||||||
| Traditional Oral |
1,023 | – | (43 | ) | 980 | +11.0% | 883 | – | 883 | |||||||||||||||||||||||
| Total New Categories and Traditional Oral |
2,278 | – | (84 | ) | 2,194 | +21.9% | 1,800 | – | 1,800 | |||||||||||||||||||||||
| Strategic Portfolio |
18,793 | – | (284 | ) | 18,509 | +7.3% | 17,257 | – | 17,257 | |||||||||||||||||||||||
| Non-strategic |
7,084 | (50 | ) | 140 | 7,174 | +1.7% | 7,235 | (180 | ) | 7,055 | ||||||||||||||||||||||
|
Revenue |
25,877 | (50 | ) | (144 | ) | 25,683 | +5.6% | 24,492 | (180 | ) | 24,312 | |||||||||||||||||||||
|
Strategic Report |
Governance Report | Financial Statements | Other Information | BAT Annual Report and Form 20-F 2020 | 279 | |||||
|
|
Adjusted Profit From Operations and Adjusted Operating Margin
Definition – profit from operations before the impact of adjusting items and adjusted profit from operations as a percentage of adjusted revenue.
To supplement BAT’s results from operations presented in accordance with IFRS, the Group’s Management Board, as the chief operating decision-maker, reviews adjusted profit from operations to evaluate the underlying business performance of the Group and its geographic segments, to allocate resources to the overall business and to communicate financial performance to investors. The Group also presents adjusted operating margin, which is defined as adjusted profit from operations as a percentage of adjusted revenue, as defined previously. Adjusted profit from operations and adjusted operating margin are not measures defined by IFRS. The most directly comparable IFRS measure to adjusted profit from operations is profit from operations.
Adjusting items, as identified in accordance with the Group’s accounting policies, represent certain items of income and expense which the Group considers distinctive based on their size, nature or incidence. In identifying and quantifying adjusting items, the Group consistently applies a policy that defines criteria that are required to be met for an item to be classified as adjusting and provides details of items that are specifically excluded from being classified as adjusting items. Adjusting items in profit from operations include restructuring and integration costs, amortisation of trademarks and similar intangibles, the fair value movement in stock on acquisition, a gain on deemed partial disposal of a trademark, and certain litigation. The definition of adjusting items is explained in note 1 in the Notes on the Accounts.
The Group’s Management Board believes that these additional measures are useful to investors and are used by the Group’s Management Board as described above, because they exclude the impact of adjusting items in profit from operations, which have less bearing on the routine operating activities of the Group, thereby enhancing users’ understanding of underlying business performance. The Group’s Management Board also believes that adjusted profit from operations provides information that enables investors to better compare the Group’s business performance across periods. Additionally, the Group’s Management Board believes that similar measures are frequently used by securities analysts, investors and other interested parties in their evaluation of companies comparable to the Group, many of which present an adjusted operating profit-related performance measure when reporting their results. Adjusted profit from operations and adjusted operating margin have limitations as analytical tools. They are not presentations made in accordance with IFRS, are not measures of financial condition or liquidity and should not be considered as alternatives to profit for the year, profit from operations or operating margin as determined in accordance with IFRS. Adjusted profit from operations and adjusted operating margin are not necessarily comparable to similarly titled measures used by other companies. As a result, you should not consider these performance measures in isolation from, or as a substitute analysis for, BAT’s results of operations as determined in accordance with IFRS.
The table below reconciles the Group’s profit from operations to adjusted profit from operations, and to adjusted profit from operations at constant rates based on a re-translation of adjusted profit from operations for each year, at the previous year’s exchange rates, and presents adjusted operating margin for the periods presented. Refer to note 2 in the Notes on the Accounts for further discussion of the segmental results and for the reconciliation of adjusted profit from operations at current and constant rates of exchange to segmental profit from operations and to Group profit for the years ended 31 December 2020, 2019 and 2018.
| For the year ended 31 December (£m) | ||||||||||||||||||||
| 2020 | 2019 | 2018 | 2017 | 2016 | ||||||||||||||||
| Profit from operations |
9,962 | 9,016 | 9,313 | 6,412 | 4,655 | |||||||||||||||
| Add: |
||||||||||||||||||||
| Restructuring and integration costs |
408 | 565 | 363 | 600 | 603 | |||||||||||||||
| Amortisation and impairment of trademarks and similar intangibles |
339 | 481 | 377 | 383 | 149 | |||||||||||||||
| Impairment of goodwill |
209 | 194 | – | – | – | |||||||||||||||
| (Income)/Charge in respect of an excise tax dispute in Russia |
(40 | ) | 202 | – | – | – | ||||||||||||||
| Charge in respect of Canada class action |
– | 436 | – | – | – | |||||||||||||||
| Fair value movement in stock on acquisition |
– | – | – | 465 | – | |||||||||||||||
| Fixed asset impairment (hyperinflation) |
– | – | 110 | – | – | |||||||||||||||
| Fox River |
– | – | – | – | 20 | |||||||||||||||
| Charge in respect of MSA liabilities related to brands sold to a third party |
400 | – | – | – | – | |||||||||||||||
| Other, including litigation |
87 | 236 | 184 | 69 | 53 | |||||||||||||||
| Adjusted profit from operations |
11,365 | 11,130 | 10,347 | 7,929 | 5,480 | |||||||||||||||
| Operating margin |
38.6% | 34.8% | 38.0% | 32.8% | 32.9% | |||||||||||||||
| Adjusted operating margin* |
44.1% | 43.1% | 42.6% | 41.1% | 38.8% | |||||||||||||||
| Impact of translational foreign exchange |
296 | (98 | ) | 577 | (324 | ) | (283 | ) | ||||||||||||
| 2020 adjusted profit from operations re-translated at 2019 exchange rates |
11,661 | |||||||||||||||||||
| 2019 adjusted profit from operations re-translated at 2018 exchange rates |
11,032 | |||||||||||||||||||
| 2018 adjusted profit from operations re-translated at 2017 exchange rates |
10,924 | |||||||||||||||||||
| 2017 adjusted profit from operations re-translated at 2016 exchange rates |
7,605 | |||||||||||||||||||
| 2016 adjusted profit from operations re-translated at 2015 exchange rates |
5,197 | |||||||||||||||||||
| Change in adjusted profit from operations at prior year’s exchange rates (constant rates) |
+4.8% | +6.6% | +37.8% | +38.8% | +4.1% | |||||||||||||||
| * | Adjusted profit from operations as a percentage of adjusted revenue. |
| 280 | BAT Annual Report and Form 20-F 2020 |
Other Information
Non-GAAP Measures
Continued
Adjusted Share of Post-Tax Results of Associates and Joint Ventures
Definition – share of post-tax results of associates and joint ventures before the impact of adjusting items.
To supplement BAT’s performance presented in accordance with IFRS, the Group’s share of post-tax results of associates and joint ventures is also presented before adjusting items (as defined in note 1 in the Notes on the Accounts). The Group’s Management Board believes that adjusted share of post-tax results of associates and joint ventures provides information that enables investors to better compare the Group’s business performance across periods. The Group’s Management Board uses adjusted share of post-tax results from associates and joint ventures as part of the total assessment of the underlying performance of all the Group’s business interests. Adjusted share of post-tax results of associates and joint ventures has limitations as an analytical tool. It is not a presentation made in accordance with IFRS, is not a measure of financial condition or liquidity, and should not be considered as an alternative to the Group’s share of post-tax results of associates and joint ventures as determined in accordance with IFRS. Adjusted share of post-tax results of associates and joint ventures is not necessarily comparable to similarly titled measures used by other companies. As a result, you should not consider this performance measure in isolation from, or as a substitute analysis for, BAT’s results of operations as determined in accordance with IFRS.
The most directly comparable IFRS measure to adjusted share of post-tax results of associates and joint ventures is share of post-tax results of associates and joint ventures.
| For the year ended 31 December (£m) | ||||||||||||||||||||
| 2020 | 2019 | 2018 | 2017 | 2016 | ||||||||||||||||
| Group’s share of post tax results of associates and joint ventures |
455 | 498 | 419 | 24,209 | 2,227 | |||||||||||||||
| Issue of shares and changes in shareholding |
(17 | ) | (25 | ) | (22 | ) | (29 | ) | (11 | ) | ||||||||||
| Gain on deemed divestment of Reynolds American Inc. |
– | – | – | (23,288 | ) | – | ||||||||||||||
| Gain on disposal of assets |
– | – | – | – | (941 | ) | ||||||||||||||
| Other |
4 | – | (10 | ) | 120 | 52 | ||||||||||||||
| Adjusted Group’s share of post tax results of associates and joint ventures |
442 | 473 | 387 | 1,012 | 1,327 | |||||||||||||||
Underlying Tax Rate
Definition – Tax rate incurred before the impact of adjusting items and to adjust for the inclusion of the Group’s share of post-tax results of associates and joint ventures within the Group’s pre-tax results.
BAT management monitors the Group’s underlying tax rate to assess the tax rate applicable to the Group’s underlying operations, excluding the Group’s share of post-tax results of associates and joint ventures in BAT’s pre-tax results and adjusting items (as defined in note 1 in the Notes on the Accounts). Underlying tax rate is not a measure defined by IFRS. The table below provides the calculation of the Group’s effective tax rate as determined in accordance with IFRS with underlying tax rate for the periods presented. The Group’s Management Board believes that this additional measure is useful to investors, and is used by BAT management as described above, because it excludes the contribution from the Group’s associates, recognised after tax but within the Group’s pre-tax profits, and adjusting items, thereby enhancing users’ understanding of underlying business performance.
Underlying tax rate has limitations as an analytical tool. It is not a presentation made in accordance with IFRS and should not be considered as an alternative to the effective tax rate as determined in accordance with IFRS. Underlying tax rate is not necessarily comparable to similarly titled measures used by other companies. As a result, you should not consider this measure in isolation from, or as a substitute analysis for, the Group’s effective tax rate as determined in accordance with IFRS. The table below provides the calculation of the Group’s underlying tax rate for the periods presented.
| For the year ended 31 December (£m) | ||||||||||||||||||||
| 2020 | 2019 | 2018 | 2017 | 2016 | ||||||||||||||||
| Profit before taxation |
8,672 | 7,912 | 8,351 | 29,527 | 6,245 | |||||||||||||||
| Less: Share of post-tax results of associates and joint ventures |
(455 | ) | (498 | ) | (419 | ) | (24,209 | ) | (2,227 | ) | ||||||||||
| Adjusting items within profit from operations |
1,403 | 2,114 | 1,034 | 1,517 | 825 | |||||||||||||||
| Adjusting items within finance costs/(income) |
153 | 80 | (4 | ) | 205 | 108 | ||||||||||||||
| Adjusted profit before taxation, excluding associates and joint ventures |
9,773 | 9,608 | 8,962 | 7,040 | 4,951 | |||||||||||||||
| Taxation on ordinary activities |
(2,108 | ) | (2,063 | ) | (2,141 | ) | 8,129 | (1,406 | ) | |||||||||||
| Adjusting items in taxation |
(35 | ) | (65 | ) | (24 | ) | (9,766 | ) | 61 | |||||||||||
| Taxation on adjusting items |
(287 | ) | (373 | ) | (199 | ) | (454 | ) | (128 | ) | ||||||||||
| Adjusted taxation |
(2,430 | ) | (2,501 | ) | (2,364 | ) | (2,091 | ) | (1,473 | ) | ||||||||||
| Effective tax rate |
+24.3% | 26.1% | 25.6% | (27.5% | ) | 22.5% | ||||||||||||||
| Underlying tax rate |
+24.9% | 26.0% | 26.4% | 29.7% | 29.8% | |||||||||||||||
|
Strategic Report |
Governance Report | Financial Statements | Other Information | BAT Annual Report and Form 20-F 2020 | 281 | |||||
|
|
Adjusted Diluted Earnings Per Share
Definition – diluted earnings per share before the impact of adjusting items.
BAT management monitors adjusted diluted earnings per share, a measure which removes the impact of adjusting items, (as defined in note 1 in the Notes on the Accounts), from diluted earnings per share. Adjusted diluted earnings per share is used by management within the Group’s incentive schemes, as reported within the Remuneration Report beginning on page 117 and reported in note 7 in the Notes on the Accounts. The Group’s Management Board believes that this additional measure is useful to investors, and is used by BAT management as described above, as an indicator of diluted earnings per share before adjusting items. Adjusted diluted earnings per share has limitations as an analytical tool and should not be used in isolation from, or as a substitute for, diluted earnings per share as determined in accordance with IFRS. The most directly comparable IFRS measure to adjusted diluted earnings per share is diluted earnings per share and a reconciliation is provided in note 7 in the Notes on the Accounts. The definition of adjusting items is provided in note 1 in the Notes on the Accounts.
Operating Cash Flow Conversion Ratio
Definition – net cash generated from operating activities before the impact of adjusting items and dividends from associates and excluding trading loans to third parties, pension short fall funding, taxes paid and net capital expenditure, as a proportion of adjusted profit from operations.
| 282 | BAT Annual Report and Form 20-F 2020 |
Other Information
Non-GAAP Measures
Continued
Net Debt
Definition – total borrowings, including related derivatives, less cash and cash equivalents and current investments held at fair value.
The Group uses net debt to assess its financial capacity. Net debt is not a measure defined by IFRS. The most directly comparable IFRS measure to net debt is total borrowings. The Group’s Management Board believes that this additional measure, which is used internally to assess the Group’s financial capacity, is useful to the users of the financial statements in helping them to see how business financing has changed over the year. Net debt has limitations as an analytical tool. It is not a presentation made in accordance with IFRS and should not be considered as an alternative to total borrowings or total liabilities determined in accordance with IFRS. Net debt is not necessarily comparable to similarly titled measures used by other companies. As a result, you should not consider this measure in isolation from, or as a substitute analysis for, the Group’s measures of financial position or liquidity as determined in accordance with IFRS. A reconciliation of borrowings to net debt is provided in note 19 in the Notes on the Accounts.
|
Strategic Report |
Governance Report | Financial Statements | Other Information | BAT Annual Report and Form 20-F 2020 | 283 | |||||
|
|
Adjusted Net Debt to Adjusted Earnings Before Interest, Tax, Depreciation and Amortisation (Adjusted EBITDA)
Definition – net debt excluding the impact of the revaluation of Reynolds American Inc. acquired debt arising as part of the purchase price allocation process, as a proportion of profit for the year (earnings) before net finance costs/income, taxation on ordinary activities, depreciation, amortisation, impairment costs, the Group’s share of post-tax results of associates and joint ventures, and other adjusting items.
| 284 | BAT Annual Report and Form 20-F 2020 |
Other Information
Non-GAAP Measures
Continued
Results on a Constant Translational Currency Basis
Movements in foreign exchange rates have impacted the Group’s financial results. The Group’s Management Board reviews certain of its results, including adjusted revenue, adjusted revenue growth from New Categories, adjusted revenue growth from the strategic portfolio, adjusted profit from operations and adjusted diluted earnings per share, at constant rates of exchange. The Group calculates these financial measures at constant rates of exchange based on a re-translation, at prior year exchange rates, of the current year’s results of the Group and, where applicable, its geographic segments. The Group does not adjust for the normal transactional gains and losses in profit from operations that are generated by exchange movements. Although the Group does not believe that these measures are a substitute for IFRS measures, the Group’s Management Board does believe that such results excluding the impact of currency fluctuations year-on-year provide additional useful information to investors regarding the Group’s operating performance on a local currency basis. Accordingly, the constant rates of exchange financial measures appearing in the discussion of the Group results of operations (beginning on page 64) should be read in conjunction with the information provided in note 2 in the Notes on the Accounts.
In 2020, 2019 and 2018, results were affected by translational exchange rate movements. In 2020, at the prevailing exchange rates, adjusted revenue declined by 0.4%, adjusted profit from operations increased by 2.1%, adjusted revenue from the strategic portfolio increased by 4.0% and adjusted revenue from New Categories increased by 14.9% versus 2019. At constant rates of exchange, adjusted revenue would have increased by 3.3%, adjusted profit from operations would have increased by 4.8%, adjusted revenue from the strategic portfolio would have increased by 7.0% and adjusted revenue from New Categories would have increased by 15.4%. This lower growth rate at prevailing exchange rates reflects the negative translational impact as a result on the relative strengthening of the pound sterling. In 2019, at the prevailing exchange rates, adjusted revenue increased by 6.2%, adjusted profit from operations increased by 7.6%, adjusted revenue from the strategic portfolio increased by 8.9% and adjusted revenue from New Categories increased by 36.9% versus 2018. At constant rates of exchange, adjusted revenue would have increased by 5.6%, adjusted profit from operations would have increased by 6.6%, adjusted revenue from the strategic portfolio would have increased by 7.3% and adjusted revenue from New Categories would have increased by 32.4%. These higher rates at prevailing exchange rates reflects the translational benefit as a result of the relative weakness of the pound sterling.
In 2020, 2019 and 2018, adjusted diluted earnings per share was affected by translational exchange rate movements. In 2020, the adjusted diluted earnings per share of 331.7p, an increase of 2.4%, would, when translated at 2019 exchange rates, have been 341.4p, an increase of 5.5%. This lower growth rate, in 2020, at prevailing exchange rates, reflects the negative translational impact as a result of the relative strength of the pound sterling. In 2019, the adjusted diluted earnings per share of 323.8p, an increase of 9.1%, would, when translated at 2018 exchange rates, have been 321.6p, an increase of 8.4%. This higher growth rate, in 2019, at prevailing exchange rates, reflects the translational benefit as a result of the relative weakness of the pound sterling.
|
Strategic Report |
Governance Report | Financial Statements | Other Information | BAT Annual Report and Form 20-F 2020 | 285 | |||||
|
|
As at 31 December 2020, the number of persons employed by the Group was 55,329 worldwide. The Group believes that its labour relations are good.
Certain temporary employees are included in the below figures. The number of such temporary employees is approximately 400 in 2020 and largely relates to seasonal workers within operations.
The following table sets forth the number of Group employees by region in 2020, 2019 and 2018.
| As of 31 December | ||||||||||||
| Region (number of employees worldwide) | 2020 | 2019 | 2018 | |||||||||
| US |
4,921 | 5,020 | 5,019 | |||||||||
| APME |
10,750 | 13,465 | 15,077 | |||||||||
| AmSSA |
15,873 | 16,862 | 17,372 | |||||||||
| ENA1 |
23,785 | 24,642 | 26,409 | |||||||||
| Total employees |
55,329 | 59,989 | 63,877 | |||||||||
Note:
| 1. | Included within the employee numbers for ENA are certain employees in different locations in respect of central functions. Some of the costs of these employees are allocated or charged to the various regions and markets in the Group. |
| 286 | BAT Annual Report and Form 20-F 2020 |
Other Information
Liquidity and Capital Resources
The Group’s cash inflows derive principally from its operating activities. They are supplemented when required by cash flows from financing activities, typically to support acquisitions. The principal sources of liquidity for the Group are cash flows generated from the operating business and proceeds from issuances of debt securities described below under ‘capital resources’.
The Board reviews and agrees the overall treasury policies and procedures, delegating appropriate oversight to the Finance Director and the treasury function. The treasury policies include a set of financing principles and key performance indicators. The Group’s treasury position is monitored by a Corporate Finance Committee chaired by the Finance Director. Treasury operations are subject to periodic independent reviews and audits, both internal and external.
In 2020, 2019 and 2018, all contractual borrowing covenants were met and none are expected to inhibit the Group’s operations or funding plans. In 2020, the Group’s financial covenant (interest cover) was removed from the terms of the revolving credit facility and syndicated term loan.
Capital Expenditure
Gross capital expenditures include purchases of property, plant and equipment and purchases of certain intangibles. The Group’s gross capital expenditures for 2020, 2019 and 2018 were £648 million, £807 million and £883 million, respectively, representing investment in the Group’s global operational infrastructure (including, but not limited to, the manufacturing network, trade marketing and IT systems). The Group expects gross capital expenditures in 2021 of approximately £700 million, representing the ongoing investment in the Group’s operational infrastructure, including the continued investment into New Categories. This is expected to be funded by the Group’s cash flows and existing facilities.
Hedging Instruments
As discussed in note 22 in the Notes on the Accounts, the Group hedges its exposure to interest rate movements and currency movements. BAT’s cash flow hedges are principally in respect of sales or purchases of inventory and certain debt instruments. A certain number of forward foreign currency contracts were used to manage the currency profile of external borrowings. Interest rate swaps have been used to manage the interest rate profile of external borrowings, while cross-currency swaps have been used to manage the currency profile of external borrowings.
Capital Resources
Policy
The Group utilises cash pooling and zero balancing bank account structures in addition to intercompany loans and borrowings to ensure that there is the maximum mobilisation of cash within the Group. The key objectives of treasury in respect of cash and cash equivalents are to protect the principal value of the Group’s cash and cash equivalents, to concentrate cash at the centre to minimise the required long-term debt issuance and to optimise the yield earned. The amount of debt the Group issues is determined by forecasting the net debt requirement after the mobilisation of cash. Subsidiary companies are funded by share capital and retained earnings, loans from the central finance companies on commercial terms or through local borrowings by the subsidiaries in appropriate currencies. All contractual borrowing covenants have been met and none are expected to inhibit the Group’s operations or funding plans.
Borrowings
The following table sets out the Group’s long-and short-term borrowings as of the dates indicated:
| As of 31 December (£m)1 | ||||||||||||||||||
| Currency | Maturity dates | Interest rates at 31 December 2020 | 2020 | 2019 | 2018 | |||||||||||||
|
Eurobonds2 |
Euro | 2021 to 2045 | 0.9% to 4.9% | 8,875 | 7,591 | 8,717 | ||||||||||||
| Euro | 2021 | 3m EURIBOR +50bps | 984 | 931 | 986 | |||||||||||||
| UK pound sterling | 2021 to 2055 | 1.8% to 7.3% | 4,590 | 4,161 | 4,671 | |||||||||||||
| US dollar | 2019 | Not applicable | – | – | 512 | |||||||||||||
| Swiss franc | 2021 to 2026 | 0.6% to 1.4% | 540 | 510 | 523 | |||||||||||||
| Bonds issued pursuant | ||||||||||||||||||
| to rules under the |
||||||||||||||||||
| US Securities Act (as |
||||||||||||||||||
| amended)2 |
US dollar | 2022 to 2050 | 1.7% to 8.1% | 25,461 | 23,805 | 25,428 | ||||||||||||
| US dollar | 2022 | USD 3m LIBOR + 88bps | 548 | 1,325 | 1,381 | |||||||||||||
| Commercial Paper2 |
– | 1,056 | 536 | |||||||||||||||
| Other loans |
1,929 | 4,624 | 3,859 | |||||||||||||||
| Bank loans |
317 | 293 | 608 | |||||||||||||||
| Bank overdrafts |
249 | 491 | 274 | |||||||||||||||
| Finance leases |
475 | 579 | 14 | |||||||||||||||
|
Total |
43,968 | 45,366 | 47,509 | |||||||||||||||
Notes:
| 1. | The financial data above has been extracted from the Group’s consolidated financial statements. |
| 2. | The issuers of these debt securities are B.A.T. International Finance p.l.c., B.A.T Capital Corporation, Reynolds American Inc., or R.J. Reynolds Tobacco Company, as applicable. British American Tobacco p.l.c. is the ultimate guarantor in each case. |
|
Strategic Report |
Governance Report | Financial Statements | Other Information | BAT Annual Report and Form 20-F 2020 | 287 | |||||
|
|
Off-Balance Sheet Arrangements and Contractual Obligations
The Group has no significant off-balance sheet arrangements. The Group has contractual obligations to make future payments on debt agreements. In the normal course of business, the Group enters into contractual arrangements where the Group commits to future purchases of services from unaffiliated parties and related parties.
The Group’s undiscounted contractual obligations as of 31 December 2020 were as follows:
| Payments due by period (£m) | ||||||||||||||||||||
| Total | Less than 1 Year |
1–3 Years | 3–5 Years | Thereafter | ||||||||||||||||
| Long-term notes and other borrowings, exclusive of interest1 |
42,994 | 3,405 | 6,467 | 7,880 | 25,242 | |||||||||||||||
| Interest payments related to long-term notes1 |
499 | 499 | – | – | – | |||||||||||||||
| Lease liabilities |
475 | 137 | 169 | 82 | 87 | |||||||||||||||
| Purchase obligations2 |
850 | 773 | 67 | 10 | – | |||||||||||||||
| Total cash obligations |
44,818 | 4,814 | 6,703 | 7,972 | 25,329 | |||||||||||||||
Notes:
| 1. | For more information about the Group’s long-term debt, see note 19 in the Notes on the Accounts. |
| 2. | Purchase obligations primarily include commitments to acquire tobacco leaf. Purchase orders for the purchase of other raw materials and other goods and services are not included in the table, as the Group’s operating subsidiaries are not able to determine the aggregate amount of such purchase orders that represent contractual obligations, as purchase orders typically represent authorisations to purchase rather than binding agreements. |
The table above does not include any amounts that the Group may pay to fund its retirement benefit plans as the timing and amount of any such future funding are unknown and dependent on, among other things, the future performance of defined benefit pension plan assets, interest rate assumptions and other factors. The net retirement benefit scheme liabilities totalled £810 million as of 31 December 2020, which is net of pension assets of £12,576 million. The Group expects to be required to contribute £81 million to its defined benefit plans during 2021. See note 11 in the Notes on the Accounts for further information.
The above table also excludes any amounts in relation to service contracts which are disclosed in note 27 in the Notes on the Accounts.
| 288 | BAT Annual Report and Form 20-F 2020 |
Other Information
The following is a summary of some of the risks and uncertainties, the occurrence of any one of which, alone or in combination with other events or circumstances, may materially adversely affect the Group’s results of operations and financial condition. You should read this summary together with the ‘Principal Group risks’ section on pages 84 to 88 and the more detailed description of each risk factor contained below.
Business execution and supply chain risks
| – | Competition from illicit trade. |
| – | Geopolitical tensions that have the potential to disrupt the Group’s business in multiple markets. |
| – | Disruption to the Group’s data and information technology systems, including by cyber attack or the malicious manipulation or disclosure of confidential or sensitive information. |
| – | Failure to meet current or future New Categories demand. |
| – | Failure of a financial counterparty. |
| – | Exposure to unavailability of, and price volatility, in raw materials and increased costs of employment. |
| – | Failure to retain key personnel or to attract and retain skilled talent. |
| – | Disruption to the supply chain and distribution channels. |
| – | Failure to deliver digital innovation and drive digital transformation. |
| – | Exposure to product contamination. |
| – | Inability to obtain adequate supplies of tobacco leaf. |
| – | Failure to successfully design, implement and sustain an integrated operating model. |
| – | Failure to uphold the high standard of ESG management. |
| – | Impact of a pandemic on the performance of the Group. |
Legal, regulatory and compliance risks
| – | Exposure to increasingly stringent regulatory measures affecting the manufacture, packaging, sale and marketing of the Group’s products. |
| – | Adverse implications of proposed EU legislation on single-use plastics that will result in on-pack environmental warnings and financial implications relating to the Extended Producer Responsibility (EPR). |
| – | Exposure to litigation on tobacco, nicotine, New Categories and other issues. |
| – | Significant and/or unexpected increases or structural changes in tobacco and nicotine-related taxes. |
| – | Failure to comply with health and safety and environmental laws. |
| – | Exposure to unfavourable tax rulings. |
| – | Unexpected legislative changes to corporate income tax laws. |
| – | Exposure to potential liability under competition or antitrust laws. |
| – | Failure to establish and maintain adequate controls and procedures to comply with applicable securities, corporate governance and compliance regulations. |
| – | Loss of confidential information, including through manipulation of data by employees and system failure. |
| – | Failure to comply with product regulations due to uncertainty surrounding the proper interpretation and application of those regulations. |
| – | Failure to uphold high standards of corporate behaviour, including under anti-bribery and anti-corruption laws. |
| – | Imposition of sanctions under sanctions regimes or similar international, regional or national measures. |
| – | Loss or misuse of personal data through a failure to comply with the European General Data Protection Regulation, the UK Data Protection Act 2018, e-Privacy laws and other privacy legislation governing the processing of personal data. |
|
Strategic Report |
Governance Report | Financial Statements | Other Information | BAT Annual Report and Form 20-F 2020 | 289 | |||||
|
|
Economic and financial risks
| – | Foreign exchange rate exposures. |
| – | Inability to obtain price increases and exposure to risks from excessive price increases and value chain erosion. |
| – | Effects of declining consumption of legitimate tobacco products and a tough competitive environment. |
| – | Funding, liquidity and interest rate risks. |
| – | Failure to achieve growth through mergers, acquisitions and joint ventures. |
| – | Unforeseen underperformance in key global markets. |
| – | Increases in net liabilities under the Group’s retirement benefit schemes. |
| – | Adverse consequences of the UK’s exit from the EU. |
Product pipeline, commercialisation and Intellectual Property risks
| – | Inability to predict consumers’ changing behaviours and launch innovative products that offer adult tobacco and nicotine consumers meaningful value-added differentiation. |
| – | Exposure to risks associated with intellectual property rights, including the failure to identify, protect and prevent infringement of the Group’s intellectual property rights and potential infringement of, or the failure to retain licences to use, third-party intellectual property rights. |
| 290 | BAT Annual Report and Form 20-F 2020 |
Other Information
Business Execution and Supply Chain Risks
Risk: Competition from illicit trade.
Description
Illicit trade, illegal products and tobacco trafficking in the form of counterfeit products, smuggled genuine products (product diversion), and locally manufactured products, which do not comply with applicable regulations and/or in which applicable taxes are evaded, represent a significant and growing threat to the legitimate tobacco industry and New Categories products. Factors such as increasing levels of taxation, price increases, economic downturn, lack of law enforcement, appropriate penalties and weak border control are encouraging more adult tobacco and New Categories consumers to switch to illegal cheaper tobacco and New Categories products and are providing greater rewards for counterfeiters and smugglers. Regulatory restrictions such as plain packaging or graphic health warnings, display bans, flavour or ingredient restrictions and increased compliance costs further disadvantage legitimate industry participants by providing competitive advantages to illicit manufacturers and distributors of illicit tobacco and New Categories products.
Impact
Illicit trade can have an adverse effect on the Group’s overall sales volume and may restrict the ability to increase selling prices. Illicit trade can also damage brand equity and reputation, which could undermine the Group’s investment in Trade Marketing and Distribution. These factors in turn could reduce profits and have an adverse effect on the Group’s results of operations and financial conditions. Further, counterfeit New Categories products and other illicit products could harm consumers, damaging goodwill and/or the category (with lower volumes and reduced profits), and potentially leading to misplaced claims against BAT and further regulation. In addition, as the Group has contractual and legislative obligations to prevent the diversion of our products into illicit channels, actual and perceived breaches of the obligations to prevent product diversion into illicit channels can lead to substantial fines in the forms of seizure payments and legislative penalties, as well as the risk of reputational damage from Group products being found in illicit channels.
Risk: Geopolitical tensions that have the potential to disrupt the Group’s business in multiple markets.
Description
The Group’s operations and financial condition are influenced by the economic and political situations in the markets and regions in which it has operations, which are often unpredictable and outside of its control. Some markets in which the Group operates face the threat of civil unrest and can be subject to frequent changes in regime. In others, there is a risk of terrorism, conflict, global health crisis, war, organised crime or other criminal activity. The Group is also exposed to economic policy changes in jurisdictions in which it operates. In addition, some markets maintain trade barriers or adopt policies that favour domestic producers, preventing or restricting the Group’s sales.
Impact
Deterioration of socio-economic or political conditions could potentially lead to loss of life, restricted mobility, loss of assets and/or denial of access to BAT sites that reduce the Group’s access to particular markets or may disrupt the Group’s operations, such as supply chain, or manufacturing or distribution capabilities. Such disruption may result in increased costs due to the need for more complex supply chain arrangements, to build new facilities or to maintain inefficient facilities, or in a reduction of the Group’s sales volume.
Risk: Disruption to the Group’s data and information technology systems, including by cyber attack or the malicious manipulation or disclosure of confidential or sensitive information.
Description
The Group increasingly relies on data and information technology systems for its daily business operations, internal communications, controls, reporting and relations with customers and suppliers. Some of these systems are managed by third-party service providers. A significant disruption of the Group’s systems, including those managed by third-party service providers, due to computer viruses, cyber threats, malicious intrusions or unintended or malicious behaviour by employees, contractors or services providers could affect the Group’s communications and operations. Computer viruses and cyber attacks are becoming more sophisticated and coordinated. In addition, such disruption may compromise the integrity of information and result in the inappropriate disclosure of confidential information, or may lead to false or misleading statements being made about the Group.
Impact
Any disruption to technology systems related to the Group’s operations could adversely affect its business and result in financial and reputational losses. Any delays or failure to rapidly detect or respond to attempts to gain unauthorised access to the Group’s information technology systems through a cyber attack can lead to a loss of access to systems or information being corrupted or lost, resulting in significantly increased costs for remediation and reputational consequences. Any delay in response will also impact the outcome.
Security breaches and the loss of data or operational capacity may disrupt relationships throughout the supply chain, expose the Group or our consumers to a risk of loss or misuse of information, which could further expose the Group to liability, impact the Group’s reputation and lead to increased costs.
The disclosure of trade secrets or other commercially sensitive information may provide competitors with a competitive advantage resulting in competitive or operational damage to the Group. The disclosure of confidential and sensitive information about the Group’s employees, customers, consumers, suppliers or other third parties could compromise data privacy and expose the Group to liability.
Failure to effectively prevent or respond to a major breach or cyber attack may also subject the Group to significant reputational damage.
|
Strategic Report |
Governance Report | Financial Statements | Other Information | BAT Annual Report and Form 20-F 2020 | 291 | |||||
|
|
Business Execution and Supply Chain Risks continued
Risk: Failure to meet current or future New Categories demand.
Description
The New Categories supply chain is a multi-tiered and complex environment with reliance on multiple factors, such as third-party suppliers’ ability to upscale production in order to meet demand while maintaining product quality, dependency on single suppliers at various points in the chain and the Group’s ability to build adequate consumables production capacity in line with product demand. The geographical spread of suppliers and customers exposes the Group to political and economic conflicts such as Brexit and trade wars which may compromise the New Categories supply chain. Given the developing nature of the New Categories portfolio, there is also an enhanced risk that some products may not meet product quality and safety standards or may be subject to regulatory changes, leading to product recalls, which we have experienced in the past, or bans of certain ingredients or products. In addition, the New Categories supply chain may be vulnerable to changes in local legislation related to liquid nicotine that could increase import duties. Furthermore, the New Categories supply chain includes the development of sensitive trade secrets jointly with external design partners, which carries the risk of exposure of innovations to competitors.
Impact
Vulnerabilities in the New Categories supply chain may impact the Group’s ability to maintain supply and meet the current and future demand requirements across the New Categories portfolio, potentially resulting in significant reputational harm and financial impact that may negatively affect the Group’s results of operations and financial condition. Over-forecasting may also lead to write-off and negatively impact working capital. The design of New Categories devices may also prevent the scaling of commercial manufacturing, which will either restrict supply or increase the costs of production.
In addition, changes in local legislation related to liquid nicotine import duties may increase New Categories production costs, which may increase end market pricing. Furthermore, the exposure of sensitive trade secrets can lead to competitive disadvantages and further negatively impact the Group’s results of operations and financial condition.
Risk: Failure of a financial counterparty.
Description
The Group relies on transactions with a variety of financial counterparties to manage the Group’s business and financial risks. In the event that any of these counterparties fails, payments due from such counterparties, such as under hedging or insurance contracts, may not be recovered. In addition, failure of a transactional banking party may lead to the loss of cash balances and disruption to payment systems involving such counterparty.
Impact
The inability to recover payments due from one or more failed financial counterparties or the loss of cash balances may cause significant financial loss and have an adverse impact on the Group’s results of operations, financial condition and financial risk profile. In addition, the loss of cash balances or a disruption to payment systems may cause disruption to the Group’s ongoing operations and ability to pay its creditors and suppliers.
Risk: Exposure to unavailability of, and price volatility, in raw materials and increased costs of employment.
Description
The availability and price of various commodities required in the manufacture of the Group’s products fluctuate. Raw materials and other inputs used in the Group’s business, such as wood pulp and energy, are commodities that are subject to price volatility caused by numerous factors, including political influence, market fluctuations and natural disasters.
Similarly, the Group is exposed to the risk of an increase above inflation in employment costs, including due to governmental action to introduce or increase minimum wages. Employment and health care law changes may also increase the cost of provided health care and other employment benefits expenses.
Impact
Restricted availability and price volatility of commodities may result in supply shortages and unexpected increases in costs for raw materials and packaging for the Group’s products, which may affect the Group’s results of operations and financial condition.
Similarly, the Group’s profitability may be affected by increases in overall employment costs.
The Group may not be able to increase prices to offset increased costs without suffering reduced sales volume and revenue. In the absence of compensating for increased costs through pricing, significant increases in raw material, packaging and employment costs above inflation will impact product margins, leading to lower profits and negatively affecting the Group’s results of operations and financial condition.
| 292 | BAT Annual Report and Form 20-F 2020 |
Other Information
Group Risk Factors
Continued
Risk: Failure to retain key personnel or to attract and retain skilled talent.
Description
The Group relies on a number of highly experienced employees with detailed knowledge of the tobacco industry, other areas of focus for the Group and the Group’s business. Similarly, the Group is dependent on its ability to identify, attract, develop and retain such qualified personnel in the future.
Furthermore, broader economic and ESG trends may impact the Group’s ability to retain key employees and may increase competition for highly talented employees, potentially resulting in the loss of experienced employees.
Impact
If the Group is unable to retain its existing key employees or to attract and retain skilled talent in the future, critical positions may be left vacant, which could adversely impact the delivery of strategic objectives, which could ultimately impact the Group’s results of operations and financial condition.
High voluntary employee turnover may also reduce organisational performance and productivity, which may have a further adverse impact on the Group’s results of operations and financial condition.
Risk: Disruption to the supply chain and distribution channels.
Description
The Group has an increasingly global approach to managing its supply chain and distribution channels and is exposed to the risk of disruption to any aspect of the Group’s supply chain, to suppliers’ operations or to distribution channels, and the deterioration in the financial condition of a trading partner.
Such disruption may be caused by a cyber event, global health crisis, major fire, violent weather conditions or other natural disasters that affect manufacturing or other facilities of the Group’s operating subsidiaries or those of their suppliers and distributors. In certain geographic areas where the Group operates, insurance coverage may not be obtainable on commercially reasonable terms, if at all. Coverage may be subject to limitations or the Group may be unable to recover damages from its insurers.
Disruption may also be caused by spread of infectious disease (such as the COVID-19 pandemic) or by a deterioration in labour or union relations, disputes or work stoppages or other labour-related developments within the Group or its suppliers and distributors.
In addition, the Group’s operating subsidiaries may not be able to establish or maintain relationships on favourable commercial terms with their suppliers and distributors. In some markets, distribution of the Group’s products is through third-party monopoly channels, often licensed by governments. The Group may be unable to renew these third-party supplier and distribution agreements on satisfactory terms for numerous reasons, including government regulations or ESG considerations.
Furthermore, there are some product categories for which the Group does not have spare production capacity or where substitution between different production plants is very difficult. Consolidation of global suppliers and certain distributors that control large geographies may reduce the Group’s availability of alternatives and negatively impact the Group’s negotiating power with key suppliers and distributors.
These risks are particularly relevant in jurisdictions where the Group’s manufacturing facilities are more concentrated or for certain product categories where production is more centralised.
Impact
Any disruption to the Group’s supply chain and distribution channels could have an adverse effect on the results of operations and financial conditions of the Group through failures to meet shipment demand, contract disputes, increased costs and loss of market share.
|
Strategic Report |
Governance Report | Financial Statements | Other Information | BAT Annual Report and Form 20-F 2020 | 293 | |||||
|
|
Business Execution and Supply Chain Risks continued
Risk: Failure to deliver digital innovation and drive digital transformation.
Description
The Group’s strategy in areas of further growth and increasing profitability depends to a large extent on digital transformation and innovation. Digital transformation and innovation are key drivers of the Group’s Ethos, which includes new and modern categories of products, increased interaction with customers, data-driven decision making and cost optimisation efforts driven by automated and modernised processes. Examples of the Group’s ambitions that depend on digital transformation include:
| – | the ability to leverage our data assets to generate insights and foresights as a key driver of revenue growth; |
| – | the expansion and flexibility of technology solutions to streamline the market realisation of new products and marketing campaigns; and |
| – | the ability to build new solutions and the flexibility to react to market disruptions. |
The Group must effectively implement new ways of working and supporting technologies to fully develop the digital agenda defined by the Board (e.g. digital channels, data and analytics, automation, cyber, etc.).
The Group may see stalled progress in the pace of digital transformation and hampered strategy goals realisation if the necessary information and digital technology is not ready to support the business implementation of Global Functional Transformations (e.g. direct relationship with consumers, integrated planning, demand forecasting and revenue growth management). The unavailability of the necessary digital technology may be due to missing technology capabilities, lack of scalability or poor data quality. Shortage of skills and ineffective ways of working may slow down the pace of the Group’s digital transformation and hamper its value realisation processes. In addition, sub-optimal design of the global digital platforms implemented by BAT may lead to the fragmentation and under-utilisation of such platforms and slow down the Group’s digital transformation.
Impact
The Group’s multi-category strategy requires dealing with different consumer needs and behaviours as well as complying with various regulations, which increasingly require the expansion and flexibility of technology solutions. This may lead to the fragmentation and under-utilisation of existing and future technology solutions. Similarly, increased control and centralisation of the technology solutions and delivery mechanisms may slow down the effective delivery of the Group’s digital transformation and innovation.
The Group’s inability to adapt to the ever-changing digital space and fully exploit the value expected from digital transformation may have an adverse impact on its competitive edge, market share and profitability, and may prevent the Group from reaching its medium and long-term financial targets.
Risk: Exposure to product contamination.
Description
The Group may experience product contamination, whether by accident or deliberate malicious intent, during supply chain or manufacturing processes, or may otherwise fail to comply with the Group’s quality standards. The Group may also receive threats of malicious tampering.
Impact
Product contamination or threats of contamination may expose the Group to significant costs associated with recalling products from the market or temporarily ceasing production. In addition, adult tobacco consumers may lose confidence in the specific brand affected by the contamination, resulting in reputational damage and a loss of sales volume and market share. The Group could be subject to liability and costs associated with civil and criminal actions as well as regulatory sanctions brought in connection with a contamination of the Group’s products. Each of these results may in turn have an adverse effect on the Group’s results of operations and financial condition.
Risk: Inability to obtain adequate supplies of tobacco leaf.
Description
The Group purchases significant volumes of packed leaf each year. Tobacco leaf supplies are impacted by a variety of factors, including weather conditions, drought, flood and other natural disasters, growing conditions, diseases causing crop failure, climate change and local planting decisions. Tobacco production in certain countries is also subject to a variety of controls, including regulation affecting farming and production control programmes, and competition for land use from other agriculture products. Such controls and competition can further constrain the production of tobacco leaf, raising prices and reducing supply.
Human rights issues may arise in connection with our tobacco leaf supply chain. Due to the large number of casual and temporary workers, the use of family labour in small-scale farming and high levels of rural poverty, the agricultural sector as a whole is vulnerable to human rights issues. The Group recognises that child labour is a risk to our tobacco leaf supply chain.
Impact
Restricted availability of tobacco leaf may impact the quality of the Group’s products to a level that may be perceptible by consumers and may impact the Group’s ability to deliver on consumer needs. Accordingly, the reduction of tobacco leaf supply may impact supply and demand of the Group’s products and have a negative impact on results of operations. The Group’s commitment to ESG may result in higher tobacco leaf prices. Higher tobacco leaf prices may also increase the Group’s costs for raw materials and have an adverse effect on its results of operations and financial condition.
| 294 | BAT Annual Report and Form 20-F 2020 |
Other Information
Group Risk Factors
Continued
Risk: Failure to successfully design, implement and sustain an integrated operating model.
Description
The Group aims to improve profitability and productivity through supply chain improvements and the implementation of an integrated operating model and organisational structure, including standardisation of processes, centralised back-office services and a common IT platform. The Group undertakes transformation initiatives periodically which aim to simplify the organisation and facilitate growth. The Group’s efforts to achieve these goals are driven and enabled through use of our TaO (central SAP ERP system) global template - a standardised process used by all BAT entities globally with the use of a central SAP instance common for BAT subsidiaries (excluding Reynolds American Inc. and its subsidiaries). These processes include, among others, core back-office global processes, procurement, warehouse management, accounting and controlling.
Impact
Failure by the Group to successfully design, implement and sustain the integrated operating model, organisational structure and transformation initiatives could lead to the failure to realise anticipated benefits, increased costs, disruption to operations, decreased trading performance, disgruntled employees, loss of institutional knowledge and reduced market share. These results could in turn reduce profitability and funds available for investment by the Group in long-term growth opportunities. Lack of adherence to the TaO template, as well as template degradation over time, may result in the failure to maintain achieved productivity gains and capture additional productivity gains which may in turn have an adverse effect on the Group’s results of operations and financial condition.
Risk: Failure to uphold the high standard of ESG management.
Description
Stakeholder and shareholder expectations of Group’s ESG performance are continually evolving. The Group may fail to have the appropriate internal standards, strategic plans and governance, monitoring and reporting mechanisms in place to ensure it can identify emerging issues, meet external expectations and align with recognised international standards.
Impact
Failure to uphold high standards of ESG management could seriously impact Group reputation and reduce investor confidence. In addition, poor performance across any aspect of ESG, such as a failure to address climate change or human rights impacts across the Group’s business and supply chain, could result in increased regulation, difficulty in attracting and retaining talent, criminal or civil prosecution, or decreases in consumer demand for our products.
Risk: Impact of a pandemic on the performance of the Group.
Description
The Group continues to closely monitor the development and disruption of the present coronavirus (the “COVID-19 pandemic”) and second and further waves seen in some countries across the Group. The consequences of COVID-19 may include significant logistical challenges for staff and their ability to perform their duties, potential loss of lives or significant level of illness in the workforce, inability to deliver revenue stream and market share targets impacting profits and cash flows, disruption to supply chain and third parties unable to deliver contractual goods and services. In addition, some countries across the Group have adopted regulations restricting the ability to manufacture, distribute, market and sell products.
Impact
The COVID-19 pandemic on the Group’s results of operations and financial condition is uncertain and cannot be predicted as the pandemic evolves.
The long-term impacts of the COVID-19 pandemic to the Group’s business will depend on a range of factors which we are not able to accurately predict, including the duration and scope of the pandemic, the geographies impacted, the impact of the pandemic on economic activity and the nature and severity of measures adopted by governments. These factors include, but are not limited to:
| – | Reductions or volatility in consumer demand for one or more of our products due to illness, retail closures, quarantine or other travel restrictions, health consciousness (quitting use of tobacco and nicotine products), government restrictions, the deterioration of socio-economic conditions, economic hardship and customer-downtrading (switching to a cheaper brand), which may impact the Group’s market share. |
| – | Disruptions to the Group’s operations, such as its supply chain, or manufacturing or distribution capabilities, which may result in increased costs due to the need for more complex supply chain arrangements, to expand existing facilities or to maintain inefficient facilities, a reduction of the Group’s sales volumes or an increase in bad debts from customers. |
| – | Disruption to the Group’s operations resulting from a significant number of the Group’s employees, including employees performing key functions, working remotely for extended periods of time or becoming ill, which may reduce the employees’ efficiency and productivity and cause product development delays, hamper new product innovation and have other unforeseen adverse effects on the Group’s business. |
| – | Significant volatility in financial markets (including exchange rate volatility) and measures adopted by governments and central banks that further restrict liquidity, which may limit the Group’s access to funds, lead to shortages of cash and cash equivalents needed to operate the Group’s business, and impact the Group’s ability to refinance its existing debt. |
| – | Regulations restricting the ability to manufacture, distribute, market and sell products, and potentially increasing illicit trade. |
| – | Governments seeking to increase revenues through increased corporate taxes and excise in combustible and/or New Category products, increasing the cost and prices of our products - which could reduce volumes and margins, and/or increase illicit trade. |
All of these factors may have material adverse effects on the Group’s results of operations and financial condition.
|
Strategic Report |
Governance Report | Financial Statements | Other Information | BAT Annual Report and Form 20-F 2020 | 295 | |||||
|
|
Legal, Regulatory and Compliance Risks
Risk: Exposure to increasingly stringent regulatory measures affecting the manufacture, packaging, sale and marketing of the Group’s products.
Description
Tobacco control measures are in place in nearly all markets in which we operate. Such restrictions are introduced by regulations and/or voluntary agreements. Most tobacco control measures can be categorised as follows:
| – | Place: including regulations restricting smoking in private and public spaces (e.g., public place smoking bans, including restaurants and bars); |
| – | Product: including regulations on the use of and/or testing for ingredients, product design and attributes (e.g., ceilings regarding tar, nicotine and carbon monoxide yields, as well as restrictions on flavours, including menthol); product safety regulations (e.g., reduced cigarette ignition propensity standards); and regulatory product disclosure requirements (e.g., ingredients and emissions reporting); |
| – | Packaging and labelling: including regulations on health warnings and other government-mandated messages (e.g., in respect of content, positioning, size and rotation); restrictions on the use of certain descriptors and brand names; requirements on pack shape, size, weight and colour; and mandatory plain packaging; |
| – | Sponsorship, promotion, advertising and marketing: including partial or total bans on advertising, marketing, promotions and sponsorship; restrictions on brand sharing and brand stretching (i.e., using tobacco branding on non-tobacco products); restrictive regulatory measures or principles (including our International Marketing Principles) on the marketing and sale of tobacco products to consumers such as age verification measures; |
| – | Purchase: including regulations on where the products are sold, such as type of outlet (e.g., supermarkets and vending machines) and how they are sold (e.g., above the counter or under the counter); and |
| – | Price: including regulations that have implications on the prices that manufacturers can charge for their tobacco products (e.g., excise taxes and minimum prices). |
The Group believes that the introduction of further regulation on tobacco control is expected over the medium term in many of the Group’s markets, e.g. in the US following the change of administration and other results in the 2020 elections. The actions of competitors contrary to the regulations applicable to certain markets, may cause reputational harm to the industry as a whole and may result in additional regulation or bans on certain products.
In addition, the Group may fail to implement the right level of control measures or to maintain adequate standards of compliance with the regulatory measures affecting the manufacture, packaging, sale and marketing of the Group’s products. For example, the Group’s marketing activities may fail to comply with the relevant law and regulations or with the Group’s International Marketing Principles. Insufficient information, instruction and training in the relevant areas and a lack of knowledge of the existence and/or requirements of relevant regulations, or a failure to monitor, assess and implement the requirements of new or modified regulation, may increase these risks.
Traditional Tobacco Products
Bans or restrictions on the sale of flavoured tobacco products and menthol have been introduced, and may be introduced in the future, at a municipal, state, national or international level. Further, various national or international regulatory regimes may seek to require the reduction of nicotine levels in tobacco products. With respect to tobacco and combustible products, many of the measures outlined in the FCTC have been or are in the process of being implemented through national legislation in many markets in which the Group operates, including recommendations for plain packaging and flavour bans with menthol bans in effect in the European Union since 20 May 2020. In November 2018, the US Food and Drug Administration (“FDA”) announced the acceleration of proposed rulemaking to seek a ban on menthol in combustible tobacco products. Additionally, in March 2018, the FDA published its ANPRM titled “Tobacco Product Standard for Nicotine Level of Combusted Cigarettes” and invited interested parties to submit comments on, among other issues, maximum nicotine limits and whether any maximum nicotine level should apply to combustible tobacco products.
In the US, manufacturers of all tobacco products deemed to be under the authority of the FDA as of 2016 (which includes vapour and Modern Oral products) must submit information to the FDA seeking formal marketing authorisation of such products. Several countries, including France, Belgium and Pakistan, have sought or are seeking to prohibit certain brands/brand variants or messaging on cigarette packaging that promotes a brand or usage. Finally, the FCTC COP9 and the EU Tobacco Product Directive 2, post-implementation review which is currently ongoing, are likely to result in further regulation for New Categories and traditional tobacco products.
New Categories
With respect to New Categories, although a common framework for regulation and taxation has yet to emerge, the manufacture, sale, packaging and advertising of such products are increasingly being regulated. In fact, some regulators have applied or are considering applying combustible tobacco products’ restrictive regulatory framework to New Categories, such as public place vaping bans or plain packaging. Some jurisdictions have banned or are considering banning New Categories altogether.
Following reports of individuals experiencing acute respiratory injury in suspected association with vaping certain e-liquids (EVALI) and several allegations regarding vaping youth usage in the USA, regulators at the local, municipal, state, national and international levels are increasingly applying or considering applying more restrictive regulations for vapour products. This approach is publicly supported by the World Health Organization (WHO) which continues to call on countries to ban or regulate novel nicotine products as tobacco. The USA, Europe and Canada are playing a leading role across all identified regulatory risks, including: bans on flavours, sales channel bans, advertising restrictions and nicotine limits, among others. With respect to Modern Oral, regulatory frameworks currently follow divergent approaches. In certain markets, in particular where there is an absence of adequate regulation, actions of irresponsible competitors may cause reputational harm to the category and result in outright bans or adverse regulation, as has been the case in Russia with allegations regarding youth usage. In markets where there is a likelihood of tobacco, pharmaceutical or food regulatory classification, the category can be at risk of severe regulation or total ban. The Group believes that Tobacco Heated Products are likely to be regulated as traditional tobacco products, driven by the decision of WHO’s 7th Conference of Parties to the Framework Convention on Tobacco Control, including recommendations for plain packaging and flavour bans.
Please refer to pages 307 to 310 for details of tobacco and nicotine regulatory regimes under which the Group’s businesses operate.
| 296 | BAT Annual Report and Form 20-F 2020 |
Other Information
Group Risk Factors
Continued
Risk: Exposure to increasingly stringent regulatory measures affecting the manufacture, packaging, sale and marketing of the Group’s products continued.
Impact
Existing and future regulatory measures impacting both New Categories and/or traditional tobacco products could adversely affect volume, revenue and profits, as a result of: restrictions on the Group’s ability to sell its products or brands, reduced margins due to increased operating costs, impediments to building or maintaining brand equity and restrictions on the Group’s ability to deliver, market and sell existing or new products responding to consumers’ preferences. In addition, new regulation could lead to greater complexity, as well as higher production and compliance costs.
As an example, through the acquisition of Reynolds American Inc., the Group acquired the Newport brand, the leading menthol cigarette brand in the US, the Group’s largest single market. The sales of Newport, together with the other menthol brands of the Group’s operating subsidiaries, represent a significant portion of the Group’s total net sales. Any action by the FDA or any other governmental authority banning or materially restricting the use of menthol in tobacco products could have a significant negative impact on sales volumes, which would, in turn, have an adverse effect on the results of operations and financial position of the Group. Any action by the FDA or any government authority restricting the use of New Category products could also have an adverse effect on the operation and financial position of the Group.
As a reflection of the real or perceived impact of stricter regulation in our business, the Group’s share price has also experienced, and could in the future experience, shocks upon the announcement or enactment of restrictive regulation. All these effects may have an adverse effect on the Group’s results of operations and financial conditions.
Similarly, regulations on nicotine levels in cigarettes and in other products that are being considered in a number of jurisdictions in which the Group operates could have a negative impact on sales volumes of the Group’s products in the relevant jurisdictions.
In addition, taking into account the significant number of regulations that may apply to the Group’s businesses across the world, the Group is and may in the future be subject to claims for breach of such regulations. In particular, national authorities (such as the FDA), organisations or even individuals may allege that our marketing activities do not comply with the relevant laws and regulations, or with our International Marketing Principles. As such, the Group could be subject to liability and costs associated with civil and criminal actions as well as regulatory sanctions, fines and penalties brought in connection with these allegations. Even when proven untrue, there are often financial costs and reputational impacts in defending against such claims and allegations (including potential adverse impact on the treatment by the FDA of the Group’s PMTAs in the US). Each of these results may in turn have an adverse effect on the Group’s results of operations and financial condition.
Risk: Adverse implications of EU legislation on single-use plastics that will result in on-pack environmental warnings and financial implications relating to the Extended Producer Responsibility (EPR).
Description
The EU adopted a Directive on single-use plastics in July 2019 which, among other products, targets tobacco products with filters containing plastic. The Cellulose Acetate in our filters is defined as a single-use plastic under the Directive and, as such, the Directive will have an impact on the Group’s cigarettes, filters for other tobacco products and consumables for THPs.
Under the Directive, the Group will be subject to Extended Producer Responsibility (“EPR”) schemes, requiring the Group to cover the costs of collecting, transporting, treating and cleaning-up of filters containing plastic. The Directive also imposes on tobacco manufacturers the obligation to finance consumer awareness campaigns and to place environmental markings on packs of products with filters containing plastic.
Prior to the anticipated implementation deadline for EPR schemes on 5 January 2023, the European Commission is expected to issue guidelines on the criteria for the costs of cleaning up litter in Q1 2021. In addition, in December 2020 the European Commission adopted and published an Implementing Act harmonising specifications for required product markings with a compliance deadline of July 2021. When transposing the Directive into national law, EU member states could decide to expand its scope under their respective national laws, which may expose the Group to additional regulations and financial obligations. This is already the case in France, where EPR implementation has already occurred with an expansion of the scope to include non-plastic filters for RYO products, and Sweden, where the Swedish Ministry of Environment has proposed introducing an EPR scheme for snus pouches (with Modern Oral products also likely to be included) in addition to the one for cigarette filters. A consultation on this is taking place until 15 March 2021.
It is noted that there is a growing level of scrutiny on the use of single-use plastic across the world and a number of other markets in which the Group operates are considering ways to restrict (or ban) the use of filters made of plastic and/or introduce EPR schemes covering other plastic elements in our products beyond filters for traditional products and/or New Categories products.
Impact
The financial implications of existing and future EPR schemes will increase operating costs and may have an adverse effect on the Group’s results of operations and financial condition. If significant space is appropriated on the packaging of some of the Group’s products, this may also be an impediment to maintaining or building brand equity of the Group’s products which may, in turn, have a negative impact on the Group’s sales volume.
|
Strategic Report |
Governance Report | Financial Statements | Other Information | BAT Annual Report and Form 20-F 2020 | 297 | |||||
|
|
Legal, Regulatory and Compliance Risks continued
Risk: Exposure to litigation on tobacco, nicotine, New Categories and other issues.
Description
The Group is involved in litigation related to its tobacco and nicotine products, including legal, regulatory and patent actions, proceedings and claims, brought against it in a number of jurisdictions. Claims brought against the Group may be based on personal injury (both individual claims and class actions), economic loss arising from the treatment of smoking and health-related diseases (such as medical recoupment claims brought by local governments), patent infringement (please refer to the risk factor under “Product pipeline, commercialisation and Intellectual Property risks, Exposure to risks associated with intellectual property rights, including the failure to identify, protect and prevent infringement of the Group’s intellectual property rights and potential infringement of, or the failure to retain licences to use, third-party intellectual property rights” below), negligence, strict tort liability, design defect, failure to warn, fraud, misrepresentation, deceptive/unfair trade practices, conspiracy, medical monitoring and violations of antitrust/racketeering laws. Certain actions, such as those in the US and Canada, involve claims in the tens or hundreds of billions of pounds sterling. The Group is also involved in proceedings that are not directly related to its tobacco and nicotine products, including proceedings based on environmental pollution claims.
Additional legal and regulatory actions, proceedings and claims may be brought against the Group in the future.
Impact
The Group’s consolidated results of operations and financial position could be materially affected by any unfavourable outcome of certain pending or future litigation. The Group could be exposed to substantial liability, which may take the form of ongoing payments. Whether successful or not, the costs of the Group’s involvement in litigation could materially increase due to costs associated with bringing proceedings and defending claims, which may also cause operational and strategic disruption by diverting management time away from business matters. Liabilities and costs in connection with litigation could result in bankruptcy of one or more Group entities which, in turn, could cause a material reduction in the Group’s sales volume and profits. Any negative publicity resulting from these claims may also adversely affect the Group’s reputation.
Please refer to note 27 in the Notes on the Accounts for details of contingent liabilities applicable to the Group.
Risk: Significant and/or unexpected increases or structural changes in tobacco and nicotine-related taxes.
Description
Tobacco and nicotine products are subject to high levels of taxation, including excise taxes, sales taxes, import duties and levies in most markets in which the Group operates. In many of these markets, taxes are generally increasing, but the rate of increase varies between markets and between different types of tobacco and nicotine products. Increases in, or the introduction of new, tobacco and nicotine-related taxes may be caused by a number of factors, including fiscal pressures, health policy objectives and increased lobbying pressure from anti-tobacco advocates.
With respect to New Categories, although a common framework for regulation and taxation has yet to emerge, the manufacture, sale, packaging and advertising of such products are increasingly being regulated and taxed.
Impact
Significant or unexpected increases in, or the introduction of new, tobacco-related taxes or minimum retail selling prices, changes in relative tax rates for different tobacco and nicotine products or adjustments to excise have in the past resulted, and may in the future result in, the need for the Group to absorb such tax increases due to limits in its ability to increase prices, an alteration in the sales mix in favour of value-for-money brands or products, or growth in illicit trade, each of which could impact pricing, sales volume and profit for the Group’s products.
Risk: Failure to comply with health and safety and environmental laws.
Description
The Group is subject to a variety of laws, regulations and operational standards relating to health and safety and the environment.
The Group may fail to assess certain risks and implement the right level of control measures or to maintain adequate standards of health and safety or environmental compliance, which could cause injury, ill health, disability or loss of life to employees, contractors or members of the public, or harm to the natural environment and local communities in which the Group operates. Insufficient information, instruction and training in the relevant areas and a lack of knowledge of the existence and/or requirements of relevant regulations, or a failure to monitor, assess and implement the requirements of new or modified legislation, may increase these risks.
Impact
Any failure by the Group to comply with applicable health and safety or environmental laws, or the exposure to the consequences of a perceived failure, could result in business disruption, reputational damage, difficulties in recruiting and retaining staff, increased insurance costs, consequential losses, the obligation to install or upgrade costly pollution control equipment, loss of value of the Group’s assets, remedial costs and damages, fines and penalties as well as civil or criminal liability. Each of these results could in turn adversely impact the Group’s results of operations and financial condition.
| 298 | BAT Annual Report and Form 20-F 2020 |
Other Information
Group Risk Factors
Continued
Risk: Exposure to unfavourable tax rulings.
Description
The Group is subject to tax laws in a variety of jurisdictions. The Group‘s interpretation and application of the tax laws could differ from those of the relevant tax authority, which may subject the Group to claims for breach of such laws, including for late or incorrect filings or for misinterpretation of rules. Tax authorities in a variety of jurisdictions, such as the Netherlands and Russia, have assessed, and may in the future assess, the Group for historical tax claims, including interest and penalties, arising from disputed areas of tax law. The Group is currently party to tax disputes in a number of jurisdictions, some of which involve claims for amounts in the hundreds of millions of pounds sterling.
Please refer to note 27 in the Notes on the Accounts for details of contingent liabilities applicable to the Group.
Impact
The Group’s failure to comply with the relevant tax authority’s interpretation and application of the tax laws could result in significant financial and legal penalties, including the payment of additional taxes, fines and interest in the event of an unfavourable ruling by a tax authority in a disputed area, as well as the payment of dispute costs. Disruption to the business could occur as a result of management’s time being diverted away from business matters. Each of these results could negatively affect the Group’s results of operations and financial condition.
Risk: Unexpected legislative changes to corporate income tax laws.
Description
The Group is subject to corporate income tax laws in the jurisdictions in which it operates. These laws frequently change on a prospective or retroactive basis.
Impact
Legislative changes to corporate income tax laws and regulations may have an adverse impact on the Group’s corporate income tax liabilities and may lead to a material increase of the Group’s overall tax rate. This could, in turn, negatively affect the Group’s results of operations and financial condition.
Risk: Exposure to potential liability under competition or antitrust laws.
Description
According to the Group’s internal estimates, the Group is a market leader by volume in certain categories in a number of countries in which it operates and/or is one of a small number of tobacco and /or New Categories companies in certain other markets in which it operates. The Group has had antitrust infringement decisions against it in the past and is subject to ongoing investigations (please refer to note 27 in the Notes on the Accounts for details of contingent liabilities applicable to the Group). The Group may fail to comply with competition or antitrust laws and may be subject to investigation and/or litigation for alleged abuse of its position in markets in which it has significant market share or for alleged collusion/anti-competitive arrangements with other market participants.
Impact
Failure by the Group to comply with competition or antitrust laws and investigations (and/or litigation) for violation of such laws may result in significant legal liability, fines, penalties and/or damages actions, criminal sanctions against the Group, its officers and employees, increased costs, prohibitions on conduct of the Group’s business, forced divestment of brands and businesses (or parts of businesses) to competitors or other buyers, director disqualifications and commercial agreements being held void. The Group may face increased public scrutiny and the investigation or imposition of sanctions by antitrust regulation agencies and/or courts for violations of competition regimes which may subject the Group to reputational damage and loss of goodwill.
Risk: Failure to establish and maintain adequate controls and procedures to comply with applicable securities, corporate governance and compliance regulations.
Description
The Group’s operations are subject to a range of rules and regulations around the world. These include US securities, corporate governance and compliance laws and regulations such as the Sarbanes-Oxley Act of 2002 and the US Foreign Corrupt Practices Act of 1977, which applies to the Group’s worldwide activities. While the Group continuously seeks to improve its systems of internal controls and to remedy any weaknesses identified, there can be no assurance that the policies and procedures will be followed at all times or effectively detect and prevent violations of applicable laws. In addition, the Group is subject to increasingly stringent reporting obligations under UK corporate reporting regulations.
Impact
The increased scope and complexity of applicable regulations to which the Group is subject may lead to higher costs for compliance. Failure to comply with laws and regulations may result in significant legal liability, fines, penalties, and/or damages actions, criminal sanctions against the Group, its officers and employees, and damage to the Group’s reputation. Non-compliance with such regulations could also lead to a loss of the Group’s listing on one or more stock exchanges or a loss of investor confidence with a subsequent reduction in share price.
|
Strategic Report |
Governance Report | Financial Statements | Other Information | BAT Annual Report and Form 20-F 2020 | 299 | |||||
|
|
Legal, Regulatory and Compliance Risks continued
Risk: Loss of confidential information, including through manipulation of data by employees and system failure.
Description
Unintended or malicious behaviour by employees, contractors, service providers and others using or managing the Group’s confidential information (including sensitive or confidential information of third parties) or personal data (including sensitive consumer personal data) may affect the Group’s communications and operations which may result in the unauthorised disclosure of such information. Extensive remote working may periodically increase this risk (e.g. during the COVID-19 pandemic).
In addition, flaws in our IT systems, a lack of infrastructure or application resilience, slow or insufficient disaster recovery service levels or the installation of new systems may increase the possibility that data, including confidential, personal or other sensitive information, stored or communicated by IT systems may be corrupted, lost or disclosed.
Impact
The loss of confidential information may result in civil or criminal legal liability and prosecution by enforcement bodies and/or claims from third parties, which may subject the Group to the imposition of material fines, damages and/or penalties and the costs associated with defending these claims. It could also lead to a competitive disadvantage through the loss of trade secrets.
Inappropriate disclosure of confidential information or violation of the GDPR or other privacy laws (please refer to the risk factor under “Loss or misuse of personal data through a failure to comply with the European General Data Protection Regulation, the UK Data Protection Act 2018, e-Privacy Laws and other privacy legislation governing the processing of personal data” below) may also result in significant reputational harm and public scrutiny, a loss of investor confidence and reduced third-party reliance on the Group’s information technology systems or other data handling practices. In addition, restoration and remediation of disclosed confidential information or personal data may be costly, difficult or even impossible. These consequences may adversely impact the Group’s results of operations and financial condition.
Risk: Failure to comply with product regulations due to uncertainty surrounding the proper interpretation and application of those regulations.
Description
The interpretation and application of regulations concerning the Group’s products, such as the Tobacco and Related Products Directive (TPD2), may be subject to debate and uncertainty. This includes uncertainty over product classifications and restrictions on advertising. In particular with respect to the developing category of New Categories, which has grown in size and complexity in a relatively short period of time, a consensus framework for the interpretation and application of existing regulation, such as the rules concerning nicotine-containing liquids used in vapour products, has yet to emerge.
The continuously changing and evolving landscape of regulation concerning the Group’s products contributes to the uncertainty surrounding interpretation and application and creates a risk that the Group may misinterpret or fail to comply with developing regulations in the various jurisdictions in which it operates, or becomes subject to enforcement actions from regulators. With the continuous changing of product cycle plans and expansion to new markets and innovations, there is a risk that such changes and launches fail to comply with the relevant regulations, including pre-approval and/or pre-registration requirements. For example, some governments have intentionally banned or are seeking to ban novel tobacco products and products containing nicotine, while others would need to amend their existing legislation to permit their sale. Even in countries where the sale of such products is currently permitted, some governments have adopted, or are seeking to adopt, bans on New Categories or restrictions on certain flavours.
Impact
The significant number of emerging regulations and the uncertainty surrounding their interpretation and application may subject the Group to claims for breach of such regulations. Financial costs of such enforcement actions include financial penalties, product recalls and litigation costs, and entail a significant risk of adverse publicity and damage to the Group’s reputation and goodwill.
| 300 | BAT Annual Report and Form 20-F 2020 | |||
Other Information
Group Risk Factors
Continued
Risk: Failure to uphold high standards of corporate behaviour, including under anti-bribery and anti-corruption laws.
Description
The Group is subject to various anti-corruption laws and regulations and other anti-financial crime laws including but not limited to failure to prevent facilitation of tax evasion (Anti-Corruption Laws). All employees of BAT, its subsidiaries and joint ventures which it controls are expected to uphold a high standard of corporate behaviour and comply with the Group Standards of Business Conduct (SoBC) which includes a requirement to comply with Anti-Corruption Laws. Employees, associates, suppliers, distributors and agents are prohibited from engaging in improper conduct to obtain or retain business or to improperly influence (directly or indirectly) a person working in an official capacity to decide in the Group’s favour. The Group’s employees may fail to comply with our SoBC and may violate applicable Anti-Corruption Laws.
In January 2021 the Group was informed that the investigation by UK’s Serious Fraud Office into suspicions of corruption in the conduct of business by Group companies and associated persons had been closed. The SFO stated that it would continue to offer assistance to the ongoing investigations of other law enforcement partners. The potential for fines, penalties or other consequences cannot currently be assessed. As the investigations are ongoing, it is not yet possible to identify the timescale in which these matters might be resolved.
Please refer to note 27 in the Notes on the Accounts for details of contingent liabilities applicable to the Group.
Impact
Failure of the Group to comply with Anti-Corruption Laws or to deploy and maintain robust internal policies, procedures and controls could result in significant fines and penalties, criminal sanctions against the Group and its officers and employees, increased costs, prohibitions or other limitations on the conduct of the Group’s business and reputational harm and may subject the Group to claims for breach of such regulations.
Even when proven untrue, there are often financial costs, time demands and reputational impacts associated with investigating and defending against such claims.
Risk: Imposition of sanctions under sanctions regimes or similar international, regional or national measures.
Description
National and international sanctions regimes or similar international, regional or national measures may affect jurisdictions in which the Group operates or third parties with which it may have commercial relationships.
In particular, the Group has operations in a number of countries that are subject to various sanctions, including Iran and Cuba. Operations in these countries expose the Group to the risk of significant financial costs and disruption in operations that may be difficult or impossible to predict or avoid or the activities could become commercially and/or operationally unviable.
National and international sanctions regimes may also affect third parties with which the Group has commercial relationships and could lead to supply and payment chain disruptions.
For example, the Group has been investigating, and is aware of governmental authorities’ investigations into, allegations of misconduct. The Group is cooperating with the authorities’ investigations, including the DOJ and OFAC in the United States, which are conducting an investigation into suspicions of breach of sanctions. The potential for fines, penalties or other consequences cannot currently be assessed but may be material. As the investigations are ongoing, it is not yet possible to identify the timescale in which these matters might be resolved.
Please refer to note 27 in the Notes on the Accounts for details of contingent liabilities applicable to the Group.
Impact
As a result of the limitations imposed by sanctions, it may become commercially and/or operationally unviable for the Group to operate in certain jurisdictions and the Group may be required to exit existing operations in such jurisdictions. The Group may also experience difficulty in sourcing materials or importing products and be exposed to increased costs. In addition, the costs of complying with sanctions may increase as a result of changes to existing sanctions regimes.
Any failure to comply with sanctions regimes or similar international, regional or national measures may result in significant legal liability, fines and/or penalties, criminal sanctions against the Group, its officers and employees, damage to commercial or banking relationships and reputational harm. Reputational harm may result regardless of whether the Group complies with imposed sanctions.
|
Strategic Report |
Governance Report | Financial Statements | Other Information | BAT Annual Report and Form 20-F 2020 | 301 | |||||
|
|
Legal, Regulatory and Compliance Risks continued
Risk: Loss or misuse of personal data through a failure to comply with the European General Data Protection Regulation, the UK Data Protection Act 2018, e-Privacy Laws and other privacy legislation governing the processing of personal data.
Description
Personal data is a subset of data (which is likely to be confidential) which attracts different risks and treatment under the law. Breaches of data privacy laws include misuse of information which may not be confidential in nature. These include, for example, unsolicited marketing calls to a publicly available number, or using an individual’s personal data in a way which was not authorised or in a way that the individual did not reasonably expect through technologies such as online tracking or monitoring.
Various privacy laws, including the European General Data Protection Regulation (“GDPR”), UK Data Protection Act 2018 (“UKDPA”) and e-Privacy Directive (“e-Privacy Laws”) / EU Regulatory guidances, govern the way in which organisations (comprising employees, contractors, service providers and other authorised persons) handle individuals’ personal data including how such organisations, including the Group, track or monitor their online behaviour.
In particular:
| – | in the event of: |
| – | an unauthorised disclosure of personal data as a result of a bad actor (e.g. cyberattack); or |
| – | flaws in our IT systems, or application resilience, slow or insufficient disaster recovery service levels or the installation failure of a new system (which result in personal data stored or communicated by IT systems being corrupted, lost or disclosed); |
Depending on the risk to the individuals concerned, such personal data breaches (including mass personal data unavailability) must be reported to the local data protection supervisory authority which could subject Group companies to not only regulatory scrutiny but also individual claims or even class action suits; and
| – | ePrivacy Laws state that any misuse of consumer personal data or lack of transparency provided to consumers on how we use their data or track their online behaviours are subject to regulatory scrutiny. |
Legal requirements relating to the collection, storage, handling, and transfer of personal data continue to evolve. Following the entry into force of the GDPR in May 2018, other jurisdictions in which the Group operates have enacted similar local legislation such as the California Consumer Privacy Act US and the “LGPD” in Brazil which further increases the risks surrounding the processing of personal data especially in the consumer space.
Impact
Failure to comply with existing or future e-Privacy Laws and privacy legislation governing the processing of personal data may adversely impact the Group’s results of operations and financial condition.
Loss or misuse of personal data may result in civil or criminal legal liability and prosecution by enforcement bodies, which may subject the Group to the imposition of material fines (currently up to 4% of Group worldwide turnover in the context of GDPR) and/or penalties and/or claims and costs associated with defending these claims (which could include class action suits brought by consumers).
Reputational damage could also potentially cause significant harm to the Group.
Relevant data protection supervisory authority could also order certain Group legal entities to cease processing activities, which could result in a significant operational disruption.
Economic and Financial Risks
Risk: Foreign exchange rate exposures.
Description
The Group’s reporting currency is the pound sterling. The Group is exposed to the risk of fluctuations in exchange rates affecting the translation of net assets and earned profits of overseas subsidiaries into the Group’s reporting currency. These translational exposures are not normally hedged.
Exposures also arise from the foreign currency denominated trading transactions undertaken by subsidiaries and dividend flows. Where not offset by opposing flows, these exposures are generally hedged according to internal policies, but hedging of exposure to certain currencies might not be possible due to exchange controls, limited currency availability or prohibitive costs, and errors in hedging may occur. Fiscal policy divergence in relation to interest rates between key markets may also increase these risks.
Impact
During periods of exchange rate volatility, the impact of exchange rates on the Group’s results of operations and financial condition can be significant. Fluctuations in exchange rates of key currencies against the pound sterling may result in volatility in the Group’s reported earnings per share, cash flow and balance sheet. Furthermore, the dividend paid by the Group may be impacted if the payout ratio is not adjusted. Differences in translation between earnings and net debt may also affect key ratios used by credit rating agencies, which may have an adverse effect on the Group’s credit ratings.
In addition, volatility and/or increased costs in the Group’s business due to transactional foreign exchange rate exposures may adversely affect operating margins and profitability and attempts to increase prices to offset such increases could adversely impact sales volumes.
| 302 | BAT Annual Report and Form 20-F 2020 | |||
Other Information
Group Risk Factors
Continued
Economic and Financial Risks continued
Risk: Inability to obtain price increases and exposure to risks from excessive price increases and value chain erosion.
Description
Annual price increases by the Group are among the key drivers in increasing market profitability. However, the Group has in the past been, and may in the future be, unable to obtain such price increases as a result of increased regulation; increased competition from illicit trade; stretched consumer affordability arising from deteriorating political and economic conditions and rising prices; sharp increases or changes in excise structures; and competitors’ pricing.
As the New Category market continues to develop, the Group may face erosion in the value chain for New Categories through lower market prices, excise taxes, high retail trade margins or high production costs that make New Categories less competitive versus combustible tobacco products. As an example, excise on Tobacco Heated Products in Japan is increasing and will align closer to FMC following a five year (2018-2022) phased excise plan.
In addition, the Group faces the risk that price increases it has conducted in the past, and may conduct in the future, may be excessive and not find adequate adult tobacco consumer acceptance.
Impact
If the Group is unable to obtain price increases or is adversely affected by impacts of excessive price increases, it may be unable to achieve its strategic growth metrics, have fewer funds to invest in growth opportunities, and, in the case of excessive price increases, be faced with quicker reductions in sales volumes than anticipated due to accelerated market decline, down-trading (switching to a cheaper brand) and increased illicit trade. These in turn impact the Group’s market share, results of operations and financial condition.
In addition, erosion in the value chain for New Categories could have a negative impact on the Group’s sales volume or pricing for these products. High excise could dampen demand for New Categories or result in lower profit margins. Lower market prices, high retail trade margins or increases in production costs could also negatively impact profit margins or lead to uncompetitive pricing.
Risk: Effects of declining consumption of legitimate tobacco products and a tough competitive environment.
Description
Evidence of market contraction and the growth of illicit trade of tobacco products is apparent in several key global markets in which the Group operates. This decline is due to multiple factors, including increases in excise taxes leading to continuous above-inflation price rises, changes in the regulatory environment, the continuing difficult economic environment in many countries impacting consumers’ disposable incomes, the increase in the trade of illicit tobacco products, rising health concerns, a decline in the social acceptability of smoking and an increase in New Category uptake.
The Group competes based on the strength of its strategic brand portfolio, product quality and taste, brand recognition, brand loyalty, taste, innovation, packaging, service, marketing, advertising and price. The Group is subject to highly competitive environments in all aspects of its business, and its competitive position can be significantly influenced by the prevailing economic climate, consumers’ disposable income, regulation, competitors’ introduction of lower-price or innovative products, higher tobacco product taxes, higher absolute prices, governmental action to increase minimum wages, employment costs, interest rates and increase in raw material costs.
Furthermore, the Group is subject to substantial payment obligations under the State Settlement Agreements, which adversely affect the ability of the Group to compete in the US with manufacturers of deep-discount cigarettes that are not subject to such substantial obligations.
Impact
Any future decline in the demand for legitimate tobacco products could have an adverse effect on the Group’s results of operations and financial conditions.
In a tough competitive environment, factors such as market size reduction, customer down-trading, illicit trade and competitors aggressively taking market share through price re-positioning or price wars generally reduce the overall profit pool of the market and may impact the Group’s profits. These risks may also lead to a decline in sales volume of the Group, loss of market share, erosion of its portfolio mix and reduction of funds available to it for investment in growth opportunities.
|
Strategic Report |
Governance Report | Financial Statements | Other Information | BAT Annual Report and Form 20-F 2020 | 303 | |||||
|
|
Economic and Financial Risks continued
Risk: Funding, liquidity and interest rate risks.
Description
The Group cannot be certain that it will have access to bank financing or to the debt and equity capital markets at all times and is therefore subject to funding and liquidity risks. In addition, the Group’s access to funding may be affected by restrictive covenants to which it is subject under some of its credit facilities. Furthermore, broader ESG trends may impact the Group’s access to funding.
The Group is also exposed to increases in interest rates in connection with both existing floating rate debt and future debt refinancings. The current economic environment, with historically low interest rates, increases the likelihood of higher interest rates in the future.
The phaseout of LIBOR and uncertainty regarding the appropriate benchmark replacement similarly increases uncertainty with respect to the interest rates applicable to the Group’s floating rate debt.
Furthermore, the Group operates in several markets closely regulated by governmental bodies that intervene in foreign exchange markets by imposing limitations on the ability to transfer local currency into foreign currency and introducing other currency controls that expose cash balances to devaluation risks or that increase costs to obtain hard currency. As a result, the Group’s operational entities in these markets may be restricted from using end-market cash resources to pay for imported goods, dividend remittances, interest payments and royalties. The inability to access end-market cash resources in certain markets contributes to the Group’s funding and liquidity risks.
Impact
Adverse developments in the Group’s funding, liquidity and interest rate environment may lead to shortages of cash and cash equivalents needed to operate the Group’s business and to refinance its existing debt. Inability to fund the business under the Group’s current capital structure, failure to access funding and foreign exchange or increases in interest rates may also have an adverse effect on the Group’s credit rating, which would in turn result in further increased funding costs and may require the Group to issue equity or seek new sources of capital. Non-compliance with the Group’s covenants under certain credit facilities could lead to an acceleration of its debt. The phaseout of LIBOR may result in the Group being subject to higher or uncertain interest rates with respect to outstanding future and floating rate debt.
All these factors may have material adverse effects on the Group’s results of operations and financial conditions. These conditions could also lead to underperforming bond prices and increased yields.
In the case of funding or liquidity constraints, the Group may also suffer reputational damage due to its perceived failure to manage the financial risk profile of its business, which may result in an erosion of shareholder value reflected in an underperforming share price, and/ or underperforming bond prices and higher yields. In addition, the Group’s ability to finance strategic opportunities or respond to threats may be impacted by limited access to funds.
Risk: Failure to achieve growth through mergers, acquisitions and joint ventures.
Description
The Group’s growth strategy includes a combination of organic growth as well as mergers, acquisitions and joint ventures. The Group may be unable to acquire attractive businesses on favourable terms and may inappropriately value or otherwise fail to identify or capitalise on growth opportunities. The Group may not be able to deliver strategic objectives and revenue improvements from business combinations, successfully integrate businesses it acquires or establishes, or obtain appropriate regulatory approvals for business combinations.
Risks from integration of businesses also include the risk that the integration may divert the Group’s focus and resources from its other strategic goals.
Additionally, the Group could be exposed to financial, legal or reputational risks if it fails to appropriately consider any compliance or antitrust aspects of a transaction. Further, the Group has certain uncapped indemnification obligations in connection with divestitures and could incur similar obligations in the future.
Impact
Any of the foregoing risks could result in increased costs, decreased revenues or a loss of opportunities and have an adverse effect on the Group’s results of operations and financial condition, and in the case of a breach of compliance or antitrust regulation, could lead to reputational damage, fines and potentially criminal sanctions.
The Group may become liable for claims arising in respect of conduct prior to any merger or acquisition of businesses if deemed to be a successor to the liabilities of the acquired company or indemnification claims relating to divestitures, and any resulting adverse judgment against the Group may adversely affect its results of operations and financial condition.
Please refer to note 27 in the Notes on the Accounts for details of contingent liabilities applicable to the Group.
| 304 | BAT Annual Report and Form 20-F 2020 | |||
Other Information
Group Risk Factors
Continued
Risk: Unforeseen underperformance in key global markets.
Description
A substantial majority of the Group’s profit from operations is based on its operations in certain key markets, including the US. A number of these markets are declining for a variety of factors, including price increases, restrictions on advertising and promotions, smoking prevention campaigns, increased pressure from anti-tobacco groups, migration to smokeless products and private businesses adopting policies that prohibit or restrict, or are intended to discourage, smoking and tobacco use.
Economic and political factors affecting the Group’s key markets include the prevailing economic climate, governmental austerity measures, levels of employment, inflation, governmental action to increase minimum wages, employment costs, interest rates, raw material costs, consumer confidence and consumer pricing.
Impact
Any change to the economic and political factors in any of the key markets in which the Group operates could affect consumer behaviour and have an impact on the Group’s results of operations and financial condition.
Risk: Increases in net liabilities under the Group’s retirement benefit schemes.
Description
The Group currently maintains and contributes to defined benefit pension plans and other post-retirement benefit plans that cover various categories of employees and retirees worldwide. The Group’s obligations to make contributions under these arrangements may increase in the case of increases in pension liabilities, decreases in asset returns, salary increases, inflation, decreases in long-term interest rates, increases in life expectancies, changes in population trends and other actuarial assumptions.
Please refer to the information under the caption ‘Retirement benefit schemes’ on page 188 and to note 11 in the Notes on the Accounts for details of the Group’s retirement benefit schemes.
Impact
Higher contributions to the Group’s retirement benefit schemes could have an adverse impact on the Group’s results of operations, financial condition and ability to raise funds.
Risk: Adverse consequences of the UK’s exit from the EU.
Description
The consequences of the UK’s exit from the EU remain uncertain and the full extent of the impact is not expected for some time, but could include reductions in the size of the UK market, down-trading as a result of affordability pressure/weakening economy in the UK, an increased cost of doing business in the UK, higher cost of capital in the UK and both transactional and translational foreign exchange impacts, disruption to supply of materials due to changed customs procedures, rules of origin requirements or duties, increased complexity and scrutiny on tax-related activities, or other changes to UK law. In addition, the UK’s exit from the EU may impose restrictions on employment and cross-border movements.
Impact
Any of the consequences of the UK’s exit from the EU may have a negative effect on the Group’s results of operations and financial conditions. In addition, any restrictions on employment and cross-border movements may result in additional employment and hiring costs and reduce the Group’s ability to attract and retain highly talented individuals from the EU in the UK.
|
Strategic Report |
Governance Report | Financial Statements | Other Information | BAT Annual Report and Form 20-F 2020 | 305 | |||||
|
|
Product Pipeline, Commercialisation and Intellectual Property Risks
Risk: Inability to predict consumers’ changing behaviours and launch innovative products that offer adult tobacco and nicotine consumers meaningful value-added differentiation.
Description
The Group focuses its research and development activities on both creating new products, including New Category product, and maintaining and improving the quality of its existing products. In a competitive market, the Group believes that innovation is key to growth. The Group considers that one of its key challenges in the medium and long term is to provide adult tobacco and nicotine consumers with high-quality products that take into account their changing preferences and expectations, including those in relation to ESG, while complying with evolving regulation.
The Group is in the early stages of development and roll-out of its New Category portfolio which requires significant initial investment. The Group may be unsuccessful in developing and launching innovative products or maintaining and improving the quality of existing products across both combustibles and New Categories that offer consumers meaningful value-added differentiation. The Group may fail to keep pace with innovation in its sector or changes in consumer expectations and is also exposed to the risk of an inability to build a strong enough brand equity through social media and other technological tools to compete with its competitors. There are potential bans and restrictions in key markets when using social media to advertise and communicate. Competitors may be more successful in predicting changing consumer behaviour, developing and rolling out consumer-relevant products and may be able to do so more quickly and at a lower cost.
In addition, the Group devotes considerable resources to the research and development of innovative products, in particular in New Categories that may have the potential to reduce the risks of smoking-related diseases. The complex nature of research and development programmes necessary to satisfy emerging regulatory and scientific requirements creates a substantial risk that these programmes will fail to demonstrate health-related claims regarding New Categories or to achieve adult tobacco consumer, regulatory and scientific acceptance.
Furthermore, the regulatory environment impacting non-combustible tobacco products, vapour products and other non-tobacco nicotine products, including classification of products for regulatory and excise purposes, is still developing and it cannot be predicted whether regulations will permit the marketing of such New Categories in any given market in the future. Categorisation as medicines, for example, and restrictions on advertising could stifle innovation, increase complexity and costs and significantly undermine the commercial viability of these products. Alternatively, categorisation of any New Categories, as tobacco products for instance, could result in the application of onerous regulation, which could further stifle uptake.
Impact
The inability to timely develop and roll out innovations or products in line with consumer demand, including any failure to predict changes in adult tobacco consumer and societal behaviour and expectations and to fill gaps in the product portfolio, as well as the risk of poor product quality, could lead to missed opportunities, under- or over-supply, loss of competitive advantage, unrecoverable costs and/or the erosion of the Group’s consumer base or brand equity.
Restrictions on packaging and labelling or on promotion and advertising could impact the Group’s ability to communicate its innovations and product differences to adult tobacco consumers, leading to unsuccessful product launches. An inability to provide robust scientific results sufficient to substantiate health-related product claims poses a significant threat to the ability to launch innovative products and comply with emerging regulatory and legal regimes.
The occurrence of any of the above effects could in turn have an adverse effect on the Group’s results of operations and financial condition and cause the Group to fail to deliver on its strategic growth plans.
| 306 | BAT Annual Report and Form 20-F 2020 |
Other Information
Group Risk Factors
Continued
Risk: Exposure to risks associated with intellectual property rights, including the failure to identify, protect and prevent infringement of the Group’s intellectual property rights and potential infringement of, or the failure to retain licences to use, third-party intellectual property rights.
Description
The Group relies on trademarks, patents, registered designs, copyrights and trade secrets. The brand names under which the Group’s products are sold are key assets of its business. The protection and maintenance of these brand names and of the reputation of these brands is important to the Group’s success. Protection of intellectual property rights is also important in connection with the Group’s innovative products, including New Categories.
The Group is exposed to the risk of infringements of its intellectual property rights by third parties due to limitations in judicial protection, failure to identify, protect and register its innovations and/or inadequate enforceability of these rights in some markets in which the Group operates.
The Group currently is involved in various patent infringement litigation proceedings globally related to technology used in the Group’s New Category products. This litigation involves both claims by the Group that competitors are infringing on the Group’s patents and claims by competitors that the Group is infringing on competitors’ patents.
Some brands and trademarks under which the Group’s products are sold are licensed for a fixed period of time in certain markets. If any of these licences are terminated or not renewed after the end of the applicable term, the Group would no longer have the right to use, and to sell products under, those brand(s) and trademark(s).
In addition, as third-party rights are not always identifiable, the Group may be subject to claims for infringement of third-party intellectual property rights.
Impact
Any erosion in the value of the Group’s brands, or failure to obtain or maintain adequate protection of intellectual property rights for any reason, or the loss of brands or trademarks under licence to Group companies, may have a material adverse effect on the Group’s market share, results of operations and financial condition. Any inability to appropriately protect the Group’s products and key innovations will also limit its growth and affect competitiveness and return on innovation investment.
Any infringement of third-party intellectual property rights could result in interim injunctions, product recalls, legal liability and the payment of damages, any of which may disrupt operations, negatively impact the Group’s reputation and have an adverse effect on its results of operations and financial condition.
|
Strategic Report |
Governance Report | Financial Statements | Other Information | BAT Annual Report and Form 20-F 2020 | 307 | |||||
|
|
Group’s Business
Overview
The Group’s businesses operate under increasingly stringent regulatory regimes worldwide. The tobacco industry is one of the most highly regulated in the world, with manufacturers required to comply with a variety of different regulatory regimes across the globe. The Group continues to respond to these regimes and engages with governments and other regulatory bodies to find solutions to changing regulatory landscapes. Restrictions on the manufacture, sale, marketing and packaging of tobacco products are in place in nearly all countries and markets.
Regulation can typically be categorised as follows:
| – | Place: Including regulations restricting smoking in private, public and work places (e.g. public place smoking bans); |
| – | Product: including regulations on the use of ingredients, product design and attributes (e.g. ceilings regarding tar, nicotine and carbon monoxide yields, as well as restrictions on flavours); product safety regulations (e.g. the EU’s General Product Safety Directive (2001/95/EC), electrical safety regulations and reduced ignition propensity standards for cigarettes); and regulatory product disclosure requirements (e.g. in relation to ingredients and emissions); |
| – | Packaging and labelling: including regulations on health warnings and other government-mandated messages (e.g. in respect of content, positioning, size and rotation); restrictions on the use of certain descriptors and brand names; requirements on pack shape, size, weight and colour and mandatory plain packaging; |
| – | Sponsorship, promotion and advertising: including partial or total bans on tobacco advertising, marketing, promotions and sponsorship and restrictions on brand sharing and stretching (the latter refers to the creation of an association between a tobacco product and a non-tobacco product by the use of tobacco branding on the non-tobacco product); |
| – | Purchase: including regulations on the manner in which tobacco products are sold, such as type of outlet (e.g. supermarkets and vending machines) and how they are sold (e.g. above-the-counter versus beneath-the-counter); and |
| – | Price: including regulations which have implications for the prices that manufacturers can charge for their tobacco products (e.g. excise taxes and minimum prices). |
In addition, the Group operates a number of global policies, and in some cases its businesses have also entered into voluntary agreements, which may impose more onerous obligations or standards than those imposed by local legislation.
World Health Organization Framework Convention on Tobacco Control
Much of the recent development in regulation at a global level has been driven by the World Health Organization Framework Convention on Tobacco Control (FCTC). The FCTC came into force in 2005 and contains provisions aimed at, among other things, reducing tobacco consumption and toxicity. The original treaty is supplemented by protocols and guidelines. While the guidelines are not legally binding, they provide a framework of recommendations for parties to the guidelines.
To date, the FCTC has been ratified by 182 countries, not including the US. The FCTC has led to increased efforts by tobacco-control advocates and public health organisations to reduce the supply of, and demand for, tobacco products, and to encourage governments to further regulate the tobacco industry. As national regulations increasingly reflect global influences, the scope of areas regulated will likely further expand. The guidelines on advertising, promotion and sponsorship, for example, seek to broaden the definition of tobacco advertising to include product display, the use of vending machines as well as the design of the pack itself. Where adopted by contracting parties, a number of the measures referred to in the guidelines may result in either additional costs for the tobacco industry or restrictions on a manufacturer’s ability to differentiate its products and communicate those differences to adult smokers. For example, a change in the number and size of on-pack health warnings requires new printing cylinders to be commissioned, while the implementation of new plant protection product standards, product testing and the submission of ingredients information to national governments require extensive resources, time and material.
EU Tobacco and Related Products Directive (2014/40/EU)
Other developments in regulation have been driven by tobacco control activities undertaken outside the FCTC process. For example, the EU Tobacco Products Directive (2001/37/EC), referred to as TPD1, was adopted by the EU in May 2001 for transposition into EU member states’ laws by September 2002. TPD1 included provisions that set maximum tar, nicotine and carbon monoxide yields, introduced larger health warnings and banned descriptors such as ‘light’ and ‘mild’.
A revised TPD1, the EU Tobacco and Related Products Directive (2014/40/EU), referred to as TPD2, was adopted in April 2014 for transposition into EU member states’ law by May 2016. Provisions of TPD2 include: larger combined pictorial and textual health warnings covering 65% of the two main pack surfaces (front and back) for cigarettes; restrictions on pack shape and size, including minimum pack sizes of 20 sticks for cigarettes and 30g for roll-your-own and make-your-own tobacco; increased ingredients reporting; ‘tracking and tracing’ requirements; and for e-cigarettes: nicotine limits, pre-market notification, ingredients reporting and advertising bans. Among other things, TPD2 bans the sale of cigarettes and roll-your-own tobacco with a characterising flavour. Menthol-flavoured cigarettes were exempted from the ban until May 2020, which has since been applied also to menthol cigarettes. (See ‘The US’ for information pertaining to the regulation of menthol in that market).
TPD2 also purports to leave open to EU Member States the possibility of further standardising the packaging of tobacco products and to apply some of its provisions in different ways. For example, it provides, among other things, that the labelling, packaging and the tobacco product itself shall not include any element or feature that suggests that a particular tobacco product has vitalising, energetic, healing, rejuvenating, natural or organic properties or has other health or lifestyle benefits. On 1 February 2017, the French government applied its laws transposing these provisions into French national law to prohibit the sale of all variants of Vogue cigarettes from February 2018, as well as the use of certain other tobacco brand and brand variant names. The law was subsequently annulled, but France may seek to reintroduce it. On 26 April 2019, Belgium adopted a Royal Decree that allows the Minister of Health to establish a procedure to put brands on a prohibited list and to draw up such a list. To date, such a procedure has not yet been established by the Belgian Minister of Health.
The European Commission is required to prepare a report by no later than 20 May 2021 on the application of TPD2 and setting out, in particular, the elements of TPD2 which it believes should be reviewed or adapted based on scientific and technical developments as well as internationally agreed rules and standards on tobacco and related products.
| 308 | BAT Annual Report and Form 20-F 2020 |
Other Information
Regulation of the Group’s Business
Continued
Single-Use Plastics
The Single Use Plastics Directive (EU) 2019/904 (the SUP Directive) entered into force on 2 July 2019. The Directive requires that EU Member States introduce Extended Producer Responsibility (EPR) schemes covering the cost to clean up litter and the application of on-pack marking requirements for tobacco product filters. Member States must transpose the SUP Directive into national law by 3 July 2021, with an implementation deadline of 3 July 2021 for pack marking requirements and of 5 January 2023 for EPR schemes. Other governments have passed or are considering similar legislation including Canada, Russia, South Korea and various levels of government in the United States.
Restrictions on Smoking in Private, Public and Workplaces
The Group operates in a number of markets which have in place restrictions on smoking in certain private, public and work places, including restaurants, bars and nightclubs. While these restrictions vary in scope and severity, extensive public and work place smoking bans have been enacted in markets including the US, Canada, the UK, Spain, New Zealand and Australia. Restrictions on smoking in private have also been adopted or proposed, and typically take the form of prohibitions on smoking in cars or residential homes when children are present, or smoking within a certain distance from specified public places (such as primary schools).
Regulation of Ingredients, Including Flavoured Tobacco Products
A number of countries have restricted, and others are seeking to restrict or ban, the use of certain flavours or ingredients in cigarettes and other tobacco products, on the basis that such products are alleged to appeal disproportionally to minors, act as a catalyst for young people taking up smoking and/or increase the addictiveness or toxicity of the relevant product.
In Canada, the manufacture and sale of cigarettes, little cigars and blunt wraps with characterising flavours are banned, and a federal menthol ban for cigarettes is in effect across the country. In Australia, the majority of states and territories have banned flavours in cigarettes that give an ‘overtly’ fruit-flavoured taste and the government is reportedly considering further regulatory options. The TPD2 similarly bans the manufacture and sale of cigarettes and roll-your-own tobacco with a characterising flavour other than tobacco, subject to an exemption until May 2020 for menthol cigarettes.
An ingredients ban in Brazil, which would ban the use of certain ingredients with flavouring or aromatic properties, including menthol, is not currently in force due to ongoing legal challenges. In Turkey, a ban on the use of menthol in cigarettes has been fully implemented as of 5 January 2020. A number of the above regulations are subject to ongoing legal challenges. (See ‘The US’ for information pertaining to the regulation of menthol in that market).
Further legislation on ingredients is to be expected. In particular, the European Commission report on TPD2 due by 20 May 2021 is required to consider, amongst other things, the benefits of establishing a single list of permitted ingredients at EU level by reference to available scientific evidence on the toxic and addictive effects of different ingredients. Similarly, the Conference of Parties to the FCTC has tasked a working group to further elaborate the partial guidelines on the regulation of the contents of tobacco products and tobacco product disclosures.
Plain and Standardised Packaging
Plain (or ‘standardised’) packaging generally refers to a ban on the use of trademarks, logos and colours on packaging other than the use of a single colour and the presentation of brand name and variant in a specified font and location(s). The presentation of individual cigarettes may be similarly restricted. Plain packaging is high on the agenda of tobacco control groups, and the non-binding FCTC guidelines recommend that contracting parties consider introducing plain packaging. To date, 21 countries (including Australia, Belgium, Canada, Denmark, France, Ireland, New Zealand, the Netherlands, Saudi Arabia, Singapore, Turkey, and the UK) have adopted plain packaging legislation, with the measure being implemented in 15 of those countries. Countries, territories and states that are currently considering adopting plain packaging legislation include, but are not limited to Argentina, India, Ecuador, Panama, Sweden, Brazil, Chile, Spain and South Africa. Others, such as South Korea, Ukraine and Colombia, are considering implementing increased graphic health warnings.
Product Display Bans at Point of Sale and Licensing Regimes
Product display bans at point of sale and licensing regimes have been in place in a number of countries for several years and have been implemented both at national and state levels. Ireland was the first EU Member State to introduce a point-of-sale display ban, which became effective in July 2009, with Norway, Iceland, Finland, New Zealand, Thailand, Canada, Australia, the UK and a number of other countries implementing or passing similar legislation banning tobacco displays. A number of countries, such as Hungary, Finland and Spain, have also sought to restrict the supply of tobacco products, including through the adoption of licensing regimes limiting the number of retail outlets from which it is possible to purchase tobacco products and/or by prohibiting the sale of tobacco products within a certain distance of specified public places.
Illicit Trade
The illegal market for tobacco products is an increasingly important issue for governments and the industry across the world.
Euromonitor International estimates that approximately 400 billion cigarettes per year are smuggled, manufactured illegally or counterfeited. A number of governments, regulators and organisations have or are considering adopting regulation to support anti-illicit trade activities. Among other forms, such regulation may comprise mandatory ‘tracking and tracing’ requirements, enabling regulators to identify the point at which any seized product left the legal supply chain, security features to combat counterfeiting and inspection and authentication obligations in respect of seized product. The TPD2, for example, requires that all unit packets of tobacco are marked with a unique and irremovable identifier, which when scanned provides various information about that product’s route to market.
In November 2012, the FCTC adopted the Protocol to Eliminate Illicit Trade in Tobacco Products which includes a raft of supply chain control measures, including the implementation of ‘tracking and tracing’ technologies. The Protocol entered into force on 25 September 2018 and was considered at the first session of the Meeting of the Parties to the Protocol in October 2018. As at 1 January 2021, 62 parties have ratified the Protocol.
In November 2012, the FCTC adopted the Protocol to Eliminate Illicit Trade in Tobacco Products which includes a raft of supply chain control measures, including the implementation of ‘tracking and tracing’ technologies. The Protocol entered into force on 25 September 2018 and was considered at the first session of the Meeting of the Parties to the Protocol in October 2018. As at 1 January 2020, 58 parties have ratified the Protocol.
|
Strategic Report |
Governance Report | Financial Statements | Other Information | BAT Annual Report and Form 20-F 2020 | 309 | |||||
|
|
Vapour Products
More recently, significant debate has been generated regarding the appropriate regulation of vapour products, including regulation of the nicotine liquids used in them. As the nascent vapour category has grown in size and complexity in a relatively short period of time, a consensus framework for regulation and taxation has yet to emerge. The TPD2, for example, establishes frameworks for the regulation of novel tobacco products and e-cigarettes, introducing nicotine limits, health warnings requirements, advertising bans and pre-market notification and post-market disclosure obligations. Conversely, some governments have intentionally banned or are seeking to ban novel tobacco products and products containing nicotine, while others would need to amend their existing legislation in order to permit their sale. For example, in Australia nicotine is currently classified as poison, meaning that the importation of vaping products or nicotine refill liquids is illegal in every state and territory, as is the possession and use of these products. While Australia’s Therapeutic Goods Administration plans to re-classify nicotine as a prescription-only medication from 1 October 2021, the effect will be that a doctor’s prescription will be required to legally access nicotine vapour products and liquid nicotine. Even in countries where the sale of vapour products is permitted, some governments have adopted, or are seeking to adopt, bans on vaping in public places, bans or restrictions on flavours or other restrictions. Recent reports in North America of individuals experiencing acute respiratory injury in suspected association with vaping certain e-liquids (EVALI) and youth usage have led to an increase in scrutiny of vapour products, especially at State and Provincial levels in the United States and Canada.
The US
Through the RAI subsidiaries, the Group is subject to US federal, state, and local laws and regulations. In 2009, President Obama signed into law the Family Smoking Prevention and Tobacco Control Act (FSPTCA), which grants the US Food & Drug Administration (FDA) broad authority over the manufacture, sale, marketing and packaging of tobacco products but at the outset limited the agency’s authority to cigarettes, smokeless tobacco products, cigarette tobacco and roll-your-own tobacco products. Key elements of the FSPTCA include: filing of facility registrations, product listing, constituent testing and ingredient information; obtaining FDA clearance for all new products or product modifications; banning all characterising flavours other than tobacco or menthol in cigarettes; establishing ‘user fees’ to fund the FDA’s regulation of tobacco products; increasing the health warning size on cigarette packs with the option to introduce pictorial health warnings; implementing good manufacturing practices; revising the labelling and advertising requirements for smokeless tobacco products; and requiring the study of menthol. The US Congress did limit the FDA’s authority in two areas, prohibiting it from:
| – | banning categories of tobacco products; and |
| – | requiring the reduction of nicotine yields of a tobacco product to zero. |
On 10 May 2016, the FDA issued a final regulation, referred to as the Deeming Rule, deeming all remaining products that are ‘made or derived from tobacco’ to be subject to the FDA’s regulatory authority under the FSPTCA. The Final Rule became effective as of 8 August 2016, though each requirement of the Final Rule has its own compliance date. Such newly ‘deemed’ tobacco products subject to the FSPTCA include, among others, electronic nicotine delivery systems (including e-cigarettes, e-hookah, e-cigars, vape pens, advanced refillable personal vapourisers, electronic pipes and e-liquids mixed in vape shops), certain dissolvable tobacco products, cigars and pipe tobacco.
The ‘grandfather’ date under the Final Rule for newly deemed products remains the same as the ‘grandfather’ date for those tobacco products already subject to the FSPTCA – 15 February 2007. Any tobacco product that was not legally marketed as of 15 February 2007 will be considered a new tobacco product subject to premarket review by the FDA. The FDA has recognised that few, if any, e-cigarettes were on the market as of 15 February 2007, but thousands of such products (including R. J. Reynolds Vapour’s Vuse Digital Vapour Cigarette) subsequently have entered into commerce. To address this issue, the FDA established a compliance policy regarding the premarket review requirements for all newly deemed tobacco products that are not grandfathered products, but were on the market as of 8 August 2016. The FDA will allow such products to remain on the market so long as the manufacturer has filed the appropriate Premarket Tobacco Application (PMTA) by a specific deadline.
The Final Rule established staggered initial compliance periods based on the expected complexity of the applications to be submitted. On 28 July 2017, as part of the FDA’s announcement of a comprehensive regulatory plan for nicotine and tobacco, the FDA extended the deadline for submission of PMTAs for newly deemed products by several years (for e-cigarettes, the new deadline was August 2022). However, as a result of legal action, in July 2019 a federal court ultimately brought forward the filing deadline for non-combustible products to 12 May 2020. In October 2019, R. J. Reynolds Vapour Company filed PMTAs for Vuse Solo. Based upon requirements of the FSPTCA that must be addressed in PMTAs, and the FDA’s Guidance regarding the type of evidence required for such applications, the costs of preparing a PMTA are significant.
In January 2020, the FDA reinforced the filing deadline of 12 May 2020 in its Guidance related to vapour, but reversed its previous compliance policy that allowed products to remain on the market without a PMTA. The Guidance announced the agency’s intent to enforce (as of February 2020) the PMTA requirements on certain products as follows: 1) Flavoured, cartridge-based vapour products except for tobacco- or menthol-flavoured products; 2) All other vapour products for which the manufacturer has failed to take (or is failing to take) adequate measures to prevent minors’ access; 3) Any vapour products that targets or whose marketing is likely to promote use by minors; and 4) Any vapour product that is offered for sale in the United States after 12 May 2020, and for which the manufacturer has not submitted a premarket application. Flavoured disposable vapour products and flavoured open systems would remain available for sale unless 1) the manufacturer has failed to take adequate measures to prevent minors’ access, 2) product that targets or whose marketing is likely to promote use by minors, or 3) fails to file a PMTA by 12 May 2020.
In April 2020, the federal court extended the PMTA deadline by 120 days to 9 September 2020 to address the FDA’s concerns regarding delays caused by the COVID-19 pandemic. R. J. Reynolds Vapour Company filed PMTAs for the remaining Vuse products (Vibe, Ciro, and Alto) and the Velo products (pouch and lozenge) by the September 2020 deadline. Certain additional data from ongoing research relevant to the Alto and Velo applications will be submitted as amendments to the PMTAs during the FDA review process.
Comprehensive plan for tobacco and nicotine regulation
On 28 July 2017, the FDA announced its intent to develop a comprehensive plan for tobacco and nicotine regulation that recognises the continuum of risk for nicotine delivery. As part of that plan, the FDA planned to publish an Advance Notice of Proposed Rulemaking (ANPRM) to seek public input regarding the potential health benefits and possible adverse effects of lowering the level of nicotine in combustible cigarettes.
| 310 | BAT Annual Report and Form 20-F 2020 |
Other Information
Regulation of the Group’s Business
Continued
The ANPRM would request comments from interested stakeholders regarding the potential impact of a nicotine product standard on, among other things:
| – | the likelihood that existing users of tobacco products will stop using cigarettes; |
| – | the likelihood that those who do not use tobacco products will start using such products; and |
| – | the illicit trade of cigarettes containing nicotine at levels higher than a non-addictive nicotine threshold. |
In addition, the Center for Tobacco Products (CTP), which was established within the FDA in 2009, will coordinate with the FDA Center for Drug Evaluation and Research regarding medicinal nicotine and other therapeutic products as part of an agency-wide nicotine framework. As part of the comprehensive plan, the FDA also announced its intent to issue ANPRMs requesting public stakeholder input on the impact of flavours (including menthol) in increased initiation among youth and young adults as well as assisting adult smokers to switch to potentially less harmful forms of nicotine delivery, and the patterns of use and public health impact of premium cigars. This follows on from the FDA’s decision to issue its own preliminary scientific evaluation regarding menthol cigarettes in 2013, which concluded that menthol cigarettes adversely affect initiation, addiction and cessation compared to non-menthol cigarettes. In 2018, the FDA took several steps to further this plan. Firstly, in January 2018, the FDA held a public hearing to obtain input from a broad group of stakeholders on ways to streamline the regulatory process for the issuance of therapeutic claims for nicotine products. Secondly, in March 2018, the agency issued three ANPRMs, seeking information on (1) the lowering of nicotine levels to non-addictive or minimally addictive levels, (2) the impact of flavours (including menthol) in increased initiation among youth and young adults as well as assisting adult smokers to switch to potentially less harmful forms of nicotine delivery, and (3) the patterns of use and public health impact of premium cigars.
Additional regulation
In addition to the ANPRMs on reduced nicotine products and flavours, the FDA, in April 2019, issued a proposed rule on the format and content of substantial equivalence applications. This follows on the FDA’s previous statements regarding the development of foundational rules so as to provide clarity and predictability to the tobacco product submission process, including not only substantial equivalence applications but new product applications as well as MRTP applications. To that end, FDA, in September 2019, published a proposed rule on the format and content of Premarket Tobacco Product Applications. Under the FSPTCA, for a manufacturer to launch a new tobacco product or modify an existing tobacco product after 22 March 2011, the manufacturer must obtain an order from the FDA allowing the new or modified product to be marketed. Similarly, a manufacturer that introduced a cigarette or smokeless tobacco product between 15 February 2007 and 22 March 2011 was required to file a substantial equivalence report with the FDA demonstrating either (1) that the new or modified product had the same characteristics as a product commercially available as at 15 February 2007, referred to as a predicate product, or (2) if the new or modified product had different characteristics than the predicate product, that it did not raise different questions of public health. A product subject to such report is referred to as a provisional product. A manufacturer may continue to market a provisional product unless and until the FDA issues an order that the provisional product is not substantially equivalent (NSE), in which case the FDA could then require the manufacturer to remove the provisional product from the market. Substantially, many of the RAI subsidiaries’ cigarette and smokeless tobacco products currently on the market are provisional products. At present, there is substantial uncertainty over the approaches that the FDA CTP will take in evaluating RAI subsidiaries’ MRTP applications, PMTAs and substantial equivalence reports. In January 2017, the FDA issued its first proposed product standard just prior to President Trump’s inauguration whereby the agency would require the reduction, over a three-year period, of the levels of N-nitrosonornicotine (NNN) contained in smokeless tobacco products. Since issuing this proposal, the agency has simply stated that it is evaluating submitted comments. The FDA’s semiannual regulatory agenda, which details the regulatory activities that the FDA expects to undertake in the foreseeable future, has not listed the NNN proposal since its publication. Thus, it is not known whether or when this proposed rule will be finalised, and, if adopted, whether the final rule will be the same as or similar to the proposed rule. On 18 December 2017, the FDA accepted for review MRTP applications for six Camel Snus smokeless tobacco products. In 2018, the FDA began its review of these applications, which included facility inspections and a public meeting held 13-14 September 2018 before the Tobacco Product Scientific Advisory Committee to obtain its review and recommendation. The FDA is completing its independent review of the applications with no announced deadline for completion.
On 18 March 2020, FDA issued a rule mandating the incorporation on cigarettes packages of graphic health warnings. The rule requires eleven new textual warnings, each accompanied by a specific graphic image, on the top 50% of the front and back of all cigarette packages, on the left 50% of the front and back of cigarette cartons, and the top 20% of all cigarette advertising, beginning June 18, 2021. On 3 April 2020, RAI subsidiaries R. J. Reynolds Tobacco Company and Santa Fe Natural Tobacco Company, in conjunction with several cigarette manufacturers and retailers, filed a lawsuit seeking to permanently enjoin implementation of the rule. The court has on two occasions entered orders delaying the implementation of the rule, which is now delayed until 14 January 2022. The court is expected to issue a decision on all pending motions by March 2021 or otherwise order another delay to the implementation date while it continues its review. Irrespective of the court’s decision, once issued it is expected to be appealed to the federal court of appeals, from which a determination is estimated for the fourth quarter of 2021. If the industry challenge is unsuccessful, the RAI companies are prepared to implement the rule’s requirements by the January 2022 deadline, having created compliant packaging and obtained approval from the FDA for the required warning rotation plans. Cigarettes and other tobacco products are subject to substantial taxes in the US. All states and the District of Columbia currently impose cigarette excise taxes. Certain city and county governments, such as New York, Philadelphia and Chicago, also impose substantial excise taxes on cigarettes sold in those jurisdictions. Also, all states and the District of Columbia currently subject smokeless tobacco products to excise taxes. Various states and the District of Columbia impose a tax on vapour products, such as e-cigarettes, and many other states have proposed taxes on vapour products. Currently, there is no federal tax on vapour products, such as e-cigarettes.
State and local governments also consider and implement other legislation and regulation regarding the sale of tobacco products. Measures include, among others, limiting or prohibiting the sale of flavours in tobacco products, restricting where tobacco products may be sold and increasing the minimum age to purchase tobacco products. The Group believes that, as a responsible business, it can contribute through information, ideas and practical steps, to help regulators address the key issues regarding its products, including underage access, illicit trade, product information, product design, involuntary exposure to smoke and the development of potentially less harmful products, while maintaining a competitive market that accommodates the significant percentage of adults who choose to be tobacco consumers. The Group is committed to working with national governments and multilateral organisations and welcomes opportunities to participate in good faith to achieve sensible and balanced regulation of traditional tobacco and potentially reduced-risk products.
|
Strategic Report |
Governance Report | Financial Statements | Other Information | BAT Annual Report and Form 20-F 2020 | 311 | |||||
|
|
Disclosure Pursuant to Section 219 of the Iran Threat Reduction and Syria Human Rights Act of 2012 (ITRA)
Section 219 of the Iran Threat Reduction and Syria Human Rights Act of 2012 added Section 13(r) to the Exchange Act. Section 13(r) requires an issuer to disclose in its annual or quarterly reports, as applicable, whether it or any of its affiliates knowingly engaged in certain activities, transactions or dealings relating to Iran or with designated natural persons or entities sanctioned under programmes relating to terrorism or the proliferation of weapons of mass destruction. Disclosure is required even where the activities, transactions or dealings are conducted outside the US by non-US affiliates in compliance with applicable law, and whether or not the activities are sanctionable under US law.
As of the date of this report, BAT is not aware of any activity, transaction or dealing by the Group or any of its affiliates during the financial year ended 31 December 2020 that is disclosable under Section 219 of the Iran Threat Reduction and Syria Human Rights Act of 2012 and Section 13(r) of the Exchange Act, except as set forth below. This information is to the best of BAT’s knowledge.
BAT has a local operation in Iran, established on 18 October 2003, through its wholly-owned non-US subsidiary, B.A.T. Pars Company (Private Joint Stock) (BAT Pars). BAT Pars produces its products, which include Kent, Pall Mall and Montana brands, in its own factory in Eshtehard, which is in the Alborz province of Iran. BAT Pars distributes its product via 54 sub-agents with national and provincial distribution licences, who sell products to wholesalers and retailers with the support of BAT Pars’ sales representatives. BAT Pars has 305 direct employees and an additional 1,172 contract workers supplied by a private company.
Concerning the business of BAT Pars, various elements such as income tax, payroll, social security, other taxes, excise, monopoly fees, duties and other fees, including for utilities, licences and judicial fees to commence litigation, are payable to the Government of Iran and affiliated entities regarding BAT Pars’ operation. BAT Pars maintains bank accounts in Iran with various banks to facilitate its operations in the country and to make any required payments, as described above, to the Government of Iran and affiliated entities regarding its operations.
During the year ended 31 December 2020, BAT did not have any gross revenues or net profits derived from transactions with the Government of Iran or affiliated entities.
BAT maintains policies and procedures designed to ensure that its activities in Iran and elsewhere comply in all material aspects with the applicable and relevant trade sanctions laws and regulations, including US and other international trade sanctions and/or embargoes. BAT’s sanctions policies and procedures have been designed to be as robust as possible. However, there can be no absolute assurance that these policies and procedures will be effective. Were they to be ineffective, penalties or sanctions could be imposed against BAT, which could be material. To the extent permitted under applicable law, and as long as it continues to meet BAT’s risk management and operational requirements, BAT Pars’ activities in Iran are expected to continue.
| 312 | BAT Annual Report and Form 20-F 2020 |
Other Information
The Master Settlement Agreement & State Settlement Agreements
In 1998, the major US cigarette manufacturers (including R.J. Reynolds Tobacco Company, Lorillard and Brown & Williamson, businesses which are now part of Reynolds American) entered into the Master Settlement Agreement (MSA) with attorneys general representing most US states and territories. The MSA imposes a perpetual stream of future payment obligations on the major US cigarette manufacturers. The amounts of money that the participating manufacturers are required to annually contribute are based upon, among other things, the volume of cigarettes sold and market share (based on cigarette shipments in that year).
During 2012, R.J. Reynolds Tobacco Company, various other tobacco manufacturers, 17 states, the District of Columbia and Puerto Rico reached a final agreement related to Reynolds American’s 2003 MSA activities, and three more states joined the agreement in 2013. Under this agreement, R.J. Reynolds Tobacco Company has received credits of more than US$1 billion in respect of its Non-Participating Manufacturer (NPM) Adjustment claims related to the period from 2003 to 2012. These credits have been applied against the company’s MSA payments over a period of five years from 2013, subject to, and dependent upon, meeting the various ongoing performance obligations. During 2014, two additional states agreed to settle NPM disputes related to claims for the period 2003 to 2012. R.J. Reynolds Tobacco Company received US$170 million in credits, which have been applied over a five-year period from 2014. During 2015, another state agreed to settle NPM disputes related to claims for the period 2004 to 2014. R.J. Reynolds Tobacco Company received US$285 million in credits, which have been applied over a four-year period from 2016. During 2016, no additional states agreed to settle NPM disputes. During 2017, two more states agreed to settle NPM disputes related to claims for the period 2004 to 2014. It is estimated that R.J. Reynolds Tobacco Company will receive US$61 million in credits, which will be applied over a five-year period from 2017. During 2018, nine more states agreed to settle NPM disputes related to claims for the period 2004 to 2019, with an option through 2022, subject to certain conditions. It is estimated that R.J. Reynolds Tobacco Company will receive US$182 million in credits for settled periods through 2017, which will be applied over a five-year period from 2018. Also in 2018, a tenth additional state agreed to settle NPM disputes related to claims for the period 2004 to 2024, subject to certain conditions. It is estimated that R.J. Reynolds Tobacco Company will receive US$205 million in credits for settled periods through 2017, which will be applied over a five-year period from 2019. In the first quarter of 2020, certain conditions set forth in the 2018 agreements were met for those ten states. In addition, in August 2020, 24 states, the District of Columbia and Puerto Rico agreed to settle NPM disputes related to claims for the period 2018-2022. Credits in respect of future years’ payments and the NPM Adjustment claims would be accounted for in the applicable year and will not be treated as adjusting items. Only credits in respect of prior year payments are included as adjusting items.
The BAT Group is subject to substantial payment obligations under the MSA and the state settlement agreements with the states of Mississippi, Florida, Texas and Minnesota (such settlement agreements, collectively State Settlement Agreements). Reynolds American Inc.’s operating subsidiaries’ expenses and payments under the MSA and the State Settlement Agreements for 2020 amounted to US$3,572 million in respect of settlement expenses and US$2,848 million in respect of settlement cash payments. Reynolds American Inc.’s operating subsidiaries’ expenses and payments under the MSA and the State Settlement Agreements for 2019 amounted to US$2,762 million in respect of settlement expenses and US$2,918 million in respect of settlement cash payments.
R.J. Reynolds Tobacco Company divested certain brands to Imperial Tobacco Group (ITG) in 2015. In 2020, R.J. Reynolds Tobacco Company recognised additional expenses, included above, under the state settlement agreements in the states of Mississippi, Florida, Texas and Minnesota related to these divested brands. R.J. Reynolds Tobacco Company recognised US$241 million of expense for payment obligations to the State of Florida for the ITG acquired brands from the date of divestiture, June 12, 2015, as a result of an unfavourable judgment. In addition, R.J. Reynolds Tobacco Company recognised US$264 million related to the resolution of claims against it in the States of Texas, Minnesota and Mississippi for payment obligations to those states for the ITG acquired brands from the date of divestiture. Finally, R.J. Reynolds Tobacco Company settled certain related claims with Phillip Morris USA under the state settlement agreements in the states of Mississippi, Texas and Minnesota for US$8 million.
|
Strategic Report |
Governance Report | Financial Statements | Other Information | BAT Annual Report and Form 20-F 2020 | 313 | |||||
|
|
Change of Control Provisions as at 31 December 2020
Significant agreements
| Nature of agreement | Key provisions | |
| The revolving credit facilities agreement effective 12 March 2020 entered into between the Company, B.A.T. International Finance p.l.c., B.A.T. Netherlands Finance B.V and B.A.T Capital Corporation (as borrowers and, in the case of the Company, as a guarantor) and HSBC Bank plc (as agent) and certain financial institutions (as lenders), pursuant to which the lenders agreed to make available to the borrowers £6 billion for general corporate purposes (the Facility). | – should a borrower (other than the Company) cease to be a direct or indirect subsidiary of the Company, such borrower shall immediately repay any outstanding advances made to it and shall cease to be a borrower under the Facility; and
– where there is a change of control in respect of the Company, the lenders can require all amounts outstanding under the Facility to be repaid. | |
| In March and April 2020, the Group arranged short-term bilateral facilities with core relationship banks for a total amount of approximately £4.8 billion. B.A.T. International Finance p.l.c. is the borrower under these facilities and the Company the guarantor. The bilateral facilities have since been reduced to a total amount of approximately £3.4 billion and remain undrawn. | – should the borrower cease to be a direct or indirect subsidiary of the Company, the borrower shall immediately repay any outstanding advances made to it under these facilities; and
– where there is a change of control in respect of the Company, the lenders can require all amounts outstanding under these facilities to be repaid. | |
| Term loan facilities agreement dated 16 January 2017: B.A.T. International Finance p.l.c. and B.A.T Capital Corporation (as borrowers), the Company, (as guarantor) and HSBC Bank plc (as agent) and certain financial institutions (as lenders) pursuant to which the lenders agreed to make available to the borrowers US$25 billion for the acquisition of Reynolds American Inc. Facilities A, B and C have been repaid and facility D, totalling the sterling equivalent of US$2.5 billion, is still outstanding. | – should a borrower cease to be a direct or indirect subsidiary of the Company, such borrower shall immediately repay any outstanding advances made to it; and
– where there is a change of control in respect of the Company, the lenders can require all amounts outstanding under the term loan facilities to be repaid. | |
| Packaging Materials Agreement dated 8 April 2015, between Souza Cruz S.A. and Amcor Group GmbH for the production and supply of packaging for a value of R$1.5 billion. | – that either party may terminate the agreement in the event of any direct or indirect acquisition of at least 25% of the voting shares of the supplier and/or its affiliates by directly or indirectly a competitor of Souza Cruz S.A., importer or distributor. | |
| On 25 July 2017, the Company acceded as a guarantor under the indenture of its indirect, wholly-owned subsidiary Reynolds American Inc. The securities issued under the indenture include approximately US$7.7 billion aggregate principal amount of unsecured Reynolds American Inc debt securities. | – with respect to each series of debt securities issued under the indenture, upon a change of control event, combined with a credit ratings downgrade of the series to below investment-grade level (such downgrade occurring on any date from the date of the public notice of an arrangement that could result in a change of control event until the end of the 60-day period following public notice of the occurrence of a change of control event), Reynolds American Inc. is obligated to make an offer to repurchase all debt securities from each holder of debt securities. As a guarantor under the indenture, the Company guarantees such payments. | |
| LTIPs | ||
| The rules of the long-term incentive plans 2007 and 2016 (the LTIPs). | – in the event of a change of control of the Company as a result of a takeover, reconstruction or winding-up of the Company (not being an internal reorganisation), LTIP awards will become exercisable for a limited period based on the period of time that has elapsed since the date of the award and the achievement of the performance conditions at that date, unless the Remuneration Committee determines this not to be appropriate in the circumstances; and
– the rules of the LTIPs allow (as an alternative to early release) that participants may, if permitted, exchange their LTIP awards for new awards of shares in the acquiring company on a comparable basis. | |
| 314 | BAT Annual Report and Form 20-F 2020 |
Other Information
and Equipment
The Group uses a combination of in-house and contract manufacturers to manufacture its products.
BAT-owned manufacturing facilities1
| United States | APME | AmSSA | ENA | Total | ||||||||||||||||
| Fully integrated cigarette manufacturing | 2 | 16 | 15 | 12 | 45 | |||||||||||||||
| Sites processing tobacco only | 1 | 7 | 9 | 2 | 19 | |||||||||||||||
| Site manufacturing other tobacco products, Snus, Modern Oral and Liquids | 3 | – | – | 5 | 8 | |||||||||||||||
| R&D facilities and Product Centres | 1 | 1 | 3 | 2 | 7 | |||||||||||||||
| Total |
7 | 24 | 27 | 21 | 79 | |||||||||||||||
Note:
| 1. | As of 31 December 2020. |
The plants and properties owned or leased and operated by the Group’s subsidiaries are maintained in good condition and are believed to be suitable and adequate for the Group’s present needs.
The technology employed in the Group’s factories is sophisticated, especially in the area of cigarette making and packing where throughputs can reach between 500 and 1,000 packs per minute. The Group can produce many different pack formats (e.g., the number of cigarettes per packet) and configurations (e.g., bevel edge, round corner, international) to suit marketing and consumer requirements. New technology machines are sourced from the leading machinery suppliers to the industry. Close cooperation with these organisations helps the Group support its marketing strategy by driving its product innovations, which are brought to the market on a regular basis.
The Group utilises quality standards, processes and procedures covering the entire end-to-end value chain to help to ensure quality products are provided to its customers and adult tobacco consumers according to the Group’s requirements and end market regulatory requirements.
The Group has several improvement initiatives which it is currently managing. For example, the Group is continuing to realise the benefits of its Integrated Work System Programme launched in 2014, which is centrally led with an aim to improve the performance of the Group’s factories globally by focusing on manufacturing standards, continuous improvement, assessment and benchmarking, and organisational development. The Group also utilises a survey process in the factories with an aim to improve factory productivity and reduce costs in the manufacturing environment. This process, known as ‘Bulls Eye’, has been in existence for a number of years and highlights productivity opportunities by benchmarking.
In 2020, the Group manufactured cigarettes in 45 cigarette factories in 43 countries. These plants and properties are owned or leased and operated by the Group’s subsidiaries. The Group’s factory outputs and establishments vary significantly in size and production capacity.
In 2020, the Group used third-party manufacturers to manufacture the components required, including the devices, related to New Categories. The Group also used third-party manufacturers to supplement the Group’s own production facilities in the US and Poland to bottle the liquids used in the vapour products.
For more information on property, plant and equipment, see note 9 in the Notes on the Accounts.
While the Group does not own tobacco farms or directly employ farmers, it sources over 370,000 tonnes of tobacco leaf each year directly from over 84,000 contracted farmers and through third-party suppliers mainly in developing countries and emerging markets. In respect of farmers we contract, we continually strive to improve farmer sustainability and viability with a focus on improved quality and resistance of seed, tailored mechanisation to reduce costs of production and increased yield, with similar expectation on our third-party suppliers in respect of their farmer contracts. We review our contracts on an annual basis considering Group requirements over the medium term (2 - 3 years) to promote the stability of demand and supply on production volumes. The Group also purchases a small amount of tobacco leaf from India where the tobacco is bought over an auction floor. The price of tobacco in US dollars varies from year-to-year driven by domestic inflationary pressures, economic and political factors, as well as climatic conditions which impact supply, demand and quality of tobacco grown.
While COVID-19 impacted tobacco supply chains across most markets and required process enhancements to minimise transmission risks within communities, prices and availability of tobacco were not significantly impacted. The Group believes there is an adequate supply of tobacco leaf in the world markets to satisfy its current and anticipated production requirements.
We also source a number of other materials required as part of our production requirements, covering areas that include wrapping materials and filters for our combustibles business and liquids and batteries for our New Categories products. We work closely with our suppliers to ensure a robust supply chain, with contingency sourcing in place. Contracts and sourcing agreements are reviewed regularly, to ensure competitive trading terms while recognising that prices may be impacted by external factors that affect our third-party supply partners. COVID-19 has led to some short-term disruption in the supply of certain materials (due to local lockdowns and travel restrictions), yet this has been proactively managed to mitigate the impact.
|
Strategic Report |
Governance Report | Financial Statements | Other Information | BAT Annual Report and Form 20-F 2020 | 315 | |||||
|
|
Other Information
Governance Practices
Principles
In the US, ADSs of the Company are listed on the New York Stock Exchange (NYSE). The significant differences between the Company’s corporate governance practices as a UK company and those required by NYSE listing standards for US companies are discussed below.
The Company has applied a robust set of board governance principles, which reflect the UK Corporate Governance Code 2018 and its principles-based approach to corporate governance. NYSE rules require US companies to adopt and disclose on their websites corporate governance guidelines. The Company complies with UK requirements, including a statement in this report of how the Company has applied the principles of the UK Corporate Governance Code 2018 and that the Company has complied with the provisions of the UK Corporate Governance Code 2018.
Independence
The Company’s Board governance principles require that all Non-Executive Directors be determined by the Board to be independent in character and judgement and free from any business or other relationships that could interfere materially with, or appear to affect, their judgement. The Board also has formal procedures for managing conflicts of interest. The Board has determined that, in its judgement, all of the Non-Executive Directors are independent. In doing so, the Board has taken into consideration the independence requirements outlined in the NYSE’s listing standards and considers these to be met by the Chairman and all of its Non-Executive Directors.
Committees
The Company has a number of Board Committees that are broadly comparable in purpose and composition to those required by NYSE rules for domestic US companies. For instance, the Company has a Nominations (rather than nominating/corporate governance) Committee and a Remuneration (rather than compensation) Committee. The Company also has an Audit Committee, which NYSE rules require for both US companies and foreign private issuers.
These Committees are composed solely of Non-Executive Directors and, in the case of the Nominations Committee, the Chairman whom the Board has determined to be independent in the manner described above.
Each Board Committee has its own terms of reference, which prescribe the composition, main tasks and requirements of each of the Committees (see the Board Committee reports on pages 105, 110 and 117).
Under US securities law and the listing standards of the NYSE, the Company is required to have an audit committee that satisfies the requirements of Rule 10A-3 under the Exchange Act and Section 303A.06 of the NYSE Listed Company Manual. The Company’s Audit Committee complies with these requirements. The Company’s Audit Committee does not have direct responsibility for the appointment, reappointment or removal of the independent auditors. Instead, it follows the UK Companies Act 2006 by making recommendations to the Board on these matters for it to put forward for shareholder approval at the AGM.
One of the NYSE’s additional requirements for the audit committee states that at least one member of the audit committee is to have ‘accounting or related financial management expertise’. The Board has determined that Luc Jobin, Holly Keller Koeppel, Jerry Fowden and Darrell Thomas possess such expertise and also possess the financial and audit committee experiences set forth in both the UK Corporate Governance Code 2018 and SEC rules (see the Audit Committee report on page 110). Mr Jobin, Ms Keller Koeppel and Mr Fowden have also each been designated as an Audit Committee financial expert as defined in Item 16.A. of Form 20-F. The Board has also determined that each Audit Committee member meets the financial literacy requirements applicable under NYSE listing standards.
Shareholder Approval of Equity Compensation Plans
The NYSE rules for US companies require that shareholders must be given the opportunity to vote on all equity-compensation plans and material revisions to those plans. The Company complies with UK requirements that are similar to the NYSE rules. The Board, however, does not explicitly take into consideration the NYSE’s detailed definition of what are considered ‘material revisions’.
Codes of Business Conduct and Ethics
The NYSE rules require US companies to adopt and disclose a code of business conduct and ethics for all directors, officers and employees and promptly disclose any waivers of the code for directors or executive officers. The Group Standards of Business Conduct (SoBC) described on pages 56 to 57 apply to all staff in the Group, including senior management and the Board, and satisfy the NYSE requirements. All Group companies have adopted the SoBC (or localised versions). The SoBC also set out the Group’s whistleblowing policy, enabling staff, in confidence and anonymously, to raise concerns without fear of reprisal, including concerns regarding questionable accounting or auditing matters. The SoBC is available at bat.com/sobc.
The Company has also adopted a code of ethics for its Chief Executive, Finance Director, Group Financial Controller and Group Chief Accountant as required by the provisions of Section 406 of the Sarbanes-Oxley Act of 2002 and the rules issued by the SEC. No waivers or exceptions to the Code of Ethics were granted in 2020. The Code of Ethics includes requirements in relation to confidentiality, conflicts of interest and corporate opportunities, and obligations for those senior financial officers to act with honesty and integrity in the performance of their duties and to promote full, fair, accurate, timely and understandable disclosures in all reports and other documents submitted to the SEC, the UK Financial Conduct Authority, and any other regulatory agency.
The Company considers that these codes and policies address the matters specified in the NYSE rules for US companies.
Independent Director Contact
Interested parties may communicate directly with the independent directors, individually or as a group, by sending written correspondence addressed to the independent director(s) to the attention of the Company Secretary at the following address: c/o Paul McCrory, Company Secretary, British American Tobacco p.l.c., Globe House, 4 Temple Place, London WC2R 2PG.
| 316 | BAT Annual Report and Form 20-F 2020 |
Other Information
Procedures
Evaluation of Disclosure Controls and Procedures
Disclosure controls and procedures
The Group maintains ‘disclosure controls and procedures’ (as such term is defined in Exchange Act Rule 13a-15(e)), that are designed to ensure that information required to be disclosed in reports the Group files or submits under the Exchange Act is recorded, processed, summarised and reported within the time periods specified in the SEC rules and forms, and that such information is accumulated and communicated to management, including the Chief Executive and Finance Director, as appropriate, to allow timely decisions regarding required disclosure.
In designing and evaluating our disclosure controls and procedures, our management, including the Chief Executive and Finance Director, recognise that any controls and procedures, no matter how well designed and operated, can provide only reasonable, not absolute, assurance that the objectives of the disclosure controls and procedures are met. Due to the inherent limitations in all control systems, no evaluation of controls can provide absolute assurance that all control issues and instances of fraud, if any, within the Group have been detected. The Group’s disclosure controls and procedures have been designed to meet, and management believes that they meet, reasonable assurance standards.
Management, with the participation of the Chief Executive and Finance Director, has evaluated the effectiveness of the Group disclosure controls and procedures pursuant to Exchange Act Rule 13a-15(b) as of the end of the period covered by this annual report. Based on that evaluation, the Chief Executive and Finance Director have concluded that the Group disclosure controls and procedures were effective at a reasonable assurance level.
Management’s report on internal control over financial reporting
Management, under the oversight of the Chief Executive and the Finance Director, is responsible for establishing and maintaining adequate internal control over financial reporting for the Group. The Group’s internal control over financial reporting consists of processes which are designed to: provide reasonable assurance regarding the reliability of financial reporting and the preparation of the Group’s financial statements for external reporting purposes in accordance with IFRS as adopted by the EU and IFRS as issued by the IASB; provide reasonable assurance that receipts and expenditure are made only in accordance with the authorisation of management; and provide reasonable assurance regarding the prevention or timely detection of any unauthorised acquisition, use or disposal of assets that could have a material effect on the consolidated financial statements.
As required by Section 404 of the Sarbanes-Oxley Act of 2002, management has assessed the effectiveness of the internal control over financial reporting (as defined in Rules 13(a)-13(f) and 15(d)-15(f) under the US Securities Exchange Act of 1934) based on the updated Internal Control-Integrated Framework issued by the Committee of Sponsoring Organisations of the Treadway Commission (COSO) (2013). Based on that assessment, management has determined that the Group’s internal control over financial reporting was effective as at 31 December 2020.
Any internal control framework, no matter how well designed, has inherent limitations, including the possibility of human error and the circumvention or overriding of controls and procedures and may not prevent or detect misstatements. Also, projections of any evaluation of effectiveness to future periods are subject to the risk that controls may become inadequate because of changes in conditions or because the degree of compliance with the policies or procedures may deteriorate.
»KPMG LLP, an independent registered public accounting firm, who also audit the Group’s consolidated financial statements, has audited the effectiveness of the Group’s internal control over financial reporting as at 31 December 2020, which is included in this document.»
Changes in internal control over financial reporting
During the period covered by this report, there were no changes in the Group’s internal control over financial reporting that have materially affected or are reasonably likely to materially affect the effectiveness of internal control over financial reporting.
Competitive Position
Statements referring to the competitive position of BAT and its subsidiaries are based on the Group’s belief and best estimates. In certain cases, such statements and figures rely on a range of sources, including investment analyst reports, independent market surveys, and the Group’s own internal assessments of market share.
|
Strategic Report |
Governance Report | Financial Statements | Other Information | BAT Annual Report and Form 20-F 2020 | 317 | |||||
|
|
Information
This Other Information section of the British American Tobacco Annual Report and Form 20-F, which includes Additional Disclosures and Shareholder Information, forms part of, and includes certain disclosures which are required by law to be included in, the Directors’ Report.
Strategic Report Disclosures
|
Section 414C(11) of the Companies Act 2006 allows the Board to include in the Strategic Report information that it considers to be of strategic importance that would otherwise need to be disclosed in the Directors’ Report. The Board has chosen to take advantage of this provision and accordingly, the information set out below, which would otherwise be required to be contained in the Directors’ Report, has been included in the Strategic Report.
| ||
| Information required in the Directors’ Report | Section in the Strategic Report | |
| Information on dividends | Financial review | |
| Certain risk information about the use of financial instruments | Financial review | |
| An indication of likely future developments in the business of the Group | A strategy for accelerated growth | |
| An indication of the activities of the Group in the field of research and development | Accelerating the Enterprise of the Future | |
| Tobacco Harm Reduction Through World-class Science | ||
| A statement describing the Group’s policy regarding the hiring, continuing employment and training, career development and promotion of disabled persons | People and Culture | |
| Details of employee engagement: information, consultation, regard to employee interests, share scheme participation and the achievement of a common awareness of the financial and economic factors affecting the performance of the Group |
Engaging with our stakeholders
People and Culture | |
| Details of business relationships: Directors’ regard to business relationships with customers, suppliers and other external stakeholders | Engaging with our stakeholders | |
| Disclosures concerning greenhouse gas emissions and energy consumption | Excellence in Environmental Management | |
| Shareholder Information Disclosures | ||
| Information required in the Directors’ Report | Section in Other Information | |
| Change of control provisions | Material contracts | |
| Information on dividends | Dividends | |
| Share capital – structure and voting rights; restrictions on transfers of shares | Articles of Association | |
| Major shareholders | Share capital and security ownership | |
| Directors – appointment and retirement | Articles of Association | |
| Amendment of Articles of Association | Articles of Association | |
| Directors – share issuance and buy-back powers | Share capital and security ownership | |
|
Purchases of shares | ||
| Listing Rules (LRs) Disclosures
|
||
|
For the purpose of LR 9.8.4C R the applicable information required to be disclosed by LR 9.8.4 R
|
Section in Other Information
| |
| Section (12) – shareholder waivers of dividends | Group Employee Trust | |
| Section (13) – shareholder waivers of future dividends | Group Employee Trust | |
Directors: Interests and Indemnities
| Interests | – details of Directors’ remuneration and emoluments, and their interests in the Company’s shares (including share options and deferred shares) as at 31 December 2020 are given in the Remuneration Report; and
– no Director had any material interest in a contract of significance (other than a service contract) with the Company or any subsidiary company during the year. | |
| Insurance | – appropriate cover provided in the event of legal action against the Company’s Directors. | |
| Indemnities | – provision of indemnities to Directors in accordance with the Company’s Articles of Association and to the maximum extent permitted by law; and
– as at the date of this report, such indemnities are in force covering any costs, charges, expenses or liabilities that they may incur in or about the execution of their duties to the Company or to any entity which is an associated company (as defined in Section 256 of the Companies Act 2006), or as a result of duties performed by them on behalf of the Company or any such associated company. | |
Directors’ Report Approval and Signature
|
The Directors’ Report comprises the information on pages 89 to 116 and pages 271 to 343. The Directors’ Report was approved by the Board of Directors on 16 February 2021 and signed on its behalf by Paul McCrory, Company Secretary.
|
| 318 | BAT Annual Report and Form 20-F 2020 |
Other Information
This document contains certain forward-looking statements, including “forward-looking” statements made within the meaning of the U.S. Private Securities Litigation Reform Act of 1995. These statements are often, but not always, made through the use of words or phrases such as “believe,” “anticipate,” “could,” “may,” “would,” “should,” “intend,” “plan,” “potential,” “predict,” “will,” “expect,” “estimate,” “project,” “positioned,” “strategy,” “outlook”, “target” and similar expressions. These include statements regarding our intentions, beliefs or current expectations concerning, amongst other things, our results of operations, financial condition, liquidity, prospects, growth, strategies and the economic and business circumstances occurring from time to time in the countries and markets in which the Group operates, including the projected future financial and operating impacts of the COVID-19 pandemic.
In particular, these forward-looking statements include, among other statements, statements regarding the Group’s future financial performance, planned product launches and future regulatory developments, as well as: (i) certain statements in the Overview section (pages 2 to 11, including the Chairman’s introduction, Chief Executive’s review and Finance Director’s overview; (ii) certain statements in the Strategic Management section (pages 12 to 28), including the Global industry overview; (iii) certain statements in the Financial Review section (pages 65 to 73), including the Treasury and cash flow section and going concern discussions; and (iv) certain statements in the Other Information section (pages 271 to 348), including the Additional disclosures and Shareholder information sections.
All such forward-looking statements involve estimates and assumptions that are subject to risks, uncertainties and other factors. It is believed that the expectations reflected in this document are reasonable but they may be affected by a wide range of variables that could cause actual results to differ materially from those currently anticipated.
Among the key factors that could cause actual results to differ materially from those projected in the forward-looking statements are uncertainties related to the following: the impact of competition from illicit trade; the impact of adverse domestic or international legislation and regulation; the inability to develop, commercialise and deliver the Group’s New Categories strategy; the impact of market size reduction and consumer down-trading; adverse litigation and dispute outcomes and the effect of such outcomes on the Group’s financial condition; the impact of significant increases or structural changes in tobacco, nicotine and New Categories related taxes; translational and transactional foreign exchange rate exposure; changes or differences in domestic or international economic or political conditions; the ability to maintain credit ratings and to fund the business under the current capital structure; the impact of serious injury, illness or death in the workplace; adverse decisions by domestic or international regulatory bodies; and changes in the market position, businesses, financial condition, results of operations or prospects of the Group. Further details on the principal risks that may affect the Group can be found in the ‘Principal Group risks’ section of the Strategic Report on pages 84 to 88 of this document. A summary of all the risk factors (including the principal risks) which are monitored by the Board through the Group’s risk register is set out in the Additional Disclosures section under the heading ‘Group risk factors’ on pages 288 to 306.
Past performance is no guide to future performance and persons needing advice should consult an independent financial adviser. The forward-looking statements reflect knowledge and information available at the date of preparation of this document and the Group undertakes no obligation to update or revise these forward-looking statements, whether as a result of new information, future events or otherwise. Readers are cautioned not to place undue reliance on such forward-looking statements.
No statement in this document is intended to be a profit forecast and no statement in this document should be interpreted to mean that earnings per share of BAT for the current or future financial years would necessarily match or exceed the historical published earnings per share of BAT.
|
Strategic Report |
Governance Report | Financial Statements | Other Information | BAT Annual Report and Form 20-F 2020 | 319 | |||||
|
|
Premium Listing – London Stock Exchange (LSE)
The primary market for BAT’s ordinary shares is the LSE (Share Code: BATS; ISIN: GB0002875804). BAT’s ordinary shares have been listed on the LSE main market since 8 September 1998 and are a constituent element of the Financial Times Stock Exchange (FTSE) 100 Index.
Secondary Listing – Johannesburg Stock Exchange (JSE Limited), South Africa
BAT’s ordinary shares have a secondary listing and are traded in South African rand on the Main Board of the JSE in South Africa (Abbreviated name: BATS; Trading code: BTI). BAT’s ordinary shares have been listed on the JSE since 28 October 2008 and are a constituent element of the JSE Top 40 Index.
American Depositary Shares (ADSs) – New York Stock Exchange (NYSE)
BAT ordinary shares trade in the form of BAT ADSs in the United States under the symbol BTI (CUSIP Number: 110448107). The BAT ADSs have been listed on the NYSE since 25 July 2017 as a Sponsored Level III ADS programme for which Citibank, N.A. is the depositary (the ‘Depositary’) and transfer agent. Each ADS represents one ordinary share. ADSs are evidenced by American Depositary Receipts (ADRs).
Share Prices
The high and low prices at which the Company’s ordinary shares and ADSs are recorded as having traded during the year on each of the LSE, JSE and NYSE are as follows:
| High | Low | |||||||
| LSE |
£35.07 | £23.82 | ||||||
| JSE |
R723.34 | R498.00 | ||||||
| NYSE |
US$45.48 | US$27.64 | ||||||
| 320 | BAT Annual Report and Form 20-F 2020 |
Other Information
Policy
The Group’s policy is to pay dividends of 65% of long-term sustainable earnings, calculated with reference to adjusted diluted earnings per share, as defined on page 281, and reconciled from earnings per share in note 7 in the Notes on the Accounts. Please see page 69 of this Annual Report and Form 20-F 2020 for further discussion on the Group’s dividend.
Currencies and Exchange Rates
Details of foreign exchange rates are set out in the Financial Review section of the Strategic Report on page 73 of this Annual Report and Form 20-F 2020. There are currently no UK foreign exchange controls or restrictions on remittance of dividends on the ordinary shares or on the conduct of the Company’s operations, other than restrictions applicable to certain countries and persons subject to EU economic sanctions or those sanctions adopted by the UK Government which implement resolutions of the Security Council of the United Nations.
American Depositary Shares – Dividends
The following table shows the dividends paid by British American Tobacco p.l.c. in the years ended 31 December 2016 to 31 December 2020 inclusive.
| Announcement Year |
Payment | Dividend period | Dividend per BAT ordinary share GBP |
Dividend per BAT
ADS1 USD2 |
||||||||
| 2016 |
May | Final 2015 | 1.046 | 3.0292160 | ||||||||
| September/October | Interim 2016 | 0.513 | 1.3324660 | |||||||||
| Total | 1.559 | 4.3616820 | ||||||||||
| Announcement Year |
Payment | Dividend Period | Dividend Per BAT Ordinary Share GBP |
Dividend Per BAT ADS1 USD2 |
||||||||
| 2017 |
May | Final 2016 | 1.181 | 1.5239380 | ||||||||
| September/October | Interim 2017 | 0.565 | 0.7585690 | |||||||||
| February 2018 | Second Interim 2017 | 0.436 | 0.6068680 | |||||||||
| Total
|
2.182 | 2.8893750 | ||||||||||
| 2018 |
May | Quarterly Interim 2018 | 0.488 | 0.6611420 | ||||||||
| August | Quarterly Interim 2018 | 0.488 | 0.6281530 | |||||||||
| November | Quarterly Interim 2018 | 0.488 | 0.6217120 | |||||||||
| February 2019 | Quarterly Interim 2018 | 0.488 | 0.6324960 | |||||||||
| Total
|
1.952 | 2.5435030 | ||||||||||
| 2019 |
May | Quarterly Interim 2019 | 0.5075 | 0.6596990 | ||||||||
| August | Quarterly Interim 2019 | 0.5075 | 0.6155970 | |||||||||
| November | Quarterly Interim 2019 | 0.5075 | 0.6521370 | |||||||||
| February 2020 | Quarterly Interim 2019 | 0.5075 | 0.6571610 | |||||||||
| Total
|
2.0300 | 2.5845940 | ||||||||||
| 2020 |
May | Quarterly Interim 2020 | 0.526 | 0.6424030 | ||||||||
| August | Quarterly Interim 2020 | 0.526 | 0.6889020 | |||||||||
| November | Quarterly Interim 2020 | 0.526 | 0.6895860 | |||||||||
| February 2021 | Quarterly Interim 2020 | 0.526 | 0.7178320 | |||||||||
| Total | 2.104 | 2.738723 | ||||||||||
Notes:
1. ADS ratio change: prior to 14 February 2017, each BAT ADS represented two BAT ordinary shares; from 14 February 2017, each BAT ADS represents one BAT ordinary share.
2. Holders of BAT ADSs: dividends are receivable in US dollars based on the £ sterling/US dollar exchange rate on the applicable ADS payment date, being three business days after the payment date for the BAT ordinary shares.
|
Strategic Report |
Governance Report | Financial Statements | Other Information | BAT Annual Report and Form 20-F 2020 | 321 | |||||
|
|
Quarterly Dividends for the Year Ended 31 December 2020
On 26 April 2017, the Group announced its move to quarterly dividends with effect from 1 January 2018.
The Board has declared an interim dividend of 215.6p per ordinary share of 25p which is payable in four equal quarterly instalments of 53.9p per ordinary share in May 2021, August 2021, November 2021 and February 2022. This represents an increase of 2.5% on 2019 (2019: 210.4p per share), and a payout ratio, on 2020 adjusted diluted earnings per share, of 65.0%.
The quarterly dividends will be paid to shareholders registered on either the UK main register or the South Africa branch register and to ADS holders, each on the applicable record dates set out under the heading ‘Key dates’ below.
Holders of American Depositary Shares (ADSs)
For holders of ADSs listed on the NYSE, the record dates and payment dates are set out below. The equivalent quarterly dividends receivable by holders of ADSs in US dollars will be calculated based on the exchange rate on the applicable payment date.
South Africa branch register
In accordance with the JSE Listing Requirements, the finalisation information relating to shareholders registered on the South Africa branch register (comprising the amount of the dividend in South African rand, the exchange rate and the associated conversion date) will be published on the dates stated below, together with South Africa dividends tax information.
The quarterly dividends are regarded as ‘foreign dividends’ for the purposes of the South Africa Dividends Tax. For the purposes of South Africa Dividends Tax reporting, the source of income for the payment of the quarterly dividends is the United Kingdom.
|
Key dates
In compliance with the requirements of the LSE, the NYSE and Strate, the electronic settlement and custody system used by the JSE, the following are the salient dates for the quarterly dividend payments. All dates are 2021 unless otherwise stated.
|
| Event | Payment No. 1 | Payment No. 2 | Payment No. 3 | Payment No. 4 | ||||
| Preliminary announcement (includes declaration data required for JSE purposes)
|
17 February
|
|||||||
| Publication of finalisation information (JSE) | 15 March | 29 June | 20 September | 13 December | ||||
| No removal requests (in either direction) permitted between the UK main register and the South Africa branch register |
15 March– 26 March
(inclusive) |
29 June– 9 July
(inclusive) |
20 September– 1 October
(inclusive) |
13 December– 24 December
(inclusive) | ||||
| Last day to trade (LDT) cum-dividend (JSE) | 23 March | 6 July | 28 September | 21 December | ||||
| Shares commence trading ex-dividend (JSE) | 24 March | 7 July | 29 September | 22 December | ||||
| No transfers permitted between the UK main register and the South Africa branch register |
24 March– 26 March
(inclusive) |
7 July– 9 July
(inclusive) |
29 September – 1 October
(inclusive) |
22 December– 24 December
(inclusive) | ||||
| No shares to be dematerialised or rematerialised on the South Africa branch register |
24 March– 26 March
(inclusive) |
7 July– 9 July
(inclusive) |
29 September– 1 October
(inclusive) |
22 December– 24 December
(inclusive) | ||||
| Shares commence trading ex-dividend (LSE) |
25 March | 8 July | 30 September | 23 December | ||||
| Shares commence trading ex-dividend (NYSE) |
25 March | 8 July | 30 September | 23 December | ||||
| Record date (LSE, JSE and NYSE) | 26 March | 9 July | 1 October | 24 December | ||||
| Last date for receipt of Dividend Reinvestment Plan (DRIP) elections (LSE) |
20 April | 29 July | 21 October | 19 January 2022 | ||||
| Payment date (LSE and JSE) | 12 May | 19 August | 11 November | 9 February 2022 | ||||
| ADS payment date (NYSE) | 17 May | 24 August | 16 November | 14 February 2022 | ||||
| 322 | BAT Annual Report and Form 20-F 2020 |
Other Information
Information
The following discussion summarises material US federal income tax consequences and UK taxation consequences to US holders of owning and disposing of ordinary shares or ADSs. This discussion does not address any tax consequences arising under the laws of any state, local or foreign jurisdiction or under any US federal laws other than those pertaining to income tax. This discussion is based upon the US Internal Revenue Code of 1986 (the ‘US Tax Code’), the Treasury regulations promulgated under the US Tax Code and court and administrative rulings and decisions, all as in effect on the date hereof. These laws may change, possibly retroactively, and any change could affect the accuracy of the statements and conclusions set forth in this discussion.
This discussion addresses only those US holders of ordinary shares or ADSs who hold such equity interests as capital assets within the meaning of Section 1221 of the US Tax Code. Further, this discussion does not address all aspects of US federal income taxation that may be relevant to US holders in light of their particular circumstances or that may be applicable to them if they are subject to special treatment under the US federal income tax laws, including, without limitation:
The determination of the actual tax consequences to a US holder will depend on the US holder’s specific situation. US holders of ordinary shares or ADSs should consult their own tax advisers as to the tax consequences of owning and disposing of ordinary shares or ADSs, in each case, including the applicability and effect of the alternative minimum tax and any state, local, foreign or other tax laws and of changes in those laws.
For purposes of this discussion, the term US holder means a beneficial owner of ordinary shares or ADSs (as the case may be) that:
| – | is for US federal income tax purposes: (i) an individual citizen or resident of the United States; (ii) a corporation, including any entity treated as a corporation for US federal income tax purposes, created or organised in or under the laws of the United States, any state thereof or the District of Columbia; (iii) a trust if a US court is able to exercise primary supervision over the trust’s administration and one or more US persons are authorised to control all substantial decisions of the trust or it has a valid election in effect under applicable Treasury regulations to be treated as a US person; or (iv) an estate that is subject to US federal income tax on its income regardless of its source; and |
| – | is not resident in the UK for UK tax purposes. |
The US federal income tax consequences to a partner in an entity or arrangement treated as a partnership for US federal income tax purposes that holds ordinary shares or ADSs generally will depend on the status of the partner and the activities of the partnership. Partners in a partnership holding any such equity interest should consult their own tax advisers.
Material US Federal Income Tax Consequences Relating to the Ownership and Disposition of Ordinary Shares or ADSs
The following is a discussion of the material US federal income tax consequences of the ownership and disposition by US holders of ordinary shares or ADSs. This discussion assumes that BAT is not, and will not become, a passive foreign investment company for US federal income tax purposes, as described below.
ADSs
A US holder of ADSs, for US federal income tax purposes, generally will be treated as the owner of the underlying ordinary shares that are represented by such ADSs. Accordingly, deposits or withdrawals of ordinary shares for or from ADSs will not be subject to US federal income tax.
Taxation of Dividends
The gross amount of distributions on the ordinary shares or ADSs will be taxable as dividends to the extent paid out of BAT’s current or accumulated earnings and profits, as determined under US federal income tax principles. Such income will be includable in a US holder’s gross income as ordinary income on the day actually or constructively received by the US holder. Such dividends will be treated as foreign source income and will not be eligible for the dividends received deduction allowed to corporations under the US Tax Code.
|
Strategic Report |
Governance Report | Financial Statements | Other Information | BAT Annual Report and Form 20-F 2020 | 323 | |||||
|
|
With respect to non-corporate US investors, certain dividends received from a qualified foreign corporation may be subject to reduced rates of taxation. A qualified foreign corporation includes a foreign corporation that is eligible for the benefits of a comprehensive income tax treaty with the United States that the Treasury determines to be satisfactory for these purposes and that includes an exchange of information provision. The Treasury has determined that the treaty between the United States and the United Kingdom meets these requirements, and BAT believes that it is eligible for the benefits of the treaty. However, non-corporate holders that do not meet a minimum holding period requirement during which they are not protected from the risk of loss or that elect to treat the dividend income as ‘investment income’ pursuant to Section 163(d)(4) of the US Tax Code will not be eligible for the reduced rates of taxation. In addition, the rate reduction will not apply to dividends if the recipient of a dividend is obligated to make related payments with respect to positions in substantially similar or related property. This disallowance applies even if the minimum holding period has been met. US holders should consult their own tax advisers regarding the application of these rules to their particular circumstances.
The amount of any dividend paid by BAT in £ sterling (including any such amount in respect of ADSs that is converted into US dollars by the depositary bank) will equal the US dollar value of the £ sterling actually or constructively received, calculated by reference to the exchange rate in effect on the date the dividend is so received by the US holder, regardless of whether the £ sterling are converted into US dollars. If the £ sterling received as a dividend are converted into US dollars on the date received, the US holder generally will not be required to recognise foreign currency exchange gain or loss in respect of the dividend income. If the £ sterling received as a dividend are not converted into US dollars on the date of receipt, the US holder will have a basis in £ sterling equal to their US dollar value on the date of receipt. Any gain or loss realised on a subsequent conversion or other disposition of £ sterling will be treated as US source ordinary income or loss. US holders of ADSs should consult their own tax advisers regarding the application of these rules to the amount of any dividend paid by BAT in £ sterling that is converted into US dollars by the depositary bank.
To the extent that the amount of any distribution exceeds BAT’s current and accumulated earnings and profits for a taxable year, as determined under US federal income tax principles, the distribution will first be treated as a tax-free return of capital, causing a reduction in the US holder’s adjusted basis of the ordinary shares or ADSs, and to the extent the amount of the distribution exceeds the US holder’s tax basis, the excess will be taxed as capital gain recognised on a sale or exchange, as described below. BAT does not expect to determine earnings and profits in accordance with US federal income tax principles. Therefore, notwithstanding the foregoing, US holders should expect that distributions generally will be reported as dividend income for US information reporting purposes.
Distributions by BAT of additional ordinary shares (which may be distributed by the depositary bank to a holder of ADSs in the form of ADSs) to a US holder that is made as part of a pro rata distribution to all holders of ordinary shares and ADSs in respect of their ordinary shares or ADSs, and for which there is no option to receive other property (not including ADSs), generally will not be subject to US federal income tax. The basis of any new ordinary shares (or ADSs representing new ordinary shares) so received will be determined by allocating the US holder’s basis in the previously held ordinary shares or ADSs between the previously held ordinary shares or ADSs and the new ordinary shares or ADSs, based on their relative fair market values on the date of distribution.
Passive foreign investment company
A passive foreign investment company (PFIC), is any foreign corporation if, after the application of certain ‘look-through’ rules: (1) at least 75% of its gross income is ‘passive income’ as that term is defined in the relevant provisions of the US Tax Code; or (2) at least 50% of the average value of its assets produce ‘passive income’ or are held for the production of ‘passive income.’ The determination as to PFIC status is made annually.
BAT does not believe that it is, for US federal income tax purposes, a PFIC, and BAT expects to operate in such a manner so as not to become a PFIC. If, however, BAT is or becomes a PFIC, US holders could be subject to additional US federal income taxes on gain recognised with respect to the ordinary shares or ADSs and on certain distributions, plus an interest charge on certain taxes treated as having been deferred under the PFIC rules. Non-corporate US holders will not be eligible for reduced rates of taxation on any dividends received from BAT if it is a PFIC in the taxable year in which such dividends are paid or in the preceding taxable year. BAT’s US counsel expresses no opinion with respect to BAT’s PFIC status.
Taxation of capital gains
Upon a sale, exchange or other taxable disposition of ordinary shares or ADSs, a US holder will generally recognise capital gain or loss for US federal income tax purposes in an amount equal to the difference between the US dollar value of the amount realised on the disposition and the US holder’s adjusted tax basis in the ordinary shares or ADSs as determined in US dollars. Such gain or loss generally will be US source gain or loss, and will be long-term capital gain or loss if the US holder has held the ordinary shares or ADSs for more than one year. Certain non-corporate US holders may be eligible for preferential rates of US federal income tax in respect of net long-term capital gains. The deductibility of capital losses is subject to limitations.
The amount realised on a sale, exchange or other taxable disposition of ordinary shares for an amount in foreign currency will be the US dollar value of that amount on the date of sale or disposition. On the settlement date, the US holder will recognise US source foreign currency exchange gain or loss (taxable as ordinary income or loss) equal to the difference (if any) between the US dollar value of the amount received based on the exchange rates in effect on the date of sale, exchange or other disposition and the settlement date. However, in the case of ordinary shares traded on an established securities market that are sold by a cash-basis US holder (or an accrual-basis US holder that so elects), the amount realised will be based on the exchange rate in effect on the settlement date for the sale, and no foreign currency exchange gain or loss will be recognised at that time.
A US holder’s tax basis in ordinary shares or ADSs will generally equal the US dollar cost of the ordinary shares or ADSs. The US dollar cost of ordinary shares purchased with foreign currency will generally be the US dollar value of the purchase price on the date of purchase, or the settlement date for the purchase in the case of ordinary shares traded on an established securities market that are purchased by a cash-basis US holder (or an accrual-basis US holder that so elects).
| 324 | BAT Annual Report and Form 20-F 2020 |
Other Information
Shareholder Taxation Information
Continued
Information with respect to foreign financial assets
Individuals and certain entities that own ‘specified foreign financial assets’ with an aggregate value in excess of US$50,000 are generally required to file information reports with respect to such assets with their US federal income tax returns. Depending on the individual’s circumstances, higher threshold amounts may apply. Specified foreign financial assets include any financial accounts maintained by foreign financial institutions, as well as any of the following, but only if they are not held in accounts maintained by financial institutions: (1) stocks and securities issued by non-US persons; (2) financial instruments and contracts held for investment that have non-US issuers or counterparties; and (3) interests in non-US entities. If a US holder is subject to this information reporting regime, the failure to file information reports may subject the US holder to penalties. US holders are urged to consult their own tax advisers regarding their obligations to file information reports with respect to ordinary shares or ADSs.
Medicare net investment tax
Certain persons who are individuals (other than non-resident aliens), estates or trusts are required to pay an additional 3.8% tax on the lesser of (1) their ‘net investment income’ (in the case of individuals) or ‘undistributed net investment income’ (in the case of estates and trusts) (which includes dividend income in respect of, and gain recognised on the disposition of, ordinary shares or ADSs) for the relevant taxable year; and (2) the excess of their modified adjusted gross income (in the case of individuals) or adjusted gross income (in the case of estates and trusts) for the taxable year over specified dollar amounts. US holders are urged to consult their tax advisers regarding the applicability of this provision to their ownership of ordinary shares or ADSs.
Credits or deductions for UK taxes
As indicated under ‘Material UK tax consequences’ below, dividends in respect of, and gains on the disposition of, ordinary shares or ADSs may be subject to UK taxation in certain circumstances. A US holder may be eligible to claim a credit or deduction in respect of UK taxes attributable to such income or gain for purposes of computing the US holder’s US federal income tax liability, subject to certain limitations. The US foreign tax credit rules are complex, and US holders should consult their own tax advisers regarding the availability of US foreign tax credits and the application of the US foreign tax credit rules to their particular situation.
Information reporting and backup withholding
Information reporting and backup withholding may apply to dividend payments and proceeds from the sale, exchange or other taxable disposition of ordinary shares or ADSs. Backup withholding will not apply, however, to a US holder that: (1) furnishes a correct taxpayer identification number (TIN), certifies that such holder is not subject to backup withholding on Internal Revenue Service Form W-9 (or appropriate successor form) and otherwise complies with all applicable requirements of the backup withholding rules; or (2) provides proof that such holder is otherwise exempt from backup withholding. Backup withholding is not an additional tax, and any amounts withheld under the backup withholding rules may be refunded or credited against a holder’s US federal income tax liability, if any, provided that such holder furnishes the required information to the Internal Revenue Service in a timely manner. The Internal Revenue Service may impose a penalty upon any taxpayer that fails to provide the correct TIN.
This summary of material US federal income tax consequences is not tax advice. The determination of the actual tax consequences for a US holder will depend on the US holder’s specific situation. US holders of ordinary shares or ADSs, in each case, should consult their own tax advisers as to the tax consequences of owning and disposing of ordinary shares or ADSs, including the applicability and effect of the alternative minimum tax and any state, local, foreign or other tax laws and of changes in those laws.
Material UK Tax Consequences
The following paragraphs summarise material aspects of the UK tax treatment of US holders of ordinary shares or ADSs and do not purport to be either a complete analysis of all tax considerations relating to holding ordinary shares or ADSs or an analysis of the tax position of BAT. They are based on current UK legislation and what is understood to be current HMRC practice, both of which are subject to change, possibly with retrospective effect.
The comments are intended as a general guide and (otherwise than where expressly stated to the contrary) apply only to US holders of ordinary shares or ADSs (other than under a personal equity plan or individual savings account) and who are the absolute beneficial owners of such shares. These comments do not deal with certain types of shareholders such as charities, dealers in securities, persons holding or acquiring shares in the course of a trade, persons who have or could be treated for tax purposes as having acquired their ordinary shares or ADSs by reason of their employment, collective investment schemes, persons subject to UK tax on the remittance basis and insurance companies. You are encouraged to consult an appropriate independent professional tax adviser with respect to your tax position.
Tax on chargeable gains as a result of disposals of ordinary shares or ADSs
Subject to the below, US holders will not generally be subject to UK tax on chargeable gains on a disposal of ordinary shares or ADSs provided that they do not carry on a trade, profession or vocation in the United Kingdom through a branch, agency or permanent establishment in connection with which the ordinary shares or ADSs are held.
A US holder who is an individual, who has ceased to be resident for tax purposes in the United Kingdom for a period of less than five years and who disposes of ordinary shares or ADSs during that period may be liable for UK tax on capital gains (in the absence of any available exemptions or reliefs). If applicable, the tax charge will arise in the tax year that the individual returns to the United Kingdom.
|
Strategic Report |
Governance Report | Financial Statements | Other Information | BAT Annual Report and Form 20-F 2020 | 325 | |||||
|
|
Tax on dividends
BAT is not required to withhold UK tax at source from dividends paid on ordinary shares or ADSs.
US holders will not generally be subject to UK tax on dividends received from BAT provided that they do not carry on a trade, profession or vocation in the United Kingdom through a branch, agency or permanent establishment in connection with which the ordinary shares or ADSs are held.
Stamp duty and stamp duty reserve tax (SDRT)
Based on current published HMRC practice and recent case law, transfers of ADSs should not be subject to SDRT or stamp duty provided that any instrument of transfer is executed and remains outside the UK. The transfer of an underlying ordinary share to the ADS holder in exchange for the cancellation of an ADS should also not give rise to a stamp duty or SDRT charge.
Transfers of ordinary shares outside of the depositary bank, including the repurchase of ordinary shares by BAT, will generally be subject to stamp duty or SDRT at the rate of 0.5% of the amount or value of the consideration given, except as described above in connection with the cancellation of an ADS. If ordinary shares are redeposited into a clearance service or depositary system, the redeposit will attract stamp duty or SDRT at the higher rate of 1.5%.
The purchaser or the transferee of the ordinary shares or ADSs will generally be responsible for paying any stamp duty or SDRT payable. Where stamp duty or SDRT is payable, it is payable regardless of the residence position of the purchaser.
Inheritance tax
A gift or settlement of ordinary shares or ADSs by, or on the death of, an individual shareholder may give rise to a liability to UK inheritance tax even if the shareholder is not a resident of, or domiciled in, the United Kingdom.
A charge to inheritance tax may arise in certain circumstances where ordinary shares or ADSs are held by close companies and trustees of settlements.
However, pursuant to the Estate and Gift Tax Treaty 1980 (the ‘Treaty’) entered into between the United Kingdom and the United States, a gift or settlement of ordinary shares or ADSs by shareholders who are domiciled in the United States for the purposes of the Treaty may be exempt from any liability to UK inheritance tax.
|
Strategic Report |
Governance Report | Financial Statements | Other Information | BAT Annual Report and Form 20-F 2020 | 327 | |||||
|
|
All shares held by the significant shareholders represent the Company’s ordinary shares. These significant shareholders have no special voting rights compared with other holders of the Company’s ordinary shares.
Additional Significant Shareholding Disclosure
»Capital Research Global Investors, a division of Capital Research and Management Company, filed with the SEC an amendment to Schedule 13G under the Exchange Act on 16 February 2021 disclosing that as of 31 December 2020 it beneficially owned 42,749,672 ordinary shares representing 1.9% of the Company’s ordinary shares outstanding as of 31 December 2020.
Capital International Investors, a division of Capital Research and Management Company, filed with the SEC a statement on Schedule 13G under the Exchange Act on 16 February 2021 disclosing that as of 31 December 2020 it beneficially owned 122,341,746 ordinary shares representing 5.3% of the Company’s ordinary shares outstanding as of 31 December 2020.»
Portfolio Services Ltd filed with the SEC a statement on Schedule 13G under the Exchange Act on 22 January 2021 disclosing that as of 31 December 2020 it » and Kenneth B. Dart, who is the beneficial owner of all of the outstanding shares of Portfolio Services Ltd.,» beneficially owned 114,819,555 ordinary shares representing 5.0% of the Company’s ordinary shares outstanding as of 31 December 2020.
BlackRock, Inc. filed with the SEC a statement on Schedule 13G under the Exchange Act on 29 January 2021 disclosing that as of 31 December 2020 it beneficially owned 178,392,857 ordinary shares representing 7.8% of the Company’s ordinary shares outstanding as of 31 December 2020.
BlackRock, Inc. filed with the SEC a statement on Schedule 13G under the Exchange Act on 7 February 2020 disclosing that as of 31 December 2019 it beneficially owned 170,313,722 ordinary shares representing 7.4% of the Company’s ordinary shares outstanding as of 31 December 2019.
Capital Research Global Investors, a division of Capital Research and Management Company, filed with the SEC an amendment to Schedule 13G under the Exchange Act on 14 February 2020 disclosing that as of 31 December 2019 it beneficially owned 120,959,021 ordinary shares representing 5.2% of the Company’s ordinary shares outstanding as of 31 December 2019. The notifications regarding the holdings by The Capital Group Companies, Inc., listed below, indicate that Capital Research and Management Company is part of a chain of controlled undertakings with The Capital Group Companies, Inc.
In accordance with the DTRs, shareholders must notify the Company if their shareholding reaches, exceeds or falls below 3% of total voting rights and each 1% threshold thereafter. The notifications received by the Company during the past three years to the best of the Company’s knowledge are set out below.
Reinet Investments S.C.A. notified the Company on 6 October 2017 that its interest had decreased below the notifiable threshold of 3% to 68,053,670 ordinary shares on 25 July 2017.
The Capital Group Companies, Inc. notified the Company on 15 March 2018 that its interest had increased above 10% to 229,777,471 ordinary shares on 14 March 2018.
The Capital Group Companies, Inc. notified the Company on 16 October 2018 that its interest had increased above 11% to 252,733,863 ordinary shares on 12 October 2018.
The Capital Group Companies, Inc. notified the Company on 14 January 2019 that its interest had decreased below 11% to 249,831,584 ordinary shares on 11 January 2019.
The Capital Group Companies, Inc. notified the Company on 8 March 2019 that its interest had increased above 11% to 253,390,697 ordinary shares on 7 March 2019.
The Capital Group Companies, Inc. notified the Company on 11 April 2019 that its interest had decreased below 11% to 252,158,534 ordinary shares on 10 April 2019.
The Capital Group Companies, Inc. notified the Company on 15 April 2019 that its interest had increased above 11% to 252,776,216 ordinary shares on 11 April 2019.
The Capital Group Companies, Inc. notified the Company on 16 April 2019 that its interest had decreased below 11% to 251,780,072 ordinary shares on 15 April 2019.
The Capital Group Companies, Inc. notified the Company on 19 November 2019 that its interest had increased above 11% to 253,543,406 ordinary shares on 18 November 2019.
The Capital Group Companies, Inc. notified the Company on 6 January 2020 that its interest had increased above 12% to 275,376,579 ordinary shares on 3 January 2020.
To the extent known by BAT, BAT is not directly or indirectly owned or controlled by another corporation, any foreign government or by any other natural or legal person, severally or jointly. BAT is not aware of any arrangements, the operation of which may at a subsequent date result in a change of control of the Group.
Security Ownership of the Board of Directors and the Management Board
The following table presents information regarding the total amount of ordinary shares beneficially owned (outright, by their family or by connected persons) by each current Director of BAT, each member of the Management Board and all Directors and the Management Board as a group, as of 16 February 2021. Unless otherwise indicated, the address for each Director and member of the Management Board listed is: c/o British American Tobacco p.l.c., Globe House, 4 Temple Place, London, WC2R 2PG, United Kingdom. The address for Michael Dijanosic is Level 30, Three Pacific Place, 1 Queen’s Road East, Hong Kong. The address for Guy Meldrum is 401 North Main Street, Winston-Salem, NC 27101, United States of America.
| Number of Ordinary Shares | Percentage of Class | 10 | ||||||
| Directors |
||||||||
| Richard Burrows |
19,000 | 0.0008 | ||||||
| Jack Bowles1,2,3 |
217,518 | 0.0094 | ||||||
| Tadeu Marroco1,2,3 |
54,360 | 0.0023 | ||||||
| Sue Farr |
– | – | ||||||
| Jerry Fowden4 |
10,000 | 0.0004 | ||||||
| Karen Guerra |
2,478 | 0.0001 | ||||||
| Dr Marion Helmes |
4,500 | 0.0002 | ||||||
| Luc Jobin4 |
45,236 | 0.0020 | ||||||
| Holly Keller Koeppel4,5 |
8,416 | 0.0004 | ||||||
| Savio Kwan |
7,455 | 0.0003 | ||||||
| Dimitri Panayotopoulos |
3,300 | 0.0001 | ||||||
| Darrell Thomas |
2,000 | 0.0000 | ||||||
| 328 | BAT Annual Report and Form 20-F 2020 |
Other Information
Share Capital and Security Ownership
Continued
| Number of Ordinary Shares | Percentage of Class | 10 | ||||||
| Management Board |
||||||||
| Jerome Abelman6,7,8 |
76,660 | 0.0033 | ||||||
| Marina Bellini6 |
2,336 | 0.0001 | ||||||
| Luciano Comin6,7,8 |
23,961 | 0.0010 | ||||||
| Michael Dijanosic ,7,8 |
21,403 | 0.0009 | ||||||
| Zafar Khan6,7,8 |
232 | 0.0000 | ||||||
| Hae In Kim6,7,8 |
13,621 | 0.0006 | ||||||
| Paul Lageweg6,7,8,9 |
112,362 | 0.0049 | ||||||
| Guy Meldrum6,7,8 |
18,643 | 0.0008 | ||||||
| David O’Reilly6,7,8 |
63,171 | 0.0027 | ||||||
| Johan Vandermeulen6,7,8 |
60,265 | 0.0026 | ||||||
| Kingsley Wheaton6,7,8 |
46,847 | 0.0020 | ||||||
| All Directors and Management Board as a group (23 persons) |
813,753 | 0.0355 | ||||||
Notes:
| 1. | The number of ordinary shares beneficially owned by the Executive Directors include ordinary shares awarded and required to be held for a period of at least three years in a UK-based trust under the SIP. Ordinary shares cannot be sold or transferred out of the trust until the end of the three-year holding period. The amounts next to the corresponding Executive Director include the following ordinary shares held in the trust under the SIP: (a) 685 ordinary shares for Mr Bowles, of which 421 have been held for less than three years; (b) 1,114 ordinary shares for Mr Marroco, of which 642 have been held for less than three years. In all cases, the beneficial owner of ordinary shares under the SIP may direct the trust to exercise its voting rights in accordance with his instructions. See footnote (5) to the table below under the heading ‘Outstanding Share-based Awards and Options-based Awards of the Board of Directors and the Management Board’ for additional details regarding the SIP and the ordinary shares held thereunder. |
| 2. | The number of ordinary shares beneficially owned by the Executive Directors include the following number of options granted under the LTIP that are scheduled to vest and may be exercised within 60 days of 16 February 2021: (a) 43,785 options under the LTIP for Mr Bowles; and (b) 28,248 options under the LTIP for Mr Marroco. Each option is convertible into one ordinary share upon exercise. See footnote (1) to the table below under the heading ‘Outstanding Share-based Awards and Options-based Awards of the Board of Directors and the Management Board’ for additional details regarding the LTIP. |
| 3. | The number of ordinary shares beneficially owned by the Executive Directors include the following number of awards of restricted ordinary shares granted under the DSBS that are scheduled to vest within 60 days of 16 Feburary 2021: (a) 12,064 ordinary shares for Mr Bowles; (b) 7,783 ordinary shares for Mr Marroco. Until awards of ordinary shares under the DSBS vest, they are held in trust and the recipient of such award does not have the ability to transfer, sell or direct the voting of the applicable ordinary shares. See footnote (4) to the table below under the heading ‘Outstanding Share-based Awards and Options-based Awards of the Board of Directors and the Management Board’ for additional details regarding the DSBS. |
| 4. | The ordinary shares beneficially owned by Mr Fowden, Mr Jobin, Ms Koeppel and Mr Thomas are represented by ADSs, each of which represents one ordinary share. |
| 5. | Ms Koeppel, being a former director of Reynolds American Inc. and a participant in the Deferred Compensation Plan for Directors of Reynolds American Inc. (DCP), holds DSUs which were granted prior to becoming a Director of BAT. Each DSU entitles the holder to receive a cash payment upon ceasing to be a Director equal to the value of one BAT ADS. The number of DSUs increases on each dividend date by reference to the value of dividends declared on the ADSs underlying the DSUs. Ms Koeppel currently holds 25,125.91 DSUs. |
| 6. | The number of ordinary shares beneficially owned by the members of the Management Board include ordinary shares awarded and required to be held for a period of at least three years in a UK-based trust under the SIP. Ordinary shares cannot be sold or transferred out of the trust until the end of the three-year holding period. The amounts next to the corresponding Management Board member include the following ordinary shares held in the trust under the SIP: (a) 954 ordinary shares for Mr Abelman, of which 438 have been held for less than three years; (b) 366 ordinary shares for Ms Bellini, of which 247 have been held for less than three years; (c) 975 ordinary shares for Mr Comin, of which 442 have been held for less than three years; (d) 112 ordinary shares for Mr Khan, all of which have been held for less than three years; (e) 343 ordinary shares for Ms Kim, all of which have been held for less than three years; (f) 338 ordinary shares for Mr Lageweg, all of which have been held for less than three years; (g) 307 ordinary shares for Mr Meldrum, all of which have been held for less than three years; (h) 2,282 ordinary shares for Dr O’Reilly, of which 652 have been held for less than three years; (i) 923 ordinary shares for Mr Vandermeulen, of which 432 have been held for less than three years; and (j) 1,115 ordinary shares for Mr Wheaton, of which 484 have been held for less than three years. In all cases, the beneficial owner of ordinary shares under the SIP may direct the trust to exercise its voting rights in accordance with their instructions. See footnote (5) to the table below under the heading ‘Outstanding Share-based Awards and Options-based Awards of the Board of Directors and the Management Board’ for additional details regarding the SIP and the ordinary shares held thereunder. |
| 7. | The number of ordinary shares beneficially owned by the members of the Management Board include the following number of options granted under the LTIP that are scheduled to vest and may be exercised within 60 days of 16 February 2021: (a) 32,100 options under the LTIP for Mr Abelman; (b) 10,313 options under the LTIP for Mr Comin; (c) 6,158 options under the LTIP for Mr Khan; (d) 6,497 options under the LTIP for Ms Kim; (e) 11,471 options under the LTIP for Mr Lageweg; (f) 11,066 options under the LTIP for Mr Meldrum; (g) 24,364 options under the LTIP for Mr O’Reilly; (h) 6,673 options under the LTIP for Mr Dijanosic; (i) 30,335 options under the LTIP for Mr Vandermeulen; (j) 32,100 options under the LTIP for Mr Wheaton. Each option is convertible into one ordinary share upon exercise. See footnote (1) to the table below under the heading ‘Outstanding Share-based Awards and Options-based Awards of the Board of Directors and the Management Board’ for additional details regarding the LTIP. |
| 8. | The number of ordinary shares beneficially owned by the members of the Management Board include the following number of awards of restricted ordinary shares granted under the DSBS that are scheduled to vest within 60 days of 16 February 2021: (a) 8,844 ordinary shares for Mr Abelman; (b) 3,464 ordinary shares for Mr Comin; (c) 2,026 ordinary shares for Mr Khan; (d) 1,863 ordinary shares for Ms Kim; (e) 2,039 ordinary shares for Mr Lageweg; (f) 3,796 ordinary shares for Mr Meldrum; (g) 6,713 ordinary shares for Dr O’Reilly; (h) 2,259 ordinary shares for Mr Dijanosic; (i) 8,358 ordinary shares for Mr Vandermeulen; and (j) 8,358 ordinary shares for Mr Wheaton. Until awards of ordinary shares under the DSBS vest, they are held in trust and the recipient of such award does not have the ability to transfer, sell or direct the voting of the applicable ordinary shares. See footnote (4) to the table below under the heading ‘Outstanding Share-based Awards and Options-based Awards of the Board of Directors and the Management Board’ for additional details regarding the DSBS. |
| 9. | The number of ordinary shares beneficially owned by Mr Lageweg includes 98,416 ADSs, each of which represents one ordinary share. |
| 10. | The information in this column is based on 2,294,246,104 ordinary shares outstanding (excluding treasury shares) as of 15 February 2021. Any securities not outstanding subject to options, warrants, rights or conversion privileges that give the beneficial owner the right to acquire the securities within 60 days are deemed to be outstanding for the purpose of computing the percentage of outstanding securities of the class owned by such person but are not deemed to be outstanding for the purpose of computing the percentage of the class by any other person. |
|
Strategic Report |
Governance Report | Financial Statements | Other Information | BAT Annual Report and Form 20-F 2020 | 329 | |||||
|
|
Outstanding Share-Based Awards and Options-Based Awards of the Board of Directors and the Management Board
The following table presents information regarding the options and the restricted share awards held by the Directors and the Management Board as of 16 February 2021. The following Directors (being the Chairman and the Non-Executive Directors) have not been granted share-based Awards or Options-based Awards over ordinary shares: Mr Burrows, Ms Farr, Mr Fowden, Ms Guerra, Dr Helmes, Mr Jobin, Ms Koeppel, Mr Kwan, Mr Panayotopoulos and Mr Thomas.
| Number of Options Held |
Date of Grant/Award |
Options Exercise Price £ |
Market
Price £ |
Number of Shares Awarded |
Exercisable (LTIP/Sharesave) Vesting (DSBS/SIP) |
|||||||||||||||||||
| Directors |
| |||||||||||||||||||||||
| Jack Bowles |
| |||||||||||||||||||||||
| LTIP1 |
43,785 | 26 Mar 2018 | 0.00 | 38.94 | – | 26 Mar 2021 – 25 Mar 2028 | ||||||||||||||||||
| 176,532 | 28 Mar 2019 | 0.00 | 33.28 | – | 28 Mar 2022 – 27 Mar 2029 | |||||||||||||||||||
| 223,129 | 30 Mar 2020 | 0.00 | 26.33 | – | 30 Mar 2023 – 29 Mar 2030 | |||||||||||||||||||
| Total Options3 |
238,814 | |||||||||||||||||||||||
| DSBS4 |
– | 26 Mar 2018 | – | – | 12,064 | 26 Mar 2021 | ||||||||||||||||||
| – | 28 Mar 2019 | – | – | 26,192 | 28 Mar 2022 | |||||||||||||||||||
| – | 30 Mar 2020 | – | – | 53,618 | 30 Mar 2023 | |||||||||||||||||||
| SIP5 |
– | 3 Apr 2018 | – | – | 70 | 3 Apr 2021 | ||||||||||||||||||
| – | 9 May 2018 | – | – | 3 | 9 May 2021 | |||||||||||||||||||
| – | 8 Aug 2018 | – | – | 4 | 8 Aug 2021 | |||||||||||||||||||
| – | 15 Nov 2018 | – | – | 6 | 15 Nov 2021 | |||||||||||||||||||
| – | 7 Feb 2019 | – | – | 7 | 7 Feb 2022 | |||||||||||||||||||
| – | 1 Apr 2019 | – | – | 112 | 1 Apr 2022 | |||||||||||||||||||
| – | 8 May 2019 | – | – | 6 | 8 May 2022 | |||||||||||||||||||
| – | 8 Aug 2019 | – | – | 8 | 8 Aug 2022 | |||||||||||||||||||
| – | 14 Nov 2019 | – | – | 9 | 14 Nov 2022 | |||||||||||||||||||
| – | 6 Feb 2020 | – | – | 7 | 6 Feb 2023 | |||||||||||||||||||
| – | 1 Apr 2020 | – | – | 125 | 1 Apr 2023 | |||||||||||||||||||
| – | 13 May 2020 | – | – | 9 | 13 May 2023 | |||||||||||||||||||
| – | 19 Aug 2020 | – | – | 13 | 19 Aug 2023 | |||||||||||||||||||
| – | 12 Nov 2020 | – | – | 12 | 12 Nov 2023 | |||||||||||||||||||
| – | 5 Feb 2021 | – | – | 13 | 5 Feb 2024 | |||||||||||||||||||
| Total Restricted Share Awards6 |
92,278 | |||||||||||||||||||||||
| 330 | BAT Annual Report and Form 20-F 2020 |
Other Information
Share Capital and Security Ownership
Continued
| Number of Options Held |
Date of Grant/Award |
Options Exercise Price £ |
Market
Price £ |
Number of Shares Awarded |
Exercisable (LTIP/Sharesave) Vesting (DSBS/SIP) |
|||||||||||||||||||
|
Tadeu Marroco |
| |||||||||||||||||||||||
| LTIP1 |
28,248 | 26 Mar 2018 | 0.00 | 38.94 | – | 26 Mar 2021 – 25 Mar 2028 | ||||||||||||||||||
| 36,057 | 28 Mar 2019 | 0.00 | 33.28 | – | 28 Mar 2022 – 27 Mar 2029 | |||||||||||||||||||
| 113,938 | 30 Mar 2020 | 0.00 | 26.33 | – | 30 Mar 2023 – 29 Mar 2030 | |||||||||||||||||||
|
Sharesave2 |
266 | 28 Mar 2018 | 33.76 | 42.20 | – | 1 May 2021 – 31 Oct 2021 | ||||||||||||||||||
| 624 | 30 Mar 2020 | 24.01 | 26.35 | – | 1 May 2025 – 31 Oct 2025 | |||||||||||||||||||
| Total Options3 |
179,133 | |||||||||||||||||||||||
| DSBS4 |
– | 26 Mar 2018 | – | – | 7,783 | 26 Mar 2021 | ||||||||||||||||||
| – | 28 Mar 2019 | – | – | 13,233 | 28 Mar 2022 | |||||||||||||||||||
| – | 30 Mar 2020 | – | – | 24,388 | 30 Mar 2023 | |||||||||||||||||||
| SIP5 |
– | 3 Apr 2018 | – | – | 70 | 3 Apr 2021 | ||||||||||||||||||
| – | 9 May 2018 | – | – | 6 | 9 May 2021 | |||||||||||||||||||
| – | 8 Aug 2018 | – | – | 7 | 8 Aug 2021 | |||||||||||||||||||
| – | 15 Nov 2018 | – | – | 10 | 15 Nov 2021 | |||||||||||||||||||
| – | 7 Feb 2019 | – | – | 11 | 7 Feb 2022 | |||||||||||||||||||
| – | 1 Apr 2019 | – | – | 112 | 1 Apr 2022 | |||||||||||||||||||
| – | 8 May 2019 | – | – | 11 | 8 May 2022 | |||||||||||||||||||
| – | 8 Aug 2019 | – | – | 13 | 8 Aug 2022 | |||||||||||||||||||
| – | 14 Nov 2019 | – | – | 14 | 14 Nov 2022 | |||||||||||||||||||
| – | 6 Feb 2020 | – | – | 12 | 6 Feb 2023 | |||||||||||||||||||
| – | 1 Apr 2020 | – | – | 125 | 1 Apr 2023 | |||||||||||||||||||
| – | 13 May 2020 | – | – | 14 | 13 May 2023 | |||||||||||||||||||
| – | 19 Aug 2020 | – | – | 21 | 19 Aug 2023 | |||||||||||||||||||
| – | 12 Nov 2020 | – | – | 20 | 12 Nov 2023 | |||||||||||||||||||
| – | 5 Feb 2021 | – | – | 21 | 5 Feb 2024 | |||||||||||||||||||
| Total Restricted Share Awards6 |
45,871 | |||||||||||||||||||||||
|
Strategic Report |
Governance Report | Financial Statements | Other Information | BAT Annual Report and Form 20-F 2020 | 331 | |||||
|
|
| Number of Options Held |
Date of Grant/Award |
Options Exercise Price £ |
Market
Price £ |
Number of Shares Awarded |
Exercisable (LTIP/Sharesave) Vesting (DSBS/SIP) |
|||||||||||||||||||
|
Management Board |
| |||||||||||||||||||||||
|
Jerome Abelman |
| |||||||||||||||||||||||
| LTIP1 |
32,100 | 26 Mar 2018 | 0.00 | 38.94 | – | 26 Mar 2021 – 25 Mar 2028 | ||||||||||||||||||
| 37,560 | 28 Mar 2019 | 0.00 | 33.28 | – | 28 Mar 2022 – 27 Mar 2029 | |||||||||||||||||||
| 40,676 | 30 Mar 2020 | 0.00 | 26.33 | – | 30 Mar 2023 – 29 Mar 2030 | |||||||||||||||||||
| Restricted Share Plan7 |
10,653 | 30 Mar 2020 | 0.00 | 26.33 | – | 30 Mar 2023 | ||||||||||||||||||
| Total Options3 |
120,989 | |||||||||||||||||||||||
| DSBS4 |
– | 26 Mar 2018 | – | – | 8,844 | 26 Mar 2021 | ||||||||||||||||||
| – | 28 Mar 2019 | – | – | 13,785 | 28 Mar 2022 | |||||||||||||||||||
| – | 30 Mar 2020 | – | – | 15,824 | 30 Mar 2023 | |||||||||||||||||||
| SIP5 |
– | 3 Apr 2018 | – | – | 70 | 3 Apr 2021 | ||||||||||||||||||
| – | 9 May 2018 | – | – | 4 | 9 May 2021 | |||||||||||||||||||
| – | 8 Aug 2018 | – | – | 5 | 8 Aug 2021 | |||||||||||||||||||
| – | 15 Nov 2018 | – | – | 8 | 15 Nov 2021 | |||||||||||||||||||
| – | 7 Feb 2019 | – | – | 9 | 7 Feb 2022 | |||||||||||||||||||
| – | 1 Apr 2019 | – | – | 112 | 1 Apr 2022 | |||||||||||||||||||
| – | 8 May 2019 | – | – | 9 | 8 May 2022 | |||||||||||||||||||
| – | 8 Aug 2019 | – | – | 10 | 8 Aug 2022 | |||||||||||||||||||
| – | 14 Nov 2019 | – | – | 11 | 14 Nov 2022 | |||||||||||||||||||
| – | 6 Feb 2020 | – | – | 10 | 6 Feb 2023 | |||||||||||||||||||
| – | 1 Apr 2020 | – | – | 125 | 1 Apr 2023 | |||||||||||||||||||
| – | 13 May 2020 | – | – | 12 | 13 May 2023 | |||||||||||||||||||
| – | 19 Aug 2020 | – | – | 18 | 19 Aug 2023 | |||||||||||||||||||
| – | 12 Nov 2020 | – | – | 17 | 12 Nov 2023 | |||||||||||||||||||
| – | 5 Feb 2021 | – | – | 18 | 5 Feb 2024 | |||||||||||||||||||
| Total Restricted Share Awards6 |
38,891 | |||||||||||||||||||||||
| Marina Bellini |
| |||||||||||||||||||||||
| LTIP1 |
29,296 | 28 Mar 2019 | 0.00 | 33.28 | – | 28 Mar 2022 – 27 Mar 2029 | ||||||||||||||||||
| 31,105 | 30 Mar 2020 | 0.00 | 26.33 | – | 30 Mar 2023 – 29 Mar 2030 | |||||||||||||||||||
| Restricted Share Plan7 |
8,146 | 30 Mar 2020 | 0.00 | 26.33 | – | 30 Mar 2023 | ||||||||||||||||||
| Sharesave2 |
785 | 28 Mar 2019 | 22.91 | 28.63 | – | 1 May 2022 – 31 Oct 2022 | ||||||||||||||||||
| Total Options3 |
69,332 | |||||||||||||||||||||||
| DSBS4 |
– | 28 Mar 2019 | – | – | 5,525 | 28 Mar 2022 | ||||||||||||||||||
| – | 30 Mar 2020 | – | – | 12,101 | 30 Mar 2023 | |||||||||||||||||||
| SIP5 |
– | 1 Apr 2019 | – | – | 99 | 1 Apr 2022 | ||||||||||||||||||
| – | 8 Aug 2019 | – | – | 1 | 8 Aug 2022 | |||||||||||||||||||
| – | 14 Nov 2019 | – | – | 3 | 14 Nov 2022 | |||||||||||||||||||
| – | 6 Feb 2020 | – | – | 2 | 6 Feb 2023 | |||||||||||||||||||
| – | 1 Apr 2020 | – | – | 125 | 1 Apr 2023 | |||||||||||||||||||
| – | 13 May 2020 | – | – | 2 | 13 May 2023 | |||||||||||||||||||
| – | 19 Aug 2020 | – | – | 7 | 19 Aug 2023 | |||||||||||||||||||
| – | 12 Nov 2020 | – | – | 6 | 12 Nov 2023 | |||||||||||||||||||
| – | 5 Feb 2021 | – | – | 2 | 5 Feb 2024 | |||||||||||||||||||
| Total Restricted Share Awards6 |
17,873 | |||||||||||||||||||||||
| 332 | BAT Annual Report and Form 20-F 2020 |
Other Information
Share Capital and Security Ownership
Continued
| Number of Options Held |
Date of Grant/Award |
Options Exercise Price £ |
Market
Price £ |
Number of Shares Awarded |
Exercisable (LTIP/Sharesave) Vesting (DSBS/SIP) |
|||||||||||||||||||
| Luciano Comin |
| |||||||||||||||||||||||
| LTIP1 |
10,313 | 26 Mar 2018 | 0.00 | 38.94 | – | 26 Mar 2021 – 25 Mar 2028 | ||||||||||||||||||
| 31,550 | 28 Mar 2019 | 0.00 | 33.28 | – | 28 Mar 2022 – 27 Mar 2029 | |||||||||||||||||||
| 33,497 | 30 Mar 2020 | 0.00 | 26.33 | – | 30 Mar 2023 – 29 Mar 2030 | |||||||||||||||||||
| Restricted Share Plan7 |
8,773 | 30 Mar 2020 | 0.00 | 26.33 | – | 30 Mar 2023 | ||||||||||||||||||
| Sharesave2 |
533 | 28 Mar 2018 | 33.76 | 42.20 | – | 1 May 2021 – 31 Oct 2021 | ||||||||||||||||||
| Total Options3 |
84,666 | |||||||||||||||||||||||
| DSBS4 |
– | 26 Mar 2018 | – | – | 3,464 | 26 Mar 2021 | ||||||||||||||||||
| – | 28 Mar 2019 | – | – | 5,084 | 28 Mar 2022 | |||||||||||||||||||
| – | 30 Mar 2020 | – | – | 13,032 | 30 Mar 2023 | |||||||||||||||||||
| SIP5 |
– | 3 Apr 2018 | – | – | 70 | 3 Apr 2021 | ||||||||||||||||||
| – | 9 May 2018 | – | – | 5 | 9 May 2021 | |||||||||||||||||||
| – | 8 Aug 2018 | – | – | 5 | 8 Aug 2021 | |||||||||||||||||||
| – | 15 Nov 2018 | – | – | 9 | 15 Nov 2021 | |||||||||||||||||||
| – | 7 Feb 2019 | – | – | 8 | 7 Feb 2022 | |||||||||||||||||||
| – | 1 Apr 2019 | – | – | 112 | 1 Apr 2022 | |||||||||||||||||||
| – | 8 May 2019 | – | – | 9 | 8 May 2022 | |||||||||||||||||||
| – | 8 Aug 2019 | – | – | 11 | 8 Aug 2022 | |||||||||||||||||||
| – | 14 Nov 2019 | – | – | 12 | 14 Nov 2022 | |||||||||||||||||||
| – | 6 Feb 2020 | – | – | 10 | 6 Feb 2023 | |||||||||||||||||||
| – | 1 Apr 2020 | – | – | 125 | 1 Apr 2023 | |||||||||||||||||||
| – | 13 May 2020 | – | – | 13 | 13 May 2023 | |||||||||||||||||||
| – | 19 Aug 2020 | – | – | 18 | 19 Aug 2023 | |||||||||||||||||||
| – | 12 Nov 2020 | – | – | 17 | 12 Nov 2023 | |||||||||||||||||||
| – | 5 Feb 2021 | – | – | 18 | 5 Feb 2024 | |||||||||||||||||||
| Total Restricted Share Awards6 |
22,022 | |||||||||||||||||||||||
| Michael Dijanosic |
| |||||||||||||||||||||||
| LTIP1 |
6,673 | 26 Mar 2018 | 0.00 | 38.94 | – | 26 Mar 2021 – 25 Mar 2028 | ||||||||||||||||||
| 8,299 | 28 Mar 2019 | 0.00 | 33.28 | – | 28 Mar 2022 – 27 Mar 2029 | |||||||||||||||||||
| 7,739 | 30 Mar 2020 | 0.00 | 26.33 | – | 30 Mar 2023 – 29 Mar 2030 | |||||||||||||||||||
| Restricted Share Plan7 |
2,149 | 30 Mar 2020 | 0.00 | 26.33 | – | 30 Mar 2023 | ||||||||||||||||||
| Total Options3 |
24,860 | |||||||||||||||||||||||
| DSBS4 |
– | 26 Mar 2018 | – | – | 2,259 | 26 Mar 2021 | ||||||||||||||||||
| – | 28 Mar 2019 | – | – | 2,827 | 28 Mar 2022 | |||||||||||||||||||
| – | 30 Mar 2020 | – | – | 2,746 | 30 Mar 2023 | |||||||||||||||||||
| Total Restricted Share Awards6 |
7,832 | |||||||||||||||||||||||
|
Strategic Report |
Governance Report | Financial Statements | Other Information | BAT Annual Report and Form 20-F 2020 | 333 | |||||
|
|
| Number of Options Held |
Date of Grant/Award |
Options Exercise Price £ |
Market
Price £ |
Number of Shares Awarded |
Exercisable (LTIP/Sharesave) Vesting (DSBS/SIP) |
|||||||||||||||||||
| Zafar Khan |
| |||||||||||||||||||||||
| LTIP1 |
6,158 | 26 Mar 2018 | 0.00 | 38.94 | – | 26 Mar 2021 – 25 Mar 2028 | ||||||||||||||||||
| 8,862 | 28 Mar 2019 | 0.00 | 33.28 | – | 28 Mar 2022 – 27 Mar 2029 | |||||||||||||||||||
| 8,855 | 30 Mar 2020 | 0.00 | 26.33 | – | 30 Mar 2023 – 29 Mar 2030 | |||||||||||||||||||
| Restricted Share Plan7 |
2,459 | 30 Mar 2020 | 0.00 | 26.33 | – | 30 Mar 2023 | ||||||||||||||||||
| Total Options3 |
26,334 | |||||||||||||||||||||||
| DSBS4 |
– | 26 Mar 2018 | – | – | 2,026 | 26 Mar 2021 | ||||||||||||||||||
| – | 28 Mar 2019 | – | – | 2,981 | 28 Mar 2022 | |||||||||||||||||||
| – | 30 Mar 2020 | – | – | 3,062 | 30 Mar 2023 | |||||||||||||||||||
| SIP5 |
– | 1 Apr 2019 | – | – | 112 | 1 Apr 2022 | ||||||||||||||||||
| Total Restricted Share Awards6 |
8,181 | |||||||||||||||||||||||
| Hae In Kim |
| |||||||||||||||||||||||
| LTIP1 |
6,497 | 26 Mar 2018 | 0.00 | 38.94 | – | 26 Mar 2021 – 25 Mar 2028 | ||||||||||||||||||
| 30,048 | 28 Mar 2019 | 0.00 | 33.28 | – | 28 Mar 2022 – 27 Mar 2029 | |||||||||||||||||||
| 31,902 | 30 Mar 2020 | 0.00 | 26.33 | – | 30 Mar 2023 – 29 Mar 2030 | |||||||||||||||||||
| Restricted Share Plan7 |
8,355 | 30 Mar 2020 | 0.00 | 26.33 | – | 30 Mar 2023 | ||||||||||||||||||
| Sharesave2 |
533 | 28 Mar 2018 | 33.76 | 42.20 | – | 1 May 2021 – 31 Oct 2021 | ||||||||||||||||||
| Total Options3 |
76,335 | |||||||||||||||||||||||
| DSBS4 |
– | 26 Mar 2018 | – | – | 1,863 | 26 Mar 2021 | ||||||||||||||||||
| – | 28 Mar 2019 | – | – | 3,798 | 28 Mar 2022 | |||||||||||||||||||
| – | 30 Mar 2020 | – | – | 12,411 | 30 Mar 2023 | |||||||||||||||||||
| SIP5 |
– | 3 Apr 2018 | – | – | 70 | 3 Apr 2021 | ||||||||||||||||||
| – | 15 Nov 2018 | – | – | 2 | 15 Nov 2021 | |||||||||||||||||||
| – | 7 Feb 2019 | – | – | 1 | 7 Feb 2022 | |||||||||||||||||||
| – | 1 Apr 2019 | – | – | 112 | 1 Apr 2022 | |||||||||||||||||||
| – | 8 May 2019 | – | – | 1 | 8 May 2022 | |||||||||||||||||||
| – | 8 Aug 2019 | – | – | 3 | 8 Aug 2022 | |||||||||||||||||||
| – | 14 Nov 2019 | – | – | 4 | 14 Nov 2022 | |||||||||||||||||||
| – | 6 Feb 2020 | – | – | 3 | 6 Feb 2023 | |||||||||||||||||||
| – | 1 Apr 2020 | – | – | 125 | 1 Apr 2023 | |||||||||||||||||||
| – | 13 May 2020 | – | – | 3 | 13 May 2023 | |||||||||||||||||||
| – | 19 Aug 2020 | – | – | 7 | 19 Aug 2023 | |||||||||||||||||||
| – | 12 Nov 2020 | – | – | 6 | 12 Nov 2023 | |||||||||||||||||||
| – | 5 Feb 2021 | – | – | 6 | 5 Feb 2024 | |||||||||||||||||||
| Total Restricted Share Awards6 |
18,415 | |||||||||||||||||||||||
| 334 | BAT Annual Report and Form 20-F 2020 |
Other Information
Share Capital and Security Ownership
Continued
| Number of Options Held |
Date of Grant/Award |
Options Exercise Price £ |
Market
Price £ |
Number of Shares Awarded |
Exercisable (LTIP/Sharesave) Vesting (DSBS/SIP) |
|||||||||||||||||||
| Paul Lageweg |
| |||||||||||||||||||||||
| LTIP1 |
4,540 | 28 Mar 2014 | 0.00 | 32.58 | – | 28 Mar 2017 – 27 Mar 2024 | ||||||||||||||||||
| 8,954 | 27 Mar 2015 | 0.00 | 36.25 | – | 27 Mar 2018 – 26 Mar 2025 | |||||||||||||||||||
| 5,956 | 12 May 2016 | 0.00 | 42.34 | – | 12 May 2019 – 11 May 2026 | |||||||||||||||||||
| 8,234 | 27 Mar 2017 | 0.00 | 52.11 | – | 27 Mar 2020 – 26 Mar 2027 | |||||||||||||||||||
| 11,471 | 26 Mar 2018 | 0.00 | 38.94 | – | 26 Mar 2021 – 25 Mar 2028 | |||||||||||||||||||
| 29,296 | 28 Mar 2019 | 0.00 | 33.28 | – | 28 Mar 2022 – 27 Mar 2029 | |||||||||||||||||||
| 31,105 | 30 Mar 2020 | 0.00 | 26.33 | – | 30 Mar 2023 – 29 Mar 2030 | |||||||||||||||||||
| Restricted Share Plan7 |
8,146 | 30 Mar 2020 | 0.00 | 26.33 | – | 30 Mar 2023 | ||||||||||||||||||
| Sharesave2 |
1,309 | 28 Mar 2019 | 22.91 | 28.63 | – | 1 May 2024 – 31 Oct 2024 | ||||||||||||||||||
| Total Options3 |
109,011 | |||||||||||||||||||||||
| DSBS4 |
– | 26 Mar 2018 | – | – | 2,039 | 26 Mar 2021 | ||||||||||||||||||
| – | 28 Mar 2019 | – | – | 5,265 | 28 Mar 2022 | |||||||||||||||||||
| – | 30 Mar 2020 | – | – | 12,101 | 30 Mar 2023 | |||||||||||||||||||
| SIP5 |
– | 3 Apr 2018 | – | – | 70 | 3 Apr 2021 | ||||||||||||||||||
| – | 9 May 2018 | – | – | 1 | 9 May 2021 | |||||||||||||||||||
| – | 15 Nov 2018 | – | – | 1 | 15 Nov 2021 | |||||||||||||||||||
| – | 7 Feb 2019 | – | – | 1 | 7 Feb 2022 | |||||||||||||||||||
| – | 1 Apr 2019 | – | – | 112 | 1 Apr 2022 | |||||||||||||||||||
| – | 8 May 2019 | – | – | 1 | 8 May 2022 | |||||||||||||||||||
| – | 8 Aug 2019 | – | – | 2 | 8 Aug 2022 | |||||||||||||||||||
| – | 14 Nov 2019 | – | – | 3 | 14 Nov 2022 | |||||||||||||||||||
| – | 6 Feb 2020 | – | – | 2 | 6 Feb 2023 | |||||||||||||||||||
| – | 1 Apr 2020 | – | – | 125 | 1 Apr 2023 | |||||||||||||||||||
| – | 13 May 2020 | – | – | 3 | 13 May 2023 | |||||||||||||||||||
| – | 19 Aug 2020 | – | – | 6 | 19 Aug 2023 | |||||||||||||||||||
| – | 12 Nov 2020 | – | – | 5 | 12 Nov 2023 | |||||||||||||||||||
| – | 5 Feb 2021 | – | – | 6 | 5 Feb 2024 | |||||||||||||||||||
| Total Restricted Share Awards6 |
19,743 | |||||||||||||||||||||||
| Guy Meldrum |
| |||||||||||||||||||||||
| LTIP1 |
11,066 | 26 Mar 2018 | 0.00 | 38.94 | – | 26 Mar 2021 – 25 Mar 2028 | ||||||||||||||||||
| 31,550 | 28 Mar 2019 | 0.00 | 33.28 | – | 28 Mar 2022 – 27 Mar 2029 | |||||||||||||||||||
| 33,497 | 30 Mar 2030 | 0.00 | 26.33 | – | 30 Mar 2023 – 30 Mar 2030 | |||||||||||||||||||
| Restricted Share Plan7 |
8,773 | 30 Mar 2030 | 0.00 | 26.33 | – | 30 Mar 2030 | ||||||||||||||||||
| Total Options3 |
84,886 | |||||||||||||||||||||||
| DSBS4 |
– | 26 Mar 2018 | – | – | 3,796 | 26 Mar 2021 | ||||||||||||||||||
| – | 28 Mar 2019 | – | – | 5,651 | 28 Mar 2022 | |||||||||||||||||||
| – | 30 Mar 2020 | – | – | 13,032 | 30 Mar 2023 | |||||||||||||||||||
| SIP5 |
– | 3 Apr 2018 | – | – | 70 | 3 Apr 2021 | ||||||||||||||||||
| – | 1 Apr 2019 | – | – | 112 | 1 Apr 2022 | |||||||||||||||||||
| – | 1 Apr 2020 | – | – | 125 | 1 Apr 2023 | |||||||||||||||||||
| Total Restricted Share Awards6 |
22,786 | |||||||||||||||||||||||
|
Strategic Report |
Governance Report | Financial Statements | Other Information | BAT Annual Report and Form 20-F 2020 | 335 | |||||
|
|
| Number of Options Held |
Date of Grant/Award |
Options Exercise Price £ |
Market
Price £ |
Number of Shares Awarded |
Exercisable (LTIP/Sharesave) Vesting (DSBS/SIP) |
|||||||||||||||||||
| Dr David O’Reilly |
| |||||||||||||||||||||||
| LTIP1 |
24,364 | 26 Mar 2018 | 0.00 | 38.94 | – | 26 Mar 2021 – 25 Mar 2028 | ||||||||||||||||||
| 30,048 | 28 Mar 2019 | 0.00 | 33.28 | – | 28 Mar 2022 – 27 Mar 2029 | |||||||||||||||||||
| 32,540 | 30 Mar 2020 | 0.00 | 26.33 | – | 30 Mar 2023 – 29 Mar 2030 | |||||||||||||||||||
| Restricted Share Plan7 |
8,522 | 30 Mar 2020 | 0.00 | 26.33 | – | 30 Mar 2023 | ||||||||||||||||||
| Total Options3 |
95,474 | |||||||||||||||||||||||
| DSBS4 |
– | 26 Mar 2018 | – | – | 6,713 | 26 Mar 2021 | ||||||||||||||||||
| – | 28 Mar 2019 | – | – | 11,028 | 28 Mar 2022 | |||||||||||||||||||
| – | 30 Mar 2020 | – | – | 12,659 | 30 Mar 2023 | |||||||||||||||||||
| SIP5 |
– | 3 Apr 2018 | – | – | 70 | 3 Apr 2021 | ||||||||||||||||||
| – | 9 May 2018 | – | – | 21 | 9 May 2021 | |||||||||||||||||||
| – | 8 Aug 2018 | – | – | 19 | 8 Aug 2021 | |||||||||||||||||||
| – | 15 Nov 2018 | – | – | 29 | 15 Nov 2021 | |||||||||||||||||||
| – | 7 Feb 2019 | – | – | 31 | 7 Feb 2022 | |||||||||||||||||||
| – | 1 Apr 2019 | – | – | 112 | 1 Apr 2022 | |||||||||||||||||||
| – | 8 May 2019 | – | – | 31 | 8 May 2022 | |||||||||||||||||||
| – | 8 Aug 2019 | – | – | 32 | 8 Aug 2022 | |||||||||||||||||||
| – | 14 Nov 2019 | – | – | 33 | 14 Nov 2022 | |||||||||||||||||||
| – | 6 Feb 2020 | – | – | 29 | 6 Feb 2023 | |||||||||||||||||||
| – | 1 Apr 2020 | – | – | 125 | 1 Apr 2023 | |||||||||||||||||||
| – | 13 May 2020 | – | – | 34 | 13 May 2023 | |||||||||||||||||||
| – | 19 Aug 2020 | – | – | 44 | 19 Aug 2023 | |||||||||||||||||||
| – | 12 Nov 2020 | – | – | 42 | 12 Nov 2023 | |||||||||||||||||||
| – | 5 Feb 2021 | – | – | 43 | 5 Feb 2024 | |||||||||||||||||||
| Total Restricted Share Awards6 |
31,095 | |||||||||||||||||||||||
| Johan Vandermeulen |
| |||||||||||||||||||||||
| LTIP1 |
30,335 | 26 Mar 2018 | 0.00 | 38.94 | – | 26 Mar 2021 – 25 Mar 2028 | ||||||||||||||||||
| 39,438 | 28 Mar 2019 | 0.00 | 33.28 | – | 28 Mar 2022 – 27 Mar 2029 | |||||||||||||||||||
| 41,872 | 30 Mar 2020 | 0.00 | 26.33 | – | 30 Mar 2023 – 29 Mar 2030 | |||||||||||||||||||
| Restricted Share Plan7 |
10,966 | 30 Mar 2020 | 0.00 | 26.33 | – | 30 Mar 2023 | ||||||||||||||||||
| Total Options3 |
122,611 | |||||||||||||||||||||||
| DSBS4 |
– | 26 Mar 2018 | – | – | 8,358 | 26 Mar 2021 | ||||||||||||||||||
| – | 28 Mar 2019 | – | – | 13,785 | 28 Mar 2022 | |||||||||||||||||||
| – | 30 Mar 2020 | – | – | 16,290 | 30 Mar 2023 | |||||||||||||||||||
| SIP5 |
– | 3 Apr 2018 | – | – | 70 | 3 Apr 2021 | ||||||||||||||||||
| – | 9 May 2018 | – | – | 4 | 9 May 2021 | |||||||||||||||||||
| – | 8 Aug 2018 | – | – | 5 | 8 Aug 2021 | |||||||||||||||||||
| – | 15 Nov 2018 | – | – | 7 | 15 Nov 2021 | |||||||||||||||||||
| – | 7 Feb 2019 | – | – | 8 | 7 Feb 2022 | |||||||||||||||||||
| – | 1 Apr 2019 | – | – | 112 | 1 Apr 2022 | |||||||||||||||||||
| – | 8 May 2019 | – | – | 8 | 8 May 2022 | |||||||||||||||||||
| – | 8 Aug 2019 | – | – | 10 | 8 Aug 2022 | |||||||||||||||||||
| – | 14 Nov 2019 | – | – | 11 | 14 Nov 2022 | |||||||||||||||||||
| – | 6 Feb 2020 | – | – | 10 | 6 Feb 2023 | |||||||||||||||||||
| – | 1 Apr 2020 | – | – | 125 | 1 Apr 2023 | |||||||||||||||||||
| – | 13 May 2020 | – | – | 11 | 13 May 2023 | |||||||||||||||||||
| – | 19 Aug 2020 | – | – | 18 | 19 Aug 2023 | |||||||||||||||||||
| – | 12 Nov 2020 | – | – | 16 | 12 Nov 2023 | |||||||||||||||||||
| – | 5 Feb 2021 | – | – | 17 | 5 Feb 2024 | |||||||||||||||||||
| Total Restricted Share Awards6 |
38,865 | |||||||||||||||||||||||
| 336 | BAT Annual Report and Form 20-F 2020 |
Other Information
Share Capital and Security Ownership
Continued
| Number of Options Held |
Date of Grant/Award |
Options Exercise Price £ |
Market
Price £ |
Number of Shares Awarded |
Exercisable (LTIP/Sharesave) Vesting (DSBS/SIP) |
|||||||||||||||||||
| Kingsley Wheaton |
| |||||||||||||||||||||||
| LTIP1 |
32,100 | 26 Mar 2018 | 0.00 | 38.94 | – | 26 Mar 2021 – 25 Mar 2028 | ||||||||||||||||||
| 43,194 | 28 Mar 2019 | 0.00 | 33.28 | – | 28 Mar 2022 – 27 Mar 2029 | |||||||||||||||||||
| 46,777 | 30 Mar 2020 | 0.00 | 26.33 | – | 30 Mar 2023 – 29 Mar 2030 | |||||||||||||||||||
| Restricted Share Plan7 |
12,251 | 30 Mar 2020 | 0.00 | 26.33 | – | 30 Mar 2023 | ||||||||||||||||||
| Sharesave2 |
1,309 | 28 Mar 2019 | 22.91 | 28.63 | – | 1 May 2024 – 31 Oct 2024 | ||||||||||||||||||
| Total Options3 |
135,631 | |||||||||||||||||||||||
| DSBS4 |
– | 26 Mar 2018 | – | – | 8,358 | 26 Mar 2021 | ||||||||||||||||||
| – | 28 Mar 2019 | – | – | 13,785 | 28 Mar 2022 | |||||||||||||||||||
| – | 30 Mar 2020 | – | – | 18,198 | 30 Mar 2023 | |||||||||||||||||||
| SIP5 |
– | 3 Apr 2018 | – | – | 70 | 3 Apr 2021 | ||||||||||||||||||
| – | 9 May 2018 | – | – | 8 | 9 May 2021 | |||||||||||||||||||
| – | 8 Aug 2018 | – | – | 8 | 8 Aug 2021 | |||||||||||||||||||
| – | 15 Nov 2018 | – | – | 13 | 15 Nov 2021 | |||||||||||||||||||
| – | 7 Feb 2019 | – | – | 13 | 7 Feb 2022 | |||||||||||||||||||
| – | 1 Apr 2019 | – | – | 112 | 1 Apr 2022 | |||||||||||||||||||
| – | 8 May 2019 | – | – | 13 | 8 May 2022 | |||||||||||||||||||
| – | 8 Aug 2019 | – | – | 14 | 8 Aug 2022 | |||||||||||||||||||
| – | 14 Nov 2019 | – | – | 16 | 14 Nov 2022 | |||||||||||||||||||
| – | 6 Feb 2020 | – | – | 13 | 6 Feb 2023 | |||||||||||||||||||
| – | 1 Apr 2020 | – | – | 125 | 1 Apr 2023 | |||||||||||||||||||
| – | 13 May 2020 | – | – | 15 | 13 May 2023 | |||||||||||||||||||
| – | 19 Aug 2020 | – | – | 22 | 19 Aug 2023 | |||||||||||||||||||
| – | 12 Nov 2020 | – | – | 20 | 12 Nov 2023 | |||||||||||||||||||
| – | 5 Feb 2021 | – | – | 22 | 5 Feb 2024 | |||||||||||||||||||
| Total Restricted Share Awards6 |
40,825 | |||||||||||||||||||||||
Notes:
Options
| 1. | LTIP: grants or awards of ordinary shares under the LTIP are for nil consideration. The number of options shown is the maximum that may be exercised subject to the completion of the applicable performance period and conditions under the rules of the LTIP. The number of options which may vest and become exercisable may be less than the number of ordinary shares shown in the table. |
| 2. | Sharesave Scheme: grants of options under the Sharesave Scheme are: (a) normally granted at a discount of 20% to the market price of ordinary shares at the time of invitation, as permitted by the rules of the Sharesave Scheme; and (b) are exercisable at the end of a three-year or five-year savings contract up to a monthly limit of £500. |
| 3. | Each of the LTIP and Sharesave Scheme contains provisions which permit the Board of Directors or a duly authorised committee of the Board of Directors to establish further plans for the benefit of overseas employees based on the relevant share plan but modified as necessary or desirable to take account of overseas tax, exchange control or applicable securities laws. Any new ordinary shares issued under such plans would not count towards any applicable plan limits under the LTIP or the Sharesave Scheme. |
Restricted Share Awards
| 4. | DSBS: a portion of annual bonus is deferred into a grant of ordinary shares which vests after a three year period. No further performance conditions apply in that period. Participants have no ownership over the shares until vesting and the shares carry no rights to vote in that period. Dividend equivalent payments are paid quarterly during the vesting period. |
| 5. | SIP: the SIP is an all-employee plan which includes the SRS under which eligible employees receive an award of ordinary shares (Free Shares) in April of each year in which the plan operates in respect of performance in the previous financial year. The Free Shares are held in a UK-based trust from the date of the award for a minimum period of three years. During that time the SIP participant is entitled to receive dividends on those ordinary shares which are re-invested by such trust to buy further ordinary shares (Dividend Shares) on behalf of the SIP participant. The Dividend Shares are also held in the trust from the date of acquisition for a minimum period of three years. During the three-year holding periods, the SIP participant may not remove the Free Shares or the Dividend Shares from the trust, but may direct the trust to exercise its voting rights in accordance with his or her instructions. In addition to the Free Shares and Dividend Shares, participants in the SIP are also eligible to purchase additional ordinary shares from their pre-tax salary up to an annual statutory limit (Partnership Shares). The SIP also provides that BAT has the right to offer additional ordinary shares to a participant at no cost for each Partnership Share the participant purchases, at a ratio of two such ordinary shares for each Partnership Share purchased (Matching Shares). BAT does not currently provide any Matching Shares. |
| 6. | BAT has established similar plans to the SIP for non-UK employees and specific plans for employees in Germany, Belgium and the Netherlands. Each of these plans has been modified to take account of overseas tax, exchange control and applicable securities laws. |
| 7. | Restricted Share Plan: grant of ordinary shares which vests after a three year period. No performance conditions apply in that period. Participants have no ownership over the shares until vesting and the shares carry no rights to vote in that period. Dividend equivalent payments are paid on shares vesting. |
|
Strategic Report |
Governance Report | Financial Statements | Other Information | BAT Annual Report and Form 20-F 2020 | 337 | |||||
|
|
|
The Company is incorporated under the name of British American Tobacco p.l.c. and is registered in England and Wales under registered number 3407696. Under the Companies Act 2006 (Companies Act), the Company’s objects are unrestricted. The following descriptions summarise certain provisions of the Company’s current Articles of Association (Articles) (as adopted by special resolution at the AGM on 28 April 2010), applicable English and Welsh law and the Companies Act. This summary is qualified in its entirety by reference to the Companies Act and the Articles, available on bat.com. The Articles may be altered or added to, or completely new articles may be adopted, by a special resolution of the shareholders of the Company, subject to the provisions of the Companies Act.
|
| Share capital – structure |
| Ordinary shares |
|
– all of the Company’s ordinary shares are fully paid |
| – no further contribution of capital may be required by the Company from the holders of such shares |
| Alteration of share capital – the Company by ordinary resolution may: |
|
– consolidate and divide all or any of its shares into shares of a larger amount than its existing shares |
|
– divide or sub-divide any of its shares into shares of smaller amount than its existing shares |
|
– determine that, as between the shares resulting from such a sub-division, any of them may have any preference or advantage as compared with the others |
| Alteration of share capital – the Company, subject to the provisions of the Companies Act, may: |
|
– reduce its share capital, its capital redemption reserve and any share premium account in any way |
|
– purchase its own shares, including redeemable shares, and may hold such shares as treasury shares or cancel them |
| Dividend rights |
|
– shareholders may, by ordinary resolution, declare dividends but not in excess of the amount recommended by the Directors |
|
– the Directors may pay interim dividends out of distributable profits |
| – no dividend shall be paid otherwise than out of the profits available for distribution as specified under the provisions of the Companies Act |
|
– the Directors may, with the authority of an ordinary resolution of the shareholders, pay scrip dividends or satisfy the payment of a dividend by the distribution of specific assets |
|
– unclaimed dividends for a period of 12 years may be forfeited and cease to be owed by the Company |
|
– specific provisions enable the Directors to elect to pay dividends by bank or electronic transfer only |
| Share capital – voting rights |
| Voting at general meetings |
| – by a show of hands, unless a poll is demanded, and on a show of hands, every shareholder who is present in person at a general meeting has one vote regardless of the number of shares held by the shareholder |
|
– every proxy appointed by a shareholder and present at a general meeting has one vote except that if the proxy has been duly appointed by more than one shareholder entitled to vote on the resolution and is instructed by one or more of those shareholders to vote for the resolution and by one or more others to vote against it, or is instructed by one or more of those shareholders to vote in one way and is given discretion as to how to vote by one or more others (and wishes to use that discretion to vote in the other way), he has one vote for and one vote against the resolution |
| – on a poll, every shareholder who is present in person or by proxy has one vote for every share held by the shareholder |
| – a shareholder (or his duly appointed proxy) entitled to more than one vote need not use all his votes or cast all the votes he uses in the same way |
| – a poll may be demanded by any of the following: |
| (1) the Chairman of the meeting; (2) the Directors; (3) not less than five shareholders having the right to vote at the meeting; |
| (4) a shareholder or shareholders representing not less than one-tenth of the total voting rights of all shareholders having the right to vote at the meeting (excluding any voting rights attached to treasury shares); or |
| (5) a shareholder or shareholders holding shares which confer a right to vote on the resolution at the meeting being shares on which an aggregate sum has been paid up equal to not less than one-tenth of the total sum paid up on all shares conferring that right (excluding any voting rights attached to treasury shares) |
| Matters transacted at general meetings |
|
– ordinary resolutions can include resolutions for the appointment, reappointment and removal of Directors, the receiving of the Annual Report, the declaration of final dividends, the appointment and reappointment of the external auditor, the authority for the Company to purchase its own shares and the grant of authority to allot shares |
| – an ordinary resolution is passed when a simple majority of the votes cast at a meeting at which there is a quorum vote in favour of the resolution |
|
– special resolutions can include resolutions amending the Company’s Articles and resolutions relating to certain matters concerning a winding-up of the Company |
| – a special resolution is passed when not less than three-quarters of the votes cast at a meeting at which there is a quorum vote in favour of the resolution |
|
– quorum for a meeting of the Company is a minimum of two shareholders present in person or by proxy or by a duly authorised representative(s) of a corporation which is a shareholder and entitled to vote |
|
– convening a meeting: the Company may specify a time not more than 48 hours before the time of the meeting (excluding any part of a day that is not a working day) by which a person must be entered on the register of members in order to have the right to attend or vote at the meeting |
| 338 | BAT Annual Report and Form 20-F 2020 |
Other Information
Articles of Association
Continued
| Share capital – pre-emptive rights and new issues of shares |
|
– holders of ordinary shares have no pre-emptive rights under the Articles – the ability of the Directors to cause the Company to issue shares, securities convertible into shares or rights to shares, otherwise than pursuant to an employee share scheme, is restricted |
|
– under the Companies Act, the Directors of a company are, with certain exceptions, unable to allot any equity securities without express authorisation, which may be contained in a company’s articles of association or given by its shareholders in a general meeting, but which in either event cannot last for more than five years |
|
– under the Companies Act, a company may also not allot shares for cash (otherwise than pursuant to an employee share scheme) without first making an offer to existing shareholders to allot such shares to them on the same or more favourable terms in proportion to their respective shareholdings, unless this requirement is waived by a special resolution of the shareholders |
| Restrictions on transfers of shares |
|
– Directors can, in their absolute discretion, refuse to register the transfer of a share in certificated form which is not fully paid, provided that such a refusal would not prevent dealings in shares in certificated form which are not fully paid from taking place on a proper basis |
|
– The Directors may also refuse to register a transfer of a share in certificated form (whether fully paid or not) unless the instrument of transfer: (1) is lodged, duly stamped, and is deposited at the registered office of the Company or such other place as the Directors may appoint and is accompanied by a certificate for the shares to which it relates and such other evidence as the Directors may reasonably require to show the right of the transferor to make the transfer; (2) is in respect of only one class of share; and (3) is in favour of not more than four transferees |
|
– for uncertificated shares, transfers shall be registered only in accordance with the terms of the Uncertificated Securities Regulations 2001 so that Directors may refuse to register a transfer which would require shares to be held jointly by more than four persons |
|
– if the Directors refuse to register a share transfer, they must give the transferee notice of this refusal as soon as practicable and in any event within two months of the instrument of transfer being lodged with the Company |
| Repurchase of shares |
|
– subject to authorisation by shareholder resolution, the Company may purchase its own shares in accordance with the Companies Act |
|
– any shares which have been bought back may be held as treasury shares or, if not so held, must be cancelled immediately upon completion of the purchase, thereby reducing the amount of the Company’s issued share capital |
| Directors |
| Appointment and retirement |
| – a Board of Directors of not fewer than five Directors and not subject to any maximum (unless otherwise determined by ordinary resolution of shareholders) |
|
– Directors and the Company (by ordinary resolution) may appoint a person who is willing to act as a Director |
|
– the Articles govern the minimum number of Directors who must be subject to retirement at each AGM and who may seek re-election |
|
– notwithstanding the Articles, all of the Directors of the Company will be subject to re-election at the forthcoming AGM to be held on 28 April 2021 in accordance with the UK Corporate Governance Code |
|
– fees for Non-Executive Directors and the Chairman are determined by the Directors but cannot currently exceed in aggregate an annual sum of £2,500,000, unless determined otherwise by ordinary resolution of the shareholders |
|
– the remuneration of the Executive Directors is determined by the Remuneration Committee, which comprises independent Non-Executive Directors |
| Disclosure of interests |
|
– specific provisions apply to the regulation and management of the disclosure of Directors’ interests in transactions and any conflicts of interest that may occur in such situations including those which may arise as a result of the Director’s office or employment or persons connected with him or her |
| Meetings and voting |
|
– the quorum for a meeting of Directors is two Directors |
|
– the Directors may delegate any of their powers to a person or a committee |
|
– the Articles place a general prohibition on a Director voting at a Board meeting on any matter in which he has an interest other than by virtue of his interest in shares in the Company |
|
– specific provisions apply to a Director’s ability to vote in relation to: the giving of guarantees; the provision of indemnities; insurance proposals; retirement benefits; and transactions or arrangements with a company in which the Director may have an interest |
| Borrowing powers |
|
– the Directors may exercise all the powers of the Company to borrow money and to mortgage or charge its undertaking, property, assets (present and future) and uncalled capital |
|
– the Directors may also issue debentures, debenture stock and other securities |
|
Strategic Report |
Governance Report | Financial Statements | Other Information | BAT Annual Report and Form 20-F 2020 | 339 | |||||
|
|
| Additional disclosures |
| Disclosure of ownership of shares |
| There are no provisions in the Articles whereby persons acquiring, holding or disposing of a certain percentage of the Company’s ordinary shares are required to make disclosure of their ownership percentage, although there are such requirements under statute and regulation. |
| Director retirement |
| There is no requirement for a director to retire on reaching any age. |
| Sinking Funds |
| There is no sinking fund provision in the Articles applicable to the Company’s ordinary shares. |
| Limitations on voting and shareholding |
| There are no limitations under the Articles restricting the right of non-resident or foreign owners to hold or vote ordinary shares in the Company. |
| Distribution of assets on a winding up |
| If the Company is wound up, the liquidator may, with the sanction of a special resolution and any other sanction required by law, divide among the members in specie the whole or any part of the assets of the Company and may, for that purpose, value any assets and determine how the division shall be carried out as between the members or different classes of members. The liquidator may, with the like sanction, vest the whole or any part of the assets in trustees upon such trusts for the benefit of the members as he may with the like sanction determine, but no member shall be compelled to accept any assets upon which there is a liability. |
| Anti-takeover devices and change of control |
| There are no provisions in the Articles that would have the effect of delaying, deferring or preventing a takeover, or change of control, of the Company. Under English law, the Company’s directors have a fiduciary duty to take only those actions that are in the interests of the Company and any anti-takeover devices employed by the directors in the future, if any, must accordingly be in the interests of the Company. The Company is also subject to the City Code on Takeovers and Mergers (the “City Code”), which governs the conduct of mergers and takeovers in the UK. Any takeover of the Company would have to be in accordance with the City Code. |
| 340 | BAT Annual Report and Form 20-F 2020 |
Other Information
Renewal of Authority for Company to Purchase Own Shares
| Current authority to purchase shares |
– this authority (granted at the 2020 AGM) will expire at the 2021 AGM; the share buy-back programme was suspended with effect from 30 July 2014; and
– renewed authority to purchase the Company’s ordinary shares in order that the appropriate mechanisms are in place to enable the share buy-back programme to be reinstated at any time and authority would be exercised when, in the opinion of the Directors, the exercise of the authority would result in an increase in the Company’s earnings per share and would be in the interest of its shareholders generally. | |
| Proposed authority to purchase shares | – the minimum price that may be paid for such shares is 25p, and the maximum price is the higher of: (i) an amount equal to 105% of the average of the middle-market prices shown in the quotation for an ordinary share as derived from the LSE Daily Official List for the five business days immediately preceding the day on which the ordinary share is contracted to be purchased; and (ii) the higher of the price of the last independent trade and the highest current independent bid for an ordinary share in the Company on the trading venues where the market purchases by the Company will be carried out;
– in the absence of the necessary practical arrangements, the proposed authority has not been extended to enable BAT to purchase its own ordinary shares on the JSE in South Africa or the NYSE in the form of ADSs; and
– further details are set out in the Notice of Annual General Meeting 2021 which is made available to all shareholders and is published on bat.com. | |
| Treasury shares | – in accordance with the Company’s policy, any repurchased shares are expected to be held as treasury shares; at 31 December 2020, the number of treasury shares was 162,347,246 (2019: 162,645,590); no dividends are paid on treasury shares; treasury shares have no voting rights; and treasury shares may be resold at a later date. | |
Purchases of Equity Securities by the Issuer and Affiliated Purchasers
At the AGM on 30 April 2020, authorisation was given to the Company to repurchase up to 229.4 million ordinary shares for the period until the next AGM in 2021. This authorisation is renewed annually at the AGM. No ordinary shares were repurchased by the Company during 2020. The following table provides details of ordinary share purchases made by the trustees of employee share ownership plans (ESOPs) and other purchases of ordinary shares and ADSs made to satisfy the commitments to deliver shares under certain employee share-based payment plans.
| |
Total number of ordinary shares purchased by ESOPs or certain employee share- based plans |
|
|
Average price paid per £ |
|
|
Total number
of ADSs purchased by ESOPs or certain employee share- based plans |
|
|
Average price paid per ADS US$ |
|
|
Total number of ordinary shares purchased as part of a publicly announced plan |
1 |
|
Maximum number of shares that may yet be purchased as part of a publicly announced plan1 |
| |||||||
| 2020 |
||||||||||||||||||||||||
|
2 January |
2,807 | 32.750000 | – | – | – | – | ||||||||||||||||||
| 5 February |
2,422 | 34.245000 | – | – | – | – | ||||||||||||||||||
|
6 February |
14,968 | 34.566100 | – | – | – | – | ||||||||||||||||||
|
4 March |
2,612 | 31.825000 | – | – | – | – | ||||||||||||||||||
| 1 April |
237,096 | 28.442330 | – | – | – | – | ||||||||||||||||||
| 1 April |
3,023 | 27.485000 | – | – | – | – | ||||||||||||||||||
| 7 April |
1,283 | 29.400000 | – | – | – | – | ||||||||||||||||||
| 7 April |
14,338 | 29.968600 | – | – | – | – | ||||||||||||||||||
|
7 April |
5,689 | 29.450000 | – | – | – | – | ||||||||||||||||||
| 5 May |
95,397 | 29.981900 | – | – | – | – | ||||||||||||||||||
| 6 May |
2,807 | 29.945000 | – | – | – | – | ||||||||||||||||||
|
13 May |
15,342 | 31.072700 | – | – | – | – | ||||||||||||||||||
|
3 June |
2,643 | 31.965000 | – | – | – | – | ||||||||||||||||||
|
1 July |
2,713 | 30.930000 | – | – | – | – | ||||||||||||||||||
| 5 August |
3,374 | 25.575000 | – | – | – | – | ||||||||||||||||||
|
19 August |
22,421 | 25.593800 | – | – | – | – | ||||||||||||||||||
|
2 September |
3,295 | 25.530000 | – | – | – | – | ||||||||||||||||||
|
7 October |
3,074 | 27.625000 | – | – | – | – | ||||||||||||||||||
| 4 November |
3,237 | 25.820000 | – | – | – | – | ||||||||||||||||||
|
12 November |
20,322 | 27.779740 | – | – | – | – | ||||||||||||||||||
|
2 December |
3,201 | 26.930000 | – | – | – | – | ||||||||||||||||||
| 462,064 | 28.040008 | – | – | – | – | |||||||||||||||||||
Notes:
| 1. | There was no publicly announced plan for BAT to purchase its own ordinary shares or ADSs during the year ended 31 December 2020. |
| 2. | All the purchases of ordinary shares were made on open market transactions. |
|
Strategic Report |
Governance Report | Financial Statements | Other Information | BAT Annual Report and Form 20-F 2020 | 341 | |||||
|
|
| The British American Tobacco Group Employee Trust (BATGET) | ||||||||||
| Function |
– used to satisfy the vesting and exercise of awards of ordinary shares under the BAT Deferred Share Bonus Scheme and Long-Term Incentive Plans; and
– a committee of senior management reporting to the Board’s Share Schemes Committee monitors the number of ordinary shares held in BATGET to satisfy outstanding awards. |
| ||||||||
| Funding |
– funded by interest-free loan facilities from the Company totalling £1 billion;
– this enables BATGET to facilitate the purchase of ordinary shares to satisfy the future vesting or exercise of options and awards;
– loan to BATGET: £795.02 million at 31 December 2020 (2019: £788.24 million);
– the loan is either repaid from the proceeds of the exercise of options or, in the case of ordinary shares acquired by BATGET to satisfy the vesting and exercise of awards, the Company will subsequently waive the loan provided over the life of the awards; and
– if any options lapse, ordinary shares may be sold by BATGET to cover the loan repayment. |
| ||||||||
| 1 Jan 2020 | 31 Dec 2020 | |||||||||
| Ordinary shares | Number of ordinary shares | 8,049,187 | 5,787,154 | |||||||
| held in BATGET | Market value of ordinary shares | £260.1m | £156.7m | |||||||
| % of issued share capital of Company | 0.33 | 0.24 | ||||||||
| Dividends
paid in 2020 |
– BATGET currently waives dividends on the ordinary shares held by it; and
– quarterly interim dividends 2020: £14.50 million across 2020. |
| ||||||||
| Voting rights |
– the trustee does not exercise any voting rights while ordinary shares are held in BATGET; and
– share scheme participants may exercise the voting rights attaching to those ordinary shares once the ordinary shares have been transferred out of BATGET. |
| ||||||||
| Notes: | ||||||||||
| 1. Company share – based payment arrangements: details of the material equity share-based and cash-settled share-based arrangements are set out in note 24 in the Notes on the Accounts.
2. The values of ordinary shares shown are based on the closing mid-market share price on 31 December 2020: 2,708p (31 December 2019: 3,232p).
3. In addition to the ordinary shares held in BATGET, the trust held the following American Depositary Shares (ADSs) which relate to the vesting and exercise of certain employee stock awards formerly granted by Reynolds American Inc. over Reynolds American Inc. common stock and which were assumed by BAT to be satisfied by the delivery of ADSs following the merger with Reynolds American Inc. on 25 July 2017. |
| |||||||||
| 1 Jan 2020 | 31 Dec 2020 | |||||||||
| Number of ADSs |
15,197 | 15,197 | ||||||||
| Market value of ADSs(a) |
US$0.6m | US$0.6m | ||||||||
| % of issued share capital |
0.0006 | 0.0006 | ||||||||
Note:
| (a) | The value of the ADSs shown is based on the closing price of ADSs on 31 December 2020 of US$37.49. |
| 342 | BAT Annual Report and Form 20-F 2020 |
Other Information
Depositary Shares
Fees and Charges Payable by ADS Holders
Citibank, N.A. (Citibank) was appointed as the depositary bank (the ‘Depositary’) for BAT’s ADS programme pursuant to the Amended and Restated Deposit Agreement dated 1 December 2008 and amended as of 14 February 2017 and 14 June 2017 between BAT, the Depositary and the owners and holders of ADSs (the ‘Deposit Agreement’). Citibank was reappointed as the Depositary pursuant to the Second Amended and Restated Deposit Agreement dated 26 November 2018 (the ‘Restated Deposit Agreement’).
The Restated Deposit Agreement provides that ADS holders may be required to pay various fees to the Depositary, and the Depositary may refuse to provide any service for which a fee is assessed until the applicable fee has been paid.
| Service | Fees | |
| Issuance of ADSs upon deposit of ordinary shares (excluding issuances as a result of distributions of shares described below) | Up to US$0.05 per ADS issued1 | |
| Cancellation of ADSs | Up to US$0.05 per ADS surrendered1 | |
| Distribution of cash dividends or other cash distributions (i.e. sale of rights and other entitlements) | Up to US$0.05 per ADS held2 | |
| Distribution of ADSs pursuant to: (1) stock dividends or other free stock distributions; or (2) exercise of rights to purchase additional BAT ADSs | Up to US$0.05 per ADS held | |
| Distribution of securities other than ADSs or rights to purchase additional ADSs (i.e. spinoff shares) | Up to US$0.05 per ADS held | |
| Depositary bank services | Up to US$0.05 per ADS held | |
Notes:
| 1. | Under the terms of a separate agreement between BAT and the Depositary, the Depositary has agreed to waive the fees that would otherwise be payable in connection with the issuance of ADSs upon deposit of ordinary shares and the cancellation of ADSs and corresponding withdrawal of ordinary shares, in each case by BAT or any of its affiliates, officers, directors or employees. The terms of this separate agreement may be amended at any time by BAT and the Depositary. |
| 2. | While under the Restated Deposit Agreement cash dividends paid in respect of ADSs are subject to a fee of up to US$0.05 per ADS payable to the Depositary, under the terms of the separate agreement between BAT and the Depositary referred to above, such dividends are instead subject to a fee of up to US$0.02 per ADS per year (a fee of US$0.005 per dividend based on the distribution of four quarterly cash dividends per year). Under the separate agreement, this dividend fee may not be varied by the Depositary without the consent of BAT. |
Contact details for Citibank Shareholder Services are on page 343.
In addition, ADS holders may be required under the Restated Deposit Agreement to pay the Depositary: (a) taxes (including applicable interest and penalties) and other governmental charges; (b) registration fees; (c) certain cable, telex and facsimile transmission and delivery expenses; (d) the expenses and charges incurred by the Depositary in the conversion of foreign currency; (e) such fees and expenses as are incurred by the Depositary in connection with compliance with applicable exchange control regulations and other regulatory requirements; and (f) the fees and expenses incurred by the Depositary, the custodian or any nominee in connection with the servicing or delivery of deposited securities. The Depositary may: (a) withhold dividends or other distributions or sell for the account of any ADS holder any or all of the shares underlying the ADSs in order to satisfy any tax or governmental charge; and (b) deduct from any cash distribution the applicable fees and charges of, and expenses incurred by, the Depositary and any taxes, duties or other governmental charges on account.
Fees and Payments Made by the Depositary to BAT
Under the terms of the contractual arrangements set out in the separate agreement between BAT and the Depositary referred to above, BAT received a total of approximately US$3.7 million from the Depositary, comprising fees charged in respect of dividends and a fixed contribution to BAT’s ADS programme administration costs for the year ended 31 December 2020.
In 2020, these programme administration costs principally included those associated with AGM proxy mailings, exchange listing and regulatory fees, foreign private issuer analysis, legal fees, share registration fees and other expenses incurred by BAT in relation to the ADS programme.
Under these contractual arrangements, the Depositary has also agreed to waive certain standard fees associated with the administration of the ADS programme.
| 344 | BAT Annual Report and Form 20-F 2020 |
Other Information
The following documents are filed in the SEC EDGAR system, as part of this Annual Report on Form 20-F, and can be viewed on the SEC’s website, www.sec.gov:
|
Strategic Report |
Governance Report | Financial Statements | Other Information | BAT Annual Report and Form 20-F 2020 | 345 | |||||
|
|
Notes:
1. Incorporated by reference to Exhibit 3.1 to BAT’s Registration Statement on Form F-4 (Reg. No. 333-217939) filed on 12 May 2017.
2. Incorporated by reference to Exhibit 4.1 to BAT’s Registration Statement on Form S-8 (Reg. No. 333-237186) filed on 16 March 2020.
3. Incorporated by reference to Exhibit 2.4 to BAT’s Annual Report on Form 20-F for the year ended 31 December 2017 filed on 15 March 2018.
4. Incorporated by reference to Exhibit 4.2 to BAT’s Registration Statement on Form F-4 (Reg. No. 333-227658) filed on 2 October 2018.
5. Incorporated by reference to Exhibit 4.1 to British American Tobacco p.l.c.’s Form 6-K filed on 6 September 2019.
6. Incorporated by reference to Exhibit 4.2 to British American Tobacco p.l.c.’s Form 6-K filed on 6 September 2019.
7. Incorporated by reference to Exhibit 4.3 to British American Tobacco p.l.c.’s Form 6-K filed on 6 September 2019.
8. Incorporated by reference to Exhibit 4.4 to British American Tobacco p.l.c.’s Form 6-K filed on 6 September 2019.
9. Incorporated by reference to Exhibit 4.5 to British American Tobacco p.l.c.’s Form 6-K filed on 6 September 2019.
10. Incorporated by reference to Exhibit 4.6 to British American Tobacco p.l.c.’s Form 6-K filed on 2 April 2020.
11. Incorporated by reference to Exhibit 4.7 to British American Tobacco p.l.c.’s Form 6-K filed on 2 April 2020.
12. Incorporated by reference to Exhibit 4.8 to British American Tobacco p.l.c.’s Form 6-K filed on 2 April 2020.
13. Incorporated by reference to Exhibit 4.9 to British American Tobacco p.l.c.’s Form 6-K filed on 25 September 2020.
14. Incorporated by reference to Exhibit 4.10 to British American Tobacco p.l.c.’s Form 6-K filed on 25 September 2020.
15. Incorporated by reference to Exhibit 4.11 to British American Tobacco p.l.c.’s Form 6-K filed on 25 September 2020.
16. Incorporated by reference to Exhibit 4.12 to British American Tobacco p.l.c.’s Form 6-K filed on 25 September 2020.
17. Incorporated by reference to Exhibit 4.13 to British American Tobacco p.l.c.’s Form 6-K filed on 25 September 2020.
18. Incorporated by reference to Exhibit 4.14 to British American Tobacco p.l.c.’s Form 6-K filed on 25 September 2020.
19. Incorporated by reference to Exhibit 99.13 to BAT’s Amendment No. 4 to Schedule 13D filed on 17 January 2017.
20. Incorporated by reference to Exhibit 10.6 to BAT’s Registration Statement on Form F-4 (Reg. No. 333-217939) filed on 12 May 2017.
21. Incorporated by reference to Exhibit 10.8 to BAT’s Registration Statement on Form F-4 (Reg. No. 333-217939) filed on 12 May 2017.
22. Incorporated by reference to Exhibit 4.6 to BAT’s Annual Report on Form 20-F for the year ended 31 December 2018 filed on 15 March 2019.
23. Incorporated by reference to Exhibit 4.7 to BAT’s Annual Report on Form 20-F for the year ended 31 December 2018 filed on 15 March 2019.
24. Incorporated by reference to Exhibit 4.2 to BAT’s Registration Statement on Form S-8 (Reg. No. 333-237186) filed on 16 March 2020.
25. Incorporated by reference to Exhibit 10.43 to Reynolds American Inc.’s Annual Report on Form 10-K for the fiscal year ended 31 December 2007 filed on 27 February 2008.
26. Incorporated by reference to Exhibit 4.11 to BAT’s Annual Report on Form 20-F for the year ended 31 December 2018 filed on 15 March 2019.
27. Incorporated by reference to Exhibit 4.14 to BAT’s Annual Report on Form 20-F for the year ended 31 December 2019 filed on 26 March 2020.
28. Incorporated by reference to Exhibit 4 to R.J. Reynolds Tobacco Holdings, Inc.’s Form 8-K dated 24 November 1998.
29. Incorporated by reference to Exhibit 2 to R.J. Reynolds Tobacco Holdings, Inc.’s Form 8-K dated 5 September 1997.
30. Incorporated by reference to Exhibit 2 to R.J. Reynolds Tobacco Holdings, Inc.’s Form 8-K dated 27 January 1998.
31. Incorporated by reference to Exhibit 99.1 to R.J. Reynolds Tobacco Holdings, Inc.’s Quarterly Report on Form 10-Q for the quarter ended 30 March 1998 filed on 15 May 1998.
32. Incorporated by reference to Exhibit 99.2 to R.J. Reynolds Tobacco Holdings, Inc.’s Quarterly Report on Form 10-Q for the quarter ended 30 March 1998 filed on 15 May 1998.
33. Incorporated by reference to Exhibit 99.3 to R.J. Reynolds Tobacco Holdings, Inc.’s Quarterly Report on Form 10-Q for the quarter ended 30 March 1998 filed on 15 May 1998.
34. Incorporated by reference to Exhibit 99.2 to R.J. Reynolds Tobacco Holdings, Inc.’s Quarterly Report on Form 10-Q for the quarter ended 30 June 1998 filed on 14 August 1998.
35. Incorporated by reference to Exhibit 99.4 to R.J. Reynolds Tobacco Holdings, Inc.’s Quarterly Report on Form 10-Q for the quarter ended 30 June 1998 filed on 14 August 1998.
36. Incorporated by reference to Exhibit 99.1 to R.J. Reynolds Tobacco Holdings, Inc.’s Quarterly Report on Form 10-Q for the quarter ended 30 September 1998 filed on 12 November 1998.
37. Incorporated by reference to Exhibit 10.1 to Reynolds American Inc.’s Form 8-K dated 12 March 2013.
38. Incorporated by reference to Exhibit 4.25 to BAT’s Annual Report on Form 20-F for the year ended 31 December 2019 filed on 26 March 2020.
39. Incorporated by reference to Exhibit 11 to BAT’s Annual Report on Form 20-F for the year ended 31 December 2017 filed on 15 March 2018.
40. These certifications are furnished only and are not filed as part of BAT’s Annual Report on Form 20-F for the year ended 31 December 2020.
Certain instruments which define the rights of holders of long-term debt issued by BAT and its subsidiaries are not being filed because the total amount of securities authorised under each such instrument does not exceed 10% of the total consolidated assets of BAT and its subsidiaries. BAT agrees to furnish copies of any or all such instruments to the SEC on request.
|
Strategic Report |
Governance Report | Financial Statements | Other Information | BAT Annual Report and Form 20-F 2020 | 347 | |||||
|
|
to Form 20-F
| Item | Form 20-F caption | Location in this document | ||
| 1 | Identity of Directors, Senior Management and Advisers | N/A | ||
| 2 | Offer Statistics and Expected Timetable | N/A | ||
| 3 | Key Information | |||
| A | Selected financial data | 273 | ||
| B | Capitalisation and indebtedness | N/A | ||
| C | Reasons for the offer and use of proceeds | N/A | ||
| D | Risk factors | 84-88, 288-289, 290-306 | ||
| 4 | Information on the Company | |||
| A | History and development of the Company | 3, 67, 70-71, 172-173, 184-187, 217-218, 272, 286, 343 | ||
| B | Business overview | 2-63, 66, 74-81, 272, 291, 293, 307-310, 313, 314, 316 | ||
| C | Organisational structure | 254-263, 272 | ||
| D | Property, plants and equipment | 184-186, 314 | ||
| 4a | Unresolved staff comments | N/A | ||
| 5 | Operating and Financial Review and Prospects | |||
| A | Operating results | 3, 7, 9, 12-15, 35, 37, 39, 40, 41, 65, 73, 77, 87, 197-199, 213, 284, 286, 297, 307-310 | ||
| B | Liquidity and capital resources | 70-71, 72, 155, 200, 206-209, 212-217, 282, 286, 303 | ||
| C | Research and development, patent and licences | 3, 22-23, 31, 49-50, 66, 167-168, 272 | ||
| D | Trend information | 2-57, 66-73, 74-81, 84-88, 307-310 | ||
| E | Off-balance sheet arrangements | 73, 224-248, 287 | ||
| F | Tabular disclosure of contractual commitments | 287 | ||
| G | Safe harbour | 318 | ||
| 6 | Directors, Senior Management and Employees | |||
| A | Directors and senior management | 92-94, 103 | ||
| B | Compensation | 117-139, 188-193, 222-223, 326-336 | ||
| C | Board practices | 92-94, 107, 110-116, 117-119, 120-123, 137, 222-223, 317, 338-339 | ||
| D | Employees | 222, 285 | ||
| E | Share ownership | 63, 122-123, 219-221, 327-336, 341 | ||
| 7 | Major Shareholders and Related Party Transactions | |||
| A | Major shareholders | 326-327 | ||
| B | Related party transactions | 222-223 | ||
| C | Interests of experts and counsel | N/A | ||
| 8 | Financial Information | |||
| A | Consolidated statements and other financial information | 69, 111-112, 150-253, 320-321 | ||
| B | Significant changes | N/A | ||
| 9 | The Offer and Listing | |||
| A | Offer and listing details | 319 | ||
| B | Plan of distribution | N/A | ||
| C | Markets | 319 | ||
| D | Selling shareholders | N/A | ||
| E | Dilution | N/A | ||
| F | Expenses of the issue | N/A | ||
| 10 | Additional Information | |||
| A | Share capital | N/A | ||
| B | Memorandum and Articles of Association | 134, 337-339 | ||
| C | Material contracts | 248, 312-313 | ||
| D | Exchange controls | 320 | ||
| E | Taxation | 322-325 | ||
| F | Dividends and paying agents | N/A | ||
| G | Statements by experts | N/A | ||
| H | Documents on display | 343 | ||
| I | Subsidiary information | N/A | ||
| 11 | Quantitative and Qualitative Disclosures about Market Risk | 212-217 | ||
| 348 | BAT Annual Report and Form 20-F 2020 |
Other Information
Cross-Reference to Form 20-F
Continued
| Item | Form 20-F caption | Location in this document | ||
| 12 | Description of Securities Other Than Equity Securities | |||
| A | Debt securities | N/A | ||
| B | Warrants and rights | N/A | ||
| C | Other securities | N/A | ||
| D | American Depositary Shares | 342 | ||
| 13 | Defaults, Dividend Arrearages and Delinquencies | N/A | ||
| 14 | Material Modifications to the Rights of Security Holders and Use of Proceeds | N/A | ||
| 15 | Controls and Procedures | 316 | ||
| 16A | Audit Committee Financial Expert | 110, 315 | ||
| 16B | Code of Ethics | 116, 315 | ||
| 16C | Principal Accountant Fees and Services | 113, 167 | ||
| 16D | Exemptions from the Listing Standards for Audit Committees | N/A | ||
| 16E | Purchases of Equity Securities by the Issuer and Affiliated Purchasers | 340 | ||
| 16F | Change in Registrant’s Certifying Accountant | N/A | ||
| 16G | Corporate Governance | 315 | ||
| 16H | Mine Safety Disclosure | N/A | ||
| 17 | Financial Statements | N/A | ||
| 18 | Financial Statements | 150-253 | ||
| 19 | Exhibits | 344-345 | ||

BAT A BETTER TOMORROW Go online Explore the story of our year www.bat.com Featuring downloadable versions of this report, along with our ESG Report @BATplc and other content all accessible on desktop, tablet and mobile. youtube.com/welcometobat www.bat.com/reporting
SIGNATURE
The registrant hereby certifies that it meets all of the requirements for filing on Form 20-F and that it has duly caused and authorized the undersigned to sign this annual report on its behalf.
Date: 9 March 2021
British American Tobacco p.l.c.
(Registrant)
| By: | /s/ Paul McCrory | |
| Paul McCrory Company Secretary |


 The strength of the business, combined with the professionalism and resilience of our global teams have enabled us, in 2020, to deliver a strong operational performance


 From the start of our portfolio transformation journey, we have always been clear that no consumer is the same. In order to meet differing needs in multiple marketplaces, a portfolio of solutions is required
–
From the start of our portfolio transformation journey, we have always been clear that no consumer is the same. In order to meet differing needs in multiple marketplaces, a portfolio of solutions is required
–
 As the largest, and only truly global company in our industry, we take seriously our role to transform ourselves and demonstrate thought
 We have a very clear purpose to reduce the
harm footprint of our business.
We have a very clear purpose to reduce the
harm footprint of our business. 
 Our business continues to transform during this period of unprecedented change.
 We believe our multi-category strategy is the most effective way to appeal to the diverse preferences
of adult consumers around the world while reducing the health impact of
We believe our multi-category strategy is the most effective way to appeal to the diverse preferences
of adult consumers around the world while reducing the health impact of


 We continue to deliver against our financial objectives, despite the unprecedented challenges arising in 2020. This allows us to continue to reward shareholders with growth in dividends while deleveraging and investing
in A Better Tomorrow.
We continue to deliver against our financial objectives, despite the unprecedented challenges arising in 2020. This allows us to continue to reward shareholders with growth in dividends while deleveraging and investing
in A Better Tomorrow.

 Revenue growth driven by New Categories performance and combustibles pricing, more than offsets an estimated 2.5% COVID-19


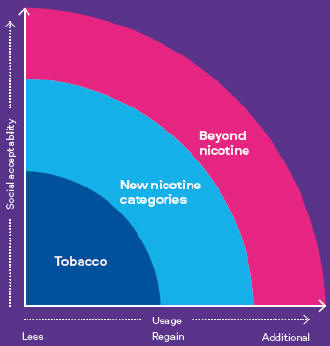
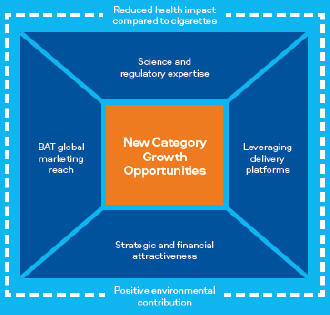


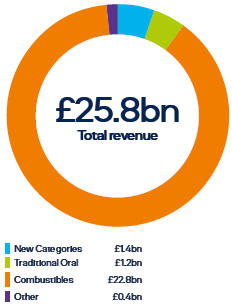
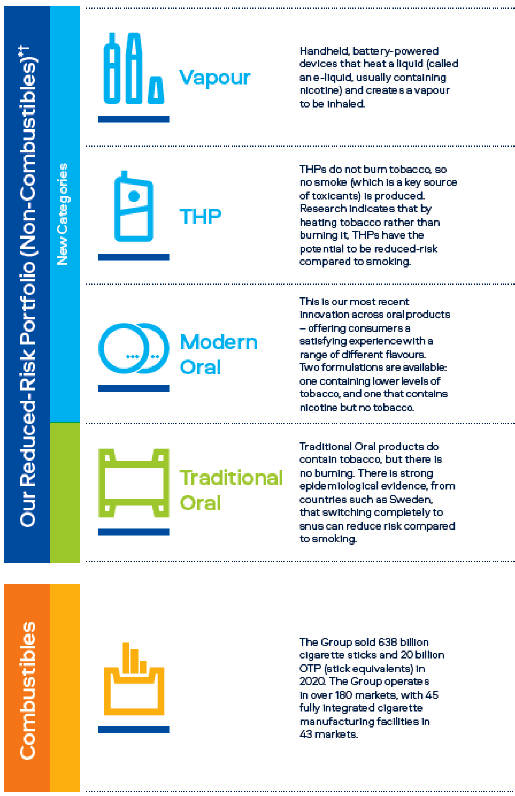
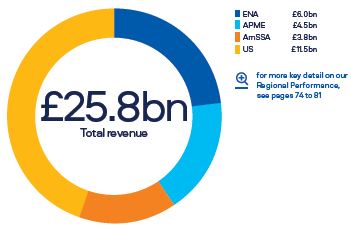


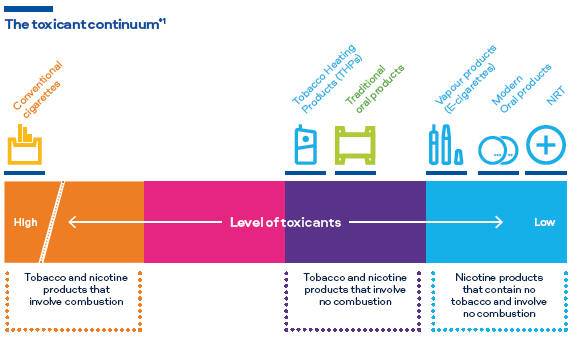
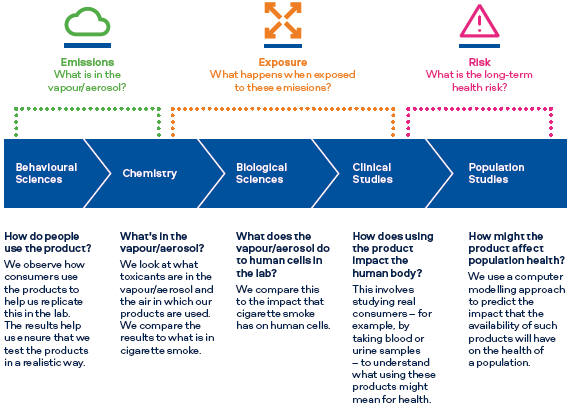


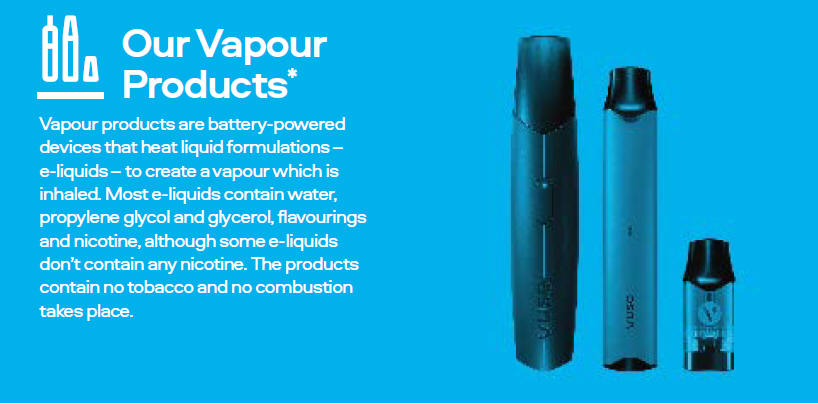
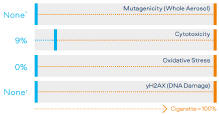

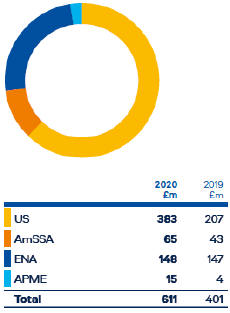
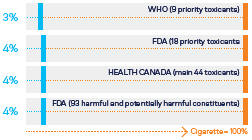
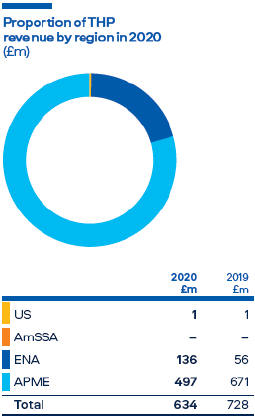
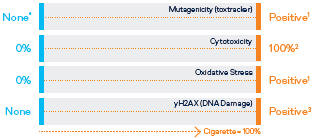
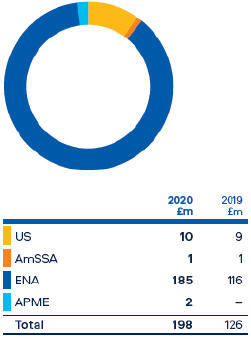
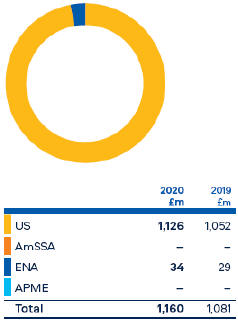

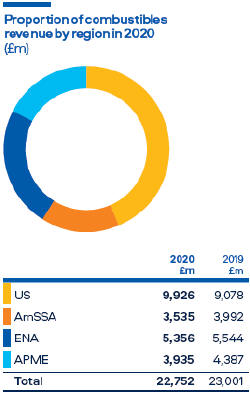


 Consumers
 Customers
 Suppliers
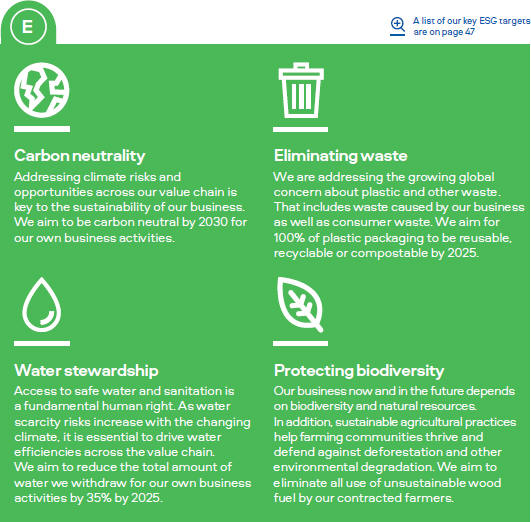
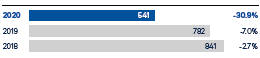
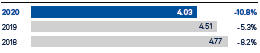
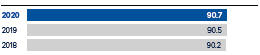


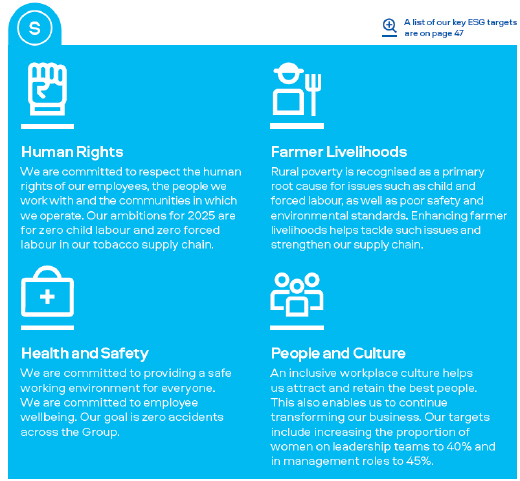

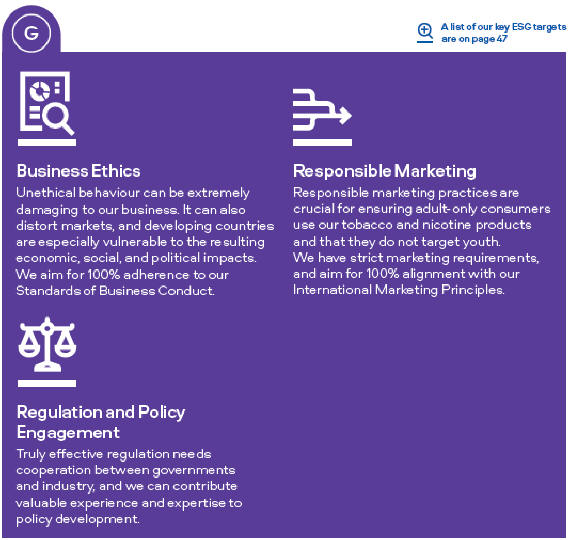


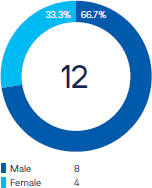
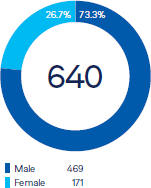
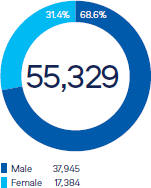


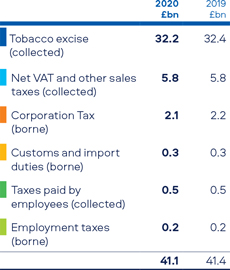


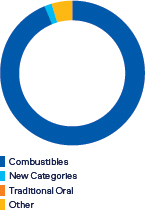


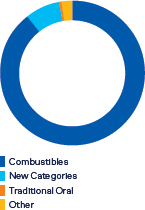


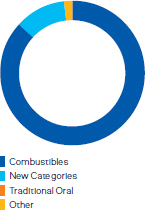


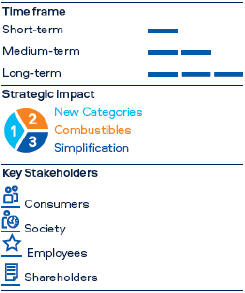


 Suppliers
  Customers
  Governments and Wider Society