
Q3 2025 October 30, 2025 SHAREHOLDER LETTER
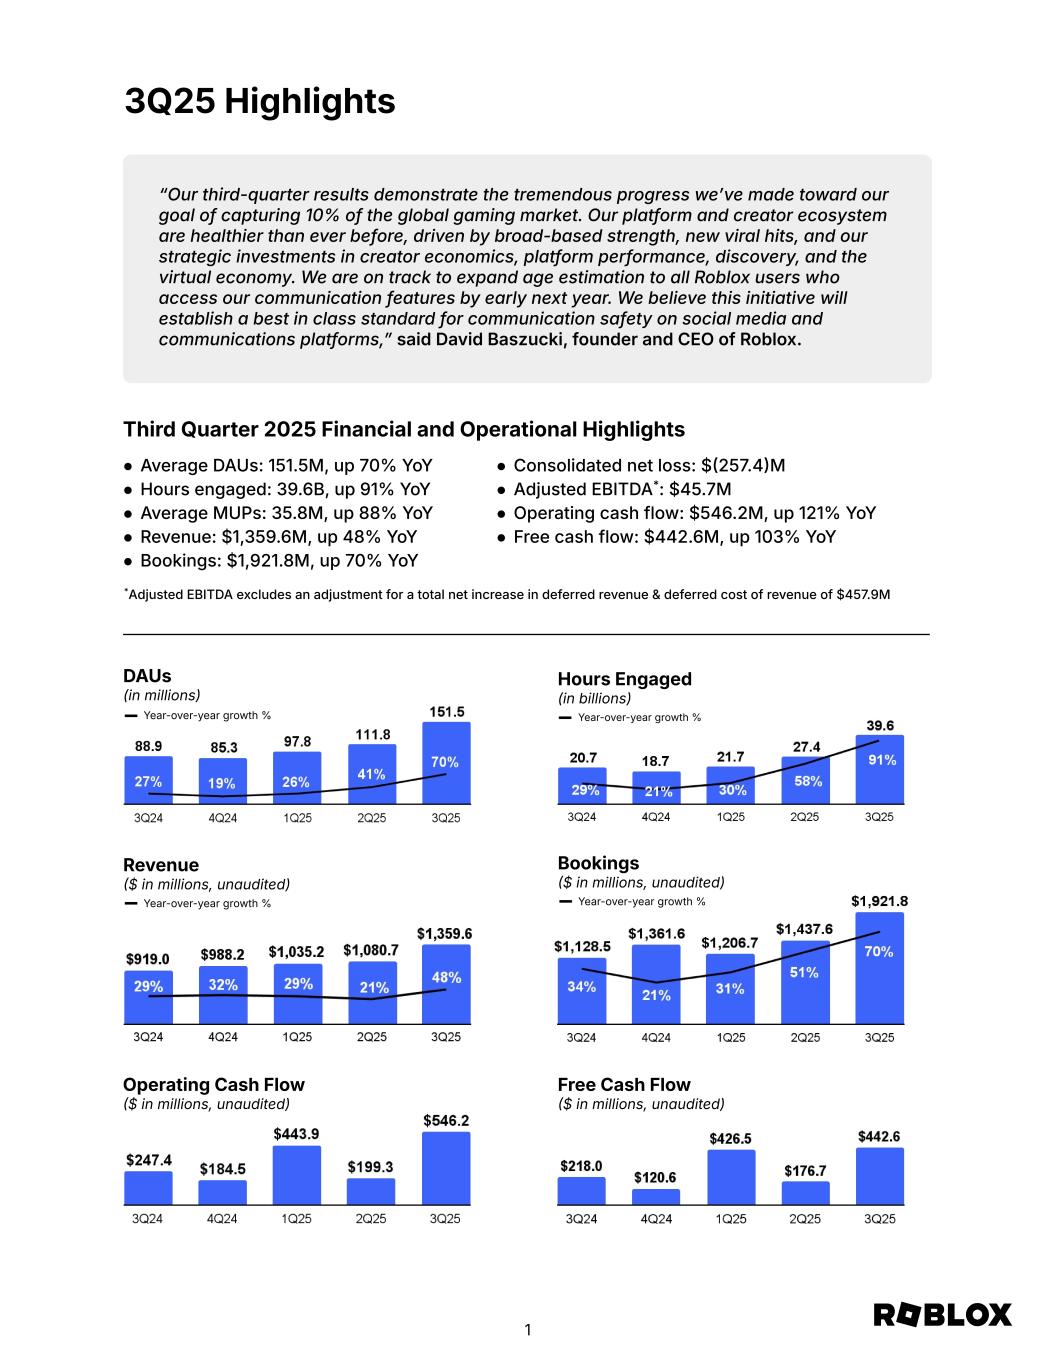
DAUs (in millions) Year-over-year growth % Hours Engaged (in billions) Year-over-year growth % 3Q25 Highlights Revenue $ in millions, unaudited) Year-over-year growth % Bookings $ in millions, unaudited) Year-over-year growth % Operating Cash Flow $ in millions, unaudited) Free Cash Flow $ in millions, unaudited) ● Average DAUs: 151.5M, up 70% YoY ● Hours engaged: 39.6B, up 91% YoY ● Average MUPs: 35.8M, up 88% YoY ● Revenue: $1,359.6M, up 48% YoY ● Bookings: $1,921.8M, up 70% YoY ● Consolidated net loss: $257.4M ● Adjusted EBITDA*: $45.7M ● Operating cash flow: $546.2M, up 121% YoY ● Free cash flow: $442.6M, up 103% YoY *Adjusted EBITDA excludes an adjustment for a total net increase in deferred revenue & deferred cost of revenue of $457.9M “Our third-quarter results demonstrate the tremendous progress weʼve made toward our goal of capturing 10% of the global gaming market. Our platform and creator ecosystem are healthier than ever before, driven by broad-based strength, new viral hits, and our strategic investments in creator economics, platform performance, discovery, and the virtual economy. We are on track to expand age estimation to all Roblox users who access our communication features by early next year. We believe this initiative will establish a best in class standard for communication safety on social media and communications platforms,ˮ said David Baszucki, founder and CEO of Roblox. Third Quarter 2025 Financial and Operational Highlights 1 Average DAUs: 151.5M, up 70% YoY Hours engaged: 39.6B, up 91% YoY Average MUPs: 35.8M, up 8 % YoY Revenue: $1,359.6M, up 48% YoY Bo kings: $1,921.8M, up 70% YoY Consolidated net los : $257.4M Adjusted EBITDA*: $45.7M Operating cash flow: $546.2M, up 121% YoY Fre cash flow: $4 2.6M, up 103% YoY
To Our Shareholders: Roblox has experienced extraordinary growth in the past two quarters. In Q3, revenue grew 48% year-over-year, bookings grew 70% year-over-year and we exceeded 150 million average daily active users (“DAUs”). We are well on our way to capturing 10% of the global gaming content market while connecting 1 billion people with optimism and civility. We are raising our guidance for the remainder of 2025. Based on these latest expectations, we are on track to deliver 37% average annual bookings growth across 2024 and 2025, putting us at least two years ahead of the long-term guidance we issued in late 2023. This is true with respect to both topline growth and margin expansion. With this scale, we see opportunities to redouble our innovation and investment in ways that further distinguish our platform and feed the flywheel of users, content, and monetization. This starts with our goal of establishing Roblox as the gold standard for communication safety on the internet. We plan to use newly available technologies to further raise the bar on our already industry leading safety practices. As we establish the mantle of safety, we also aspire to unlock the next generation of AI-powered game creation and game play using world models built by Roblox, trained on over 13 billion hours of interactive data per month and, over time, increasingly running on Roblox infrastructure (just as our core and edge data centers power us today). While these opportunities may require incremental near term investment, our decision to pursue them now, reflects our commitment to prioritize safety and long-term growth above near term results. We are enthusiastic about the value these opportunities can create in combination with numerous other initiatives currently underway across the company – all of which facilitate our goal for genre and audience expansion on Roblox. Our third quarter results demonstrate this tremendous momentum and highlight the exciting opportunities ahead. 2
Platform Update Our Q3 2025 results reflect the growing diversity of users and content on the Roblox platform, coupled with deepening engagement and strong monetization. DAUs grew 70% year-over year to 151.5 million, an increase of 36% from Q2. User growth was even stronger among users aged 13 and older (“13+”) which grew 89% year-over-year. We also saw continued diversification of Roblox's geographic footprint as DAUs outside of the U.S. and Canada grew 81% year-over-year while U.S. and Canada DAUs also grew at 32% year-over-year. We saw positive trends in both content diversity and velocity in Q3. We observed continued success from Grow a Garden, and witnessed the rise of two new viral experiences: Steal a Brainrot and 99 Nights in the Forest. Each of these experiences achieved concurrent user peaks which would have exceeded those of our entire platform last year. In July, Grow a Garden set what was then a world record for the most concurrent videogame players at nearly 22 million. Earlier this month, Steal a Brainrot eclipsed 25 million concurrent players. While these viral experiences drove significant engagement, growth in the platform at large continues to be robust. Engagement in experiences outside the top 10 grew 58% year-over-year in Q3 and spending in experiences outside the top 10 grew 40% year-over-year. We also continue to observe healthy velocity among top content, with the number of new experiences (experiences created in the last 12 months) in our Top 100 (measured by engagement) increasing over 50% compared to Q3 2024. This combination of user expansion and increasing content diversity resulted in significant engagement growth. Hours Engaged (“Hours”) grew 91% year-over-year to 39.6 billion. Similar to user growth trends, Hours growth was strongest in APAC but also included 47% growth in the U.S. and Canada. Demographically speaking, engagement growth was higher among 13+ users with their total Hours increasing 107% year-over-year compared to a 67% increase for users aged under 13. Rapid expansion of the Roblox platform translated to significantly better than expected revenue and bookings performance. Revenue grew 48% year-on-year and bookings grew 70% year-on-year. Notably, average bookings per DAU grew in every region year-over-year and we added over 12 million average monthly unique payers (“MUPs”) sequentially, reaching 35.8 million. Payer growth was particularly strong in international markets where we believe initiatives such as 3
the launch of regional pricing for avatar marketplace items in June complemented the virality of top experiences to increase the geographical diversity of our payer base. Growth in international payers was dilutive to overall average bookings per monthly unique payer (“ABPMUP”) even though ABPMUP for U.S. and Canada grew more than 10% year-over-year. User growth, content diversity, and deepening engagement are driving the Roblox flywheel and yielding significant growth in monetization and a larger economic opportunity for our creator community. At the beginning of the year we aspired for our creators to earn over $1 billion in 2025. We have achieved that goal in only nine months. Moreover, creator participation in our extraordinary growth is broad based. Our top 1,000 creators are now earning an average of $1.1 million on an LTM basis, up over 40% compared to one year ago. 4
Key Initiative Updates Trust & Safety: While Roblox continues to experience tremendous growth, long-term platform success depends on being the gold standard for safety. Going beyond many other platforms, Roblox monitors text and voice communication for critical harms, we do not encrypt communication, we use filters designed to block the exchange of personal information and we prevent the sharing of images and videos in chat. In addition to these initiatives, we are continuing to innovate. We are committed to demonstrating what we believe will be an industry standard for communication safety early in Q1. We plan to require facial estimation for all users accessing communication functions, and to limit communication between adults and minors who do not know each other in real life. In addition, we are adopting International Age Rating Coalition (“IARC”) ratings to give parents and kids more transparency into content on Roblox. These new policies may negatively impact platform engagement in the short term, but we believe this is outweighed by the long-term benefits for our users, creators, and shareholders. Artificial Intelligence: AI Enhanced Safety. Roblox is an AI-led company deeply committed to user safety and civility. Our advanced AI infrastructure powers moderation systems that process billions of chat messages and millions of minutes of voice chat daily. We've open-sourced key safety tools like RoGuard for LLM safety, Sentinel for text, and a voice safety classifier model, demonstrating our commitment to collaborating with the open-source community. These proactive measures have led to a significant reduction in abuse report rates and have helped us more rapidly and more accurately detect and escalate potential child endangerment cases to law enforcement. Our approach combines robust AI with human expertise to continuously improve our models and address complex safety challenges at scale. AI Augmented Creation. Roblox is reinventing immersive 3D creation with AI, empowering both novice and skilled creators. Our generative AI tools, such as Cube 3D, a 1.8 billion-parameter mesh generation model, allow creators and users to create 3D objects from text prompts, accelerating prototyping and enabling unprecedented personalization. We're also advancing towards "4D creation," which will introduce functional and interactive objects. Every day, over 150 million DAUs engage with the Roblox platform, generating an equivalent of over 30,000 years of multi-modal 5
human interaction data. This data is crucial for training generative and world models, encompassing 3D environments, video, voice, player movement, and user intent. Roblox has built the AI infrastructure to enhance its training and inference capabilities for building world models, with over 400 AI model inferences and a 4D foundation model. Roblox is committed to using this data privately, compliantly, and we have no intention to ever sell it. AI Powered Discovery. Enhancing user experience through algorithmic discovery and personalization is a core focus for Roblox. With over 150 million DAUs and tens of millions of experiences, our AI-driven platform ensures that users can find content tailored to their individual preferences. As described below, we’ve launched several AI powered discovery features this year which have benefited engagement and discovery of new content. Apps, Social, and Discovery: We launched Moments in September as a new way for users to engage with content on Roblox. While overall usage is limited by the beta entry points, we are excited by the early data: today over 30% of moments viewers join games from the Moments feed, providing an encouraging signal about the long-term potential of Moments as a discovery surface. In the coming months, we are focused on developer API launches, core quality improvements, and more prominent placement. Beyond Moments, we are consistently evolving the Roblox user experience to improve safety, discovery, and platform engagement. Our recommendation engine is getting better at highlighting experiences that drive long term ecosystem health by incorporating signals like qualified play-through rate, 7-day play days per user, and 7-day intentional co-play days (among others). Consistent with our commitment to transparency, earlier this year we shared the set of signals utilized by our algorithms to recognize and promote content on the platform. Creators now have access to a dashboard that shows how their experiences are performing against these signals and how comparable experiences are performing. This quarter, we saw a 20% year-over-year increase in the number of unique experiences surfaced per 1 million recommendations. We also worked to make discovery safer by adding ratings requirements for all experiences. As a result, we removed access to millions of unrated experiences and built a process to provide ratings for more than 200,000 unrated experiences that are no longer maintained by an active creator. Finally, this quarter we also reduced median app load times by 10% year-over-year across our platforms, which has historically correlated to improved engagement, retention, and monetization. 6

Infrastructure: The explosive growth Roblox has experienced over the past few quarters would not have been possible at efficient cost without our purpose built and managed infrastructure. Q3 saw almost 40 billion Hours and multiple new records for concurrency, including over 45 million concurrent users on August 23, 2025. This level of concurrency has been enabled by cloud bursting technology launched earlier this year which allows Roblox to optimize our owned infrastructure for high utilization while serving peak loads with third party cloud resources. Looking ahead, we are focused on scaling Roblox’s infrastructure to support our ambitions for user growth, AI, safety, and game performance. This will include further CapEx investment in owned infrastructure and onboarding new cloud partners to ensure appropriate elastic capacity. In Q4 we plan to start deploying GPUs at scale in our own data centers to support training and inference loads of the AI models now powering Roblox. From a cost-to-serve perspective, we expect growth in AI related workloads to dilute near-term cost reduction opportunities. Economy: Regional Pricing. In June 2025, we expanded our regional pricing offering to include both Game Passes and Marketplace items. We believe this launch helped increase payer penetration on our platform, particularly in countries like Indonesia, where we have seen significant year-over-year growth in payers due to lower revenue-optimizing price points. We further expanded regional pricing to cover Developer Products in October. Creator Economics. We launched two key initiatives to improve our creator community’s economic share in the quarter: ● Creator Rewards replaced our Premium Payouts program, aligning creator returns with high-value actions that build long term growth and engagement across both individual games and the overall platform. ● DevEx Rate Increase. On September 5, 2025, we announced an 8.5% increase in our creator community’s economic share, moving the rate from $3.50 to $3.80 per thousand Earned Robux. We believe incremental increases in developer exchange fees correlate with increases in creator dedication, focus, and recruitment - leading to genre expansion and ultimately deeper engagement and monetization. 7

Advertising: Native Advertising. Approximately 18,000 creators used traffic driving ads in Q3, up 27% from Q2 and over 30 of our top 100 creators by engagement are using Ads Manager to grow their audience. Spend on traffic driving advertising by our creators more than doubled on a year-over-year basis, though total dollars remain modest. During Q3 we deployed a number of improvements to Ads Manager which helped drive adoption and performance of sponsored tiles including a more than 30% reduction in cost per play compared to Q2. Mass Market. In Q3, we launched our rewarded video to limited general availability with over 140 creators onboarded. Feedback from our creators has been highly positive and we see strong product-market fit. That said, this will take time to build as we iterate with key creators to optimize ad load and performance. Content Integrations. Our partnerships with leading studios continue to deliver strong results, exemplified by Universal Pictures' recent Jurassic World: Rebirth campaign which garnered approximately 2 billion impressions over three weeks. This success underscores Roblox’s ability to bring iconic IP to life and engage fans in new ways. Beyond entertainment, we’re encouraged by the growing expansion of partners across diverse sectors, including non-endemic brands such as Sam’s Club, Venmo, and Snap. 8

Financial Results Our Q3 results significantly exceeded both our top and bottom line guidance. Revenue grew 48% year-over-year to $1,359.6 million, and bookings grew 70% year-over-year reaching $1,921.8 million.1 Notably, revenue and bookings growth accelerated significantly across all regions on both a year-over-year and sequential basis. Cost of revenue grew 45% year-over-year, totaling $296.5 million, representing 21.8% of revenue. When combined with changes in deferred cost of revenue, cost of revenue as percent of bookings improved by 100 basis points, consistent with our ongoing goal to improve gross margins through various product and business development initiatives. In addition to strong topline performance, Q3 saw continued operating leverage in certain key fixed costs, enabling us to increase developer exchange fees while still delivering a 600 basis point improvement in operating margins. Specifically: ● Developer exchange fees grew 85% year-over-year, totaling $427.9 million. Developer exchange fees were 31.5% of revenue and 22.3% of bookings in Q3 2025 compared to 25.2% of revenue and 20.5% of bookings in Q3 2024. On September 5, 2025, the DevEx rate increased by 8.5%, resulting in a $9.7 million increase in developer exchange fees during the quarter. ● Certain infrastructure and trust & safety expenses grew to $208.2 million in Q3 2025, 61% higher than Q3 2024 and 36% higher than Q2 2025. The year-over-year and sequential increases are largely driven by third-party cloud infrastructure expenses to support large increases in concurrent players during the quarter. These costs amounted to 15.3% of revenue and 10.8% of bookings in Q3 2025 compared to 14.1% of revenue and 11.5% of bookings in Q3 2024. ● Personnel costs exclusive of stock-based compensation expenses were $250.4 million, growing 24% year-over-year. These costs amounted to 18.4% of revenue and 13.0% of bookings in Q3 2025 compared to 22.0% of revenue and 17.9% of bookings in Q3 2024. 1 On a constant currency basis, revenue was up 47% year-over-year and bookings were up 68% year-over-year. Constant currency is calculated by converting our current period bookings and associated revenue generated from current period bookings into U.S. dollars using the comparative prior period’s monthly exchange rates for our non-USD currencies, rather than the actual average exchange rates in effect during the current period. By adjusting revenue and bookings for constant currency, we are able to provide a framework for assessing how our business performed excluding the effect of foreign currency rate fluctuations. 9

Consolidated net loss was $257.4 million, compared to $240.4 million in Q3 2024. Adjusted EBITDA was $45.7 million, compared to $55.0 million in Q3 2024. Adjusted EBITDA excludes adjustments for an increase in deferred revenue of $572.9 million and an increase in deferred cost of revenue of $(115.0) million, or a total change in net deferrals of $457.9 million in Q3 2025 compared to a total change in net deferrals of $168.4 million in Q3 2024. Meanwhile, operating cash flow grew 121% year-over-year to $546.2 million and free cash flow totaled $442.6 million, up 103% year-over-year. As a reminder, for revenue purposes, the vast majority of the Q3 bookings outperformance is deferred and will be recognized as revenue over the estimated average lifetime of a paying user, which was 27 months during Q3 2025. Meanwhile, our primary operating costs, which include developer exchange fees, personnel costs, and certain infrastructure and trust & safety expenses, are recognized during the period. As a result, consolidated net loss increased and Adjusted EBITDA decreased year-over-year even as we experienced rapid year-over-year growth in both operating cash flow and free cash flow. Total cash, cash equivalents, and investments was $5.2 billion as of September 30, 2025, an increase of $1.3 billion compared to the previous year’s balance. Our fully diluted share count was 742.5 million shares as of September 30, 2025, an increase of 2% compared to the previous year. We use equity to hire and retain exceptional people and will continue to strike a balance between dilution and the key value drivers in our business, namely bookings and free cash flow growth. 10

Guidance Management guidance is as follows: For Q4 2025: ● Revenue of $1,350 million - $1,400 million, or year-over-year growth of 37-42%.2 ● Bookings of $2,000 million - $2,050 million, or year-over-year growth of 47-51%. ● Consolidated net loss between $(375) million - $(345) million. ● Adjusted EBITDA between $(20) million - $10 million, which excludes an adjustment for a total net increase in deferred revenue and deferred cost of revenue of $555 million. ● Operating cash flow between $425 million - $455 million. ● Capital expenditures of $325 million. ● Free cash flow between $100 million - $130 million. For fiscal 2025: ● Revenue of $4,826 million - $4,876 million, or year-over-year growth of 34-35%.2 ○ The growth rate is impacted by a $98.0 million acceleration of revenue recorded in FY 2024, due to the decrease in the estimated average paying user life from 28 months to 27 months in Q2 2024. ● Bookings of $6,566 million - $6,616 million, or year-over-year growth of 50-51%. ● Consolidated net loss between $(1,129) million - $(1,099) million. ● Adjusted EBITDA between $102 million - $132 million, which excludes an adjustment for a total net increase in deferred revenue and deferred cost of revenue of $1,462 million. ● Operating cash flow between $1,614 million - $1,644 million. ● Capital expenditures of $468 million. This is an increase of $158 million over prior guidance to meet the faster-than-expected surge in demand and to invest in strategic initiatives like safety and AI. ● Free cash flow between $1,146 million - $1,176 million. Our Q4 2025 bookings guidance is based on trends observed through the tail-end of Q3 and early Q4. While viral hits from the summer have started to decline, new hits have begun to emerge and the broader platform continues to demonstrate healthy bookings growth. That said, it remains challenging to predict the exact timing and longevity of new hits and we therefore apply some 2 Our revenue guidance assumes that there are no material changes in estimates used in our revenue recognition, such as the estimated consumable/durable allocation of virtual goods purchased on the Platform and the estimated average lifetime of a paying user. 11

conservatism in our bookings guidance, particularly given the heavy backweighting of Q4 bookings in the last few days of the quarter. In raising our Q4 2025 bookings growth expectation to 47-51%, we’re bringing our full-year bookings growth expectation to 50-51%, a significant increase relative to our prior guidance. This level of bookings puts us on pace to deliver margins in 2025 that are well ahead of our long-term guidance. We want to highlight that the rapid topline growth we have experienced in the back half of 2025 has outpaced our ability to deploy some of the OpEx and CapEx investments we believe are important to ensuring sustainable growth. Our increased guidance for Q4 CapEx is an example of our growth investments catching-up with faster than expected bookings growth. Although we intend to provide formal 2026 guidance during our Q4 2025 earnings call, we believe directional comments may be helpful now, given the significant overperformance of both top and bottom line results during the past two quarters. We are clearly pacing ahead of our long term bookings goals. As previously noted, based on our 2025 guidance, bookings will have compounded 37% annually since the end of 2023. As we look to next year, our long-term objectives have not changed, though we recognize that tough comps and valuable new safety features will factor into reported growth in 2026. With respect to margins, we will continue to prioritize investments to support genre expansion and long-term growth. As a result, our operating margin could decline slightly year-over-year due to the combination of higher DevEx rates and the impact of infrastructure and safety related investments catching up with rapid bookings growth in the back half of 2025. These investments will also require additional CapEx spend such that the total magnitude of CapEx will likely be roughly flat between 2025 and 2026. We still expect free cash flow growth to meaningfully exceed bookings growth in 2026 and we anticipate a reduction in share dilution in 2026 compared to 2025. While the path may not be entirely linear, we are increasingly bullish about our ability to capture 10% of the $180 billion global gaming content market on Roblox and, ultimately, become one of the great global consumer internet platforms. 12

EARNINGS Q&A SESSION We will host a live Q&A session to answer questions regarding our third quarter 2025 results on Thursday, October 30, 2025 at 5:30 a.m. Pacific Time/8:30 a.m. Eastern Time. The live webcast and Q&A session will be open to the public at ir.roblox.com and we invite you to join us and to visit our investor relations website at ir.roblox.com to review supplemental information. 13

Roblox Corporation Unaudited Financial Statements ROBLOX CORPORATION CONDENSED CONSOLIDATED BALANCE SHEETS Unaudited (in thousands) As of September 30, 2025 December 31, 2024 Assets Current assets: Cash and cash equivalents $ 1,016,825 $ 711,683 Short-term investments 1,843,675 1,697,862 Accounts receivable—net of allowances 634,267 614,838 Prepaid expenses and other current assets 96,242 75,415 Deferred cost of revenue, current portion 761,967 628,232 Total current assets 4,352,976 3,728,030 Long-term investments 2,360,642 1,610,215 Property and equipment—net 677,024 659,589 Operating lease right-of-use assets 617,457 665,885 Deferred cost of revenue, long-term 397,375 321,824 Intangible assets, net 22,777 34,153 Goodwill 142,630 141,688 Other assets 19,928 13,619 Total assets $ 8,590,809 $ 7,175,003 Liabilities and Stockholders’ equity Current liabilities: Accounts payable $ 88,637 $ 42,885 Accrued expenses and other current liabilities 341,228 275,754 Developer exchange liability 391,689 339,600 Deferred revenue—current portion 3,708,932 3,004,969 Total current liabilities 4,530,486 3,663,208 Deferred revenue—net of current portion 1,978,861 1,567,007 Operating lease liabilities 617,898 670,051 Long-term debt, net 992,736 1,006,371 Other long-term liabilities 80,591 59,712 Total liabilities 8,200,572 6,966,349 Stockholders' equity: Common stock 64 62 Additional paid-in capital 5,136,014 4,220,916 Accumulated other comprehensive income/(loss) 16,185 (3,895) Accumulated deficit (4,744,694) (3,995,637) Total Roblox Corporation Stockholders' equity 407,569 221,446 Noncontrolling interest (17,332) (12,792) Total Stockholders' equity 390,237 208,654 Total Liabilities and Stockholders' equity $ 8,590,809 $ 7,175,003 14
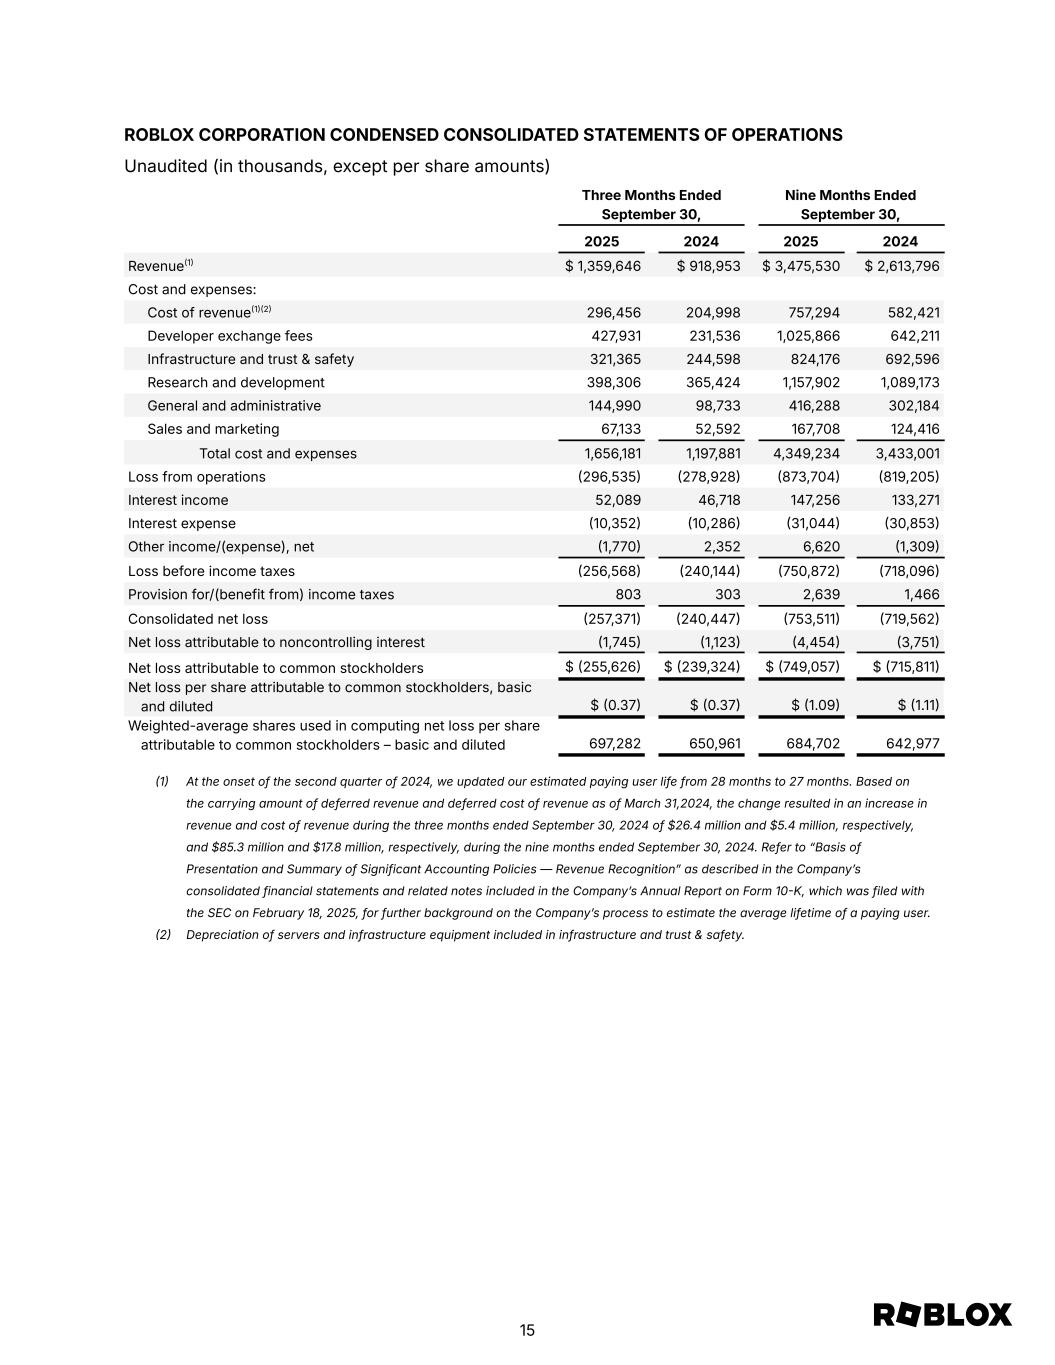
ROBLOX CORPORATION CONDENSED CONSOLIDATED STATEMENTS OF OPERATIONS Unaudited (in thousands, except per share amounts) Three Months Ended September 30, Nine Months Ended September 30, 2025 2024 2025 2024 Revenue(1) $ 1,359,646 $ 918,953 $ 3,475,530 $ 2,613,796 Cost and expenses: Cost of revenue(1)(2) 296,456 204,998 757,294 582,421 Developer exchange fees 427,931 231,536 1,025,866 642,211 Infrastructure and trust & safety 321,365 244,598 824,176 692,596 Research and development 398,306 365,424 1,157,902 1,089,173 General and administrative 144,990 98,733 416,288 302,184 Sales and marketing 67,133 52,592 167,708 124,416 Total cost and expenses 1,656,181 1,197,881 4,349,234 3,433,001 Loss from operations (296,535) (278,928) (873,704) (819,205) Interest income 52,089 46,718 147,256 133,271 Interest expense (10,352) (10,286) (31,044) (30,853) Other income/(expense), net (1,770) 2,352 6,620 (1,309) Loss before income taxes (256,568) (240,144) (750,872) (718,096) Provision for/(benefit from) income taxes 803 303 2,639 1,466 Consolidated net loss (257,371) (240,447) (753,511) (719,562) Net loss attributable to noncontrolling interest (1,745) (1,123) (4,454) (3,751) Net loss attributable to common stockholders $ (255,626) $ (239,324) $ (749,057) $ (715,811) Net loss per share attributable to common stockholders, basic and diluted $ (0.37) $ (0.37) $ (1.09) $ (1.11) Weighted-average shares used in computing net loss per share attributable to common stockholders – basic and diluted 697,282 650,961 684,702 642,977 (1) At the onset of the second quarter of 2024, we updated our estimated paying user life from 28 months to 27 months. Based on the carrying amount of deferred revenue and deferred cost of revenue as of March 31,2024, the change resulted in an increase in revenue and cost of revenue during the three months ended September 30, 2024 of $26.4 million and $5.4 million, respectively, and $85.3 million and $17.8 million, respectively, during the nine months ended September 30, 2024. Refer to “Basis of Presentation and Summary of Significant Accounting Policies — Revenue Recognition” as described in the Company’s consolidated financial statements and related notes included in the Company’s Annual Report on Form 10-K, which was filed with the SEC on February 18, 2025, for further background on the Company’s process to estimate the average lifetime of a paying user. (2) Depreciation of servers and infrastructure equipment included in infrastructure and trust & safety. 15

ROBLOX CORPORATION CONDENSED CONSOLIDATED STATEMENTS OF CASH FLOWS Unaudited (in thousands) Three Months Ended September 30, Nine Months Ended September 30, 2025 2024 2025 2024 Cash flows from operating activities: Consolidated net loss $ (257,371) $ (240,447) $ (753,511) $ (719,562) Adjustments to reconcile consolidated net loss to net cash and cash equivalents provided by operating activities: Depreciation and amortization expense 55,313 68,613 162,831 175,126 Stock-based compensation expense 286,930 265,165 830,628 757,558 Operating lease non-cash expense 27,944 31,104 88,663 88,592 Accretion on marketable securities, net (15,760) (20,909) (50,199) (60,442) Amortization of debt issuance costs 359 344 1,065 1,023 Impairment expense, (gain)/loss on investment and other asset sales, and other, net (2,159) 1,907 2,527 2,350 Changes in operating assets and liabilities, net of effect of acquisitions: Accounts receivable (109,112) (40,585) (21,424) 119,460 Prepaid expenses and other current assets 2,912 16,295 (21,573) 3,340 Deferred cost of revenue (115,294) (46,876) (208,615) (99,491) Other assets 922 1,744 (6,242) (4,922) Accounts payable 8,262 4,424 21,695 (4,404) Accrued expenses and other current liabilities 29,061 8,238 36,745 (15,278) Developer exchange liability 77,515 (18) 52,089 15,405 Deferred revenue 574,379 212,159 1,113,135 409,809 Operating lease liabilities (31,474) (25,292) (84,561) (54,621) Other long-term liabilities 13,757 11,564 26,107 23,882 Net cash and cash equivalents provided by operating activities 546,184 247,430 1,189,360 637,825 Cash flows from investing activities: Acquisition of property and equipment (102,582) (29,405) (142,557) (115,786) Payments related to business combination, net of cash acquired — (840) — (2,840) Purchases of intangible assets (1,000) — (1,000) (1,370) Purchases of investments (1,460,566) (1,607,405) (4,071,390) (3,474,187) Maturities of investments 859,189 842,450 2,668,639 2,431,770 Sales of investments 161,492 161,547 573,183 394,853 Net cash and cash equivalents used in investing activities (543,467) (633,653) (973,125) (767,560) Cash flows from financing activities: Proceeds from issuance of common stock 20,813 19,949 84,505 57,196 Financing payments related to acquisitions — — — (4,450) Net cash and cash equivalents provided by financing activities 20,813 19,949 84,505 52,746 Effect of exchange rate changes on cash and cash equivalents (1,275) 2,499 4,402 1,154 Net increase/(decrease) in cash and cash equivalents 22,255 (363,775) 305,142 (75,835) Cash and cash equivalents Beginning of period 994,570 966,406 711,683 678,466 End of period $ 1,016,825 $ 602,631 $ 1,016,825 $ 602,631 16

Forward-Looking Statements This letter and the live webcast and Q&A session which will be held at 5:30 a.m. Pacific Time/8:30 a.m. Eastern Time on Thursday, October 30, 2025 contain “forward-looking statements” within the meaning of the “safe harbor” provisions of the Private Securities Litigation Reform Act of 1995, including but not limited to, statements regarding our vision to connect one billion users with optimism and civility, our vision to reach 10% of the global gaming content market, the amount of expected earnings for the developer and creator community, our efforts to improve the Roblox Platform, our trust and safety efforts, including our efforts to expand age-estimation for expand age estimation to all users who access our on-platform communication features, our investments in AI-powered initiatives, including those related to complex safety challenges, discovery and personalization, and “4D creation”, our infrastructure and capital expenditure plans, including our deployment of GPUs in our data centers, our efforts toward scaled advertising on the platform, including our Google partnership and expansion of content integrations with new partners, our improvements to our creator economics, including our expansion of regional pricing and investments in our creator community, our product efforts regarding Moments, our business, product, strategy, and user growth, our investment strategy, including with respect to people and opportunities for and expectations of improvements in financial and operating metrics, including operating leverage, margin, free cash flow, operating expenses, and capital expenditures and cost-to-serve, our expectation of successfully executing such strategies and plans, disclosures regarding the seasonality of our business and future growth rates, including with respect to our user demographics, changes to our estimated average lifetime of a paying user and the resulting effect on revenue, cost of revenue, deferred revenue and deferred cost of revenue, our expectations of future net losses and net cash and cash equivalents provided by operating activities, payments to our developers and creators, statements by our Chief Executive Officer and Chief Financial Officer, our outlook and guidance for the fourth quarter and full year 2025 and future periods, and our outlook and guidance for 2026. These forward-looking statements are made as of the date they were first issued and were based on current plans, expectations, estimates, forecasts, and projections as well as the beliefs and assumptions of management. Words such as “expect,” “vision,” “envision,” “evolving,” “drive,” “anticipate,” “intend,” “maintain,” “should,” “believe,” “continue,” “plan,” “goal,” “opportunity,” “estimate,” “predict,” “may,” “will,” “could,” “hope,” “target,” “project,” “potential,” “might,” “shall,” “contemplate,” and “would,” and variations of these terms or the negative of these terms and similar expressions are intended to identify these forward-looking statements. Forward-looking statements are subject to a number of risks and uncertainties, many of which involve factors or circumstances that are beyond our control. Our actual results could differ materially from those stated or implied in forward-looking statements due to a number of factors, including but not limited to risks detailed in our filings with the Securities and Exchange Commission (the “SEC”), including our annual reports on Form 10-K, our quarterly reports on Form 10-Q, and other filings and reports we make with the SEC from time to time. In particular, the following factors, among others, could cause results to differ materially from those expressed or implied by such forward-looking statements: our ability to successfully execute our business and growth strategy; the sufficiency of our cash and cash equivalents to meet our liquidity needs, including the repayment of our senior notes; the demand for our platform in general; our ability to sustain virality of experiences on our platform; the seasonality of our 17
business and the impact of viral experiences; our ability to retain and increase our number of users, developers, and creators, while adequately scaling our infrastructure as engagement increases; changes in the average lifetime of a paying user; the impact of inflation, tariffs, and global economic conditions on our operations; the impact of changing legal and regulatory requirements on our business, including the use of verified parental consent; our ability to develop enhancements to our platform, and bring them to market in a timely manner; our ability to develop and protect our brand; any misuse of user data or other undesirable activity by third parties on our platform; our ability to maintain the security and availability of our platform; our ability to detect and minimize unauthorized use of our platform; and the impact of AI on our platform, users, creators, and developers. Additional information regarding these and other risks and uncertainties that could cause actual results to differ materially from our expectations is included in the reports we have filed or will file with the SEC, including our annual reports on Form 10-K and our quarterly reports on Form 10-Q. The forward-looking statements included in this letter represent our views as of the date of this letter. We anticipate that subsequent events and developments will cause our views to change. However, we undertake no intention or obligation to update or revise any forward-looking statements, whether as a result of new information, future events or otherwise. These forward-looking statements should not be relied upon as representing our views as of any date subsequent to the date of this letter. Special Note Regarding Operating Metrics Additional information regarding our core financial and operating metrics disclosed above is included in the reports we have filed or will file with the SEC, including our annual reports on Form 10-K and our quarterly reports on Form 10-Q. We encourage investors and others to review these reports in their entirety. 18
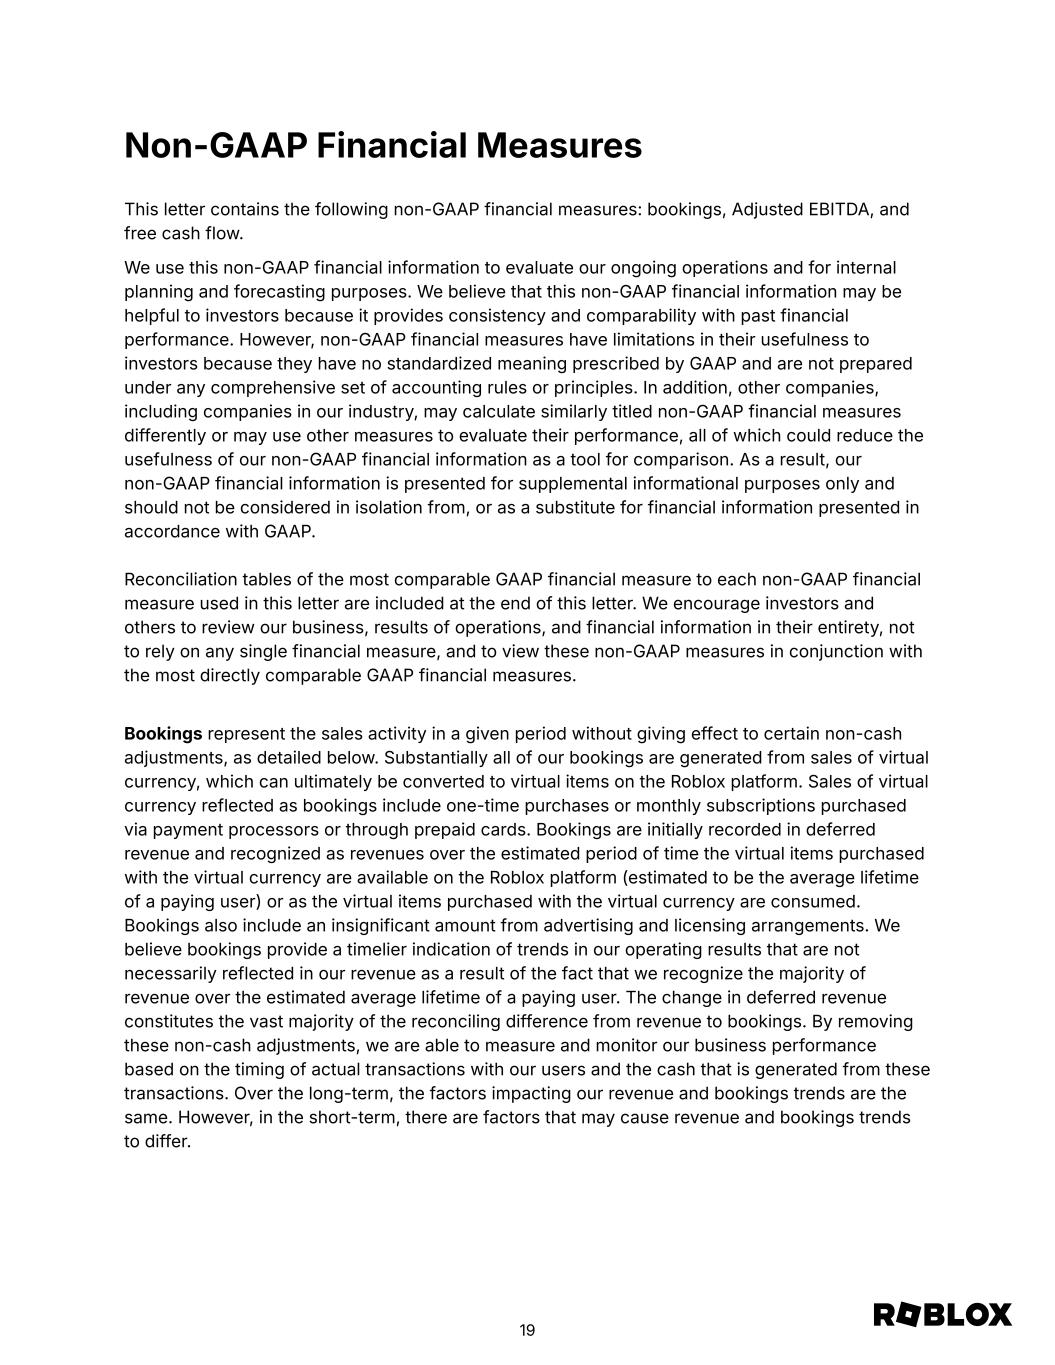
Non-GAAP Financial Measures This letter contains the following non-GAAP financial measures: bookings, Adjusted EBITDA, and free cash flow. We use this non-GAAP financial information to evaluate our ongoing operations and for internal planning and forecasting purposes. We believe that this non-GAAP financial information may be helpful to investors because it provides consistency and comparability with past financial performance. However, non-GAAP financial measures have limitations in their usefulness to investors because they have no standardized meaning prescribed by GAAP and are not prepared under any comprehensive set of accounting rules or principles. In addition, other companies, including companies in our industry, may calculate similarly titled non-GAAP financial measures differently or may use other measures to evaluate their performance, all of which could reduce the usefulness of our non-GAAP financial information as a tool for comparison. As a result, our non-GAAP financial information is presented for supplemental informational purposes only and should not be considered in isolation from, or as a substitute for financial information presented in accordance with GAAP. Reconciliation tables of the most comparable GAAP financial measure to each non-GAAP financial measure used in this letter are included at the end of this letter. We encourage investors and others to review our business, results of operations, and financial information in their entirety, not to rely on any single financial measure, and to view these non-GAAP measures in conjunction with the most directly comparable GAAP financial measures. Bookings represent the sales activity in a given period without giving effect to certain non-cash adjustments, as detailed below. Substantially all of our bookings are generated from sales of virtual currency, which can ultimately be converted to virtual items on the Roblox platform. Sales of virtual currency reflected as bookings include one-time purchases or monthly subscriptions purchased via payment processors or through prepaid cards. Bookings are initially recorded in deferred revenue and recognized as revenues over the estimated period of time the virtual items purchased with the virtual currency are available on the Roblox platform (estimated to be the average lifetime of a paying user) or as the virtual items purchased with the virtual currency are consumed. Bookings also include an insignificant amount from advertising and licensing arrangements. We believe bookings provide a timelier indication of trends in our operating results that are not necessarily reflected in our revenue as a result of the fact that we recognize the majority of revenue over the estimated average lifetime of a paying user. The change in deferred revenue constitutes the vast majority of the reconciling difference from revenue to bookings. By removing these non-cash adjustments, we are able to measure and monitor our business performance based on the timing of actual transactions with our users and the cash that is generated from these transactions. Over the long-term, the factors impacting our revenue and bookings trends are the same. However, in the short-term, there are factors that may cause revenue and bookings trends to differ. 19
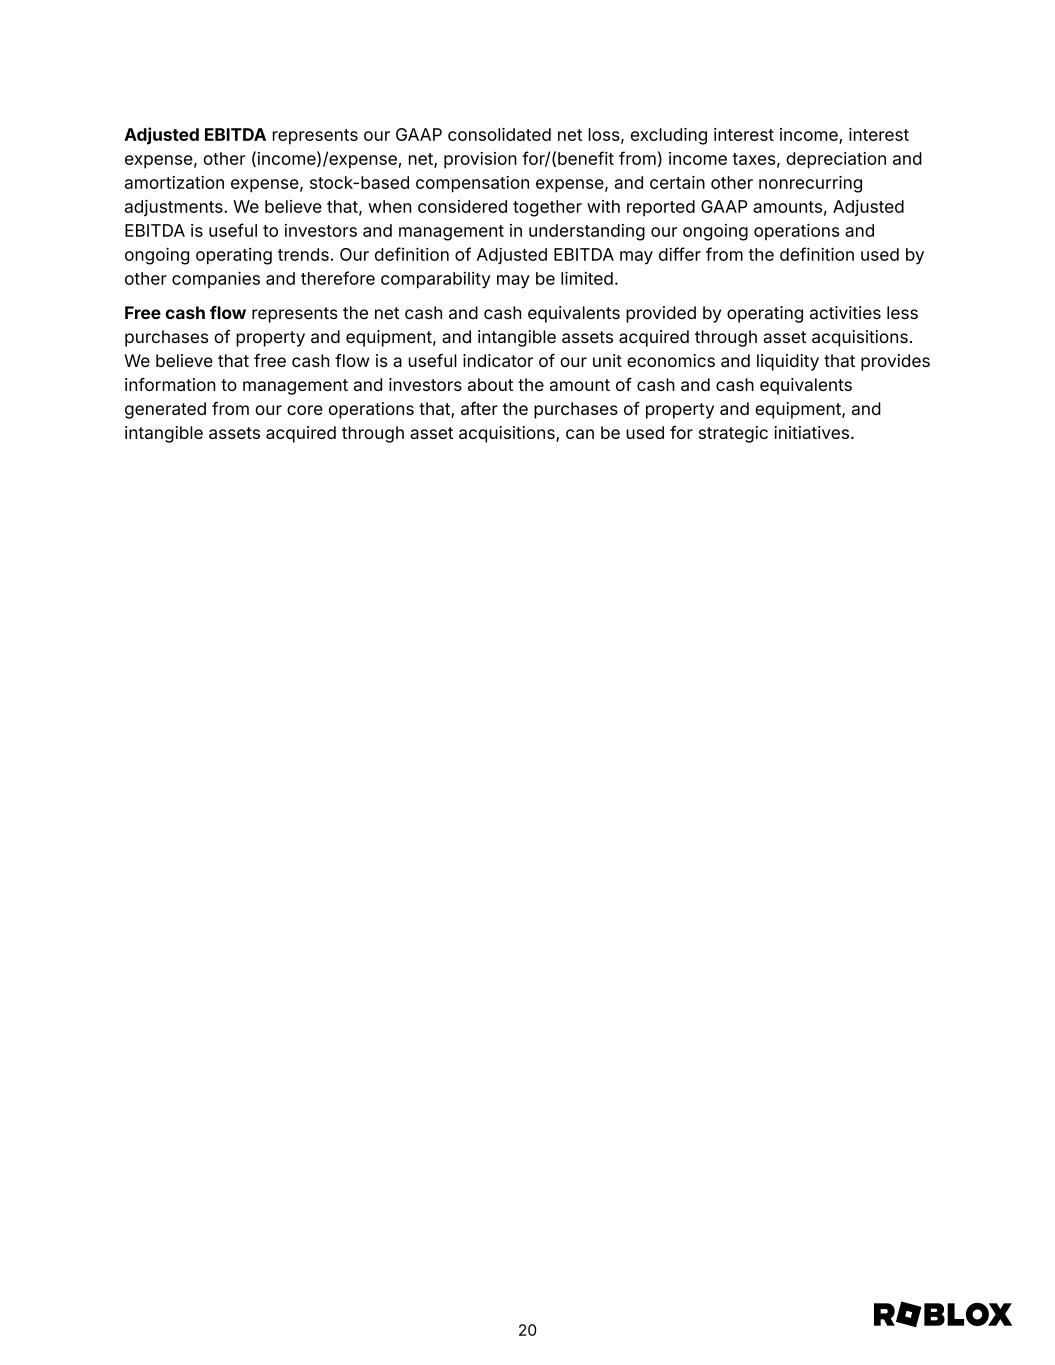
Adjusted EBITDA represents our GAAP consolidated net loss, excluding interest income, interest expense, other (income)/expense, net, provision for/(benefit from) income taxes, depreciation and amortization expense, stock-based compensation expense, and certain other nonrecurring adjustments. We believe that, when considered together with reported GAAP amounts, Adjusted EBITDA is useful to investors and management in understanding our ongoing operations and ongoing operating trends. Our definition of Adjusted EBITDA may differ from the definition used by other companies and therefore comparability may be limited. Free cash flow represents the net cash and cash equivalents provided by operating activities less purchases of property and equipment, and intangible assets acquired through asset acquisitions. We believe that free cash flow is a useful indicator of our unit economics and liquidity that provides information to management and investors about the amount of cash and cash equivalents generated from our core operations that, after the purchases of property and equipment, and intangible assets acquired through asset acquisitions, can be used for strategic initiatives. 20
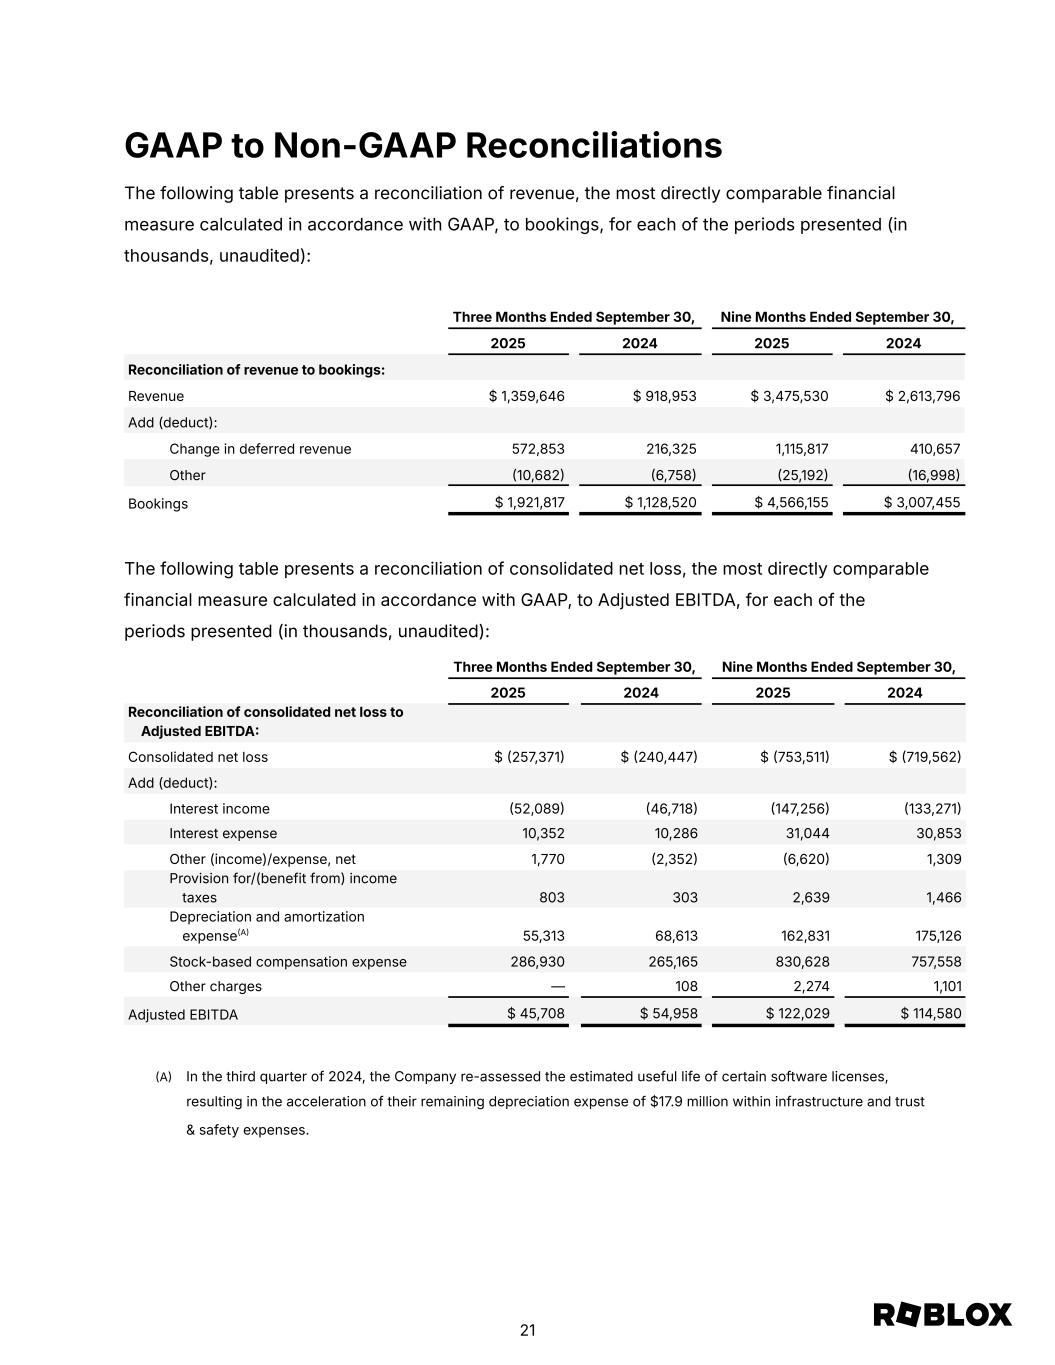
GAAP to Non-GAAP Reconciliations The following table presents a reconciliation of revenue, the most directly comparable financial measure calculated in accordance with GAAP, to bookings, for each of the periods presented (in thousands, unaudited): Three Months Ended September 30, Nine Months Ended September 30, 2025 2024 2025 2024 Reconciliation of revenue to bookings: Revenue $ 1,359,646 $ 918,953 $ 3,475,530 $ 2,613,796 Add (deduct): Change in deferred revenue 572,853 216,325 1,115,817 410,657 Other (10,682) (6,758) (25,192) (16,998) Bookings $ 1,921,817 $ 1,128,520 $ 4,566,155 $ 3,007,455 The following table presents a reconciliation of consolidated net loss, the most directly comparable financial measure calculated in accordance with GAAP, to Adjusted EBITDA, for each of the periods presented (in thousands, unaudited): Three Months Ended September 30, Nine Months Ended September 30, 2025 2024 2025 2024 Reconciliation of consolidated net loss to Adjusted EBITDA: Consolidated net loss $ (257,371) $ (240,447) $ (753,511) $ (719,562) Add (deduct): Interest income (52,089) (46,718) (147,256) (133,271) Interest expense 10,352 10,286 31,044 30,853 Other (income)/expense, net 1,770 (2,352) (6,620) 1,309 Provision for/(benefit from) income taxes 803 303 2,639 1,466 Depreciation and amortization expense(A) 55,313 68,613 162,831 175,126 Stock-based compensation expense 286,930 265,165 830,628 757,558 Other charges — 108 2,274 1,101 Adjusted EBITDA $ 45,708 $ 54,958 $ 122,029 $ 114,580 (A) In the third quarter of 2024, the Company re-assessed the estimated useful life of certain software licenses, resulting in the acceleration of their remaining depreciation expense of $17.9 million within infrastructure and trust & safety expenses. 21
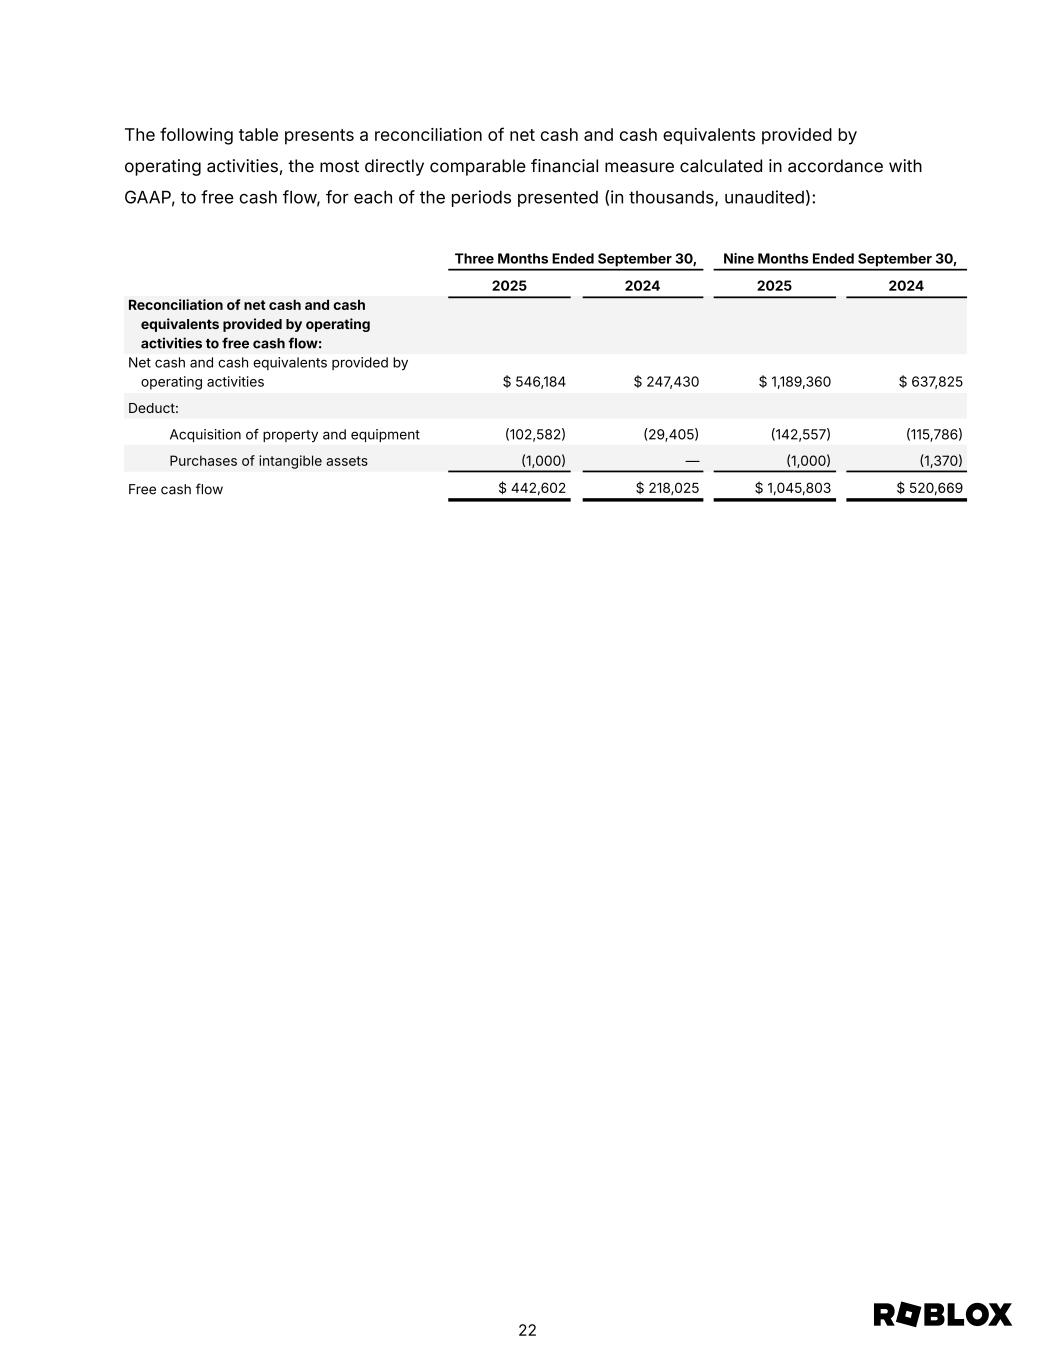
The following table presents a reconciliation of net cash and cash equivalents provided by operating activities, the most directly comparable financial measure calculated in accordance with GAAP, to free cash flow, for each of the periods presented (in thousands, unaudited): Three Months Ended September 30, Nine Months Ended September 30, 2025 2024 2025 2024 Reconciliation of net cash and cash equivalents provided by operating activities to free cash flow: Net cash and cash equivalents provided by operating activities $ 546,184 $ 247,430 $ 1,189,360 $ 637,825 Deduct: Acquisition of property and equipment (102,582) (29,405) (142,557) (115,786) Purchases of intangible assets (1,000) — (1,000) (1,370) Free cash flow $ 442,602 $ 218,025 $ 1,045,803 $ 520,669 22
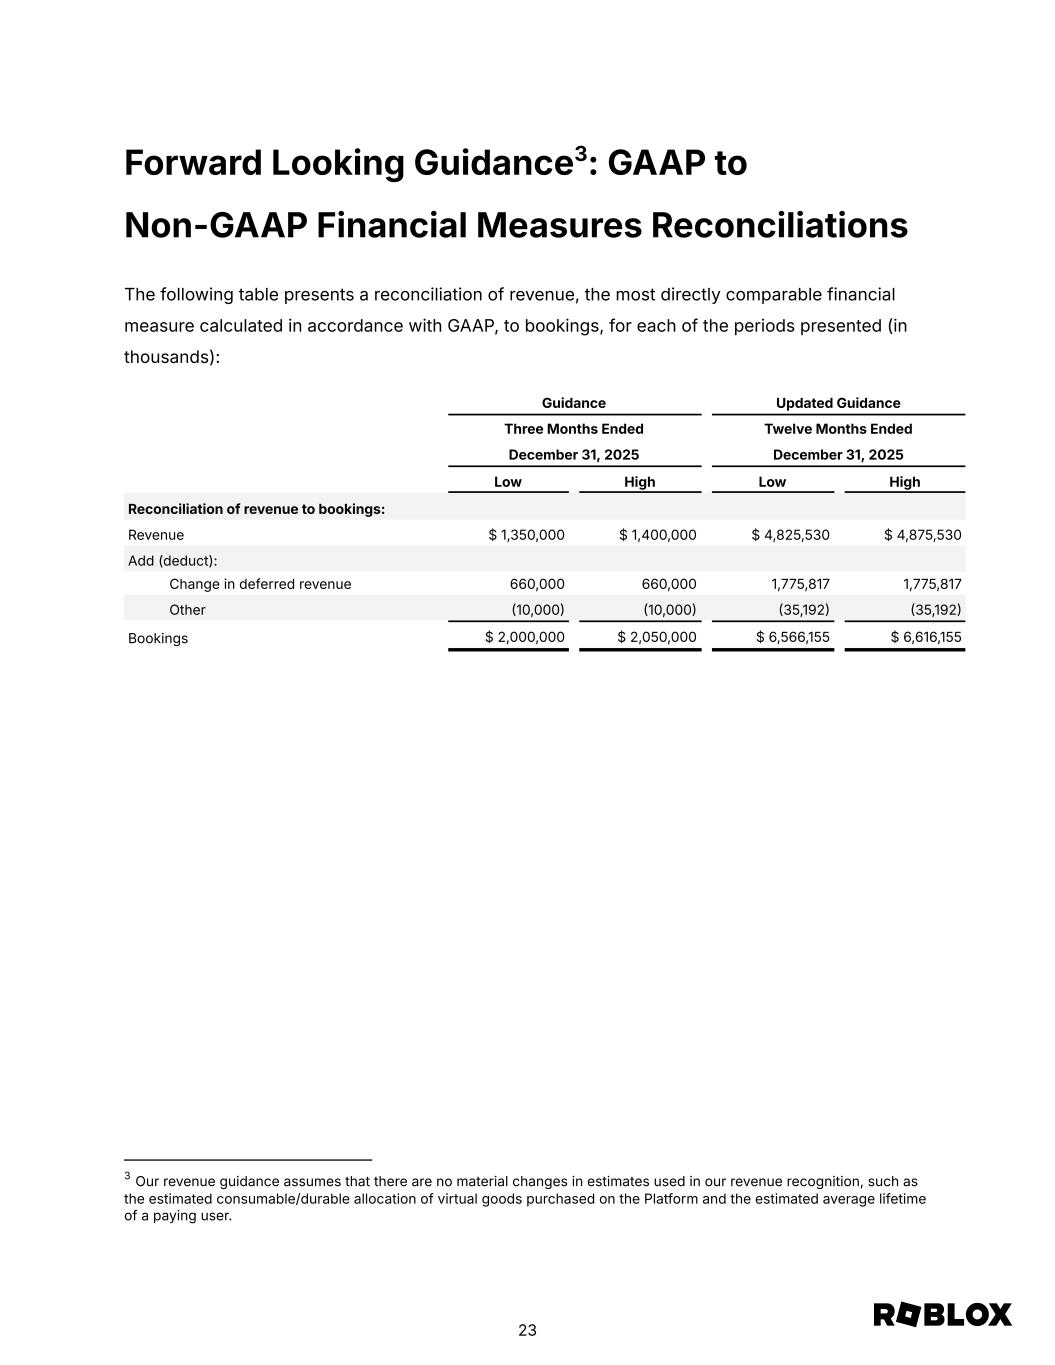
Forward Looking Guidance3: GAAP to Non-GAAP Financial Measures Reconciliations The following table presents a reconciliation of revenue, the most directly comparable financial measure calculated in accordance with GAAP, to bookings, for each of the periods presented (in thousands): Guidance Updated Guidance Three Months Ended Twelve Months Ended December 31, 2025 December 31, 2025 Low High Low High Reconciliation of revenue to bookings: Revenue $ 1,350,000 $ 1,400,000 $ 4,825,530 $ 4,875,530 Add (deduct): Change in deferred revenue 660,000 660,000 1,775,817 1,775,817 Other (10,000) (10,000) (35,192) (35,192) Bookings $ 2,000,000 $ 2,050,000 $ 6,566,155 $ 6,616,155 3 Our revenue guidance assumes that there are no material changes in estimates used in our revenue recognition, such as the estimated consumable/durable allocation of virtual goods purchased on the Platform and the estimated average lifetime of a paying user. 23
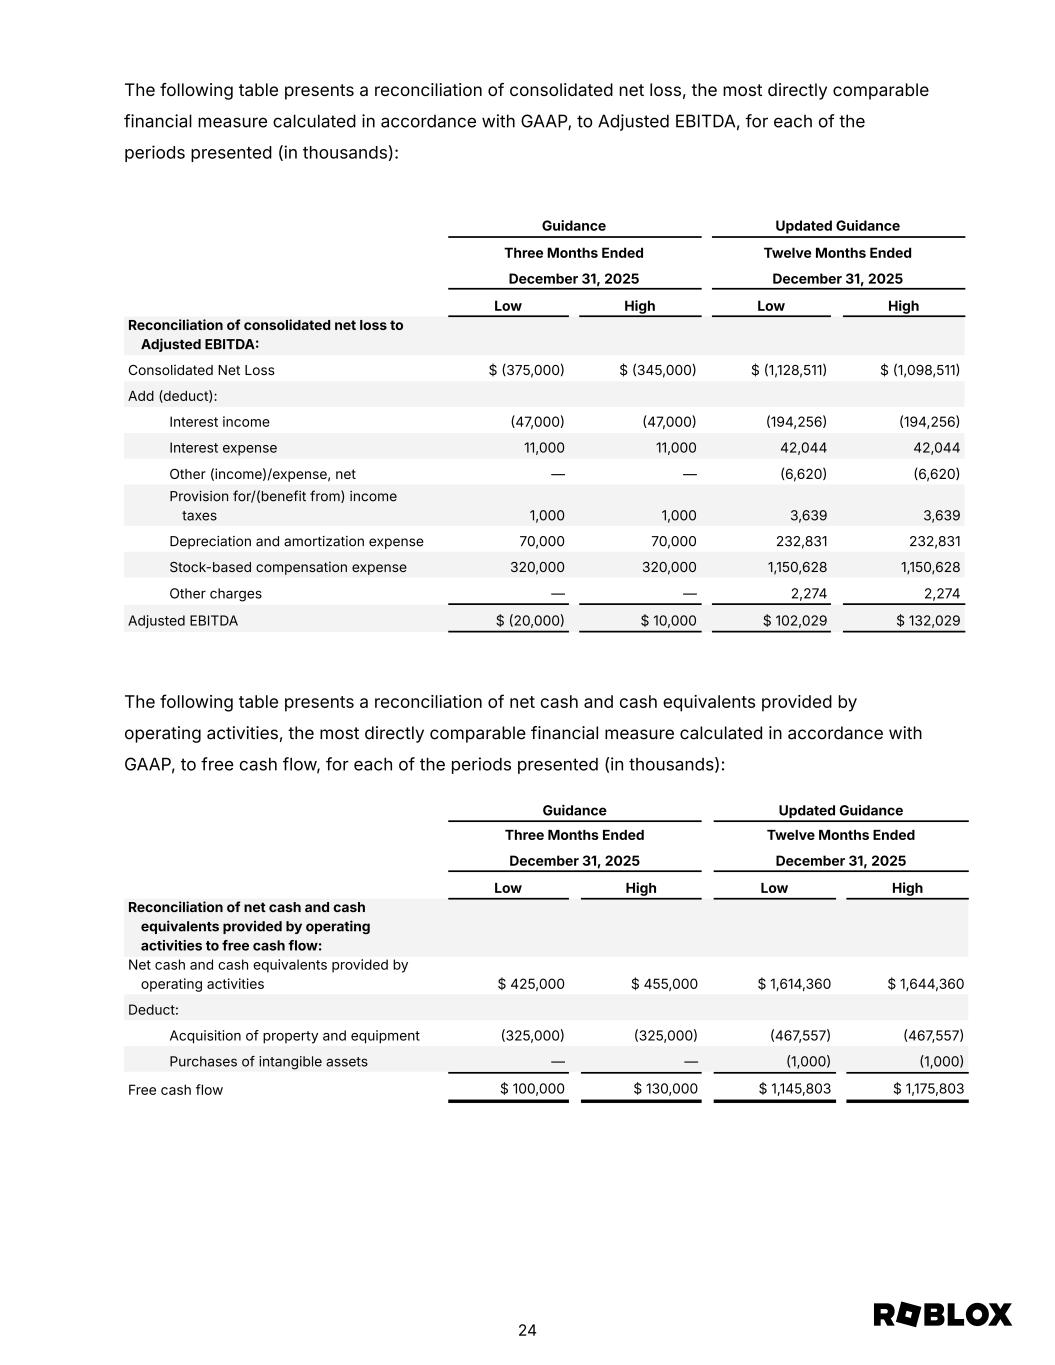
The following table presents a reconciliation of consolidated net loss, the most directly comparable financial measure calculated in accordance with GAAP, to Adjusted EBITDA, for each of the periods presented (in thousands): Guidance Updated Guidance Three Months Ended Twelve Months Ended December 31, 2025 December 31, 2025 Low High Low High Reconciliation of consolidated net loss to Adjusted EBITDA: Consolidated Net Loss $ (375,000) $ (345,000) $ (1,128,511) $ (1,098,511) Add (deduct): Interest income (47,000) (47,000) (194,256) (194,256) Interest expense 11,000 11,000 42,044 42,044 Other (income)/expense, net — — (6,620) (6,620) Provision for/(benefit from) income taxes 1,000 1,000 3,639 3,639 Depreciation and amortization expense 70,000 70,000 232,831 232,831 Stock-based compensation expense 320,000 320,000 1,150,628 1,150,628 Other charges — — 2,274 2,274 Adjusted EBITDA $ (20,000) $ 10,000 $ 102,029 $ 132,029 The following table presents a reconciliation of net cash and cash equivalents provided by operating activities, the most directly comparable financial measure calculated in accordance with GAAP, to free cash flow, for each of the periods presented (in thousands): Guidance Updated Guidance Three Months Ended Twelve Months Ended December 31, 2025 December 31, 2025 Low High Low High Reconciliation of net cash and cash equivalents provided by operating activities to free cash flow: Net cash and cash equivalents provided by operating activities $ 425,000 $ 455,000 $ 1,614,360 $ 1,644,360 Deduct: Acquisition of property and equipment (325,000) (325,000) (467,557) (467,557) Purchases of intangible assets — — (1,000) (1,000) Free cash flow $ 100,000 $ 130,000 $ 1,145,803 $ 1,175,803 24