| March 1, 2026 Confidential Discussion Materials Prepared for Project Stallion WELLS FARGO J.EMorgan |

| 2 C O N F I D E N T I A L P R O J E C T S T A L L I O N Topics for Today’s Discussion I. Transaction Summary II. Stallion Update III. Exit Considerations J.RMorgan WELLS FARGO |
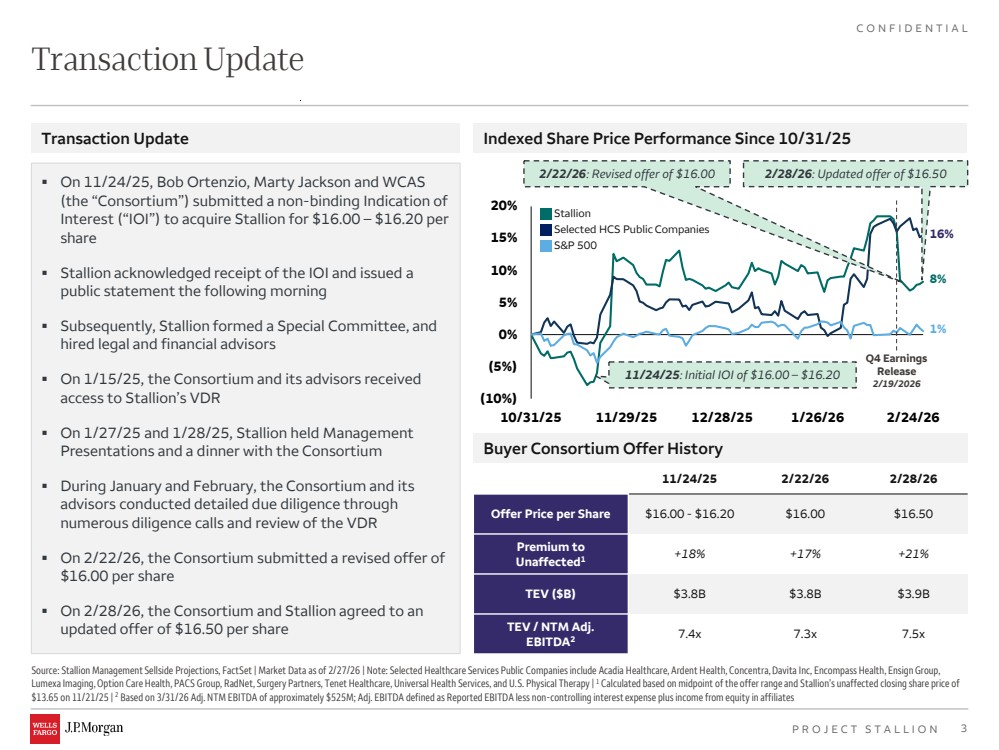
| 3 C O N F I D E N T I A L P R O J E C T S T A L L I O N Transaction Update ▪ On 11/24/25, Bob Ortenzio, Marty Jackson and WCAS (the “Consortium”) submitted a non-binding Indication of Interest (“IOI”) to acquire Stallion for $16.00 – $16.20 per share ▪ Stallion acknowledged receipt of the IOI and issued a public statement the following morning ▪ Subsequently, Stallion formed a Special Committee, and hired legal and financial advisors ▪ On 1/15/25, the Consortium and its advisors received access to Stallion’s VDR ▪ On 1/27/25 and 1/28/25, Stallion held Management Presentations and a dinner with the Consortium ▪ During January and February, the Consortium and its advisors conducted detailed due diligence through numerous diligence calls and review of the VDR ▪ On 2/22/26, the Consortium submitted a revised offer of $16.00 per share ▪ On 2/28/26, the Consortium and Stallion agreed to an updated offer of $16.50 per share Transaction Update Source: Stallion Management Sellside Projections, FactSet | Market Data as of 2/27/26 | Note: Selected Healthcare Services Public Companies include Acadia Healthcare, Ardent Health, Concentra, Davita Inc, Encompass Health, Ensign Group, Lumexa Imaging, Option Care Health, PACS Group, RadNet, Surgery Partners, Tenet Healthcare, Universal Health Services, and U.S. Physical Therapy | 1 Calculated based on midpoint of the offer range and Stallion’s unaffected closing share price of $13.65 on 11/21/25 | 2 Based on 3/31/26 Adj. NTM EBITDA of approximately $525M; Adj. EBITDA defined as Reported EBITDA less non-controlling interest expense plus income from equity in affiliates Indexed Share Price Performance Since 10/31/25 (10%) (5%) 0% 5% 10% 15% 20% 10/31/25 11/29/25 12/28/25 1/26/26 2/24/26 Stallion Selected HCS Public Companies S&P 500 8% 1% 16% Buyer Consortium Offer History 11/24/25: Initial IOI of $16.00 – $16.20 11/24/25 2/22/26 2/28/26 Offer Price per Share $16.00 - $16.20 $16.00 $16.50 Premium to Unaffected1 +18% +17% +21% TEV ($B) $3.8B $3.8B $3.9B TEV / NTM Adj. EBITDA2 7.4x 7.3x 7.5x Q4 Earnings Release 2/19/2026 2/22/26: Revised offer of $16.00 2/28/26: Updated offer of $16.50 |
| I. Transaction Summary |

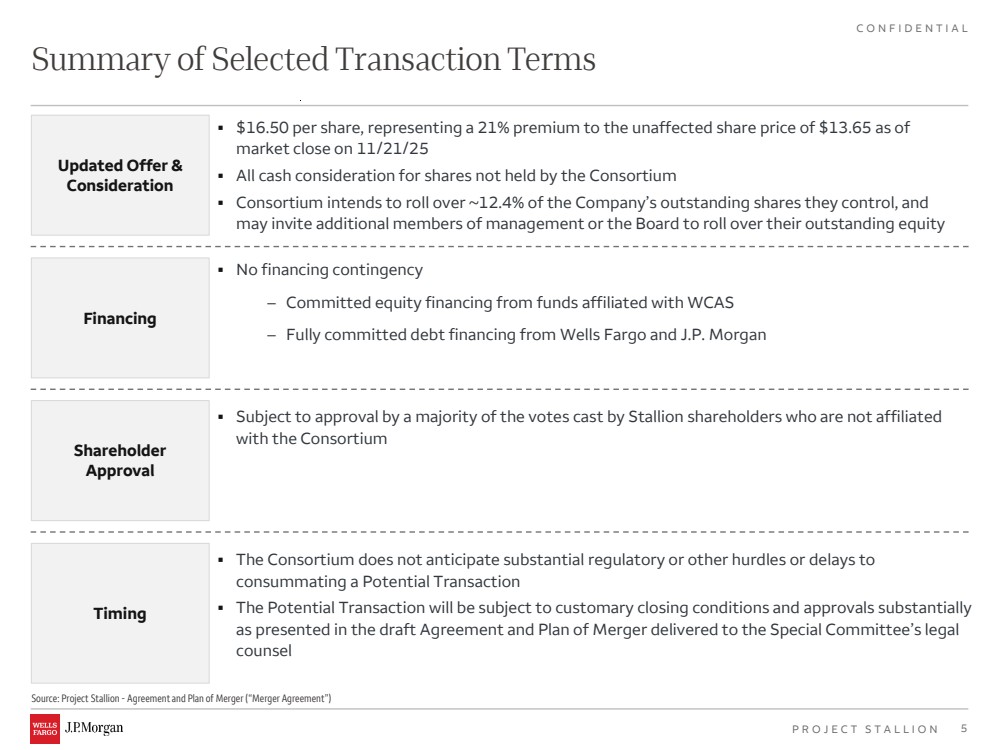
| 5 C O N F I D E N T I A L P R O J E C T S T A L L I O N Summary of Selected Transaction Terms Source: Project Stallion - Agreement and Plan of Merger (“Merger Agreement”) Updated Offer & Consideration Financing Shareholder Approval Timing ▪ $16.50 per share, representing a 21% premium to the unaffected share price of $13.65 as of market close on 11/21/25 ▪ All cash consideration for shares not held by the Consortium ▪ Consortium intends to roll over ~12.4% of the Company’s outstanding shares they control, and may invite additional members of management or the Board to roll over their outstanding equity ▪ No financing contingency ‒ Committed equity financing from funds affiliated with WCAS ‒ Fully committed debt financing from Wells Fargo and J.P. Morgan ▪ Subject to approval by a majority of the votes cast by Stallion shareholders who are not affiliated with the Consortium ▪ The Consortium does not anticipate substantial regulatory or other hurdles or delays to consummating a Potential Transaction ▪ The Potential Transaction will be subject to customary closing conditions and approvals substantially as presented in the draft Agreement and Plan of Merger delivered to the Special Committee’s legal counsel |
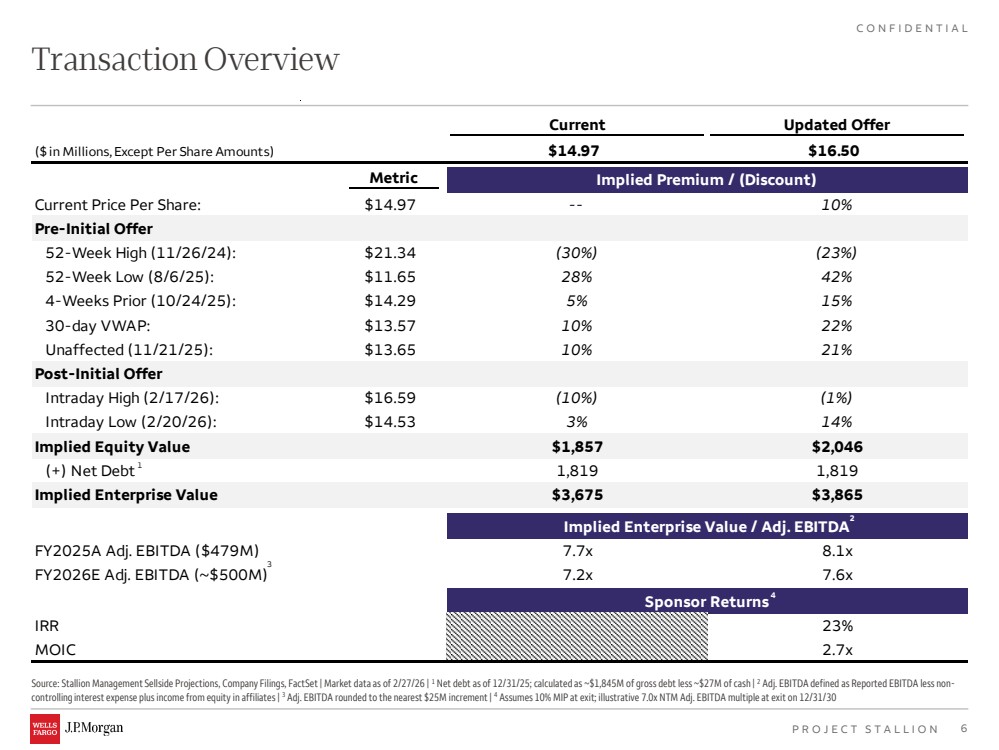
| 6 C O N F I D E N T I A L P R O J E C T S T A L L I O N Transaction Overview Source: Stallion Management Sellside Projections, Company Filings, FactSet | Market data as of 2/27/26 | 1 Net debt as of 12/31/25; calculated as ~$1,845M of gross debt less ~$27M of cash | 2 Adj. EBITDA defined as Reported EBITDA less non-controlling interest expense plus income from equity in affiliates | 3 Adj. EBITDA rounded to the nearest $25M increment | 4 Assumes 10% MIP at exit; illustrative 7.0x NTM Adj. EBITDA multiple at exit on 12/31/30 1 Current Updated Offer ($ in Millions, Except Per Share Amounts) $14.97 $16.50 Metric Implied Premium / (Discount) Current Price Per Share: $14.97 - - 10% Pre-Initial Offer 52-Week High (11/26/24): $21.34 (30%) (23%) 52-Week Low (8/6/25): $11.65 28% 42% 4-Weeks Prior (10/24/25): $14.29 5 % 15% 30-day VWAP: $13.57 10% 22% Unaffected (11/21/25): $13.65 10% 21% Post-Initial Offer Intraday High (2/17/26): $16.59 (10%) (1%) Intraday Low (2/20/26): $14.53 3 % 14% Implied Equity Value $1,857 $2,046 (+) Net Debt 1,819 1,819 Implied Enterprise Value $3,675 $3,865 Implied Enterprise Value / Adj. EBITDA FY2025A Adj. EBITDA ($479M) 7.7x 8.1x FY2026E Adj. EBITDA (~$500M) 7.2x 7.6x Sponsor Returns IRR 23% MOIC 2.7x 4 2 3 |
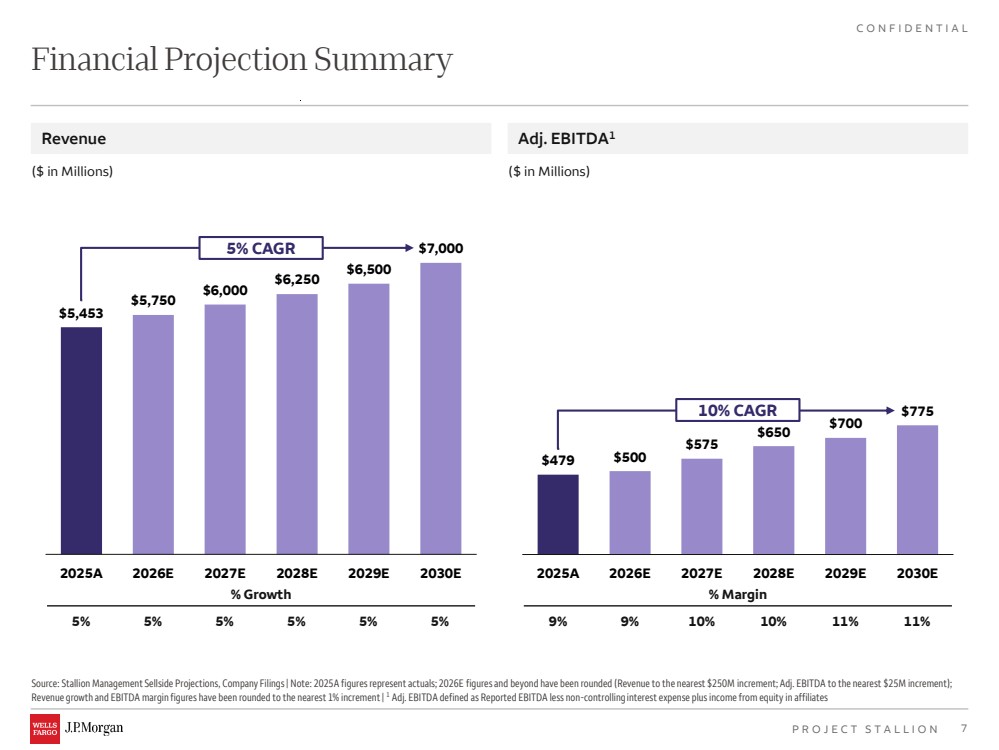
| 7 C O N F I D E N T I A L P R O J E C T S T A L L I O N Source: Stallion Management Sellside Projections, Company Filings | Note: 2025A figures represent actuals; 2026E figures and beyond have been rounded (Revenue to the nearest $250M increment; Adj. EBITDA to the nearest $25M increment); Revenue growth and EBITDA margin figures have been rounded to the nearest 1% increment | 1 Adj. EBITDA defined as Reported EBITDA less non-controlling interest expense plus income from equity in affiliates Financial Projection Summary Revenue Adj. EBITDA1 ($ in Millions) ($ in Millions) $5,453 $5,750 $6,000 $6,250 $6,500 $7,000 2025A 2026E 2027E 2028E 2029E 2030E $479 $500 $575 $650 $700 $775 2025A 2026E 2027E 2028E 2029E 2030E 5% CAGR % Margin 5% 5% 5% 5% 5% 5% 9% 9% 10% 11% 11% % Growth 10% CAGR 10% |
| II. Stallion Update |

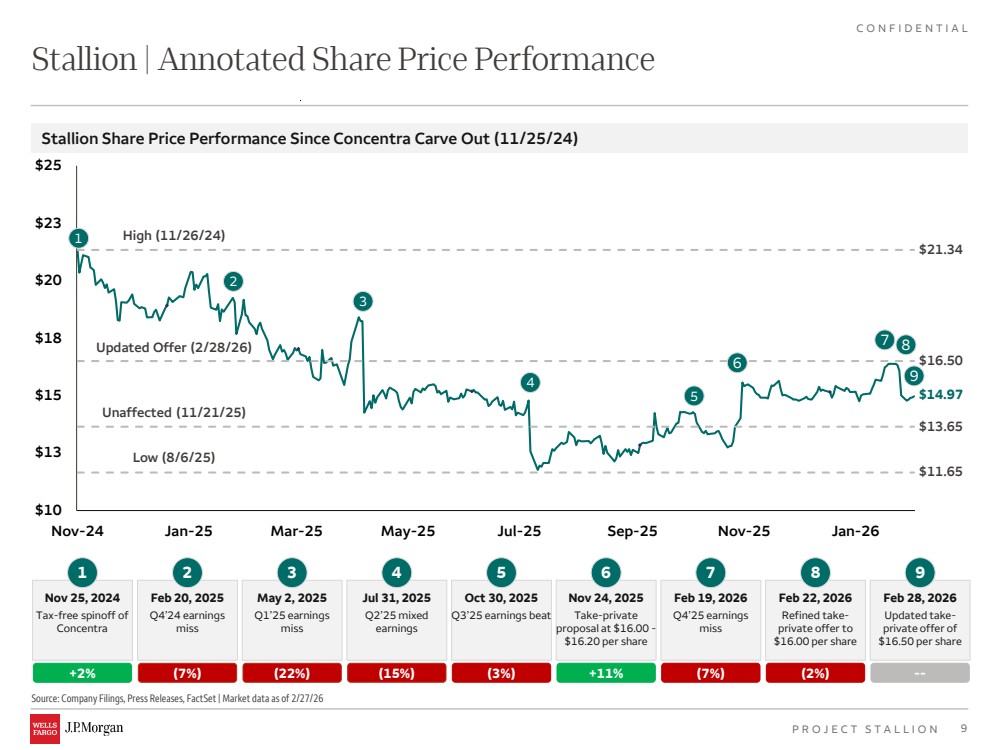
| 9 C O N F I D E N T I A L P R O J E C T S T A L L I O N High (11/26/24) Low (8/6/25) Unaffected (11/21/25) $10 $13 $15 $18 $20 $23 $25 Nov-24 Jan-25 Mar-25 May-25 Jul-25 Sep-25 Nov-25 Jan-26 Stallion | Annotated Share Price Performance Source: Company Filings, Press Releases, FactSet | Market data as of 2/27/26 $14.97 $11.65 2 3 4 $21.34 Nov 25, 2024 Tax-free spinoff of Concentra +2% Feb 20, 2025 Q4’24 earnings miss (7%) May 2, 2025 Q1’25 earnings miss (22%) 6 Jul 31, 2025 Q2’25 mixed earnings (15%) 7 Oct 30, 2025 Q3’25 earnings beat (3%) 5 Stallion Share Price Performance Since Concentra Carve Out (11/25/24) Nov 24, 2025 Take-private proposal at $16.00 - $16.20 per share +11% Feb 19, 2026 Q4’25 earnings miss (7%) 8 $13.65 $16.50 Updated Offer (2/28/26) 1 Feb 22, 2026 Refined take-private offer to $16.00 per share (2%) Feb 28, 2026 Updated take-private offer of $16.50 per share -- 1 2 3 4 5 6 7 8 9 9 |
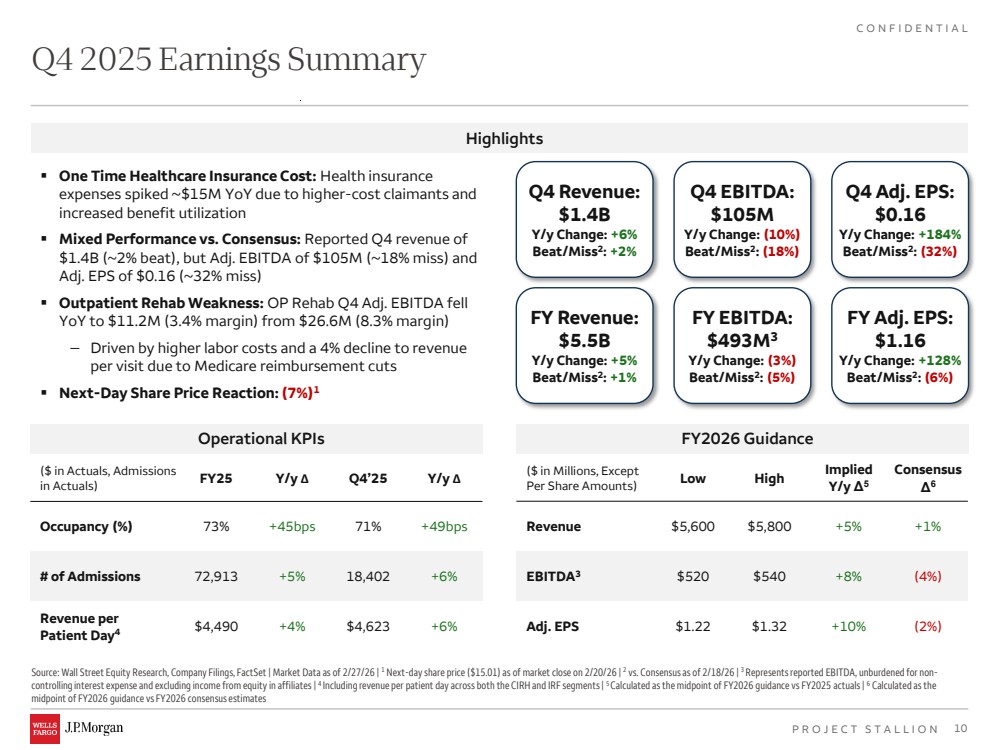
| 10 C O N F I D E N T I A L P R O J E C T S T A L L I O N ▪ One Time Healthcare Insurance Cost: Health insurance expenses spiked ~$15M YoY due to higher-cost claimants and increased benefit utilization ▪ Mixed Performance vs. Consensus: Reported Q4 revenue of $1.4B (~2% beat), but Adj. EBITDA of $105M (~18% miss) and Adj. EPS of $0.16 (~32% miss) ▪ Outpatient Rehab Weakness: OP Rehab Q4 Adj. EBITDA fell YoY to $11.2M (3.4% margin) from $26.6M (8.3% margin) ‒ Driven by higher labor costs and a 4% decline to revenue per visit due to Medicare reimbursement cuts ▪ Next-Day Share Price Reaction: (7%)1 Q4 2025 Earnings Summary Source: Wall Street Equity Research, Company Filings, FactSet | Market Data as of 2/27/26 | 1 Next-day share price ($15.01) as of market close on 2/20/26 | 2 vs. Consensus as of 2/18/26 | 3 Represents reported EBITDA, unburdened for non-controlling interest expense and excluding income from equity in affiliates | 4 Including revenue per patient day across both the CIRH and IRF segments | 5 Calculated as the midpoint of FY2026 guidance vs FY2025 actuals | 6 Calculated as the midpoint of FY2026 guidance vs FY2026 consensus estimates ($ in Actuals, Admissions in Actuals) FY25 Y/y Δ Q4’25 Y/y Δ Occupancy (%) 73% +45bps 71% +49bps # of Admissions 72,913 +5% 18,402 +6% Revenue per Patient Day4 $4,490 +4% $4,623 +6% ($ in Millions, Except Per Share Amounts) Low High Implied Y/y Δ5 Consensus Δ6 Revenue $5,600 $5,800 +5% +1% EBITDA3 $520 $540 +8% (4%) Adj. EPS $1.22 $1.32 +10% (2%) Q4 EBITDA: $105M Y/y Change: (10%) Beat/Miss2 : (18%) Q4 Revenue: $1.4B Y/y Change: +6% Beat/Miss2 : +2% Q4 Adj. EPS: $0.16 Y/y Change: +184% Beat/Miss2 : (32%) FY EBITDA: $493M3 Y/y Change: (3%) Beat/Miss2 : (5%) FY Revenue: $5.5B Y/y Change: +5% Beat/Miss2 : +1% FY Adj. EPS: $1.16 Y/y Change: +128% Beat/Miss2 : (6%) Highlights Operational KPIs FY2026 Guidance |
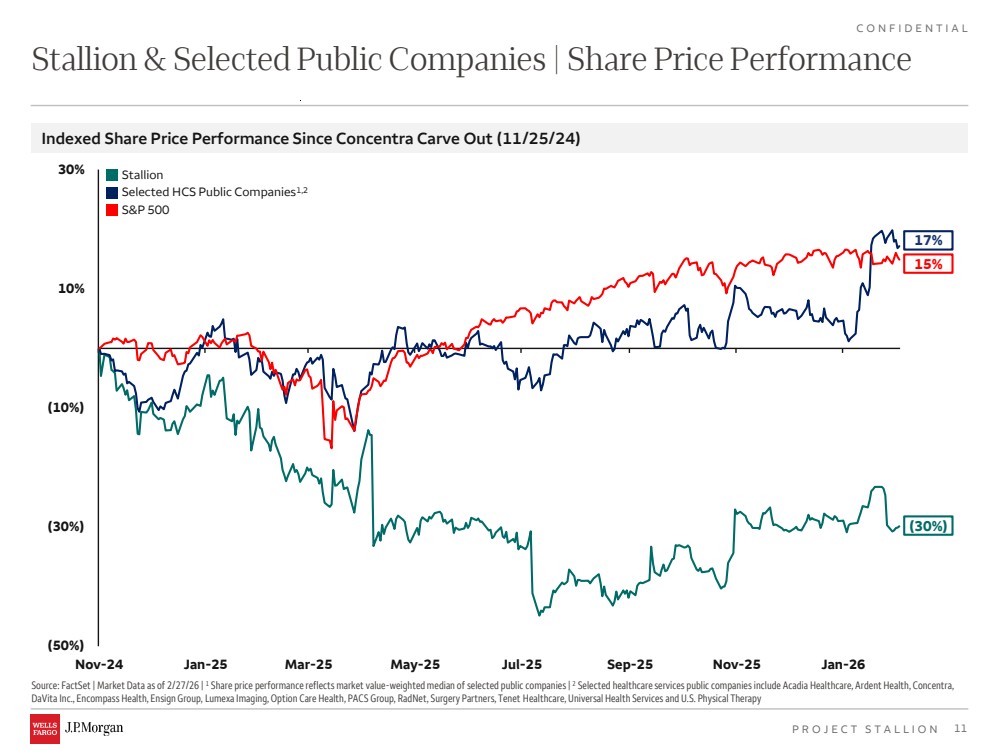
| 11 C O N F I D E N T I A L P R O J E C T S T A L L I O N Stallion & Selected Public Companies | Share Price Performance Source: FactSet | Market Data as of 2/27/26 | 1 Share price performance reflects market value-weighted median of selected public companies | 2 Selected healthcare services public companies include Acadia Healthcare, Ardent Health, Concentra, DaVita Inc., Encompass Health, Ensign Group, Lumexa Imaging, Option Care Health, PACS Group, RadNet, Surgery Partners, Tenet Healthcare, Universal Health Services and U.S. Physical Therapy Indexed Share Price Performance Since Concentra Carve Out (11/25/24) (50%) (30%) (10%) 10% 30% Nov-24 Jan-25 Mar-25 May-25 Jul-25 Sep-25 Nov-25 Jan-26 Stallion Selected HCS Public Companies1,2 S&P 500 (30%) 17% 15% |
| III. Exit Considerations |

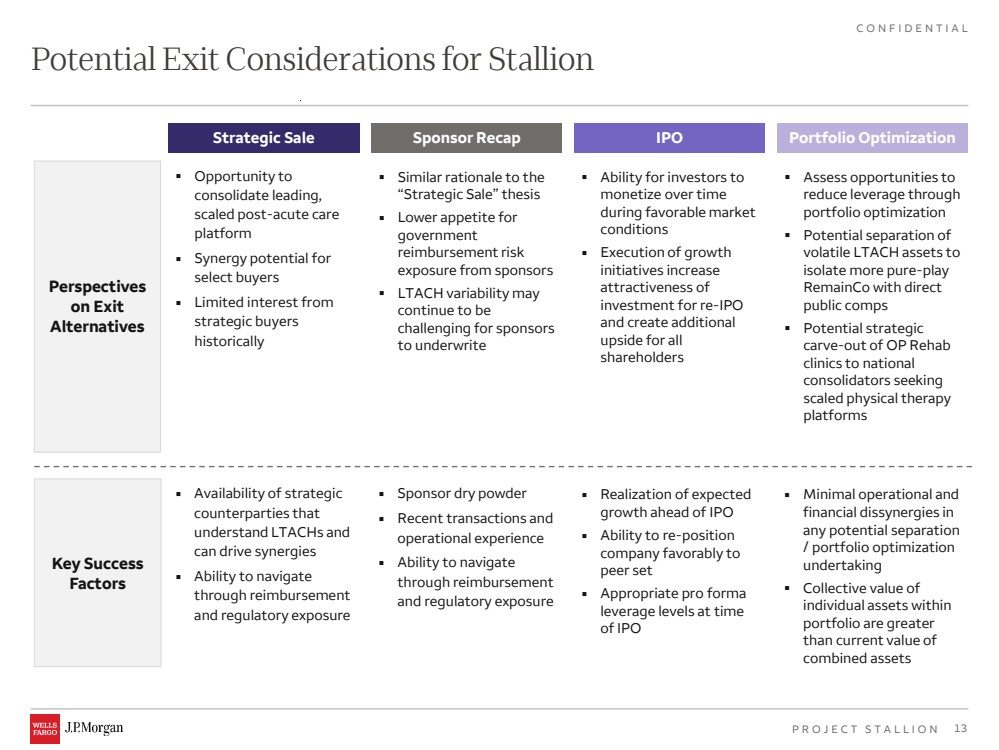
| 13 C O N F I D E N T I A L P R O J E C T S T A L L I O N Strategic Sale ▪ Opportunity to consolidate leading, scaled post-acute care platform ▪ Synergy potential for select buyers ▪ Limited interest from strategic buyers historically ▪ Availability of strategic counterparties that understand LTACHs and can drive synergies ▪ Ability to navigate through reimbursement and regulatory exposure Sponsor Recap ▪ Similar rationale to the “Strategic Sale” thesis ▪ Lower appetite for government reimbursement risk exposure from sponsors ▪ LTACH variability may continue to be challenging for sponsors to underwrite ▪ Sponsor dry powder ▪ Recent transactions and operational experience ▪ Ability to navigate through reimbursement and regulatory exposure IPO ▪ Ability for investors to monetize over time during favorable market conditions ▪ Execution of growth initiatives increase attractiveness of investment for re-IPO and create additional upside for all shareholders ▪ Realization of expected growth ahead of IPO ▪ Ability to re-position company favorably to peer set ▪ Appropriate pro forma leverage levels at time of IPO Potential Exit Considerations for Stallion Perspectives on Exit Alternatives Key Success Factors Portfolio Optimization ▪ Assess opportunities to reduce leverage through portfolio optimization ▪ Potential separation of volatile LTACH assets to isolate more pure-play RemainCo with direct public comps ▪ Potential strategic carve-out of OP Rehab clinics to national consolidators seeking scaled physical therapy platforms ▪ Minimal operational and financial dissynergies in any potential separation / portfolio optimization undertaking ▪ Collective value of individual assets within portfolio are greater than current value of combined assets |
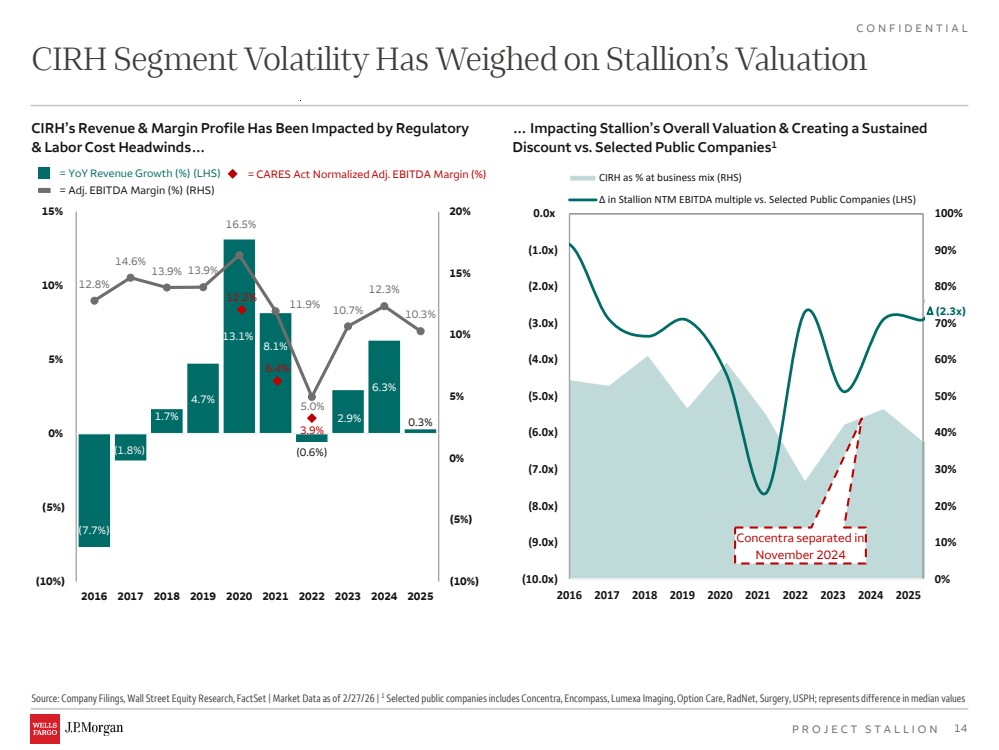
| 14 C O N F I D E N T I A L P R O J E C T S T A L L I O N CIRH Segment Volatility Has Weighed on Stallion’s Valuation Source: Company Filings, Wall Street Equity Research, FactSet | Market Data as of 2/27/26 | 1 Selected public companies includes Concentra, Encompass, Lumexa Imaging, Option Care, RadNet, Surgery, USPH; represents difference in median values … Impacting Stallion’s Overall Valuation & Creating a Sustained Discount vs. Selected Public Companies1 CIRH’s Revenue & Margin Profile Has Been Impacted by Regulatory & Labor Cost Headwinds… (7.7%) (1.8%) 1.7% 4.7% 13.1% 8.1% (0.6%) 2.9% 6.3% 0.3% 12.8% 14.6% 13.9% 13.9% 16.5% 11.9% 5.0% 10.7% 12.3% 10.3% (10%) (5%) 0% 5% 10% 15% 20% (10%) (5%) 0% 5% 10% 15% 2016 2017 2018 2019 2020 2021 2022 2023 2024 2025 6.4% 3.9% 12.2% = YoY Revenue Growth (%) (LHS) = Adj. EBITDA Margin (%) (RHS) = CARES Act Normalized Adj. EBITDA Margin (%) 0% 10% 20% 30% 40% 50% 60% 70% 80% 90% 100% (10.0x) (9.0x) (8.0x) (7.0x) (6.0x) (5.0x) (4.0x) (3.0x) (2.0x) (1.0x) 0.0x 2016 2017 2018 2019 2020 2021 2022 2023 2024 2025 CIRH as % at business mix (RHS) ∆ in Stallion NTM EBITDA multiple vs. Selected Public Companies (LHS) Concentra separated in November 2024 ∆ (2.3x) |
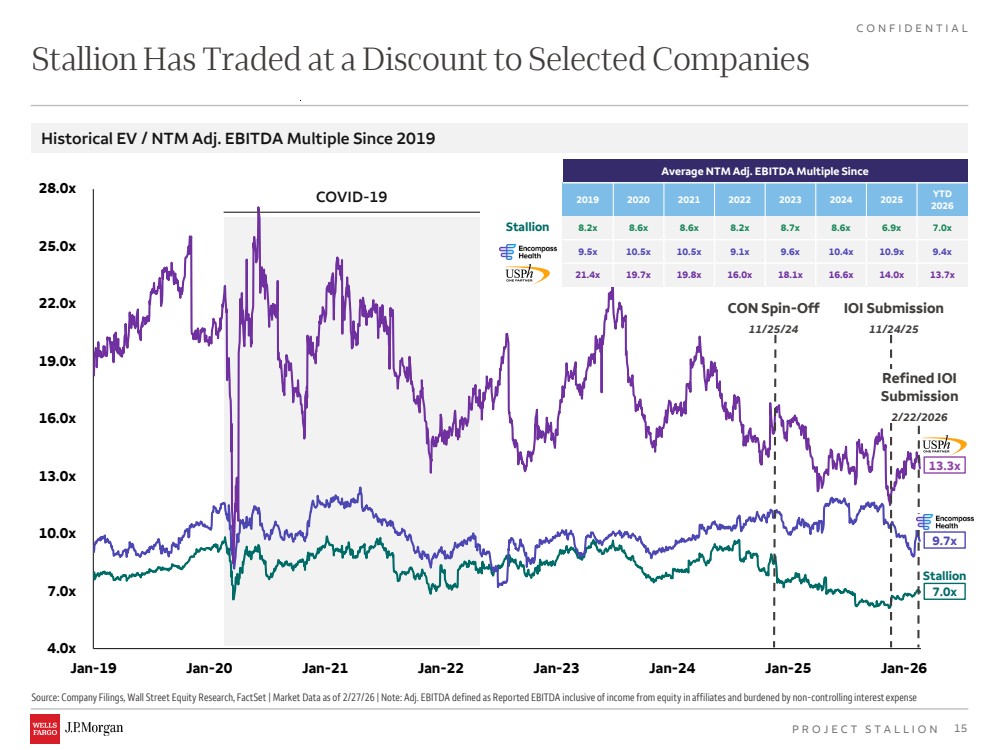
| 15 C O N F I D E N T I A L P R O J E C T S T A L L I O N 4.0x 7.0x 10.0x 13.0x 16.0x 19.0x 22.0x 25.0x 28.0x Jan-19 Jan-20 Jan-21 Jan-22 Jan-23 Jan-24 Jan-25 Jan-26 Stallion Has Traded at a Discount to Selected Companies Source: Company Filings, Wall Street Equity Research, FactSet | Market Data as of 2/27/26 | Note: Adj. EBITDA defined as Reported EBITDA inclusive of income from equity in affiliates and burdened by non-controlling interest expense Historical EV / NTM Adj. EBITDA Multiple Since 2019 8.8 9.7x CON Spin-Off 11/25/24 7.0x Stallion 13.3x Average NTM Adj. EBITDA Multiple Since 2019 2020 2021 2022 2023 2024 2025 YTD 2026 8.2x 8.6x 8.6x 8.2x 8.7x 8.6x 6.9x 7.0x 9.5x 10.5x 10.5x 9.1x 9.6x 10.4x 10.9x 9.4x 21.4x 19.7x 19.8x 16.0x 18.1x 16.6x 14.0x 13.7x Stallion IOI Submission 11/24/25 COVID-19 Refined IOI Submission 2/22/2026 |
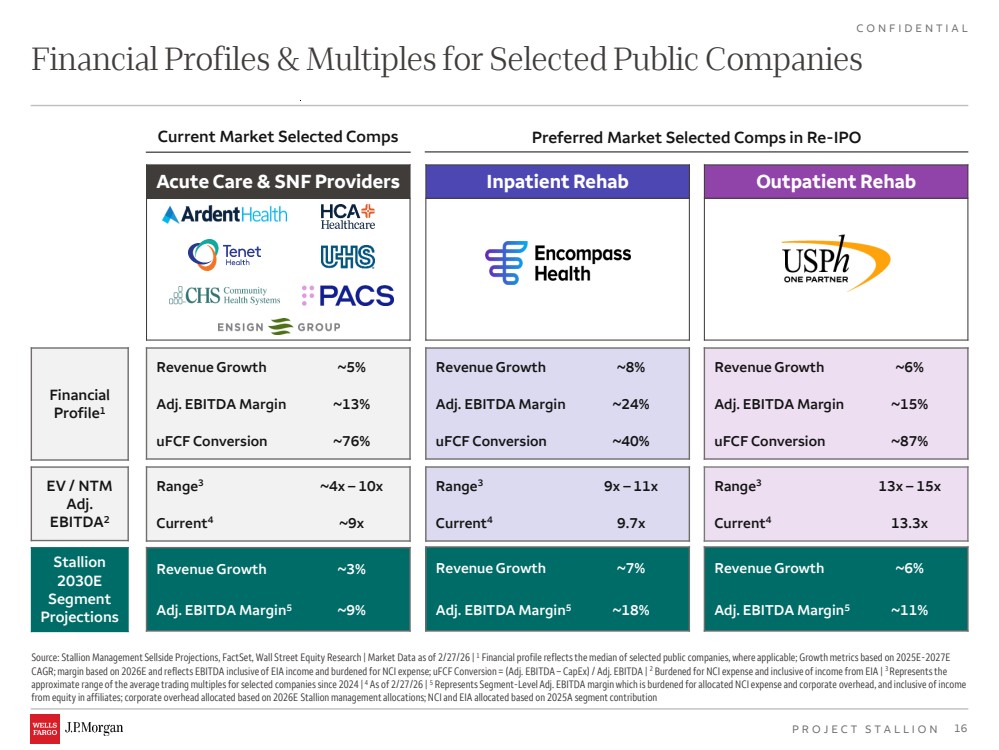
| 16 C O N F I D E N T I A L P R O J E C T S T A L L I O N Financial Profiles & Multiples for Selected Public Companies Source: Stallion Management Sellside Projections, FactSet, Wall Street Equity Research | Market Data as of 2/27/26 | 1 Financial profile reflects the median of selected public companies, where applicable; Growth metrics based on 2025E-2027E CAGR; margin based on 2026E and reflects EBITDA inclusive of EIA income and burdened for NCI expense; uFCF Conversion = (Adj. EBITDA – CapEx) / Adj. EBITDA | 2 Burdened for NCI expense and inclusive of income from EIA | 3 Represents the approximate range of the average trading multiples for selected companies since 2024 | 4 As of 2/27/26 | 5 Represents Segment-Level Adj. EBITDA margin which is burdened for allocated NCI expense and corporate overhead,and inclusive of income from equity in affiliates; corporate overhead allocated based on 2026E Stallion management allocations; NCI and EIA allocated based on 2025A segment contribution Acute Care & SNF Providers Inpatient Rehab Outpatient Rehab Revenue Growth ~8% Adj. EBITDA Margin ~24% uFCF Conversion ~40% Range3 9x – 11x Current4 9.7x Revenue Growth ~6% Adj. EBITDA Margin ~15% uFCF Conversion ~87% Range3 13x – 15x Current4 13.3x Revenue Growth ~5% Adj. EBITDA Margin ~13% uFCF Conversion ~76% Range3 ~4x – 10x Current4 ~9x Financial Profile1 EV / NTM Adj. EBITDA2 Stallion 2030E Segment Projections Current Market Selected Comps Preferred Market Selected Comps in Re-IPO Revenue Growth ~3% Adj. EBITDA Margin5 ~9% Revenue Growth ~7% Adj. EBITDA Margin5 ~18% Revenue Growth ~6% Adj. EBITDA Margin5 ~11% |
| 17 C O N F I D E N T I A L P R O J E C T S T A L L I O N Disclaimer This document and any other materials accompanying this document (collectively, the “Materials”) are provided for general informational purposes. By accepting any Materials, the recipient thereof acknowledges and agrees to the matters set forth below in this notice. Wells Fargo Corporate and Investment Banking (CIB) makes no representation or warranty (express or implied) regarding the adequacy, accuracy or completeness of any information in the Materials. Information in the Materials is preliminary and is not intended to be complete, and such information is qualified in its entirety. Any opinions or estimates contained in the Materials represent the judgment of CIB at this time, and are subject to change without notice. Interested parties are advised to contact CIB for more information. The Materials are not an offer to sell, or a solicitation of an offer to buy, the securities or instruments named or described herein. The Materials are not intended to provide, and must not be relied on for, accounting, legal, regulatory, tax, business, financial or related advice or investment recommendations. No person providing any Materials is acting as fiduciary or advisor with respect to the Materials. You must consult with your own advisors as to the legal, regulatory, tax, business, financial, investment and other aspects of the Materials. Wells Fargo Corporate & Investment Banking (CIB) and Wells Fargo Securities (WFS) are the trade names used for the corporate banking, capital markets, and investment banking services of Wells Fargo & Company and its subsidiaries, including but not limited to Wells Fargo Securities, LLC, member of NYSE, FINRA, NFA, and SIPC, Wells Fargo Prime Services, LLC, member of FINRA, NFA and SIPC, and Wells Fargo Bank, N.A., member NFA and swap dealer registered with the CFTC and security-based swap dealer registered with the SEC, member FDIC. Wells Fargo Securities, LLC and Wells Fargo Prime Services, LLC, are distinct entities from affiliated banks and thrifts. Notwithstanding anything to the contrary contained in the Materials, all persons may disclose to any and all persons, without limitations of any kind, the U.S. federal, state or local tax treatment or tax structure of any transaction, any fact that may be relevant to understanding the U.S. federal, state or local tax treatment or tax structure of any transaction, and all materials of any kind (including opinions or other tax analyses) relating to such U.S. federal, state or local tax treatment or tax structure, other than the name of the parties or any other person named herein, or information that would permit identification of the parties or such other persons, and any pricing terms or nonpublic business or financial information that is unrelated to the U.S. federal, state or local tax treatment or tax structure of the transaction to the taxpayer and is not relevant to understanding the U.S. federal, state or local tax treatment or tax structure of the transaction to the taxpayer. All information provided in this presentation represents the views of CIBs Investment Banking and Equity Capital Markets team, and not the independent views of our Research Analysts. CIB has adopted policies and procedures designed to preserve the independence of our Research Analysts, whose views may differ from those presented herein. ©2026 Wells Fargo & Company. All rights reserved. This presentation was prepared exclusively for the benefit and internal use of the J.P. Morgan client to whom it is directly addressed and delivered (including such client’s subsidiaries, the “Company”) in order to assist the Company in evaluating, on a preliminary basis, the feasibility of a possible transaction or transactions and does not carry any right of publication or disclosure, in whole or in part, to any other party. This presentation is for discussion purposes only and is incomplete without reference to,and should be viewed solely in conjunction with, the oral briefing provided by J.P. Morgan. Neither this presentation nor any of its contents may be disclosed or used for any other purpose without the prior written consent of J.P. Morgan. Additionally, this presentation may contain content initially generated by AI or other automated technologies. The information in this presentation is based upon any management forecasts supplied to usand reflects prevailing conditionsand ourviews as of this date, all of which are accordingly subject to change. J.P. Morgan’s opinionsand estimatesconstitute J.P. Morgan’s judgment and should be regarded as indicative, preliminary and for illustrative purposes only. In preparing this presentation, we have relied upon and assumed, without independent verification, the accuracy and completeness of all information available from public sources or which was provided to us by or on behalf of the Company or which was otherwise reviewed by us. In addition, our analysesare not and do not purport to be appraisals of the assets, stock, or business of the Company orany other entity. J.P. Morgan makes no representationsas to the actual value which may be received in connection with a transaction nor the legal, tax or accounting effects of consummating a transaction. Unless expressly contemplated hereby, the information in this presentation does not take into account the effects of a possible transaction or transactions involving an actual or potential change ofcontrol, which may have significant valuation and other effects. Notwithstanding anything herein to the contrary, the Company and each of its employees, representatives or other agents may disclose to any and all persons, without limitation ofany kind, the U.S. federal and state income tax treatment and the U.S. federaland state income tax structure of the transactions contemplated hereby and all materials of any kind (including opinions or other tax analyses) that are provided to the Company relating to such tax treatment and tax structure insofar as such treatment and/or structure relates to a U.S. federal or state income tax strategy provided to the Company byJ.P.Morgan. J.P.Morgan's policies on data privacy can be found at http://www.jpmorgan.com/pages/privacy. J.P. Morgan is a party to the SEC Research Settlement and as such, is generally not permitted to utilize the firm's research capabilities in pitching for investment banking business. All views contained in this presentation are the views of J.P. Morgan’s Investment Bank, not the Research Department. J.P. Morgan’s policies prohibit employees from offering, directly or indirectly, afavorable research rating or specific price target, or offering to change arating or price target, to a subject company as consideration or inducement for the receipt of business or forcompensation. J.P.Morgan also prohibits its research analysts frombeing compensated for involvement in investment banking transactions except to the extent that such participation is intended to benefit investors. Changesto Interbank Offered Rates(IBORs) and other benchmark rates: Certain interest rate benchmarks are, or may in the future become, subject to ongoing international, nationaland other regulatory guidance, reform and proposalsfor reform. For more information, please consult: https://www.jpmorgan.com/global/disclosures/interbank_offered_rates JPMorgan Chase & Co. and its affiliates do not provide tax advice. Accordingly, any discussion of U.S. tax matters included herein (including any attachments) is not intended or written to be used, and cannot be used, in connection with the promotion, marketing or recommendation by anyone not affiliated with JPMorgan Chase & Co. of any ofthematters addressed herein or forthe purpose of avoiding U.S.tax-related penalties. J.P. Morgan is a marketing name for investment businesses of JPMorgan Chase & Co. and its subsidiaries and affiliates worldwide. Securities, syndicated loan arranging, financial advisory, lending, derivatives and other investment banking and commercial banking activities are performed by a combination of J.P. Morgan Securities LLC, J.P. Morgan Securities plc, J.P. Morgan SE, JPMorgan Chase Bank, N.A. and the appropriately licensed subsidiaries and affiliates of JPMorgan Chase & Co. worldwide. J.P. Morgan deal team members may be employees of any of the foregoing entities. J.P. Morgan Securities plc is authorized by the Prudential Regulation Authority and regulated by the Financial Conduct Authority and the Prudential Regulation Authority. J.P. Morgan SE is authorized as a credit institution by the German Federal Financial Supervisory Authority(Bundesanstalt für Finanzdienstleistungsaufsicht, BaFin) and jointly supervised bythe BaFin, the German Central Bank (Deutsche Bundesbank) and the European Central Bank (ECB). For information on any J.P.Morgan German legal entity see: https://www.jpmorgan.com/country/US/en/disclosures/legal-entity-information#germany. For information on any other J.P.Morgan legal entity see: https://www.jpmorgan.com/country/GB/EN/disclosures/investment-bank-legal-entity-disclosures. JPMS LLC intermediates securitiestransactions effected by its non-U.S. affiliatesfor or with its U.S.clients when appropriate and in accordancewith Rule 15a-6 under the Securities Exchange Act of 1934. Please consult: www.jpmorgan.com/securities-transactions This presentation does not constitute acommitment byany J.P.Morgan entity to underwrite, subscribe for or place any securities or to extend orarrange credit or to provide any other services. Copyright 2026 JPMorgan Chase & Co. All rights reserved. JPMorgan Chase Bank, N.A., organized under the laws of U.S.A. with limited liability. |