| November 2025 Preliminary Discussion Materials Prepared for Project Stallion DRAFT – Preliminary & For Reference Only WELLS FARGO J.PMorgan |
| DRAFT – Preliminary & For Reference Only 2 CONFIDENTIAL PROJECT STALLION Table of Contents I. Executive Summary II. Outside-In Perspectives on Stallion III. Preliminary Transaction Analysis IV. Potential Exit Considerations Supplemental Analysis WELLS FARGO J.EMorgan |
| I. Executive Summary |

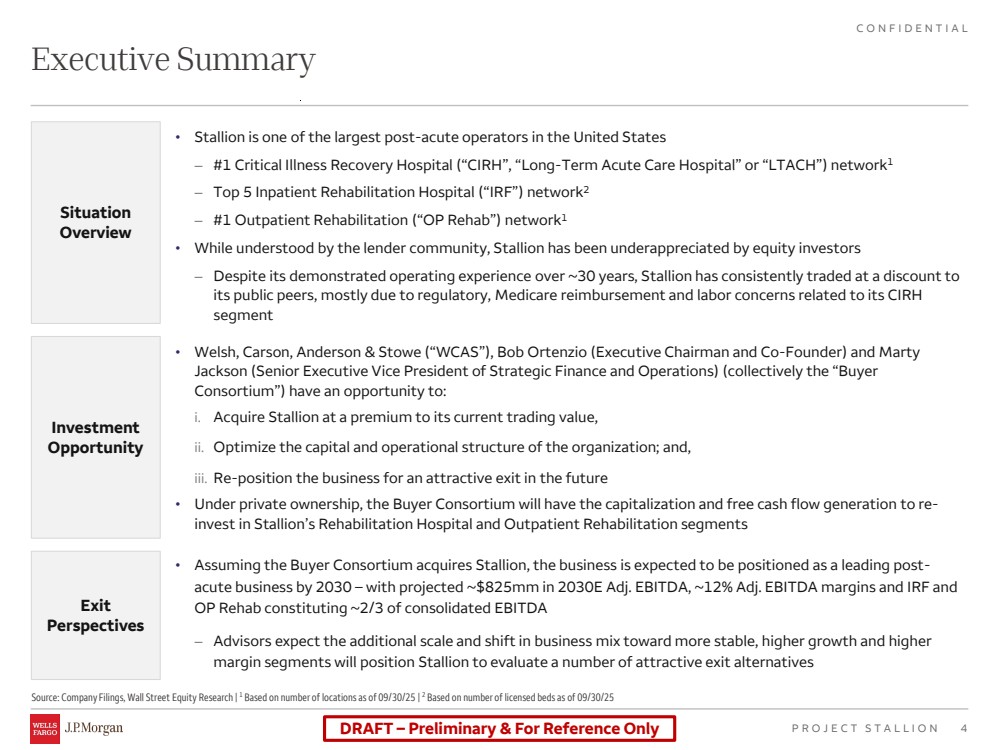
| DRAFT – Preliminary & For Reference Only 4 CONFIDENTIAL PROJECT STALLION Source: Company Filings, Wall Street Equity Research | 1 Based on number of locations as of 09/30/25 | 2 Based on number of licensed beds as of 09/30/25 Executive Summary Situation Overview • Stallion is one of the largest post-acute operators in the United States ‒ #1 Critical Illness Recovery Hospital (“CIRH”, “Long-Term Acute Care Hospital” or “LTACH”) network1 ‒ Top 5 Inpatient Rehabilitation Hospital (“IRF”) network2 ‒ #1 Outpatient Rehabilitation (“OP Rehab”) network1 • While understood by the lender community, Stallion has been underappreciated by equity investors ‒ Despite its demonstrated operating experience over ~30 years, Stallion has consistently traded at a discount to its public peers, mostly due to regulatory, Medicare reimbursement and labor concerns related to its CIRH segment • Welsh, Carson, Anderson & Stowe (“WCAS”), Bob Ortenzio (Executive Chairman and Co-Founder) and Marty Jackson (Senior Executive Vice President of Strategic Finance and Operations) (collectively the “Buyer Consortium”) have an opportunity to: i. Acquire Stallion at a premium to its current trading value, ii. Optimize the capital and operational structure of the organization; and, iii. Re-position the business for an attractive exit in the future • Under private ownership, the Buyer Consortium will have the capitalization and free cash flow generation to re-invest in Stallion’s Rehabilitation Hospital and Outpatient Rehabilitation segments Investment Opportunity Exit Perspectives • Assuming the Buyer Consortium acquires Stallion, the business is expected to be positioned as a leading post-acute business by 2030 – with projected ~$825mm in 2030E Adj. EBITDA, ~12% Adj. EBITDA margins and IRF and OP Rehab constituting ~2/3 of consolidated EBITDA ‒ Advisors expect the additional scale and shift in business mix toward more stable, higher growth and higher margin segments will position Stallion to evaluate a number of attractive exit alternatives |
| II. Outside-In Perspectives on Stallion |

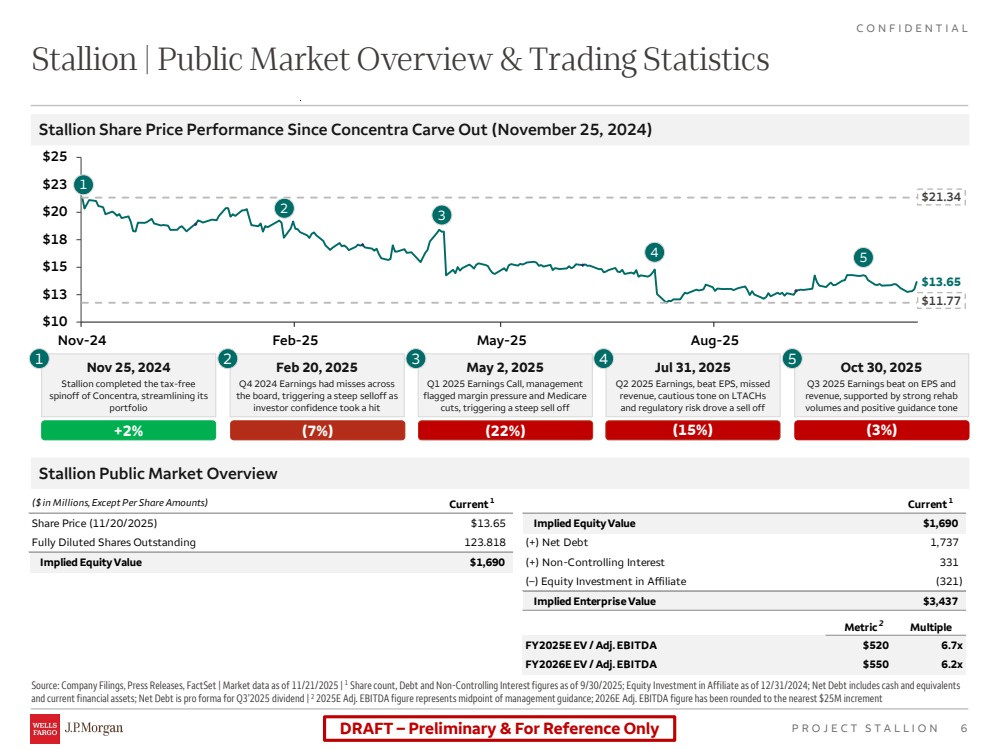
| DRAFT – Preliminary & For Reference Only 6 CONFIDENTIAL PROJECT STALLION $10 $13 $15 $18 $20 $23 $25 Nov-24 Feb-25 May-25 Aug-25 Stallion | Public Market Overview & Trading Statistics Source: Company Filings, Press Releases, FactSet | Market data as of 11/21/2025 | 1 Share count, Debt and Non-Controlling Interest figures as of 9/30/2025; Equity Investment in Affiliate as of 12/31/2024; Net Debt includes cash and equivalents and current financial assets; Net Debt is pro forma for Q3’2025 dividend | 2 2025E Adj. EBITDA figure represents midpoint of management guidance; 2026E Adj. EBITDA figure has been rounded to the nearest $25M increment $13.65 $11.77 1 2 3 4 $21.34 Nov 25, 2024 Stallion completed the tax-free spinoff of Concentra, streamlining its portfolio 1 +2% Feb 20, 2025 Q4 2024 Earnings had misses across the board, triggering a steep selloff as investor confidence took a hit 2 (7%) May 2, 2025 Q1 2025 Earnings Call, management flagged margin pressure and Medicare cuts, triggering a steep sell off 3 (22%) Jul 31, 2025 Q2 2025 Earnings, beat EPS, missed revenue, cautious tone on LTACHs and regulatory risk drove a sell off 4 (15%) Oct 30, 2025 Q3 2025 Earnings beat on EPS and revenue, supported by strong rehab volumes and positive guidance tone 5 (3%) 5 Stallion Share Price Performance Since Concentra Carve Out (November 25, 2024) Stallion Public Market Overview 2 ($ in Millions, Except Per Share Amounts) Current 1 Current 1 Share Price (11/20/2025) $13.65 Implied Equity Value $1,690 Fully Diluted Shares Outstanding 123.818 (+) Net Debt 1,737 Implied Equity Value $1,690 (+) Non-Controlling Interest 331 (–) Equity Investment in Affiliate (321) Implied Enterprise Value $3,437 Metric Multiple FY2025E EV / Adj. EBITDA $520 6.7x FY2026E EV / Adj. EBITDA $550 6.2x |
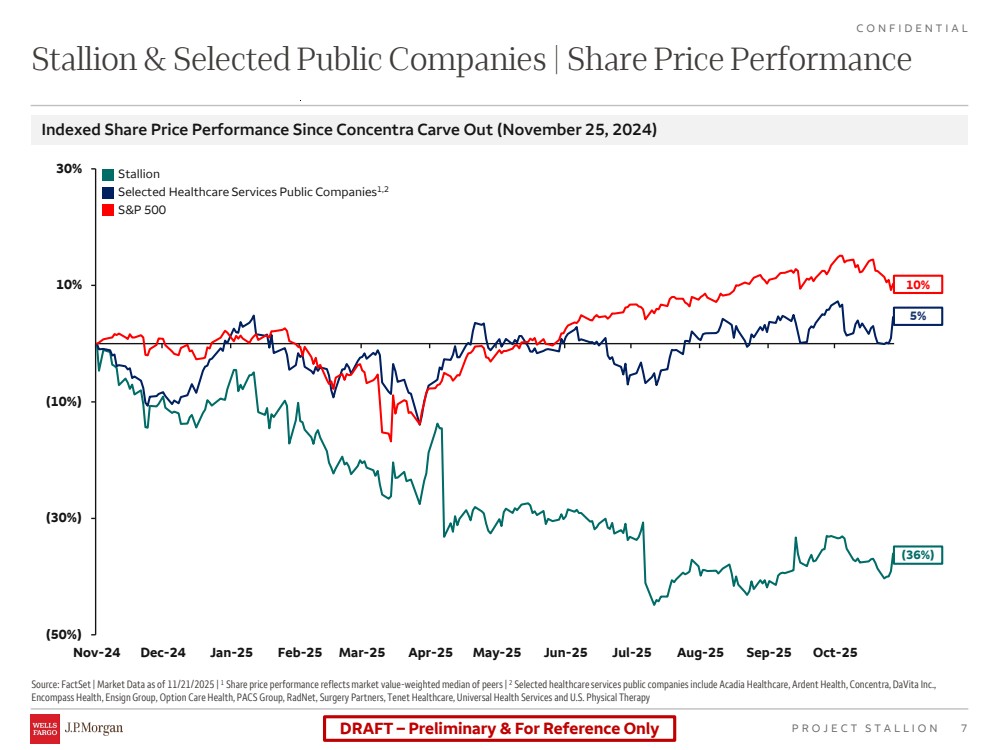
| DRAFT – Preliminary & For Reference Only 7 CONFIDENTIAL PROJECT STALLION Stallion & Selected Public Companies | Share Price Performance Source: FactSet | Market Data as of 11/21/2025 | 1 Share price performance reflects market value-weighted median of peers | 2 Selected healthcare services public companies include Acadia Healthcare, Ardent Health, Concentra, DaVita Inc., Encompass Health, Ensign Group, Option Care Health, PACS Group, RadNet, Surgery Partners, Tenet Healthcare, Universal Health Services and U.S. Physical Therapy Indexed Share Price Performance Since Concentra Carve Out (November 25, 2024) (50%) (30%) (10%) 10% 30% Nov-24 Dec-24 Jan-25 Feb-25 Mar-25 Apr-25 May-25 Jun-25 Jul-25 Aug-25 Sep-25 Oct-25 Stallion Selected Healthcare Services Public Companies1,2 S&P 500 (36%) 5% 10% |
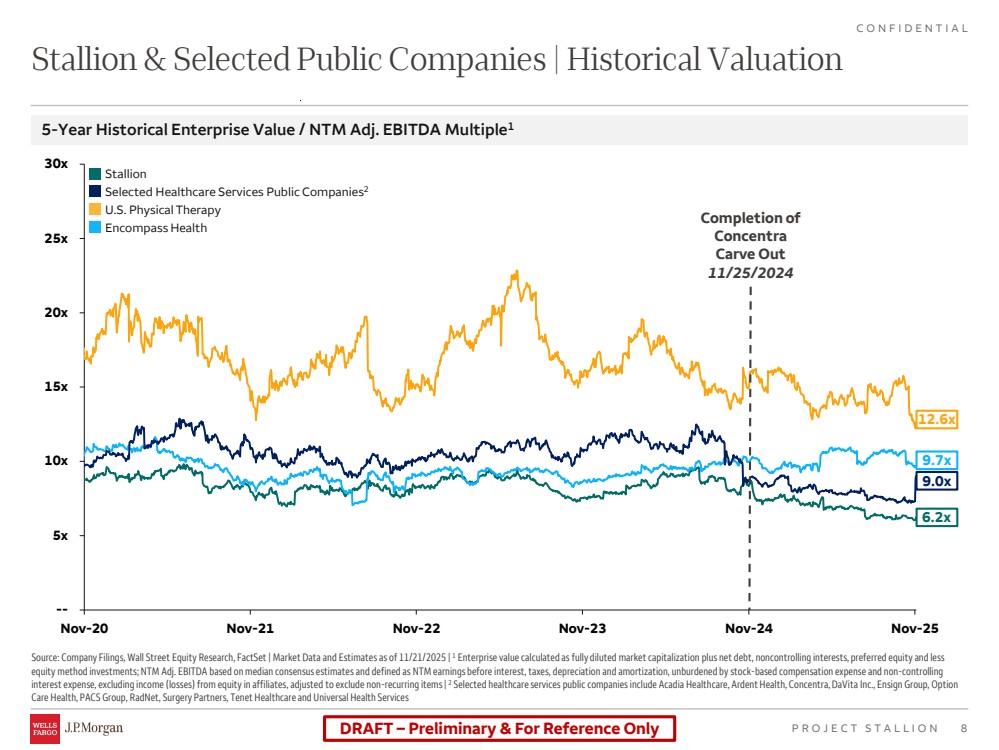
| DRAFT – Preliminary & For Reference Only 8 CONFIDENTIAL PROJECT STALLION -- 5x 10x 15x 20x 25x 30x Nov-20 Nov-21 Nov-22 Nov-23 Nov-24 Nov-25 Stallion & Selected Public Companies | Historical Valuation Source: Company Filings, Wall Street Equity Research, FactSet | Market Data and Estimates as of 11/21/2025 | 1 Enterprise value calculated as fully diluted market capitalization plus net debt, noncontrolling interests, preferred equity and less equity method investments; NTM Adj. EBITDA based on median consensus estimates and defined as NTM earnings before interest, taxes, depreciation and amortization, unburdened by stock-based compensation expense and non-controlling interest expense, excluding income (losses) from equity in affiliates, adjusted to exclude non-recurring items | 2 Selected healthcare services public companies include Acadia Healthcare, Ardent Health, Concentra, DaVita Inc., Ensign Group, Option Care Health, PACS Group, RadNet, Surgery Partners, Tenet Healthcare and Universal Health Services 5-Year Historical Enterprise Value / NTM Adj. EBITDA Multiple1 6.2x Completion of Concentra Carve Out 11/25/2024 9.7x 12.6x 9.0x Stallion Selected Healthcare Services Public Companies2 U.S. Physical Therapy Encompass Health |
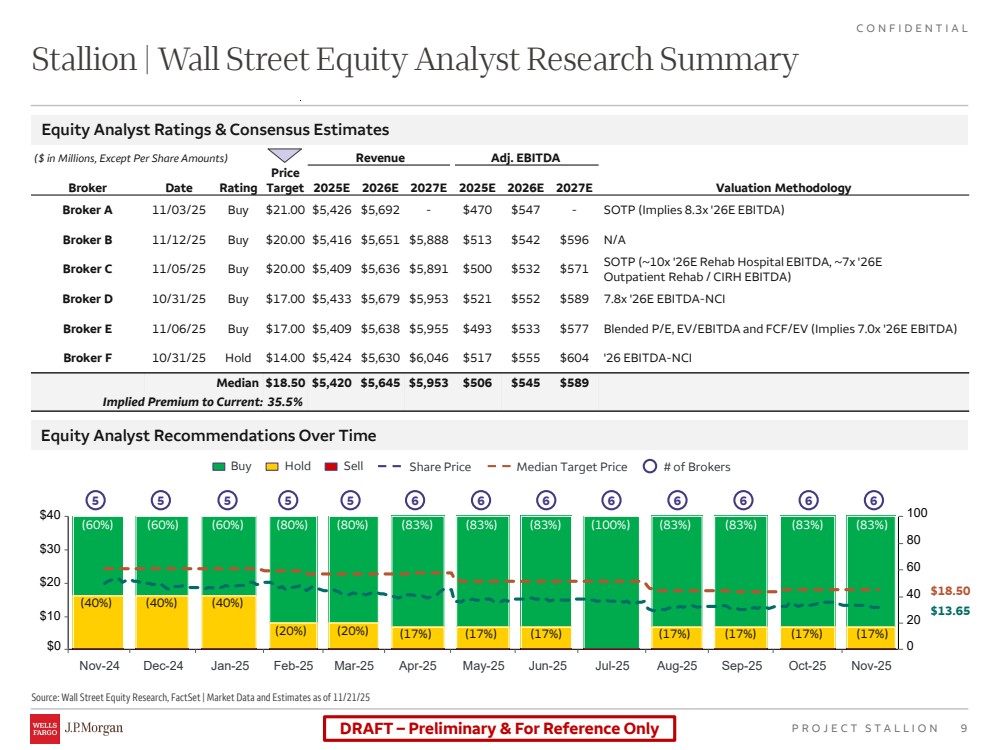
| DRAFT – Preliminary & For Reference Only 9 CONFIDENTIAL PROJECT STALLION Stallion | Wall Street Equity Analyst Research Summary Source: Wall Street Equity Research, FactSet | Market Data and Estimates as of 11/21/25 Revenue Adj. EBITDA Broker Date Rating Price Target 2025E 2026E 2027E 2025E 2026E 2027E Valuation Methodology Broker A 11/03/25 Buy $21.00 $5,426 $5,692 - $470 $547 - SOTP (Implies 8.3x '26E EBITDA) Broker B 11/12/25 Buy $20.00 $5,416 $5,651 $5,888 $513 $542 $596 N/A Broker C 11/05/25 Buy $20.00 $5,409 $5,636 $5,891 $500 $532 $571 SOTP (~10x '26E Rehab Hospital EBITDA, ~7x '26E Outpatient Rehab / CIRH EBITDA) Broker D 10/31/25 Buy $17.00 $5,433 $5,679 $5,953 $521 $552 $589 7.8x '26E EBITDA-NCI Broker E 11/06/25 Buy $17.00 $5,409 $5,638 $5,955 $493 $533 $577 Blended P/E, EV/EBITDA and FCF/EV (Implies 7.0x '26E EBITDA) Broker F 10/31/25 Hold $14.00 $5,424 $5,630 $6,046 $517 $555 $604 '26 EBITDA-NCI Median $18.50 $5,420 $5,645 $5,953 $506 $545 $589 Implied Premium to Current: 35.5% Equity Analyst Ratings & Consensus Estimates Equity Analyst Recommendations Over Time Nov-24 Dec-24 Jan-25 Feb-25 Mar-25 Apr-25 May-25 Jun-25 Jul-25 Aug-25 Sep-25 Oct-25 Nov-25 100 80 60 40 20 $0 0 $10 $20 $30 $40 $13.65 $18.50 5 5 5 5 5 6 6 6 6 6 6 6 6 (60%) (40%) (60%) (40%) (60%) (40%) (80%) (80%) (83%) (83%) (83%) (100%) (83%) (83%) (83%) (83%) (20%) (20%) (17%) (17%) (17%) (17%) (17%) (17%) (17%) Buy Hold Sell Share Price Median Target Price # of Brokers ($ in Millions, Except Per Share Amounts) |
| III. Preliminary Transaction Analysis |
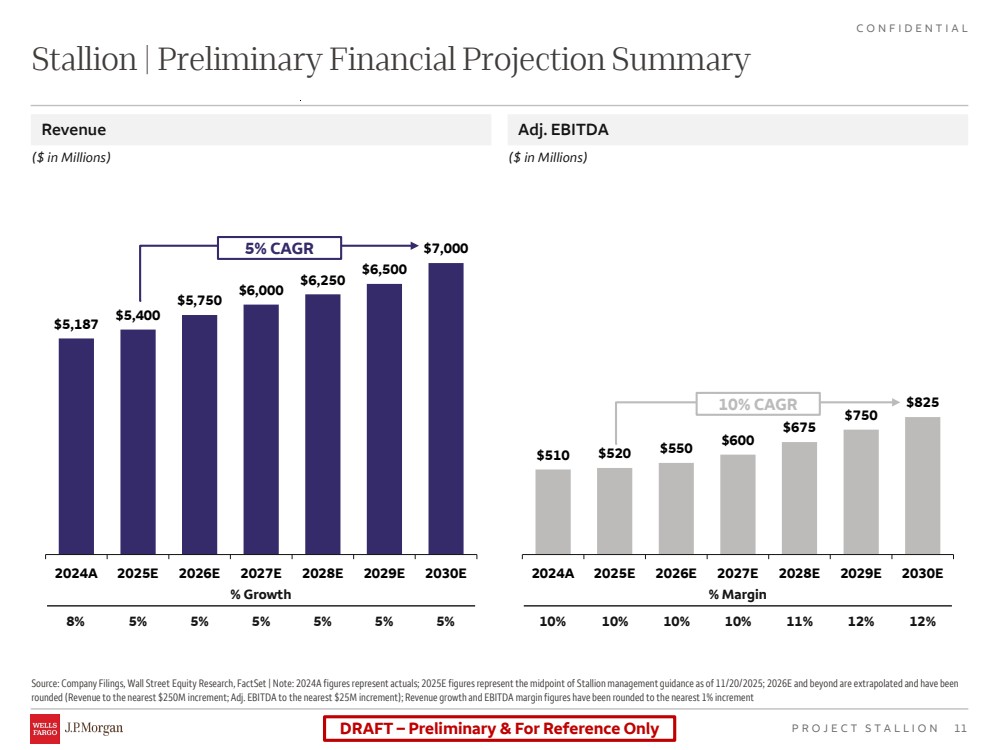
| DRAFT – Preliminary & For Reference Only 11 CONFIDENTIAL PROJECT STALLION Source: Company Filings, Wall Street Equity Research, FactSet | Note: 2024A figures represent actuals; 2025E figures represent the midpoint of Stallion management guidance as of 11/20/2025; 2026E and beyond are extrapolated and have been rounded (Revenue to the nearest $250M increment; Adj. EBITDA to the nearest $25M increment); Revenue growth and EBITDA margin figures have been rounded to the nearest 1% increment Stallion | Preliminary Financial Projection Summary Revenue Adj. EBITDA ($ in Millions) ($ in Millions) $5,187 $5,400 $5,750 $6,000 $6,250 $6,500 $7,000 2024A 2025E 2026E 2027E 2028E 2029E 2030E $510 $520 $550 $600 $675 $750 $825 2024A 2025E 2026E 2027E 2028E 2029E 2030E 5% CAGR % Margin 5% 5% 5% 5% 5% 5% 10% 10% 10% 10% 11% 12% 12% % Growth 8% 10% CAGR |
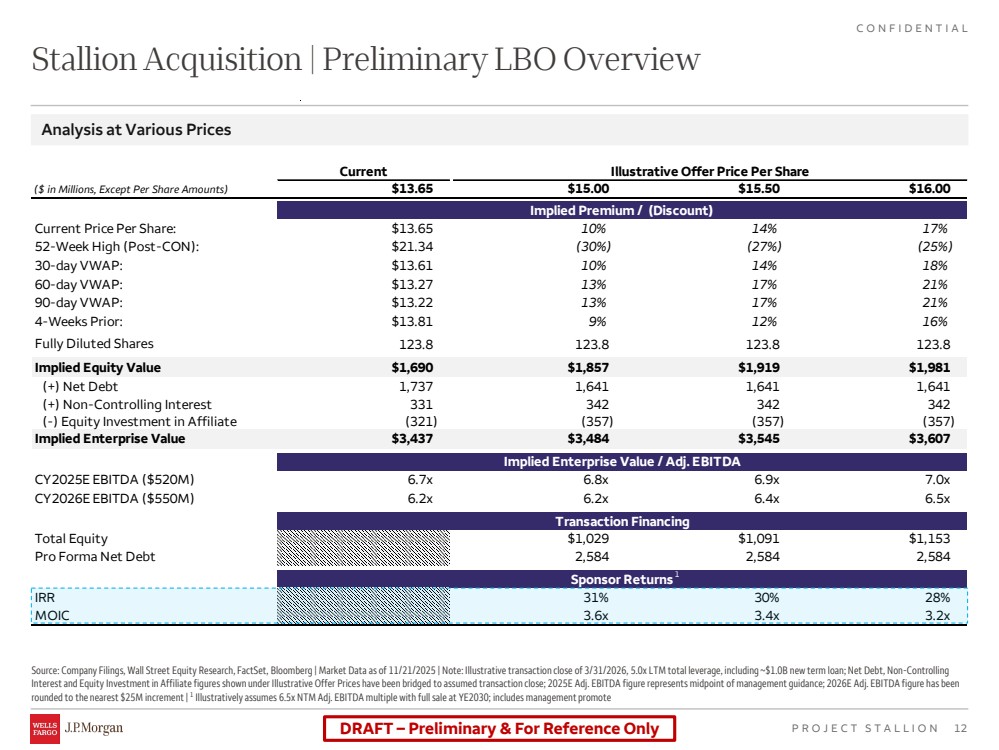
| DRAFT – Preliminary & For Reference Only 12 CONFIDENTIAL PROJECT STALLION Current Illustrative Offer Price Per Share ($ in Millions, Except Per Share Amounts) $13.65 $15.00 $15.50 $16.00 Implied Premium / (Discount) Current Price Per Share: $13.65 10% 14% 17% 52-Week High (Post-CON): $21.34 (30%) (27%) (25%) 30-day VWAP: $13.61 10% 14% 18% 60-day VWAP: $13.27 13% 17% 21% 90-day VWAP: $13.22 13% 17% 21% 4-Weeks Prior: $13.81 9% 12% 16% Fully Diluted Shares 123.8 123.8 123.8 123.8 Implied Equity Value $1,690 $1,857 $1,919 $1,981 (+) Net Debt 1,737 1,641 1,641 1,641 (+) Non-Controlling Interest 331 342 342 342 (-) Equity Investment in Affiliate (321) (357) (357) (357) Implied Enterprise Value $3,437 $3,484 $3,545 $3,607 Implied Enterprise Value / Adj. EBITDA CY2025E EBITDA ($520M) 6.7x 6.8x 6.9x 7.0x CY2026E EBITDA ($550M) 6.2x 6.2x 6.4x 6.5x Transaction Financing Total Equity $1,029 $1,091 $1,153 Pro Forma Net Debt 2,584 2,584 2,584 Sponsor Returns IRR 31% 30% 28% MOIC 3.6x 3.4x 3.2x Source: Company Filings, Wall Street Equity Research, FactSet, Bloomberg | Market Data as of 11/21/2025 | Note: Illustrative transaction close of 3/31/2026, 5.0x LTM total leverage, including ~$1.0B new term loan; Net Debt, Non-Controlling Interest and Equity Investment in Affiliate figures shown under Illustrative Offer Prices have been bridged to assumed transaction close; 2025E Adj. EBITDA figure represents midpoint of management guidance; 2026E Adj. EBITDA figure has been rounded to the nearest $25M increment | 1 Illustratively assumes 6.5x NTM Adj. EBITDA multiple with full sale at YE2030; includes management promote Stallion Acquisition | Preliminary LBO Overview Analysis at Various Prices 1 |
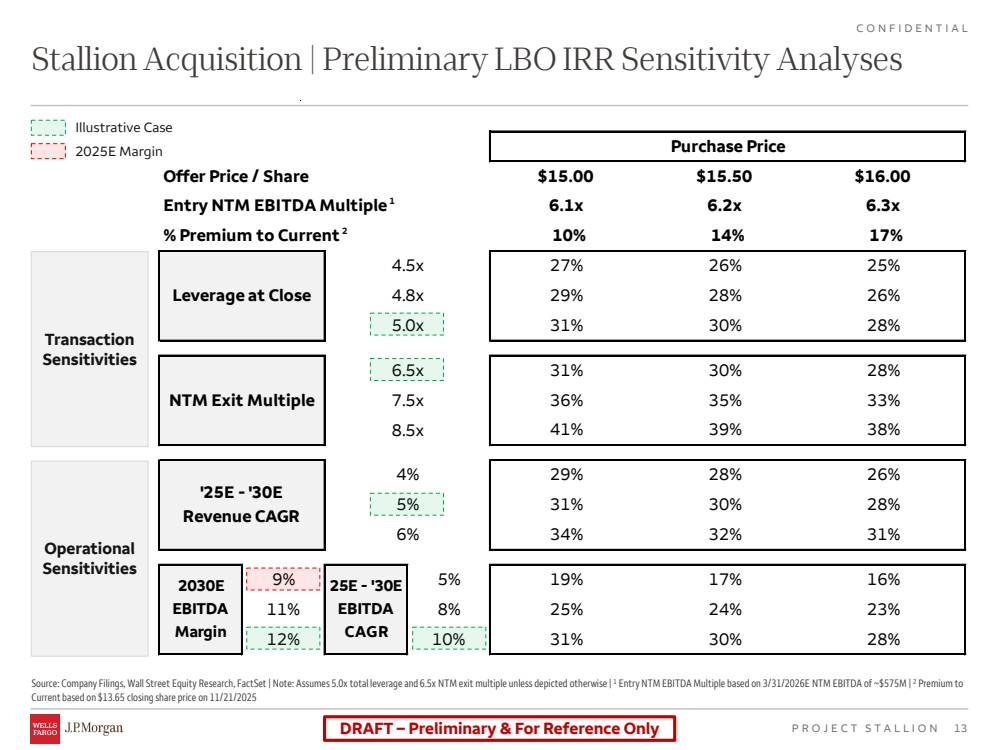
| DRAFT – Preliminary & For Reference Only 13 CONFIDENTIAL PROJECT STALLION Purchase Price Offer Price / Share $15.00 $15.50 $16.00 Entry NTM EBITDA Multiple 6.1x 6.2x 6.3x % Premium to Current 10% 14% 17% 27% 26% 25% 29% 28% 26% 31% 30% 28% 31% 30% 28% 36% 35% 33% 41% 39% 38% 29% 28% 26% 31% 30% 28% 34% 32% 31% 9% 5% 19% 17% 16% 11% 8% 25% 24% 23% 12% 10% 31% 30% 28% Leverage at Close 4.5x 4.8x 5.0x 2030E EBITDA Margin 25E - '30E EBITDA CAGR NTM Exit Multiple 6.5x 7.5x 8.5x '25E - '30E Revenue CAGR 4% 5% 6% Source: Company Filings, Wall Street Equity Research, FactSet | Note: Assumes 5.0x total leverage and 6.5x NTM exit multiple unless depicted otherwise | 1 Entry NTM EBITDA Multiple based on 3/31/2026E NTM EBITDA of ~$575M | 2 Premium to Current based on $13.65 closing share price on 11/21/2025 Stallion Acquisition | Preliminary LBO IRR Sensitivity Analyses Transaction Sensitivities Operational Sensitivities Illustrative Case 2025E Margin 1 2 |
| IV. Potential Exit Considerations |

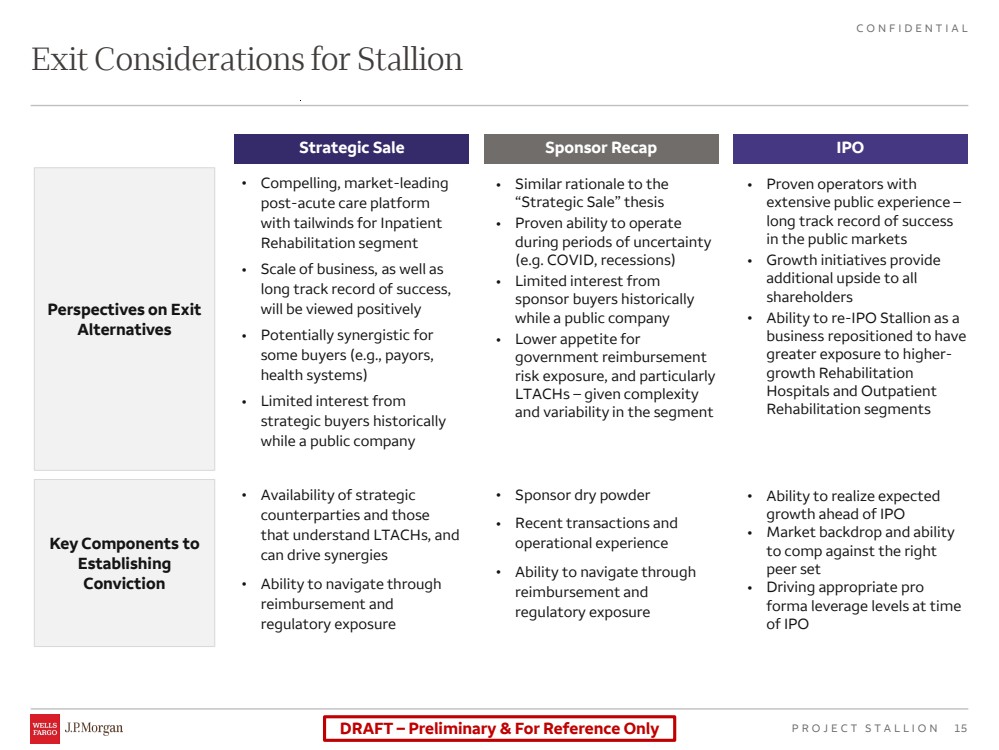
| DRAFT – Preliminary & For Reference Only 15 CONFIDENTIAL PROJECT STALLION Strategic Sale • Compelling, market-leading post-acute care platform with tailwinds for Inpatient Rehabilitation segment • Scale of business, as well as long track record of success, will be viewed positively • Potentially synergistic for some buyers (e.g., payors, health systems) • Limited interest from strategic buyers historically while a public company • Availability of strategic counterparties and those that understand LTACHs, and can drive synergies • Ability to navigate through reimbursement and regulatory exposure Sponsor Recap • Similar rationale to the “Strategic Sale” thesis • Proven ability to operate during periods of uncertainty (e.g. COVID, recessions) • Limited interest from sponsor buyers historically while a public company • Lower appetite for government reimbursement risk exposure, and particularly LTACHs – given complexity and variability in the segment • Sponsor dry powder • Recent transactions and operational experience • Ability to navigate through reimbursement and regulatory exposure IPO • Proven operators with extensive public experience – long track record of success in the public markets • Growth initiatives provide additional upside to all shareholders • Ability to re-IPO Stallion as a business repositioned to have greater exposure to higher-growth Rehabilitation Hospitals and Outpatient Rehabilitation segments • Ability to realize expected growth ahead of IPO • Market backdrop and ability to comp against the right peer set • Driving appropriate pro forma leverage levels at time of IPO Exit Considerations for Stallion Perspectives on Exit Alternatives Key Components to Establishing Conviction |
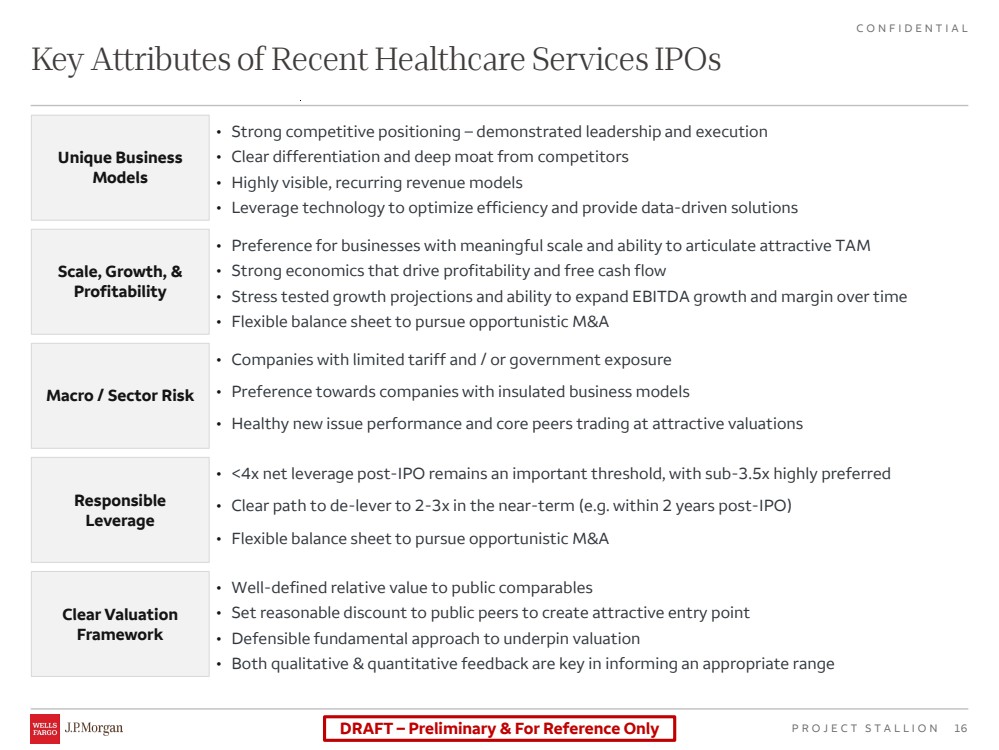
| DRAFT – Preliminary & For Reference Only 16 CONFIDENTIAL PROJECT STALLION Key Attributes of Recent Healthcare Services IPOs • Well-defined relative value to public comparables • Set reasonable discount to public peers to create attractive entry point • Defensible fundamental approach to underpin valuation • Both qualitative & quantitative feedback are key in informing an appropriate range Unique Business Models Scale, Growth, & Profitability Macro / Sector Risk Responsible Leverage Clear Valuation Framework • Strong competitive positioning – demonstrated leadership and execution • Clear differentiation and deep moat from competitors • Highly visible, recurring revenue models • Leverage technology to optimize efficiency and provide data-driven solutions • Preference for businesses with meaningful scale and ability to articulate attractive TAM • Strong economics that drive profitability and free cash flow • Stress tested growth projections and ability to expand EBITDA growth and margin over time • Flexible balance sheet to pursue opportunistic M&A • Companies with limited tariff and / or government exposure • Preference towards companies with insulated business models • Healthy new issue performance and core peers trading at attractive valuations • <4x net leverage post-IPO remains an important threshold, with sub-3.5x highly preferred • Clear path to de-lever to 2-3x in the near-term (e.g. within 2 years post-IPO) • Flexible balance sheet to pursue opportunistic M&A |
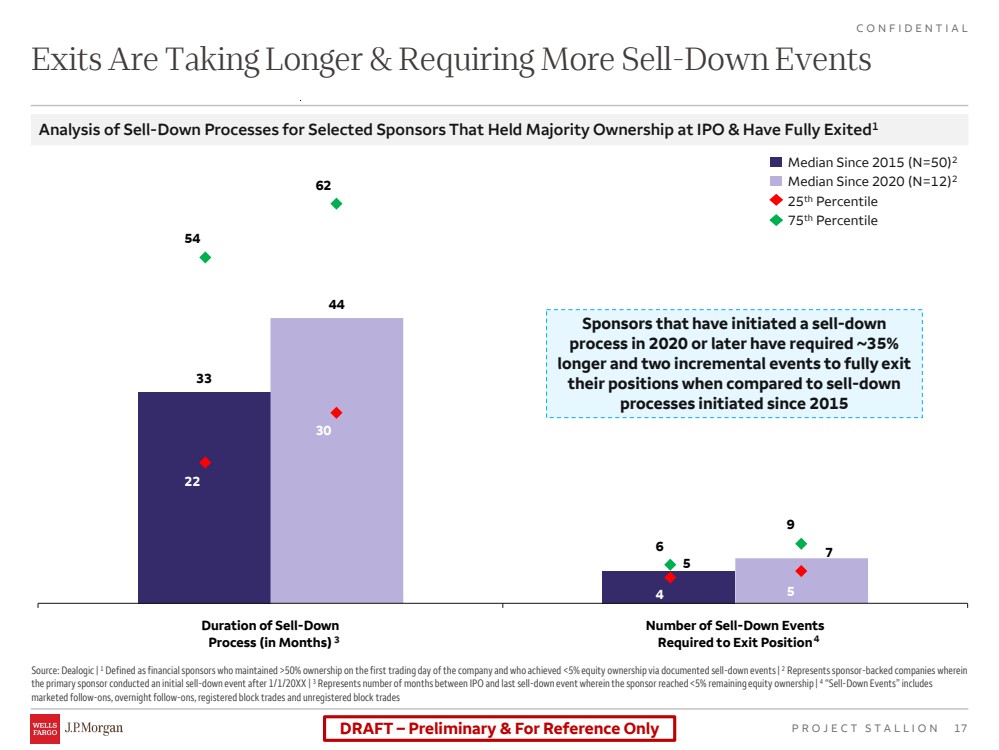
| DRAFT – Preliminary & For Reference Only 17 CONFIDENTIAL PROJECT STALLION 33 5 44 7 22 4 54 6 30 5 62 9 Duration of Sell-Down Process (in Months) Number of Sell-Down Events Required to Exit Position Exits Are Taking Longer & Requiring More Sell-Down Events Source: Dealogic | 1 Defined as financial sponsors who maintained >50% ownership on the first trading day of the company and who achieved <5% equity ownership via documented sell-down events | 2 Represents sponsor-backed companies wherein the primary sponsor conducted an initial sell-down event after 1/1/20XX | 3 Represents number of months between IPO and last sell-down event wherein the sponsor reached <5% remaining equity ownership | 4 “Sell-Down Events” includes marketed follow-ons, overnight follow-ons, registered block trades and unregistered block trades Analysis of Sell-Down Processes for Selected Sponsors That Held Majority Ownership at IPO & Have Fully Exited1 Median Since 2015 (N=50)2 Median Since 2020 (N=12)2 25th Percentile 75th Percentile 3 4 Sponsors that have initiated a sell-down process in 2020 or later have required ~35% longer and two incremental events to fully exit their positions when compared to sell-down processes initiated since 2015 |
| Supplemental Analysis |
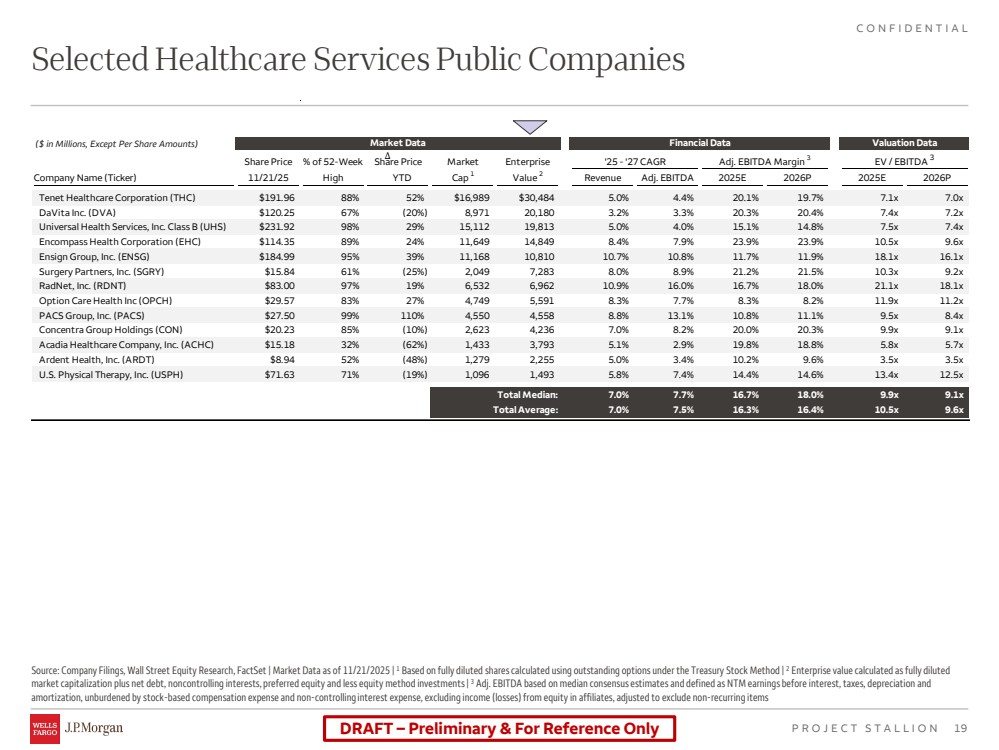
| DRAFT – Preliminary & For Reference Only 19 CONFIDENTIAL PROJECT STALLION Selected Healthcare Services Public Companies Source: Company Filings, Wall Street Equity Research, FactSet | Market Data as of 11/21/2025 | 1 Based on fully diluted shares calculated using outstanding options under the Treasury Stock Method | 2 Enterprise value calculated as fully diluted market capitalization plus net debt, noncontrolling interests, preferred equity and less equity method investments | 3 Adj. EBITDA based on median consensus estimates and defined as NTM earnings before interest, taxes, depreciation and amortization, unburdened by stock-based compensation expense and non-controlling interest expense, excluding income (losses) from equity in affiliates, adjusted to exclude non-recurring items Market Data Financial Data Valuation Data Share Price % of 52-Week Share Price Market Enterprise '25 - '27 CAGR Adj. EBITDA Margin 3 EV / EBITDA 3 Company Name (Ticker) 11/21/25 High ∆ YTD Cap 1 Value 2 Revenue Adj. EBITDA 2025E 2026P 2025E 2026P Tenet Healthcare Corporation (THC) $191.96 88% 52% $16,989 $30,484 5.0% 4.4% 20.1% 19.7% 7.1x 7.0x DaVita Inc. (DVA) $120.25 67% (20%) 8,971 20,180 3.2% 3.3% 20.3% 20.4% 7.4x 7.2x Universal Health Services, Inc. Class B (UHS) $231.92 98% 29% 15,112 19,813 5.0% 4.0% 15.1% 14.8% 7.5x 7.4x Encompass Health Corporation (EHC) $114.35 89% 24% 11,649 14,849 8.4% 7.9% 23.9% 23.9% 10.5x 9.6x Ensign Group, Inc. (ENSG) $184.99 95% 39% 11,168 10,810 10.7% 10.8% 11.7% 11.9% 18.1x 16.1x Surgery Partners, Inc. (SGRY) $15.84 61% (25%) 2,049 7,283 8.0% 8.9% 21.2% 21.5% 10.3x 9.2x RadNet, Inc. (RDNT) $83.00 97% 19% 6,532 6,962 10.9% 16.0% 16.7% 18.0% 21.1x 18.1x Option Care Health Inc (OPCH) $29.57 83% 27% 4,749 5,591 8.3% 7.7% 8.3% 8.2% 11.9x 11.2x PACS Group, Inc. (PACS) $27.50 99% 110% 4,550 4,558 8.8% 13.1% 10.8% 11.1% 9.5x 8.4x Concentra Group Holdings (CON) $20.23 85% (10%) 2,623 4,236 7.0% 8.2% 20.0% 20.3% 9.9x 9.1x Acadia Healthcare Company, Inc. (ACHC) $15.18 32% (62%) 1,433 3,793 5.1% 2.9% 19.8% 18.8% 5.8x 5.7x Ardent Health, Inc. (ARDT) $8.94 52% (48%) 1,279 2,255 5.0% 3.4% 10.2% 9.6% 3.5x 3.5x U.S. Physical Therapy, Inc. (USPH) $71.63 71% (19%) 1,096 1,493 5.8% 7.4% 14.4% 14.6% 13.4x 12.5x Total Median: 7.0% 7.7% 16.7% 18.0% 9.9x 9.1x Total Average: 7.0% 7.5% 16.3% 16.4% 10.5x 9.6x ($ in Millions, Except Per Share Amounts) |
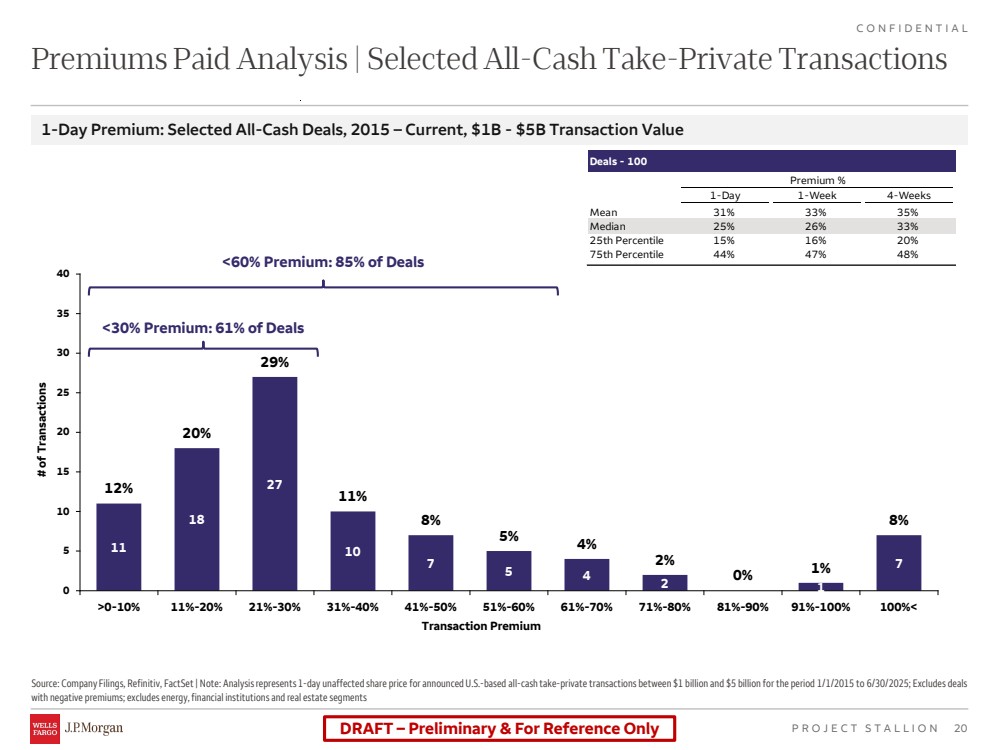
| DRAFT – Preliminary & For Reference Only 20 CONFIDENTIAL PROJECT STALLION Deals - 100 Premium % 1-Day 1-Week 4-Weeks Mean 31% 33% 35% Median 25% 26% 33% 25th Percentile 15% 16% 20% 75th Percentile 44% 47% 48% Source: Company Filings, Refinitiv, FactSet | Note: Analysis represents 1-day unaffected share price for announced U.S.-based all-cash take-private transactions between $1 billion and $5 billion for the period 1/1/2015 to 6/30/2025; Excludes deals with negative premiums; excludes energy, financial institutions and real estate segments Premiums Paid Analysis | Selected All-Cash Take-Private Transactions 1-Day Premium: Selected All-Cash Deals, 2015 – Current, $1B - $5B Transaction Value <30% Premium: 61% of Deals <60% Premium: 85% of Deals 11 18 27 10 7 5 4 2 1 7 12% 20% 29% 11% 8% 5% 4% 2% 0% 1% 8% 0 5 10 15 20 25 30 35 40 >0-10% 11%-20% 21%-30% 31%-40% 41%-50% 51%-60% 61%-70% 71%-80% 81%-90% 91%-100% 100%< # of Transactions Transaction Premium |
| DRAFT – Preliminary & For Reference Only 21 CONFIDENTIAL PROJECT STALLION This document and any other materials accompanying this document (collectively, the “Materials”) are provided for general informational purposes. By accepting any Materials, the recipient thereof acknowledges and agrees to the matters set forth below in this notice. Wells Fargo Corporate and Investment Banking (CIB) makes no representation or warranty (express or implied) regarding the adequacy, accuracy or completeness of any information in the Materials. Information in the Materials is preliminary and is not intended to be complete, and such information is qualified in its entirety. Any opinions or estimates contained in the Materials represent the judgment of CIB at this time, and are subject to change without notice. Interested parties are advised to contact CIB for more information. The Materials are not an offer to sell, or a solicitation of an offer to buy, the securities or instruments named or described herein. The Materials are not intended to provide, and must not be relied on for, accounting, legal, regulatory, tax, business, financial or related advice or investment recommendations. No person providing any Materials is acting as fiduciary or advisor with respect to the Materials. You must consult with your own advisors as to the legal, regulatory, tax, business, financial, investment and other aspects of the Materials. Wells Fargo Corporate & Investment Banking (CIB) and Wells Fargo Securities (WFS) are the trade names used for the corporate banking, capital markets, and investment banking services of Wells Fargo & Company and its subsidiaries, including but not limited to Wells Fargo Securities, LLC, member of NYSE, FINRA, NFA, and SIPC, Wells Fargo Prime Services, LLC, member of FINRA, NFA and SIPC, and Wells Fargo Bank, N.A., member NFA and swap dealer registered with the CFTC and security-based swap dealer registered with the SEC, member FDIC. Wells Fargo Securities, LLC and Wells Fargo Prime Services, LLC, are distinct entities from affiliated banks and thrifts. Notwithstanding anything to the contrary contained in the Materials, all persons may disclose to any and all persons, without limitations of any kind, the U.S. federal, state or local tax treatment or tax structure of any transaction, any fact that may be relevant to understanding the U.S. federal, state or local tax treatment or tax structure of any transaction, and all materials of any kind (including opinions or other tax analyses) relating to such U.S. federal, state or local tax treatment or tax structure, other than the name of the parties or any other person named herein, or information that would permit identification of the parties or such other persons, and any pricing terms or nonpublic business or financial information that is unrelated to the U.S. federal, state or local tax treatment or tax structure of the transaction to the taxpayer and is not relevant to understanding the U.S. federal, state or local tax treatment or tax structure of the transaction to the taxpayer. All information provided in this presentation represents the views of CIBs Investment Banking and Equity Capital Markets team, and not the independent views of our Research Analysts. CIB has adopted policies and procedures designed to preserve the independence of our Research Analysts, whose views may differ from those presented herein. ©2025 Wells Fargo & Company. All rights reserved. This presentation was prepared exclusively for the benefit and internal use of the J.P. Morgan client to whom it is directly addressed and delivered (including such client’s subsidiaries, the “Company”) in order to assist the Company in evaluating, on a preliminary basis, the feasibility ofa possible transaction or transactions and does not carry any right of publication or disclosure, in whole or in part, to any other party. This presentation is for discussion purposes only and is incomplete without reference to, and should be viewed solely in conjunction with, the oral briefing provided by J.P. Morgan. Neither this presentation nor any of its contents may be disclosed or used for any other purpose without the prior written consent of J.P. Morgan. Additionally, this presentation may contain content initially generated by AI or other automated technologies. The information in this presentation is based upon any management forecasts supplied to us and reflects prevailing conditions and our views as of this date, all of which are accordingly subject to change. J.P. Morgan’s opinions and estimates constitute J.P. Morgan’s judgment and should be regarded as indicative, preliminary and for illustrative purposes only. In preparing this presentation, we have relied upon and assumed, without independent verification, the accuracy and completeness of all information available from public sources or which was provided to us by or on behalf of the Company or which was otherwise reviewed by us. In addition, our analyses are not and do not purport to be appraisals of the assets, stock, or business of the Company or any other entity. J.P. Morgan makes no representations as to the actualvalue which may be received in connection with a transaction nor the legal, tax or accounting effects of consummating a transaction. Unless expressly contemplated hereby, the information in this presentation does not take into account the effects of a possible transaction or transactions involving an actual or potential change ofcontrol, which may have significant valuation and other effects. Notwithstanding anything herein to the contrary, the Company and each of its employees, representatives or other agents may disclose to any and all persons, without limitation of any kind, the U.S. federal and state income tax treatment and the U.S. federal and state income tax structure of the transactions contemplated hereby and all materials of any kind (including opinions or other tax analyses) that are provided to the Company relating to such tax treatment and tax structure insofar as such treatment and/or structure relates to a U.S. federal or state income tax strategy provided to the Company byJ.P.Morgan. J.P. Morgan's policies on data privacy can be found at http://www.jpmorgan.com/pages/privacy. J.P. Morgan is a party to the SEC Research Settlement and as such, is generally not permitted to utilize the firm's research capabilities in pitching for investment banking business. All views contained in this presentation are the views of J.P. Morgan’s Investment Bank, not the Research Department. J.P. Morgan’s policies prohibit employees from offering, directly or indirectly, afavorable research rating or specific price target, or offering to change arating or price target, to a subject company as consideration or inducement for the receipt of business or for compensation. J.P.Morgan also prohibits its research analysts frombeing compensated for involvement in investment banking transactions except to the extent that such participation is intended to benefit investors. Changes to Interbank Offered Rates (IBORs) and other benchmark rates: Certain interest rate benchmarks are, or may in the future become, subject to ongoing international, national and other regulatory guidance, reform and proposals for reform. For more information, please consult: https://www.jpmorgan.com/global/disclosures/interbank_offered_rates JPMorgan Chase & Co. and its affiliates do not provide tax advice. Accordingly, any discussion of U.S. tax matters included herein (including any attachments) is not intended or written to be used, and cannot be used, in connection with the promotion, marketing or recommendation by anyone not affiliated with JPMorgan Chase & Co. of any ofthematters addressed herein or forthe purpose of avoiding U.S.tax-related penalties. J.P. Morgan is a marketing name for investment businesses of JPMorgan Chase & Co. and its subsidiaries and affiliates worldwide. Securities, syndicated loan arranging, financial advisory, lending, derivatives and other investment banking and commercial banking activities are performed by acombination of J.P. Morgan Securities LLC, J.P. Morgan Securities plc, J.P. Morgan SE, JPMorgan Chase Bank, N.A. and the appropriately licensed subsidiaries and affiliates of JPMorgan Chase & Co. worldwide. J.P. Morgan deal team members may be employees of any of the foregoing entities. J.P. Morgan Securities plc is authorized by the Prudential Regulation Authority and regulated by the Financial Conduct Authority and the Prudential Regulation Authority. J.P. Morgan SE is authorized as a credit institution by the German Federal Financial Supervisory Authority(Bundesanstalt für Finanzdienstleistungsaufsicht, BaFin) and jointly supervised bythe BaFin, the German Central Bank (Deutsche Bundesbank) and the European Central Bank (ECB). For information on any J.P.Morgan German legal entity see: https://www.jpmorgan.com/country/US/en/disclosures/legal-entity-information#germany. For information on any other J.P.Morgan legal entity see: https://www.jpmorgan.com/country/GB/EN/disclosures/investment-bank-legal-entity-disclosures. JPMS LLC intermediates securitiestransactions effected by its non-U.S. affiliatesfor or with its U.S.clients when appropriate and in accordancewith Rule 15a-6 under the Securities Exchange Act of 1934. Please consult: www.jpmorgan.com/securities-transactions This presentation does not constitute acommitment byany J.P.Morgan entity to underwrite, subscribe for or place any securities or to extend orarrange credit or to provide any other services. Copyright 2025 JPMorgan Chase & Co. All rights reserved. JPMorgan Chase Bank, N.A., organized under the laws of U.S.A. with limited liability. Disclaimer |