| Confidential, Preliminary & Highly Illustrative for Discussion Purposes Materials for the Special Committee Goldman Sachs & Co. LLC February 10th, 2026 Goldman Sachs does not provide accounting, tax, or legal advice. Notwithstanding anything in this document to the contrary, and except as required to enable compliance with applicable securities law, you (and each of your employees, representatives, and other agents) may disclose to any and all persons the US federal income and state tax treatment and tax structure of the transaction and all materials of any kind (including tax opinions and other tax analyses) that are provided to you relating to such tax treatment and tax structure, without Goldman Sachs imposing any limitation of any kind. |
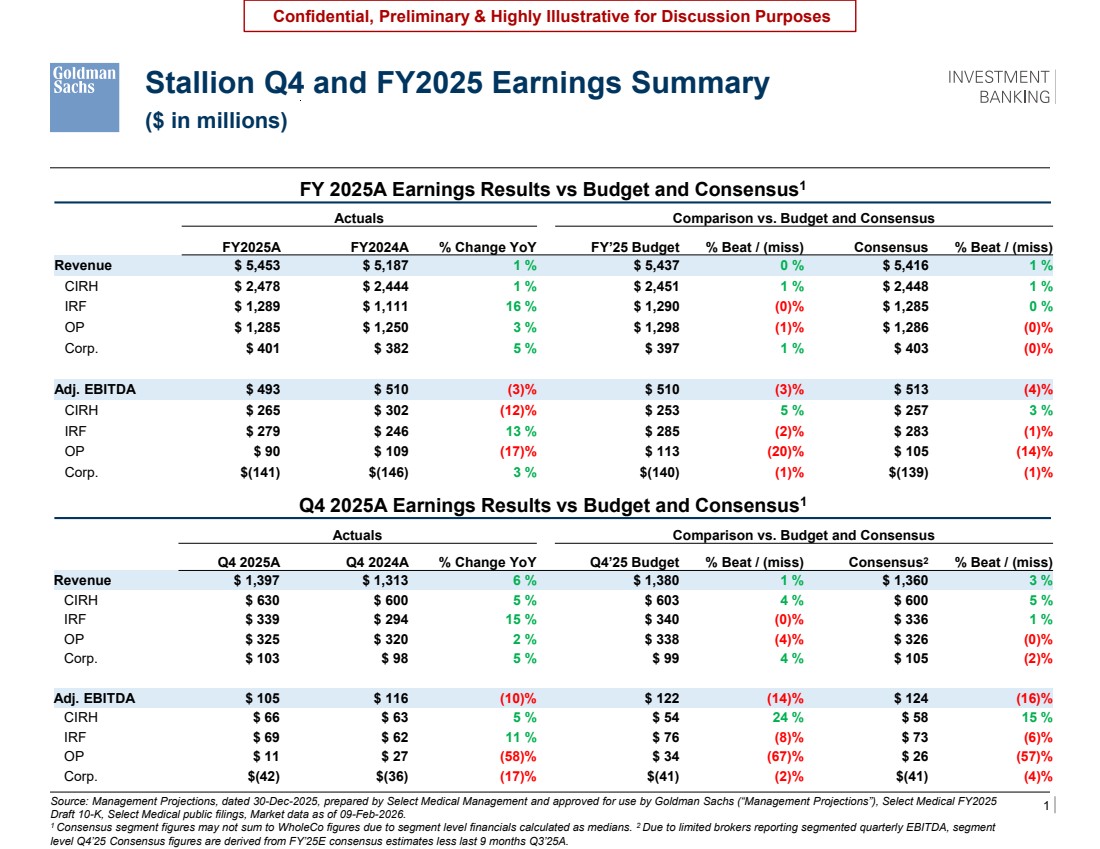
| 1 Confidential, Preliminary & Highly Illustrative for Discussion Purposes Actuals Comparison vs. Budget and Consensus Q4 2025A Q4 2024A % Change YoY Q4’25 Budget % Beat / (miss) Consensus2 % Beat / (miss) Revenue $ 1,397 $ 1,313 6 % $ 1,380 1 % $ 1,360 3 % CIRH $ 630 $ 600 5 % $ 603 4 % $ 600 5 % IRF $ 339 $ 294 15 % $ 340 (0)% $ 336 1 % OP $ 325 $ 320 2 % $ 338 (4)% $ 326 (0)% Corp. $ 103 $ 98 5 % $ 99 4 % $ 105 (2)% Adj. EBITDA $ 105 $ 116 (10)% $ 122 (14)% $ 124 (16)% CIRH $ 66 $ 63 5 % $ 54 24 % $ 58 15 % IRF $ 69 $ 62 11 % $ 76 (8)% $ 73 (6)% OP $ 11 $ 27 (58)% $ 34 (67)% $ 26 (57)% Corp. $(42) $(36) (17)% $(41) (2)% $(41) (4)% Actuals Comparison vs. Budget and Consensus FY2025A FY2024A % Change YoY FY’25 Budget % Beat / (miss) Consensus % Beat / (miss) Revenue $ 5,453 $ 5,187 1 % $ 5,437 0 % $ 5,416 1 % CIRH $ 2,478 $ 2,444 1 % $ 2,451 1 % $ 2,448 1 % IRF $ 1,289 $ 1,111 16 % $ 1,290 (0)% $ 1,285 0 % OP $ 1,285 $ 1,250 3 % $ 1,298 (1)% $ 1,286 (0)% Corp. $ 401 $ 382 5 % $ 397 1 % $ 403 (0)% Adj. EBITDA $ 493 $ 510 (3)% $ 510 (3)% $ 513 (4)% CIRH $ 265 $ 302 (12)% $ 253 5 % $ 257 3 % IRF $ 279 $ 246 13 % $ 285 (2)% $ 283 (1)% OP $ 90 $ 109 (17)% $ 113 (20)% $ 105 (14)% Corp. $(141) $(146) 3 % $(140) (1)% $(139) (1)% Stallion Q4 and FY2025 Earnings Summary \\firmwide.corp.gs.com\ibdroot\projects\IBD-NY\sapient2025\977110_1\Presentations\(2026.02.08) - Special Committee Follow Up Call\12.25 YTD MDA Common Size Analysis_Offline.xlsx Q4 2025A Earnings Results vs Budget and Consensus1 FY 2025A Earnings Results vs Budget and Consensus1 Source: Management Projections, dated 30-Dec-2025, prepared by Select Medical Management and approved for use by Goldman Sachs (“Management Projections”), Select Medical FY2025 Draft 10-K, Select Medical public filings, Market data as of 09-Feb-2026. 1 Consensus segment figures may not sum to WholeCo figures due to segment level financials calculated as medians. 2 Due to limited brokers reporting segmented quarterly EBITDA, segment level Q4’25 Consensus figures are derived from FY’25E consensus estimates less last 9 months Q3’25A. ($ in millions) |
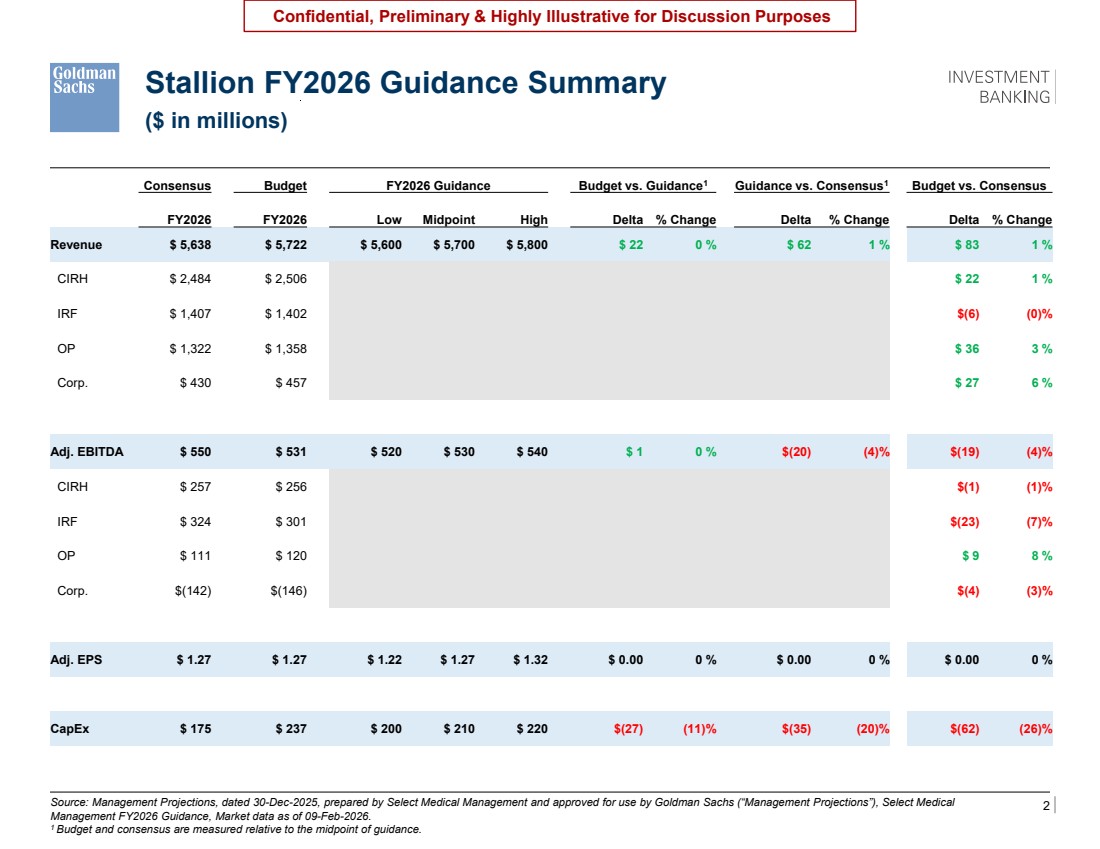
| 2 Confidential, Preliminary & Highly Illustrative for Discussion Purposes Stallion FY2026 Guidance Summary ($ in millions) Source: Management Projections, dated 30-Dec-2025, prepared by Select Medical Management and approved for use by Goldman Sachs (“Management Projections”), Select Medical Management FY2026 Guidance, Market data as of 09-Feb-2026. 1 Budget and consensus are measured relative to the midpoint of guidance. Consensus Budget FY2026 Guidance Budget vs. Guidance1 Guidance vs. Consensus1 Budget vs. Consensus FY2026 FY2026 Low Midpoint High Delta % Change Delta % Change Delta % Change Revenue $ 5,638 $ 5,722 $ 5,600 $ 5,700 $ 5,800 $ 22 0 % $ 62 1 % $ 83 1 % CIRH $ 2,484 $ 2,506 $ 22 1 % IRF $ 1,407 $ 1,402 $(6) (0)% OP $ 1,322 $ 1,358 $ 36 3 % Corp. $ 430 $ 457 $ 27 6 % Adj. EBITDA $ 550 $ 531 $ 520 $ 530 $ 540 $ 1 0 % $(20) (4)% $(19) (4)% CIRH $ 257 $ 256 $(1) (1)% IRF $ 324 $ 301 $(23) (7)% OP $ 111 $ 120 $ 9 8 % Corp. $(142) $(146) $(4) (3)% Adj. EPS $ 1.27 $ 1.27 $ 1.22 $ 1.27 $ 1.32 $ 0.00 0 % $ 0.00 0 % $ 0.00 0 % CapEx $ 175 $ 237 $ 200 $ 210 $ 220 $(27) (11)% $(35) (20)% $(62) (26)% |