| Confidential, Preliminary & Highly Illustrative for Discussion Purposes Materials for the Special Committee Goldman Sachs & Co. LLC January 12th, 2026 Goldman Sachs does not provide accounting, tax, or legal advice. Notwithstanding anything in this document to the contrary, and except as required to enable compliance with applicable securities law, you (and each of your employees, representatives, and other agents) may disclose to any and all persons the US federal income and state tax treatment and tax structure of the transaction and all materials of any kind (including tax opinions and other tax analyses) that are provided to you relating to such tax treatment and tax structure, without Goldman Sachs imposing any limitation of any kind. |
| 1 Confidential, Preliminary & Highly Illustrative for Discussion Purposes Today’s Discussion 2 Overview of Management Forecast 1 Public Market Perspectives on Select 3 Overview of Financial Analyses A Appendix 4 Overview of Potential Strategic Alternatives |
| 2 Confidential, Preliminary & Highly Illustrative for Discussion Purposes 1 Public Market Perspectives on Select |
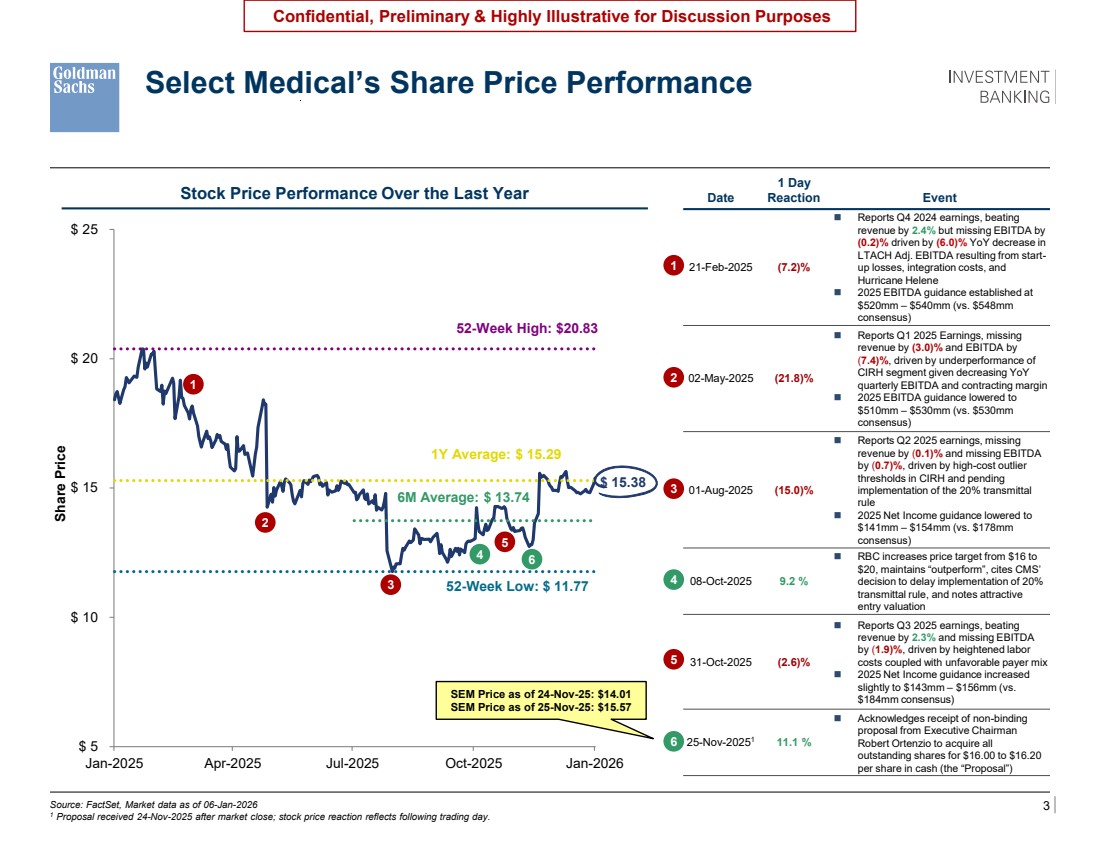
| 3 Confidential, Preliminary & Highly Illustrative for Discussion Purposes Source: FactSet, Market data as of 06-Jan-2026 1 Proposal received 24-Nov-2025 after market close; stock price reaction reflects following trading day. Select Medical’s Share Price Performance Date 1 Day Reaction Event 21-Feb-2025 (7.2)% ◼ Reports Q4 2024 earnings, beating revenue by 2.4% but missing EBITDA by (0.2)% driven by (6.0)% YoY decrease in LTACH Adj. EBITDA resulting from start-up losses, integration costs, and Hurricane Helene ◼ 2025 EBITDA guidance established at $520mm – $540mm (vs. $548mm consensus) 02-May-2025 (21.8)% ◼ Reports Q1 2025 Earnings, missing revenue by (3.0)% and EBITDA by (7.4)%, driven by underperformance of CIRH segment given decreasing YoY quarterly EBITDA and contracting margin ◼ 2025 EBITDA guidance lowered to $510mm – $530mm (vs. $530mm consensus) 01-Aug-2025 (15.0)% ◼ Reports Q2 2025 earnings, missing revenue by (0.1)% and missing EBITDA by (0.7)%, driven by high-cost outlier thresholds in CIRH and pending implementation of the 20% transmittal rule ◼ 2025 Net Income guidance lowered to $141mm – $154mm (vs. $178mm consensus) 08-Oct-2025 9.2 % ◼ RBC increases price target from $16 to $20, maintains “outperform”, cites CMS’ decision to delay implementation of 20% transmittal rule, and notes attractive entry valuation 31-Oct-2025 (2.6)% ◼ Reports Q3 2025 earnings, beating revenue by 2.3% and missing EBITDA by (1.9)%, driven by heightened labor costs coupled with unfavorable payer mix ◼ 2025 Net Income guidance increased slightly to $143mm – $156mm (vs. $184mm consensus) 25-Nov-20251 11.1 % ◼ Acknowledges receipt of non-binding proposal from Executive Chairman Robert Ortenzio to acquire all outstanding shares for $16.00 to $16.20 per share in cash (the “Proposal”) good good good good check good good good $ 5 $ 10 $ 15 $ 20 $ 25 Jan-2025 Apr-2025 Jul-2025 Oct-2025 Jan-2026 Share Price $ 15.38 1Y Average: $ 15.29 6M Average: $ 13.74 52-Week High: $20.83 52-Week Low: $ 11.77 SEM Price as of 24-Nov-25: $14.01 SEM Price as of 25-Nov-25: $15.57 1 2 5 3 4 6 1 2 3 4 5 6 Stock Price Performance Over the Last Year |
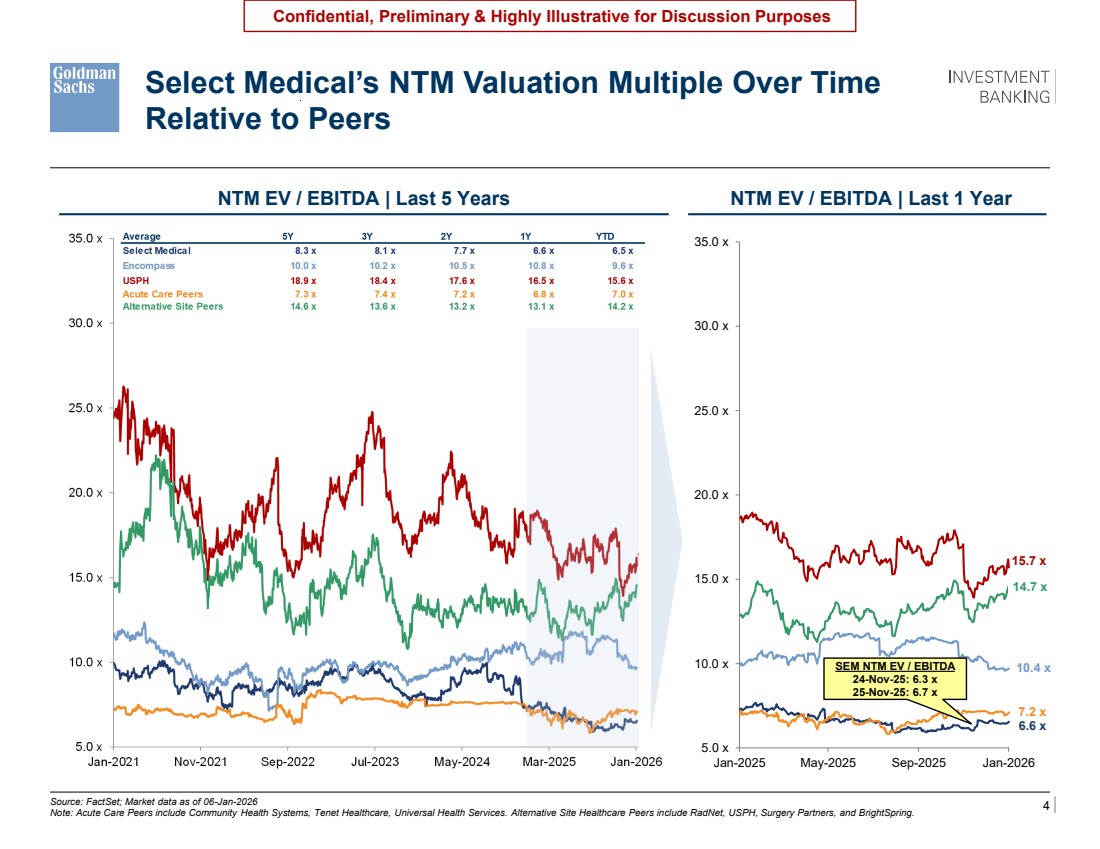
| 4 Confidential, Preliminary & Highly Illustrative for Discussion Purposes 5.0 x 10.0 x 15.0 x 20.0 x 25.0 x 30.0 x 35.0 x Jan-2025 May-2025 Sep-2025 Jan-2026 9.7 x 6.6 x 15.7 x 7.1 x 14.5 x Source: FactSet; Market data as of 06-Jan-2026 Note: Acute Care Peers include Community Health Systems, Tenet Healthcare, Universal Health Services. Alternative Site Healthcare Peers include RadNet, USPH, Surgery Partners, and BrightSpring. NTM EV / EBITDA | Last 5 Years Select Medical’s NTM Valuation Multiple Over Time Relative to Peers 03-Jan-2024 Select announces its intention to spin off Concentra; stock has traded up 42.0% and multiple has traded up by 1.4x since then Backup \\firmwide.corp.gs.com\ibdroot\projects\IBD-NY\sawbones2024\925030_1\Presentations\2024.08.16 RemainCo Analysis\Excel\NTM EV EBITDA_vMaster.xlsx Select’s NTM EV / EBITDA pro forma for Concentra Separation: ~7.5x SEM NTM EV / EBITDA 24-Nov-25: 6.3 x 25-Nov-25: 6.7 x NTM EV / EBITDA | Last 1 Year \\firmwide.corp.gs.com\ibdroot\projects\IBD-NY\sapient2025\977110_1\Presentations\2. Fairness Opinion Presentation\Excel\NTM EV EBITDA_vMaster_06Jan2026_v02.xlsx 7.2 x 10.4 x 14.7 x WIP Implied ex-Concentra Select Medical 5-year, 3-year, and 2-year average NTM EV / EBITDA Multiples of 7.9x, 7.8x, and 7.5x respectively, assuming Concentra valued at 9.5x NTM EBITDA |
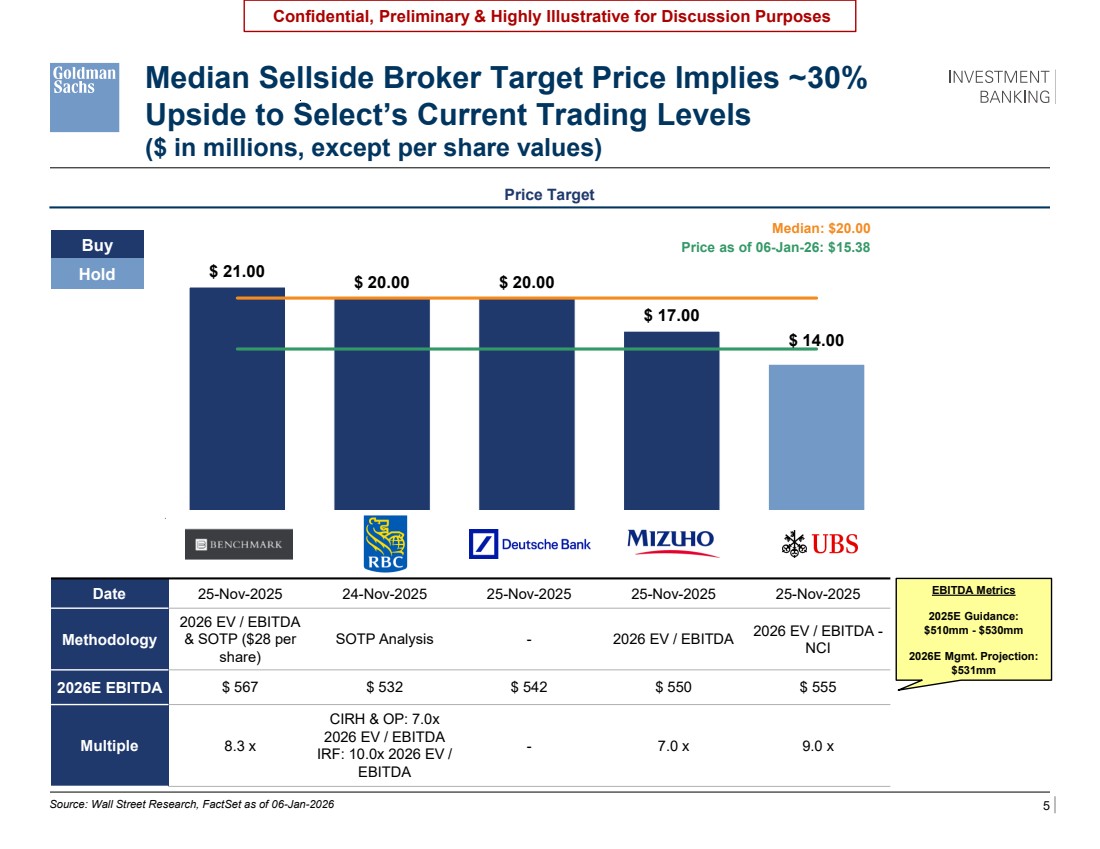
| 5 Confidential, Preliminary & Highly Illustrative for Discussion Purposes $ 21.00 $ 20.00 $ 20.00 $ 17.00 $ 14.00 Benchmark RBC DB Mizuho UBS Median: $20.00 Price as of 06-Jan-26: $15.38 Median Sellside Broker Target Price Implies ~30% Upside to Select’s Current Trading Levels ($ in millions, except per share values) Price Target Source: Wall Street Research, FactSet as of 06-Jan-2026 Date 25-Nov-2025 24-Nov-2025 25-Nov-2025 25-Nov-2025 25-Nov-2025 Methodology 2026 EV / EBITDA & SOTP ($28 per share) SOTP Analysis - 2026 EV / EBITDA 2026 EV / EBITDA - NCI 2026E EBITDA $ 567 $ 532 $ 542 $ 550 $ 555 Multiple 8.3 x CIRH & OP: 7.0x 2026 EV / EBITDA IRF: 10.0x 2026 EV / EBITDA - 7.0 x 9.0 x Buy Hold \\firmwide.corp.gs.com\ibdroot\projects\IBD-NY\sapient2025\977110_1\Presentations\2. Fairness Opinion Presentation\Excel\Broker Perspectives and Projections\Broker Perspectives and Projections_v03.xlsx EBITDA Metrics 2025E Guidance: $510mm - $530mm 2026E Mgmt. Projection: $531mm |
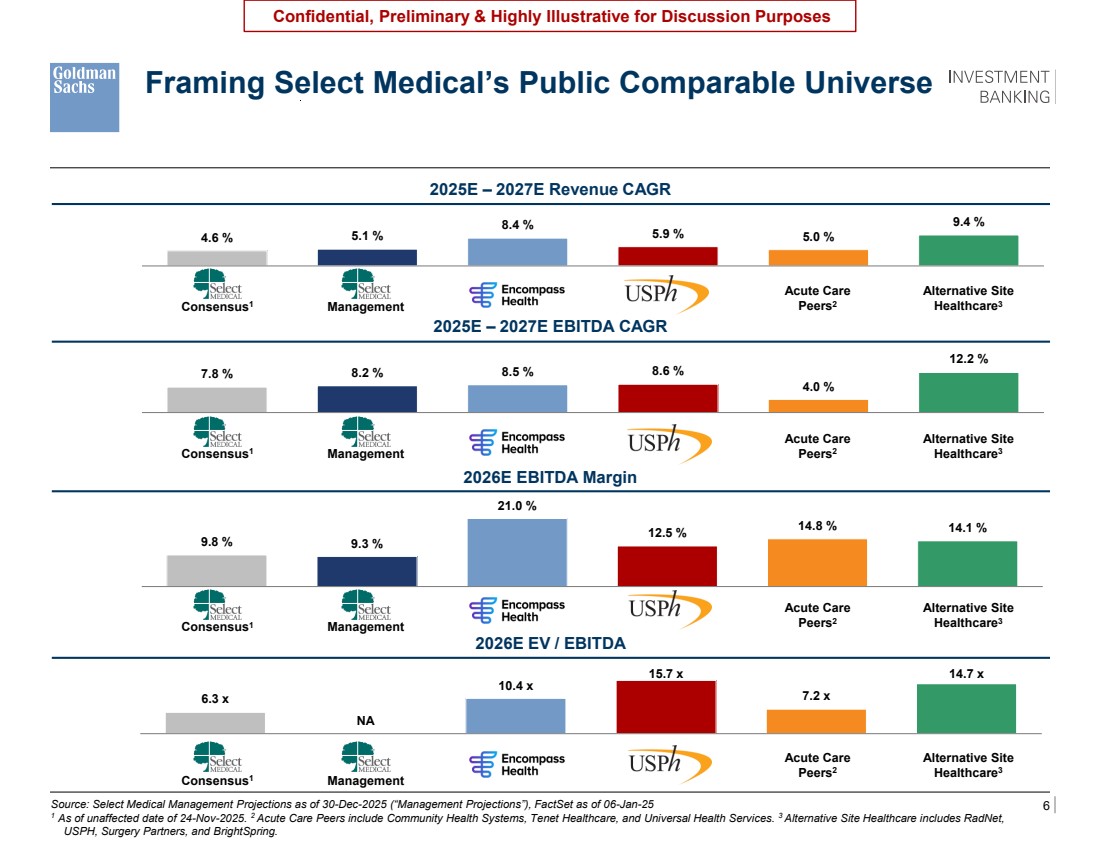
| 6 Confidential, Preliminary & Highly Illustrative for Discussion Purposes 7.8 % 8.2 % 8.5 % 8.6 % 4.0 % 12.2 % Source: Select Medical Management Projections as of 30-Dec-2025 (“Management Projections”), FactSet as of 06-Jan-25 1 As of unaffected date of 24-Nov-2025. 2 Acute Care Peers include Community Health Systems, Tenet Healthcare, and Universal Health Services. 3 Alternative Site Healthcare includes RadNet, USPH, Surgery Partners, and BrightSpring. 2025E – 2027E Revenue CAGR 2025E – 2027E EBITDA CAGR 2026E EBITDA Margin Consensus1 Framing Select Medical’s Public Comparable Universe Management Acute Care Peers2 Alternative Site Healthcare3 Consensus1 Management Acute Care Peers2 Alternative Site Healthcare3 Consensus1 Management Acute Care Peers2 Alternative Site Healthcare3 \\firmwide.corp.gs.com\ibdroot\projects\IBD-NY\sapient2025\977110_1\Presentations\2. Fairness Opinion Presentation\Excel\CSC\Copy of Select Medical CSC 1.6.2026 v2.xlsx 9.8 % 9.3 % 21.0 % 12.5 % 14.8 % 14.1 % 4.6 % 5.1 % 8.4 % 5.9 % 5.0 % 9.4 % 2026E EV / EBITDA Consensus1 Management Acute Care Peers2 Alternative Site Healthcare3 6.3 x NA 10.4 x 15.7 x 7.2 x 14.7 x |
| 7 Confidential, Preliminary & Highly Illustrative for Discussion Purposes 2 Overview of Management Forecast |
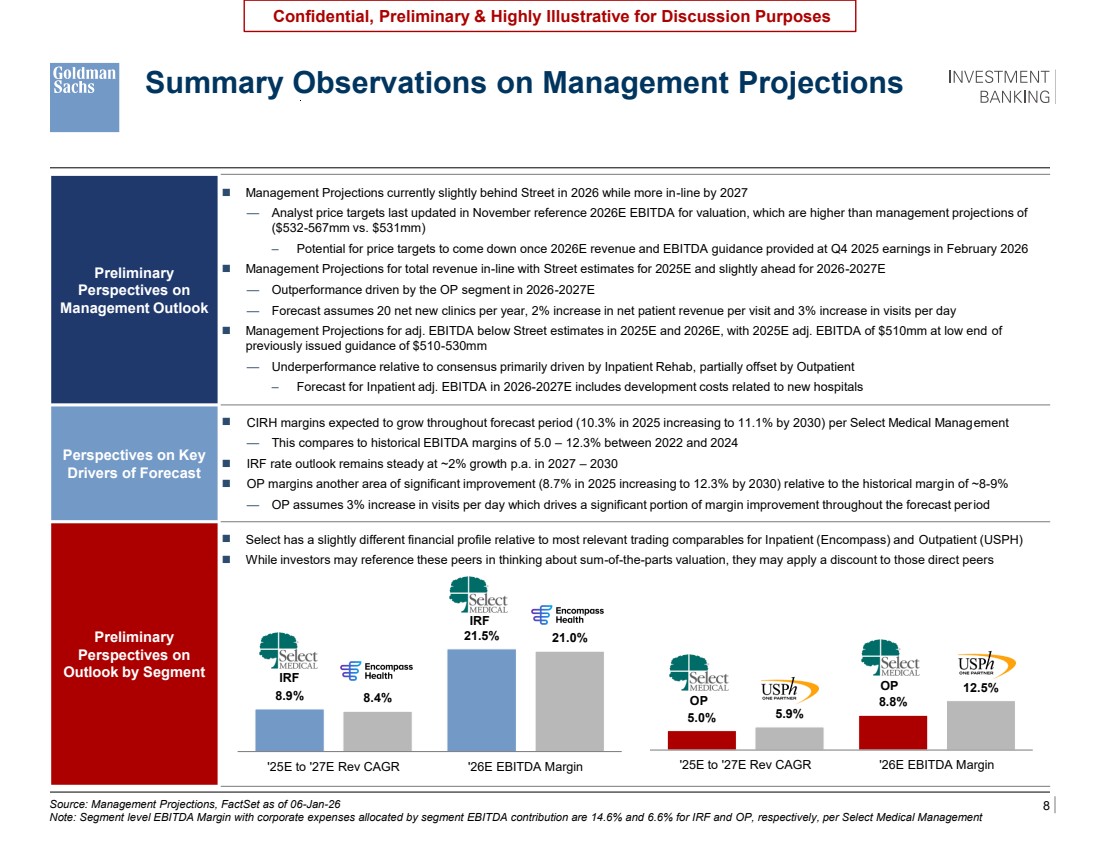
| 8 Confidential, Preliminary & Highly Illustrative for Discussion Purposes Preliminary Perspectives on Management Outlook ◼ Management Projections currently slightly behind Street in 2026 while more in-line by 2027 — Analyst price targets last updated in November reference 2026E EBITDA for valuation, which are higher than management projections of ($532-567mm vs. $531mm) – Potential for price targets to come down once 2026E revenue and EBITDA guidance provided at Q4 2025 earnings in February 2026 ◼ Management Projections for total revenue in-line with Street estimates for 2025E and slightly ahead for 2026-2027E — Outperformance driven by the OP segment in 2026-2027E — Forecast assumes 20 net new clinics per year, 2% increase in net patient revenue per visit and 3% increase in visits per day ◼ Management Projections for adj. EBITDA below Street estimates in 2025E and 2026E, with 2025E adj. EBITDA of $510mm at low end of previously issued guidance of $510-530mm — Underperformance relative to consensus primarily driven by Inpatient Rehab, partially offset by Outpatient – Forecast for Inpatient adj. EBITDA in 2026-2027E includes development costs related to new hospitals Perspectives on Key Drivers of Forecast ◼ CIRH margins expected to grow throughout forecast period (10.3% in 2025 increasing to 11.1% by 2030) per Select Medical Management — This compares to historical EBITDA margins of 5.0 – 12.3% between 2022 and 2024 ◼ IRF rate outlook remains steady at ~2% growth p.a. in 2027 – 2030 ◼ OP margins another area of significant improvement (8.7% in 2025 increasing to 12.3% by 2030) relative to the historical margin of ~8-9% — OP assumes 3% increase in visits per day which drives a significant portion of margin improvement throughout the forecast period Preliminary Perspectives on Outlook by Segment ◼ Select has a slightly different financial profile relative to most relevant trading comparables for Inpatient (Encompass) and Outpatient (USPH) ◼ While investors may reference these peers in thinking about sum-of-the-parts valuation, they may apply a discount to those direct peers Source: Management Projections, FactSet as of 06-Jan-26 Note: Segment level EBITDA Margin with corporate expenses allocated by segment EBITDA contribution are 14.6% and 6.6% for IRF and OP, respectively, per Select Medical Management Summary Observations on Management Projections Home Health Revenue Volume Growth: — Episodic admissions expected to decline at a low single digit rate throughout the projection period as Medicare-eligible population continues to shift to Medicare Advantage — Majority of current revenue (66% in YTD 2023) contributed by Medicare FFS — Non-episodic visits expected to continue to grow at a double-digit growth rate as MA population is expected to increase Revenue Growth: — Episodic revenue to remain under pressure in 2024E due to the CMS proposed rate decrease of (2.2)% into (1.8)% for Enhabit); beyond 2024E, rates expected to increase at long-term inflation target of 2% — Management forecast does not yet reflect most recent CMS rate increase of +0.8% for 2024 (expected to translate into +1.2% for Enhabit) — Non-episodic revenue per visit expected to improve driven by the Company’s Payor Innovation initiative Cost Per Visit Growth: In 2024E-efficiency gains; in 2024E, includes contract labor initiative starting mid-2023 with a (0.7)% impact Hospice Revenue Admissions: Anticipated growth in-line with long-term market growth of hospice in the US of 5.5% Revenue per Patient Day: Rate expected to improve 2.6% in 2024E based on final rule of 2.8%1 ; beyond 2024E, rate expected to increase at long-term inflation target of 2% Cost per Patient Day Growth: in 2024E and 2025E, expect increased census with no additional labor costs from transition to case management model; in 2026E and 2027E, expect annual 3% increase due to inflation partially offset by 0.5% efficiency gains Other Corporate G&A: Expected to grow faster than revenue in 2023E as the company continues to build out corporate functions — Expect Pre-Corp SG&A growth to be 50% of revenue growth for the Home Health and Hospice Segments in 2024E onwards Maintenance capex as a % of revenue expected to remain at ~0.8% of Revenue Expects to open 10 De Novo locations per year (2 Home Health / 8 Hospice) starting in 2023E Projections do not include additional acquisition spend other than one acquisition that closed in Q1 2023A \\firmwide.corp.gs.com\ibdroot\projects\IBD-NY\sapient2025\977110_1\Presentations\2. Fairness Opinion Presentation\Excel\CSC\Select Medical CSC 1.6.2026 v1.xlsx Charts at Bottom \\firmwide.corp.gs.com\ibdroot\projects\IBD-NY\sapient2025\977110_1\Presentations\2. Fairness Opinion Presentation\Excel\Broker Perspectives and Projections\Broker Perspectives and Projections_v03.xlsx Top portion (for the fill in the blank from jeff) IRF IRF OP OP 8.9% 21.5% 8.4% 21.0% '25E to '27E Rev CAGR '26E EBITDA Margin 5.0% 8.8% 5.9% 12.5% '25E to '27E Rev CAGR '26E EBITDA Margin |
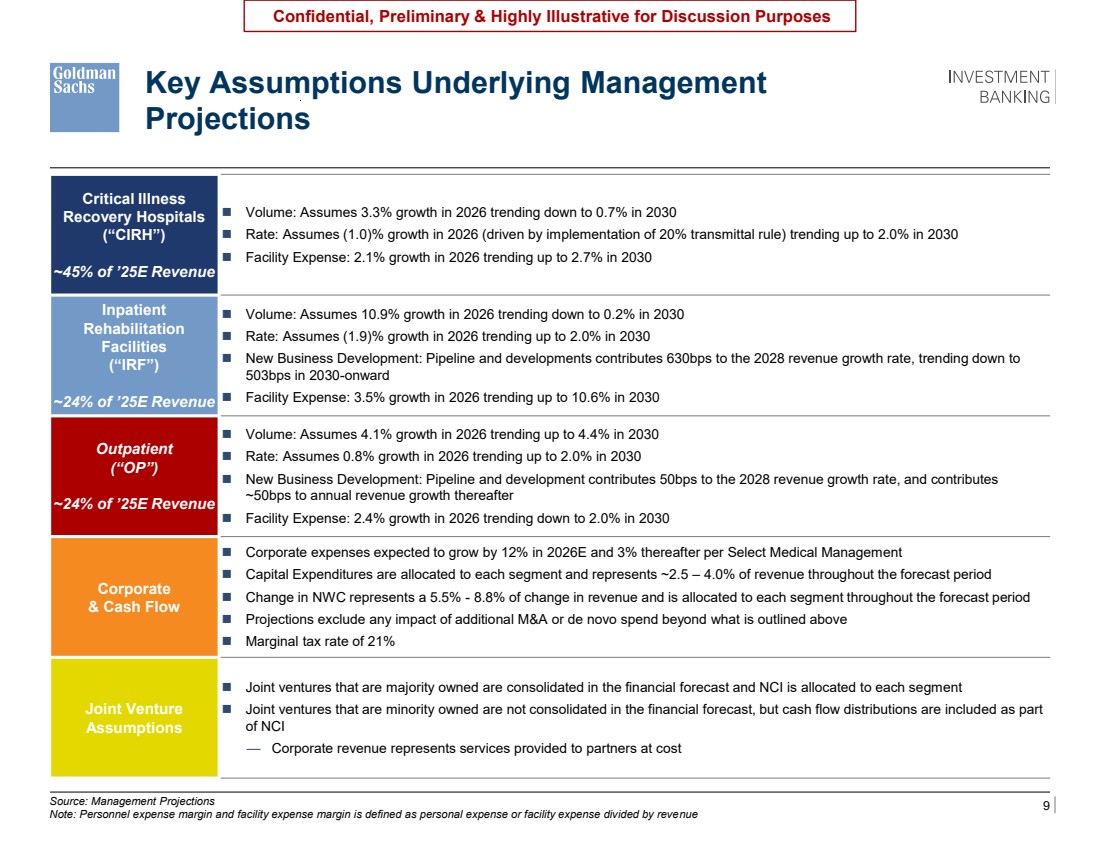
| 9 Confidential, Preliminary & Highly Illustrative for Discussion Purposes Source: Management Projections Note: Personnel expense margin and facility expense margin is defined as personal expense or facility expense divided by revenue Key Assumptions Underlying Management Projections Critical Illness Recovery Hospitals (“CIRH”) ~45% of ’25E Revenue ◼ Volume: Assumes 3.3% growth in 2026 trending down to 0.7% in 2030 ◼ Rate: Assumes (1.0)% growth in 2026 (driven by implementation of 20% transmittal rule) trending up to 2.0% in 2030 ◼ Facility Expense: 2.1% growth in 2026 trending up to 2.7% in 2030 Inpatient Rehabilitation Facilities (“IRF”) ~24% of ’25E Revenue ◼ Volume: Assumes 10.9% growth in 2026 trending down to 0.2% in 2030 ◼ Rate: Assumes (1.9)% growth in 2026 trending up to 2.0% in 2030 ◼ New Business Development: Pipeline and developments contributes 630bps to the 2028 revenue growth rate, trending down to 503bps in 2030-onward ◼ Facility Expense: 3.5% growth in 2026 trending up to 10.6% in 2030 Outpatient (“OP”) ~24% of ’25E Revenue ◼ Volume: Assumes 4.1% growth in 2026 trending up to 4.4% in 2030 ◼ Rate: Assumes 0.8% growth in 2026 trending up to 2.0% in 2030 ◼ New Business Development: Pipeline and development contributes 50bps to the 2028 revenue growth rate, and contributes ~50bps to annual revenue growth thereafter ◼ Facility Expense: 2.4% growth in 2026 trending down to 2.0% in 2030 Corporate & Cash Flow ◼ Corporate expenses expected to grow by 12% in 2026E and 3% thereafter per Select Medical Management ◼ Capital Expenditures are allocated to each segment and represents ~2.5 – 4.0% of revenue throughout the forecast period ◼ Change in NWC represents a 5.5% - 8.8% of change in revenue and is allocated to each segment throughout the forecast period ◼ Projections exclude any impact of additional M&A or de novo spend beyond what is outlined above ◼ Marginal tax rate of 21% Joint Venture Assumptions ◼ Joint ventures that are majority owned are consolidated in the financial forecast and NCI is allocated to each segment ◼ Joint ventures that are minority owned are not consolidated in the financial forecast, but cash flow distributions are included as part of NCI — Corporate revenue represents services provided to partners at cost Home Health Revenue Volume Growth: — Episodic admissions expected to decline at a low single digit rate throughout the projection period as Medicare-eligible population continues to shift to Medicare Advantage — Majority of current revenue (66% in YTD 2023) contributed by Medicare FFS — Non-episodic visits expected to continue to grow at a double-digit growth rate as MA population is expected to increase Revenue Growth: — Episodic revenue to remain under pressure in 2024E due to the CMS proposed rate decrease of (2.2)% into (1.8)% for Enhabit); beyond 2024E, rates expected to increase at long-term inflation target of 2% — Management forecast does not yet reflect most recent CMS rate increase of +0.8% for 2024 (expected to translate into +1.2% for Enhabit) — Non-episodic revenue per visit expected to improve driven by the Company’s Payor Innovation initiative Cost Per Visit Growth: In 2024E-efficiency gains; in 2024E, includes contract labor initiative starting mid-2023 with a (0.7)% impact Hospice Revenue Admissions: Anticipated growth in-line with long-term market growth of hospice in the US of 5.5% Revenue per Patient Day: Rate expected to improve 2.6% in 2024E based on final rule of 2.8%1 ; beyond 2024E, rate expected to increase at long-term inflation target of 2% Cost per Patient Day Growth: in 2024E and 2025E, expect increased census with no additional labor costs from transition to case management model; in 2026E and 2027E, expect annual 3% increase due to inflation partially offset by 0.5% efficiency gains Other Corporate G&A: Expected to grow faster than revenue in 2023E as the company continues to build out corporate functions — Expect Pre-Corp SG&A growth to be 50% of revenue growth for the Home Health and Hospice Segments in 2024E onwards Maintenance capex as a % of revenue expected to remain at ~0.8% of Revenue Expects to open 10 De Novo locations per year (2 Home Health / 8 Hospice) starting in 2023E Projections do not include additional acquisition spend other than one acquisition that closed in Q1 2023A For inpatient - rate = net patient revenue per day volume = patient days For outpatient - rate = net patient revenue per visit volume = total clinic visits \\firmwide.corp.gs.com\ibdroot\projects\IBD-NY\sapient2025\977110_1\Presentations\2. Fairness Opinion Presentation\Excel\Broker Perspectives and Projections\Broker Perspectives and Projections_v03.xlsx Key Assumptions sheet |
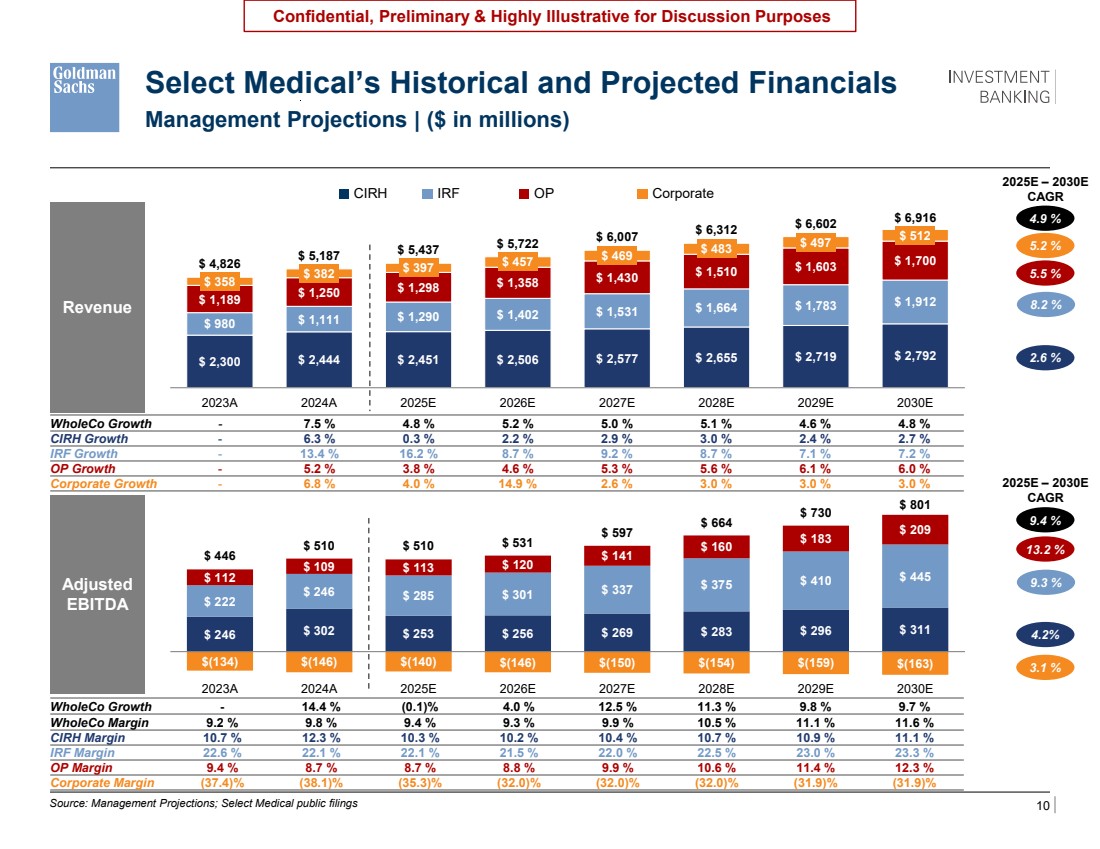
| 10 Confidential, Preliminary & Highly Illustrative for Discussion Purposes $ 2,300 $ 2,444 $ 2,451 $ 2,506 $ 2,577 $ 2,655 $ 2,719 $ 2,792 $ 980 $ 1,189 $ 1,111 $ 1,290 $ 1,402 $ 1,531 $ 1,664 $ 1,783 $ 1,912 $ 1,250 $ 1,298 $ 1,358 $ 1,430 $ 1,510 $ 1,603 $ 1,700 $ 358 $ 382 $ 397 $ 457 $ 469 $ 483 $ 497 $ 512 $ 4,826 $ 5,187 $ 5,437 $ 5,722 $ 6,007 $ 6,312 $ 6,602 $ 6,916 2023A 2024A 2025E 2026E 2027E 2028E 2029E 2030E $ 246 $ 302 $ 253 $ 256 $ 269 $ 283 $ 296 $ 311 $ 222 $ 246 $ 285 $ 301 $ 337 $ 375 $ 410 $ 112 $ 445 $ 109 $ 113 $ 120 $ 141 $ 160 $ 183 $ 209 $(134) $(146) $(140) $(146) $(150) $(154) $(159) $(163) $ 446 $ 510 $ 510 $ 531 $ 597 $ 664 $ 730 $ 801 2023A 2024A 2025E 2026E 2027E 2028E 2029E 2030E Source: Management Projections; Select Medical public filings Revenue WholeCo Growth - 7.5 % 4.8 % 5.2 % 5.0 % 5.1 % 4.6 % 4.8 % CIRH Growth - 6.3 % 0.3 % 2.2 % 2.9 % 3.0 % 2.4 % 2.7 % IRF Growth - 13.4 % 16.2 % 8.7 % 9.2 % 8.7 % 7.1 % 7.2 % OP Growth - 5.2 % 3.8 % 4.6 % 5.3 % 5.6 % 6.1 % 6.0 % Corporate Growth - 6.8 % 4.0 % 14.9 % 2.6 % 3.0 % 3.0 % 3.0 % 5.5 % 2025E – 2030E CAGR Adjusted EBITDA Select Medical’s Historical and Projected Financials Management Projections | ($ in millions) OP 2.6 % WholeCo Growth - 14.4 % (0.1)% 4.0 % 12.5 % 11.3 % 9.8 % 9.7 % WholeCo Margin 9.2 % 9.8 % 9.4 % 9.3 % 9.9 % 10.5 % 11.1 % 11.6 % CIRH Margin 10.7 % 12.3 % 10.3 % 10.2 % 10.4 % 10.7 % 10.9 % 11.1 % IRF Margin 22.6 % 22.1 % 22.1 % 21.5 % 22.0 % 22.5 % 23.0 % 23.3 % OP Margin 9.4 % 8.7 % 8.7 % 8.8 % 9.9 % 10.6 % 11.4 % 12.3 % Corporate Margin (37.4)% (38.1)% (35.3)% (32.0)% (32.0)% (32.0)% (31.9)% (31.9)% 8.2 % 2025E – 2030E CAGR CIRH IRF 5.2 % 4.9 % Corporate 13.2 % 4.2% 9.3 % 9.4 % \\firmwide.corp.gs.com\ibdroot\projects\IBD-NY\sapient2025\977110_1\Presentations\2. Fairness Opinion Presentation\Excel\Broker Perspectives and Projections\Broker Perspectives and Projections_v02.xlsx 3.1 % |
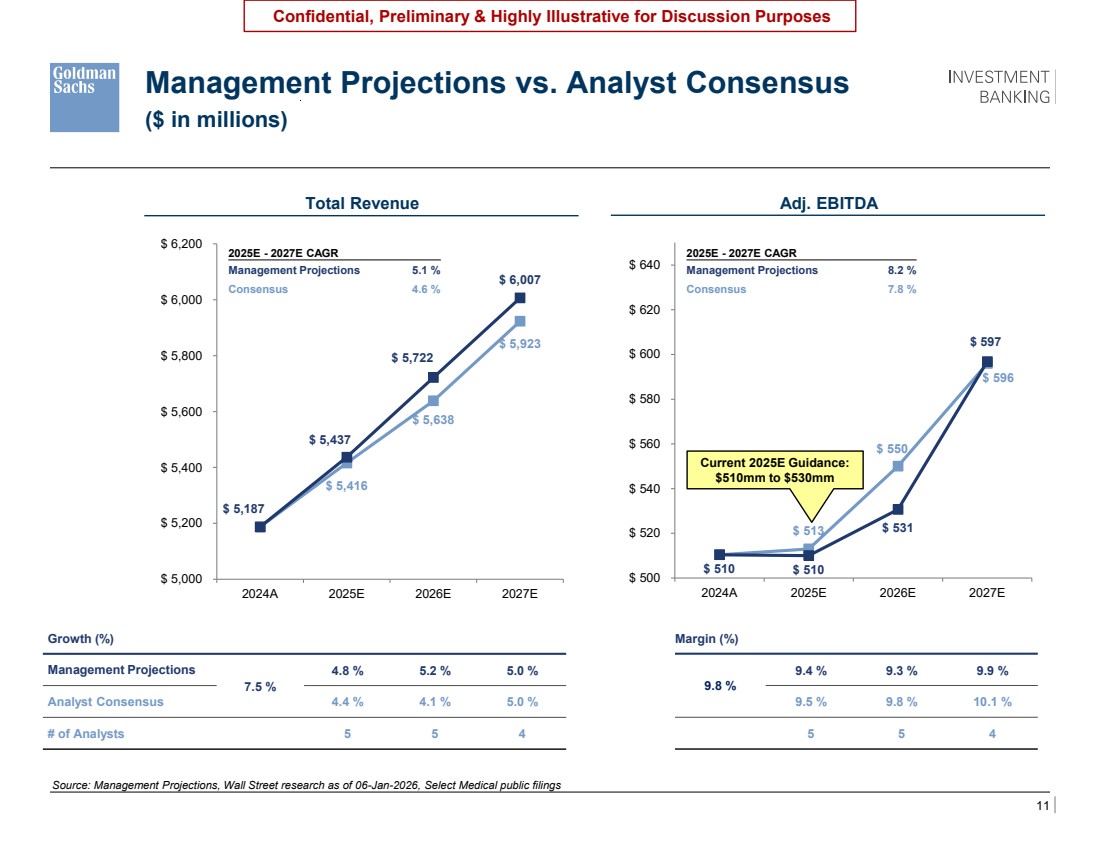
| 11 Confidential, Preliminary & Highly Illustrative for Discussion Purposes $ 513 $ 550 $ 596 $ 510 $ 510 $ 531 $ 597 $ 500 $ 520 $ 540 $ 560 $ 580 $ 600 $ 620 $ 640 2024A 2025E 2026E 2027E $ 5,416 $ 5,638 $ 5,923 $ 5,187 $ 5,437 $ 5,722 $ 6,007 $ 5,000 $ 5,200 $ 5,400 $ 5,600 $ 5,800 $ 6,000 $ 6,200 2024A 2025E 2026E 2027E Total Revenue Source: Management Projections, Wall Street research as of 06-Jan-2026, Select Medical public filings Growth (%) Management Projections 7.5 % 4.8 % 5.2 % 5.0 % Analyst Consensus 4.4 % 4.1 % 5.0 % # of Analysts 5 5 4 Management Projections vs. Analyst Consensus ($ in millions) Adj. EBITDA Margin (%) 9.8 % 9.4 % 9.3 % 9.9 % 9.5 % 9.8 % 10.1 % 5 5 4 2025E - 2027E CAGR Management Projections 5.1 % Consensus 4.6 % 2025E - 2027E CAGR Management Projections 8.2 % Consensus 7.8 % \\firmwide.corp.gs.com\ibdroot\projects\IBD-NY\sapient2025\977110_1\Presentations\2. Fairness Opinion Presentation\Excel\Broker Perspectives and Projections\Broker Perspectives and Projections_v02.xlsx Growth (%) [ ] % [ ] % [ ] % Consensus 4.5 % 4.1 % 4.4 % 4 4 3 Margin (%) 9.8 % [ ] % [ ] % [ ] % 9.5 % 9.7 % 10.1 % 4 4 3 Current 2025E Guidance: $510mm to $530mm |
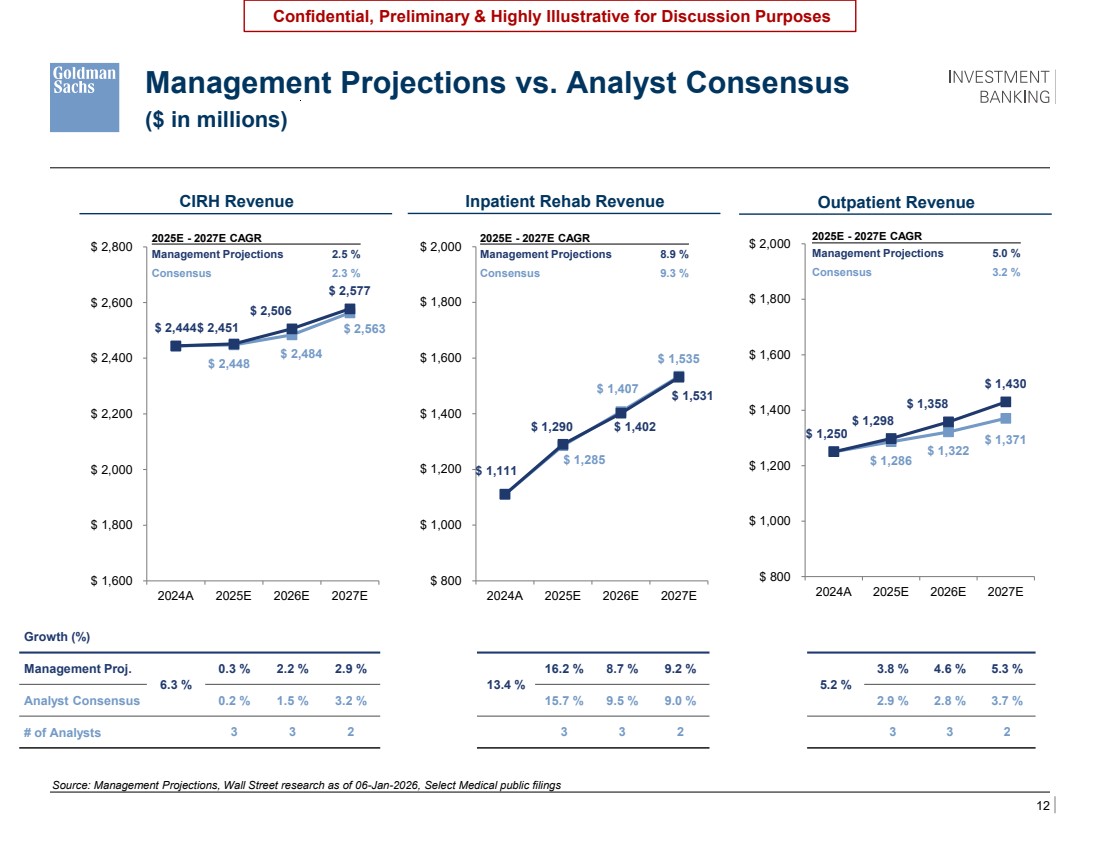
| 12 Confidential, Preliminary & Highly Illustrative for Discussion Purposes $ 1,285 $ 1,407 $ 1,535 $ 1,111 $ 1,290 $ 1,402 $ 1,531 $ 800 $ 1,000 $ 1,200 $ 1,400 $ 1,600 $ 1,800 $ 2,000 2024A 2025E 2026E 2027E $ 1,286 $ 1,322 $ 1,371 $ 1,250 $ 1,298 $ 1,358 $ 1,430 $ 800 $ 1,000 $ 1,200 $ 1,400 $ 1,600 $ 1,800 $ 2,000 2024A 2025E 2026E 2027E $ 2,448 $ 2,484 $ 2,444 $ 2,451 $ 2,563 $ 2,506 $ 2,577 $ 1,600 $ 1,800 $ 2,000 $ 2,200 $ 2,400 $ 2,600 $ 2,800 2024A 2025E 2026E 2027E Source: Management Projections, Wall Street research as of 06-Jan-2026, Select Medical public filings Growth (%) Management Proj. 6.3 % 0.3 % 2.2 % 2.9 % Analyst Consensus 0.2 % 1.5 % 3.2 % # of Analysts 3 3 2 Management Projections vs. Analyst Consensus ($ in millions) Outpatient Revenue 2025E - 2027E CAGR Management Projections 2.5 % Consensus 2.3 % \\firmwide.corp.gs.com\ibdroot\projects\IBD-NY\sapient2025\977110_1\Presentations\2. Fairness Opinion Presentation\Excel\Broker Perspectives and Projections\Broker Perspectives and Projections_v02.xlsx CIRH Revenue Inpatient Rehab Revenue 2025E - 2027E CAGR Management Projections 8.9 % Consensus 9.3 % 2025E - 2027E CAGR Management Projections 5.0 % Consensus 3.2 % 13.4 % 16.2 % 8.7 % 9.2 % 15.7 % 9.5 % 9.0 % 3 3 2 5.2 % 3.8 % 4.6 % 5.3 % 2.9 % 2.8 % 3.7 % 3 3 2 |
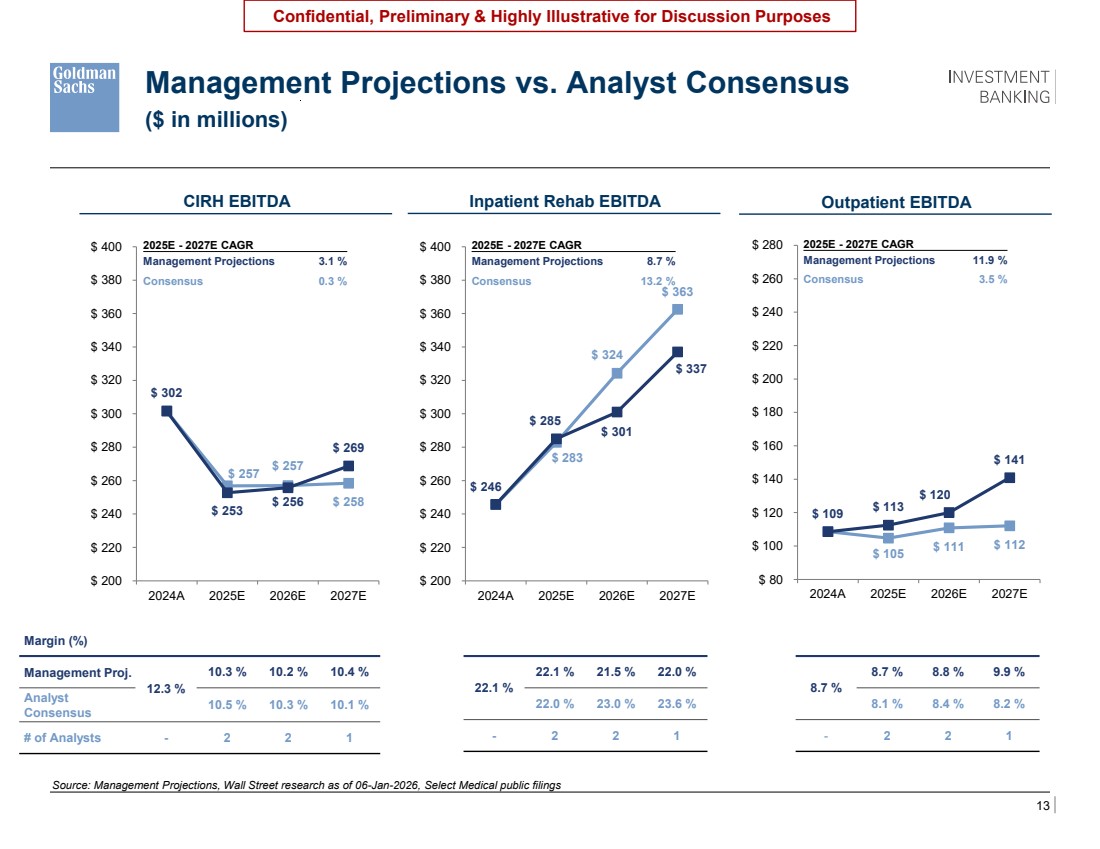
| 13 Confidential, Preliminary & Highly Illustrative for Discussion Purposes $ 257 $ 257 $ 258 $ 302 $ 253 $ 256 $ 269 $ 200 $ 220 $ 240 $ 260 $ 280 $ 300 $ 320 $ 340 $ 360 $ 380 $ 400 2024A 2025E 2026E 2027E $ 283 $ 324 $ 363 $ 246 $ 285 $ 301 $ 337 $ 200 $ 220 $ 240 $ 260 $ 280 $ 300 $ 320 $ 340 $ 360 $ 380 $ 400 2024A 2025E 2026E 2027E $ 105 $ 111 $ 112 $ 109 $ 113 $ 120 $ 141 $ 80 $ 100 $ 120 $ 140 $ 160 $ 180 $ 200 $ 220 $ 240 $ 260 $ 280 2024A 2025E 2026E 2027E Source: Management Projections, Wall Street research as of 06-Jan-2026, Select Medical public filings Margin (%) Management Proj. 12.3 % 10.3 % 10.2 % 10.4 % Analyst Consensus 10.5 % 10.3 % 10.1 % # of Analysts - 2 2 1 Management Projections vs. Analyst Consensus ($ in millions) Outpatient EBITDA 2025E - 2027E CAGR Management Projections 3.1 % Consensus 0.3 % \\firmwide.corp.gs.com\ibdroot\projects\IBD-NY\sapient2025\977110_1\Presentations\2. Fairness Opinion Presentation\Excel\Broker Perspectives and Projections\Broker Perspectives and Projections_v02.xlsx CIRH EBITDA Inpatient Rehab EBITDA 2025E - 2027E CAGR Management Projections 8.7 % Consensus 13.2 % 2025E - 2027E CAGR Management Projections 11.9 % Consensus 3.5 % 22.1 % 22.1 % 21.5 % 22.0 % 22.0 % 23.0 % 23.6 % - 2 2 1 8.7 % 8.7 % 8.8 % 9.9 % 8.1 % 8.4 % 8.2 % - 2 2 1 |
| 14 Confidential, Preliminary & Highly Illustrative for Discussion Purposes 3 Overview of Financial Analyses |
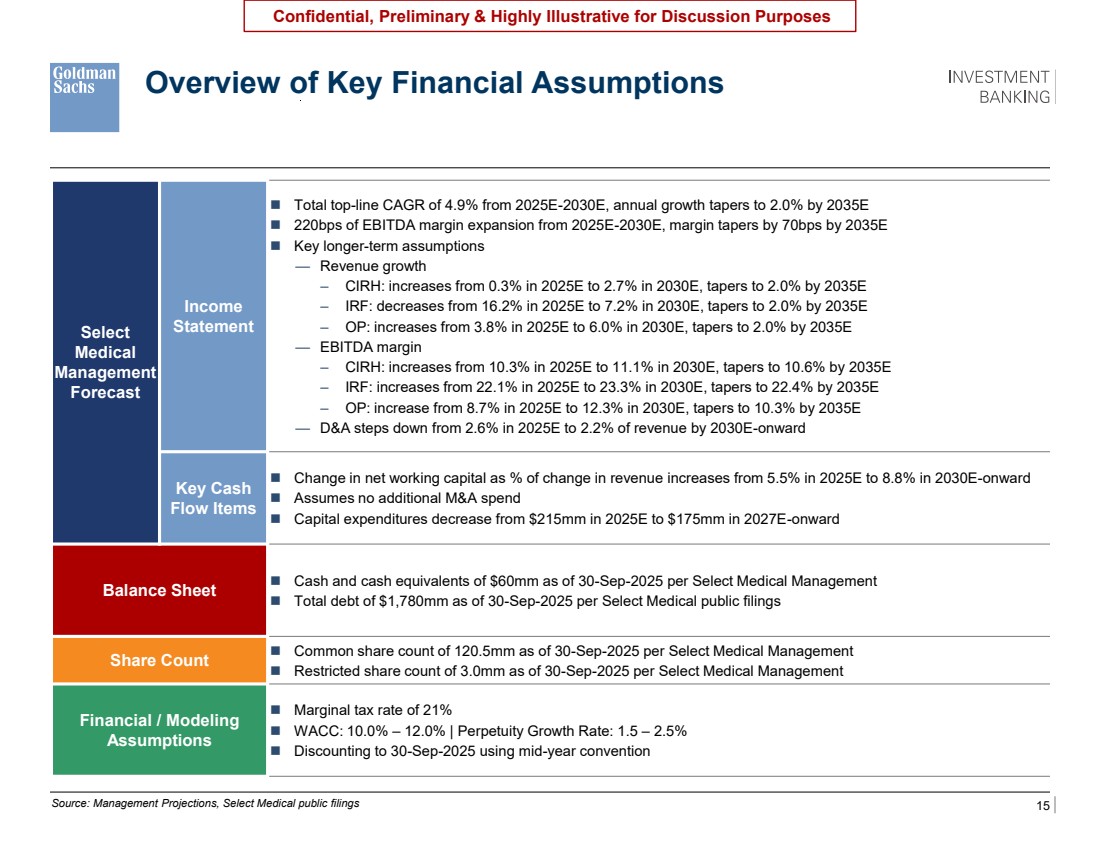
| 15 Confidential, Preliminary & Highly Illustrative for Discussion Purposes Source: Management Projections, Select Medical public filings Select Medical Management Forecast Income Statement ◼ Total top-line CAGR of 4.9% from 2025E-2030E, annual growth tapers to 2.0% by 2035E ◼ 220bps of EBITDA margin expansion from 2025E-2030E, margin tapers by 70bps by 2035E ◼ Key longer-term assumptions — Revenue growth – CIRH: increases from 0.3% in 2025E to 2.7% in 2030E, tapers to 2.0% by 2035E – IRF: decreases from 16.2% in 2025E to 7.2% in 2030E, tapers to 2.0% by 2035E – OP: increases from 3.8% in 2025E to 6.0% in 2030E, tapers to 2.0% by 2035E — EBITDA margin – CIRH: increases from 10.3% in 2025E to 11.1% in 2030E, tapers to 10.6% by 2035E – IRF: increases from 22.1% in 2025E to 23.3% in 2030E, tapers to 22.4% by 2035E – OP: increase from 8.7% in 2025E to 12.3% in 2030E, tapers to 10.3% by 2035E — D&A steps down from 2.6% in 2025E to 2.2% of revenue by 2030E-onward Key Cash Flow Items ◼ Change in net working capital as % of change in revenue increases from 5.5% in 2025E to 8.8% in 2030E-onward ◼ Assumes no additional M&A spend ◼ Capital expenditures decrease from $215mm in 2025E to $175mm in 2027E-onward Balance Sheet ◼ Cash and cash equivalents of $60mm as of 30-Sep-2025 per Select Medical Management ◼ Total debt of $1,780mm as of 30-Sep-2025 per Select Medical public filings Share Count ◼ Common share count of 120.5mm as of 30-Sep-2025 per Select Medical Management ◼ Restricted share count of 3.0mm as of 30-Sep-2025 per Select Medical Management Financial / Modeling Assumptions ◼ Marginal tax rate of 21% ◼ WACC: 10.0% – 12.0% | Perpetuity Growth Rate: 1.5 – 2.5% ◼ Discounting to 30-Sep-2025 using mid-year convention Overview of Key Financial Assumptions |
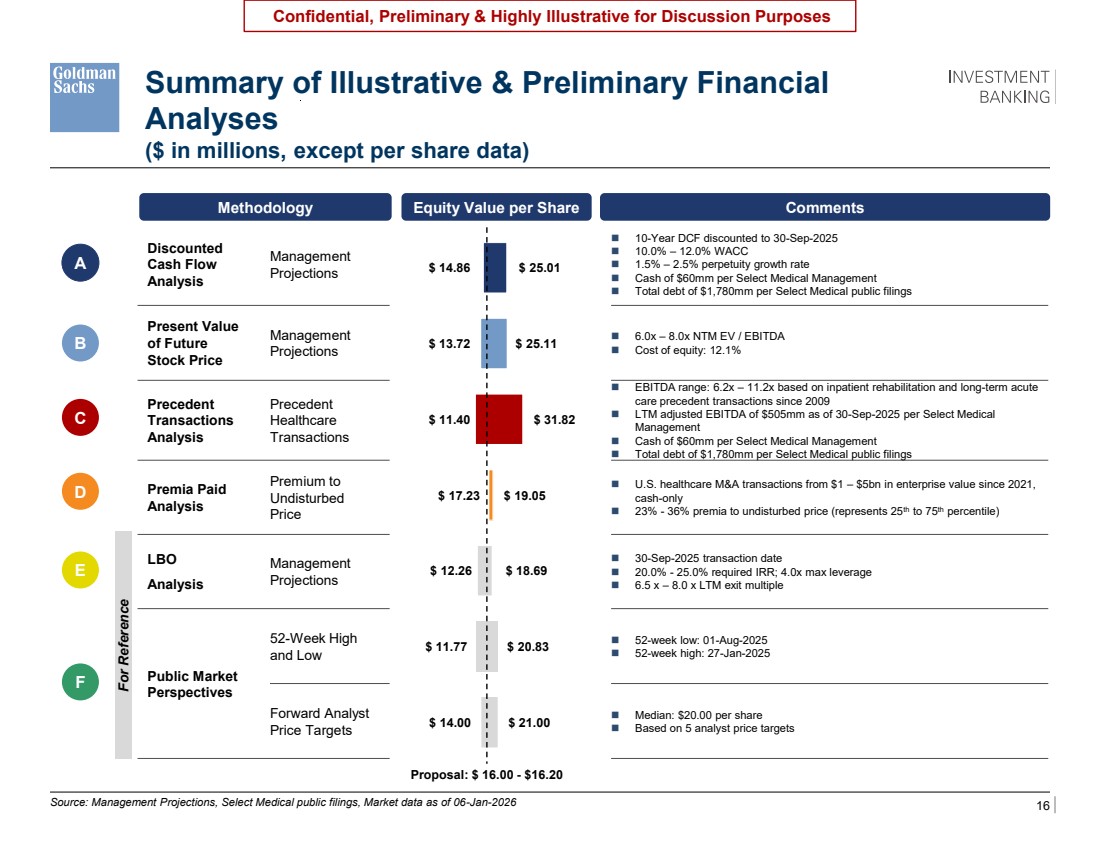
| 16 Confidential, Preliminary & Highly Illustrative for Discussion Purposes $ 14.86 $ 13.72 $ 11.40 $ 17.23 $ 12.26 $ 11.77 $ 14.00 $ 25.01 $ 25.11 $ 31.82 $ 19.05 $ 18.69 $ 20.83 $ 21.00 Summary of Illustrative & Preliminary Financial Analyses Discounted Cash Flow Analysis Management Projections ◼ 10-Year DCF discounted to 30-Sep-2025 ◼ 10.0% – 12.0% WACC ◼ 1.5% – 2.5% perpetuity growth rate ◼ Cash of $60mm per Select Medical Management ◼ Total debt of $1,780mm per Select Medical public filings Present Value of Future Stock Price Management Projections ◼ 6.0x – 8.0x NTM EV / EBITDA ◼ Cost of equity: 12.1% Precedent Transactions Analysis Precedent Healthcare Transactions ◼ EBITDA range: 6.2x – 11.2x based on inpatient rehabilitation and long-term acute care precedent transactions since 2009 ◼ LTM adjusted EBITDA of $505mm as of 30-Sep-2025 per Select Medical Management ◼ Cash of $60mm per Select Medical Management ◼ Total debt of $1,780mm per Select Medical public filings Premia Paid Analysis Premium to Undisturbed Price ◼ U.S. healthcare M&A transactions from $1 – $5bn in enterprise value since 2021, cash-only ◼ 23% - 36% premia to undisturbed price (represents 25th to 75th percentile) LBO Analysis Management Projections ◼ 30-Sep-2025 transaction date ◼ 20.0% - 25.0% required IRR; 4.0x max leverage ◼ 6.5 x – 8.0 x LTM exit multiple Public Market Perspectives 52-Week High and Low ◼ 52-week low: 01-Aug-2025 ◼ 52-week high: 27-Jan-2025 Forward Analyst Price Targets ◼ Median: $20.00 per share ◼ Based on 5 analyst price targets Methodology Equity Value per Share Comments Proposal: $ 16.00 - $16.20 A B D E Source: Management Projections, Select Medical public filings, Market data as of 06-Jan-2026 ($ in millions, except per share data) F C For Reference oPV of FSP should be 15.20 – 22.28 The orange bubble should be undisturbed price of $14.01on page 19 oAdd a bullet the forward PTs which says CY2026E Consensus Median EBITDA is [ ]% above current Management estimates oLBO: Run the exit multiples at 6.5x – 8.0x with 7.25x at the midpoint |
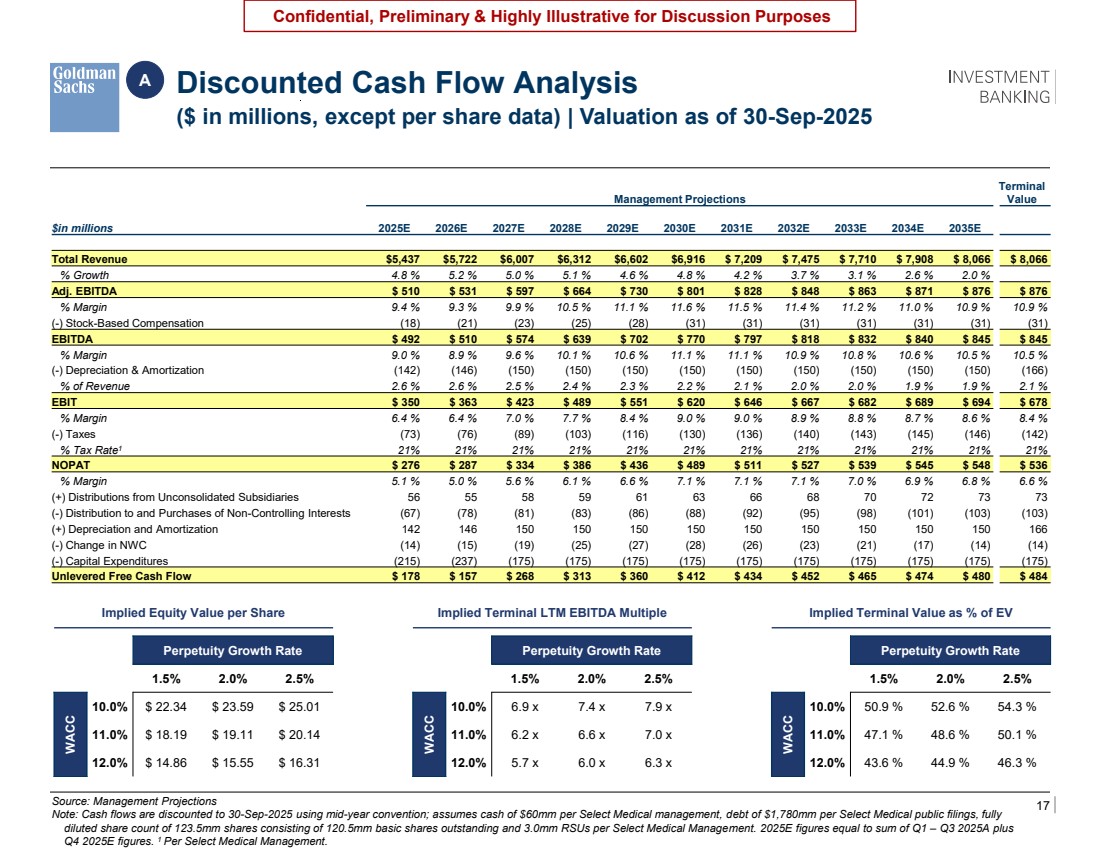
| 17 Confidential, Preliminary & Highly Illustrative for Discussion Purposes Source: Management Projections Note: Cash flows are discounted to 30-Sep-2025 using mid-year convention; assumes cash of $60mm per Select Medical management, debt of $1,780mm per Select Medical public filings, fully diluted share count of 123.5mm shares consisting of 120.5mm basic shares outstanding and 3.0mm RSUs per Select Medical Management. 2025E figures equal to sum of Q1 – Q3 2025A plus Q4 2025E figures. 1 Per Select Medical Management. Discounted Cash Flow Analysis ($ in millions, except per share data) | Valuation as of 30-Sep-2025 A Management Projections Terminal Value $in millions 2025E 2026E 2027E 2028E 2029E 2030E 2031E 2032E 2033E 2034E 2035E Total Revenue $5,437 $5,722 $6,007 $6,312 $6,602 $6,916 $ 7,209 $ 7,475 $ 7,710 $ 7,908 $ 8,066 $ 8,066 % Growth 4.8 % 5.2 % 5.0 % 5.1 % 4.6 % 4.8 % 4.2 % 3.7 % 3.1 % 2.6 % 2.0 % Adj. EBITDA $ 510 $ 531 $ 597 $ 664 $ 730 $ 801 $ 828 $ 848 $ 863 $ 871 $ 876 $ 876 % Margin 9.4 % 9.3 % 9.9 % 10.5 % 11.1 % 11.6 % 11.5 % 11.4 % 11.2 % 11.0 % 10.9 % 10.9 % (-) Stock-Based Compensation (18) (21) (23) (25) (28) (31) (31) (31) (31) (31) (31) (31) EBITDA $ 492 $ 510 $ 574 $ 639 $ 702 $ 770 $ 797 $ 818 $ 832 $ 840 $ 845 $ 845 % Margin 9.0 % 8.9 % 9.6 % 10.1 % 10.6 % 11.1 % 11.1 % 10.9 % 10.8 % 10.6 % 10.5 % 10.5 % (-) Depreciation & Amortization (142) (146) (150) (150) (150) (150) (150) (150) (150) (150) (150) (166) % of Revenue 2.6 % 2.6 % 2.5 % 2.4 % 2.3 % 2.2 % 2.1 % 2.0 % 2.0 % 1.9 % 1.9 % 2.1 % EBIT $ 350 $ 363 $ 423 $ 489 $ 551 $ 620 $ 646 $ 667 $ 682 $ 689 $ 694 $ 678 % Margin 6.4 % 6.4 % 7.0 % 7.7 % 8.4 % 9.0 % 9.0 % 8.9 % 8.8 % 8.7 % 8.6 % 8.4 % (-) Taxes (73) (76) (89) (103) (116) (130) (136) (140) (143) (145) (146) (142) % Tax Rate1 21% 21% 21% 21% 21% 21% 21% 21% 21% 21% 21% 21% NOPAT $ 276 $ 287 $ 334 $ 386 $ 436 $ 489 $ 511 $ 527 $ 539 $ 545 $ 548 $ 536 % Margin 5.1 % 5.0 % 5.6 % 6.1 % 6.6 % 7.1 % 7.1 % 7.1 % 7.0 % 6.9 % 6.8 % 6.6 % (+) Distributions from Unconsolidated Subsidiaries 56 55 58 59 61 63 66 68 70 72 73 73 (-) Distribution to and Purchases of Non-Controlling Interests (67) (78) (81) (83) (86) (88) (92) (95) (98) (101) (103) (103) (+) Depreciation and Amortization 142 146 150 150 150 150 150 150 150 150 150 166 (-) Change in NWC (14) (15) (19) (25) (27) (28) (26) (23) (21) (17) (14) (14) (-) Capital Expenditures (215) (237) (175) (175) (175) (175) (175) (175) (175) (175) (175) (175) Unlevered Free Cash Flow $ 178 $ 157 $ 268 $ 313 $ 360 $ 412 $ 434 $ 452 $ 465 $ 474 $ 480 $ 484 Implied Equity Value per Share Perpetuity Growth Rate 20.4 x 1.5% 2.0% 2.5% WACC 10.0% $ 22.34 $ 23.59 $ 25.01 11.0% $ 18.19 $ 19.11 $ 20.14 12.0% $ 14.86 $ 15.55 $ 16.31 Implied Terminal LTM EBITDA Multiple Perpetuity Growth Rate 6.6 x 1.5% 2.0% 2.5% WACC 10.0% 6.9 x 7.4 x 7.9 x 11.0% 6.2 x 6.6 x 7.0 x 12.0% 5.7 x 6.0 x 6.3 x Implied Terminal Value as % of EV Perpetuity Growth Rate 0.7 % 1.5% 2.0% 2.5% WACC 10.0% 50.9 % 52.6 % 54.3 % 11.0% 47.1 % 48.6 % 50.1 % 12.0% 43.6 % 44.9 % 46.3 % |
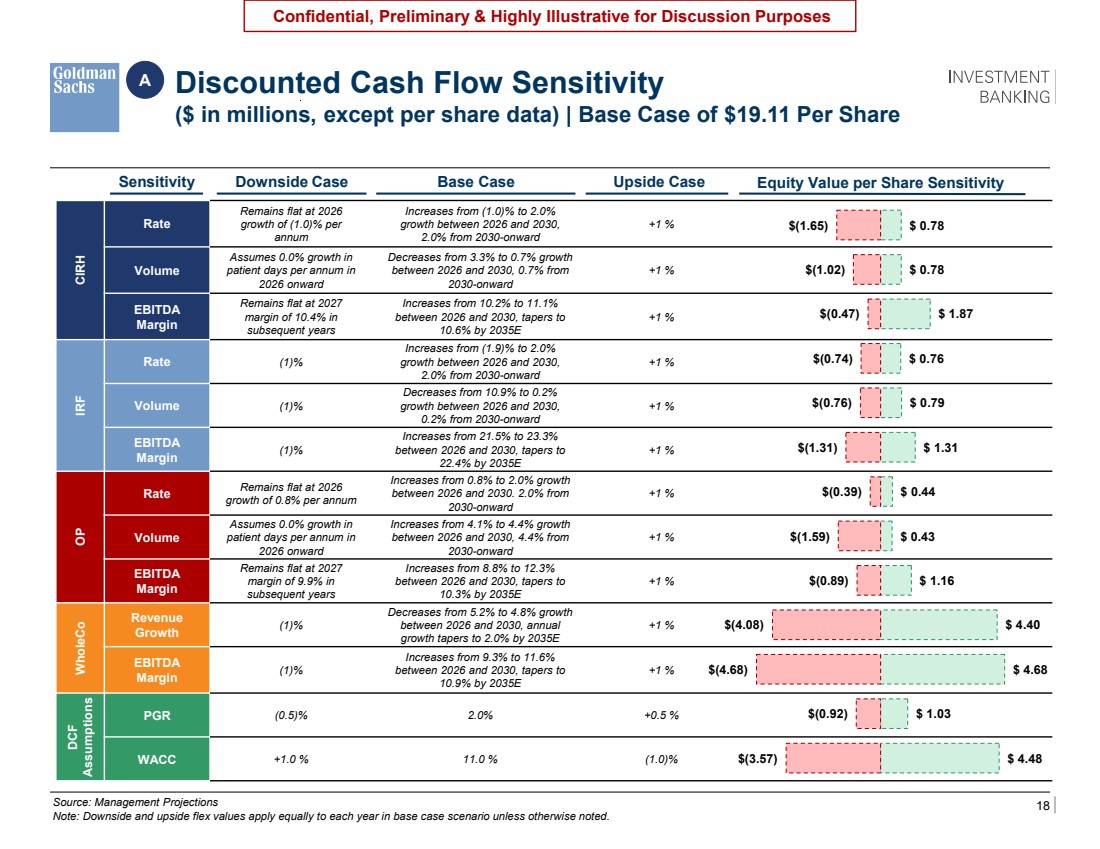
| 18 Confidential, Preliminary & Highly Illustrative for Discussion Purposes CIRH Rate Remains flat at 2026 growth of (1.0)% per annum Increases from (1.0)% to 2.0% growth between 2026 and 2030, 2.0% from 2030-onward +1 % Volume Assumes 0.0% growth in patient days per annum in 2026 onward Decreases from 3.3% to 0.7% growth between 2026 and 2030, 0.7% from 2030-onward +1 % EBITDA Margin Remains flat at 2027 margin of 10.4% in subsequent years Increases from 10.2% to 11.1% between 2026 and 2030, tapers to 10.6% by 2035E +1 % IRF Rate (1)% Increases from (1.9)% to 2.0% growth between 2026 and 2030, 2.0% from 2030-onward +1 % Volume (1)% Decreases from 10.9% to 0.2% growth between 2026 and 2030, 0.2% from 2030-onward +1 % EBITDA Margin (1)% Increases from 21.5% to 23.3% between 2026 and 2030, tapers to 22.4% by 2035E +1 % OP Rate Remains flat at 2026 growth of 0.8% per annum Increases from 0.8% to 2.0% growth between 2026 and 2030. 2.0% from 2030-onward +1 % Volume Assumes 0.0% growth in patient days per annum in 2026 onward Increases from 4.1% to 4.4% growth between 2026 and 2030, 4.4% from 2030-onward +1 % EBITDA Margin Remains flat at 2027 margin of 9.9% in subsequent years Increases from 8.8% to 12.3% between 2026 and 2030, tapers to 10.3% by 2035E +1 % WholeCo Revenue Growth (1)% Decreases from 5.2% to 4.8% growth between 2026 and 2030, annual growth tapers to 2.0% by 2035E +1 % EBITDA Margin (1)% Increases from 9.3% to 11.6% between 2026 and 2030, tapers to 10.9% by 2035E +1 % DCF Assumptions PGR (0.5)% 2.0% +0.5 % WACC +1.0 % 11.0 % (1.0)% Source: Management Projections Note: Downside and upside flex values apply equally to each year in base case scenario unless otherwise noted. Sensitivity Upside Case Equity Value per Share Sensitivity Discounted Cash Flow Sensitivity ($ in millions, except per share data) | Base Case of $19.11 Per Share A Downside Case Base Case $(1.65) $(1.02) $(0.47) $(0.74) $(0.76) $(1.31) $(0.39) $(1.59) $(0.89) $(4.08) $(4.68) $(0.92) $(3.57) $ 0.78 $ 0.78 $ 1.87 $ 0.76 $ 0.79 $ 1.31 $ 0.44 $ 0.43 $ 1.16 $ 4.40 $ 4.68 $ 1.03 $ 4.48 |
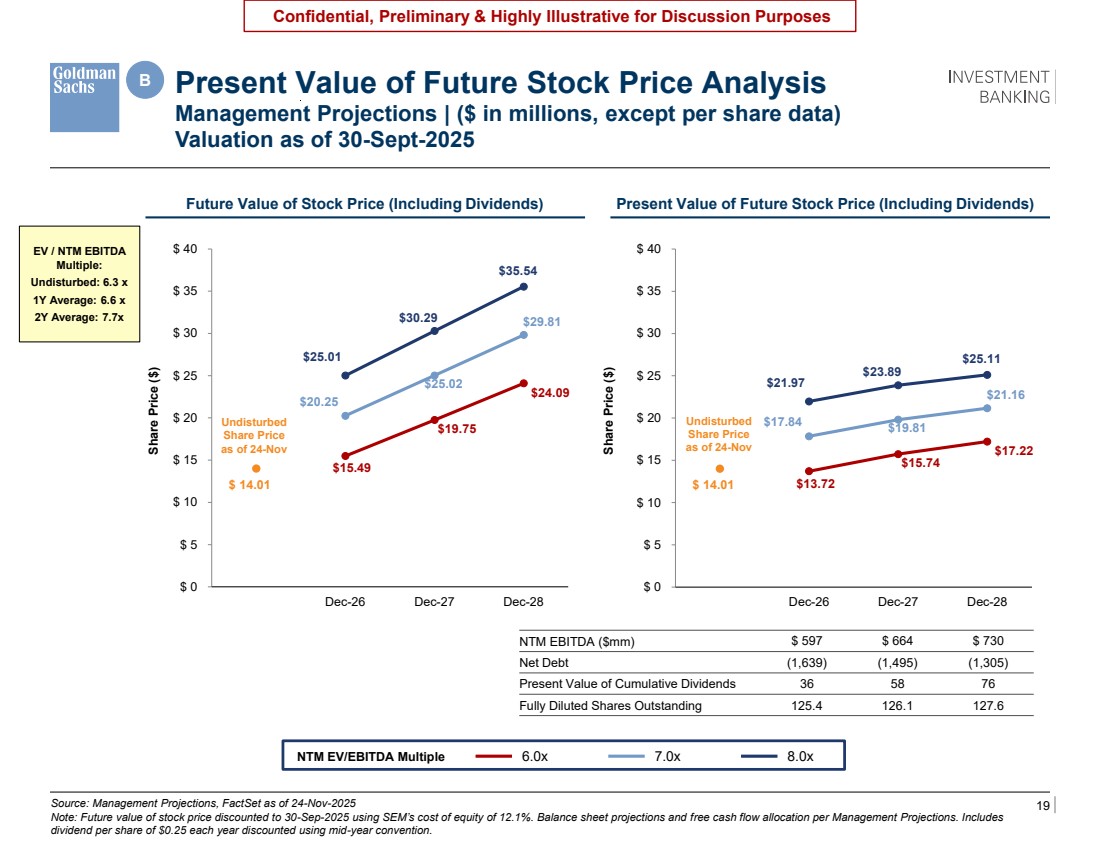
| 19 Confidential, Preliminary & Highly Illustrative for Discussion Purposes Source: Management Projections, FactSet as of 24-Nov-2025 Note: Future value of stock price discounted to 30-Sep-2025 using SEM’s cost of equity of 12.1%. Balance sheet projections and free cash flow allocation per Management Projections. Includes dividend per share of $0.25 each year discounted using mid-year convention. B Present Value of Future Stock Price Analysis Management Projections | ($ in millions, except per share data) Valuation as of 30-Sept-2025 o Run the 3 year average excluding Concentra (like from the earlier page and footnote this carefully – I think this will enable us to support 6.5x – 7.5x o The current multiple here should be re-labeled as “Undisturbed” and be as of November 24, 2025 which we say is 6.1x page 4. Would also flag we say undisturbed 2026E is 6.3x on page 20 based on consensus which I can’t quite tie to the 6.1x on page 4 $21.97 $23.89 $25.11 $17.84 $19.81 $21.16 $13.72 $15.74 $17.22 $ 14.01 $ 0 $ 5 $ 10 $ 15 $ 20 $ 25 $ 30 $ 35 $ 40 Sep-25 Dec-26 Dec-27 Dec-28 $25.01 $30.29 $35.54 $20.25 $25.02 $29.81 $15.49 $19.75 $24.09 $ 14.01 $ 0 $ 5 $ 10 $ 15 $ 20 $ 25 $ 30 $ 35 $ 40 Sep-25 Dec-26 Dec-27 Dec-28 NTM EBITDA ($mm) $ 597 $ 664 $ 730 Net Debt (1,639) (1,495) (1,305) Present Value of Cumulative Dividends 36 58 76 Fully Diluted Shares Outstanding 125.4 126.1 127.6 Future Value of Stock Price (Including Dividends) Present Value of Future Stock Price (Including Dividends) Share Price ($) Share Price ($) NTM EV/EBITDA Multiple 6.0x 7.0x 8.0x Undisturbed Share Price as of 24-Nov EV / NTM EBITDA Multiple: Undisturbed: 6.3 x 1Y Average: 6.6 x 2Y Average: 7.7x Undisturbed Share Price as of 24-Nov |
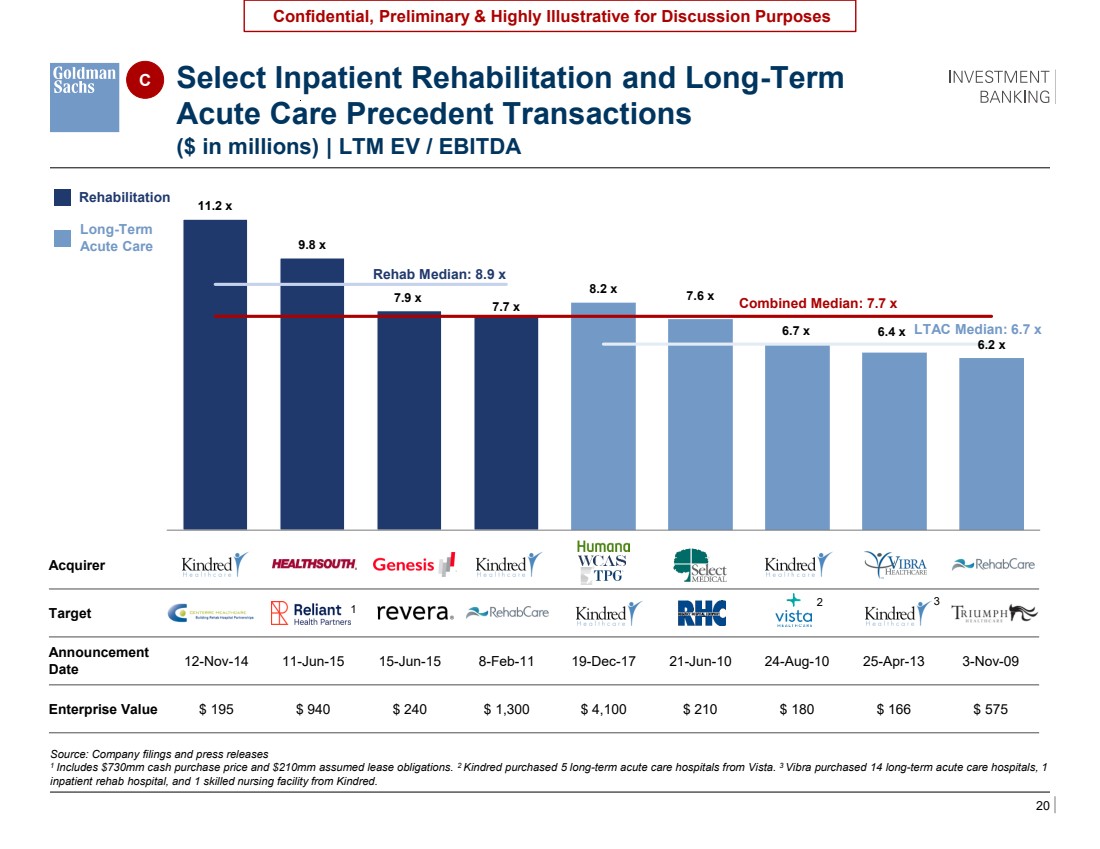
| 20 Confidential, Preliminary & Highly Illustrative for Discussion Purposes 11.2 x 9.8 x 7.9 x 7.7 x 8.2 x 7.6 x 6.7 x 6.4 x 6.2 x Kindred Healthcare / Centerre Healthcare Corporation HealthSouth Corporation / Reliant Hospital Partners Genesis Healthcare / Revera Kindred Healthcare / RehabCare Group Kindred Healthcare WholeCo Acquisition Select Medical Holdings Corporation / Regency Hospital Company, L.L.C. Kindred Healthcare, Inc. / Certain facilities owned by Vista Healthcare Holdings, LLC Vibra Healthcare, LLC / Certain facilities owned by Kindred Healthcare, Inc. RehabCare Group, Inc. / Triumph HealthCare Holdings, Inc. ($ in millions) | LTM EV / EBITDA Source: Company filings and press releases 1 Includes $730mm cash purchase price and $210mm assumed lease obligations. 2 Kindred purchased 5 long-term acute care hospitals from Vista. 3 Vibra purchased 14 long-term acute care hospitals, 1 inpatient rehab hospital, and 1 skilled nursing facility from Kindred. Acquirer Target Announcement Date 12-Nov-14 11-Jun-15 15-Jun-15 8-Feb-11 19-Dec-17 21-Jun-10 24-Aug-10 25-Apr-13 3-Nov-09 Enterprise Value $ 195 $ 940 $ 240 $ 1,300 $ 4,100 $ 210 $ 180 $ 166 $ 575 Rehab Median: 8.9 x Select Inpatient Rehabilitation and Long-Term Acute Care Precedent Transactions 1 2 3 LTAC Median: 6.7 x Combined Median: 7.7 x Rehabilitation Long-Term Acute Care C TBU – adding Scion Health, scrubbing incremental Deal Logic run for additional names |
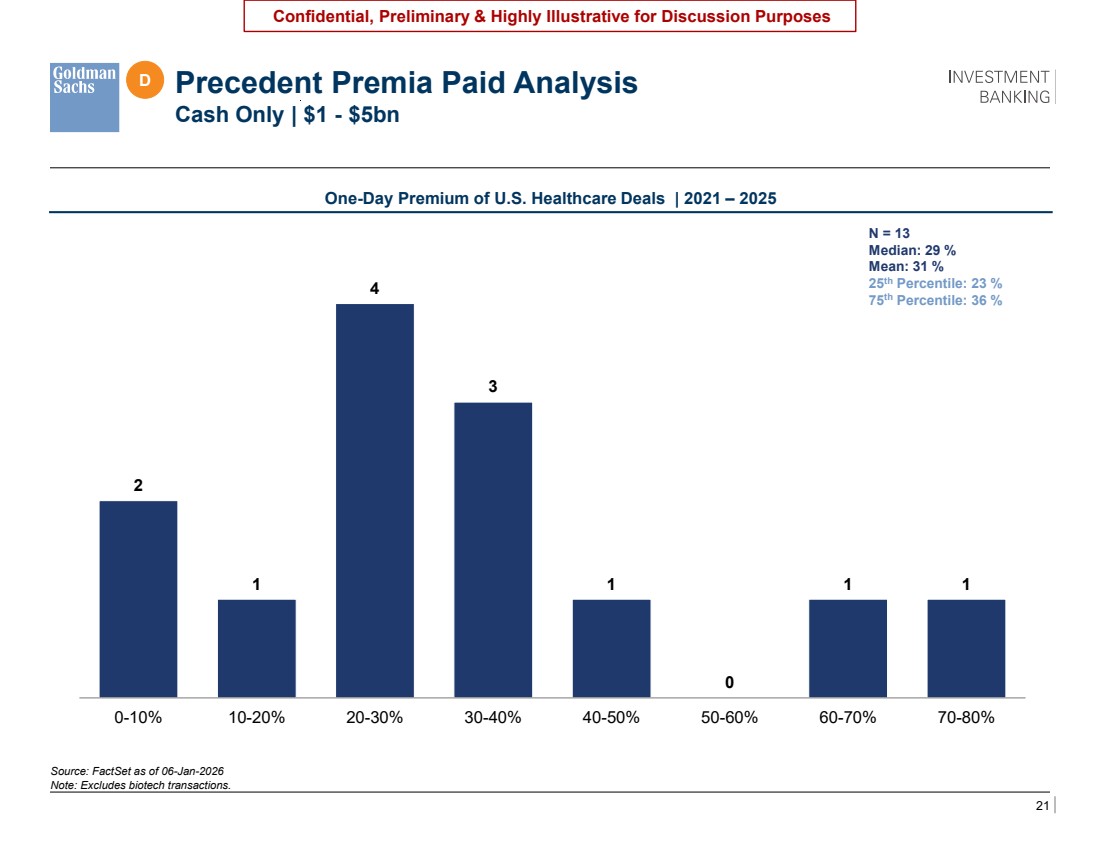
| 21 Confidential, Preliminary & Highly Illustrative for Discussion Purposes One-Day Premium of U.S. Healthcare Deals | 2021 – 2025 Source: FactSet as of 06-Jan-2026 Note: Excludes biotech transactions. N = 13 Median: 29 % Mean: 31 % 25th Percentile: 23 % 75th Percentile: 36 % D Precedent Premia Paid Analysis Cash Only | $1 - $5bn TBU – Price update, show format with lines across page showing 25th/75th percentile lines across page TBU – ISG pulling updated deal run 2 1 4 3 1 0 1 1 0-10% 10-20% 20-30% 30-40% 40-50% 50-60% 60-70% 70-80% |
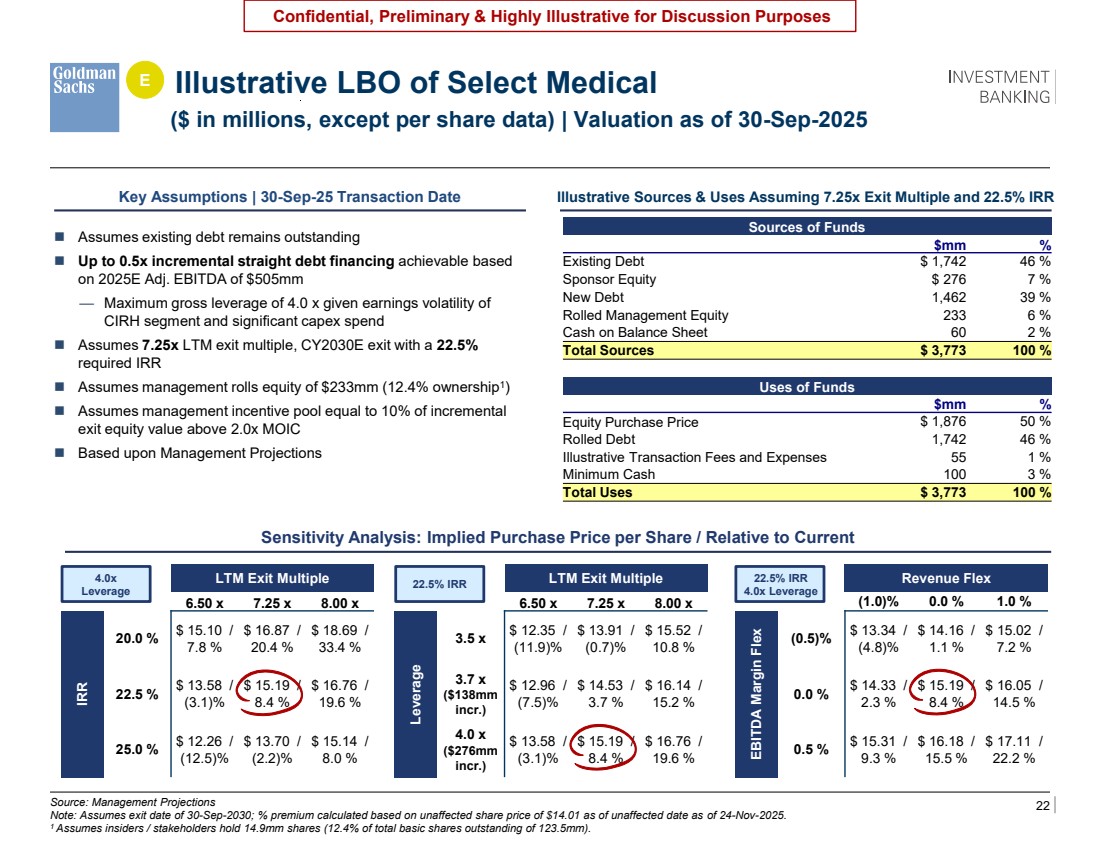
| 22 Confidential, Preliminary & Highly Illustrative for Discussion Purposes Illustrative LBO of Select Medical ($ in millions, except per share data) | Valuation as of 30-Sep-2025 E Source: Management Projections Note: Assumes exit date of 30-Sep-2030; % premium calculated based on unaffected share price of $14.01 as of unaffected date as of 24-Nov-2025. 1 Assumes insiders / stakeholders hold 14.9mm shares (12.4% of total basic shares outstanding of 123.5mm). o Confirm that this includes a separate management incentive pool that pays 10% of everything above 2.0x MOIC LTM Exit Multiple $ 18.15 6.50 x 7.25 x 8.00 x Leverage 3.5 x $ 12.35 / (11.9)% $ 13.91 / (0.7)% $ 15.52 / 10.8 % 3.7 x ($138mm incr.) $ 12.96 / (7.5)% $ 14.53 / 3.7 % $ 16.14 / 15.2 % 4.0 x ($276mm incr.) $ 13.58 / (3.1)% $ 15.19 / 8.4 % $ 16.76 / 19.6 % Revenue Flex 18.2 x (1.0)% 0.0 % 1.0 % EBITDA Margin Flex (0.5)% $ 13.34 / (4.8)% $ 14.16 / 1.1 % $ 15.02 / 7.2 % 0.0 % $ 14.33 / 2.3 % $ 15.19 / 8.4 % $ 16.05 / 14.5 % 0.5 % $ 15.31 / 9.3 % $ 16.18 / 15.5 % $ 17.11 / 22.2 % LTM Exit Multiple $ 18.15 6.50 x 7.25 x 8.00 x IRR 20.0 % $ 15.10 / 7.8 % $ 16.87 / 20.4 % $ 18.69 / 33.4 % 22.5 % $ 13.58 / (3.1)% $ 15.19 / 8.4 % $ 16.76 / 19.6 % 25.0 % $ 12.26 / (12.5)% $ 13.70 / (2.2)% $ 15.14 / 8.0 % Key Assumptions | 30-Sep-25 Transaction Date Illustrative Sources & Uses Assuming 7.25x Exit Multiple and 22.5% IRR ◼ Assumes existing debt remains outstanding ◼ Up to 0.5x incremental straight debt financing achievable based on 2025E Adj. EBITDA of $505mm — Maximum gross leverage of 4.0 x given earnings volatility of CIRH segment and significant capex spend ◼ Assumes 7.25x LTM exit multiple, CY2030E exit with a 22.5% required IRR ◼ Assumes management rolls equity of $233mm (12.4% ownership1 ) ◼ Assumes management incentive pool equal to 10% of incremental exit equity value above 2.0x MOIC ◼ Based upon Management Projections Sensitivity Analysis: Implied Purchase Price per Share / Relative to Current 4.0x Leverage 22.5% IRR 22.5% IRR 4.0x Leverage Sources of Funds $mm % Existing Debt $ 1,742 46 % Sponsor Equity $ 276 7 % New Debt 1,462 39 % Rolled Management Equity 233 6 % Cash on Balance Sheet 60 2 % Total Sources $ 3,773 100 % Uses of Funds $mm % Equity Purchase Price $ 1,876 50 % Rolled Debt 1,742 46 % Illustrative Transaction Fees and Expenses 55 1 % Minimum Cash 100 3 % Total Uses $ 3,773 100 % |
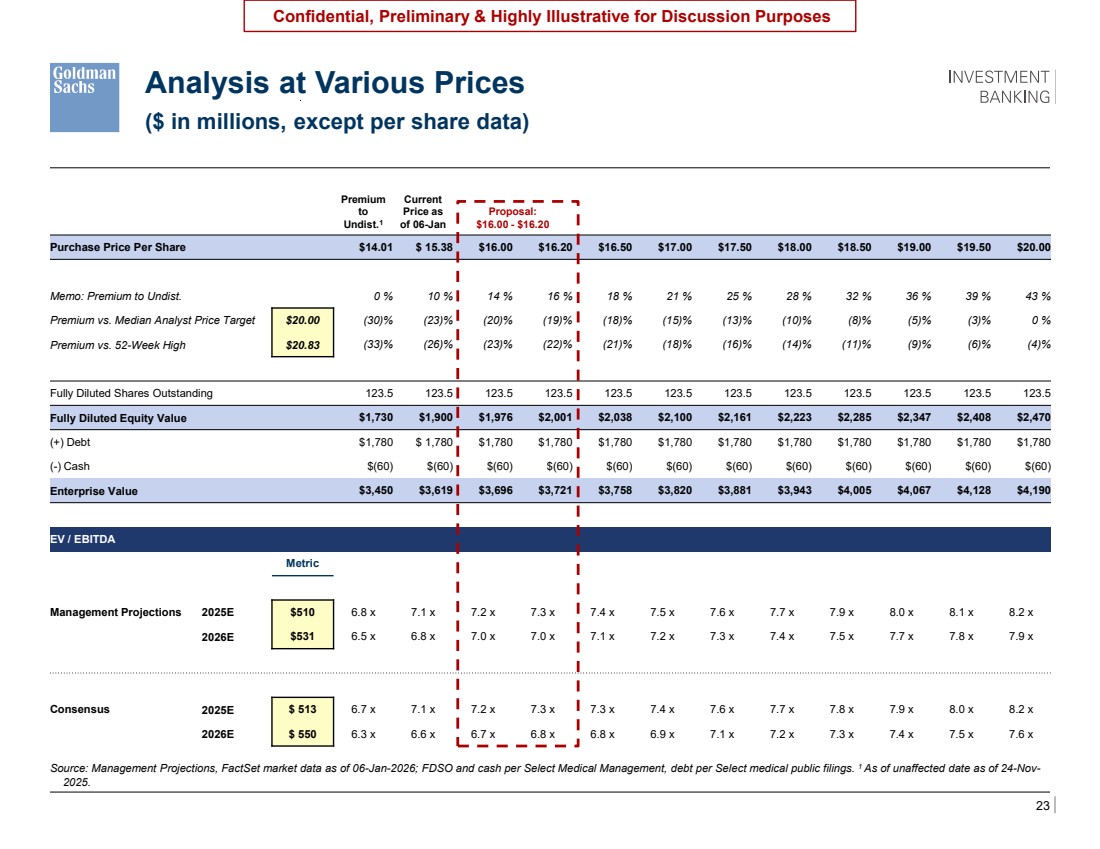
| 23 Confidential, Preliminary & Highly Illustrative for Discussion Purposes Source: Management Projections, FactSet market data as of 06-Jan-2026; FDSO and cash per Select Medical Management, debt per Select medical public filings. 1 As of unaffected date as of 24-Nov-2025. Analysis at Various Prices ($ in millions, except per share data) Premium to Undist.1 Current Price as of 06-Jan Proposal: $16.00 - $16.20 Purchase Price Per Share $14.01 $ 15.38 $16.00 $16.20 $16.50 $17.00 $17.50 $18.00 $18.50 $19.00 $19.50 $20.00 Memo: Premium to Undist. 0 % 10 % 14 % 16 % 18 % 21 % 25 % 28 % 32 % 36 % 39 % 43 % Premium vs. Median Analyst Price Target $20.00 (30)% (23)% (20)% (19)% (18)% (15)% (13)% (10)% (8)% (5)% (3)% 0 % Premium vs. 52-Week High $20.83 (33)% (26)% (23)% (22)% (21)% (18)% (16)% (14)% (11)% (9)% (6)% (4)% Fully Diluted Shares Outstanding 123.5 123.5 123.5 123.5 123.5 123.5 123.5 123.5 123.5 123.5 123.5 123.5 Fully Diluted Equity Value $1,730 $1,900 $1,976 $2,001 $2,038 $2,100 $2,161 $2,223 $2,285 $2,347 $2,408 $2,470 (+) Debt $1,780 $ 1,780 $1,780 $1,780 $1,780 $1,780 $1,780 $1,780 $1,780 $1,780 $1,780 $1,780 (-) Cash $(60) $(60) $(60) $(60) $(60) $(60) $(60) $(60) $(60) $(60) $(60) $(60) Enterprise Value $3,450 $3,619 $3,696 $3,721 $3,758 $3,820 $3,881 $3,943 $4,005 $4,067 $4,128 $4,190 EV / EBITDA Metric Management Projections 2025E $510 6.8 x 7.1 x 7.2 x 7.3 x 7.4 x 7.5 x 7.6 x 7.7 x 7.9 x 8.0 x 8.1 x 8.2 x 2026E $531 6.5 x 6.8 x 7.0 x 7.0 x 7.1 x 7.2 x 7.3 x 7.4 x 7.5 x 7.7 x 7.8 x 7.9 x Consensus 2025E $ 513 6.7 x 7.1 x 7.2 x 7.3 x 7.3 x 7.4 x 7.6 x 7.7 x 7.8 x 7.9 x 8.0 x 8.2 x 2026E $ 550 6.3 x 6.6 x 6.7 x 6.8 x 6.8 x 6.9 x 7.1 x 7.2 x 7.3 x 7.4 x 7.5 x 7.6 x |
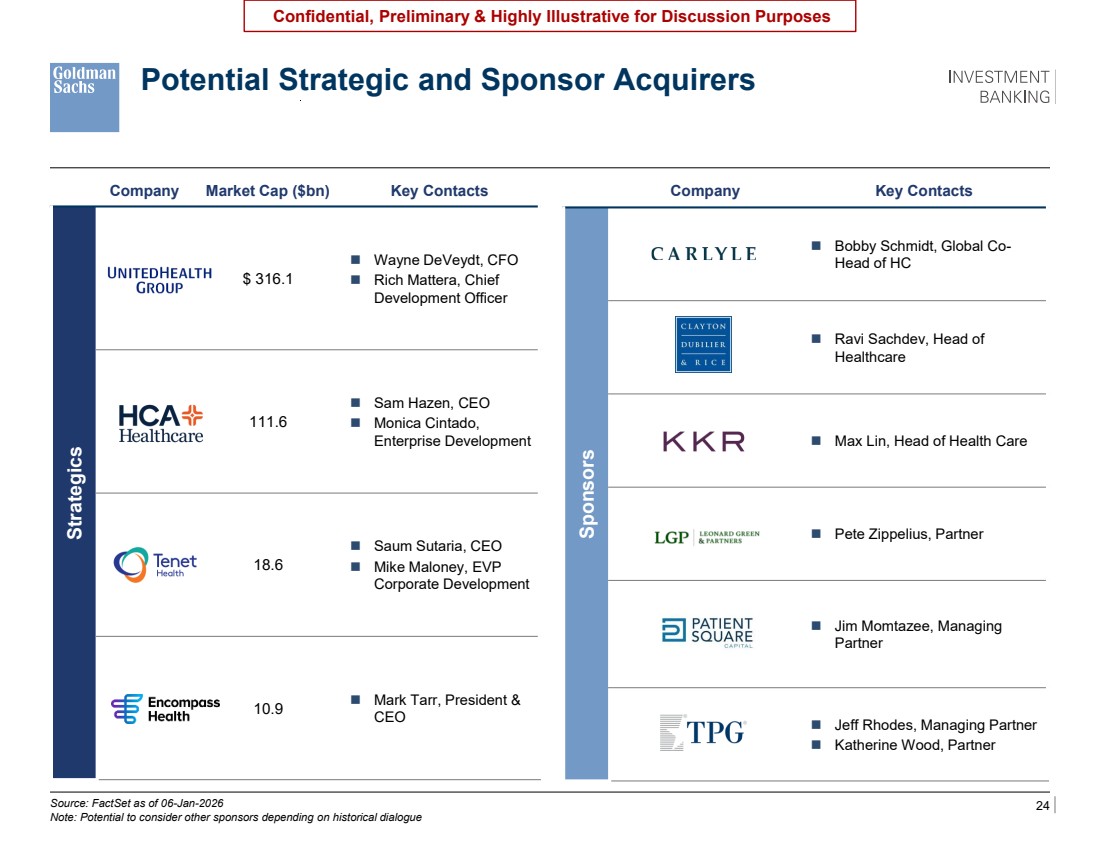
| 24 Confidential, Preliminary & Highly Illustrative for Discussion Purposes Potential Strategic and Sponsor Acquirers Organize strategics by market cap and sponsors in alpha order Potential to consider other sponsors depending on historical dialogue Source: FactSet as of 06-Jan-2026 Note: Potential to consider other sponsors depending on historical dialogue \\firmwide.corp.gs.com\ibdroot\projects\IBD-NY\sapient2025\977110_1\Presentations\2. Fairness Opinion Presentation\Excel\CSC\Copy of Select Medical CSC 1.6.2026 v2.xlsx Company Key Contacts Sponsors Carlyle ◼ Bobby Schmidt, Global Co-Head of HC CD&R ◼ Ravi Sachdev, Head of Healthcare LGP ◼ Max Lin, Head of Health Care Patient Square ◼ Pete Zippelius, Partner Towerbookook ◼ Jim Momtazee, Managing Partner TPG ◼ Jeff Rhodes, Managing Partner ◼ Katherine Wood, Partner Company Market Cap ($bn) Key Contacts Strategics UNH $ 316.1 ◼ Wayne DeVeydt, CFO ◼ Rich Mattera, Chief Development Officer HCA 111.6 ◼ Sam Hazen, CEO ◼ Monica Cintado, Enterprise Development THC 18.6 ◼ Saum Sutaria, CEO ◼ Mike Maloney, EVP Corporate Development Encompass 10.9 ◼ Mark Tarr, President & CEO |
| 25 Confidential, Preliminary & Highly Illustrative for Discussion Purposes 4 Overview of Potential Strategic Alternatives |
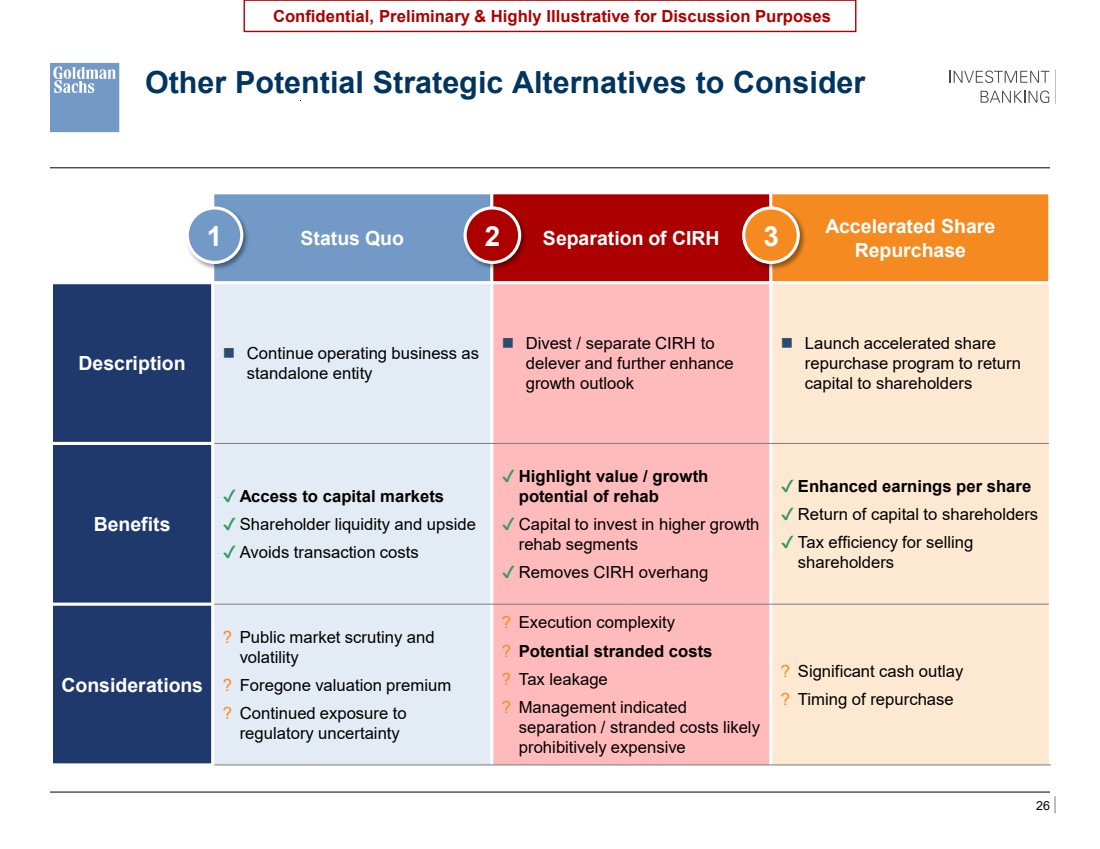
| 26 Confidential, Preliminary & Highly Illustrative for Discussion Purposes Other Potential Strategic Alternatives to Consider Status Quo Separation of CIRH Accelerated Share Repurchase Description ◼ Continue operating business as standalone entity ◼ Divest / separate CIRH to delever and further enhance growth outlook ◼ Launch accelerated share repurchase program to return capital to shareholders Benefits ✔ Access to capital markets ✔ Shareholder liquidity and upside ✔ Avoids transaction costs ✔ Highlight value / growth potential of rehab ✔ Capital to invest in higher growth rehab segments ✔ Removes CIRH overhang ✔ Enhanced earnings per share ✔ Return of capital to shareholders ✔ Tax efficiency for selling shareholders Considerations ? Public market scrutiny and volatility ? Foregone valuation premium ? Continued exposure to regulatory uncertainty ? Execution complexity ? Potential stranded costs ? Tax leakage ? Management indicated separation / stranded costs likely prohibitively expensive ? Significant cash outlay ? Timing of repurchase 1 2 3 |
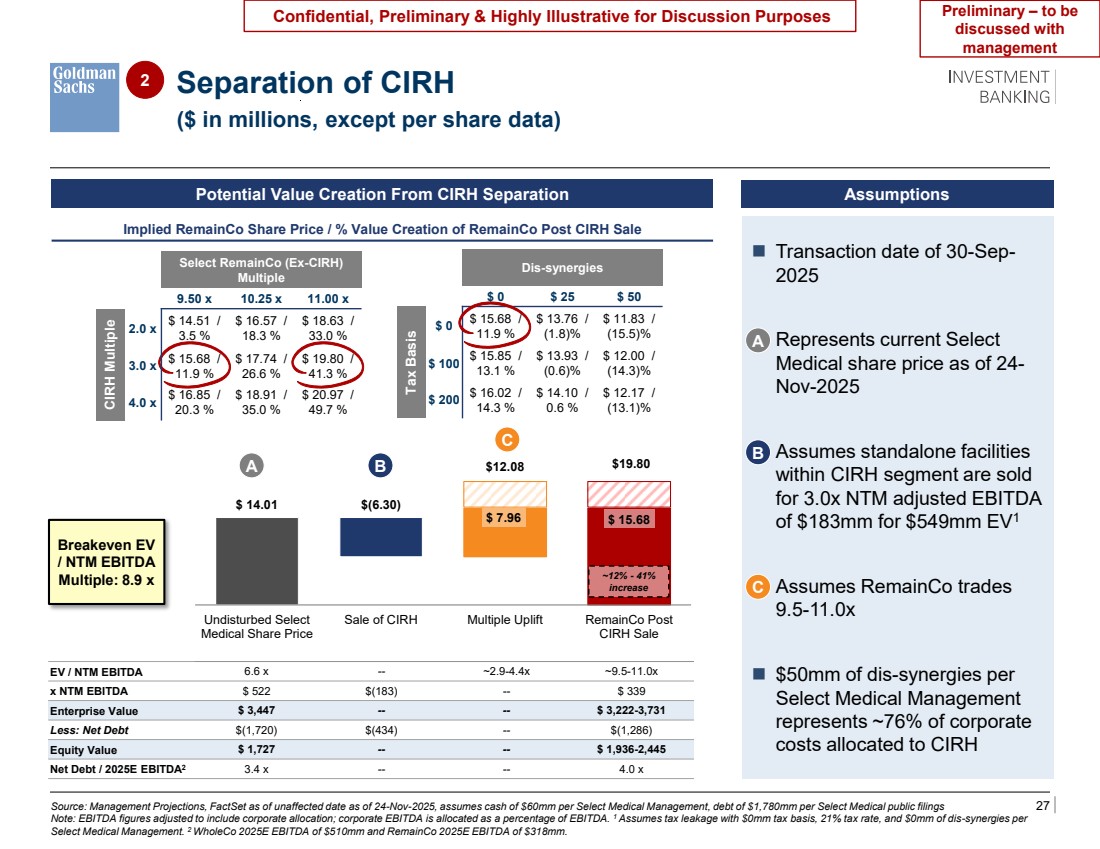
| 27 Confidential, Preliminary & Highly Illustrative for Discussion Purposes $12.08 $19.80 $ 14.01 $(6.30) $ 7.96 $ 15.68 Undisturbed Select Medical Share Price Sale of CIRH Multiple Uplift RemainCo Post CIRH Sale ~12% - 41% increase Potential Value Creation From CIRH Separation Assumptions ◼ Transaction date of 30-Sep-2025 ◼ Represents current Select Medical share price as of 24- Nov-2025 ◼ Assumes standalone facilities within CIRH segment are sold for 3.0x NTM adjusted EBITDA of $183mm for $549mm EV1 ◼ Assumes RemainCo trades 9.5-11.0x ◼ $50mm of dis-synergies per Select Medical Management represents ~76% of corporate costs allocated to CIRH EV / NTM EBITDA 6.6 x -- ~2.9-4.4x ~9.5-11.0x x NTM EBITDA $ 522 $(183) -- $ 339 Enterprise Value $ 3,447 -- -- $ 3,222-3,731 Less: Net Debt $(1,720) $(434) -- $(1,286) Equity Value $ 1,727 -- -- $ 1,936-2,445 Net Debt / 2025E EBITDA2 3.4 x -- -- 4.0 x Source: Management Projections, FactSet as of unaffected date as of 24-Nov-2025, assumes cash of $60mm per Select Medical Management, debt of $1,780mm per Select Medical public filings Note: EBITDA figures adjusted to include corporate allocation; corporate EBITDA is allocated as a percentage of EBITDA. 1 Assumes tax leakage with $0mm tax basis, 21% tax rate, and $0mm of dis-synergies per Select Medical Management. 2 WholeCo 2025E EBITDA of $510mm and RemainCo 2025E EBITDA of $318mm. B B A C C A ($ in millions, except per share data) 2 Separation of CIRH Implied RemainCo Share Price / % Value Creation of RemainCo Post CIRH Sale Select RemainCo (Ex-CIRH) Multiple 9.50 x 10.25 x 11.00 x CIRH Multiple 2.0 x $ 14.51 / 3.5 % $ 16.57 / 18.3 % $ 18.63 / 33.0 % 3.0 x $ 15.68 / 11.9 % $ 17.74 / 26.6 % $ 19.80 / 41.3 % 4.0 x $ 16.85 / 20.3 % $ 18.91 / 35.0 % $ 20.97 / 49.7 % Dis-synergies $ 0 $ 25 $ 50 Tax Basis $ 0 $ 15.68 / 11.9 % $ 13.76 / (1.8)% $ 11.83 / (15.5)% $ 100 $ 15.85 / 13.1 % $ 13.93 / (0.6)% $ 12.00 / (14.3)% $ 200 $ 16.02 / 14.3 % $ 14.10 / 0.6 % $ 12.17 / (13.1)% Breakeven EV / NTM EBITDA Multiple: 8.9 x Preliminary – to be discussed with management |
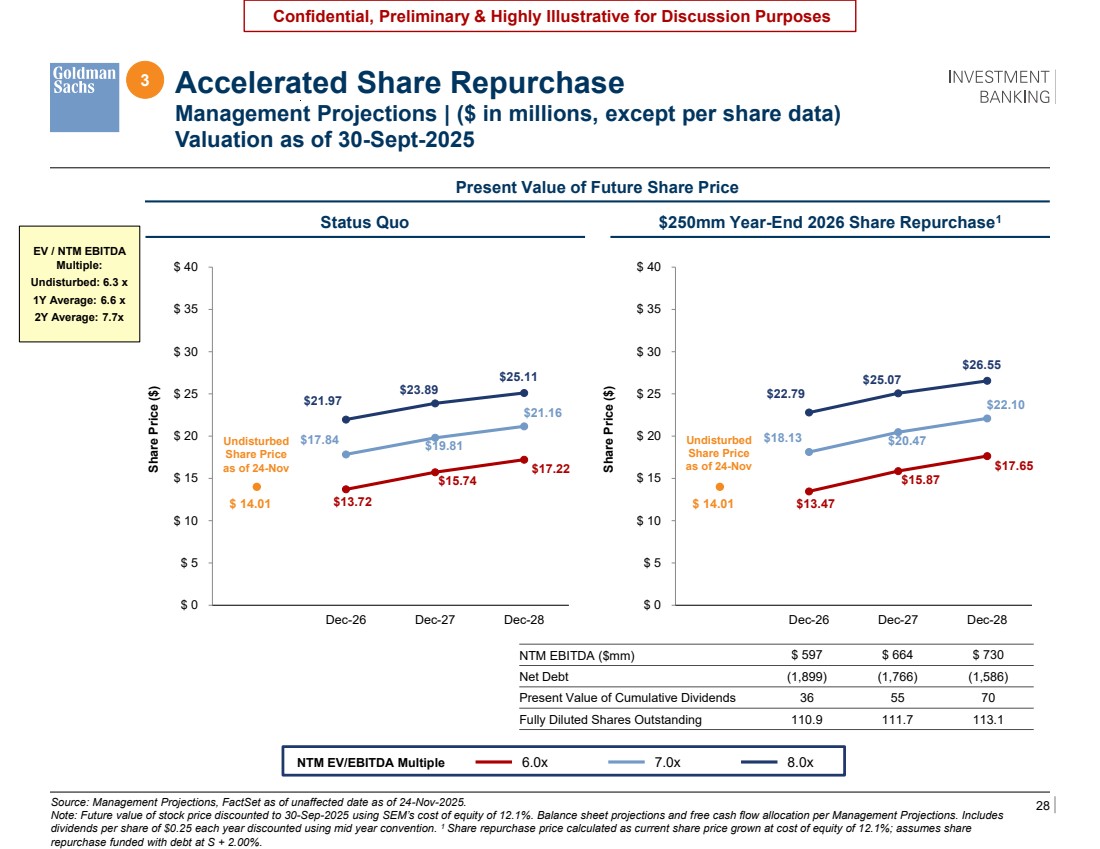
| 28 Confidential, Preliminary & Highly Illustrative for Discussion Purposes Source: Management Projections, FactSet as of unaffected date as of 24-Nov-2025. Note: Future value of stock price discounted to 30-Sep-2025 using SEM’s cost of equity of 12.1%. Balance sheet projections and free cash flow allocation per Management Projections. Includes dividends per share of $0.25 each year discounted using mid year convention. 1 Share repurchase price calculated as current share price grown at cost of equity of 12.1%; assumes share repurchase funded with debt at S + 2.00%. 3 Accelerated Share Repurchase Management Projections | ($ in millions, except per share data) Valuation as of 30-Sept-2025 TBU Model what a $250mm ASR could do to their PV of FSP by 2026 YE and show the impact to leverage which will likely be prohibitively high $22.79 $25.07 $26.55 $18.13 $20.47 $22.10 $13.47 $15.87 $17.65 $ 14.01 $ 0 $ 5 $ 10 $ 15 $ 20 $ 25 $ 30 $ 35 $ 40 Sep-25 Dec-26 Dec-27 Dec-28 $21.97 $23.89 $25.11 $17.84 $19.81 $21.16 $13.72 $15.74 $17.22 $ 14.01 $ 0 $ 5 $ 10 $ 15 $ 20 $ 25 $ 30 $ 35 $ 40 Sep-25 Dec-26 Dec-27 Dec-28 Status Quo $250mm Year-End 2026 Share Repurchase1 Share Price ($) Share Price ($) Present Value of Future Share Price Undisturbed Share Price as of 24-Nov Undisturbed Share Price as of 24-Nov EV / NTM EBITDA Multiple: Undisturbed: 6.3 x 1Y Average: 6.6 x 2Y Average: 7.7x NTM EBITDA ($mm) $ 597 $ 664 $ 730 Net Debt (1,899) (1,766) (1,586) Present Value of Cumulative Dividends 36 55 70 Fully Diluted Shares Outstanding 110.9 111.7 113.1 NTM EV/EBITDA Multiple 6.0x 7.0x 8.0x |
| 29 Confidential, Preliminary & Highly Illustrative for Discussion Purposes A Appendix |
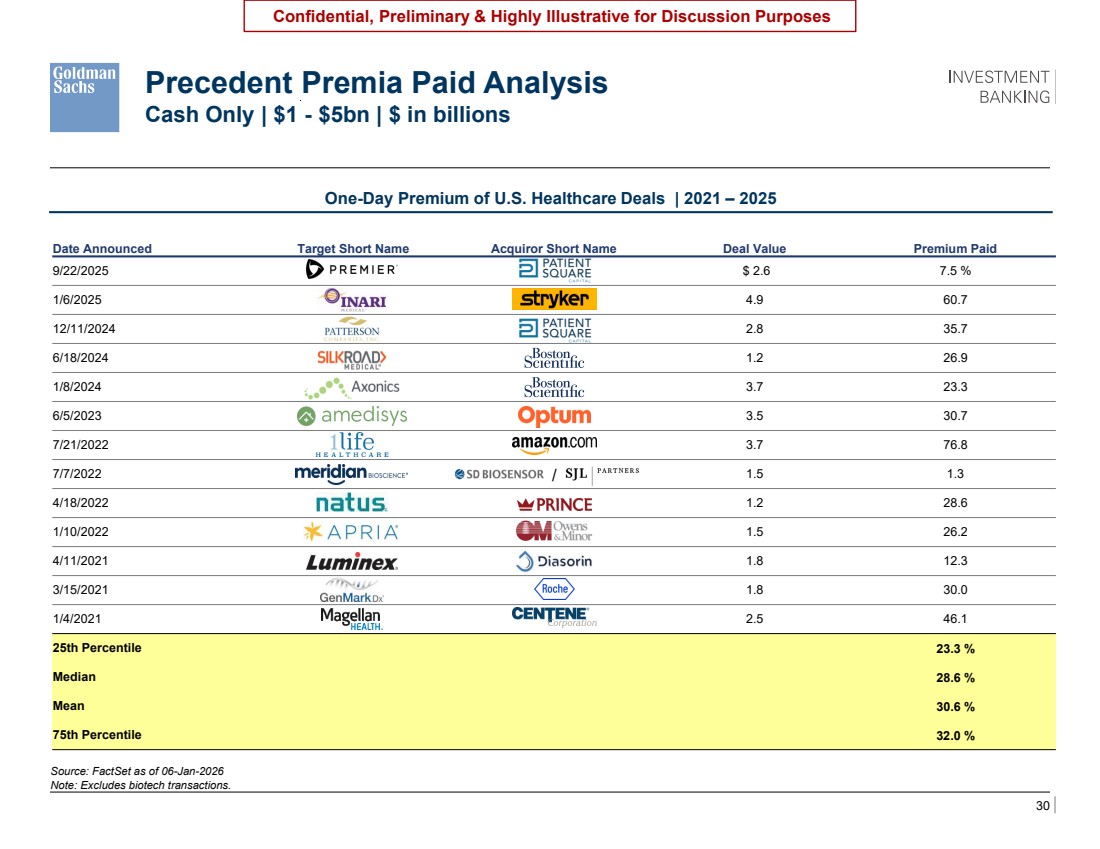
| 30 Confidential, Preliminary & Highly Illustrative for Discussion Purposes One-Day Premium of U.S. Healthcare Deals | 2021 – 2025 Source: FactSet as of 06-Jan-2026 Note: Excludes biotech transactions. Precedent Premia Paid Analysis Cash Only | $1 - $5bn | $ in billions TBU – Price update, show format with lines across page showing 25th/75th percentile lines across page Date Announced Target Short Name Acquiror Short Name Deal Value Premium Paid 9/22/2025 Premier Inc Patient Square Capital $ 2.6 7.5 % 1/6/2025 Inari Medical Inc Stryker Corp 4.9 60.7 12/11/2024 Patterson Cos Inc Patient Square Capital 2.8 35.7 6/18/2024 Silk Road Medical Inc Boston Scientific Corp 1.2 26.9 1/8/2024 Axonics Inc Boston Scientific Corp 3.7 23.3 6/5/2023 Amedisys Inc Optum Inc 3.5 30.7 7/21/2022 1Life Healthcare Inc Amazon.com Inc 3.7 76.8 7/7/2022 Meridian Bioscience Inc SD Biosensor / SJL Partners 1.5 1.3 4/18/2022 Natus Medical Inc Prince Parent Inc 1.2 28.6 1/10/2022 Apria Inc Owens & Minor Inc 1.5 26.2 4/11/2021 Luminex Corp DiaSorin SpA 1.8 12.3 3/15/2021 GenMark Diagnostics Inc Roche Holding AG 1.8 30.0 1/4/2021 Magellan Health Inc Centene Corp 2.5 46.1 25th Percentile 23.3 % Median 28.6 % Mean 30.6 % 75th Percentile 32.0 % / |
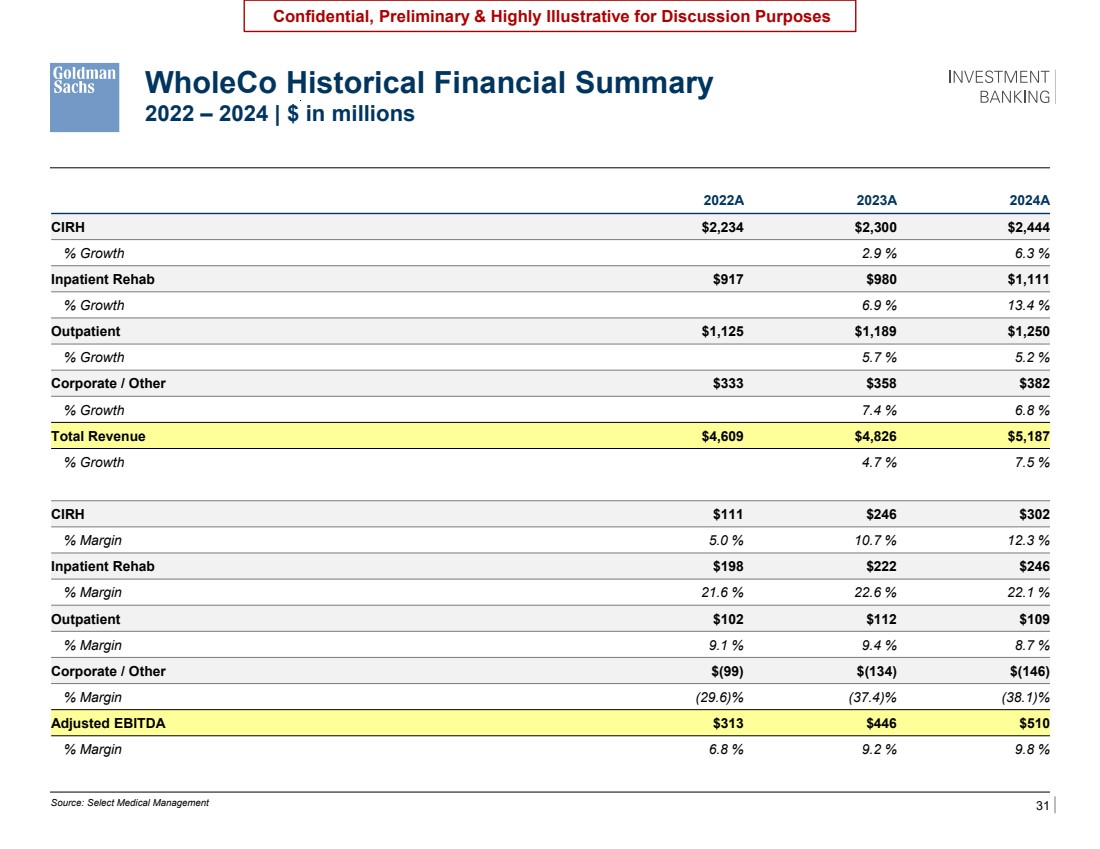
| 31 Confidential, Preliminary & Highly Illustrative for Discussion Purposes WholeCo Historical Financial Summary 2022 – 2024 | $ in millions Source: Select Medical Management 2022A 2023A 2024A CIRH $2,234 $2,300 $2,444 % Growth 2.9 % 6.3 % Inpatient Rehab $917 $980 $1,111 % Growth 6.9 % 13.4 % Outpatient $1,125 $1,189 $1,250 % Growth 5.7 % 5.2 % Corporate / Other $333 $358 $382 % Growth 7.4 % 6.8 % Total Revenue $4,609 $4,826 $5,187 % Growth 4.7 % 7.5 % CIRH $111 $246 $302 % Margin 5.0 % 10.7 % 12.3 % Inpatient Rehab $198 $222 $246 % Margin 21.6 % 22.6 % 22.1 % Outpatient $102 $112 $109 % Margin 9.1 % 9.4 % 8.7 % Corporate / Other $(99) $(134) $(146) % Margin (29.6)% (37.4)% (38.1)% Adjusted EBITDA $313 $446 $510 % Margin 6.8 % 9.2 % 9.8 % Revenue and EBITDA by segment, corporate expense, 2022 – 2024A Adjusted EBITDA Label each page’s P&L as Adjusted EBITDA b/c it’s excluding SBC |
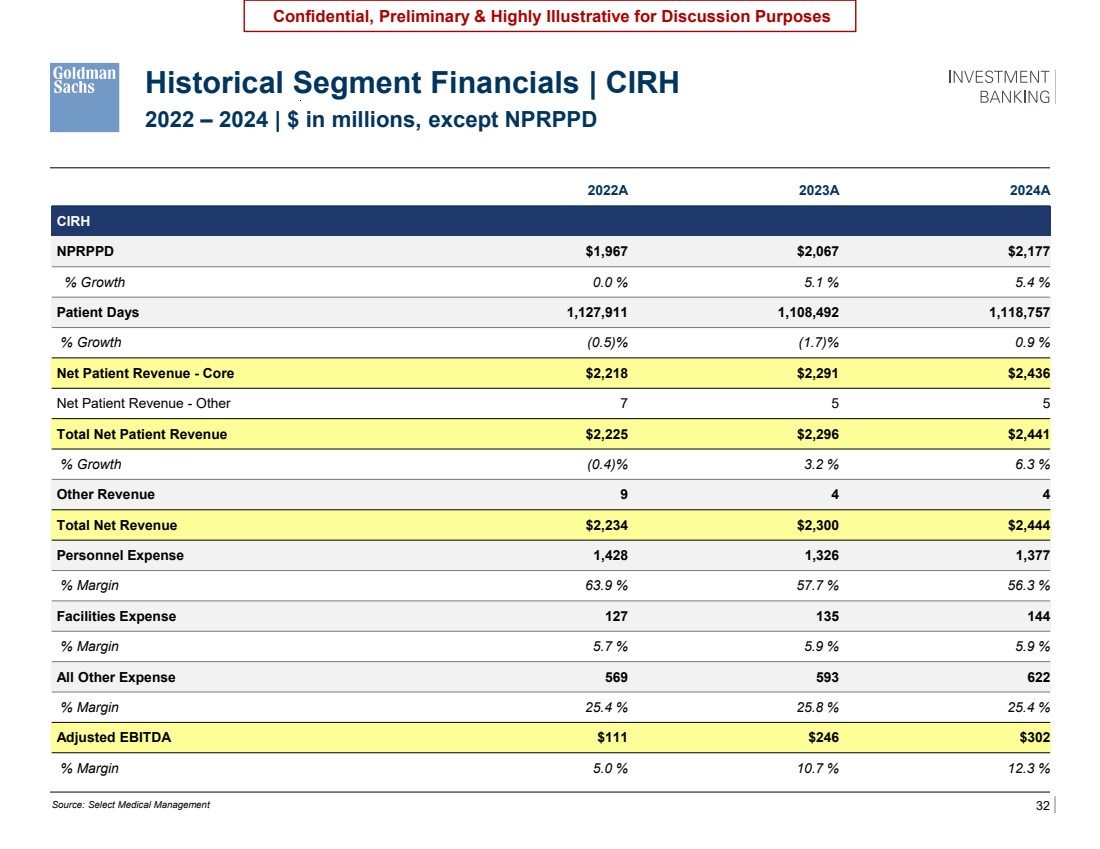
| 32 Confidential, Preliminary & Highly Illustrative for Discussion Purposes Historical Segment Financials | CIRH 2022 – 2024 | $ in millions, except NPRPPD Source: Select Medical Management 2022A 2023A 2024A CIRH NPRPPD $1,967 $2,067 $2,177 % Growth 0.0 % 5.1 % 5.4 % Patient Days 1,127,911 1,108,492 1,118,757 % Growth (0.5)% (1.7)% 0.9 % Net Patient Revenue - Core $2,218 $2,291 $2,436 Net Patient Revenue - Other 7 5 5 Total Net Patient Revenue $2,225 $2,296 $2,441 % Growth (0.4)% 3.2 % 6.3 % Other Revenue 9 4 4 Total Net Revenue $2,234 $2,300 $2,444 Personnel Expense 1,428 1,326 1,377 % Margin 63.9 % 57.7 % 56.3 % Facilities Expense 127 135 144 % Margin 5.7 % 5.9 % 5.9 % All Other Expense 569 593 622 % Margin 25.4 % 25.8 % 25.4 % Adjusted EBITDA $111 $246 $302 % Margin 5.0 % 10.7 % 12.3 % |
| 33 Confidential, Preliminary & Highly Illustrative for Discussion Purposes Historical Segment Financials | IRF 2022 – 2024 | $ in millions, except NPRPPD 2022A 2023A 2024A IRF NPRPPD $1,953 $2,017 $2,134 % Growth 4.6 % 3.3 % 5.8 % Patient Days 430,547 446,145 470,594 % Growth 3.8 % 3.6 % 5.5 % Net Patient Revenue - Core $841 $900 $1,004 Net Patient Revenue - Other 31 31 55 Total Net Patient Revenue $872 $931 $1,060 % Growth 8.0 % 6.7 % 13.8 % Other Revenue 45 49 51 Total Net Revenue $917 $980 $1,111 Personnel Expense 530 555 629 % Margin 57.8 % 56.6 % 56.6 % Facilities Expense 58 60 71 % Margin 6.3 % 6.1 % 6.4 % All Other Expense 131 143 165 % Margin 14.3 % 14.6 % 14.8 % Adjusted EBITDA $198 $222 $246 % Margin 21.6 % 22.6 % 22.1 % Source: Select Medical Management |

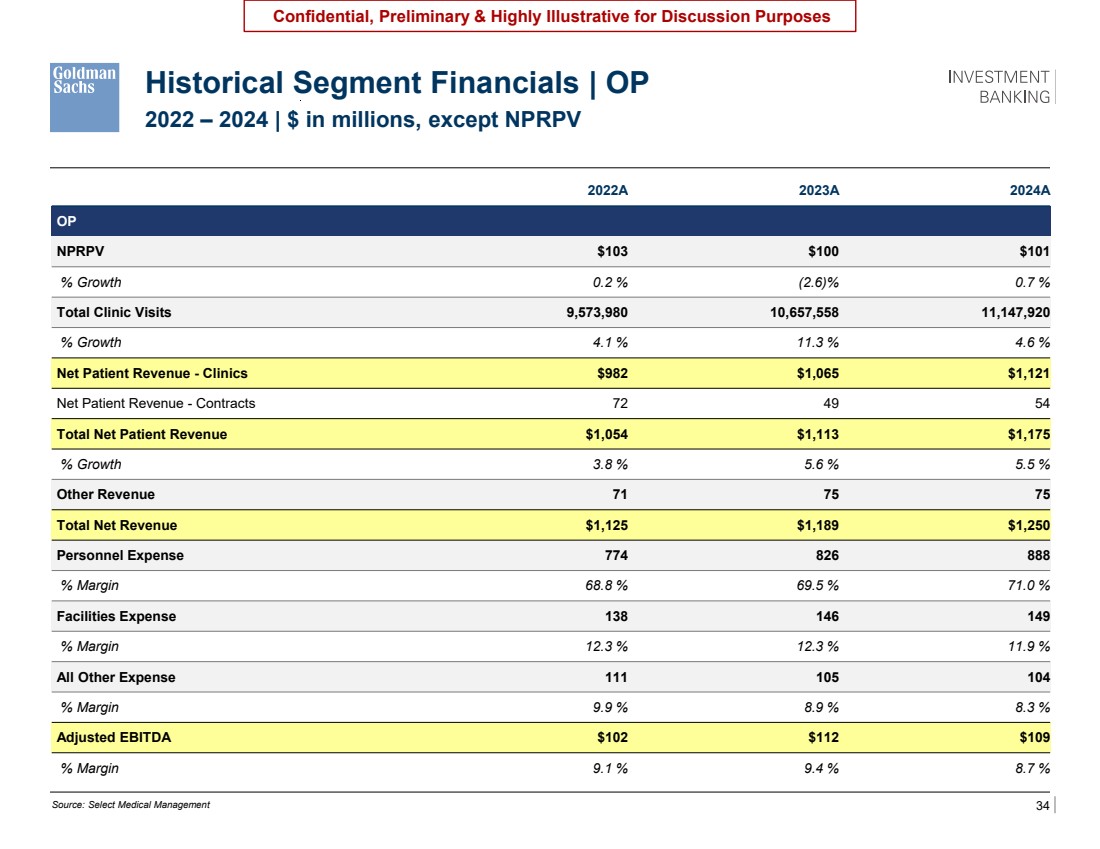
| 34 Confidential, Preliminary & Highly Illustrative for Discussion Purposes Historical Segment Financials | OP 2022 – 2024 | $ in millions, except NPRPV 2022A 2023A 2024A OP NPRPV $103 $100 $101 % Growth 0.2 % (2.6)% 0.7 % Total Clinic Visits 9,573,980 10,657,558 11,147,920 % Growth 4.1 % 11.3 % 4.6 % Net Patient Revenue - Clinics $982 $1,065 $1,121 Net Patient Revenue - Contracts 72 49 54 Total Net Patient Revenue $1,054 $1,113 $1,175 % Growth 3.8 % 5.6 % 5.5 % Other Revenue 71 75 75 Total Net Revenue $1,125 $1,189 $1,250 Personnel Expense 774 826 888 % Margin 68.8 % 69.5 % 71.0 % Facilities Expense 138 146 149 % Margin 12.3 % 12.3 % 11.9 % All Other Expense 111 105 104 % Margin 9.9 % 8.9 % 8.3 % Adjusted EBITDA $102 $112 $109 % Margin 9.1 % 9.4 % 8.7 % Source: Select Medical Management |
| 35 Confidential, Preliminary & Highly Illustrative for Discussion Purposes Disclaimer These materials have been prepared and are provided by Goldman Sachs on a confidential basis solely for the information and assistance of the Special Committee of Select Medical Holdings Corporation (the "Company") in connection with their consideration of the matters referred to herein. These materials and Goldman Sachs’ presentation relating to these materials (the “Confidential Information”) may not be disclosed to the third party or circulated or referred to publicly or used for or relied upon for any other purpose without the prior written consent of Goldman Sachs. The Confidential Information was not prepared with a view to public disclosure or to conform to any disclosure standards under any state, federal or international securities laws or other laws, rules or regulations, and Goldman Sachs does not take any responsibility for the use of the Confidential Information by persons other than those set forth above. Notwithstanding anything in this Confidential Information to the contrary, the Company may disclose to any person the US federal income and state income tax treatment and tax structure of any transaction described herein and all materials of any kind (including tax opinions and other tax analyses) that are provided to the Company relating to such tax treatment and tax structure, without Goldman Sachs imposing any limitation of any kind. The Confidential Information has been prepared by Goldman Sachs Investment Banking and is not a product of Goldman Sachs Global Investment Research. Goldman Sachs and its affiliates are engaged in advisory, underwriting and financing, principal investing, sales and trading, research, investment management and other financial and non-financial activities and services for various persons and entities. Goldman Sachs and its affiliates and employees, and funds or other entities they manage or in which they invest or have other economic interest or with which they co-invest, may at any time purchase, sell, hold or vote long or short positions and investments in securities, derivatives, loans, commodities, currencies, credit default swaps and other financial instruments of the Company, any other party to any transaction and any of their respective affiliates or any currency or commodity that may be involved in any transaction. Goldman Sachs Investment Banking maintains regular, ordinary course client service dialogues with clients and potential clients to review events, opportunities, and conditions in particular sectors and industries and, in that connection, Goldman Sachs may make reference to the Company, but Goldman Sachs will not disclose any confidential information received from the Company. The Confidential Information has been prepared based on historical financial information, forecasts and other information obtained by Goldman Sachs from publicly available sources, the management of the Company or other sources (approved for our use by the Company in the case of information from management and non-public information). In preparing the Confidential Information, Goldman Sachs has relied upon and assumed, without assuming any responsibility for independent verification, the accuracy and completeness of all of the financial, legal, regulatory, tax, accounting and other information provided to, discussed with or reviewed by us, and Goldman Sachs does not assume any liability for any such information. Goldman Sachs does not provide accounting, tax, legal or regulatory advice. Goldman Sachs has not made an independent evaluation or appraisal of the assets and liabilities (including any contingent, derivative or off-balance sheet assets and liabilities) of the Company or any other party to any transaction or any of their respective affiliates and has no obligation to evaluate the solvency of the Company or any other party to any transaction under any state or federal laws relating to bankruptcy, insolvency or similar matters. The analyses contained in the Confidential Information do not purport to be appraisals nor do they necessarily reflect the prices at which businesses or securities actually may be sold or purchased. Goldman Sachs’ role in any due diligence review is limited solely to performing such a review as it shall deem necessary to support its own advice and analysis and shall not be on behalf of the Company. Analyses based upon forecasts of future results are not necessarily indicative of actual future results, which may be significantly more or less favorable than suggested by these analyses, and Goldman Sachs does not assume responsibility if future results are materially different from those forecast. The Confidential Information does not address the underlying business decision of the Company to engage in any transaction, or the relative merits of any transaction or strategic alternative referred to herein as compared to any other transaction or alternative that may be available to the Company. The Confidential Information is necessarily based on economic, monetary, market and other conditions as in effect on, and the information made available to Goldman Sachs as of, the date of such Confidential Information and Goldman Sachs assumes no responsibility for updating or revising the Confidential Information based on circumstances, developments or events occurring after such date. The Confidential Information does not constitute any opinion, nor does the Confidential Information constitute a recommendation to the Board, any security holder of the Company or any other person as to how to vote or act with respect to any transaction or any other matter. The Confidential Information, including this disclaimer, are subject to, and governed by, any written agreement between the Company, the Board and/or any committee thereof, on the hand, and Goldman Sachs, on the other hand. The Confidential Information does not address, nor does Goldman Sachs express any view as to, the potential effects of volatility in the credit, financial and stock markets on the Company, any other party to any transaction or any transaction. |