| Confidential, Preliminary & Highly Illustrative for Discussion Purposes Materials for the Special Committee Goldman Sachs & Co. LLC February 6th, 2026 Goldman Sachs does not provide accounting, tax, or legal advice. Notwithstanding anything in this document to the contrary, and except as required to enable compliance with applicable securities law, you (and each of your employees, representatives, and other agents) may disclose to any and all persons the US federal income and state tax treatment and tax structure of the transaction and all materials of any kind (including tax opinions and other tax analyses) that are provided to you relating to such tax treatment and tax structure, without Goldman Sachs imposing any limitation of any kind. |
| 1 Confidential, Preliminary & Highly Illustrative for Discussion Purposes Today’s Agenda and Next Steps 2 Buyer and Shareholder Update 1 Process Update 3 Valuation Update 4 Illustrative Script for Call with Bob Ortenzio Today’s Agenda Next Steps 2 Refine Analysis on Separation of CIRH 1 Debrief Following Call Between Bob and Special Committee 3 Refine Analysis of Stallion’s Shareholder Base 4 Refine Valuation Analysis Following Incremental Diligence |
| 2 Confidential, Preliminary & Highly Illustrative for Discussion Purposes 1 Process Update |
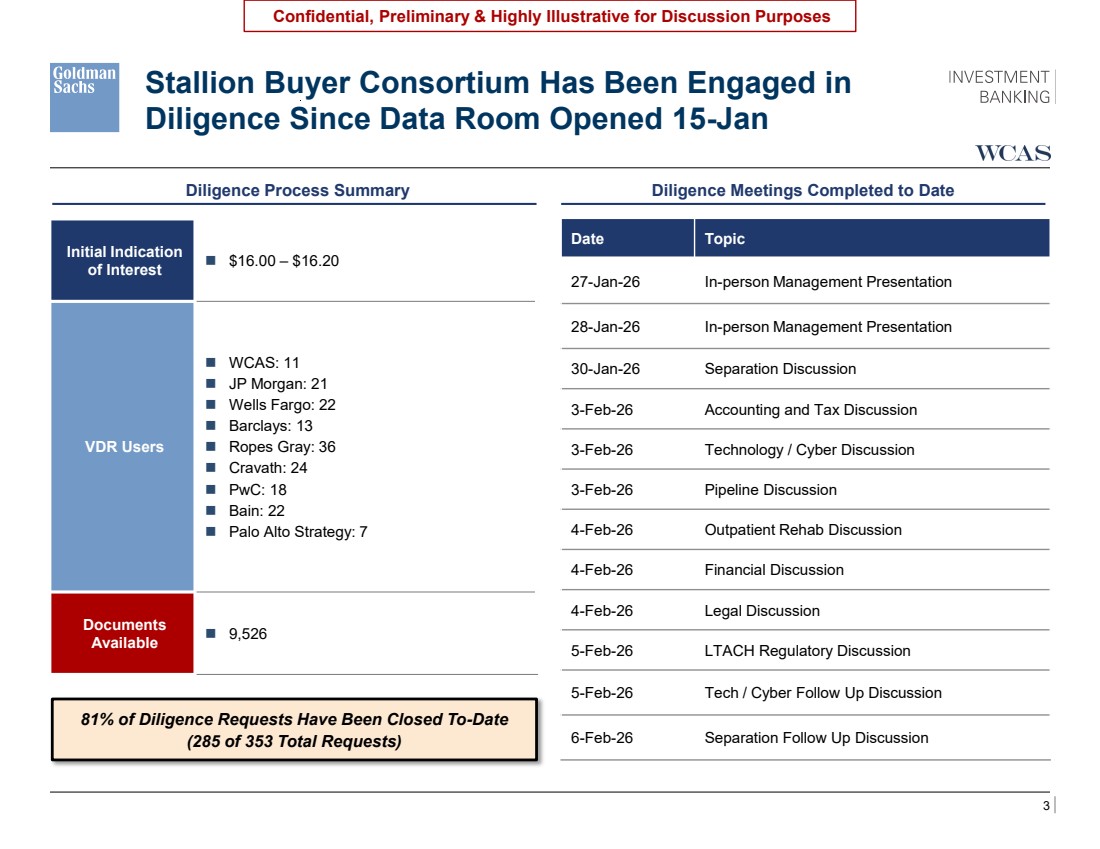
| 3 Confidential, Preliminary & Highly Illustrative for Discussion Purposes Stallion Buyer Consortium Has Been Engaged in Diligence Since Data Room Opened 15-Jan Initial Indication of Interest ◼ $16.00 – $16.20 VDR Users ◼ WCAS: 11 ◼ JP Morgan: 21 ◼ Wells Fargo: 22 ◼ Barclays: 13 ◼ Ropes Gray: 36 ◼ Cravath: 24 ◼ PwC: 18 ◼ Bain: 22 ◼ Palo Alto Strategy: 7 Documents Available ◼ 9,526 Diligence Process Summary Diligence Meetings Completed to Date \\firmwide.corp.gs.com\ibdroot\projects\IBD-NY\sapient2025\977110_1\Presentations\8. Special Committee Process Update\Excel\Content Engagement Report.xlsx 81% of Diligence Requests Have Been Closed To-Date (285 of 353 Total Requests) Date Topic 27-Jan-26 In-person Management Presentation 28-Jan-26 In-person Management Presentation 30-Jan-26 Separation Discussion 3-Feb-26 Accounting and Tax Discussion 3-Feb-26 Technology / Cyber Discussion 3-Feb-26 Pipeline Discussion 4-Feb-26 Outpatient Rehab Discussion 4-Feb-26 Financial Discussion 4-Feb-26 Legal Discussion 5-Feb-26 LTACH Regulatory Discussion 5-Feb-26 Tech / Cyber Follow Up Discussion 6-Feb-26 Separation Follow Up Discussion |
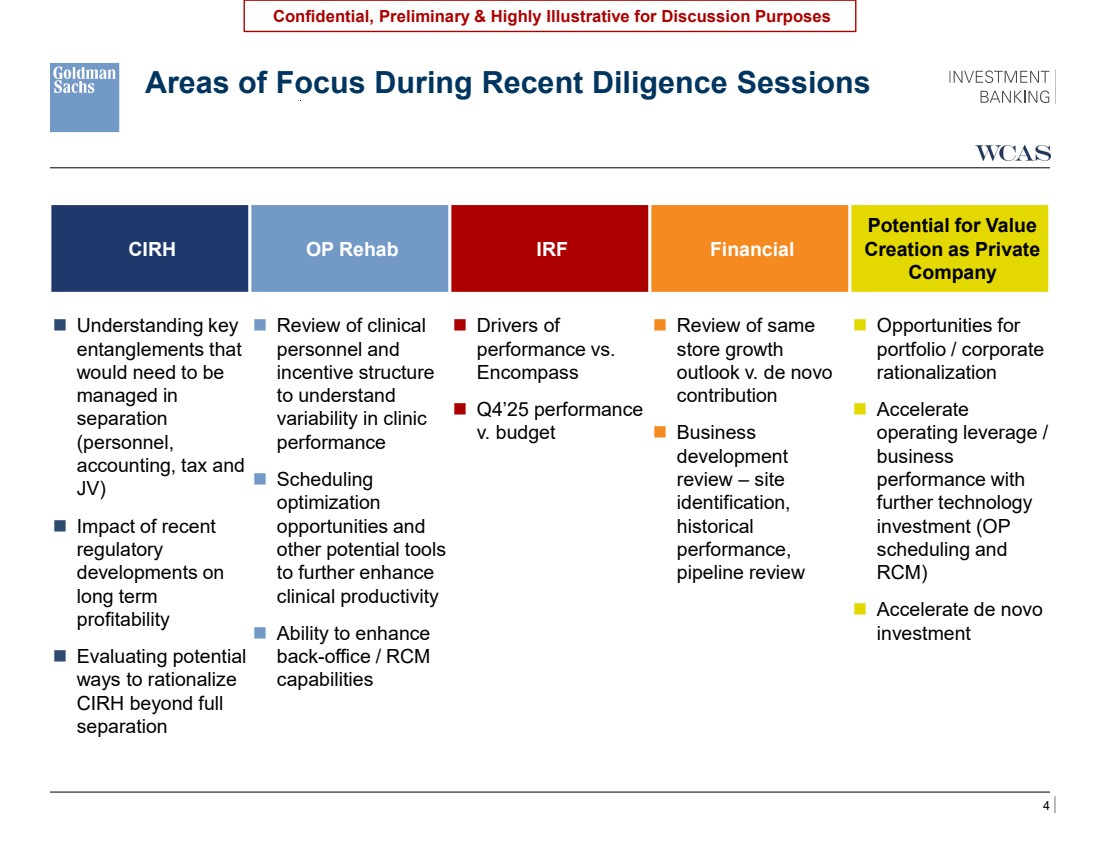
| 4 Confidential, Preliminary & Highly Illustrative for Discussion Purposes Areas of Focus During Recent Diligence Sessions \\firmwide.corp.gs.com\ibdroot\projects\IBD-NY\sapient2025\977110_1\Presentations\8. Special Committee Process Update\Excel\Content Engagement Report.xlsx CIRH OP Rehab IRF Financial Potential for Value Creation as Private Company ◼ Understanding key entanglements that would need to be managed in separation (personnel, accounting, tax and JV) ◼ Impact of recent regulatory developments on long term profitability ◼ Evaluating potential ways to rationalize CIRH beyond full separation ◼ Review of clinical personnel and incentive structure to understand variability in clinic performance ◼ Scheduling optimization opportunities and other potential tools to further enhance clinical productivity ◼ Ability to enhance back-office / RCM capabilities ◼ Drivers of performance vs. Encompass ◼ Q4’25 performance v. budget ◼ Review of same store growth outlook v. de novo contribution ◼ Business development review – site identification, historical performance, pipeline review ◼ Opportunities for portfolio / corporate rationalization ◼ Accelerate operating leverage / business performance with further technology investment (OP scheduling and RCM) ◼ Accelerate de novo investment Presentation ◼ [ ] CIRH Separation ◼ [ ] Accounting and Tax ◼ [ ] Technology and Cyber ◼ [ ] Pipeline ◼ [ ] OP Rehab ◼ [ ] Financial ◼ [ ] Legal ◼ [ ] LTACH Regulatory ◼ [ ] Procurement ◼ [ ] |
| 5 Confidential, Preliminary & Highly Illustrative for Discussion Purposes 2 Buyer and Shareholder Update |
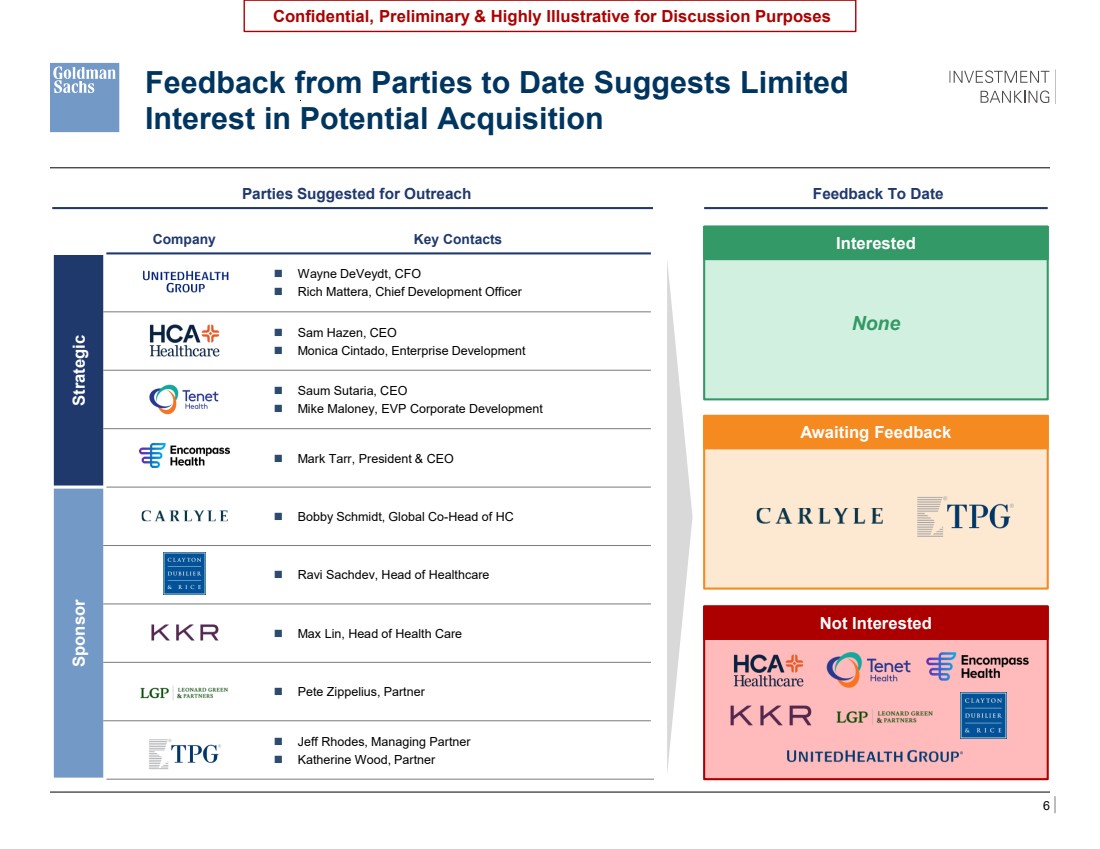
| 6 Confidential, Preliminary & Highly Illustrative for Discussion Purposes Company Key Contacts Strategic UNH ◼ Wayne DeVeydt, CFO ◼ Rich Mattera, Chief Development Officer HCA ◼ Sam Hazen, CEO ◼ Monica Cintado, Enterprise Development THC ◼ Saum Sutaria, CEO ◼ Mike Maloney, EVP Corporate Development Encompass ◼ Mark Tarr, President & CEO Sponsor Carlyle ◼ Bobby Schmidt, Global Co-Head of HC CD&R ◼ Ravi Sachdev, Head of Healthcare KKR ◼ Max Lin, Head of Health Care LGP ◼ Pete Zippelius, Partner TPG ◼ Jeff Rhodes, Managing Partner ◼ Katherine Wood, Partner Would have strategics / sponsors on LHS that we suggested for outreach And then bifurcate RHS into 3 buckets: Interested / Not interested / Awaiting feedback First bucket would have no names Encompass a pass Speaking to United on Friday Tenet encompass and HCA all no LGP and KKR a no so far Cd&r also a no Parties Suggested for Outreach Feedback To Date Interested None Awaiting Feedback Not Interested Feedback from Parties to Date Suggests Limited Interest in Potential Acquisition |
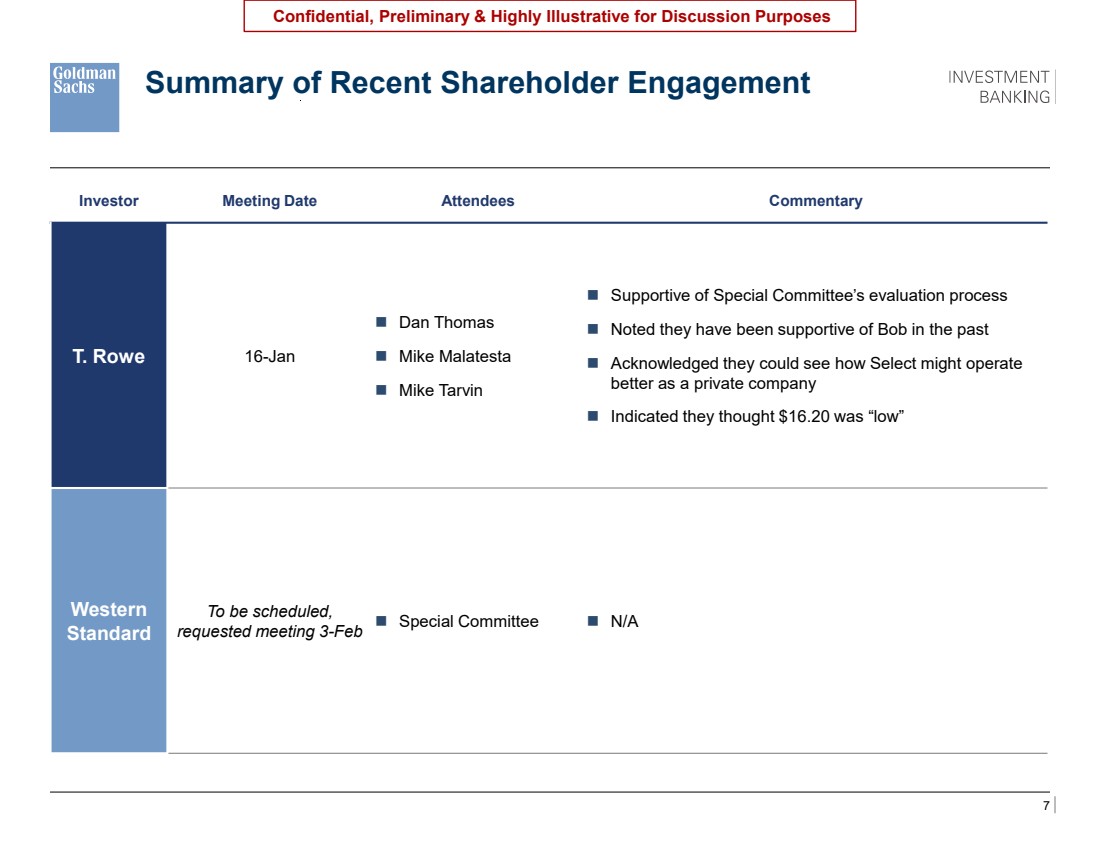
| 7 Confidential, Preliminary & Highly Illustrative for Discussion Purposes Investor Meeting Date Attendees Commentary T. Rowe 16-Jan ◼ Dan Thomas ◼ Mike Malatesta ◼ Mike Tarvin ◼ Supportive of Special Committee’s evaluation process ◼ Noted they have been supportive of Bob in the past ◼ Acknowledged they could see how Select might operate better as a private company ◼ Indicated they thought $16.20 was “low” Western Standard To be scheduled, requested meeting 3-Feb ◼ Special Committee ◼ N/A Summary of Recent Shareholder Engagement High level table of engagement with TRowe and Western Standard Shareholder / date of meeting / attendees / commentary |
| 8 Confidential, Preliminary & Highly Illustrative for Discussion Purposes 3 Valuation Update |
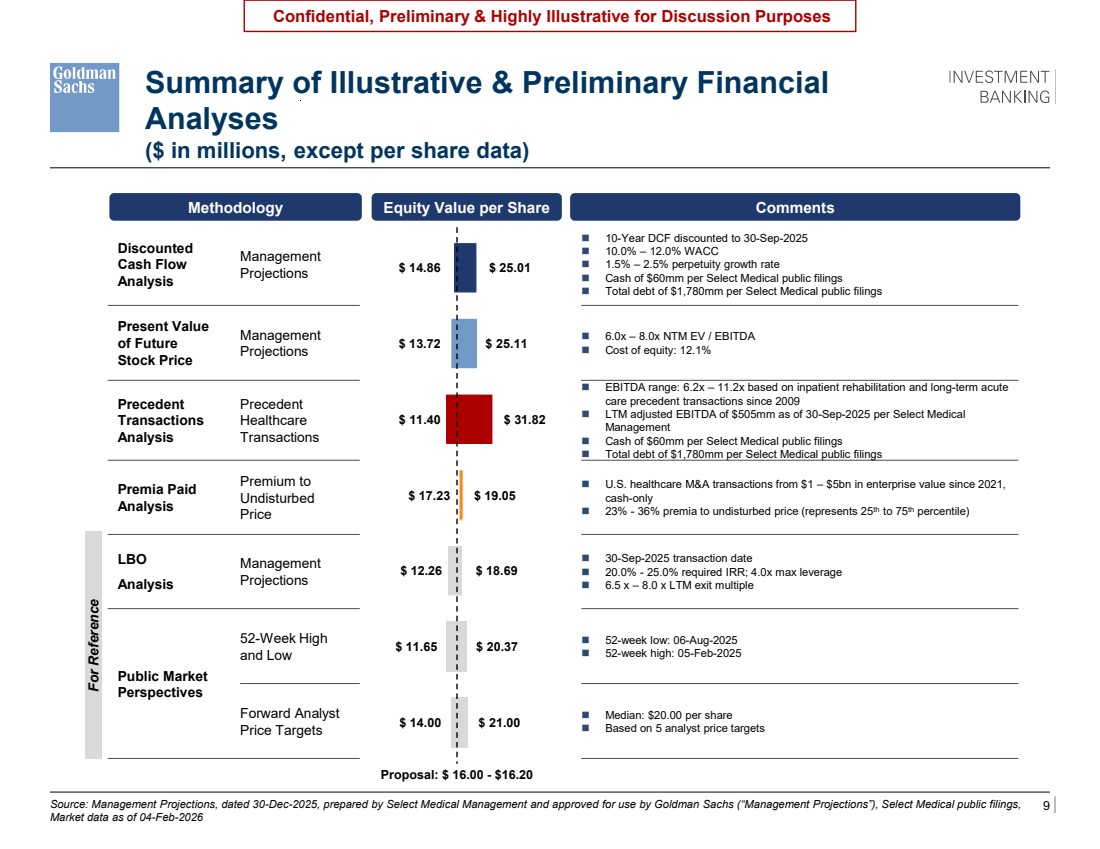
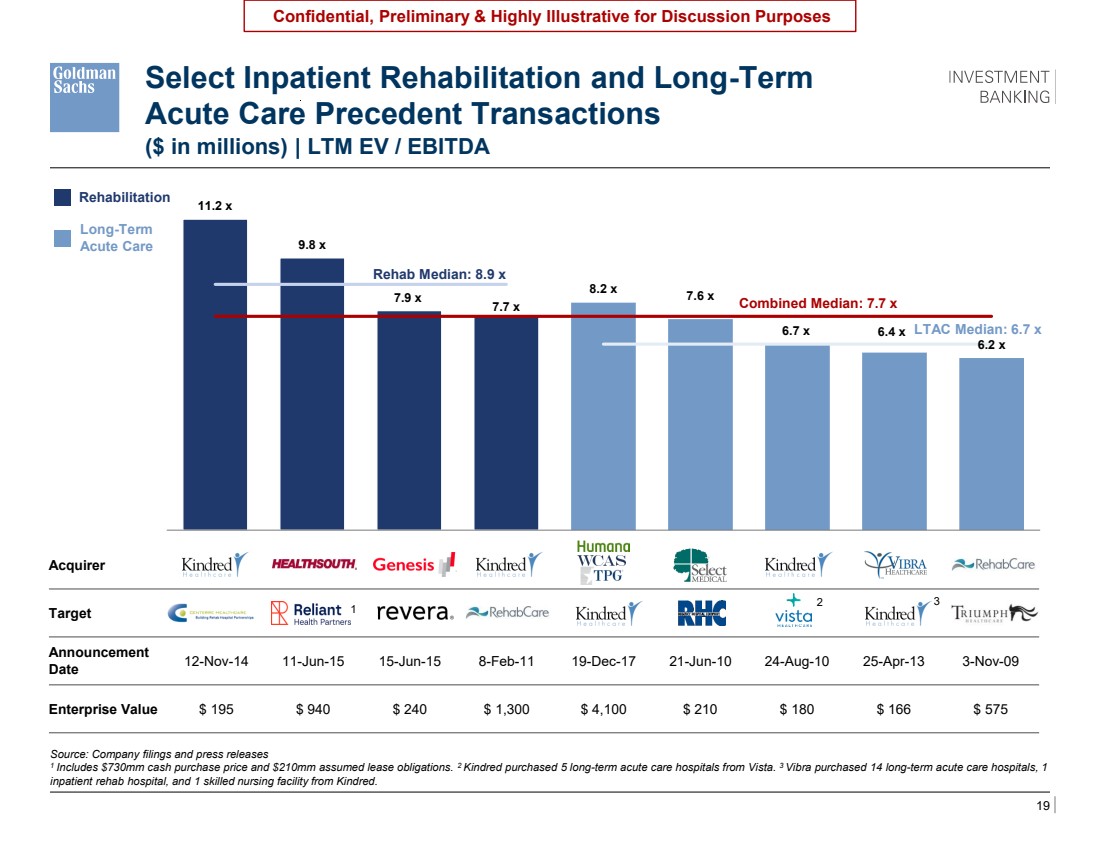
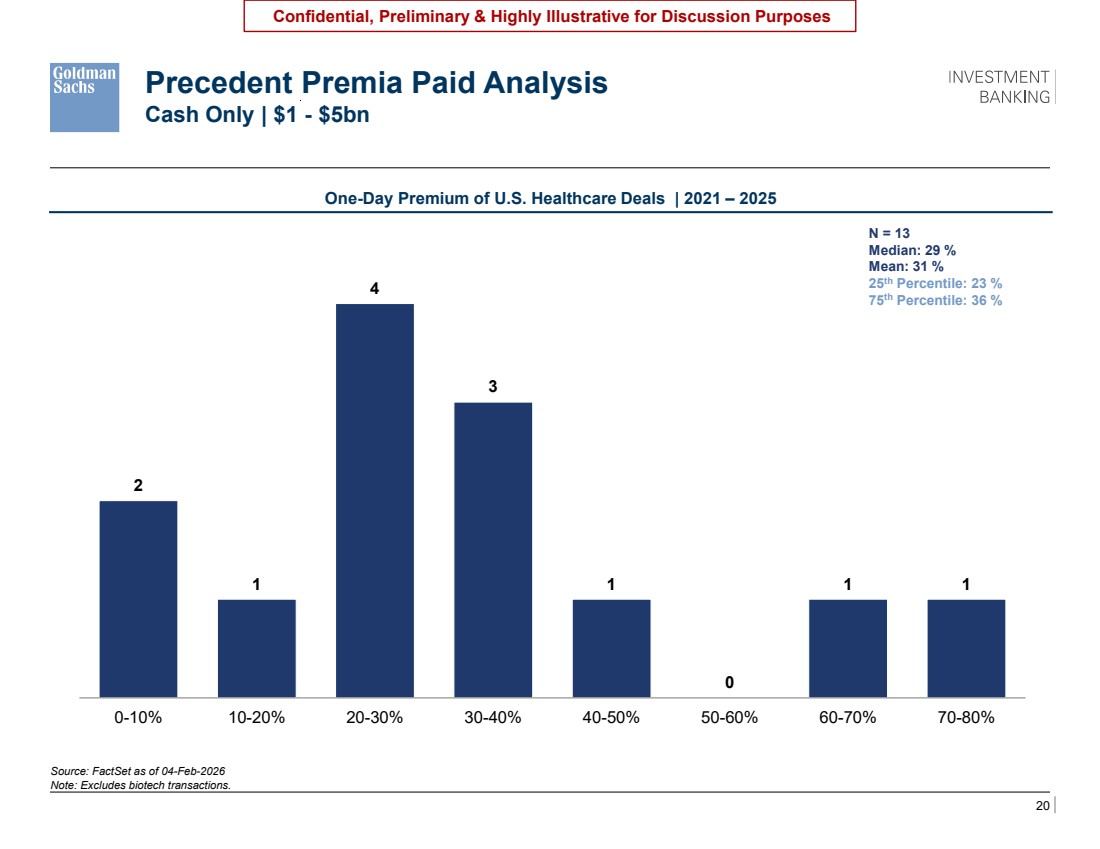
| 9 Confidential, Preliminary & Highly Illustrative for Discussion Purposes Discounted Cash Flow Analysis Management Projections ◼ 10-Year DCF discounted to 30-Sep-2025 ◼ 10.0% – 12.0% WACC ◼ 1.5% – 2.5% perpetuity growth rate ◼ Cash of $60mm per Select Medical public filings ◼ Total debt of $1,780mm per Select Medical public filings Present Value of Future Stock Price Management Projections ◼ 6.0x – 8.0x NTM EV / EBITDA ◼ Cost of equity: 12.1% Precedent Transactions Analysis Precedent Healthcare Transactions ◼ EBITDA range: 6.2x – 11.2x based on inpatient rehabilitation and long-term acute care precedent transactions since 2009 ◼ LTM adjusted EBITDA of $505mm as of 30-Sep-2025 per Select Medical Management ◼ Cash of $60mm per Select Medical public filings ◼ Total debt of $1,780mm per Select Medical public filings Premia Paid Analysis Premium to Undisturbed Price ◼ U.S. healthcare M&A transactions from $1 – $5bn in enterprise value since 2021, cash-only ◼ 23% - 36% premia to undisturbed price (represents 25th to 75th percentile) LBO Analysis Management Projections ◼ 30-Sep-2025 transaction date ◼ 20.0% - 25.0% required IRR; 4.0x max leverage ◼ 6.5 x – 8.0 x LTM exit multiple Public Market Perspectives 52-Week High and Low ◼ 52-week low: 06-Aug-2025 ◼ 52-week high: 05-Feb-2025 Forward Analyst Price Targets ◼ Median: $20.00 per share ◼ Based on 5 analyst price targets $ 14.86 $ 13.72 $ 11.40 $ 17.23 $ 12.26 $ 11.65 $ 14.00 $ 25.01 $ 25.11 $ 31.82 $ 19.05 $ 18.69 $ 20.37 $ 21.00 Summary of Illustrative & Preliminary Financial Analyses Methodology Equity Value per Share Comments Proposal: $ 16.00 - $16.20 Source: Management Projections, dated 30-Dec-2025, prepared by Select Medical Management and approved for use by Goldman Sachs (“Management Projections”), Select Medical public filings, Market data as of 04-Feb-2026 ($ in millions, except per share data) For Reference oPV of FSP should be 15.20 – 22.28 The orange bubble should be undisturbed price of $14.01on page 19 oAdd a bullet the forward PTs which says CY2026E Consensus Median EBITDA is [ ]% above current Management estimates oLBO: Run the exit multiples at 6.5x – 8.0x with 7.25x at the midpoint |
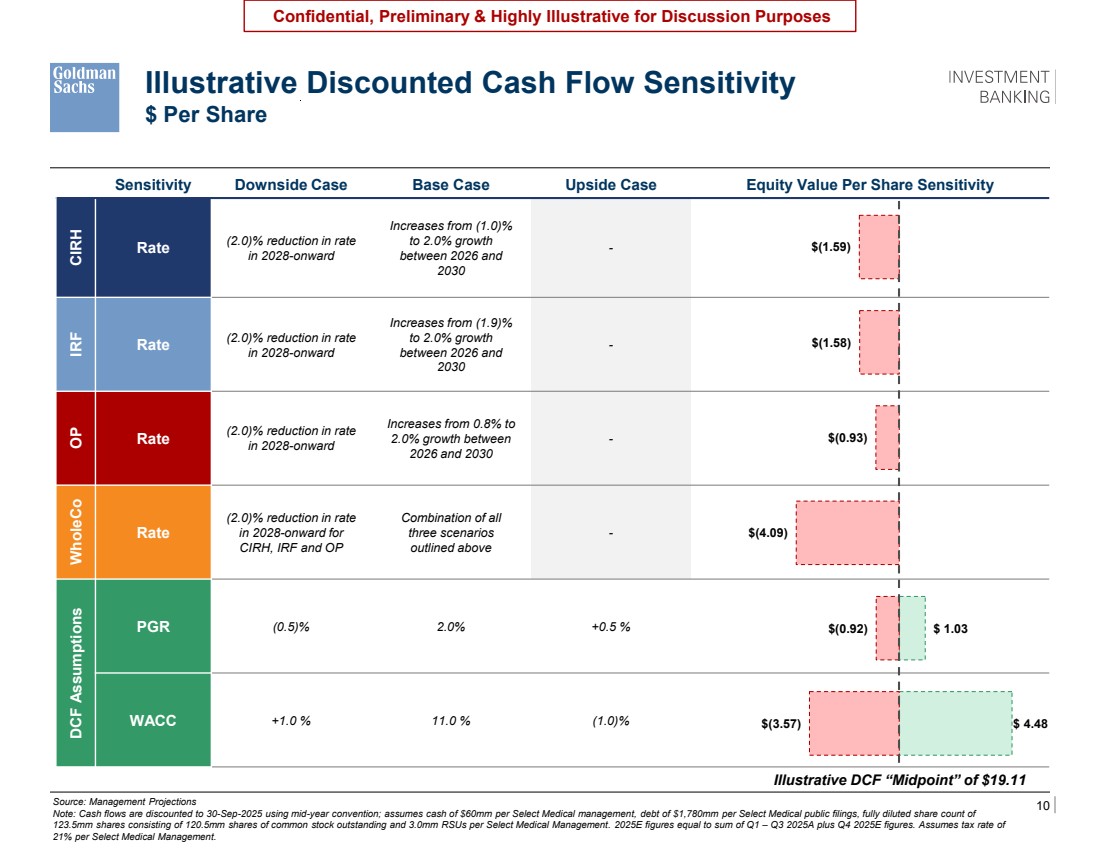
| 10 Confidential, Preliminary & Highly Illustrative for Discussion Purposes Sensitivity Downside Case Base Case Upside Case Equity Value Per Share Sensitivity CIRH Rate (2.0)% reduction in rate in 2028-onward Increases from (1.0)% to 2.0% growth between 2026 and 2030 - IRF Rate (2.0)% reduction in rate in 2028-onward Increases from (1.9)% to 2.0% growth between 2026 and 2030 - OP Rate (2.0)% reduction in rate in 2028-onward Increases from 0.8% to 2.0% growth between 2026 and 2030 - WholeCo Rate (2.0)% reduction in rate in 2028-onward for CIRH, IRF and OP Combination of all three scenarios outlined above - DCF Assumptions PGR (0.5)% 2.0% +0.5 % WACC +1.0 % 11.0 % (1.0)% Source: Management Projections Note: Cash flows are discounted to 30-Sep-2025 using mid-year convention; assumes cash of $60mm per Select Medical management, debt of $1,780mm per Select Medical public filings, fully diluted share count of 123.5mm shares consisting of 120.5mm shares of common stock outstanding and 3.0mm RSUs per Select Medical Management. 2025E figures equal to sum of Q1 – Q3 2025A plus Q4 2025E figures. Assumes tax rate of 21% per Select Medical Management. Illustrative Discounted Cash Flow Sensitivity $ Per Share $(1.59) $(1.58) $(0.93) $(4.09) $(0.92) $(3.57) $ 1.03 $ 4.48 Illustrative DCF “Midpoint” of $19.11 |
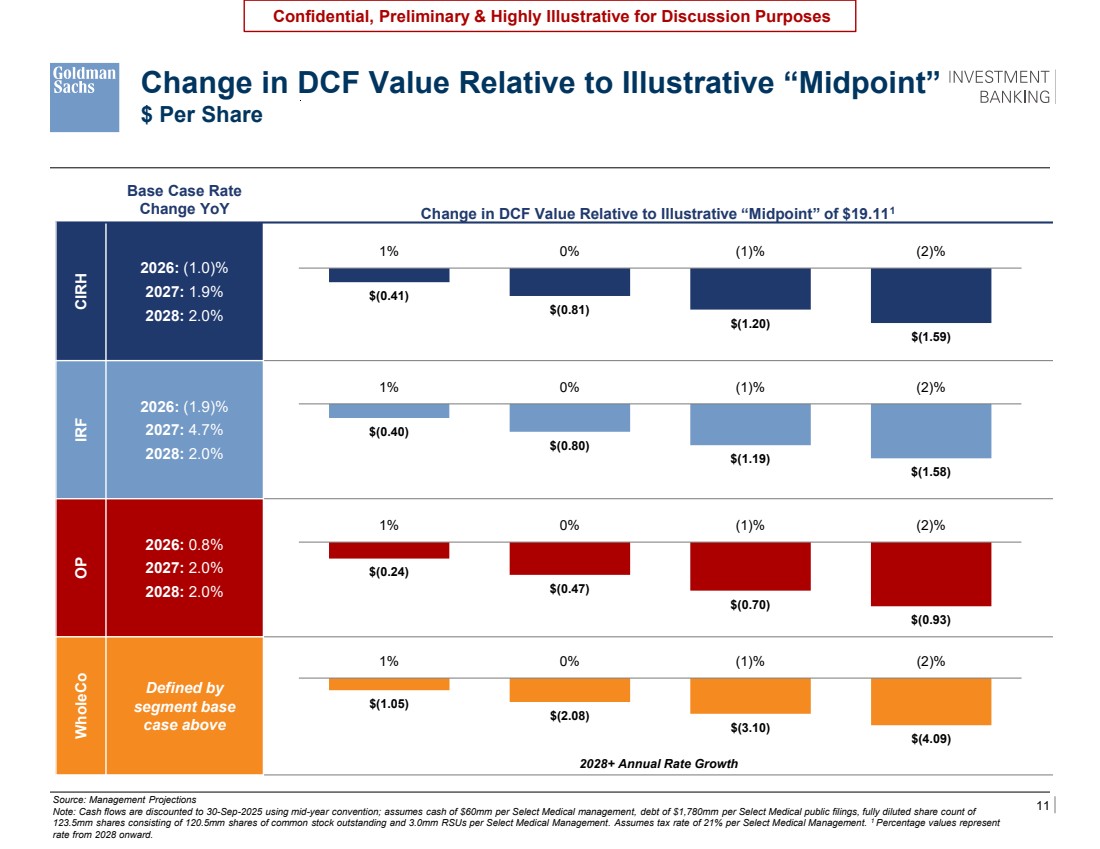
| 11 Confidential, Preliminary & Highly Illustrative for Discussion Purposes Change in DCF Value Relative to Illustrative “Midpoint” $ Per Share Base Case Rate Change YoY Change in DCF Value Relative to Illustrative “Midpoint” of $19.111 CIRH 2026: (1.0)% 2027: 1.9% 2028: 2.0% IRF 2026: (1.9)% 2027: 4.7% 2028: 2.0% OP 2026: 0.8% 2027: 2.0% 2028: 2.0% WholeCo Defined by segment base case above Source: Management Projections Note: Cash flows are discounted to 30-Sep-2025 using mid-year convention; assumes cash of $60mm per Select Medical management, debt of $1,780mm per Select Medical public filings, fully diluted share count of 123.5mm shares consisting of 120.5mm shares of common stock outstanding and 3.0mm RSUs per Select Medical Management. Assumes tax rate of 21% per Select Medical Management. 1 Percentage values represent rate from 2028 onward. $(0.41) $(0.81) $(1.20) $(1.59) 1% 0% (1)% (2)% $(0.40) $(0.80) $(1.19) $(1.58) 1% 0% (1)% (2)% $(0.24) $(0.47) $(0.70) $(0.93) 1% 0% (1)% (2)% $(1.05) $(2.08) $(3.10) $(4.09) 1% 0% (1)% (2)% Base Case Increased Reimbursement Relative to Base Case Decreased Reimbursement Relative to Base Case Base Case: $ 19.11 Per Share 2028+ Annual Rate Growth |
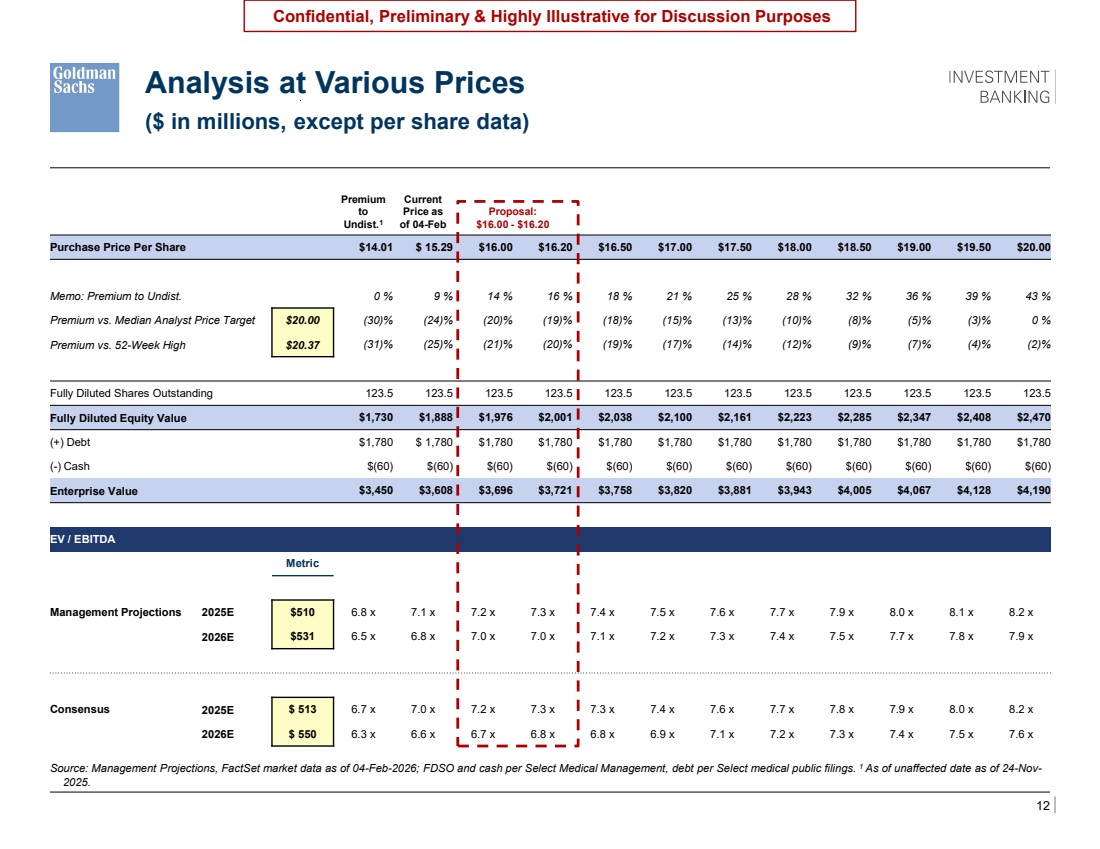
| 12 Confidential, Preliminary & Highly Illustrative for Discussion Purposes Source: Management Projections, FactSet market data as of 04-Feb-2026; FDSO and cash per Select Medical Management, debt per Select medical public filings. 1 As of unaffected date as of 24-Nov-2025. Analysis at Various Prices ($ in millions, except per share data) Premium to Undist.1 Current Price as of 04-Feb Proposal: $16.00 - $16.20 Purchase Price Per Share $14.01 $ 15.29 $16.00 $16.20 $16.50 $17.00 $17.50 $18.00 $18.50 $19.00 $19.50 $20.00 Memo: Premium to Undist. 0 % 9 % 14 % 16 % 18 % 21 % 25 % 28 % 32 % 36 % 39 % 43 % Premium vs. Median Analyst Price Target $20.00 (30)% (24)% (20)% (19)% (18)% (15)% (13)% (10)% (8)% (5)% (3)% 0 % Premium vs. 52-Week High $20.37 (31)% (25)% (21)% (20)% (19)% (17)% (14)% (12)% (9)% (7)% (4)% (2)% Fully Diluted Shares Outstanding 123.5 123.5 123.5 123.5 123.5 123.5 123.5 123.5 123.5 123.5 123.5 123.5 Fully Diluted Equity Value $1,730 $1,888 $1,976 $2,001 $2,038 $2,100 $2,161 $2,223 $2,285 $2,347 $2,408 $2,470 (+) Debt $1,780 $ 1,780 $1,780 $1,780 $1,780 $1,780 $1,780 $1,780 $1,780 $1,780 $1,780 $1,780 (-) Cash $(60) $(60) $(60) $(60) $(60) $(60) $(60) $(60) $(60) $(60) $(60) $(60) Enterprise Value $3,450 $3,608 $3,696 $3,721 $3,758 $3,820 $3,881 $3,943 $4,005 $4,067 $4,128 $4,190 EV / EBITDA Metric Management Projections 2025E $510 6.8 x 7.1 x 7.2 x 7.3 x 7.4 x 7.5 x 7.6 x 7.7 x 7.9 x 8.0 x 8.1 x 8.2 x 2026E $531 6.5 x 6.8 x 7.0 x 7.0 x 7.1 x 7.2 x 7.3 x 7.4 x 7.5 x 7.7 x 7.8 x 7.9 x Consensus 2025E $ 513 6.7 x 7.0 x 7.2 x 7.3 x 7.3 x 7.4 x 7.6 x 7.7 x 7.8 x 7.9 x 8.0 x 8.2 x 2026E $ 550 6.3 x 6.6 x 6.7 x 6.8 x 6.8 x 6.9 x 7.1 x 7.2 x 7.3 x 7.4 x 7.5 x 7.6 x |
| 13 Confidential, Preliminary & Highly Illustrative for Discussion Purposes 4 Illustrative Script for Call with Bob Ortenzio |
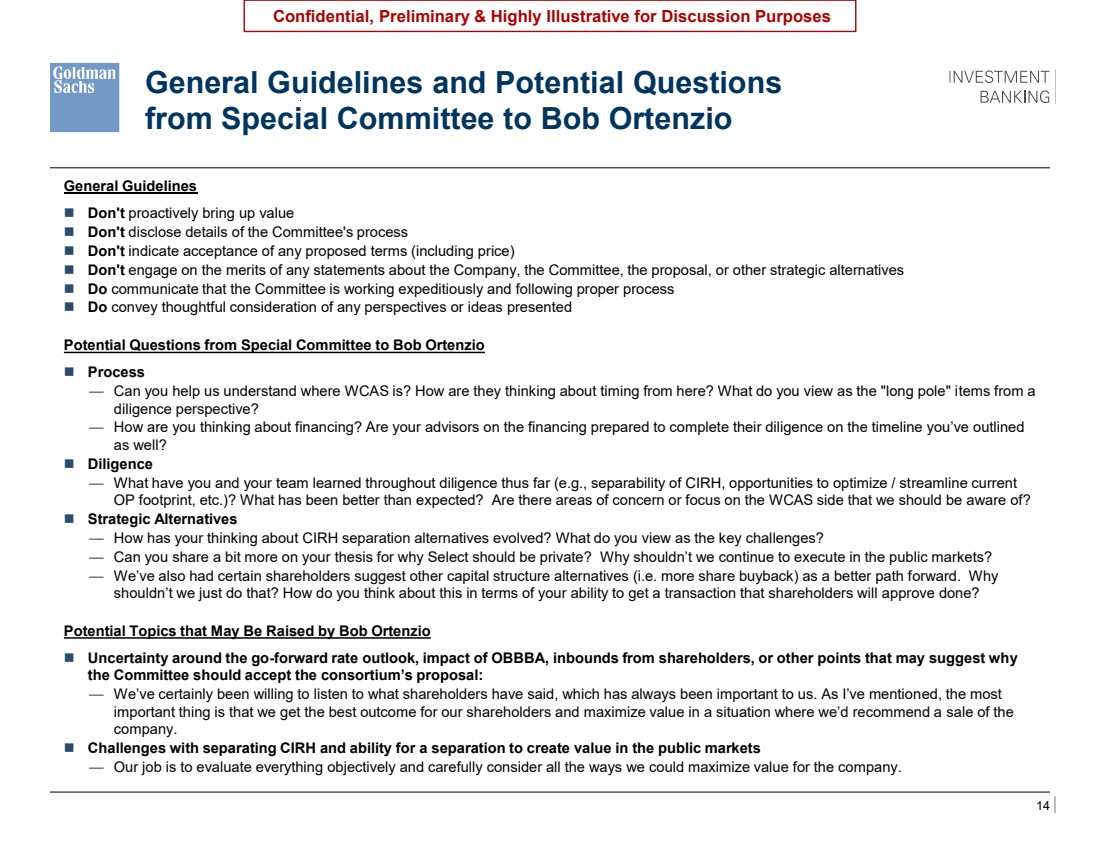
| 14 Confidential, Preliminary & Highly Illustrative for Discussion Purposes Would have strategics / sponsors on LHS that we suggested for outreach And then bifurcate RHS into 3 buckets: Interested / Not interested / Awaiting feedback First bucket would have no names Encompass a pass Speaking to United on Friday Tenet encompass and HCA all no LGP and KKR a no so far Cd&r also a no General Guidelines and Potential Questions from Special Committee to Bob Ortenzio General Guidelines ◼ Don't proactively bring up value ◼ Don't disclose details of the Committee's process ◼ Don't indicate acceptance of any proposed terms (including price) ◼ Don't engage on the merits of any statements about the Company, the Committee, the proposal, or other strategic alternatives ◼ Do communicate that the Committee is working expeditiously and following proper process ◼ Do convey thoughtful consideration of any perspectives or ideas presented Potential Questions from Special Committee to Bob Ortenzio ◼ Process — Can you help us understand where WCAS is? How are they thinking about timing from here? What do you view as the "long pole" items from a diligence perspective? — How are you thinking about financing? Are your advisors on the financing prepared to complete their diligence on the timeline you’ve outlined as well? ◼ Diligence — What have you and your team learned throughout diligence thus far (e.g., separability of CIRH, opportunities to optimize / streamline current OP footprint, etc.)? What has been better than expected? Are there areas of concern or focus on the WCAS side that we should be aware of? ◼ Strategic Alternatives — How has your thinking about CIRH separation alternatives evolved? What do you view as the key challenges? — Can you share a bit more on your thesis for why Select should be private? Why shouldn’t we continue to execute in the public markets? — We’ve also had certain shareholders suggest other capital structure alternatives (i.e. more share buyback) as a better path forward. Why shouldn’t we just do that? How do you think about this in terms of your ability to get a transaction that shareholders will approve done? Potential Topics that May Be Raised by Bob Ortenzio ◼ Uncertainty around the go-forward rate outlook, impact of OBBBA, inbounds from shareholders, or other points that may suggest why the Committee should accept the consortium’s proposal: — We’ve certainly been willing to listen to what shareholders have said, which has always been important to us. As I’ve mentioned, the most important thing is that we get the best outcome for our shareholders and maximize value in a situation where we’d recommend a sale of the company. ◼ Challenges with separating CIRH and ability for a separation to create value in the public markets — Our job is to evaluate everything objectively and carefully consider all the ways we could maximize value for the company. |
| 15 Confidential, Preliminary & Highly Illustrative for Discussion Purposes Would have strategics / sponsors on LHS that we suggested for outreach And then bifurcate RHS into 3 buckets: Interested / Not interested / Awaiting feedback First bucket would have no names Encompass a pass Speaking to United on Friday Tenet encompass and HCA all no LGP and KKR a no so far Cd&r also a no Potential Q&A From Bob Ortenzio to Special Committee ◼ Valuation — Question: Based on diligence done to date, we’re prepared to submit a revised proposal of $[ ] per share. Is that at a level the Committee would transact at? We’ve done a lot of our value-driving diligence to date and think we can move quickly towards a transaction. – Answer: – I appreciate you sharing that perspective with me and I’ll share that with the rest of the Committee and our advisors. – As you know, this is going to make the Committee’s decision quite difficult based on the current management forecast. – [As appropriate] The management forecast is the same forecast we discussed as a Board last October, before your offer. Can you help me understand what has changed about your view on the forecast? — Question: Can you give me a bit more color on the Committee’s current valuation expectations? – Answer: – Our focus remains on maximizing shareholder value, which includes evaluating your proposal as well as other alternatives including our status quo path as a public company. – You have management’s forecast, and I’m sure you can understand the value implications of that. ◼ Process-Related — Question: We’ve been working as quickly as possible and pushing our advisors to wrap up their diligence. Assuming we can continue to close out any outstanding questions our team has, we’d like to be in a position to announce a transaction as soon as the company’s Q4 / FY 2025 earnings call on Thursday, February 19th. Do you think we can execute on that timeline? – Answer: – As you know, we continue to evaluate all opportunities that can enhance value for shareholders. – We would need to review a revised written proposal that outlines your revised proposal and specifically what diligence remains outstanding to determine appropriate next steps from here . – [As appropriate] Practically speaking, announcing a transaction on February 19th is challenging, and I’m sure you’d agree that doing this quickly cannot come at the expense of doing this the right way. — Question: Are there other parties that you’re engaging with? Do you have other offers you’re evaluating? – Answer: – I can’t comment on that, but know that we are working diligently to ensure that we comprehensively evaluate all of the company’s potential paths forward. – We will do what’s best for Select’s shareholders in evaluating strategic alternatives. — Question: We need greater focus from management to determine whether there is a transaction to do here. Can you direct management to be more engaged? – Answer: – The management team has been working hard to be responsive to your questions, which have included an in-person management presentation, 10 diligence calls this week, and written responses to the questions you’ve shared. – We also think it is important that management remain focused on preparing for the upcoming earnings release – that will be an opportunity to hear perspectives from shareholders on potential paths forward as well. |
| 16 Confidential, Preliminary & Highly Illustrative for Discussion Purposes A Appendix |
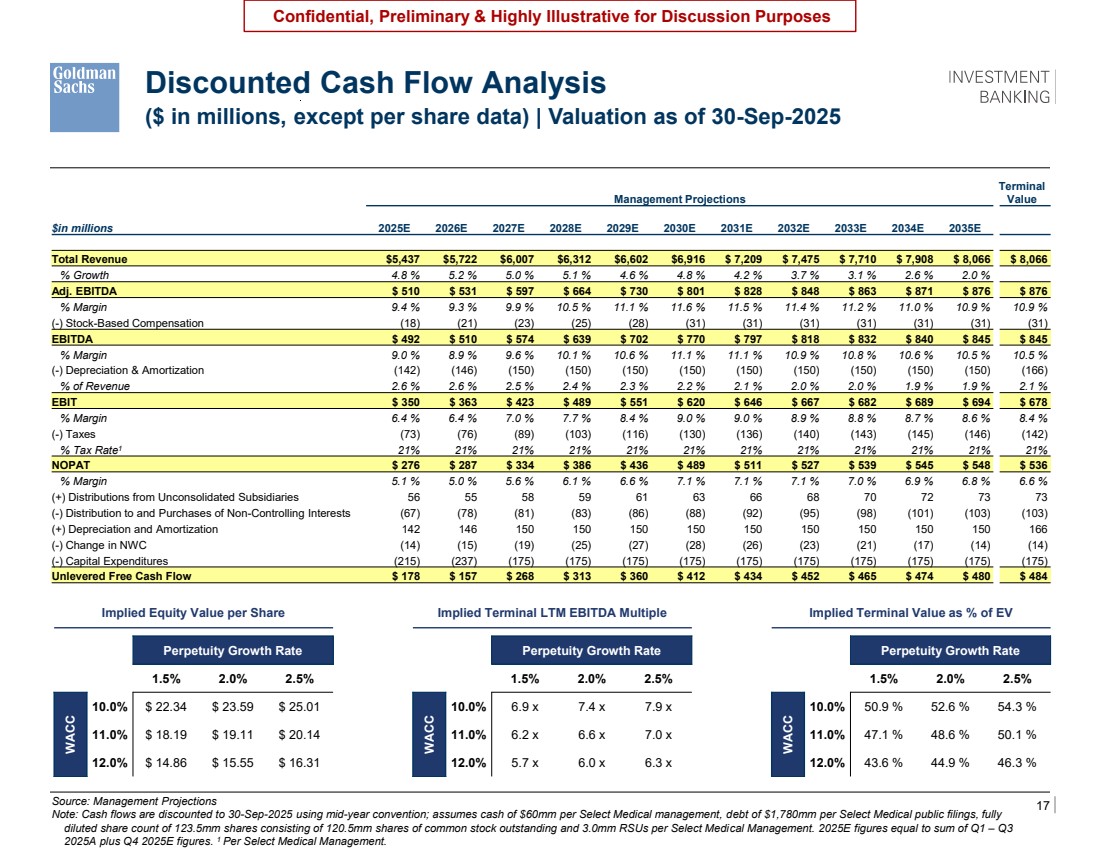
| 17 Confidential, Preliminary & Highly Illustrative for Discussion Purposes Source: Management Projections Note: Cash flows are discounted to 30-Sep-2025 using mid-year convention; assumes cash of $60mm per Select Medical management, debt of $1,780mm per Select Medical public filings, fully diluted share count of 123.5mm shares consisting of 120.5mm shares of common stock outstanding and 3.0mm RSUs per Select Medical Management. 2025E figures equal to sum of Q1 – Q3 2025A plus Q4 2025E figures. 1 Per Select Medical Management. Discounted Cash Flow Analysis ($ in millions, except per share data) | Valuation as of 30-Sep-2025 Management Projections Terminal Value $in millions 2025E 2026E 2027E 2028E 2029E 2030E 2031E 2032E 2033E 2034E 2035E Total Revenue $5,437 $5,722 $6,007 $6,312 $6,602 $6,916 $ 7,209 $ 7,475 $ 7,710 $ 7,908 $ 8,066 $ 8,066 % Growth 4.8 % 5.2 % 5.0 % 5.1 % 4.6 % 4.8 % 4.2 % 3.7 % 3.1 % 2.6 % 2.0 % Adj. EBITDA $ 510 $ 531 $ 597 $ 664 $ 730 $ 801 $ 828 $ 848 $ 863 $ 871 $ 876 $ 876 % Margin 9.4 % 9.3 % 9.9 % 10.5 % 11.1 % 11.6 % 11.5 % 11.4 % 11.2 % 11.0 % 10.9 % 10.9 % (-) Stock-Based Compensation (18) (21) (23) (25) (28) (31) (31) (31) (31) (31) (31) (31) EBITDA $ 492 $ 510 $ 574 $ 639 $ 702 $ 770 $ 797 $ 818 $ 832 $ 840 $ 845 $ 845 % Margin 9.0 % 8.9 % 9.6 % 10.1 % 10.6 % 11.1 % 11.1 % 10.9 % 10.8 % 10.6 % 10.5 % 10.5 % (-) Depreciation & Amortization (142) (146) (150) (150) (150) (150) (150) (150) (150) (150) (150) (166) % of Revenue 2.6 % 2.6 % 2.5 % 2.4 % 2.3 % 2.2 % 2.1 % 2.0 % 2.0 % 1.9 % 1.9 % 2.1 % EBIT $ 350 $ 363 $ 423 $ 489 $ 551 $ 620 $ 646 $ 667 $ 682 $ 689 $ 694 $ 678 % Margin 6.4 % 6.4 % 7.0 % 7.7 % 8.4 % 9.0 % 9.0 % 8.9 % 8.8 % 8.7 % 8.6 % 8.4 % (-) Taxes (73) (76) (89) (103) (116) (130) (136) (140) (143) (145) (146) (142) % Tax Rate1 21% 21% 21% 21% 21% 21% 21% 21% 21% 21% 21% 21% NOPAT $ 276 $ 287 $ 334 $ 386 $ 436 $ 489 $ 511 $ 527 $ 539 $ 545 $ 548 $ 536 % Margin 5.1 % 5.0 % 5.6 % 6.1 % 6.6 % 7.1 % 7.1 % 7.1 % 7.0 % 6.9 % 6.8 % 6.6 % (+) Distributions from Unconsolidated Subsidiaries 56 55 58 59 61 63 66 68 70 72 73 73 (-) Distribution to and Purchases of Non-Controlling Interests (67) (78) (81) (83) (86) (88) (92) (95) (98) (101) (103) (103) (+) Depreciation and Amortization 142 146 150 150 150 150 150 150 150 150 150 166 (-) Change in NWC (14) (15) (19) (25) (27) (28) (26) (23) (21) (17) (14) (14) (-) Capital Expenditures (215) (237) (175) (175) (175) (175) (175) (175) (175) (175) (175) (175) Unlevered Free Cash Flow $ 178 $ 157 $ 268 $ 313 $ 360 $ 412 $ 434 $ 452 $ 465 $ 474 $ 480 $ 484 Implied Equity Value per Share Perpetuity Growth Rate 20.4 x 1.5% 2.0% 2.5% WACC 10.0% $ 22.34 $ 23.59 $ 25.01 11.0% $ 18.19 $ 19.11 $ 20.14 12.0% $ 14.86 $ 15.55 $ 16.31 Implied Terminal LTM EBITDA Multiple Perpetuity Growth Rate 6.6 x 1.5% 2.0% 2.5% WACC 10.0% 6.9 x 7.4 x 7.9 x 11.0% 6.2 x 6.6 x 7.0 x 12.0% 5.7 x 6.0 x 6.3 x Implied Terminal Value as % of EV Perpetuity Growth Rate 0.7 % 1.5% 2.0% 2.5% WACC 10.0% 50.9 % 52.6 % 54.3 % 11.0% 47.1 % 48.6 % 50.1 % 12.0% 43.6 % 44.9 % 46.3 % |
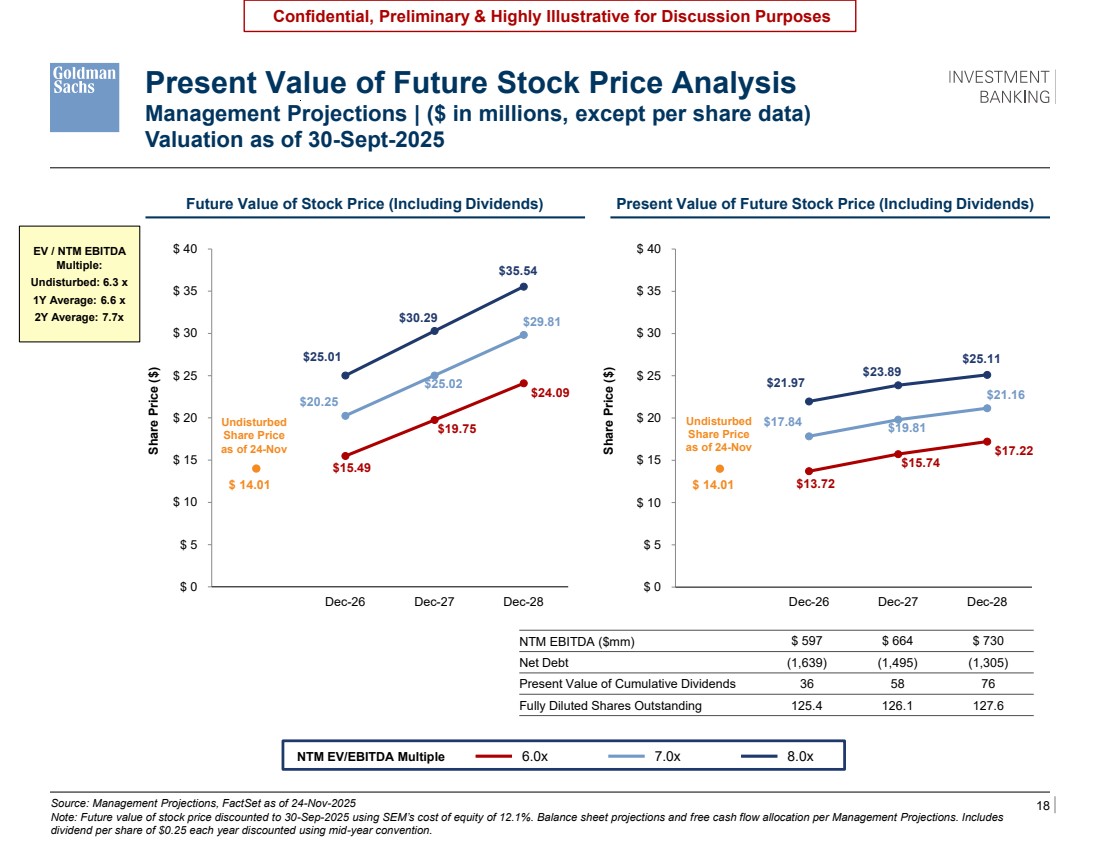
| 18 Confidential, Preliminary & Highly Illustrative for Discussion Purposes Source: Management Projections, FactSet as of 24-Nov-2025 Note: Future value of stock price discounted to 30-Sep-2025 using SEM’s cost of equity of 12.1%. Balance sheet projections and free cash flow allocation per Management Projections. Includes dividend per share of $0.25 each year discounted using mid-year convention. Present Value of Future Stock Price Analysis Management Projections | ($ in millions, except per share data) Valuation as of 30-Sept-2025 o Run the 3 year average excluding Concentra (like from the earlier page and footnote this carefully – I think this will enable us to support 6.5x – 7.5x o The current multiple here should be re-labeled as “Undisturbed” and be as of November 24, 2025 which we say is 6.1x page 4. Would also flag we say undisturbed 2026E is 6.3x on page 20 based on consensus which I can’t quite tie to the 6.1x on page 4 $21.97 $23.89 $25.11 $17.84 $19.81 $21.16 $13.72 $15.74 $17.22 $ 14.01 $ 0 $ 5 $ 10 $ 15 $ 20 $ 25 $ 30 $ 35 $ 40 Sep-25 Dec-26 Dec-27 Dec-28 $25.01 $30.29 $35.54 $20.25 $25.02 $29.81 $15.49 $19.75 $24.09 $ 14.01 $ 0 $ 5 $ 10 $ 15 $ 20 $ 25 $ 30 $ 35 $ 40 Sep-25 Dec-26 Dec-27 Dec-28 NTM EBITDA ($mm) $ 597 $ 664 $ 730 Net Debt (1,639) (1,495) (1,305) Present Value of Cumulative Dividends 36 58 76 Fully Diluted Shares Outstanding 125.4 126.1 127.6 Future Value of Stock Price (Including Dividends) Present Value of Future Stock Price (Including Dividends) Share Price ($) Share Price ($) NTM EV/EBITDA Multiple 6.0x 7.0x 8.0x Undisturbed Share Price as of 24-Nov EV / NTM EBITDA Multiple: Undisturbed: 6.3 x 1Y Average: 6.6 x 2Y Average: 7.7x Undisturbed Share Price as of 24-Nov |
| 19 Confidential, Preliminary & Highly Illustrative for Discussion Purposes 11.2 x 9.8 x 7.9 x 7.7 x 8.2 x 7.6 x 6.7 x 6.4 x 6.2 x Kindred Healthcare / Centerre Healthcare Corporation HealthSouth Corporation / Reliant Hospital Partners Genesis Healthcare / Revera Kindred Healthcare / RehabCare Group Kindred Healthcare WholeCo Acquisition Select Medical Holdings Corporation / Regency Hospital Company, L.L.C. Kindred Healthcare, Inc. / Certain facilities owned by Vista Healthcare Holdings, LLC Vibra Healthcare, LLC / Certain facilities owned by Kindred Healthcare, Inc. RehabCare Group, Inc. / Triumph HealthCare Holdings, Inc. ($ in millions) | LTM EV / EBITDA Source: Company filings and press releases 1 Includes $730mm cash purchase price and $210mm assumed lease obligations. 2 Kindred purchased 5 long-term acute care hospitals from Vista. 3 Vibra purchased 14 long-term acute care hospitals, 1 inpatient rehab hospital, and 1 skilled nursing facility from Kindred. Acquirer Target Announcement Date 12-Nov-14 11-Jun-15 15-Jun-15 8-Feb-11 19-Dec-17 21-Jun-10 24-Aug-10 25-Apr-13 3-Nov-09 Enterprise Value $ 195 $ 940 $ 240 $ 1,300 $ 4,100 $ 210 $ 180 $ 166 $ 575 Rehab Median: 8.9 x Select Inpatient Rehabilitation and Long-Term Acute Care Precedent Transactions 1 2 3 LTAC Median: 6.7 x Combined Median: 7.7 x Rehabilitation Long-Term Acute Care TBU – adding Scion Health, scrubbing incremental Deal Logic run for additional names |
| 20 Confidential, Preliminary & Highly Illustrative for Discussion Purposes One-Day Premium of U.S. Healthcare Deals | 2021 – 2025 Source: FactSet as of 04-Feb-2026 Note: Excludes biotech transactions. N = 13 Median: 29 % Mean: 31 % 25th Percentile: 23 % 75th Percentile: 36 % Precedent Premia Paid Analysis Cash Only | $1 - $5bn TBU – Price update, show format with lines across page showing 25th/75th percentile lines across page TBU – ISG pulling updated deal run 2 1 4 3 1 0 1 1 0-10% 10-20% 20-30% 30-40% 40-50% 50-60% 60-70% 70-80% |
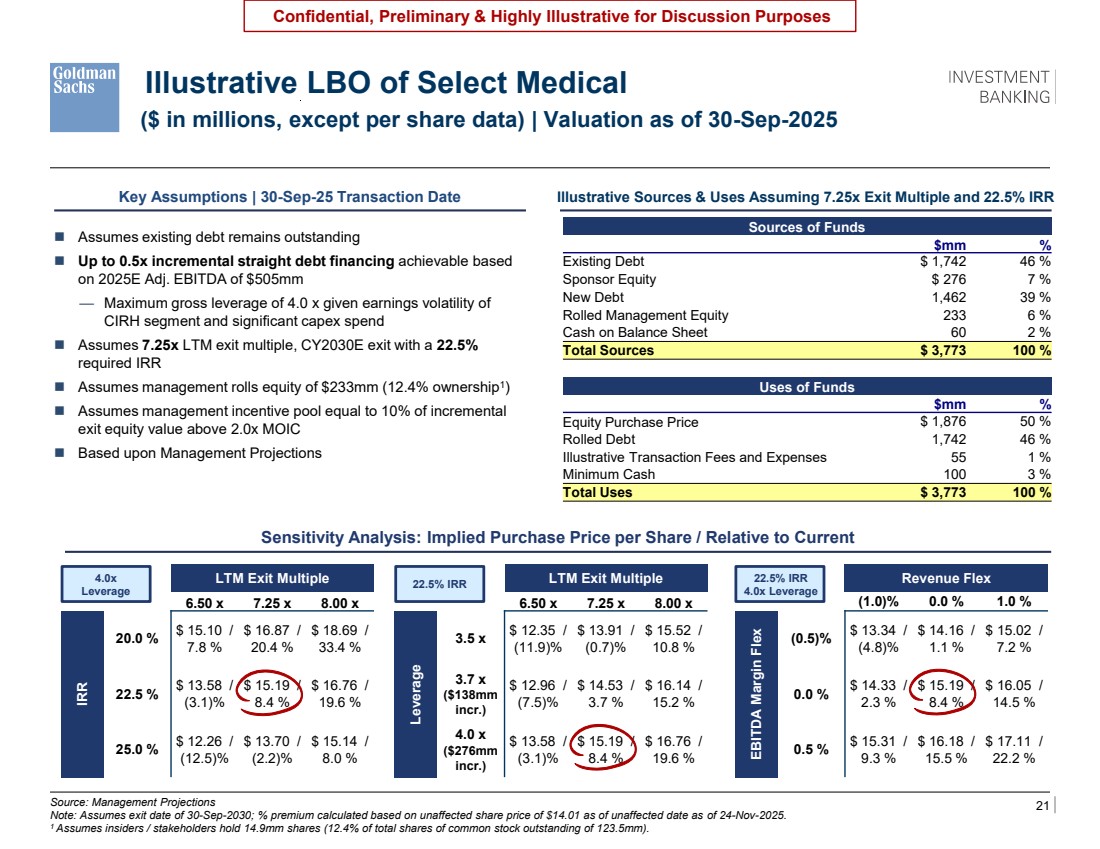
| 21 Confidential, Preliminary & Highly Illustrative for Discussion Purposes Illustrative LBO of Select Medical ($ in millions, except per share data) | Valuation as of 30-Sep-2025 Source: Management Projections Note: Assumes exit date of 30-Sep-2030; % premium calculated based on unaffected share price of $14.01 as of unaffected date as of 24-Nov-2025. 1 Assumes insiders / stakeholders hold 14.9mm shares (12.4% of total shares of common stock outstanding of 123.5mm). o Confirm that this includes a separate management incentive pool that pays 10% of everything above 2.0x MOIC LTM Exit Multiple $ 18.15 6.50 x 7.25 x 8.00 x Leverage 3.5 x $ 12.35 / (11.9)% $ 13.91 / (0.7)% $ 15.52 / 10.8 % 3.7 x ($138mm incr.) $ 12.96 / (7.5)% $ 14.53 / 3.7 % $ 16.14 / 15.2 % 4.0 x ($276mm incr.) $ 13.58 / (3.1)% $ 15.19 / 8.4 % $ 16.76 / 19.6 % Revenue Flex 18.2 x (1.0)% 0.0 % 1.0 % EBITDA Margin Flex (0.5)% $ 13.34 / (4.8)% $ 14.16 / 1.1 % $ 15.02 / 7.2 % 0.0 % $ 14.33 / 2.3 % $ 15.19 / 8.4 % $ 16.05 / 14.5 % 0.5 % $ 15.31 / 9.3 % $ 16.18 / 15.5 % $ 17.11 / 22.2 % LTM Exit Multiple $ 18.15 6.50 x 7.25 x 8.00 x IRR 20.0 % $ 15.10 / 7.8 % $ 16.87 / 20.4 % $ 18.69 / 33.4 % 22.5 % $ 13.58 / (3.1)% $ 15.19 / 8.4 % $ 16.76 / 19.6 % 25.0 % $ 12.26 / (12.5)% $ 13.70 / (2.2)% $ 15.14 / 8.0 % Key Assumptions | 30-Sep-25 Transaction Date Illustrative Sources & Uses Assuming 7.25x Exit Multiple and 22.5% IRR ◼ Assumes existing debt remains outstanding ◼ Up to 0.5x incremental straight debt financing achievable based on 2025E Adj. EBITDA of $505mm — Maximum gross leverage of 4.0 x given earnings volatility of CIRH segment and significant capex spend ◼ Assumes 7.25x LTM exit multiple, CY2030E exit with a 22.5% required IRR ◼ Assumes management rolls equity of $233mm (12.4% ownership1 ) ◼ Assumes management incentive pool equal to 10% of incremental exit equity value above 2.0x MOIC ◼ Based upon Management Projections Sensitivity Analysis: Implied Purchase Price per Share / Relative to Current 4.0x Leverage 22.5% IRR 22.5% IRR 4.0x Leverage Sources of Funds $mm % Existing Debt $ 1,742 46 % Sponsor Equity $ 276 7 % New Debt 1,462 39 % Rolled Management Equity 233 6 % Cash on Balance Sheet 60 2 % Total Sources $ 3,773 100 % Uses of Funds $mm % Equity Purchase Price $ 1,876 50 % Rolled Debt 1,742 46 % Illustrative Transaction Fees and Expenses 55 1 % Minimum Cash 100 3 % Total Uses $ 3,773 100 % |
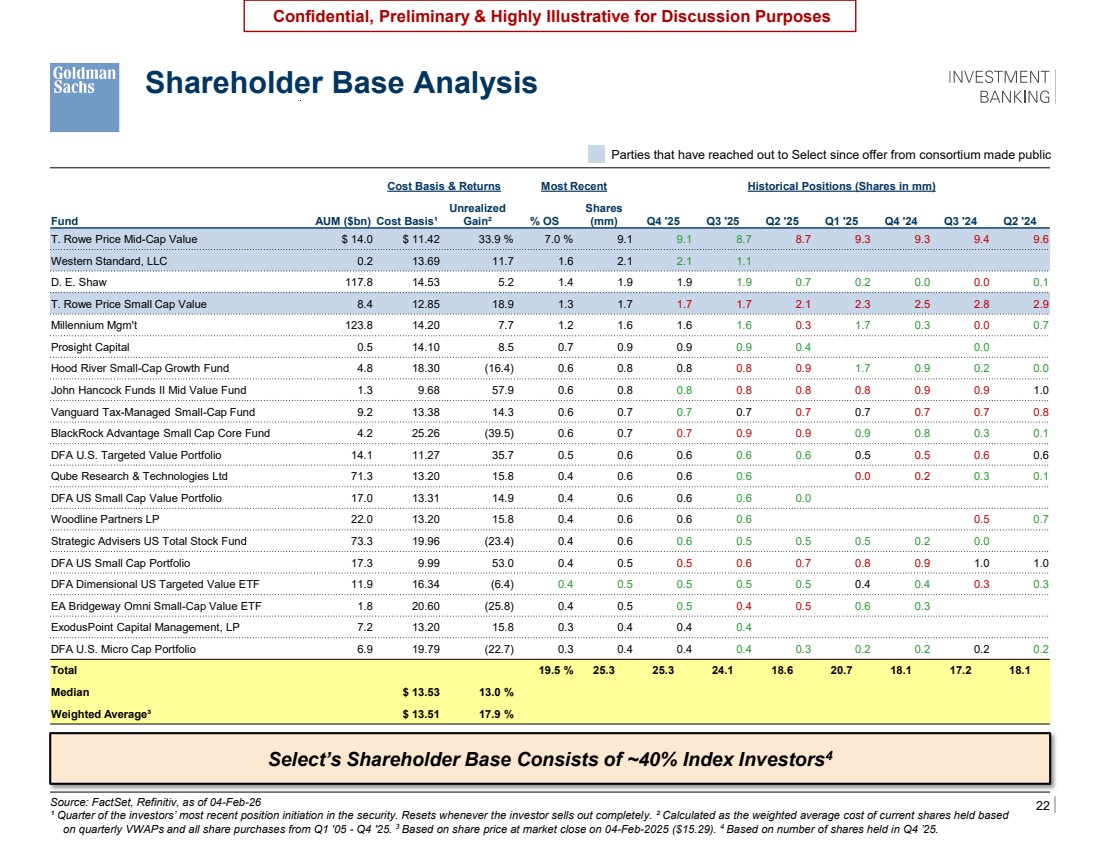
| 22 Confidential, Preliminary & Highly Illustrative for Discussion Purposes Shareholder Base Analysis Source: FactSet, Refinitiv, as of 04-Feb-26 ¹ Quarter of the investors’ most recent position initiation in the security. Resets whenever the investor sells out completely. ² Calculated as the weighted average cost of current shares held based on quarterly VWAPs and all share purchases from Q1 '05 - Q4 '25. 3 Based on share price at market close on 04-Feb-2025 ($15.29). 4 Based on number of shares held in Q4 ’25. Parties that have reached out to Select since offer from consortium made public Western Standard says they own 2.2% - can you check why this says 0.8% • Page 23 – Michael is going to want more here. (put this page after page 8) • Can you reach out to ASA and ask them if they can help us look at the shareholder base for Select and identify “paths to a successful M&A transaction” • Then, to this page, can you add the breakout of index v. actives v. other types of shareholders? What I think it’s going to show is that index shareholders are the majority of this companies register which should make things easier for us (run that by ASA to get their perspective as well – Matt Kim) – ideally we can get his input before the 6pm call Cost Basis & Returns Most Recent Historical Positions (Shares in mm) Fund AUM ($bn) Cost Basis¹ Unrealized Gain² % OS Shares (mm) Q4 '25 Q3 '25 Q2 '25 Q1 '25 Q4 '24 Q3 '24 Q2 '24 T. Rowe Price Mid-Cap Value $ 14.0 $ 11.42 33.9 % 7.0 % 9.1 9.1 8.7 8.7 9.3 9.3 9.4 9.6 Western Standard, LLC 0.2 13.69 11.7 1.6 2.1 2.1 1.1 D. E. Shaw 117.8 14.53 5.2 1.4 1.9 1.9 1.9 0.7 0.2 0.0 0.0 0.1 T. Rowe Price Small Cap Value 8.4 12.85 18.9 1.3 1.7 1.7 1.7 2.1 2.3 2.5 2.8 2.9 Millennium Mgm't 123.8 14.20 7.7 1.2 1.6 1.6 1.6 0.3 1.7 0.3 0.0 0.7 Prosight Capital 0.5 14.10 8.5 0.7 0.9 0.9 0.9 0.4 0.0 Hood River Small-Cap Growth Fund 4.8 18.30 (16.4) 0.6 0.8 0.8 0.8 0.9 1.7 0.9 0.2 0.0 John Hancock Funds II Mid Value Fund 1.3 9.68 57.9 0.6 0.8 0.8 0.8 0.8 0.8 0.9 0.9 1.0 Vanguard Tax-Managed Small-Cap Fund 9.2 13.38 14.3 0.6 0.7 0.7 0.7 0.7 0.7 0.7 0.7 0.8 BlackRock Advantage Small Cap Core Fund 4.2 25.26 (39.5) 0.6 0.7 0.7 0.9 0.9 0.9 0.8 0.3 0.1 DFA U.S. Targeted Value Portfolio 14.1 11.27 35.7 0.5 0.6 0.6 0.6 0.6 0.5 0.5 0.6 0.6 Qube Research & Technologies Ltd 71.3 13.20 15.8 0.4 0.6 0.6 0.6 0.0 0.2 0.3 0.1 DFA US Small Cap Value Portfolio 17.0 13.31 14.9 0.4 0.6 0.6 0.6 0.0 Woodline Partners LP 22.0 13.20 15.8 0.4 0.6 0.6 0.6 0.5 0.7 Strategic Advisers US Total Stock Fund 73.3 19.96 (23.4) 0.4 0.6 0.6 0.5 0.5 0.5 0.2 0.0 DFA US Small Cap Portfolio 17.3 9.99 53.0 0.4 0.5 0.5 0.6 0.7 0.8 0.9 1.0 1.0 DFA Dimensional US Targeted Value ETF 11.9 16.34 (6.4) 0.4 0.5 0.5 0.5 0.5 0.4 0.4 0.3 0.3 EA Bridgeway Omni Small-Cap Value ETF 1.8 20.60 (25.8) 0.4 0.5 0.5 0.4 0.5 0.6 0.3 ExodusPoint Capital Management, LP 7.2 13.20 15.8 0.3 0.4 0.4 0.4 DFA U.S. Micro Cap Portfolio 6.9 19.79 (22.7) 0.3 0.4 0.4 0.4 0.3 0.2 0.2 0.2 0.2 Total 19.5 % 25.3 25.3 24.1 18.6 20.7 18.1 17.2 18.1 Median $ 13.53 13.0 % Weighted Average³ $ 13.51 17.9 % Select’s Shareholder Base Consists of ~40% Index Investors4 |
| 23 Confidential, Preliminary & Highly Illustrative for Discussion Purposes Disclaimer These materials have been prepared and are provided by Goldman Sachs on a confidential basis solely for the information and assistance of the Special Committee of Select Medical Holdings Corporation (the "Company") in connection with their consideration of the matters referred to herein. These materials and Goldman Sachs’ presentation relating to these materials (the “Confidential Information”) may not be disclosed to the third party or circulated or referred to publicly or used for or relied upon for any other purpose without the prior written consent of Goldman Sachs. The Confidential Information was not prepared with a view to public disclosure or to conform to any disclosure standards under any state, federal or international securities laws or other laws, rules or regulations, and Goldman Sachs does not take any responsibility for the use of the Confidential Information by persons other than those set forth above. Notwithstanding anything in this Confidential Information to the contrary, the Company may disclose to any person the US federal income and state income tax treatment and tax structure of any transaction described herein and all materials of any kind (including tax opinions and other tax analyses) that are provided to the Company relating to such tax treatment and tax structure, without Goldman Sachs imposing any limitation of any kind. The Confidential Information has been prepared by Goldman Sachs Investment Banking and is not a product of Goldman Sachs Global Investment Research. Goldman Sachs and its affiliates are engaged in advisory, underwriting and financing, principal investing, sales and trading, research, investment management and other financial and non-financial activities and services for various persons and entities. Goldman Sachs and its affiliates and employees, and funds or other entities they manage or in which they invest or have other economic interest or with which they co-invest, may at any time purchase, sell, hold or vote long or short positions and investments in securities, derivatives, loans, commodities, currencies, credit default swaps and other financial instruments of the Company, any other party to any transaction and any of their respective affiliates or any currency or commodity that may be involved in any transaction. Goldman Sachs Investment Banking maintains regular, ordinary course client service dialogues with clients and potential clients to review events, opportunities, and conditions in particular sectors and industries and, in that connection, Goldman Sachs may make reference to the Company, but Goldman Sachs will not disclose any confidential information received from the Company. The Confidential Information has been prepared based on historical financial information, forecasts and other information obtained by Goldman Sachs from publicly available sources, the management of the Company or other sources (approved for our use by the Company in the case of information from management and non-public information). In preparing the Confidential Information, Goldman Sachs has relied upon and assumed, without assuming any responsibility for independent verification, the accuracy and completeness of all of the financial, legal, regulatory, tax, accounting and other information provided to, discussed with or reviewed by us, and Goldman Sachs does not assume any liability for any such information. Goldman Sachs does not provide accounting, tax, legal or regulatory advice. Goldman Sachs has not made an independent evaluation or appraisal of the assets and liabilities (including any contingent, derivative or off-balance sheet assets and liabilities) of the Company or any other party to any transaction or any of their respective affiliates and has no obligation to evaluate the solvency of the Company or any other party to any transaction under any state or federal laws relating to bankruptcy, insolvency or similar matters. The analyses contained in the Confidential Information do not purport to be appraisals nor do they necessarily reflect the prices at which businesses or securities actually may be sold or purchased. Goldman Sachs’ role in any due diligence review is limited solely to performing such a review as it shall deem necessary to support its own advice and analysis and shall not be on behalf of the Company. Analyses based upon forecasts of future results are not necessarily indicative of actual future results, which may be significantly more or less favorable than suggested by these analyses, and Goldman Sachs does not assume responsibility if future results are materially different from those forecast. The Confidential Information does not address the underlying business decision of the Company to engage in any transaction, or the relative merits of any transaction or strategic alternative referred to herein as compared to any other transaction or alternative that may be available to the Company. The Confidential Information is necessarily based on economic, monetary, market and other conditions as in effect on, and the information made available to Goldman Sachs as of, the date of such Confidential Information and Goldman Sachs assumes no responsibility for updating or revising the Confidential Information based on circumstances, developments or events occurring after such date. The Confidential Information does not constitute any opinion, nor does the Confidential Information constitute a recommendation to the Board, any security holder of the Company or any other person as to how to vote or act with respect to any transaction or any other matter. The Confidential Information, including this disclaimer, are subject to, and governed by, any written agreement between the Company, the Board and/or any committee thereof, on the hand, and Goldman Sachs, on the other hand. The Confidential Information does not address, nor does Goldman Sachs express any view as to, the potential effects of volatility in the credit, financial and stock markets on the Company, any other party to any transaction or any transaction. |