| Confidential, Preliminary & Highly Illustrative for Discussion Purposes Discussion Materials for The Special Committee of Goldman Sachs & Co. LLC March 2026 Goldman Sachs does not provide accounting, tax, or legal advice. Notwithstanding anything in this document to the contrary, and except as required to enable compliance with applicable securities law, you (and each of your employees, representatives, and other agents) may disclose to any and all persons the US federal income and state tax treatment and tax structure of the transaction and all materials of any kind (including tax opinions and other tax analyses) that are provided to you relating to such tax treatment and tax structure, without Goldman Sachs imposing any limitation of any kind. |
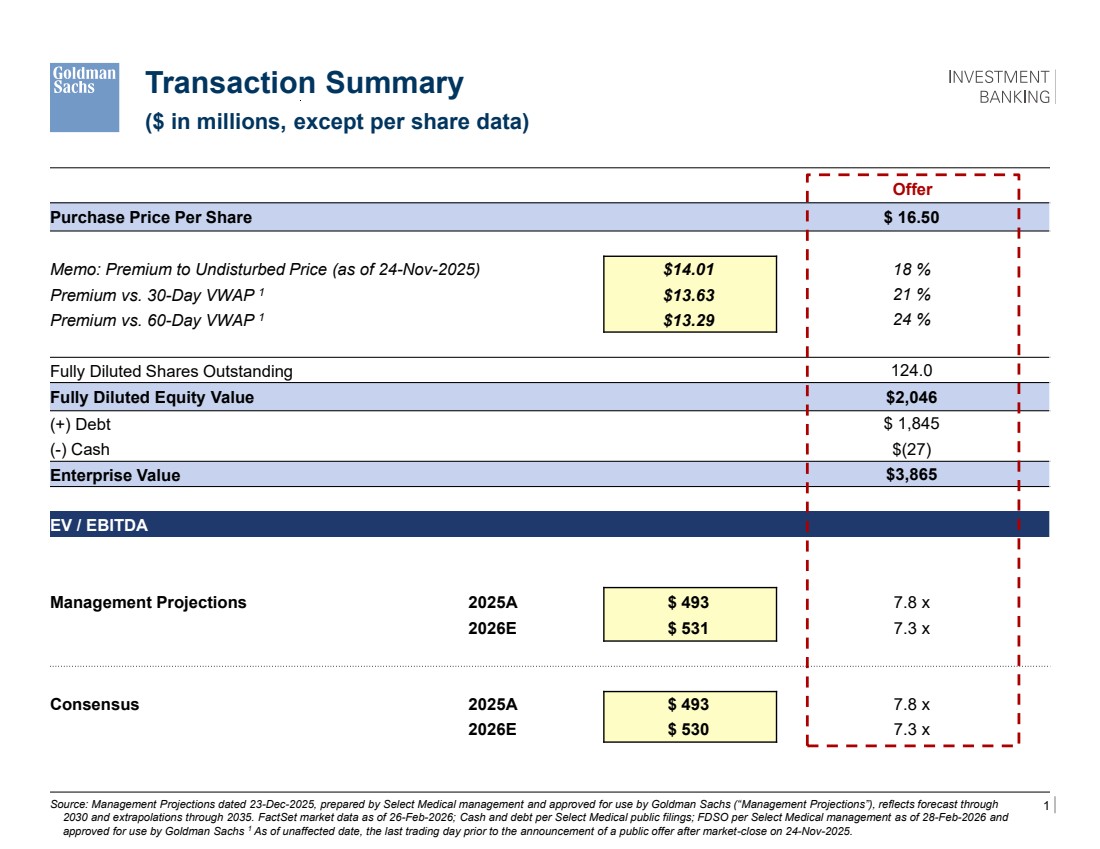
| 1 Confidential, Preliminary & Highly Illustrative for Discussion Purposes Offer Purchase Price Per Share $ 16.50 Memo: Premium to Undisturbed Price (as of 24-Nov-2025) $14.01 18 % Premium vs. 30-Day VWAP 1 $13.63 21 % Premium vs. 60-Day VWAP 1 $13.29 24 % Fully Diluted Shares Outstanding 124.0 Fully Diluted Equity Value $2,046 (+) Debt $ 1,845 (-) Cash $(27) Enterprise Value $3,865 EV / EBITDA Management Projections 2025A $ 493 7.8 x 2026E $ 531 7.3 x Consensus 2025A $ 493 7.8 x 2026E $ 530 7.3 x Source: Management Projections dated 23-Dec-2025, prepared by Select Medical management and approved for use by Goldman Sachs (“Management Projections”), reflects forecast through 2030 and extrapolations through 2035. FactSet market data as of 26-Feb-2026; Cash and debt per Select Medical public filings; FDSO per Select Medical management as of 28-Feb-2026 and approved for use by Goldman Sachs 1 As of unaffected date, the last trading day prior to the announcement of a public offer after market-close on 24-Nov-2025. Transaction Summary ($ in millions, except per share data) |
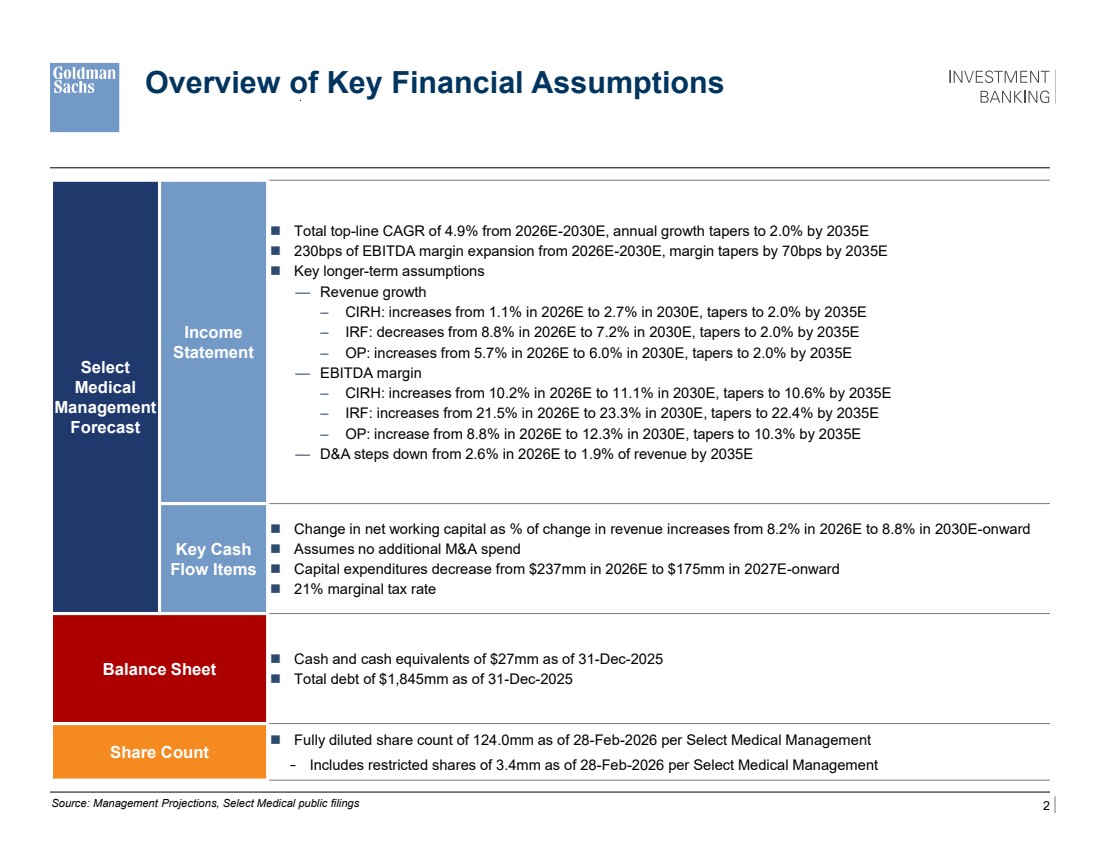
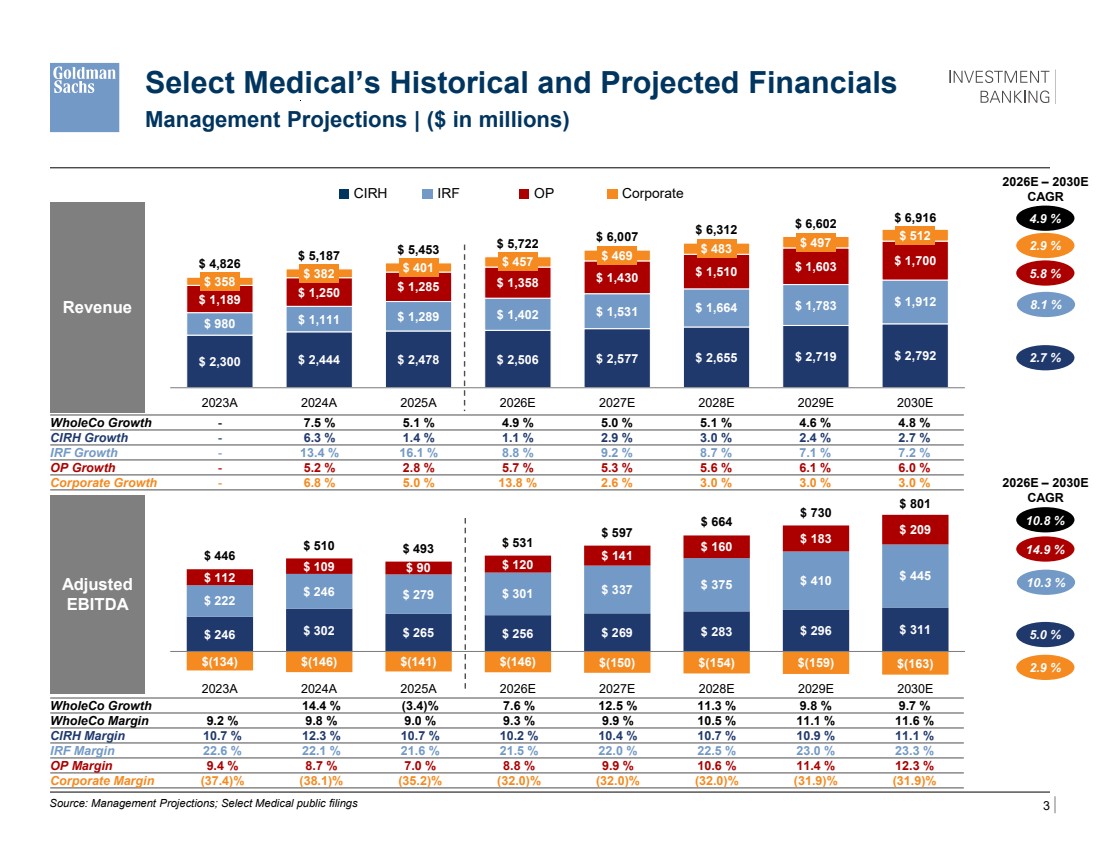
| 2 Confidential, Preliminary & Highly Illustrative for Discussion Purposes Source: Management Projections, Select Medical public filings Select Medical Management Forecast Income Statement ◼ Total top-line CAGR of 4.9% from 2026E-2030E, annual growth tapers to 2.0% by 2035E ◼ 230bps of EBITDA margin expansion from 2026E-2030E, margin tapers by 70bps by 2035E ◼ Key longer-term assumptions — Revenue growth – CIRH: increases from 1.1% in 2026E to 2.7% in 2030E, tapers to 2.0% by 2035E – IRF: decreases from 8.8% in 2026E to 7.2% in 2030E, tapers to 2.0% by 2035E – OP: increases from 5.7% in 2026E to 6.0% in 2030E, tapers to 2.0% by 2035E — EBITDA margin – CIRH: increases from 10.2% in 2026E to 11.1% in 2030E, tapers to 10.6% by 2035E – IRF: increases from 21.5% in 2026E to 23.3% in 2030E, tapers to 22.4% by 2035E – OP: increase from 8.8% in 2026E to 12.3% in 2030E, tapers to 10.3% by 2035E — D&A steps down from 2.6% in 2026E to 1.9% of revenue by 2035E Key Cash Flow Items ◼ Change in net working capital as % of change in revenue increases from 8.2% in 2026E to 8.8% in 2030E-onward ◼ Assumes no additional M&A spend ◼ Capital expenditures decrease from $237mm in 2026E to $175mm in 2027E-onward ◼ 21% marginal tax rate Balance Sheet ◼ Cash and cash equivalents of $27mm as of 31-Dec-2025 ◼ Total debt of $1,845mm as of 31-Dec-2025 Share Count ◼ Fully diluted share count of 124.0mm as of 28-Feb-2026 per Select Medical Management - Includes restricted shares of 3.4mm as of 28-Feb-2026 per Select Medical Management Overview of Key Financial Assumptions |
| 3 Confidential, Preliminary & Highly Illustrative for Discussion Purposes $ 246 $ 302 $ 265 $ 256 $ 269 $ 283 $ 296 $ 311 $ 222 $ 246 $ 279 $ 301 $ 337 $ 375 $ 410 $ 112 $ 445 $ 109 $ 90 $ 120 $ 141 $ 160 $ 183 $ 209 $(134) $(146) $(141) $(146) $(150) $(154) $(159) $(163) $ 446 $ 510 $ 493 $ 531 $ 597 $ 664 $ 730 $ 801 2023A 2024A 2025A 2026E 2027E 2028E 2029E 2030E $ 2,300 $ 2,444 $ 2,478 $ 2,506 $ 2,577 $ 2,655 $ 2,719 $ 2,792 $ 980 $ 1,189 $ 1,111 $ 1,289 $ 1,402 $ 1,531 $ 1,664 $ 1,783 $ 1,912 $ 1,250 $ 1,285 $ 1,358 $ 1,430 $ 1,510 $ 1,603 $ 1,700 $ 358 $ 382 $ 401 $ 457 $ 469 $ 483 $ 497 $ 512 $ 4,826 $ 5,187 $ 5,453 $ 5,722 $ 6,007 $ 6,312 $ 6,602 $ 6,916 2023A 2024A 2025A 2026E 2027E 2028E 2029E 2030E Source: Management Projections; Select Medical public filings Revenue WholeCo Growth - 7.5 % 5.1 % 4.9 % 5.0 % 5.1 % 4.6 % 4.8 % CIRH Growth - 6.3 % 1.4 % 1.1 % 2.9 % 3.0 % 2.4 % 2.7 % IRF Growth - 13.4 % 16.1 % 8.8 % 9.2 % 8.7 % 7.1 % 7.2 % OP Growth - 5.2 % 2.8 % 5.7 % 5.3 % 5.6 % 6.1 % 6.0 % Corporate Growth - 6.8 % 5.0 % 13.8 % 2.6 % 3.0 % 3.0 % 3.0 % 5.8 % 2026E – 2030E CAGR Adjusted EBITDA Select Medical’s Historical and Projected Financials Management Projections | ($ in millions) OP 2.7 % WholeCo Growth 14.4 % (3.4)% 7.6 % 12.5 % 11.3 % 9.8 % 9.7 % WholeCo Margin 9.2 % 9.8 % 9.0 % 9.3 % 9.9 % 10.5 % 11.1 % 11.6 % CIRH Margin 10.7 % 12.3 % 10.7 % 10.2 % 10.4 % 10.7 % 10.9 % 11.1 % IRF Margin 22.6 % 22.1 % 21.6 % 21.5 % 22.0 % 22.5 % 23.0 % 23.3 % OP Margin 9.4 % 8.7 % 7.0 % 8.8 % 9.9 % 10.6 % 11.4 % 12.3 % Corporate Margin (37.4)% (38.1)% (35.2)% (32.0)% (32.0)% (32.0)% (31.9)% (31.9)% 8.1 % 2026E – 2030E CAGR CIRH IRF 2.9 % 4.9 % Corporate 14.9 % 5.0 % 10.3 % 10.8 % \\firmwide.corp.gs.com\ibdroot\projects\IBD-NY\sapient2025\977110_1\Presentations\2. Fairness Opinion Presentation\Excel\Broker Perspectives and Projections\Broker Perspectives and Projections_v02.xlsx 2.9 % 5.8 % 2025A – 2030E CAGR 2.7 % 8.1 % 2025A – 2030E CAGR 2.9% 4.9% 14.9 % 5.0% 10.3 % 10.8 % 2.9 % |
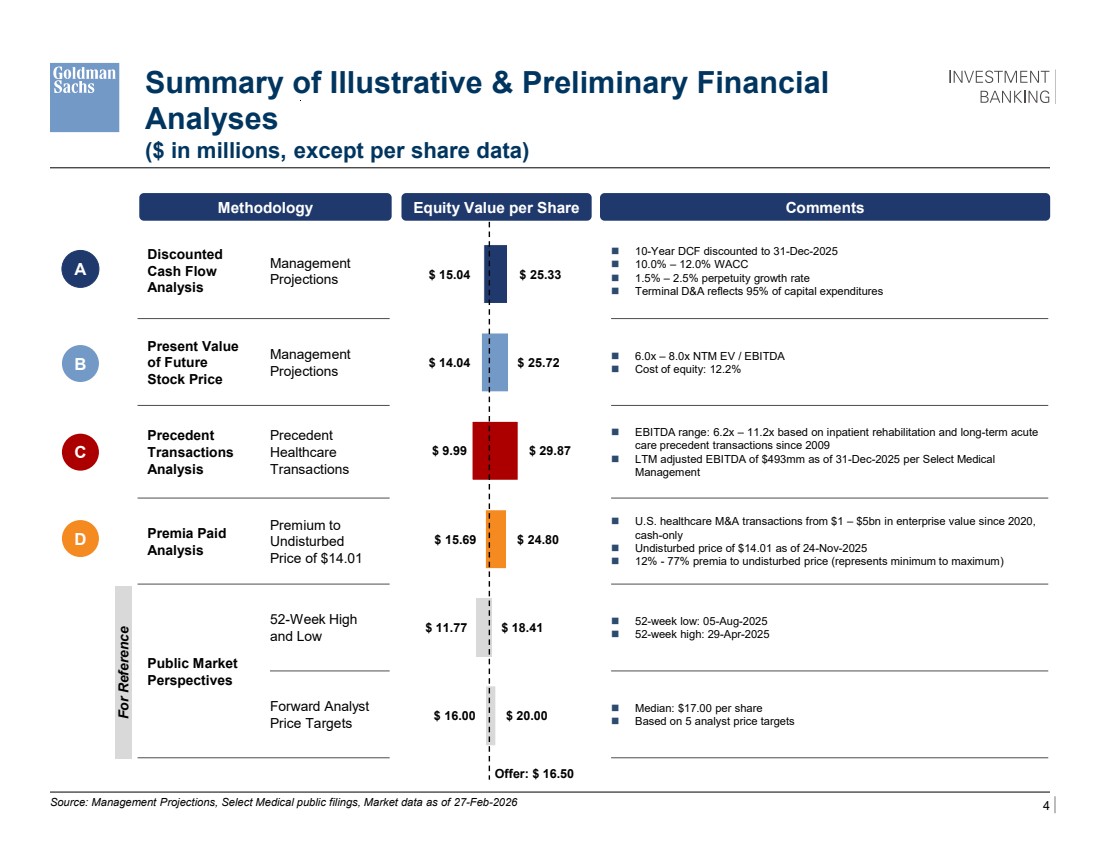
| 4 Confidential, Preliminary & Highly Illustrative for Discussion Purposes Discounted Cash Flow Analysis Management Projections ◼ 10-Year DCF discounted to 31-Dec-2025 ◼ 10.0% – 12.0% WACC ◼ 1.5% – 2.5% perpetuity growth rate ◼ Terminal D&A reflects 95% of capital expenditures Present Value of Future Stock Price Management Projections ◼ 6.0x – 8.0x NTM EV / EBITDA ◼ Cost of equity: 12.2% Precedent Transactions Analysis Precedent Healthcare Transactions ◼ EBITDA range: 6.2x – 11.2x based on inpatient rehabilitation and long-term acute care precedent transactions since 2009 ◼ LTM adjusted EBITDA of $493mm as of 31-Dec-2025 per Select Medical Management Premia Paid Analysis Premium to Undisturbed Price of $14.01 ◼ U.S. healthcare M&A transactions from $1 – $5bn in enterprise value since 2020, cash-only ◼ Undisturbed price of $14.01 as of 24-Nov-2025 ◼ 12% - 77% premia to undisturbed price (represents minimum to maximum) Public Market Perspectives 52-Week High and Low ◼ 52-week low: 05-Aug-2025 ◼ 52-week high: 29-Apr-2025 Forward Analyst Price Targets ◼ Median: $17.00 per share ◼ Based on 5 analyst price targets $ 15.04 $ 14.04 $ 9.99 $ 15.69 $ 11.77 $ 16.00 $ 25.33 $ 25.72 $ 29.87 $ 24.80 $ 18.41 $ 20.00 Summary of Illustrative & Preliminary Financial Analyses Methodology Equity Value per Share Comments Offer: $ 16.50 A B D Source: Management Projections, Select Medical public filings, Market data as of 27-Feb-2026 ($ in millions, except per share data) C For Reference oPV of FSP should be 15.20 – 22.28 The orange bubble should be undisturbed price of $14.01on page 19 oAdd a bullet the forward PTs which says CY2026E Consensus Median EBITDA is [ ]% above current Management estimates oLBO: Run the exit multiples at 6.5x – 8.0x with 7.25x at the midpoint |
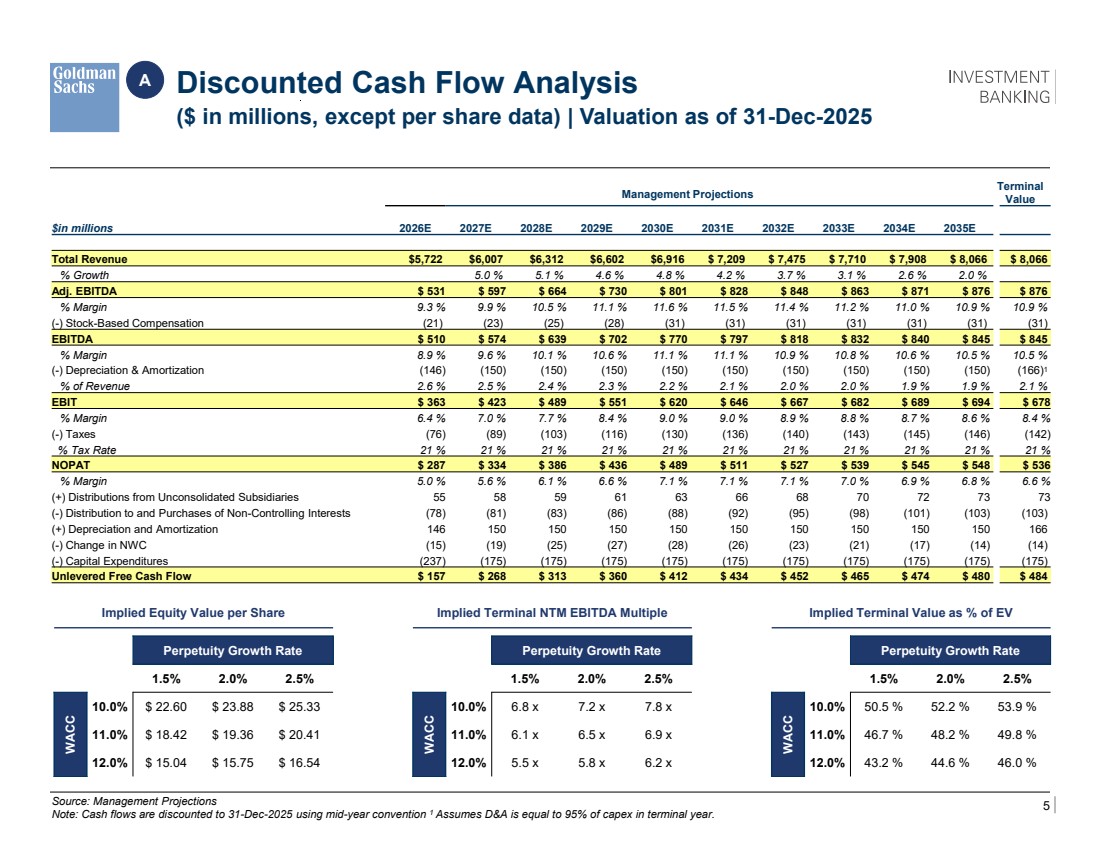
| 5 Confidential, Preliminary & Highly Illustrative for Discussion Purposes Source: Management Projections Note: Cash flows are discounted to 31-Dec-2025 using mid-year convention 1 Assumes D&A is equal to 95% of capex in terminal year. Discounted Cash Flow Analysis ($ in millions, except per share data) | Valuation as of 31-Dec-2025 A Management Projections Terminal Value $in millions 2026E 2027E 2028E 2029E 2030E 2031E 2032E 2033E 2034E 2035E Total Revenue $5,722 $6,007 $6,312 $6,602 $6,916 $ 7,209 $ 7,475 $ 7,710 $ 7,908 $ 8,066 $ 8,066 % Growth 5.0 % 5.1 % 4.6 % 4.8 % 4.2 % 3.7 % 3.1 % 2.6 % 2.0 % Adj. EBITDA $ 531 $ 597 $ 664 $ 730 $ 801 $ 828 $ 848 $ 863 $ 871 $ 876 $ 876 % Margin 9.3 % 9.9 % 10.5 % 11.1 % 11.6 % 11.5 % 11.4 % 11.2 % 11.0 % 10.9 % 10.9 % (-) Stock-Based Compensation (21) (23) (25) (28) (31) (31) (31) (31) (31) (31) (31) EBITDA $ 510 $ 574 $ 639 $ 702 $ 770 $ 797 $ 818 $ 832 $ 840 $ 845 $ 845 % Margin 8.9 % 9.6 % 10.1 % 10.6 % 11.1 % 11.1 % 10.9 % 10.8 % 10.6 % 10.5 % 10.5 % (-) Depreciation & Amortization (146) (150) (150) (150) (150) (150) (150) (150) (150) (150) (166)1 % of Revenue 2.6 % 2.5 % 2.4 % 2.3 % 2.2 % 2.1 % 2.0 % 2.0 % 1.9 % 1.9 % 2.1 % EBIT $ 363 $ 423 $ 489 $ 551 $ 620 $ 646 $ 667 $ 682 $ 689 $ 694 $ 678 % Margin 6.4 % 7.0 % 7.7 % 8.4 % 9.0 % 9.0 % 8.9 % 8.8 % 8.7 % 8.6 % 8.4 % (-) Taxes (76) (89) (103) (116) (130) (136) (140) (143) (145) (146) (142) % Tax Rate 21 % 21 % 21 % 21 % 21 % 21 % 21 % 21 % 21 % 21 % 21 % NOPAT $ 287 $ 334 $ 386 $ 436 $ 489 $ 511 $ 527 $ 539 $ 545 $ 548 $ 536 % Margin 5.0 % 5.6 % 6.1 % 6.6 % 7.1 % 7.1 % 7.1 % 7.0 % 6.9 % 6.8 % 6.6 % (+) Distributions from Unconsolidated Subsidiaries 55 58 59 61 63 66 68 70 72 73 73 (-) Distribution to and Purchases of Non-Controlling Interests (78) (81) (83) (86) (88) (92) (95) (98) (101) (103) (103) (+) Depreciation and Amortization 146 150 150 150 150 150 150 150 150 150 166 (-) Change in NWC (15) (19) (25) (27) (28) (26) (23) (21) (17) (14) (14) (-) Capital Expenditures (237) (175) (175) (175) (175) (175) (175) (175) (175) (175) (175) Unlevered Free Cash Flow $ 157 $ 268 $ 313 $ 360 $ 412 $ 434 $ 452 $ 465 $ 474 $ 480 $ 484 Implied Equity Value per Share Perpetuity Growth Rate 20.4 x 1.5% 2.0% 2.5% WACC 10.0% $ 22.60 $ 23.88 $ 25.33 11.0% $ 18.42 $ 19.36 $ 20.41 12.0% $ 15.04 $ 15.75 $ 16.54 Implied Terminal NTM EBITDA Multiple Perpetuity Growth Rate 6.6 x 1.5% 2.0% 2.5% WACC 10.0% 6.8 x 7.2 x 7.8 x 11.0% 6.1 x 6.5 x 6.9 x 12.0% 5.5 x 5.8 x 6.2 x Implied Terminal Value as % of EV Perpetuity Growth Rate 0.7 % 1.5% 2.0% 2.5% WACC 10.0% 50.5 % 52.2 % 53.9 % 11.0% 46.7 % 48.2 % 49.8 % 12.0% 43.2 % 44.6 % 46.0 % |
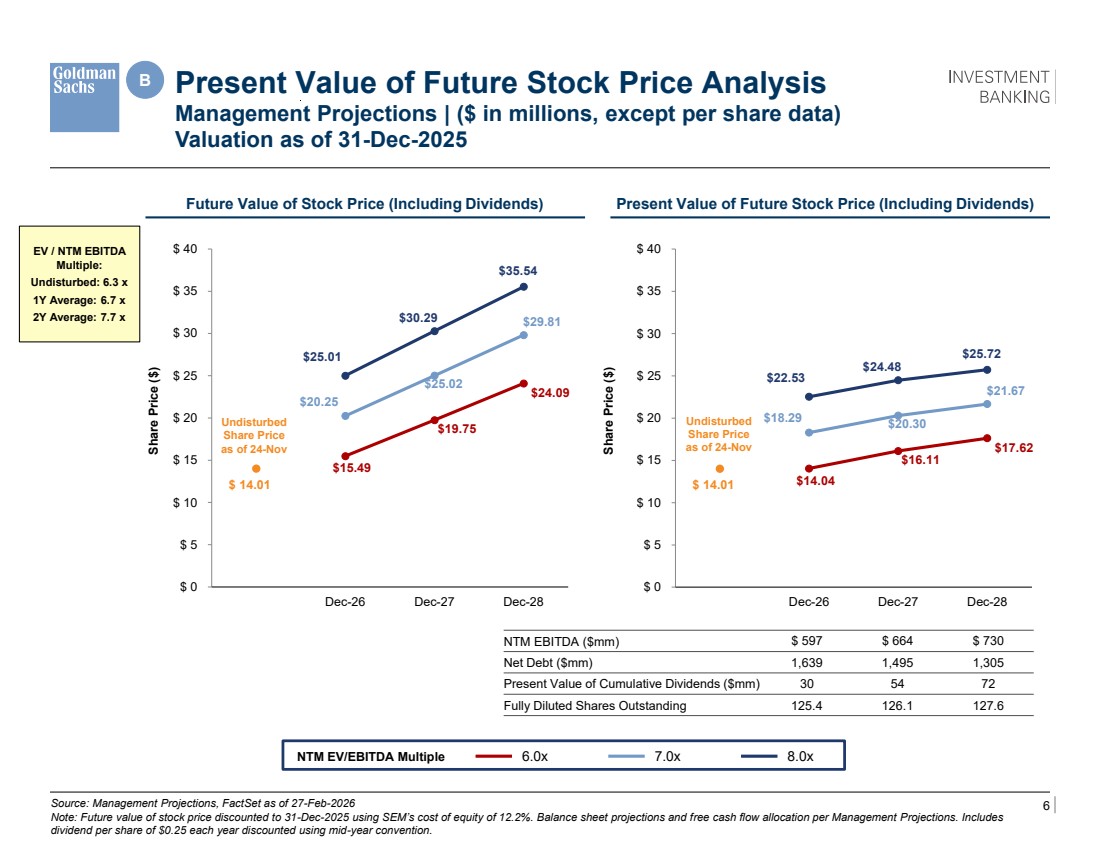
| 6 Confidential, Preliminary & Highly Illustrative for Discussion Purposes $22.53 $24.48 $25.72 $18.29 $20.30 $21.67 $14.04 $16.11 $17.62 $ 14.01 $ 0 $ 5 $ 10 $ 15 $ 20 $ 25 $ 30 $ 35 $ 40 Dec-25 Dec-26 Dec-27 Dec-28 $25.01 $30.29 $35.54 $20.25 $25.02 $29.81 $15.49 $19.75 $24.09 $ 14.01 $ 0 $ 5 $ 10 $ 15 $ 20 $ 25 $ 30 $ 35 $ 40 Dec-25 Dec-26 Dec-27 Dec-28 Source: Management Projections, FactSet as of 27-Feb-2026 Note: Future value of stock price discounted to 31-Dec-2025 using SEM’s cost of equity of 12.2%. Balance sheet projections and free cash flow allocation per Management Projections. Includes dividend per share of $0.25 each year discounted using mid-year convention. B Present Value of Future Stock Price Analysis Management Projections | ($ in millions, except per share data) Valuation as of 31-Dec-2025 o Run the 3 year average excluding Concentra (like from the earlier page and footnote this carefully – I think this will enable us to support 6.5x – 7.5x o The current multiple here should be re-labeled as “Undisturbed” and be as of November 24, 2025 which we say is 6.1x page 4. Would also flag we say undisturbed 2026E is 6.3x on page 20 based on consensus which I can’t quite tie to the 6.1x on page 4 NTM EBITDA ($mm) $ 597 $ 664 $ 730 Net Debt ($mm) 1,639 1,495 1,305 Present Value of Cumulative Dividends ($mm) 30 54 72 Fully Diluted Shares Outstanding 125.4 126.1 127.6 Future Value of Stock Price (Including Dividends) Present Value of Future Stock Price (Including Dividends) Share Price ($) Share Price ($) NTM EV/EBITDA Multiple 6.0x 7.0x 8.0x Undisturbed Share Price as of 24-Nov EV / NTM EBITDA Multiple: Undisturbed: 6.3 x 1Y Average: 6.7 x 2Y Average: 7.7 x Undisturbed Share Price as of 24-Nov |
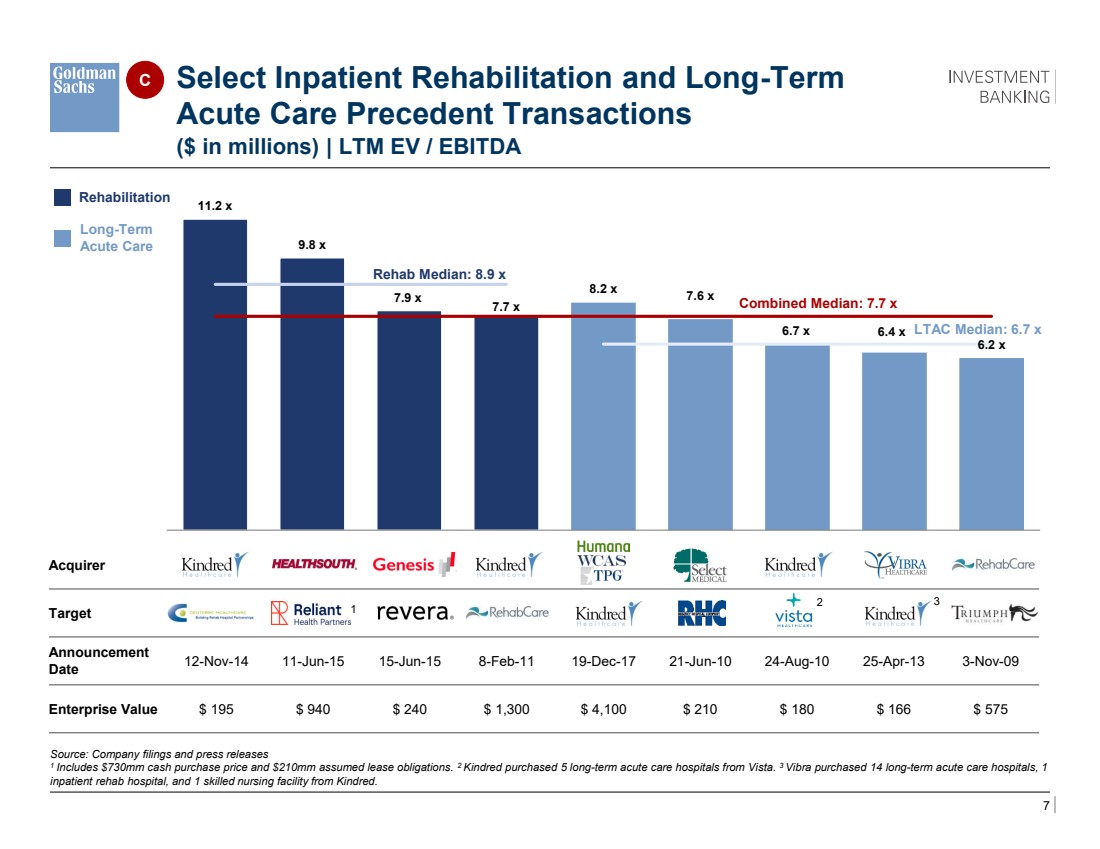
| 7 Confidential, Preliminary & Highly Illustrative for Discussion Purposes 11.2 x 9.8 x 7.9 x 7.7 x 8.2 x 7.6 x 6.7 x 6.4 x 6.2 x Kindred Healthcare / Centerre Healthcare Corporation HealthSouth Corporation / Reliant Hospital Partners Genesis Healthcare / Revera Kindred Healthcare / RehabCare Group Kindred Healthcare WholeCo Acquisition Select Medical Holdings Corporation / Regency Hospital Company, L.L.C. Kindred Healthcare, Inc. / Certain facilities owned by Vista Healthcare Holdings, LLC Vibra Healthcare, LLC / Certain facilities owned by Kindred Healthcare, Inc. RehabCare Group, Inc. / Triumph HealthCare Holdings, Inc. ($ in millions) | LTM EV / EBITDA Source: Company filings and press releases 1 Includes $730mm cash purchase price and $210mm assumed lease obligations. 2 Kindred purchased 5 long-term acute care hospitals from Vista. 3 Vibra purchased 14 long-term acute care hospitals, 1 inpatient rehab hospital, and 1 skilled nursing facility from Kindred. Acquirer Target Announcement Date 12-Nov-14 11-Jun-15 15-Jun-15 8-Feb-11 19-Dec-17 21-Jun-10 24-Aug-10 25-Apr-13 3-Nov-09 Enterprise Value $ 195 $ 940 $ 240 $ 1,300 $ 4,100 $ 210 $ 180 $ 166 $ 575 Rehab Median: 8.9 x Select Inpatient Rehabilitation and Long-Term Acute Care Precedent Transactions 1 2 3 LTAC Median: 6.7 x Combined Median: 7.7 x Rehabilitation Long-Term Acute Care C TBU – adding Scion Health, scrubbing incremental Deal Logic run for additional names |
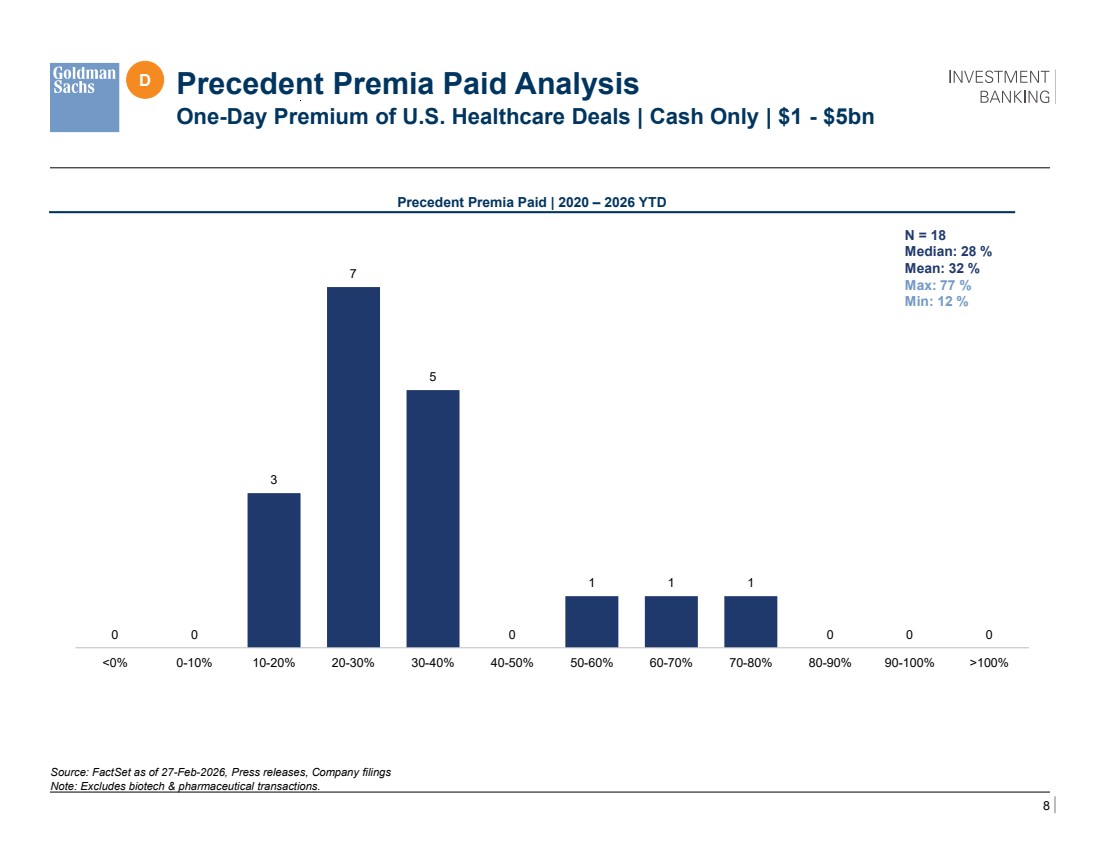
| 8 Confidential, Preliminary & Highly Illustrative for Discussion Purposes Precedent Premia Paid | 2020 – 2026 YTD Source: FactSet as of 27-Feb-2026, Press releases, Company filings Note: Excludes biotech & pharmaceutical transactions. N = 18 Median: 28 % Mean: 32 % Max: 77 % Min: 12 % Precedent Premia Paid Analysis One-Day Premium of U.S. Healthcare Deals | Cash Only | $1 - $5bn 0 0 3 7 5 0 1 1 1 0 0 0 <0% 0-10% 10-20% 20-30% 30-40% 40-50% 50-60% 60-70% 70-80% 80-90% 90-100% >100% D |
| 9 Confidential, Preliminary & Highly Illustrative for Discussion Purposes A Appendix |
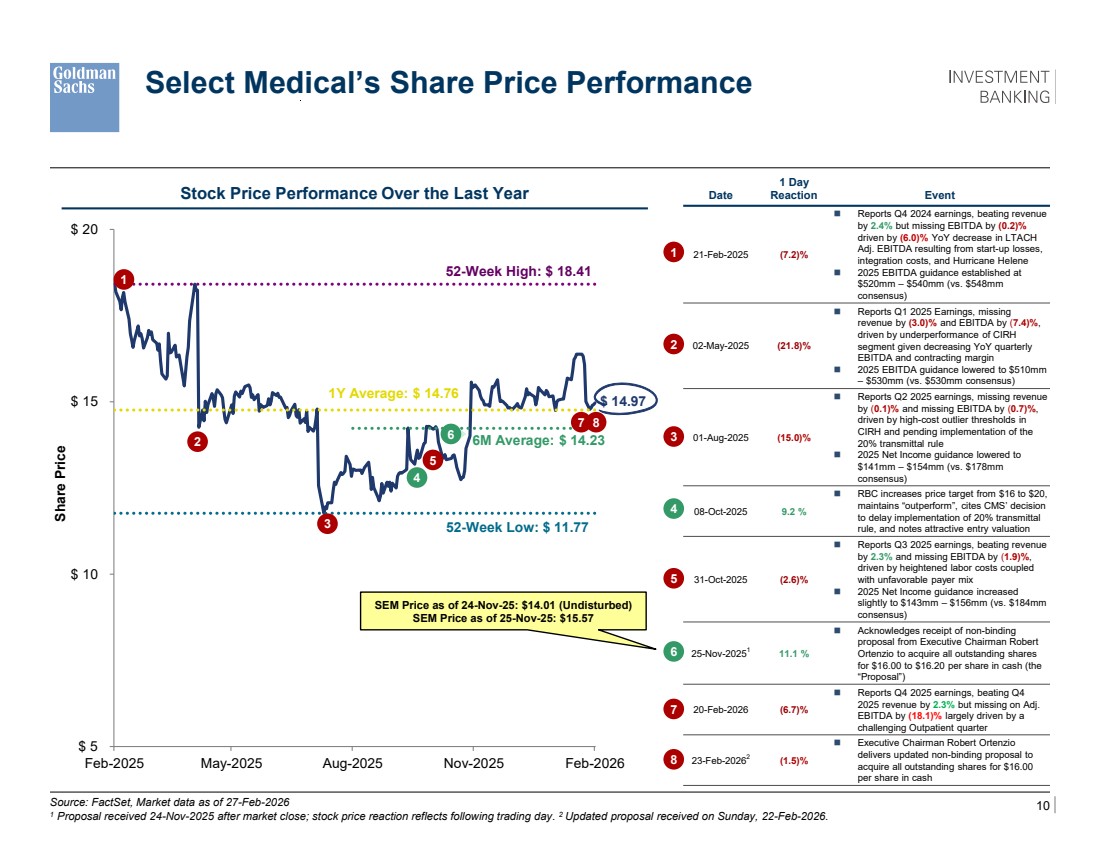
| 10 Confidential, Preliminary & Highly Illustrative for Discussion Purposes Source: FactSet, Market data as of 27-Feb-2026 1 Proposal received 24-Nov-2025 after market close; stock price reaction reflects following trading day. 2 Updated proposal received on Sunday, 22-Feb-2026. Select Medical’s Share Price Performance Date 1 Day Reaction Event 21-Feb-2025 (7.2)% ◼ Reports Q4 2024 earnings, beating revenue by 2.4% but missing EBITDA by (0.2)% driven by (6.0)% YoY decrease in LTACH Adj. EBITDA resulting from start-up losses, integration costs, and Hurricane Helene ◼ 2025 EBITDA guidance established at $520mm – $540mm (vs. $548mm consensus) 02-May-2025 (21.8)% ◼ Reports Q1 2025 Earnings, missing revenue by (3.0)% and EBITDA by (7.4)%, driven by underperformance of CIRH segment given decreasing YoY quarterly EBITDA and contracting margin ◼ 2025 EBITDA guidance lowered to $510mm – $530mm (vs. $530mm consensus) 01-Aug-2025 (15.0)% ◼ Reports Q2 2025 earnings, missing revenue by (0.1)% and missing EBITDA by (0.7)%, driven by high-cost outlier thresholds in CIRH and pending implementation of the 20% transmittal rule ◼ 2025 Net Income guidance lowered to $141mm – $154mm (vs. $178mm consensus) 08-Oct-2025 9.2 % ◼ RBC increases price target from $16 to $20, maintains “outperform”, cites CMS’ decision to delay implementation of 20% transmittal rule, and notes attractive entry valuation 31-Oct-2025 (2.6)% ◼ Reports Q3 2025 earnings, beating revenue by 2.3% and missing EBITDA by (1.9)%, driven by heightened labor costs coupled with unfavorable payer mix ◼ 2025 Net Income guidance increased slightly to $143mm – $156mm (vs. $184mm consensus) 25-Nov-20251 11.1 % ◼ Acknowledges receipt of non-binding proposal from Executive Chairman Robert Ortenzio to acquire all outstanding shares for $16.00 to $16.20 per share in cash (the “Proposal”) 20-Feb-2026 (6.7)% ◼ Reports Q4 2025 earnings, beating Q4 2025 revenue by 2.3% but missing on Adj. EBITDA by (18.1)% largely driven by a challenging Outpatient quarter 23-Feb-20262 (1.5)% ◼ Executive Chairman Robert Ortenzio delivers updated non-binding proposal to acquire all outstanding shares for $16.00 per share in cash good good good good check good good good $ 5 $ 10 $ 15 $ 20 Feb-2025 May-2025 Aug-2025 Nov-2025 Feb-2026 Share Price $ 14.97 1Y Average: $ 14.76 6M Average: $ 14.23 52-Week High: $ 18.41 52-Week Low: $ 11.77 SEM Price as of 24-Nov-25: $14.01 (Undisturbed) SEM Price as of 25-Nov-25: $15.57 1 2 5 3 4 6 1 2 3 4 5 6 Stock Price Performance Over the Last Year 7 8 7 8 |
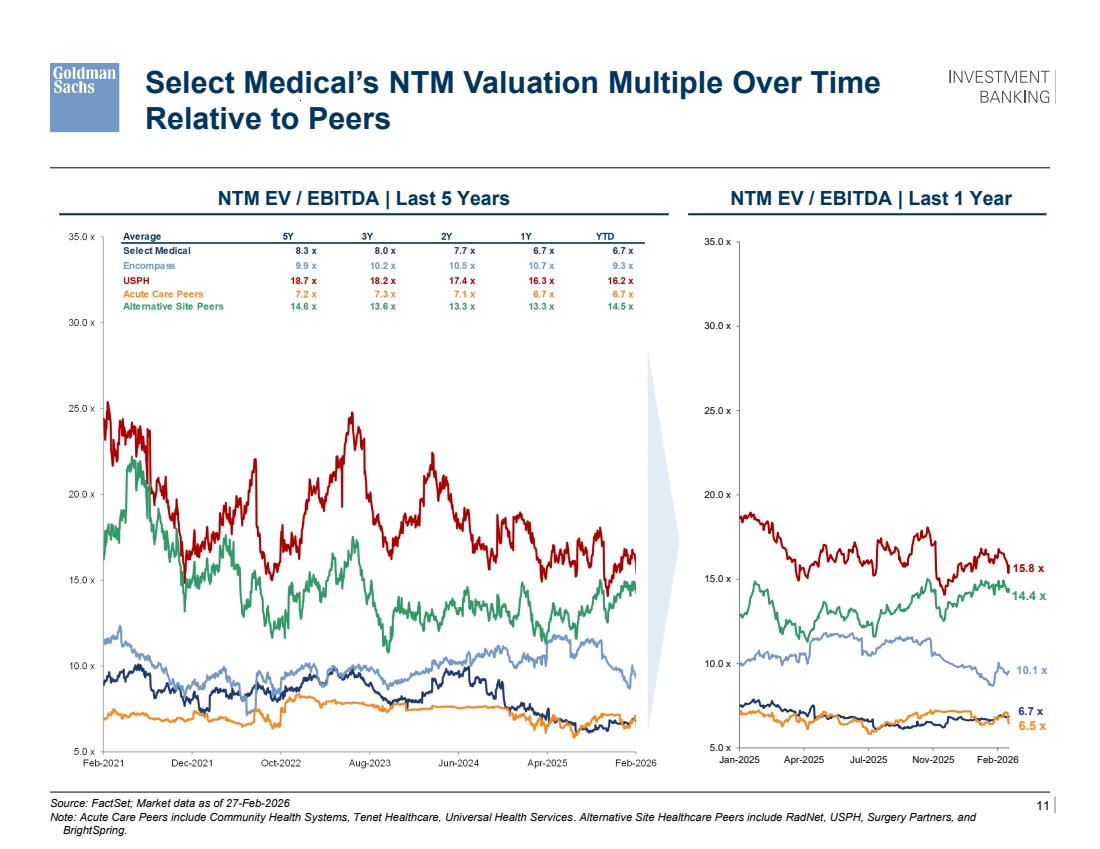
| 11 Confidential, Preliminary & Highly Illustrative for Discussion Purposes 5.0 x 10.0 x 15.0 x 20.0 x 25.0 x 30.0 x 35.0 x Jan-2025 Apr-2025 Jul-2025 Nov-2025 Feb-2026 9.5 x 6.9 x 15.8 x 6.5 x 14.4 x Source: FactSet; Market data as of 27-Feb-2026 Note: Acute Care Peers include Community Health Systems, Tenet Healthcare, Universal Health Services. Alternative Site Healthcare Peers include RadNet, USPH, Surgery Partners, and BrightSpring. NTM EV / EBITDA | Last 5 Years Select Medical’s NTM Valuation Multiple Over Time Relative to Peers 03-Jan-2024 Select announces its intention to spin off Concentra; stock has traded up 42.0% and multiple has traded up by 1.4x since then Backup \\firmwide.corp.gs.com\ibdroot\projects\IBD-NY\sawbones2024\925030_1\Presentations\2024.08.16 RemainCo Analysis\Excel\NTM EV EBITDA_vMaster.xlsx Select’s NTM EV / EBITDA pro forma for Concentra Separation: ~7.5x NTM EV / EBITDA | Last 1 Year \\firmwide.corp.gs.com\ibdroot\projects\IBD-NY\sapient2025\977110_1\Presentations\2. Fairness Opinion Presentation\Excel\NTM EV EBITDA_vMaster_06Jan2026_v02.xlsx WIP Implied ex-Concentra Select Medical 5-year, 3-year, and 2-year average NTM EV / EBITDA Multiples of 7.9x, 7.8x, and 7.5x respectively, assuming Concentra valued at 9.5x NTM EBITDA 6.7 x 10.1 x 15.8 x |
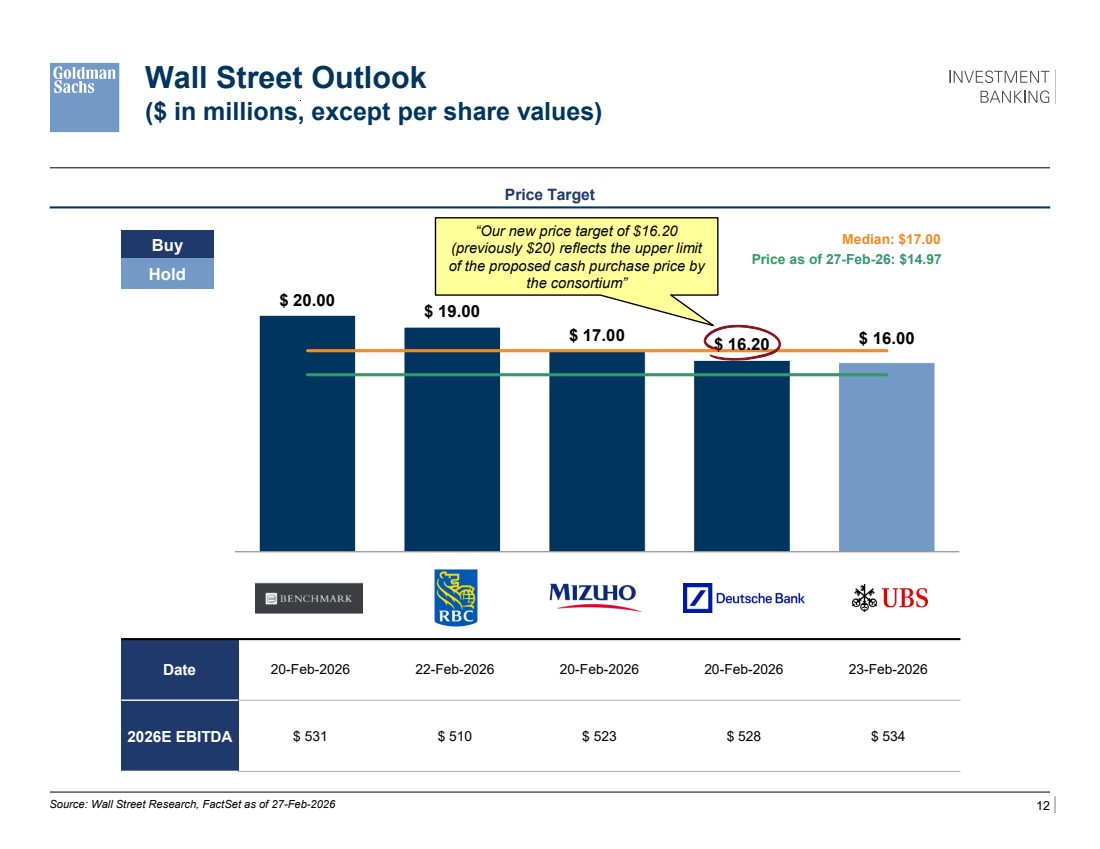
| 12 Confidential, Preliminary & Highly Illustrative for Discussion Purposes $ 20.00 $ 19.00 $ 17.00 $ 16.20 $ 16.00 Benchmark RBC Mizuho DB UBS Median: $17.00 Price as of 27-Feb-26: $14.97 Wall Street Outlook ($ in millions, except per share values) Price Target Source: Wall Street Research, FactSet as of 27-Feb-2026 Date 20-Feb-2026 22-Feb-2026 20-Feb-2026 20-Feb-2026 23-Feb-2026 2026E EBITDA $ 531 $ 510 $ 523 $ 528 $ 534 Buy Hold \\firmwide.corp.gs.com\ibdroot\projects\IBD-NY\sapient2025\977110_1\Presentations\2. Fairness Opinion Presentation\Excel\Broker Perspectives and Projections\Broker Perspectives and Projections_v03.xlsx “Our new price target of $16.20 (previously $20) reflects the upper limit of the proposed cash purchase price by the consortium” |
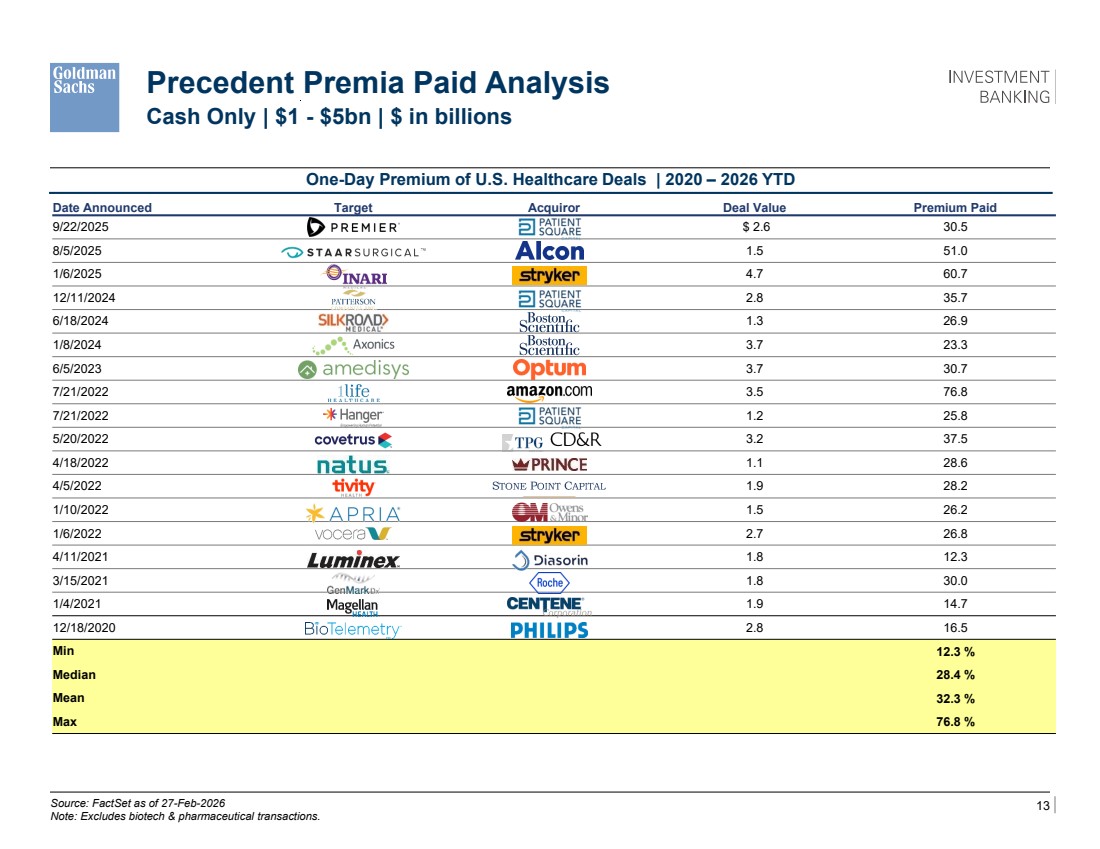
| 13 Confidential, Preliminary & Highly Illustrative for Discussion Purposes One-Day Premium of U.S. Healthcare Deals | 2020 – 2026 YTD Source: FactSet as of 27-Feb-2026 Note: Excludes biotech & pharmaceutical transactions. Precedent Premia Paid Analysis Cash Only | $1 - $5bn | $ in billions TBU – Price update, show format with lines across page showing 25th/75th percentile lines across page Date Announced Target Acquiror Deal Value Premium Paid 9/22/2025 Premier Inc Patient Square Capital $ 2.6 30.5 8/5/2025 STAAR Surgical Alcon 1.5 51.0 1/6/2025 Inari Medical Inc Stryker Corp 4.7 60.7 12/11/2024 Patterson Cos Inc Patient Square Capital 2.8 35.7 6/18/2024 Silk Road Medical Inc Boston Scientific Corp 1.3 26.9 1/8/2024 Axonics Inc Boston Scientific Corp 3.7 23.3 6/5/2023 Amedisys Inc Optum Inc 3.7 30.7 7/21/2022 1Life Healthcare Inc Amazon.com Inc 3.5 76.8 7/21/2022 Hanger PSQ 1.2 25.8 5/20/2022 Covetrus TPG / CD&R 3.2 37.5 4/18/2022 Natus Medical Inc Prince Parent Inc 1.1 28.6 4/5/2022 Tivity Stone Point 1.9 28.2 1/10/2022 Apria Inc Owens & Minor Inc 1.5 26.2 1/6/2022 Vocera Stryker 2.7 26.8 4/11/2021 Luminex Corp DiaSorin SpA 1.8 12.3 3/15/2021 GenMark Diagnostics Inc Roche Holding AG 1.8 30.0 1/4/2021 Magellan Health Inc Centene Corp 1.9 14.7 12/18/2020 BioTelemetry Koninklikke Philips 2.8 16.5 Min 12.3 % Median 28.4 % Mean 32.3 % Max 76.8 % |
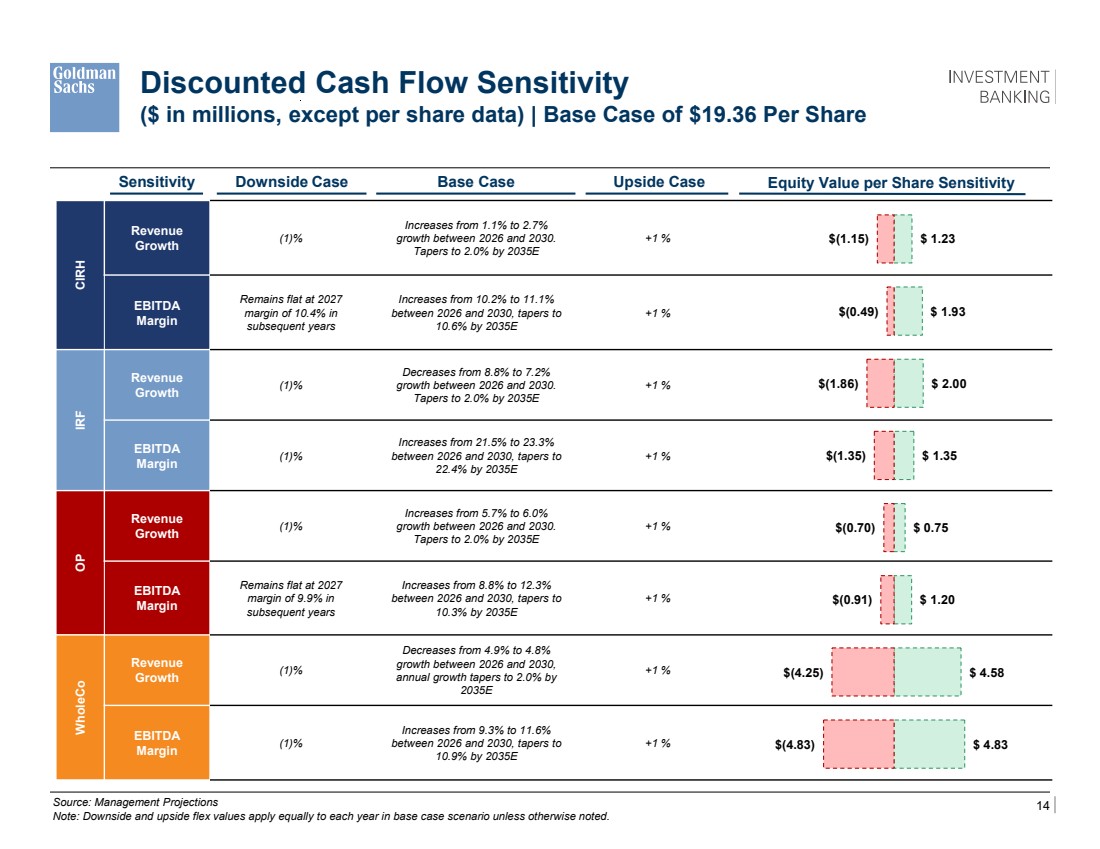
| 14 Confidential, Preliminary & Highly Illustrative for Discussion Purposes CIRH Revenue Growth (1)% Increases from 1.1% to 2.7% growth between 2026 and 2030. Tapers to 2.0% by 2035E +1 % EBITDA Margin Remains flat at 2027 margin of 10.4% in subsequent years Increases from 10.2% to 11.1% between 2026 and 2030, tapers to 10.6% by 2035E +1 % IRF Revenue Growth (1)% Decreases from 8.8% to 7.2% growth between 2026 and 2030. Tapers to 2.0% by 2035E +1 % EBITDA Margin (1)% Increases from 21.5% to 23.3% between 2026 and 2030, tapers to 22.4% by 2035E +1 % OP Revenue Growth (1)% Increases from 5.7% to 6.0% growth between 2026 and 2030. Tapers to 2.0% by 2035E +1 % EBITDA Margin Remains flat at 2027 margin of 9.9% in subsequent years Increases from 8.8% to 12.3% between 2026 and 2030, tapers to 10.3% by 2035E +1 % WholeCo Revenue Growth (1)% Decreases from 4.9% to 4.8% growth between 2026 and 2030, annual growth tapers to 2.0% by 2035E +1 % EBITDA Margin (1)% Increases from 9.3% to 11.6% between 2026 and 2030, tapers to 10.9% by 2035E +1 % Source: Management Projections Note: Downside and upside flex values apply equally to each year in base case scenario unless otherwise noted. Sensitivity Upside Case Equity Value per Share Sensitivity Discounted Cash Flow Sensitivity ($ in millions, except per share data) | Base Case of $19.36 Per Share Downside Case Base Case $(1.15) $(0.49) $(1.86) $(1.35) $(0.70) $(0.91) $(4.25) $(4.83) $ 1.23 $ 1.93 $ 2.00 $ 1.35 $ 0.75 $ 1.20 $ 4.58 $ 4.83 |
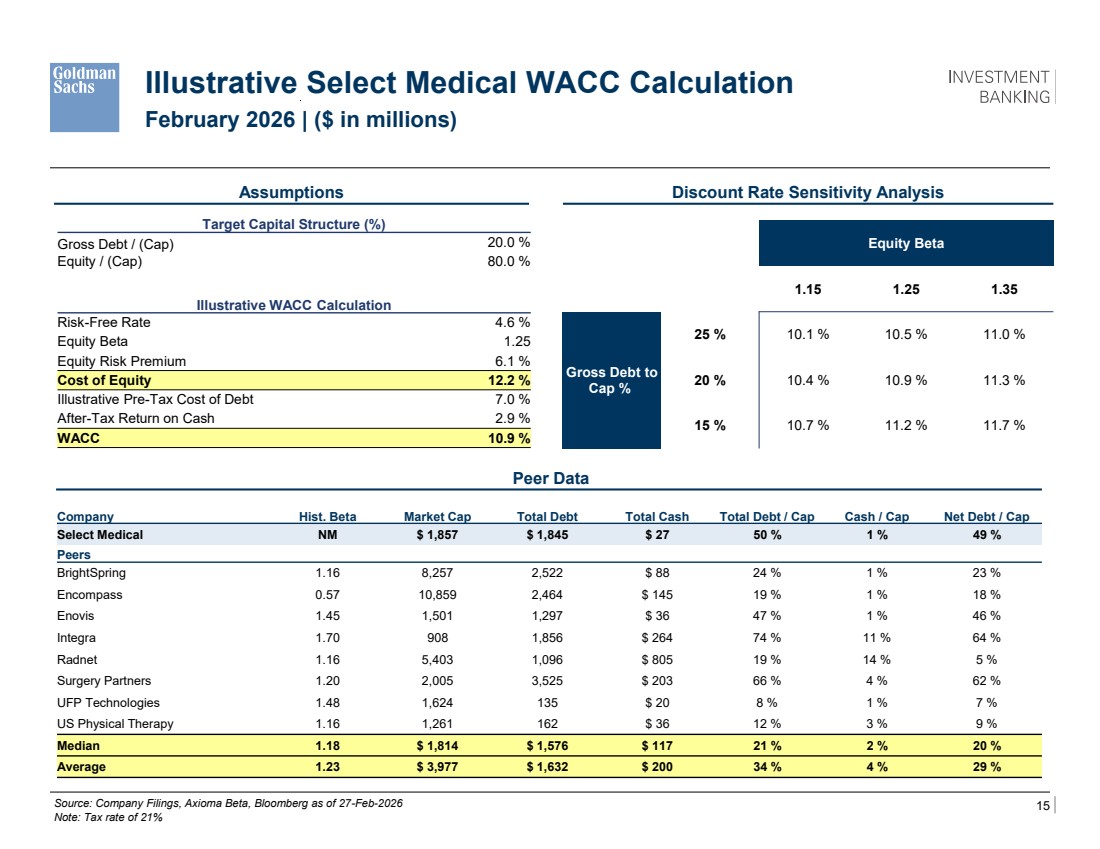
| 15 Confidential, Preliminary & Highly Illustrative for Discussion Purposes Target Capital Structure (%) Gross Debt / (Cap) 20.0 % Equity / (Cap) 80.0 % Illustrative WACC Calculation Risk-Free Rate 4.6 % Equity Beta 1.25 Equity Risk Premium 6.1 % Cost of Equity 12.2 % Illustrative Pre-Tax Cost of Debt 7.0 % After-Tax Return on Cash 2.9 % WACC 10.9 % Company Hist. Beta Market Cap Total Debt Total Cash Total Debt / Cap Cash / Cap Net Debt / Cap Select Medical NM $ 1,857 $ 1,845 $ 27 50 % 1 % 49 % Peers BrightSpring 1.16 8,257 2,522 $ 88 24 % 1 % 23 % Encompass 0.57 10,859 2,464 $ 145 19 % 1 % 18 % Enovis 1.45 1,501 1,297 $ 36 47 % 1 % 46 % Integra 1.70 908 1,856 $ 264 74 % 11 % 64 % Radnet 1.16 5,403 1,096 $ 805 19 % 14 % 5 % Surgery Partners 1.20 2,005 3,525 $ 203 66 % 4 % 62 % UFP Technologies 1.48 1,624 135 $ 20 8 % 1 % 7 % US Physical Therapy 1.16 1,261 162 $ 36 12 % 3 % 9 % Median 1.18 $ 1,814 $ 1,576 $ 117 21 % 2 % 20 % Average 1.23 $ 3,977 $ 1,632 $ 200 34 % 4 % 29 % Illustrative Select Medical WACC Calculation February 2026 | ($ in millions) Assumptions Discount Rate Sensitivity Analysis Source: Company Filings, Axioma Beta, Bloomberg as of 27-Feb-2026 Note: Tax rate of 21% Peer Data Equity Beta 1.15 1.25 1.35 25 % 10.1 % 10.5 % 11.0 % Gross Debt to Cap % 20 % 10.4 % 10.9 % 11.3 % 15 % 10.7 % 11.2 % 11.7 % For internal reference only |
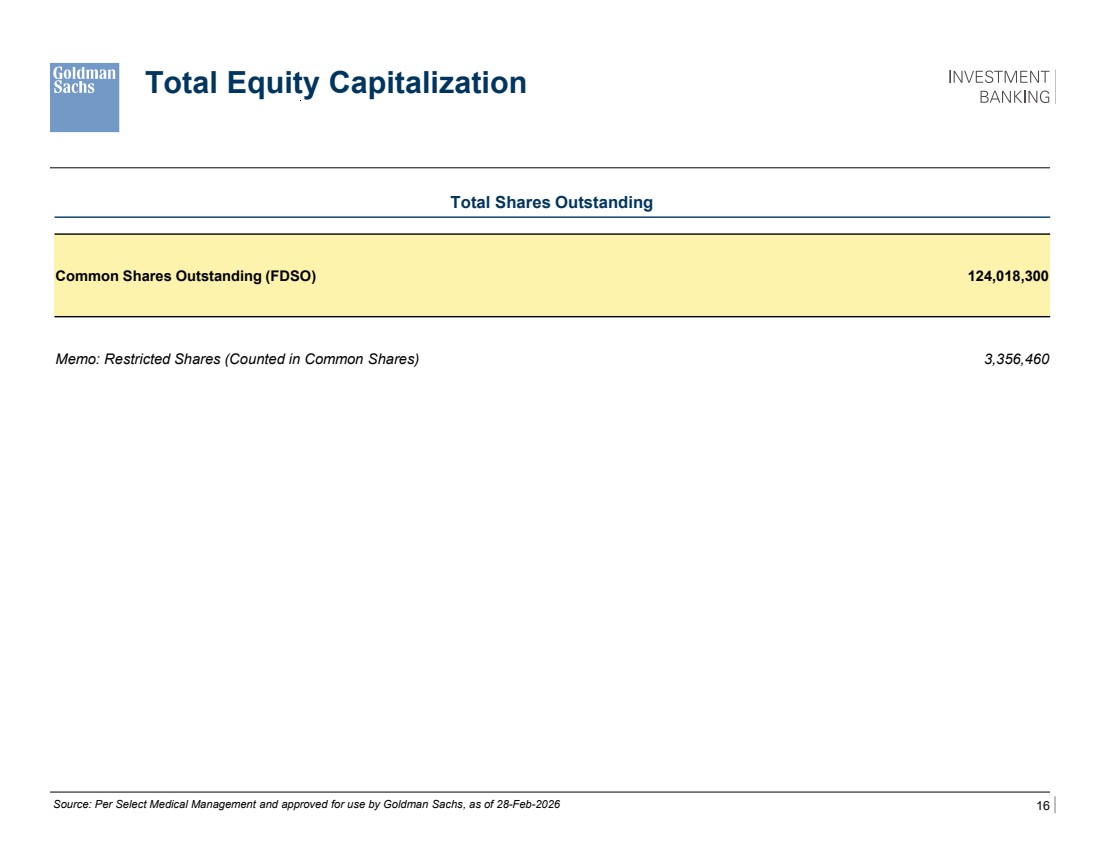
| 16 Confidential, Preliminary & Highly Illustrative for Discussion Purposes Total Equity Capitalization Common Shares Outstanding (FDSO) 124,018,300 Memo: Restricted Shares (Counted in Common Shares) 3,356,460 Source: Per Select Medical Management and approved for use by Goldman Sachs, as of 28-Feb-2026 Total Shares Outstanding |
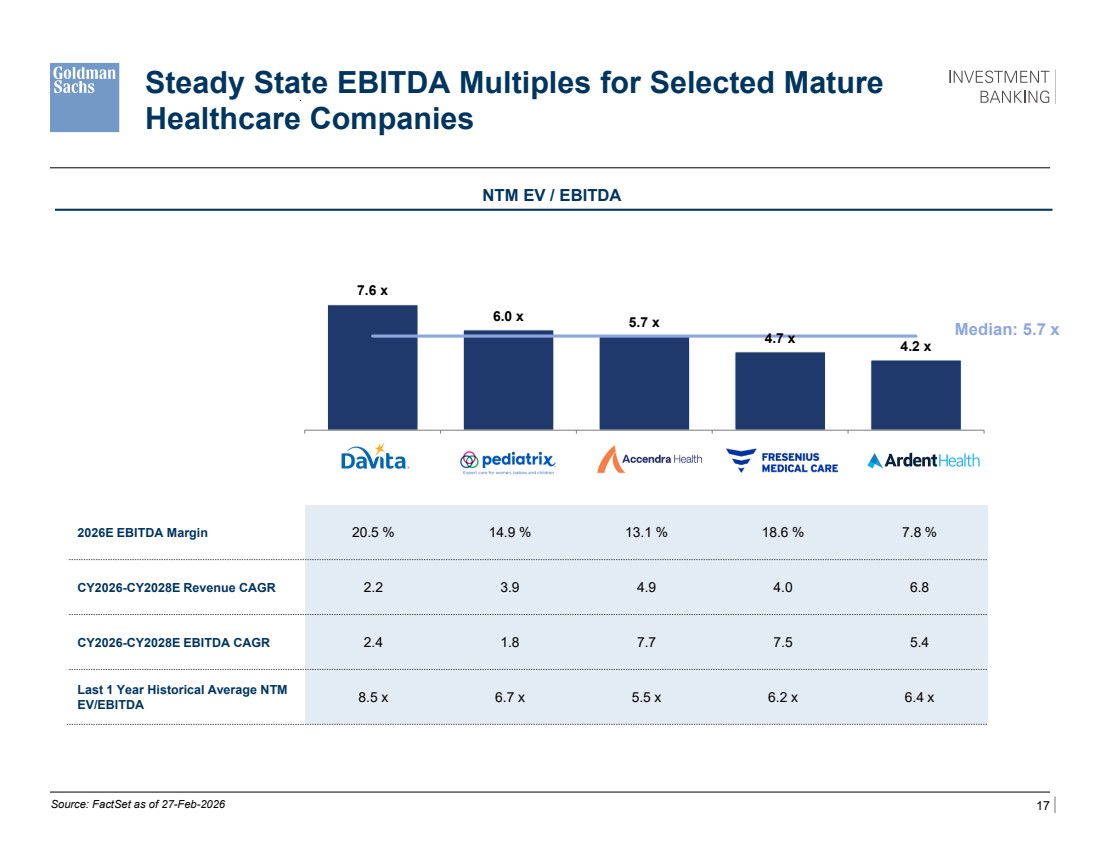
| 17 Confidential, Preliminary & Highly Illustrative for Discussion Purposes 7.6 x 6.0 x 5.7 x 4.7 x 4.2 x DaVita Inc. Pediatrix Medical Group, Inc. Accendra Health Inc Fresenius Medical Care AG Ardent Health, Inc. Steady State EBITDA Multiples for Selected Mature Healthcare Companies NTM EV / EBITDA Source: FactSet as of 27-Feb-2026 2026E EBITDA Margin 20.5 % 14.9 % 13.1 % 18.6 % 7.8 % CY2026-CY2028E Revenue CAGR 2.2 3.9 4.9 4.0 6.8 CY2026-CY2028E EBITDA CAGR 2.4 1.8 7.7 7.5 5.4 Last 1 Year Historical Average NTM EV/EBITDA 8.5 x 6.7 x 5.5 x 6.2 x 6.4 x Median: 5.7 x \\firmwide.corp.gs.com\ibdroot\projects\IBD-NY\sapient2025\977110_1\Presentations\(2026.02.25) - Model Rollforward Pack\Excel\Steady state Multiples\CSC for WACC Peers_v02.xlsx |
| 18 Confidential, Preliminary & Highly Illustrative for Discussion Purposes Disclaimer \\firmwide.corp.gs.com\ibdroot\projects\IBD-NY\sapient2025\977110_1\Presentations\(2026.02.25) - Model Rollforward Pack\Excel\Steady state Multiples\CSC for WACC Peers_v02.xlsx These materials have been prepared and are provided by Goldman Sachs on a confidential basis solely for the information and assistance of the Special Committee of Select Medical Holdings Corporation (the "Company") in connection with their consideration of the matters referred to herein. These materials and Goldman Sachs’ presentation relating to these materials (the “Confidential Information”) may not be disclosed to the third party or circulated or referred to publicly or used for or relied upon for any other purpose without the prior written consent of Goldman Sachs. The Confidential Information was not prepared with a view to public disclosure or to conform to any disclosure standards under any state, federal or international securities laws or other laws, rules or regulations, and Goldman Sachs does not take any responsibility for the use of the Confidential Information by persons other than those set forth above. Notwithstanding anything in this Confidential Information to the contrary, the Company may disclose to any person the US federal income and state income tax treatment and tax structure of any transaction described herein and all materials of any kind (including tax opinions and other tax analyses) that are provided to the Company relating to such tax treatment and tax structure, without Goldman Sachs imposing any limitation of any kind. The Confidential Information has been prepared by Goldman Sachs Investment Banking and is not a product of Goldman Sachs Global Investment Research. Goldman Sachs and its affiliates are engaged in advisory, underwriting and financing, principal investing, sales and trading, research, investment management and other financial and non-financial activities and services for various persons and entities. Goldman Sachs and its affiliates and employees, and funds or other entities they manage or in which they invest or have other economic interest or with which they co-invest, may at any time purchase, sell, hold or vote long or short positions and investments in securities, derivatives, loans, commodities, currencies, credit default swaps and other financial instruments of the Company, any other party to any transaction and any of their respective affiliates or any currency or commodity that may be involved in any transaction. Goldman Sachs Investment Banking maintains regular, ordinary course client service dialogues with clients and potential clients to review events, opportunities, and conditions in particular sectors and industries and, in that connection, Goldman Sachs may make reference to the Company, but Goldman Sachs will not disclose any confidential information received from the Company. The Confidential Information has been prepared based on historical financial information, forecasts and other information obtained by Goldman Sachs from publicly available sources, the management of the Company or other sources (approved for our use by the Company in the case of information from management and nonpublic information). In preparing the Confidential Information, Goldman Sachs has relied upon and assumed, without assuming any responsibility for independent verification, the accuracy and completeness of all of the financial, legal, regulatory, tax, accounting and other information provided to, discussed with or reviewed by us, and Goldman Sachs does not assume any liability for any such information. Goldman Sachs does not provide accounting, tax, legal or regulatory advice. Goldman Sachs has not made an independent evaluation or appraisal of the assets and liabilities (including any contingent, derivative or off-balance sheet assets and liabilities) of the Company or any other party to any transaction or any of their respective affiliates and has no obligation to evaluate the solvency of the Company or any other party to any transaction under any state or federal laws relating to bankruptcy, insolvency or similar matters. The analyses contained in the Confidential Information do not purport to be appraisals nor do they necessarily reflect the prices at which businesses or securities actually may be sold or purchased. Goldman Sachs’ role in any due diligence review is limited solely to performing such a review as it shall deem necessary to support its own advice and analysis and shall not be on behalf of the Company. Analyses based upon forecasts of future results are not necessarily indicative of actual future results, which may be significantly more or less favorable than suggested by these analyses, and Goldman Sachs does not assume responsibility if future results are materially different from those forecast. The Confidential Information does not address the underlying business decision of the Company to engage in any transaction, or the relative merits of any transaction or strategic alternative referred to herein as compared to any other transaction or alternative that may be available to the Company. The Confidential Information is necessarily based on economic, monetary, market and other conditions as in effect on, and the information made available to Goldman Sachs as of, the date of such Confidential Information and Goldman Sachs assumes no responsibility for updating or revising the Confidential Information based on circumstances, developments or events occurring after such date. The Confidential Information does not constitute any opinion, nor does the Confidential Information constitute a recommendation to the Board, any security holder of the Company or any other person as to how to vote or act with respect to any transaction or any other matter. The Confidential Information, including this disclaimer, are subject to, and governed by, any written agreement between the Company, the Board and/or any committee thereof, on the hand, and Goldman Sachs, on the other hand. The Confidential Information does not address, nor does Goldman Sachs express any view as to, the potential effects of volatility in the credit, financial and stock markets on the Company, any other party to any transaction or any transaction. |