| 114:151:197 255:255:255 0:0:0 Brand Colors A. 240:235:230 167:162:157 114:115:117 Brand Grays B. 220:220:224 187:187:191 Background Grays C. 253:243:173 184:208:245 242:203:231 153:224:217 245:208:206 198:233:189 Table Highlight D. E. 0:0:0 114:115:117 Table Borders F. Functional Data Colors G. 194:23:10 243:196:63 57:128:37 Primary Sequence 9:44:97 114:151:197 166:66:140 21:151:136 224:115:26 117:55:173 176:48:48 189:140:0 105.55.14 97:122:39 9:107:96 59:124:222 64:37:56 145:87:196 9:74:171 143:106:4 107:20:20 199:97:172 55:71:19 59:26:89 1. 2. 3. 4. 5. 6. 7. 8. 9. 10. 11. 12. 13. 14. 15. 16. 17. 18. 19. 20. Theme Colors Primary Sequence Secondary Shade Materials for the Special Committee Goldman Sachs & Co. LLC March 2026 Goldman Sachs does not provide accounting, tax, or legal advice. Notwithstanding anything in this document to the contrary, and except as required to enable compliance with applicable securities law, you (and each of your employees, representatives, and other agents) may disclose to any and all persons the US federal income and state tax treatment and tax structure of the transaction and all materials of any kind (including tax opinions and other tax analyses) that are provided to you relating to such tax treatment and tax structure, without Goldman Sachs imposing any limitation of any kind. PROPRIETARY & CONFIDENTIAL |

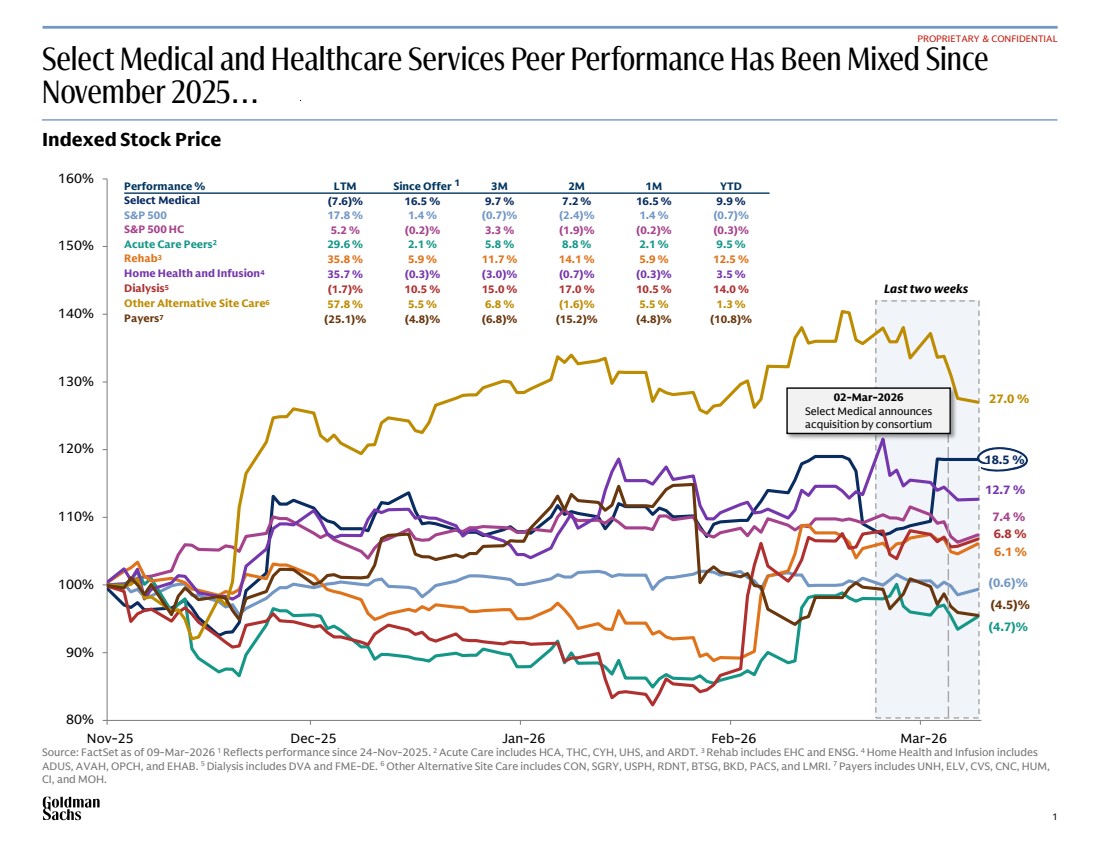
| 1 114:151:197 255:255:255 0:0:0 Brand Colors A. 240:235:230 167:162:157 114:115:117 Brand Grays B. 220:220:224 187:187:191 Background Grays C. 253:243:173 184:208:245 242:203:231 153:224:217 245:208:206 198:233:189 Table Highlight D. E. 0:0:0 114:115:117 Table Borders F. Functional Data Colors G. 194:23:10 243:196:63 57:128:37 Primary Sequence 9:44:97 114:151:197 166:66:140 21:151:136 224:115:26 117:55:173 176:48:48 189:140:0 105.55.14 97:122:39 9:107:96 59:124:222 64:37:56 145:87:196 9:74:171 143:106:4 107:20:20 199:97:172 55:71:19 59:26:89 1. 2. 3. 4. 5. 6. 7. 8. 9. 10. 11. 12. 13. 14. 15. 16. 17. 18. 19. 20. Theme Colors Primary Sequence Secondary Shade 80% 90% 100% 110% 120% 130% 140% 150% 160% Nov-25 Dec-25 Jan-26 Feb-26 Mar-26 6.1 % 12.7 % 18.5 % (4.7)% 27.0 % (4.5)% 6.8 % 7.4 % (0.6)% Select Medical and Healthcare Services Peer Performance Has Been Mixed Since November 2025… Source: FactSet as of 09-Mar-2026 1 Reflects performance since 24-Nov-2025. 2 Acute Care includes HCA, THC, CYH, UHS, and ARDT. 3 Rehab includes EHC and ENSG. 4 Home Health and Infusion includes ADUS, AVAH, OPCH, and EHAB. 5 Dialysis includes DVA and FME-DE. 6 Other Alternative Site Care includes CON, SGRY, USPH, RDNT, BTSG, BKD, PACS, and LMRI. 7 Payers includes UNH, ELV, CVS, CNC, HUM, CI, and MOH. PROPRIETARY & CONFIDENTIAL Indexed Stock Price \\firmwide.corp.gs.com\ibdroot\projects\IBD-NY\sapient2025\977110_1\Presentations\(2026.03.03) - Market and Sector Update\_Excel\Peers TSR 03.04.2026 v1.XLSM 1 02-Mar-2026 Select Medical announces acquisition by consortium Performance % LTM Since Offer 3M 2M 1M YTD Select Medical (7.6)% 16.5 % 9.7 % 7.2 % 16.5 % 9.9 % S&P 500 17.8 % 1.4 % (0.7)% (2.4)% 1.4 % (0.7)% S&P 500 HC 5.2 % (0.2)% 3.3 % (1.9)% (0.2)% (0.3)% Acute Care Peers2 29.6 % 2.1 % 5.8 % 8.8 % 2.1 % 9.5 % Rehab3 35.8 % 5.9 % 11.7 % 14.1 % 5.9 % 12.5 % Home Health and Infusion4 35.7 % (0.3)% (3.0)% (0.7)% (0.3)% 3.5 % Dialysis5 (1.7)% 10.5 % 15.0 % 17.0 % 10.5 % 14.0 % Other Alternative Site Care6 57.8 % 5.5 % 6.8 % (1.6)% 5.5 % 1.3 % Payers7 (25.1)% (4.8)% (6.8)% (15.2)% (4.8)% (10.8)% Last two weeks |
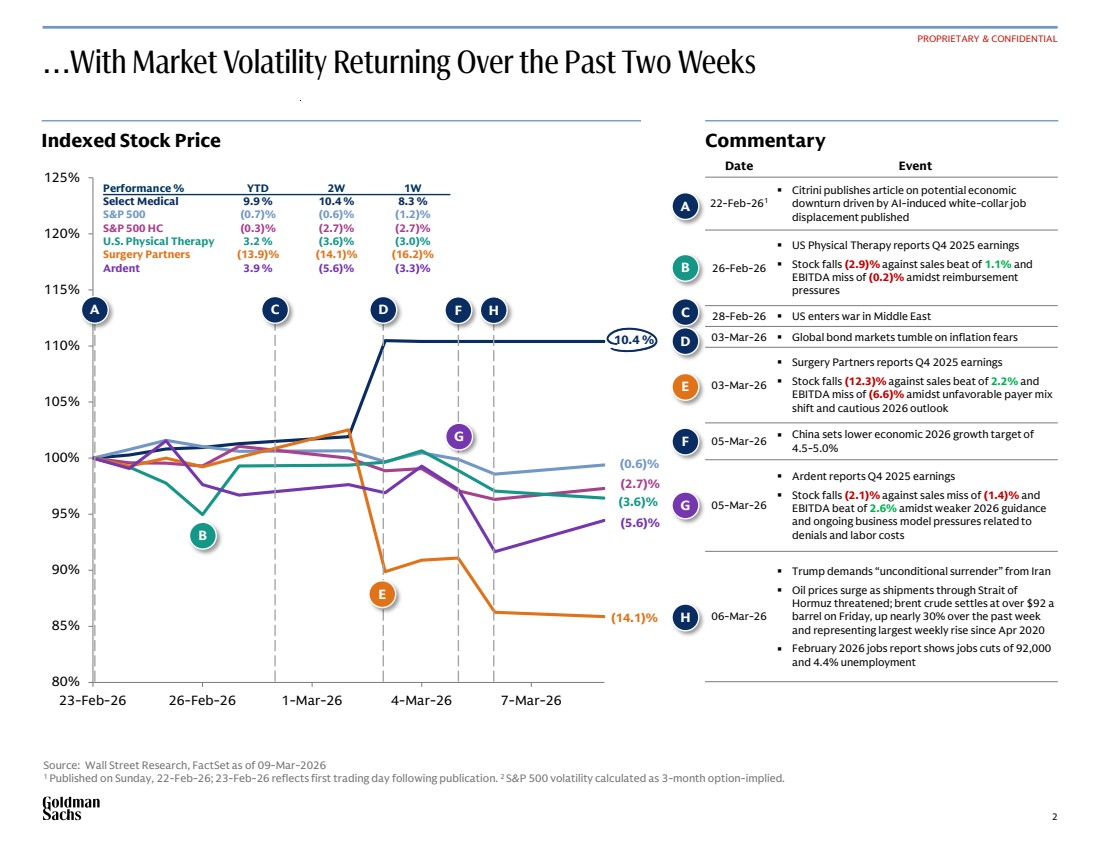
| 2 114:151:197 255:255:255 0:0:0 Brand Colors A. 240:235:230 167:162:157 114:115:117 Brand Grays B. 220:220:224 187:187:191 Background Grays C. 253:243:173 184:208:245 242:203:231 153:224:217 245:208:206 198:233:189 Table Highlight D. E. 0:0:0 114:115:117 Table Borders F. Functional Data Colors G. 194:23:10 243:196:63 57:128:37 Primary Sequence 9:44:97 114:151:197 166:66:140 21:151:136 224:115:26 117:55:173 176:48:48 189:140:0 105.55.14 97:122:39 9:107:96 59:124:222 64:37:56 145:87:196 9:74:171 143:106:4 107:20:20 199:97:172 55:71:19 59:26:89 1. 2. 3. 4. 5. 6. 7. 8. 9. 10. 11. 12. 13. 14. 15. 16. 17. 18. 19. 20. Theme Colors Primary Sequence Secondary Shade 80% 85% 90% 95% 100% 105% 110% 115% 120% 125% 23-Feb-26 26-Feb-26 1-Mar-26 4-Mar-26 7-Mar-26 (14.1)% (5.6)% 10.4 % (3.6)% (2.7)% (0.6)% …With Market Volatility Returning Over the Past Two Weeks Source: Wall Street Research, FactSet as of 09-Mar-2026 1 Published on Sunday, 22-Feb-26; 23-Feb-26 reflects first trading day following publication. 2 S&P 500 volatility calculated as 3-month option-implied. PROPRIETARY & CONFIDENTIAL \\firmwide.corp.gs.com\ibdroot\projects\IBD-NY\sapient2025\977110_1\Presentations\(2026.03.03) - Market and Sector Update\_Excel\Peers TSR 03.04.2026 v1.XLSM Indexed Stock Price Commentary Date Event 22-Feb-261 ▪ Citrini publishes article on potential economic downturn driven by AI-induced white-collar job displacement published 26-Feb-26 ▪ US Physical Therapy reports Q4 2025 earnings ▪ Stock falls (2.9)% against sales beat of 1.1% and EBITDA miss of (0.2)% amidst reimbursement pressures 28-Feb-26 ▪ US enters war in Middle East 03-Mar-26 ▪ Global bond markets tumble on inflation fears 03-Mar-26 ▪ Surgery Partners reports Q4 2025 earnings ▪ Stock falls (12.3)% against sales beat of 2.2% and EBITDA miss of (6.6)% amidst unfavorable payer mix shift and cautious 2026 outlook 05-Mar-26 ▪ China sets lower economic 2026 growth target of 4.5-5.0% 05-Mar-26 ▪ Ardent reports Q4 2025 earnings ▪ Stock falls (2.1)% against sales miss of (1.4)% and EBITDA beat of 2.6% amidst weaker 2026 guidance and ongoing business model pressures related to denials and labor costs 06-Mar-26 ▪ Trump demands “unconditional surrender” from Iran ▪ Oil prices surge as shipments through Strait of Hormuz threatened; brent crude settles at over $92 a barrel on Friday, up nearly 30% over the past week and representing largest weekly rise since Apr 2020 ▪ February 2026 jobs report shows jobs cuts of 92,000 and 4.4% unemployment A C H Performance % YTD 2W 1W Select Medical 9.9 % 10.4 % 8.3 % S&P 500 (0.7)% (0.6)% (1.2)% S&P 500 HC (0.3)% (2.7)% (2.7)% U.S. Physical Therapy 3.2 % (3.6)% (3.0)% Surgery Partners (13.9)% (14.1)% (16.2)% Ardent 3.9 % (5.6)% (3.3)% A C D F H B E G B D E F G |
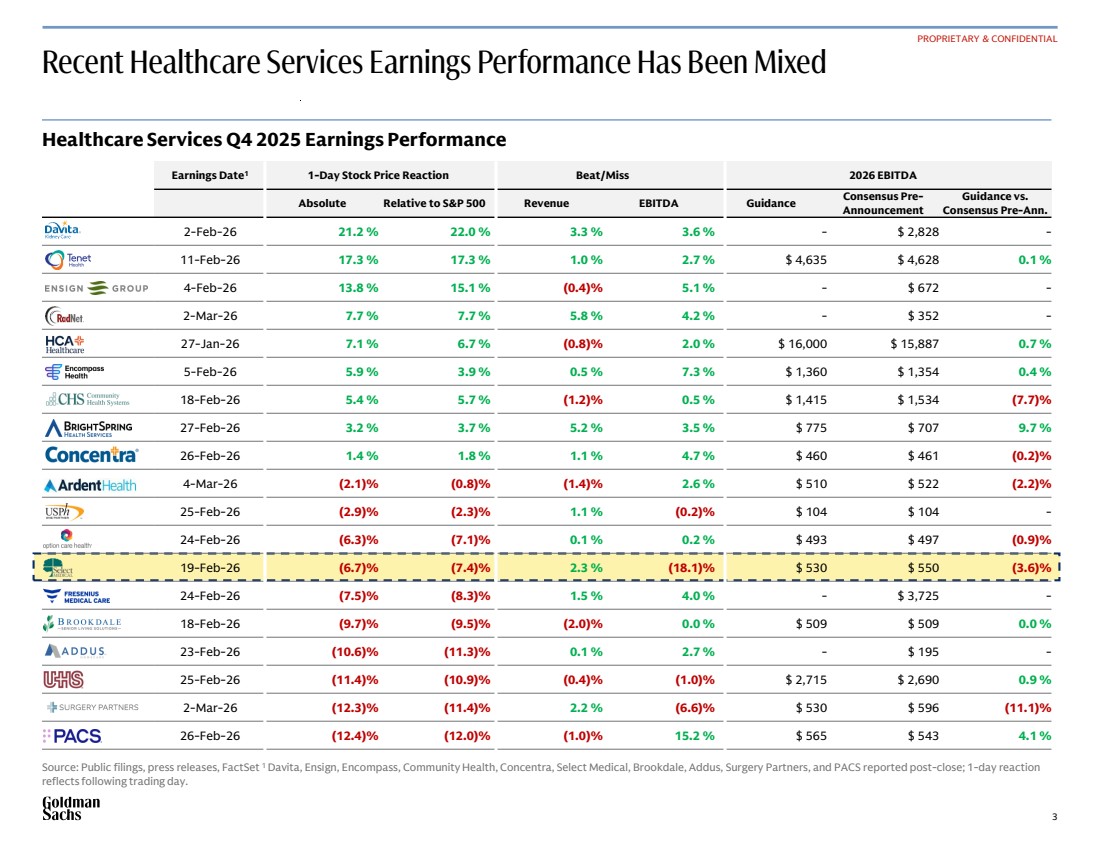
| 3 114:151:197 255:255:255 0:0:0 Brand Colors A. 240:235:230 167:162:157 114:115:117 Brand Grays B. 220:220:224 187:187:191 Background Grays C. 253:243:173 184:208:245 242:203:231 153:224:217 245:208:206 198:233:189 Table Highlight D. E. 0:0:0 114:115:117 Table Borders F. Functional Data Colors G. 194:23:10 243:196:63 57:128:37 Primary Sequence 9:44:97 114:151:197 166:66:140 21:151:136 224:115:26 117:55:173 176:48:48 189:140:0 105.55.14 97:122:39 9:107:96 59:124:222 64:37:56 145:87:196 9:74:171 143:106:4 107:20:20 199:97:172 55:71:19 59:26:89 1. 2. 3. 4. 5. 6. 7. 8. 9. 10. 11. 12. 13. 14. 15. 16. 17. 18. 19. 20. Theme Colors Primary Sequence Secondary Shade Earnings Date1 1-Day Stock Price Reaction Beat/Miss 2026 EBITDA Absolute Relative to S&P 500 Revenue EBITDA Guidance Consensus Pre-Announcement Guidance vs. Consensus Pre-Ann. 2-Feb-26 21.2 % 22.0 % 3.3 % 3.6 % - $ 2,828 - 11-Feb-26 17.3 % 17.3 % 1.0 % 2.7 % $ 4,635 $ 4,628 0.1 % 4-Feb-26 13.8 % 15.1 % (0.4)% 5.1 % - $ 672 - 2-Mar-26 7.7 % 7.7 % 5.8 % 4.2 % - $ 352 - 27-Jan-26 7.1 % 6.7 % (0.8)% 2.0 % $ 16,000 $ 15,887 0.7 % 5-Feb-26 5.9 % 3.9 % 0.5 % 7.3 % $ 1,360 $ 1,354 0.4 % 18-Feb-26 5.4 % 5.7 % (1.2)% 0.5 % $ 1,415 $ 1,534 (7.7)% 27-Feb-26 3.2 % 3.7 % 5.2 % 3.5 % $ 775 $ 707 9.7 % 26-Feb-26 1.4 % 1.8 % 1.1 % 4.7 % $ 460 $ 461 (0.2)% 4-Mar-26 (2.1)% (0.8)% (1.4)% 2.6 % $ 510 $ 522 (2.2)% 25-Feb-26 (2.9)% (2.3)% 1.1 % (0.2)% $ 104 $ 104 - 24-Feb-26 (6.3)% (7.1)% 0.1 % 0.2 % $ 493 $ 497 (0.9)% 19-Feb-26 (6.7)% (7.4)% 2.3 % (18.1)% $ 530 $ 550 (3.6)% 24-Feb-26 (7.5)% (8.3)% 1.5 % 4.0 % - $ 3,725 - 18-Feb-26 (9.7)% (9.5)% (2.0)% 0.0 % $ 509 $ 509 0.0 % 23-Feb-26 (10.6)% (11.3)% 0.1 % 2.7 % - $ 195 - 25-Feb-26 (11.4)% (10.9)% (0.4)% (1.0)% $ 2,715 $ 2,690 0.9 % 2-Mar-26 (12.3)% (11.4)% 2.2 % (6.6)% $ 530 $ 596 (11.1)% 26-Feb-26 (12.4)% (12.0)% (1.0)% 15.2 % $ 565 $ 543 4.1 % Recent Healthcare Services Earnings Performance Has Been Mixed PROPRIETARY & CONFIDENTIAL ▪ RHS – annotations around earnings reactions for those names, make sure to cover the following for each peer ‐ 1D stock price reaction (absolute and vs. S&P500) ‐ Most recent quarter (and FY if applicable) reported vs. consensus ‐ FY guidance vs. consensus ‐ Any other material updates in commentary (e.g., Elevance disclosed sanctions from CMS) Healthcare Services Q4 2025 Earnings Performance \\firmwide.corp.gs.com\ibdroot\projects\IBD-NY\sapient2025\977110_1\Presentations\(2026.03.03) - Market and Sector Update\_Excel\Beat Miss Summary v03.04.2026 v2.xlsx Source: Public filings, press releases, FactSet 1 Davita, Ensign, Encompass, Community Health, Concentra, Select Medical, Brookdale, Addus, Surgery Partners, and PACS reported post-close; 1-day reaction reflects following trading day. |
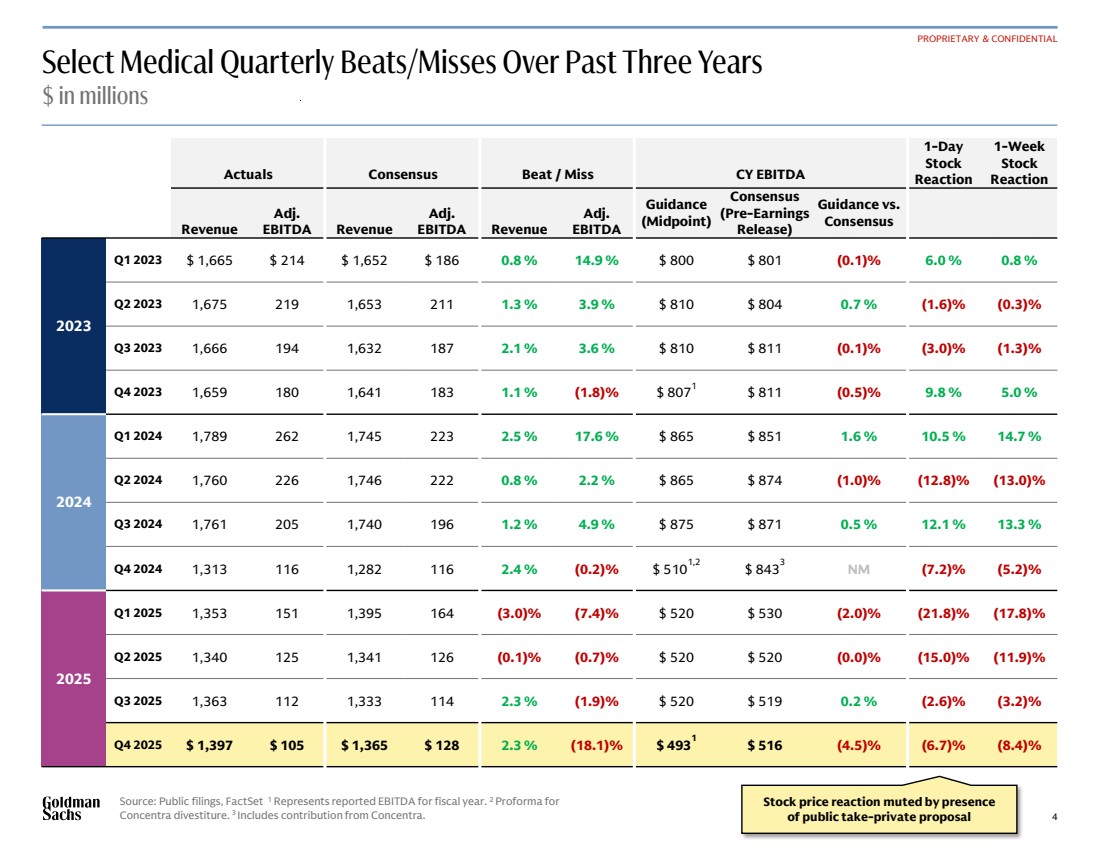
| 4 114:151:197 255:255:255 0:0:0 Brand Colors A. 240:235:230 167:162:157 114:115:117 Brand Grays B. 220:220:224 187:187:191 Background Grays C. 253:243:173 184:208:245 242:203:231 153:224:217 245:208:206 198:233:189 Table Highlight D. E. 0:0:0 114:115:117 Table Borders F. Functional Data Colors G. 194:23:10 243:196:63 57:128:37 Primary Sequence 9:44:97 114:151:197 166:66:140 21:151:136 224:115:26 117:55:173 176:48:48 189:140:0 105.55.14 97:122:39 9:107:96 59:124:222 64:37:56 145:87:196 9:74:171 143:106:4 107:20:20 199:97:172 55:71:19 59:26:89 1. 2. 3. 4. 5. 6. 7. 8. 9. 10. 11. 12. 13. 14. 15. 16. 17. 18. 19. 20. Theme Colors Primary Sequence Secondary Shade Select Medical Quarterly Beats/Misses Over Past Three Years $ in millions Source: Public filings, FactSet 1 Represents reported EBITDA for fiscal year. 2 Proforma for Concentra divestiture. 3 Includes contribution from Concentra. PROPRIETARY & CONFIDENTIAL Actuals Consensus Beat / Miss CY EBITDA 1-Day Stock Reaction 1-Week Stock Reaction Revenue Adj. EBITDA Revenue Adj. EBITDA Revenue Adj. EBITDA Guidance (Midpoint) Consensus (Pre-Earnings Release) Guidance vs. Consensus 2023 Q1 2023 $ 1,665 $ 214 $ 1,652 $ 186 0.8 % 14.9 % $ 800 $ 801 (0.1)% 6.0 % 0.8 % Q2 2023 1,675 219 1,653 211 1.3 % 3.9 % $ 810 $ 804 0.7 % (1.6)% (0.3)% Q3 2023 1,666 194 1,632 187 2.1 % 3.6 % $ 810 $ 811 (0.1)% (3.0)% (1.3)% Q4 2023 1,659 180 1,641 183 1.1 % (1.8)% $ 8071 $ 811 (0.5)% 9.8 % 5.0 % 2024 Q1 2024 1,789 262 1,745 223 2.5 % 17.6 % $ 865 $ 851 1.6 % 10.5 % 14.7 % Q2 2024 1,760 226 1,746 222 0.8 % 2.2 % $ 865 $ 874 (1.0)% (12.8)% (13.0)% Q3 2024 1,761 205 1,740 196 1.2 % 4.9 % $ 875 $ 871 0.5 % 12.1 % 13.3 % Q4 2024 1,313 116 1,282 116 2.4 % (0.2)% $ 5101,2 $ 8433 NM (7.2)% (5.2)% 2025 Q1 2025 1,353 151 1,395 164 (3.0)% (7.4)% $ 520 $ 530 (2.0)% (21.8)% (17.8)% Q2 2025 1,340 125 1,341 126 (0.1)% (0.7)% $ 520 $ 520 (0.0)% (15.0)% (11.9)% Q3 2025 1,363 112 1,333 114 2.3 % (1.9)% $ 520 $ 519 0.2 % (2.6)% (3.2)% Q4 2025 $ 1,397 $ 105 $ 1,365 $ 128 2.3 % (18.1)% $ 4931 $ 516 (4.5)% (6.7)% (8.4)% \\firmwide.corp.gs.com\ibdroot\projects\IBD-NY\sapient2025\977110_1\Presentations\(2026.03.03) - Market and Sector Update\_Excel\Beat Miss Summary v03.04.2026 v2.xlsx Stock price reaction muted by presence of public take-private proposal |
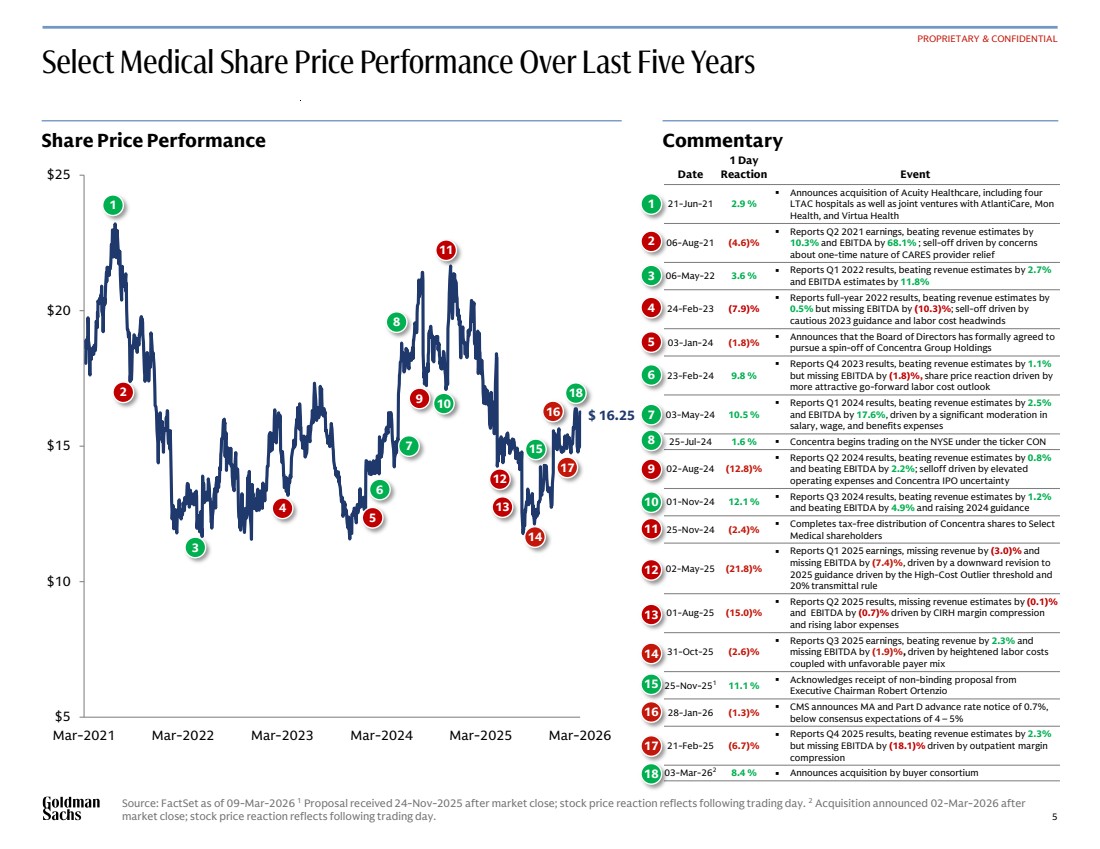
| 5 114:151:197 255:255:255 0:0:0 Brand Colors A. 240:235:230 167:162:157 114:115:117 Brand Grays B. 220:220:224 187:187:191 Background Grays C. 253:243:173 184:208:245 242:203:231 153:224:217 245:208:206 198:233:189 Table Highlight D. E. 0:0:0 114:115:117 Table Borders F. Functional Data Colors G. 194:23:10 243:196:63 57:128:37 Primary Sequence 9:44:97 114:151:197 166:66:140 21:151:136 224:115:26 117:55:173 176:48:48 189:140:0 105.55.14 97:122:39 9:107:96 59:124:222 64:37:56 145:87:196 9:74:171 143:106:4 107:20:20 199:97:172 55:71:19 59:26:89 1. 2. 3. 4. 5. 6. 7. 8. 9. 10. 11. 12. 13. 14. 15. 16. 17. 18. 19. 20. Theme Colors Primary Sequence Secondary Shade $5 $10 $15 $20 $25 Mar-2021 Mar-2022 Mar-2023 Mar-2024 Mar-2025 Mar-2026 $ 16.25 1m VWAP: 3m VWAP: 6m VWAP: 52w Low: 12m VWAP: 9m VWAP: Select Medical Share Price Performance Over Last Five Years Source: FactSet as of 09-Mar-2026 1 Proposal received 24-Nov-2025 after market close; stock price reaction reflects following trading day. 2 Acquisition announced 02-Mar-2026 after market close; stock price reaction reflects following trading day. PROPRIETARY & CONFIDENTIAL Share Price Performance Commentary Date 1 Day Reaction Event 21-Jun-21 2.9 % ▪ Announces acquisition of Acuity Healthcare, including four LTAC hospitals as well as joint ventures with AtlantiCare, Mon Health, and Virtua Health 06-Aug-21 (4.6)% ▪ Reports Q2 2021 earnings, beating revenue estimates by 10.3% and EBITDA by 68.1% ; sell-off driven by concerns about one-time nature of CARES provider relief 06-May-22 3.6 % ▪ Reports Q1 2022 results, beating revenue estimates by 2.7% and EBITDA estimates by 11.8% 24-Feb-23 (7.9)% ▪ Reports full-year 2022 results, beating revenue estimates by 0.5% but missing EBITDA by (10.3)%; sell-off driven by cautious 2023 guidance and labor cost headwinds 03-Jan-24 (1.8)% ▪ Announces that the Board of Directors has formally agreed to pursue a spin-off of Concentra Group Holdings 23-Feb-24 9.8 % ▪ Reports Q4 2023 results, beating revenue estimates by 1.1% but missing EBITDA by (1.8)%, share price reaction driven by more attractive go-forward labor cost outlook 03-May-24 10.5 % ▪ Reports Q1 2024 results, beating revenue estimates by 2.5% and EBITDA by 17.6%, driven by a significant moderation in salary, wage, and benefits expenses 25-Jul-24 1.6 % ▪ Concentra begins trading on the NYSE under the ticker CON 02-Aug-24 (12.8)% ▪ Reports Q2 2024 results, beating revenue estimates by 0.8% and beating EBITDA by 2.2%; selloff driven by elevated operating expenses and Concentra IPO uncertainty 01-Nov-24 12.1 % ▪ Reports Q3 2024 results, beating revenue estimates by 1.2% and beating EBITDA by 4.9% and raising 2024 guidance 25-Nov-24 (2.4)% ▪ Completes tax-free distribution of Concentra shares to Select Medical shareholders 02-May-25 (21.8)% ▪ Reports Q1 2025 earnings, missing revenue by (3.0)% and missing EBITDA by (7.4)%, driven by a downward revision to 2025 guidance driven by the High-Cost Outlier threshold and 20% transmittal rule 01-Aug-25 (15.0)% ▪ Reports Q2 2025 results, missing revenue estimates by (0.1)% and EBITDA by (0.7)% driven by CIRH margin compression and rising labor expenses 31-Oct-25 (2.6)% ▪ Reports Q3 2025 earnings, beating revenue by 2.3% and missing EBITDA by (1.9)%, driven by heightened labor costs coupled with unfavorable payer mix 25-Nov-251 11.1 % ▪ Acknowledges receipt of non-binding proposal from Executive Chairman Robert Ortenzio 28-Jan-26 (1.3)% ▪ CMS announces MA and Part D advance rate notice of 0.7%, below consensus expectations of 4 – 5% 21-Feb-25 (6.7)% ▪ Reports Q4 2025 results, beating revenue estimates by 2.3% but missing EBITDA by (18.1)% driven by outpatient margin compression 03-Mar-262 8.4 % ▪ Announces acquisition by buyer consortium 14 15 15 18 18 14 16 16 3 12 12 3 -Jun-21 Acuity and enter new joint ventures, adding 7 critical illness -through-partnership model. May-22 Jan-24 spin-off of , its occupational health segment, to -Jul-24 -Nov-24 -Off Completion - -Dec-25 Landmark Hospital of Savannah - -Feb-26 Mar-26 -Private Deal Executive Chairman Robert Ortenzio and for $16.50 per share in cash. Mar-26 ~8.4% 5 5 8 8 11 11 4 4 2 2 1 1 6 7 9 10 13 17 Date 1 Day n Event 1 1 -Jun- 2.9 % four LTAC hospitals as well as joint ventures with AtlantiCare, Mon Health, and Virtua Health 2 2 -Aug 21 (4.6)% by 10.3% and EBITDA by 68.1% ; sell-off driven by concerns about one-time nature of CARES provider relief fund payments and labor cost trend 3 3 -May 22 3.6 % Reports Q1 2022 results, beating revenue estimates by 2.7% and EBITDA estimates by 11.8% 4 4 -Feb- (7.9)% Reports full-year 2022 results, beating revenue estimates by 0.5% but missing EBITDA by (10.3)%; sell-off driven by cautious 2023 guidance and labor cost headwinds 5 5 -Jan- (1.8)% Announces that the Board of Directors has formally agreed to pursue a spin-off of Concentra Group Holdings - 6 -Feb- 9.8 % Reports Q4 2023 results, beating revenue estimates by 1.1% but missing EBITDA by (1.8)%, share price reaction driven by more attractive go-forward labor cost outlook - 7 -May 24 10.5 % Reports Q1 2024 results, beating revenue estimates by 2.5% and EBITDA by 17.6% moderation in salary, wage, and benefits expenses 6 8 -Jul- 1.6 % Concentra begins trading on the NYSE under the ticker CON - 9 -Aug 24 Reports Q2 2024 results, beating revenue estimates by 0.8% and beating EBITDA by 2.2%; selloff driven by elevated operating expenses and Concentra IPO uncertainty - 10 -Nov 24 12.1 % Reports Q3 2024 results, beating revenue estimates by 1.2% and beating EBITDA by 4.9% and raising 2024 guidance 7 11 -Nov 24 (2.4)% Completes tax-free distribution of Concentra shares to Select Medical shareholders 8 12 -May 25 Reports Q1 2025 earnings, missing revenue by and missing EBITDA by (7.4)% revision to 2025 guidance driven by the High-Cost Outlier threshold and 20% transmittal rule - 13 -Aug 25 Reports Q2 2025 results, missing revenue estimates by (0.1)% and EBITDA by (0.7)% driven by CIRH margin compression and rising labor expenses 9 14 -Oct- (2.6)% Reports Q3 2025 earnings, beating revenue by 2.3% and missing EBITDA by (1.9)%, driven by heightened labor costs coupled with unfavorable payer mix 10 15 -Nov 251 11.1 % Acknowledges receipt of non-binding proposal from Executive Chairman Robert Ortenzio 11 16 -Jan- (1.3)% 0.7%, below consensus expectations of 4 – 5% - 17 -Feb- (6.7)% Reports Q4 2025 results, beating revenue estimates by 2.3% but missing EBITDA by (18.1)% driven by outpatient margin compression 12 18 -Mar 262 8.4 % Announces acquisition by buyer consortium 6 7 9 10 13 17 |
| 6 114:151:197 255:255:255 0:0:0 Brand Colors A. 240:235:230 167:162:157 114:115:117 Brand Grays B. 220:220:224 187:187:191 Background Grays C. 253:243:173 184:208:245 242:203:231 153:224:217 245:208:206 198:233:189 Table Highlight D. E. 0:0:0 114:115:117 Table Borders F. Functional Data Colors G. 194:23:10 243:196:63 57:128:37 Primary Sequence 9:44:97 114:151:197 166:66:140 21:151:136 224:115:26 117:55:173 176:48:48 189:140:0 105.55.14 97:122:39 9:107:96 59:124:222 64:37:56 145:87:196 9:74:171 143:106:4 107:20:20 199:97:172 55:71:19 59:26:89 1. 2. 3. 4. 5. 6. 7. 8. 9. 10. 11. 12. 13. 14. 15. 16. 17. 18. 19. 20. Theme Colors Primary Sequence Secondary Shade Appendix PROPRIETARY & CONFIDENTIAL |
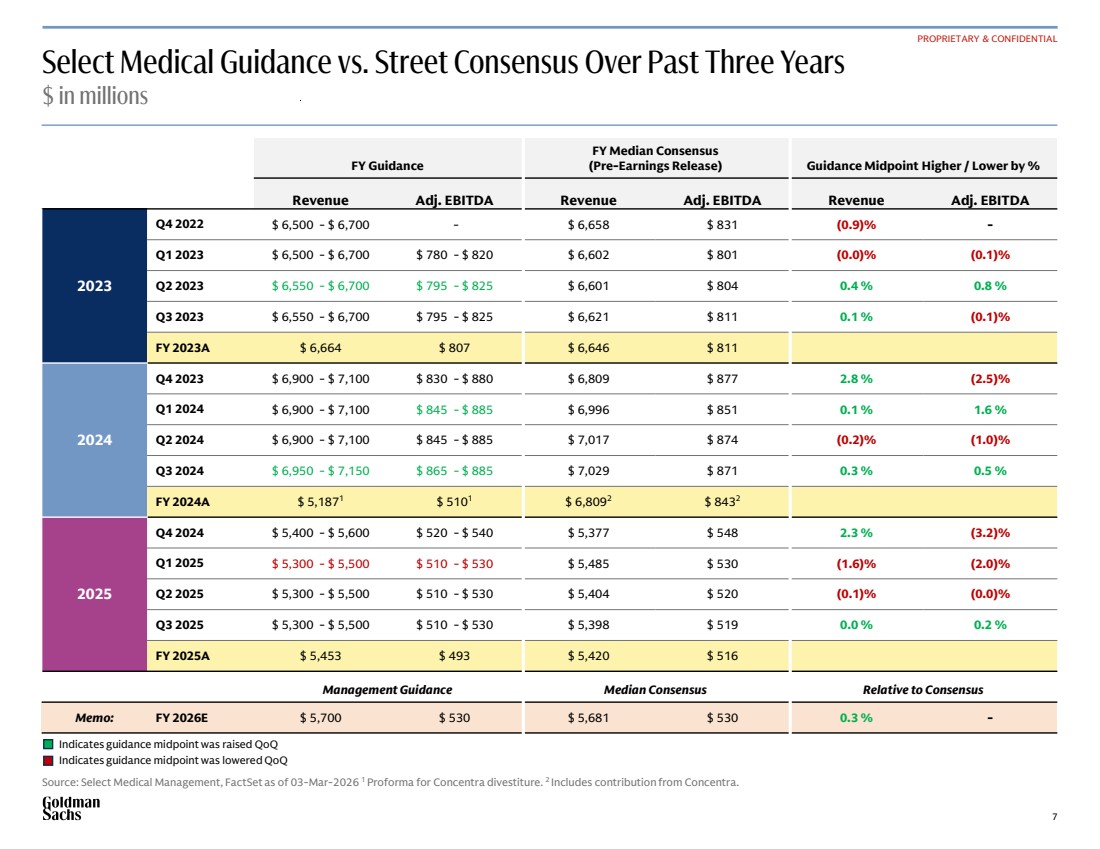
| 7 114:151:197 255:255:255 0:0:0 Brand Colors A. 240:235:230 167:162:157 114:115:117 Brand Grays B. 220:220:224 187:187:191 Background Grays C. 253:243:173 184:208:245 242:203:231 153:224:217 245:208:206 198:233:189 Table Highlight D. E. 0:0:0 114:115:117 Table Borders F. Functional Data Colors G. 194:23:10 243:196:63 57:128:37 Primary Sequence 9:44:97 114:151:197 166:66:140 21:151:136 224:115:26 117:55:173 176:48:48 189:140:0 105.55.14 97:122:39 9:107:96 59:124:222 64:37:56 145:87:196 9:74:171 143:106:4 107:20:20 199:97:172 55:71:19 59:26:89 1. 2. 3. 4. 5. 6. 7. 8. 9. 10. 11. 12. 13. 14. 15. 16. 17. 18. 19. 20. Theme Colors Primary Sequence Secondary Shade Select Medical Guidance vs. Street Consensus Over Past Three Years Source: Select Medical Management, FactSet as of 03-Mar-2026 1 Proforma for Concentra divestiture. 2 Includes contribution from Concentra. PROPRIETARY & CONFIDENTIAL FY Guidance FY Median Consensus (Pre-Earnings Release) Guidance Midpoint Higher / Lower by % Revenue Adj. EBITDA Revenue Adj. EBITDA Revenue Adj. EBITDA 2023 Q4 2022 $ 6,500 - $ 6,700 - $ 6,658 $ 831 (0.9)% - Q1 2023 $ 6,500 - $ 6,700 $ 780 - $ 820 $ 6,602 $ 801 (0.0)% (0.1)% Q2 2023 $ 6,550 - $ 6,700 $ 795 - $ 825 $ 6,601 $ 804 0.4 % 0.8 % Q3 2023 $ 6,550 - $ 6,700 $ 795 - $ 825 $ 6,621 $ 811 0.1 % (0.1)% FY 2023A $ 6,664 $ 807 $ 6,646 $ 811 2024 Q4 2023 $ 6,900 - $ 7,100 $ 830 - $ 880 $ 6,809 $ 877 2.8 % (2.5)% Q1 2024 $ 6,900 - $ 7,100 $ 845 - $ 885 $ 6,996 $ 851 0.1 % 1.6 % Q2 2024 $ 6,900 - $ 7,100 $ 845 - $ 885 $ 7,017 $ 874 (0.2)% (1.0)% Q3 2024 $ 6,950 - $ 7,150 $ 865 - $ 885 $ 7,029 $ 871 0.3 % 0.5 % FY 2024A $ 5,1871 $ 5101 $ 6,8092 $ 8432 2025 Q4 2024 $ 5,400 - $ 5,600 $ 520 - $ 540 $ 5,377 $ 548 2.3 % (3.2)% Q1 2025 $ 5,300 - $ 5,500 $ 510 - $ 530 $ 5,485 $ 530 (1.6)% (2.0)% Q2 2025 $ 5,300 - $ 5,500 $ 510 - $ 530 $ 5,404 $ 520 (0.1)% (0.0)% Q3 2025 $ 5,300 - $ 5,500 $ 510 - $ 530 $ 5,398 $ 519 0.0 % 0.2 % FY 2025A $ 5,453 $ 493 $ 5,420 $ 516 Management Guidance Median Consensus Relative to Consensus Memo: FY 2026E $ 5,700 $ 530 $ 5,681 $ 530 0.3 % - $ in millions Indicates guidance midpoint was raised QoQ Indicates guidance midpoint was lowered QoQ |
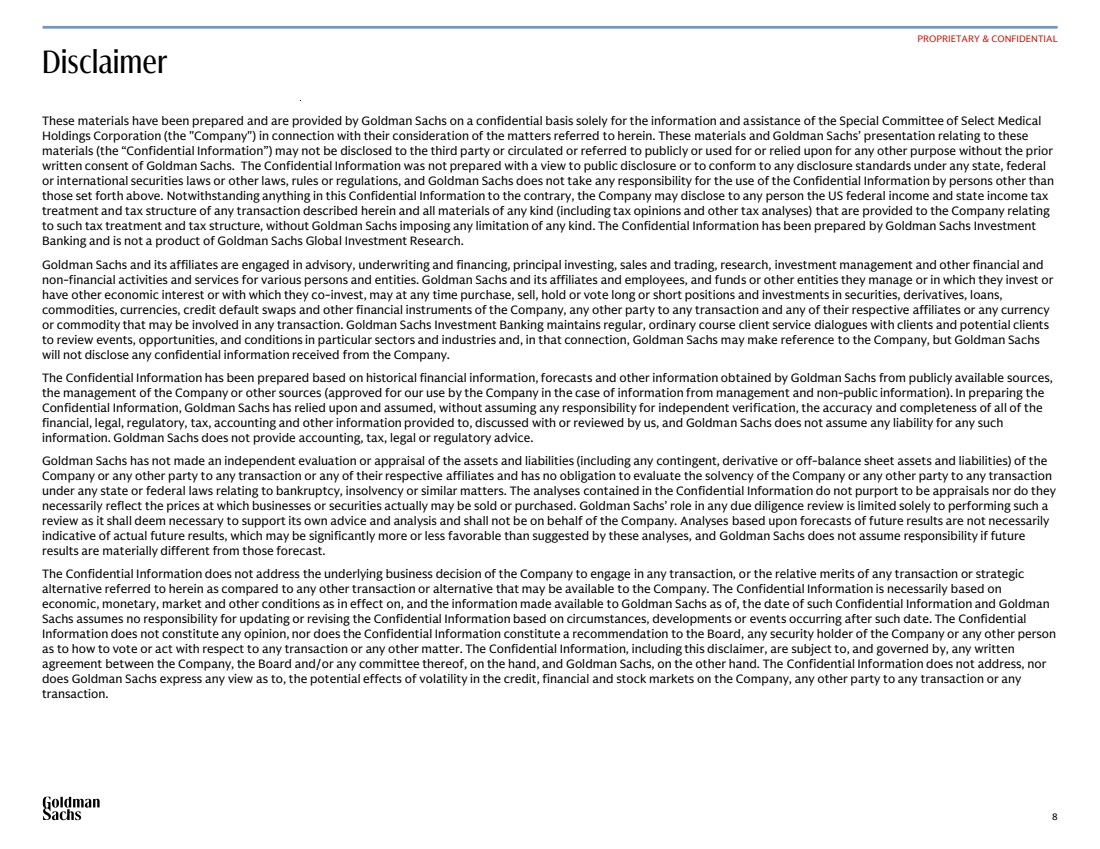
| 8 114:151:197 255:255:255 0:0:0 Brand Colors A. 240:235:230 167:162:157 114:115:117 Brand Grays B. 220:220:224 187:187:191 Background Grays C. 253:243:173 184:208:245 242:203:231 153:224:217 245:208:206 198:233:189 Table Highlight D. E. 0:0:0 114:115:117 Table Borders F. Functional Data Colors G. 194:23:10 243:196:63 57:128:37 Primary Sequence 9:44:97 114:151:197 166:66:140 21:151:136 224:115:26 117:55:173 176:48:48 189:140:0 105.55.14 97:122:39 9:107:96 59:124:222 64:37:56 145:87:196 9:74:171 143:106:4 107:20:20 199:97:172 55:71:19 59:26:89 1. 2. 3. 4. 5. 6. 7. 8. 9. 10. 11. 12. 13. 14. 15. 16. 17. 18. 19. 20. Theme Colors Primary Sequence Secondary Shade Disclaimer These materials have been prepared and are provided by Goldman Sachs on a confidential basis solely for the information and assistance of the Special Committee of Select Medical Holdings Corporation (the "Company") in connection with their consideration of the matters referred to herein. These materials and Goldman Sachs’ presentation relating to these materials (the “Confidential Information”) may not be disclosed to the third party or circulated or referred to publicly or used for or relied upon for any other purpose without the prior written consent of Goldman Sachs. The Confidential Information was not prepared with a view to public disclosure or to conform to any disclosure standards under any state, federal or international securities laws or other laws, rules or regulations, and Goldman Sachs does not take any responsibility for the use of the Confidential Information by persons other than those set forth above. Notwithstanding anything in this Confidential Information to the contrary, the Company may disclose to any person the US federal income and state income tax treatment and tax structure of any transaction described herein and all materials of any kind (including tax opinions and other tax analyses) that are provided to the Company relating to such tax treatment and tax structure, without Goldman Sachs imposing any limitation of any kind. The Confidential Information has been prepared by Goldman Sachs Investment Banking and is not a product of Goldman Sachs Global Investment Research. Goldman Sachs and its affiliates are engaged in advisory, underwriting and financing, principal investing, sales and trading, research, investment management and other financial and non-financial activities and services for various persons and entities. Goldman Sachs and its affiliates and employees, and funds or other entities they manage or in which they invest or have other economic interest or with which they co-invest, may at any time purchase, sell, hold or vote long or short positions and investments in securities, derivatives, loans, commodities, currencies, credit default swaps and other financial instruments of the Company, any other party to any transaction and any of their respective affiliates or any currency or commodity that may be involved in any transaction. Goldman Sachs Investment Banking maintains regular, ordinary course client service dialogues with clients and potential clients to review events, opportunities, and conditions in particular sectors and industries and, in that connection, Goldman Sachs may make reference to the Company, but Goldman Sachs will not disclose any confidential information received from the Company. The Confidential Information has been prepared based on historical financial information, forecasts and other information obtained by Goldman Sachs from publicly available sources, the management of the Company or other sources (approved for our use by the Company in the case of information from management and non-public information). In preparing the Confidential Information, Goldman Sachs has relied upon and assumed, without assuming any responsibility for independent verification, the accuracy and completeness of all of the financial, legal, regulatory, tax, accounting and other information provided to, discussed with or reviewed by us, and Goldman Sachs does not assume any liability for any such information. Goldman Sachs does not provide accounting, tax, legal or regulatory advice. Goldman Sachs has not made an independent evaluation or appraisal of the assets and liabilities (including any contingent, derivative or off-balance sheet assets and liabilities) of the Company or any other party to any transaction or any of their respective affiliates and has no obligation to evaluate the solvency of the Company or any other party to any transaction under any state or federal laws relating to bankruptcy, insolvency or similar matters. The analyses contained in the Confidential Information do not purport to be appraisals nor do they necessarily reflect the prices at which businesses or securities actually may be sold or purchased. Goldman Sachs’ role in any due diligence review is limited solely to performing such a review as it shall deem necessary to support its own advice and analysis and shall not be on behalf of the Company. Analyses based upon forecasts of future results are not necessarily indicative of actual future results, which may be significantly more or less favorable than suggested by these analyses, and Goldman Sachs does not assume responsibility if future results are materially different from those forecast. The Confidential Information does not address the underlying business decision of the Company to engage in any transaction, or the relative merits of any transaction or strategic alternative referred to herein as compared to any other transaction or alternative that may be available to the Company. The Confidential Information is necessarily based on economic, monetary, market and other conditions as in effect on, and the information made available to Goldman Sachs as of, the date of such Confidential Information and Goldman Sachs assumes no responsibility for updating or revising the Confidential Information based on circumstances, developments or events occurring after such date. The Confidential Information does not constitute any opinion, nor does the Confidential Information constitute a recommendation to the Board, any security holder of the Company or any other person as to how to vote or act with respect to any transaction or any other matter. The Confidential Information, including this disclaimer, are subject to, and governed by, any written agreement between the Company, the Board and/or any committee thereof, on the hand, and Goldman Sachs, on the other hand. The Confidential Information does not address, nor does Goldman Sachs express any view as to, the potential effects of volatility in the credit, financial and stock markets on the Company, any other party to any transaction or any transaction. PROPRIETARY & CONFIDENTIAL |