

Management's Discussion and Analysis of
Results of Operations and Financial Condition
For the three and six months ended
June 30, 2026
July 28, 2026
INTRODUCTION
This Management's Discussion and Analysis ("MD&A") dated July 28, 2026 is intended to supplement Hudbay Minerals Inc.'s unaudited condensed consolidated interim financial statements and related notes for the three and six months ended June 30, 2026 and 2025 (the "consolidated interim financial statements"). The consolidated interim financial statements have been prepared in accordance with IFRS® Accounting Standards ("IFRS" or "GAAP") as issued by the International Accounting Standards Board ("IASB").
References to "Hudbay" or the "Company" refer to Hudbay Minerals Inc. and its direct and indirect subsidiaries as at June 30, 2026.
Readers should be aware that:
- This MD&A contains certain "forward-looking statements" and "forward-looking information" (collectively, "forward-looking information") that are subject to risk factors set out in a cautionary note contained in Hudbay's MD&A.
- This MD&A has been prepared in accordance with the requirements of the securities laws in effect in Canada, which may differ materially from the requirements of United States securities laws applicable to US issuers.
- Hudbay uses a number of non-GAAP financial performance measures in Hudbay's MD&A, which do not have standardized meaning under IFRS. For further information and detailed reconciliations of such measures, please see the discussion under the "Non-GAAP Financial Performance Measures" section herein.
- The technical and scientific information in this MD&A has been approved by qualified persons based on a variety of assumptions and estimates. Please see the discussion under the "Qualified Persons and NI 43-101" section herein.
Readers are also urged to review the "Notes to Reader" section beginning on page 68 of this MD&A.
Additional information regarding Hudbay, including the risks related to its business and those that are reasonably likely to affect its consolidated interim financial statements in the future, is contained in Hudbay's continuous disclosure materials, including its most recent Annual Information Form, consolidated interim financial statements and Management Information Circular available on SEDAR+ at www.sedarplus.ca and on EDGAR at www.sec.gov.
All amounts are in US dollars unless otherwise noted.
HUDBAY'S BUSINESS
Hudbay is a copper-focused critical minerals company with three long-life operations and a world-class pipeline of copper growth projects in tier-one mining jurisdictions of Canada, Peru and the United States. Hudbay's operating portfolio includes the Constancia mine in Cusco (Peru), the Snow Lake operations in Manitoba (Canada) and the Copper Mountain mine in British Columbia (Canada). Copper is the primary metal produced by the Company, which is complemented by meaningful gold production and by-product zinc, silver and molybdenum. The Company's growth pipeline includes the Copper World project in Arizona (United States), the Cactus project in Arizona (United States), the Mason project in Nevada (United States), the Llaguen project in La Libertad (Peru) and several expansion and exploration opportunities near its existing operations. Hudbay is governed by the Canada Business Corporations Act and its shares are listed under the symbol "HBM" on the Toronto Stock Exchange, New York Stock Exchange and Bolsa de Valores de Lima.
HUDBAY'S PURPOSE
The value Hudbay creates and the impact it has is embodied in its purpose statement: "We care about our people, our communities and our planet. Hudbay provides the metals the world needs. We work sustainably, transform lives and create better futures for communities."
Hudbay transforms lives: Hudbay invests in its employees, their families and local communities through long-term employment, local procurement and economic development to improve their quality of life and ensure the communities benefit from the Company's presence.
Hudbay operates responsibly: From exploration to closure, Hudbay operates safely and responsibly, welcomes innovation and strives to minimize its environmental footprint while following leading operating practices in all facets of mining.
Hudbay provides critical metals: Hudbay produces copper and other metals needed for everyday products and essential for applications to support the energy transition toward a more sustainable future.
SUMMARY
Delivered Strong Second Quarter Financial Results; Production Guidance Reaffirmed and Cost Guidance Improved
• Achieved quarterly revenue of $631.3 million, net earnings attributable to owners1 of $137.4 million, quarterly adjusted EBITDA1 of $321.2 million and adjusted net earnings attributable to owners1 of $113.5 million in the second quarter, driven by steady operating performance, attractive operating margins and strong exposure to copper and gold across Hudbay's diversified operating portfolio.
• Steady production continued in the second quarter with consolidated copper and gold production of 28,267 tonnes and 51,234 ounces, respectively, with higher copper production in line with quarterly cadence expectations while gold production was slightly lower than quarterly cadence expectations.
• Industry-leading margins continue to be achieved with consolidated cash cost1 and sustaining cash cost1, net of by-product credits, of $(0.40) and $1.39, per pound of copper respectively, in the second quarter of 2026.
• Reaffirmed full year 2026 consolidated production guidance including 110,000 to 138,000 tonnes of copper and 217,000 to 272,000 ounces of gold.
• Improved full year 2026 consolidated cash cost1 guidance to $(0.45) to $(0.25) per pound of copper from $(0.30) to $(0.10) per pound as costs are tracking well below the low end of the guidance range given strong exposure to gold by-product credits and continued operating efficiencies are more than offsetting higher input costs for fuel and consumables.
• Peru operations produced 19,446 tonnes of copper and 5,282 ounces of gold in the second quarter of 2026, in line with quarterly cadence expectations with a planned semi-annual plant maintenance shutdown during the quarter. Peru cash cost1, net of by-product credits, of $1.66 per pound outperformed the low end of the 2026 annual guidance range of $1.70 to $2.10 per pound despite the lower planned production and higher fuel costs.
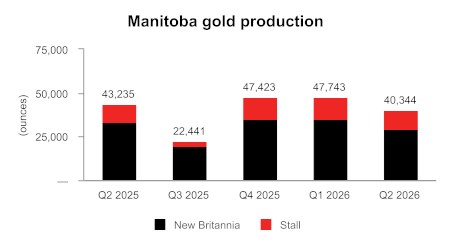
• Manitoba operations produced 40,344 ounces of gold, 2,366 tonnes of copper, 4,760 tonnes of zinc and 209,478 ounces of silver in the second quarter of 2026, slightly lower than quarterly cadence expectations. Manitoba cash cost1 of $776 per ounce of gold was within the annual guidance range of $500 to $800 per ounce.
• British Columbia operations produced 6,455 tonnes of copper, 5,608 ounces of gold and 71,178 ounces of silver in the second quarter of 2026, in line with quarterly cadence expectations. British Columbia cash cost1 of $3.22 per pound of copper was higher than the annual cost guidance range of $1.50 to $2.50 per pound primarily due to elevated fuel prices and timing of equipment maintenance. British Columbia cash cost is expected to improve in the second half of the year, in line with the annual guidance range.
• Second quarter earnings per share attributable to owners was $0.34, reflecting strong gross profit margins as a result of the continued focus on strong cost control and higher metal prices more than offsetting higher input costs. After adjusting for various non-cash items on a pre-tax basis, second quarter adjusted earnings1 per share attributable to owners was $0.28.
• Cash and cash equivalents were $890.9 million and total liquidity2 was $1,044.6 million at the end of the second quarter of 2026, despite using cash to retire over $200 million in long term debt and benefitting from the approximate $420 million initial cash contribution from Mitsubishi Corporation ("Mitsubishi") received on closing of the Copper World joint venture transaction in January 2026.
Continued Strong Cash Flow Generation and Prudent Balance Sheet Management
• Hudbay's unique copper and gold diversification across its operations provides exposure to higher copper and gold prices, which together with a focus on cost control across the business, continues to realize strong margins and generate significant free cash flow.
• While the majority of Hudbay's revenue continues to be derived from copper production, revenue from gold production represents a meaningful portion of total revenues. Gold revenues were 38% of total revenue in the second quarter of 2026.
• Cash generated from operating activities was $297.0 million during the second quarter of 2026, reflecting an increase of $85.7 million compared to the first quarter partially as a result of favourable changes in non-cash working capital.
• Operating cash flow before changes in non-cash working capital was $210.1 million during the second quarter of 2026, relatively consistent with the first quarter.
• Delivered free cash flow1 generation of $101.8 million during the second quarter of 2026, representing a similar level of free cash flow generation to the first quarter through continued strong operating margins and cost controls, resulting in more than $200 million of free cash flow generated in the first half of 2026 despite investing over $200 million of sustaining capital in the business over this period.
• Achieved quarterly adjusted EBITDA1 of $321.2 million in the second quarter of 2026, resulting in record trailing twelve month adjusted EBITDA1 of $1,271.6 million.
• Achieved net debt1 of negative $80.5 million as at June 30, 2026, representing an $86.1 million improvement from the first quarter of 2026 and positioning the Company well to reinvest in high-return growth capital projects across the business.
• Net debt to adjusted EBITDA ratio1 was negative 0.1x in the second quarter of 2026, significantly improved from 0.4x in the fourth quarter of 2025 as a result of the initial proceeds received from Mitsubishi on closing of the Copper World joint venture transaction along with strong cash flows from operations.
• Consistent with Hudbay's prudent balance sheet management and focus on cost of capital, Hudbay repaid $472.5 million of its outstanding 2026 senior unsecured notes on maturity on April 1, 2026, using a combination of cash on hand and a $272 million draw on its low-cost revolving credit facilities, providing the Company with enhanced financial flexibility in advance of a Copper World sanctioning decision later this year.
• Received proceeds of an offering of $52 million in aggregate principal amount of solid waste disposal revenue bonds with an initial mandatory tender date in 2036. These long-term, low-cost, non-amortizing U.S. municipal bonds, may be used for certain eligible costs associated with the development of Copper World.
• Hudbay's enhanced Capital Allocation Framework is embedded into its annual financial planning cycle to provide a holistic approach to capital allocation decisions to maximize long-term risk-adjusted returns, including capital deployment into brownfield projects, greenfield projects, strategic investments and exploration, while considering debt repurchases, share buybacks and dividends.
Advancing Generational Growth Investments to Further Enhance Copper and Gold Exposure
• The Copper World definitive feasibility study ("DFS") is progressing well, and a project sanctioning decision continues to be on track for late 2026. The DFS is expected to include scope for future mill expansion optionality.
• Completed the acquisition of Arizona Sonoran Copper Company Inc. ("ASCU") to bring together two highly complementary copper growth assets in Arizona and strengthen Hudbay's position as a premier Americas-focused copper company with a pipeline of long-life, low-cost assets located in tier-one jurisdictions. The acquisition of ASCU enhances Hudbay's long-term copper production profile and expands its U.S. growth pipeline through the staged development of Copper World and Cactus. Hudbay expects to spend approximately $30 million at Cactus in the second half of 2026 to advance an updated pre-feasibility study, perform site de-risking activities, conduct exploration activities and for other ongoing site costs.
• Continued to advance a large Snow Lake exploration program to further increase near-term production and mineral reserves, test regional satellite deposits for additional mill feed to utilize available capacity at Stall and explore the large land package for a new anchor deposit to meaningfully extend mine life.
• Celebrated the official groundbreaking of the New Ingerbelle expansion project at Copper Mountain, marking a significant milestone for the operation and its long-term future in British Columbia, enhancing the copper and gold production profile and securing a longer mine life. Growth capital expenditures in British Columbia in 2026 are expected to increase by approximately $30 million to $115 million due to additional costs associated with the development of infrastructure for New Ingerbelle.
• Received approval from the government in Peru to further increase annual mill processing capacity at Constancia to 34 million tonnes of ore per annum from the previously permitted 31 million tonnes, enabling additional capacity to further optimize Constancia's operations and deliver strong copper production.
• Advanced initial pre-feasibility study activities at the Mason copper project in Nevada.
Summary of Second Quarter Results
Hudbay's diversified asset portfolio delivered consolidated copper production of 28,267 tonnes and consolidated gold production of 51,234 ounces in the second quarter of 2026. Consolidated copper production was higher than the first quarter of 2026 as higher mill throughput in British Columbia more than offset lower planned mill throughput in Peru. Consolidated gold production was lower than the first quarter of 2026 primarily due to lower milled gold grades. Consolidated silver production of 845,161 ounces was higher than the first quarter of 2026 due to higher grades and recoveries in British Columbia. Zinc production of 4,760 tonnes in the second quarter of 2026 also increased compared to the previous quarter, primarily reflecting higher ore grades at the Manitoba operations.
Cash generated from operating activities was $297.0 million during the second quarter of 2026, reflecting an increase of $85.7 million compared to the first quarter of 2026 and an increase of $37.1 million compared to the same period in 2025. The increases are partially as a result of favourable changes in non-cash working capital. Operating cash flow before changes in non-cash working capital was $210.1 million during the second quarter of 2026 and remained relatively consistent with the first quarter of 2026 and second quarter of 2025.
Adjusted EBITDA1 was $321.2 million in the second quarter of 2026, a decrease compared to the record $421.9 million achieved in the first quarter of 2026, primarily due to lower sales volumes, partially offset by higher copper prices. Second quarter adjusted EBITDA1 increased by 31% compared to $245.2 million in the second quarter of 2025 as a result of higher metal prices partially offset by lower sales volumes of all metals. The lower sales volumes in the second quarter of 2026 was impacted by a temporary build-up of concentrate inventory at the port in Peru. This accumulation was caused by ocean swells that resulted in temporary port closures and delayed scheduled shipments of approximately 10,000 dry metric tonnes of copper concentrate which were delivered in the first half of July 2026.
Net earnings attributable to owners was $137.4 million, or $0.34 per share, in the second quarter of 2026 compared to $190.4 million, or $0.48 per share, in the first quarter of 2026. The decrease is primarily the result of lower revenue due to lower sales volumes of all metals.
Adjusted net earnings attributable to owners1 and adjusted net earnings per share attributable to owners1 in the second quarter of 2026 were $113.5 million and $0.28 per share, respectively, after adjusting for various non-cash items on a pre-tax basis including a $38.2 million mark-to-market revaluation net gain on various financial instruments such as investments and share-based compensation, a non-cash $12.0 million foreign exchange loss, an $11.5 million business interruption insurance recovery related to the Manitoba mandatory wildfire evacuations shutdowns in 2025, among other items. This compares to adjusted net earnings attributable to owners1 and net earnings per share attributable to owners1 of $161.0 million and $0.40 per share, respectively, in the first quarter of 2026. The decrease is a result of lower realized metal prices for gold and the aforementioned lower sales volumes.
Consolidated cash cost1, net of by-product credits, in the second quarter of 2026 was $(0.40) per pound of copper, compared to record low cash cost of $(1.80) per pound in the first quarter of 2026. The increase from the first quarter of 2026 was a result of lower by-product credits from lower gold volumes. When compared to the second quarter of 2025, consolidated cash cost1, net of by-product credits1 decreased by $0.38 per pound as a result of higher by-product credits, partially offset by lower production.
Consolidated sustaining cash cost1, net of by-product credits, in the second quarter of 2026 was $1.39 per pound of copper, compared to $0.00 per pound in the first quarter of 2026. This increase was primarily due to the same factors impacting consolidated cash cost noted above. When compared to the second quarter of 2025, consolidated sustaining cash cost1, net of by-production credits decreased by $0.26 per pound due to the same factors impacting consolidated cash cost noted above.
Consolidated all-in sustaining cash cost1, net of by-product credits, in the second quarter of 2026 was $1.80 per pound of copper, higher than the first quarter of 2026 due to the same reasons noted above, partially offset by lower corporate general and administrative ("G&A") costs from the impact of the revaluation of Hudbay's share-based compensation.
As at June 30, 2026, total liquidity2 was $1,044.6 million, including $890.9 million in cash and cash equivalents, which excludes $49.8 million in U.S. municipal bond proceeds that is classified as restricted cash, and undrawn availability of $153.7 million under Hudbay's revolving credit facilities. Net debt1 at the end of the second quarter was negative $80.5 million, marking an $86.1 million improvement from first quarter of 2026, primarily as a result of positive cash flows from operations. Hudbay expects that the current liquidity, together with cash flows from operations, will be sufficient to meet the Company's liquidity needs for the next 12 months.
KEY FINANCIAL RESULTS
| Financial Condition | ||||||
| (in $ millions, except net debt to adjusted EBITDA ratio) | Jun. 30, 2026 | Dec. 31, 2025 | ||||
| Cash and cash equivalents1 | $ | 890.9 | $ | 568.9 | ||
| Total long-term debt | 860.2 | 1,008.6 | ||||
| Net debt2, 3 | (80.5 | ) | 439.7 | |||
| Working capital4 | 751.8 | (65.6 | ) | |||
| Total assets | 8,062.0 | 6,223.3 | ||||
| Equity attributable to owners of the Company | 4,797.2 | 3,231.0 | ||||
| Net debt to adjusted EBITDA 2 | (0.1 | ) | 0.4 |
1 As at June 30, 2026 cash and cash equivalents include $334.5 million in cash held by Copper World LLC. These funds are contractually restricted solely for the advancement of the Copper World project and are not available to the general Hudbay group.
2 Net debt and net debt to adjusted EBITDA are non-GAAP financial performance measures with no standardized definition under IFRS. For further information, please see discussion under the "Non-GAAP Financial Performance Measures" section of this MD&A.
3 Hudbay calculates net debt as total long-term debt less cash and cash equivalents and restricted cash related to unspent proceeds of its senior unsecured municipal bond financing.
4 Working capital is determined as total current assets less total current liabilities as defined under IFRS and disclosed on the consolidated interim financial statements.
| Financial Performance | Three months ended | Six months ended | |||||||||||||
| (in $ millions, except per share amounts or as noted below) | Jun. 30, 2026 | Mar. 31, 2026 |
Jun. 30, 2025 |
Jun. 30, 2026 |
June. 30, 2025 |
||||||||||
| Revenue | $ | 631.3 | $ | 757.3 | $ | 536.4 | $ | 1,388.6 | $ | 1,131.3 | |||||
| Cost of sales | 362.3 | 389.3 | 359.9 | 751.6 | 723.5 | ||||||||||
| Earnings before tax | 240.4 | 339.0 | 153.1 | 579.4 | 324.4 | ||||||||||
| Net earnings | 138.1 | 191.5 | 114.7 | 329.6 | 213.9 | ||||||||||
| Net earnings attributable to owners | 137.4 | 190.4 | 117.7 | 327.8 | 218.1 | ||||||||||
| Basic and diluted earnings per share - attributable | 0.34 | 0.48 | 0.30 | 0.82 | 0.55 | ||||||||||
| Adjusted earnings per share - attributable1 | 0.28 | 0.40 | 0.19 | 0.69 | 0.43 | ||||||||||
| Operating cash flow before change in non-cash working capital | 210.1 | 208.7 | 193.9 | 418.8 | 357.4 | ||||||||||
| Adjusted EBITDA1 | 321.2 | 421.9 | 245.2 | 743.1 | 532.4 | ||||||||||
| Free cash flow1 | 101.8 | 102.3 | 86.7 | 204.7 | 171.1 | ||||||||||
1 Adjusted earnings per share - attributable to owners, adjusted EBITDA and free cash flow are non-GAAP financial performance measures with no standardized definition under IFRS. For further information and a detailed reconciliation, please see discussion under the "Non-GAAP Financial Performance Measures" section of this MD&A.
KEY PRODUCTION RESULTS
| Three months ended | Six months ended | Guidance | |||||||||||||||||
| Jun. 30, 2026 |
Mar. 31, 2026 |
Jun. 30, 2025 |
Jun. 30, 2026 |
Jun. 30, 2025 |
Annual 2026 | ||||||||||||||
| Contained metal in concentrate and doré produced1 | |||||||||||||||||||
| Copper | tonnes | 28,267 | 27,929 | 29,956 | 56,196 | 60,914 | 110,000 - 138,000 | ||||||||||||
| Gold | oz | 51,234 | 61,700 | 56,271 | 112,934 | 130,055 | 217,000 - 272,000 | ||||||||||||
| Silver | oz | 845,161 | 787,449 | 814,989 | 1,632,610 | 1,734,764 | 2,900,000 - 3,690,000 | ||||||||||||
| Zinc | tonnes | 4,760 | 4,565 | 5,130 | 9,325 | 11,395 | 16,000 - 21,000 | ||||||||||||
| Molybdenum | tonnes | 277 | 380 | 375 | 657 | 772 | 900 - 1,100 | ||||||||||||
| Payable metal sold | |||||||||||||||||||
| Copper | tonnes | 23,780 | 29,544 | 30,354 | 53,324 | 62,122 | |||||||||||||
| Gold2 | oz | 56,266 | 66,562 | 62,466 | 122,828 | 137,558 | |||||||||||||
| Silver2 | oz | 674,490 | 923,051 | 894,160 | 1,597,541 | 1,901,128 | |||||||||||||
| Zinc | tonnes | 2,635 | 3,897 | 2,871 | 6,532 | 7,728 | |||||||||||||
| Molybdenum | tonnes | 298 | 375 | 427 | 673 | 875 | |||||||||||||
1 Metal reported in concentrate is prior to deductions associated with smelter contract terms and includes other secondary products.
2 Includes total payable gold and silver in concentrate and in doré sold and other secondary products.
KEY COST RESULTS
| Three months ended | Six months ended | Guidance | |||||||||||||||||
| Jun. 30, 2026 |
Mar. 31, 2026 |
Jun. 30, 2025 |
Jun. 30, 2026 |
Jun. 30, 2025 |
Annual 20262 |
||||||||||||||
| Peru cash cost per pound of copper produced | |||||||||||||||||||
| Cash cost1 | $/lb | 1.66 | 0.70 | 1.45 | 1.17 | 1.29 | 1.70 - 2.10 | ||||||||||||
| Sustaining cash cost1 | $/lb | 2.71 | 1.43 | 2.63 | 2.05 | 2.29 | |||||||||||||
| Manitoba cash cost per ounce of gold produced | |||||||||||||||||||
| Cash cost1 | $/oz | 776 | 408 | 710 | 577 | 515 | 500 - 800 | ||||||||||||
| Sustaining cash cost1 | $/oz | 1,358 | 833 | 1,025 | 1,074 | 793 | |||||||||||||
| British Columbia cash cost per pound of copper produced | |||||||||||||||||||
| Cash cost1 | $/lb | 3.22 | 2.41 | 2.39 | 2.87 | 2.41 | 1.50 - 2.50 | ||||||||||||
| Sustaining cash cost1 | $/lb | 6.23 | 7.81 | 5.18 | 6.91 | 4.69 | |||||||||||||
| Consolidated cash cost per pound of copper produced | |||||||||||||||||||
| Cash cost1 | $/lb | (0.40 | ) | (1.80 | ) | (0.02 | ) | (1.09 | ) | (0.24 | ) | (0.45) - (0.25 | ) | ||||||
| Sustaining cash cost1 | $/lb | 1.39 | 0.00 | 1.65 | 0.70 | 1.18 | 1.70 - 2.10 | ||||||||||||
| All-in sustaining cash cost1 | $/lb | 1.80 | 0.73 | 2.03 | 1.26 | 1.49 | |||||||||||||
1 Cash cost, sustaining cash cost, all-in sustaining cash cost per pound of copper produced, net of by-product credits, gold cash cost, sustaining cash cost per ounce of gold produced, and net of by-product credits are non-GAAP financial performance measures with no standardized definition under IFRS. For further information and a detailed reconciliation, please see the discussion under the "Non-GAAP Financial Performance Measures" section of this MD&A.
2 Improved full year 2026 consolidated copper cash cost guidance range to $(0.45) to $(0.25) per pound from the original guidance range of $(0.30) to $(0.10) per pound.
RECENT DEVELOPMENTS
Key Leadership Appointments
Hudbay is pleased to announce senior management team appointments as the Company positions itself for the next phase of transformational growth. Eugene Lei has been appointed President and Chief Financial Officer, with Peter Kukielski continuing as Chief Executive Officer. Robert Carter has been appointed Chief Operating Officer, transitioning from Andre Lauzon who will retire at the end of September.
Mr. Lei has been Chief Financial Officer since 2022 and has been responsible for providing strategic financial and capital markets leadership at Hudbay. He has been instrumental in the Company's significant transformation, and under his leadership, Hudbay successfully executed the strategic plan to unlock Copper World, which included achieving stated balance sheet targets ahead of schedule and prudently allocating capital to maximize shareholder value. He currently serves as the Chair of the Copper World Joint Venture board. Mr. Lei joined Hudbay in 2012 and progressed through several senior management roles with increasing executive responsibilities. He has over 25 years of global mining finance, investment banking and corporate development experience. Prior to joining Hudbay, Mr. Lei was Managing Director, Mining at Macquarie Capital Markets, working as an advisor on transformative mining mergers and acquisitions and leading equity capital markets offerings. He holds a Bachelor of Commerce (Honours) degree from Queen's University. In 2025, Mr. Lei was the recipient of the Globe and Mail's Report on Business 2025 Canada's Best Executive Award in the Finance category. In 2015, Mr. Lei received the Canadian Institute of Mining, Metallurgy and Petroleum's CIM-Bedford Canadian Young (under 40) Mining Leaders Award.
Mr. Carter was appointed Senior Vice President, Canada in June 2025, and as leader of the Canadian operations, he has been responsible for the strategic oversight of Hudbay's business activities in Manitoba and British Columbia. His leadership in Manitoba revitalized the operations into a sustainable cash flow contributor and he has strategically positioned the British Columbia operations for long-term success. Mr. Carter's extensive experience with a deep focus on safety and continuous improvement has been invaluable at the operations and is seen through consistent operational execution. Previously, he held the role of Vice President, Manitoba Business Unit since April 2022 and prior to that was the General Manager of the Company's Manitoba mines since 2018. He has held various other positions at Hudbay, including Manager of the Lalor Mine in Manitoba and Director of Business Development and Technical Services in Hudbay's corporate group. He has nearly 30 years of mining industry experience in technical, operational and senior leadership roles, with the majority of those years at Hudbay. Mr. Carter holds a Bachelor of Science, Geological Engineering from the University of Manitoba and is a Professional Engineer registered with Professional Engineers Ontario and Engineers Geoscientists of Manitoba.
The Company is grateful for Mr. Lauzon's significant contributions since joining Hudbay in 2016. Mr. Lauzon was the architect of the Copper World project, and his valued expertise as Chief Operating Officer has positioned the Company's operating and growth platform for long-term success. Mr. Lauzon has worked closely with Mr. Lei over the past several years on operational finance and growth, focusing the business on delivering strong free cash flow. He has also worked closely with Mr. Carter in optimizing the Company's Canadian operations and de-risking many growth projects across the business, and Mr. Carter's appointment ensures a seamless transition in accordance with Hudbay's succession planning. In his retirement, Mr. Lauzon will also provide on-going consulting and advisory services to Hudbay.
Hudbay has appointed Sebastien Fortin as Vice President and Head of the British Columbia Business Unit ("BCBU"). Mr. Fortin has been serving as Acting Head of the BCBU since October 2025 after first joining Copper Mountain as General Manager of Operations in 2024. Under his leadership, the operations have achieved many productivity and safety objectives, and he continues to drive significant improvements across the business to position Copper Mountain for long-term success. Mr. Fortin is a Professional Mining Engineer and he previously worked at Teck Resources for 16 years in several senior technical roles before joining Hudbay. He holds a bachelor's degree in Geological Engineering and a master's degree in Mining Engineering, both from Laval University, and is a graduate of the MBA Program at Simon Fraser University.
Hudbay also announced that Warren Flannery is taking on an expanded role as Vice President and Head of the Arizona Business Unit, and he will continue to support Javier Del Rio, Senior Vice President and Head of Hudbay USA. Under this enhanced role, Mr. Flannery is responsible for leading the business development and operational readiness of Copper World and the advancement of the Cactus project through feasibility studies and key de-risking initiatives. He previously held the role of Vice President of Copper World since August 2024 and he first joined Hudbay in 2023 as Vice President, Business Planning and Reclamation. Mr. Flannery is an experienced mining professional with over 30 years of extensive experience in mine operations, planning and project development at global companies. Prior to joining Hudbay, Mr. Flannery was the head of the mining technical group at CIBC's global mining corporate and investment banking arm for ten years. He is a Professional Engineer and holds a master's degree in Mineral Economics from the Colorado School of Mines and a bachelor's degree in Mining Engineering from Queen's University.
Continued Free Cash Flow Generation Driven by Strong Operating Margins; External Cost Pressures Insulated by Diversified Copper and Gold Exposure
Hudbay's unique copper and gold diversification across its operations provides exposure to strong commodity prices, which together with a focus on cost control across the business, continues to realize strong margins and generate attractive free cash flow. While the majority of Hudbay's revenue continues to be derived from copper production, revenue from gold production represents a meaningful portion of total revenues, with gold accounting for 38% of total revenue in the second quarter of 2026.
Hudbay's cost control efforts are focused on navigating external cost pressures, such as higher fuel and consumable costs. The Company continues to manage costs and deliver strong margins through initiatives to further improve throughput and enhance operating efficiencies. Despite such external cost pressures in the second quarter, Hudbay achieved consolidated cash cost1 of negative $0.40 per pound of copper and generated operating cash flow of over $200 million and free cash flow of over $100 million, similar to the first quarter of 2026. Hudbay continues to benefit from its diversified platform with significant by-product credits from gold production.
The Company had $890.9 million in cash and cash equivalents and net debt1 of negative $80.5 million at the end of the second quarter of 2026. Hudbay's strong cash position and continued prudent balance sheet management position the Company well to advance its generational growth investments across the portfolio and allocate capital to the highest risk-adjusted return opportunities to deliver significant value for stakeholders.
Copper World DFS Progressing Well and Project Sanctioning on Track for Late 2026
In January 2026, Hudbay announced the closing of the joint venture transaction with Mitsubishi, securing a premier, long-term strategic partner for the development of Copper World. The $420 million of initial proceeds received at closing from Mitsubishi will be used to directly fund the remaining DFS costs and pre-sanctioning costs in addition to the initial project development costs for Copper World. Mitsubishi will contribute an additional $180 million within 18 months of closing to complete its 30% minority investment and will also fund its pro-rata 30% share of future equity capital contributions.
Feasibility activities for the Copper World DFS are progressing well, with 95% of the engineering work completed and a sanctioning decision remains on track for later in 2026. The DFS is expected to reflect higher capital expenditures as compared to the 2023 pre-feasibility study primarily due to typical cost inflation along with new capital related to project scope changes that would allow for future mill expansion optionality, while continuing to generate robust economics.
On June 24, 2026, Copper World LLC received proceeds of an offering of $52.0 million aggregate principal amount of solid waste disposal revenue bonds due July 2, 2036 (the "Municipal Bonds"). The Municipal Bonds were issued by the Arizona Industrial Development Authority at par and carry a fixed interest rate of 4.5% per annum, with interest payable by Copper World LLC semi-annually. The Municipal Bond proceeds may be used for certain eligible costs associated with the development of the Copper World project and are treated as restricted cash on Hudbay's balance sheet.
Completion of the Arizona Sonoran Acquisition to Create the Third Largest Copper District in North America
On June 24, 2026, Hudbay successfully completed its previously announced acquisition of ASCU, pursuant to which Hudbay acquired all of the issued and outstanding common shares of ASCU not already owned by Hudbay (the "ASCU Transaction").
As a result of the completion of the ASCU Transaction, ASCU became a wholly-owned subsidiary of Hudbay and Hudbay acquired 100% ownership of Arizona Sonoran's Cactus project. In aggregate, Hudbay issued 46,794,082 Hudbay common shares under the ASCU Transaction to former ASCU shareholders as consideration for their Arizona Sonoran shares. Following the closing of the ASCU Transaction, the Arizona Sonoran shares were de-listed from the Toronto Stock Exchange ("TSX") and Arizona Sonoran ceased to be a reporting issuer pursuant to applicable Canadian securities laws.
The ASCU Transaction brings together two highly complementary copper growth assets in Arizona and strengthens Hudbay's position as a premier Americas-focused copper company with a pipeline of long-life, low-cost assets located in tier-one jurisdictions. The ASCU Transaction is expected to enhance Hudbay's long-term copper production profile, expand its U.S. growth pipeline, and generate significant operational efficiencies and regional synergies with Hudbay's staged development of Copper World and Cactus.
Hudbay expects to spend approximately $30 million at Cactus in the second half of 2026 to advance an updated pre-feasibility study ("PFS"), perform site de-risking activities, conduct exploration activities and for other ongoing site costs. The updated Cactus PFS is expected to be completed in the second half of 2027.
New Ingerbelle Expansion Project Underway to Enhance Copper and Gold Production Profile at Copper Mountain
In June 2026, Hudbay celebrated the official groundbreaking of the New Ingerbelle expansion project at Copper Mountain, marking a significant milestone for the operation and its long-term future in British Columbia. The event was attended by Hudbay's executive team, employees, B.C.'s Minister of Mining and Critical Minerals, the B.C. Mining Association, the Chief of the Upper Similkameen Indian Band, regional representatives, and leaders from the local community. The event was also recognized by Canada's Minister of Energy and Natural Resources.
New Ingerbelle enhances the copper and gold production profile and secures a longer mine life at Copper Mountain. Based on current mineral reserves, New Ingerbelle is projected to produce approximately 750,000 tonnes of copper, 900,000 ounces of gold and 5.5 million ounces of silver over the life of mine. Designed to access higher-grade mineralization, the expansion also features a stripping ratio approximately three times lower than current mining areas.
The groundbreaking comes shortly after the Government of British Columbia added New Ingerbelle to its list of priority resource projects, recognizing initiatives that support economic growth, responsible resource development and long-term value creation across the province. The New Ingerbelle expansion received key mining permits on February 19, 2026 from the British Columbia Major Mines Office ("MMO") following a robust review and consultation process. Throughout the permitting process, Hudbay proactively engaged with the MMO, local communities, the Upper Similkameen Indian Band ("USIB") and the Lower Similkameen Indian Band ("LSIB") to ensure transparency and collaborative oversight and to seek consensus, although, as previously disclosed, the LSIB subsequently submitted an application for judicial review of the regulatory decision to grant the New Ingerbelle permit amendment.
With key permits in place, Hudbay is advancing important infrastructure required for the expansion, including an access road, a bridge across the Similkameen river and an east haul road connecting New Ingerbelle to existing operations. Growth capital expenditures in British Columbia in 2026 are expected to increase by approximately $30 million to $115 million related to additional costs associated with infrastructure development at New Ingerbelle. Hudbay expects similar levels of growth capital investments in British Columbia in 2027 related to the continued infrastructure development at New Ingerbelle, which is expected to achieve first production in late 2028. The Company has also initiated a targeted drilling program at New Ingerbelle, focusing on upgrading existing inferred resources to reserves to further optimize and extend the mine life at Copper Mountain.
Peru Regulatory Approval Received to Further Increase Mill Throughput at Constancia
Hudbay received approval from the National Environmental Certification Service for Sustainable Investments in Peru to amend its environmental permit and further increase annual mill processing capacity at Constancia. The approval was received in late June and represented the fifth environmental permit amendment at Constancia. The amended permit increases the processing capacity of the Constancia mill to 34 million tonnes of ore per annum from the previously permitted 31 million tonnes. In March 2026, Hudbay received permit approval to increase mill throughput capacity to 31 million tonnes from 29.9 million tonnes per annum.
As part of the Company's continuous improvement efforts, the updated permit enables additional capacity to further optimize Constancia's operations and deliver strong copper production. Hudbay's efforts to increase mill throughput align with the Peru Ministry of Energy and Mines' regulatory framework, which permits operational flexibility to operate up to 10% above nominal daily capacity. Hudbay achieved total ore processed of 30.3 million tonnes and 31.9 million tonnes in 2025 and 2024, respectively. With this permit amendment, Hudbay is aligning its operational capacity to support the new level of 34 million tonnes per annum, while maintaining the standard operational flexibility to handle daily increases of up to 10% above permitted levels.
Large Exploration Drill Program Continues in Snow Lake
Hudbay continues to execute the largest exploration program in Snow Lake in the Company's history through extensive geophysical surveying and drilling campaigns as part of Hudbay's multi-pronged exploration strategy:
• Near-mine Exploration at Lalor and 1901 to Further Increase Near-term Production and Extend Mine Life - Near-mine exploration at the Lalor mine and the adjacent 1901 deposit continued to support near-term production growth and mine life extension. The exploration program will continue during the remainder of 2026 to potentially increase mineral reserves and resources and enable additional resource conversion. At the 1901 deposit, activities are focused on exploration and definition drilling, orebody access and establishing the critical infrastructure required to support full production beginning in late 2027. Exploration activities at 1901 will include step-out drilling to potentially extend the orebody, as well as infill drilling aimed at converting inferred mineral resources within the gold lenses to mineral reserves.
• Evaluating Significant Gold Production Potential from Past-Producing New Britannia mine - Acquired through the New Britannia mill acquisition in 2015, the past-producing New Britannia mine provides potential for significant incremental gold production in Snow Lake. The Company is developing an exploration plan to test down plunge extensions and underexplored areas between known deposits at the mine. Hudbay plans to conduct infill and expansion drilling at the 3 Zone, a satellite deposit to New Britannia, with three drills scheduled for later in 2026.
• Testing Regional Satellite Deposits to Utilize Available Processing Capacity and Increase Production - Hudbay's extensive regional land package includes an attractive portfolio of deposits in Snow Lake within trucking distance of the Snow Lake processing infrastructure, including the Talbot, Rail, Pen II, Watts, and WIM deposits. With available mill processing capacity at the Stall mill, the Company continues to progress exploration work across the region to define satellite deposits to potentially increase production and extend the life of the Snow Lake operations beyond 2041. During the second quarter of 2026, the infill drilling program at Talbot was completed as well as the geotechnical drilling required for PFS activities. The Company is also testing additional targets to expand the footprint of the deposit at depth. Hudbay intends to update Rockcliff's prior mineral resource estimate for Talbot using Hudbay's standard methods.
• Exploring Large Land Package for New Anchor Deposit to Significantly Extend Mine Life - A majority of the land claims acquired as part of the Rockcliff acquisition in 2023 have been untested by modern deep geophysics, which was the discovery method for the Lalor deposit. The large geophysics program underway consisting of surface electromagnetic surveys using cutting edge techniques that enable the team to detect targets at depths of almost 1,000 metres below surface. The planned 2026 geophysics program includes 600 kilometres of ground electromagnetic surveys and an extensive airborne geophysics survey.
Mason Project Commences Pre-feasibility Study Activities
The Mason project is a 100% owned greenfield copper deposit located in the historic Yerington District of Nevada and is one of the largest undeveloped copper porphyry deposits in North America. Hudbay views the Mason project as a long-term future development asset as part of the Company's pipeline of high-quality copper growth opportunities.
Hudbay completed a preliminary economic assessment on Mason in 2021 which contemplated a 27-year mine life with average annual copper production of approximately 140,000 tonnes over the first ten years of full production. The Company recently initiated PFS activities at Mason and expects to spend approximately $20 million in evaluation expenses at Mason for the remainder of 2026. The Mason PFS is expected to be completed in the second half of 2027.
Dividend Declared
A quarterly dividend of C$0.01 per share was declared on July 28, 2026. The dividend will be paid out on September 8, 2026 to shareholders of record as of close of business on September 25, 2026.
1 Net debt and net debt to adjusted EBITDA are non-GAAP financial performance measures with no standardized definition under IFRS. For further information, please see discussion under the "Non-GAAP Financial Performance Measures" section of this MD&A.
PERU OPERATIONS REVIEW
| Three months ended | Six months ended | |||||||||||||||
| Jun. 30, 2026 | Mar. 31, 2026 | Jun. 30, 2025 | Jun. 30, 2026 | Jun. 30, 2025 | ||||||||||||
| Constancia ore mined1 | tonnes | 10,962,399 | 10,701,375 | 6,735,316 | 21,663,774 | 15,363,595 | ||||||||||
| Copper | % | 0.28 | 0.29 | 0.34 | 0.28 | 0.31 | ||||||||||
| Gold | g/tonne | 0.04 | 0.03 | 0.03 | 0.03 | 0.03 | ||||||||||
| Silver | g/tonne | 3.68 | 3.11 | 3.26 | 3.40 | 3.19 | ||||||||||
| Molybdenum | % | 0.01 | 0.01 | 0.02 | 0.01 | 0.02 | ||||||||||
| Pampacancha ore mined1,2 | tonnes | - | - | 762,172 | - | 1,151,361 | ||||||||||
| Copper | % | - | - | 0.26 | - | 0.32 | ||||||||||
| Gold | g/tonne | - | - | 0.24 | - | 0.25 | ||||||||||
| Silver | g/tonne | - | - | 4.59 | - | 4.28 | ||||||||||
| Molybdenum | % | - | - | 0.01 | - | 0.01 | ||||||||||
| Total ore mined | tonnes | 10,962,399 | 10,701,375 | 7,497,488 | 21,663,774 | 16,514,956 | ||||||||||
| Strip ratio3 | 0.88 | 0.83 | 1.47 | 0.86 | 1.22 | |||||||||||
| Ore milled | tonnes | 7,827,509 | 8,163,847 | 7,559,047 | 15,991,356 | 15,673,071 | ||||||||||
| Copper | % | 0.30 | 0.31 | 0.34 | 0.31 | 0.32 | ||||||||||
| Gold | g/tonne | 0.04 | 0.06 | 0.05 | 0.05 | 0.05 | ||||||||||
| Silver | g/tonne | 3.75 | 3.09 | 3.58 | 3.41 | 3.39 | ||||||||||
| Molybdenum | % | 0.01 | 0.01 | 0.01 | 0.01 | 0.01 | ||||||||||
| Copper concentrate | tonnes | 90,500 | 93,704 | 94,813 | 184,204 | 186,984 | ||||||||||
| Concentrate grade | % Cu | 21.49 | 21.95 | 22.90 | 21.73 | 22.46 | ||||||||||
| Copper recovery | % | 82.0 | 81.5 | 84.5 | 81.7 | 84.6 | ||||||||||
| Gold recovery | % | 48.8 | 59.9 | 56.0 | 55.2 | 56.2 | ||||||||||
| Silver recovery | % | 59.9 | 65.4 | 63.5 | 62.4 | 64.7 | ||||||||||
| Molybdenum recovery | % | 39.9 | 36.0 | 38.7 | 37.8 | 37.1 | ||||||||||
| Combined unit operating costs4,5 | $/tonne | 14.06 | 11.61 | 13.59 | 12.82 | 12.29 | ||||||||||
1 Reported tonnes and grade for ore mined are estimates based on mine plan assumptions and may not reconcile fully to ore milled.
2 Pampacancha has been depleted as of December 31, 2025.
3 Strip ratio is calculated as waste mined divided by ore mined.
4 Reflects combined mine, mill and general and administrative ("G&A") costs per tonne of ore milled. Reflects the deduction of expected capitalized stripping costs.
5 Combined unit costs is a non-GAAP financial performance measure with no standardized definition under IFRS. For further information and a detailed reconciliation, please see the discussion under the "Non-GAAP Financial Performance Measures" section of this MD&A.
| Three months ended | Six months ended | |||||||||||||||
| Jun. 30, 2026 |
Mar. 31, 2026 |
Jun. 30, 2025 |
Jun. 30, 2026 |
Jun. 30, 2025 |
||||||||||||
| Contained metal in concentrate produced | ||||||||||||||||
| Copper | tonnes | 19,446 | 20,573 | 21,710 | 40,019 | 42,003 | ||||||||||
| Gold | oz | 5,282 | 8,770 | 7,366 | 14,052 | 15,235 | ||||||||||
| Silver | oz | 564,505 | 531,199 | 551,979 | 1,095,704 | 1,106,671 | ||||||||||
| Molybdenum | tonnes | 277 | 380 | 375 | 657 | 772 | ||||||||||
| Payable metal sold | ||||||||||||||||
| Copper | tonnes | 15,755 | 21,056 | 21,418 | 36,811 | 44,308 | ||||||||||
| Gold | oz | 4,042 | 15,162 | 9,721 | 19,204 | 24,083 | ||||||||||
| Silver | oz | 418,640 | 676,119 | 616,578 | 1,094,759 | 1,331,233 | ||||||||||
| Molybdenum | tonnes | 298 | 375 | 427 | 673 | 875 | ||||||||||
| Cost per pound of copper produced | ||||||||||||||||
| Cash cost1 | $/lb | 1.66 | 0.70 | 1.45 | 1.17 | 1.29 | ||||||||||
| Sustaining cash cost1 | $/lb | 2.71 | 1.43 | 2.63 | 2.05 | 2.29 | ||||||||||
1 Cash cost and sustaining cash costs, net of by-product credits, per pound of copper produced are not recognized under IFRS. For more detail on these non-GAAP financial performance measures, please see the discussion under the "Non-GAAP Financial Performance Measures" section of this MD&A.
Overview
The Peru operations continued to demonstrate steady operating performance during the second quarter of 2026, with production and costs in line with full-year expectations following the depletion of Pampacancha at the end of 2025.
The Company continues to advance the installation of pebble crushers at Constancia to increase mill throughput rates starting in the third quarter of 2026, which will allow the mine to deliver steady annual copper production despite lower grades following the depletion of Pampacancha.
In June 2026, the Company received approval from the National Environmental Certification Service for Sustainable Investments in Perú ("SENACE") to amend its environmental permit and further increase annual mill processing capacity at Constancia. This represented the fifth environmental permit amendment at Constancia. The amended permit increases the processing capacity of the Constancia mill to 34 million tonnes of ore per annum from the previously permitted 31 million tonnes per annum. Previously, in March 2026, Hudbay received permit approval to increase mill throughput capacity to 31 million tonnes from 29.9 million tonnes per annum.
As part of the Company's continuous improvement efforts, the updated permit enables additional capacity to further optimize Constancia's operations and deliver strong copper production. Hudbay's efforts to increase mill throughput align with the Peru Ministry of Energy and Mines' regulatory framework, which provides operational flexibility to operate up to 10% above nominal daily capacity. Hudbay achieved total ore processed of 30.3 million tonnes and 31.9 million tonnes in 2025 and 2024, respectively. With this permit amendment, Hudbay is in the process of aligning its operational capacity to support the new level of 34 million tonnes per annum, while maintaining the standard operational flexibility to handle daily increases of up to 10% above permitted levels.
The environmental permit amendment also approves further optimization of the mine plan, extends the operational life of Constancia, and incorporates the implementation of additional infrastructure to improve tailings transport infrastructure and water management systems.
In April 2026, Constancia was recognized as the safest open pit operation in Peru during the local National Mining Safety Contest for its performance in 2025. This award reflects the Company's unwavering commitment to safety and validates Constancia's compliance with the highest operational safety and regulatory standards.
Mining Activities
Total material moved during the second quarter of 2026 was 23.9 million tonnes, 15% higher than the same period in 2025, primarily as a result of shorter hauling distances from mining exclusively within the Constancia pit compared with mining two pits in 2025. A new monthly record total volume of material moved was achieved in May 2026. In addition, Peru realized improved productivity from enhanced fleet efficiency and the implementation of haulage optimization strategies. Total ore mined during the quarter remained consistent with ore mined in the first quarter of 2026.
Year-to-date total material moved was 16% higher than the same period in 2025, while year-to-date ore mined increased by 31% compared to the prior year period, driven by the same structural and fleet efficiency improvements noted in the quarterly variance, as well as positive reconciliation obtaining ore instead of waste.
Milling Activities
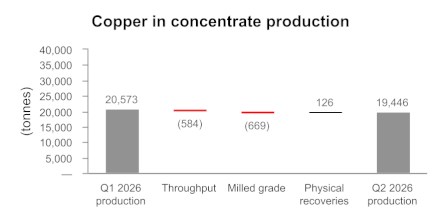
Mill throughput levels averaged approximately 86,000 tonnes per day during the second quarter of 2026, a marginal decrease compared to the first quarter of 2026, primarily due to the scheduled semi-annual plant maintenance shutdown and the processing of more metallurgically complex ore during the second quarter of 2026. Milled copper grades decreased slightly compared to the first quarter of 2026 due to blending targets implemented to control contaminants in the concentrate. As expected, overall gold grades declined primarily due to the transition away from the higher-grade gold contributions from the Pampacancha stockpile. Compared to the second quarter of 2025, milled copper and gold grades decreased primarily due to mining exclusively within the Constancia pit, compared to a two-pit operation in the prior year period. Metal recoveries remained in line with expectations.
Ore milled during the first half of 2026 was higher than the comparable period in 2025, largely driven by plant mechanical availability at the plant. Milled copper and gold grades in the first half of 2026 were slightly lower than the same period in 2025 due to processing ore from the Constancia pit. Copper recoveries during the first half of 2026 averaged 82%, a 3% decline compared to the same year-to-date period, driven by a lower grades and a higher proportion of stockpile ore feed. Gold and silver recoveries during the first half of 2026 were 55% and 62%, respectively, representing a decrease compared to the same year-to-date period of 2% and 4%, respectively, but remained in line with Hudbay's metallurgical models.
Production and Sales Performance
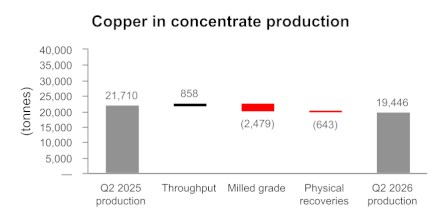
During the second quarter of 2026, the Peru operations produced 19,446 tonnes of copper, 5,282 ounces of gold, 564,505 ounces of silver and 277 tonnes of molybdenum. Production of copper, gold and molybdenum was slightly lower compared to the first quarter of 2026, reflecting the planned semi-annual plant maintenance shutdown during the second quarter of 2026. Compared to the same period in 2025, production of copper and gold declined slightly, primarily as a result of lower mill recoveries associated with the processing of lower grade ore feed.
Year-to-date production of copper and gold during the first half of 2026 was 40,019 tonnes and 14,052 ounces, respectively, representing a decrease of 5% and 8%, respectively, compared to the same period in 2025, primarily due to lower recoveries that resulted from processing slightly lower head grades as more material was mined from the Constancia pit and reclaimed from stockpiles compared with the same period last year, which included material mined from Pampacancha.
Quantities of metal sold during the three and six months ended June 30, 2026 were in line with the variances noted above, but were further affected by higher finished goods concentrate inventory levels at the end of the second quarter of 2026, resulting in lower sales volumes. Sales volumes were impacted by a temporary build-up of concentrate inventory at the port caused by ocean swells that resulted in temporary port closures and delayed scheduled shipments. As a result, approximately 10,000 dry metric tonnes of copper concentrate sales were deferred to the first half of July.
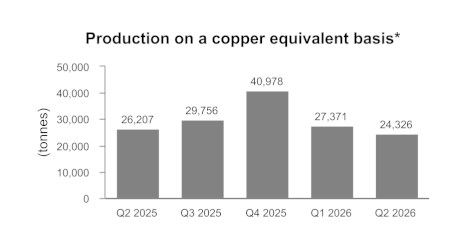
*Copper equivalent production is calculated using the quarter average LME prices for each metal excluding molybdenum.
Cost Performance
Combined mine, mill and G&A unit operating cost in the second quarter of 2026 was $14.06 per tonne, which was 3% higher than the same period in 2025, primarily driven by higher fuel prices, partially offset by lower power costs related to a new power purchase agreement that came into effect on January 1, 2026, and additional tonnes of ore milled.
Combined mine, mill and G&A unit operating cost in the second quarter of 2026 increased by 21% compared to the first quarter of 2026, primarily due to higher fuel prices and a scheduled semi-annual plant shutdown in May 2026.
Combined mine, mill and G&A unit operating costs for the six months ended June 30, 2026 was $12.82 per tonne, a 4% increase compared to the same period in 2025, primarily due to higher diesel prices. This increase was partially offset by lower power prices and additional tonnes of ore milled.
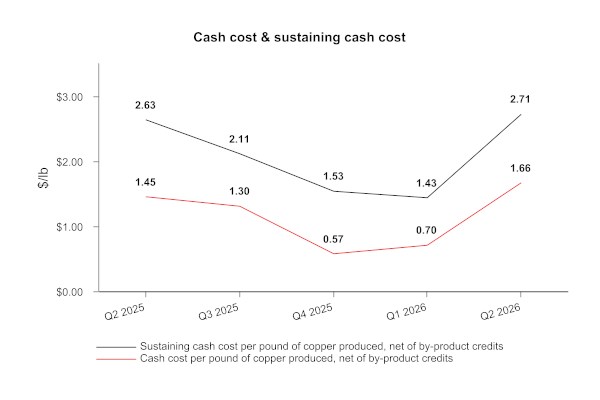
Cash cost1, net of by-product credits, in the second quarter of 2026 was $1.66 per pound of copper, a 14% increase compared to the same period in 2025. This variance was mainly due to lower net pounds of copper produced and higher fuel prices, which were partially offset by higher by-product credits and lower power costs given the new power purchase agreement. Cash cost1, net of by-product credits increased by 137% compared to the first quarter of 2026, primarily due to lower gold by-product credits resulting from lower gold volumes given the completion of mining of the high gold content Pampacancha stockpile in the first quarter, higher fuel prices and the planned semi-annual plant maintenance shutdown in May 2026. This increase was partially offset by lower profit sharing. Despite the increase, cash cost for the quarter continued to outperform the low-end of the 2026 guidance range.
Year-to-date 2026 cash cost1, net of by-product credits2 were $1.17 per pound of copper, a decrease from $1.29 in the prior year period. This decrease was driven by higher gold and silver by-product credits, and the lower power price noted above, and was partially offset by a higher fuel price and higher profit sharing.
Sustaining cash cost1, net of by-product credits, in the second quarter of 2026 was $2.71 per pound of copper, an increase of 3% compared to the same period in 2025 as a result of lower net pounds of copper produced and the cash costs variance explained above. This increase was partially offset by lower tailings management facility construction costs in 2026 and the timing of mine maintenance. During the second quarter of 2026, sustaining cash cost1, net of by-product credits, per pound of copper increased by 90% compared to the first quarter of 2026, primarily due to the same reasons affecting cash costs above, as well as higher community agreement payments.
On a year-to-date basis, sustaining cash cost1, net of by-products credits, was $2.05 per pound of copper, a 10% decrease when compared to the first half of 2025. This was primarily a result of lower cash cost as described above as well as the timing of mine equipment maintenance and lower tailing management facility construction costs in 2026 and was partially offset by lower pounds of copper produced and a higher cash payment for community agreements.
Peru Guidance Outlook
| Three months ended | Six months ended | Guidance | ||||||||||||||
| Jun. 30, 2026 | Jun. 30, 2025 | Jun. 30, 2026 | Jun. 30, 2025 | Annual 2026 | ||||||||||||
| Contained metal in concentrate produced | ||||||||||||||||
| Copper | tonnes | 19,446 | 21,710 | 40,019 | 42,003 | 75,000 - 90,000 | ||||||||||
| Gold | oz | 5,282 | 7,366 | 14,052 | 15,235 | 15,000 - 20,000 | ||||||||||
| Silver | oz | 564,505 | 551,979 | 1,095,704 | 1,106,671 | 1,900,000 - 2,400,000 | ||||||||||
| Molybdenum | tonnes | 277 | 375 | 657 | 772 | 900 - 1,100 | ||||||||||
| Cost per pound of copper produced | ||||||||||||||||
| Cash cost1 | $/lb | 1.66 | 1.45 | 1.17 | 1.29 | 1.70 - 2.10 | ||||||||||
1 Cash cost, net of by-product credits, per pound of copper produced are not recognized under IFRS. For more detail on these non-GAAP financial performance measures, please see the discussion under the "Non-GAAP Financial Performance Measures" section of this MD&A.
2 Refer to the "Outlook" section of this MD&A for more information.
Hudbay is on track to achieve its 2026 production guidance for all metals in Peru. Cash cost for the quarter outperformed the low-end of the 2026 guidance range as a result of strong operating cost performance and higher by-product prices, despite external cost pressures. Hudbay is well positioned to achieve the full year 2026 cash cost guidance range in Peru.
MANITOBA OPERATIONS REVIEW
| Three months ended | Six months ended | |||||||||||||||
| Jun. 30, 2026 | Mar. 31, 2026 | Jun. 30, 2025 | Jun. 30, 2026 | Jun. 30, 2025 | ||||||||||||
| Total ore mined1 | tonnes | 321,719 | 349,980 | 303,062 | 671,699 | 687,296 | ||||||||||
| Gold | g/tonne | 4.41 | 4.72 | 4.97 | 4.57 | 5.25 | ||||||||||
| Copper | % | 0.84 | 0.80 | 0.61 | 0.82 | 0.80 | ||||||||||
| Zinc | % | 2.25 | 2.10 | 2.46 | 2.17 | 2.44 | ||||||||||
| Silver | g/tonne | 28.33 | 26.22 | 29.94 | 27.23 | 30.67 | ||||||||||
| New Britannia ore milled | tonnes | 170,477 | 181,403 | 162,934 | 351,880 | 352,058 | ||||||||||
| Gold | g/tonne | 5.31 | 6.06 | 6.48 | 5.70 | 6.96 | ||||||||||
| Copper | % | 1.00 | 1.04 | 0.65 | 1.02 | 0.94 | ||||||||||
| Zinc | % | 0.97 | 1.09 | 1.01 | 1.03 | 1.01 | ||||||||||
| Silver | g/tonne | 29.73 | 22.75 | 30.29 | 26.13 | 31.93 | ||||||||||
| Copper concentrate | tonnes | 11,228 | 12,198 | 6,278 | 23,426 | 20,674 | ||||||||||
| Concentrate grade | % Cu | 13.82 | 14.07 | 14.73 | 13.95 | 14.24 | ||||||||||
| Gold recovery2 | % | 90.5 | 90.4 | 89.4 | 90.4 | 89.9 | ||||||||||
| Copper recovery | % | 90.9 | 90.8 | 87.4 | 90.9 | 89.3 | ||||||||||
| Silver recovery2 | % | 84.5 | 82.2 | 78.0 | 83.4 | 80.0 | ||||||||||
| Contained metal in concentrate produced | ||||||||||||||||
| Gold | oz | 18,155 | 21,348 | 17,801 | 39,503 | 44,287 | ||||||||||
| Copper | tonnes | 1,553 | 1,716 | 926 | 3,269 | 2,945 | ||||||||||
| Silver | oz | 101,599 | 78,463 | 80,516 | 180,062 | 200,753 | ||||||||||
| Metal in doré produced3 | ||||||||||||||||
| Gold | oz | 11,051 | 12,626 | 15,379 | 23,677 | 30,490 | ||||||||||
| Silver | oz | 35,526 | 36,494 | 46,311 | 72,020 | 91,623 | ||||||||||
| Stall ore milled | tonnes | 148,037 | 178,981 | 144,204 | 327,018 | 359,490 | ||||||||||
| Gold | g/tonne | 3.30 | 3.26 | 3.19 | 3.28 | 3.60 | ||||||||||
| Copper | % | 0.66 | 0.53 | 0.56 | 0.59 | 0.68 | ||||||||||
| Zinc | % | 3.81 | 3.22 | 4.20 | 3.48 | 3.74 | ||||||||||
| Silver | g/tonne | 27.46 | 29.68 | 29.55 | 28.68 | 29.54 | ||||||||||
| Copper concentrate | tonnes | 4,683 | 4,831 | 3,854 | 9,514 | 10,562 | ||||||||||
| Concentrate grade | % Cu | 17.35 | 16.95 | 17.79 | 17.15 | 20.22 | ||||||||||
| Zinc concentrate | tonnes | 9,279 | 9,038 | 9,739 | 18,317 | 22,323 | ||||||||||
| Concentrate grade | % Zn | 51.31 | 50.51 | 52.68 | 50.92 | 51.05 | ||||||||||
| Gold recovery | % | 70.8 | 73.5 | 67.9 | 72.3 | 69.3 | ||||||||||
| Copper recovery | % | 83.7 | 85.9 | 84.7 | 84.8 | 87.1 | ||||||||||
| Zinc recovery | % | 84.5 | 79.3 | 84.8 | 81.9 | 84.7 | ||||||||||
| Silver recovery | % | 55.4 | 57.5 | 51.9 | 56.6 | 56.0 | ||||||||||
| Contained metal in concentrate produced | ||||||||||||||||
| Gold | oz | 11,138 | 13,769 | 10,055 | 24,907 | 28,812 | ||||||||||
| Copper | tonnes | 813 | 819 | 686 | 1,632 | 2,136 | ||||||||||
| Zinc | tonnes | 4,760 | 4,565 | 5,130 | 9,325 | 11,395 | ||||||||||
| Silver | oz | 72,353 | 98,251 | 71,143 | 170,604 | 191,197 | ||||||||||
1 Reported tonnes and grade for ore mined are estimates based on mine plan assumptions and may not reconcile fully to ore milled. Total ore mined includes tonnes from Lalor and 1901.
2 Gold and silver recovery includes total recovery from concentrate and doré.
3 Doré includes sludge, slag and carbon fines.
| Three months ended | Six months ended | |||||||||||||||
| Jun. 30, 2026 | Mar. 31, 2026 | Jun. 30, 2025 | Jun. 30, 2026 | Jun. 30, 2025 | ||||||||||||
| Total contained metal in concentrate and doré produced1 | ||||||||||||||||
| Gold | oz | 40,344 | 47,743 | 43,235 | 88,087 | 103,589 | ||||||||||
| Copper | tonnes | 2,366 | 2,535 | 1,612 | 4,901 | 5,081 | ||||||||||
| Zinc | tonnes | 4,760 | 4,565 | 5,130 | 9,325 | 11,395 | ||||||||||
| Silver | oz | 209,478 | 213,208 | 197,970 | 422,686 | 483,573 | ||||||||||
| Payable metal sold in concentrate and doré2 | ||||||||||||||||
| Gold | oz | 47,066 | 45,274 | 46,932 | 92,340 | 102,697 | ||||||||||
| Copper | tonnes | 2,466 | 2,658 | 2,133 | 5,124 | 4,858 | ||||||||||
| Zinc | tonnes | 2,635 | 3,897 | 2,871 | 6,532 | 7,728 | ||||||||||
| Silver | oz | 209,383 | 193,472 | 209,594 | 402,855 | 441,848 | ||||||||||
| Unit Operating Costs3 | ||||||||||||||||
| Lalor | C$/tonne | 186.93 | 165.99 | 153.08 | 176.02 | 147.55 | ||||||||||
| New Britannia | C$/tonne | 86.18 | 77.20 | 67.98 | 81.55 | 68.05 | ||||||||||
| Stall | C$/tonne | 53.26 | 46.42 | 51.53 | 49.52 | 42.21 | ||||||||||
| Combined unit operating costs4,5,6 | C$/tonne | 300 | 254 | 241 | 276 | 225 | ||||||||||
| Cost per ounce of gold produced | ||||||||||||||||
| Cash cost6,7 | $/oz | 776 | 408 | 710 | 577 | 515 | ||||||||||
| Sustaining cash cost6 | $/oz | 1,358 | 833 | 1,025 | 1,074 | 793 | ||||||||||
1 Total metal reported in concentrate is prior to deductions associated with smelter terms and includes other secondary products.
2 Includes other secondary products.
3 Reflects costs per tonne of ore mined/milled.
4 Reflects combined mine, mill and G&A costs per tonne of milled ore.
5 Excludes $3.2 million or C$14 per tonne of overhead costs incurred during temporary suspension during the three months ended June 30, 2025 and $3.2 million or C$6 per tonne during the six months ended June 30, 2025.
6 Combined unit costs, cash cost and sustaining cash cost, net of by-product credits, per ounce of gold produced are non-GAAP financial performance measures with no standardized definition under IFRS. For further information and a detailed reconciliation, please see the discussion under the "Non-GAAP Financial Performance Measures" section of this MD&A.
7 Excludes $3.2 million or $74 per ounce of overhead costs incurred during temporary suspension during the three months ended June 30, 2025 and $3.2 million or $31 per ounce during the six months ended June 30, 2025.
Overview
The Manitoba operations continued to execute its strategic initiatives during the second quarter of 2026, navigating short-term operational hurdles while positioning the business for an expected strong second half of the year. To address labour availability constraints, Hudbay engaged an experienced mining contractor to advance the 1901 deposit. This strategic decision has enabled the team to redeploy its skilled internal workforce to other critical development areas at Lalor. Hudbay has simultaneously increased internal capacity, onboarding over 100 new employees in 2026, who are currently undergoing upskilling to enhance long-term operational self-sufficiency in Manitoba.
While the Manitoba operations experienced minor production impacts from an unplanned hoist gearbox failure at Lalor in June, the hoist is now repaired and fully operational, and the team strategically prioritized high-value gold zones to maintain consistent feed for the New Britannia mill. These initiatives position the business to support higher production volumes and grades in the second half of 2026, which remains aligned with annual production guidance in Manitoba.
Hudbay's Mining Fundamentals Training program, in partnership with the Northern Manitoba Sector Council, achieved a 100% conversion rate in the second quarter, with all nine cohort graduates accepting full-time roles at Hudbay. Building on this success, the team have engaged the University College of the North to further refine the curriculum. A fifth cohort, which will include participants from local Indigenous communities, is scheduled to launch in the third quarter of 2026.
The Snow Lake operations advanced key sustaining capital environmental projects during the second quarter, including construction of a cyanide recycling initiative at the New Britannia mill and construction of a dam lift at the Anderson Tailings Impoundment Area. Both projects remain on schedule for completion by the end of 2026.
Mining Activities
Total ore mined in Manitoba in the second quarter of 2026 was higher compared to the same period in 2025, reflecting an improvement over the prior year period which was impacted by a temporary suspension in operations related to wildfire evacuation orders in 2025. Conversely, total ore mined was lower than the first quarter of 2026, primarily driven by reduced workforce availability, which limited effective utilization of equipment and workplaces. In the second quarter of 2026, gold grades decreased by 11% and 7% when compared to the same period in 2025 and to the first quarter of 2026, respectively, driven by planned mine sequencing.
The Lalor mine hoisted an average of approximately 3,500 tonnes of ore per day, strategically prioritizing gold zones to secure optimal feed for the New Britannia mill.
The 1901 deposit delivered approximately 7,600 tonnes of development ore in the quarter. Looking ahead, the plan is to continue to prioritize exploration and infill drilling, orebody access and critical infrastructure development as 1901 progresses toward full production in late 2027.
Total ore mined at Manitoba operations during the first half of 2026 was 2% lower than the same period in 2025, primarily driven by reduced worker hours, which was partially offset by the impact of wildfire related shutdowns in June 2025. Gold, zinc, and silver grades mined at Lalor during the first half of 2026 were 13%, 11%, and 11% lower, respectively, compared with the same period in 2025. Copper grades mined during the first half of 2026 were 2% higher than the same period in 2025.
Milling Activities
The New Britannia mill processed approximately 1,900 tonnes per day in the second quarter of 2026, matching the gold ore output from Lalor during the quarter. New Britannia continued to achieve steady gold recoveries of approximately 90%, reflecting ongoing optimization efforts.
The Stall mill processed more ore in the second quarter of 2026 compared to the second quarter of 2025, and less ore than the first quarter of 2026. Ore processed in the current quarter was consistent with Lalor base metal production. The Stall mill achieved gold recoveries of 71% during the second quarter of 2026, higher than the comparable period in 2025, reflecting recovery focused initiatives.
Hudbay also initiated early works on installing new tailings lines between the two mills, which is expected to increase the pipeline capacity to enable higher throughput and leaching of gold-bearing material at New Britannia from base metal ore originally processed at Stall mill.
Production and Sales Performance
The Manitoba operations produced 40,344 ounces of gold, 2,366 tonnes of copper, 4,760 tonnes of zinc and 209,478 ounces of silver in the second quarter of 2026. Production of gold and zinc decreased compared to the second quarter of 2025 primarily due to lower gold and zinc grades partially offset by higher recoveries for gold. Production of copper and silver increased compared to the second quarter of 2025, driven by the higher mill throughput and higher copper recoveries. Compared to the first quarter of 2026, production of gold, copper and silver was lower, primarily due to lower tonnes milled, while zinc production was slightly higher.
Year-to-date production of gold and zinc in 2026 was lower than the comparative 2025 period as a result of lower mined grades, partially offset by higher mill throughputs. Conversely, year-to-date production of copper and silver were higher than the comparative 2025 period due to higher copper grades, while zinc was lower due to lower grades.
Manitoba sales volumes in the second quarter of 2026 reflect typical levels of inventory and the lower production across most metals. During the six months ended June 30, 2026, quantities sold for all metals were relatively in line with variances in production with the exception of copper sales, which were slightly higher compared to the same period in 2025.
Cost Performance
Combined mine, mill and G&A unit operating costs in the second quarter of 2026 were C$300 per tonne, an increase compared to the second quarter of 2025, primarily due to higher onsite costs partially offset by higher ore milled in the period. Combined unit cost increased when compared to the first quarter of 2026 as a result of marginally higher onsite costs and lower ore milled due to reduced workforce availability, limiting the effective utilization of equipment and workplaces, as well as the failure of a critical hoist gearbox motor at Lalor.
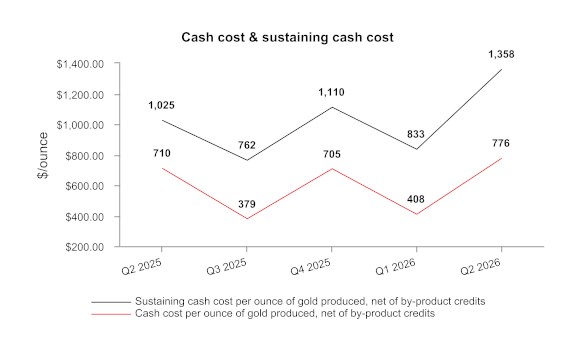
Cash cost4, net of by-product credits, in the second quarter of 2026 was $776 per ounce of gold. This represents an increase compared to the same period in 2025, primarily attributed to the impact of lower grades on gold production volumes and higher unit operating costs across mining, milling activities and G&A cost including profit sharing. These costs were partially offset by higher by-product credits resulting from higher metal prices. Cash cost1, net of by-product credits increased by 90% compared to the first quarter of 2026, primarily due to lower gold production and the same factors impacting combined mine, mill and G&A unit operating costs. Despite the increase, cash cost was within the guidance range for 2026.
Sustaining cash cost4, net of by-product credits, in the second quarter of 2026 was $1,358 per ounce of gold, higher than the same period in 2025 and higher than the first quarter of 2026, primarily due to the same factors affecting cash costs along with higher sustaining capital. As reflected in the Company's annual guidance, sustaining capital expenditures are expected to be higher than 2025, in part due to 2026 investments to raise the dam at the Anderson Tailings Impoundment Area and the New Britannia mill cyanide recycling project.
Cash cost, net of by-product credits, during the six months ended June 30, 2026 was $577 per ounce of gold. These costs were 12% higher compared to the same period in 2025 primarily due to lower gold production and higher mining, milling and G&A costs, partially offset by higher by-product credits. Sustaining cash cost, net of by-product credits, for the six months ended June 30, 2026 was $1,074 per ounce of gold, an increase of 35% from the same period in 2025 primarily due to the same factors affecting cash cost noted above, together with higher sustaining capital expenditures compared to the prior year.
Manitoba Guidance Outlook
| Three months ended | Six months ended | Guidance | ||||||||||||||
| Jun. 30, 2026 |
Jun. 30, 2025 |
Jun. 30, 2026 |
Jun. 30, 2025 |
Annual 2026 | ||||||||||||
| Total contained metal in concentrate and doré produced1 | ||||||||||||||||
| Gold2 | oz | 40,344 | 43,235 | 88,087 | 103,589 | 180,000 - 220,000 | ||||||||||
| Copper | tonnes | 2,366 | 1,612 | 4,901 | 5,081 | 10,000 - 13,000 | ||||||||||
| Zinc | tonnes | 4,760 | 5,130 | 9,325 | 11,395 | 16,000 - 21,000 | ||||||||||
| Silver3 | oz | 209,478 | 197,970 | 422,686 | 483,573 | 800,000 - 1,000,000 | ||||||||||
| Cost per ounce of gold produced | ||||||||||||||||
| Cash cost4,5 | $/oz | 776 | 710 | 577 | 515 | 500 - 800 | ||||||||||
1 Metal reported in concentrate is prior to deductions associated with smelter terms and includes other secondary products.
2 Gold production guidance includes gold contained in concentrate produced and gold in doré and includes other secondary products.
3 Silver production guidance includes silver contained in concentrate produced and silver in doré and includes other secondary products.
4 Combined unit costs, cash cost per ounce of gold produced, net of by-product credits, are non-GAAP financial performance measures with no standardized definition under IFRS. For further information and a detailed reconciliation, please see the discussion under the "Non-GAAP Financial Performance Measures" section of this MD&A.
5 Excludes $3.2 million or $74 per ounce of overhead costs incurred during temporary suspension during the three months ended June 30, 2025 and $3.2 million or $31 per ounce during the six months ended June 30, 2025.
Production in the second half of 2026 is expected to be higher than the first half of 2026 due to grade sequencing and higher ore output from Lalor, as previously disclosed. Hudbay is on track to achieve its 2026 production guidance for all metals in Manitoba and is well positioned to achieve the 2026 cash cost guidance range in Manitoba.
BRITISH COLUMBIA OPERATIONS REVIEW
| Three months ended5 | Six months ended5 | |||||||||||||||
| Jun. 30, 2026 | Mar. 31, 2026 | Jun. 30, 2025 | Jun. 30, 2026 | Jun. 30, 2025 | ||||||||||||
| Ore mined1 | tonnes | 3,276,090 | 2,916,152 | 2,509,969 | 6,192,242 | 5,158,063 | ||||||||||
| Strip ratio2 | 6.22 | 7.06 | 7.50 | 6.61 | 7.11 | |||||||||||
| Ore milled | tonnes | 3,616,083 | 3,078,342 | 2,900,008 | 6,694,425 | 5,660,994 | ||||||||||
| Copper | % | 0.23 | 0.20 | 0.28 | 0.22 | 0.31 | ||||||||||
| Gold | g/tonne | 0.08 | 0.08 | 0.09 | 0.08 | 0.09 | ||||||||||
| Silver | g/tonne | 0.88 | 0.67 | 0.97 | 0.78 | 1.12 | ||||||||||
| Copper concentrate | tonnes | 27,274 | 21,136 | 28,198 | 48,411 | 59,432 | ||||||||||
| Concentrate grade | % Cu | 23.7 | 22.8 | 23.5 | 23.3 | 23.3 | ||||||||||
| Copper recovery | % | 77.3 | 78.9 | 81.0 | 78.0 | 79.5 | ||||||||||
| Gold recovery | % | 62.9 | 64.7 | 68.2 | 63.8 | 65.7 | ||||||||||
| Silver recovery | % | 69.7 | 64.6 | 71.8 | 67.7 | 70.7 | ||||||||||
| Combined unit operating costs3,4 | C$/tonne | 25.52 | 25.23 | 24.51 | 25.39 | 25.12 | ||||||||||
1 Reported tonnes and grade for ore mined are estimates based on mine plan assumptions and may not reconcile fully to ore milled.
2 Strip ratio is calculated as waste mined divided by ore mined.
3 Reflects combined mine, mill and general and administrative ("G&A") costs per tonne of ore milled. Reflects the deduction of expected capitalized stripping costs.
4 Combined unit costs is a non-GAAP financial performance measure with no standardized definition under IFRS. For further information and a detailed reconciliation, please see the discussion under the "Non-GAAP Financial Performance Measures" section of this MD&A.
5 Copper Mountain mine results are stated at 100%. On April 30, 2025 Hudbay completed the acquisition of the remaining 25% interest in the Copper Mountain mine and now owns 100%.
| Three months ended2 | Six months ended2 | |||||||||||||||
| Jun. 30, 2026 | Mar. 31, 2026 | Jun. 30, 2025 | Jun. 30, 2026 | Jun. 30, 2025 | ||||||||||||
| Contained metal in concentrate produced | ||||||||||||||||
| Copper | tonnes | 6,455 | 4,821 | 6,634 | 11,276 | 13,830 | ||||||||||
| Gold | oz | 5,608 | 5,187 | 5,670 | 10,795 | 11,231 | ||||||||||
| Silver | oz | 71,178 | 43,042 | 65,040 | 114,220 | 144,520 | ||||||||||
| Payable metal sold | ||||||||||||||||
| Copper | tonnes | 5,559 | 5,830 | 6,803 | 11,389 | 12,956 | ||||||||||
| Gold | oz | 5,158 | 6,126 | 5,813 | 11,284 | 10,778 | ||||||||||
| Silver | oz | 46,467 | 53,460 | 67,988 | 99,927 | 128,047 | ||||||||||
| Cost per pound of copper produced | ||||||||||||||||
| Cash cost1 | $/lb | 3.22 | 2.41 | 2.39 | 2.87 | 2.41 | ||||||||||
| Sustaining cash cost1 | $/lb | 6.23 | 7.81 | 5.18 | 6.91 | 4.69 | ||||||||||
1 Cash cost and sustaining cash cost, net of by-product credits, per pound of copper produced are non-GAAP financial performance measures with no standardized definition under IFRS. For further information and a detailed reconciliation, please see the discussion under the "Non-GAAP Financial Performance Measures" section of this MD&A.
2 Copper Mountain mine results are stated at 100%. On April 30, 2025 Hudbay completed the acquisition of the remaining 25% interest in the Copper Mountain mine and now owns 100%.
Overview
Hudbay continued to advance its multi-year optimization plan at Copper Mountain, achieving significant milestones in mining productivity, operational improvements and project execution in the second quarter of 2026. The British Columbia operations produced 6,455 tonnes of copper, 5,608 ounces of gold, and 71,178 ounces of silver in the second quarter of 2026, which is aligned with guidance and the planned mining sequence. The sustained focus on safe production was highlighted with the receipt of the 2025 John Ash Safety Award from the BC Ministry of Mining and Critical Minerals, recognizing Copper Mountain as the safest open pit mine in British Columbia in 2025.
The New Ingerbelle project achieved another major milestone in the second quarter of 2026 with its official groundbreaking ceremony on June 16, following its designation as a priority resource project by the British Columbia government. This expansion significantly enhances the long-term copper and gold production profile at Copper Mountain, supporting continuous operations and securing the asset's substantial economic benefits and employment baseline beyond 2040. The project is designed to access higher-grade mineralization while maximizing operational efficiency with a stripping ratio approximately three times lower than current mining areas. With key permits and refreshed First Nations participation agreements firmly in place, Hudbay is actively advancing critical infrastructure required to connect the New Ingerbelle pit expansion on the west side of the Similkameen River to existing operations on the east side. Key infrastructure within the project scope includes the construction of the west access road, a clear-span bridge across the Similkameen River, and the development of the east haul road. The project is currently on schedule with significant progress achieved on all project components. Concurrently, a targeted drilling program is underway at New Ingerbelle to upgrade inferred resources to higher confidence levels, expand resources, and further optimize the future mine plan. This program is 71% complete and is scheduled for completion in the fourth quarter of 2026.
Following the execution of refreshed participation agreements with the USIB and the LSIB earlier in the year, the Joint Implementation Committee and the Joint Technical Committee for the New Ingerbelle project were established in the second quarter of 2026. These committees are instrumental in safeguarding the environment and building transparency and constructive relationships with the Bands.
On March 23, 2026, the LSIB submitted an application for judicial review of the regulatory decision by the Province of British Columbia to grant the New Ingerbelle permit amendment. Hudbay remains confident in the integrity and robustness of the regulatory process that led to the issuance of the permit amendment and Hudbay believes the court will uphold the decision. Hudbay is collaborating with the Province of British Columbia to prepare for a court hearing expected later in 2026. While this review process is underway, Hudbay remains committed to working with the LSIB in a respectful and constructive manner to try to resolve the LSIB's concerns through the mechanisms that were agreed to by the parties in the Participation Agreement.
Mining Activities
Mining activities reached a record total material movement of approximately 30.1 million tonnes in the second quarter of 2026, driven by an optimized mining sequence and improved operational performance, while self-performing the construction of the east haul road for the New Ingerbelle project. As part of the accelerated stripping program, these production efficiencies resulted in a record daily average mining rate of 331,000 tonnes per day, ahead of budget. This ramp-up was supported by the successful commissioning of a new production shovel in April 2026.
Total ore mined at Copper Mountain in the second quarter of 2026 was 3.3 million tonnes, an increase of 31% and 12% compared to the second quarter of 2025 and first quarter of 2026, respectively. During the second quarter of 2026, blending initiatives from the main pit maintained stable ore feed to the mill, allowing the operation to prioritize waste stripping activities to expose higher-value mining fronts in the future. The mine is now positioned favourably to unlock high-grade copper from the main pit in late 2026, and more specifically in 2027 and 2028.
Total ore mined at Copper Mountain during the six months ended June 30, 2026 was 20% higher than the same period in 2025, driven by an optimized mining sequence, improved operational performance, and the accelerated stripping program as described above. In comparison, ore mined during the first half of 2026 had lower copper grades than the same period in 2025, primarily due to mine plan sequencing and mining activities during the first half of 2025 were deeper in the deposit where copper grades were higher.
Milling Activities
Mill performance continues to demonstrate improvement following the optimization efforts initiated in 2025. The second semi-autogenous grinding (SAG) mill delivered increased throughput in the quarter, reaching commercial production in May and averaging 12,000 tonnes per day thereafter. Throughput continues to ramp up, with individual days exceeding 20,000 tonnes per day in late June and into July.
The primary SAG mill was temporarily shut down on June 26, 2026 and will be offline until the end of July to complete the feed end head maintenance program. The replacement is tracking on schedule and will remove the constraints previously in place due to the localized damage to the feed end head that occurred in September 2025. While repairs are underway on the primary SAG mill, the second SAG continues to operate. Total mill throughput is expected to ramp up to 50,000 tonnes per day in the second half of 2026, once the primary SAG mill resumes operation.
Despite the operating constraints on the primary SAG, the mill processed 3.6 million tonnes of ore during the second quarter of 2026, an increase of 25% and 17% compared to the same period in 2025 and the first quarter of 2026, respectively. Milling throughput benefitted from improved operating parameters from the second SAG mill and the temporary conveyor system trial in place to divert crushed pebbles from the primary SAG to the second SAG. Based on the successful trial, a more permanent system is being constructed and is scheduled to be commissioned by the fourth quarter.
Milled copper grades during the second quarter of 2026 were 18% lower than the same period in 2025, as the prior year period benefited from higher grade ore mined from grade sequencing. Compared to the first quarter of 2026, copper grades were higher, driven by a greater proportion of ore feed mined from a higher-grade phase in the second quarter of 2026. Copper and gold recoveries during the quarter declined to 77% and 63%, respectively. This decline resulted from the ramp-up of mill throughput during the second quarter which revealed a grinding constraint in the ball mills, resulting in increased grind size and lower overall recoveries, compared to the first quarter of 2026. Several grinding initiatives are underway, alongside flotation advanced process controls to improve recoveries.
Milled copper grades during the first half of 2026 were lower than the same period in 2025 as the prior year period benefited from higher-grade ore contributions from the main pit, resulting in stronger metallurgical performance. Year-to-date 2026 copper and gold recoveries were 78% and 64%, respectively, representing a decline from the comparable period in 2025. This decline was a result of lower average head grades combined with a coarser grind size, which resulted from higher SAG mill throughput and the ball mill circuit operating under constraints.
The mill remains on track to achieve its permitted capacity of 50,000 tonnes per day in the second half of 2026, supported by improved throughput performance from the second SAG mill and the removal of the constraints previously in place on the primary SAG by replacing the feed end head.
Production and Sales Performance
During the second quarter of 2026, the British Columbia operations produced 6,455 tonnes of copper, 5,608 ounces of gold and 71,178 ounces of silver. Copper and gold production were lower than the second quarter of 2025, primarily due to lower mined grades, partially offset by higher throughput. Compared to the first quarter of 2026, production of all metals increased as a result of higher ore mined, improved grades and higher throughput.
During the first half of 2026, production of copper, gold and silver was 11,276 tonnes, 10,795 ounces and 114,220 ounces, respectively. Year-to-date production of all metals was lower than the same period in 2025 as a result of lower mined grades and recoveries, partially offset by higher mill throughput.
Sales volumes for all metals in the second quarter of 2026 were lower than the corresponding period in 2025, primarily driven by same factors impacting production during this period. Compared to the first quarter of 2026, copper sales volumes were consistent during the second quarter of 2026.
Year-to-date sales quantity changes compared to the same period in 2025 reflect the changes in production during the periods.
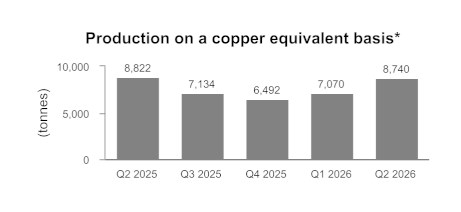
*Copper equivalent production is calculated using the quarter average LME prices for each metal. Copper Mountain mine production is stated at 100%. On April 30, 2025 Hudbay completed the acquisition of the remaining 25% interest in the Copper Mountain mine and now owns 100%.
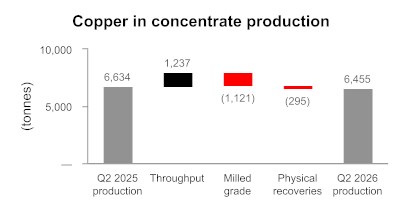
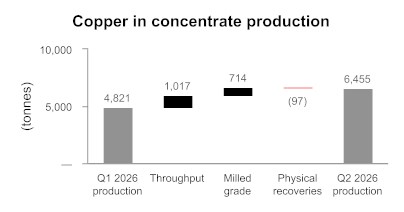
Cost Performance
Combined mine, mill and G&A unit operating costs in the second quarter of 2026 were C$25.52 per tonne milled, higher than the second quarter of 2025. This increase was primarily due to higher mining, milling and G&A costs, driven by higher energy and consumable costs, partially offset by higher milled throughput. Combined unit operating costs increased marginally compared to the first quarter of 2026, primarily driven by higher mining and G&A, partially offset by lower milling costs and higher milled throughput.
Combined mine, mill and G&A unit operating costs during the six months ended June 30, 2026 were C$25.39 per tonne milled versus C$25.12 per tonne milled in the first half of 2025 primarily due to the same factors affecting the quarterly variance.
Cash cost1 and sustaining cash cost1, net of by-product credits, were $3.22 and $6.23, respectively, per pound of copper in the second quarter of 2026. Cash cost1 was higher than the first quarter of 2026 primarily as a result of higher mining costs, less deferred stripping and lower by-product credits, partially offset by higher copper production. The increase in mill availability in the second quarter of 2026 allowed for higher mill throughput and enhanced operational efficiencies. Compared to the second quarter of 2025, cash cost was higher primarily due to higher mining, milling and G&A costs. Sustaining cash cost1 was higher than the second quarter of 2025 primarily due to the same factors affecting cash cost, together with increased sustaining capital and higher royalties.
Cash cost and sustaining cash cost per pound of copper produced, net of by-product credits, during the six months ended June 30, 2026 were $2.87 and $6.91, respectively. Variances with the same period last year were for largely the same factors affecting the quarterly variances.
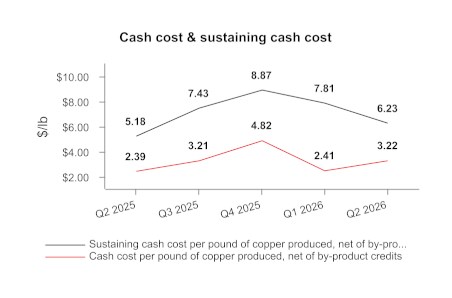
British Columbia Guidance Outlook
| Three months ended2 | Six months ended2 | Guidance | ||||||||||||||
| Jun. 30, 2026 | Jun. 30, 2025 | Jun. 30, 2026 | Jun. 30, 2025 | Annual 2026 | ||||||||||||
| Contained metal in concentrate produced | ||||||||||||||||
| Copper | tonnes | 6,455 | 6,634 | 11,276 | 13,830 | 25,000 - 35,000 | ||||||||||
| Gold | oz | 5,608 | 5,670 | 10,795 | 11,231 | 22,000 - 32,000 | ||||||||||
| Silver | oz | 71,178 | 65,040 | 114,220 | 144,520 | 200,000 - 290,000 | ||||||||||
| Cost per pound of copper produced | ||||||||||||||||
| Cash cost1 | $/lb | 3.22 | 2.39 | 2.87 | 2.41 | 1.50 - 2.50 | ||||||||||
1 Cash cost and sustaining cash cost, net of by-product credits, per pound of copper produced is a non-GAAP financial performance measures with no standardized definition under IFRS. For further information and a detailed reconciliation, please see the discussion under the "Non-GAAP Financial Performance Measures" section of this MD&A.
2 Copper Mountain mine results are stated at 100%. On April 30, 2025 Hudbay completed the acquisition of the remaining 25% interest in the Copper Mountain mine and now owns 100%.
Hudbay is on track to achieve its 2026 production guidance for all metals in British Columbia and continues to expect higher production in the second half of the year as the mill improvement projects take effect. Although second quarter cash cost was above the 2026 guidance range due to external cost pressures, Hudbay expects to achieve the full year 2026 cash cost guidance range in British Columbia.
FINANCIAL REVIEW
Financial Results
In the second quarter of 2026, Hudbay recorded net earnings attributable to owners of $137.4 million compared to the net earnings on the same basis of $117.7 million in the second quarter of 2025, representing an increase in net earnings attributable to owners of $19.7 million. Year-to-date in 2026, Hudbay recorded net earnings attributable to owners of $327.8 million compared to net earnings on the same basis of $218.1 million for the same period in 2025, representing an increase in earnings attributable to owners of $109.7 million.
The following table provides further details on the makeup of this variance:
| (in $ millions) | Three months ended June 30, 2026 |
Six months ended June 30, 2026 |
||||
| Increase (decrease) in components of earnings: | ||||||
| Revenues | 94.9 | 257.3 | ||||
| Cost of sales | ||||||
| Mine operating costs | (10.0 | ) | (43.9 | ) | ||
| Depreciation and amortization | 7.6 | 15.8 | ||||
| Selling and administrative expenses | 0.8 | (19.9 | ) | |||
| Exploration expenses | (9.8 | ) | (12.1 | ) | ||
| Other operating expenses | 2.4 | (2.5 | ) | |||
| Re-evaluation adjustment - environmental obligation | (19.3 | ) | (8.6 | ) | ||
| Other (income) expense | 20.7 | 68.9 | ||||
| Tax expense | (63.9 | ) | (139.3 | ) | ||
| Increase in net earnings for the period | 23.4 | 115.7 | ||||
| Change in non-controlling interest | (3.7 | ) | (6.0 | ) | ||
| Increase in net earnings attributable to owners for the period | 19.7 | 109.7 |
Revenue
Revenue for the second quarter of 2026 was $631.3 million, $94.9 million higher than the same period in 2025, primarily due to stronger metal prices, lower treatment and refining charges, partially offset by lower sales volume of all metals.
Revenue during the six months ended June 30, 2026 was $1,388.6 million, $257.3 million higher than in 2025, as a result of the same factors impacting the second quarter of 2026.
While a majority of revenues continue to be from copper, gold represented a significant portion of total revenues at 38% and 39% for the three months and six months ended June 30, 2026, respectively. This is as a result of exposure to higher gold prices.
The following table provides further details on these variances:
| (in $ millions) | Three months ended June 30, 2026 |
Six months ended June 30, 2026 |
||||
| Metals prices1 | ||||||
| Higher copper prices | 92.4 | 179.1 | ||||
| Higher gold prices | 66.2 | 163.9 | ||||
| Higher zinc prices | 2.5 | 3.7 | ||||
| Higher silver prices | 17.7 | 37.2 | ||||
| Sales volumes | ||||||
| Lower copper sales volumes | (63.3 | ) | (85.9 | ) | ||
| Lower gold sales volumes | (19.4 | ) | (45.1 | ) | ||
| Lower zinc sales volumes | (0.6 | ) | (3.2 | ) | ||
| Lower silver sales volumes | (5.7 | ) | (7.9 | ) | ||
| Other | ||||||
| Molybdenum and other volume and pricing differences | 1.7 | 11.2 | ||||
| Variable consideration adjustments | - | (10.0 | ) | |||
| Effect of lower treatment and refining charges | 3.4 | 14.3 | ||||
| Increase in revenue in 2026 compared to 2025 | 94.9 | 257.3 |
1 See discussion below for further information regarding metals prices.
2 Copper Mountain mine results are stated at 100%
Hudbay's revenue by significant product type is summarized below:
| Three months ended | Six months ended | ||||||||||||||
| (in $ millions) | Jun. 30, 2026 | Mar. 31, 2026 | Jun. 30, 2025 | Jun. 30, 2026 | Jun. 30, 2025 | ||||||||||
| Copper | 333.8 | 380.1 | 297.1 | 713.9 | 599.4 | ||||||||||
| Gold | 262.4 | 289.6 | 189.2 | 552.0 | 383.4 | ||||||||||
| Zinc | 9.6 | 11.9 | 7.1 | 21.5 | 21.4 | ||||||||||
| Silver | 34.1 | 32.4 | 13.9 | 66.5 | 28.2 | ||||||||||
| Molybdenum | 18.4 | 20.6 | 19.1 | 39.0 | 40.0 | ||||||||||
| Other metals | 0.1 | 4.9 | - | 5.0 | (0.2 | ) | |||||||||
| Revenue from contracts | 658.4 | 739.5 | 526.4 | 1,397.9 | 1,072.2 | ||||||||||
| Amortization of deferred revenue - gold | 2.5 | 9.1 | 5.9 | 11.6 | 14.3 | ||||||||||
| Amortization of deferred revenue - silver | 7.0 | 10.5 | 9.5 | 17.5 | 20.5 | ||||||||||
| Amortization of deferred revenue - variable consideration adjustments - prior periods | - | (0.1 | ) | - | (0.1 | ) | 9.9 | ||||||||
| Pricing and volume adjustments1 | (36.7 | ) | 1.4 | (2.1 | ) | (35.3 | ) | 31.7 | |||||||
| Treatment and refining charges | 0.1 | (3.1 | ) | (3.3 | ) | (3.0 | ) | (17.3 | ) | ||||||
| Revenue | 631.3 | 757.3 | 536.4 | 1,388.6 | 1,131.3 | ||||||||||
1 Pricing and volume adjustments represents mark-to-market adjustments on provisionally prices sales, realized and unrealized changes to fair value for non-hedge derivative contracts (QP hedges) and adjustments to originally invoiced weights and assays.
For further detail on variable consideration adjustments, refer to note 18 of Hudbay's consolidated interim financial statements.
Realized sales prices
This measure is intended to enable management and investors to understand the average realized price of metals sold to third parties in each reporting period. The average realized price per unit sold does not have any standardized meaning prescribed by IFRS, is unlikely to be comparable to similar measures presented by other issuers and should not be considered in isolation or a substitute for measures of performance prepared in accordance with IFRS.
For sales of copper, zinc, gold and silver, Hudbay may enter into non-hedge derivatives ("QP hedges") which are intended to manage the provisional pricing risk arising from quotational period terms in concentrate sales agreements. The gains and losses on QP hedges are included in the calculation of realized prices. Hudbay expects that gains and losses on QP hedges will offset provisional pricing adjustments on concentrate sales contracts.
Hudbay's realized prices for the three months ended June 30, 2026 and 2025 and March 31, 2026 and six months ended June 30, 2026 and 2025, respectively, are summarized below:
| Realized prices1 for the | Realized prices1 for the | |||||||||||||||||||||
| Three months ended | Six months ended | |||||||||||||||||||||
| Prices | LME QTD 20262 |
Jun. 30, 2026 |
Mar. 31, 2026 |
Jun. 30, 2025 |
LME YTD 20262 |
Jun. 30, 2026 |
Jun. 30, 2025 |
|||||||||||||||
| Copper | $/lb | 6.05 | 6.13 | 5.81 | 4.36 | 5.94 | 5.96 | 4.43 | ||||||||||||||
| Gold3 | $/oz | 4,508 | 4,312 | 4,468 | 3,135 | 4,691 | 4,396 | 3,062 | ||||||||||||||
| Zinc | $/lb | 1.58 | 1.44 | 1.15 | 1.50 | 1.24 | ||||||||||||||||
| Silver3 | $/oz | 52.48 | 47.02 | 26.17 | 49.33 | 26.04 | ||||||||||||||||
1 Realized prices exclude refining and treatment charges and are on the sale of finished metal or metal in concentrate. Realized prices include the effect of provisional pricing adjustments on prior period sales.
2 London Metal Exchange average for Cash copper and zinc prices.
3 Sales of gold and silver from Constancia mine are subject to Hudbay's precious metals stream agreement with Wheaton, pursuant to which Hudbay recognizes deferred revenue for precious metals deliveries and also receive cash payments. Stream sales are included within realized prices and their respective deferred revenue and cash payment rates can be found on page 33 of this MD&A.
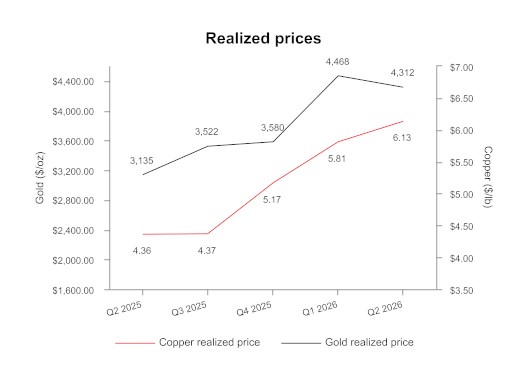
In addition to QP hedges, the Company may periodically undertake metal price hedging in accordance with Board approved policies to achieve strategic objectives, including locking in favourable metal prices to ensure minimum cash flows during or after the construction of a mine or during a period of reduced liquidity due to large capital investments, to manage cash flows at shorter life or higher cost operations or as part of a financing arrangement. The realized prices, denoted in the table above, exclude the impact of derivative mark-to-market gains and losses on these non-QP hedges, which are included in change in fair value of financial instruments in Hudbay's condensed consolidated interim statements of income.
Hudbay entered into forward copper sales and zero copper cost collar hedges during the first quarter of 2026 that cover approximately 35% of Copper Mountain's expected 2026 production.
As of June 30, 2026, Hudbay had the following non-QP hedges outstanding:
• Forward sales contracts for a total of 6.6 million pounds of copper production over the period of July 2026 to April 2027 at an average price of $6.03 per pound; and
• Zero-cost collar program for 13.2 million pounds of copper production over the period of July 2026 to April 2027 at an average floor price of $5.76 per pound and an average cap price of $6.36 per pound.
The following tables provide a reconciliation of average realized price per unit sold, by metal, to revenues as shown in the consolidated interim financial statements.
| Three months ended June 30, 2026 | |||||||||||||||||||||
| (in $ millions except for realized price and payable metal sold) 1 | Copper | Gold | Zinc | Silver | Molybdenum | Other | Total | ||||||||||||||
| Revenue from contracts 2 | 333.8 | 262.4 | 9.6 | 34.1 | 18.4 | 0.1 | 658.4 | ||||||||||||||
| Amortization of deferred revenue | - | 2.5 | - | 7.0 | - | - | 9.5 | ||||||||||||||
| Pricing and volume adjustments 3 | (12.3 | ) | (22.3 | ) | (0.4 | ) | (5.7 | ) | 4.0 | - | (36.7 | ) | |||||||||
| Revenue, including mark-to-market on QP hedges 4 | 321.5 | 242.6 | 9.2 | 35.4 | 22.4 | 0.1 | 631.2 | ||||||||||||||
| Realized non-QP derivative mark-to-market | (0.1 | ) | - | - | - | - | - | (0.1 | ) | ||||||||||||
| By-product credits 5 | 321.4 | 242.6 | 9.2 | 35.4 | 22.4 | 0.1 | 631.1 | ||||||||||||||
| Payable metal in concentrate and doré sold 6 | 23,780 | 56,266 | 2,635 | 674,490 | 298 | - | - | ||||||||||||||
| Realized price 7 | 6.13 | 4,312 | 1.58 | 52.48 | - | - | - | ||||||||||||||
| Realized price, including realized non-QP derivative 7 | 6.13 | 4,312 | 1.58 | 52.48 | - | - | - | ||||||||||||||
| Three months ended March 31, 2026 | |||||||||||||||||||||
| Revenue from contracts 2 | 380.1 | 289.6 | 11.9 | 32.4 | 20.6 | 4.9 | 739.5 | ||||||||||||||
| Amortization of deferred revenue | - | 9.1 | - | 10.5 | - | - | 19.6 | ||||||||||||||
| Pricing and volume adjustments 3 | (1.7 | ) | (1.3 | ) | 0.5 | 0.5 | 3.4 | - | 1.4 | ||||||||||||
| Revenue, including mark-to-market on QP hedges 4 | 378.4 | 297.4 | 12.4 | 43.4 | 24.0 | 4.9 | 760.5 | ||||||||||||||
| Realized non-QP derivative mark-to-market | - | - | - | - | - | - | - | ||||||||||||||
| By-product credits 5 | 378.4 | 297.4 | 12.4 | 43.4 | 24.0 | 4.9 | 760.5 | ||||||||||||||
| Payable metal in concentrate and doré sold 6 | 29,544 | 66,562 | 3,897 | 923,051 | 375 | - | - | ||||||||||||||
| Realized price 7 | 5.81 | 4,468 | 1.44 | 47.02 | - | - | - | ||||||||||||||
| Realized price, including realized non-QP derivative 7 | 5.81 | 4,468 | 1.44 | 47.02 | |||||||||||||||||
| Three months ended June 30, 2025 | |||||||||||||||||||||
| Revenue from contracts 2 | 297.1 | 189.2 | 7.1 | 13.9 | 19.1 | - | 526.4 | ||||||||||||||
| Amortization of deferred revenue | - | 5.9 | - | 9.5 | - | - | 15.4 | ||||||||||||||
| Pricing and volume adjustments 3 | (4.7 | ) | 0.7 | 0.2 | - | 1.7 | - | (2.1 | ) | ||||||||||||
| Revenue, including mark-to-market on QP hedges 4 | 292.4 | 195.8 | 7.3 | 23.4 | 20.8 | - | 539.7 | ||||||||||||||
| Realized non-QP derivative mark-to-market 5 | (0.4 | ) | - | - | - | - | - | (0.4 | ) | ||||||||||||
| By-product credits 4 | 292.0 | 195.8 | 7.3 | 23.4 | 20.8 | - | 539.3 | ||||||||||||||
| Payable metal in concentrate and doré sold 6 | 30,354 | 62,466 | 2,871 | 894,160 | 427 | - | - | ||||||||||||||
| Realized price 7 | 4.36 | 3,135 | 1.15 | 26.17 | - | - | - | ||||||||||||||
| Realized price, including realized non-QP derivative 7 | 4.36 | 3,135 | 1.15 | 26.17 | |||||||||||||||||
1 Average realized price per unit sold may not calculate based on amounts presented in this table due to rounding.
2 As per IFRS Accounting Standards.
3 Pricing and volume adjustments represents mark-to-market adjustments on provisionally priced sales, realized and unrealized changes to fair value for QP hedge derivative contracts and adjustments to originally invoiced weights and assays.
4 Revenue, including mark-to-market on QP hedges is used in the calculation of realized price.
5 By-product credits subtotal is used in the calculated of cash cost per pound of copper and ounce of gold produced, net of by-product credits. Cash cost per pound of copper and per ounce of gold produced, net of by-product credits, are non-GAAP financial performance measures with no standardized definition under IFRS. For further information and a detailed reconciliation, please see the discussion under the "Non-GAAP Financial Performance Measures" section of this MD&A.
6 Copper and zinc shown in metric tonnes and gold and silver shown in ounces.
7 Realized price for copper and zinc in $/lb and realized price for gold and silver in $/oz.
| Six months ended June 30, 2026 | |||||||||||||||||||||
| (in $ millions except for realized price and payable metal sold) 1 | Copper | Gold | Zinc | Silver | Molybdenum | Other | Total | ||||||||||||||
| Revenue from contracts 2 | 713.9 | 552.0 | 21.5 | 66.5 | 39.0 | 5.0 | 1,397.9 | ||||||||||||||
| Amortization of deferred revenue | - | 11.6 | - | 17.5 | - | - | 29.1 | ||||||||||||||
| Pricing and volume adjustments 3 | (14.0 | ) | (23.6 | ) | 0.1 | (5.2 | ) | 7.4 | - | (35.3 | ) | ||||||||||
| Revenue, including mark-to-market on QP hedges 4 | 699.9 | 540.0 | 21.6 | 78.8 | 46.4 | 5.0 | 1,391.7 | ||||||||||||||
| Realized non-QP derivative mark-to-market | (0.1 | ) | - | - | - | - | - | (0.1 | ) | ||||||||||||
| By-product credits 5 | 699.8 | 540.0 | 21.6 | 78.8 | 46.4 | 5.0 | 1,391.6 | ||||||||||||||
| Payable metal in concentrate and doré sold 6 | 53,324 | 122,828 | 6,532 | 1,597,541 | 673 | - | - | ||||||||||||||
| Realized price 7 | 5.96 | 4,396 | 1.50 | 49.33 | - | - | - | ||||||||||||||
| Realized price, including realized non-QP derivative 7 | 5.95 | 4,396 | 1.50 | 49.33 | - | - | - | ||||||||||||||
| Six months ended June 30, 2025 | |||||||||||||||||||||
| (in $ millions except for realized price and payable metal sold) 1 | Copper | Gold | Zinc | Silver | Molybdenum | Other | Total | ||||||||||||||
| Revenue from contracts 2 | 599.4 | 383.4 | 21.4 | 28.2 | 40.0 | (0.2 | ) | 1,072.2 | |||||||||||||
| Amortization of deferred revenue | - | 14.3 | - | 20.5 | - | - | 34.8 | ||||||||||||||
| Pricing and volume adjustments 3 | 7.3 | 23.5 | (0.3 | ) | 0.8 | 0.4 | - | 31.7 | |||||||||||||
| Revenue, including mark-to-market on QP hedges 4 | 606.7 | 421.2 | 21.1 | 49.5 | 40.4 | (0.2 | ) | 1,138.7 | |||||||||||||
| Realized non-QP derivative mark-to-market | (2.3 | ) | - | - | - | - | - | (2.3 | ) | ||||||||||||
| By-product credits 5 | 604.4 | 421.2 | 21.1 | 49.5 | 40.4 | (0.2 | ) | 1,136.4 | |||||||||||||
| Payable metal in concentrate and doré sold 6 | 62,122 | 137,558 | 7,728 | 1,901,128 | - | - | - | ||||||||||||||
| Realized price 7 | 4.43 | 3,062 | 1.24 | 26.04 | - | - | - | ||||||||||||||
| Realized price, including realized non-QP derivative 7 | 4.41 | 3,062 | 1.24 | 26.04 | - | - | - | ||||||||||||||
1 Average realized price per unit sold may not calculate based on amounts presented in this table due to rounding.
2 As per consolidated interim financial statements.
3 Pricing and volume adjustments represents mark-to-market adjustments on provisionally priced sales, realized and unrealized changes to fair value for QP hedge derivative contracts and adjustments to originally invoiced weights and assays.
4 Revenue, including mark-to-market on QP hedges is used in the calculation of realized price.
5 By-product credits subtotal is used in the calculated of cash cost per pound of copper and ounce of gold produced, net of by-product credits. Cash cost per pound of copper and per ounce of gold produced, net of by-product credits, are non-GAAP financial performance measures with no standardized definition under IFRS. For further information and a detailed reconciliation, please see the discussion under the "Non-GAAP Financial Performance Measures" section of this MD&A.
6 Copper and zinc shown in metric tonnes and gold and silver shown in ounces.
7 Realized price for copper and zinc in $/lb and realized price for gold and silver in $/oz.
The price, quantity and mix of metals sold affect Hudbay's revenue, operating cash flow and gross profit. Revenue from metals sales can vary from quarter to quarter due to production levels, shipping volumes and transfer of risk and title to customers.
Precious metals - stream sales and realized price breakdown
The following table shows a breakdown of realized prices for precious metals inclusive of stream and offtaker revenue. It further identifies the components of the realized price for stream revenues between the amortized drawdown rate and cash payment rate.
| (in $ millions except for realized price and payable metal sold) | Gold | Silver | |||||||||||||||||||||||
| Three months ended | Six months ended | Three months ended | Six months ended | ||||||||||||||||||||||
| Revenue | Jun. 30, 2026 |
Jun. 30, 2025 |
Jun. 30, 2026 |
Jun. 30, 2025 |
Jun. 30, 2026 |
Jun. 30, 2025 |
Jun. 30, 2026 |
Jun. 30, 2025 |
|||||||||||||||||
| Stream | 3.8 | 8.8 | 17.5 | 21.4 | 10.0 | 13.3 | 24.7 | 28.9 | |||||||||||||||||
| Offtaker | 238.8 | 187.0 | 522.5 | 399.8 | 25.4 | 10.1 | 54.1 | 20.6 | |||||||||||||||||
| Revenue, including mark-to-market on QP hedges 3 | 242.6 | 195.8 | 540.0 | 421.2 | 35.4 | 23.4 | 78.8 | 49.5 | |||||||||||||||||
| Payable metal sold | |||||||||||||||||||||||||
| Stream | oz | 2,990 | 6,827 | 13,876 | 16,615 | 452,847 | 624,787 | 1,127,132 | 1,354,674 | ||||||||||||||||
| Offtaker | oz | 53,276 | 55,639 | 108,952 | 120,943 | 221,643 | 269,373 | 470,409 | 546,454 | ||||||||||||||||
| Total payable metal sold | oz | 56,266 | 62,466 | 122,828 | 137,558 | 674,490 | 894,160 | 1,597,541 | 1,901,128 | ||||||||||||||||
| Deferred revenue drawdown rate1 | $/oz | 833 | 860 | 833 | 860 | 15.56 | 15.06 | 15.56 | 15.06 | ||||||||||||||||
| Cash rate2 | $/oz | 429 | 425 | 429 | 425 | 6.33 | 6.26 | 6.33 | 6.26 | ||||||||||||||||
| Stream realized price | $/oz | 1,262 | 1,285 | 1,262 | 1,285 | 21.89 | 21.32 | 21.89 | 21.32 | ||||||||||||||||
| Offtaker realized price | $/oz | 4,482 | 3,361 | 4,796 | 3,306 | 114.60 | 37.49 | 115.01 | 37.70 | ||||||||||||||||
| Realized price | $/oz | 4,312 | 3,135 | 4,396 | 3,062 | 52.48 | 26.17 | 49.33 | 26.04 | ||||||||||||||||
1 Deferred revenue drawdown rates for gold and silver do not include variable consideration adjustments.
2 The gold and silver cash rate for Peru increased by 1% from $400/oz and $5.90/oz effective August 4, 2019. Subsequently every year, on August 4, the cash rate will increase by 1% compounded.
3 Revenue, including mark-to-market on QP hedges is used in the calculation of realized price.
Subsequent to the variable consideration adjustment recorded on January 1, 2026, the deferred revenue amortization is recorded in Peru at $833 per ounce gold and $15.56 per ounce silver (June 30, 2025 - $860 per ounce gold and $15.06 per ounce silver).
Cost of Sales
Hudbay's detailed cost of sales is summarized as follows:
| (in $ millions) | Three months ended | Six months ended | |||||||||||||
| Jun. 30, 2026 |
Mar. 31, 2026 |
Jun. 30, 2025 |
Jun. 30, 2026 |
Jun. 30, 2025 |
|||||||||||
| Peru | |||||||||||||||
| Mining | 42.2 | 34.5 | 28.1 | 76.7 | 59.1 | ||||||||||
| Milling | 50.9 | 43.4 | 57.8 | 94.3 | 102.2 | ||||||||||
| Changes in product inventory | (20.3 | ) | 7.6 | 4.0 | (12.7 | ) | 17.8 | ||||||||
| Depreciation and amortization | 45.4 | 61.4 | 56.0 | 106.8 | 124.2 | ||||||||||
| G&A | 25.6 | 33.7 | 23.4 | 59.3 | 46.0 | ||||||||||
| Inventory adjustments | - | - | 1.1 | - | 1.5 | ||||||||||
| Freight, royalties and other charges | 14.0 | 16.0 | 13.4 | 30.0 | 29.7 | ||||||||||
| Total Peru cost of sales | 157.8 | 196.6 | 183.8 | 354.4 | 380.5 | ||||||||||
| Manitoba | |||||||||||||||
| Mining | 43.5 | 42.3 | 33.5 | 85.8 | 71.8 | ||||||||||
| Milling | 16.3 | 16.3 | 13.4 | 32.6 | 27.8 | ||||||||||
| Changes in product inventory | 5.6 | (5.9 | ) | 3.8 | (0.3 | ) | 2.8 | ||||||||
| Depreciation and amortization | 21.2 | 20.0 | 23.6 | 41.2 | 47.5 | ||||||||||
| Overhead costs incurred during Manitoba temporary suspension (cash) | - | - | 3.2 | - | 3.2 | ||||||||||
| Inventory adjustments | 0.9 | - | 1.0 | 0.9 | 1.0 | ||||||||||
| G&A | 19.3 | 21.8 | 14.3 | 41.1 | 29.4 | ||||||||||
| Freight, royalties and other charges | 5.3 | 5.7 | 5.1 | 11.0 | 10.8 | ||||||||||
| Total Manitoba cost of sales | 112.1 | 100.2 | 97.9 | 212.3 | 194.3 | ||||||||||
| British Columbia1 | |||||||||||||||
| Mining | 31.3 | 16.2 | 24.2 | 47.5 | 46.1 | ||||||||||
| Milling | 27.2 | 31.5 | 21.4 | 58.7 | 43.2 | ||||||||||
| Changes in product inventory | (2.6 | ) | 11.3 | 3.6 | 8.7 | 2.8 | |||||||||
| Depreciation and amortization | 22.2 | 18.5 | 16.8 | 40.7 | 32.8 | ||||||||||
| G&A | 8.5 | 9.0 | 6.3 | 17.5 | 12.9 | ||||||||||
| Inventory adjustments | - | - | 1.4 | - | 2.2 | ||||||||||
| Freight, royalties and other charges | 5.8 | 6.0 | 4.5 | 11.8 | 8.7 | ||||||||||
| Total British Columbia cost of sales | 92.4 | 92.5 | 78.2 | 184.9 | 148.7 | ||||||||||
| Cost of sales | 362.3 | 389.3 | 359.9 | 751.6 | 723.5 | ||||||||||
1 Copper Mountain mine results are stated at 100%.
Total cost of sales for the second quarter of 2026 was $362.3 million, reflecting an increase of $2.4 million compared to the second quarter of 2025.
Peru cost of sales during the second quarter of 2026 decreased by $26.0 million compared to the same period in 2025, primarily driven by the build-up of finished concentrate inventory. The build-up of inventory at the port was due to ocean swell-related closures, as well as an increase in the ore stockpile, which subsequently led to lower depreciation being recognized during the quarter. Additionally, milling costs were lower primarily as a result of lower power prices compared to the same period last year once the new power purchase agreement came into effect on January 1, 2026. These decreases were partially offset by higher mining costs resulting from higher diesel prices and increased contractor services as well as higher G&A costs driven by increased employee profit sharing. Peru cost of sales during the second quarter of 2026 decreased by $38.8 million compared to the first quarter of 2026, primarily driven by the same factors mentioned above.
Manitoba cost of sales during the second quarter of 2026 increased by $14.2 million compared to the same period in 2025, primarily driven by higher mining costs as a result of increased development, direct mining, and fuel costs. Milling costs also increased, reflecting fewer operational down days compared to the prior year period, which was impacted by a wildfire-related evacuation order. Additionally, the increase was a result of higher change in inventory costs and an increase in G&A costs, resulting from higher employee profit sharing. Manitoba cost of sales during the second quarter of 2026 increased by $11.9 million compared to the first quarter of 2026, primarily driven by a higher change in product inventory.
British Columbia cost of sales during the second quarter of 2026 increased by $14.2 million compared to the same period in 2025, primarily driven by higher mining costs resulting from elevated fuel prices and the timing of equipment maintenance, as well as higher milling costs driven by increased throughput, which led to higher power costs and consumables usage. Depreciation was also higher due to the acquisition of high valued capital assets that commenced depreciation during the period. These increases were partially offset by lower change in product inventory and fewer inventory adjustments. British Columbia cost of sales during the second quarter of 2026 decreased by $0.1 million compared to the first quarter of 2026, primarily driven by a build-up of product inventory. This decrease was partially offset by higher mining costs resulting from elevated fuel prices and the timing of equipment maintenance.
Total cost of sales for the six months ended June 30, 2026 was $751.6 million, remaining relatively consistent with the comparable period, reflecting an increase of $28.1 million.
Peru cost of sales decreased by $26.1 million for the six months ended June 30, 2026, compared to the same period of 2025 primarily due to the same factors mentioned above. Manitoba cost of sales increased by $18.0 million primarily due to higher mining, milling, and G&A partially offset by lower change in product inventory and depreciation. British Columbia cost of sales increased by $36.2 million primarily driven by the same factors mentioned in the quarterly variance.
For details on unit operating costs, refer to the respective tables in the "Operations Review" section of this MD&A.
For the second quarter of 2026, other significant variances in expenses, compared to the same period in 2025, include the following:
- Re-evaluation DRO adjustment gain decreased by $19.3 million due to the relative revaluation of the environmental reclamation provision on Hudbay's Manitoba non-producing sites from changes in long-term risk-free discount and inflation rates. Given the long term nature of the reclamation cash flows, the related environmental reclamation provision is highly sensitive to changes in inflation and long-term-risk free discount rates, and, as such, Hudbay may continue to experience significant quarterly environmental reclamation revaluations.
- Other operating expenses decreased by $2.4 million, primarily due to a gain of $11.5 million from business interruption insurance proceeds in Manitoba from the temporary suspension of operations related to the wildfire evacuation orders in 2025 offset by an increase in evaluation costs of $8.9 million primarily related to Mason project drilling activities.
- Other (income) expense decreased by $20.7 million, primarily due to an increase in mark-to-market gains of $53.4 million from investments, a decrease of $2.3 million in interest expense on long-term debt benefitting from the retirement of the 2026 senior unsecured notes, partially offset by an increase in foreign exchange loss of $30.9 million from the revaluation of foreign currency monetary balances and an increase in losses of $8.8 million from non-QP hedges.
For year-to-date 2026, other significant variances in expenses, compared to the same period in 2025, include the following:
- General administration expenses increased by $19.9 million, primarily due to an increase of $16.8 million in share-based compensation expense mostly from the revaluation of share units due to higher share prices compared to the prior period.
- Exploration expenses increased by $12.1 million, primarily due to Hudbay's planned Snow Lake exploration program consisting of modern geophysical programs and multi-phased drilling campaigns, most of which was funded by flow-through financing.
- Other operating expenses increased by $2.5 million, primarily due to an increase in evaluation costs of $10.6 million primarily relating to Mason project drilling activities, an increase of $5.1 million in amortization of community costs, partially offset by $11.5 million from business interruption insurance proceeds in Manitoba as noted above.
- Re-evaluation adjustment - environmental provision gain decreased by $8.6 million due to the relative revaluation of the environmental reclamation provision on Hudbay's Manitoba non-producing sites from changes in long-term risk-free discount and inflation rates.
- Other (income) expense increased by $68.9 million due to an increase in mark-to-market gains of $100.6 million from investments, an increase of $4.9 million in net interest income, a decrease of $3.8 million in net interest expense on long-term debt benefitting from the retirement of the 2026 senior unsecured notes, partially offset by a $44.7 million increase in net foreign exchange loss from the revaluation of foreign currency monetary balances.
Tax Expense
For the three months ended June 30, 2026, tax expense increased by $63.9 million compared to the same period in 2025. For the six months ended June 30, 2026, tax expense increased by $139.3 million compared to the same period in 2025. The following table provides further details:
| (in $ millions) | Three months ended | Six months ended | ||||||||||
| Jun. 30, 2026 |
Jun. 30, 2025 |
Jun. 30, 2026 |
Jun. 30, 2025 |
|||||||||
| Current tax expense - income tax | 41.7 | 30.3 | 123.2 | 65.5 | ||||||||
| Deferred tax expense (recovery) - income tax1 | 26.5 | (10.5 | ) | 44.7 | 10.2 | |||||||
| Total income tax expense | 68.2 | 19.8 | 167.9 | 75.7 | ||||||||
| Current tax expense - mining tax | 32.7 | 17.6 | 81.2 | 36.2 | ||||||||
| Deferred tax expense (recovery) - mining tax1 | 1.4 | 1.0 | 0.7 | (1.4 | ) | |||||||
| Total mining tax expense | 34.1 | 18.6 | 81.9 | 34.8 | ||||||||
| Tax expense | 102.3 | 38.4 | 249.8 | 110.5 | ||||||||
1 Deferred tax expense (recovery) represents Hudbay's draw down/increase of non-cash deferred income and mining tax assets/liabilities.
Income Tax Expense/Recovery
Applying the estimated Canadian statutory income tax rate of 26.7% to Hudbay's net earnings before taxes of $579.4 million for the year-to-date of 2026 would have resulted in a tax expense of approximately $154.7 million. Hudbay recorded an income tax expense of $167.9 million. The primary items causing Hudbay's effective income tax rate to be different than the 26.7% estimated Canadian statutory income tax rate are the following:
- The tax expense with respect to Hudbay's foreign operations is recorded using an income tax rate other than the Canadian statutory income tax rate of 26.7%, resulting a tax expense of $33.2 million.
- Current mining tax deductions resulted in a tax recovery of $23.0 million.
Mining Tax Expense
For the year-to-date 2026, Hudbay recorded a mining tax expense of $81.9 million. Effective mining tax rates can vary significantly based on the composition of Hudbay's earnings and the expected amount of mining taxable profits. Corporate costs and other costs not related to mining operations are not deductible in computing mining profits. A brief description of how mining taxes are calculated in Hudbay's various business units is discussed below.
Manitoba
The Province of Manitoba imposes mining tax on earnings related to the sale of mineral products mined in the Province of Manitoba (mining taxable profit) at the following rates:
- 10% of total mining taxable earnings if mining profit is C$50 million or less;
- Between mining earnings of C$50 and $C55 million, mining tax is equal to a minimum of C$5 million plus mining earnings less C$50 million multiplied by 65%;
- 15% of total mining taxable earnings if mining profits are between C$55 million and C$100 million;
- Between mining earnings of C$100 million and C$105 million, mining tax is equal to a minimum of C$15 million plus mining earnings less C$100 million multiplied by 57%; and
- 17% of total mining taxable earnings if mining profits exceed C$105 million.
Hudbay estimates that the deferred tax rate that will be applicable when temporary differences reverse will be approximately 10.0%.
Peru
The Peruvian government imposes two parallel mining tax regimes, the Special Mining Tax and the Modified Royalty, on companies' operating mining income on a sliding scale, with progressive rates ranging from 2.0% to 8.4% and 1.0% to 12.0%, respectively. Based on financial forecasts, Hudbay has recorded a deferred tax liability as at June 30, 2026, at the tax rate expected to be applied when temporary differences reverse.
British Columbia
The Province of British Columbia imposes a 13% net revenue tax on the sale of mineral products mined in the province of British Columbia after the mine owner has recovered the capital invested in the mine and its Cumulative Expenditure Account ("CEA") no longer has a balance. The tax is paid on the profit in excess of the capital that has been invested in the mine. British Columbia mineral tax is deductible for federal and provincial income tax purposes.
While there is a balance in the CEA account, the mine owner must pay a Net Current Proceeds ("NCP") tax of 2%. Any amounts paid as NCP can then be claimed in the future against net revenue taxes payable.
Hudbay estimates that the effective tax rate that will be applicable when temporary differences reverse will be approximately 9.49%.
LIQUIDITY AND CAPITAL RESOURCES
As at June 30, 2026, Hudbay's total liquidity of $1,044.6 million includes $890.9 million in cash, which excludes $49.8 million in Municipal Bond proceeds that is classified as restricted cash, as well as undrawn total availability of $153.7 million under Hudbay's revolving credit facilities.
Senior Unsecured Notes
As at June 30, 2026, Hudbay had $542.4 million aggregate principal amount of 2029 Notes.
On April 1, 2026, the Company completed the repayment of its 2026 Notes upon their maturity. The total principal amount settled was $472.5 million, plus accrued and unpaid interest. The repayment was funded using the Company's available cash on hand and $272.0 million through a draw on the Company's senior secured revolving credit facility.
Senior Secured Revolving Credit Facilities
Hudbay has two senior secured revolving credit facilities with total commitments of $450 million ("the Credit Facilities") for its Canadian and Peruvian businesses on substantially similar terms and conditions. The Credit Facilities include an accordion feature that allows Hudbay the option to increase the facility by an additional $150 million at Hudbay's discretion over the four-year term.
As at June 30, 2026, $272.0 million was drawn under the Credit Facilities and $24.3 million in letters of credit secured under the Canadian Credit Facility. The proceeds of the $272.0 million draw were used to repay the 2026 Notes, as mentioned earlier.
As at June 30, 2026, Hudbay was in compliance with its covenants under the Credit Facilities.
Municipal Bonds
On June 24, 2026, the Arizona Industrial Development Authority issued the Municipal Bonds. The Municipal Bonds carry a fixed interest rate of 4.50%, payable semi-annually, and have an initial mandatory tender date of July 2, 2036. The Municipal Bonds represent senior unsecured obligations of Copper World LLC and are guaranteed on a senior unsecured basis by Hudbay and its primary operating subsidiaries. The proceeds from this issuance help enhance the Company's overall liquidity position and are intended to support the ongoing development and capital requirements of the Copper World project, specifically with respect to qualifying solid waste disposal expenditures.
C$130 Million Bilateral Letter of Credit Facility
Hudbay has a C$130.0 million bilateral letter of credit facility ("LC Facility") with a major Canadian financial institution. The LC Facility has no financial covenants and enables Hudbay to issue up to C$130.0 million of letters of credit to beneficiaries on an unsecured basis at attractive rates, including C$30.0 million sub-limit for financial letters of credit. As at June 30, 2026, the Manitoba business unit had drawn $55.7 million in letters of credit under the LC Facility.
Surety Bonds and Letters of Credit
As at June 30, 2026, the United States business unit had $23.2 million in surety bonds issued to support future reclamation and closure obligations and the Peru business unit had $145.3 million in letters of credit issued with various Peruvian financial institutions to support future reclamation and other operating matters. In addition, the British Columbia business unit had $46.2 million in surety bonds issued to support future reclamation and $1.8 million in surety bonds and letters of credit to support other operating matters. No cash collateral is required to be posted under these surety bonds.
Working Capital
Working capital increased by $817.4 million to $751.8 million from December 31, 2025 to June 30, 2026, primarily due to a decrease in the current portion of long-term debt of $472.1 million as a result of a full repayment of the 2026 senior unsecured debt, an increase in cash and cash equivalents of $322.0 million as a result of the $411.7 million net proceeds from the sale of Copper World non-controlling interest, a decrease of $53.5 million in taxes payable, an increase in other financial assets of $52.5 million as a result of an increase in restricted cash from the $49.8 million proceeds received from the municipal bonds, a decrease in other financial liabilities of $27.9 million primarily as a result of the revaluation of derivative liabilities, a decrease in other liabilities of $27.6 million primarily relating to share-based compensation paid in the first quarter of 2026, and a decrease of $18.9 million relating to deferred revenue. These increases are offset by a $173.8 million decrease in trade and other receivables primarily related to the temporary build-up of concentrate inventory at the port in Peru caused by port closures resulting from ocean swells, and a decrease in inventory by $9.4 million.
Cash Flows
The following table summarizes Hudbay's cash flows for the three months ended June 30, 2026, March 31, 2026 and June 30, 2025 and for six months ended June 30, 2026 and June 30, 2025:
| (in $ millions) | Three months ended | Six months ended | |||||||||||||
| June. 30, 2026 |
Mar. 31, 2026 |
June. 30, 2025 |
June. 30, 2026 |
June. 30, 2025 |
|||||||||||
| Operating cash flow before change in non-cash working capital | 210.1 | 208.7 | 193.9 | 418.8 | 357.4 | ||||||||||
| Change in non-cash working capital | 86.9 | 2.6 | 66.0 | 89.5 | 27.3 | ||||||||||
| Cash generated from operating activities | 297.0 | 211.3 | 259.9 | 508.3 | 384.7 | ||||||||||
| Cash used in investing activities | (154.5 | ) | (166.6 | ) | (100.6 | ) | (321.1 | ) | (184.9 | ) | |||||
| Cash (used in) generated from financing activities | (253.8 | ) | 391.9 | (98.9 | ) | 138.1 | (119.7 | ) | |||||||
| Effect of movement in exchange rates on cash | (1.6 | ) | (1.7 | ) | 2.5 | (3.3 | ) | 3.6 | |||||||
| Net (decrease) increase in cash | (112.9 | ) | 434.9 | 62.9 | 322.0 | 83.7 | |||||||||
Cash Flow from Operating Activities
Cash generated from operating activities was $297.0 million during the second quarter of 2026, an increase of $37.1 million compared to the same period in 2025. Operating cash flow before change in non-cash working capital was $210.1 million during the second quarter of 2026, reflecting an increase of $16.2 million compared to the second quarter of 2025. The increase in operating cash flows before change in working capital compared with the second quarter of 2025 was primarily the result of higher metal prices, partially offset by higher cash taxes paid which are a function of higher profits in earlier quarters in Peru and Manitoba that were subsequently payable.
During the six months ended June 30, 2026 cash generated from operating activities was $508.3 million, an increase of $123.6 million compared to the same period in 2025. Operating cash flow before changes in non-cash working capital for the six months ended June 30, 2026 was $418.8 million, an increase of $61.4 million compared to the same period in 2025. The increas was primarily the result of higher metal prices. This was partially offset by a significant increase in cash taxes paid of $101.4 million and stock based compensation paid, compared to the same period in 2025.
Cash Flow from Investing and Financing Activities
During the second quarter of 2026, Hudbay spent $408.3 million in investing and financing activities, primarily driven by the $472.5 million repurchase of the 2026 senior unsecured notes, $152.9 million in capital expenditures, $16.4 million in capitalized lease and equipment financing payments, $13.0 million in community agreement payments, $7.2 million in net purchases of investments, $3.1 million in financing costs paid and $2.8 million in dividends paid. This was partially offset by $272.0 million proceeds received from the drawdown of the revolving credit facility.
During the six months ended June 30, 2026 Hudbay spent $183.0 million in investing and financing activities, primarily driven by the $472.5 million repurchase of the 2026 senior unsecured note, $293.1 million in capital expenditures, $38.7 million in purchase of investments, $32.5 million in capitalized lease and equipment financing payments, $30.0 million in interest paid on Hudbay's long-term debt, $16.7 million in community agreement payments, $5.9 million in financing costs paid and $5.7 million in dividends paid. This was partially offset by cash $272.0 million proceeds received from the drawdown of the revolving credit facility and $16.1 million in investment income received.
Capital Expenditures
The following summarizes accrued and cash additions to capital assets for the periods indicated:
| Three months ended | Six months ended | Guidance | ||||||||||||||||
| Jun. 30, 2026 |
Mar. 31, 2026 |
Jun. 30, 2025 |
Jun. 30, 2026 |
Jun. 30, 2025 |
Annual | |||||||||||||
| (in $ millions) | 20262 | |||||||||||||||||
| Sustaining capital expenditures | ||||||||||||||||||
| Peru 1 | 26.4 | 22.9 | 44.4 | 49.3 | 72.9 | 140.0 | ||||||||||||
| Manitoba 1 | 20.7 | 17.2 | 11.3 | 37.9 | 23.8 | 105.0 | ||||||||||||
| British Columbia 1,3 | 33.0 | 46.9 | 32.9 | 79.9 | 54.4 | 190.0 | ||||||||||||
| Total sustaining capital expenditures | 80.1 | 87.0 | 88.6 | 167.1 | 151.1 | 435.0 | ||||||||||||
| Copper World growth capitalized costs4 | 38.3 | 29.6 | 13.7 | 67.9 | 25.1 | 135.0 | ||||||||||||
| Growth capital expenditures | ||||||||||||||||||
| Peru | 6.0 | 1.4 | 1.3 | 7.4 | 2.2 | 40.0 | ||||||||||||
| Manitoba | 2.5 | 3.4 | 1.6 | 5.9 | 3.9 | 15.0 | ||||||||||||
| British Columbia | 30.6 | 9.5 | 16.5 | 40.1 | 27.5 | 115.0 | ||||||||||||
| Total growth capital expenditures - excluding Copper World | 39.1 | 14.3 | 19.4 | 53.4 | 33.6 | 170.0 | ||||||||||||
| Capitalized exploration | 8.4 | 5.8 | 3.5 | 14.2 | 4.5 | 25.0 | ||||||||||||
| Cactus Project capitalized costs | 4.0 | - | - | 4.0 | - | |||||||||||||
| Right-of-use asset and property, plant & equipment financing additions | 34.7 | 36.6 | 13.9 | 71.3 | 28.9 | |||||||||||||
| LOM community agreement adjustments | (0.6 | ) | (0.1 | ) | 0.6 | (0.7 | ) | 0.6 | ||||||||||
| Non-cash capitalized stripping | 6.1 | 9.4 | 8.5 | 15.5 | 14.9 | |||||||||||||
| Grants and other capitalized costs | (0.3 | ) | (0.1 | ) | (0.8 | ) | (0.4 | ) | (1.9 | ) | ||||||||
| Total other non-sustaining capital costs5 | 129.7 | 95.5 | 58.8 | 225.2 | 105.7 | |||||||||||||
| Total accrued capital additions | 209.8 | 182.5 | 147.4 | 392.3 | 256.8 | |||||||||||||
| Reconciliation to cash capital additions: | ||||||||||||||||||
| Other capitalized costs2 | (40.2 | ) | (45.9 | ) | (23.0 | ) | (86.1 | ) | (44.4 | ) | ||||||||
| Change in capital accruals and other | (16.7 | ) | 3.6 | (2.7 | ) | (13.1 | ) | 0.6 | ||||||||||
| Acquisition of property, plant & equipment - cash | 152.9 | 140.2 | 121.7 | 293.1 | 213.0 | |||||||||||||
1 Peru, Manitoba and British Columbia sustaining capital expenditures include capitalized stripping costs and capitalized development.
2 Other capitalized costs primarily include right-of-use lease and equipment financing additions, which are excluded from guidance in 2026, community agreement additions and non-cash capitalized stripping.
3 Includes 100% of Copper Mountain mine production. On April 30, 2025 Hudbay completed the acquisition of the remaining 25% interest in the Copper Mountain mine and now owns 100%.
4 Copper World growth capital shown on a 100% basis.
5 Other non-sustaining capital costs include Copper World capitalized costs, Cactus Project capitalized costs, capitalized interest, capitalized exploration, right-of-use lease asset additions, equipment financing asset additions, growth capital expenditures and reclassification related to capital spares.
For the three and six months ended June 30, 2026, total accrued capital expenditures increased by $62.4 million and $135.5 million, respectively, compared to the same period in 2025, primarily due to a planned increase in growth capital in British Columbia and planned increase in Copper World growth capital.
Sustaining capital expenditures in Manitoba for the three and six months ended June 30, 2026 were $20.7 million and $37.9 million, respectively, representing an increase of $9.4 million and $14.1 million, respectively, compared to the same periods in 2025, primarily driven by higher capital development at Lalor, mill improvement projects, and increased project spending on the SART plant and tailing dam raise. Sustaining capital expenditures in Peru for the three and six months ended June 30, 2026 were $26.4 million and $49.3 million, respectively, representing a decrease of $18.0 million and $23.6 million, respectively, compared to the same periods in 2025 as a result of the timing of various stripping campaigns and civil work projects. Sustaining capital expenditures in British Columbia for the three and six months ended June 30, 2026 were $33.0 million and $79.9 million, respectively, which included $23.0 million and $64.9 million, respectively, of capitalized stripping related to Hudbay's planned three-year accelerated stripping campaign to access higher grade ore.
Growth capital spending in Manitoba for the three and six months ended June 30, 2026 was $2.5 million and $45.9 million, respectively, primarily relating to the 1901 deposit, representing an increase of $0.9 million and $2.0 million, respectively, compared to the same periods in 2025. Growth capital expenditures in Peru for the three and six months ended June 30, 2026 were $6.0 million and $7.4 million, respectively, representing an increase of $4.7 million and $5.2 million, respectively. Copper World's capital expenditures for the three and six months ended June 30, 2026 were $38.3 million and $67.9 million, respectively, mainly related to ongoing carrying costs and feasibility preparation.
Capitalized exploration for the three months and six months ended June 30, 2026 was $8.4 million and $14.2 million, respectively, primarily related to New Ingerbelle.
Hudbay expects full year sustaining capital expenditure to be in line with 2026 guidance. Full year growth capital expenditures are expected to be approximately $30 million higher than the original 2026 guidance related to additional infrastructure development costs at New Ingerbelle in British Columbia.
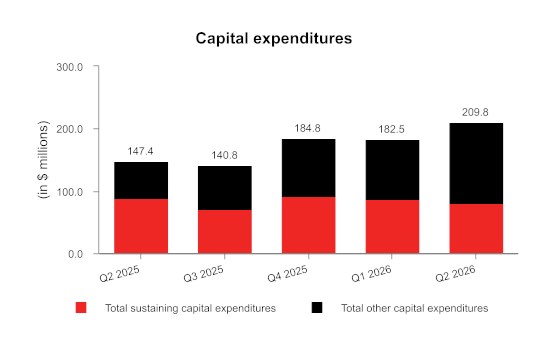
Capital Commitments
As at June 30, 2026, Hudbay had outstanding capital commitments in Canada of approximately $68.9 million, of which $52.4 million can be terminated, approximately $19.2 million in Peru primarily related to sustaining capital commitments and exploration option agreements, all of which can be terminated, and approximately $114.5 million in United States, primarily related to the Copper World project, of which $112.3 million can be terminated.
Contractual Obligations
The following table summarizes Hudbay's significant contractual obligations as at June 30, 2026:
| Total | Less than 12 months |
13 - 36 months |
37 - 60 months |
More than 60 months |
|||||||||||
| Payment Schedule (in $ millions) | |||||||||||||||
| Long-term debt obligations1 | 1,031.6 | 51.8 | 910.2 | 4.7 | 64.9 | ||||||||||
| Property, plant and equipment financing and lease obligations | 288.1 | 95.3 | 122.9 | 52.7 | 17.2 | ||||||||||
| Purchase obligation - capital commitments | 202.6 | 157.0 | 34.0 | 1.0 | 10.6 | ||||||||||
| Purchase obligation - other commitments2 | 1,160.7 | 481.8 | 240.9 | 116.5 | 321.5 | ||||||||||
| Deferred payment and contingent obligations | 36.8 | 3.0 | 6.0 | 13.5 | 14.3 | ||||||||||
| Pension and other employee future benefits obligations3 | 89.0 | 4.3 | 15.0 | 8.0 | 61.7 | ||||||||||
| Deferred land payments | 119.6 | 5.0 | 10.0 | 104.6 | - | ||||||||||
| Community agreement obligations4, 5 | 115.2 | 51.8 | 13.3 | 9.1 | 41.0 | ||||||||||
| Decommissioning and restoration obligations5 | 526.8 | 16.3 | 13.6 | 12.3 | 484.6 | ||||||||||
| Total | 3,570.4 | 866.3 | 1,365.9 | 322.4 | 1,015.8 |
1 Long-term debt obligations include scheduled interest payments, as well as principal repayments
2 Primarily made up of trades payables, accrued liabilities, long-term agreements with operational suppliers, obligations for power purchases, concentrate handling and fleet and port services.
3 Discounted.
4 Represents community agreement obligations and various finalized land user agreements, including Pampacancha.
5 Undiscounted before inflation.
In addition to the contractual obligations included in the above payment schedule, Hudbay also has the following commitments which impact Hudbay's financial position:
- A profit-sharing plan with most Manitoba employees;
- A profit-sharing plan with all Peru employees;
- Share-based compensation;
- Wheaton precious metals stream agreement for the Constancia mine;
- Government royalty payments related to the Constancia mines;
- Participation agreements related to the Copper Mountain mine, and
- Contracts related to future production and sales, such as royalties.
Outstanding Share Data
As of July 27, 2026, the final trading day prior to the date of this MD&A, there were 444,144,760 common shares of Hudbay issued and outstanding. In addition, there were 2,423,222 stock options outstanding.
TREND ANALYSIS AND QUARTERLY REVIEW
A detailed quarterly and annual summary of financial and operating performance can be found in the "Summary of Results" section at the end of this MD&A. The following table sets forth selected consolidated financial information for each of Hudbay's eight most recently completed quarters:
| (in $ millions, except per share amounts, production on a copper equivalent basis and average realized copper price) | 2026 | 2025 | 2024 | |||||||||||||||||||||
| Q2 | Q1 | Q42 | Q3 | Q2 | Q1 | Q42 | Q3 | |||||||||||||||||
| Production on a copper equivalent basis (tonnes) | 51,449 | 57,635 | 71,242 | 46,224 | 53,693 | 58,611 | 77,769 | 60,895 | ||||||||||||||||
| Average realized copper price ($/lb) | 6.13 | 5.81 | 5.17 | 4.37 | 4.36 | 4.49 | 4.09 | 4.24 | ||||||||||||||||
| Average realized gold price ($/oz) | 4,312 | 4,468 | 3,580 | 3,522 | 3,135 | 3,002 | 2,327 | 2,592 | ||||||||||||||||
| Revenue | 631.3 | 757.3 | 732.9 | 346.8 | 536.4 | 594.9 | 584.9 | 485.8 | ||||||||||||||||
| Gross profit | 269.0 | 368.0 | 270.1 | 65.3 | 176.5 | 231.3 | 184.4 | 139.8 | ||||||||||||||||
| Income before tax | 240.4 | 339.0 | 257.1 | 330.5 | 153.1 | 171.3 | 103.7 | 79.7 | ||||||||||||||||
| Net income (loss) | 138.1 | 191.5 | 128.0 | 222.4 | 114.7 | 99.2 | 19.3 | 50.3 | ||||||||||||||||
| Net income (loss) - attributable | 137.4 | 190.4 | 128.0 | 222.4 | 117.7 | 100.4 | 21.2 | 49.7 | ||||||||||||||||
| Adjusted net earnings 1 - attributable | 113.5 | 159.1 | 86.0 | 10.1 | 75.5 | 93.8 | 70.3 | 50.2 | ||||||||||||||||
| Earnings (loss) per share attributable: | ||||||||||||||||||||||||
| Basic and diluted | 0.34 | 0.48 | 0.32 | 0.56 | 0.30 | 0.25 | 0.05 | 0.13 | ||||||||||||||||
| Adjusted net earnings1 per share - attributable | 0.28 | 0.40 | 0.22 | 0.03 | 0.19 | 0.24 | 0.18 | 0.13 | ||||||||||||||||
| Operating cash flow before change in non-cash working capital | 210.1 | 208.7 | 336.9 | 70.3 | 193.9 | 163.5 | 231.5 | 188.3 | ||||||||||||||||
| Adjusted EBITDA1 | 321.2 | 421.9 | 385.9 | 142.6 | 245.2 | 287.2 | 257.3 | 206.0 | ||||||||||||||||
| Adjusted EBITDA LTM1 | 1,271.6 | 1,195.6 | 1,060.9 | 932.3 | 995.9 | 895.7 | 823.3 | 840.4 | ||||||||||||||||
1 Adjusted net earnings (loss) - attributable to owners, adjusted net earnings (loss) per share - attributable to owners, adjusted EBITDA, and adjusted EBITDA last twelve months ("LTM") are non-GAAP financial performance measure with no standardized definition under IFRS. For further information and a detailed reconciliation, please see the discussion under the "Non-GAAP Financial Performance Measures" section of this MD&A.
2 Annual consolidated results may not calculate based on amounts presented in this table due to rounding.
On a quarterly basis, Hudbay's revenue is primarily impacted by metal prices, production mix and sales volumes of the key metals Hudbay produces. In addition to these factors, gross profit, net earnings (loss) attributable, earnings (loss) per share attributable, operating cash flow before change in non-cash working capital and adjusted EBITDA are also impacted by input costs. Net earnings (loss) and earnings (loss) per share are further impacted by net finance expense and re-evaluation adjustments of Hudbay's closed site environmental provision.
During the second quarter of 2026, copper equivalent production, sales and gross margin declined compared to the most recent period, primarily driven by lower overall production volumes and lower realized gold prices compared to the first quarter of 2026. Consequently, revenue, gross profit and income before tax decreased during the quarter. Sales volumes was impacted by a temporary build-up of concentrate inventory at the port in Peru. This accumulation was caused by ocean swells that resulted in temporary port closures and delayed scheduled shipments, which have been realized during the first half of July 2026. In addition, given global political tensions, energy and consumable input prices have risen and this has exerted pressure on gross profit.
During the first quarter of 2026, revenue and gross profit reached record levels, driven by higher realized metal prices and disciplined cost management, which resulted in record quarterly and last twelve months adjusted EBITDA. While consolidated copper equivalent production decreased to 51,449 tonnes compared to the most recent quarter following the planned depletion of Pampacancha, consolidated cash cost improved following the successful initial ramp up of the secondary SAG mill, leading to improved throughput levels and enhanced operational efficiencies. Operating cash flow decreased primarily due to higher cash taxes paid and elevated share-based compensation payments resulting from higher share prices, these were partially offset by lower depreciation charges following the Pampacancha closure and by higher realized metal prices across all metals.
During the fourth quarter of 2025, copper equivalent production increased to 71,242 tonnes compared to the most recent quarters. This was primarily due to higher realized price across all metals, partially offset by a one-week power outage in Manitoba during the fourth quarter of 2025 due to weather related constraints. Hudbay achieved record quarterly revenue of $732.9 million as a result of high metal prices, despite the one-week operational interruption in Manitoba in October. In addition, along with continued strong cost control and productivity gains coming from previous investments in optimization efforts, Hudbay achieved record high gross profit. The cumulative effect of the high commodity prices, cost control and optimization efforts resulted in Hudbay achieving record adjusted EBITDA over a twelve month period of $1.06 billion.
During the third quarter of 2025, copper equivalent production decreased to 46,224 tonnes because of reduced copper and zinc output. This was primarily due to the temporary suspension of operations in Manitoba in July and August related to the wildfire evacuation order and the Peru temporary suspension for nine days during the third quarter of 2025 caused by social unrest. As a result of the social unrest impacting transportation routes earlier in the quarter and ocean swells impacting port shipments in late September, a 20,000 dry metric tonne copper concentrate shipment valued at $60 million was deferred to early October 2025. The temporary operational suspensions during the quarter increased pressure on gross margins and operating cash flow compared to the earlier quarters. Earnings in the third quarter of 2025 also included an after-tax impairment reversal of $242.7 million, following the announcement of the Copper World joint venture transaction with Mitsubishi for a 30% minority interest.
After adjusting for the fixed costs associated with the temporary suspensions in Manitoba and Peru, production costs continue to be well controlled and comparable to prior periods.
During the second quarter of 2025, copper equivalent production decreased to 53,693 tonnes because of reduced copper, gold and silver output. This was primarily due to the temporary suspension of operations in Manitoba in June related to the wildfire evacuation order. This was partially offset by record average gold prices and high copper prices which positively impacted gross profits and contributing to increased net income and higher earnings per share in the second quarter of 2025. While higher profitability led to significant cash taxes paid of $43.9 million, the business's strong operating performance caused the overall impact to operating cash flow before changes in non-cash working capital to remain positive. Higher foreign exchange gains due to the strengthening of the Canadian dollar along with declining net interest cost as a result of Hudbay's deleveraging efforts led to reduced net finance expenses in the second quarter. Adjusted EBITDA over the last twelve months hit a record high of $995.9 million as a result of strong operating performances at the Manitoba and Peru operations resulting in higher sales volumes, benefitting from high copper and gold prices. Net debt to EBITDA is now at its lowest level since the development of the Peru operation more than a decade ago given the business's strong operating performance in conjunction with the same aforementioned deleveraging efforts. The lower net debt and stronger cash position is despite larger reinvestment in the business through growing capital expenditures in recent years.
During the first quarter of 2025, copper equivalent production decreased to 58,611 tonnes as expected, reflecting lower production of copper, gold and silver primarily related to lower planned grades in Peru as the final stripping phase at the Pampacancha deposit was underway. This was partially offset by higher gold production in Manitoba and record average gold prices and high copper prices which positively impacted gross profits.
The Manitoba operations delivered strong quarterly throughput as expected and unlocked better-than-expected grades, resulting in higher production that exceeded Hudbay's quarterly cadence expectations. Strong cost control, a weaker Canadian dollar and meaningful exposure to gold by-product credits resulted in consolidated cash cost1 and sustaining cash cost1 per pound of copper produced, net of by-product credits, in the first quarter of 2025 of $(0.45) and $0.72, respectively, contributing to the increased gross margin and very strong growth in adjusted EBITDA. Higher profits since 2023 in Peru and Canada have resulted in significant cash taxes paid of $117.5 million in the first quarter of 2025, which is reflected in operating cash flow before changes in non-cash working capital. In addition, deleveraging efforts including the repurchases of the Company's senior secured notes over the course of 2024 led to declining net interest cost to service Hudbay's long term debt.
During the fourth quarter of 2024, copper equivalent production increased to 77,769 tonnes. Hudbay's Manitoba and Peru operations delivered strong quarterly production as expected and unlocked higher grade helping the Company exceed 2024 annual gold guidance. Strong cost control and meaningful exposure to gold by-product credits resulted in consolidated cash cost1 and sustaining cash cost1 per pound of copper produced, net of by-product credits1, in the fourth quarter of 2024 of $0.45 and $1.37, respectively, contributing to Hudbay's outperformance of its improved full year 2024 cost guidance. Furthermore, the settlement of the gold prepayment liability in the third quarter of 2024, allowed Hudbay to capitalize on surging gold prices. Since acquiring Copper Mountain in June 2023, Hudbay has moved to optimization efforts which have been focused on ramping up the mining fleet to execute a planned accelerated stripping campaign to gain access to higher grades, as well as plant improvement initiatives to improve mill reliability and recoveries.
During the third quarter of 2024, profitability and cash flows grew compared to the second quarter of 2024. This strength was attributable in part to higher gold, copper and zinc production compared to the second quarter of 2024, along with returning strength in commodity prices including record gold prices. These impacts offset planned lower mined grades observed in Peru in the third quarter of 2024 and the higher cash mining taxes paid in Peru resulting from higher profitability over the past several quarters. Strong operating cost control continued into the third quarter of 2024 resulting from a number of operational initiatives and high levels of mill throughput being experienced throughout the business.
NON-GAAP FINANCIAL PERFORMANCE MEASURES
Adjusted net earnings (loss) attributable to owners, adjusted net earnings (loss) per share attributable to owners, adjusted EBITDA, realized prices, net debt, net debt to adjusted EBITDA, free cash flow, cash cost, sustaining and all-in sustaining cash cost per pound of copper produced, cash cost and sustaining cash cost per ounce of gold produced, combined unit cost and ratios based on these measures are non-GAAP performance measures. These measures do not have a meaning prescribed by IFRS and are therefore unlikely to be comparable to similar measures presented by other issuers. These measures should not be considered in isolation or as a substitute for measures prepared in accordance with IFRS and are not necessarily indicative of gross profit or cash flow from operations as determined under IFRS. Other companies may calculate these measures differently.
Management believes adjusted net earnings (loss) attributable to owners and adjusted net earnings (loss) per share attributable to owners provides an alternate measure of the Company's performance for the current period and gives insight into its expected performance in future periods. These measures are used internally by the Company to evaluate the performance of its underlying operations and to assist with its planning and forecasting of future operating results. As such, the Company believes these measures are useful to investors in assessing the Company's underlying performance. Hudbay provides adjusted EBITDA to help users analyze Hudbay's results and to provide additional information about its ongoing cash generating potential in order to assess its capacity to service and repay debt, carry out investments and cover working capital needs. Net debt is shown because it is a performance measure used by the Company to assess its financial position. Net debt to adjusted EBITDA is shown because it is a performance measure used by the Company to assess its financial leverage and debt capacity. Realized price is shown to understand the average realized price of metals sold to third parties in each reporting period. Free cash flow is shown as it provides investors and management additional information in assessing the Company's ability to generate cash flow from current operations after investing in capital to sustain the operations. Cash cost, sustaining and all-in sustaining cash cost per pound of copper produced are shown because Hudbay believes they help investors and management assess the performance of its operations, including the margin generated by the operations and the Company. Cash cost and sustaining cash cost per ounce of gold produced are shown because Hudbay believes they help investors and management assess the performance of its Manitoba operations. Combined unit cost is shown because Hudbay believes it helps investors and management assess the cost structure and margins that are not impacted by variability in by-product commodity prices.
Adjusted Net Earnings - Attributable to owners
Adjusted net earnings attributable to owners represents net earnings (loss) excluding certain impacts such as mark-to-market adjustments, foreign exchange (gains) loss, revaluation adjustment - environmental provisions for closed sites, variable consideration adjustment related to stream agreements, impairment charges and reversal of impairment charges on assets, (gain) loss on disposal of assets, evaluation costs, temporary shut down costs other items that are not indicative of the underlying operating performance of Hudbay's core business; and tax effect and non-controlling interest of the previously discussed items. These measures are not necessarily indicative of net earnings (loss) as determined under IFRS. The following table provides a reconciliation of net earnings and non-controlling interest per the condensed consolidated interim statements of income, to adjusted net earnings attributable to owners of the Company for the three months ended June 30 and March 31, 2026, and June 30, 2025 and six months ended June 30, 2026 and 2025.
| Three months ended | Six months ended | ||||||||||||||
| (in $ millions) | Jun. 30, 2026 |
Mar. 31, 2026 |
Jun. 30, 2025 |
Jun. 30, 2026 |
Jun. 30, 2025 |
||||||||||
| Earnings for the period | 138.1 | 191.5 | 114.7 | 329.6 | 213.9 | ||||||||||
| Tax expense | 102.3 | 147.5 | 38.4 | 249.8 | 110.5 | ||||||||||
| Earnings before tax | 240.4 | 339.0 | 153.1 | 579.4 | 324.4 | ||||||||||
| Adjusting items: | |||||||||||||||
| Mark-to-market adjustments1 | (38.2 | ) | (38.7 | ) | 6.3 | (76.9 | ) | 3.2 | |||||||
| Foreign exchange (gain) loss | 12.0 | 10.7 | (18.9 | ) | 22.7 | (22.0 | ) | ||||||||
| Re-evaluation adjustment - environmental provision | 5.5 | 2.1 | (13.8 | ) | 7.6 | (1.0 | ) | ||||||||
| Manitoba cost of sales and other expense from temporary shutdown | - | - | 5.3 | - | 5.3 | ||||||||||
| Variable consideration adjustment - stream revenue and accretion | - | 0.1 | - | 0.1 | (10.5 | ) | |||||||||
| Inventory adjustments | 0.9 | - | 3.5 | 0.9 | 4.7 | ||||||||||
| Evaluation expenses | 9.2 | 2.9 | - | 12.1 | - | ||||||||||
| Insurance recovery | (11.5 | ) | - | - | (11.5 | ) | - | ||||||||
| Reduction of obligation to renounce flow-through share expenditures, net of provisions | (2.8 | ) | (3.3 | ) | (1.2 | ) | (6.1 | ) | (3.1 | ) | |||||
| Loss/write-down on disposal of PP&E | 0.5 | 1.0 | 0.3 | 1.5 | 0.9 | ||||||||||
| Changes in other provisions (non-capital) | - | - | - | - | 0.7 | ||||||||||
| Adjusted earnings before income taxes | 216.0 | 313.8 | 134.6 | 529.8 | 302.7 | ||||||||||
| Tax expense | (102.3 | ) | (147.5 | ) | (38.4 | ) | (249.8 | ) | (110.5 | ) | |||||
| Tax impact of adjusting items | 0.5 | (4.2 | ) | (23.0 | ) | (3.7 | ) | (25.7 | ) | ||||||
| Adjusted net earnings | 114.2 | 162.1 | 73.2 | 276.3 | 166.5 | ||||||||||
| Adjusted net earnings attributable to non-controlling interest: | |||||||||||||||
| Net (earnings) loss for the period | (0.7 | ) | (1.1 | ) | 3.0 | (1.8 | ) | 4.2 | |||||||
| Adjusting items, including tax impact | - | - | (0.7 | ) | - | (1.1 | ) | ||||||||
| Adjusted net earnings - attributable to owners | 113.5 | 161.0 | 75.5 | 274.5 | 169.6 | ||||||||||
| Adjusted net earnings ($/share) - attributable to owners | 0.28 | 0.40 | 0.19 | 0.69 | 0.43 | ||||||||||
| Basic weighted average number of common shares outstanding (millions) | 400.4 | 396.9 | 395.1 | 397.7 | 395.0 | ||||||||||
1 Includes changes in fair value of Canadian junior mining investments, other financial assets and liabilities at fair value through net earnings and share-based compensation expenses (recoveries). Also includes gains and losses on disposition of investments.
Adjusted EBITDA
Adjusted EBITDA is net earnings before net finance expense/income, tax expense/recoveries, depreciation and amortization of property, plant and equipment and deferred revenue, as well as certain other adjustments. Hudbay calculates adjusted EBITDA by excluding certain adjustments included within Hudbay's adjusted net earnings attributable measure which reflects the underlying performance of Hudbay's core operating activities. The measure also removes the impact of non-cash items and financing costs that are not associated with measuring the underlying performance of Hudbay's operations. However, Hudbay's adjusted EBITDA is not the measure defined as EBITDA under Hudbay's senior notes or revolving credit facilities and may not be comparable with performance measures with the same name reported by other companies. Adjusted EBITDA should not be considered as a substitute for earnings, which is calculated in accordance with IFRS. Hudbay provides adjusted EBITDA to help users analyze their results and to provide additional information about Hudbay's ongoing cash generating potential in order to assess its capacity to service and repay debt, carry out investments and cover working capital needs.
The following table presents the reconciliation of earnings per the condensed consolidated interim statements of income, to adjusted EBITDA for the three months ended June 30 and March 31, 2026, and June 30, 2025 and six months ended June 30, 2026 and 2025:
| Three months ended | Six months ended | ||||||||||||||
| (in $ millions) | Jun. 30, 2026 |
Mar. 31, 2026 |
Jun. 30, 2025 | Jun. 30, 2026 |
Jun. 30, 2025 | ||||||||||
| Earnings for the period | 138.1 | 191.5 | 114.7 | 329.6 | 213.9 | ||||||||||
| Add back: | |||||||||||||||
| Tax expense | 102.3 | 147.5 | 38.4 | 249.8 | 110.5 | ||||||||||
| Other (income) expense | (20.7 | ) | (33.8 | ) | - | (54.5 | ) | 14.4 | |||||||
| Other operating expense | 4.7 | 10.1 | 7.1 | 14.8 | 12.3 | ||||||||||
| Depreciation and amortization | 88.8 | 99.9 | 96.4 | 188.7 | 204.5 | ||||||||||
| Amortization of deferred revenue and variable consideration adjustment | (9.5 | ) | (19.5 | ) | (15.4 | ) | (29.0 | ) | (44.7 | ) | |||||
| Adjusting items (pre-tax): | |||||||||||||||
| Re-evaluation adjustment - environmental provision | 5.5 | 2.1 | (13.8 | ) | 7.6 | (1.0 | ) | ||||||||
| Inventory adjustments | 0.9 | - | 3.5 | 0.9 | 4.7 | ||||||||||
| Overhead costs incurred during Manitoba temporary suspension (cash) | - | - | 3.2 | - | 3.2 | ||||||||||
| Option agreement proceeds | 1.0 | 0.6 | 1.0 | 1.6 | 2.5 | ||||||||||
| Realized loss on non-QP hedges | (0.1 | ) | - | (0.4 | ) | (0.1 | ) | (2.3 | ) | ||||||
| Share-based compensation expense 1 | 10.2 | 23.5 | 10.5 | 33.7 | 14.4 | ||||||||||
| Adjusted EBITDA | 321.2 | 421.9 | 245.2 | 743.1 | 532.4 | ||||||||||
1 Share-based compensation expense reflected in cost of sales and selling and administrative expenses.
Net Debt
The following table presents Hudbay's calculation of net debt as at June 30, 2026 and December 31, 2025:
| (in $ millions) | Jun. 30, 2026 |
Dec. 31, 2025 |
||||
| Total long-term debt | 860.2 | 1,008.6 | ||||
| Cash and cash equivalents1 | (890.9 | ) | (568.9 | ) | ||
| Restricted cash related to unspent proceeds on senior unsecured municipal bonds 2 | (49.8 | ) | - | |||
| Net debt 2 | (80.5 | ) | 439.7 |
1 As at June 30, 2026 cash and cash equivalents includes $334.5 million in cash held by Copper World LLC. These funds are contractually restricted for the advancement of the Copper World project and are not available to the general Hudbay group.
2 Hudbay calculates net debt as total long-term debt less cash and cash equivalents and restricted cash related to unspent proceeds of its senior unsecured municipal bond financing. For further information on the restricted cash related to unspent proceeds of senior unsecured municipal bond financing please see note 11 in the consolidated interim financial statements.
Net Debt to Adjusted EBITDA Ratio
The following table presents Hudbay's calculation of net debt to adjusted EBITDA, both metrics have been reconciled above to the most comparable IFRS measure, as at June 30, 2026 and December 31, 2025:
| (in $ millions, except net debt to adjusted EBITDA ratio) | Jun. 30, 2026 |
Dec. 31, 2025 |
||||
| Net debt | (80.5 | ) | 439.7 | |||
| Adjusted EBITDA for the last twelve months | 1,271.6 | 1,060.9 | ||||
| Net debt to adjusted EBITDA | (0.1 | ) | 0.4 |
The following table presents the reconciliation of earnings per the condensed consolidated interim statements of income, to adjusted EBITDA for the twelve months ended June 30, 2026 and December 31, 2025:
| Twelve months ended | ||||||
| (in $ millions) | Jun. 30, 2026 |
Dec. 31, 2025 | ||||
| Earnings for the period | 680.0 | 564.3 | ||||
| Add back: | ||||||
| Tax expense | 487.0 | 347.7 | ||||
| Net finance expense | (49.5 | ) | 19.4 | |||
| Other operating expense | 10.3 | 7.8 | ||||
| Depreciation and amortization | 423.9 | 439.7 | ||||
| Amortization of deferred revenue and variable consideration adjustment | (59.3 | ) | (75.0 | ) | ||
| Adjusting items (pre-tax): | ||||||
| Impairment reversal | (322.3 | ) | (322.3 | ) | ||
| Consideration received from previously sold non-core project | (14.9 | ) | (14.9 | ) | ||
| Re-evaluation adjustment - environmental provision | 8.8 | 0.2 | ||||
| Inventory adjustments | 0.3 | 4.1 | ||||
| Overhead costs incurred during Manitoba temporary suspension (cash) | 16.0 | 19.2 | ||||
| Overhead costs incurred during Peru temporary suspension (cash) | 8.6 | 8.6 | ||||
| Option agreement proceeds | 3.6 | 4.5 | ||||
| Realized loss on non-QP hedges | (0.1 | ) | (2.3 | ) | ||
| Share-based compensation expense 1 | 79.2 | 59.9 | ||||
| Adjusted EBITDA for the last twelve months | 1,271.6 | 1,060.9 | ||||
1 Share-based compensation expense reflected in cost of sales and selling and administrative expenses.
The following table presents the calculation of the last twelve months adjusted EBITDA:
| Three months ended | LTM1 | ||||||||||||||
| Trailing Adjusted EBITDA (in $ millions) |
Jun. 30, 2026 |
Mar. 31, 2026 |
Dec. 31, 2025 |
Sep. 30, 2025 |
|||||||||||
| Earnings for the period | 138.1 | 191.5 | 128.0 | 222.4 | 680.0 | ||||||||||
| Add back: | |||||||||||||||
| Tax expense | 102.3 | 147.5 | 129.1 | 108.1 | 487.0 | ||||||||||
| Other (income) expenses | (20.7 | ) | (33.8 | ) | (14.6 | ) | 19.6 | (49.5 | ) | ||||||
| Other operating expenses | 4.7 | 10.1 | (13.6 | ) | 9.1 | 10.3 | |||||||||
| Depreciation and amortization | 88.8 | 99.9 | 152.5 | 82.7 | 423.9 | ||||||||||
| Amortization of deferred revenue and variable consideration adjustment | (9.5 | ) | (19.5 | ) | (24.0 | ) | (6.3 | ) | (59.3 | ) | |||||
| Adjusting items (pre-tax): | |||||||||||||||
| Impairment reversal | - | - | - | (322.3 | ) | (322.3 | ) | ||||||||
| Consideration received from previously sold non-core project | - | - | - | (14.9 | ) | (14.9 | ) | ||||||||
| Re-evaluation adjustment - environmental provision | 5.5 | 2.1 | (0.2 | ) | 1.4 | 8.8 | |||||||||
| Inventory adjustments | 0.9 | - | 0.7 | (1.3 | ) | 0.3 | |||||||||
| Overhead costs incurred during Manitoba temporary suspension (cash) | - | - | - | 16.0 | 16.0 | ||||||||||
| Overhead costs incurred during Peru temporary suspension (cash) | - | - | 1.3 | 7.3 | 8.6 | ||||||||||
| Realized loss on non-QP hedges | (0.1 | ) | - | - | - | (0.1 | ) | ||||||||
| Option agreement proceeds | 1.0 | 0.6 | 0.9 | 1.1 | 3.6 | ||||||||||
| Share-based compensation expenses2 | 10.2 | 23.5 | 25.8 | 19.7 | 79.2 | ||||||||||
| Adjusted EBITDA | 321.2 | 421.9 | 385.9 | 142.6 | 1,271.6 | ||||||||||
1 LTM (last twelve months) as of June 30, 2026.
2 Share-based compensation expense reflected in cost of sales and administrative expenses.
Free Cash Flow
Hudbay defines free cash flow as cash generated from operations adjusted for changes in non-cash working capital, sustaining capital expenditures and cash payments from operating sites related to leases, equipment financings and community agreements. Free cash flow is intended to provide additional information only and should not be considered in isolation or as a substitute for measures of performance prepared in accordance with IFRS Accounting Standards. This measure is not necessarily indicative of cash flow from operations as determined under IFRS Accounting Standards. The following table presents Hudbay's calculation of free cash flow and reconciles to the most directly comparable IFRS measure:
| Three months ended | Six months ended | |||||||||||
| (in $ millions) | Jun. 30, 2026 |
Jun. 30, 2025 |
Jun. 30, 2026 |
Jun. 30, 2025 |
||||||||
| Cash generated from operations | 297.0 | 259.9 | 508.3 | 384.7 | ||||||||
| Add back: | ||||||||||||
| Change in non-cash working capital | 86.9 | 66.0 | 89.5 | 27.3 | ||||||||
| Cash sustaining capital expenditures1 | 108.3 | 107.2 | 214.1 | 186.3 | ||||||||
| Free cash flow | 101.8 | 86.7 | 204.7 | 171.1 | ||||||||
| Cash sustaining capital expenditures1 | ||||||||||||
| Total sustaining capital costs2 | 80.1 | 88.6 | 167.1 | 151.1 | ||||||||
| Capitalized lease and equipment financing cash payments - operating sites | 15.2 | 13.4 | 30.3 | 26.2 | ||||||||
| Community agreement cash payments | 13.0 | 5.2 | 16.7 | 9.0 | ||||||||
| Cash sustaining capital expenditures1 | 108.3 | 107.2 | 214.1 | 186.3 | ||||||||
1 Excludes amortization of decommissioning and restoration PP&E assets and accretion of decommissioning and restoration liabilities related to producing sites. Includes all community agreement payments.
2 See reconciliation to property, plant & equipment additions on page 59 of this MD&A.
The following table presents the calculation of the last twelve months free cash flow:
| Three months ended | LTM1 | ||||||||||||||
| (in $ millions) | Jun. 30, 2026 |
Mar. 31, 2026 |
Dec. 31, 2025 |
Sep. 30, 2025 |
|||||||||||
| Cash generated from operations | 297.0 | 211.3 | 209.4 | 113.5 | 831.2 | ||||||||||
| Add back: | |||||||||||||||
| Change in non-cash working capital | 86.9 | 2.6 | (127.5 | ) | 43.2 | 5.2 | |||||||||
| Cash sustaining capital expenditures2 | 108.3 | 106.4 | 111.9 | 86.4 | 413.0 | ||||||||||
| Free cash flow | 101.8 | 102.3 | 225.0 | (16.1 | ) | 413.0 | |||||||||
| Cash sustaining capital expenditures2 | |||||||||||||||
| Total sustaining capital costs3 | 80.1 | 87.0 | 91.8 | 71.2 | 330.1 | ||||||||||
| Capitalized lease and equipment financing cash payments - operating sites | 15.2 | 15.7 | 12.5 | 14.3 | 57.7 | ||||||||||
| Community agreement cash payments | 13.0 | 3.7 | 7.6 | 0.9 | 25.2 | ||||||||||
| Cash sustaining capital expenditures2 | 108.3 | 106.4 | 111.9 | 86.4 | 413.0 | ||||||||||
1 LTM (last twelve months) as at June 30, 2026
2 Excludes amortization of decommissioning and restoration PP&E assets and accretion of decommissioning and restoration liabilities related to producing sites. Includes all community agreement payments.
3 See reconciliation to property, plant & equipment additions on page 60 of this MD&A.
Cash Cost, Sustaining and All-in Sustaining Cash Cost (Copper Basis)
Cash cost per pound of copper produced ("cash cost") is a non-GAAP measure that management uses as a key performance indicator to assess the performance of its operations. Hudbay's calculation designates copper as the primary metal of production as it has been the largest component of revenues. The calculation is presented in four manners:
- Cash cost, before by-product credits - This measure is gross of by-product revenues and is a function of the efforts and costs incurred to mine and process all ore mined. However, the measure divides this aggregate cost over only pounds of copper produced, Hudbay's primary metal of production. This measure is generally less volatile from period to period, as it is not affected by changes in the price received for by-product metals. It is, however, affected by the relative mix of copper concentrate and zinc concentrate production, where an increase in production of zinc concentrate will tend to result in an increase in cash cost under this measure.
- Cash cost, net of by-product credits - In order to calculate the net cost to produce and sell copper, the net of by-product credits measure subtracts the revenues realized from the sale of the metals other than copper. The by-product revenues from zinc, gold, and silver are significant and are integral to the economics of Hudbay's operations. The economics that support Hudbay's decision to produce and sell copper would be different if Hudbay did not receive revenues from the other significant metals being extracted and processed. This measure provides management and investors with an indication of the minimum copper price consistent with positive operating margins, assuming realized by-product metal prices are consistent with those prevailing during the reporting period. It also serves as an important operating statistic that management and investors utilize to measure its operating performance versus that of its competitors. However, it is important to understand that if by-product metal prices decline alongside copper prices, the cash cost net of by-product credits would increase, requiring a higher copper price than that reported to maintain positive cash flows and operating margins.
- Sustaining cash cost, net of by-product credits - This measure is an extension of cash cost that includes cash sustaining capital expenditures, including payments on capitalized leases, payments on equipment financing, capitalized sustaining exploration, net smelter returns royalties, payments on certain long-term community agreements, as well as accretion and amortization for expected decommissioning activities for producing assets. It does not include corporate selling and administrative expenses. It provides a more fulsome measurement of the cost of sustaining production than cash cost, which is focused on operating costs only.
- All-in sustaining cash cost, net of by-product credits - This measure is an extension of sustaining cash cost that includes corporate G&A, regional costs, accretion and amortization for community agreements relating to current operations, and accretion for expected decommissioning activities for non-producing sites. Due to the inclusion of corporate selling and administrative expenses, all-in sustaining cash cost is presented on a consolidated basis only.
The tables below present a detailed build-up of cash cost and sustaining cash cost, net of by-product credits, by business unit in addition to consolidated all-in sustaining cash cost, net of by-product credits, and reconciliations between cash cost, net of by-product credits, to the most comparable IFRS measures of cost of sales for the three months ended June 30, and March 31, 2026 and June 30, 2025 and six months ended June 30, 2026 and June 30, 2025. Cash cost, net of by-product credits may not calculate exactly based on amounts presented in the tables below due to rounding.
| Consolidated | Three months ended | Six months ended | ||||||||||||||||||||||
| (in thousands) | Jun. 30, 2026 | Mar. 31, 2026 | Jun. 30, 2025 | Jun. 30, 2026 | Jun. 30, 2025 | |||||||||||||||||||
| Peru | 42,871 | 45,356 | 47,863 | 88,227 | 92,601 | |||||||||||||||||||
| Manitoba | 5,216 | 5,589 | 3,554 | 10,805 | 11,202 | |||||||||||||||||||
| British Columbia | 14,231 | 10,628 | 14,626 | 24,859 | 30,490 | |||||||||||||||||||
| Net pounds of copper produced1 | 62,318 | 61,573 | 66,043 | 123,891 | 134,293 | |||||||||||||||||||
1 Contained copper in concentrate.
| Consolidated | Three months ended | |||||||||||||||||
| Jun. 30, 2026 | Mar. 31, 2026 | Jun. 30, 2025 | ||||||||||||||||
| Cash cost per pound of copper produced | $millions | $/lb | $millions | $/lb | $ millions | $/lb | ||||||||||||
| Cash cost, before by-product credits | 285.0 | 4.57 | 271.5 | 4.41 | 245.6 | 3.72 | ||||||||||||
| By-product credits | (309.7 | ) | (4.97 | ) | (382.1 | ) | (6.21 | ) | (247.3 | ) | (3.74 | ) | ||||||
| Cash cost, net of by-product credits | (24.7 | ) | (0.40 | ) | (110.6 | ) | (1.80 | ) | (1.7 | ) | (0.02 | ) | ||||||
| Consolidated | Six months ended | |||||||||||
| Jun. 30, 2026 | Jun. 30, 2025 | |||||||||||
| Cash cost per pound of copper produced | $ millions | $/lb | $ millions | $/lb | ||||||||
| Cash cost, before by-product credits | 556.5 | 4.49 | 499.3 | 3.72 | ||||||||
| By-product credits | (691.8 | ) | (5.58 | ) | (532.0 | ) | (3.96 | ) | ||||
| Cash cost, net of by-product credits | (135.3 | ) | (1.09 | ) | (32.7 | ) | (0.24 | ) | ||||
| Consolidated | Three months ended | |||||||||||||||||
| Jun. 30, 2026 | Mar. 31, 2026 | Jun. 30, 2025 | ||||||||||||||||
| Cash cost per pound of copper produced | $ millions | $/lb | $ millions | $/lb | $ millions | $/lb | ||||||||||||
| Mining | 117.0 | 1.88 | 93.0 | 1.51 | 85.8 | 1.30 | ||||||||||||
| Milling | 94.4 | 1.51 | 91.2 | 1.48 | 92.6 | 1.40 | ||||||||||||
| G&A | 52.2 | 0.84 | 61.6 | 1.00 | 43.1 | 0.66 | ||||||||||||
| Onsite costs | 263.6 | 4.23 | 245.8 | 3.99 | 221.5 | 3.36 | ||||||||||||
| Treatment & refining | (0.1 | ) | (0.01 | ) | 3.1 | 0.05 | 3.3 | 0.05 | ||||||||||
| Freight & other | 21.5 | 0.35 | 22.6 | 0.37 | 20.8 | 0.31 | ||||||||||||
| Cash cost, before by-product credits | 285.0 | 4.57 | 271.5 | 4.41 | 245.6 | 3.72 | ||||||||||||
| Consolidated | Six months ended | |||||||||||
| Jun. 30, 2026 | Jun. 30, 2025 | |||||||||||
| Cash cost per pound of copper produced | $ millions | $/lb | $ millions | $/lb | ||||||||
| Mining | 210.0 | 1.69 | 177.0 | 1.32 | ||||||||
| Milling | 185.6 | 1.50 | 173.2 | 1.29 | ||||||||
| G&A | 113.8 | 0.92 | 86.7 | 0.64 | ||||||||
| Onsite costs | 509.4 | 4.11 | 436.9 | 3.25 | ||||||||
| Treatment & refining | 3.0 | 0.02 | 17.3 | 0.13 | ||||||||
| Freight & other | 44.1 | 0.36 | 45.1 | 0.34 | ||||||||
| Cash cost, before by-product credits | 556.5 | 4.49 | 499.3 | 3.72 | ||||||||
| Consolidated | Three months ended | |||||||||||||||||
| Jun. 30, 2026 | Mar. 31, 2026 | Jun. 30, 2025 | ||||||||||||||||
| Supplementary cash cost information | $ millions | $/lb 1 | $ millions | $/lb 1 | $ millions | $/lb 1 | ||||||||||||
| By-product credits2: | ||||||||||||||||||
| Zinc | 9.2 | 0.15 | 12.4 | 0.20 | 7.3 | 0.11 | ||||||||||||
| Gold3 | 242.6 | 3.89 | 297.4 | 4.83 | 195.8 | 2.96 | ||||||||||||
| Silver3 | 35.4 | 0.57 | 43.4 | 0.71 | 23.4 | 0.35 | ||||||||||||
| Molybdenum & other | 22.5 | 0.36 | 28.9 | 0.47 | 20.8 | 0.32 | ||||||||||||
| Total by-product credits | 309.7 | 4.97 | 382.1 | 6.21 | 247.3 | 3.74 | ||||||||||||
| Reconciliation to IFRS: | ||||||||||||||||||
| Cash cost, net of by-product credits | (24.7 | ) | (110.6 | ) | (1.7 | ) | ||||||||||||
| By-product credits | 309.7 | 382.1 | 247.3 | |||||||||||||||
| Treatment and refining charges | 0.1 | (3.1 | ) | (3.3 | ) | |||||||||||||
| Inventory adjustments | 0.9 | - | 3.5 | |||||||||||||||
| Share-based compensation expense | 1.2 | 2.9 | 0.9 | |||||||||||||||
| Change in product inventory | (17.3 | ) | 13.0 | 11.4 | ||||||||||||||
| Royalties and statutory contributions5 | 3.6 | 5.1 | 2.2 | |||||||||||||||
| Overhead costs incurred during Manitoba temporary suspension (cash) | - | - | 3.2 | |||||||||||||||
| Depreciation and amortization4 | 88.8 | 99.9 | 96.4 | |||||||||||||||
| Cost of sales6 | 362.3 | 389.3 | 359.9 | |||||||||||||||
1 Per pound of copper produced.
2 By-product credits are computed as revenue per financial statements, including amortization of deferred revenue and pricing and volume adjustments. For more information, please see the realized price reconciliation table on page 31 of this MD&A for these figures.
3 Gold and silver by-product credits do not include variable consideration adjustments with respect to stream arrangements. Variable consideration adjustments are cumulative adjustments to gold and silver stream deferred revenue primarily associated with the net change in mineral reserves and resources or amendments to the mine plan that would change the total expected deliverable ounces under the precious metal streaming arrangement. For the three months ended June 30, 2026 the variable consideration adjustments amounted to $nil (three months ended June 30, 2025 - $nil and March 31, 2026 - loss of $0.1 million).
4 Depreciation is based on concentrate sold.
5 Certain of Hudbay's properties are subject to royalty arrangements based on mineral production at the properties. Royalties include net smelter return royalty and price participation agreements.
6 As per consolidated interim financial statements.
| Consolidated | Six months ended | |||||||||||
| Jun. 30, 2026 | Jun. 30, 2025 | |||||||||||
| Supplementary cash cost information | $ millions | $/lb1 | $ millions | $/lb1 | ||||||||
| By-product credits2: | ||||||||||||
| Zinc | 21.6 | 0.17 | 21.1 | 0.16 | ||||||||
| Gold3 | 540.0 | 4.36 | 421.2 | 3.13 | ||||||||
| Silver3 | 78.8 | 0.64 | 49.5 | 0.37 | ||||||||
| Molybdenum & other | 51.4 | 0.41 | 40.2 | 0.30 | ||||||||
| Total by-product credits | 691.8 | 5.58 | 532.0 | 3.96 | ||||||||
| Reconciliation to IFRS: | ||||||||||||
| Cash cost, net of by-product credits | (135.3 | ) | (32.7 | ) | ||||||||
| By-product credits | 691.8 | 532.0 | ||||||||||
| Treatment and refining charges | (3.0 | ) | (17.3 | ) | ||||||||
| Inventory adjustments | 0.9 | 4.7 | ||||||||||
| Share-based compensation expense | 4.1 | 1.6 | ||||||||||
| Change in product inventory | (4.3 | ) | 23.4 | |||||||||
| Royalties and statutory contributions5 | 8.7 | 4.1 | ||||||||||
| Overhead costs incurred during Manitoba temporary suspension (cash) | - | 3.2 | ||||||||||
| Depreciation and amortization4 | 188.7 | 204.5 | ||||||||||
| Cost of sales6 | 751.6 | 723.5 | ||||||||||
1 Per pound of copper produced.
2 By-product credits are computed as revenue per financial statements, including amortization of deferred revenue and pricing and volume adjustments. For more information, please see the realized price reconciliation table on page 32 of this MD&A for these figures.
3 Gold and silver by-product credits do not include variable consideration adjustments with respect to stream arrangements. Variable consideration adjustments are cumulative adjustments to gold and silver stream deferred revenue primarily associated with the net change in mineral reserves and resources or amendments to the mine plan that would change the total expected deliverable ounces under the precious metal streaming arrangement. For the six months ended June 30, 2026 the variable consideration adjustments amounted to a gain of $0.1 million (six months ended June 30, 2025 - gain of $9.9 million).
4 Depreciation is based on concentrate sold.
5 Certain of Hudbay's properties are subject to royalty arrangements based on mineral production at the properties. Royalties include net smelter return royalty and price participation agreements.
6 As per consolidated interim financial statements.
| Peru | Three months ended | Six months ended | ||||||||||||||
| (in thousands) | Jun. 30, 2026 | Mar. 31, 2026 | Jun. 30, 2025 | Jun. 30, 2026 | Jun. 30, 2025 | |||||||||||
| Net pounds of copper produced1 | 42,871 | 45,356 | 47,863 | 88,227 | 92,601 | |||||||||||
1 Contained copper in concentrate.
| Peru | Three months ended | |||||||||||||||||
| Jun. 30, 2026 | Mar. 31, 2026 | Jun. 30, 2025 | ||||||||||||||||
| Cash cost per pound of copper produced | $ millions | $/lb | $ millions | $/lb | $ millions | $/lb | ||||||||||||
| Mining | 42.2 | 0.98 | 34.5 | 0.76 | 28.1 | 0.59 | ||||||||||||
| Milling | 50.9 | 1.19 | 43.4 | 0.96 | 57.8 | 1.21 | ||||||||||||
| G&A | 25.4 | 0.59 | 33.2 | 0.73 | 23.2 | 0.48 | ||||||||||||
| Onsite costs | 118.5 | 2.76 | 111.1 | 2.45 | 109.1 | 2.28 | ||||||||||||
| Treatment & refining | (0.5 | ) | (0.01 | ) | (1.6 | ) | (0.04 | ) | (0.1 | ) | 0.00 | |||||||
| Freight & other | 12.7 | 0.30 | 14.1 | 0.31 | 12.4 | 0.25 | ||||||||||||
| Cash cost, before by-product credits | 130.7 | 3.05 | 123.6 | 2.72 | 121.4 | 2.53 | ||||||||||||
| By-product credits | (59.7 | ) | (1.39 | ) | (91.8 | ) | (2.02 | ) | (51.8 | ) | (1.08 | ) | ||||||
| Cash cost, net of by-product credits | 71.0 | 1.66 | 31.8 | 0.70 | 69.6 | 1.45 | ||||||||||||
| Peru | Six months ended | |||||||||||
| Jun. 30, 2026 | Jun. 30, 2025 | |||||||||||
| Cash cost per pound of copper produced | $ millions | $/lb | $ millions | $/lb | ||||||||
| Mining | 76.7 | 0.87 | 59.1 | 0.64 | ||||||||
| Milling | 94.3 | 1.07 | 102.2 | 1.10 | ||||||||
| G&A | 58.6 | 0.66 | 45.7 | 0.50 | ||||||||
| Onsite costs | 229.6 | 2.60 | 207.0 | 2.24 | ||||||||
| Treatment & refining | (2.1 | ) | (0.02 | ) | 6.6 | 0.07 | ||||||
| Freight & other | 26.8 | 0.30 | 27.6 | 0.30 | ||||||||
| Cash cost, before by-product credits | 254.3 | 2.88 | 241.2 | 2.61 | ||||||||
| By-product credits | (151.5 | ) | (1.71 | ) | (122.0 | ) | (1.32 | ) | ||||
| Cash cost, net of by-product credits | 102.8 | 1.17 | 119.2 | 1.29 | ||||||||
| Peru | Three months ended | |||||||||||||||||
| Jun. 30, 2026 | Mar. 31, 2026 | Jun. 30, 2025 | ||||||||||||||||
| Supplementary cash cost information | $ millions | $/lb 1 | $ millions | $/lb 1 | $ millions | $/lb 1 | ||||||||||||
| By-product credits2: | ||||||||||||||||||
| Gold3 | 16.3 | 0.38 | 44.9 | 0.99 | 17.3 | 0.36 | ||||||||||||
| Silver3 | 21.0 | 0.49 | 22.9 | 0.50 | 13.7 | 0.29 | ||||||||||||
| Molybdenum | 22.4 | 0.52 | 24.0 | 0.53 | 20.8 | 0.43 | ||||||||||||
| Total by-product credits | 59.7 | 1.39 | 91.8 | 2.02 | 51.8 | 1.08 | ||||||||||||
| Reconciliation to IFRS: | ||||||||||||||||||
| Cash cost, net of by-product credits | 71.0 | 31.8 | 69.6 | |||||||||||||||
| By-product credits | 59.7 | 91.8 | 51.8 | |||||||||||||||
| Treatment and refining charges | 0.5 | 1.6 | 0.1 | |||||||||||||||
| Inventory adjustments | - | - | 1.1 | |||||||||||||||
| Share-based compensation expenses | 0.2 | 0.5 | 0.2 | |||||||||||||||
| Change in product inventory | (20.3 | ) | 7.6 | 4.0 | ||||||||||||||
| Royalties and statutory contributions | 1.3 | 1.9 | 1.0 | |||||||||||||||
| Depreciation and amortization4 | 45.4 | 61.4 | 56.0 | |||||||||||||||
| Cost of sales5 | 157.8 | 196.6 | 183.8 | |||||||||||||||
1 Per pound of copper produced.
2 By-product credits are computed as revenue per financial statements, including amortization of deferred revenue and pricing and volume adjustments.
3 Gold and silver by-product credits do not include variable consideration adjustments with respect to stream arrangements.
4 Depreciation is based on concentrate sold.
5 As per the consolidated interim financial statements.
| Peru | Six months ended | |||||||||||
| Jun. 30, 2026 | Jun. 30, 2025 | |||||||||||
| Supplementary cash cost information | $ millions | $/lb 1 | $ millions | $/lb 1 | ||||||||
| By-product credits2: | ||||||||||||
| Gold3 | 61.2 | 0.69 | 52.3 | 0.56 | ||||||||
| Silver3 | 43.9 | 0.50 | 29.3 | 0.32 | ||||||||
| Molybdenum | 46.4 | 0.53 | 40.4 | 0.44 | ||||||||
| Total by-product credits | 151.5 | 1.72 | 122.0 | 1.32 | ||||||||
| Reconciliation to IFRS: | ||||||||||||
| Cash cost, net of by-product credits | 102.8 | 119.2 | ||||||||||
| By-product credits | 151.5 | 122.0 | ||||||||||
| Treatment and refining charges | 2.1 | (6.6 | ) | |||||||||
| Inventory adjustments | - | 1.5 | ||||||||||
| Share-based compensation expenses | 0.7 | 0.3 | ||||||||||
| Change in product inventory | (12.7 | ) | 17.8 | |||||||||
| Royalties and statutory contributions | 3.2 | 2.1 | ||||||||||
| Depreciation and amortization4 | 106.8 | 124.2 | ||||||||||
| Cost of sales5 | 354.4 | 380.5 | ||||||||||
1 Per pound of copper produced.
2 By-product credits are computed as revenue per financial statements, including amortization of deferred revenue and pricing and volume adjustments.
3 Gold and silver by-product credits do not include variable consideration adjustments with respect to stream arrangements.
4 Depreciation is based on concentrate sold.
5 As per the consolidated interim financial statements.
| British Columbia | Three months ended | Six months ended | ||||||||||||||
| (in thousands) | Jun. 30, 2026 | Mar. 31, 2026 | Jun. 30, 2025 | Jun. 30, 2026 | Jun. 30, 2025 | |||||||||||
| Net pounds of copper produced1 | 14,231 | 10,628 | 14,626 | 24,859 | 30,490 | |||||||||||
1 Contained copper in concentrate.
| British Columbia | Three months ended | |||||||||||||||||
| Jun. 30, 2026 | Mar. 31, 2026 | Jun. 30, 2025 | ||||||||||||||||
| Cash cost per pound of copper produced | $ millions | $/lb | $ millions | $/lb | $ millions | $/lb | ||||||||||||
| Mining | 31.3 | 2.20 | 16.2 | 1.53 | 24.2 | 1.65 | ||||||||||||
| Milling | 27.2 | 1.91 | 31.5 | 2.96 | 21.4 | 1.46 | ||||||||||||
| G&A | 7.9 | 0.56 | 8.4 | 0.79 | 6.1 | 0.42 | ||||||||||||
| Onsite costs | 66.4 | 4.67 | 56.1 | 5.28 | 51.7 | 3.53 | ||||||||||||
| Treatment & refining | (0.6 | ) | (0.04 | ) | 2.1 | 0.20 | 2.1 | 0.14 | ||||||||||
| Freight & other | 3.5 | 0.24 | 2.8 | 0.26 | 3.3 | 0.24 | ||||||||||||
| Cash cost, before by-product credits | 69.3 | 4.87 | 61.0 | 5.74 | 57.1 | 3.91 | ||||||||||||
| By-product credits | (23.5 | ) | (1.65 | ) | (35.4 | ) | (3.33 | ) | (22.2 | ) | (1.52 | ) | ||||||
| Cash cost, net of by-product credits | 45.8 | 3.22 | 25.6 | 2.41 | 34.9 | 2.39 | ||||||||||||
| British Columbia | Six months ended | |||||||||||
| Jun. 30, 2026 | Jun. 30, 2025 | |||||||||||
| Cash cost per pound of copper produced | $ millions | $/lb | $ millions | $/lb | ||||||||
| Mining | 47.5 | 1.91 | 46.1 | 1.51 | ||||||||
| Milling | 58.7 | 2.36 | 43.2 | 1.42 | ||||||||
| G&A | 16.3 | 0.66 | 12.4 | 0.41 | ||||||||
| Onsite costs | 122.5 | 4.93 | 101.7 | 3.34 | ||||||||
| Treatment & refining | 1.5 | 0.06 | 5.7 | 0.19 | ||||||||
| Freight & other | 6.3 | 0.25 | 6.7 | 0.21 | ||||||||
| Cash cost, before by-product credits | 130.3 | 5.24 | 114.1 | 3.74 | ||||||||
| By-product credits | (58.9 | ) | (2.37 | ) | (40.5 | ) | (1.33 | ) | ||||
| Cash cost, net of by-product credits | 71.4 | 2.87 | 73.6 | 2.41 | ||||||||
| British Columbia | Three months ended | |||||||||||||||||
| Jun. 30, 2026 | Mar. 31, 2026 | Jun. 30, 2025 | ||||||||||||||||
| Supplementary cash cost information | $ millions | $/lb 1 | $ millions | $/lb 1 | $ millions | $/lb 1 | ||||||||||||
| By-product credits2: | ||||||||||||||||||
| Gold | 20.7 | 1.45 | 30.6 | 2.88 | 19.8 | 1.35 | ||||||||||||
| Silver | 2.8 | 0.20 | 4.8 | 0.45 | 2.4 | 0.17 | ||||||||||||
| Total by-product credits | 23.5 | 1.65 | 35.4 | 3.33 | 22.2 | 1.52 | ||||||||||||
| Reconciliation to IFRS: | ||||||||||||||||||
| Cash cost, net of by-product credits | 45.8 | 25.6 | 34.9 | |||||||||||||||
| By-product credits | 23.5 | 35.4 | 22.2 | |||||||||||||||
| Treatment and refining charges | 0.6 | (2.1 | ) | (2.1 | ) | |||||||||||||
| Inventory adjustments | - | - | 1.4 | |||||||||||||||
| Change in product inventory | (2.6 | ) | 11.3 | 3.6 | ||||||||||||||
| Share-based compensation expense | 0.6 | 0.6 | 0.2 | |||||||||||||||
| Royalties | 2.3 | 3.2 | 1.2 | |||||||||||||||
| Depreciation and amortization3 | 22.2 | 18.5 | 16.8 | |||||||||||||||
| Cost of sales4 | 92.4 | 92.5 | 78.2 | |||||||||||||||
1 Per pound of copper produced.
2 By-product credits are computed as revenue per financial statements, including amortization of deferred revenue and pricing and volume adjustments.
3 Depreciation is based on concentrate sold.
4 As per consolidated interim financial statements.
| British Columbia | Six months ended | |||||||||||
| Jun. 30, 2026 | Jun. 30, 2025 | |||||||||||
| Supplementary cash cost information | $ millions | $/lb 1 | $ millions | $/lb 1 | ||||||||
| By-product credits2: | ||||||||||||
| Gold | 51.3 | 2.06 | 35.9 | 1.18 | ||||||||
| Silver | 7.6 | 0.31 | 4.6 | 0.15 | ||||||||
| Total by-product credits | 58.9 | 2.37 | 40.5 | 1.33 | ||||||||
| Reconciliation to IFRS: | ||||||||||||
| Cash cost, net of by-product credits | 71.4 | 73.6 | ||||||||||
| By-product credits | 58.9 | 40.5 | ||||||||||
| Treatment and refining charges | (1.5 | ) | (5.7 | ) | ||||||||
| Inventory adjustments | - | 2.2 | ||||||||||
| Change in product inventory | 8.7 | 2.8 | ||||||||||
| Share-based compensation expense | 1.2 | 0.5 | ||||||||||
| Royalties | 5.5 | 2.0 | ||||||||||
| Depreciation and amortization3 | 40.7 | 32.8 | ||||||||||
| Cost of sales4 | 184.9 | 148.7 | ||||||||||
1 Per pound of copper produced.
2 By-product credits are computed as revenue per financial statements, including amortization of deferred revenue and pricing and volume adjustments.
3 Depreciation is based on concentrate sold.
4 As per consolidated interim financial statements.
| Consolidated | Three months ended | |||||||||||||||||
| Jun. 30, 2026 | Mar. 31, 2026 | Jun. 30, 2025 | ||||||||||||||||
| All-in sustaining cash cost per pound of copper produced |
$ millions | $/lb | $ millions | $/lb | $ millions | $/lb | ||||||||||||
| Cash cost, net of by-product credits | (24.7 | ) | (0.40 | ) | (110.6 | ) | (1.80 | ) | (1.7 | ) | (0.02 | ) | ||||||
| Cash sustaining capital expenditures | 107.9 | 1.73 | 105.2 | 1.71 | 108.3 | 1.64 | ||||||||||||
| Royalties and statutory contributions | 3.6 | 0.06 | 5.1 | 0.08 | 2.2 | 0.03 | ||||||||||||
| Sustaining cash cost, net of by-product credits | 86.8 | 1.39 | (0.3 | ) | 0.00 | 108.8 | 1.65 | |||||||||||
| Corporate selling and administrative expenses & regional costs | 22.0 | 0.35 | 38.1 | 0.62 | 22.1 | 0.33 | ||||||||||||
| Accretion and amortization of decommissioning and community agreements1 |
3.6 | 0.06 | 6.5 | 0.11 | 3.2 | 0.05 | ||||||||||||
| All-in sustaining cash cost, net of by-product credits | 112.4 | 1.80 | 44.3 | 0.73 | 134.1 | 2.03 | ||||||||||||
| Reconciliation to property, plant and equipment additions: | ||||||||||||||||||
| Property, plant and equipment additions | 160.0 | 109.5 | 93.6 | |||||||||||||||
| Capitalized stripping net additions | 49.8 | 73.0 | 53.8 | |||||||||||||||
| Total accrued capital additions | 209.8 | 182.5 | 147.4 | |||||||||||||||
| Less other non-sustaining capital costs2 | 129.7 | 95.5 | 58.8 | |||||||||||||||
| Total sustaining capital costs | 80.1 | 87.0 | 88.6 | |||||||||||||||
| Capitalized lease & equipment financing cash payments - operating sites | 15.2 | 15.1 | 13.4 | |||||||||||||||
| LOM Community agreement cash payments | 10.1 | 0.6 | 4.1 | |||||||||||||||
| Accretion and amortization of decommissioning and restoration obligations 3 |
2.5 | 2.5 | 2.2 | |||||||||||||||
| Cash sustaining capital expenditures | 107.9 | 105.2 | 108.3 | |||||||||||||||
1 Includes accretion of decommissioning liability relating to non-producing sites, and accretion and amortization of community agreements capitalized to Other assets.
2 Other non-sustaining capital costs include Copper World capitalized costs, Cactus Project capitalized costs, capitalized interest, capitalized exploration, right-of-use lease asset additions, equipment financing asset additions, growth capital expenditures and reclassification related to capital spares.
3 Includes amortization of decommissioning and restoration PP&E assets and accretion of decommissioning and restoration liabilities related to producing sites.
| Consolidated | Six months ended | |||||||||||
| Jun. 30, 2026 | Jun. 30, 2025 | |||||||||||
| All-in sustaining cash cost per pound of copper produced | $ millions | $/lb | $ millions | $/lb | ||||||||
| Cash cost, net of by-product credits | (135.3 | ) | (1.09 | ) | (32.7 | ) | (0.24 | ) | ||||
| Cash sustaining capital expenditures | 213.1 | 1.72 | 186.5 | 1.39 | ||||||||
| Royalties and statutory contributions | 8.7 | 0.07 | 4.1 | 0.03 | ||||||||
| Sustaining cash cost, net of by-product credits | 86.5 | 0.70 | 157.9 | 1.18 | ||||||||
| Corporate selling and administrative expenses & regional costs | 60.1 | 0.49 | 37.4 | 0.27 | ||||||||
| Accretion and amortization of decommissioning and community agreements1 | 10.1 | 0.08 | 5.2 | 0.04 | ||||||||
| All-in sustaining cash cost, net of by-product credits | 156.7 | 1.26 | 200.5 | 1.49 | ||||||||
| Reconciliation to property, plant and equipment additions: | ||||||||||||
| Property, plant and equipment additions | 269.5 | 161.8 | ||||||||||
| Capitalized stripping net additions | 122.8 | 95.1 | ||||||||||
| Total accrued capital additions | 392.3 | 256.9 | ||||||||||
| Less other non-sustaining capital costs2 | 225.2 | 105.8 | ||||||||||
| Total sustaining capital costs | 167.1 | 151.1 | ||||||||||
| Capitalized lease & equipment financing cash payments - operating sites | 30.3 | 26.2 | ||||||||||
| LOM Community agreement cash payments | 10.7 | 4.9 | ||||||||||
| Accretion and amortization of decommissioning and restoration obligations 3 | 5.0 | 4.3 | ||||||||||
| Cash sustaining capital expenditures | 213.1 | 186.5 | ||||||||||
1 Includes accretion of decommissioning liability relating to non-producing sites, and accretion and amortization of community agreements capitalized to Other assets.
2 Other non-sustaining capital costs include Copper World capitalized costs, capitalized interest, capitalized exploration, right-of-use lease asset additions, equipment financing asset additions, growth capital expenditures and reclassification related to capital spares.
3 Includes amortization of decommissioning and restoration PP&E assets and accretion of decommissioning and restoration liabilities related to producing sites.
| Peru | Three months ended | |||||||||||||||||
| Jun. 30, 2026 | Mar. 31, 2026 | Jun. 30, 2025 | ||||||||||||||||
| Sustaining cash cost per pound of copper produced | $ millions | $/lb | $ millions | $/lb | $ millions | $/lb | ||||||||||||
| Cash cost, net of by-product credits | 71.0 | 1.66 | 31.8 | 0.70 | 69.6 | 1.45 | ||||||||||||
| Cash sustaining capital expenditures | 43.8 | 1.02 | 30.7 | 0.69 | 55.1 | 1.15 | ||||||||||||
| Royalties and statutory contributions | 1.3 | 0.03 | 1.9 | 0.04 | 1.0 | 0.03 | ||||||||||||
| Sustaining cash cost per pound of copper produced | 116.1 | 2.71 | 64.4 | 1.43 | 125.7 | 2.63 | ||||||||||||
| Peru | Six months ended | |||||||||||
| Jun. 30, 2026 | Jun. 30, 2025 | |||||||||||
| Sustaining cash cost per pound of copper produced | $ millions | $/lb | $ millions | $/lb | ||||||||
| Cash cost, net of by-product credits | 102.8 | 1.17 | 119.2 | 1.29 | ||||||||
| Cash sustaining capital expenditures | 74.5 | 0.84 | 90.4 | 0.98 | ||||||||
| Royalties and statutory contributions | 3.2 | 0.04 | 2.1 | 0.02 | ||||||||
| Sustaining cash cost per pound of copper produced | 180.5 | 2.05 | 211.7 | 2.29 | ||||||||
| British Columbia | Three months ended | |||||||||||||||||
| Jun. 30, 2026 | Mar. 31, 2026 | Jun. 30, 2025 | ||||||||||||||||
| Sustaining cash cost per pound of copper produced | $ millions | $/lb | $ millions | $/lb | $ millions | $/lb | ||||||||||||
| Cash cost, net of by-product credits | 45.8 | 3.22 | 25.6 | 2.41 | 34.9 | 2.39 | ||||||||||||
| Cash sustaining capital expenditures | 40.6 | 2.85 | 54.2 | 5.10 | 39.6 | 2.71 | ||||||||||||
| Royalties and statutory contributions | 2.3 | 0.16 | 3.2 | 0.30 | 1.2 | 0.08 | ||||||||||||
| Sustaining cash cost per pound of copper produced | 88.7 | 6.23 | 83.0 | 7.81 | 75.7 | 5.18 | ||||||||||||
| British Columbia | Six months ended | |||||||||||
| Jun. 30, 2026 | Jun. 30, 2025 | |||||||||||
| Sustaining cash cost per pound of copper produced | $ millions | $/lb | $ millions | $/lb | ||||||||
| Cash cost, net of by-product credits | 71.4 | 2.87 | 73.6 | 2.41 | ||||||||
| Cash sustaining capital expenditures | 94.8 | 3.81 | 67.4 | 2.21 | ||||||||
| Royalties and statutory contributions | 5.5 | 0.23 | 2.0 | 0.07 | ||||||||
| Sustaining cash cost per pound of copper produced | 171.7 | 6.91 | 143.0 | 4.69 | ||||||||
Gold Cash Cost and Gold Sustaining Cash Cost
Cash cost per ounce of gold produced ("gold cash cost") is a non-GAAP measure that management uses as a key performance indicator to assess the performance of Hudbay's Manitoba operations. This alternative cash cost calculation designates gold as the primary metal of production as it represents a substantial component of revenues for Hudbay's Manitoba business unit and should therefore be less volatile over time than Manitoba cash cost per pound of copper. The calculation is presented in three manners:
- Gold cash cost, before by-product credits - This measure is gross of by-product revenues and is a function of the efforts and costs incurred to mine and process all ore mined. However, the measure divides this aggregate cost over only ounces of gold produced, the assumed primary metal of production. This measure is generally less volatile from period to period, as it is not affected by changes in the price received for by-product metals.
- Gold cash cost, net of by-product credits - In order to calculate the net cost to produce and sell gold, the net of by-product credits measure subtracts the revenues realized from the sale of the metals other than gold. The by-product revenues from copper, zinc, and silver are significant and are integral to the economics of Hudbay's Manitoba operation. The economics that support its decision to produce and sell gold would be different if Hudbay did not receive revenues from the other significant metals being extracted and processed. This measure provides management and investors with an indication of the minimum gold price consistent with positive operating margins, assuming realized by-product metal prices are consistent with those prevailing during the reporting period. It also serves as an important operating statistic that management and investors utilize to measure Hudbay's operating performance at its Manitoba operation versus that of its competitors. However, it is important to understand that if by-product metal prices decline alongside gold prices, the gold cash cost net of by-product credits would increase, requiring a higher gold price than that reported to maintain positive cash flows and operating margins.
- Gold sustaining cash cost, net of by-product credits - This measure is an extension of gold cash cost that includes cash sustaining capital expenditures, capitalized exploration, net smelter returns royalties, as well as accretion and amortization for expected decommissioning activities for producing assets. It does not include corporate selling and administrative expenses. It provides a more fulsome measurement of the cost of sustaining production than gold cash cost, which is focused on operating costs only.
The tables below present a detailed build-up of gold cash cost and gold sustaining cash cost, net of by-product credits, for the Manitoba business unit, and reconciliations between gold cash cost, net of by-product credits, to the most comparable IFRS measures of cost of sales for the three months ended June 30, and March 31, 2026 and June 30, 2025 and six months ended June 30, 2026 and 2025. Gold cash cost, net of by-product credits, may not calculate exactly based on amounts presented in the tables below due to rounding.
| Manitoba | Three months ended | Six months ended | |||||||||||||
| (in thousands) | Jun. 30, 2026 | Mar. 31, 2026 | Jun. 30, 2025 | Jun. 30, 2026 | Jun. 30, 2025 | ||||||||||
| Net ounces of gold produced1 | 40,344 | 47,743 | 43,235 | 88,087 | 103,589 | ||||||||||
1 Contained gold in concentrate and doré.
| Manitoba | Three months ended | |||||||||||||||||
| Jun. 30, 2026 | Mar. 31, 2026 | Jun. 30, 2025 | ||||||||||||||||
| Cash cost per ounce of gold produced | $ millions | $/oz1 | $ millions | $/oz1 | $ millions | $/oz1 | ||||||||||||
| Mining | 43.5 | 1,078 | 42.3 | 886 | 33.5 | 775 | ||||||||||||
| Milling | 16.3 | 404 | 16.3 | 341 | 13.4 | 310 | ||||||||||||
| G&A | 18.9 | 469 | 20.0 | 419 | 13.8 | 319 | ||||||||||||
| Onsite costs | 78.7 | 1,951 | 78.6 | 1,646 | 60.7 | 1,404 | ||||||||||||
| Treatment & refining | 1.0 | 25 | 2.6 | 55 | 1.3 | 30 | ||||||||||||
| Freight & other | 5.3 | 131 | 5.7 | 119 | 5.1 | 118 | ||||||||||||
| Cash cost, before by-product credits | 85.0 | 2,107 | 86.9 | 1,820 | 67.1 | 1,552 | ||||||||||||
| By-product credits | (53.7 | ) | (1,331 | ) | (67.4 | ) | (1,412 | ) | (36.4 | ) | (842 | ) | ||||||
| Gold cash cost, net of by-product credits | 31.3 | 776 | 19.5 | 408 | 30.7 | 710 | ||||||||||||
| Manitoba | Six months ended | |||||||||||
| Jun. 30, 2026 | Jun. 30, 2025 | |||||||||||
| Cash cost per ounce of gold produced | $ millions | $/oz1 | $ millions | $/oz1 | ||||||||
| Mining | 85.8 | 974 | 71.8 | 693 | ||||||||
| Milling | 32.6 | 370 | 27.8 | 268 | ||||||||
| G&A | 38.9 | 442 | 28.6 | 277 | ||||||||
| Onsite costs | 157.3 | 1,786 | 128.2 | 1,238 | ||||||||
| Treatment & refining | 3.6 | 41 | 5.0 | 48 | ||||||||
| Freight & other | 11.0 | 125 | 10.8 | 104 | ||||||||
| Cash cost, before by-product credits | 171.9 | 1,952 | 144.0 | 1,390 | ||||||||
| By-product credits | (121.1 | ) | (1,375 | ) | (90.6 | ) | (875 | ) | ||||
| Gold cash cost, net of by-product credits | 50.8 | 577 | 53.4 | 515 | ||||||||
| Manitoba | Three months ended | |||||||||||||||||
| Supplementary cash cost information | Jun. 30, 2026 | Mar. 31, 2026 | Jun. 30, 2025 | |||||||||||||||
| $ millions | $/oz 1 | $ millions | $/oz1 | $ millions | $/oz 1 | |||||||||||||
| By-product credits2: | ||||||||||||||||||
| Copper | 32.8 | 813 | 34.4 | 720 | 21.8 | 504 | ||||||||||||
| Zinc | 9.2 | 228 | 12.4 | 260 | 7.3 | 169 | ||||||||||||
| Silver | 11.6 | 288 | 15.7 | 329 | 7.3 | 169 | ||||||||||||
| Other | 0.1 | 2 | 4.9 | 103 | - | - | ||||||||||||
| Total by-product credits | 53.7 | 1,331 | 67.4 | 1,412 | 36.4 | 842 | ||||||||||||
| Reconciliation to IFRS: | ||||||||||||||||||
| Cash cost, net of by-product credits | 31.3 | 19.5 | 30.7 | |||||||||||||||
| By-product credits | 53.7 | 67.4 | 36.4 | |||||||||||||||
| Treatment and refining charges | (1.0 | ) | (2.6 | ) | (1.3 | ) | ||||||||||||
| Share-based compensation expenses | 0.4 | 1.8 | 0.5 | |||||||||||||||
| Inventory adjustments | 0.9 | - | 1.0 | |||||||||||||||
| Change in product inventory | 5.6 | (5.9 | ) | 3.8 | ||||||||||||||
| Overhead costs incurred during Manitoba temporary suspension (cash) | - | - | 3.2 | |||||||||||||||
| Depreciation and amortization3 | 21.2 | 20.0 | 23.6 | |||||||||||||||
| Cost of sales4 | 112.1 | 100.2 | 97.9 | |||||||||||||||
1 Per ounce of gold produced.
2 By-product credits are computed as revenue per financial statements, amortization of deferred revenue and pricing and volume adjustments.
3 Depreciation is based on concentrate sold.
4 As per consolidated interim financial statements.
| Manitoba | Six months ended | |||||||||||
| Supplementary cash cost information | Jun. 30, 2026 | Jun. 30, 2025 | ||||||||||
| $ millions | $/oz 1 | $ millions | $/oz 1 | |||||||||
| By-product credits2: | ||||||||||||
| Copper | 67.2 | 763 | 54.1 | 522 | ||||||||
| Zinc | 21.6 | 245 | 21.1 | 204 | ||||||||
| Silver | 27.3 | 310 | 15.6 | 151 | ||||||||
| Other | 5.0 | 57 | (0.2 | ) | (2 | ) | ||||||
| Total by-product credits | 121.1 | 1,375 | 90.6 | 875 | ||||||||
| Reconciliation to IFRS: | ||||||||||||
| Cash cost, net of by-product credits | 50.8 | 53.4 | ||||||||||
| By-product credits | 121.1 | 90.6 | ||||||||||
| Treatment and refining charges | (3.6 | ) | (5.0 | ) | ||||||||
| Share-based compensation expenses | 2.2 | 0.8 | ||||||||||
| Inventory adjustments | 0.9 | 1.0 | ||||||||||
| Change in product inventory | (0.3 | ) | 2.8 | |||||||||
| Overhead costs incurred during Manitoba temporary suspension (cash) | - | 3.2 | ||||||||||
| Depreciation and amortization3 | 41.2 | 47.5 | ||||||||||
| Cost of sales4 | 212.3 | 194.3 | ||||||||||
1 Per ounce of gold produced.
2 By-product credits are computed as revenue per financial statements, amortization of deferred revenue and pricing and volume adjustments.
3 Depreciation is based on concentrate sold.
4 As per consolidated interim financial statements.
| Manitoba | Three months ended | |||||||||||||||||
| Jun. 30, 2026 | Mar. 31, 2026 | Jun. 30, 2025 | ||||||||||||||||
| Sustaining cash cost per ounce of gold produced | $ millions | $/oz | $ millions | $/oz | $ millions | $/oz | ||||||||||||
| Gold cash cost, net of by-product credits | 31.3 | 776 | 19.5 | 408 | 30.7 | 710 | ||||||||||||
| Cash sustaining capital expenditures | 23.5 | 582 | 20.3 | 425 | 13.6 | 315 | ||||||||||||
| Sustaining cash cost per ounce of gold produced | 54.8 | 1,358 | 39.8 | 833 | 44.3 | 1,025 | ||||||||||||
| Manitoba | Six months ended | |||||||||||
| Jun. 30, 2026 | Jun. 30, 2025 | |||||||||||
| Sustaining cash cost per ounce of gold produced | $ millions | $/oz | $ millions | $/oz | ||||||||
| Gold cash cost, net of by-product credits | 50.8 | 577 | 53.4 | 515 | ||||||||
| Cash sustaining capital expenditures | 43.8 | 497 | 28.7 | 278 | ||||||||
| Sustaining cash cost per ounce of gold produced | 94.6 | 1,074 | 82.1 | 793 | ||||||||
Combined Unit Cost
Combined unit cost ("unit cost") and zinc plant unit cost is a non-GAAP measure that management uses as a key performance indicator to assess the performance of Hudbay's mining and milling operations. Combined unit cost is calculated by dividing the cost of sales by mill throughput. This measure is utilized by management and investors to assess Hudbay's cost structure and margins and compare it to similar information provided by other companies in the industry. Unlike cash cost, this measure is not impacted by variability in by-product commodity prices since there are no by-product deductions; costs associated with profit-sharing and similar costs are excluded because of their correlation to external metal prices. In addition, the unit costs are reported in the functional currency of the operation which minimizes the impact of foreign currency fluctuations. In all, the unit cost measures provide an alternative perspective on operating cost performance with minimal impact from external market prices.
The tables below present a detailed combined unit cost for the Peru and Manitoba business units, and reconciliations between these measures to the most comparable IFRS measures of cost of sales for the three months ended June 30, 2026 and 2025 and March 31, 2026 and six months ended June 30, 2026 and 2025.
| Peru | Three months ended | Six months ended | |||||||||||||
| (in millions except ore tonnes milled and unit cost per tonne) | Jun. 30, 2026 |
Mar. 31, 2026 |
Jun. 30, 2025 |
Jun. 30, 2026 |
Jun. 30, 2025 |
||||||||||
| Combined unit cost per tonne processed | |||||||||||||||
| Mining | 42.2 | 34.5 | 28.1 | 76.7 | 59.1 | ||||||||||
| Milling | 50.9 | 43.4 | 57.8 | 94.3 | 102.2 | ||||||||||
| G&A1 | 25.4 | 33.2 | 23.2 | 58.6 | 45.7 | ||||||||||
| Less: Other G&A2 | (8.4 | ) | (16.3 | ) | (6.4 | ) | (24.6 | ) | (14.3 | ) | |||||
| Unit cost | 110.1 | 94.8 | 102.7 | 205.0 | 192.7 | ||||||||||
| Tonnes ore milled (in thousands) | 7,828 | 8,164 | 7,559 | 15,991 | 15,673 | ||||||||||
| Combined unit cost per tonne | 14.06 | 11.61 | 13.59 | 12.82 | 12.29 | ||||||||||
| Reconciliation to IFRS: | |||||||||||||||
| Unit cost | 110.1 | 94.8 | 102.7 | 205.0 | 192.7 | ||||||||||
| Freight & other | 12.7 | 14.1 | 12.4 | 26.8 | 27.6 | ||||||||||
| Other G&A | 8.4 | 16.3 | 6.4 | 24.6 | 14.3 | ||||||||||
| Share-based compensation expenses | 0.2 | 0.5 | 0.2 | 0.7 | 0.3 | ||||||||||
| Inventory adjustments | - | - | 1.1 | - | 1.5 | ||||||||||
| Change in product inventory | (20.3 | ) | 7.6 | 4.0 | (12.7 | ) | 17.8 | ||||||||
| Royalties and statutory contributions | 1.3 | 1.9 | 1.0 | 3.2 | 2.1 | ||||||||||
| Depreciation and amortization | 45.4 | 61.4 | 56.0 | 106.8 | 124.2 | ||||||||||
| Cost of sales3 | 157.8 | 196.6 | 183.8 | 354.4 | 380.5 | ||||||||||
1 G&A as per cash cost reconciliation above.
2 Other G&A primarily includes profit sharing costs.
4 As per consolidated interim financial statements.
| Manitoba | Three months ended | Six months ended | |||||||||||||
| (in millions except tonnes ore milled and unit cost per tonne) | Jun. 30, 2026 |
Mar. 31, 2026 |
Jun. 30, 2025 |
Jun. 30, 2026 |
Jun. 30, 2025 |
||||||||||
| Combined unit cost per tonne processed | |||||||||||||||
| Mining | 43.5 | 42.3 | 33.5 | 85.8 | 71.8 | ||||||||||
| Milling | 16.3 | 16.3 | 13.4 | 32.6 | 27.8 | ||||||||||
| G&A1 | 18.9 | 20.0 | 13.8 | 38.9 | 28.6 | ||||||||||
| Less: Other G&A related to profit sharing costs | (9.6 | ) | (11.9 | ) | (7.2 | ) | (21.5 | ) | (14.4 | ) | |||||
| Unit cost | 69.1 | 66.7 | 53.5 | 135.8 | 113.8 | ||||||||||
| USD/CAD implicit exchange rate | 1.38 | 1.37 | 1.38 | 1.38 | 1.41 | ||||||||||
| Unit cost - C$ | 95.6 | 91.5 | 73.9 | 187.1 | 160.4 | ||||||||||
| Tonnes ore milled | 318,514 | 360,384 | 307,138 | 678,898 | 711,548 | ||||||||||
| Combined unit cost per tonne - C$ | 300 | 254 | 241 | 276 | 225 | ||||||||||
| Reconciliation to IFRS: | |||||||||||||||
| Unit cost | 69.1 | 66.7 | 53.5 | 135.8 | 113.8 | ||||||||||
| Freight & other | 5.3 | 5.7 | 5.1 | 11.0 | 10.8 | ||||||||||
| Other G&A related to profit sharing | 9.6 | 11.9 | 7.2 | 21.5 | 14.4 | ||||||||||
| Share-based compensation expenses | 0.4 | 1.8 | 0.5 | 2.2 | 0.8 | ||||||||||
| Inventory adjustments | 0.9 | - | 1.0 | 0.9 | 1.0 | ||||||||||
| Change in product inventory | 5.6 | (5.9 | ) | 3.8 | (0.3 | ) | 2.8 | ||||||||
| Overhead costs incurred during Manitoba temporary suspension (cash) | - | - | 3.2 | - | 3.2 | ||||||||||
| Depreciation and amortization | 21.2 | 20.0 | 23.6 | 41.2 | 47.5 | ||||||||||
| Cost of sales2 | 112.1 | 100.2 | 97.9 | 212.3 | 194.3 | ||||||||||
1 G&A as per cash cost reconciliation above.
2 As per consolidated interim financial statements.
| British Columbia | Three months ended | Six months ended | |||||||||||||
| (in millions except tonnes ore milled and unit cost per tonne) | Jun. 30, 2026 | Mar. 31, 2026 |
Jun. 30, 2025 | Jun. 30, 2026 | Jun. 30, 2025 | ||||||||||
| Combined unit cost per tonne processed | |||||||||||||||
| Mining | 31.3 | 16.2 | 24.2 | 47.5 | 46.1 | ||||||||||
| Milling | 27.2 | 31.5 | 21.4 | 58.7 | 43.2 | ||||||||||
| G&A1 | 7.9 | 8.4 | 6.1 | 16.3 | 12.4 | ||||||||||
| Unit cost | 66.4 | 56.1 | 51.7 | 122.5 | 101.7 | ||||||||||
| USD/CAD implicit exchange rate | 1.39 | 1.38 | 1.38 | 1.39 | 1.40 | ||||||||||
| Unit cost - C$ | 92.3 | 77.7 | 71.1 | 170.0 | 142.2 | ||||||||||
| Tonnes ore milled | 3,616 | 3,078 | 2,900 | 6,694 | 5,661 | ||||||||||
| Combined unit cost per tonne - C$ | 25.52 | 25.23 | 24.51 | 25.39 | 25.12 | ||||||||||
| Reconciliation to IFRS: | |||||||||||||||
| Unit cost | 66.4 | 56.1 | 51.7 | 122.5 | 101.7 | ||||||||||
| Freight & other | 3.5 | 2.8 | 3.3 | 6.3 | 6.7 | ||||||||||
| Change in product inventory | (2.6 | ) | 11.3 | 3.6 | 8.7 | 2.8 | |||||||||
| Shared based compensation | 0.6 | 0.6 | 0.2 | 1.2 | 0.5 | ||||||||||
| Inventory adjustments | - | - | 1.4 | - | 2.2 | ||||||||||
| Royalties | 2.3 | 3.2 | 1.2 | 5.5 | 2.0 | ||||||||||
| Depreciation and amortization | 22.2 | 18.5 | 16.8 | 40.7 | 32.8 | ||||||||||
| Cost of sales2 | 92.4 | 92.5 | 78.2 | 184.9 | 148.7 | ||||||||||
1 G&A as per cash cost reconciliation above.
2 As per consolidated interim financial statements.
ACCOUNTING CHANGES AND CRITICAL ESTIMATES
New standards and interpretations
For information on new standards and interpretations adopted and new standards issued but not yet effective, refer to note 3 of Hudbay's June 30, 2026 consolidated interim financial statements.
Estimates and judgements
The preparation of the consolidated interim financial statements in accordance with IFRS requires Hudbay to make judgements, estimates and assumptions that affect the application of accounting policies, reported amounts of assets and liabilities, disclosure of contingent assets and liabilities at the date of the consolidated interim financial statements, and reported amounts of revenue and expenses during the reporting period. Actual results may differ from these estimates.
Hudbay reviews these estimates and underlying assumptions on an ongoing basis based on its experience and other factors, including expectations of future events that Hudbay believes to be reasonable under the circumstances. Revisions to accounting estimates are recognized in the period in which the estimates are revised and in any future periods affected. Certain accounting estimates and judgements have been identified as being "critical" to the presentation of Hudbay's financial condition and results of operations because they require Hudbay to make subjective and/or complex judgments about matters that are inherently uncertain; or there is a reasonable likelihood that materially different amounts could be reported under different conditions or using different assumptions and estimates.
For more information on judgements and estimates, refer to note 2 of Hudbay's June 30, 2026 consolidated interim financial statements.
CHANGES IN INTERNAL CONTROL OVER FINANCIAL REPORTING
Management is responsible for establishing and maintaining adequate internal control over financial reporting ("ICFR"). ICFR is designed to provide reasonable assurance regarding the reliability of financial reporting and the preparation of consolidated interim financial statements for external purposes in accordance with IFRS.
Hudbay did not make any changes to ICFR during the three months ended June 30, 2026 that materially affected or are reasonably likely to materially affect Hudbay's ICFR.
NOTES TO READER
Forward-Looking Information
This MD&A contains forward-looking information within the meaning of applicable Canadian and United States securities legislation. All information contained in this MD&A, other than statements of current and historical fact, is forward-looking information. Often, but not always, forward-looking information can be identified by the use of words such as "plans", "expects", "budget", "guidance", "scheduled", "estimates", "forecasts", "strategy", "target", "intends", "objective", "goal", "understands", "anticipates" and "believes" (and variations of these or similar words) and statements that certain actions, events or results "may", "could", "would", "should", "might" "occur" or "be achieved" or "will be taken" (and variations of these or similar expressions). All of the forward-looking information in this MD&A is qualified by this cautionary note.
Forward-looking information includes, but is not limited to, statements with respect to Hudbay's production, cost and capital and exploration expenditure guidance, Hudbay's ability to advance and complete the multi-year optimization of the Copper Mountain mine in British Columbia, including with respect to the primary SAG mill repairs and related ramp-up plans, the implementation of stripping strategies and the expected benefits therefrom, the expected timing and benefits of British Columbia growth initiatives, including with respect to the development timelines associated with New Ingerbelle and any challenges to the New Ingerbelle permits (including LSIB's recent application for judicial review), the estimated timelines and pre-requisites for sanctioning the Copper World project, including the completion and anticipated results of (and costs associated with) the DFS and the potential timing of a project sanctioning decision, expectations regarding the benefits of (and costs associated with) sanctioning of the Copper World project, expectations regarding the potential impact of recent policy decisions from the United States government, the benefits, timing and consummation of the definitive agreement with Wheaton Precious Metals Corp. ("Wheaton") in respect of the enhanced precious metals stream at Copper World, the expected benefits of Manitoba growth initiatives, including the use of the exploration drift at the 1901 deposit and the potential utilization of excess capacity at the Stall mill, the ability for Hudbay to complete mill throughput enhancements at its operating business units in Peru, British Columbia and Manitoba, Hudbay's future deleveraging strategies and Hudbay's ability to deleverage and repay debt as needed, expectations regarding the benefits of the ASCU Transaction and the acquisition of the Cactus project, expectations regarding the timing and costs associated with the updated Cactus PFS, expectations regarding Hudbay's cash balance and liquidity and related cash management strategies, expectations regarding Hudbay's capital planning strategies, including but not limited to Hudbay's enhanced Capital Allocation Framework, expectations regarding sustaining capital projects, including but not limited to the construction of a cyanide recycling initiative at the New Britannia mill and construction of a dam lift at the Anderson Tailings Impoundment Area, expectations regarding tax synergies, expectations regarding the ability to conduct exploration work and execute on exploration programs on its properties and to advance related drill plans, Hudbay's evaluation and assessment of opportunities to reprocess tailings using various metallurgical technologies, the anticipated impact of brownfield and greenfield growth projects on Hudbay's performance, anticipated exploration and expansion opportunities and extension of mine life in Snow Lake and Hudbay's ability to find a new anchor deposit near Hudbay's Snow Lake operations, anticipated future drill programs and exploration activities and any results expected therefrom, potential updates to Rockcliff's prior mineral resource estimate for the Talbot project, the enhancement of stakeholder engagement and advancement of a pre-feasibility study and related test work at the Mason copper project in Nevada, expectations regarding the timing and costs associated with the Mason PFS, anticipated mine plans, anticipated metals prices and the anticipated sensitivity of Hudbay's financial performance to metals prices, events that may affect Hudbay's operations and development projects, anticipated cash flows from operations and related liquidity requirements, the ability to successfully obtain proceeds from insurance claims, the ability to achieve Hudbay's climate change goals and initiatives, the anticipated effect of external factors on revenue, such as commodity prices, estimation of mineral reserves and resources, mine life projections, reclamation costs, economic outlook, government regulation of mining operations, and business and acquisition strategies. Forward-looking information is not, and cannot be, a guarantee of future results or events. Forward-looking information is based on, among other things, opinions, assumptions, estimates and analyses that, while considered reasonable by Hudbay at the date the forward-looking information is provided, inherently are subject to significant risks, uncertainties, contingencies and other factors that may cause actual results and events to be materially different from those expressed or implied by the forward-looking information.
The material factors or assumptions that Hudbay has identified and were applied in drawing conclusions or making forecasts or projections set out in the forward-looking information include, but are not limited to:
- the ability to achieve production, cost and capital and exploration expenditure guidance;
- no significant interruptions to Hudbay's operations due to social or political unrest in the regions Hudbay operates, including the navigation of the complex political and social environment in Peru and the resolution of grievances raised by local communities and their residents;
- the ability to consummate the definitive agreement with Wheaton in respect of the enhanced precious metals stream at Copper World;
- no interruptions to Hudbay's plans for advancing the Copper World project, including with respect to the completion of the DFS, timing of a project sanctioning decision, and any successful challenges to the Copper World permits;
- no interruptions to Hudbay's plans for advancing New Ingerbelle, including with respect to any challenges to the New Ingerbelle permits;
- Hudbay's ability to successfully advance and complete the optimization of the Copper Mountain operations, and develop and maintain good relations with key stakeholders;
- the ability to execute on its exploration plans and to advance related drill plans;
- the ability to advance the exploration program at the Maria Reyna and Caballito properties;
- the success of mining, processing, exploration and development activities;
- the scheduled maintenance and availability of Hudbay's processing facilities;
- the accuracy of geological, mining and metallurgical estimates;
- anticipated metals prices and the costs of production;
- the supply and demand for metals Hudbay produces;
- the supply and availability of all forms of energy and fuels at reasonable prices;
- no significant unanticipated operational or technical difficulties;
- no significant interruptions to operations due to adverse effects from extreme weather events, including forest fires that have affected and may continue to affect the regions in which Hudbay operates;
- the execution of Hudbay's business and growth strategies, including the success of its strategic investments and initiatives;
- the availability of additional financing, if needed;
- the ability to deleverage and repay debt, as needed;
- the ability to complete project targets on time and on budget and other events that may affect Hudbay's ability to develop Hudbay's projects;
- the timing and receipt of various regulatory and governmental approvals;
- the availability of personnel for Hudbay's exploration, development and operational projects and ongoing employee relations;
- maintaining good relations with the employees at Hudbay's operations;
- maintaining good relations with the labour unions that represent certain of Hudbay employees in Manitoba and Peru;
- maintaining good relations with the communities in which Hudbay operates, including the neighbouring Indigenous communities and local governments;
- no significant unanticipated challenges with stakeholders at Hudbay's various projects;
- no significant unanticipated events or changes relating to regulatory, environmental, health and safety matters;
- no contests over title to Hudbay's properties, including as a result of rights or claimed rights of Indigenous peoples or challenges to the validity of Hudbay's unpatented mining claims;
- the timing and possible outcome of pending litigation and no significant unanticipated litigation;
- certain tax matters, including, but not limited to current tax laws and regulations, changes in taxation policies and the refund of certain value added taxes from the Canadian and Peruvian governments; and
- no significant and continuing adverse changes in general economic conditions or conditions in the financial markets (including commodity prices and foreign exchange rates).
The risks, uncertainties, contingencies and other factors that may cause actual results to differ materially from those expressed or implied by the forward-looking information may include, but are not limited to, risks related to the failure to effectively advance and complete the optimization of the Copper Mountain mine operations including with respect to the primary SAG mill repairs and related ramp-up plans, political and social risks in the regions Hudbay operates, including the complex political and social environment in Peru and potential disruptions to operations arising from community protests and grievances, risks generally associated with the mining industry and the current geopolitical environment, including future commodity prices, the potential implementation or expansion of tariffs, currency and interest rate fluctuations, energy and consumable prices, supply chain constraints and general cost escalation in the current inflationary environment, uncertainties related to the development and operation of Hudbay's projects, the risk of an indicator of impairment or impairment reversal relating to a material mineral property, risks associated with the development of new projects, risks associated with acquisitions, investments and other strategic transactions including but not limited to the recent acquisition of ASCU, risks related to the Copper World project, including the risk of capital cost escalation, risks related to ongoing litigation in respect of the project's air permit and certain land rights, risks from community opposition, project delivery risks, joint venture risks and financing risks, risks related to the Lalor mine plan, including the ability to convert inferred mineral resource estimates to higher confidence categories, dependence on key personnel and employee and union relations, risks related to political or social instability, unrest or change, risks in respect of Indigenous and community relations, rights and title claims, operational risks and hazards, including the cost of maintaining and upgrading Hudbay's tailings management facilities and any unanticipated environmental, industrial and geological events and developments and the inability to insure against all risks (including any unanticipated significant interruptions to operations due to adverse effects from extreme weather events), failure of plant, equipment, processes, transportation and other infrastructure to operate as anticipated, compliance with government and environmental regulations, including permitting requirements and anti-bribery legislation, depletion of Hudbay's reserves, volatile financial markets and interest rates that may affect Hudbay's ability to obtain additional financing on acceptable terms, the failure to obtain required approvals or clearances from government authorities on a timely basis, uncertainties related to the geology, continuity, grade and estimates of mineral reserves and resources, and the potential for variations in grade and recovery rates, uncertain costs of reclamation activities, Hudbay's ability to comply with Hudbay's pension and other post-retirement obligations, Hudbay's ability to abide by the covenants in Hudbay's debt instruments and other material contracts, tax refunds, hedging transactions, cybersecurity risks and risks related to the reliability and security of Hudbay's information technology and operational technology systems, including risks arising from cyber-attacks ransomware, phishing and other malware, risks associated with the use of artificial intelligence technologies, as well as the risks discussed under the heading "Risk Factors" in Hudbay's most recent Annual Information Form which is available on the Company's SEDAR+ profile at www.sedarplus.ca and the Company's EDGAR profile at www.sec.gov.
Should one or more risk, uncertainty, contingency or other factor materialize or should any factor or assumption prove incorrect, actual results could vary materially from those expressed or implied in the forward-looking information. Accordingly, you should not place undue reliance on forward-looking information. Hudbay does not assume any obligation to update or revise any forward-looking information after the date of this MD&A or to explain any material difference between subsequent actual events and any forward-looking information, except as required by applicable law.
Note to United States Investors
This MD&A has been prepared in accordance with the requirements of the securities laws in effect in Canada, which may differ materially from the requirements of United States securities laws applicable to U.S. issuers.
Qualified Persons and NI 43-101
The technical and scientific information in this MD&A related to Hudbay's material mineral projects other than the Copper Mountain mine has been approved by Olivier Tavchandjian, P. Geo, Senior Vice President, Exploration and Technical Services. Mr. Tavchandjian is a qualified person pursuant to National Instrument 43-101 - Standards of Disclosure for Mineral Projects ("NI 43-101").
The technical and scientific information in this MD&A related to the Copper Mountain mine has been approved by Marc-Andre Brulotte, P. Geo, Executive Director, Global Mineral Resource Evaluation. Mr. Brulotte is a qualified person pursuant to NI 43-101.
For a description of the key assumptions, parameters and methods used to estimate mineral reserves and resources at Hudbay's material mineral properties, as well as data verification procedures and a general discussion of the extent to which the estimates of scientific and technical information may be affected by any known environmental, permitting, legal title, taxation, sociopolitical, marketing or other relevant factors, please see the technical reports for Hudbay's material properties as filed by the Company on SEDAR+ at www.sedarplus.ca and EDGAR at www.sec.gov.
SUMMARY OF HISTORICAL RESULTS
The following unaudited tables set out a summary of quarterly and annual results for the Company.
| Q2 2026 | Q1 2026 | 20254 | Q4 2025 | Q3 2025 | Q2 2025 | Q1 2025 | 2024 4 | Q4 2024 | Q3 2024 | Q2 2024 | |||||||||||||||||||||||
| Consolidated Financial Condition ($ millions) | |||||||||||||||||||||||||||||||||
| Cash and cash equivalents and short-term investment | $ | 890.9 | $ | 1,003.8 | $ | 568.9 | $ | 568.9 | $ | 611.1 | $ | 625.5 | $ | 582.6 | $ | 581.8 | $ | 581.8 | $ | 483.3 | $ | 0.5 | |||||||||||
| Total long-term debt | 860.2 | 1,009.4 | 1,008.6 | 1,008.6 | 1,047.0 | 1,059.6 | 1,108.7 | 1,107.5 | 1,107.5 | 1,108.9 | 1.2 | ||||||||||||||||||||||
| Net debt1 | (80.5 | ) | 5.6 | 439.7 | 439.7 | 435.9 | 434.1 | 526.1 | 525.7 | 525.7 | 625.6 | 0.6 | |||||||||||||||||||||
| Free cash flow | 101.8 | 102.3 | 380.0 | 225.0 | (16.1 | ) | 86.7 | 84.4 | 350.5 | 146.9 | 86.3 | 30.6 | |||||||||||||||||||||
| Consolidated Financial Performance ($ millions except per share amounts) | |||||||||||||||||||||||||||||||||
| Revenue | $ | 631.3 | $ | 757.3 | $ | 2,211.0 | $ | 732.9 | $ | 346.8 | $ | 536.4 | $ | 594.9 | $ | 2,021.2 | $ | 584.9 | $ | 485.8 | $ | 425.5 | |||||||||||
| Cost of sales | 362.3 | 389.3 | 1,467.8 | 462.8 | 281.5 | 359.9 | 363.6 | 1,467.4 | 400.5 | 346.0 | 347.9 | ||||||||||||||||||||||
| Earnings (loss) before tax | 240.4 | 339.0 | 912.0 | 257.1 | 330.5 | 153.1 | 171.3 | 251.6 | 103.7 | 79.7 | 0.4 | ||||||||||||||||||||||
| Net earnings (loss) | 138.1 | 191.5 | 564.3 | 128.0 | 222.4 | 114.7 | 99.2 | 67.8 | 19.3 | 50.3 | (20.3 | ) | |||||||||||||||||||||
| Net earnings (loss) attributable to owners1 | 137.4 | 190.4 | 568.5 | 128.0 | 222.4 | 117.7 | 100.4 | 76.7 | 21.2 | 49.7 | (16.5 | ) | |||||||||||||||||||||
| Basic and diluted earnings (loss) per share attributable to owners | $ | 0.34 | $ | 0.48 | $ | 1.44 | $ | 0.32 | $ | 0.56 | $ | 0.30 | $ | 0.25 | $ | 0.20 | $ | 0.05 | $ | 0.13 | $ | (0.04 | ) | ||||||||||
| Adjusted earnings (loss) per share attributable to owners 1 | $ | 0.28 | $ | 0.40 | $ | 0.67 | $ | 0.22 | $ | 0.03 | $ | 0.19 | $ | 0.24 | $ | 0.48 | $ | 0.18 | $ | 0.13 | $ | 0.00 | |||||||||||
| Operating cash flow before change in non-cash working capital | 210.1 | 208.7 | 764.3 | 336.9 | 70.3 | 193.9 | 163.5 | 691.1 | 231.5 | 188.3 | 123.7 | ||||||||||||||||||||||
| Adjusted EBITDA 1 | 321.2 | 421.9 | 1,060.9 | 385.9 | 142.6 | 245.2 | 287.2 | 823.3 | 257.3 | 206.0 | 145.0 | ||||||||||||||||||||||
| Consolidated Operational Performance | |||||||||||||||||||||||||||||||||
| Contained metal in concentrate and doré produced 2 | |||||||||||||||||||||||||||||||||
| Copper | 28,267 | 27,929 | 118,188 | 33,069 | 24,205 | 29,956 | 30,958 | 137,943 | 43,262 | 31,354 | 28,578 | ||||||||||||||||||||||
| Gold | 51,234 | 61,700 | 267,934 | 84,298 | 53,581 | 56,271 | 73,784 | 332,240 | 94,161 | 89,073 | 58,614 | ||||||||||||||||||||||
| Silver | 845,161 | 787,449 | 3,468,143 | 1,002,985 | 730,394 | 814,989 | 919,775 | 3,983,851 | 1,311,658 | 985,569 | 738,707 | ||||||||||||||||||||||
| Zinc | 4,760 | 4,565 | 17,646 | 5,703 | 548 | 5,130 | 6,265 | 33,339 | 8,385 | 8,069 | 8,087 | ||||||||||||||||||||||
| Molybdenum | 277 | 380 | 1,282 | 325 | 185 | 375 | 397 | 1,323 | 195 | 362 | 369 | ||||||||||||||||||||||
| Payable metal in concentrate and doré sold | |||||||||||||||||||||||||||||||||
| Copper | 23,780 | 29,544 | 114,534 | 34,132 | 18,280 | 30,354 | 31,768 | 125,094 | 37,927 | 27,760 | 25,799 | ||||||||||||||||||||||
| Gold | 56,266 | 66,562 | 260,261 | 84,424 | 38,279 | 62,466 | 75,092 | 335,342 | 92,734 | 73,232 | 61,295 | ||||||||||||||||||||||
| Silver | 674,490 | 923,051 | 3,190,552 | 871,006 | 418,418 | 894,160 | 1,006,968 | 3,549,816 | 1,150,518 | 663,413 | 667,036 | ||||||||||||||||||||||
| Zinc 3 | 2,635 | 3,897 | 15,152 | 3,972 | 3,452 | 2,871 | 4,857 | 25,120 | 5,261 | 8,607 | 5,133 | ||||||||||||||||||||||
| Molybdenum | 298 | 375 | 1,334 | 190 | 269 | 427 | 448 | 1,287 | 182 | 343 | 347 | ||||||||||||||||||||||
| Cash cost 1 | $ | (0.40 | ) | $ | (1.80 | ) | $ | (0.22 | ) | $ | (0.63 | ) | $ | 0.42 | $ | (0.02 | ) | $ | (0.45 | ) | $ | 0.46 | $ | 0.45 | $ | 0.18 | $ | 1.14 | |||||
| Sustaining cash cost 1 | $ | 1.39 | $ | 0.00 | $ | 1.30 | $ | 0.94 | $ | 2.09 | $ | 1.65 | $ | 0.72 | $ | 1.62 | $ | 1.37 | $ | 1.71 | $ | 2.65 | |||||||||||
| All-in sustaining cash cost 1 | $ | 1.80 | $ | 0.73 | $ | 1.74 | $ | 1.43 | $ | 2.78 | $ | 2.03 | $ | 0.97 | $ | 1.88 | $ | 1.53 | $ | 1.95 | $ | 3.07 | |||||||||||
1Net debt, adjusted earnings (loss) per share attributable to owners, adjusted EBITDA, cash cost, sustaining cash cost and all-in sustaining cash cost per pound of copper produced, net of by-product credits, are non-GAAP financial performance measures with no standardized definition under IFRS. For further information and a detailed reconciliation, please see discussion under the "Non-GAAP Financial Performance Measures" section of this MD&A. The above table sets forth selected non-GAAP financial performance measures for each of the Company's nine most recently completed quarters and three most recently completed years; detailed reconciliations for non-comparable prior periods can be found in Hudbay's MD&A for these prior periods in the "Non-GAAP Financial Performance Measures" section of these documents.
2 Metal reported in concentrate is prior to deductions associated with smelter contract terms and includes other secondary products.
3 Includes refined zinc metal sold.
4 Annual consolidated results may not calculate based on amounts presented in this table due to rounding.
| Q2 2026 | Q1 2026 | 20254 | Q4 2025 | Q3 2025 | Q2 2025 | Q1 2025 | 2024 4 | Q4 2024 | Q3 2024 | Q2 2024 | |||||||||||||||||||||||
| Peru Operations | |||||||||||||||||||||||||||||||||
| Constancia ore mined1 | tonnes | 10,962,399 | 10,701,375 | 21,539,089 | 5,610,915 | 564,579 | 6,735,316 | 8,628,279 | 15,046,190 | 4,186,058 | 3,022,931 | 5,277,654 | |||||||||||||||||||||
| Copper | % | 0.28 | 0.29 | 0.31 | 0.31 | 0.25 | 0.34 | 0.28 | 0.34 | 0.40 | 0.36 | 0.29 | |||||||||||||||||||||
| Gold | g/tonne | 0.04 | 0.03 | 0.03 | 0.03 | 0.02 | 0.03 | 0.03 | 0.04 | 0.04 | 0.04 | 0.03 | |||||||||||||||||||||
| Silver | g/tonne | 3.68 | 3.11 | 3.18 | 3.27 | 1.92 | 3.26 | 3.14 | 3.08 | 3.88 | 3.20 | 2.50 | |||||||||||||||||||||
| Molybdenum | % | 0.01 | 0.01 | 0.02 | 0.01 | 0.01 | 0.02 | 0.02 | 0.01 | 0.02 | 0.02 | 0.01 | |||||||||||||||||||||
| Pampacancha ore mined1 | tonnes | - | - | 9,563,442 | 4,152,000 | 4,260,081 | 762,172 | 389,189 | 9,317,499 | 4,037,264 | 1,777,092 | 1,288,789 | |||||||||||||||||||||
| Copper | % | - | - | 0.40 | 0.43 | 0.38 | 0.26 | 0.44 | 0.55 | 0.63 | 0.48 | 0.41 | |||||||||||||||||||||
| Gold | g/tonne | - | - | 0.29 | 0.27 | 0.31 | 0.24 | 0.26 | 0.32 | 0.38 | 0.27 | 0.20 | |||||||||||||||||||||
| Silver | g/tonne | - | - | 4.78 | 4.84 | 4.87 | 4.59 | 3.68 | 5.61 | 6.43 | 6.23 | 3.83 | |||||||||||||||||||||
| Molybdenum | % | - | - | 0.01 | 0.01 | 0.01 | 0.01 | 0.01 | 0.01 | 0.00 | 0.01 | 0.02 | |||||||||||||||||||||
| Strip Ratio | 0.88 | 0.83 | 1.04 | 0.57 | 1.38 | 1.47 | 1.02 | 1.78 | 1.22 | 2.62 | 1.74 | ||||||||||||||||||||||
| Ore milled | tonnes | 7,827,509 | 8,163,847 | 30,292,668 | 7,627,853 | 6,991,744 | 7,559,047 | 8,114,024 | 31,933,624 | 7,999,453 | 8,137,248 | 7,718,962 | |||||||||||||||||||||
| Copper | % | 0.30 | 0.31 | 0.33 | 0.39 | 0.31 | 0.34 | 0.30 | 0.36 | 0.48 | 0.32 | 0.30 | |||||||||||||||||||||
| Gold | g/tonne | 0.04 | 0.06 | 0.11 | 0.18 | 0.16 | 0.05 | 0.05 | 0.14 | 0.20 | 0.11 | 0.07 | |||||||||||||||||||||
| Silver | g/tonne | 3.75 | 3.09 | 3.72 | 4.19 | 3.94 | 3.58 | 3.22 | 3.84 | 5.28 | 3.70 | 2.85 | |||||||||||||||||||||
| Molybdenum | % | 0.01 | 0.01 | 0.01 | 0.01 | 0.01 | 0.01 | 0.01 | 0.01 | 0.01 | 0.01 | 0.01 | |||||||||||||||||||||
| Copper recovery | % | 82.0 | 81.5 | 84.3 | 84.5 | 83.2 | 84.5 | 84.6 | 85.0 | 87.8 | 82.6 | 83.1 | |||||||||||||||||||||
| Gold recovery | % | 48.8 | 59.9 | 69.2 | 74.7 | 72.1 | 56.0 | 56.5 | 70.7 | 73.3 | 68.1 | 61.4 | |||||||||||||||||||||
| Silver recovery | % | 59.9 | 65.4 | 66.7 | 71.1 | 65.2 | 63.5 | 66.0 | 68.8 | 71.4 | 67.0 | 63.9 | |||||||||||||||||||||
| Molybdenum recovery | % | 39.9 | 36.0 | 37.4 | 38.8 | 33.9 | 38.7 | 35.7 | 41.7 | 37.1 | 39.0 | 46.3 | |||||||||||||||||||||
| Contained metal in concentrate | |||||||||||||||||||||||||||||||||
| Copper | tonnes | 19,446 | 20,573 | 85,155 | 25,038 | 18,114 | 21,710 | 20,293 | 99,001 | 33,988 | 21,220 | 19,217 | |||||||||||||||||||||
| Gold | ounces | 5,282 | 8,770 | 74,480 | 32,865 | 26,380 | 7,366 | 7,869 | 98,226 | 38,079 | 20,331 | 10,672 | |||||||||||||||||||||
| Silver | ounces | 564,505 | 531,199 | 2,415,134 | 731,017 | 577,446 | 551,979 | 554,692 | 2,708,262 | 969,502 | 648,209 | 450,833 | |||||||||||||||||||||
| Molybdenum | tonnes | 277 | 380 | 1,282 | 325 | 185 | 375 | 397 | 1,323 | 195 | 362 | 369 | |||||||||||||||||||||
| Payable metal sold | |||||||||||||||||||||||||||||||||
| Copper | tonnes | 15,755 | 21,056 | 84,438 | 28,361 | 11,769 | 21,418 | 22,890 | 88,138 | 28,775 | 18,803 | 16,806 | |||||||||||||||||||||
| Gold | ounces | 4,042 | 15,162 | 71,755 | 37,874 | 9,798 | 9,721 | 14,362 | 103,364 | 37,459 | 9,795 | 13,433 | |||||||||||||||||||||
| Silver | ounces | 418,640 | 676,119 | 2,239,832 | 650,384 | 258,215 | 616,578 | 714,654 | 2,343,820 | 824,613 | 365,198 | 400,302 | |||||||||||||||||||||
| Molybdenum | tonnes | 298 | 375 | 1,334 | 190 | 269 | 427 | 448 | 1,287 | 182 | 343 | 347 | |||||||||||||||||||||
| Unit cost 2,3 | $/tonne | $ | 14.06 | $ | 11.61 | $ | 13.02 | $ | 14.51 | $ | 13.03 | $ | 13.59 | $ | 11.09 | $ | 12.91 | $ | 15.25 | $ | 12.78 | $ | 12.68 | ||||||||||
| Peru cash cost3 | $/lb | $ | 1.66 | $ | 0.70 | $ | 1.08 | $ | 0.57 | $ | 1.30 | $ | 1.45 | $ | 1.11 | $ | 1.18 | $ | 1.00 | $ | 1.80 | $ | 1.78 | ||||||||||
| Peru sustaining cash cost3 | $/lb | $ | 2.71 | $ | 1.43 | $ | 2.02 | $ | 1.53 | $ | 2.11 | $ | 2.63 | $ | 1.92 | $ | 1.86 | $ | 1.48 | $ | 2.78 | $ | 2.60 | ||||||||||
1 Reported tonnes and grade for ore mined are estimates based on mine plan assumptions and may not fully reconcile to ore milled.
2 Reflects combined mine, mill and G&A costs per tonne of ore milled. Reflects the deduction of expected capitalized stripping costs.
3 Combined unit costs, cash cost, and sustaining cash cost per pound of copper produced, net of by-product credits, are non-GAAP financial performance measures with no standardized definition under IFRS. For further information and a detailed reconciliation, please see the discussion under the "Non-GAAP Financial Performance Measures" section of this MD&A. The above table sets forth selected non-GAAP financial performance measures for each of the Company's nine most recently completed quarters and three most recently completed years; detailed reconciliations for non-comparable prior periods can be found in Hudbay's MD&A for these prior periods in the "Non-GAAP Financial Performance Measures" section of these documents.
4 Annual consolidated results may not calculate based on amounts presented in this table due to rounding.
| Manitoba Operations | |||||||||||||||||||||||||||||||||
| Total ore mined2 | tonnes | 321,719 | 349,980 | 1,180,121 | 353,819 | 139,006 | 303,062 | 384,234 | 1,626,935 | 422,454 | 411,295 | 385,478 | |||||||||||||||||||||
| Gold | g/tonne | 4.41 | 4.72 | 5.35 | 5.51 | 5.42 | 4.97 | 5.46 | 4.68 | 4.61 | 5.45 | 3.75 | |||||||||||||||||||||
| Copper | % | 0.84 | 0.80 | 0.79 | 0.82 | 0.67 | 0.61 | 0.95 | 0.85 | 0.95 | 0.91 | 0.69 | |||||||||||||||||||||
| Zinc | % | 2.25 | 2.10 | 2.41 | 2.55 | 1.93 | 2.46 | 2.42 | 2.84 | 2.95 | 2.73 | 2.76 | |||||||||||||||||||||
| Silver | g/tonne | 28.33 | 26.22 | 30.43 | 29.52 | 31.57 | 29.94 | 31.23 | 27.14 | 31.91 | 30.45 | 22.29 | |||||||||||||||||||||
| Stall Concentrator: | |||||||||||||||||||||||||||||||||
| Ore milled | tonnes | 148,037 | 178,981 | 572,704 | 169,274 | 43,940 | 144,204 | 215,286 | 893,510 | 222,004 | 222,621 | 229,527 | |||||||||||||||||||||
| Gold | g/tonne | 3.30 | 3.26 | 3.45 | 3.24 | 3.10 | 3.19 | 3.86 | 3.42 | 3.36 | 4.23 | 3.02 | |||||||||||||||||||||
| Copper | % | 0.66 | 0.53 | 0.67 | 0.69 | 0.56 | 0.56 | 0.76 | 0.71 | 0.73 | 0.89 | 0.59 | |||||||||||||||||||||
| Zinc | % | 3.81 | 3.22 | 3.90 | 4.32 | 3.61 | 4.20 | 3.44 | 4.33 | 4.62 | 4.12 | 4.05 | |||||||||||||||||||||
| Silver | g/tonne | 27.46 | 29.68 | 28.31 | 24.97 | 31.04 | 29.55 | 29.53 | 26.54 | 29.90 | 30.20 | 21.74 | |||||||||||||||||||||
| Gold recovery | % | 70.8 | 73.5 | 70.1 | 71.3 | 72.6 | 67.9 | 70.1 | 68.6 | 69.6 | 70.5 | 65.5 | |||||||||||||||||||||
| Copper recovery | % | 83.7 | 85.9 | 86.7 | 86.5 | 83.4 | 84.7 | 88.3 | 87.4 | 84.4 | 88.3 | 85.4 | |||||||||||||||||||||
| Zinc recovery | % | 84.5 | 79.3 | 79.0 | 78.0 | 34.6 | 84.8 | 84.7 | 86.2 | 81.7 | 88.1 | 87.1 | |||||||||||||||||||||
| Silver recovery | % | 55.4 | 57.5 | 55.4 | 55.6 | 50.3 | 51.9 | 58.7 | 56.8 | 55.1 | 57.8 | 54.2 | |||||||||||||||||||||
| New Britannia Concentrator: | |||||||||||||||||||||||||||||||||
| Ore milled | tonnes | 170,477 | 181,403 | 624,631 | 179,808 | 92,765 | 162,934 | 189,124 | 715,198 | 185,592 | 191,298 | 167,899 | |||||||||||||||||||||
| Gold | g/tonne | 5.31 | 6.06 | 6.87 | 6.68 | 6.88 | 6.48 | 7.37 | 6.29 | 5.99 | 6.77 | 5.31 | |||||||||||||||||||||
| Copper | % | 1.00 | 1.04 | 0.95 | 1.08 | 0.76 | 0.65 | 1.18 | 1.04 | 1.17 | 0.93 | 0.94 | |||||||||||||||||||||
| Zinc | % | 0.97 | 1.09 | 1.09 | 1.30 | 1.00 | 1.01 | 1.00 | 0.99 | 1.08 | 1.12 | 0.92 | |||||||||||||||||||||
| Silver | g/tonne | 29.73 | 22.75 | 31.75 | 31.17 | 32.18 | 30.29 | 33.35 | 27.78 | 33.97 | 30.24 | 24.42 | |||||||||||||||||||||
| Gold recovery - concentrate and doré | % | 90.5 | 90.4 | 89.8 | 88.6 | 91.8 | 89.4 | 90.3 | 89.7 | 90.2 | 90.0 | 90.0 | |||||||||||||||||||||
| Copper recovery | % | 90.9 | 90.8 | 89.2 | 88.6 | 90.0 | 87.4 | 90.3 | 93.6 | 91.3 | 92.8 | 94.4 | |||||||||||||||||||||
| Silver recovery - concentrate and doré | % | 84.5 | 82.2 | 79.0 | 77.1 | 78.5 | 78.0 | 81.6 | 80.9 | 79.6 | 79.9 | 83.1 | |||||||||||||||||||||
1 Annual consolidated results may not calculate based on amounts presented in this table due to rounding.
2 Reported tonnes and grade for ore mined are estimates based on mine plan assumptions and may not reconcile fully to ore milled. Total ore mined includes tonnes from Lalor and 1901.
| Q2 2026 | Q1 2026 | 2025 4 | Q4 2025 | Q3 2025 | Q2 2025 | Q1 2025 | 2024 4 | Q4 2024 | Q3 2024 | Q2 2024 | |||||||||||||||||||||||
| Manitoba Operations (continued) | |||||||||||||||||||||||||||||||||
| Total Manitoba contained metal in concentrate and doré produced5 | |||||||||||||||||||||||||||||||||
| Gold | ounces | 40,344 | 47,743 | 173,453 | 47,423 | 22,441 | 43,235 | 60,354 | 214,225 | 51,438 | 62,468 | 43,488 | |||||||||||||||||||||
| Copper | tonnes | 2,366 | 2,535 | 9,249 | 3,326 | 842 | 1,612 | 3,469 | 12,536 | 3,347 | 3,398 | 2,642 | |||||||||||||||||||||
| Zinc | tonnes | 4,760 | 4,565 | 17,646 | 5,703 | 548 | 5,130 | 6,265 | 33,339 | 8,385 | 8,069 | 8,087 | |||||||||||||||||||||
| Silver | ounces | 209,478 | 213,208 | 800,198 | 214,493 | 102,132 | 197,970 | 285,603 | 995,090 | 283,223 | 281,397 | 210,647 | |||||||||||||||||||||
| Total Manitoba payable metal sold in concentrate and doré | |||||||||||||||||||||||||||||||||
| Gold | ounces | 47,066 | 45,274 | 169,041 | 43,226 | 23,118 | 46,932 | 55,765 | 212,243 | 50,239 | 57,238 | 42,763 | |||||||||||||||||||||
| Copper | tonnes | 2,466 | 2,658 | 7,651 | 2,024 | 769 | 2,133 | 2,725 | 11,602 | 3,321 | 2,931 | 2,429 | |||||||||||||||||||||
| Zinc1 | tonnes | 2,635 | 3,897 | 15,152 | 3,972 | 3,452 | 2,871 | 4,857 | 25,120 | 5,261 | 8,607 | 5,133 | |||||||||||||||||||||
| Silver | ounces | 209,383 | 193,472 | 729,314 | 175,324 | 112,142 | 209,594 | 232,255 | 956,460 | 282,158 | 244,974 | 197,486 | |||||||||||||||||||||
| Combined unit cost 2,3 | C$/tonne | $ | 300 | $ | 254 | $ | 236 | $ | 248 | $ | 258 | $ | 241 | $ | 214 | $ | 226 | $ | 233 | $ | 211 | $ | 225 | ||||||||||
| Gold cash cost 3 | $/oz | $ | 776 | $ | 408 | $ | 549 | $ | 705 | $ | 379 | $ | 710 | $ | 376 | $ | 606 | $ | 607 | $ | 372 | $ | 771 | ||||||||||
| Sustaining gold cash cost 3 | $/oz | $ | 1,358 | $ | 833 | $ | 875 | $ | 1,110 | $ | 762 | $ | 1,025 | $ | 626 | $ | 868 | $ | 908 | $ | 553 | $ | 1,163 | ||||||||||
1 Includes refined zinc metal sold.
2 Reflects combined mine, mill and G&A costs per tonne of milled ore.
3 Combined unit costs, cash cost, and sustaining cash cost per pound of copper produced, cash cost, and sustaining cash cost per ounce of gold produced, net of by-product credits, are non-GAAP financial performance measures with no standardized definition under IFRS. For further information and a detailed reconciliation, please see the discussion under the "Non-GAAP Financial Performance Measures" section of this MD&A. The above table sets forth selected non-GAAP financial performance measures for each of the Company's nine most recently completed quarters and three most recently completed years; detailed reconciliations for non-comparable prior periods can be found in Hudbay's MD&A for these prior periods in the "Non-GAAP Financial Performance Measures" section of these documents.
4 Annual consolidated results may not calculate based on amounts presented in this table due to rounding.
5 Metal reported in concentrate is prior to deductions associated with smelter terms and includes other secondary products.
| Q2 2026 | Q1 2026 | 20255 | Q4 2025 | Q3 2025 | Q2 2025 | Q1 2025 | 2024 5 | Q4 2024 | Q3 2024 | Q2 2024 | |||||||||||||||||||||||
| British Columbia Operations 4 | |||||||||||||||||||||||||||||||||
| Ore mined1 | tonnes | 3,276,090 | 2,916,152 | 9,368,918 | 2,395,166 | 1,815,689 | 2,509,969 | 2,648,094 | 11,360,125 | 2,374,044 | 3,098,863 | 2,164,722 | |||||||||||||||||||||
| Strip Ratio | 6.22 | 7.06 | 7.46 | 7.18 | 8.84 | 7.50 | 6.73 | 5.98 | 7.36 | 6.05 | 7.61 | ||||||||||||||||||||||
| Ore milled | tonnes | 3,616,083 | 3,078,342 | 11,016,842 | 2,268,405 | 3,087,443 | 2,900,008 | 2,760,986 | 12,656,679 | 2,880,927 | 3,363,176 | 3,232,427 | |||||||||||||||||||||
| Copper | % | 0.23 | 0.20 | 0.27 | 0.26 | 0.22 | 0.28 | 0.33 | 0.25 | 0.26 | 0.24 | 0.25 | |||||||||||||||||||||
| Gold | g/tonne | 0.08 | 0.08 | 0.09 | 0.09 | 0.08 | 0.09 | 0.10 | 0.08 | 0.09 | 0.09 | 0.07 | |||||||||||||||||||||
| Silver | g/tonne | 0.88 | 0.67 | 1.02 | 1.10 | 0.78 | 0.97 | 1.28 | 0.96 | 0.92 | 0.73 | 1.01 | |||||||||||||||||||||
| Copper recovery | % | 77.3 | 78.9 | 78.6 | 78.4 | 76.6 | 81.0 | 78.3 | 82.4 | 79.5 | 84.1 | 82.3 | |||||||||||||||||||||
| Gold recovery | % | 62.9 | 64.7 | 63.6 | 63.3 | 59.2 | 68.2 | 63.4 | 60.5 | 55.8 | 67.3 | 57.2 | |||||||||||||||||||||
| Silver recovery | % | 69.7 | 64.6 | 69.7 | 71.4 | 65.5 | 71.8 | 69.8 | 71.8 | 69.0 | 71.2 | 73.9 | |||||||||||||||||||||
| Contained metal in concentrate produced | |||||||||||||||||||||||||||||||||
| Copper | tonnes | 6,455 | 4,821 | 23,784 | 4,705 | 5,249 | 6,634 | 7,196 | 26,406 | 5,927 | 6,736 | 6,719 | |||||||||||||||||||||
| Gold | ounces | 5,608 | 5,187 | 20,001 | 4,010 | 4,760 | 5,670 | 5,561 | 19,789 | 4,644 | 6,274 | 4,454 | |||||||||||||||||||||
| Silver | ounces | 71,178 | 43,042 | 252,811 | 57,475 | 50,816 | 65,040 | 79,480 | 280,499 | 58,933 | 55,963 | 77,227 | |||||||||||||||||||||
| Payable metal sold | |||||||||||||||||||||||||||||||||
| Copper | tonnes | 5,559 | 5,830 | 22,445 | 3,747 | 5,742 | 6,803 | 6,153 | 25,354 | 5,831 | 6,026 | 6,564 | |||||||||||||||||||||
| Gold | ounces | 5,158 | 6,126 | 19,465 | 3,324 | 5,363 | 5,813 | 4,965 | 19,735 | 5,036 | 6,199 | 5,099 | |||||||||||||||||||||
| Silver | ounces | 46,467 | 53,460 | 221,406 | 45,298 | 48,061 | 67,988 | 60,059 | 249,536 | 43,747 | 53,241 | 69,248 | |||||||||||||||||||||
| Combined unit cost 2,3 | C$/tonne | $ | 25.52 | $ | 25.23 | $ | 28.12 | $ | 39.80 | $ | 25.02 | $ | 24.51 | $ | 25.98 | $ | 20.39 | $ | 23.22 | $ | 15.58 | $ | 19.65 | ||||||||||
| Cash cost3 | $/lb | $ | 3.22 | $ | 2.41 | $ | 3.06 | $ | 4.82 | $ | 3.21 | $ | 2.39 | $ | 2.44 | $ | 2.74 | $ | 3.00 | $ | 1.81 | $ | 2.67 | ||||||||||
| Sustaining cash cost 3 | $/lb | $ | 6.23 | $ | 7.81 | $ | 6.12 | $ | 8.87 | $ | 7.43 | $ | 5.18 | $ | 4.24 | $ | 5.29 | $ | 5.76 | $ | 5.06 | $ | 5.56 | ||||||||||
2 Reflects combined mine, mill and general and administrative ("G&A") costs per tonne of ore milled. Reflects the deduction of expected capitalized stripping costs.
3 Combined unit costs, cash cost, and sustaining cash cost per pound of copper produced, net of by-product credits, are non-GAAP financial performance measures with no standardized definition under IFRS. For further information and a detailed reconciliation, please see the discussion under the "Non-GAAP Financial Performance Measures" section of this MD&A. The above table sets forth selected non-GAAP financial performance measures for each of the Company's nine most recently completed quarters and three most recently completed years; detailed reconciliations for non-comparable prior periods can be found in Hudbay's MD&A for these prior periods in the "Non-GAAP Financial Performance Measures" section of these documents.
4 Copper Mountain mine results are stated at 100%. On April 30, 2025 Hudbay completed the acquisition of the remaining 25% interest in the Copper Mountain mine and now owns 100%.
5 Annual consolidated results may not calculate based on amounts presented in this table due to rounding.