.2

.2
Management’s Discussion and Analysis of Results of Operations and Financial Condition for the Year Ended December 31, 2025
This Management’s Discussion and Analysis (“MD&A”) should be read in conjunction with Wheaton Precious Metals Corp.’s (“Wheaton” or the “Company”) consolidated financial statements for the year ended December 31, 2025 and related notes thereto which have been prepared in accordance with IFRS Accounting Standards as issued by the International Accounting Standards Board (“IFRS Accounting Standards”). Reference to Wheaton or the Company includes the Company’s wholly-owned subsidiaries. This MD&A contains “forward-looking” statements that are subject to risk factors set out in the cautionary note contained on page 60 of this MD&A as well as throughout this document. All figures are presented in United States dollars unless otherwise noted. This MD&A has been prepared as of March 12, 2026.
Table of Contents
| Highlights |
5 | |||
| Outlook |
7 | |||
| Mineral Stream Interests |
8 | |||
| Acquisition of Mineral Stream Interests |
9 | |||
| Updates on the Operating Mineral Stream Interests |
10 | |||
| Updates on the Development Stage Mineral Stream Interests |
11 | |||
| Early Deposit Mineral Stream Interests |
12 | |||
| Mineral Royalty Interests |
12 | |||
| Long-Term Equity Investments |
13 | |||
| Summarized Financial Results |
15 | |||
| Summary of Units Produced |
16 | |||
| Summary of Units Sold |
17 | |||
| Quarterly Financial Review |
18 | |||
| Results of Operations and Operational Review |
21 | |||
| Gain on Partial Disposal of Mineral Stream Interest |
29 | |||
| General and Administrative |
29 | |||
| Share Based Compensation |
29 | |||
| Donations and Community Investments |
30 | |||
| Other Income (Expense) |
30 | |||
| Finance Costs |
30 | |||
| Income Tax Expense |
31 | |||
| Liquidity and Capital Resources |
31 | |||
| Share Capital |
41 | |||
| Dividends Paid |
41 | |||
| Financial Instruments |
42 | |||
| Material Risks |
42 | |||
| Critical Accounting Estimates |
44 | |||
| Non-GAAP Measures |
46 | |||
| Subsequent Events |
50 | |||
| Controls and Procedures |
50 | |||
| Attributable Reserves and Resources |
51 | |||
| Cautionary Note Regarding Forward-Looking Statements |
60 | |||
WHEATON PRECIOUS METALS 2025 ANNUAL REPORT- MANAGEMENT DISCUSSION & ANALYSIS [2]
Overview
Wheaton Precious Metals Corp. is a precious metal streaming company which generates its revenue primarily from the sale of precious metals (gold, silver and palladium) and cobalt. The Company is listed on the New York Stock Exchange (“NYSE”), the Toronto Stock Exchange (“TSX”) and the London Stock Exchange (“LSE”) and trades under the symbol WPM.
As of December 31, 2025, the Company has entered into 42 long-term agreements¹ (34 of which are precious metal purchase agreements, or “PMPAs”, three of which are early deposit PMPAs, and five of which are royalty agreements), with 34 different mining companies, related to precious metals and cobalt relating to 23 mining assets which are currently operating, 23 of which are at various stages of development and 2 which have been placed into care and maintenance or have been closed, located in 18 countries. Pursuant to the PMPAs, Wheaton acquires metal production from the counterparties for an initial upfront payment plus an additional cash payment for each ounce or pound delivered which is fixed by contract, generally at or below the prevailing market price. Attributable metal production as referred to in this MD&A is the metal production to which Wheaton is entitled pursuant to the various PMPAs. During the year ended December 31, 2025, the per ounce price paid by the Company for the metals acquired under the agreements averaged $479 for gold, $6.58 for silver, $195 for palladium and $3.57 per pound for cobalt. The primary drivers of the Company’s financial results are the volume of metal production at the various mining assets to which the PMPAs relate and the price realized by Wheaton upon the sale of the metals received. Throughout this MD&A, the production and sales volume of gold, silver and palladium are reported in ounces, while cobalt is reported in pounds.
| 1 | Minto has been removed from the mine count due to Minto Metals Corp. being placed in receivership. |
WHEATON PRECIOUS METALS 2025 ANNUAL REPORT- MANAGEMENT DISCUSSION & ANALYSIS [3]
Operational Overview
| Q4 2025 | Q4 2024 | Change | 2025 | 2024 | Change | |||||||||||||||||||
|
|
||||||||||||||||||||||||
| Units produced |
||||||||||||||||||||||||
| Gold ounces |
130,676 | 118,328 | 10.4 % | 416,171 | 381,248 | 9.2 % | ||||||||||||||||||
| Silver ounces |
6,064 | 5,865 | 3.4 % | 22,289 | 20,959 | 6.3 % | ||||||||||||||||||
| Palladium ounces |
2,519 | 2,797 | (9.9)% | 10,265 | 15,632 | (34.3)% | ||||||||||||||||||
| Cobalt pounds |
670 | 393 | 70.4 % | 2,460 | 1,289 | 90.8 % | ||||||||||||||||||
| Gold equivalent ounces 2 |
205,037 | 189,059 | 8.5 % | 689,864 | 635,488 | 8.6 % | ||||||||||||||||||
| Units sold |
||||||||||||||||||||||||
| Gold ounces |
121,791 | 87,662 | 38.9 % | 411,005 | 332,701 | 23.5 % | ||||||||||||||||||
| Silver ounces |
5,685 | 4,307 | 32.0 % | 19,796 | 16,072 | 23.2 % | ||||||||||||||||||
| Palladium ounces |
1,730 | 4,434 | (61.0)% | 9,356 | 17,270 | (45.8)% | ||||||||||||||||||
| Cobalt pounds |
485 | 485 | 0.0 % | 1,632 | 970 | 68.2 % | ||||||||||||||||||
| Gold equivalent ounces 2 |
190,535 | 141,495 | 34.7 % | 651,311 | 529,493 | 23.0 % | ||||||||||||||||||
| Change in PBND 3 |
||||||||||||||||||||||||
| Gold ounces |
2,667 | 25,582 | 22,915 | (14,622) | 30,782 | 45,404 | ||||||||||||||||||
| Silver ounces |
(402) | 652 | 1,054 | (356) | 1,610 | 1,966 | ||||||||||||||||||
| Palladium ounces |
745 | (1,747) | (2,492) | 730 | (2,227) | (2,957) | ||||||||||||||||||
| Cobalt pounds |
140 | (118) | (258) | 664 | 233 | (431) | ||||||||||||||||||
| Gold equivalent ounces 2 |
(968) | 31,853 | 32,821 | (15,013) | 49,756 | 64,769 | ||||||||||||||||||
|
|
||||||||||||||||||||||||
| Per unit metrics |
||||||||||||||||||||||||
| Sales price |
||||||||||||||||||||||||
| Gold per ounce |
$ | 4,215 | $ | 2,677 | 57.5 % | $ | 3,494 | $ | 2,393 | 46.0 % | ||||||||||||||
| Silver per ounce |
$ | 59.32 | $ | 31.28 | 89.6 % | $ | 42.26 | $ | 28.49 | 48.3 % | ||||||||||||||
| Palladium per ounce |
$ | 1,479 | $ | 1,008 | 46.7 % | $ | 1,126 | $ | 984 | 14.4 % | ||||||||||||||
| Cobalt per pound |
$ | 23.89 | $ | 13.66 | 74.9 % | $ | 19.11 | $ | 14.18 | 34.8 % | ||||||||||||||
| Gold equivalent per ounce 2 |
$ | 4,538 | $ | 2,689 | 68.8 % | $ | 3,554 | $ | 2,426 | 46.5 % | ||||||||||||||
| Cash costs 4 |
||||||||||||||||||||||||
| Gold per ounce 4 |
$ | 495 | $ | 440 | (12.5)% | $ | 479 | $ | 440 | (8.9)% | ||||||||||||||
| Silver per ounce 4 |
$ | 8.95 | $ | 5.16 | (73.4)% | $ | 6.58 | $ | 4.98 | (32.1)% | ||||||||||||||
| Palladium per ounce 4 |
$ | 244 | $ | 184 | (32.6)% | $ | 195 | $ | 179 | (8.9)% | ||||||||||||||
| Cobalt per pound 4 |
$ | 4.33 | $ | 2.59 | (67.2)% | $ | 3.57 | $ | 2.71 | (31.7)% | ||||||||||||||
| Gold equivalent per ounce 2, 4 |
$ | 597 | $ | 444 | (34.5)% | $ | 514 | $ | 438 | (17.4)% | ||||||||||||||
| Cash operating margin 4 |
||||||||||||||||||||||||
| Gold per ounce 4 |
$ | 3,720 | $ | 2,237 | 66.3 % | $ | 3,015 | $ | 1,953 | 54.4 % | ||||||||||||||
| Silver per ounce 4 |
$ | 50.37 | $ | 26.12 | 92.8 % | $ | 35.68 | $ | 23.51 | 51.8 % | ||||||||||||||
| Palladium per ounce 4 |
$ | 1,235 | $ | 824 | 49.8 % | $ | 931 | $ | 805 | 15.7 % | ||||||||||||||
| Cobalt per pound 4 |
$ | 19.56 | $ | 11.07 | 76.7 % | $ | 15.54 | $ | 11.47 | 35.5 % | ||||||||||||||
| Gold equivalent per ounce 2, 4 |
$ | 3,941 | $ | 2,245 | 75.5 % | $ | 3,040 | $ | 1,988 | 52.9 % | ||||||||||||||
|
|
||||||||||||||||||||||||
| Total revenue |
$ | 864,714 | $ | 380,516 | 127.2 % | $ | 2,314,600 | $ | 1,284,639 | 80.2 % | ||||||||||||||
| Gold revenue |
$ | 513,374 | $ | 234,690 | 118.7 % | $ | 1,436,218 | $ | 796,051 | 80.4 % | ||||||||||||||
| Silver revenue |
$ | 337,197 | $ | 134,733 | 150.3 % | $ | 836,671 | $ | 457,830 | 82.7 % | ||||||||||||||
| Palladium revenue |
$ | 2,558 | $ | 4,468 | (42.7)% | $ | 10,536 | $ | 16,999 | (38.0)% | ||||||||||||||
| Cobalt revenue |
$ | 11,585 | $ | 6,625 | 74.9 % | $ | 31,175 | $ | 13,759 | 126.6 % | ||||||||||||||
| Net earnings |
$ | 558,250 | $ | 88,148 | 533.3 % | $ | 1,471,720 | $ | 529,140 | 178.1 % | ||||||||||||||
| Per share |
$ | 1.230 | $ | 0.194 | 534.0 % | $ | 3.242 | $ | 1.167 | 177.8 % | ||||||||||||||
| Adjusted net earnings 4 |
$ | 554,979 | $ | 198,969 | 178.9 % | $ | 1,372,862 | $ | 640,170 | 114.5 % | ||||||||||||||
| Per share 4 |
$ | 1.222 | $ | 0.439 | 178.4 % | $ | 3.025 | $ | 1.412 | 114.2 % | ||||||||||||||
| Operating cash flows |
$ | 746,277 | $ | 319,471 | 133.6 % | $ | 1,904,981 | $ | 1,027,581 | 85.4 % | ||||||||||||||
| Per share 4 |
$ | 1.644 | $ | 0.704 | 133.5 % | $ | 4.197 | $ | 2.266 | 85.2 % | ||||||||||||||
| Dividends paid 5 |
$ | 74,913 | $ | 70,318 | 6.5 % | $ | 299,595 | $ | 281,166 | 6.6 % | ||||||||||||||
| Per share |
$ | 0.165 | $ | 0.155 | 6.5 % | $ | 0.660 | $ | 0.620 | 6.5 % | ||||||||||||||
|
|
||||||||||||||||||||||||
| 1) | All amounts in thousands except gold and palladium ounces produced and sold, per ounce amounts and per share amounts. |
| 2) | Gold-equivalent ounces (“GEOs”), which are provided to assist the reader, are based on the following commodity price assumptions: $2,600 per ounce gold; $30.00 per ounce silver; $950 per ounce palladium; and $13.50 per pound cobalt; consistent with those used in estimating the Company’s production guidance for 2025. |
| 3) | Represents the increase (decrease) in payable ounces produced but not delivered (“PBND”) relative to the various mines that the Company derives precious metals from and, for cobalt, the increase (decrease) of payable pounds PBND. Payable units PBND will be recognized in future sales as they are delivered to the Company under the terms of their contracts. Payable ounces PBND to Wheaton is expected to average approximately two to three months of annualized production for both gold and palladium and two months for silver but may vary from quarter to quarter due to a number of factors, including mine ramp-up and the timing of shipments. Please see “Cautionary Note Regarding Forward-Looking Statements” for material risks, assumptions and important disclosures associated with this information. |
| 4) | Refer to discussion on non-GAAP measures beginning on page 46 of this MD&A. |
| 5) | As at December 31, 2025, cumulative dividends of $2.6 billion have been declared and paid by the Company. |
WHEATON PRECIOUS METALS 2025 ANNUAL REPORT- MANAGEMENT DISCUSSION & ANALYSIS [4]
Highlights
Operations
| ● | For the three months ended December 31, 2025, relative to the comparable period of the prior year: |
| o | Production amounted to 205,000 gold equivalent ounces (“GEOs”), an increase of 8%, with increased production from Antamina and Salobo, the recommencement of production at Aljustrel and the commencement of production at Blackwater being partially offset by lower production at Constancia and Peñasquito. |
| o | Sales volumes amounted to 190,500 GEOs, an increase of 35%, primarily the result of relative changes to GEOs produced but not delivered (“PBND”), combined with the higher production. PBND GEOs decreased 1,000 GEOs during the quarter, compared to an increase of 31,900 GEOs in the same period of the prior year. |
| o | Revenue increased 127% or $484 million to $865 million (59% gold, 39% silver, 1% palladium and 1% cobalt), representing a record for the Company, with the increase being primarily due to a 69% increase in realized commodity prices coupled with the higher sales volumes. |
| o | Gross margin amounted to $664 million (77% of revenue), representing a record for the Company and an increase of $416 million (a 12% increase as a percentage of revenue). The higher margin as a percentage of revenue reflects the leverage provided by fixed per-ounce production payments, which accounted for 80% of revenue during the quarter. |
| o | Net earnings amounted to $558 million, an increase of $470 million, primarily due to the increased gross margin and the absence of the $109 million impairment charge recognized in 2024 on the Voisey’s Bay PMPA, which resulted from a significant and sustained decline in cobalt prices. |
| o | Adjusted net earnings increased 179% or $356 million to $555 million, representing a record for the Company. |
| o | Operating cash flow amounted to $746 million, representing a record for the Company, with the $427 million increase being the result of the higher gross margin. |
| ● | For the year ended December 31, 2025 relative to the prior year: |
| o | Production amounted to 689,900 GEOs, an increase of 9%, with increased production from Salobo and Antamina, the recommencement of production at Aljustrel and the commencement of production at Blackwater being partially offset by lower production at Constancia and Peñasquito. |
| o | Sales volumes amounted to 651,300 GEOs, an increase of 23% resulting from higher production and relative changes in the number of GEOs PBND, with PBND decreasing by 15,000 GEOs, compared to a 49,800 GEO increase during the comparable period of the prior year. |
| o | Revenue increased 80% or $1.0 billion to $2.3 billion (62% gold, 36% silver, 1% palladium and 1% cobalt), representing a record for the Company, with the increase being primarily due to a 46% increase in realized commodity prices coupled with the 23% increase in sales volumes. |
| o | Gross margin amounted to $1.7 billion (72% of revenue), representing an increase of $869 million (a 10% increase as a percentage of revenue). |
| o | Net earnings amounted to $1.5 billion, an increase of $943 million, primarily due to the higher gross margin, the gain from the exercise of the 33% buy-back option under the Cangrejos PMPA and the absence of the $109 million impairment charge recognized in 2024 on the Voisey’s Bay PMPA, partially offset by higher income taxes driven by higher income. |
| o | Adjusted net earnings increased 114% or $733 million to $1.4 billion, representing a record for the Company. |
| o | Operating cash flow amounted to $1.9 billion, representing a record for the Company, with the $877 million increase being due primarily to the higher gross margin. |
| ● | For the third consecutive year, the Company has increased its quarterly dividend. For 2026, the Board of Directors has set the quarterly dividend to $0.195 per common share, which represents an 18% increase, or $0.03 per common share. |
WHEATON PRECIOUS METALS 2025 ANNUAL REPORT- MANAGEMENT DISCUSSION & ANALYSIS [5]
Corporate Development
| ● | On March 4, 2025, Vale informed the Company that it had achieved a sustained throughput capacity of over 35 million tonnes per annum (“Mtpa”) over a 90-day period, resulting in the completion of the second phase of the Salobo III expansion project. |
| ● | On March 7, 2025, the Company amended the Blackwater Silver PMPA, modifying the payable silver profile under the stream, which is expected to accelerate the receipt of payable silver ounces by Wheaton. |
| ● | On November 6, 2025, the Company entered into a PMPA with Waterton Gold LP (“Waterton Gold”) in respect to the Spring Valley project located in Nevada, USA. |
| ● | On November 26, 2025, the Company entered into a PMPA with Hemlo Mining Corp.(“Hemlo”) in respect to the currently operating Hemlo mine located in Ontario, Canada. |
| ● | In connection with its acquisition of Lumina, CMOC exercised its 33% buy-back option under the Cangrejos PMPA for a cash payment of $102 million. Wheaton had previously paid an upfront amount of $16 million attributable to this portion of the stream. The transaction resulted in a gain of $86 million. |
| ● | On February 17, 2026, the Company entered into a PMPA with BHP Group Limited (“BHP”) for their 33.75% portion of the silver produced at the Antamina mine located in Peru. |
Asset Updates
| ● | Rio2 Limited (“Rio2”) reports the first official gold pour at the Fenix mine, with a focus for the remainder of 2026 to ramp up operations to 20,000 tonnes per day. |
| ● | Artemis Gold Inc. (“Artemis Gold”) reports that its board of directors approved the expanded Phase 2 development at the Blackwater mine, which is planned to increase nameplate capacity from 8 Mtpa to 21 Mtpa before the end of 2028. |
| ● | Ivanhoe Mines Ltd. (“Ivanhoe”) reports that the first production of concentrate at the Platreef mine occurred on November 18, 2025. |
| ● | Allied Gold Corporation (“Allied”) reports that the Kurmuk project is being executed to accommodate average throughput of up to 6.4 Mtpa (up from 6.0 Mtpa), with pre-commissioning expected in 2026. |
| ● | B2Gold Corp. (“B2Gold”) reports that the Goose mine achieved commercial production on October 2, 2025, with 2026 production expected to be weighted to the second half of 2026. |
| ● | Aris Mining Corporation (“Aris”) reports that development of the new underground decline to the Bulk Mining Zone at the Marmato mine is approximately 60% complete and is scheduled for completion in Q3 2026, ahead of the commissioning of the carbon in pulp plant, which is expected in Q4 2026. |
| ● | Waterton Copper LP (“Waterton Copper”) continued ramp-up efforts at the Mineral Park mine, with first concentrate sales occurring in Q4 2025 and first silver deliveries to Wheaton occurring in January 2026. Ramp-up to commercial production is expected to continue in Q1 2026. |
| ● | Montage Gold Corp. (“Montage”) reports that first gold pour through the oxide circuit at the Koné project is anticipated in late Q4 2026, while the hard-rock comminution circuit remains on track for completion in Q2 2027. |
| ● | Hudbay Mineral Inc. (“Hudbay”) reported that they intend to complete the definitive feasibility study at Copper World in mid-2026 with final sanctioning decision expected in 2026. |
Other
| ● | On February 5, 2026, the Company announced that as part of the Company’s strategic succession planning, Haytham Hodaly, currently President, will succeed Randy Smallwood as Wheaton’s Chief Executive Officer, effective March 31, 2026, reflecting an ongoing leadership evolution to support the next phase in the Company’s growth trajectory. |
| ● | During the fourth quarter of 2025, the Company: |
| o | Paid a quarterly dividend of $75 million. |
| o | Made total upfront cash payments relative to 7 PMPAs totaling $646 million. |
| ● | During 2025, the Company: |
| o | Made four quarterly dividend payments totaling $300 million. |
| o | Made total upfront cash payments relative to 10 PMPAs totaling $1.3 billion. |
WHEATON PRECIOUS METALS 2025 ANNUAL REPORT- MANAGEMENT DISCUSSION & ANALYSIS [6]
| ● | Subsequent to the quarter, the Company made additional upfront cash payments of $90 million relative to the Spring Valley PMPA ($50 million) and the Marmato PMPA ($40 million), partially offset by a repayment of $30 million relative to the Santo Domingo PMPA, with this amount to be re-advanced at a later date. |
Outlook1
Wheaton’s estimated attributable production in 2026, the estimated attributable gold equivalent production in 2030, as well as the estimated 5-year average annual gold equivalent production for 2031 to 2035, is as follows:
| Metal |
2025 Actual |
2026 Production Guidance |
2030 Target |
2031-2035 Guidance 2 | ||||
| Gold Ounces |
416,171 | 400,000 to 430,000 | ||||||
| Silver Ounces (‘000s) |
22,289 | 27,000 to 29,000 | ||||||
| Other Metals (GEOs) |
16,021 | 19,000 to 21,000 | ||||||
| Gold Equivalent Ounces 3 |
803,658 | 860,000 to 940,000 | 1,200,000 | 1,200,000 |
2026 Production Outlook
The Company anticipates that 2026 GEO2 production will increase by over 11% from levels achieved in 2025. This expected year-over-year growth is driven primarily by the additional stream at Antamina which is expected to add another 70,000 GEOs2 to the portfolio in 2026 and begin generating production on April 1, 2026. Further contributions from newly operating assets, including Blackwater, Mineral Park, Fenix, Hemlo, Goose and Platreef are also forecast to support this growth. These increases are expected to be partially offset by lower production from Constancia following the depletion of the Pampacancha pit in late December 2025.
At the Company’s cornerstone assets, after achieving record production levels in 2025, attributable production levels at Salobo are forecast to decrease slightly, with higher throughput levels anticipated to be offset by modestly lower gold grades. Attributable production is forecast to increase significantly at Antamina in 2026 due to the additional stream, with the Company receiving a combined 67.5% of silver production commencing April 1, 2026, up from the 33.75% delivered in 2025 under the existing stream. Lastly, attributable production from Peñasquito is forecast to increase from 2025, driven by stronger silver grades, including contributions from stockpile material as mining progresses through planned sequencing.
Long-Term Production Outlook
Production is forecast to increase by approximately 50% to 1,200,000 GEOs2 by 2030, due to growth from multiple Operating assets including Antamina, Blackwater, Aljustrel, Marmato, Hemlo and Goose; Development assets that are in construction and/or various stages of ramp-up, including the Koné, Fenix, Kurmuk, Platreef, Mineral Park and El Domo projects; and Pre-development assets including the Spring Valley, Copper World and Santo Domingo projects, all of which have received their major permits.
From 2031 to 2035, attributable production is forecast to be maintained at 1,200,000 GEOs2 annually and incorporates additional incremental production from Pre-development assets including the Cangrejos, Kudz Ze Kayah and Marathon projects, in addition to the Mt. Todd and Black Pine royalties.
Not included in Wheaton’s long-term forecast and instead classified as ‘optionality’, is potential future production from 11 other assets including El Alto3, Navidad and Toroparu.
| 1 | Statements made in this section contain forward-looking information with respect to forecast production, funding outstanding commitments and continuing to acquire accretive mineral stream interests and readers are cautioned that actual outcomes may vary. Please see “Cautionary Note Regarding Forward-Looking Statements” for material risks, assumptions and important disclosures associated with this information. |
| 2 | Ounces produced represent the quantity of silver, gold, palladium, platinum and cobalt contained in concentrate or doré prior to smelting or refining deductions. Gold equivalent forecast production for 2026 and the longer-term outlook are based on the following updated commodity price assumptions: $4,800 per ounce gold, $80 per ounce silver, $1,500 per ounce palladium, $2,000 per ounce of platinum and $25 per pound cobalt. For purposes of comparison, 2025 actual production numbers have been adjusted to reflect 2026 commodity price assumptions. |
| 3 | El Alto was formerly known as Pascua-Lama. |
WHEATON PRECIOUS METALS 2025 ANNUAL REPORT- MANAGEMENT DISCUSSION & ANALYSIS [7]
Mineral Stream Interests
The following table summarizes the mineral stream interests currently owned by the Company:
| Total Upfront Consideration | ||||||||||||||||||||||||||||||||||||||||||
| Mineral Stream Interests |
Mine Owner ¹ |
Location¹ | Attributable Production |
Production Payment Per Unit 2,3 |
Depletion Rate Per Unit ¹ |
Paid to Dec 31, 2025 3 |
To be Paid 2 | Total 3 | Cash Flow Generated to Date 3 |
Q4-2025 PBND 3, 4 |
Term ¹ | |||||||||||||||||||||||||||||||
| Gold |
||||||||||||||||||||||||||||||||||||||||||
| Salobo |
Vale | BRA | 75% | $433 | $404 | $ | 3,573,360 | $ | - | $ | 3,573,360 | $ | 3,519,774 | 79,466 | LOM | |||||||||||||||||||||||||||
| Sudbury 5 |
Vale | CAN | 70% | $400 | $1,399 | 623,572 | - | 623,572 | 373,177 | 12,761 | 20 years 5 | |||||||||||||||||||||||||||||||
| Constancia |
Hudbay | PER | 50% | $429 | $338 | 135,000 | - | 135,000 | 434,418 | 7,240 | LOM | |||||||||||||||||||||||||||||||
| San Dimas |
FM | MEX | variable 6 | $643 | $428 | 220,000 | - | 220,000 | 395,909 | 2,098 | LOM | |||||||||||||||||||||||||||||||
| Stillwater 7 |
Sibanye | USA | 100% | 18% | $570 | 237,880 | - | 237,880 | 118,935 | 4,462 | LOM | |||||||||||||||||||||||||||||||
| Blackwater |
Artemis Gold | CAN | 8% 8 | 35% | $606 | 340,000 | - | 340,000 | 40,543 | 319 | LOM | |||||||||||||||||||||||||||||||
| Platreef |
Ivanhoe | SA | 62.5% 9 | $100 | NP | 275,300 | - | 275,300 | - | - | LOM 9 | |||||||||||||||||||||||||||||||
| Other |
||||||||||||||||||||||||||||||||||||||||||
| Copper World |
Hudbay | USA | 100% | $450 | NP | - | 39,296 | 39,296 | - | - | LOM | |||||||||||||||||||||||||||||||
| Marmato |
Aris | CO | 10.5% 10 | 18% | $527 | 85,416 | 77,584 | 163,000 | 24,630 | 112 | LOM | |||||||||||||||||||||||||||||||
| Santo Domingo |
Capstone | CHL | 100% ¹¹ | 18% | NP | 25,028 | 260,000 | 285,028 | 6,159 | - | LOM | |||||||||||||||||||||||||||||||
| Fenix |
Rio2 | CHL | 22% ¹² | 18% | NP | 150,000 | - | 150,000 | - | - | LOM | |||||||||||||||||||||||||||||||
| El Domo |
Silvercorp | ECU | 50% ¹³ | 18% | NP | 31,981 | 96,655 | 128,636 | 1,203 | - | LOM | |||||||||||||||||||||||||||||||
| Marathon |
Gen Mining | CAN | 100% ¹4 | 18% | NP | 21,857 | 102,145 | 124,002 | - | - | LOM | |||||||||||||||||||||||||||||||
| Goose |
B2Gold | CAN | 2.78% ¹5 | 18% | $1,212 | 83,750 | - | 83,750 | 2,124 | 810 | LOM | |||||||||||||||||||||||||||||||
| Cangrejos |
CMOC | ECU | 4.4% ¹6 | 18% | NP | 32,160 | 168,840 | 201,000 | - | - | LOM | |||||||||||||||||||||||||||||||
| Curraghinalt |
Dalradian | UK | 3.05% ¹7 | 18% | NP | 20,000 | 55,000 | 75,000 | - | - | LOM | |||||||||||||||||||||||||||||||
| Kudz Ze Kayah |
BMC | CAN | 7.375% ¹8 | 20% | NP | 14,760 | 5,400 | 20,160 | - | - | LOM | |||||||||||||||||||||||||||||||
| Koné |
Montage | CIV | 19.5% ¹9 | 20% | NP | 468,750 | 156,250 | 625,000 | - | - | LOM | |||||||||||||||||||||||||||||||
| Kurmuk |
Allied | ETH | 6.7% ²0 | 15% | NP | 175,000 | - | 175,000 | - | - | LOM | |||||||||||||||||||||||||||||||
| Spring Valley |
Waterton Gold | USA | 8% ²¹ | 20% | NP | 50,000 | 620,000 | 670,000 | - | - | LOM | |||||||||||||||||||||||||||||||
| Hemlo |
Hemlo | CAN | 10.13% ²² | 20% | $1,423 | 300,000 | - | 300,000 | - | 1,622 | LOM | |||||||||||||||||||||||||||||||
| $ | 6,863,814 | $ | 1,581,170 | $ | 8,444,984 | $ | 4,916,872 | 108,890 | ||||||||||||||||||||||||||||||||||
| Silver |
||||||||||||||||||||||||||||||||||||||||||
| Peñasquito |
Newmont | MEX | 25% | $4.62 | $5.09 | $ | 485,000 | $ | - | $ | 485,000 | $ | 1,819,088 | 1,105 | LOM | |||||||||||||||||||||||||||
| Antamina |
Glencore | PER | 33.75% ²³ | 20% | $4.39 | 900,000 | - | 900,000 | 949,639 | 1,206 | LOM | |||||||||||||||||||||||||||||||
| Constancia |
Hudbay | PER | 100% | $6.32 | $6.43 | 294,900 | - | 294,900 | 351,874 | 433 | LOM | |||||||||||||||||||||||||||||||
| Blackwater |
Artemis Gold | CAN | 50% 8 | 18% | $7.55 | 170,800 | - | 170,800 | 16,561 | 17 | LOM | |||||||||||||||||||||||||||||||
| Other |
||||||||||||||||||||||||||||||||||||||||||
| Los Filos |
Equinox | MEX | 100% | $4.74 | $0.00 | 4,463 | - | 4,463 | 45,193 | 51 | 25 years 24 | |||||||||||||||||||||||||||||||
| Zinkgruvan |
Boliden | SWE | 100% | $4.81 | $1.00 | 77,866 | - | 77,866 | 606,915 | 172 | LOM | |||||||||||||||||||||||||||||||
| Stratoni |
Eldorado | GRC | 100% | $11.54 | NP | 57,500 | - | 57,500 | 155,868 | - | LOM | |||||||||||||||||||||||||||||||
| Neves-Corvo |
Boliden | PRT | 100% | $4.55 | $1.36 | 35,350 | - | 35,350 | 210,142 | 101 | 50 years ²5 | |||||||||||||||||||||||||||||||
| Aljustrel |
Almina | PRT | 100% 26 | 50% | $0.00 | 2,451 | - | 2,451 | 60,062 | - | 50 years ²5 | |||||||||||||||||||||||||||||||
| El Alto ²7 |
Barrick | CHL/ARG | 25% | $3.90 | NP | 625,000 | - | 625,000 | 372,767 | - | LOM | |||||||||||||||||||||||||||||||
| Copper World |
Hudbay | USA | 100% | $3.90 | NP | - | 191,855 | 191,855 | - | - | LOM | |||||||||||||||||||||||||||||||
| Navidad |
PAAS | ARG | 12.5% | $4.00 | NP | 10,788 | 32,400 | 43,188 | - | - | LOM | |||||||||||||||||||||||||||||||
| Marmato |
Aris | CO | 100% 10 | 18% | $6.60 | 7,600 | 4,400 | 12,000 | 4,295 | 2 | LOM | |||||||||||||||||||||||||||||||
| Cozamin |
Capstone | MEX | 50% ²8 | 10% | $21.62 | 150,000 | - | 150,000 | 77,715 | 133 | LOM | |||||||||||||||||||||||||||||||
| El Domo |
Silvercorp | ECU | 75% ¹³ | 18% | NP | 11,531 | 34,969 | 46,500 | - | - | LOM | |||||||||||||||||||||||||||||||
| Mineral Park |
Waterton | US | 100% | 18% | $12.29 | 115,000 | - | 115,000 | - | 7 | LOM | |||||||||||||||||||||||||||||||
| Kudz Ze Kayah |
BMC | CAN | 6.875% ¹8 | 20% | NP | 26,240 | 9,600 | 35,840 | - | - | LOM | |||||||||||||||||||||||||||||||
| $ | 2,974,489 | $ | 273,224 | $ | 3,247,713 | $ | 4,670,119 | 3,227 | ||||||||||||||||||||||||||||||||||
| Palladium |
||||||||||||||||||||||||||||||||||||||||||
| Stillwater 7 |
Sibanye | USA | 4.5% ²9 | 18% | $492.09 | $ | 262,120 | $ | - | $ | 262,120 | $ | 171,460 | 5,169 | LOM | |||||||||||||||||||||||||||
| Platreef |
Ivanhoe | SA | 5.25% 9 | 30% | NP | 78,700 | - | 78,700 | - | - | LOM 9 | |||||||||||||||||||||||||||||||
| $ | 340,820 | $ | - | $ | 340,820 | $ | 171,460 | 5,169 | ||||||||||||||||||||||||||||||||||
| Platinum |
||||||||||||||||||||||||||||||||||||||||||
| Marathon |
Gen Mining | CAN | 22% ¹4 | 18% | NP | $ | 9,367 | $ | 43,776 | $ | 53,143 | $ | - | - | LOM | |||||||||||||||||||||||||||
| Platreef |
Ivanhoe | SA | 5.25% 9 | 30% | NP | 57,500 | - | 57,500 | - | - | LOM 9 | |||||||||||||||||||||||||||||||
| $ | 66,867 | $ | 43,776 | $ | 110,643 | $ | - | - | ||||||||||||||||||||||||||||||||||
| Cobalt |
||||||||||||||||||||||||||||||||||||||||||
| Voisey’s Bay |
Vale | CAN | 42.4% ³° | 18% | $9.02 | $ | 390,000 | $ | - | $ | 390,000 | $ | 84,040 | 1,341 | LOM | |||||||||||||||||||||||||||
| Total PMPAs Currently Owned |
|
$ | 10,635,990 | $ | 1,898,170 | $ | 12,534,160 | $ | 9,842,491 | |||||||||||||||||||||||||||||||||
| Terminated / Matured PMPAs |
|
1,358,502 | - | $ | 1,358,502 | 3,376,971 | ||||||||||||||||||||||||||||||||||||
| Total |
$ | 11,994,492 | $ | 1,898,170 | $ | 13,892,662 | $ | 13,219,462 | ||||||||||||||||||||||||||||||||||
WHEATON PRECIOUS METALS 2025 ANNUAL REPORT- MANAGEMENT DISCUSSION & ANALYSIS [8]
| 1) | Abbreviations as follows: FM = First Majestic Silver Corp; BMC = BMC Minerals; PAAS = Pan American Silver Corp; Gen Mining = Generation Mining Ltd.; Waterton = Waterton Copper LP.; Waterton Gold = Waterton Gold LP; ARG = Argentina; BRA = Brazil; CAN = Canada; CHL = Chile; CIV = Côte d’Ivoire, CO = Colombia; ECU = Ecuador; ETH = Ethiopia, GRC = Greece; MEX = Mexico; PER = Peru; PRT = Portugal; SA = South Africa; SWE = Sweden; USA = United States; UK = United Kingdom; NP = Not Producing; and LOM = Life of Mine. |
| 2) | Please refer to the section entitled “Contractual Obligations and Contingencies – Mineral Stream Interests” on page 36 of this MD&A for more information. |
| 3) | All figures in thousands except gold and palladium ounces and per ounce amounts. The total upfront consideration paid to date excludes closing costs and capitalized interest, where applicable. Please refer to the section entitled “Other Contractual Obligations and Contingencies” on page 38 of this MD&A for details of when the remaining upfront consideration is forecasted to be paid. Certain contracts, including Santo Domingo and El Domo, contain delay ounce provisions whereby should construction of the mine not be completed by an agreed to date, the mine operator must compensate the Company for the delay until certain conditions are satisfied by delivering additional ounces. The value of these ounces on the date first due, net of amounts owed to the mine operator, is treated as a reduction to the upfront consideration paid. Sale of the resulting ounces received is treated as revenue, with the associated cost of sales being equal to the fair value of the ounces on the date received. |
| 4) | Payable gold, silver, palladium and cobalt PBND are based on management estimates. These figures may be updated in the future as additional information is received. Please see “Cautionary Note Regarding Forward-Looking Statements” for material risks, assumptions and important disclosures associated with this information. |
| 5) | Comprised of the operating Coleman, Copper Cliff, Garson, Creighton, Stobie and Totten gold interests as well as the non-operating Victor gold interest. As of December 31, 2025, the Company has received approximately $373 million of operating cash flows from the Sudbury stream. Should the market value of gold delivered to Wheaton through the 20-year term of the contract, net of the per ounce cash payment, be lower than the initial $670 million refundable deposit, the Company will be entitled to a refund of the difference at the conclusion of the term. The term of the Sudbury PMPA ends on May 11, 2033. |
| 6) | The original San Dimas SPA, entered into on October 15, 2004, was terminated on May 10, 2018 and concurrently the Company entered into the new San Dimas PMPA. Under the terms of the San Dimas PMPA, the Company is entitled to an amount equal to 25% of the payable gold production plus an additional amount of gold equal to 25% of the payable silver production converted to gold at a fixed gold to silver exchange ratio of 70:1 from the San Dimas mine. If the average gold to silver price ratio decreases to less than 50:1 or increases to more than 90:1 for a period of 6 months or more, then the “70” shall be revised to “50” or “90”, as the case may be, until such time as the average gold to silver price ratio is between 50:1 to 90:1 for a period of 6 months or more in which event the “70” shall be reinstated. During the period of April 30, 2025 to October 28, 2025, the fixed gold to silver exchange ratio was revised from 70:1 to 90:1. The current gold to silver price ratio is 70:1. |
| 7) | Comprised of the Stillwater and East Boulder gold and palladium interests. |
| 8) | Once the Company has received 464,000 ounces of gold under the amended Blackwater Gold PMPA, the attributable gold production will be reduced to 4%. Once the Company has received 17.8 million ounces of silver under the Blackwater Silver PMPA, the attributable silver production will be reduced to 33%. |
| 9) | Once the Company has received 218,750 ounces of gold under the Platreef Gold PMPA, the attributable gold production will reduce to 50% until 428,300 ounces have been delivered, after which the stream drops to 3.125%. Under the Platreef Palladium and Platinum PMPA, once the Company has received 350,000 ounces of combined palladium and platinum, the attributable palladium and platinum production will reduce to 3% until 485,115 ounces have been delivered, after which the stream drops to 0.1% of the payable palladium and platinum production. If certain thresholds are met, including if production through the Platreef project concentrator achieves 5.5 million tonnes per annum (“Mtpa”), the 3.125% residual gold stream and the 0.1% residual palladium and platinum stream will terminate. Under the Platreef Gold PMPA, a subsidiary of Royal Gold Inc. (formerly Sandstorm Gold Ltd./Nomad Royalty Ltd.) (“Royal Gold”) is entitled to purchase 37.5% of payable gold. The decrease in the percentage of payable metal that Wheaton will be entitled to purchase is conditional on delivery of the total amount of payable gold to all purchasers (Wheaton and Royal Gold combined). The values set out herein pertain only to Wheaton’s share of the payable gold. |
| 10) | Once the Company has received 310,000 ounces of gold and 2.15 million ounces of silver under the Marmato PMPA, the attributable gold and silver production will be reduced to 5.25% and 50%, respectively. |
| 11) | Once the Company has received 285,000 ounces of gold under the Santo Domingo PMPA, the Company’s attributable gold production will be reduced to 67%. The units sold under Santo Domingo relate to ounces received due to the delay ounce provision (see footnote 3, above). |
| 12) | On October 21, 2024, the Company amended the Fenix PMPA. Under the original agreement, the Company was to acquire an amount of gold equal to 6% of the gold production until 90,000 ounces have been delivered, 4% of the gold production until the delivery of a further 140,000 ounces and 3.5% gold production thereafter for the life of mine. Under the revised agreement, the Company is entitled to purchase an additional 16% of payable gold production (22% in total) (subject to adjustment if there are delays in deliveries relative to an agreed schedule). Once Rio2 delivers the incremental 95,000 ounces (as adjusted), the stream reverts to the percentages and thresholds under the original Fenix PMPA (as described). Rio2 has a one-time option to terminate the requirement to deliver the incremental gold production from the end of 2027 until the end of 2029 by delivering 95,000 ounces (as adjusted) less previously delivered gold ounces, excluding those gold ounces which would have been delivered under the original Fenix PMPA. |
| 13) | Once the Company has received 145,000 ounces of gold under the El Domo PMPA, the attributable gold production will be reduced to 33%, and once the Company has received 4.6 million ounces of silver, the attributable silver production will be reduced to 50%. The units sold under El Domo relate to ounces received due to the delay ounce provision (see footnote 3, above). |
| 14) | Once the Company has received 150,000 ounces of gold and 120,000 ounces of platinum under the Marathon PMPA, the attributable gold and platinum production will be reduced to 67% and 15%. |
| 15) | Once the Company has received 87,100 ounces of gold under the Goose PMPA, the Company’s attributable gold production will be 1.44%, and once the Company has received 134,000 ounces of gold under the agreement, the Company’s attributable gold production will be reduced to 1.0%. |
| 16) | During Q3 2025, in connection with its acquisition of Lumina Gold Corp., CMOC exercised its 33% buy-back option under the Cangrejos PMPA for a cash payment of $102 million, resulting in a gain of $86 million on partial disposal of the Cangrejos PMPA. In connection with the exercise of the option, once the Company has received 469,000 ounces of gold under the Cangrejos PMPA, the Company’s attributable gold production will be reduced to 2.9%. |
| 17) | Once the Company has received 125,000 ounces of gold under the Curraghinalt PMPA, the Company’s attributable gold production will be reduced to 1.5%. |
| 18) | Once the Company has received 330,000 ounces of gold and 43.30 million ounces of silver under the Kudz Ze Kayah PMPA, the Company’s attributable gold and silver production will be reduced to 6.125%, with a further reduction to 5.5% until the Company has received an additional 59,800 ounces of gold and 7.96 million ounces of silver, with a further reduction to 5.5% until the Company has received an additional 270,200 ounces of gold and 35.34 million ounces of silver, thereafter increased to 6.75%. |
| 19) | Once the Company has received 400,000 ounces of gold under the Koné PMPA, subject to adjustment if there are delays in deliveries relative to an agreed schedule, the attributable gold production will reduce to 10.8% until an additional 130,000 ounces of gold has been delivered, after which the stream drops to 5.4%. |
| 20) | Once the Company has received 220,000 ounces of gold under the Kurmuk PMPA, the Company’s attributable gold production will be reduced to 4.8%. During any period in which debt exceeding $150 million ranks ahead of the gold stream, the stream percentage increases to 7.15% and decreases to 5.25% once the drop-down threshold is reached. |
| 21) | Once the Company has received 300,000 ounces of gold under the Spring Valley PMPA, the Company’s attributable gold production will be reduced to 6%. |
| 22) | Once the Company has received 135,750 ounces of gold under the Hemlo PMPA (the “First Dropdown Threshold”), the Company’s attributable gold production will be reduced to 6.75% until an additional 117,998 ounces of gold has been delivered (the “Second Dropdown Threshold”), at which point the Company’s attributable gold production will be 4.50% for the life of the mine. Each of the First Dropdown Threshold and the Second Dropdown Threshold will be subject to adjustment if there are delays in deliveries relative to an agreed schedule, and commencing in 2033, if deliveries fall behind the agreed schedule by 10,000 ounces or more, the stream percentage will be increased by 5% until deliveries catch up with the agreed schedule. The payable gold will be reduced by half with respect to gold production from certain claims comprising the Interlake deposit. |
| 23) | Once Wheaton has received 140 million ounces of silver under the Antamina PMPA, the Company’s attributable silver production will be reduced to 22.5%. |
| 24) | The term of the Los Filos PMPA ends on October 15, 2029. |
| 25) | The term of the Neves-Corvo and Aljustrel PMPAs ends on June 5, 2057. |
| 26) | Wheaton only has the rights to silver contained in concentrate containing less than 15% copper at the Aljustrel mine. |
| 27) | Previously referred to as Pascua-Lama in this MD&A. |
| 28) | Once Wheaton has received 10 million ounces of silver under the Cozamin PMPA, the Company’s attributable silver production will be reduced to 33%. |
| 29) | Once the Company has received 375,000 ounces of palladium under the Stillwater PMPA, the Company’s attributable palladium production will be reduced to 2.25%, and once the Company has received 550,000 ounces of palladium under the agreement, the Company’s attributable palladium production will be reduced to 1%. |
| 30) | Once the Company has received 31 million pounds of cobalt under the Voisey’s Bay PMPA, the Company’s attributable cobalt production will be reduced to 21.2%. |
Significant amendments and acquisitions (if any) of mineral stream interests during Q4 2025 are outlined below. The percentage of payable production and other key PMPA terms for all mineral stream interests are described in the Contractual Obligations and Contingencies section of this MD&A starting on page 36 of the MD&A.
Acquisition of Mineral Stream Interests
Spring Valley
On November 6, 2025, the Company entered into a PMPA (the “Spring Valley PMPA”) with Waterton Gold Corp., a subsidiary of Waterton Gold LP (“Waterton Gold”), in respect of gold production from the Spring Valley project located
WHEATON PRECIOUS METALS 2025 ANNUAL REPORT- MANAGEMENT DISCUSSION & ANALYSIS [9]
in Nevada, USA (“Spring Valley project”). Under the terms of the Spring Valley PMPA, the Company is committed to pay Waterton Gold total upfront cash consideration of $670 million in installments as various conditions are satisfied, with the initial payment being paid on December 11, 2025. The Company has also provided a cost overrun facility (the “Spring Valley Facility”) of up to $150 million, accessible during an availability period commencing once the full upfront consideration has been paid under the Spring Valley PMPA. The Spring Valley Facility has a maturity date of three years following the first drawdown under the Spring Valley Facility.
Hemlo
On November 26, 2025, the Company entered into a PMPA (the “Hemlo PMPA”) with Hemlo in respect of gold production from the currently operating Hemlo mine located in Ontario, Canada. Under the terms of the Hemlo PMPA, which will deliver immediate production and cash flow to the Company, the Company paid Hemlo total upfront cash consideration of $300 million.
As part of its financing commitment, on October 7, 2025 the Company invested $30 million (Cdn$42 million) in Hemlo’s equity offering.
Antamina
On February 16, 2026, the Company announced it had entered into a definitive PMPA with BHP (the “BHP Antamina PMPA”) for their 33.75% portion of the silver produced at the Antamina Mine located in Peru. Upon closing, Wheaton will receive a combined 67.5% of all the silver produced from Antamina, up from the 33.75% currently delivered under the existing Glencore silver stream.
Under the terms of the BHP Antamina PMPA, the Company will pay BHP total upfront cash consideration of $4.3 billion on closing, subject to certain customary conditions. Additionally, the Company will make ongoing payments for the silver ounces delivered equal to 20% of the spot price of silver. The BHP Antamina PMPA is effective April 1, 2026, from which time the Company will purchase BHP’s 33.75% of the payable silver until a total of 100 million ounces has been delivered, at which point the Company will purchase 22.5% of the payable silver for the life of mine. Payable silver will be calculated using a fixed payable factor of 90.0%.
Updates on the Operating Mineral Stream Interests
Peñasquito
On February 19, 2026, Newmont Corporation (“Newmont”) reported that silver production at Peñasquito is expected to increase in 2026, largely due to grades milled, including increased stockpile processing in 2026.
Constancia
On February 20, 2026, Hudbay announced that Constancia is expected to deliver at higher mill throughput rates starting in the second half of 2026 with the installation of pebble crushers. 2026 gold production is expected to be lower than 2025 production, reflecting the depletion of Pampacancha, a satellite open pit deposit that has been a source of higher grade gold ore, in 2025.
Blackwater
On December 15, 2025, Artemis Gold announced that its board of directors approved an expanded Phase 2 development at the Blackwater mine. This Phase 2 development is a significant addition to the previously announced Phase 1A project, designed to increase nameplate capacity from 8 Mtpa to 21 Mtpa before the end of 2028.
On March 12, 2026, Artemis Gold reported an unplanned mill shutdown due to the failure of a ball mill gearbox, with the estimated time to complete repairs and restart mill operations between 8 to 10 days. Artemis Gold reports that plans are underway to make use of this interruption to carry out maintenance activities originally planned for Q2 2026. Artemis Gold notes that while mining related activities are continuing normally, production in Q1 2026 is expected to be lower than originally anticipated as a result of this mill outage.
Goose
On October 6, 2025, B2Gold announced that the Goose mine achieved commercial production on October 2, 2025. On February 18, 2026, B2Gold reported that production at the Goose mine in 2025 was impacted by crushing plant capacity constraints in the third quarter and temporary delays in accessing higher-grade ore from the Umwelt underground in the third quarter and early fourth quarter. Initial near-term crushing circuit modifications, ordered in late 2025 and scheduled for implementation in the second half of 2026, are expected to increase average throughput to approximately 3,200 tonnes per day and eliminate the need for full-time use of the mobile crusher, while studies are underway to evaluate further enhancements to increase capacity to approximately 4,000 tonnes per day, with decisions on scope and timing expected in the first half of 2026. B2Gold also states that production in 2026 is expected to be weighted to the second half of 2026, with approximately 65% of estimated annual gold production to be achieved during the third and fourth quarters.
WHEATON PRECIOUS METALS 2025 ANNUAL REPORT- MANAGEMENT DISCUSSION & ANALYSIS [10]
Marmato
On March 11, 2026, Aris reported that development of the new underground decline to the Bulk Mining Zone at the Marmato mine is approximately 60% complete and is scheduled for completion in Q3 2026, ahead of the commissioning of the carbon in pulp plant, which is expected in Q4 2026.
Hemlo
On January 29, 2026 Hemlo announced that they had initiated a 130,000 meter exploration drilling program aimed at extending the mine life, de-risking the near-term mine plan and identifying near-mine growth opportunities.
Updates on the Development Stage Mineral Stream Interests
Mineral Park
During the quarter, Waterton Copper continued ore commissioning of the newly refurbished concentrator at its Mineral Park project. The ramp-up efforts in Q4 2025 were focused on mill alignment to handle increasing throughput and gradually increasing both operating uptime and overall site throughput. First concentrate sales occurred in Q4 2025 and first silver delivery to Wheaton occurred in January 2026. Ramp-up to commercial production is expected to continue in Q1 2026, with increasing concentrate production throughout the first quarter. At steady state throughput, the fully refurbished mill capacity will be 16.5 Mtpa.
Platreef
On January 12, 2026, Ivanhoe announced that following the official opening and first production of concentrate from the Platreef mine on November 18, 2025, the development of the mine continues to rapidly advance. During the initial ramp-up period, lower-grade development ore is being processed, with a transition to production ore expected once Shaft #3 is ready to hoist in early Q2 2026, with the concentrator expected to achieve approximately 80 percent of nameplate capacity by mid-year.
Fenix
On January 26, 2026, Rio2 announced the first official gold pour at the Fenix Gold Mine, where construction of critical path items were completed on time and on budget, as previously guided. Rio2 states that the focus now is to ramp up operations to 20,000 tonnes per day of ore.
Kurmuk
On February 18, 2026, Allied reported that the Kurmuk project was progressing in line with plan, with advancement at the processing plant and crushing circuit, mining activities supporting ore stockpiling, and power line construction advancing toward completion ahead of commissioning. A review of processing capacity was completed in Q4 2025, and the project is now being executed to accommodate average throughput of up to 6.4 Mtpa (from 6.0 Mtpa), with pre-commissioning expected in 2026.
On January 26, 2026, Allied announced it has entered into a definitive agreement with Zijin Gold International Company Limited (“Zijin Gold”), where Zijin Gold will acquire all of the issued and outstanding shares of Allied in cash. Subject to the satisfaction or waiver by the parties of all necessary closing conditions and the receipt of all required approvals, the completion of the transaction is anticipated in late April 20261.
Koné
On January 19, 2026, Montage announced that rapid construction progress continues to be made at the Koné project, where first gold pour through the oxide circuit is anticipated in late Q4 2026, while the hard-rock comminution circuit remains on track for completion in Q2 2027. Since commencement of the project, key milestones achieved include the erection of all 14 carbon-in-leach tanks, piperack and grid mesh walkways, completion of the oxide sizer and the delivery of the ball mill to site.
El Domo
On February 4, 2026, Silvercorp Metals Inc. (“Silvercorp”) reported that during 2025, construction activities at its El Domo project advanced across site preparation, infrastructure, and water management works, with approximately $44.5 million spent (about 16% of their revised budget), including completion of archaeological clearance, significant earthworks and road construction, camp commissioning, and placement of orders for long-lead time major equipment. Silvercorp reports that the El Domo Project is now scheduled to be in production in 2027.
Copper World
On January 12, 2026, Hudbay announced the closing of the joint venture transaction with Mitsubishi Corporation, securing a premier, long-term strategic partner for the development of Copper World. Hudbay notes that they intend
| 1 | Under the terms of the Kurmuk PMPA, within 30 days of a change of control Allied has a one-time option to repurchase one-third of the gold stream. |
WHEATON PRECIOUS METALS 2025 ANNUAL REPORT- MANAGEMENT DISCUSSION & ANALYSIS [11]
to complete the definitive feasibility study at Copper World in mid-2026 with final sanctioning decision expected in 2026.
Santo Domingo
On February 17, 2026, Capstone Copper Corp. (“Capstone”) reported that they plan to progress the financing strategy, detailed engineering and infrastructure optimization opportunities at its Santo Domingo project towards a sanctioning decision expected in the second half of 2026.
Early Deposit Mineral Stream Interests
Early deposit mineral stream interests represent agreements relative to early-stage development projects whereby Wheaton can choose not to proceed with the agreement once certain documentation has been received including, but not limited to, feasibility studies, environmental studies and impact assessment studies. Once Wheaton has elected to proceed with the agreement, the carrying value of the stream will be transferred to Mineral Stream Interests.
The following table summarizes the early deposit mineral stream interests currently owned by the Company:
| Attributable Production to be Purchased |
||||||||||||||||||||||||||||||||||||
| Early Deposit Mineral Stream Interests |
Mine Owner |
Location of Mine |
Upfront Consideration Paid to Date 1 |
Upfront Consideration to be Paid 1, 2 |
Total Upfront Consideration¹ |
Gold | Silver | Term of Agreement |
Date of Original Contract |
|||||||||||||||||||||||||||
| Toroparu |
Aris Mining | Guyana | $ | 15,500 | $ | 138,000 | $ | 153,500 | 10% | 50% | Life of Mine | 11-Nov-13 | ||||||||||||||||||||||||
| Cotabambas |
Panoro | Peru | 14,000 | 126,000 | 140,000 | 25% ³ | 100% ³ | Life of Mine | 21-Mar-16 | |||||||||||||||||||||||||||
| Kutcho |
Kutcho | Canada | 16,852 | 58,000 | 74,852 | 100% | 100% | Life of Mine | 14-Dec-17 | |||||||||||||||||||||||||||
| $ | 46,352 | $ | 322,000 | $ | 368,352 | |||||||||||||||||||||||||||||||
| 1) | Expressed in thousands; excludes closing costs and capitalized interest, where applicable. |
| 2) | Please refer to the section entitled “Other Contractual Obligations and Contingencies” on page 38 of this MD&A for details of when the remaining upfront consideration is forecast to be paid. |
| 3) | Once 90 million silver equivalent ounces attributable to Wheaton have been produced, the attributable production will decrease to 16.67% of gold production and 66.67% of silver production for the life of mine. |
Mineral Royalty Interests
The following table summarizes the mineral royalty interests owned by the Company as at December 31, 2025:
| Royalty Interests | Mine Owner |
Location of Mine |
Royalty 1 | Total Upfront Consideration 2 |
Term of Agreement |
Date of Original Contract |
||||||||||||||||||
| Metates |
Chesapeake | Mexico | 0.5% NSR | $ | 3,000 | Life of Mine | 07-Aug-2014 | |||||||||||||||||
| Brewery Creek 3 |
Victoria Gold | Canada | 2.0% NSR | 3,529 | Life of Mine | 04-Jan-2021 | ||||||||||||||||||
| Black Pine 4 |
Liberty Gold | USA | 0.5% NSR | 3,600 | Life of Mine | 10-Sep-2023 | ||||||||||||||||||
| Mt Todd 5 |
Vista | Australia | 1.0% GR | 20,000 | Life of Mine | 13-Dec-2023 | ||||||||||||||||||
| DeLamar 6 |
Integra | USA | 1.5% NSR | 9,750 | Life of Mine | 20-Feb-2024 | ||||||||||||||||||
| $ | 39,879 | |||||||||||||||||||||||
| 1) | Abbreviation as follows: NSR = Net Smelter Return Royalty; and GR = Gross Royalty. |
| 2) | Expressed in thousands; excludes closing costs. |
| 3) | The Company paid $3 million for an existing 2.0% net smelter return royalty interests on the first 600,000 ounces of gold mined and a 2.75% net smelter returns royalty interest thereafter. The Brewery Creek Royalty agreement provides, among other things, that Golden Predator Mining Corp., (subsidiary of Victoria Gold) may reduce the 2.75% net smelter royalty interest to 2.125% on payment of the sum of Cdn$2 million to the Company. On August 14, 2024, the Ontario Superior Court of Justice placed Victoria Gold Corp into receivership following the failure of the heap leach pad at its Eagle Mine in June, 2024. |
| 4) | Liberty Gold has been granted an option to repurchase 50% of the NSR for $4 million at any point in time up to the earlier of commercial production at Black Pine or January 1, 2030. |
| 5) | The Mt Todd royalty is at a rate of 1% of gross revenue with such rate being subject to increase to a maximum rate of 2%, depending on the timing associated with the achievement of certain operational milestones. |
| 6) | Under the DeLamar royalty, if completion is not achieved by January 1, 2029, the DeLamar royalty will increase annually by 0.15% of net smelter returns to a maximum of 2.7% of net smelter returns. |
Mt Todd
On January 13, 2026, Vista Gold Corp. announced continued progress at the Mt Todd gold project and outlined the pathway to initiate detailed engineering and design by early 2027. The focus for 2026 is to obtain permit modifications to align existing approved permits with the 2025 Feasibility Study, expand corporate capability to lead project development and address recommendations presented in the feasibility study that will provide key inputs for detailed engineering and design.
WHEATON PRECIOUS METALS 2025 ANNUAL REPORT- MANAGEMENT DISCUSSION & ANALYSIS [12]
Long-Term Equity Investments
The Company will, from time to time, invest in securities of companies for strategic purposes including, but not limited to, exploration and mining companies. The Company held the following investments as at December 31, 2025 and December 31, 2024:
| (in thousands) | December 31 2025 |
December 31 2024 |
||||||
| Common shares held |
$ | 407,230 | $ | 98,190 | ||||
| Warrants held |
3,265 | 785 | ||||||
| Total long-term equity investments |
$ | 410,495 | $ | 98,975 | ||||
The Company’s long-term investments in common shares (“LTIs”) are held for long-term strategic purposes and not for trading purposes. As such, the Company has elected to reflect any fair value adjustments, net of tax, as a component of other comprehensive income (“OCI”). The cumulative gain or loss will not be reclassified to net earnings on disposal of these LTIs but is reclassified to retained earnings.
While long-term investments in warrants are also held for long-term strategic purposes, they meet the definition of a derivative and therefore are classified as financial assets with fair value adjustments being recorded as a component of net earnings under the classification Other Income (Expense). Warrants that do not have a quoted market price are valued using a Black-Scholes option pricing model.
By holding these long-term investments, the Company is inherently exposed to various risk factors including currency risk, market price risk and liquidity risk.
A summary of the fair value of these equity investments and the fair value changes recognized as a component of the Company’s OCI during the three months and year ended December 31, 2025 and 2024 is presented below. Please see the Liquidity and Capital Resources on page 31 of this MD&A for more information.
Common Shares Held
| Three Months Ended December 31, 2025 | ||||||||||||||||||||||||
| (in thousands) | Fair Value at Sep 30, 2025 |
Additions | Disposals | Fair Value Adjustment Gains 1 |
Fair Value at Dec 31, 2025 |
Realized Gain on Disposal |
||||||||||||||||||
|
|
||||||||||||||||||||||||
| Streaming or royalty partners |
$ | 244,312 | $ | 30,147 | $ | - | $ | 108,169 | $ | 382,628 | $ | - | ||||||||||||
| Strategic investments |
18,100 | - | - | 6,502 | 24,602 | - | ||||||||||||||||||
|
|
||||||||||||||||||||||||
| Total |
$ | 262,412 | $ | 30,147 | $ | - | $ | 114,671 | $ | 407,230 | $ | - | ||||||||||||
|
|
||||||||||||||||||||||||
| 1) | Fair Value Gains (Losses) are reflected as a component of Other Comprehensive Income (“OCI”). |
| Three Months Ended December 31, 2024 | ||||||||||||||||||||||||
| (in thousands) | Fair Value at Sep 30, 2024 |
Additions | Disposals | Fair Value Adjustment Losses 1 |
Fair Value at Dec 31, 2024 |
Realized Gain on |
||||||||||||||||||
|
|
||||||||||||||||||||||||
| Streaming or royalty partners |
$ | 97,037 | $ | 18,409 | $ | - | $ | (21,531 | ) | $ | 93,915 | $ | - | |||||||||||
| Strategic investments |
4,336 | 346 | - | (407 | ) | 4,275 | - | |||||||||||||||||
|
|
||||||||||||||||||||||||
| Total |
$ | 101,373 | $ | 18,755 | $ | - | $ | (21,938 | ) | $ | 98,190 | $ | - | |||||||||||
|
|
||||||||||||||||||||||||
| 1) | Fair Value Gains (Losses) are reflected as a component of OCI. |
WHEATON PRECIOUS METALS 2025 ANNUAL REPORT- MANAGEMENT DISCUSSION & ANALYSIS [13]
| Year Ended December 31, 2025 | ||||||||||||||||||||||||
| (in thousands) | Fair Value at Dec 31, 2024 |
Additions | Disposals | Fair Value Adjustment Gains 1 |
Fair Value at Dec 31, 2025 |
Realized Gain on Disposal |
||||||||||||||||||
|
|
||||||||||||||||||||||||
| Streaming or royalty partners |
$ | 93,915 | $ | 37,927 | $ | - | $ | 250,786 | $ | 382,628 | $ | - | ||||||||||||
| Strategic investments |
4,275 | 8,386 | - | 11,941 | 24,602 | - | ||||||||||||||||||
|
|
||||||||||||||||||||||||
| Total |
$ | 98,190 | $ | 46,313 | $ | - | $ | 262,727 | $ | 407,230 | $ | - | ||||||||||||
|
|
||||||||||||||||||||||||
| 1) | Fair Value Gains (Losses) are reflected as a component of OCI. |
| Year Ended December 31, 2024 | ||||||||||||||||||||||||
| (in thousands) | Fair Value at Dec 31, 2023 |
Additions | Disposals | Fair Value Adjustment Gains (Losses) 1 |
Fair Value at Dec 31, 2024 |
Realized (Loss) Gain on Disposal |
||||||||||||||||||
|
|
||||||||||||||||||||||||
| Streaming or royalty partners |
$ | 75,481 | $ | 36,275 | $ | (12,018 | ) | $ | (5,823) | $ | 93,915 | $ | (3,543) | |||||||||||
| Strategic investments |
170,545 | 346 | (177,088 | ) | 10,472 | 4,275 | 35,768 | |||||||||||||||||
|
|
||||||||||||||||||||||||
| Total |
$ | 246,026 | $ | 36,621 | $ | (189,106 | ) | $ | 4,649 | $ | 98,190 | $ | 32,225 | |||||||||||
|
|
||||||||||||||||||||||||
| 1) | Fair Value Gains (Losses) are reflected as a component of OCI. |
WHEATON PRECIOUS METALS 2025 ANNUAL REPORT- MANAGEMENT DISCUSSION & ANALYSIS [14]
Summarized Financial Results
| Dec 31, 2025 | Dec 31, 2024 |
Dec 31, 2023 |
||||||||||
| Attributable precious metal production |
||||||||||||
| Gold ounces |
416,171 | 381,248 | 375,371 | |||||||||
| Silver ounces (000’s) |
22,289 | 20,959 | 17,191 | |||||||||
| Palladium ounces |
10,265 | 15,632 | 15,800 | |||||||||
| Cobalt pounds (000’s) |
2,460 | 1,289 | 673 | |||||||||
| GEOs 1 |
689,864 | 635,488 | 583,000 | |||||||||
| Precious metal sales |
||||||||||||
| Gold ounces |
411,005 | 332,701 | 327,336 | |||||||||
| Silver ounces (000’s) |
19,796 | 16,072 | 14,326 | |||||||||
| Palladium ounces |
9,356 | 17,270 | 13,919 | |||||||||
| Cobalt pounds (000’s) |
1,632 | 970 | 1,074 | |||||||||
| GEOs 1 |
651,311 | 529,493 | 503,293 | |||||||||
| Average realized price |
||||||||||||
| Gold per ounce |
$ | 3,494 | $ | 2,393 | $ | 1,968 | ||||||
| Silver per ounce |
$ | 42.26 | $ | 28.49 | $ | 23.64 | ||||||
| Palladium per ounce |
$ | 1,126 | $ | 984 | $ | 1,329 | ||||||
| Cobalt per pound |
$ | 19.11 | $ | 14.18 | $ | 13.81 | ||||||
| GEO 1 |
$ | 3,554 | $ | 2,426 | $ | 2,019 | ||||||
| Average cash cost 2 |
||||||||||||
| Gold per ounce |
$ | 479 | $ | 440 | $ | 455 | ||||||
| Silver per ounce |
$ | 6.58 | $ | 4.98 | $ | 5.05 | ||||||
| Palladium per ounce |
$ | 195 | $ | 179 | $ | 241 | ||||||
| Cobalt per pound 3 |
$ | 3.57 | $ | 2.71 | $ | 3.30 | ||||||
| GEO 1 |
$ | 514 | $ | 438 | $ | 453 | ||||||
| Average depletion 4 |
||||||||||||
| Gold per ounce |
$ | 448 | $ | 419 | $ | 382 | ||||||
| Silver per ounce |
$ | 5.30 | $ | 5.64 | $ | 4.82 | ||||||
| Palladium per ounce |
$ | 458 | $ | 434 | $ | 441 | ||||||
| Cobalt per pound |
$ | 9.08 | $ | 12.78 | $ | 13.41 | ||||||
| GEO 1 |
$ | 473 | $ | 472 | $ | 426 | ||||||
| Total revenue ($000’s) |
$ | 2,314,600 | $ | 1,284,639 | $ | 1,016,045 | ||||||
| Net earnings ($000’s) |
$ | 1,471,720 | $ | 529,140 | $ | 537,644 | ||||||
| Earnings per share |
||||||||||||
| Basic |
$ | 3.242 | $ | 1.167 | $ | 1.177 | ||||||
| Diluted |
$ | 3.237 | $ | 1.165 | $ | 1.176 | ||||||
| Adjusted net earnings 5 ($000’s) |
$ | 1,372,862 | $ | 640,170 | $ | 533,051 | ||||||
| Adjusted earnings per share 5 |
||||||||||||
| Basic |
$ | 3.025 | $ | 1.412 | $ | 1.177 | ||||||
| Diluted |
$ | 3.019 | $ | 1.410 | $ | 1.176 | ||||||
| Cash flow from operations ($000’s) |
$ | 1,904,981 | $ | 1,027,581 | $ | 750,809 | ||||||
| Dividends |
||||||||||||
| Dividends paid ($000’s) |
$ | 299,595 | $ | 281,166 | $ | 271,744 | ||||||
| Dividends paid per share |
$ | 0.66 | $ | 0.62 | $ | 0.60 | ||||||
| Total assets ($000’s) |
$ | 9,125,781 | $ | 7,424,457 | $ | 7,031,185 | ||||||
| Total non-current financial liabilities ($000’s) |
$ | 278,792 | $ | 135,225 | $ | 19,362 | ||||||
| Total other liabilities ($000’s) |
$ | 156,481 | $ | 29,853 | $ | 26,307 | ||||||
| Shareholders’ equity ($000’s) |
$ | 8,690,508 | $ | 7,259,379 | $ | 6,985,516 | ||||||
| Shares outstanding |
454,033,830 | 453,677,299 | 453,069,254 | |||||||||
| 1) | GEOs, which are provided to assist the reader, are based on the following commodity price assumptions: $2,600 per ounce gold; $30.00 per ounce silver; $950 per ounce palladium; and $13.50 per pound cobalt; consistent with those used in estimating the Company’s production guidance for 2025. |
| 2) | Refer to discussion on non-GAAP measure (iii) on page 48 of this MD&A. |
| 3) | Cash cost per pound of cobalt sold during 2023 was net of a previously recorded inventory write-down of $1.6 million, resulting in a decrease of $0.91 per pound sold. |
| 4) | Includes the non-cash per ounce cost of sale associated with delay ounces. Please see footnote 3 on page 9 of this MD&A for more information. |
| 5) | Refer to discussion on non-GAAP measure (i) on page 46 of this MD&A. |
WHEATON PRECIOUS METALS 2025 ANNUAL REPORT- MANAGEMENT DISCUSSION & ANALYSIS [15]
Summary of Units Produced
|
Q4 2025 |
Q3 2025 | Q2 2025 | Q1 2025 | Q4 2024 | Q3 2024 | Q2 2024 | Q1 2024 | |||||||||||||||||||||||||
| Gold ounces produced ² |
||||||||||||||||||||||||||||||||
| Salobo |
88,907 | 66,997 | 69,418 | 71,384 | 84,291 | 62,689 | 63,225 | 61,622 | ||||||||||||||||||||||||
| Sudbury 3 |
7,808 | 4,852 | 5,403 | 4,880 | 5,259 | 3,593 | 4,477 | 5,618 | ||||||||||||||||||||||||
| Constancia |
15,396 | 12,797 | 4,604 | 4,876 | 18,727 | 10,760 | 6,269 | 14,316 | ||||||||||||||||||||||||
| San Dimas 4 |
8,206 | 7,507 | 6,987 | 8,416 | 7,263 | 6,882 | 7,089 | 7,542 | ||||||||||||||||||||||||
| Stillwater 5 |
1,518 | 1,717 | 1,654 | 1,339 | 2,166 | 2,247 | 2,099 | 2,637 | ||||||||||||||||||||||||
| Blackwater |
5,479 | 4,879 | 4,050 | 1,017 | - | - | - | - | ||||||||||||||||||||||||
| Other |
||||||||||||||||||||||||||||||||
| Marmato |
705 | 807 | 748 | 757 | 622 | 648 | 584 | 623 | ||||||||||||||||||||||||
| Goose |
1,027 | 387 | 19 | - | - | - | - | - | ||||||||||||||||||||||||
| Hemlo |
1,630 | - | - | - | - | - | - | - | ||||||||||||||||||||||||
| Total Other |
3,362 | 1,194 | 767 | 757 | 622 | 648 | 584 | 623 | ||||||||||||||||||||||||
| Total gold ounces produced |
130,676 | 99,943 | 92,883 | 92,669 | 118,328 | 86,819 | 83,743 | 92,358 | ||||||||||||||||||||||||
| Silver ounces produced 2 |
||||||||||||||||||||||||||||||||
| Peñasquito |
1,821 | 2,087 | 2,103 | 1,754 | 2,465 | 1,785 | 2,263 | 2,643 | ||||||||||||||||||||||||
| Antamina |
1,600 | 1,672 | 1,482 | 1,047 | 1,071 | 931 | 1,013 | 806 | ||||||||||||||||||||||||
| Constancia |
731 | 577 | 552 | 555 | 970 | 648 | 451 | 640 | ||||||||||||||||||||||||
| Blackwater |
148 | 136 | 138 | 35 | - | - | - | - | ||||||||||||||||||||||||
| Other |
||||||||||||||||||||||||||||||||
| Los Filos 6 |
- | - | - | 68 | 29 | 26 | 27 | 48 | ||||||||||||||||||||||||
| Zinkgruvan |
513 | 688 | 684 | 585 | 637 | 537 | 699 | 641 | ||||||||||||||||||||||||
| Neves-Corvo |
549 | 431 | 449 | 459 | 494 | 425 | 432 | 524 | ||||||||||||||||||||||||
| Aljustrel 7 |
516 | 180 | - | - | - | - | - | - | ||||||||||||||||||||||||
| Cozamin |
170 | 169 | 174 | 174 | 192 | 185 | 177 | 173 | ||||||||||||||||||||||||
| Marmato |
8 | 10 | 8 | 8 | 7 | 7 | 6 | 7 | ||||||||||||||||||||||||
| Mineral Park |
8 | - | - | - | - | - | - | - | ||||||||||||||||||||||||
| Total Other |
1,764 | 1,478 | 1,315 | 1,294 | 1,359 | 1,180 | 1,341 | 1,393 | ||||||||||||||||||||||||
| Total silver ounces produced |
6,064 | 5,950 | 5,590 | 4,685 | 5,865 | 4,544 | 5,068 | 5,482 | ||||||||||||||||||||||||
| Palladium ounces produced ² |
||||||||||||||||||||||||||||||||
| Stillwater 5 |
2,519 | 2,650 | 2,435 | 2,661 | 2,797 | 4,034 | 4,338 | 4,463 | ||||||||||||||||||||||||
| Cobalt pounds produced ² |
||||||||||||||||||||||||||||||||
| Voisey’s Bay |
670 | 604 | 647 | 540 | 393 | 397 | 259 | 240 | ||||||||||||||||||||||||
| GEOs produced 8 |
205,037 | 172,697 | 161,630 | 150,500 | 189,059 | 142,787 | 145,151 | 158,490 | ||||||||||||||||||||||||
| Average payable rate 2 |
||||||||||||||||||||||||||||||||
| Gold |
95.0% | 94.6% | 95.2% | 94.9% | 95.3% | 95.0% | 95.0% | 94.7% | ||||||||||||||||||||||||
| Silver |
86.9% | 87.6% | 87.7% | 86.3% | 84.6% | 83.9% | 84.4% | 84.5% | ||||||||||||||||||||||||
| Palladium |
96.9% | 96.7% | 97.4% | 96.4% | 97.5% | 98.4% | 97.3% | 97.8% | ||||||||||||||||||||||||
| Cobalt |
93.3% | 93.3% | 93.3% | 93.3% | 93.3% | 93.3% | 93.3% | 93.3% | ||||||||||||||||||||||||
| GEOs 9 |
92.2% | 91.8% | 92.2% | 91.8% | 91.4% | 91.0% | 90.7% | 90.6% | ||||||||||||||||||||||||
| 1) | All figures in thousands except gold and palladium ounces produced. |
| 2) | Quantity produced represent the amount of gold, silver, palladium and cobalt contained in concentrate or doré prior to smelting or refining deductions. Production figures and payable rates are based on information provided by the operators of the mining operations to which the mineral stream interests relate or management estimates in those situations where other information is not available. Certain production figures and payable rates may be updated in future periods as additional information is received. |
| 3) | Comprised of the Coleman, Copper Cliff, Garson, Creighton, Stobie and Totten gold interests. |
| 4) | Under the terms of the San Dimas PMPA, the Company is entitled to an amount equal to 25% of the payable gold production plus an additional amount of gold equal to 25% of the payable silver production converted to gold at a fixed gold to silver exchange ratio of 70:1 from the San Dimas mine. If the average gold to silver price ratio decreases to less than 50:1 or increases to more than 90:1 for a period of 6 months or more, then the “70” shall be revised to “50” or “90”, as the case may be, until such time as the average gold to silver price ratio is between 50:1 to 90:1 for a period of 6 months or more in which event the “70” shall be reinstated. From April 30, 2025 to October 28, 2025, the fixed gold to silver exchange ratio was revised to 90:1. Effective October 29, 2025, the fixed gold to silver exchange ratio was returned to 70:1. For reference, attributable silver production from prior periods is as follows: Q4 2025 - 329,000 ounces; Q3 2025 - 364,000 ounces; Q2 2025 - 311,000 ounces; Q1 2025 - 340,000 ounces; Q4 2024 - 295,000 ounces; Q3 2024 - 262,000 ounces; Q2 2024 - 285,000 ounces; Q1 2024 - 291,000 ounces. |
| 5) | Comprised of the Stillwater and East Boulder gold and palladium interests. On September 12, 2024, Sibanye Stillwater (“Sibanye”) announced that as a result of low palladium prices it was placing the Stillwater West operations into care and maintenance, while using Stillwater East and East Boulder operations to improve efficiencies that could get Stillwater West back to production as prices permit. |
| 6) | On April 1, 2025, Equinox Gold Corp., (“Equinox”) reported it has indefinitely suspended operations at Los Filos following the expiry of its land access agreement with the community of Carrizalillo on March 31, 2025. |
| 7) | On September 12, 2023, it was announced that the production of the zinc and lead concentrates at the Aljustrel mine will be halted from September 24, 2023 until the third quarter of 2025. |
| 8) | GEOs, which are provided to assist the reader, are based on the following commodity price assumptions: $2,600 per ounce gold; $30.00 per ounce silver; $950 per ounce palladium; and $13.50 per pound cobalt; consistent with those used in estimating the Company’s production guidance for 2025. |
WHEATON PRECIOUS METALS 2025 ANNUAL REPORT- MANAGEMENT DISCUSSION & ANALYSIS [16]
Summary of Units Sold
| Q4 2025 | Q3 2025 | Q2 2025 | Q1 2025 | Q4 2024 | Q3 2024 | Q2 2024 | Q1 2024 | |||||||||||||||||||||||||
| Gold ounces sold |
||||||||||||||||||||||||||||||||
| Salobo |
83,697 | 55,768 | 76,331 | 83,809 | 55,170 | 58,101 | 54,962 | 56,841 | ||||||||||||||||||||||||
| Sudbury 2 |
3,715 | 4,729 | 2,849 | 5,632 | 4,048 | 2,495 | 5,679 | 4,129 | ||||||||||||||||||||||||
| Constancia |
17,029 | 2,708 | 6,827 | 9,788 | 17,873 | 5,186 | 6,640 | 20,123 | ||||||||||||||||||||||||
| San Dimas |
8,686 | 6,655 | 7,235 | 8,962 | 6,990 | 7,022 | 6,801 | 7,933 | ||||||||||||||||||||||||
| Stillwater 3 |
1,790 | 1,465 | 1,386 | 1,947 | 2,410 | 1,635 | 2,628 | 2,355 | ||||||||||||||||||||||||
| Blackwater |
5,225 | 6,463 | 3,291 | 110 | - | - | - | - | ||||||||||||||||||||||||
| Other |
||||||||||||||||||||||||||||||||
| Marmato |
809 | 749 | 742 | 737 | 650 | 550 | 616 | 638 | ||||||||||||||||||||||||
| Goose |
528 | 95 | - | - | - | - | - | - | ||||||||||||||||||||||||
| Santo Domingo 4 |
312 | 312 | 312 | 312 | 312 | 447 | - | - | ||||||||||||||||||||||||
| El Domo 4 |
- | - | - | - | 209 | 258 | - | - | ||||||||||||||||||||||||
| Total Other |
1,649 | 1,156 | 1,054 | 1,049 | 1,171 | 1,255 | 616 | 638 | ||||||||||||||||||||||||
| Total gold ounces sold |
121,791 | 78,944 | 98,973 | 111,297 | 87,662 | 75,694 | 77,326 | 92,019 | ||||||||||||||||||||||||
| Silver ounces sold |
||||||||||||||||||||||||||||||||
| Peñasquito |
1,878 | 1,609 | 2,112 | 1,976 | 1,852 | 1,667 | 1,482 | 1,839 | ||||||||||||||||||||||||
| Antamina |
1,893 | 1,552 | 1,073 | 884 | 858 | 989 | 917 | 762 | ||||||||||||||||||||||||
| Constancia |
613 | 275 | 625 | 730 | 797 | 366 | 422 | 726 | ||||||||||||||||||||||||
| Blackwater |
137 | 137 | 143 | - | - | - | - | - | ||||||||||||||||||||||||
| Other |
||||||||||||||||||||||||||||||||
| Los Filos |
- | 3 | 8 | 57 | 29 | 26 | 24 | 44 | ||||||||||||||||||||||||
| Zinkgruvan |
358 | 708 | 520 | 446 | 452 | 488 | 597 | 297 | ||||||||||||||||||||||||
| Neves-Corvo |
245 | 212 | 224 | 218 | 154 | 185 | 216 | 243 | ||||||||||||||||||||||||
| Aljustrel |
382 | 122 | - | - | - | - | - | 1 | ||||||||||||||||||||||||
| Cozamin |
169 | 133 | 154 | 164 | 158 | 148 | 158 | 147 | ||||||||||||||||||||||||
| Marmato |
10 | 9 | 9 | 8 | 7 | 6 | 7 | 8 | ||||||||||||||||||||||||
| Total Other |
1,164 | 1,187 | 915 | 893 | 800 | 853 | 1,002 | 740 | ||||||||||||||||||||||||
| Total silver ounces sold |
5,685 | 4,760 | 4,868 | 4,483 | 4,307 | 3,875 | 3,823 | 4,067 | ||||||||||||||||||||||||
| Palladium ounces sold |
||||||||||||||||||||||||||||||||
| Stillwater 3 |
1,730 | 2,594 | 2,575 | 2,457 | 4,434 | 3,761 | 4,301 | 4,774 | ||||||||||||||||||||||||
| Cobalt pounds sold |
||||||||||||||||||||||||||||||||
| Voisey’s Bay |
485 | 529 | 353 | 265 | 485 | 88 | 88 | 309 | ||||||||||||||||||||||||
| GEOs sold 5 |
190,535 | 137,563 | 157,916 | 165,297 | 141,495 | 122,242 | 123,462 | 142,294 | ||||||||||||||||||||||||
| Cumulative payable units PBND 6 |
||||||||||||||||||||||||||||||||
| Gold ounces |
108,890 | 106,222 | 90,284 | 100,512 | 123,511 | 97,929 | 90,406 | 88,145 | ||||||||||||||||||||||||
| Silver ounces |
3,227 | 3,629 | 3,178 | 3,145 | 3,583 | 2,931 | 2,993 | 2,539 | ||||||||||||||||||||||||
| Palladium ounces |
5,169 | 4,424 | 4,414 | 4,596 | 4,439 | 6,186 | 6,018 | 6,198 | ||||||||||||||||||||||||
| Cobalt pounds |
1,341 | 1,202 | 1,168 | 917 | 678 | 796 | 513 | 360 | ||||||||||||||||||||||||
| GEOs 5 |
154,981 | 155,949 | 134,630 | 143,238 | 169,994 | 138,141 | 129,808 | 121,574 | ||||||||||||||||||||||||
| 1) | All figures in thousands except gold and palladium ounces sold. |
| 2) | Comprised of the Coleman, Copper Cliff, Garson, Creighton, Stobie and Totten gold interests. |
| 3) | Comprised of the Stillwater and East Boulder gold and palladium interests. |
| 4) | The ounces sold under Santo Domingo and El Domo relate to ounces received due to the delay ounce provision as per the respective PMPA (see footnote 3 on page 9 of this MD&A for more information). |
| 5) | GEOs, which are provided to assist the reader, are based on the following commodity price assumptions: $2,600 per ounce gold; $30.00 per ounce silver; $950 per ounce palladium; and $13.50 per pound cobalt; consistent with those used in estimating the Company’s production guidance for 2025. |
| 6) | Payable gold, silver and palladium ounces PBND and cobalt pounds PBND are based on management estimates. These figures may be updated in future periods as additional information is received. |
WHEATON PRECIOUS METALS 2025 ANNUAL REPORT- MANAGEMENT DISCUSSION & ANALYSIS [17]
Quarterly Financial Review 1
| Q4 2025 | Q3 2025 | Q2 2025 | Q1 2025 | Q4 2024 | Q3 2024 | Q2 2024 | Q1 2024 | |||||||||||||||||||||||||
| Gold ounces sold |
121,791 | 78,944 | 98,973 | 111,297 | 87,662 | 75,694 | 77,326 | 92,019 | ||||||||||||||||||||||||
| Realized price 2 |
$ | 4,215 | $ | 3,481 | $ | 3,318 | $ | 2,872 | $ | 2,677 | $ | 2,491 | $ | 2,356 | $ | 2,072 | ||||||||||||||||
| Gold sales |
$ | 513,374 | $ | 274,797 | $ | 328,354 | $ | 319,696 | $ | 234,690 | $ | 188,521 | $ | 182,150 | $ | 190,689 | ||||||||||||||||
| Silver ounces sold |
5,685 | 4,760 | 4,868 | 4,483 | 4,307 | 3,875 | 3,823 | 4,067 | ||||||||||||||||||||||||
| Realized price 2 |
$ | 59.32 | $ | 39.66 | $ | 34.05 | $ | 32.33 | $ | 31.28 | $ | 29.71 | $ | 29.11 | $ | 23.77 | ||||||||||||||||
| Silver sales |
$ | 337,197 | $ | 188,795 | $ | 165,739 | $ | 144,937 | $ | 134,733 | $ | 115,149 | $ | 111,291 | $ | 96,658 | ||||||||||||||||
| Palladium ounces sold |
1,730 | 2,594 | 2,575 | 2,457 | 4,434 | 3,761 | 4,301 | 4,774 | ||||||||||||||||||||||||
| Realized price 2 |
$ | 1,479 | $ | 1,173 | $ | 996 | $ | 965 | $ | 1,008 | $ | 969 | $ | 979 | $ | 980 | ||||||||||||||||
| Palladium sales |
$ | 2,558 | $ | 3,042 | $ | 2,564 | $ | 2,372 | $ | 4,468 | $ | 3,644 | $ | 4,210 | $ | 4,677 | ||||||||||||||||
| Cobalt pounds sold |
485 | 529 | 353 | 265 | 485 | 88 | 88 | 309 | ||||||||||||||||||||||||
| Realized price 2 |
$ | 23.89 | $ | 18.19 | $ | 18.60 | $ | 12.88 | $ | 13.66 | $ | 10.65 | $ | 16.02 | $ | 15.49 | ||||||||||||||||
| Cobalt sales |
$ | 11,585 | $ | 9,623 | $ | 6,561 | $ | 3,406 | $ | 6,625 | $ | 939 | $ | 1,413 | $ | 4,782 | ||||||||||||||||
| Total sales |
$ | 864,714 | $ | 476,257 | $ | 503,218 | $ | 470,411 | $ | 380,516 | $ | 308,253 | $ | 299,064 | $ | 296,806 | ||||||||||||||||
| Cash cost 2, 3 |
||||||||||||||||||||||||||||||||
| Gold / oz |
$ | 495 | $ | 515 | $ | 470 | $ | 445 | $ | 440 | $ | 440 | $ | 441 | $ | 439 | ||||||||||||||||
| Silver / oz |
$ | 8.95 | $ | 6.35 | $ | 5.33 | $ | 5.17 | $ | 5.16 | $ | 5.03 | $ | 4.95 | $ | 4.77 | ||||||||||||||||
| Palladium / oz |
$ | 244 | $ | 205 | $ | 175 | $ | 172 | $ | 184 | $ | 173 | $ | 175 | $ | 182 | ||||||||||||||||
| Cobalt / lb 5 |
$ | 4.33 | $ | 3.44 | $ | 3.57 | $ | 2.46 | $ | 2.59 | $ | 2.15 | $ | 3.11 | $ | 2.96 | ||||||||||||||||
| Depletion 2 |
||||||||||||||||||||||||||||||||
| Gold / oz 4 |
$ | 452 | $ | 497 | $ | 433 | $ | 423 | $ | 420 | $ | 418 | $ | 438 | $ | 404 | ||||||||||||||||
| Silver / oz |
$ | 4.79 | $ | 4.57 | $ | 5.93 | $ | 6.03 | $ | 5.90 | $ | 5.89 | $ | 5.76 | $ | 5.03 | ||||||||||||||||
| Palladium / oz |
$ | 492 | $ | 492 | $ | 429 | $ | 429 | $ | 429 | $ | 429 | $ | 429 | $ | 445 | ||||||||||||||||
| Cobalt / lb |
$ | 9.02 | $ | 9.02 | $ | 9.18 | $ | 9.18 | $ | 12.78 | $ | 12.78 | $ | 12.78 | $ | 12.77 | ||||||||||||||||
| Gain on disposal of PMPA |
$ | - | $ | 85,724 | $ | - | $ | - | $ | - | $ | - | $ | - | $ | - | ||||||||||||||||
| Impairment |
$ | - | $ | - | $ | - | $ | - | $ | 108,861 | $ | - | $ | - | $ | - | ||||||||||||||||
| Net earnings |
$ | 558,250 | $ | 367,216 | $ | 292,270 | $ | 253,984 | $ | 88,148 | $ | 154,635 | $ | 122,317 | $ | 164,041 | ||||||||||||||||
| Per share |
||||||||||||||||||||||||||||||||
| Basic |
$ | 1.230 | $ | 0.809 | $ | 0.644 | $ | 0.560 | $ | 0.194 | $ | 0.341 | $ | 0.270 | $ | 0.362 | ||||||||||||||||
| Diluted |
$ | 1.227 | $ | 0.807 | $ | 0.643 | $ | 0.559 | $ | 0.194 | $ | 0.340 | $ | 0.269 | $ | 0.362 | ||||||||||||||||
| Adjusted net earnings 3 |
$ | 554,979 | $ | 281,054 | $ | 286,004 | $ | 250,825 | $ | 198,969 | $ | 152,803 | $ | 149,565 | $ | 138,834 | ||||||||||||||||
| Per share |
||||||||||||||||||||||||||||||||
| Basic |
$ | 1.222 | $ | 0.619 | $ | 0.630 | $ | 0.553 | $ | 0.439 | $ | 0.337 | $ | 0.330 | $ | 0.306 | ||||||||||||||||
| Diluted |
$ | 1.220 | $ | 0.618 | $ | 0.629 | $ | 0.552 | $ | 0.438 | $ | 0.336 | $ | 0.329 | $ | 0.306 | ||||||||||||||||
| Cash flow from operations |
$ | 746,277 | $ | 382,953 | $ | 414,959 | $ | 360,793 | $ | 319,471 | $ | 254,337 | $ | 234,393 | $ | 219,380 | ||||||||||||||||
| Per share 3 |
||||||||||||||||||||||||||||||||
| Basic |
$ | 1.644 | $ | 0.844 | $ | 0.914 | $ | 0.795 | $ | 0.704 | $ | 0.561 | $ | 0.517 | $ | 0.484 | ||||||||||||||||
| Diluted |
$ | 1.641 | $ | 0.842 | $ | 0.913 | $ | 0.794 | $ | 0.703 | $ | 0.560 | $ | 0.516 | $ | 0.484 | ||||||||||||||||
| Dividends declared |
$ | 74,913 | $ | 74,903 | $ | 74,899 | $ | 74,881 | $ | 70,318 | $ | 70,314 | $ | 70,273 | $ | 70,261 | ||||||||||||||||
| Per share |
$ | 0.165 | $ | 0.165 | $ | 0.165 | $ | 0.165 | $ | 0.155 | $ | 0.155 | $ | 0.155 | $ | 0.155 | ||||||||||||||||
| Total assets |
$ | 9,125,781 | $ | 8,419,518 | $ | 7,982,385 | $ | 7,739,297 | $ | 7,424,457 | $ | 7,386,179 | $ | 7,247,082 | $ | 7,180,455 | ||||||||||||||||
| Total liabilities |
$ | 435,273 | $ | 326,761 | $ | 256,679 | $ | 273,155 | $ | 165,078 | $ | 126,165 | $ | 87,410 | $ | 101,260 | ||||||||||||||||
| Total shareholders’ equity |
$ | 8,690,508 | $ | 8,092,757 | $ | 7,725,706 | $ | 7,466,142 | $ | 7,259,379 | $ | 7,260,014 | $ | 7,159,672 | $ | 7,079,195 | ||||||||||||||||
| 1) | All figures in thousands except gold and palladium ounces produced and sold, per unit amounts and per share amounts. |
| 2) | Expressed as dollars per ounce for gold, silver and palladium; and dollars per pound for cobalt. |
| 3) | Refer to discussion on non-GAAP measures beginning on page 46 of this MD&A. |
| 4) | Includes the non-cash per ounce cost of sale associated with delay ounces. Please see footnote 3 on page 9 of this MD&A for more information. |
Changes in sales, net earnings and cash flow from operations from quarter to quarter are affected primarily by fluctuations in production at the mines, the timing of shipments, changes in the price of commodities, the
WHEATON PRECIOUS METALS 2025 ANNUAL REPORT- MANAGEMENT DISCUSSION & ANALYSIS [18]
commencement of operations of mines under construction, as well as acquisitions of PMPAs and any related capital raising activities.
Revenue by Commodity
Revenue was $2.3 billion (62% gold, 36% silver, 1% palladium and 1% cobalt) during the year ended December 31, 2025, with the $1.0 billion increase from the comparable period of the previous year due primarily to a 46% increase in the average realized price per GEO sold; and a 23% increase in the number of GEOs sold.
The following two tables present (i) a summary of the key factors driving changes in revenue, specifically the number of GEOs sold and the average realized price per GEO for the years 2023 through 2025; and (ii) the commodity mix for 2025 and 2024.
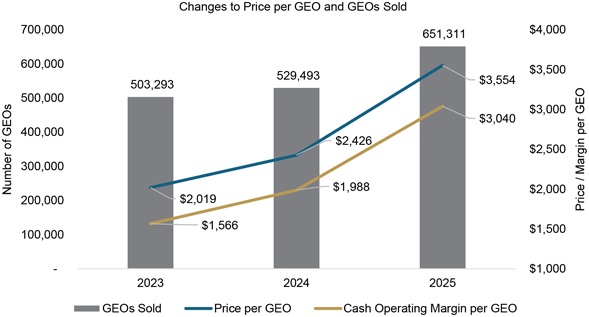
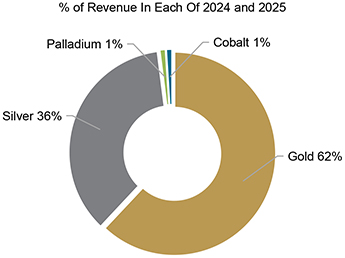
WHEATON PRECIOUS METALS 2025 ANNUAL REPORT- MANAGEMENT DISCUSSION & ANALYSIS [19]
Cash Operating Margin 1
From 2023 to 2025, average cash costs¹ rose 13%, increasing from $453 per GEO in 2023 to $514 per GEO in 2025. Over the same period, cash operating margin¹ expanded by 94%, climbing from $1,566 per GEO to $3,040 per GEO. This substantial margin growth reflects the strong leverage inherent in Wheaton’s streaming model, where fixed per-ounce production payments across most operating streams—representing 83% of 2025 revenue—amplify profitability in a rising price environment. Notably, year-over-year margin growth outpaced the 76% increase in GEO prices, underscoring the effectiveness of Wheaton’s business model in generating enhanced cash flow and margins as precious metal prices strengthen.
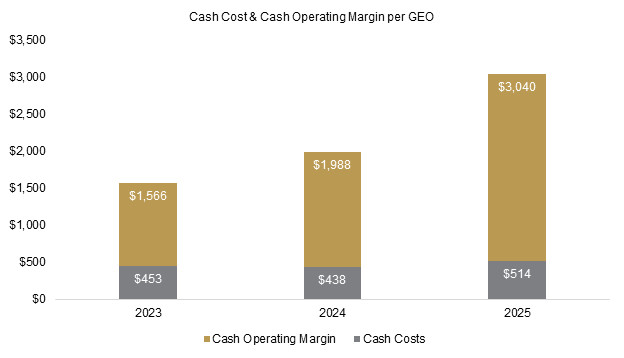
| 1 | Refer to discussion on non-GAAP measures beginning on page 46 of this MD&A |
WHEATON PRECIOUS METALS 2025 ANNUAL REPORT- MANAGEMENT DISCUSSION & ANALYSIS [20]
Results of Operations and Operational Review
The operating results of the Company’s reportable operating segments are summarized in the tables and commentary below.
Results of Operations For The Three Months Ended December 31, 2025 and 2024
The following two tables present the results of operations based on the Company’s reportable operating segments.
| Three Months Ended December 31, 2025 | ||||||||||||||||||||||||||||||||||||
| Units Produced² |
Units Sold |
Average Realized Price ($‘s Per Unit) |
Average Cash Cost ($‘s Per Unit) 3 |
Average Depletion ($‘s Per Unit) 4 |
Sales | Net Earnings |
Cash Flow From Operations |
Total Assets |
||||||||||||||||||||||||||||
| Gold |
||||||||||||||||||||||||||||||||||||
| Salobo |
88,907 | 83,697 | $ | 4,214 | $ | 429 | $ | 404 | $ | 352,713 | $ | 282,995 | $ | 316,820 | $ | 2,620,710 | ||||||||||||||||||||
| Sudbury 5 |
7,808 | 3,715 | 4,234 | 400 | 1,399 | 15,726 | 9,044 | 22,894 | 218,494 | |||||||||||||||||||||||||||
| Constancia |
15,396 | 17,029 | 4,214 | 429 | 338 | 71,764 | 58,699 | 64,461 | 52,284 | |||||||||||||||||||||||||||
| San Dimas |
8,206 | 8,686 | 4,214 | 643 | 428 | 36,603 | 27,296 | 31,015 | 125,218 | |||||||||||||||||||||||||||
| Stillwater |
1,518 | 1,790 | 4,214 | 727 | 570 | 7,544 | 5,222 | 6,243 | 204,202 | |||||||||||||||||||||||||||
| Blackwater |
5,479 | 5,225 | 4,234 | 1,485 | 606 | 22,123 | 11,197 | 28,991 | 331,048 | |||||||||||||||||||||||||||
| Platreef |
- | - | n.a. | n.a. | n.a. | - | - | - | 275,702 | |||||||||||||||||||||||||||
| Other 6 |
3,362 | 1,649 | 4,184 | 598 | 1,406 | 6,901 | 3,596 | 5,915 | 1,457,132 | |||||||||||||||||||||||||||
| 130,676 | 121,791 | $ | 4,215 | $ | 495 | $ | 452 | $ | 513,374 | $ | 398,049 | $ | 476,339 | $ | 5,284,790 | |||||||||||||||||||||
| Silver |
||||||||||||||||||||||||||||||||||||
| Peñasquito |
1,821 | 1,878 | $ | 55.20 | $ | 4.56 | $ | 5.09 | $ | 103,647 | $ | 85,530 | $ | 95,086 | $ | 206,866 | ||||||||||||||||||||
| Antamina |
1,600 | 1,893 | 55.20 | 11.15 | 4.39 | 104,502 | 75,072 | 83,387 | 459,083 | |||||||||||||||||||||||||||
| Constancia |
731 | 613 | 55.20 | 6.32 | 6.43 | 33,836 | 26,024 | 29,963 | 151,403 | |||||||||||||||||||||||||||
| Blackwater |
148 | 137 | 61.49 | 10.88 | 7.52 | 8,446 | 5,918 | 9,013 | 167,502 | |||||||||||||||||||||||||||
| Other 7 |
1,764 | 1,164 | 74.54 | 13.59 | 3.78 | 86,766 | 66,542 | 45,642 | 556,887 | |||||||||||||||||||||||||||
| 6,064 | 5,685 | $ | 59.32 | $ | 8.95 | $ | 4.79 | $ | 337,197 | $ | 259,086 | $ | 263,091 | $ | 1,541,741 | |||||||||||||||||||||
| Palladium |
||||||||||||||||||||||||||||||||||||
| Stillwater |
2,519 | 1,730 | $ | 1,479 | $ | 244 | $ | 492 | $ | 2,558 | $ | 1,285 | $ | 2,136 | $ | 208,892 | ||||||||||||||||||||
| Platreef |
- | - | n.a. | n.a. | n.a. | - | - | - | 78,814 | |||||||||||||||||||||||||||
| 2,519 | 1,730 | $ | 1,479 | $ | 244 | $ | 492 | $ | 2,558 | $ | 1,285 | $ | 2,136 | $ | 287,706 | |||||||||||||||||||||
| Platinum |
||||||||||||||||||||||||||||||||||||
| Marathon |
- | - | $ | n.a. | $ | n.a. | $ | n.a. | $ | - | $ | - | $ | - | $ | 9,451 | ||||||||||||||||||||
| Platreef |
- | - | n.a. | n.a. | n.a. | - | - | - | 57,584 | |||||||||||||||||||||||||||
| - | - | $ | n.a. | $ | n.a. | $ | n.a. | $ | - | $ | - | $ | - | $ | 67,035 | |||||||||||||||||||||
| Cobalt |
||||||||||||||||||||||||||||||||||||
| Voisey’s Bay |
670 | 485 | $ | 23.89 | $ | 4.33 | $ | 9.02 | $ | 11,585 | $ | 5,110 | $ | 7,664 | $ | 215,877 | ||||||||||||||||||||
| Operating results |
$ | 864,714 | $ | 663,530 | $ | 749,230 | $ | 7,397,149 | ||||||||||||||||||||||||||||
| Other |
||||||||||||||||||||||||||||||||||||
| General and administrative |
|
$ | (11,796) | $ | (7,631) | |||||||||||||||||||||||||||||||
| Share based compensation |
|
(1,709) | - | |||||||||||||||||||||||||||||||||
| Donations and community investments |
|
(4,269) | (3,980) | |||||||||||||||||||||||||||||||||
| Finance costs |
|
(1,451) | (1,114) | |||||||||||||||||||||||||||||||||
| Other |
|
6,373 | 9,813 | |||||||||||||||||||||||||||||||||
| Income tax |
|
(92,428) | (41) | |||||||||||||||||||||||||||||||||
| Total other |
$ | (105,280) | $ | (2,953) | $ | 1,728,632 | ||||||||||||||||||||||||||||||
| $ | 558,250 | $ | 746,277 | $ | 9,125,781 | |||||||||||||||||||||||||||||||
| 1) | Units of gold, silver and palladium produced and sold are reported in ounces, while cobalt is reported in pounds. All figures in thousands except gold and palladium ounces produced and sold and per unit amounts. |
| 2) | Quantity produced represents the amount of gold, silver, palladium and cobalt contained in concentrate or doré prior to smelting or refining deductions. Production figures are based on information provided by the operators of the mining operations to which the mineral stream interests relate or management estimates in those situations where other information is not available. Certain production figures may be updated in future periods as additional information is received. |
| 3) | Refer to discussion on non-GAAP measure (iii) on page 48 of this MD&A. |
| 4) | Includes the non-cash per ounce cost of sale associated with delay ounces. Please see footnote 3 on page 9 of this MD&A for more information. |
| 5) | Comprised of the operating Coleman, Copper Cliff, Garson, Creighton, Stobie and Totten gold interests and the non-operating Victor gold interest. |
| 6) | Other gold interests comprised of the operating Marmato, Goose and Hemlo gold interests as well as the non-operating Copper World, Santo Domingo, Fenix, El Domo, Marathon, Cangrejos, Curraghinalt, Kudz Ze Kayah, Koné and Kurmuk, Spring Valley gold interests. Other includes ounces sold that were received under the delay ounce provision of the Santo Domingo PMPA (see footnote 3 on page 9 of this MD&A for more information). |
| 7) | Other silver interests comprised of the operating Los Filos, Zinkgruvan, Neves-Corvo, Aljustrel, Marmato and Cozamin silver interests as well as the non-operating Stratoni, El Alto (previously referred to as Pascua-Lama), Copper World, Navidad, El Domo, Mineral Park and Kudz Ze Kayah silver interests. |
| 8) | During the current period, the Company classified the Blackwater and Platreef PMPAs as reportable segments. |
WHEATON PRECIOUS METALS 2025 ANNUAL REPORT- MANAGEMENT DISCUSSION & ANALYSIS [21]
| Three Months Ended December 31, 2024 | ||||||||||||||||||||||||||||||||||||||||
| Units Produced² |
Units Sold |
Average Realized Price ($‘s Per Unit) |
Average Cash Cost ($‘s Per Unit) 3 |
Average Depletion ($‘s Per Unit) 4 |
Sales | Impairment Charges |
Net Earnings |
Cash Flow From Operations |
Total Assets |
|||||||||||||||||||||||||||||||
| Gold |
||||||||||||||||||||||||||||||||||||||||
| Salobo |
84,291 | 55,170 | $ | 2,676 | $ | 425 | $ | 378 | $ | 147,610 | $ | - | $ | 103,323 | $ | 121,254 | $ | 2,595,485 | ||||||||||||||||||||||
| Sudbury 5 |
5,259 | 4,048 | 2,709 | 400 | 1,326 | 10,968 | - | 3,982 | 9,853 | 241,551 | ||||||||||||||||||||||||||||||
| Constancia |
18,727 | 17,873 | 2,676 | 425 | 323 | 47,821 | - | 34,463 | 40,232 | 64,326 | ||||||||||||||||||||||||||||||
| San Dimas |
7,263 | 6,990 | 2,676 | 637 | 290 | 18,704 | - | 12,226 | 14,251 | 136,481 | ||||||||||||||||||||||||||||||
| Stillwater |
2,166 | 2,410 | 2,676 | 481 | 421 | 6,448 | - | 4,275 | 5,289 | 207,460 | ||||||||||||||||||||||||||||||
| Blackwater |
- | - | n.a. | n.a. | n.a. | - | - | - | - | 340,231 | ||||||||||||||||||||||||||||||
| Platreef |
- | - | n.a. | n.a. | n.a. | - | - | - | - | 275,702 | ||||||||||||||||||||||||||||||
| Other 6 |
622 | 1,171 | 2,681 | 265 | 1,485 | 3,139 | - | 1,089 | 2,828 | 365,383 | ||||||||||||||||||||||||||||||
| 118,328 | 87,662 | $ | 2,677 | $ | 440 | $ | 420 | $ | 234,690 | $ | - | $ | 159,358 | $ | 193,707 | $ | 4,226,619 | |||||||||||||||||||||||
| Silver |
||||||||||||||||||||||||||||||||||||||||
| Peñasquito |
2,465 | 1,852 | $ | 31.48 | $ | 4.50 | $ | 4.86 | $ | 58,293 | $ | - | $ | 40,965 | $ | 49,960 | $ | 244,465 | ||||||||||||||||||||||
| Antamina |
1,071 | 858 | 31.48 | 6.28 | 8.46 | 27,009 | - | 14,360 | 21,619 | 490,771 | ||||||||||||||||||||||||||||||
| Constancia |
970 | 797 | 31.48 | 6.26 | 6.10 | 25,084 | - | 15,232 | 20,096 | 165,378 | ||||||||||||||||||||||||||||||
| Blackwater |
- | - | n.a. | n.a. | n.a. | - | - | - | - | 140,908 | ||||||||||||||||||||||||||||||
| Other 7 |
1,359 | 800 | 30.43 | 4.37 | 5.34 | 24,347 | - | 16,570 | 25,204 | 521,722 | ||||||||||||||||||||||||||||||
| 5,865 | 4,307 | $ | 31.28 | $ | 5.16 | $ | 5.90 | $ | 134,733 | $ | - | $ | 87,127 | $ | 116,879 | $ | 1,563,244 | |||||||||||||||||||||||
| Palladium |
||||||||||||||||||||||||||||||||||||||||
| Stillwater |
2,797 | 4,434 | $ | 1,008 | $ | 184 | $ | 429 | $ | 4,468 | $ | - | $ | 1,749 | $ | 3,653 | $ | 213,179 | ||||||||||||||||||||||
| Platreef |
- | - | n.a. | n.a. | n.a. | - | - | - | - | 78,814 | ||||||||||||||||||||||||||||||
| 2,797 | 4,434 | $ | 1,008 | $ | 184 | $ | 429 | $ | 4,468 | $ | - | $ | 1,749 | $ | 3,653 | $ | 291,993 | |||||||||||||||||||||||
| Platinum |
||||||||||||||||||||||||||||||||||||||||
| Marathon |
- | - | $ | n.a. | $ | n.a. | $ | n.a. | $ | - | $ | - | $ | - | $ | - | $ | 9,451 | ||||||||||||||||||||||
| Platreef |
- | - | n.a. | n.a. | n.a. | - | - | - | - | 57,584 | ||||||||||||||||||||||||||||||
| - | - | $ | n.a. | $ | n.a. | $ | n.a. | $ | - | $ | - | $ | - | $ | - | $ | 67,035 | |||||||||||||||||||||||
| Cobalt |
||||||||||||||||||||||||||||||||||||||||
| Voisey’s Bay |
393 | 485 | $ | 13.66 | $ | 2.59 | $ | 12.78 | $ | 6,625 | $ | (108,861) | $ | (109,688) | $ | 4,618 | $ | 230,689 | ||||||||||||||||||||||
| Operating results |
$ | 380,516 | $ | (108,861) | $ | 138,546 | $ | 318,857 | $ | 6,379,580 | ||||||||||||||||||||||||||||||
| Other |
||||||||||||||||||||||||||||||||||||||||
| General and administrative |
|
$ | (10,475) | $ | (6,996) | |||||||||||||||||||||||||||||||||||
| Share based compensation |
|
(6,118) | - | |||||||||||||||||||||||||||||||||||||
| Donations and community investments |
|
(4,332) | (3,913) | |||||||||||||||||||||||||||||||||||||
| Finance costs |
|
(1,404) | (1,046) | |||||||||||||||||||||||||||||||||||||
| Other |
|
9,138 | 6,787 | |||||||||||||||||||||||||||||||||||||
| Income tax |
|
(37,207) | 5,782 | |||||||||||||||||||||||||||||||||||||
| Total other |
$ | (50,398) | $ | 614 | $ | 1,044,877 | ||||||||||||||||||||||||||||||||||
| $ | 88,148 | $ | 319,471 | $ | 7,424,457 | |||||||||||||||||||||||||||||||||||
| 1) | Units of gold, silver and palladium produced and sold are reported in ounces, while cobalt is reported in pounds. All figures in thousands except gold and palladium ounces produced and sold and per unit amounts. |
| 2) | Quantity produced represent the amount of gold, silver, palladium and cobalt contained in concentrate or doré prior to smelting or refining deductions. Production figures are based on information provided by the operators of the mining operations to which the mineral stream interests relate or management estimates in those situations where other information is not available. Certain production figures may be updated in future periods as additional information is received. |
| 3) | Refer to discussion on non-GAAP measure (iii) on page 48 of this MD&A. |
| 4) | Includes the non-cash per ounce cost of sale associated with delay ounces. Please see footnote 3 on page 9 of this MD&A for more information. |
| 5) | Comprised of the operating Coleman, Copper Cliff, Garson, Creighton and Totten gold interests as well as the non-operating Stobie and Victor gold interests. |
| 6) | Other gold interests are comprised of the operating Marmato gold interest as well as the non-operating Minto, Copper World, Santo Domingo, Fenix, El Domo, Marathon, Goose, Cangrejos, Curraghinalt and Kudz Ze Kayah gold interests. Other includes ounces sold that were received under the delay ounce provision of the Santo Domingo and El Domo PMPAs (see footnote 3 on page 9 of this MD&A for more information). |
| 7) | Other silver interests comprised of the operating Los Filos, Zinkgruvan, Neves-Corvo, Marmato and Cozamin silver interests as well as the non-operating Stratoni, Aljustrel, Minto, El Alto (previously referred to as Pascua-Lama), Copper World, Navidad, El Domo, Mineral Park and Kudz Ze Kayah silver interests. |
| 8) | During the current period, the Company classified the Blackwater and Platreef PMPAs as reportable segments. The comparative figures have been reclassified to conform with this presentation. |
WHEATON PRECIOUS METALS 2025 ANNUAL REPORT- MANAGEMENT DISCUSSION & ANALYSIS [22]
Comparative Results of Operations on a GEO Basis
| Q4 2025 | Q4 2024 | Change | Change | |||||||||||||
| GEO Production 1, 2 |
205,037 | 189,059 | 15,978 | 8.5% | ||||||||||||
| GEO Sales 2 |
190,535 | 141,495 | 49,040 | 34.7% | ||||||||||||
| Average price per GEO sold 2 |
$ | 4,538 | $ | 2,689 | $ | 1,849 | 68.8% | |||||||||
| Revenue |
$ | 864,714 | $ | 380,516 | $ | 484,198 | 127.2% | |||||||||
| Cost of sales, excluding depletion |
$ | 114,956 | $ | 64,236 | $ | (50,720) | (79.0)% | |||||||||
| Depletion |
86,228 | 68,873 | (17,355) | (25.2)% | ||||||||||||
| Cost of sales |
$ | 201,184 | $ | 133,109 | $ | (68,075) | (51.1)% | |||||||||
| Gross margin |
$ | 663,530 | $ | 247,407 | $ | 416,123 | 168.2% | |||||||||
| General and administrative |
11,796 | 10,475 | (1,321) | (12.6)% | ||||||||||||
| Share based compensation |
1,709 | 6,118 | 4,409 | 72.1% | ||||||||||||
| Donations and community investments |
4,269 | 4,332 | 63 | 1.5% | ||||||||||||
| Impairment of mineral stream interests |
- | 108,861 | 108,861 | 100.0% | ||||||||||||
| Earnings from operations |
$ | 645,756 | $ | 117,621 | $ | 528,135 | 449.0% | |||||||||
| Other income (expense) |
6,373 | 9,138 | (2,765) | (30.3)% | ||||||||||||
| Earnings before finance costs and income taxes |
$ | 652,129 | $ | 126,759 | $ | 525,370 | 414.5% | |||||||||
| Finance costs |
1,451 | 1,404 | (47) | (3.3)% | ||||||||||||
| Earnings before income taxes |
$ | 650,678 | $ | 125,355 | $ | 525,323 | 419.1% | |||||||||
| Income tax expense |
92,428 | 37,207 | (55,221) | (148.4)% | ||||||||||||
| Net earnings |
$ | 558,250 | $ | 88,148 | $ | 470,102 | 533.3% | |||||||||
| 1) | Quantity produced represents the amount of gold, silver, palladium and cobalt contained in concentrate or doré prior to smelting or refining deductions. Production figures are based on information provided by the operators of the mining operations to which the mineral stream interests relate or management estimates in those situations where other information is not available. Certain production figures may be updated in future periods as additional information is received. |
| 2) | GEOs, which are provided to assist the reader, are based on the following commodity price assumptions: $2,600 per ounce gold; $30.00 per ounce silver; $950 per ounce palladium; and $13.50 per pound cobalt; consistent with those used in estimating the Company’s production guidance for 2025. |
GEO Production
For the three months ended December 31, 2025, attributable GEO production was 205,000 ounces, with the 15,900 ounce increase from the comparable period in 2024 being primarily attributable to the following factors:
| ● | 7,400 ounce or 45% increase from the Other mines (comprised of 2,700 gold ounces and 406,000 silver ounces), primarily due to the resumption of mining at Aljustrel, coupled with the commencement of production at Goose and the acquisition of the Hemlo PMPA; |
| ● | 7,200 ounce increase from Blackwater (comprised of 5,500 gold ounces and 148,000 silver ounces), with the mine achieving commercial production in May 2025; |
| ● | 6,100 ounce or 49% increase from Antamina (529,000 silver ounces), primarily due to higher grades and recoveries; |
| ● | 4,600 ounce or 5% increase from Salobo primarily the result of higher throughput and recoveries resulting from improved efficiencies at Salobo 1 and 2, partially offset by lower grades; |
| ● | 2,500 ounce or 48% increase from Sudbury, primarily due to higher recoveries; |
| ● | 1,400 ounce or 70% increase from Voisey’s Bay (277,000 cobalt pounds) as the underground mine at Voisey’s Bay continues ramp-up to full production, with full ramp-up expected by the second half of 2026; and |
| ● | 900 ounce or 13% increase from San Dimas, with higher throughput being partially offset by the change of the gold to silver conversion ratio from 70:1 to 90:1, effective for the period April 30, 2025 to October 28, 2025. On October 29, 2025, the gold to silver conversion ratio returned to 70:1; partially offset by |
| ● | 7,400 ounce or 26% decrease from Peñasquito (644,000 silver ounces), primarily the result of lower grades with mining activities having transitioned back into the Peñasco pit which contains lower silver grades relative to the Chile Colorado pit, partially offset by higher recoveries; |
| ● | 6,100 ounce or 20% decrease from Constancia (comprised of 3,300 gold ounces and 239,000 silver ounces), primarily due to lower grades; and |
| ● | 700 ounce or 24% decrease from Stillwater (comprised of 600 gold ounces and 300 palladium ounces), primarily due to lower grades and recoveries. |
WHEATON PRECIOUS METALS 2025 ANNUAL REPORT- MANAGEMENT DISCUSSION & ANALYSIS [23]
Net Earnings
For the three months ended December 31, 2025, net earnings amounted to $558 million, with the $471 million increase relative to the comparable period of the prior year being attributable to the following factors:
| Net earnings for the three months ended December 31, 2024 |
$ | 88,148 | ||
| Changes in: |
||||
| Revenue: GEO production |
$ | 43,599 | ||
| Revenue: PBND |
88,697 | |||
| Revenue: Delay ounces received |
(545) | |||
| Revenue: Prices realized per GEO sold |
352,447 | |||
| Cost of sales: Sales volume |
(41,600) | |||
| Cost of sales: Sales mix differences |
(19,411) | |||
| Cost of sales: Cash cost per ounce |
(11,924) | |||
| Cost of sales: Depletion per ounce |
4,716 | |||
| Cost of sales: Delay ounces received 1 |
144 | |||
| Impairment of mineral stream interests |
108,861 | |||
| General and administrative and share based compensation |
3,088 | |||
| Donations and community investments |
63 | |||
| Other income / expense and finance costs |
(2,812) | |||
| Income taxes |
(55,221) | |||
| Total increase in net earnings |
470,102 | |||
| Net earnings for the three months ended December 31, 2025 |
$ | 558,250 | ||
| 1) | The cost of sales related to delay ounces is a non-cash expense (see footnote 3 on page 9 of this MD&A for more information). |
WHEATON PRECIOUS METALS 2025 ANNUAL REPORT- MANAGEMENT DISCUSSION & ANALYSIS [24]
Results of Operations For The Year Ended December 31, 2025 and 2024
The following two tables present the results of operations based on the Company’s reportable operating segments.
| Year Ended December 31, 2025 | ||||||||||||||||||||||||||||||||||||||||
| Units Produced² |
Units Sold |
Average Realized Price ($‘s Per Unit) |
Average Cash Cost ($‘s Per Unit) 3 |
Average Depletion ($‘s Per Unit) 4 |
Sales | Gain on Disposal 5 |
Net Earnings |
Cash Flow From Operations |
Total Assets |
|||||||||||||||||||||||||||||||
| Gold |
||||||||||||||||||||||||||||||||||||||||
| Salobo |
296,706 | 299,605 | $ | 3,471 | $ | 429 | $ | 396 | $ | 1,039,878 | $ | - | $ | 792,618 | $ | 911,393 | $ | 2,620,710 | ||||||||||||||||||||||
| Sudbury 6 |
22,943 | 16,925 | 3,444 | 400 | 1,362 | 58,290 | - | 28,463 | 51,506 | 218,494 | ||||||||||||||||||||||||||||||
| Constancia |
37,673 | 36,352 | 3,629 | 427 | 331 | 131,904 | - | 104,347 | 116,389 | 52,284 | ||||||||||||||||||||||||||||||
| San Dimas |
31,116 | 31,538 | 3,469 | 641 | 357 | 109,411 | - | 77,939 | 89,202 | 125,218 | ||||||||||||||||||||||||||||||
| Stillwater |
6,228 | 6,588 | 3,463 | 605 | 495 | 22,811 | - | 15,567 | 18,825 | 204,202 | ||||||||||||||||||||||||||||||
| Blackwater |
15,425 | 15,089 | 3,748 | 1,307 | 609 | 56,549 | - | 27,651 | 40,543 | 331,048 | ||||||||||||||||||||||||||||||
| Platreef |
- | - | n.a. | n.a. | n.a. | - | - | - | - | 275,702 | ||||||||||||||||||||||||||||||
| Other 7 |
6,080 | 4,908 | 3,540 | 473 | 1,335 | 17,375 | 85,724 | 94,227 | 15,054 | 1,457,132 | ||||||||||||||||||||||||||||||
| 416,171 | 411,005 | $ | 3,494 | $ | 479 | $ | 448 | $ | 1,436,218 | $ | 85,724 | $ | 1,140,812 | $ | 1,242,912 | $ | 5,284,790 | |||||||||||||||||||||||
| Silver |
||||||||||||||||||||||||||||||||||||||||
| Peñasquito |
7,765 | 7,575 | $ | 39.82 | $ | 4.56 | $ | 4.96 | $ | 301,590 | $ | - | $ | 229,453 | $ | 267,052 | $ | 206,866 | ||||||||||||||||||||||
| Antamina |
5,801 | 5,402 | 42.59 | 8.65 | 5.87 | 230,098 | - | 151,672 | 183,359 | 459,083 | ||||||||||||||||||||||||||||||
| Constancia |
2,415 | 2,243 | 39.76 | 6.28 | 6.23 | 89,156 | - | 61,095 | 75,070 | 151,403 | ||||||||||||||||||||||||||||||
| Blackwater |
457 | 417 | 46.50 | 8.27 | 8.27 | 19,378 | - | 12,486 | 16,561 | 167,502 | ||||||||||||||||||||||||||||||
| Other 8 |
5,851 | 4,159 | 47.21 | 7.55 | 4.36 | 196,449 | - | 146,898 | 130,717 | 556,887 | ||||||||||||||||||||||||||||||
| 22,289 | 19,796 | $ | 42.26 | $ | 6.58 | $ | 5.30 | $ | 836,671 | $ | - | $ | 601,604 | $ | 672,759 | $ | 1,541,741 | |||||||||||||||||||||||
| Palladium |
||||||||||||||||||||||||||||||||||||||||
| Stillwater |
10,265 | 9,356 | $ | 1,126 | $ | 195 | $ | 458 | $ | 10,536 | $ | - | $ | 4,422 | $ | 8,709 | $ | 208,892 | ||||||||||||||||||||||
| Platreef |
- | - | n.a. | n.a. | n.a. | - | - | - | - | 78,814 | ||||||||||||||||||||||||||||||
| 10,265 | 9,356 | $ | 1,126 | $ | 195 | $ | 458 | $ | 10,536 | $ | - | $ | 4,422 | $ | 8,709 | $ | 287,706 | |||||||||||||||||||||||
| Platinum |
||||||||||||||||||||||||||||||||||||||||
| Marathon |
- | - | $ | n.a. | $ | n.a. | $ | n.a. | $ | - | $ | - | $ | - | $ | - | $ | 9,451 | ||||||||||||||||||||||
| Platreef |
- | - | n.a. | n.a. | n.a. | - | - | - | - | 57,584 | ||||||||||||||||||||||||||||||
| - | - | $ | n.a. | $ | n.a. | $ | n.a. | $ | - | $ | - | $ | - | $ | - | $ | 67,035 | |||||||||||||||||||||||
| Cobalt |
||||||||||||||||||||||||||||||||||||||||
| Voisey’s Bay |
2,460 | 1,632 | $ | 19.11 | $ | 3.57 | $ | 9.08 | $ | 31,175 | $ | - | $ | 10,534 | $ | 23,079 | $ | 215,877 | ||||||||||||||||||||||
| Operating results |
$ | 2,314,600 | $ | 85,724 | $ | 1,757,372 | $ | 1,947,459 | $ | 7,397,149 | ||||||||||||||||||||||||||||||
| Other |
||||||||||||||||||||||||||||||||||||||||
| General and administrative |
|
$ | (46,767) | $ | (44,227) | |||||||||||||||||||||||||||||||||||
| Share based compensation |
|
(32,504) | (17,209) | |||||||||||||||||||||||||||||||||||||
| Donations and community investments |
|
(10,736) | (10,396) | |||||||||||||||||||||||||||||||||||||
| Finance costs |
|
(5,760) | (4,444) | |||||||||||||||||||||||||||||||||||||
| Other |
|
36,463 | 37,443 | |||||||||||||||||||||||||||||||||||||
| Income tax |
|
(226,348) | (3,645) | |||||||||||||||||||||||||||||||||||||
| Total other |
$ | (285,652) | $ | (42,478) | $ | 1,728,632 | ||||||||||||||||||||||||||||||||||
| $ | 1,471,720 | $ | 1,904,981 | $ | 9,125,781 | |||||||||||||||||||||||||||||||||||
| 1) | Units of gold, silver and palladium produced and sold are reported in ounces, while cobalt is reported in pounds. All figures in thousands except gold and palladium ounces produced and sold and per unit amounts. |
| 2) | Quantity produced represents the amount of gold, silver, palladium and cobalt contained in concentrate or doré prior to smelting or refining deductions. Production figures are based on information provided by the operators of the mining operations to which the mineral stream interests relate or management estimates in those situations where other information is not available. Certain production figures may be updated in future periods as additional information is received. |
| 3) | Refer to discussion on non-GAAP measure (iii) on page 48 of this MD&A. |
| 4) | Includes the non-cash per ounce cost of sale associated with delay ounces. Please see footnote 3 on page 9 of this MD&A for more information. |
| 5) | Refer to page 29 of this MD&A for more information. |
| 6) | Comprised of the operating Coleman, Copper Cliff, Garson, Creighton, Stobie and Totten gold interests and the non-operating Victor gold interest. |
| 7) | Other gold interests comprised of the operating Marmato, Goose and Hemlo gold interests as well as the non-operating Copper World, Santo Domingo, Fenix, El Domo, Marathon, Cangrejos, Curraghinalt, Kudz Ze Kayah, Koné and Kurmuk, Spring Valley gold interests. Other includes ounces sold that were received under the delay ounce provision of the Santo Domingo PMPA (see footnote 3 on page 9 of this MD&A for more information). |
| 8) | Other silver interests comprised of the operating Los Filos, Zinkgruvan, Neves-Corvo, Aljustrel, Marmato and Cozamin silver interests as well as the non-operating Stratoni, El Alto (previously referred to as Pascua-Lama), Copper World, Navidad, El Domo, Mineral Park and Kudz Ze Kayah silver interests. |
| 9) | During the current period, the Company classified the Blackwater and Platreef PMPAs as reportable segments. |
WHEATON PRECIOUS METALS 2025 ANNUAL REPORT- MANAGEMENT DISCUSSION & ANALYSIS [25]
| Year Ended December 31, 2024 | ||||||||||||||||||||||||||||||||||||||||
| Units Produced² |
Units Sold |
Average Realized Price ($‘s Per Unit) |
Average Cash Cost ($‘s Per Unit) 3 |
Average Depletion ($‘s Per Unit) 4 |
Sales | Impairment Charges |
Net Earnings |
Cash Flow From Operations |
Total Assets |
|||||||||||||||||||||||||||||||
| Gold |
||||||||||||||||||||||||||||||||||||||||
| Salobo |
271,827 | 225,074 | $ | 2,397 | $ | 425 | $ | 382 | $ | 539,583 | $ | - | $ | 358,081 | $ | 444,015 | $ | 2,595,485 | ||||||||||||||||||||||
| Sudbury 5 |
18,947 | 16,351 | 2,391 | 400 | 1,280 | 39,098 | - | 11,623 | 32,571 | 241,551 | ||||||||||||||||||||||||||||||
| Constancia |
50,072 | 49,822 | 2,370 | 422 | 320 | 118,096 | - | 81,126 | 97,066 | 64,326 | ||||||||||||||||||||||||||||||
| San Dimas |
28,776 | 28,746 | 2,388 | 635 | 287 | 68,654 | - | 42,166 | 50,407 | 136,481 | ||||||||||||||||||||||||||||||
| Stillwater |
9,149 | 9,028 | 2,392 | 425 | 444 | 21,592 | - | 13,743 | 17,752 | 207,460 | ||||||||||||||||||||||||||||||
| Blackwater |
- | - | n.a. | n.a. | n.a. | - | - | - | - | 340,231 | ||||||||||||||||||||||||||||||
| Platreef |
- | - | n.a. | n.a. | n.a. | - | - | - | - | 275,702 | ||||||||||||||||||||||||||||||
| Other 6 |
2,477 | 3,680 | 2,453 | 284 | 1,192 | 9,028 | - | 3,596 | 7,982 | 365,383 | ||||||||||||||||||||||||||||||
| 381,248 | 332,701 | $ | 2,393 | $ | 440 | $ | 419 | $ | 796,051 | $ | - | $ | 510,335 | $ | 649,793 | $ | 4,226,619 | |||||||||||||||||||||||
| Silver |
||||||||||||||||||||||||||||||||||||||||
| Peñasquito |
9,156 | 6,840 | $ | 28.34 | $ | 4.50 | $ | 4.64 | $ | 193,871 | $ | - | $ | 131,325 | $ | 163,092 | $ | 244,465 | ||||||||||||||||||||||
| Antamina |
3,821 | 3,526 | 28.56 | 5.74 | 8.16 | 100,719 | - | 51,738 | 80,497 | 490,771 | ||||||||||||||||||||||||||||||
| Constancia |
2,709 | 2,311 | 28.25 | 6.23 | 6.15 | 65,264 | - | 36,676 | 50,881 | 165,378 | ||||||||||||||||||||||||||||||
| Blackwater |
- | - | n.a. | n.a. | n.a. | - | - | - | - | 140,908 | ||||||||||||||||||||||||||||||
| Other 7 |
5,273 | 3,395 | 28.85 | 4.31 | 4.71 | 97,976 | - | 67,356 | 85,230 | 521,722 | ||||||||||||||||||||||||||||||
| 20,959 | 16,072 | $ | 28.49 | $ | 4.98 | $ | 5.64 | $ | 457,830 | $ | - | $ | 287,095 | $ | 379,700 | $ | 1,563,244 | |||||||||||||||||||||||
| Palladium |
||||||||||||||||||||||||||||||||||||||||
| Stillwater |
15,632 | 17,270 | $ | 984 | $ | 179 | $ | 434 | $ | 16,999 | $ | - | $ | 6,423 | $ | 13,911 | $ | 213,179 | ||||||||||||||||||||||
| Platreef |
- | - | n.a. | n.a. | n.a. | - | - | - | - | 78,814 | ||||||||||||||||||||||||||||||
| 15,632 | 17,270 | $ | 984 | $ | 179 | $ | 434 | $ | 16,999 | $ | - | $ | 6,423 | $ | 13,911 | $ | 291,993 | |||||||||||||||||||||||
| Platinum |
||||||||||||||||||||||||||||||||||||||||
| Marathon |
- | - | $ | n.a. | $ | n.a. | $ | n.a. | $ | - | $ | - | $ | - | $ | - | $ | 9,451 | ||||||||||||||||||||||
| Platreef |
- | - | n.a. | n.a. | n.a. | - | - | - | - | 57,584 | ||||||||||||||||||||||||||||||
| - | - | $ | n.a. | $ | n.a. | $ | n.a. | $ | - | $ | - | $ | - | $ | - | $ | 67,035 | |||||||||||||||||||||||
| Cobalt |
||||||||||||||||||||||||||||||||||||||||
| Voisey’s Bay |
1,289 | 970 | $ | 14.18 | $ | 2.71 | $ | 12.78 | $ | 13,759 | $ | (108,861) | $ | (110,127) | $ | 14,025 | $ | 230,689 | ||||||||||||||||||||||
| Operating results |
$ | 1,284,639 | $ | (108,861) | $ | 693,726 | $ | 1,057,429 | $ | 6,379,580 | ||||||||||||||||||||||||||||||
| Other |
||||||||||||||||||||||||||||||||||||||||
| General and administrative |
|
$ | (40,668) | $ | (38,130) | |||||||||||||||||||||||||||||||||||
| Share based compensation |
|
(23,268) | (11,129) | |||||||||||||||||||||||||||||||||||||
| Donations and community investments |
|
(8,958) | (8,098) | |||||||||||||||||||||||||||||||||||||
| Finance costs |
|
(5,549) | (4,280) | |||||||||||||||||||||||||||||||||||||
| Other |
|
29,061 | 23,273 | |||||||||||||||||||||||||||||||||||||
| Income tax |
|
(115,204) | 8,516 | |||||||||||||||||||||||||||||||||||||
| Total other |
$ | (164,586) | $ | (29,848) | $ | 1,044,877 | ||||||||||||||||||||||||||||||||||
| $ | 529,140 | $ | 1,027,581 | $ | 7,424,457 | |||||||||||||||||||||||||||||||||||
| 1) | Units of gold, silver and palladium produced and sold are reported in ounces, while cobalt is reported in pounds. All figures in thousands except gold and palladium ounces produced and sold and per unit amounts. |
| 2) | Quantity produced represents the amount of gold, silver, palladium and cobalt contained in concentrate or doré prior to smelting or refining deductions. Production figures are based on information provided by the operators of the mining operations to which the mineral stream interests relate or management estimates in those situations where other information is not available. Certain production figures may be updated in future periods as additional information is received. |
| 3) | Refer to discussion on non-GAAP measure (iii) on page 48 of this MD&A. |
| 4) | Includes the non-cash per ounce cost of sale associated with delay ounces. Please see footnote 3 on page 9 of this MD&A for more information. |
| 5) | Comprised of the operating Coleman, Copper Cliff, Garson, Creighton and Totten gold interests as well as the non-operating Stobie and Victor gold interests. |
| 6) | Other gold interests are comprised of the operating Marmato gold interest as well as the non-operating Minto, Copper World, Santo Domingo, Fenix, El Domo, Marathon, Goose, Cangrejos, Curraghinalt and Kudz Ze Kayah gold interests. Other includes ounces sold that were received under the delay ounce provision of the Santo Domingo and El Domo PMPAs (see footnote 3 on page 9 of this MD&A for more information). |
| 7) | Other silver interests comprised of the operating Los Filos, Zinkgruvan, Neves-Corvo, Marmato and Cozamin silver interests as well as the non-operating Stratoni, Aljustrel, Minto, El Alto (previously referred to as Pascua-Lama), Copper World, Navidad, El Domo, Mineral Park and Kudz Ze Kayah silver interests. |
| 8) | During the current period, the Company classified the Blackwater and Platreef PMPAs as reportable segments. The comparative figures have been reclassified to conform with this presentation. |
WHEATON PRECIOUS METALS 2025 ANNUAL REPORT- MANAGEMENT DISCUSSION & ANALYSIS [26]
Comparative Results of Operations on a GEO Basis
| 2025 | 2024 | Change | Change | |||||||||||||
| GEO Production 1, 2 |
689,864 | 635,488 | 54,377 | 8.6 % | ||||||||||||
| GEO Sales 2 |
651,311 | 529,493 | 121,818 | 23.0 % | ||||||||||||
| Average price per GEO sold 2 |
$ | 3,554 | $ | 2,426 | $ | 1,128 | 46.5 % | |||||||||
| Revenue |
$ | 2,314,600 | $ | 1,284,639 | $ | 1,029,961 | 80.2 % | |||||||||
| Cost of sales, excluding depletion |
$ | 339,063 | $ | 235,108 | $ | (103,955 | ) | (44.2)% | ||||||||
| Depletion |
303,889 | 246,944 | (56,945 | ) | (23.1)% | |||||||||||
| Cost of sales |
$ | 642,952 | $ | 482,052 | $ | (160,900 | ) | (33.4)% | ||||||||
| Gross margin |
$ | 1,671,648 | $ | 802,587 | $ | 869,061 | 108.3 % | |||||||||
| General and administrative |
46,767 | 40,668 | (6,099 | ) | (15.0)% | |||||||||||
| Share based compensation |
32,504 | 23,268 | (9,236 | ) | (39.7)% | |||||||||||
| Donations and community investments |
10,736 | 8,958 | (1,778 | ) | (19.8)% | |||||||||||
| Impairment of mineral stream interests |
- | 108,861 | 108,861 | 100.0 % | ||||||||||||
| Earnings from operations |
$ | 1,581,641 | $ | 620,832 | $ | 960,809 | 154.8 % | |||||||||
| Gain on disposal of mineral stream interests |
85,724 | - | 85,724 | n.a. | ||||||||||||
| Other income (expense) |
36,463 | 29,061 | 7,402 | 25.5 % | ||||||||||||
| Earnings before finance costs and income taxes |
$ | 1,703,828 | $ | 649,893 | $ | 1,053,935 | 162.2 % | |||||||||
| Finance costs |
5,760 | 5,549 | (211 | ) | (3.8)% | |||||||||||
| Earnings before income taxes |
$ | 1,698,068 | $ | 644,344 | $ | 1,053,724 | 163.5 % | |||||||||
| Income tax expense |
226,348 | 115,204 | (111,144 | ) | (96.5)% | |||||||||||
| Net earnings |
$ | 1,471,720 | $ | 529,140 | $ | 942,580 | 178.1 % | |||||||||
| 1) | Quantity produced represents the amount of gold, silver, palladium and cobalt contained in concentrate or doré prior to smelting or refining deductions. Production figures are based on information provided by the operators of the mining operations to which the mineral stream interests relate or management estimates in those situations where other information is not available. Certain production figures may be updated in future periods as additional information is received. |
| 2) | GEOs, which are provided to assist the reader, are based on the following commodity price assumptions: $2,600 per ounce gold; $30.00 per ounce silver; $950 per ounce palladium; and $13.50 per pound cobalt; consistent with those used in estimating the Company’s production guidance for 2025. |
WHEATON PRECIOUS METALS 2025 ANNUAL REPORT- MANAGEMENT DISCUSSION & ANALYSIS [27]
GEO Production
For the year ended December 31, 2025, attributable GEO production was 689,900 ounces, with the 54,400 ounce increase from the comparable period in 2024 being primarily attributable to the following factors:
| ● | 24,900 ounce or 9% increase from Salobo primarily the result of higher throughput resulting from improved efficiencies at Salobo 1 and 2, partially offset by lower grades and recoveries.; |
| ● | 22,900 ounce or 52% increase from Antamina (1,981,000 silver ounces), primarily due to higher grades and throughput, partially offset by lower recoveries; |
| ● | 20,700 ounce increase from Blackwater (comprised of 15,400 gold ounces and 456,000 silver ounces), with the mine achieving commercial production in May 2025; |
| ● | 10,300 ounce or 16% increase from the Other mines (comprised of 3,600 gold ounces and 579,000 silver ounces), primarily due to the resumption of mining at Aljustrel, coupled with the commencement of production at Goose and the acquisition of the Hemlo PMPA; |
| ● | 6,100 ounce or 91% increase from Voisey’s Bay (1,171,000 cobalt pounds) as the underground mine at Voisey’s Bay continues ramp-up to full production, with full ramp-up expected by the second half of 2026; |
| ● | 4,000 ounce or 21% increase from Sudbury, primarily due to higher throughput and recoveries, partially offset by lower grades; and |
| ● | 2,300 ounce or 8% increase from San Dimas, with higher throughput being partially offset by the change of the gold to silver conversion ratio from 70:1 to 90:1, effective for the period April 30, 2025 to October 28, 2025. On October 29, 2025, the gold to silver conversion ratio returned to 70:1; partially offset by |
| ● | 16,100 ounce or 15% decrease from Peñasquito (1,393,000 silver ounces), primarily the result of lower grades as mining activities have transitioned back into the Peñasco pit which contains lower silver grades relative to the Chile Colorado pit; |
| ● | 15,800 ounce or 19% decrease from Constancia (comprised of 12,400 gold ounces and 293,000 silver ounces), primarily due to lower grades; and |
| ● | 4,900 ounce or 33% decrease from Stillwater (comprised of 2,900 gold ounces and 5,400 palladium ounces), primarily due to lower throughput as Stillwater West operations were placed into care and maintenance in September 2024. |
Net Earnings
For the year ended December 31, 2025, net earnings amounted to $1.5 billion, with the $943 million increase relative to the comparable period of the prior year being attributable to the following factors:
| Net earnings for the year ended December 31, 2024 |
$ | 529,140 | ||
| Changes in: |
||||
| Revenue: GEO production |
$ | 138,969 | ||
| Revenue: PBND |
156,004 | |||
| Revenue: Delay ounces received |
64 | |||
| Revenue: Prices realized per GEO sold |
734,924 | |||
| Cost of sales: Sales volume |
(104,278 | ) | ||
| Cost of sales: Sales mix differences |
(29,335 | ) | ||
| Cost of sales: Cash cost per ounce |
(31,340 | ) | ||
| Cost of sales: Depletion per ounce |
5,155 | |||
| Cost of sales: Delay ounces received 1 |
(1,102 | ) | ||
| Gain on disposal of mineral stream interest |
85,724 | |||
| Impairment of mineral stream interests |
108,861 | |||
| General and administrative and share based compensation |
(15,335 | ) | ||
| Donations and community investments |
(1,778 | ) | ||
| Other income / expense and finance costs |
7,191 | |||
| Income taxes |
(111,144 | ) | ||
| Total increase in net earnings |
$ | 942,580 | ||
| Net earnings for the year ended December 31, 2025 |
$ | 1,471,720 | ||
| 1) | The cost of sales related to delay ounces is a non-cash expense (see footnote 3 on page 9 of this MD&A for more information). |
WHEATON PRECIOUS METALS 2025 ANNUAL REPORT- MANAGEMENT DISCUSSION & ANALYSIS [28]
Gain on Partial Disposal of Mineral Stream Interest
Cangrejos
On September 16, 2025, in connection with its acquisition of Lumina, CMOC exercised its 33% buy-back option under the Cangrejos PMPA for a cash payment of $102 million, resulting in a gain of $86 million on the partial disposal of the Cangrejos PMPA, calculated as follows:
| (in thousands) | ||||
| Proceeds received on 33% buyback of Cangrejos |
$ | 101,730 | ||
| Less: 33% carrying value |
(16,006 | ) | ||
| Gain on partial disposal of the Cangrejos PMPA |
$ | 85,724 | ||
General and Administrative
The following tables provide a breakdown of general and administrative expenses incurred for the three months and years ended December 31, 2025 and 2024, respectively:
| Three Months Ended December 31 |
Years Ended December 31 |
|||||||||||||||
| (in thousands) | 2025 | 2024 | 2025 | 2024 | ||||||||||||
| Salaries and benefits |
$ | 6,682 | $ | 5,370 | $ | 25,988 | $ | 21,795 | ||||||||
| Depreciation |
350 | 318 | 1,277 | 1,359 | ||||||||||||
| Professional fees, audit and regulatory |
2,230 | 2,140 | 8,246 | 6,718 | ||||||||||||
| Business travel |
577 | 527 | 2,147 | 2,117 | ||||||||||||
| Business taxes |
130 | 117 | 1,166 | 1,007 | ||||||||||||
| Insurance |
404 | 498 | 1,884 | 1,878 | ||||||||||||
| Other |
1,423 | 1,505 | 6,059 | 5,794 | ||||||||||||
|
Total general and administrative |
$ | 11,796 | $ | 10,475 | $ | 46,767 | $ | 40,668 | ||||||||
Share Based Compensation
| Three Months Ended December 31 |
Years Ended December 31 |
|||||||||||||||
| (in thousands) | 2025 | 2024 | 2025 | 2024 | ||||||||||||
| Equity settled share based compensation 1 |
||||||||||||||||
| Share purchase options |
$ | 678 | $ | 733 | $ | 2,653 | $ | 2,837 | ||||||||
| Restricted share units |
951 | 992 | 3,822 | 3,866 | ||||||||||||
| Cash settled share based compensation |
||||||||||||||||
| Performance share units |
80 | 4,393 | 26,029 | 16,565 | ||||||||||||
| Total share based compensation |
$ | 1,709 | $ | 6,118 | $ | 32,504 | $ | 23,268 | ||||||||
| 1) | Equity settled share based compensation is a non-cash expense. |
For the three months ended December 31, 2025, share based compensation decreased by $4 million relative to the comparable period in the previous year, while for the year ended December 31, 2025, share based compensation increased by $9 million relative to the comparable period in the previous year. The year-over-year change primarily reflects differences in accrued costs related to the Company’s performance share units (PSUs), as the impact of a higher share price was offset by a lower estimated performance factor at maturity.
WHEATON PRECIOUS METALS 2025 ANNUAL REPORT- MANAGEMENT DISCUSSION & ANALYSIS [29]
Donations and Community Investments
| Three Months Ended December 31 |
Years Ended December 31 |
|||||||||||||||
| (in thousands) | 2025 | 2024 | 2025 | 2024 | ||||||||||||
| Local donations and community investments 1 |
$ | 1,452 | $ | 983 | $ | 3,694 | $ | 2,934 | ||||||||
| Partner donations and community investments 2 |
2,586 | 3,349 | 5,676 | 6,024 | ||||||||||||
| Environmental and innovation investments 3 |
231 | - | 1,366 | - | ||||||||||||
| Total donations and community investments |
$ | 4,269 | $ | 4,332 | $ | 10,736 | $ | 8,958 | ||||||||
| 1) | The Local Community Investment Program supports organizations in Vancouver and the Cayman Islands, where Wheaton’s offices are located. |
| 2) | The Partner Community Investment Program supports the communities influenced by Mining Partners’ operations. |
| 3) | Includes the Company’s funding of initiatives that seek to reduce environmental impacts and support innovation and efficiency in mining, including costs associated with the Future of Mining Challenge. |
Other Income (Expense)
| Three Months Ended December 31 |
Years Ended December 31 |
|||||||||||||||
| (in thousands) | 2025 | 2024 | 2025 | 2024 | ||||||||||||
| Interest income |
$ | 9,748 | $ | 7,925 | $ | 36,729 | $ | 24,826 | ||||||||
| Dividend income |
286 | 525 | 1,051 | 2,188 | ||||||||||||
| Foreign exchange gain (loss) |
(5,422) | 1,650 | (6,277) | 2,095 | ||||||||||||
| Gain (loss) on fair value adjustment of share purchase warrants held |
1,283 | (910) | 5,805 | (8) | ||||||||||||
| Other |
478 | (52) | (845) | (40) | ||||||||||||
| Total other income (expense) |
$ | 6,373 | $ | 9,138 | $ | 36,463 | $ | 29,061 | ||||||||
Interest Income
For the three months ended December 31, 2025, interest income increased by $2 million, a result of the average cash balance during the period increasing from approximately $605 million with an average rate of return of 4.6% to approximately $985 million with an average rate of return of 3.8%.
For the year ended December 31, 2025, interest income increased by $12 million, a result of the average cash balance during the period increasing from approximately $466 million with an average rate of return of 5.0% to approximately $874 million with an average rate of return of 4.1%.
Finance Costs
| Three Months Ended December 31 |
Years Ended December 31 |
|||||||||||||||
| (in thousands) | 2025 | 2024 | 2025 | 2024 | ||||||||||||
| Costs related to undrawn credit facilities |
$ | 1,332 | $ | 1,337 | $ | 5,331 | $ | 5,347 | ||||||||
| Interest expense - lease liabilities |
119 | 67 | 429 | 284 | ||||||||||||
| Letter of guarantee |
- | - | - | (82) | ||||||||||||
| Total finance costs |
$ | 1,451 | $ | 1,404 | $ | 5,760 | $ | 5,549 | ||||||||
WHEATON PRECIOUS METALS 2025 ANNUAL REPORT- MANAGEMENT DISCUSSION & ANALYSIS [30]
Income Tax Expense
Income tax recognized in net earnings is comprised of the following:
| Three Months Ended December 31 |
Years Ended December 31 |
|||||||||||||||
| (in thousands) | 2025 | 2024 | 2025 | 2024 | ||||||||||||
| Current income tax expense (recovery) |
$ | 114 | $ | 753 | $ | (3,045) | $ | (1,275) | ||||||||
| Global minimum income tax expense |
94,276 | 35,144 | 247,412 | 113,505 | ||||||||||||
| Total current income tax expense |
$ | 94,390 | $ | 35,897 | $ | 244,367 | $ | 112,230 | ||||||||
| Deferred income tax expense (recovery) related to: |
||||||||||||||||
| Origination and reversal of temporary differences |
$ | 7,372 | $ | (4,218) | $ | 19,747 | $ | (318) | ||||||||
| Write down (reversal of write down) or recognition of prior period temporary differences |
(9,334) | 5,528 | (37,766) | 3,292 | ||||||||||||
| Total deferred income tax (recovery) expense |
$ | (1,962) | $ | 1,310 | $ | (18,019) | $ | 2,974 | ||||||||
| Total income tax expense recognized in net earnings |
$ | 92,428 | $ | 37,207 | $ | 226,348 | $ | 115,204 | ||||||||
| Effective tax rate |
14% | 30% | 13% | 18% | ||||||||||||
For the three months and year ended December 31, 2025, the Company recorded increases in global minimum tax (“GMT”) expense of $59 million and $134 million, respectively, primarily attributable to higher net earnings from the Cayman Islands subsidiaries, which rose by $394 million and $893 million over the respective prior-year periods.
GMT is payable to the Government of Canada 15 months after year-end (18 months after year-end for the year ended December 31, 2024). To date, the government of the Cayman Islands has indicated that they do not intend to enact Pillar Two Legislation.
During the year ended December 31, 2025, the Company recorded a deferred tax expense of $22 million in other comprehensive income as a result of increased unrealized gains on long-term equity investments. This was partly offset by an $18 million deferred tax recovery recognized in net earnings, driven predominantly by the recognition of $38 million of previously unrecognized deferred tax assets and offset by $20 million of temporary-difference movements arising from regular operations.
Note that the Company’s effective tax rate was higher in 2024 relative to 2025, with the 2024 effective tax rate being elevated due to an impairment charge on the Company’s Voisey’s Bay PMPA held in Canada, which reduced the Canadian net income and deferred tax position. The 2024 impairment did not impact the net income position of the Cayman operations which is subject to a 15% GMT. Additionally, the 2025 effective tax rate is lower due to the significant deferred tax recovery in net earnings that resulted from the recognition of previously unrecognized deferred tax assets.
Liquidity and Capital Resources1
As at December 31, 2025, the Company had cash and cash equivalents of $1.2 billion (December 31, 2024 - $818 million) and no debt outstanding under its Revolving Facility (December 31, 2024 - $NIL). The Company expects to make the $4.3 billion upfront payment relative to the Antamina stream on or around April 1, 2026.
The upfront payment of $4.3 billion will be funded through a combination of existing liquidity and new financing. Funding sources include estimated cash on hand at closing of approximately $1.9 billion, including the $1.2 billion cash on hand at December 31, 2025 in addition to $323 million realized on the disposal of certain Long-Term Equity Investments. The remaining balance will be funded through an approximate $0.9 billion draw on the Company’s Revolving Facility, in addition to a new $1.5 billion non-revolving term loan credit facility (the “Term Loan”) which carries a two-year maturity and aligns with the terms of the Company’s existing Revolving Facility.
| 1 | Statements made in this section contain forward-looking information with respect to funding outstanding commitments and continuing to acquire accretive mineral stream interests and readers are cautioned that actual outcomes may vary. Please see “Cautionary Note Regarding Forward-Looking Statements” for material risks, assumptions and important disclosures associated with this information. |
WHEATON PRECIOUS METALS 2025 ANNUAL REPORT- MANAGEMENT DISCUSSION & ANALYSIS [31]
The Term Loan and the Revolving Facility provide flexible, non-dilutive financing that may be repaid at any time without penalty. The remaining liquidity available from the Revolving Facility, in addition to continued strong operating cash flows, provides healthy balance sheet capacity. Net debt at closing of the BHP Antamina PMPA acquisition is currently expected to be approximately $2.4 billion1, assuming estimated approximate incremental cash flows.
In the opinion of management, with the liquidity provided by the remaining available credit under the $2 billion Revolving Facility coupled with the $500 million accordion and ongoing operating cash flows, the Company remains well positioned to fund all outstanding commitments, as detailed in the Contractual Obligations and Contingencies section on pages 36 through 41 of this MD&A, as well as providing flexibility to acquire additional accretive mineral stream interests.
A summary of the Company’s cash flow activity is as follows:
Three Months Ended December 31, 2025
Cash Flows From Operating Activities
During the three months ended December 31, 2025, the Company generated operating cash flows of $746 million, with the $427 million increase relative to the comparable period of the prior year being attributable to the following factors:
| Operating cash inflow for the three months ended December 31, 2024 |
$ | 319,471 | ||
| Changes in: |
||||
| Revenue |
$ | 484,198 | ||
| Cost of sales (excluding depletion) |
(50,865) | |||
| Working Capital changes |
(2,960) | |||
| General and administrative |
(635) | |||
| Donations and community investments |
(67) | |||
| Finance costs |
(68) | |||
| Income taxes |
(5,823) | |||
| Interest received |
1,944 | |||
| Other |
1,082 | |||
| Total increase to net cash inflows |
$ | 426,806 | ||
| Operating cash inflow for the three months ended December 31, 2025 |
$ | 746,277 |
| 1) | The cost of sales related to delay ounces is a non-cash expense (see footnote 3 on page 9 of this MD&A for more information). |
Cash Flows From Financing Activities
During the three months ended December 31, 2025, the Company had net cash outflows from financing activities of $74 million, as compared to $70 million for the comparable period of the previous year, with the major sources (uses) of cash flows being as follows:
| Three Months Ended December 31 |
||||||||
| (in thousands) |
2025 | 2024 | ||||||
| Credit facility extension fees |
$ | - | $ | (1 | ) | |||
| Share purchase options exercised |
856 | 181 | ||||||
| Lease payments |
(167 | ) | (150 | ) | ||||
| Dividends paid |
(74,197 | ) | (69,942 | ) | ||||
| Cash used for financing activities |
$ | (73,508 | ) | $ | (69,912 | ) | ||
| 1 | Estimated approximate net debt at closing based on: (i) 2026 production forecast as detailed in the Outlook section of this MD&A; (ii) production payments per ounce (pound) of metal received determined under applicable PMPAs; (iii) 2026 and long-term commodity price assumptions of $4,800 / oz gold, $80 / oz silver, $1,500 / oz palladium, $2,000 / oz platinum, and $25 / lb cobalt, in place throughout the period; (iv) deduction of general & administrative expenses; (v) calculation before dividends and interest expense; (vi) includes taxes. Approximate net debt at closing is an estimate only, is not guaranteed, and may be materially different at the time of the BHP Antamina PMPA acquisition. If cash on hand at BHP Antamina PMPA closing is lower than expected, the Company maintains the option to increase its draw on the Revolving Facility. Please see “Cautionary Note Regarding Forward-Looking Statements” for material risks, assumptions and important disclosures associated with this information. |
WHEATON PRECIOUS METALS 2025 ANNUAL REPORT- MANAGEMENT DISCUSSION & ANALYSIS [32]
Cash Flows From Investing Activities
During the three months ended December 31, 2025, the Company had net cash outflows from investing activities of $677 million, as compared to $125 million during the comparable period of the previous year, with the major sources (uses) of cash flow being as follows:
| Three Months Ended December 31 |
||||||||
| (in thousands) | 2025 | 2024 | ||||||
| Payments for the acquisition of PMPAs 1: |
||||||||
| Hemlo PMPA |
$ | (300,000) | $ | - | ||||
| Kone PMPA |
(156,250) | - | ||||||
| Fenix PMPA |
(50,000) | - | ||||||
| Spring Valley PMPA |
(50,000) | - | ||||||
| El Domo PMPA 2 |
(43,875) | 13,250 | ||||||
| Kurmuk PMPA |
(43,750) | (43,750) | ||||||
| KZK PMPA |
(2,500) | - | ||||||
| Mineral Park PMPA |
- | (25,000) | ||||||
| Marmato PMPA |
- | (40,016) | ||||||
| Cangrejos PMPA |
- | (6,000) | ||||||
| $ | (646,375) | $ | (101,516) | |||||
| Acquisition of long-term equity investments |
(30,159) | (18,755) | ||||||
| Investment in subscription receipts 3 |
- | (3,114) | ||||||
| Other |
(347) | (1,882) | ||||||
| Total cash used for investing activities |
$ | (676,881) | $ | (125,267) | ||||
| 1) | Excludes closing costs. |
| 2) | On November 8, 2024, Silvercorp made a temporary repayment of amounts advanced under the El Domo PMPA, which ended Silvercorp’s requirement to make delay ounce payments under the PMPA (see footnote 3 on page 9 of this MD&A for more information). |
| 3) | The subscription rights relating to the prior year were converted to common shares during the first quarter of 2025 and were reclassified to long-term equity investments. |
WHEATON PRECIOUS METALS 2025 ANNUAL REPORT- MANAGEMENT DISCUSSION & ANALYSIS [33]
Year Ended December 31, 2025
Cash Flows From Operating Activities
During the year ended December 31, 2025, the Company generated operating cash flows of $1.9 billion, with the $877 million increase relative to the comparable period of the prior year being attributable to the following factors:
| Operating cash inflow for the year ended December 31, 2024 |
$ | 1,027,581 | ||
| Changes in: |
||||
| Revenue |
$ | 1,029,961 | ||
| Cost of sales (excluding depletion) |
(102,855) | |||
| Working Capital changes |
(37,076) | |||
| General and administrative |
(6,097) | |||
| Donations and community investments |
(2,298) | |||
| Share based compensation - PSUs |
(6,080) | |||
| Finance costs |
(164) | |||
| Income taxes |
(12,161) | |||
| Interest received |
11,730 | |||
| Other |
2,440 | |||
| Total increase to net cash inflows |
$ | 877,400 | ||
| Operating cash inflow for the year ended December 31, 2025 |
$ | 1,904,981 | ||
| 1) | The cost of sales related to delay ounces is a non-cash expense (see footnote 3 on page 9 of this MD&A for more information). |
Share based compensation - PSUs Variance
The increase to cash outflows relative to PSUs during the period was due to a higher payout in the current year resulting from share price at maturity being 65% higher in 2025 relative to 2024.
WHEATON PRECIOUS METALS 2025 ANNUAL REPORT- MANAGEMENT DISCUSSION & ANALYSIS [34]
Cash Flows From Financing Activities
During the year ended December 31, 2025, the Company had net cash outflows from financing activities of $291 million, as compared to $267 million during the comparable period of the previous year, with the major sources (uses) of cash flow being as follows:
| Years Ended December 31 |
||||||||
| (in thousands) | 2025 | 2024 | ||||||
| Credit facility extension fees |
$ | (955) | $ | (937) | ||||
| Share purchase options exercised |
7,271 | 13,192 | ||||||
| Lease payments |
(505) | (594) | ||||||
| Dividends paid |
(296,367) | (279,050) | ||||||
| Cash used for financing activities |
$ | (290,556) | $ | (267,389) | ||||
Cash Flows From Investing Activities
During the year ended December 31, 2025, the Company had net cash outflows from investing activities of $1.3 billion, as compared to $488 million during the comparable period of the previous year, with the major sources (uses) of cash flow being as follows:
| Years Ended December 31 |
||||||||
| (in thousands) | 2025 | 2024 | ||||||
| Payments for the acquisition of PMPAs 1: |
||||||||
| Kone PMPA |
$ | (468,750) | $ | - | ||||
| Hemlo PMPA |
(300,000) | - | ||||||
| Salobo Expansion PMPA |
(144,000) | - | ||||||
| Kurmuk PMPA |
(131,250) | (43,750) | ||||||
| Fenix PMPA |
(125,000) | - | ||||||
| Spring Valley PMPA |
(50,000) | - | ||||||
| El Domo PMPA 2 |
(43,875) | 13,150 | ||||||
| Mineral Park PMPA |
(40,000) | (75,000) | ||||||
| Blackwater Silver PMPA |
(30,000) | - | ||||||
| KZK PMPA |
(2,500) | (38,500) | ||||||
| Cangrejos PMPA |
(3,100) | (16,200) | ||||||
| Platreef PMPA |
- | (411,500) | ||||||
| Marmato PMPA |
- | (40,016) | ||||||
| $ | (1,338,475) | $ | (611,816) | |||||
| Proceeds on the partial disposal of the Cangrejos PMPA |
101,730 | - | ||||||
| Acquisition of long-term equity investments |
(39,873) | (20,234) | ||||||
| Proceeds on disposal of long-term equity investments |
- | 177,088 | ||||||
| Payments for the acquisition of new royalty agreements: |
||||||||
| DeLamar Royalty |
- | (9,750) | ||||||
| Mt Todd Royalty |
- | (17,000) | ||||||
| Investment in subscription receipts 3 |
- | (3,114) | ||||||
| Other |
(2,525) | (3,477) | ||||||
| Total cash used for investing activities |
$ | (1,279,143) | ($ | 488,303) | ||||
| 1) | Excludes closing costs. |
| 2) | On November 8, 2024, Silvercorp made a temporary repayment of amounts advanced under the El Domo PMPA, which ended Silvercorp’s requirement to make delay ounce payments under the PMPA (see footnote 3 on page 9 of this MD&A for more information). |
| 3) | The subscription rights relating to the prior year were converted to common shares during the first quarter of 2025 and were reclassified to long-term equity investments. |
WHEATON PRECIOUS METALS 2025 ANNUAL REPORT- MANAGEMENT DISCUSSION & ANALYSIS [35]
Contractual Obligations and Contingencies1
Mineral Stream Interests
The following tables summarize the Company’s commitments to make per ounce or per pound cash payments for gold, silver, palladium, platinum and cobalt to which it has the contractual right pursuant to the PMPAs:
Per Ounce Cash Payment for Gold
| Mineral Stream Interests |
Attributable |
Per Ounce Cash Payment 1 |
Term of Agreement |
Date of |
||||||||||||
| Constancia |
50% | $ | 429 | 2 | Life of Mine | 8-Aug-12 | ||||||||||
| Salobo |
75% | $ | 433 | Life of Mine | 28-Feb-13 | |||||||||||
| Sudbury |
70% | $ | 400 | 20 years | 28-Feb-13 | |||||||||||
| San Dimas |
variable | 3 | $ | 643 | Life of Mine | 10-May-18 | ||||||||||
| Stillwater |
100% | 18% | 4 | Life of Mine | 16-Jul-18 | |||||||||||
| Blackwater |
8% | 5 | 35% | Life of Mine | 13-Dec-21 | |||||||||||
| Platreef |
62.5% | 5 | $ | 100 | 5 | Life of Mine | 5 | 7-Dec-21 | 7 | |||||||
| Other |
||||||||||||||||
| Copper World |
100% | $ | 450 | Life of Mine | 10-Feb-10 | |||||||||||
| Marmato |
10.5% | 5 | 18% | 4 | Life of Mine | 5-Nov-20 | ||||||||||
| Santo Domingo |
100% | 5 | 18% | 4 | Life of Mine | 24-Mar-21 | ||||||||||
| Fenix |
22% | 5 | 20% | Life of Mine | 15-Nov-21 | |||||||||||
| El Domo |
50% | 5 | 18% | 4 | Life of Mine | 17-Jan-22 | ||||||||||
| Marathon |
100% | 5 | 18% | 4 | Life of Mine | 26-Jan-22 | ||||||||||
| Goose |
2.78% | 5 | 18% | 4 | Life of Mine | 8-Feb-22 | ||||||||||
| Cangrejos |
4.4% | 5 | 18% | 4 | Life of Mine | 16-May-23 | ||||||||||
| Curraghinalt |
3.05% | 5 | 18% | 4 | Life of Mine | 15-Nov-23 | ||||||||||
| Kudz Ze Kayah |
7.375% | 5 | 20% | Life of Mine | 22-Dec-21 | 7 | ||||||||||
| Koné |
19.5% | 5 | 20% | 8 | Life of Mine | 23-Oct-24 | ||||||||||
| Kurmuk |
6.7% | 5 | 15% | Life of Mine | 5-Dec-24 | |||||||||||
| Spring Valley |
8% | 5 | 20% | 8 | Life of Mine | 6-Nov-25 | ||||||||||
| Hemlo |
10.13% | 5 | 20% | 8 | Life of Mine | 26-Nov-25 | ||||||||||
| Early Deposit |
||||||||||||||||
| Toroparu |
10% | $ | 400 | Life of Mine | 11-Nov-13 | |||||||||||
| Cotabambas |
25% | 5 | $ | 450 | Life of Mine | 21-Mar-16 | ||||||||||
| Kutcho |
100% | 20% | Life of Mine | 14-Dec-17 | ||||||||||||
| 1) | The production payment is measured as either a fixed amount per ounce of gold delivered, or as a percentage of the spot price of gold on the date of delivery. Contracts where the payment is a fixed amount per ounce of gold delivered are subject to an annual inflationary increase, with the exception of Sudbury. Additionally, should the prevailing market price for gold be lower than this fixed amount, the per ounce cash payment will be reduced to the prevailing market price, subject to an annual inflationary factor. |
| 2) | Subject to an increase to $550 per ounce of gold after the initial 40-year term. |
| 3) | Under the terms of the San Dimas PMPA, the Company is entitled to an amount equal to 25% of the payable gold production plus an additional amount of gold equal to 25% of the payable silver production converted to gold at a fixed gold to silver exchange ratio of 70:1 from the San Dimas mine. If the average gold to silver price ratio decreases to less than 50:1 or increases to more than 90:1 for a period of 6 months or more, then the “70” shall be revised to “50” or “90”, as the case may be, until such time as the average gold to silver price ratio is between 50:1 to 90:1 for a period of 6 months or more in which event the “70” shall be reinstated. Effective October 29, 2025, the fixed gold to silver exchange ratio was revised from 90:1 to 70:1. |
| 4) | To be increased to 22% once the market value of all metals delivered to Wheaton, net of the per ounce cash payment, exceeds the initial upfront cash deposit. |
| 5) | Under certain PMPAs, the Company’s attributable gold percentage will be reduced once certain thresholds are achieved: |
| a. | Blackwater – reduced to 4% once the Company has received 464,000 ounces of gold. |
| b. | Platreef - reduced to 50% once the Company has received 218,750 ounces of gold, with a further reduction to 3.125% once the Company has received 428,300 ounces, at which point the per ounce cash payment increases to 80% of the spot price of gold. If certain thresholds are met, including if production through the Platreef project concentrator achieves 5.5 Mtpa, the 3.125% residual gold stream will terminate. |
| c. | Marmato – reduced to 5.25% once Wheaton has received 310,000 ounces of gold. |
| d. | Santo Domingo – reduced to 67% once the Company has received 285,000 ounces of gold. |
| e. | El Domo – reduced to 33% once the Company has received 145,000 ounces of gold. |
| f. | Marathon – reduced to 67% once the Company has received 150,000 ounces of gold. |
| g. | Goose – reduced to 1.44% once the Company has received 87,100 ounces of gold, with a further reduction to 1% once the Company has received 134,000 ounces. |
| h. | Cangrejos – reduced to 2.9% once the Company has received 469,000 ounces of gold. |
| i. | Curraghinalt – reduced to 1.5% once the Company has received 125,000 ounces of gold. |
| j. | Koné - reduced to 10.8% once the Company has received 400,000 ounces of gold, subject to adjustment if there are delays in deliveries relative to an agreed schedule, with a further reduction to 5.4% once the Company has received an additional 130,000 ounces of gold. |
| k. | Kurmuk – reduced to 4.8% once the Company has received 220,000 ounces of gold. During any period in which debt exceeding $150 million ranks ahead of the gold stream, the stream percentage increases to 7.15% and decreases to 5.25% once the drop down threshold is reached. |
| l. | Kudz Ze Kayah – reduced to 6.125% once the Company has received 330,000 ounces of gold, with a further reduction to 5.5% until the Company has received an additional 59,800 ounces of gold, with a further reduction to 5.5% until the Company has received an additional 270,200 ounces of gold, thereafter increased to 6.75%. |
| m. | Cotabambas – reduced to 16.67% once the Company has received 90 million silver equivalent ounces. |
| n. | Spring Valley – reduced to 6% once the Company has received 300,000 ounces of gold. |
| o. | Hemlo – reduced to 6.75% once the Company has received 135,750 ounces of gold (the “First Dropdown Threshold”), with a further reduction to 4.5% once the Company has received an additional 117,998 ounces of gold (the “Second Dropdown Threshold”), at which point this rate will apply for the life of the mine. Each of the First Dropdown Threshold and the Second Dropdown |
| Threshold will be subject to adjustment if there are delays in deliveries relative to an agreed schedule, and |
| 1 | Statements made in this section contain forward-looking information and readers are cautioned that actual outcomes may vary. Please see “Cautionary Note Regarding Forward-Looking Statements” for material risks, assumptions and important disclosures associated with this information. |
WHEATON PRECIOUS METALS 2025 ANNUAL REPORT- MANAGEMENT DISCUSSION & ANALYSIS [36]
| commencing in 2033, if deliveries fall behind the agreed schedule by 10,000 ounces or more, the stream percentage will be increased by 5% until deliveries catch up with the agreed schedule. The payable gold will be reduced by half with respect to gold production from certain claims comprising the Interlake deposit |
| 6) | On October 21, 2024, the Company amended the Fenix PMPA. Under the original agreement, the Company was to acquire an amount of gold equal to 6% of the gold production until 90,000 ounces have been delivered, 4% of the gold production until the delivery of a further 140,000 ounces and 3.5% gold production thereafter for the life of mine. Under the revised agreement, the Company is entitled to purchase an additional 16% of payable gold production (22% in total) (subject to adjustment if there are delays in deliveries relative to an agreed schedule). Once Rio2 delivers the incremental 95,000 ounces (as adjusted), the stream reverts to the percentages and thresholds under the original Fenix PMPA (as described). Rio2 has a one-time option to terminate the requirement to deliver the incremental gold production from the end of 2027 until the end of 2029 by delivering 95,000 ounces (as adjusted) less previously delivered gold ounces, excluding those gold ounces which would have been delivered under the original Fenix PMPA. |
| 7) | On February 27, 2024, the Company closed the Orion Purchase Agreement to acquire the Platreef and Kudz Ze Kayah PMPAs. |
| 8) | Until October 23, 2029, there is a price adjustment mechanism under the Koné PMPA: |
| a. | if the spot price of gold is less than $2,100 per ounce, the Company will pay 20% of $2,100 less 25% of the difference between $2,100 and $1,800, less 30% of the difference between $1,800 and the spot price of gold; and |
| b. | if the spot price is greater than $2,700 per ounce, the Company will pay 25% of the difference between $3,000 and $2,700, plus 30% of the difference between the actual spot price of gold and $3,000. |
Per Ounce Cash Payment for Silver
| Mineral Stream Interests | Attributable Payable Production to be Purchased |
Per Ounce Cash Payment 1 |
Term of Agreement |
Date of Original Contract |
||||||||||||
| Peñasquito |
25 | % | $ | 4.62 | Life of Mine | 24-Jul-07 | ||||||||||
| Constancia |
100 | % | $ | 6.32 | 2 | Life of Mine | 8-Aug-12 | |||||||||
| Antamina |
33.75 | % | 20% | Life of Mine | 3-Nov-15 | |||||||||||
| Blackwater |
50 | % 6 | 18% | 7 | Life of Mine | 13-Dec-21 | ||||||||||
| Other |
||||||||||||||||
| Los Filos |
100 | % | $ | 4.74 | 25 years | 15-Oct-04 | ||||||||||
| Zinkgruvan |
100 | % | $ | 4.81 | Life of Mine | 8-Dec-04 | ||||||||||
| Stratoni |
100 | % | $ | 11.54 | Life of Mine | 23-Apr-07 | ||||||||||
| Neves-Corvo |
100 | % | $ | 4.55 | 50 years | 5-Jun-07 | ||||||||||
| Aljustrel |
100 | % 3 | 50% | 50 years | 5-Jun-07 | |||||||||||
| El Alto 4 |
25 | % | $ | 3.90 | Life of Mine | 8-Sep-09 | ||||||||||
| Copper World |
100 | % | $ | 3.90 | Life of Mine | 10-Feb-10 | ||||||||||
| Loma de La Plata |
12.5 | % | $ | 4.00 | Life of Mine | n/a | 5 | |||||||||
| Marmato |
100 | % 6 | 18% | 7 | Life of Mine | 5-Nov-20 | ||||||||||
| Cozamin |
50 | % 6 | 10% | Life of Mine | 11-Dec-20 | |||||||||||
| El Domo |
75 | % | 18% | 7 | Life of Mine | 17-Jan-22 | ||||||||||
| Mineral Park |
100 | % | 18% | 7 | Life of Mine | 24-Oct-23 | ||||||||||
| Kudz Ze Kayah |
7.375 | % 6 | 20% | Life of Mine | 22-Dec-21 | 8 | ||||||||||
| Early Deposit |
||||||||||||||||
| Toroparu |
50 | % | $ | 3.90 | Life of Mine | 11-Nov-13 | ||||||||||
| Cotabambas |
100 | % 6 | $ | 5.90 | Life of Mine | 21-Mar-16 | ||||||||||
| Kutcho |
100 | % | 20% | Life of Mine | 14-Dec-17 | |||||||||||
| 1) | The production payment is measured as either a fixed amount per unit of silver delivered, or as a percentage of the spot price of silver on the date of delivery. Contracts where the payment is a fixed amount per ounce of silver delivered are subject to an annual inflationary increase, with the exception of Loma de La Plata. Additionally, should the prevailing market price for silver be lower than this fixed amount, the per ounce cash payment will be reduced to the prevailing market price, subject to an annual inflationary factor. |
| 2) | Subject to an increase to $9.90 per ounce of silver after the initial 40-year term. |
| 3) | Wheaton only has the rights to silver contained in concentrate containing less than 15% copper at the Aljustrel mine. |
| 4) | Previously referred to as Pascua-Lama in this MD&A. |
| 5) | Terms of the agreement not yet finalized. |
| 6) | Under certain PMPAs, the Company’s attributable silver percentage will be reduced once certain thresholds are achieved: |
| a. | Blackwater – reduced to 33% once the Company has received 17.8 million ounces of silver. |
| b. | Marmato – reduced to 50% once the Company has received 2.15 million ounces of silver. |
| c. | Cozamin – reduced to 33% once the Company has received 10 million ounces of silver. |
| d. | Cotabambas – reduced to 66.67% once the Company has received 90 million silver equivalent ounces. |
| e. | Kudz Ze Kayah – reduced to 6.125% once the Company has received 43.30 million ounces of silver, with a further reduction to 5.5% until the Company has received an additional 7.96 million ounces of silver, with a further reduction to 5.5% until the Company has received an additional 35.34 million ounces of silver, thereafter increased to 6.75%. |
| 7) | To be increased to 22% once the total market value of all metals delivered to the Company, net of the per ounce cash payment, exceeds the initial upfront cash deposit. |
| 8) | On February 27, 2024, the Company closed the Orion Purchase Agreement to acquire the Platreef and Kudz Ze Kayah PMPAs. |
WHEATON PRECIOUS METALS 2025 ANNUAL REPORT- MANAGEMENT DISCUSSION & ANALYSIS [37]
Per Ounce Cash Payment for Palladium and Platinum and Per Pound for Cobalt
| Mineral Stream Interests | Attributable Payable Production to be Purchased |
Per Unit of Measurement Cash Payment 1 |
Term of Agreement |
Date of Original Contract |
||||||||||||
| Palladium |
||||||||||||||||
| Stillwater |
4.5% ² | 18% ³ | Life of Mine | 16-Jul-18 | ||||||||||||
| Platreef |
5.25% ² | 30% ² | Life of Mine ² | 7-Dec-21 | 4 | |||||||||||
| Platinum |
||||||||||||||||
| Marathon |
22% ² | 18% ³ | Life of Mine | 26-Jan-22 | ||||||||||||
| Platreef |
5.25% ² | 30% ² | Life of Mine ² | 7-Dec-21 | 4 | |||||||||||
| Cobalt |
||||||||||||||||
| Voisey’s Bay |
42.4% ² | 18% ³ | Life of Mine | 11-Jun-18 | ||||||||||||
| 1) | The production payment is measured as either a fixed amount per unit of metal delivered, or as a percentage of the spot price of the underlying metal on the date of delivery. |
| 2) | Under certain PMPAs, the Company’s attributable metal percentage will be reduced once certain thresholds are achieved: |
| a. | Stillwater – reduced to 2.25% once the Company has received 375,000 ounces of palladium, with a further reduction to 1% once the Company has received 550,000 ounces. |
| b. | Platreef – reduced to 3% once the Company has received 350,000 ounces of combined palladium and platinum, with a further reduction to 0.1% once the Company has received a combined 485,115 ounces, at which point the per ounce cash payment increases to 80% of the spot price of palladium and platinum. If certain thresholds are met, including if production through the Platreef project concentrator achieves 5.5 Mtpa, the 0.1% residual palladium and platinum stream will terminate. |
| c. | Marathon – reduced to 15% once the Company has received 120,000 ounces of platinum. |
| d. | Voisey’s Bay – reduced to 21.2% once the Company has received 31 million pounds of cobalt. |
| 3) | To be increased to 22% once the market value of all metals delivered to Wheaton, net of the per unit cash payment, exceeds the initial upfront cash deposit. |
| 4) | On February 27, 2024, the Company closed the Orion Purchase Agreement to acquire the Platreef and Kudz Ze Kayah PMPAs. |
Other Contractual Obligations and Contingencies
| Projected Payment Dates 1 | ||||||||||||||||||||
| (in thousands) | 2026 | 2027 - 2028 | 2029 - 2030 | After 2030 | Total | |||||||||||||||
| Payments for mineral stream interests & royalty |
||||||||||||||||||||
| Salobo |
$ | - | $ | 8,000 | $ | 16,000 | $ | 56,000 | $ | 80,000 | ||||||||||
| Copper World 2 |
- | 231,151 | - | - | 231,151 | |||||||||||||||
| Marmato |
81,984 | - | - | - | 81,984 | |||||||||||||||
| Santo Domingo |
- | 260,000 | - | - | 260,000 | |||||||||||||||
| El Domo |
87,750 | 43,875 | - | - | 131,625 | |||||||||||||||
| Marathon |
- | 102,145 | 43,777 | - | 145,922 | |||||||||||||||
| Cangrejos |
- | 84,420 | 84,420 | - | 168,840 | |||||||||||||||
| Curraghinalt |
- | - | - | 55,000 | 55,000 | |||||||||||||||
| Loma de La Plata |
- | - | - | 32,400 | 32,400 | |||||||||||||||
| Spring Valley |
260,000 | 360,000 | - | - | 620,000 | |||||||||||||||
| Kudz Ze Kayah |
- | 15,000 | - | - | 15,000 | |||||||||||||||
| Koné |
156,250 | - | - | - | 156,250 | |||||||||||||||
| Payments for early deposit mineral stream interest |
||||||||||||||||||||
| Cotabambas |
- | - | - | 126,000 | 126,000 | |||||||||||||||
| Toroparu |
- | - | - | 138,000 | 138,000 | |||||||||||||||
| Kutcho |
- | - | - | 58,000 | 58,000 | |||||||||||||||
| Leases liabilities |
995 | 2,056 | 2,147 | 4,908 | 10,106 | |||||||||||||||
| Total contractual obligations |
$ | 586,979 | $ | 1,106,647 | $ | 146,344 | $ | 470,308 | $ | 2,310,278 | ||||||||||
| 1) | Projected payment date based on management estimate. Dates may be updated in the future as additional information is received. |
| 2) | Figure includes contingent transaction costs of $1 million. |
WHEATON PRECIOUS METALS 2025 ANNUAL REPORT- MANAGEMENT DISCUSSION & ANALYSIS [38]
Salobo
The Company will be required to make annual payments of $8 million over a 10-year period, if the Salobo mine implements a high-grade mine plan. Payments will be made for each year in which the high-grade plan is achieved.
Copper World Complex
The Company is committed to pay Hudbay total upfront cash payments of $230 million in two installments, with the first $50 million being advanced upon Hudbay’s receipt of permitting for the Copper World Complex and other customary conditions and the balance of $180 million being advanced once project costs incurred on the Copper World Complex exceed $98 million and certain other customary conditions. Under the Copper World Complex PMPA, the Company is permitted to elect to pay the deposit in cash or the delivery of common shares. Additionally, the Company will be entitled to certain delay payments, including where construction ceases in any material respect, or if completion is not achieved within agreed upon timelines.
Marmato
Under the terms of the Marmato PMPA, the Company is committed to pay Aris Mining additional upfront cash payments of $82 million, payable during the construction of the Marmato Lower Mine development portion of the Marmato mine, subject to customary conditions.
Santo Domingo
Under the terms of the Santo Domingo PMPA, the Company is committed to pay Capstone additional upfront cash payments of $260 million, which is payable during the construction of the Santo Domingo project, subject to customary conditions being satisfied, including Capstone attaining sufficient financing to cover total expected capital expenditures.
Fenix
Under the terms of the Fenix PMPA, the Company provided a $20 million secured standby loan facility, however this facility was cancelled on December 19, 2025.
El Domo
Under the terms of the El Domo PMPA, the Company is committed to pay additional upfront cash payments of $131.6 million, which includes $0.25 million which will be paid to support certain local community development initiatives around the El Domo project. The payments will be payable in three staged installments during construction, subject to various customary conditions being satisfied.
Marathon
Under the terms of the Marathon PMPA, the Company is committed to pay additional upfront cash payments of $146 million (Cdn$200 million), which is to be paid in four staged installments during construction of the Marathon project, subject to various customary conditions being satisfied.
Cangrejos
Under the terms of the Cangrejos PMPA, the Company is committed to pay additional upfront consideration of $169 million, which is to be paid in two staged equal installments during construction of the mine, subject to various customary conditions being satisfied.
Curraghinalt
Under the terms of the Curraghinalt PMPA, the Company is committed to pay additional upfront cash payments of $55 million to be paid to an affiliate of Dalradian Gold during construction of the Curraghinalt project.
Loma de La Plata
Under the terms of the Loma de La Plata PMPA, the Company is committed to pay Pan American Silver Corp., (“PAAS”) total upfront cash payments of $32 million following the satisfaction of certain conditions, including PAAS receiving all necessary permits to proceed with the mine construction and the Company finalizing the definitive terms of the PMPA.
Spring Valley
Under the terms of the Spring Valley PMPA, the Company is committed to pay Waterton Gold Corp. (“Waterton Gold”) additional upfront cash payments of $620 million in installments as various conditions are satisfied. The Company has also provided a cost overrun facility (the “Spring Valley Facility”) of up to $150 million, accessible during an availability period commencing once the full upfront consideration has been paid under the Spring Valley PMPA. The Spring Valley Facility has a maturity date of three years following the first drawdown under the Spring Valley Facility.
WHEATON PRECIOUS METALS 2025 ANNUAL REPORT- MANAGEMENT DISCUSSION & ANALYSIS [39]
Mineral Park
The Company has entered into a loan agreement to provide a secured debt facility of up to $25 million to Origin Mining Company, LLC, the Mineral Park owner and affiliate of Waterton Copper, to help support the mine construction if necessary, once the full upfront consideration under the stream has been paid.
Kudz Ze Kayah
Under the terms of the amended KZK PMPA, an additional $15 million contingency payment is due to BCM if the KZK project achieves certain permitting milestones.
Koné
Under the terms of the Koné PMPA, the Company is committed to pay one additional upfront cash payment of $156 million during construction, subject to certain customary conditions. The Company has also provided Montage Gold Corp., with a secured debt facility of up to $75 million to be allocated to project costs, including cost overruns, prior to completion of construction and once the full upfront consideration under the Koné PMPA has been paid.
Cotabambas
Under the terms of the Cotabambas Early Deposit Agreement, the Company is committed to pay Panoro Minerals Ltd., additional upfront cash payments of $126 million. Following the delivery of a bankable definitive feasibility study, environmental study and impact assessment, and other related documents (collectively, the “Cotabambas Feasibility Documentation”), and receipt of permits and construction commencing, the Company may then advance the remaining deposit or elect to terminate the Cotabambas Early Deposit Agreement. If the Company elects to terminate, the Company will be entitled to a return of the portion of the amounts advanced less $2 million payable upon certain triggering events occurring.
Toroparu
Under the terms of the Toroparu Early Deposit Agreement, the Company is committed to pay a subsidiary of Aris Mining an additional $138 million, payable on an installment basis to partially fund construction of the mine. Aris Mining is to deliver certain feasibility documentation. Prior to the delivery of this feasibility documentation, Wheaton may elect to (i) not proceed with the agreement or (ii) not pay the balance of the upfront consideration and reduce the gold stream percentage from 10% to 0.909% and the silver stream percentage from 50% to nil. If option (i) is chosen, Wheaton will be entitled to a return of the amounts advanced less $2 million. If Wheaton elects option (ii), Aris Mining may elect to terminate the agreement and Wheaton will be entitled to a return of the amount of the deposit already advanced less $2 million.
Kutcho
Under the terms of the Kutcho Early Deposit Agreement, the Company is committed to pay Kutcho additional upfront cash payments of $58 million, which will be advanced on an installment basis to partially fund construction of the mine once certain conditions have been satisfied.
Tax Contingencies
Due to the size, complexity and nature of the Company’s operations, various legal and tax matters are outstanding from time to time, including audits and disputes.
Under the terms of the settlement with the CRA of the transfer pricing dispute relating to the 2005 to 2010 taxation years (the “CRA Settlement”), income earned outside of Canada by the Company’s foreign subsidiaries will not be subject to tax in Canada under transfer pricing rules. The CRA Settlement principles apply to all taxation years after 2010 subject to there being no material change in facts or change in law or jurisprudence. Bill C-15, Budget 2025 Implementation Act, No.1, contains proposed amendments to the existing transfer pricing regime under the Tax Act, which could have an impact on the application of the CRA Settlement to taxation years after 2025. Once it is in force, the Company expects to apply the same transfer pricing methodology and achieve a consistent outcome with past periods.
The CRA is not restricted under the terms of the CRA Settlement from issuing reassessments on some basis other than transfer pricing which could result in some or all of the income of the Company’s foreign subsidiaries being subject to tax in Canada.
It is not known or determinable by the Company when any ongoing audits by CRA of international and domestic transactions will be completed, or whether reassessments will be issued, or the basis, quantum or timing of any such potential reassessments, and it is therefore not practicable for the Company to estimate the financial effect, if any, of any ongoing audits. From time to time there may also be proposed legislative changes to law or outstanding legal actions that may have an impact on the current or prior periods, the outcome, applicability and impact of which is also not known or determinable by the Company.
WHEATON PRECIOUS METALS 2025 ANNUAL REPORT- MANAGEMENT DISCUSSION & ANALYSIS [40]
General
By their nature, contingencies will only be resolved when one or more future events occur or fail to occur. The assessment of contingencies inherently involves the exercise of significant judgment and estimates of the outcome of future events. If the Company is unable to resolve any of these matters favorably, there may be a material adverse impact on the Company’s financial performance, cash flows or results of operations. In the event that the Company’s estimate of the future resolution of any of the foregoing matters changes, the Company will recognize the effects of the change in its consolidated financial statements in the appropriate period relative to when such change occurs.
Share Capital
During the three months ended December 31, 2025, a total of 17,101 share purchase options were exercised at a weighted average exercise price of Cdn$61.08 per option, resulting in total cash proceeds to the Company in the amount of $1 million (twelve months - $7 million from the exercise of 178,489 share purchase options at a weighted average exercise price of Cdn$56.51). During the three months ended December 31, 2024, a total of 5,560 share purchase options were exercised at a weighted average exercise price of Cdn$37.43 per option, resulting in total cash proceeds to the Company in the amount of $0.1 million (twelve months - $13 million from the exercise of 500,017 share purchase options at a weighted average exercise price of Cdn$36.18).
During the year ended December 31, 2025, the Company released 141,525 RSUs, as compared to 69,494 RSUs during the comparable period of the previous year.
The Company has implemented a dividend reinvestment plan (“DRIP”) whereby shareholders can elect to have dividends reinvested directly into additional Wheaton common shares. During the three months ended December 31, 2025, there were 6,603 common shares issued under the DRIP (twelve months - 36,517 common shares). During the three months ended December 31, 2024, there were 6,016 common shares issued under the DRIP (twelve months - 38,534 common shares).
As of March 12, 2026, there were 454,036,958 outstanding common shares, 1,032,188 share purchase options and 241,880 restricted share units.
Dividends Paid 1
During 2025, the Company paid quarterly dividends of $0.165 per share, amounting to $300 million, as compared to $281 million at a rate of $0.155 per share in 2024.
The following is a summary of the dividends paid and the annual dividend per share for the last 3 years, along with the forecast for 2026.
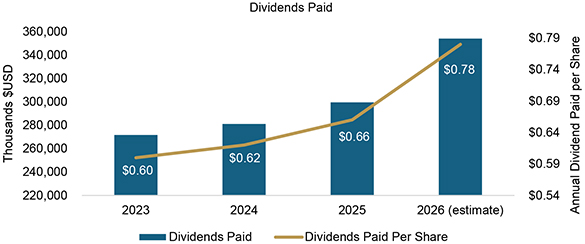
For 2026, the Company has increased its quarterly dividend under its dividend policy, setting it at $0.195 per common share for 2026. This represents an 18% increase over the quarterly dividend paid in 2025 and represents the third consecutive year that the dividend has been increased, highlighting the Company’s commitment to a progressive
| 1 | Estimated 2026 total dividend payments based on 454 million common shares outstanding throughout the period and a quarterly dividend of $0.195 per common share. Please see “Cautionary Note Regarding Forward-Looking Statements” for material risks, assumptions and important disclosures associated with this information. |
WHEATON PRECIOUS METALS 2025 ANNUAL REPORT- MANAGEMENT DISCUSSION & ANALYSIS [41]
dividend. The declaration, timing, amount and payment of future dividends remain at the discretion of the Board of Directors.
Financial Instruments
The Company owns equity interests in several companies as long-term investments (see page 13 of this MD&A) and therefore is inherently exposed to various risk factors including currency risk, market price risk and liquidity risk.
In order to mitigate the effect of short-term volatility in gold, silver and palladium prices, the Company will occasionally enter into forward contracts in relation to gold, silver and palladium deliveries that it is highly confident will occur within a given quarter. The Company does not hedge its long-term exposure to commodity prices. The Company has not used derivative financial instruments to manage the risks associated with its operations and therefore, in the normal course of business, it is inherently exposed to currency, interest rate and commodity price fluctuations. Refer to Note 5 to the consolidated financial statement for further information.
Material Risks
The following summarizes the most material risks to the Company’s business. This is not a complete list of the potential risks the Company faces. For a comprehensive discussion about the Company’s risks, see the most recent Annual Information Form and Form 40-F on file with the U.S. Securities and Exchange Commission and Canadian provincial securities regulatory authorities and see “Cautionary Note Regarding Forward-Looking Statements” in this MD&A.
| ● | Commodity Prices – The Company’s business operations are fully exposed to changes in the market prices of precious metals and cobalt which fluctuate widely. Changes in the market price of commodities that we purchase under our PMPAs and in the commodities markets will affect our profitability. The price of the Common Shares and the Company’s financial results may be significantly and adversely affected by a decline in the price of precious metals and cobalt. |
| ● | Production from Mining Operations – To the extent that they relate to the production of precious metals or cobalt from, or the continued operation of, the Mining Operations, the Company will be subject to the following risks applicable to the operators of such mines or projects: |
| o | No Control Over Mining Operations Production – The Company’s business operations are fully exposed to the risk that Mining Operations will not meet production forecasts or targets. The Company has no direct involvement in the operation of the Mining Operations and as a result the activities of third-party operators at these Mining Operations could negatively affect the cash flows generated by the Company. The ability for the operators of the Mining Operations to act in their sole discretion could therefore have a material adverse effect on the Company’s business, financial condition, results of operations and cash flows. |
| o | Production Forecasts: The Company prepares estimates and forecasts of future attributable production from the Mining Operations and relies on public disclosure and other information it receives from the owners, operators and independent experts of the Mining Operations to prepare such estimates. Such information is necessarily imprecise because it depends upon the judgment of the individuals who operate the Mining Operations as well as those who review and assess the geological and engineering information. If the Company’s production forecasts prove to be incorrect, it may have a material adverse effect on the Company. |
| o | Commodity Price Fluctuations: Declining commodity prices can adversely impact production from Mining Operations; future production from the Mining Operations is dependent on metal prices that are adequate to make these properties economic. |
| o | Mineral Reserve and Mineral Resource Estimates: Mineral reserve and mineral resource estimates are uncertain and may be adversely impacted by market fluctuations, productions costs operating factors or reduced recovery rates. The economic viability of a mineral deposit may be impacted by attributes of a particular deposit, which may require operators of Mining Operations to reduce their mineral reserves and mineral resources, which may result in a material and adverse effect on the Company’s profitability, results of operations, financial condition and the trading price of the Company’s securities. |
| o | Governmental Regulations: The Mining Operations are subject to extensive laws and regulations. The costs of discovering, evaluating, planning, designing, developing, constructing, operating and closing the Mining Operations in compliance with such laws and regulations are significant. It is possible that the costs and delays associated with compliance with such laws and regulations could become such that the owners or operators of the Mining Operations would not proceed with the development of or continue to operate a mine. Moreover, it is possible that future regulatory developments could result in substantial costs and liabilities for the owners or operators of the |
WHEATON PRECIOUS METALS 2025 ANNUAL REPORT- MANAGEMENT DISCUSSION & ANALYSIS [42]
| Mining Operations such that they would not proceed with the development of, or continue to operate, a mine or mines which may impact on the amount of precious metals or cobalt that the Company may receive under the terms of its relevant PMPAs and which could have a material adverse effect on the Company’s business and financial position. |
| o | International Operations: The Mining Operations are all exposed to various levels of political, economic and other risks and uncertainties due to their international location. Changes, if any, in mining or investment policies or shifts in political attitude may adversely affect the operations or profitability of the Mining Operations in these countries. The occurrence of these various factors and uncertainties cannot be accurately predicted and could have an adverse effect on the Mining Operations or on the ability of the companies with which the Company has PMPAs to perform their obligations under those PMPAs. |
| o | Exploration, Development, Operating, Expansions and Improvements: The Mining Operations are subject to significant hazards and risks that can adversely impact the Mining Operations ability to commence operations or to continue to operate as planned or at all. The occurrence of any of the above-mentioned hazards or risks could result in an interruption or suspension of operation of the Mining Operations and have a material adverse effect on the Company and the trading price of the Company’s securities as well as the Company’s reputation. |
| o | Climate Change: All of Wheaton’s PMPAs are exposed to climate-related risks through the Mining Operations. Climate change could result in challenging physical conditions including acute weather events such as higher intensity storms, extreme heat, flooding (surface and fluvial), wildfire and landslides, as well as chronic weather and physical conditions such as rising temperatures, water stress, changes in precipitation patterns and drought. These conditions, and the costs of efforts by the Mining Operations to manage such conditions, may adversely affect the Mining Operations and there can be no assurances that the Mining Operations will be able to predict, respond to, measure, monitor or manage the risks posed such conditions. Further, such conditions could result in the owners or operators of the Mining Operations not proceeding with the development of or continue to operate a mine, which may impact the amount of precious metals or cobalt or other payments that the Company may receive under the terms of its relevant PMPAs. This could have a material adverse effect on the Company’s business and financial position, the Company’s reputation and the trading price of the Company’s securities. |
| o | Licenses, Permits, Approvals and Rulings. The Mining Operations are subject to receiving and maintaining licenses, permits, approvals and rulings from appropriate governmental authorities. Changes in laws and regulations or in the granting or renewal of licenses, permits, approvals and rulings could have a material adverse effect on the revenue the Company derives from the Mining Operations. Any failure to comply with applicable laws and regulations, permits and licenses, or to maintain permits and licenses in good standing, even if inadvertent, could result in interruption or closure of exploration, development or mining operations or fines, penalties or other liabilities accruing to the owner or operator of the Mining Operations. Any such occurrence could substantially decrease production or cause the termination of operations on the property and have a material adverse effect on the Company and the trading price of the Company’s securities. |
| ● | Counterparty Credit and Liquidity – The Company is exposed to counterparty risks and liquidity risks including, but not limited to: (i) through the companies with which the Company has PMPAs which may experience financial, operational or other difficulties, including insolvency, which could limit or suspend those companies’ ability to perform their obligations under those PMPAs; (ii) through financial institutions that hold the Company’s cash and cash equivalents; (iii) through companies that have payables to the Company, including concentrate customers; (iv) through the Company’s insurance providers; (v) through companies that owe a refund of the Refundable Deposit under the terms of the respective PMPA; and (vi) through the Company’s lenders, financial institutions, and bullion banks. The inability of the Company’s counterparties to perform their obligations under agreements with the Company or the inability of the Company to meet operating expenditure requirements could adversely impact the Company’s cash flows. In addition, any adverse financial or operational consequences on a counterparty may have a material adverse effect on the Company’s business, financial condition, results of operations and cash flows. |
| ● | Mine Operator and Counterparty Concentration – Precious metals and cobalt purchases under certain of Wheaton’s PMPAs are subject to both mine operator concentration risk and counterparty concentration risk, with total revenues relative to Vale, Newmont, Hudbay and Glencore during the year ended December 31, 2025 being 49%, 13%, 10% and 10% respectively of the Company’s total revenue. Should any of these mine operators or counterparties become unable or unwilling to fulfill their obligations under their agreements with the Company, or should any of the risk factors identified by the Company materialize in respect of the mine operators, counterparties or the Mining Operations, there could be a material adverse effect on the Company, including, but not limited to, the Company’s revenue, net income and cash flows from operations. |
WHEATON PRECIOUS METALS 2025 ANNUAL REPORT- MANAGEMENT DISCUSSION & ANALYSIS [43]
| ● | Taxes – The introduction of new tax laws, regulations or rules, or changes to, or differing interpretation of, or application of, or court decisions in respect of, existing tax laws, regulations or rules in Canada, the Cayman Islands or Luxembourg, or any of the countries in which the Company’s subsidiaries or the Mining Operations are located, or to which deliveries of precious metals, precious metals credits or cobalt are made, could result in an increase in the Company’s taxes, or other governmental charges, duties or impositions. |
| ● | Competition – The Company competes with other companies for PMPAs and similar transactions. The competition for PMPAs and similar transactions could adversely impact the Company’s ability to acquire desirable PMPAs. In addition, competition from companies with substantial resources could impact the Company’s ability to acquire PMPAs and similar transactions at acceptable valuations or at acceptable returns, which could adversely impact the Company’s cash flows, results of operations and financial condition. |
Critical Accounting Estimates
The preparation of financial statements in conformity with IFRS Accounting Standards requires management to make estimates and assumptions that affect the reported amount of assets and liabilities and disclosure of contingent liabilities at the balance sheet date, and the reported amounts of revenues and expenditures during the reporting period. The following discussion provides details of the critical accounting estimates made in preparing the financial statements. For additional information, Note 3 of the Company’s consolidated financial statements describes all of the material accounting policies while Note 4 describes the significant areas of estimation uncertainty and judgments made by management in preparing the consolidated financial statements.
Mineral Stream Interests
Attributable Reserve, Resource and Exploration Potential Estimates
Mineral stream interests are significant assets of the Company, with a carrying value of $7.4 billion at December 31, 2025, inclusive of early deposit agreements. This amount represents the capitalized expenditures related to the acquisition of the mineral stream interests, net of accumulated depletion and accumulated impairment charges, if any. The Company estimates the reserves, resources and exploration potential relating to each agreement. Reserves are estimates of the amount of metals contained in ore that can be economically and legally extracted from the mining properties in respect of which the Company has PMPAs. Resources are estimates of the amount of metals contained in mineralized material for which there is a reasonable prospect for economic extraction from the mining properties in respect of which the Company has PMPAs. Exploration potential represents an estimate of additional reserves and resources which may be discovered through the mine operator’s exploration program. The Company adjusts its estimates of reserves, resources (where applicable) and exploration potential (where applicable) to reflect the Company’s percentage entitlement to metals produced from such mines. The Company compiles its estimates of its reserves and resources based on information supplied by appropriately qualified persons relating to the geological data on the size, density and grade of the ore body, and require complex geological and geostatistical judgments to interpret the data. The estimation of recoverable reserves and resources is based upon factors such as estimates of foreign exchange rates, commodity prices, future capital requirements, and production costs along with geological assumptions and judgments made in estimating the size and grade of the ore body. The Company estimates exploration potential based on assumptions surrounding the ore body continuity which requires judgment as to future success of any exploration programs undertaken by the mine operator. Changes in the reserve estimates, resource estimates or exploration potential estimates may impact upon the carrying value of the Company’s mineral stream interests and depletion charges.
Depletion
As described above, the cost of these mineral stream interests are separately allocated to reserves, resources and exploration potential. The value allocated to reserves is classified as depletable and is depleted on a unit-of-production basis over the estimated recoverable proven and probable reserves at the mine corresponding to the specific agreement. The value associated with resources and exploration potential is the value beyond proven and probable reserves at acquisition and is classified as non-depletable until such time as it is transferred to the depletable category as a result of the conversion of resources and/or exploration potential into reserves. To make this allocation, the Company estimates the recoverable reserves, resources and exploration potential at each mining operation. These calculations require the use of estimates and assumptions, including the amount of contained metals, recovery rates and payable rates. Changes to these assumptions may impact the estimated recoverable reserves, resources or exploration potential which could directly impact the depletion rates used. Changes to depletion rates are accounted for prospectively.
Impairment of Assets
The Company assesses each PMPA at the end of every reporting period to determine whether any indication of impairment or impairment reversal exists. If such an indication exists, the recoverable amount of the PMPA is estimated in order to determine the extent of the impairment or impairment reversal (if any). The calculation of the recoverable
WHEATON PRECIOUS METALS 2025 ANNUAL REPORT- MANAGEMENT DISCUSSION & ANALYSIS [44]
amount requires the use of estimates and assumptions such as long-term commodity prices, discount rates, recoverable ounces of attributable metals, and operating performance.
The price of precious metals and cobalt has been volatile over the past several years. The Company monitors spot and forward metal prices and if necessary re-evaluates the long-term metal price assumptions used for impairment testing. Should price levels decline or increase in the future, either for an extended period of time or due to known macro economic changes, the Company may need to re-evaluate the long-term metal price assumptions used for impairment testing. A significant decrease in long-term metal price assumptions may be an indication of potential impairment, while a significant increase in long-term metal price assumptions may be an indication of potential impairment reversal. In addition, the Company also monitors the estimated recoverable reserves and resources as well as operational developments and other matters at the mining properties in respect of which the Company has PMPAs for indications of impairment or impairment reversal. Should the Company conclude that it has an indication of impairment or impairment reversal at any balance sheet date, the Company is required to perform an impairment assessment.
At December 31, 2024, indicators of impairment were identified relative to the Voisey’s Bay PMPA, primarily as a result of significant and sustained decrease in the market price of cobalt over the year ended December 31, 2024 compared to historical price levels. Management estimated that the recoverable amount at December 31, 2024 of the Voisey’s Bay PMPA was less than the carrying amount and accordingly recorded an impairment charge of $109 million. Refer to Note 13 of the financial statements for further information. No such indicators of impairment were identified in 2025.
Valuation of Stock Based Compensation
The Company has various forms of stock based compensation, including share purchase options, restricted share units (“RSUs”) and performance share units (“PSUs”). The calculation of the fair value of share purchase options, RSUs and PSUs issued requires the use of estimates as more fully described below.
The Company recognizes a stock based compensation expense for all share purchase options and RSUs awarded to employees, officers and directors based on the fair values of the share purchase options and RSUs at the date of grant. The fair values of share purchase options and RSUs at the date of grant are expensed over the vesting periods of the share purchase options and RSUs, respectively, with a corresponding increase to equity. The fair value of share purchase options is determined using the Black-Scholes option pricing model with market related inputs as of the date of grant. Share purchase options with graded vesting schedules are accounted for as separate grants with different vesting periods and fair values. The fair value of RSUs is the market value of the underlying shares at the date of grant. At the end of each reporting period, the Company re-assesses its estimates of the number of awards that are expected to vest and recognizes the impact of any revisions to this estimate in the consolidated statement of earnings.
The Company recognizes a stock based compensation expense for PSUs which are awarded to eligible employees and are settled in cash. The related expense is based on the value of the anticipated settlement and multiplier for current performance at the end of the associated performance periods. This estimated expense is reflected as a component of net earnings over the vesting period of the PSUs with the related obligation recorded as a liability on the balance sheet. The amount of compensation expense is adjusted at the end of each reporting period to reflect the fair market value of common shares and the number of PSUs anticipated to vest based on the anticipated performance factor.
New Accounting Standards Effective in 2025
Amendment to IAS 21 - Lack of Exchangeability
Effective January 1, 2025, the Company adopted the Amendment to IAS 21 - Lack of Exchangeability. The amendments contain guidance to specify when a currency is exchangeable and how to determine the exchange rate when it is not, as well as associated disclosure requirements when it is concluded a currency is not exchangeable. The adoption of this amendment had no impact on the Company’s financial statements.
Future Changes to Accounting Policies
IFRS 18 - Presentation and Disclosure in Financial Statements.
In April 2024, IFRS 18 Presentation and Disclosure in Financial Statements was issued. IFRS 18 replaces IAS 1 Presentation of Financial Statements while carrying forward many of the requirements in IAS 1. IFRS 18 introduces new requirements to: i) present specified categories and defined subtotals in the statement of earnings, ii) provide disclosures on management-defined performance measures (MPMs) in the notes to the financial statements, iii) improve aggregation and disaggregation. Some of the requirements in IAS 1 are moved to IAS 8 Accounting Policies, Changes in Accounting Estimates and Errors and IFRS 7 Financial Instruments: Disclosures. There were also minor amendments to IAS 7 Statement of Cash Flows and IAS 33 Earnings per Share in connection with the new standard. IFRS 18 requires retrospective application with specific transition provisions. The Company is required to apply IFRS 18 for annual reporting periods beginning on or after January 1, 2027 with early adoption permitted. The Company is currently evaluating the impact of IFRS 18 on its financial statements.
WHEATON PRECIOUS METALS 2025 ANNUAL REPORT- MANAGEMENT DISCUSSION & ANALYSIS [45]
Non-GAAP Measures
Wheaton has included, throughout this document, certain non-GAAP performance measures, including (i) adjusted net earnings and adjusted net earnings per share; (ii) operating cash flow per share (basic and diluted); (iii) average cash costs of gold, silver and palladium on a per ounce basis and cobalt on a per pound basis; and (iv) cash operating margin.
These non-GAAP measures do not have any standardized meaning prescribed by IFRS Accounting Standards, and other companies may calculate these measures differently. The presentation of these non-GAAP measures is intended to provide additional information and should not be considered in isolation or as a substitute for measures of performance prepared in accordance with IFRS Accounting Standards.
| i. | Adjusted net earnings and adjusted net earnings per share are calculated by removing the effects of non-cash impairment charges (reversals) (if any), non-cash fair value (gains) losses and other one-time (income) expenses as well as the reversal of non-cash income tax expense (recovery) which is offset by income tax expense (recovery) recognized in the Statements of Shareholders’ Equity and OCI, respectively. The Company believes that, in addition to conventional measures prepared in accordance with IFRS Accounting Standards, management and certain investors use this information to evaluate the Company’s performance. |
The following table provides a reconciliation of adjusted net earnings and adjusted net earnings per share (basic and diluted).
| Three Months Ended December 31 |
Years Ended December 31 |
|||||||||||||||
| (in thousands, except for per share amounts) | 2025 | 2024 | 2025 | 2024 | ||||||||||||
| Net earnings |
$ | 558,250 | $ | 88,148 | $ | 1,471,720 | $ | 529,140 | ||||||||
| Add back (deduct): |
||||||||||||||||
| Impairment charge (reversal) |
- | 108,861 | - | 108,861 | ||||||||||||
| Gain on disposal of Mineral Stream Interest |
- | - | (85,724) | - | ||||||||||||
| Income tax expense related to disposal of Mineral Stream Interest |
- | - | 12,859 | - | ||||||||||||
| (Gain) loss on fair value adjustment of share purchase warrants held |
(1,283) | 910 | (5,805) | 8 | ||||||||||||
| Income tax (expense) recovery recognized in the Statement of Shareholders’ Equity |
- | - | (1,152) | - | ||||||||||||
| Deferred income tax (expense) recovery recognized in the Statement of OCI |
(1,799) | 1,225 | (18,286) | 2,857 | ||||||||||||
| Other |
(189) | (175) | (750) | (696) | ||||||||||||
| Adjusted net earnings |
$ | 554,979 | $ | 198,969 | $ | 1,372,862 | $ | 640,170 | ||||||||
| Divided by: |
||||||||||||||||
| Basic weighted average number of shares outstanding |
454,020 | 453,669 | 453,893 | 453,460 | ||||||||||||
| Diluted weighted average number of shares outstanding |
454,841 | 454,361 | 454,685 | 454,119 | ||||||||||||
| Equals: |
||||||||||||||||
| Adjusted earnings per share - basic |
$ | 1.222 | $ | 0.439 | $ | 3.025 | $ | 1.412 | ||||||||
| Adjusted earnings per share - diluted |
$ | 1.220 | $ | 0.438 | $ | 3.019 | $ | 1.410 | ||||||||
WHEATON PRECIOUS METALS 2025 ANNUAL REPORT- MANAGEMENT DISCUSSION & ANALYSIS [46]
| ii. | Operating cash flow per share (basic and diluted) is calculated by dividing cash generated by operating activities by the weighted average number of shares outstanding (basic and diluted). The Company presents operating cash flow per share as management and certain investors use this information to evaluate the Company’s performance in comparison to other companies in the precious metal mining industry who present results on a similar basis. |
The following table provides a reconciliation of operating cash flow per share (basic and diluted).
| Three Months Ended December 31 |
Years Ended |
|||||||||||||||
| (in thousands, except for per share amounts) | 2025 | 2024 | 2025 | 2024 | ||||||||||||
| Cash generated by operating activities |
$ | 746,277 | $ | 319,471 | $ | 1,904,981 | $ | 1,027,581 | ||||||||
| Divided by: |
||||||||||||||||
| Basic weighted average number of shares outstanding |
454,020 | 453,669 | 453,893 | 453,460 | ||||||||||||
| Diluted weighted average number of shares outstanding |
454,841 | 454,361 | 454,685 | 454,119 | ||||||||||||
| Equals: |
||||||||||||||||
| Operating cash flow per share - basic |
$ | 1.644 | $ | 0.704 | $ | 4.197 | $ | 2.266 | ||||||||
| Operating cash flow per share - diluted |
$ | 1.641 | $ | 0.703 | $ | 4.190 | $ | 2.263 | ||||||||
WHEATON PRECIOUS METALS 2025 ANNUAL REPORT- MANAGEMENT DISCUSSION & ANALYSIS [47]
| iii. | Average cash cost of gold, silver and palladium on a per ounce basis and cobalt on a per pound basis is calculated by dividing the total cost of sales, less depletion and cost of sales related to delay ounces, by the ounces or pounds sold. In the precious metal mining industry, this is a common performance measure but does not have any standardized meaning prescribed by IFRS Accounting Standards. In addition to conventional measures prepared in accordance with IFRS Accounting Standards, management and certain investors use this information to evaluate the Company’s performance and ability to generate cash flow. |
The following table provides a calculation of average cash cost of gold, silver and palladium on a per ounce basis and cobalt on a per pound basis.
| Three Months Ended December 31 |
Years Ended December 31 |
|||||||||||||||
| (in thousands, except for gold and palladium ounces sold and per unit amounts) |
2025 | 2024 | 2025 | 2024 | ||||||||||||
| Cost of sales |
$ | 201,184 | $ | 133,109 | $ | 642,952 | $ | 482,052 | ||||||||
| Less: depletion |
(86,228) | (68,873) | (303,889) | (246,944) | ||||||||||||
| Less: cost of sales related to delay ounces 1 |
(1,253) | (1,396) | (4,196) | (3,095) | ||||||||||||
| Cash cost of sales |
$ | 113,703 | $ | 62,840 | $ | 334,867 | $ | 232,013 | ||||||||
| Cash cost of sales is comprised of: |
||||||||||||||||
| Total cash cost of gold sold |
$ | 60,314 | $ | 38,556 | $ | 197,001 | $ | 146,271 | ||||||||
| Total cash cost of silver sold |
50,865 | 22,213 | 130,210 | 80,022 | ||||||||||||
| Total cash cost of palladium sold |
422 | 816 | 1,827 | 3,088 | ||||||||||||
| Total cash cost of cobalt sold |
2,102 | 1,255 | 5,829 | 2,632 | ||||||||||||
| Total cash cost of sales |
$ | 113,703 | $ | 62,840 | $ | 334,867 | $ | 232,013 | ||||||||
| Divided by: |
||||||||||||||||
| Total gold ounces sold |
121,791 | 87,662 | 411,005 | 332,701 | ||||||||||||
| Total silver ounces sold |
5,685 | 4,307 | 19,796 | 16,072 | ||||||||||||
| Total palladium ounces sold |
1,730 | 4,434 | 9,356 | 17,270 | ||||||||||||
| Total cobalt pounds sold |
485 | 485 | 1,632 | 970 | ||||||||||||
| Equals: |
||||||||||||||||
| Average cash cost of gold (per ounce) |
$ | 495 | $ | 440 | $ | 479 | $ | 440 | ||||||||
| Average cash cost of silver (per ounce) |
$ | 8.95 | $ | 5.16 | $ | 6.58 | $ | 4.98 | ||||||||
| Average cash cost of palladium (per ounce) |
$ | 244 | $ | 184 | $ | 195 | $ | 179 | ||||||||
| Average cash cost of cobalt (per pound) |
$ | 4.33 | $ | 2.59 | $ | 3.57 | $ | 2.71 | ||||||||
| 1) | The cost of sales related to delay ounces is a non-cash expense (see footnote 3 on page 9 of this MD&A for more information). |
WHEATON PRECIOUS METALS 2025 ANNUAL REPORT- MANAGEMENT DISCUSSION & ANALYSIS [48]
| iv. | Cash operating margin is calculated by adding back depletion and the cost of sales related to delay ounces to the gross margin. Cash operating margin on a per ounce or per pound basis is calculated by dividing the cash operating margin by the number of ounces or pounds sold during the period. The Company presents cash operating margin as management and certain investors use this information to evaluate the Company’s performance in comparison to other companies in the precious metal mining industry who present results on a similar basis as well as to evaluate the Company’s ability to generate cash flow. |
The following table provides a reconciliation of cash operating margin.
| Three Months Ended December 31 |
Years Ended December 31 |
|||||||||||||||
| (in thousands, except for gold and palladium ounces sold and per unit amounts) | 2025 | 2024 | 2025 | 2024 | ||||||||||||
| Gross margin |
$ | 663,530 | $ | 247,407 | $ | 1,671,648 | $ | 802,587 | ||||||||
| Add back: depletion |
86,228 | 68,873 | 303,889 | 246,944 | ||||||||||||
| Add back: cost of sales related to delay ounces 1 |
1,253 | 1,396 | 4,196 | 3,095 | ||||||||||||
| Cash operating margin |
$ | 751,011 | $ | 317,676 | $ | 1,979,733 | $ | 1,052,626 | ||||||||
| Cash operating margin is comprised of: |
||||||||||||||||
| Total cash operating margin of gold sold |
$ | 453,060 | $ | 196,134 | $ | 1,239,217 | $ | 649,780 | ||||||||
| Total cash operating margin of silver sold |
286,332 | 112,520 | 706,461 | 377,808 | ||||||||||||
| Total cash operating margin of palladium sold |
2,136 | 3,652 | 8,709 | 13,911 | ||||||||||||
| Total cash operating margin of cobalt sold |
9,483 | 5,370 | 25,346 | 11,127 | ||||||||||||
| Total cash operating margin |
$ | 751,011 | $ | 317,676 | $ | 1,979,733 | $ | 1,052,626 | ||||||||
| Divided by: |
||||||||||||||||
| Total gold ounces sold |
121,791 | 87,662 | 411,005 | 332,701 | ||||||||||||
| Total silver ounces sold |
5,685 | 4,307 | 19,796 | 16,072 | ||||||||||||
| Total palladium ounces sold |
1,730 | 4,434 | 9,356 | 17,270 | ||||||||||||
| Total cobalt pounds sold |
485 | 485 | 1,632 | 970 | ||||||||||||
| Equals: |
||||||||||||||||
| Cash operating margin per gold ounce sold |
$ | 3,720 | $ | 2,237 | $ | 3,015 | $ | 1,953 | ||||||||
| Cash operating margin per silver ounce sold |
$ | 50.37 | $ | 26.12 | $ | 35.68 | $ | 23.51 | ||||||||
| Cash operating margin per palladium ounce sold |
$ | 1,235 | $ | 824 | $ | 931 | $ | 805 | ||||||||
| Cash operating margin per cobalt pound sold |
$ | 19.56 | $ | 11.07 | $ | 15.54 | $ | 11.47 | ||||||||
| 1) | The cost of sales related to delay ounces is a non-cash expense (see footnote 3 on page 9 of this MD&A for more information). |
WHEATON PRECIOUS METALS 2025 ANNUAL REPORT- MANAGEMENT DISCUSSION & ANALYSIS [49]
Subsequent Events
Declaration of Dividend
On March 12, 2026, the Board of Directors declared a dividend in the amount of $0.195 per common share, with this dividend being payable to shareholders of record on March 31, 2026 and is expected to be distributed on or about April 10, 2026. The Company has implemented a dividend reinvestment plan (“DRIP”) whereby shareholders can elect to have dividends reinvested directly into additional Wheaton common shares based on the Average Market Price, as defined in the DRIP.
Controls and Procedures
Disclosure Controls and Procedures
Wheaton’s management, with the participation of its Chief Executive Officer and Chief Financial Officer, has evaluated the design and effectiveness of Wheaton’s disclosure controls and procedures, as defined in the rules of the U.S. Securities and Exchange Commission and Canadian Securities Administrators, as of December 31, 2025. Based on that evaluation, the Company’s Chief Executive Officer and Chief Financial Officer have concluded that Wheaton’s disclosure controls and procedures were effective as of December 31, 2025.
Internal Control Over Financial Reporting
The Company’s management, with the participation of its Chief Executive Officer and Chief Financial Officer, are responsible for establishing and maintaining adequate internal control over financial reporting. Under the supervision of the Chief Financial Officer, the Company’s internal control over financial reporting is a process designed to provide reasonable assurance regarding the reliability of financial reporting and the preparation of financial statements for external purposes in accordance with IFRS Accounting Standards. The Company’s controls include policies and procedures that:
| ● | pertain to the maintenance of records that, in reasonable detail, accurately and fairly reflect the transactions and dispositions of the assets of the Company; |
| ● | provide reasonable assurance that transactions are recorded as necessary to permit preparation of financial statements in accordance with IFRS Accounting Standards, and that receipts and expenditures of the Company are being made only in accordance with authorizations of the Company’s management and directors; and, |
| ● | provide reasonable assurance regarding prevention or timely detection of unauthorized acquisition, use or disposition of the Company’s assets that could have a material effect on the annual financial statements or interim financial statements. |
The Company’s management, including its Chief Executive Officer and Chief Financial Officer, has evaluated the effectiveness of the Company’s internal control over financial reporting using the framework and criteria established in Internal Control – Integrated Framework (2013), issued by the Committee of Sponsoring Organizations of the Treadway Commission. Based on this evaluation, management has concluded that the internal control over financial reporting was effective at as of December 31, 2025.
There have been no changes in the Company’s internal control over financial reporting during the three months ended December 31, 2025 that would materially affect, or is reasonably likely to materially affect, the Company’s internal control over financial reporting.
Limitation of Controls and Procedures
The Company’s management, including its Chief Executive Officer and Chief Financial Officer, believe that any disclosure controls and procedures or internal control over financial reporting, no matter how well conceived and operated, can provide only reasonable, not absolute, assurance that the objectives of the control system are met. Further, the design of a control system must reflect the fact that there are resource constraints, and the benefits of controls must be considered relative to their costs. Because of the inherent limitations in all control systems, they cannot provide absolute assurance that all control issues and instances of fraud, if any, within the Company have been prevented or detected. These inherent limitations include the realities that judgments in decision-making can be faulty, and that breakdowns can occur because of simple error or mistake. Additionally, controls can be circumvented by the individual acts of some persons, by collusion of two or more people, or by unauthorized override of the controls. The design of any system of controls also is based in part upon certain assumptions about the likelihood of future events, and there can be no assurance that any design will succeed in achieving its stated goals under all potential future conditions. Accordingly, because of the inherent limitations in a cost effective control system, misstatements due to error or fraud may occur and not be detected.
WHEATON PRECIOUS METALS 2025 ANNUAL REPORT- MANAGEMENT DISCUSSION & ANALYSIS [50]
Attributable Reserves and Resources
The following tables set forth the estimated Mineral Reserves and Mineral Resources (metals attributable to Wheaton only) for the mines relating to which the Company has PMPAs, adjusted where applicable to reflect the Company’s percentage entitlement to such metals, as of December 31, 2025, unless otherwise noted. The tables are based on information available to the Company as of the date of this document, and therefore will not reflect updates, if any, after such date. The most current Mineral Reserves and Mineral Resources will be available on the Company’s website.
Mineral Reserves Attributable to Wheaton Precious Metals (1,2,3,8,41)
| December 31, 2025 (6) |
December 31, 2024 | |||||||||||||||||||||||||||||||||||||||||||||||||||||
| Proven | Probable | Proven & Probable | Proven & Probable | |||||||||||||||||||||||||||||||||||||||||||||||||||
| Tonnage | Grade | Contained | Tonnage | Grade | Contained | Tonnage | Grade | Contained | Process Recovery % (7) |
Tonnage | Grade | Contained | ||||||||||||||||||||||||||||||||||||||||||
| Asset | Interest | Mt | g/t / % | Moz /Mlbs | Mt | g/t / % | Moz / Mlbs | Mt | g/t / % | Moz / Mlbs | Mt | g/t / % | Moz / Mlbs | |||||||||||||||||||||||||||||||||||||||||
| Gold |
||||||||||||||||||||||||||||||||||||||||||||||||||||||
| Black Pine Royalty (32) |
0.5% | - | - | - | 1.5 | 0.32 | 0.02 | 1.5 | 0.32 | 0.02 | 70% | 1.5 | 0.32 | 0.02 | ||||||||||||||||||||||||||||||||||||||||
| Blackwater (11,27) |
8% | 23.4 | 0.74 | 0.56 | 0.7 | 0.80 | 0.02 | 24.1 | 0.74 | 0.57 | 91% | 24.1 | 0.74 | 0.57 | ||||||||||||||||||||||||||||||||||||||||
| Cangrejos (11,31) |
4.4% | - | - | - | 29.0 | 0.55 | 0.51 | 29.0 | 0.55 | 0.51 | 85% | 43.5 | 0.55 | 0.76 | ||||||||||||||||||||||||||||||||||||||||
| Constancia |
50% | 226.0 | 0.04 | 0.30 | 32.5 | 0.04 | 0.04 | 258.5 | 0.04 | 0.34 | 61% | 258.5 | 0.04 | 0.34 | ||||||||||||||||||||||||||||||||||||||||
| Copper World Complex (21) |
100% | 319.4 | 0.03 | 0.27 | 65.7 | 0.02 | 0.04 | 385.1 | 0.02 | 0.31 | 60% | 385.1 | 0.02 | 0.31 | ||||||||||||||||||||||||||||||||||||||||
| Curraghinalt (11,33) |
3.05% | 0.002 | 9.14 | 0.001 | 0.4 | 6.43 | 0.08 | 0.4 | 6.45 | 0.08 | 94% | 0.4 | 6.45 | 0.08 | ||||||||||||||||||||||||||||||||||||||||
| DeLamar Royalty(37) |
1.5% | 0.2 | 0.40 | 0.002 | 1.6 | 0.32 | 0.02 | 1.8 | 0.33 | 0.02 | 72% | 1.4 | 0.40 | 0.02 | ||||||||||||||||||||||||||||||||||||||||
| El Domo (11,29) |
50% | 1.6 | 2.83 | 0.14 | 1.7 | 2.23 | 0.12 | 3.2 | 2.52 | 0.26 | 53% | 3.2 | 2.52 | 0.26 | ||||||||||||||||||||||||||||||||||||||||
| Fenix (11,26) |
22% | 8.3 | 0.50 | 0.13 | 6.8 | 0.45 | 0.10 | 15.1 | 0.48 | 0.23 | 75% | 15.1 | 0.48 | 0.23 | ||||||||||||||||||||||||||||||||||||||||
| Goose (11,30) |
2.78% | - | - | - | 0.3 | 6.82 | 0.07 | 0.3 | 6.82 | 0.07 | 93% | 0.3 | 6.82 | 0.07 | ||||||||||||||||||||||||||||||||||||||||
| Hemlo (11,41) |
10.13% | - | - | - | - | - | - | - | - | - | ||||||||||||||||||||||||||||||||||||||||||||
| Hemlo O/P |
- | - | - | 2.6 | 0.85 | 0.07 | 2.6 | 0.85 | 0.07 | 93% | 2.6 | 0.85 | 0.07 | |||||||||||||||||||||||||||||||||||||||||
| Hemlo Interlake |
- | - | - | 0.2 | 3.93 | 0.02 | 0.2 | 3.93 | 0.02 | 93% | 0.2 | 3.94 | 0.03 | |||||||||||||||||||||||||||||||||||||||||
| Hemlo Non-Interlake |
- | - | - | 0.8 | 3.67 | 0.10 | 0.8 | 3.67 | 0.10 | 93% | 0.7 | 3.63 | 0.09 | |||||||||||||||||||||||||||||||||||||||||
| Koné (11,38) |
19.5% | - | - | - | 26.7 | 0.72 | 0.62 | 26.7 | 0.72 | 0.62 | 89% | 26.7 | 0.72 | 0.62 | ||||||||||||||||||||||||||||||||||||||||
| Kudz Ze Kayah (11,34) |
7.27% | - | - | - | 1.1 | 1.32 | 0.05 | 1.1 | 1.32 | 0.05 | 64% | 1.1 | 1.32 | 0.05 | ||||||||||||||||||||||||||||||||||||||||
| Kurmuk (11,39) |
6.7% | 1.5 | 1.51 | 0.07 | 2.6 | 1.35 | 0.11 | 4.1 | 1.41 | 0.18 | 92% | 4.1 | 1.41 | 0.18 | ||||||||||||||||||||||||||||||||||||||||
| Kutcho (12) |
100% | 6.8 | 0.37 | 0.08 | 10.6 | 0.39 | 0.13 | 17.4 | 0.38 | 0.21 | 41% | 17.4 | 0.38 | 0.21 | ||||||||||||||||||||||||||||||||||||||||
| Marathon (11,28) |
100% | 111.6 | 0.07 | 0.26 | 12.3 | 0.06 | 0.03 | 123.8 | 0.07 | 0.28 | 71% | 123.8 | 0.07 | 0.28 | ||||||||||||||||||||||||||||||||||||||||
| Marmato (11,15) |
10.5% | 0.2 | 4.31 | 0.03 | 3.0 | 3.07 | 0.30 | 3.2 | 3.16 | 0.33 | 90% | 3.2 | 3.16 | 0.33 | ||||||||||||||||||||||||||||||||||||||||
| Mt Todd Royalty (11,36) |
1% | 0.7 | 0.95 | 0.02 | 0.9 | 0.93 | 0.03 | 1.6 | 0.94 | 0.05 | 89% | 2.4 | 0.77 | 0.06 | ||||||||||||||||||||||||||||||||||||||||
| Platreef (11,35) |
62.5% | - | - | - | 72.3 | 0.29 | 0.67 | 72.3 | 0.29 | 0.67 | 79% | 72.3 | 0.29 | 0.67 | ||||||||||||||||||||||||||||||||||||||||
| Salobo (10) |
75% | 262.2 | 0.34 | 2.87 | 505.5 | 0.33 | 5.43 | 767.7 | 0.34 | 8.29 | 72% | 793.2 | 0.35 | 8.85 | ||||||||||||||||||||||||||||||||||||||||
| San Dimas (14) |
25% | 0.3 | 3.16 | 0.03 | 0.5 | 2.63 | 0.04 | 0.8 | 2.84 | 0.07 | 95% | 0.8 | 2.84 | 0.07 | ||||||||||||||||||||||||||||||||||||||||
| Santo Domingo (11,25) |
100% | 125.9 | 0.07 | 0.28 | 293.5 | 0.04 | 0.33 | 419.4 | 0.05 | 0.61 | 56% | 419.4 | 0.05 | 0.61 | ||||||||||||||||||||||||||||||||||||||||
| Spring Valley (11,42) |
8% | - | - | - | 22.3 | 0.43 | 0.31 | 22.3 | 0.43 | 0.31 | 78% | 22.3 | 0.43 | 0.31 | ||||||||||||||||||||||||||||||||||||||||
| Stillwater (13) |
100% | 7.9 | 0.39 | 0.10 | 37.1 | 0.36 | 0.43 | 45.0 | 0.37 | 0.53 | 69% | 44.5 | 0.36 | 0.52 | ||||||||||||||||||||||||||||||||||||||||
| Sudbury (11) |
70% | 12.0 | 0.45 | 0.17 | 9.3 | 0.38 | 0.11 | 21.2 | 0.42 | 0.29 | 75% | 28.0 | 0.26 | 0.24 | ||||||||||||||||||||||||||||||||||||||||
| Total Gold |
5.32 | 9.77 | 15.09 | 15.85 | ||||||||||||||||||||||||||||||||||||||||||||||||||
WHEATON PRECIOUS METALS 2025 ANNUAL REPORT- MANAGEMENT DISCUSSION & ANALYSIS [51]
Mineral Reserves Attributable to Wheaton Precious Metals (Continued) (1,2,3,8,41)
| December 31, 2025 (6) |
December 31, 2024 | |||||||||||||||||||||||||||||||||||||||||||||||||||||
| Tonnage | Grade | Contained | Tonnage | Grade | Contained | Tonnage | Grade | Contained | Process Recovery % (7) |
Tonnage | Grade | Contained | ||||||||||||||||||||||||||||||||||||||||||
| Asset | Interest | Mt | g/t / % | Moz /Mlbs | Mt | g/t / % | Moz / Mlbs | Mt | g/t / % | Moz / Mlbs | Mt | g/t / % | Moz / Mlbs | |||||||||||||||||||||||||||||||||||||||||
| Silver |
||||||||||||||||||||||||||||||||||||||||||||||||||||||
| Aljustrel (19) |
100% | 7.8 | 46.2 | 11.7 | 19.2 | 39.4 | 24.3 | 27.0 | 41.4 | 36.0 | 26% | 24.3 | 43.4 | 33.9 | ||||||||||||||||||||||||||||||||||||||||
| Antamina (10,11,18,43) |
67.50% | |||||||||||||||||||||||||||||||||||||||||||||||||||||
| Copper |
143.1 | 7.9 | 36.3 | 118.1 | 9.6 | 36.4 | 261.2 | 8.7 | 72.8 | 75% | 130.6 | 8.7 | 36.7 | |||||||||||||||||||||||||||||||||||||||||
| Copper-Zinc |
32.5 | 18.7 | 19.6 | 63.0 | 19.4 | 39.3 | 95.5 | 19.2 | 58.8 | 75% | 55.0 | 18.8 | 33.3 | |||||||||||||||||||||||||||||||||||||||||
| Blackwater (11,27) |
50% | 165.2 | 5.8 | 30.7 | 4.7 | 5.8 | 0.9 | 169.9 | 5.8 | 31.6 | 61% | 169.9 | 5.8 | 31.6 | ||||||||||||||||||||||||||||||||||||||||
| Constancia |
100% | 451.9 | 2.6 | 38.4 | 65.0 | 1.8 | 3.7 | 516.9 | 2.5 | 42.1 | 70% | 516.9 | 2.5 | 42.1 | ||||||||||||||||||||||||||||||||||||||||
| Copper World Complex (21) |
100% | 319.4 | 5.7 | 58.3 | 65.7 | 4.3 | 9.1 | 385.1 | 5.4 | 67.4 | 76% | 385.1 | 5.4 | 67.4 | ||||||||||||||||||||||||||||||||||||||||
| Cozamin (11,20) |
50% | |||||||||||||||||||||||||||||||||||||||||||||||||||||
| Copper |
0.0 | 38.0 | 0.0 | 2.8 | 40.6 | 3.6 | 2.8 | 40.6 | 3.7 | 86% | 3.5 | 41.8 | 4.7 | |||||||||||||||||||||||||||||||||||||||||
| Zinc |
- | - | - | 0.5 | 50.9 | 0.9 | 0.5 | 50.9 | 0.9 | 60% | 0.5 | 50.9 | 0.9 | |||||||||||||||||||||||||||||||||||||||||
| DeLamar Royalty (37) |
1.5% | 0.2 | 16.3 | 0.1 | 1.6 | 13.3 | 0.7 | 1.8 | 13.6 | 0.8 | 37% | 1.4 | 17.3 | 0.8 | ||||||||||||||||||||||||||||||||||||||||
| El Domo (11,29) |
75% | 2.4 | 41.4 | 3.1 | 2.5 | 49.7 | 4.0 | 4.9 | 45.7 | 7.1 | 63% | 4.9 | 45.7 | 7.1 | ||||||||||||||||||||||||||||||||||||||||
| Kudz Ze Kayah (11,34) |
7.21% | - | - | - | 1.1 | 137.5 | 4.8 | 1.1 | 137.5 | 4.8 | 86% | 1.1 | 137.5 | 4.8 | ||||||||||||||||||||||||||||||||||||||||
| Kutcho (12) |
100% | 6.8 | 24.5 | 5.4 | 10.6 | 30.1 | 10.2 | 17.4 | 27.9 | 15.6 | 46% | 17.4 | 27.9 | 15.6 | ||||||||||||||||||||||||||||||||||||||||
| Los Filos (11,40) |
100% | 13.0 | 4.2 | 1.8 | 57.8 | 6.0 | 11.1 | 70.7 | 5.6 | 12.8 | 10% | 70.7 | 5.6 | 12.8 | ||||||||||||||||||||||||||||||||||||||||
| Marmato (11,15) |
100% | 2.1 | 16.4 | 1.1 | 27.4 | 5.3 | 4.7 | 29.5 | 6.1 | 5.8 | 34% | 29.7 | 6.1 | 5.8 | ||||||||||||||||||||||||||||||||||||||||
| Mineral Park |
100% | 123.3 | 2.3 | 9.2 | 247.1 | 2.5 | 19.6 | 370.4 | 2.4 | 28.9 | 61% | 188.3 | 2.4 | 14.6 | ||||||||||||||||||||||||||||||||||||||||
| Neves-Corvo |
100% | |||||||||||||||||||||||||||||||||||||||||||||||||||||
| Copper |
3.9 | 29.0 | 3.7 | 20.0 | 31.0 | 20.0 | 24.0 | 30.7 | 23.6 | 24% | 20.1 | 31.6 | 20.5 | |||||||||||||||||||||||||||||||||||||||||
| Zinc |
6.7 | 66.0 | 14.1 | 17.5 | 57.0 | 32.0 | 24.1 | 59.5 | 46.1 | 30% | 18.7 | 62.2 | 37.4 | |||||||||||||||||||||||||||||||||||||||||
| Peñasquito (10) |
25% | 21.1 | 35.3 | 23.9 | 34.2 | 30.6 | 33.6 | 55.3 | 32.4 | 57.5 | 82% | 64.2 | 30.7 | 63.3 | ||||||||||||||||||||||||||||||||||||||||
| San Dimas (14) |
25% | 0.3 | 253.2 | 2.6 | 0.5 | 240.5 | 3.8 | 0.8 | 245.5 | 6.4 | 94% | 0.8 | 245.5 | 6.4 | ||||||||||||||||||||||||||||||||||||||||
| Zinkgruvan |
100% | |||||||||||||||||||||||||||||||||||||||||||||||||||||
| Zinc |
3.9 | 63.0 | 7.9 | 9.9 | 75.0 | 23.9 | 13.8 | 71.6 | 31.8 | 83% | 11.3 | 76.7 | 27.8 | |||||||||||||||||||||||||||||||||||||||||
| Copper |
1.4 | 32.0 | 1.4 | 0.2 | 34.0 | 0.3 | 1.6 | 32.3 | 1.7 | 70% | 1.6 | 33.1 | 1.7 | |||||||||||||||||||||||||||||||||||||||||
| Total Silver |
269.3 | 286.8 | 556.1 | 469.2 | ||||||||||||||||||||||||||||||||||||||||||||||||||
| Palladium |
||||||||||||||||||||||||||||||||||||||||||||||||||||||
| Platreef (11,35) |
5.25% | - | - | - | 5.7 | 1.9 | 0.35 | 5.7 | 1.9 | 0.35 | 87% | 5.7 | 1.9 | 0.35 | ||||||||||||||||||||||||||||||||||||||||
| Stillwater (11,13) |
4.5% | 0.3 | 11.6 | 0.09 | 1.2 | 10.2 | 0.39 | 1.4 | 10.5 | 0.48 | 90% | 1.4 | 10.3 | 0.48 | ||||||||||||||||||||||||||||||||||||||||
| Total Palladium |
0.09 | 0.74 | 0.83 | 0.83 | ||||||||||||||||||||||||||||||||||||||||||||||||||
| Platinum |
||||||||||||||||||||||||||||||||||||||||||||||||||||||
| Marathon (11,28) |
22% | 25.4 | 0.2 | 0.17 | 2.8 | 0.2 | 0.01 | 28.2 | 0.2 | 0.18 | 76% | 28.2 | 0.2 | 0.18 | ||||||||||||||||||||||||||||||||||||||||
| Platreef (11,35) |
5.25% | - | 0.0 | - | 5.7 | 1.9 | 0.34 | 5.7 | 1.9 | 0.34 | 87% | 5.7 | 1.9 | 0.34 | ||||||||||||||||||||||||||||||||||||||||
| Total Platinum |
0.17 | 0.35 | 0.52 | 0.52 | ||||||||||||||||||||||||||||||||||||||||||||||||||
| Cobalt |
||||||||||||||||||||||||||||||||||||||||||||||||||||||
| Voisey’s Bay (11,22) |
42.4% | 8.4 | 0.11 | 20.3 | 3.6 | 0.11 | 8.5 | 12.0 | 0.11 | 28.8 | 84% | 12.4 | 0.11 | 30.6 | ||||||||||||||||||||||||||||||||||||||||
| Total Cobalt |
20.3 | 8.5 | 28.8 | 30.6 | ||||||||||||||||||||||||||||||||||||||||||||||||||
WHEATON PRECIOUS METALS 2025 ANNUAL REPORT- MANAGEMENT DISCUSSION & ANALYSIS [52]
Mineral Resources Attributable to Wheaton Precious Metals (1,2,3,4,5,9,41)
| December 31, 2025 (6) |
||||||||||||||||||||||||||||||||||||||||||||||||
| Measured | Indicated | Measured & Indicated | Inferred | |||||||||||||||||||||||||||||||||||||||||||||
| Tonnage | Grade | Contained | Tonnage | Grade | Contained | Tonnage | Grade | Contained | Tonnage | Grade | Contained | |||||||||||||||||||||||||||||||||||||
| Interest | Mt | g/t / % | Moz / Mlbs | Mt | g/t / % | Moz / Mlbs | Mt | g/t / % | Moz / Mlbs | Mt | g/t / % | Moz / Mlbs | ||||||||||||||||||||||||||||||||||||
| Gold |
||||||||||||||||||||||||||||||||||||||||||||||||
| Black Pine Royalty (32) |
0.5% | - | - | - | 1.0 | 0.26 | 0.01 | 1.0 | 0.26 | 0.01 | 0.8 | 0.21 | 0.005 | |||||||||||||||||||||||||||||||||||
| Blackwater (11,27) |
8% | 4.1 | 0.35 | 0.05 | 6.4 | 0.49 | 0.10 | 10.5 | 0.44 | 0.15 | 0.7 | 0.45 | 0.01 | |||||||||||||||||||||||||||||||||||
| Brewery Creek Royalty (24) |
2% | 0.3 | 1.06 | 0.01 | 0.5 | 1.02 | 0.02 | 0.8 | 1.03 | 0.03 | 1.0 | 0.88 | 0.03 | |||||||||||||||||||||||||||||||||||
| Cangrejos (11,31) |
4.4% | - | - | - | 13.7 | 0.38 | 0.17 | 13.7 | 0.38 | 0.17 | 8.7 | 0.39 | 0.11 | |||||||||||||||||||||||||||||||||||
| Constancia |
50% | 46.4 | 0.04 | 0.06 | 43.5 | 0.04 | 0.05 | 89.8 | 0.04 | 0.11 | 20.5 | 0.07 | 0.05 | |||||||||||||||||||||||||||||||||||
| Copper World Complex (21) |
100% | 424.0 | 0.02 | 0.30 | 191.0 | 0.02 | 0.10 | 615.0 | 0.02 | 0.40 | 192.0 | 0.01 | 0.08 | |||||||||||||||||||||||||||||||||||
| Cotabambas (12,23) |
25% | - | - | - | 126.8 | 0.20 | 0.82 | 126.8 | 0.20 | 0.82 | 105.9 | 0.17 | 0.57 | |||||||||||||||||||||||||||||||||||
| Curraghinalt (11,33) |
3.05% | - | - | - | - | - | - | - | - | - | 0.2 | 12.24 | 0.07 | |||||||||||||||||||||||||||||||||||
| DeLamar Royalty (37) |
1.5% | 0.4 | 0.49 | 0.006 | 1.5 | 0.38 | 0.02 | 1.9 | 0.40 | 0.02 | 0.6 | 0.31 | 0.006 | |||||||||||||||||||||||||||||||||||
| El Domo (11,29) |
50% | - | - | - | 1.2 | 1.63 | 0.06 | 1.2 | 1.63 | 0.06 | 0.4 | 1.62 | 0.02 | |||||||||||||||||||||||||||||||||||
| Fenix (11,26) |
22% | 2.4 | 0.34 | 0.03 | 8.5 | 0.34 | 0.09 | 10.9 | 0.34 | 0.12 | 3.2 | 0.33 | 0.03 | |||||||||||||||||||||||||||||||||||
| Goose (11,30) |
2.78% | - | - | - | 0.1 | 4.31 | 0.01 | 0.1 | 4.31 | 0.01 | 0.2 | 7.54 | 0.04 | |||||||||||||||||||||||||||||||||||
| Hemlo (11,41) |
10.13% | |||||||||||||||||||||||||||||||||||||||||||||||
| Hemlo O/P |
- | - | - | 1.9 | 0.85 | 0.05 | 1.9 | 0.85 | 0.05 | 0.4 | 0.42 | 0.01 | ||||||||||||||||||||||||||||||||||||
| Hemlo Interlake |
- | - | - | 0.03 | 5.37 | 0.01 | 0.03 | 5.37 | 0.01 | 0.04 | 7.13 | 0.01 | ||||||||||||||||||||||||||||||||||||
| Hemlo Non-Interlake |
- | - | - | 0.1 | 4.41 | 0.01 | 0.1 | 4.41 | 0.01 | 0.1 | 3.78 | 0.01 | ||||||||||||||||||||||||||||||||||||
| Koné (11,38) |
19.5% | - | - | - | 4.7 | 0.43 | 0.06 | 4.7 | 0.43 | 0.06 | 2.4 | 0.54 | 0.04 | |||||||||||||||||||||||||||||||||||
| Kudz Ze Kayah (11,34) |
7.27% | - | - | - | 0.2 | 1.23 | 0.01 | 0.2 | 1.23 | 0.01 | 0.04 | 1.15 | 0.002 | |||||||||||||||||||||||||||||||||||
| Kurmuk (11,39) |
6.7% | 0.2 | 1.30 | 0.01 | 0.5 | 1.35 | 0.02 | 0.6 | 1.34 | 0.03 | 0.4 | 1.62 | 0.02 | |||||||||||||||||||||||||||||||||||
| Kutcho (12) |
100% | 0.4 | 0.20 | 0.003 | 5.0 | 0.38 | 0.06 | 5.4 | 0.37 | 0.06 | 12.9 | 0.25 | 0.10 | |||||||||||||||||||||||||||||||||||
| Marathon (11,28) |
100% | 32.4 | 0.06 | 0.06 | 44.9 | 0.06 | 0.08 | 77.3 | 0.06 | 0.15 | 20.0 | 0.04 | 0.03 | |||||||||||||||||||||||||||||||||||
| Marmato (11,15) |
10.5% | 0.1 | 5.04 | 0.01 | 1.7 | 2.28 | 0.13 | 1.8 | 2.40 | 0.14 | 1.9 | 2.43 | 0.15 | |||||||||||||||||||||||||||||||||||
| Metates Royalty (17) |
0.5% | 0.2 | 0.86 | 0.004 | 4.5 | 0.56 | 0.08 | 4.6 | 0.57 | 0.08 | 0.7 | 0.47 | 0.01 | |||||||||||||||||||||||||||||||||||
| Mt Todd Royalty (11,36) |
1% | 0.4 | 0.60 | 0.007 | 0.8 | 0.73 | 0.02 | 1.2 | 0.69 | 0.03 | 0.4 | 0.78 | 0.01 | |||||||||||||||||||||||||||||||||||
| Platreef (11,35) |
62.5% | - | - | - | 7.7 | 0.26 | 0.07 | 7.7 | 0.26 | 0.07 | 15.8 | 0.26 | 0.13 | |||||||||||||||||||||||||||||||||||
| Salobo (10) |
75% | 8.7 | 0.25 | 0.07 | 459.9 | 0.22 | 3.25 | 468.6 | 0.22 | 3.32 | 148.3 | 0.30 | 1.43 | |||||||||||||||||||||||||||||||||||
| San Dimas (14) |
25% | 0.2 | 4.01 | 0.03 | 0.4 | 1.60 | 0.02 | 0.6 | 2.49 | 0.05 | 1.3 | 2.89 | 0.12 | |||||||||||||||||||||||||||||||||||
| Santo Domingo (11,25) |
100% | 2.0 | 0.02 | 0.001 | 72.3 | 0.03 | 0.07 | 74.3 | 0.03 | 0.07 | 154.1 | 0.03 | 0.13 | |||||||||||||||||||||||||||||||||||
| Spring Valley (11,42) |
100% | - | - | - | 5.1 | 0.37 | 0.06 | 5.1 | 0.37 | 0.06 | 4.6 | 0.37 | 0.05 | |||||||||||||||||||||||||||||||||||
| Stillwater (13) |
100% | 20.5 | 0.36 | 0.24 | 20.6 | 0.31 | 0.20 | 41.0 | 0.34 | 0.44 | 96.5 | 0.37 | 1.14 | |||||||||||||||||||||||||||||||||||
| Sudbury (11) |
70% | 1.0 | 0.25 | 0.01 | 2.0 | 0.28 | 0.02 | 3.0 | 0.27 | 0.03 | 1.4 | 0.34 | 0.02 | |||||||||||||||||||||||||||||||||||
| Toroparu (12,16) |
10% | 4.9 | 1.31 | 0.20 | 7.8 | 1.30 | 0.33 | 12.7 | 1.30 | 0.53 | 2.3 | 1.60 | 0.12 | |||||||||||||||||||||||||||||||||||
| Total Gold |
1.10 | 6.00 | 7.10 | 4.57 | ||||||||||||||||||||||||||||||||||||||||||||
WHEATON PRECIOUS METALS 2025 ANNUAL REPORT- MANAGEMENT DISCUSSION & ANALYSIS [53]
Mineral Resources Attributable to Wheaton Precious Metals (Continued) (1,2,3,4,5,9,41)
| December 31, 2025 (6) |
||||||||||||||||||||||||||||||||||||||||||||||||
| Measured | Indicated | Measured & Indicated | Inferred | |||||||||||||||||||||||||||||||||||||||||||||
| Tonnage | Grade | Contained | Tonnage | Grade | Contained | Tonnage | Grade | Contained | Tonnage | Grade | Contained | |||||||||||||||||||||||||||||||||||||
| Interest | Mt | g/t / % | Moz / Mlbs | Mt | g/t / % | Moz / Mlbs | Mt | g/t / % | Moz / Mlbs | Mt | g/t / % | Moz / Mlbs | ||||||||||||||||||||||||||||||||||||
| Silver |
||||||||||||||||||||||||||||||||||||||||||||||||
| Aljustrel (19) |
100% | 14.2 | 45.3 | 20.7 | 11.5 | 45.2 | 16.8 | 25.8 | 45.2 | 37.5 | 27.1 | 41.7 | 36.3 | |||||||||||||||||||||||||||||||||||
| Antamina (10,11,18,43) |
33.75% | |||||||||||||||||||||||||||||||||||||||||||||||
| Copper |
57.2 | 6.6 | 12.1 | 118.1 | 8.2 | 31.0 | 175.2 | 7.7 | 43.1 | 488.1 | 8.9 | 140.0 | ||||||||||||||||||||||||||||||||||||
| Copper-Zinc |
9.5 | 25.5 | 7.8 | 43.9 | 18.4 | 25.9 | 53.4 | 19.6 | 33.7 | 132.1 | 16.2 | 69.0 | ||||||||||||||||||||||||||||||||||||
| Blackwater (11,27) |
50% | 33.7 | 4.7 | 5.1 | 52.9 | 8.7 | 14.8 | 86.6 | 7.1 | 19.9 | 5.6 | 12.8 | 2.3 | |||||||||||||||||||||||||||||||||||
| Constancia |
100% | 92.7 | 2.2 | 6.7 | 86.9 | 2.2 | 6.3 | 179.6 | 2.2 | 12.9 | 40.9 | 3.7 | 4.8 | |||||||||||||||||||||||||||||||||||
| Copper World Complex (21) |
100% | 424.0 | 4.1 | 55.9 | 191.0 | 3.5 | 21.5 | 615.0 | 3.9 | 77.4 | 192.0 | 3.1 | 19.1 | |||||||||||||||||||||||||||||||||||
| Cotabambas (12,23) |
100% | - | - | - | 507.3 | 2.4 | 39.5 | 507.3 | 2.4 | 39.5 | 423.6 | 2.5 | 34.5 | |||||||||||||||||||||||||||||||||||
| Cozamin (11,20) |
50% | |||||||||||||||||||||||||||||||||||||||||||||||
| Copper |
0.2 | 53.8 | 0.3 | 3.9 | 40.1 | 5.0 | 4.0 | 40.7 | 5.3 | 2.8 | 42.1 | 3.8 | ||||||||||||||||||||||||||||||||||||
| Zinc |
- | - | - | 1.4 | 36.4 | 1.6 | 1.4 | 36.4 | 1.6 | 1.7 | 33.8 | 1.8 | ||||||||||||||||||||||||||||||||||||
| DeLamar Royalty (37) |
1.5% | 0.4 | 32.3 | 0.40 | 1.5 | 19.5 | 1.0 | 1.9 | 22.1 | 1.4 | 0.6 | 11.7 | 0.2 | |||||||||||||||||||||||||||||||||||
| El Alto |
25% | 10.7 | 57.2 | 19.7 | 97.9 | 52.2 | 164.4 | 108.6 | 52.7 | 184.1 | 3.8 | 17.8 | 2.2 | |||||||||||||||||||||||||||||||||||
| El Domo (11,29) |
75% | - | - | - | 1.8 | 38.4 | 2.2 | 1.8 | 38.4 | 2.2 | 0.7 | 31.6 | 0.7 | |||||||||||||||||||||||||||||||||||
| Kudz Ze Kayah (11,34) |
7.21% | - | - | - | 0.2 | 134.7 | 0.9 | 0.2 | 134.7 | 0.9 | 0.04 | 144.2 | 0.2 | |||||||||||||||||||||||||||||||||||
| Kutcho (12) |
100% | 0.4 | 28.0 | 0.4 | 5.0 | 25.7 | 4.1 | 5.4 | 25.9 | 4.5 | 12.9 | 20.0 | 8.3 | |||||||||||||||||||||||||||||||||||
| Loma de La Plata |
12.5% | - | - | - | 3.6 | 169.0 | 19.8 | 3.6 | 169.0 | 19.8 | 0.2 | 76.0 | 0.4 | |||||||||||||||||||||||||||||||||||
| Marmato (11,15) |
100% | 0.7 | 25.3 | 0.6 | 16.3 | 6.0 | 3.1 | 17.0 | 6.8 | 3.7 | 17.8 | 3.2 | 1.8 | |||||||||||||||||||||||||||||||||||
| Metates Royalty (17) |
0.5% | 0.2 | 18.2 | 0.1 | 4.5 | 14.2 | 2.0 | 4.6 | 14.3 | 2.1 | 0.7 | 13.2 | 0.3 | |||||||||||||||||||||||||||||||||||
| Mineral Park |
100% | 13.6 | 1.9 | 0.8 | 233.4 | 1.9 | 14.1 | 246.9 | 1.9 | 15.0 | 391.2 | 1.2 | 15.5 | |||||||||||||||||||||||||||||||||||
| Neves-Corvo |
100% | |||||||||||||||||||||||||||||||||||||||||||||||
| Copper |
5.9 | 27.0 | 5.2 | 23.5 | 31.0 | 23.4 | 29.4 | 30.2 | 28.6 | 39.2 | 23.0 | 29.0 | ||||||||||||||||||||||||||||||||||||
| Zinc |
5.6 | 58.0 | 10.5 | 15.0 | 56.0 | 27.1 | 20.7 | 56.5 | 37.6 | 4.4 | 51.0 | 7.2 | ||||||||||||||||||||||||||||||||||||
| Peñasquito (10) |
25% | 13.2 | 28.3 | 12.0 | 43.0 | 25.3 | 35.0 | 56.2 | 26.0 | 47.0 | 2.3 | 24.2 | 1.8 | |||||||||||||||||||||||||||||||||||
| San Dimas (14) |
25% | 0.2 | 291.8 | 2.2 | 0.4 | 161.2 | 2.0 | 0.6 | 209.5 | 4.2 | 1.3 | 249.9 | 10.7 | |||||||||||||||||||||||||||||||||||
| Stratoni |
100% | - | - | - | 1.4 | 151.7 | 6.8 | 1.4 | 151.7 | 6.8 | 1.8 | 166.5 | 9.7 | |||||||||||||||||||||||||||||||||||
| Toroparu (12,16) |
50% | 24.3 | 1.8 | 1.4 | 39.2 | 1.2 | 1.5 | 63.5 | 1.4 | 2.9 | 11.5 | 0.7 | 0.3 | |||||||||||||||||||||||||||||||||||
| Zinkgruvan |
100% | |||||||||||||||||||||||||||||||||||||||||||||||
| Zinc |
3.7 | 70.0 | 8.3 | 3.0 | 53.0 | 5.1 | 6.7 | 62.4 | 13.4 | 16.0 | 96.0 | 49.4 | ||||||||||||||||||||||||||||||||||||
| Copper |
0.6 | 25.0 | 0.5 | 0.1 | 30.0 | 0.1 | 0.7 | 25.6 | 0.6 | 0.3 | 29.0 | 0.3 | ||||||||||||||||||||||||||||||||||||
| Total Silver |
170.6 | 474.9 | 645.5 | 449.5 | ||||||||||||||||||||||||||||||||||||||||||||
| Palladium |
||||||||||||||||||||||||||||||||||||||||||||||||
| Platreef (11,35) |
5.25% | - | - | - | 0.3 | 1.5 | 0.01 | 0.3 | 1.5 | 0.01 | 0.5 | 1.5 | 0.02 | |||||||||||||||||||||||||||||||||||
| Stillwater (11,13) |
4.5% | 0.2 | 10.7 | 0.07 | 0.2 | 8.7 | 0.06 | 0.4 | 9.7 | 0.13 | 1.0 | 10.3 | 0.32 | |||||||||||||||||||||||||||||||||||
| Total Palladium |
0.07 | 0.07 | 0.14 | 0.34 | ||||||||||||||||||||||||||||||||||||||||||||
| Platinum |
||||||||||||||||||||||||||||||||||||||||||||||||
| Marathon (11,28) |
22.0% | 7.6 | 0.1 | 0.04 | 10.5 | 0.1 | 0.04 | 18.1 | 0.1 | 0.08 | 4.5 | 0.1 | 0.01 | |||||||||||||||||||||||||||||||||||
| Platreef (11,35) |
5.25% | - | 0.0 | - | 0.3 | 1.5 | 0.01 | 0.3 | 1.5 | 0.01 | 0.5 | 1.4 | 0.02 | |||||||||||||||||||||||||||||||||||
| Total Platinum |
0.04 | 0.06 | 0.09 | 0.04 | ||||||||||||||||||||||||||||||||||||||||||||
| Cobalt |
||||||||||||||||||||||||||||||||||||||||||||||||
| Voisey’s Bay (11,22) |
42.4% | 0.5 | 0.07 | 0.7 | 3.5 | 0.11 | 8.5 | 3.9 | 0.11 | 9.2 | 2.9 | 0.08 | 5.3 | |||||||||||||||||||||||||||||||||||
| Total Cobalt |
0.7 | 8.5 | 9.2 | 5.3 | ||||||||||||||||||||||||||||||||||||||||||||
WHEATON PRECIOUS METALS 2025 ANNUAL REPORT- MANAGEMENT DISCUSSION & ANALYSIS [54]
Notes on Mineral Reserves & Mineral Resources:
| 1. | All Mineral Reserves and Mineral Resources have been estimated in accordance with the 2014 Canadian Institute of Mining, Metallurgy and Petroleum (CIM) Standards for Mineral Resources and Mineral Reserves and National Instrument 43-101 – Standards for Disclosure for Mineral Projects (“NI 43-101”), or the 2012 Australasian Joint Ore Reserves Committee (JORC) Code for Reporting of Exploration Results, Mineral Resources and Ore Reserves. |
| 2. | Mineral Reserves and Mineral Resources are reported above in millions of metric tonnes (“Mt”), grams per metric tonne (“g/t”) for gold, silver, palladium and platinum, percent (“%”) for cobalt, millions of ounces (“Moz”) for gold, silver, palladium and platinum and millions of pounds (“Mlbs”) for cobalt. |
| 3. | Qualified persons (“QPs”), as defined by the NI 43-101, for the technical information contained in this document (including the Mineral Reserve and Mineral Resource estimates) are: |
| a. | Ryan Ulansky, M.A.Sc., P.Eng. (Vice President, Engineering); and |
| b. | Jeremy Vincent, M.Sc., P.Geo. (Director, Geology), |
| both | employees of the Company (the “Company’s QPs”). |
| 4. | The Mineral Resources reported in the above tables are exclusive of Mineral Reserves. The Aljustrel mines, Black Pine project, Blackwater mine, Cangrejos project, Cozamin mine, Curraghinalt project, El Domo project, Fenix project, Goose mine, Hemlo mine, Kudz Ze Kayah project, Kutcho project, Marathon project, Platreef project, San Dimas mine, Santo Domingo project, and Spring Valley project report Mineral Resources inclusive of Mineral Reserves. The Company’s QPs have made the exclusive Mineral Resource estimates for these mines based on average mine recoveries and dilution. |
| 5. | Mineral Resources, which are not Mineral Reserves do not have demonstrated economic viability. |
| 6. | Other than as detailed below, Mineral Reserves and Mineral Resources are reported as of December 31, 2025 based on information available to the Company as of the date of this document, and therefore will not reflect updates, if any, after such date. |
| a. | Mineral Resources for Aljustrel’s Moinho mine are reported as of June 30, 2025, for the Feitais mine as of May 31, 2025, the Estação mine as of April 2024, and the São João project as of December 31, 2023. Mineral Reserves for, Moinho, Feitais, and Estação are reported as of December 31, 2024. |
| b. | Mineral Resources and Mineral Reserves for the Black Pine project are reported as of January 31, 2026. |
| c. | Mineral Resources for the Blackwater mine are reported as of May 5, 2020 and Mineral Reserves as of September 10, 2021. |
| d. | Mineral Resources for the Brewery Creek project are reported as of May 31, 2020. |
| e. | Mineral Resources for the Cangrejos project are reported as of January 30, 2023 and Mineral Reserves as of March 30, 2023. |
| f. | Mineral Resources and Mineral Reserves for the Copper World Complex project are reported as of July 1, 2023. |
| g. | Mineral Resources for the Cotabambas project are reported as of November 20, 2023. |
| h. | Mineral Resources for the El Domo project are reported as of October 26, 2021 and Mineral Reserves as of October 22, 2021. |
| i. | Mineral Resources for the Curraghinalt project are reported as of May 10, 2018 and Mineral Reserves as of February 25, 2022. |
| j. | Mineral Resources and Mineral Reserves for the DeLamar project are reported as of December 8, 2025. |
| k. | Mineral Resources and Mineral Reserves for the Fenix project are reported as of October 16, 2023. |
| l. | Mineral Resources and Mineral Reserves for the Hemlo mine are reported as of December 31, 2024. |
| m. | Mineral Resources for the Koné project are reported as of January 31, 2025 for the satellite and Gbongogo deposits and as of February 20, 2025 for the Koné deposit. Mineral Reserves are reported as of January 14, 2024. |
| n. | Mineral Resources for the Kudz Ze Kayah project are reported as of January 3, 2025 for the ABM deposit and June 30, 2025 for the Kona Deposit, and Mineral Reserves as of October 30, 2023 for the ABM deposit. |
| o. | Mineral Resources for the Kutcho project are reported as of July 30, 2021 and Mineral Reserves are reported as of November 8, 2021. |
| p. | Mineral Resources for the Loma de La Plata project are reported as of May 20, 2009. |
| q. | Mineral Resources and Mineral Reserves for the Los Filos mine are reported as of June 30, 2022. |
| r. | Mineral Resources and Mineral Reserves for the Marathon project are reported as of November 1, 2024. |
| s. | Mineral Resources and Mineral Reserves for the Marmato mine are reported as of June 30, 2022. |
| t. | Mineral Resources for the Metates royalty are reported as of January 28, 2023. |
| u. | Mineral Resources for the Mineral Park project are reported as of January 31, 2026 and Mineral Reserves as of February 11, 2026. |
| v. | Mineral Resources and Mineral Reserves for the Mt. Todd project are reported as of July 25, 2025. |
| w. | Mineral Resources and Mineral Reserves for the Platreef project are reported as of February 15, 2025. |
| x. | Mineral Resources and Mineral Reserves for the Santo Domingo project are reported as of March 31, 2024. |
| y. | Mineral Resources and Mineral Reserves for the Spring Valley project are reported as of October 31, 2025. |
| z. | Mineral Resources for the Stratoni mine are reported as of September 30, 2025. |
| aa. | Mineral Resources for the Toroparu project are reported as of February 10, 2023. |
| 7. | Process recoveries are the Company’s estimated average percentage of gold, silver, palladium, platinum, or cobalt in a saleable product (doré or concentrate) recovered from mined ore at the applicable site process plants. |
| 8. | Mineral Reserves are estimated using appropriate process and mine recovery rates, dilution, operating costs and the following commodity prices: |
| a. | Aljustrel mine – 2.5% zinc cut-off for the Moinho, Feitais, and Estação mines project. |
| b. | Antamina mine - $6,000 per hour of mill operation cut-off assuming $3.75 per pound copper, $1.21 per pound zinc, $15.00 per pound molybdenum and $27.00 per ounce silver. |
| c. | Black Pine – 0.1 grams per tonne gold cut-off assuming $1,650 per ounce gold. |
| d. | Blackwater mine – NSR cut-off of Cdn $13.00 per tonne assuming $1,400 per ounce gold and $15.00 per ounce silver. |
| e. | Cangrejos project - declining NSR cut-offs of between $23.00 and $7.76 per tonne assuming $1,500 per ounce gold, $3.00 per pound copper and $18.00 per ounce silver. |
| f. | Constancia mine – NSR cut-off of $6.40 per tonne for Pampacancha and $7.30 per tonne for Constancia assuming $1,900 per ounce gold, $23.00 per ounce silver, $4.15 per pound copper and $15.00 per pound molybdenum. |
| g. | Copper World Complex project – $4.00 per pound copper, $12.00 per pound molybdenum, $23.00 per ounce silver and $1,700 per ounce gold. |
WHEATON PRECIOUS METALS 2025 ANNUAL REPORT- MANAGEMENT DISCUSSION & ANALYSIS [55]
| h. | Cozamin mine - NSR cut-off of $60.54 per tonne for long-hole and $65.55 per tonne for cut and fill for MNV and MNFWZ, and $82.78 per tonne for both mining methods at MNV West, assuming $3.55 per pound copper for MNV and MNFWZ and $3.75 per pound for MNV West, $20.00 per ounce silver, $0.90 per pound lead and $1.15 per pound zinc. |
| i. | Curraghinalt project - 3.0 grams per tonne gold cut-off assuming $1,200 per ounce gold. |
| j. | DeLamar project – Variable cut-offs based on variable processing costs of $3.26-$5.30 per tonne and metallurgical recoveries of 45%-95% for gold and 15%-92% for silver, all assuming $2,000 per ounce gold and $25.00 per ounce silver. |
| k. | El Domo project - NSR cut-off of $32.99 per tonne assuming $1,630 per ounce gold, $21.00 per ounce silver, $3.31 per pound copper, $0.92 per pound lead and $1.16 per pound zinc. |
| l. | Fenix project – 0.235 grams per tonne gold cut-off assuming $1.650 per ounce gold. |
| m. | Goose mine – 1.65 grams per tonne gold cut-off for open pit and 4.64 grams per tonne for underground, assuming $1,750 per ounce gold. |
| n. | Hemlo mine – NSR cut-off of $110.8 per tonne or $120.0 per tonne cut-off depending on underground mining method, and $34.13 per tonne for open pit material assuming $1,700 per ounce gold. |
| o. | Koné project – gold grade cut-offs ranging from 0.19 to 0.49 grams per tonne assuming $1,550 per ounce gold. |
| p. | Kudz Ze Kayah project - NSR cut-off of Cdn$29.30 per tonne for open pit and Cdn$173.23 per tonne for underground assuming $1,700 per ounce gold, $22.60 per ounce silver, $3.80 per pound copper, $0.95 per pound lead and $1.20 per pound zinc. |
| q. | Kurmuk project - gold grade cut-offs ranging from 0.30 to 0.45 grams per tonne assuming $1,500 per ounce gold. |
| r. | Kutcho project – NSR cut-offs of Cdn $38.40 per tonne for oxide ore and Cdn $55.00 per tonne for sulfide for the open pit and Cdn $129.45 per tonne for the underground assuming $3.50 per pound copper, $1.15 per pound zinc, $20.00 per ounce silver and $1,600 per ounce gold. |
| s. | Los Filos mine – Variable break-even cut-offs for the open pits depending on process destination and metallurgical recoveries and NSR cut-offs of $65.80 - $96.60 per tonne for the underground mines, assuming $1,450 per ounce gold and $18.00 per ounce silver. |
| t. | Marathon project - NSR cut-off of Cdn $16.00 per tonne assuming $1,525 per ounce palladium, $950 per ounce platinum, $4.00 per pound copper, $2,000 per ounce gold and $24.00 per ounce silver. |
| u. | Marmato mine – 2.05 grams per tonne gold cut-off for the Upper Mine and 1.62 grams per tonne gold cut-off for the Lower Mine, all assuming $1,500 per ounce gold. |
| v. | Mineral Park mine - NSR cut-off of $8.50 per tonne assuming $4.50 per pound copper, $20.00 per pound molybdenum and $37.00 per ounce silver. |
| w. | Mt Todd project – 0.50 grams per tonne gold cut-off for the Batman deposit and zero cut-off for the Heap Leach, assuming $1,800 per ounce gold. |
| x. | Neves-Corvo mine – NSR cut-offs ranging from EUR 49 to 89 per tonne depending on area and mining method for both the copper and zinc Mineral Reserves assuming $4.04 per pound copper, $0.91 per pound lead and $1.27 per pound zinc. |
| y. | Peñasquito mine - $1,700 per ounce gold, $25.00 per ounce silver, $0.90 per pound lead and $1.20 per pound zinc. |
| z. | Platreef project - declining NSR cut-offs of between $155 and $80 per tonne assuming $1,600 per ounce platinum, $815 per ounce palladium, $1,300 per ounce gold, $1,500 per ounce rhodium, $8.90 per pound nickel and $3.00 per pound copper. |
| aa. | Salobo mine – 0.248% copper equivalent cut-off assuming $1,925 per ounce gold and $4.15 per pound copper. |
| bb. | San Dimas mine – $2,200 per ounce gold and $26.00 per ounce silver. |
| cc. | Santo Domingo project – NSR cut-off of $9.77 per tonne assuming $3.75 per pound copper, $1,400 per ounce gold and $69 to $115 per tonne iron. |
| dd. | Spring Valley project – 0.10 grams per tonne gold cut-off assuming $1,800 per ounce gold. |
| ee. | Stillwater mines - combined platinum and palladium cut-off of 10.1 grams per tonne for Stillwater and 8.0 grams per tonne for East Boulder assuming $1,172 per ounce 2E PGM prices. |
| ff. | Sudbury mines - $1,300 to 1,450 per ounce gold, $6.07 to $8.53 per pound nickel, $2.77 to $3.40 per pound copper, $1,155 to $1,225 per ounce platinum, $925 to $1,400 per ounce palladium and $20.41 to $22.68 per pound cobalt. |
| gg. | Voisey’s Bay mines – NSR cut-offs of Cdn $28.35 per tonne for Discovery Hill Open Pit, Cdn$220 to $230 per tonne for Reid Brook and Cdn$220 per tonne for Eastern Deeps all assuming $3.40 per pound copper, $8.16 per pound nickel and $22.68 per pound cobalt. |
| hh. | Zinkgruvan mine – NSR cut-offs ranging from SEK 1,050 to 1,300 per tonne depending on area and mining method for both the zinc and copper Mineral Reserves assuming $3.85 per pound copper and $0.90 per pound lead and $1.20 per pound zinc and $4.83 per ounce silver. |
| 9. | Mineral Resources are estimated using appropriate recovery rates and the following commodity prices: |
| a. | Aljustrel mine – 2.5% zinc cut-off for Feitais, Moinho and St João mines and the Estação project. |
| b. | Antamina mine - $6,000 per hour of mill operation cut-off for the open pit and $58.70 per tonne NSR cut-off for the undergound, both assuming $3.75 per pound copper, $1.33 per pound zinc, $21.00 per pound molybdenum and $31.38 per ounce silver. |
| c. | Black Pine – 0.1 grams per tonne gold cut-off assuming $2,000 per ounce gold. |
| d. | Blackwater mine – 0.2 grams per tonne gold equivalent cut-off assuming $1,400 per ounce gold and $15.00 per ounce silver. |
| e. | Brewery Creek project – 0.37 grams per tonne gold cut-off assuming $1,500 per ounce gold. |
| f. | Cangrejos project - 0.25 grams per tonne gold equivalent cut-off assuming $1,600 per ounce gold, $3.50 per pound copper, $11.00 per pound molybdenum and $21.00 per ounce silver. |
| g. | Constancia mine – NSR cut-off of $6.40 per tonne for open pit and 0.65% copper cut-off for underground, both assuming $1,900 per ounce gold, $23.00 per ounce silver, $4.15 per pound copper and $15.00 per pound molybdenum. |
| h. | Copper World Complex project – 0.1% copper cut-off and an oxidation ratio of lower than 50%, assuming $3.75 per pound copper, $12.00 per pound molybdenum, $22.00 per ounce silver, and $1,650 per ounce gold. |
| i. | Cotabambas project – 0.15% copper equivalent cut-off assuming $1,850 per ounce gold, $23.00 per ounce silver, $4.25 per pound copper and $20.00 per pound molybdenum. |
| j. | Cozamin mine – NSR cut-off of $59.00 per tonne assuming $3.75 per pound copper, $22.00 per ounce silver, $1.00 per pound lead and $1.35 per pound zinc. |
| k. | Curraghinalt project – 5.0 grams per tonne gold cut-off assuming $1,200 per ounce gold. |
| l. | DeLamar project – 0.17 grams per tonne gold equivalent cut-off for oxide leach and mixed leach and 0.1 grams per tonne gold |
WHEATON PRECIOUS METALS 2025 ANNUAL REPORT- MANAGEMENT DISCUSSION & ANALYSIS [56]
| equivalent cut-off for stockpile, all assuming $2,650 per ounce gold and $30.00 per ounce silver. |
| m. | El Domo project - NSR cut-off of $29.00 per tonne for the open pit and $105 per tonne for the underground assuming $1,800 per ounce gold, $24.00 per ounce silver, $4.00 per pound copper, $1.05 per pound lead and $1.30 per pound zinc. |
| n. | Fenix project – 0.15 grams per tonne gold cut-off assuming $1,800 per ounce gold. |
| o. | Goose mine – 0.9 grams per tonne gold cut-off for open pit and 2.2 grams per tonne for underground, assuming $2,100 per ounce gold. |
| p. | Hemlo mine – 2.38 grams per tonne gold cut-off on average for underground and 0.21 grams per tonne gold cut-off for open pit. |
| q. | Koné project - 0.2 grams per tonne gold cut-off for the Koné deposit, 0.5 grams per tonne for the Gbongogo, Gbongogo South, Koban North, Sena, Diouma North and Lokolo Main deposits and 0.6 grams per tonne for the Yere North and ANV deposits, all assuming a gold price of $2,000 per ounce. |
| r. | Kudz Ze Kayah project – NSR cut-off of $40 per tonne for “shallow” and $150 per tonne for ”deep” mineralization at the ABM deposit, assuming $1,700 per ounce gold, $22.60 per ounce silver, $3.80 per pound copper, $0.95 per pound lead and $1.20 per pound zinc. |
| s. | Kurmuk project - gold grade cut-off of 0.5 grams per tonne assuming a gold price of $1,800 per ounce. |
| t. | Kutcho project – 0.45% copper equivalent cut-off for the Main open pit and underground copper equivalent cut-offs of 1.05%, 0.95% and 1.05% for Main, Esso and Sumac respectively, all assuming $3.50 per pound copper, $1.15 per pound zinc, $20.00 per ounce silver and $1,600 per ounce gold. |
| u. | Loma de La Plata project – 50 grams per tonne silver equivalent cut-off assuming $12.50 per ounce silver and $0.50 per pound lead. |
| v. | Marathon project – NSR cut-off of Cdn $13.60 per tonne for the Marathon project assuming $1,550 per ounce palladium, $1,100 per ounce platinum, $4.25 per pound copper, $2,300 per ounce gold and $27.00 per ounce silver. NSR cut-off of Cdn $13.00 per tonne for the Sally and Geordie projects assuming $1,600 per ounce palladium, $900 per ounce platinum, $3.00 per pound copper, $1,500 per ounce gold and $18.00 per ounce silver. |
| w. | Marmato mine – 1.8 grams per tonne gold cut-off for the Upper Mine and 1.3 grams per tonne gold cut-off for the Lower Mine, all assuming $1,700 per ounce gold. |
| x. | Metates royalty – 0.26 grams per tonne gold equivalent cut-off assuming $1,600 per ounce gold and $20.00 per ounce silver. |
| y. | Mineral Park project – NSR cut-off of $8.00 per tonne assuming $4.50 per pound copper, $20.00 per pound molybdenum and $37.00 per ounce silver. |
| z. | Mt Todd project – 0.4 grams per tonne gold cut-off for the Batman and Quigleys deposits and zero cut-off for Heap Leach, assuming $1,950 per ounce gold. |
| aa. | Neves-Corvo mine – 15% lower than the Mineral Reserve cut-off value for each mine zone and mining method. |
| bb. | El Alto project – $1,700 per ounce gold, $21.00 per ounce silver and $3.75 per pound copper. |
| cc. | Peñasquito mine - $2,000 per ounce gold, $28.00 per ounce silver, $1.00 per pound lead and $1.30 per pound zinc. |
| dd. | Platreef project - 2.0 grams per tonne 3PE + Au (platinum, palladium, rhodium and gold) cut-off assuming $1,200 per ounce platinum, $1,130 per ounce palladium, $2,170 per ounce gold, $5,000 per ounce rhodium, $8.50 per pound nickel and $4.25 per pound copper. |
| ee. | Salobo mine – 0.248% copper equivalent cut-off assuming $2,300 per ounce gold and $4.54 per pound copper. |
| ff. | San Dimas mine – NSR cut-off of $174 per tonne assuming $2,400 per ounce gold and $28.00 per ounce silver. |
| gg. | Santo Domingo project – NSR cut-off of $9.85 per tonne assuming $4.10 per pound copper, $1,600 per ounce gold and $95 to $140 per tonne iron. |
| hh. | Spring Valley – 0.10 grams per tonne gold cut-off assuming $2,200 per ounce gold. |
| ii. | Stillwater mines – combined platinum and palladium cut-off of 8.8 grams per tonne for Stillwater and 6.5 grams per tonne for East Boulder assuming $1,350 per ounce 2E PGM prices. |
| jj. | Stratoni mine – NSR cut-off of $200 per tonne assuming $2.75 per pound copper, $0.91 per pound lead, $1.04 per pound zinc and $17.00 per ounce silver. |
| kk. | Sudbury mines - $1,000 to $1,950 per ounce gold, $6.07 to $9.44 per pound nickel, $2.77 to $4.31 per pound copper, $1,124 to $1,350 per ounce platinum, $925 to $1,450 per ounce palladium and $20.41 to $25.54 per pound cobalt. |
| ll. | Toroparu project – 0.45 grams per tonne gold cut-off for open pit and 1.5 grams per tonne gold for underground assuming $1,950 per ounce gold. |
| mm. | Voisey’s Bay mines – NSR cut-off of Cdn $28.35 per tonne for Discovery Hill Open Pit and Cdn$230 to $250 per tonne for Reid Brook, Cdn$145 to $220 per tonne for Eastern Deeps Underground, and Cdn$210 to $250 per tonne for Discovery Hill Underground, all assuming $3.40 per pound copper, $8.16 per pound nickel and $22.68 per pound cobalt. |
| nn. | Zinkgruvan mine – NSR cut-offs ranging from SEK 750 to 1,100 per tonne depending on area and mining method for the zinc Mineral Resources assuming $3.85 per pound copper and $0.90 per pound lead and $1.20 per pound zinc and $4.83 per ounce silver. |
| 10. | The scientific and technical information in these tables regarding the Antamina, Peñasquito and Salobo mines was sourced by the Company from the following filed documents: |
| a. | Antamina – Teck Resources Annual Information Form filed on SEDAR on February 18, 2026. |
| b. | Peñasquito – Newmont’s December 31, 2025 Resources and Reserves press release dated February 19, 2026 and |
| c. | Salobo – Vale has filed a technical report summary for the Salobo Mine, which is available on Edgar at https://www.sec.gov/Archives/edgar/data/0000917851/000110465922040322/tm2210823d1_6k.htm. |
The Company QP’s have approved this partner disclosed scientific and technical information in respect of the Company’s Mineral Resource and Mineral Reserve estimates for the Antamina mine, Peñasquito mine and Salobo mine.
| 11. | The Company’s attributable Mineral Resources and Mineral Reserves have been constrained to the production expected for the various contracts. |
| 12. | The Company has the option in the Early Deposit agreements, to terminate the agreement following the delivery of a feasibility study or if the feasibility study is not delivered within a required time frame. |
| 13. | The Stillwater PMPA provides that effective July 1, 2018, Sibanye-Stillwater will deliver 100% of the gold production for the life of the mines and 4.5% of palladium production until 375,000 ounces are delivered, 2.25% of palladium production until a further 175,000 ounces are delivered and 1.0% of the palladium production thereafter for the life of the mines. Attributable palladium Mineral Reserves and Mineral Resources are calculated based upon the 4.5% / 2.25% / 1.0% production entitlements. |
WHEATON PRECIOUS METALS 2025 ANNUAL REPORT- MANAGEMENT DISCUSSION & ANALYSIS [57]
The Stillwater mine has been in operation since 1986 and the East Boulder mine since 2002. Individual grades for platinum, palladium, gold and rhodium are estimated using ratios applied to the combined platinum plus palladium grades based upon average historic production results provided to the Company as of the date of this document. As such, the Attributable Mineral Resource and Mineral Reserve palladium and gold grades for the Stillwater mines have been estimated using the following ratios:
| a. | Stillwater mine: Pd = (Pt + Pd) / (1/3.46 + 1) and Au = (Pd + Pt) x 0.0238 |
| b. | East Boulder mine: Pd = (Pt + Pd) / (1/3.66 + 1) and Au = (Pd + Pt) x 0.0323 |
| 14. | Under the terms of the San Dimas PMPA, the Company is entitled to an amount equal to 25% of the payable gold production plus an additional amount of gold equal to 25% of the payable silver production converted to gold at a fixed gold to silver exchange ratio of 70:1 from the San Dimas mine. If the average gold to silver price ratio decreases to less than 50:1 or increases to more than 90:1 for a period of 6 months or more, then the “70” shall be revised to “50” or “90”, as the case may be, until such time as the average gold to silver price ratio is between 50:1 to 90:1 for a period of 6 months or more in which event the “70” shall be reinstated. |
| 15. | The Marmato PMPA provides that Aris Gold Corp will deliver 10.5% of the gold production until 310,000 ounces are delivered and 5.25% of gold production thereafter, as well as 100% of the silver production until 2.15 million ounces are delivered and 50% of silver production thereafter. Attributable reserves and resources have been calculated on the 10.5% / 5.25% basis for gold and 100% / 50% basis for silver. |
| 16. | Under the Company’s Toroparu Early Deposit Agreement, the Company will be entitled to purchase 10% of the gold production and 50% of the silver production from the Toroparu project for the life of mine. |
| 17. | The Company’s Metates Royalty entitles the Company to a 0.5% net smelter return royalty. |
| 18. | The Glencore Antamina PMPA provides that Glencore will deliver silver equal to 33.75% of the silver production until 140 million ounces are delivered and 22.5% of silver production thereafter. Attributable reserves and resources have been calculated on the 33.75% / 22.5% basis. |
| 19. | The Company only has the rights to silver contained in concentrates containing less than 15% copper at the Aljustrel mine. |
| 20. | The new Cozamin PMPA provides that Capstone will deliver silver equal to 50% of the silver production until 10 million ounces are delivered and 33% thereafter for the life of the mine. Attributable reserves and resources have been calculated on the 50% / 33% basis. |
| 21. | The Copper World Complex Mineral Resources and Mineral Reserves do not include the Leach material. |
| 22. | The Voisey’s Bay PMPA provides that Vale will deliver 42.4% of the cobalt production until 31 million pounds are delivered to the Company and 21.2% of cobalt production thereafter, for the life of the mine. Attributable reserves and resources have been calculated on the 42.4% / 21.2% basis. |
| 23. | Under the Cotabambas Early Deposit Agreement, the Company will be entitled to purchase 100% of the silver production and 25% of the gold production from the Cotabambas project until 90 million silver equivalent ounces have been delivered, at which point the stream will drop to 66.67% of silver production and 16.67% of gold production for the life of mine. |
| 24. | Under the Brewery Creek Royalty, the Company will be entitled to a 2.0% net smelter return royalty for the first 600,000 ounces of gold produced from the Brewery Creek project, above which the NSR will increase to 2.75%. Victoria Gold has the right to repurchase 0.625% of the increased NSR by paying the Company Cdn $2.0 million. Attributable resources have been calculated on the 2.0% / 2.75% basis. |
| 25. | The Santo Domingo PMPA provides that Capstone will deliver gold equal to 100% of the gold production until 285,000 ounces are delivered and 67% thereafter for the life of the mine. Attributable reserves and resources have been calculated on the 100% / 67% basis. |
| 26. | The Fenix PMPA provides that Rio2 will deliver gold equal to 22% of the gold production until 130,625 ounces are delivered, then 6% of the gold production until 185,000 ounces are delivered, then 4% of the gold production until 235,000 ounces are delivered and 3.5% thereafter for the life of the mine. Attributable reserves and resources have been calculated on this 22% / 6% / 4% / 3.5% basis. |
| 27. | The Blackwater Silver and Blackwater Gold PMPAs provide that Artemis will deliver respectively silver and gold equal to (i) 50% of the payable silver production until 17.8 million ounces are delivered and 33% thereafter for the life of the mine, and (ii) 8% of the payable gold production until 464,000 ounces are delivered and 4% thereafter for the life of the mine. Attributable reserves and resources have been calculated on the 50% / 33% basis for silver and 8% / 4% basis for gold. |
| 28. | The Marathon PMPA provides that Gen Mining will deliver 100% of the gold production until 150,000 ounces are delivered and 67% thereafter for the life of the mine and 22% of the platinum production until 120,000 ounces are delivered and 15% thereafter for the life of the mine. Attributable reserves and resources have been calculated on the 100% / 67% basis for gold and 22% / 15% basis for platinum. |
| 29. | The El Domo PMPA provides that Adventus will deliver silver and gold equal to 75% of the silver production until 4.6 million ounces are delivered and 50% thereafter for the life of the mine and 50% of the gold production until 150,000 ounces are delivered and 33% thereafter for the life of the mine. Attributable reserves and resources have been calculated on the 75% / 50% basis for silver and 50% / 33% basis for gold. |
| 30. | In connection with Sabina’s exercise of its option to repurchase 33% of the Goose gold stream on a change in control, the gold delivery obligations under the Goose PMPA with Sabina, a subsidiary of B2Gold, were reduced so that Sabina will deliver gold equal to 2.78% of the gold production until 87,100 ounces are delivered, then 1.44% until 134,000 ounces are delivered and 1.0% thereafter for the life of the mine. Attributable reserves and resources have been calculated on the 2.78% / 1.44% / 1.0% basis. |
| 31. | The Cangrejos PMPA provides that Lumina will deliver gold equal to 4.40% of the gold production until 0.47 million ounces are delivered and 2.93% thereafter for the life of the mine. Attributable reserves and resources have been calculated on the 4.40% / 2.93% basis. On September 16, 2025, in connection with its acquisition of Lumina, CMOC exercised its 33% buy-back option under the Cangrejos PMPA, bringing the stream percentages and thresholds to the stated values. |
| 32. | The Black Pine Royalty provides that the Company will be entitled to a 0.5% net smelter return. Attributable resources have been calculated on the 0.5% basis. |
| 33. | The Curraghinalt PMPA provides that Dalradian will deliver gold equal to 3.05% of the payable gold production until 125,000 ounces of gold are delivered and 1.5% thereafter for the life of the mine. Attributable gold reserves and resources have been calculated on the 3.05% / 1.5% basis. |
| 34. | The Kudz Ze Kayah PMPA provides that BMC will deliver gold and silver equal to 7.375% of the metal contained in concentrates until 24,338 ounces of gold and 3,193,375 ounces of silver are delivered, then 6.125% until 28,000 ounces of gold and 3,680,803 ounces of silver are delivered, then 5.5% until 42,861 ounces of gold and 5,624,613 ounces of silver are delivered and 6.75% thereafter for the life of the mine. Attributable gold and silver reserves and resources have been calculated on the 7.375% / 6.125% / 5.5% / 6.75% basis. |
| 35. | The Platreef Gold PMPA provides that Ivanhoe will deliver gold equal to 62.5% of the payable gold production until 218,750 ounces of gold are delivered and 50% until 428,300 ounces of gold are delivered, then 3.125% thereafter for a tail period which will terminate on certain conditions being met. The Platreef Palladium and Platinum PMPA provides that Ivanhoe will deliver 5.25% of the platinum and palladium until 350,000 ounces are delivered and 3.0% until 485,115 ounces are delivered, then 0.1% for a tail period which will terminate on certain conditions being met. Attributable gold reserves and resources have been calculated on the 62.5% / 50% / 3.125% basis and attributable platinum and palladium on the 5.25% / 3.0% / 0.1% basis. |
| 36. | The Mt Todd Royalty provides that the Company will be entitled to 1.0% of gross revenue until 3.47 million ounces of gold are delivered to an offtaker, then 0.667% of gross revenue for the life of the mine. Attributable gold reserves and resources have been calculated on the 1.0% / 0.667% basis. |
WHEATON PRECIOUS METALS 2025 ANNUAL REPORT- MANAGEMENT DISCUSSION & ANALYSIS [58]
| 37. | The DeLamar Royalty provides that the Company will be entitled to a 1.5% net smelter return on Oxide and Mixed material. Attributable resources and reserves have been calculated on the 1.5% basis. |
| 38. | The Koné PMPA provides that Montage will deliver gold equal to 19.5% of the payable gold production until 400,000 ounces of gold are delivered, then 10.8% until 530,000 ounces are delivered and 5.4% thereafter for the life of the mine. Attributable reserves and resources have been calculated on the 19.5% / 10.8% / 5.4% basis. |
| 39. | The Kurmuk PMPA provides that Allied will deliver gold equal to 6.7% of the payable gold production until 220,000 ounces of gold are delivered, then 4.8% thereafter for the life of the mine. Attributable reserves and resources have been calculated on the 6.7% / 4.8% basis. |
| 40. | The Los Filos PMPA has a 25-year term and is expected to terminate on October 15, 2029. Attributable reserves have been limited to this term and include only heap leach material as detailed in Equinox’s October 2022 technical report for the Los Filos mine. |
| 41. | The Hemlo PMPA provides that Hemlo Mining Corp. will deliver gold equal to 10.13% of the payable gold production until 135,750 ounces of gold are delivered, then 6.75% until an additional 117,998 ounces of gold are delivered, and 4.5% thereafter for the life of the mine. Attributable reserves and resources have been calculated on the 10.13% / 6.75% / 4.5% basis. |
| 42. | The Spring Valley PMPA provides that Waterton will deliver gold equal to 8% of the payable gold production until 300,000 ounces of gold are delivered, then 6% thereafter for the life of the mine. Attributable reserves and resources have been calculated on the 8% / 6% basis. |
| 43. | The BHP Antamina PMPA provides that BHP will deliver silver equal to 33.75% of the silver production until 100 million ounces are delivered and 22.5% of silver production thereafter. Attributable reserves and resources have been calculated on the 33.75% / 22.5% basis. |
| 44. | Precious metals and cobalt are by-product metals at all of the Mining Operations, other than gold at the Marmato mine, Toroparu project, Fenix project, Goose mine, Blackwater mine, Black Pine project, Curraghinalt project, Mt Todd project, DeLamar project, Koné project, Kurmuk project, Hemlo Mine, and Spring Valley project, silver at the Loma de La Plata zone of the Navidad project and palladium at the Stillwater mines and Platreef project, and therefore, the economic cut-off applied to the reporting of precious metals and cobalt reserves and resources will be influenced by changes in the commodity prices of other metals at the mines. |
Statements made in this section contain forward-looking information. Please see “Cautionary Note Regarding Forward-Looking Statements” for material risks, assumptions and important disclosures associated with this information.
WHEATON PRECIOUS METALS 2025 ANNUAL REPORT- MANAGEMENT DISCUSSION & ANALYSIS [59]
Cautionary Note Regarding Forward-Looking Statements
The information contained herein contains “forward-looking statements” within the meaning of the United States Private Securities Litigation Reform Act of 1995 and “forward-looking information” within the meaning of applicable Canadian securities legislation. Forward-looking statements, which are all statements other than statements of historical fact, include, but are not limited to, statements with respect to:
| ● | payment by the Company of $4.3 billion to BHP and the satisfaction of each party’s obligations in accordance with the BHP Antamina PMPA; |
| ● | the receipt by the Company of silver production in respect of the Antamina mine under the BHP Antamina PMPA; |
| ● | the ability of the Company to drawdown sufficient funds under both its existing Revolving Facility and the new Term Loan and the satisfaction of each party’s obligations under the existing Revolving Facility and the new Term Loan; |
| ● | the ability of the Company to repay the existing Revolving Facility and new Term Loan; |
| ● | the future price of commodities; |
| ● | the estimation of future production from Mining Operations (including in the estimation of production, mill throughput, grades, recoveries and exploration potential); |
| ● | the estimation of mineral reserves and mineral resources (including the estimation of reserve conversion rates and the realization of such estimations); |
| ● | the commencement, timing and achievement of construction, expansion or improvement projects by Wheaton’s PMPA counterparties at Mining Operations; |
| ● | the payment of upfront cash consideration to counterparties under PMPAs, the satisfaction of each party’s obligations in accordance with PMPAs and the receipt by the Company of precious metals and cobalt production or other payments in respect of the applicable Mining Operations under PMPAs or other payments under royalty arrangements; |
| ● | the ability of Wheaton’s PMPA counterparties to comply with the terms of a PMPA (including as a result of the business, mining operations and performance of Wheaton’s PMPA counterparties) and the potential impacts of such on Wheaton; |
| ● | future payments by the Company in accordance with PMPAs, including any acceleration of payments; |
| ● | the costs of future production; |
| ● | the estimation of produced but not yet delivered ounces; |
| ● | continued listing of the Common Shares on the LSE, NYSE and TSX; |
| ● | any statements as to future dividends; |
| ● | the ability to fund outstanding commitments and the ability to continue to acquire accretive PMPAs; |
| ● | projected increases to Wheaton’s production and cash flow profile; |
| ● | projected changes to Wheaton’s production mix; |
| ● | the ability of Wheaton’s PMPA counterparties to comply with the terms of any other obligations under agreements with the Company; |
| ● | the ability to sell precious metals and cobalt production; |
| ● | confidence in the Company’s business structure; |
| ● | the Company’s assessment of taxes payable, and the Company’s ability to pay its taxes; |
| ● | possible CRA domestic or international audits; |
| ● | the Company’s assessment of the impact of any tax reassessments; |
| ● | the Company’s climate change and environmental commitments; and |
| ● | assessments of the impact and resolution of various legal and tax matters, including but not limited to audits. |
Generally, these forward-looking statements can be identified by the use of forward-looking terminology such as “plans”, “expects” or “does not expect”, “is expected”, “budget”, “scheduled”, “estimates”, “forecasts”, “projects”, “intends”, “anticipates” or “does not anticipate”, or “believes”, “potential”, or variations of such words and phrases or statements that certain actions, events or results “may”, “could”, “would”, “might” or “will be taken”, “occur” or “be achieved”. Forward-looking statements are subject to known and unknown risks, uncertainties and other factors that may cause the actual results, level of activity, performance or achievements of Wheaton to be materially different from those expressed or implied by such forward-looking statements, including but not limited to:
| ● | risks relating to the satisfaction of each party’s obligations in accordance with the terms of the BHP Antamina PMPA; |
| ● | risks relating to the Company’s ability to meet the conditions of, and the satisfaction of each party’s obligations under, the existing Revolving Facility and the new Term Loan; |
| ● | risks relating to the generation of sufficient cash flow to repay the existing Revolving Facility and the new Term Loan; |
| ● | risks associated with fluctuations in the price of commodities (including Wheaton’s ability to sell its precious metals or cobalt production at acceptable prices or at all); |
WHEATON PRECIOUS METALS 2025 ANNUAL REPORT- MANAGEMENT DISCUSSION & ANALYSIS [60]
| ● | risks related to the Mining Operations (including fluctuations in the price of the primary or other commodities mined at such operations, regulatory, political and other risks of the jurisdictions in which the Mining Operations are located, actual results of mining, risks associated with exploration, development, operating, expansions and improvement at the Mining Operations, environmental and economic risks of the Mining Operations, and changes in project parameters as Mining Operations plans continue to be refined); |
| ● | absence of control over the Mining Operations and having to rely on the accuracy of the public disclosure and other information Wheaton receives from the owners and operators of the Mining Operations as the basis for its analyses, forecasts and assessments relating to its own business; |
| ● | risks related to the uncertainty in the accuracy of mineral reserve and mineral resource estimation; |
| ● | risks related to the satisfaction of each party’s obligations in accordance with the terms of the Company’s PMPAs, including the ability of the companies with which the Company has PMPAs to perform their obligations under those PMPAs in the event of a material adverse effect on the results of operations, financial condition, cash flows or business of such companies, any acceleration of payments, estimated throughput and exploration potential; |
| ● | risks relating to production estimates from Mining Operations, including anticipated timing of the commencement of production by certain Mining Operations; |
| ● | Wheaton’s interpretation of, or compliance with, or application of, tax laws and regulations or accounting policies and rules, being found to be incorrect, or the tax impact to the Company’s business operations being materially different than currently contemplated, or the ability to pay such taxes as and when due; |
| ● | any challenge or reassessment by the CRA of the Company’s tax filings being successful and the potential negative impact to the Company’s previous and future tax filings; |
| ● | risks in assessing the impact of the CRA Settlement; |
| ● | risks related to any changes to the Income Tax Act (Canada) that may result in a material change to the amount of future taxes payable; |
| ● | counterparty credit and liquidity risks; |
| ● | mine operator and counterparty concentration risks; |
| ● | indebtedness and guarantees risks; |
| ● | hedging risk; |
| ● | competition in the streaming industry risk; |
| ● | risks relating to security over underlying assets; |
| ● | risks relating to third-party PMPAs; |
| ● | risks relating to revenue from royalty interests; |
| ● | risks related to Wheaton’s acquisition strategy; |
| ● | risks relating to third-party rights under PMPAs; |
| ● | risks relating to future financings and security issuances; |
| ● | risks relating to unknown defects and impairments; |
| ● | risks related to governmental regulations; |
| ● | risks related to international operations of Wheaton and the Mining Operations; |
| ● | risks relating to exploration, development, operating, expansions and improvements at the Mining Operations; |
| ● | risks related to environmental regulations; |
| ● | the ability of Wheaton and the Mining Operations to obtain and maintain necessary licenses, permits, approvals and rulings; |
| ● | the ability of Wheaton and the Mining Operations to comply with applicable laws, regulations and permitting requirements; |
| ● | lack of suitable supplies, infrastructure and employees to support the Mining Operations; |
| ● | risks related to underinsured Mining Operations; |
| ● | inability to replace and expand mineral reserves, including anticipated timing of the commencement of production by certain Mining Operations (including increases in production, estimated grades and recoveries); |
| ● | uncertainties related to title and indigenous rights with respect to the mineral properties of the Mining Operations; |
| ● | the ability of Wheaton and the Mining Operations to obtain adequate financing; |
| ● | the ability of the Mining Operations to complete permitting, construction, development and expansion; |
| ● | challenges related to global financial conditions; |
| ● | risks associated with sustainability-related matters; |
| ● | risks related to fluctuations in commodity prices of metals produced from the Mining Operations other than precious metals or cobalt; |
| ● | risks related to claims and legal proceedings against Wheaton or the Mining Operations; |
| ● | risks related to the market price of the Common Shares of Wheaton; |
WHEATON PRECIOUS METALS 2025 ANNUAL REPORT- MANAGEMENT DISCUSSION & ANALYSIS [61]
| ● | the ability of Wheaton and the Mining Operations to retain key management employees or procure the services of skilled and experienced personnel; |
| ● | risks related to interest rates; |
| ● | risks related to the declaration, timing and payment of dividends; |
| ● | risks related to access to confidential information regarding Mining Operations; |
| ● | risks associated with multiple listings of the Common Shares on the LSE, NYSE and TSX; |
| ● | risks associated with a possible suspension of trading of Common Shares; |
| ● | equity price risks related to Wheaton’s holding of long-term investments in other companies; |
| ● | risks relating to activist shareholders; |
| ● | risks relating to reputational damage; |
| ● | risks relating to expression of views by industry analysts; |
| ● | risks related to the impacts of climate change and the transition to a low-carbon economy; |
| ● | risks associated with the ability to achieve climate change and environmental commitments at Wheaton and at the Mining Operations; |
| ● | risks related to ensuring the security and safety of information systems, including cyber security risks; |
| ● | risks relating to artificial intelligence; |
| ● | risks relating to compliance with anti-corruption and anti-bribery laws; |
| ● | risks relating to corporate governance and public disclosure compliance; |
| ● | risks of significant impacts on Wheaton or the Mining Operations as a result of an epidemic or pandemic; |
| ● | risks related to the adequacy of internal control over financial reporting; and |
| ● | other risks discussed in the section entitled “Description of the Business – Risk Factors” in Wheaton’s most recent Annual Information Form available on SEDAR+ at www.sedarplus.ca, and in Wheaton’s Form 40-F and Form 6-Ks, all on file with the U.S. Securities and Exchange Commission in Washington, D.C. and available on EDGAR (the “Disclosure”). |
Forward-looking statements are based on assumptions management currently believes to be reasonable, including but not limited to:
| ● | that the payment of $4.3 billion to BHP will be made and that each party’s obligations in accordance with the terms of the BHP Antamina PMPA will be satisfied; |
| ● | that the Company will be able to drawdown sufficient funds under both its existing Revolving Facility and the new Term Loan and that each party’s obligations under the existing Revolving Facility and the new Term Loan will be satisfied; |
| ● | that the Company will be able to repay the existing Revolving Facility and new Term Loan; |
| ● | that there will be no material adverse change in the market price of commodities; |
| ● | that the Mining Operations will continue to operate and the mining projects will be completed in accordance with public statements and achieve their stated production estimates; |
| ● | that the mineral reserves and mineral resource estimates from Mining Operations (including reserve conversion rates) are accurate; |
| ● | that public disclosure and other information Wheaton receives from the owners and operators of the Mining Operations is accurate and complete; |
| ● | that the production estimates from Mining Operations are accurate; |
| ● | that each party will satisfy their obligations in accordance with the PMPAs; |
| ● | that Wheaton will continue to be able to fund or obtain funding for outstanding commitments; |
| ● | that Wheaton will be able to source and obtain accretive PMPAs; |
| ● | that the terms and conditions of a PMPA are sufficient to recover liabilities owed to the Company; |
| ● | that Wheaton has fully considered the value and impact of any third-party interests in PMPAs; |
| ● | that expectations regarding the resolution of legal and tax matters will be achieved (including CRA audits involving the Company); |
| ● | that Wheaton has properly considered the application of Canadian tax laws to its structure and operations and that Wheaton will be able to pay taxes when due; |
| ● | that Wheaton has filed its tax returns and paid applicable taxes in compliance with applicable tax laws; |
| ● | that the trading of the Common Shares will not be adversely affected by the differences in liquidity, settlement and clearing systems as a result of multiple listings of the Common Shares on the LSE, the TSX and the NYSE; |
| ● | that the trading of the Company’s Common Shares will not be suspended; |
| ● | the estimate of the recoverable amount for any PMPA with an indicator of impairment; |
| ● | that neither Wheaton nor the Mining Operations will suffer significant impacts as a result of an epidemic or pandemic; and |
| ● | such other assumptions and factors as set out in the Disclosure. |
Although Wheaton has attempted to identify important factors that could cause actual results, level of activity, performance or achievements to differ materially from those contained in forward-looking statements, there may be
WHEATON PRECIOUS METALS 2025 ANNUAL REPORT- MANAGEMENT DISCUSSION & ANALYSIS [62]
other factors that cause results, level of activity, performance or achievements not to be as anticipated, estimated or intended. There can be no assurance that forward-looking statements will prove to be accurate and even if events or results described in the forward-looking statements are realized or substantially realized, there can be no assurance that they will have the expected consequences to, or effects on, Wheaton. Accordingly, readers should not place undue reliance on forward-looking statements and are cautioned that actual outcomes may vary. The forward-looking statements included herein are for the purpose of providing investors with information to assist them in understanding Wheaton’s expected financial and operational performance and may not be appropriate for other purposes. Any forward looking statement speaks only as of the date on which it is made. Wheaton does not undertake to update any forward-looking statements that are included or incorporated by reference herein, except in accordance with applicable securities laws.
Cautionary Language Regarding Reserves And Resources
For further information on Mineral Reserves and Mineral Resources and on Wheaton more generally, readers should refer to Wheaton’s Annual Information Form for the year ended December 31, 2024 and other continuous disclosure documents filed by Wheaton since January 1, 2025, available on SEDAR+ at www.sedarplus.ca. Wheaton’s Mineral Reserves and Mineral Resources are subject to the qualifications and notes set forth therein. Mineral Resources which are not Mineral Reserves do not have demonstrated economic viability.
Cautionary Note to United States Investors Concerning Estimates of Measured, Indicated and Inferred Resources:
The information contained herein has been prepared in accordance with the requirements of the securities laws in effect in Canada, which differ from the requirements of United States securities laws. The terms “mineral reserve”, “proven mineral reserve” and “probable mineral reserve” are Canadian mining terms defined in accordance with Canadian National Instrument 43-101 – Standards of Disclosure for Mineral Projects (“NI 43-101”) and the Canadian Institute of Mining, Metallurgy and Petroleum (the “CIM”) – CIM Definition Standards on Mineral Resources and Mineral Reserves, adopted by the CIM Council, as amended (the “CIM Definition Standards”). NI 43-101 differs significantly from the disclosure requirements of the SEC generally applicable to U.S. companies. For example, there is no assurance any mineral reserves or mineral resources that the Company may report as “proven mineral reserves”, “probable mineral reserves”, “measured mineral resources”, “indicated mineral resources” and “inferred mineral resources” under NI 43-101 would be the same had the Company prepared the reserve or resource estimates under the standards of the SEC generally applicable to U.S. companies. Accordingly, information contained herein that describes Wheaton’s mineral deposits may not be comparable to similar information made public by U.S. companies subject to reporting and disclosure requirements under the United States federal securities laws and the rules and regulations thereunder. United States investors are urged to consider closely the disclosure in Wheaton’s Form 40-F, a copy of which may be obtained from Wheaton or from http://www.sec.gov/edgar.html.
WHEATON PRECIOUS METALS 2025 ANNUAL REPORT- MANAGEMENT DISCUSSION & ANALYSIS [63]