Dec 312025Q3FALSE0001323885xbrli:sharesiso4217:USDiso4217:USDxbrli:sharesatrc:segmentxbrli:pureatrc:itematrc:plan00013238852025-01-012025-09-3000013238852025-10-2700013238852025-09-3000013238852024-12-3100013238852025-07-012025-09-3000013238852024-07-012024-09-3000013238852024-01-012024-09-300001323885us-gaap:CommonStockMember2024-06-300001323885us-gaap:AdditionalPaidInCapitalMember2024-06-300001323885us-gaap:RetainedEarningsMember2024-06-300001323885us-gaap:AccumulatedOtherComprehensiveIncomeMember2024-06-3000013238852024-06-300001323885us-gaap:CommonStockMember2024-07-012024-09-300001323885us-gaap:AdditionalPaidInCapitalMember2024-07-012024-09-300001323885us-gaap:AccumulatedOtherComprehensiveIncomeMember2024-07-012024-09-300001323885us-gaap:RetainedEarningsMember2024-07-012024-09-300001323885us-gaap:CommonStockMember2024-09-300001323885us-gaap:AdditionalPaidInCapitalMember2024-09-300001323885us-gaap:RetainedEarningsMember2024-09-300001323885us-gaap:AccumulatedOtherComprehensiveIncomeMember2024-09-3000013238852024-09-300001323885us-gaap:CommonStockMember2025-06-300001323885us-gaap:AdditionalPaidInCapitalMember2025-06-300001323885us-gaap:RetainedEarningsMember2025-06-300001323885us-gaap:AccumulatedOtherComprehensiveIncomeMember2025-06-3000013238852025-06-300001323885us-gaap:CommonStockMember2025-07-012025-09-300001323885us-gaap:AdditionalPaidInCapitalMember2025-07-012025-09-300001323885us-gaap:AccumulatedOtherComprehensiveIncomeMember2025-07-012025-09-300001323885us-gaap:RetainedEarningsMember2025-07-012025-09-300001323885us-gaap:CommonStockMember2025-09-300001323885us-gaap:AdditionalPaidInCapitalMember2025-09-300001323885us-gaap:RetainedEarningsMember2025-09-300001323885us-gaap:AccumulatedOtherComprehensiveIncomeMember2025-09-300001323885us-gaap:CommonStockMember2023-12-310001323885us-gaap:AdditionalPaidInCapitalMember2023-12-310001323885us-gaap:RetainedEarningsMember2023-12-310001323885us-gaap:AccumulatedOtherComprehensiveIncomeMember2023-12-3100013238852023-12-310001323885us-gaap:CommonStockMember2024-01-012024-09-300001323885us-gaap:AdditionalPaidInCapitalMember2024-01-012024-09-300001323885us-gaap:AccumulatedOtherComprehensiveIncomeMember2024-01-012024-09-300001323885us-gaap:RetainedEarningsMember2024-01-012024-09-300001323885us-gaap:CommonStockMember2024-12-310001323885us-gaap:AdditionalPaidInCapitalMember2024-12-310001323885us-gaap:RetainedEarningsMember2024-12-310001323885us-gaap:AccumulatedOtherComprehensiveIncomeMember2024-12-310001323885us-gaap:CommonStockMember2025-01-012025-09-300001323885us-gaap:AdditionalPaidInCapitalMember2025-01-012025-09-300001323885us-gaap:AccumulatedOtherComprehensiveIncomeMember2025-01-012025-09-300001323885us-gaap:RetainedEarningsMember2025-01-012025-09-300001323885srt:EuropeMember2025-09-300001323885srt:EuropeMember2024-12-310001323885us-gaap:MoneyMarketFundsMemberus-gaap:FairValueMeasurementsRecurringMemberus-gaap:FairValueInputsLevel1Member2025-09-300001323885us-gaap:MoneyMarketFundsMemberus-gaap:FairValueMeasurementsRecurringMemberus-gaap:FairValueInputsLevel2Member2025-09-300001323885us-gaap:MoneyMarketFundsMemberus-gaap:FairValueMeasurementsRecurringMemberus-gaap:FairValueInputsLevel3Member2025-09-300001323885us-gaap:MoneyMarketFundsMemberus-gaap:FairValueMeasurementsRecurringMember2025-09-300001323885us-gaap:FairValueMeasurementsRecurringMemberus-gaap:FairValueInputsLevel1Member2025-09-300001323885us-gaap:FairValueMeasurementsRecurringMemberus-gaap:FairValueInputsLevel2Member2025-09-300001323885us-gaap:FairValueMeasurementsRecurringMemberus-gaap:FairValueInputsLevel3Member2025-09-300001323885us-gaap:FairValueMeasurementsRecurringMember2025-09-300001323885us-gaap:MoneyMarketFundsMemberus-gaap:FairValueMeasurementsRecurringMemberus-gaap:FairValueInputsLevel1Member2024-12-310001323885us-gaap:MoneyMarketFundsMemberus-gaap:FairValueMeasurementsRecurringMemberus-gaap:FairValueInputsLevel2Member2024-12-310001323885us-gaap:MoneyMarketFundsMemberus-gaap:FairValueMeasurementsRecurringMemberus-gaap:FairValueInputsLevel3Member2024-12-310001323885us-gaap:MoneyMarketFundsMemberus-gaap:FairValueMeasurementsRecurringMember2024-12-310001323885us-gaap:FairValueMeasurementsRecurringMemberus-gaap:FairValueInputsLevel1Member2024-12-310001323885us-gaap:FairValueMeasurementsRecurringMemberus-gaap:FairValueInputsLevel2Member2024-12-310001323885us-gaap:FairValueMeasurementsRecurringMemberus-gaap:FairValueInputsLevel3Member2024-12-310001323885us-gaap:FairValueMeasurementsRecurringMember2024-12-310001323885atrc:ContingentConsiderationMember2025-09-300001323885atrc:ContingentConsiderationMember2024-12-310001323885us-gaap:TechnologyBasedIntangibleAssetsMember2025-09-300001323885us-gaap:TechnologyBasedIntangibleAssetsMember2024-12-310001323885us-gaap:PatentsMember2025-09-300001323885us-gaap:PatentsMember2024-12-310001323885us-gaap:CostOfSalesMember2025-07-012025-09-300001323885us-gaap:CostOfSalesMember2024-07-012024-09-300001323885us-gaap:CostOfSalesMember2025-01-012025-09-300001323885us-gaap:CostOfSalesMember2024-01-012024-09-300001323885us-gaap:ResearchAndDevelopmentExpenseMember2025-07-012025-09-300001323885us-gaap:ResearchAndDevelopmentExpenseMember2024-07-012024-09-300001323885us-gaap:ResearchAndDevelopmentExpenseMember2025-01-012025-09-300001323885us-gaap:ResearchAndDevelopmentExpenseMember2024-01-012024-09-300001323885us-gaap:RevolvingCreditFacilityMemberatrc:ABLFacilityMemberus-gaap:LineOfCreditMember2024-01-050001323885us-gaap:LetterOfCreditMemberatrc:ABLFacilityMemberus-gaap:LineOfCreditMember2024-01-050001323885us-gaap:RevolvingCreditFacilityMemberatrc:ABLFacilityMemberus-gaap:LineOfCreditMember2024-01-052024-01-050001323885us-gaap:RevolvingCreditFacilityMemberatrc:ABLFacilityMemberus-gaap:LineOfCreditMember2025-09-300001323885atrc:ABLFacilityMemberus-gaap:LineOfCreditMember2024-01-052024-01-050001323885us-gaap:RevolvingCreditFacilityMemberatrc:AdjustedTermSecuredOvernightFinancingRateSOFRMemberatrc:ABLFacilityMemberus-gaap:LineOfCreditMember2024-01-052024-01-050001323885us-gaap:RevolvingCreditFacilityMemberatrc:NTFRBRateMemberatrc:ABLFacilityMemberus-gaap:LineOfCreditMember2024-01-052024-01-050001323885atrc:AdjustedBaseRateMemberatrc:ABLFacilityMembersrt:MinimumMemberus-gaap:LineOfCreditMember2024-01-052024-01-050001323885atrc:AdjustedBaseRateMemberatrc:ABLFacilityMembersrt:MaximumMemberus-gaap:LineOfCreditMember2024-01-052024-01-050001323885us-gaap:SecuredOvernightFinancingRateSofrMemberatrc:ABLFacilityMembersrt:MinimumMemberus-gaap:LineOfCreditMember2024-01-052024-01-050001323885us-gaap:SecuredOvernightFinancingRateSofrMemberatrc:ABLFacilityMembersrt:MaximumMemberus-gaap:LineOfCreditMember2024-01-052024-01-050001323885atrc:ABLFacilityMemberus-gaap:LineOfCreditMember2025-09-300001323885atrc:FinancingObligationMemberus-gaap:SecuredDebtMember2025-08-012025-08-310001323885atrc:FinancingObligationMemberus-gaap:SecuredDebtMember2025-08-3100013238852025-08-310001323885atrc:BuildingExpansionMember2025-09-300001323885atrc:BuildingAndRealPropertyMember2025-09-300001323885atrc:FinancingObligationMemberus-gaap:SecuredDebtMemberatrc:BuildingAndRealPropertyMember2025-09-300001323885srt:MinimumMember2025-09-300001323885srt:MaximumMember2025-09-300001323885atrc:CooperationAgreementMember2025-01-012025-09-300001323885atrc:CooperationAgreementMember2025-09-300001323885atrc:CooperationAgreementMemberus-gaap:SubsequentEventMember2025-12-3100013238852022-01-012022-12-310001323885atrc:CloudComputingArrangementMember2025-01-012025-09-300001323885atrc:SentreHEARTVAtricureMember2025-02-072025-02-070001323885atrc:OpenheartMembercountry:US2025-07-012025-09-300001323885atrc:OpenheartMembercountry:US2024-07-012024-09-300001323885atrc:OpenheartMembercountry:US2025-01-012025-09-300001323885atrc:OpenheartMembercountry:US2024-01-012024-09-300001323885atrc:MinimallyInvasiveMembercountry:US2025-07-012025-09-300001323885atrc:MinimallyInvasiveMembercountry:US2024-07-012024-09-300001323885atrc:MinimallyInvasiveMembercountry:US2025-01-012025-09-300001323885atrc:MinimallyInvasiveMembercountry:US2024-01-012024-09-300001323885atrc:PainManagementMembercountry:US2025-07-012025-09-300001323885atrc:PainManagementMembercountry:US2024-07-012024-09-300001323885atrc:PainManagementMembercountry:US2025-01-012025-09-300001323885atrc:PainManagementMembercountry:US2024-01-012024-09-300001323885atrc:AppendageManagementMembercountry:US2025-07-012025-09-300001323885atrc:AppendageManagementMembercountry:US2024-07-012024-09-300001323885atrc:AppendageManagementMembercountry:US2025-01-012025-09-300001323885atrc:AppendageManagementMembercountry:US2024-01-012024-09-300001323885country:US2025-07-012025-09-300001323885country:US2024-07-012024-09-300001323885country:US2025-01-012025-09-300001323885country:US2024-01-012024-09-300001323885atrc:OpenheartMemberus-gaap:NonUsMember2025-07-012025-09-300001323885atrc:OpenheartMemberus-gaap:NonUsMember2024-07-012024-09-300001323885atrc:OpenheartMemberus-gaap:NonUsMember2025-01-012025-09-300001323885atrc:OpenheartMemberus-gaap:NonUsMember2024-01-012024-09-300001323885atrc:MinimallyInvasiveMemberus-gaap:NonUsMember2025-07-012025-09-300001323885atrc:MinimallyInvasiveMemberus-gaap:NonUsMember2024-07-012024-09-300001323885atrc:MinimallyInvasiveMemberus-gaap:NonUsMember2025-01-012025-09-300001323885atrc:MinimallyInvasiveMemberus-gaap:NonUsMember2024-01-012024-09-300001323885atrc:PainManagementMemberus-gaap:NonUsMember2025-07-012025-09-300001323885atrc:PainManagementMemberus-gaap:NonUsMember2024-07-012024-09-300001323885atrc:PainManagementMemberus-gaap:NonUsMember2025-01-012025-09-300001323885atrc:PainManagementMemberus-gaap:NonUsMember2024-01-012024-09-300001323885atrc:AppendageManagementMemberus-gaap:NonUsMember2025-07-012025-09-300001323885atrc:AppendageManagementMemberus-gaap:NonUsMember2024-07-012024-09-300001323885atrc:AppendageManagementMemberus-gaap:NonUsMember2025-01-012025-09-300001323885atrc:AppendageManagementMemberus-gaap:NonUsMember2024-01-012024-09-300001323885us-gaap:NonUsMember2025-07-012025-09-300001323885us-gaap:NonUsMember2024-07-012024-09-300001323885us-gaap:NonUsMember2025-01-012025-09-300001323885us-gaap:NonUsMember2024-01-012024-09-300001323885srt:EuropeMember2025-07-012025-09-300001323885srt:EuropeMember2024-07-012024-09-300001323885srt:EuropeMember2025-01-012025-09-300001323885srt:EuropeMember2024-01-012024-09-300001323885srt:AsiaMember2025-07-012025-09-300001323885srt:AsiaMember2024-07-012024-09-300001323885srt:AsiaMember2025-01-012025-09-300001323885srt:AsiaMember2024-01-012024-09-300001323885atrc:OtherInternationalMember2025-07-012025-09-300001323885atrc:OtherInternationalMember2024-07-012024-09-300001323885atrc:OtherInternationalMember2025-01-012025-09-300001323885atrc:OtherInternationalMember2024-01-012024-09-300001323885atrc:TwoThousandTwentyThreePlanMember2025-09-300001323885atrc:TwoThousandEighteenEmployeeStockPlanMember2025-01-012025-09-300001323885atrc:TwoThousandEighteenEmployeeStockPlanMember2025-09-300001323885us-gaap:SellingGeneralAndAdministrativeExpensesMember2025-07-012025-09-300001323885us-gaap:SellingGeneralAndAdministrativeExpensesMember2024-07-012024-09-300001323885us-gaap:SellingGeneralAndAdministrativeExpensesMember2025-01-012025-09-300001323885us-gaap:SellingGeneralAndAdministrativeExpensesMember2024-01-012024-09-300001323885us-gaap:AccumulatedNetUnrealizedInvestmentGainLossMember2025-06-300001323885us-gaap:AccumulatedNetUnrealizedInvestmentGainLossMember2024-06-300001323885us-gaap:AccumulatedNetUnrealizedInvestmentGainLossMember2024-12-310001323885us-gaap:AccumulatedNetUnrealizedInvestmentGainLossMember2023-12-310001323885us-gaap:AccumulatedNetUnrealizedInvestmentGainLossMember2025-07-012025-09-300001323885us-gaap:AccumulatedNetUnrealizedInvestmentGainLossMember2024-07-012024-09-300001323885us-gaap:AccumulatedNetUnrealizedInvestmentGainLossMember2025-01-012025-09-300001323885us-gaap:AccumulatedNetUnrealizedInvestmentGainLossMember2024-01-012024-09-300001323885us-gaap:AccumulatedNetUnrealizedInvestmentGainLossMember2025-09-300001323885us-gaap:AccumulatedNetUnrealizedInvestmentGainLossMember2024-09-300001323885us-gaap:AccumulatedTranslationAdjustmentMember2025-06-300001323885us-gaap:AccumulatedTranslationAdjustmentMember2024-06-300001323885us-gaap:AccumulatedTranslationAdjustmentMember2024-12-310001323885us-gaap:AccumulatedTranslationAdjustmentMember2023-12-310001323885us-gaap:AccumulatedTranslationAdjustmentMember2025-07-012025-09-300001323885us-gaap:AccumulatedTranslationAdjustmentMember2024-07-012024-09-300001323885us-gaap:AccumulatedTranslationAdjustmentMember2025-01-012025-09-300001323885us-gaap:AccumulatedTranslationAdjustmentMember2024-01-012024-09-300001323885us-gaap:AccumulatedTranslationAdjustmentMember2025-09-300001323885us-gaap:AccumulatedTranslationAdjustmentMember2024-09-30
xQUARTERLY REPORT PURSUANT TO SECTION 13 OR 15(d) OF THE SECURITIES EXCHANGE ACT OF 1934
For the quarterly period ended September 30, 2025
or
¨TRANSITION REPORT PURSUANT TO SECTION 13 OR 15(d) OF THE SECURITIES EXCHANGE ACT OF 1934
For the transition period from_____________to_____________
Commission File Number 000-51470
_____________________________________________
AtriCure, Inc.
(Exact name of Registrant as specified in its charter)
_____________________________________________
Delaware
34-1940305
(State or other jurisdiction of
incorporation)
(IRS Employer
Identification No.)
7555 Innovation Way
Mason, OH45040
(Address of principal executive offices)
(513) 755-4100
(Registrant’s telephone number, including area code)
(Former name, former address and former fiscal year, if changed since last report)
_____________________________________________
Securities registered pursuant to Section 12(b) of the Act:
Title of each class
Trading Symbol(s)
Name of each exchange on which registered
Common Stock, $.001 par value
ATRC
NASDAQ Global Market
Indicate by check mark whether the registrant (1) has filed all reports required to be filed by Section 13 or 15(d) of the Securities Exchange Act of 1934 during the preceding 12 months (or for such shorter period that the registrant was required to file such reports), and (2) has been subject to such filing requirements for the past 90 days: Yes☒ No ☐
Indicate by check mark whether the registrant has submitted electronically every Interactive Data File required to be submitted pursuant to Rule 405 of Regulation S-T (§232.405 of this chapter) during the preceding 12 months (or for such shorter period that the registrant was required to submit such files). Yes☒ No ☐
Indicate by check mark whether the registrant is a large accelerated filer, an accelerated filer, a non-accelerated filer or a smaller reporting company, or an emerging growth company. See the definitions of “large accelerated filer,” “accelerated filer,” “smaller reporting company,” and “emerging growth company” in Rule 12b-2 of the Exchange Act.
Large Accelerated Filer
☒
Accelerated Filer
☐
Emerging growth company
☐
Non-Accelerated Filer
☐
Smaller reporting company
☐
If an emerging growth company, indicate by check mark if the registrant has elected not to use the extended transition period for complying with any new or revised financial accounting standards provided pursuant to Section 13(a) of the Exchange Act: ☐
Indicate by check mark whether the registrant is a shell company (as defined in Rule 12b-2 of the Exchange Act): YES ☐ NO ☒
Indicate the number of shares outstanding of each of the issuer’s classes of common stock, as of the latest practicable date.
NOTES TO CONDENSED CONSOLIDATED FINANCIAL STATEMENTS
(In Thousands, except per share amounts)
(Unaudited)
1.DESCRIPTION OF BUSINESS AND SUMMARY OF SIGNIFICANT ACCOUNTING POLICIES
Nature of the Business—The “Company” or “AtriCure” consists of AtriCure, Inc. and its wholly-owned subsidiaries. The Company is a leading innovator in surgical treatments and therapies for atrial fibrillation (Afib), left atrial appendage (LAA) management and post-operative pain management, and sells its products to medical centers globally through its direct sales force and distributors.
Basis of Presentation—The accompanying interim financial statements have been prepared in accordance with the rules and regulations of the Securities and Exchange Commission (SEC). All intercompany accounts and transactions have been eliminated in consolidation. The accompanying interim financial statements are unaudited, but in the opinion of the Company’s management, contain all normal, recurring adjustments considered necessary to present fairly the financial position, results of operations and cash flows for the periods presented in conformity with accounting principles generally accepted in the United States of America (GAAP) applicable to interim periods. Certain information and footnote disclosures included in annual financial statements prepared in accordance with GAAP have been omitted or condensed. The Company believes the disclosures herein are adequate to make the information presented not misleading. Results of operations are not necessarily indicative of the results expected for the full year or for any future period.
The accompanying interim financial statements should be read in conjunction with the Company’s audited financial statements included in the Company’s Annual Report on Form 10-K for the year ended December 31, 2024 filed with the SEC. Except as discussed herein, there have been no changes in the Company's significant accounting policies for the nine months ended September 30, 2025 as compared to the significant accounting policies described in the Company's Annual Report on Form 10-K for the year ended December 31, 2024.
Use of Estimates—The preparation of the financial statements in conformity with GAAP requires management to make estimates and assumptions that affect the reported amounts of assets and liabilities, disclosure of contingent assets and liabilities at the date of the financial statements and the reported amounts of revenue and expense. Actual results could differ from those estimates.
Segments—The Company evaluates reporting segments in accordance with the Financial Accounting Standards Board's (FASB) Accounting Standards Codification (ASC) 280, "Segment Reporting". The chief operating decision maker is its Chief Executive Officer. The Company has one business activity and operates as one operating segment: the development, manufacture and sale of devices used by physicians in surgical procedures, designed primarily for ablation of cardiac tissue, exclusion of the left atrial appendage and ablation of peripheral nerves. These devices are developed and marketed to a broad base of medical centers globally. Management considers all such sales to be part of the single operating segment. The Chief Executive Officer is regularly provided with consolidated expenses consistent with the presented consolidated statements of operations, accompanied by revenue information by product type and geographic area, for purposes of allocating resources and evaluating financial performance. Revenue by product type and geographic area is included at Note 9 – Revenue. The Company’s long-lived assets are located in the United States, except for $5,891 as of September 30, 2025 and $4,021 as of December 31, 2024 located primarily in Europe.
Earnings Per Share—Basic and diluted net loss per share are computed by dividing the net loss by the weighted average number of common shares outstanding during the period. Since the Company has experienced net losses for all periods presented, net loss per share excludes the effect of 2,897 and 2,724 shares as of September 30, 2025 and 2024 because they are anti-dilutive. Therefore, the number of shares used for basic and diluted net loss per share are the same.
Sale-and-Leaseback Transaction—Sale-and-leaseback transactions occur when a company sells assets to a third-party and simultaneously leases them back. In accordance with FASB ASC 842, "Leases", for potential sale-and-leaseback transactions, the Company assesses the contract to identify if a sale occurred via transfer of control of the assets in accordance with ASC 606 "Revenue from Contracts with Customers". In cases where control has not transferred, we continue to recognize the underlying asset within Property and equipment, net within the consolidated balance sheets, which is then depreciated over the shorter of the remaining useful life or lease term. Additionally, a financial liability is recognized and referred to as a financing obligation and is accounted for similarly to debt or finance leases. Rental payments are recognized as a reduction of the financing obligation and interest expense using the effective interest method. During the quarter ended September 30, 2025, the Company entered into one failed sale-and-leaseback transaction. See additional discussion in Note 6 – Borrowings and Financing Obligation.
NOTES TO CONDENSED CONSOLIDATED FINANCIAL STATEMENTS
(In Thousands, except per share amounts)
(Unaudited)
Recently Issued Accounting Pronouncements Not Yet Adopted—In September 2025, the FASB issued Accounting Standards Update (ASU) No. 2025-06, "Intangibles—Goodwill and Other—Internal-Use Software (Topic 350-40): Targeted Improvements to the Accounting for Internal-Use Software". This amendment modernizes and makes targeted improvements to the accounting for software costs found under Topic 350-40, effective for fiscal years and interim periods beginning after December 15, 2027, with early adoption permitted. The Company is evaluating the impact of adopting this standard on its consolidated financial statements and disclosures.
2.FAIR VALUE
Fair value is defined as the exchange price that would be received for an asset or paid to settle a liability (an exit price) in the principal or most advantageous market for the asset or liability in an orderly transaction between market participants on the measurement date. To measure the fair value of assets and liabilities, the Company uses the following fair value hierarchy based on three levels of inputs:
•Level 1—Observable inputs, such as quoted prices in active markets for identical assets or liabilities.
•Level 2—Inputs other than Level 1 that are observable, either directly or indirectly, such as quoted prices for similar assets or liabilities; quoted prices in markets that are not active; or other inputs that are observable or can be corroborated by observable market data for substantially the full term of the assets or liabilities.
•Level 3—Unobservable inputs that are supported by little or no market activity and that are significant to the fair value of the assets or liabilities.
The following table represents the Company’s fair value hierarchy for its financial assets measured at fair value on a recurring basis as of September 30, 2025:
Quoted Prices in Active Markets for Identical Assets (Level 1)
Significant Other Observable Inputs (Level 2)
Significant Other Unobservable Inputs (Level 3)
Total
Assets:
Money market funds
$
137,941
$
—
$
—
$
137,941
Total assets
$
137,941
$
—
$
—
$
137,941
There were no changes in the levels or methodology of measurement of financial assets and liabilities during the three and nine months ended September 30, 2025.
The following table represents the Company’s fair value hierarchy for its financial assets measured at fair value on a recurring basis as of December 31, 2024:
Quoted Prices in Active Markets for Identical Assets (Level 1)
Significant Other Observable Inputs (Level 2)
Significant Other Unobservable Inputs (Level 3)
Total
Assets:
Money market funds
$
101,147
$
—
$
—
$
101,147
Total assets
$
101,147
$
—
$
—
$
101,147
Contingent Consideration.The Company’s contingent consideration arrangements arising from the SentreHEART acquisition obligate the Company to pay certain defined amounts to former shareholders of SentreHEART if specified milestones are met related to the aMAZE™ IDE clinical trial, including PMA approval and reimbursement for the therapy involving SentreHEART’s devices. The PMA approval milestone expired December 31, 2023, while the achievement period for the reimbursement milestone expires on December 31, 2026. The Company assessed the projected probability of payment during the contractual achievement periods as remote, resulting in no reported fair value as of September 30, 2025 and December 31, 2024.
NOTES TO CONDENSED CONSOLIDATED FINANCIAL STATEMENTS
(In Thousands, except per share amounts)
(Unaudited)
6.BORROWINGS AND FINANCING OBLIGATION
Asset backed revolving credit facility.The Company has a credit agreement (Credit Agreement) with JPMorgan Chase Bank, N.A., as administrative agent, and JPMorgan Chase Bank, N.A., as bookrunner and lead arranger (JPMCB), and Silicon Valley Bank, a Division of First-Citizens Bank & Trust Company, as Joint Lead Arrangers and Joint Bookrunners, and the lenders party thereto (Lenders) effective January 5, 2024. The Credit Agreement provides for an asset based revolving credit facility (ABL Facility) in an amount of up to $125,000. Borrowing availability under the ABL Facility is based on the lesser of $125,000 or a borrowing base calculation as defined by the Credit Agreement. The Company may request an increase in the revolving commitment by up to $40,000 (not to exceed a total of $165,000). A portion of the ABL Facility, limited to $5,000, is available for the issuance of letters of credit by JPMCB or other financial institutions. JPMCB in its sole discretion, may create swingline loans by advancing floating rate revolving loans requested. Any such swingline loans will reduce availability under the ABL Facility on a dollar-for-dollar basis.
The Credit Agreement has a three-year term, and all outstanding borrowings are due upon maturity of the Credit Agreement on January 5, 2027. Subject to customary exceptions and restrictions, the Company may voluntarily prepay outstanding amounts under the ABL Facility at any time thereafter without premium or penalty. Any voluntary prepayments made will not reduce commitments under the ABL Facility. The Credit Agreement contains mandatory prepayment provisions which require prepayment of amounts outstanding under the ABL Facility upon specified events or availability shortfall.
As of September 30, 2025, the Company had borrowings of $61,865 and had borrowing capacity of $61,885 under the ABL facility. Future maturities of long-term debt are projected as follows:
2025 (excluding the nine months ended September 30, 2025)
$
—
2026
—
2027
61,865
2028
—
2029
—
Total long-term debt, of which $61,865 is noncurrent
$
61,865
The ABL Facility is subject to a facility fee of 0.37% per annum of the daily available revolving commitment and paid on a quarterly basis. Outstanding amounts under the Credit Agreement bear interest at a rate per annum equal to, at the Company's election: (i) an alternate base rate (ABR) plus an applicable margin or (ii) an adjusted term secured overnight financing rate (SOFR) plus an applicable margin. All swingline loans bear interest at a rate per annum equal to the ABR plus the applicable margin under the Credit Agreement. Alternate base rate is equal to the greater of Prime, the NYFRB Rate plus 0.50% or Adjusted Term SOFR Rate plus 1.00%. The applicable margin on borrowings will adjust ranging from 1.50% to 1.75% per annum for ABR borrowings and from 2.50% to 2.75% per annum for SOFR term borrowings determined by the average historical excess availability. Participation and fronting fees are accrued and paid on a quarterly basis. As of September 30, 2025, the effective interest rate on the ABL Facility was 7.00%.
The ABL Facility is secured by the assets of the Company, consisting of personal, tangible or intangible property, including certain outstanding equity interests of the Company’s direct subsidiaries, subject to limitations specified in the Credit Agreement. The Credit Agreement contains customary representations and warranties, events of default and financial, affirmative and negative covenants for facilities of this type, including but not limited to financial covenants relating to a fixed charge coverage ratio and minimum excess availability, and restrictions on indebtedness, liens, investments and acquisitions, asset dispositions, specified agreements, restricted payments and prepayment of certain indebtedness.
Financing obligation. In August 2025, the Company transferred legal ownership of a building and certain real property on its corporate headquarters campus in Mason, Ohio for cash consideration of $6,250. Simultaneously, the Company entered into a contract to lease back the existing building and real property, as well as the planned building expansion space from the buyer-lessor. The buyer-lessor is financing the development and construction of the expansion of additional manufacturing and office space. During construction of the expansion, the Company will maintain occupancy and pay rent for the existing building. Upon construction completion, the expanded premises will be leased for fifteen years with threefive-year options to renew. Annual rental payments will be calculated at an amount equal to 8% of the construction costs and will escalate 3% annually. Rental payments will be allocated between the existing and the expanded property based on the relative fair value upon construction completion. Expansion rental payments are projected to be $38,469 for the fifteen year lease term expected to
NOTES TO CONDENSED CONSOLIDATED FINANCIAL STATEMENTS
(In Thousands, except per share amounts)
(Unaudited)
begin during 2026. The classification of the lease related to the expansion will be assessed upon completion of construction. Rental payments will be finalized upon completion of the expansion construction. Estimated rental payments for the expansion over the next five annual periods are as follows:
2025
$
—
2026
1,034
2027
2,099
2028
2,162
2029
2,227
2030
2,294
The lease of the existing building and certain real property sold is a failed sale-and-leaseback as a result of finance lease classification. The Company recorded a financing obligation equal to the $6,250 cash proceeds received. The Company allocated projected rental payments during the term of construction and fifteen-year lease term based on the estimated fair value of the existing real property assets and future expansion. The company imputes interest monthly at a rate of 6.76%. During the three and nine months ended September 30, 2025, interest expense was not significant. Future maturities of the financing obligation are projected as follows:
2025 (excluding the nine months ended September 30, 2025)
$
11
2026
81
2027
128
2028
152
2029
180
2030 and thereafter
5,694
Total long-term financing obligation, of which $64 is current
$
6,246
The financing obligation is included in Other current liabilities and Other noncurrent liabilities on the Condensed Consolidated Balance Sheet.
See additional discussion in Note 1 – Description of the Business and Summary of Significant Accounting Policies.
7.LEASES
The Company has operating and finance leases for office, manufacturing and warehouse facilities and automobiles. The Company’s leases have remaining lease terms of less than one year to ten years. Options to renew or extend leases beyond their initial term have been excluded from measurement of the right-of-use (ROU) assets and lease liabilities as exercise is not reasonably certain.
The weighted average remaining lease term and the discount rate for the reporting periods are as follows:
NOTES TO CONDENSED CONSOLIDATED FINANCIAL STATEMENTS
(In Thousands, except per share amounts)
(Unaudited)
A letter of credit for $1,250 issued to the lessor of the Company's corporate headquarters building is renewed annually and remains outstanding as of September 30, 2025.
The components of lease expense are as follows:
Three Months Ended September 30,
Nine Months Ended September 30,
2025
2024
2025
2024
Operating lease cost
$
504
$
423
$
1,461
$
1,187
Finance lease cost:
Amortization of right-of-use assets
262
262
786
785
Interest on lease liabilities
137
157
426
474
Total finance lease cost
$
399
$
419
$
1,212
$
1,259
Short-term lease expense was not significant for the three and nine months ended September 30, 2025 and 2024.
Supplemental cash flow information related to leases is as follows:
Nine Months Ended September 30, 2025
Nine Months Ended September 30, 2024
Cash paid for amounts included in the measurement of lease liabilities:
Operating cash flows for operating leases
$
1,528
$
1,206
Operating cash flows for finance leases
426
474
Financing cash flows for finance leases
876
774
Right-of-use assets and corresponding lease obligations related to new and modified lease agreements:
NOTES TO CONDENSED CONSOLIDATED FINANCIAL STATEMENTS
(In Thousands, except per share amounts)
(Unaudited)
Supplemental balance sheet information related to leases is as follows:
September 30, 2025
December 31, 2024
Operating Leases
Operating lease right-of-use assets
$
6,800
$
5,727
Other current liabilities
$
1,659
$
1,619
Finance and operating lease liabilities
5,551
4,579
Total operating lease liabilities
$
7,210
$
6,198
Finance Leases
Property and equipment, at cost
$
14,765
$
14,765
Accumulated depreciation
(9,661)
(8,875)
Property and equipment, net
$
5,104
$
5,890
Other current liabilities
$
1,275
$
1,186
Finance and operating lease liabilities
6,316
7,281
Total finance lease liabilities
$
7,591
$
8,467
Future maturities of lease liabilities as of September 30, 2025 are as follows:
Operating Leases
Finance Leases
2025 (excluding the nine months ended September 30, 2025)
$
506
$
441
2026
1,831
1,775
2027
1,779
1,808
2028
1,361
1,842
2029
971
1,818
2030 and thereafter
2,377
1,339
Total payments
$
8,825
$
9,023
Less imputed interest
(1,615)
(1,432)
Total
$
7,210
$
7,591
8.COMMITMENTS AND CONTINGENCIES
Cooperation Agreement. The Company holds an exclusive licensing agreement (Cooperation Agreement) to co-develop and commercialize equipment incorporating pulsed field ablation (PFA) technology. The Cooperation Agreement requires the Company to pay contingent consideration, settled in cash, with a maximum total payout of $28,000 if all milestones are achieved successfully through the agreement term ending in 2034. The contingent consideration will be expensed when each milestone is paid or becomes payable as a result of achievement. Payments made under this agreement were $5,000 for the nine months ended September 30, 2025 and included as a component of research and development expense. During October 2025, the next milestone was achieved. The impact of the $1,000 payment and expense will be included in the fourth quarter of 2025. The agreement also contains provisions requiring future royalty payments on devices incorporating co-developed technology upon commercialization.
Purchase Agreements. The Company enters into standard purchase agreements with suppliers in the ordinary course of business, generally with terms that allow cancellation. In 2022, the Company entered into a clinical trial management agreement for the LeAAPS clinical trial. The terms of the agreement require payments upon achievement of various enrollment and project milestones over the estimated ten-year term, however, the agreement may be terminated early for any reason. Furthermore, the Company incurs additional variable costs, including pass through costs from clinical trial sites. Payments
NOTES TO CONDENSED CONSOLIDATED FINANCIAL STATEMENTS
(In Thousands, except per share amounts)
(Unaudited)
made under this agreement were $5,144 and $312 for the three months ended September 30, 2025 and 2024, respectively, and $12,631 and $6,461 for the nine months ended September 30, 2025 and 2024, respectively. In August 2025, the Company entered into a non-cancellable cloud computing arrangement with a term of seven years requiring total payments of $3,616. Payments under this agreement will begin March 2026.
Legal. The Company may, from time to time, become a party to legal proceedings which are subject to many uncertainties. Litigation and administrative proceedings over patent and other intellectual property rights are common in our industry, as are requests for information related to interactions with medical professionals. Accordingly, the financial impact of ultimate resolutions from legal proceedings may not be known for extended periods of time and are not predictable with assurance. A liability is established once management determines a loss is probable and an amount can be reasonably estimated. The Company recognizes income from a favorable resolution of legal proceedings when the associated cash or assets are received.
On February 7, 2025, the representative for former securityholders of SentreHEART, Inc. filed a complaint in the Delaware Court of Chancery naming the Company as a defendant, and on May 23, 2025 filed a first amended complaint. The Company acquired SentreHEART, Inc. pursuant to a merger agreement dated August 11, 2019. The merger agreement provides for contingent consideration to be paid upon achievement of specified PMA and CPT reimbursement milestones by specified dates. The amended complaint alleges breach of contract and a related claim for breach of the implied covenant of good faith and fair dealing resulting from the Company's alleged failure to use commercially reasonable efforts to obtain premarket approval from FDA for the LARIAT System. The amended complaint seeks damages in the amount of the original PMA and CPT reimbursement milestones of up to $260,000 plus interest. The Company intends to vigorously defend this claim. A liability has not been recognized related to this matter because any potential loss is not currently probable or reasonably estimable.
9.REVENUE
The Company develops, manufactures and sells devices designed for surgical ablation of cardiac tissue, exclusion of the left atrial appendage, and temporarily blocking pain by ablating peripheral nerves. These devices are marketed to a broad base of medical centers globally. The Company recognizes revenue when control of promised goods is transferred to customers in an amount that reflects the consideration the Company expects to be entitled to in exchange for those goods.
United States revenue by product type is as follows:
Three Months Ended September 30,
Nine Months Ended September 30,
2025
2024
2025
2024
Open ablation
$
35,592
$
30,601
$
105,368
$
90,661
Minimally invasive ablation
7,428
11,117
23,747
35,263
Pain management
20,837
16,314
59,275
44,059
Appendage management
45,450
37,420
132,649
111,257
Total United States
$
109,307
$
95,452
$
321,039
$
281,240
International revenue by product type is as follows:
NOTES TO CONDENSED CONSOLIDATED FINANCIAL STATEMENTS
(In Thousands, except per share amounts)
(Unaudited)
Revenue attributed to customer geographic locations is as follows:
Three Months Ended September 30,
Nine Months Ended September 30,
2025
2024
2025
2024
United States
$
109,307
$
95,452
$
321,039
$
281,240
Europe
15,170
12,215
45,501
36,193
Asia Pacific
8,083
6,914
22,351
19,916
Other International
1,709
1,329
5,137
3,681
Total International
24,962
20,458
72,989
59,790
Total Revenue
$
134,269
$
115,910
$
394,028
$
341,030
10.INCOME TAX PROVISION
The Company files federal, state and foreign income tax returns in jurisdictions with varying statutes of limitations. The Company uses the asset and liability method to determine its provision for income taxes. The Company’s provision for income taxes in interim periods is computed by applying the discrete method and is based on financial results through the end of the interim period. The Company determined that using the discrete method is more appropriate than using the annual effective tax rate method. The Company is unable to estimate the annual effective tax rate with sufficient precision to use the effective tax rate method, which requires a full-year projection of income. The effective tax rate for the three months ended September 30, 2025 and 2024 was (210.5%) and (4.3%), respectively. The effective tax rate for the nine months ended September 30, 2025 and 2024 was (5.4%) and (2.7%), respectively. The Company’s worldwide effective tax rate differs from the US statutory rate of 21% primarily due to valuation allowances.
The Company's federal, state, local and foreign tax returns are subject to review by various taxing authorities. The Company has not accrued any interest and penalties related to unrecognized income tax benefits as a result of offsetting net operating losses. However, if required, the Company will recognize interest and penalties within income tax expense and within the related tax liability.
On July 4, 2025, the One Big Beautiful Bill Act ("OBBBA") was signed into law. Key elements of the Tax Cuts and Jobs Act of 2017 are made permanent under the OBBBA, including 100% bonus depreciation, domestic research cost expensing and the business interest expense limitation. The legislation has multiple effective dates, with certain provisions effective in 2025 and others effective in 2026 or 2027. FASB ASC 740, "Income Taxes", requires the effects of changes in tax rates and laws on tax balances to be recognized in the period in which the legislation is enacted. As the Company maintains a full valuation allowance on its U.S. deferred tax assets, the legislation did not have a material impact on the income tax expense or effective tax rate for the three months ended September 30, 2025.
11.EQUITY COMPENSATION PLANS
The Company has two share-based incentive plans: the 2023 Stock Incentive Plan (2023 Plan) and the 2018 Employee Stock Purchase Plan (ESPP).
Stock Incentive Plan
Under the 2023 Plan, the Board of Directors may grant restricted stock awards or restricted stock units (collectively RSAs), nonstatutory stock options, performance share awards, performance share units or stock appreciation rights to Company employees, directors and consultants, and may grant incentive stock options to Company employees. The Compensation Committee of the Board of Directors, as the administrator of the 2023 Plan, has the authority to determine the terms of any awards, including the number of shares subject to each award, the exercisability of the awards and the form of consideration. As of September 30, 2025, 5,787 shares of common stock have been reserved for issuance under the 2023 Plan, and 3,127 shares were available for future grants. The Company issues registered shares of common stock for stock option exercises, restricted stock grants and performance share award payments.
NOTES TO CONDENSED CONSOLIDATED FINANCIAL STATEMENTS
(In Thousands, except per share amounts)
(Unaudited)
Employee Stock Purchase Plan
Under the ESPP, shares of the Company’s common stock may be purchased at a discount (15%) to the lesser of the closing price of the Company’s common stock on the first or last trading day of the offering period. The offering period (currently six months) and the offering price are subject to change. Participants may not purchase more than $25 of the Company’s common stock in a calendar year or more than 3 shares during an offering period. As of September 30, 2025, there were 381 shares available for future issuance under the ESPP.
Share-Based Compensation Expense Information
The following table summarizes the allocation of share-based compensation expense:
Three Months Ended September 30,
Nine Months Ended September 30,
2025
2024
2025
2024
Cost of revenue
$
773
$
578
$
2,183
$
1,736
Research and development expenses
2,164
1,738
5,998
5,090
Selling, general and administrative expenses
9,487
8,048
25,244
23,194
Total
$
12,424
$
10,364
$
33,425
$
30,020
12.COMPREHENSIVE LOSS AND ACCUMULATED OTHER COMPREHENSIVE INCOME (LOSS)
In addition to net losses, comprehensive loss includes foreign currency translation adjustments and unrealized gains (losses) on investments.
Accumulated other comprehensive income (loss) consisted of the following, net of tax:
Three Months Ended September 30,
Nine Months Ended September 30,
2025
2024
2025
2024
Total accumulated other comprehensive income (loss) at beginning of period
$
749
$
(569)
$
(1,035)
$
(993)
Unrealized Gains (Losses) on Investments
Balance at beginning of period
$
—
$
(15)
$
—
$
(800)
Other comprehensive income before reclassifications
—
15
—
800
Balance at end of period
$
—
$
—
$
—
$
—
Foreign Currency Translation Adjustment
Balance at beginning of period
$
749
$
(554)
$
(1,035)
$
(193)
Other comprehensive income (loss) before reclassifications
(77)
586
2,280
199
Amounts reclassified to other income
(99)
(179)
(672)
(153)
Balance at end of period
$
573
$
(147)
$
573
$
(147)
Total accumulated other comprehensive income (loss) at end of period
Item 2. Management’s Discussion and Analysis of Financial Condition and Results of Operations
(Dollar amounts referenced in this Item 2 are in thousands, except per share amounts.)
The following discussion and analysis of our financial condition and results of operations should be read in conjunction with the accompanying Condensed Consolidated Financial Statements and notes thereto contained in Item 1 of Part I of this Form 10-Q and our audited consolidated financial statements and notes thereto as well as the information under the heading “Management’s Discussion and Analysis of Financial Condition and Results of Operations” as of and for the year ended December 31, 2024 included in our Form 10-K filed with the Securities and Exchange Commission (SEC). This discussion and analysis is intended to provide an understanding of our results of operations, financial condition and cash flows and contains forward-looking statements reflecting current expectations that involve risks, uncertainties and assumptions. The actual results may differ materially from those anticipated in these forward-looking statements as a result of many factors, including but not limited to those set forth under Item 1A “Risk Factors,” the cautionary statement regarding forward-looking statements below and elsewhere in this Form 10-Q.
Forward-Looking Statements
This Form 10-Q contains forward-looking statements. We intend such forward-looking statements to be covered by the safe harbor provisions for forward-looking statements contained in Section 27A of the Securities Act of 1933 and Section 21F of the Securities Exchange Act of 1934. All forward-looking information is inherently uncertain and actual results may differ materially from assumptions, estimates or expectations reflected or contained in the forward-looking statements as a result of various factors, including those set forth under “Risk Factors” and elsewhere in this quarterly report on Form 10-Q, and in our annual report on Form 10-K for the year ended December 31, 2024 as amended by our subsequent quarterly reports on Form 10-Q. There may be additional risks of which we are not presently aware or that we currently believe are immaterial which could have an adverse impact on our business. Forward-looking statements often address our expected future business, financial performance, financial condition and results of operations, and often contain words such as “intends,” “estimates,” “anticipates,” “hopes,” “projects,” “plans,” “expects,” “drives,” “seek,” “believes,” “see,” “focus,” “should,” “will,” “would,” “opportunity,” “outlook,” “could,” “can,” “may,” “future,” “predicts,” “target,” “potential,” "forecast," "trend," "might" and similar expressions and the negative versions of those words, and may be identified by the context in which they are used. However, the absence of these words does not mean that a statement is not forward-looking. Forward-looking statements include, without limitation, statements that address activities, events, circumstances or developments that AtriCure expects, believes or anticipates will or may occur in the future, such as earnings estimates (including projections and guidance), other predictions of financial performance, launches by AtriCure of new products, developments with competitors and market acceptance of AtriCure's products. Such statements are based largely upon current expectations of AtriCure. Reliance should not be placed on forward-looking statements because they involve known and unknown risks, uncertainties and other factors which may cause actual results, performance or achievements to different materially from those expressed or implied. Forward-looking statements are based on AtriCure’s expectations, experience and perception of current conditions, trends, expected future developments and other factors it believes are appropriate under the circumstances and are subject to numerous risks and uncertainties, many of which are beyond AtriCure’s control. In light of these risks, uncertainties and other factors, the forward-looking events and circumstances described may not occur and our financial condition and actual results could differ materially and adversely from those anticipated or implied in the forward-looking statements. In other words, these statements are not guarantees of future performance and inherently involve a wide range of risks and uncertainties that are difficult to predict. Some of the factors that could cause actual results to differ from our expectations include regional, national, or global political, economic, business, competitive, market and regulatory conditions and the other factors included in our Form 10-K for the fiscal year ended December 31, 2024 in “Item 1A Risk Factors,” “Item 7 Management’s Discussion and Analysis of Financial Condition and Results of Operations,” and “Item 7A Quantitative and Qualitative Disclosures About Market Risk” and subsequent Form 10-Q reports. These forward-looking statements speak only as of the date of this Form 10-Q. We undertake no obligation to publicly update or revise any forward-looking statements to reflect new information or future events or otherwise unless required by law.
Overview
We are a leading innovator in treatments for atrial fibrillation (Afib), left atrial appendage (LAA) management and post-operative pain management. Our ablation and left atrial appendage management (LAAM) products are used by physicians during both open-heart and minimally invasive surgical procedures. In open-heart procedures, the physician is performing heart surgery for other conditions and our products are used in conjunction with (or “concomitant” to) such a procedure. Minimally invasive procedures are performed on a standalone basis, and often include multi-disciplinary or “hybrid” approaches, combining surgical procedures using AtriCure ablation and LAAM products with catheter ablation procedures performed by electrophysiologists. Our pain management devices are used by physicians to ablate peripheral nerves, providing pain relief in
cardiac, thoracic and amputation procedures. We anticipate that substantially all of our revenue for the foreseeable future will relate to products we currently sell or are in the process of developing.
We sell our products to medical centers through our direct sales force in the United States, Germany, France, the United Kingdom, the Benelux region, Australia and Canada. We also sell our products through distributors who in turn sell our products to medical centers in other markets. Our business is primarily transacted in U.S. Dollars; direct sales outside the United States are transacted in Euros, British Pounds, Australian Dollars or Canadian Dollars.
Recent Developments
In 2025, we continued to realize strong growth across most of our key franchises and geographies, resulting from our strategic initiatives of product innovation, clinical science and physician education and training to expand awareness and adoption. Our worldwide revenue for the nine months ended September 30, 2025 was $394,028, representing an increase of $52,998, or 15.5% (15.3% on a constant currency basis), over the first nine months of 2024, highlighted by accelerated adoption in our appendage management and pain management product lines, where recent product launches contributed to growth. There are limited competitors in our key markets; however, new entrants are developing competing products, procedures, and/or clinical solutions that may cause variability in our results.
Highlights of the strategic and operational advancements include:
PRODUCT INNOVATION. We continue to invest in research and development of new products and pursue regulatory approvals to market and sell globally across all franchises.
Pain management. During the third quarter of 2025, we launched the cryoICE® cryoXT™ probe in the United States. The cryoXT probe is a cryoablation device designed specifically for Cryo Nerve Block therapy to alleviate pain in amputation patients. This device temporarily blocks pain by freezing target peripheral nerves, preventing the conduction pathway at the site of amputation.
CLINICAL SCIENCE. We invest in studies to expand labeling claims, support various indications for our products and gather and publish clinical data for therapies and procedures involving our products.
LeAAPS. The Left Atrial Appendage Exclusion for Prophylactic Stroke Reduction (LeAAPS) IDE clinical trial is designed to evaluate the effectiveness of prophylactic LAA exclusion using the AtriClip LAA Exclusion System for the prevention of ischemic stroke or systemic arterial embolism in cardiac surgery patients without pre-operative AF diagnosis who are at risk for these events. This prospective, multicenter, randomized trial evaluates safety at 30 days post-procedure to demonstrate no increased risk with LAA exclusion during cardiac surgery, and efficacy over a minimum follow-up period of five years post procedure. In July 2025, we completed trial enrollment of 6,500 patients across 137 centers globally. Patient follow-up for a minimum of five years post procedure is required by the study protocol and remains ongoing.
BoxX-NoAF. The Box Lesion and Left Atrial Appendage EXclusion Procedure for the Prevention of New Onset of Atrial Fibrillation (BoxX-NoAF) IDE trial evaluates the impact of concomitant ablation using the EnCompass clamp and LAA exclusion with the AtriClip system in non-AF patients for the reduction of post-operative AF (POAF) and Clinical AF. This prospective, multi-center, multi-national randomized trial evaluates safety at 30 days post-procedure for POAF and secondary effectiveness for Clinical AF through three years. The trial provides enrollment of up to 960 subjects. FDA approved the trial protocol during the fourth quarter of 2024 and during October 2025, we completed the first patient enrollment. Site initiation and enrollment is ongoing.
TRAINING. Our professional education team conducts a variety of in-person and virtual training programs for physicians and other healthcare professionals. These training methods ensure access to continuing education and awareness of our products and related procedures. During 2025, we launched new and innovative training methods for physicians that include virtual proctoring and observerships as well as the ability to review case-in-a-box on a peer-to-peer basis. We have also extended our courses for Advanced Practice Providers, incorporating new content and workshops. We also recently launched our first electronic manual created by physicians for physicians that provides an outline for best practices in developing and growing a Hybrid Ablation Program. These new training events along with our traditional on-demand, local and national training courses allow for collaborative, hands-on engagement with our physician partners and other healthcare professionals. Additionally, our professional education courses continue to be enhanced by the use of simulation models or synthetic cadavers, known as CADets. These reusable CADets provide a sustainable alternative to the use of cadaver specimens, in addition to increasing the efficiencies of education and more cost effective training alternatives.
Three months ended September 30, 2025 compared to three months ended September 30, 2024
The following table sets forth, for the periods indicated, our results of operations expressed as dollar amounts and as percentages of revenue:
Three Months Ended September 30,
2025
2024
Amount
% of Revenues
Amount
% of Revenues
Revenue
$
134,269
100.0
%
$
115,910
100.0
%
Cost of revenue
32,937
24.5
29,117
25.1
Gross profit
101,332
75.5
86,793
74.9
Operating expenses:
Research and development expenses
22,892
17.0
20,960
18.1
Selling, general and administrative expenses
78,232
58.3
73,238
63.2
Total operating expenses
101,124
75.3
94,198
81.3
Income (loss) from operations
208
0.2
(7,405)
(6.4)
Other expense, net
(294)
(0.2)
(126)
(0.1)
Loss before income tax expense
(86)
(0.1)
(7,531)
(6.5)
Income tax expense
181
0.1
322
0.3
Net loss
$
(267)
(0.2)
%
$
(7,853)
(6.8)
%
Revenue. The following table sets forth, for the periods indicated, our revenue by product type and geography expressed as dollar amounts and the corresponding change in such revenues between periods, in both dollars and percentages:
Three Months Ended September 30,
Change
2025
2024
Amount
%
Open ablation
$
35,592
$
30,601
$
4,991
16.3
%
Minimally invasive ablation
7,428
11,117
(3,689)
(33.2)
Pain management
20,837
16,314
4,523
27.7
Appendage management
45,450
37,420
8,030
21.5
Total United States
$
109,307
$
95,452
$
13,855
14.5
Total International
24,962
20,458
4,504
22.0
Total revenue
$
134,269
$
115,910
$
18,359
15.8
%
Worldwide revenue increased 15.8% (15.1% on a constant currency basis). In the United States, sales grew in most product lines with significant contribution from our AtriClip® FLEX-Mini™ device for appendage management, our EnCompass® clamp for open ablation and our cryoSPHERE MAX™ probe for post-operative pain management. Minimally invasive ablation sales declined during the quarter from continued reduction in Hybrid procedures as physicians adopt PFA catheters to treat patients. International sales increased 22.0% (17.9% on a constant currency basis), with broad growth across all of our franchises and most geographic regions.
Revenue reported on a constant currency basis is a non-GAAP measure calculated by applying previous period foreign currency exchange rates, which are determined by the average daily exchange rate, to each of the comparable periods. Revenue is analyzed on a constant currency basis to better measure the comparability of results between periods. Because changes in foreign currency exchange rates have a non-operating impact on revenue, we believe that evaluating growth in revenue on a constant currency basis provides an additional and meaningful assessment of revenue to both management and investors.
Cost of revenue and gross margin. Cost of revenue increased $3,820 primarily reflecting higher sales volumes. Gross margin increased 59 basis points, driven by favorable product mix.
Research and development expenses. Research and development expenses increased $1,932 or 9.2%, primarily from a $2,081 increase in personnel costs, including share-based compensation and travel expenses. Clinical expenses overall decreased $517 driven by the completion of the LeAAPS trial enrollment, partially offset by patient enrollments in registries and continued LeAAPS trial follow-up activities.
Selling, general and administrative expenses. Selling, general and administrative expenses increased $4,994, or 6.8%, driven by a $5,629 increase in personnel costs, including travel and share-based compensation, as a result of growth in headcount and variable compensation. These increases were partially offset by lower consulting costs of $1,071.
Other income (expense). Other expense consists primarily of net interest expense.
Nine months ended September 30, 2025 compared to nine months ended September 30, 2024
The following table sets forth, for the periods indicated, our results of operations expressed as dollar amounts and as percentages of revenue:
Nine Months Ended September 30,
2025
2024
Amount
% of Revenues
Amount
% of Revenues
Revenue
$
394,028
100.0
%
$
341,030
100.0
%
Cost of revenue
98,586
25.0
86,125
25.3
Gross profit
295,442
75.0
254,905
74.7
Operating expenses:
Research and development expenses
74,704
19.0
61,221
18.0
Selling, general and administrative expenses
232,676
59.1
219,174
64.3
Total operating expenses
307,380
78.0
280,395
82.2
Loss from operations
(11,938)
(3.0)
(25,490)
(7.5)
Other expense, net
(585)
(0.1)
(2,882)
(0.8)
Loss before income tax expense
(12,523)
(3.2)
(28,372)
(8.3)
Income tax expense
681
0.2
758
0.2
Net loss
$
(13,204)
(3.4)
%
$
(29,130)
(8.5)
%
Revenue. The following table sets forth, for the periods indicated, our revenue by product type and geography expressed as dollar amounts and the corresponding change in such revenues between periods, in both dollars and percentages:
Nine Months Ended September 30,
Change
2025
2024
Amount
%
Open ablation
$
105,368
$
90,661
$
14,707
16.2
%
Minimally invasive ablation
23,747
35,263
(11,516)
(32.7)
Pain management
59,275
44,059
15,216
34.5
Appendage management
132,649
111,257
21,392
19.2
Total United States
$
321,039
$
281,240
$
39,799
14.2
Total International
72,989
59,790
13,199
22.1
Total revenue
$
394,028
$
341,030
$
52,998
15.5
%
Worldwide revenue increased 15.5% (15.3% on a constant currency basis). In the United States, sales grew across most product lines with strong contribution from our AtriClip FLEX-Mini device for appendage management, EnCompass clamp in open ablation and cryoSPHERE MAX probe for post-operative pain management. Sales for minimally invasive ablation devices declined as physicians referred fewer patients for Hybrid procedures. International sales increased 22.1% (20.5% on a constant currency basis), with growth in major geographic markets across all product lines.
Cost of revenue and gross margin. Cost of revenue increased $12,461 as a result of higher sales volumes. Gross margin increased 23 basis points, driven by favorable product mix.
Research and development expenses. Research and development expenses increased $13,483 or 22.0%, driven by a $5,486 increase in personnel costs, including share-based compensation and travel, as a result of headcount growth and higher variable and share-based compensation. Additional increases include the second quarter milestone payment of $5,000 for the acquired IPR&D and $3,693 of clinical trial expenses for LeAAPS clinical trial patient enrollment and follow up activities. These increases were partially offset by a $879 reduction in regulatory filing costs as a result of the timing of product development initiatives.
Selling, general and administrative expenses. Selling, general and administrative expenses increased $13,502, or 6.2%, driven by a $14,862 increase in personnel costs, including travel and share-based compensation, primarily reflecting growth in headcount and variable and share-based compensation. This increase was partially offset by $1,102 decrease in marketing and training costs and $1,018 decrease in consulting costs.
Other income (expense). Other expense decreased $2,297, primarily due to the $1,362 loss on debt extinguishment during the first quarter of 2024. Net interest expense decreased $512 from lower borrowing costs, while net foreign currency transaction gain increased $402.
Liquidity and Capital Resources
As of September 30, 2025, we had cash and cash equivalents of $147,865 and outstanding debt of $61,865. We had unused borrowing capacity of $61,885 (see Note 6 – Borrowings and Financing Obligation for related discussion). All cash equivalents and most of our operating cash is held in United States financial institutions. A small portion of our cash is held in foreign banks to support our international operations. We had net working capital of $223,270 and an accumulated deficit of $414,959 as of September 30, 2025.
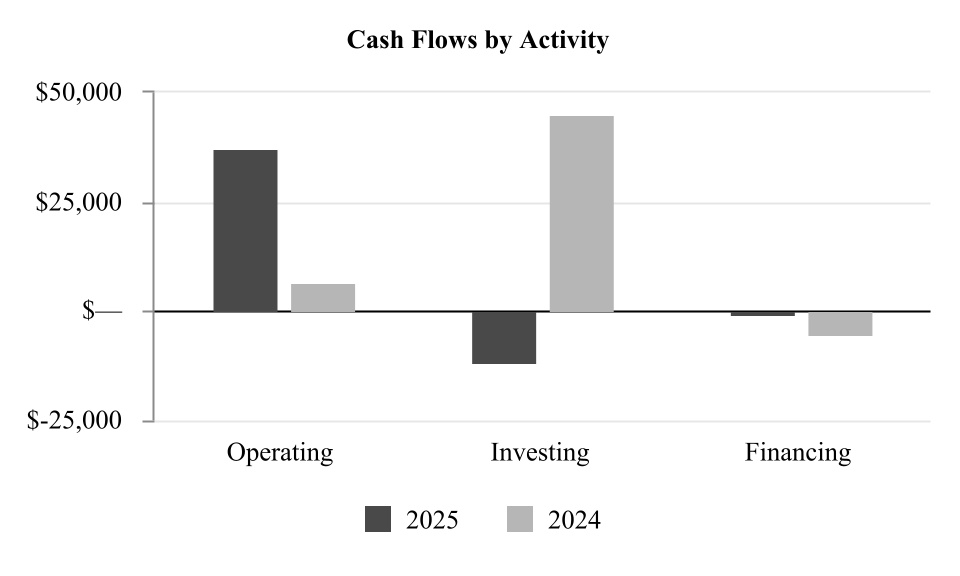
Consolidated Cash Flows - For the nine months ended September 30, 2025 and 2024
Cash flows provided by operating activities. Net cash provided by operating activities increased $30,939 from 2024 to 2025, reflecting improved operating results of $15,926, driven by higher sales and moderating expansion of operating expenses. This improvement includes an adjustment of $5,000 related to the acquired IPR&D milestone payment in 2025. Cash used for working capital and other assets and liabilities decreased $6,559 primarily due to moderating investments in inventory.
Cash flows used in investing activities. Net cash used in investing activities increased by $56,875 from 2024 to 2025, due to a $53,668 decrease in sales and maturities of available-for-sale securities and the first acquired IPR&D milestone payment for $5,000 in 2025.
Cash flows used in financing activities. Net cash used in financing activities decreased by $4,419 in 2025. This decrease was a result of $6,250 in proceeds from the August 2025 sale-and-leaseback arrangement and a $1,679 reduction of payments
for extinguishment of debt and financing fees from 2024. These improvements were offset by a $4,176 increase in shares repurchased for payment of taxes on stock awards.
Credit facility. The Company has a credit agreement (Credit Agreement) with JPMorgan Chase Bank, N.A. as Administrative Agent, JPMorgan Chase Bank, N.A. and Silicon Valley Bank, a division of First-Citizens Bank and Trust Company, as Joint Lead Arrangers and Joint Bookrunners effective January 5, 2024. The Credit Agreement provides for a $125,000 asset-based revolving credit facility (ABL Facility), with an option to increase the revolving commitment by an additional $40,000. A portion of the ABL Facility, limited to $5,000, is available for the issuance of letters of credit. The Credit Agreement has a three-year term and expires January 5, 2027. Amounts available to be drawn from time to time under the ABL Facility are determined by calculating the applicable borrowing base, which is based upon applicable percentages of the values of eligible accounts receivable, eligible inventory, eligible liquid assets, less reserves as determined by the Administrative Agent, all as specified in the Credit Agreement. The borrowings bear interest at a rate per annum equal to, at the Company's election: (i) an alternate base rate (ABR) plus an applicable margin or (ii) an adjusted term secured overnight financing rate (SOFR) plus an applicable margin. As of September 30, 2025, the Company has borrowed $61,865, classified as noncurrent and had unused borrowing availability of $61,885.
Our corporate headquarters lease agreement requires a $1,250 letter of credit which we renew annually and remains outstanding as of September 30, 2025.
For additional information on the terms and conditions, as well as applicable interest and fee payments, see Note 6 – Borrowings and Financing Obligation.
Uses of liquidity and capital resources. Our executive officers and Board of Directors review our funding sources and future capital requirements in connection with our annual operating plan and periodic updates to the plan. Our principal cash requirements include costs of operations, capital expenditures, debt service costs and other contractual obligations. Our future capital requirements depend on a number of factors, including, without limitation: market acceptance of our current and future products; costs to develop and support our products, including professional training; costs to expand and support our sales and marketing efforts; operating and filing costs relating to changes in regulatory policies or laws; costs for clinical trials and to secure regulatory approval for new products; costs to prosecute, defend and enforce our intellectual property rights; costs to defend against and/or resolve litigation or claims against us; maintenance and enhancements to our information systems and security; and possible acquisitions and joint ventures, including potential business integration costs. We continue to evaluate additional measures to maintain financial flexibility, and we will continue to closely monitor macroeconomic conditions including, but not limited to, inflationary pressures, rising interest rates, tariffs, and fluctuations in currency exchange rates that may impact our liquidity and access to capital resources.
Critical Accounting Policies and Estimates
Our discussion and analysis of our financial condition and results of operations is based upon our financial statements, which have been prepared in accordance with accounting principles generally accepted in the United States of America (GAAP). The preparation of financial statements requires management to make estimates and judgments that affect the reported amounts of assets and liabilities, revenue and expenses and disclosures of contingent assets and liabilities at the date of the financial statements. On a periodic basis, we evaluate our estimates, including those related to sales returns and allowances, inventories, share-based compensation and income taxes. We use authoritative pronouncements, historical experience and other assumptions as the basis for making estimates. Actual results could differ from those estimates under different assumptions or conditions. Our Annual Report on Form 10-K for the fiscal year ended December 31, 2024 includes additional information about the Company, our operations, our financial position and our critical accounting policies and estimates and should be read in conjunction with this Quarterly Report on Form 10-Q.
Recent Accounting Pronouncements
Refer to Note 1, “Description of the Business and Summary of Significant Accounting Policies” to the condensed financial statements for a discussion of recently issued accounting pronouncements.
Item 3. Quantitative and Qualitative Disclosures About Market Risk
As of September 30, 2025, there were no material changes to the information provided under Item 7A, “Quantitative and Qualitative Disclosures About Market Risk” in the Company’s Form 10-K for the year ended December 31, 2024.
The Company’s management, with the participation of the President and Chief Executive Officer (the Principal Executive Officer) and Chief Financial Officer (the Principal Accounting and Financial Officer), has evaluated the effectiveness of the Company’s disclosure controls and procedures, as defined in Rules 13(a) -15(e) and 15(d) -15(e) of the Securities Exchange Act of 1934 as amended (Exchange Act), as of the end of the period covered by this report. Based on this evaluation, we concluded that, as of the end of the period covered by this report, our disclosure controls and procedures were effective in providing reasonable assurance that information required to be disclosed by us in the reports we file or submit under the Exchange Act is recorded, processed, summarized and reported within the time periods specified in the SEC’s forms and rules, and the material information relating to the Company is accumulated and communicated to management, including the President and Chief Executive Officer and the Chief Financial Officer, as appropriate, to allow timely decisions regarding required disclosures.
Control systems, no matter how well designed and operated, can provide only reasonable, not absolute, assurance that control objectives are met. Because of inherent limitations in all control systems, no evaluation of controls can provide assurance that all control issues and instances of fraud, if any, within a company will be detected. Additionally, controls can be circumvented by individuals, by collusion of two or more people or by management override. Over time, controls can become inadequate because of changes in conditions or the degree of compliance may deteriorate. Further, the design of any system of controls is based in part upon assumptions about the likelihood of future events. There can be no assurance that any design will succeed in achieving its stated goals under all future conditions. Because of the inherent limitations in any cost-effective control system, misstatements due to errors or fraud may occur and not be detected.
Changes in Internal Control Over Financial Reporting
In the ordinary course of business, we routinely enhance our information systems by either upgrading current systems or implementing new ones. There were no changes in our internal control over financial reporting that occurred during the three months ended September 30, 2025 that have materially affected, or are reasonably likely to materially affect, our internal control over financial reporting.
PART II. OTHER INFORMATION
Item 1. Legal Proceedings
Information with respect to legal proceedings can be found under the heading “Legal” in Note 8 – Commitments and Contingencies to the Condensed Consolidated Financial Statements in Part I, Item 1 of this Quarterly Report on Form 10-Q, and is incorporated herein by reference.
Item 1A. Risk Factors
In addition to the other information set forth in this report, careful consideration should be given to the factors discussed in Item 1A, “Risk Factors” in our Form 10-K for the year ended December 31, 2024, which could materially affect our business, financial condition or future results. The risks described therein are not the only risks facing us. Additional risks and uncertainties not currently known to us, or that we currently deem to be immaterial, also may adversely affect our business, financial condition and/or operating results. There have been no material changes with respect to the risk factors previously disclosed in our Annual Report on Form 10-K for the year ended December 31, 2024, as amended by risk factors provided in our Form 10-Q for the quarter ended March 31, 2025 which are incorporated herein by reference.
Item 5. Other Information
During the three months ended September 30, 2025, none of our executive officers or directors adopted,terminated or modified a "Rule 10b5-1(c) trading arrangement" or a “non-Rule 10b5-1 trading arrangement” (as each term is defined in Item 408 of Regulation S-K).
Pursuant to the requirements of the Securities Exchange Act of 1934, the Registrant has duly caused this report to be signed on its behalf by the undersigned, thereunto duly authorized.