 October 28, 2014
2014 STOCKHOLDER OUTREACH
SUMMARY OF EXECUTIVE COMPENSATION PROGRAM |
UNITED STATES
SECURITIES AND EXCHANGE COMMISSION
Washington, D.C. 20549
SCHEDULE 14A
(Rule 14a-101)
Proxy Statement Pursuant to Section 14(a) of the
Securities Exchange Act of 1934
(Amendment No. )
Filed by the Registrant x Filed by a Party other than the Registrant ¨
Check the appropriate box:
| ¨ | Preliminary Proxy Statement | |
| ¨ | Confidential, for Use of the Commission Only (as permitted by Rule 14a-6(e)(2)) | |
| ¨ | Definitive Proxy Statement | |
| x | Definitive Additional Materials | |
| ¨ | Soliciting Material Pursuant to §240.14a-12 | |
SOLERA HOLDINGS, INC.
(Name of Registrant as Specified In Its Charter)
(Name of Person(s) Filing Proxy Statement, if other than the Registrant)
Payment of Filing Fee (Check the appropriate box):
| x | No fee required. | |||
| ¨ | Fee computed on table below per Exchange Act Rules 14a-6(i)(1) and 0-11. | |||
| (1) | Title of each class of securities to which transaction applies:
| |||
| (2) | Aggregate number of securities to which transaction applies:
| |||
| (3) | Per unit price or other underlying value of transaction computed pursuant to Exchange Act Rule 0-11 (set forth the amount on which the filing fee is calculated and state how it was determined):
| |||
| (4) | Proposed maximum aggregate value of transaction:
| |||
| (5) | Total fee paid:
| |||
| ¨ | Fee paid previously with preliminary materials. | |||
| ¨ | Check box if any part of the fee is offset as provided by Exchange Act Rule 0-11(a)(2) and identify the filing for which the offsetting fee was paid previously. Identify the previous filing by registration statement number, or the Form or Schedule and the date of its filing. | |||
| (1) | Amount Previously Paid:
| |||
| (2) | Form, Schedule or Registration Statement No.:
| |||
| (3) | Filing Party:
| |||
| (4) | Date Filed:
| |||
| October 28, 2014
2014 STOCKHOLDER OUTREACH
SUMMARY OF EXECUTIVE COMPENSATION PROGRAM |
 SAFE
HARBOR STATEMENT Statements
in
this
presentation
that
are
not
reported
financial
results
or
other
historical
information
are
“forward-looking
statements”
within
the
meaning
of
the
Private
Securities
Litigation
Reform
Act
of
1995.
These
statements
relate
to
analyses
and
other
information
that
are
based
on
forecasts
of
future
results
and
estimates
of
amounts
not
yet
determinable
and
historical
results
or
performance
that
may
suggest
trends
for
our
business.
These
forward-looking
statements
include
statements
about:
Mission
2020,
including
our
ability
to
achieve
Mission
2020;
our
acquisition
strategy;
our
ability
to
continue
to
diversify
our
business;
geographic
expansion;
operating
benefits
emanating
from
our
capital
structure; realizable compensation associated with the Mission 2020 Awards and
historical results that may suggest trends for our business, including our
completed acquisitions, revenue and Adjusted EBITDA results, stockholder returns, our financial and operating performance
relative to our peer group companies and total direct compensation. These
forward-looking statements are based on current plans, estimates
and
expectations,
and
are
not
guarantees
of
future
performance.
They
are
based
on
management’s
expectations
that
involve
a
number
of
business risks and uncertainties, any of which could cause actual results to differ
materially from those expressed in or implied by the forward-
looking
statements.
Factors
that
could
cause
actual
results
to
differ
materially
from
the
forward-looking
statements
include,
but
are
not
limited
to:
our reliance on a limited number of customers for a substantial portion of our
revenues; unpredictability and volatility of our operating results, which
include the volatility associated with foreign currency exchange risks, our sales cycle, seasonality, global economic conditions,
acquisitions and other factors; risks associated with the uncertainty in and
volatility of global economic conditions; risks associated with and possible
negative consequences of acquisitions, joint ventures, divestitures and similar transactions, including regulatory matters and our ability
to successfully integrate our acquired businesses; we may not complete any
subsequent acquisitions of additional equity interests of our Service Repair
Solutions joint venture ("SRS"); the failure to realize the expected benefits from SRS or our investment in or subsequent
acquisition of SRS; our inability to successfully integrate SRS's business,
including SRS's existing employees, infrastructure and service
offerings,
with
our
existing
businesses
at
reasonable
cost,
or
at
all;
our
inability
to
pay
(or
finance,
as
applicable)
the
call
price
or
put
prices
for
additional equity interests in SRS at our expected cost, or at all, and the
possible reduction in our cash balance or increase in outstanding debt after
payment of such call price or put prices; risks associated with entering new
business segments with which we have limited experience or successful
integration of acquired businesses that operate in industries outside of our core market; effects of competition on our software and
service pricing and our business; time and expenses associated with customers
switching from competitive software and services to our software
and
services;
rapid
technology
changes
in
our
industry;
risks
associated
with
operating
in
multiple
countries;
risks
associated
with
a
diversified business; effects of changes in or violations by us or our customers of
government regulations; use of cash to service our debt and effects
on
our
business
of
restrictive
covenants
in
our
bond
indentures;
our
ability
to
obtain
additional
financing
as
necessary
to
support
our
operations, including Mission 2020; our reliance on third-party information for
our software and services; costs and possible future losses or impairments
relating to our acquisitions; the financial impact of future significant restructuring and severance charges; the impact of changes in
our tax provision (benefit) or effective tax rate; our ability to pay dividends or
repurchase shares in future periods; our dependence on a limited number of
key personnel; effects of system failures or security breaches on our business and reputation; and any material adverse impact of
current or future litigation on our results or business, including litigation with
Mitchell International; and other risks and uncertainties that could impact
our operations or financial results and cause our results to differ
materially from those in the forward-looking statements described in our
filings
with
the
Securities
and
Exchange
Commission,
particularly
our
Annual
Report
on
Form
10-K
for
the
year
ended
June
30,
2014.
We
undertake
no
obligation
to
publicly
update
or
revise
any
forward-looking
statement.
This
presentation
includes
a
calculation
of
Adjusted
EBITDA,
a
non-GAAP
financial
measure
that
is
different
from
financial
measures
calculated
in
accordance
with
GAAP
and
may
be
different
from
calculations
of
Adjusted
EBITDA
made
by
other
companies.
A
quantitative
reconciliation
of
Adjusted
EBITDA
to
Net
Income
and
Adjusted
Net
Income
to
GAAP
Net
earnings,
the
most
directly
comparable
GAAP
financial
measures,
was
previously
included
in
our
Q4
fiscal
year
2014
earnings release issued on August 26, 2014.
2 |
 Update to
Mission 2020 Mission 2020
$2 billion in revenue and $800 million (subsequently revised to $840 million in Aug
2014) in Adjusted EBITDA by FY2020.
•
Requires significant and long-term commitment to grow the
business. •
Publicly announced in FY13.
•
Uncommon
for
companies
to
publicly
announce
such
long
term
growth
initiatives.
How do we drive the growth required to achieve Mission 2020 and mitigate
risk? •
LDD Strategy:
Leverage
our core business,
Diversify
into new markets and geographies, and
Disrupt
the market with investments in new technologies and businesses.
Mission 2020 Growth Requirements.
•
Based on our FY13 step-off rate (on a straight-line basis):
Requires revenue CAGR of 13.2%, and
Requires Adjusted EBITDA (at $800M) CAGR of 11.6%.
•
Based on our FY14 step-off rate (on a straight-line basis):
Requires revenue CAGR of 12.5%, and
Requires Adjusted EBITDA (at $840M) CAGR of 12.5%.
•
Phase
1
of
Mission
2020
(FY14
through
FY17)
–
“investment
phase”.
Including
this
investment,
annual
Adjusted
EBITDA
targets
during
Phase
1
require
growth
that
is
comparable
to
our
10.9%
compounded
annual
growth
for
three
fiscal
years
ended
June
30,
2013.
3 |
 FY 2014
Accomplishments Solera
and
NEOs
delivered
strong
operating
results
and
strategic
results
in
FY14:
•
On a constant currency basis:
Grew
revenue
by
16.8%
FY13 revenue growth over FY12 results was 8.5%.
Grew
Adjusted
EBITDA
by
11.3%
over
FY13
results.
FY13 Adjusted EBITDA growth over FY12 results was 6.7%.
Adjusted
EBITDA
margin
was
42.2%
•
Completed seven acquisition transactions and announced two additional acquisition
transactions that were completed in Q1 2015, which:
Contributed approximately $242 million in annual revenue on a run-rate basis,
Strengthened
our
core
business,
and
Diversified
our
portfolio
of
businesses.
Mitigates business risk by reducing reliance on any one market or solution.
Entered
new
market
segments
(ex:
SMR,
property
and
glass
claims)
and
five
new
geographic
markets.
Non-claims revenue in FY14 was 39% of total revenue vs 27% of total revenue in
FY13. •
Completed senior notes offerings totaling $1 billion, enabling us to redeem $850 million of existing notes.
More flexible covenant package provides additional freedom to operate to
facilitate Mission 2020. •
Increased
FY14
annualized
dividend
by
36%
vs
FY13
dividend
•
Returned
to
stockholders
about
$75
million
in
value
through
dividends
and
stock
repurchases.
•
Delivered
a
TSR
of
22.0%
during
FY14,
bringing
our
five-year
compound
annual
TSR
to
22.5%.
4
(despite increased investments in the business).
over
FY13
results. |
 Culture
of Meritocracy. •Well
known
and
understood
by
our
investors,
and
reflected
in
our
pay-
for-performance compensation philosophy, strategy and design.
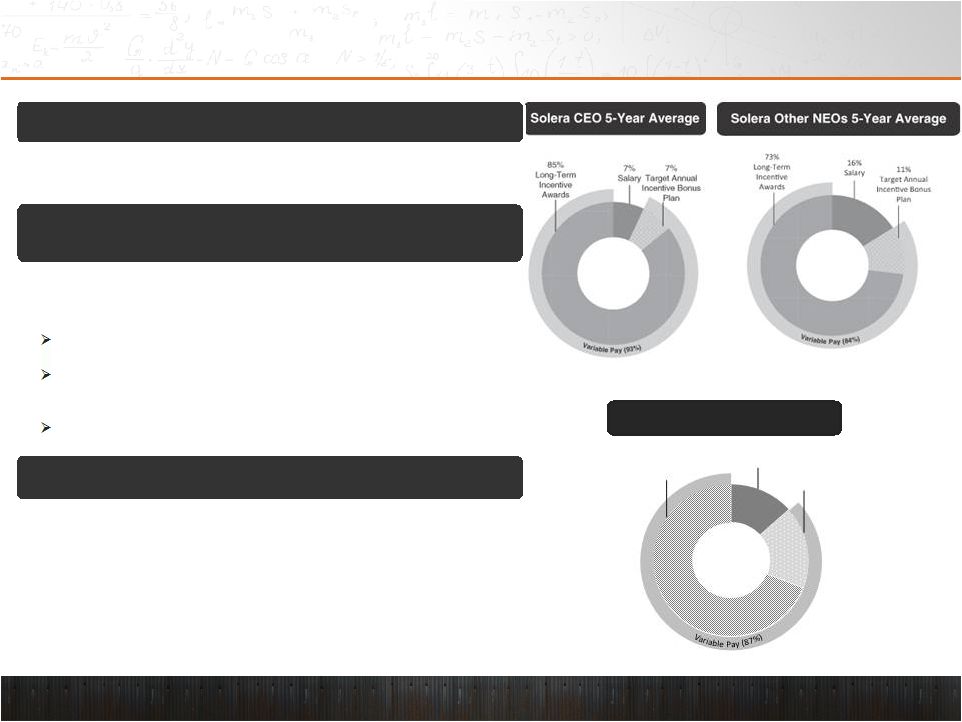
Variable vs Non-Variable Compensation.
•Non-Variable: Annual base salary.
•Variable: Annual cash bonus and LTI equity awards.
•CEO compensation (during the last five years):
93% variable vs 87% variable for similar positions in our FY15
peer group.
79% specific to performance-based equity awards or stock
options vs only 52% for FY15 peer group.
•Other NEOs (during the last five years):
84%
variable
-
Similar
strong
emphasis
on
performance-based
equity awards and stock options.
Other Effective Design Components.
•Balance
of
performance
metrics
-
shareholder
return
relative
to
peers, revenue and adjusted EBITDA growth, and ROIC.
•Severance and almost all equity awards are “double trigger”.
•No tax gross-ups in the event of a change-in-control.
•Stock ownership guidelines for all NEOs.
•NEOs subject to clawback policy.
Our Pay for Performance Philosophy, Strategy and Design
Peer Group CEOs
5
-Term
13%
Salary
18%
Annual Target
Bonus
69%
Long
Incentive
Awards |
 NEO Pay at
a Glance CEO Pay
•
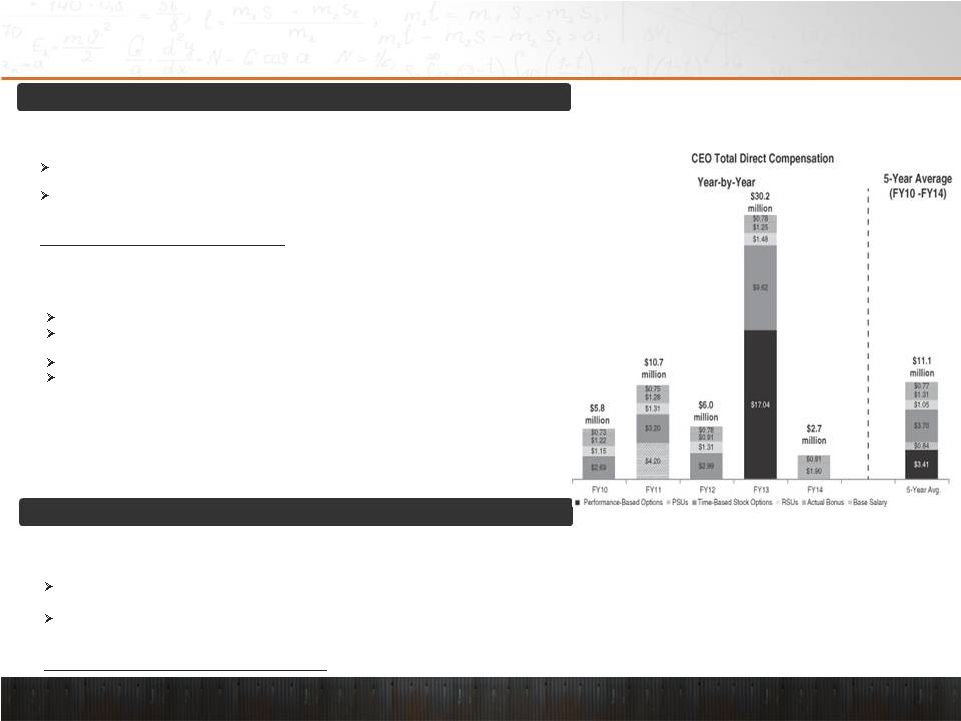
$2.7
million
–
CEO
FY14
total
direct
compensation
(“TDC”)
reported
in
proxy
statement.
•
Consists of base salary and annual cash incentive.
•
No equity awards granted to CEO in FY14.
Mission 2020 Awards are by design significant relative to competitive practice for
annual awards.
In
recognition
of
this
dynamic,
the
Committee
does
not
intend
to
grant
any
additional
equity
to
the CEO until Q4 of FY16.
CEO
FY14
TDC
was
well
below
the
median
for
similarly
situated
positions
at
peers.
Average
CEO
TDC
during
five
years
ended
June
30,
2014
–
$11.1
million.
•
TDC not a reflection of realizable compensation.
•
FY11:
Road
to
$1
Billion
PSUs
granted
(40%
of
TDC).
Due
to
tough
relative
TSR
performance
hurdles,
only
4%
of
PSUs
were
earned
and
96%
of
the
PSUs
were
forfeited.
FY13:
Mission
2020
Awards
granted
(80%
of
TDC).
The FY14 tranche of the Mission 2020 Awards has not been earned as relative TSR vesting
hurdle has not yet been achieved.
Other NEOs Pay
•$730,000
to
$1.3
million
–
Other
NEO
FY14
TDC.
•Consists of base salary and annual cash incentive payment.
•No equity awards granted to Other NEOs in FY14.
Mission 2020 Awards granted to the Other NEOs represented a portion of their equity
awards associated with Mission 2020.
Other NEO equity awards granted in October 2014 represent the balance of the
equity award opportunity associated with Mission 2020 and take into consideration
the increased Adjusted EBITDA target for Mission 2020.
•Other
NEOs’
TDC
was
well
below
the
median
for
similarly
situated
positions
at
peers.
6
The Committee remains committed to ensuring that CEO compensation design and
opportunities are aligned with retaining and motivating Mr. Aquila to continue his
strong performance and contributions.
Highest TDC years were FY11 and FY13
•
Realizable compensation does not approach summary compensation table value
until stock price reaches mid-$70s. See Annex B.
|
 2013
Annual Meeting and Say-on-Pay Vote; Stockholder Engagement 2013
Annual Meeting Results. •Approx. 51.5% of the votes cast were cast FOR
MSOP. •Down from about 94% of the votes cast FOR MSOP at our 2012 Annual
Meeting. Stockholder Outreach.
•We engaged in a concerted stockholder outreach effort during FY14 and
FY15. Ensure stockholders were being heard and to address their
concerns. Connected with stockholders representing approximately 72% of
outstanding shares (including 17 of our 20 largest investors).
Consistent Feedback Themes from Stockholders.
•Consistent Theme No. 1: Consider a different financial metric as a new
vesting hurdle for the Mission 2020 Awards. •Consistent
Theme
No.
2:
Too
many
of
the
executive
comp
program’s
performance-based
elements
include
Adjusted
EBITDA.
Committee Responses to Consistent Feedback Themes.
•ROIC Vesting hurdle (approved by Committee October 1, 2014):
ROIC is an additional vesting hurdle, rather than simply replacing an
existing hurdle. Accordingly, the final three tranches of the
Performance-Based Awards require that three vesting hurdles be achieved to earn the
awards
–
Adjusted
EBITDA;
Relative
TSR
(which
requires
60
th
percentile
performance);
and
ROIC.
See Annex A for an illustration of the interplay between the three vesting hurdles
for the final three tranches of the Performance- Based Awards.
•The Performance-Based Awards require exceptional performance to be
earned. Example:
We
achieved
the
Adjusted
EBITDA
vesting
hurdle
for
the
FY14
tranche
and
achieved
TSR
of
22%
in
FY14;
we
have
not
achieved
the
applicable
required
Relative
TSR
vesting
hurdle
Therefore,
this
tranche
has
not
yet
vested.
NEO and Investor Interests are Aligned.
•Mission 2020 Awards are stock options with an exercise price of $58.33.
•NEOs
will
only
realize
value
as
stock
price
appreciates,
aligning
the
interests
of
the
NEOs
and
our
investors.
7 |
 Other
Feedback
from
Stockholder
Advisory
Firms
and
Investors
and
Our
Responses
Topic: NEO compensation opportunities exceed peer median levels.
•
Performance
has
historically
exceeded
peer
median
levels,
supporting
above-median
pay.
•
CEO’s FY14 TDC was well below the median for peers.
•
Rigorous performance-based compensation:
Example -
Only 4% of the Road to $1 Billion PSUs were earned and 96% were forfeited.
Example -
FY14 tranche of the Mission 2020 Awards has not been earned.
•
NEOs were not granted any equity awards during FY14.
•
We
do
more
with
less
–
Only
three
NEOs
each
with
roles
that
are
broader
than
their
peers.
Similar
dynamic
exists
across
all
management
levels
at
Solera
Result
=
Aggregate
compensation
expense
remains
modest.
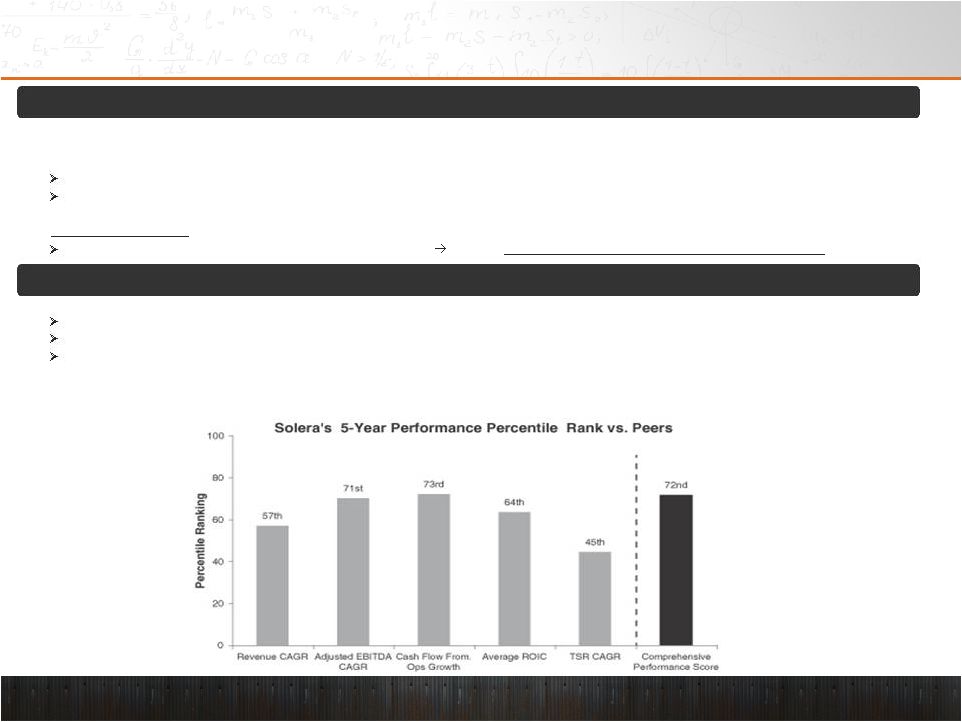
Topic: CEO pay and Company performance are not aligned.
Comprehensive approach
pay-for-performance alignment, focusing on:
Long-term performance
(five years versus three years or one year);
Evaluation of performance metrics in addition to TSR; and
Realizable compensation versus TDC
calculated in accordance with SEC regulations.
•
CEO
realizable
compensation
approximated
the
90
percentile,
our
comprehensive
performance
approximated
the
72
percentile
and
our
stockholder
value
created
approximated
the
69
percentile.
•
Difference
of
25
points
or
less
between
realizable
compensation
and
comprehensive
performance
score
suggests
reasonable
alignment.
8
th
th
nd |
 Other
Feedback
from
Stockholder
Advisory
Firms
and
Investors
and
Our
Responses
Topic: Mission 2020 Awards have multiple vesting opportunities.
•Mission 2020 is an eight-year performance period
that requires growth and investment to facilitate that growth.
•Performance outcomes may be volatile in the short/medium term,
especially in regards to acquisitions, their timing and impact on our results.
•Provides ongoing incentive to achieve clear financial performance
hurdles and create stockholder value, even if early hurdles are missed.
•Progressively
higher
Adjusted
EBITDA
vesting
hurdles
–
require
an
aggressive
performance
path
and
value
creation.
•Relative
TSR
hurdles
and
the
ROIC
hurdles
reinforce
alignment
with
our
stockholders’
interests.
•Performance-Based Awards vest only if all of the vesting hurdles are
achieved. Topic: Maximum discretionary multiplier has been applied to
the CEO’s annual cash incentive. •Discretionary multiplier
provides an opportunity to recognize performance beyond that which is captured by our ABIP.
Examples: market segment and geographic diversification; business risk
mitigation; M&A execution and integration; product research and
development;
management
development
and
succession
planning;
and
enhancements
to
capital
structure.
•Discretion may be applied to either increase or decrease
compensation. •Discretion requires Committee to conduct a more
thorough assessment of CEO performance than what is captured by financial formulae.
9 |
 Conclusion and Takeaways
10
Road to $1B Awards: Relative TSR performance hurdles.
Mission 2020 Awards: Relative TSR and ROIC performance hurdles; awards are stock
options. CEO and Other NEOs’
FY14 TDC well below the median.
No equity awards granted to NEOs during FY14.
CEO compensation:
Road to $1B PSUs -
due to rigorous relative TSR performance hurdles, only 4% of PSUs were earned and 96% of the PSUs were forfeited.
FY14 tranche of Mission 2020 Awards not earned
as relative TSR performance hurdle has not yet been achieved.
Based on our five-year measure of comprehensive performance and stockholder
value creation, CEO realizable pay and Company performance
are within relative alignment band.
Mission 2020 Awards: Added ROIC as an additional performance hurdle,
resulting in more rigorous performance standards
Other
Elements
of
Compensation
Program:
increased
dialogue
with
stockholders;
enhanced
explanations
of
Committee
decisions
and
rationales. |
 11
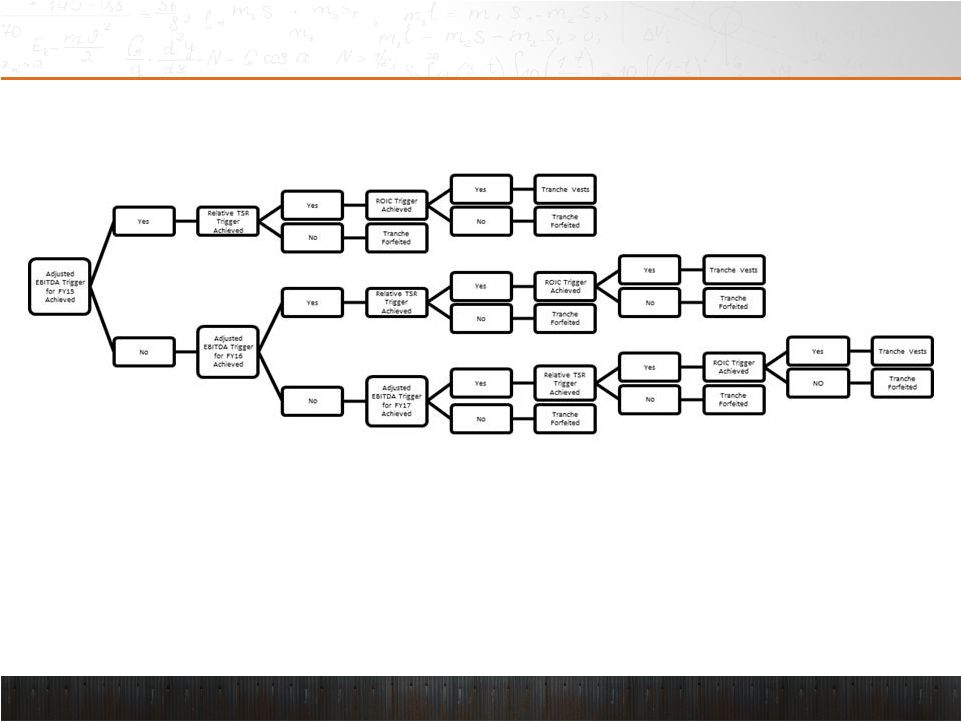
Annex A – Mission 2020 Vesting Hurdles for Second Tranche of Performance-Based Awards ROIC
Trigger– Achieve ROIC in excess our weighted average
cost of capital plus a one percent premium. ROIC Trigger must be achieved when either the
applicable Adjusted EBITDA Vesting Trigger or the applicable Relative
TSR Trigger is achieved. Relative TSR Trigger
–
Achieve greater than 60th percentile TSR rank vs. the S&P 400
midcap index constituents. Beginning point for all measurements is
March
29, 2013 and measurements consider 20 trading day trailing average
stock price. Ending date for measurement may be any 20 trading day period
ending the first day of the fiscal year (July 1) following the
applicable tranche (e.g., July 1, 2015 following the second tranche) or ending any day thereafter
through March
29, 2020.
Adjusted EBITDA
–
Calculated in a manner identical to the Adjusted EBITDA calculation in
our earnings press releases, except that we deduct non-
controlling interests as required by the Performance-Based Award
Agreement. |
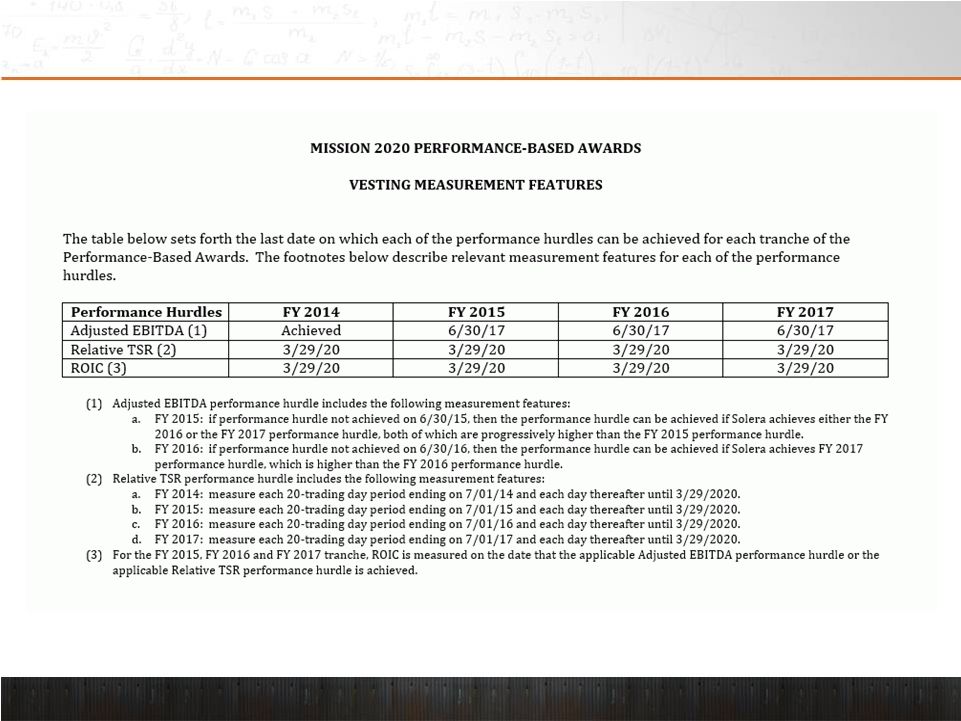 Annex
B
–
Mission
2020
Performance-Based
Awards
12 |
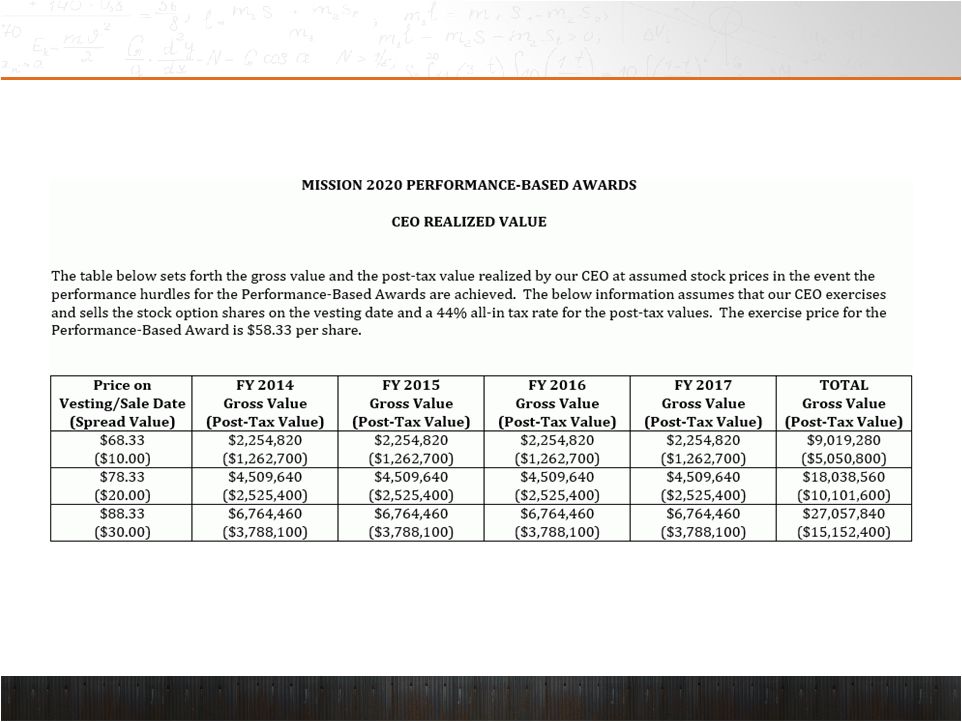 Annex B
– (continued)
13 |