| 2025 Third Quarter Financial Results November 5, 2025 NYSE: CF |
| Safe harbor statement All statements in this presentation by CF Industries Holdings, Inc. (together with its subsidiaries, the “Company”), other than those relating to historical facts, are forward-looking statements. Forward-looking statements can generally be identified by their use of terms such as “anticipate,” “believe,” “could,” “estimate,” “expect,” “intend,” “may,” “plan,” “predict,” “project,” “will” or “would” and similar terms and phrases, including references to assumptions. Forward-looking statements are not guarantees of future performance and are subject to a number of assumptions, risks and uncertainties, many of which are beyond the Company’s control, which could cause actual results to differ materially from such statements. These statements may include, but are not limited to, statements about: strategic plans and management’s expectations with respect to the production of low-carbon ammonia, the development of carbon capture and sequestration projects, the transition to and growth of a hydrogen economy, greenhouse gas reduction targets, projected capital expenditures, statements about future financial and operating results, and other items described in this presentation. Important factors that could cause actual results to differ materially from those in the forward-looking statements include, among others: the Company’s ability to complete the projects at its Blue Point Complex, including the construction of a low-carbon ammonia production facility with its joint venture partners and scalable infrastructure on schedule and on budget or at all; the Company’s ability to fund the capital expenditure needs related to the joint venture at its Blue Point Complex, which may exceed its current estimates; the cyclical nature of the Company’s business and the impact of global supply and demand on the Company’s selling prices and operating results; the global commodity nature of the Company’s nitrogen products, the conditions in the global market for nitrogen products, and the intense global competition from other producers; announced or future tariffs, retaliatory measures, and global trade relations, including the potential impact of tariffs and retaliatory measures on the price and availability of materials for its capital projects and maintenance; conditions in the United States, Europe and other agricultural areas, including the influence of governmental policies and technological developments on the demand for its fertilizer products; the volatility of natural gas prices in North America and globally; weather conditions and the impact of adverse weather events; the seasonality of the fertilizer business; the impact of changing market conditions on the Company’s forward sales programs; difficulties in securing the supply and delivery of raw materials or utilities, increases in their costs or delays or interruptions in their delivery; reliance on third party providers of transportation services and equipment; the Company’s reliance on a limited number of key facilities; risks associated with cybersecurity; acts of terrorism and regulations to combat terrorism; the significant risks and hazards involved in producing and handling the Company’s products against which the Company may not be fully insured; risks associated with international operations; the Company’s ability to manage its indebtedness and any additional indebtedness that may be incurred; risks associated with changes in tax laws and adverse determinations by taxing authorities, including any potential changes in tax regulations and its qualification for tax credits; risks involving derivatives and the effectiveness of the Company’s risk management and hedging activities; potential liabilities and expenditures related to environmental, health and safety laws and regulations and permitting requirements; regulatory restrictions and requirements related to greenhouse gas emissions, including announced or future changes in environmental or climate change laws; the development and growth of the market for low-carbon ammonia and the risks and uncertainties relating to the development and implementation of the Company’s low-carbon ammonia projects; risks associated with investments in and expansions of the Company’s business, including unanticipated adverse consequences and the significant resources that could be required; and failure of technologies to perform, develop or be available as expected, including the low-carbon ATR ammonia production facility with carbon capture and sequestration technologies being constructed at its Blue Point Complex. More detailed information about factors that may affect the Company’s performance and could cause actual results to differ materially from those in any forward-looking statements may be found in CF Industries Holdings, Inc.’s filings with the Securities and Exchange Commission, including CF Industries Holdings, Inc.’s most recent annual and quarterly reports on Form 10-K and Form 10-Q, which are available in the Investor Relations section of the Company’s web site. It is not possible to predict or identify all risks and uncertainties that might affect the accuracy of our forward-looking statements and, consequently, our descriptions of such risks and uncertainties should not be considered exhaustive. There is no guarantee that any of the events, plans or goals anticipated by these forward-looking statements will occur, and if any of the events do occur, there is no guarantee what effect they will have on our business, results of operations, cash flows, financial condition and future prospects. Forward-looking statements are given only as of the date of this presentation and the Company disclaims any obligation to update or revise the forward-looking statements, whether as a result of new information, future events or otherwise, except as required by law. |
| Note regarding non-GAAP financial measures The Company reports its financial results in accordance with U.S. generally accepted accounting principles (GAAP). Management believes that EBITDA, adjusted EBITDA, free cash flow, free cash flow to adjusted EBITDA conversion, free cash flow yield and market cap to free cash flow, which are non-GAAP financial measures, provide additional meaningful information regarding the Company's performance and financial strength. Non-GAAP financial measures should be viewed in addition to, and not as an alternative for, the Company’s reported results prepared in accordance with GAAP. In addition, because not all companies use identical calculations, EBITDA, adjusted EBITDA, free cash flow, free cash flow to adjusted EBITDA conversion, free cash flow yield and market cap to free cash flow included in this presentation may not be comparable to similarly titled measures of other companies. Reconciliations of EBITDA, adjusted EBITDA, free cash flow and free cash flow yield to the most directly comparable GAAP measures are provided in the tables accompanying this presentation. EBITDA is defined as net earnings attributable to common stockholders plus interest expense (income)—net, income taxes and depreciation and amortization. Other adjustments include the elimination of the portion of interest income (expense)—net and the portion of depreciation and amortization that are included in noncontrolling interests, and loan fee amortization that is included in both interest and amortization. The Company has presented EBITDA because management uses the measure to track performance and believes that it is frequently used by securities analysts, investors and other interested parties in the evaluation of companies in the industry. Adjusted EBITDA is defined as EBITDA adjusted with the selected items as summarized in the tables accompanying this presentation. The Company has presented adjusted EBITDA because management uses adjusted EBITDA, and believes it is useful to investors, as a supplemental financial measure in the comparison of year-over-year performance. Free cash flow is defined as net cash provided by operating activities, as stated in the consolidated statements of cash flows, reduced by capital expenditures and distributions to noncontrolling interest plus contributions from noncontrolling interests. Free cash flow to adjusted EBITDA conversion is defined as free cash flow divided by adjusted EBITDA. Free cash flow yield is defined as free cash flow divided by market value of equity (market cap). Market cap to free cash flow (FCF) is defined as market cap divided by free cash flow. The Company has presented free cash flow, free cash flow to adjusted EBITDA conversion, free cash flow yield and market cap to free cash flow because management uses these measures and believes they are useful to investors, as an indication of the strength of the Company and its ability to generate cash and to evaluate the Company’s cash generation ability relative to its industry competitors. It should not be inferred that the entire free cash flow amount is available for discretionary expenditures. |
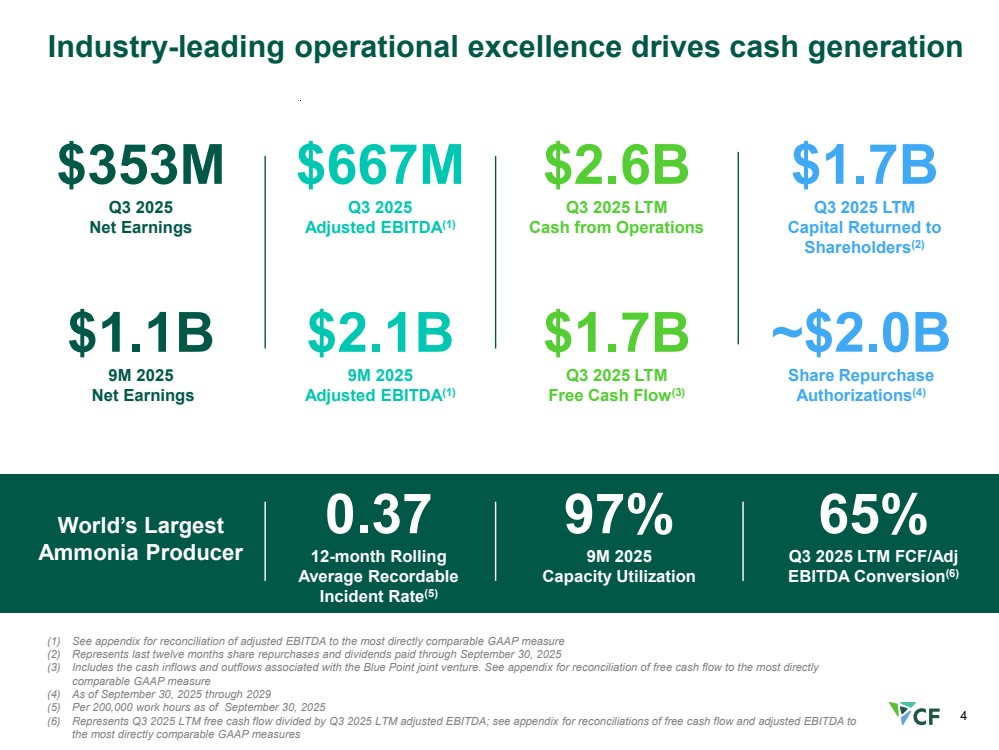
| 4 Industry-leading operational excellence drives cash generation (1) See appendix for reconciliation of adjusted EBITDA to the most directly comparable GAAP measure (2) Represents last twelve months share repurchases and dividends paid through September 30, 2025 (3) Includes the cash inflows and outflows associated with the Blue Point joint venture. See appendix for reconciliation of free cash flow to the most directly comparable GAAP measure (4) As of September 30, 2025 through 2029 (5) Per 200,000 work hours as of September 30, 2025 (6) Represents Q3 2025 LTM free cash flow divided by Q3 2025 LTM adjusted EBITDA; see appendix for reconciliations of free cash flow and adjusted EBITDA to the most directly comparable GAAP measures 97% 9M 2025 Capacity Utilization 0.37 12-month Rolling Average Recordable Incident Rate(5) World’s Largest Ammonia Producer 65% Q3 2025 LTM FCF/Adj EBITDA Conversion(6) $667M Q3 2025 Adjusted EBITDA(1) $2.1B 9M 2025 Adjusted EBITDA(1) $2.6B Q3 2025 LTM Cash from Operations $1.7B Q3 2025 LTM Free Cash Flow(3) $1.7B Q3 2025 LTM Capital Returned to Shareholders(2) ~$2.0B Share Repurchase Authorizations(4) $1.1B 9M 2025 Net Earnings $353M Q3 2025 Net Earnings |
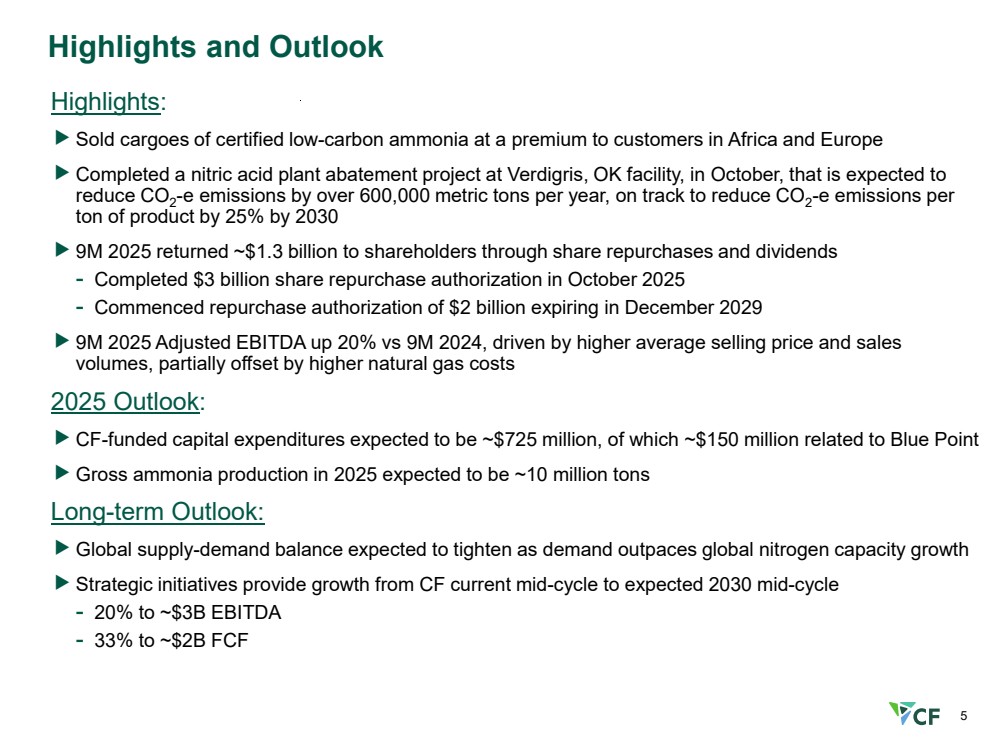
| 5 Highlights and Outlook Highlights: Sold cargoes of certified low-carbon ammonia at a premium to customers in Africa and Europe Completed a nitric acid plant abatement project at Verdigris, OK facility, in October, that is expected to reduce CO2-e emissions by over 600,000 metric tons per year, on track to reduce CO2-e emissions per ton of product by 25% by 2030 9M 2025 returned ~$1.3 billion to shareholders through share repurchases and dividends - Completed $3 billion share repurchase authorization in October 2025 - Commenced repurchase authorization of $2 billion expiring in December 2029 9M 2025 Adjusted EBITDA up 20% vs 9M 2024, driven by higher average selling price and sales volumes, partially offset by higher natural gas costs 2025 Outlook: CF-funded capital expenditures expected to be ~$725 million, of which ~$150 million related to Blue Point Gross ammonia production in 2025 expected to be ~10 million tons Long-term Outlook: Global supply-demand balance expected to tighten as demand outpaces global nitrogen capacity growth Strategic initiatives provide growth from CF current mid-cycle to expected 2030 mid-cycle - 20% to ~$3B EBITDA - 33% to ~$2B FCF |
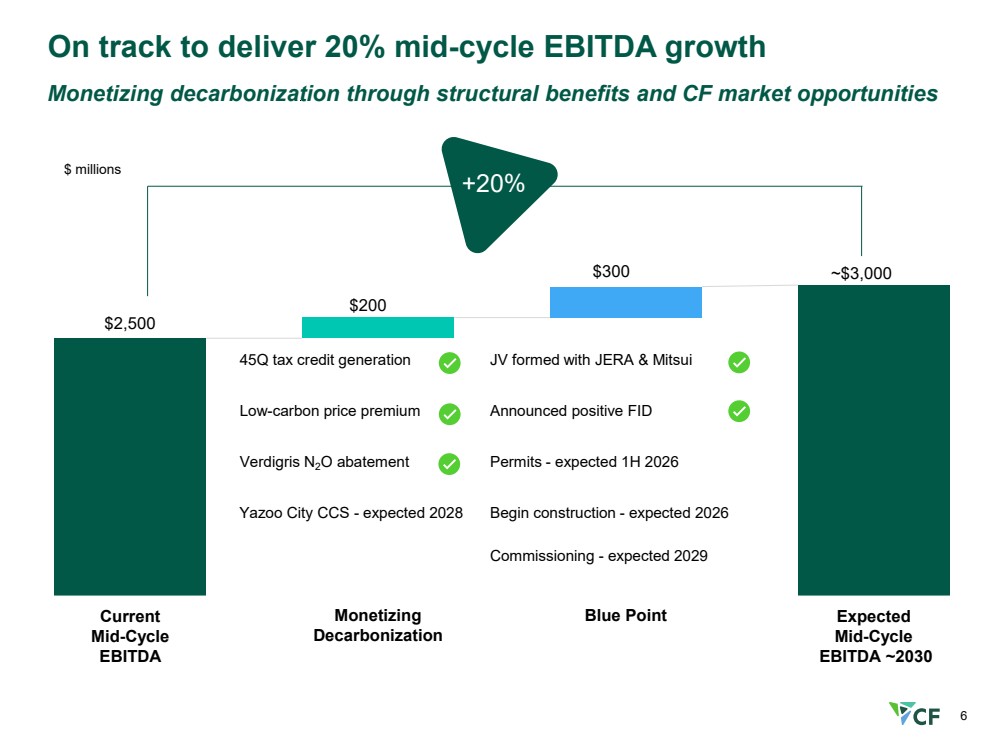
| 6 On track to deliver 20% mid-cycle EBITDA growth Current Mid-Cycle EBITDA Monetizing Decarbonization Blue Point Expected Mid-Cycle EBITDA ~2030 $ millions +20% $2,500 $200 $300 ~$3,000 45Q tax credit generation Low-carbon price premium Verdigris N2O abatement Yazoo City CCS - expected 2028 Announced positive FID JV formed with JERA & Mitsui Monetizing decarbonization through structural benefits and CF market opportunities Permits - expected 1H 2026 Commissioning - expected 2029 Begin construction - expected 2026 |
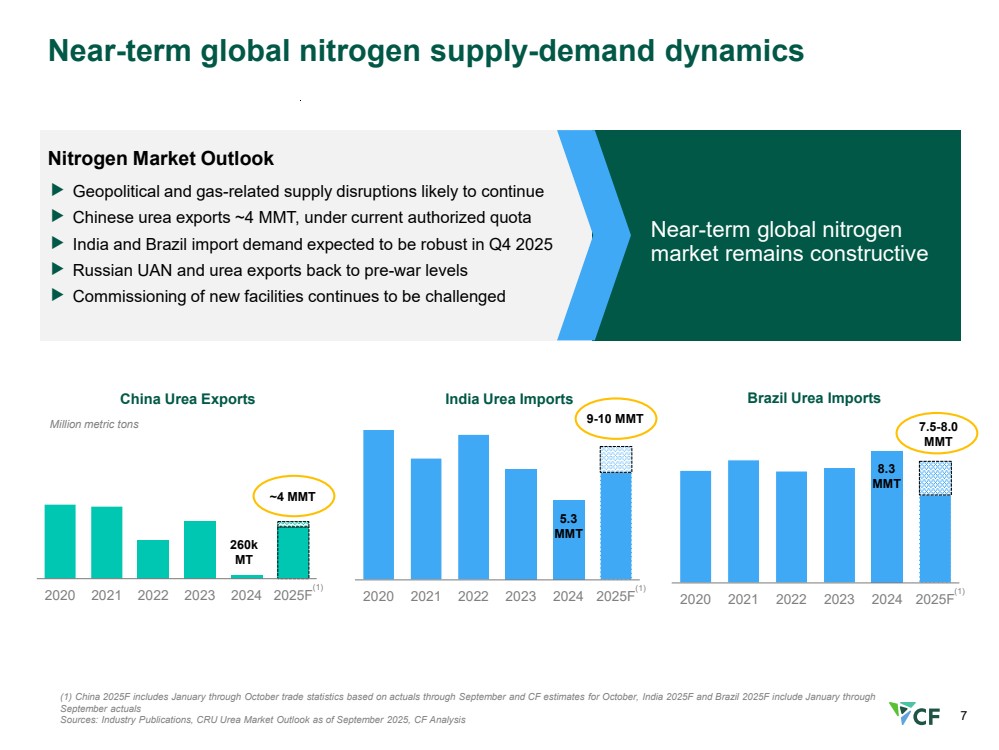
| 7 2020 2021 2022 2023 2024 2025F Near-term global nitrogen supply-demand dynamics (1) China 2025F includes January through October trade statistics based on actuals through September and CF estimates for October, India 2025F and Brazil 2025F include January through September actuals Sources: Industry Publications, CRU Urea Market Outlook as of September 2025, CF Analysis India Urea Imports 5.3 MMT 9-10 MMT 2020 2021 2022 2023 2024 2025F China Urea Exports Million metric tons 4.3 MMT ~4 MMT 2020 2021 2022 2023 2024 2025F Brazil Urea Imports 8.3 MMT Nitrogen Market Outlook Geopolitical and gas-related supply disruptions likely to continue Chinese urea exports ~4 MMT, under current authorized quota India and Brazil import demand expected to be robust in Q4 2025 Russian UAN and urea exports back to pre-war levels Commissioning of new facilities continues to be challenged 7.5-8.0 MMT 260k MT Near-term global nitrogen market remains constructive (1) (1) (1) |
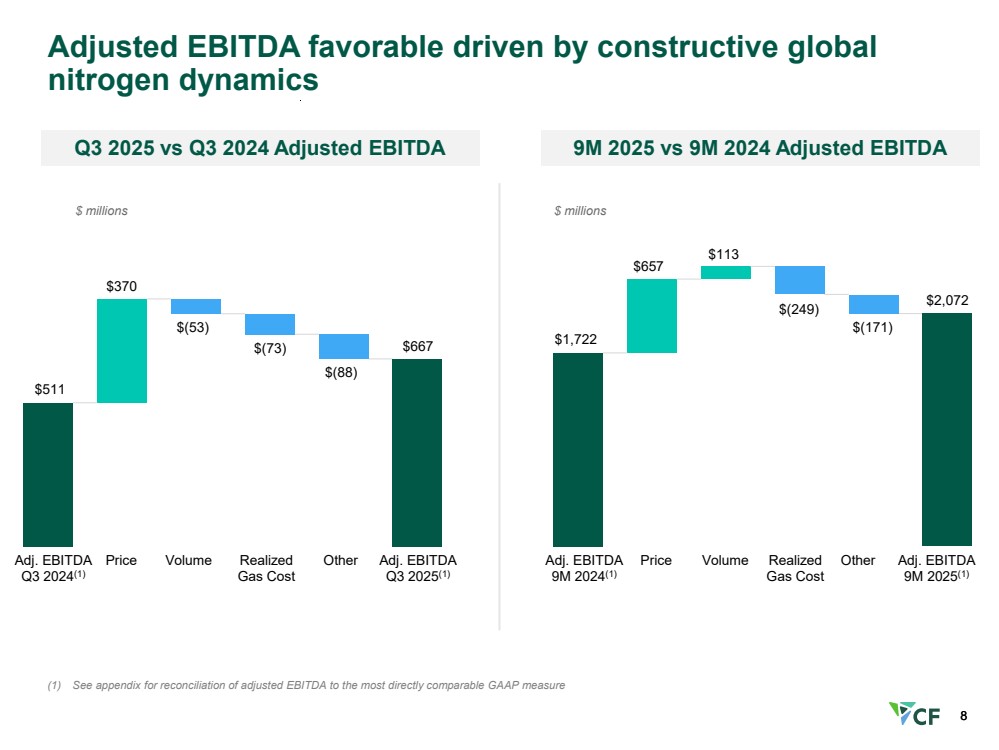
| 8 Adjusted EBITDA favorable driven by constructive global nitrogen dynamics (1) See appendix for reconciliation of adjusted EBITDA to the most directly comparable GAAP measure 8 Q3 2025 vs Q3 2024 Adjusted EBITDA $511 $370 $(53) $(73) $667 Adj. EBITDA Q3 2024(1) Price Volume Realized Gas Cost Adj. EBITDA Q3 2025(1) $ millions $(88) Other 9M 2025 vs 9M 2024 Adjusted EBITDA Adj. EBITDA 9M 2024(1) Price Volume Realized Gas Cost Adj. EBITDA 9M 2025(1) Other $1,722 $657 $113 $(249) $2,072 $(171) $ millions |
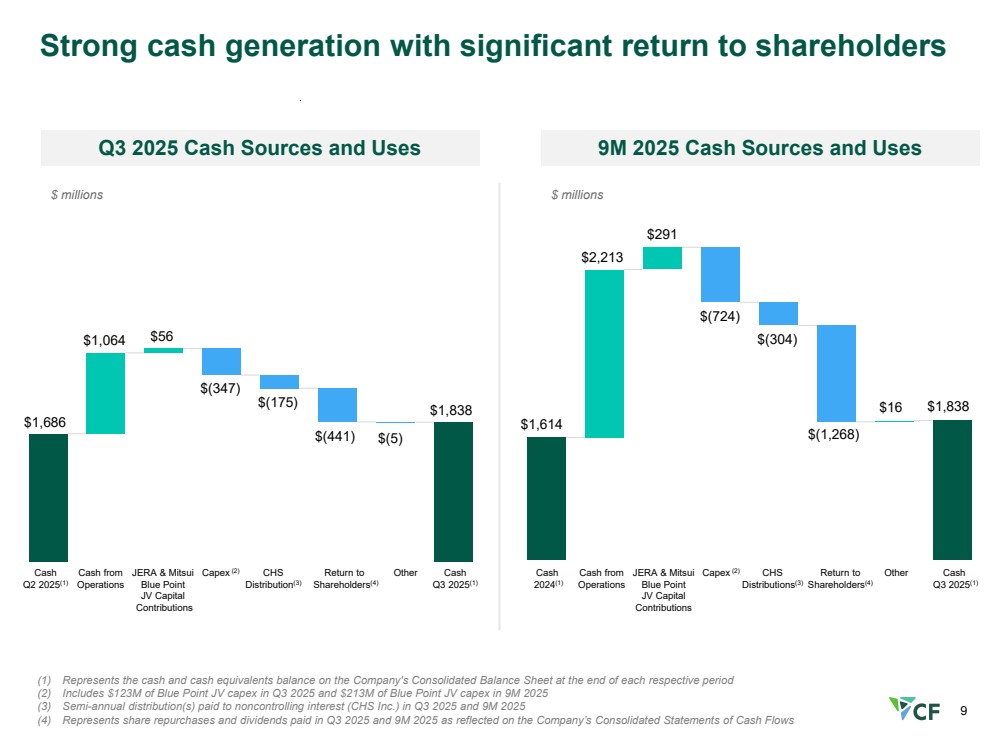
| 9 Strong cash generation with significant return to shareholders (1) Represents the cash and cash equivalents balance on the Company's Consolidated Balance Sheet at the end of each respective period (2) Includes $123M of Blue Point JV capex in Q3 2025 and $213M of Blue Point JV capex in 9M 2025 (3) Semi-annual distribution(s) paid to noncontrolling interest (CHS Inc.) in Q3 2025 and 9M 2025 (4) Represents share repurchases and dividends paid in Q3 2025 and 9M 2025 as reflected on the Company’s Consolidated Statements of Cash Flows $1,686 Cash Q2 2025(1) Cash from Operations Capex (2) Return to Shareholders(4) Other Cash Q3 2025(1) $1,838 $(441) $1,064 $(347) $(5) JERA & Mitsui Blue Point JV Capital Contributions $56 $(175) CHS Distribution(3) Cash 2024(1) Cash from Operations Capex (2) CHS Distributions(3) Return to Shareholders(4) Other Cash Q3 2025(1) JERA & Mitsui Blue Point JV Capital Contributions $1,614 $2,213 $291 $(724) $(304) $(1,268) $16 $1,838 $ millions $ millions Q3 2025 Cash Sources and Uses 9M 2025 Cash Sources and Uses |
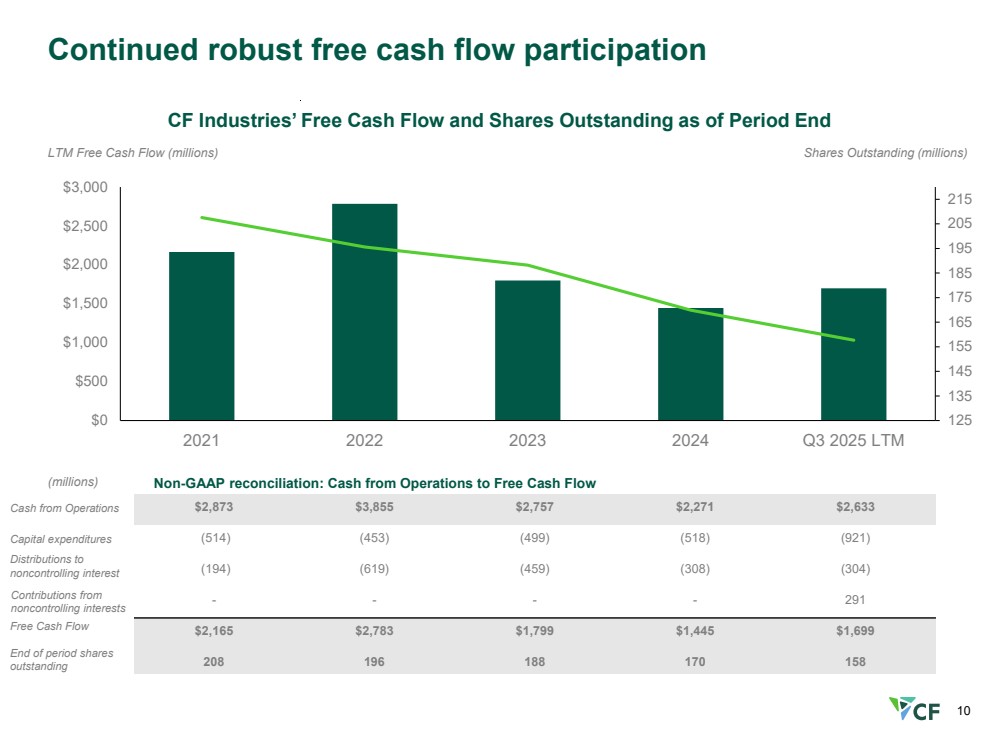
| 10 $2,873 $3,855 $2,757 $2,271 $2,633 (514) (453) (499) (518) (921) (194) (619) (459) (308) (304) - - - - 291 $2,165 $2,783 $1,799 $1,445 $1,699 208 196 188 170 158 LTM Free Cash Flow (millions) CF Industries’ Free Cash Flow and Shares Outstanding as of Period End Shares Outstanding (millions) 125 135 145 155 165 175 185 195 205 215 $0 $500 $1,000 $1,500 $2,000 $2,500 $3,000 2021 2022 2023 2024 Q3 2025 LTM Continued robust free cash flow participation End of period shares outstanding Cash from Operations Capital expenditures Distributions to noncontrolling interest Free Cash Flow (millions) Non-GAAP reconciliation: Cash from Operations to Free Cash Flow Contributions from noncontrolling interests |
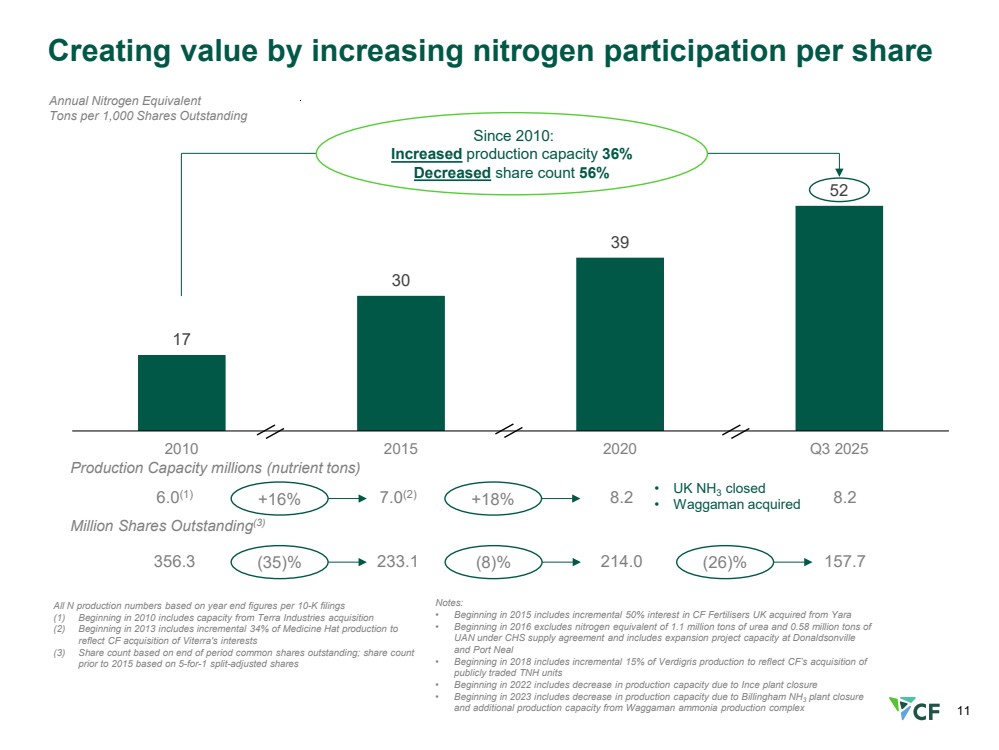
| 11 17 30 39 2010 2015 2020 Q3 2025 6.0(1) 7.0(2) 8.2 8.2 Production Capacity millions (nutrient tons) Annual Nitrogen Equivalent Tons per 1,000 Shares Outstanding Creating value by increasing nitrogen participation per share Million Shares Outstanding(3) Since 2010: Increased production capacity 36% Decreased share count 56% 356.3 233.1 214.0 157.7 +16% (35)% +18% (8)% (26)% • UK NH3 closed • Waggaman acquired Notes: • Beginning in 2015 includes incremental 50% interest in CF Fertilisers UK acquired from Yara • Beginning in 2016 excludes nitrogen equivalent of 1.1 million tons of urea and 0.58 million tons of UAN under CHS supply agreement and includes expansion project capacity at Donaldsonville and Port Neal • Beginning in 2018 includes incremental 15% of Verdigris production to reflect CF’s acquisition of publicly traded TNH units • Beginning in 2022 includes decrease in production capacity due to Ince plant closure • Beginning in 2023 includes decrease in production capacity due to Billingham NH3 plant closure and additional production capacity from Waggaman ammonia production complex All N production numbers based on year end figures per 10-K filings (1) Beginning in 2010 includes capacity from Terra Industries acquisition (2) Beginning in 2013 includes incremental 34% of Medicine Hat production to reflect CF acquisition of Viterra's interests (3) Share count based on end of period common shares outstanding; share count prior to 2015 based on 5-for-1 split-adjusted shares 52 |
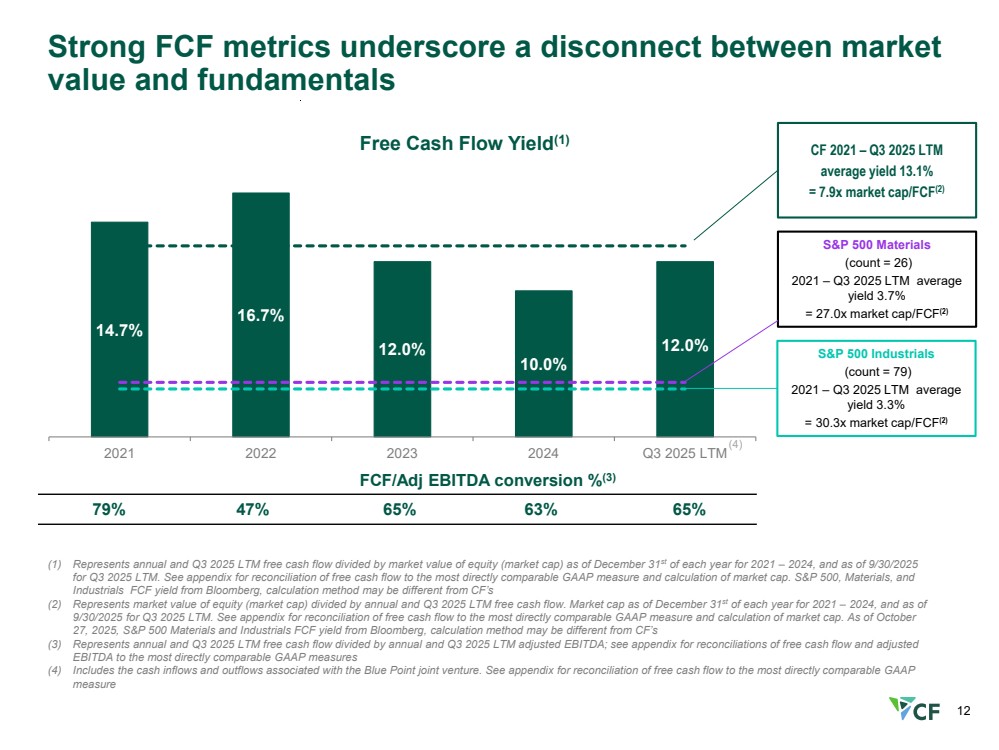
| 12 14.7% 16.7% 12.0% 10.0% 12.0% 2021 2022 2023 2024 Q3 2025 LTM Strong FCF metrics underscore a disconnect between market value and fundamentals Free Cash Flow Yield(1) FCF/Adj EBITDA conversion %(3) 79% 47% 65% 63% 65% (1) Represents annual and Q3 2025 LTM free cash flow divided by market value of equity (market cap) as of December 31st of each year for 2021 – 2024, and as of 9/30/2025 for Q3 2025 LTM. See appendix for reconciliation of free cash flow to the most directly comparable GAAP measure and calculation of market cap. S&P 500, Materials, and Industrials FCF yield from Bloomberg, calculation method may be different from CF’s (2) Represents market value of equity (market cap) divided by annual and Q3 2025 LTM free cash flow. Market cap as of December 31st of each year for 2021 – 2024, and as of 9/30/2025 for Q3 2025 LTM. See appendix for reconciliation of free cash flow to the most directly comparable GAAP measure and calculation of market cap. As of October 27, 2025, S&P 500 Materials and Industrials FCF yield from Bloomberg, calculation method may be different from CF’s (3) Represents annual and Q3 2025 LTM free cash flow divided by annual and Q3 2025 LTM adjusted EBITDA; see appendix for reconciliations of free cash flow and adjusted EBITDA to the most directly comparable GAAP measures (4) Includes the cash inflows and outflows associated with the Blue Point joint venture. See appendix for reconciliation of free cash flow to the most directly comparable GAAP measure (4) S&P 500 Materials (count = 26) 2021 – Q3 2025 LTM average yield 3.7% = 27.0x market cap/FCF(2) S&P 500 Industrials (count = 79) 2021 – Q3 2025 LTM average yield 3.3% = 30.3x market cap/FCF(2) CF 2021 – Q3 2025 LTM average yield 13.1% = 7.9x market cap/FCF(2) |
| Appendix |

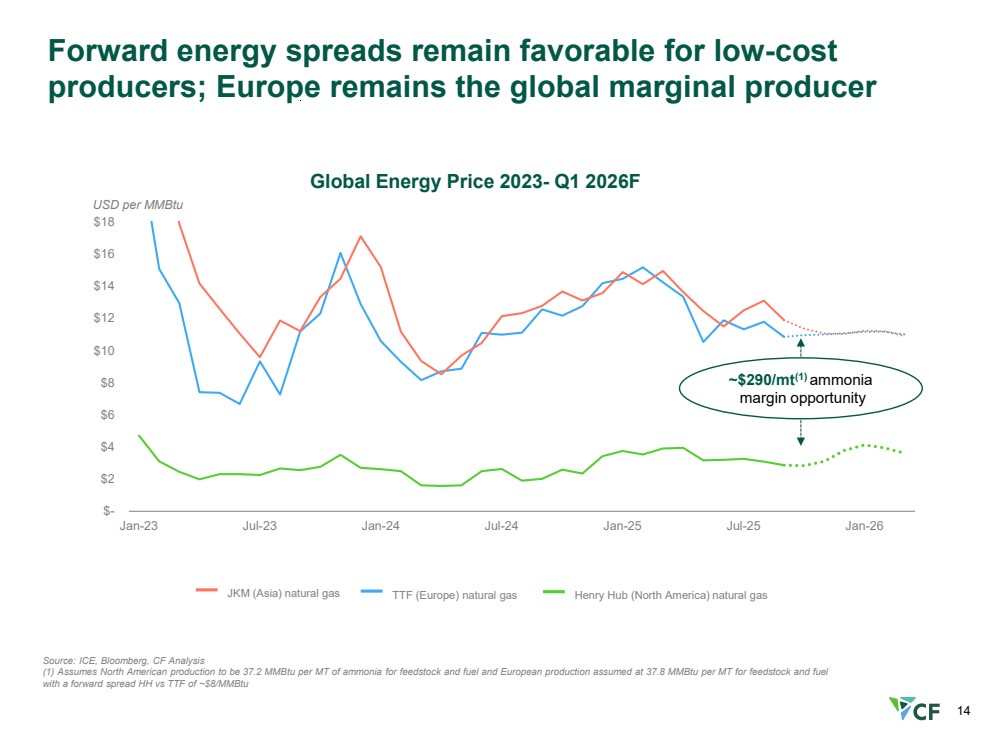
| 14 Global Energy Price 2023- Q1 2026F Source: ICE, Bloomberg, CF Analysis (1) Assumes North American production to be 37.2 MMBtu per MT of ammonia for feedstock and fuel and European production assumed at 37.8 MMBtu per MT for feedstock and fuel with a forward spread HH vs TTF of ~$8/MMBtu Forward energy spreads remain favorable for low-cost producers; Europe remains the global marginal producer $- $2 $4 $6 $8 $10 $12 $14 $16 $18 Jan-23 Jul-23 Jan-24 Jul-24 Jan-25 Jul-25 Jan-26 USD per MMBtu ~$290/mt(1) ammonia margin opportunity JKM (Asia) natural gas TTF (Europe) natural gas Henry Hub (North America) natural gas |
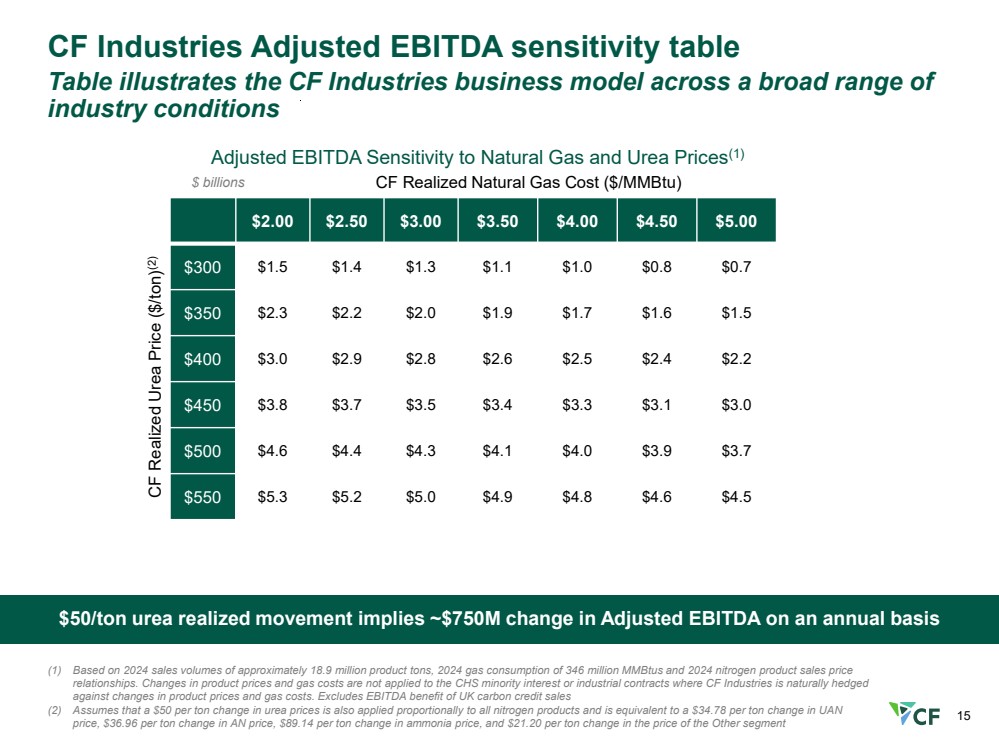
| 15 $2.00 $2.50 $3.00 $3.50 $4.00 $4.50 $5.00 $300 $1.5 $1.4 $1.3 $1.1 $1.0 $0.8 $0.7 $350 $2.3 $2.2 $2.0 $1.9 $1.7 $1.6 $1.5 $400 $3.0 $2.9 $2.8 $2.6 $2.5 $2.4 $2.2 $450 $3.8 $3.7 $3.5 $3.4 $3.3 $3.1 $3.0 $500 $4.6 $4.4 $4.3 $4.1 $4.0 $3.9 $3.7 $550 $5.3 $5.2 $5.0 $4.9 $4.8 $4.6 $4.5 CF Industries Adjusted EBITDA sensitivity table Table illustrates the CF Industries business model across a broad range of industry conditions $50/ton urea realized movement implies ~$750M change in Adjusted EBITDA on an annual basis (1) Based on 2024 sales volumes of approximately 18.9 million product tons, 2024 gas consumption of 346 million MMBtus and 2024 nitrogen product sales price relationships. Changes in product prices and gas costs are not applied to the CHS minority interest or industrial contracts where CF Industries is naturally hedged against changes in product prices and gas costs. Excludes EBITDA benefit of UK carbon credit sales (2) Assumes that a $50 per ton change in urea prices is also applied proportionally to all nitrogen products and is equivalent to a $34.78 per ton change in UAN price, $36.96 per ton change in AN price, $89.14 per ton change in ammonia price, and $21.20 per ton change in the price of the Other segment Adjusted EBITDA Sensitivity to Natural Gas and Urea Prices(1) $ billions CF Realized Natural Gas Cost ($/MMBtu) CF Realized Urea Price ($/ton)(2) |
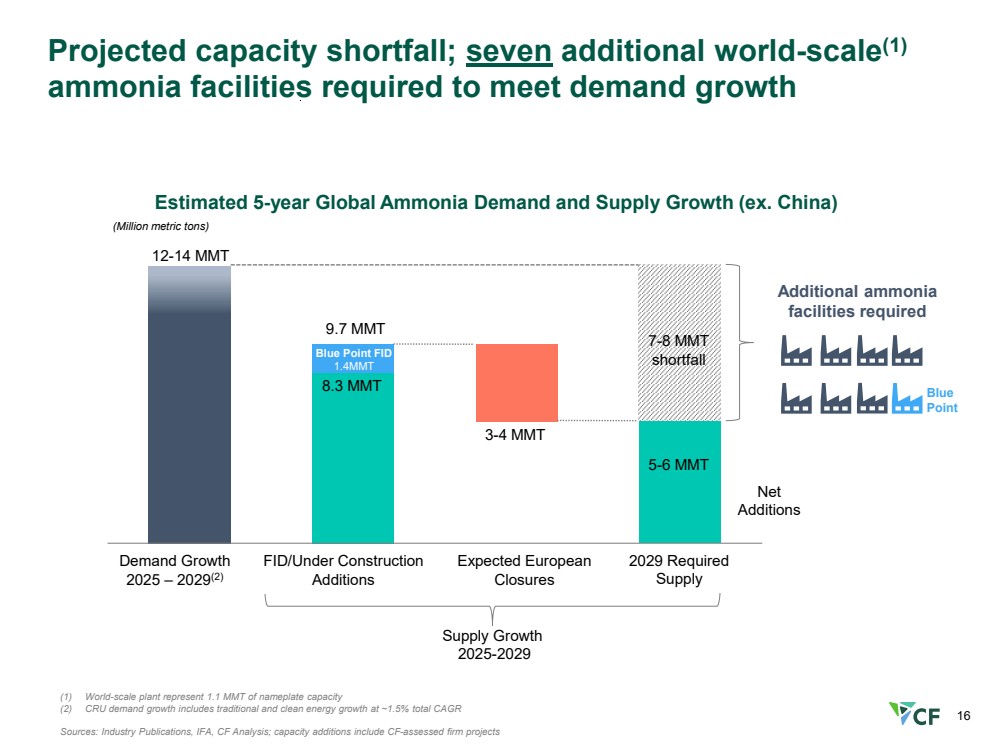
| 16 Demand Growth FID/Under Contruction…Expected European Closures 2029 Supply Blue Point FID 1.4MMT Projected capacity shortfall; seven additional world-scale(1) ammonia facilities required to meet demand growth (1) World-scale plant represent 1.1 MMT of nameplate capacity (2) CRU demand growth includes traditional and clean energy growth at ~1.5% total CAGR Sources: Industry Publications, IFA, CF Analysis; capacity additions include CF-assessed firm projects Estimated 5-year Global Ammonia Demand and Supply Growth (ex. China) (Million metric tons) 8.3 MMT 3-4 MMT 5-6 MMT Demand Growth 2025 – 2029(2) 12-14 MMT Supply Growth 2025-2029 Expected European Closures 7-8 MMT shortfall Additional ammonia facilities required Net Additions FID/Under Construction Additions 2029 Required Supply Blue Point 9.7 MMT |
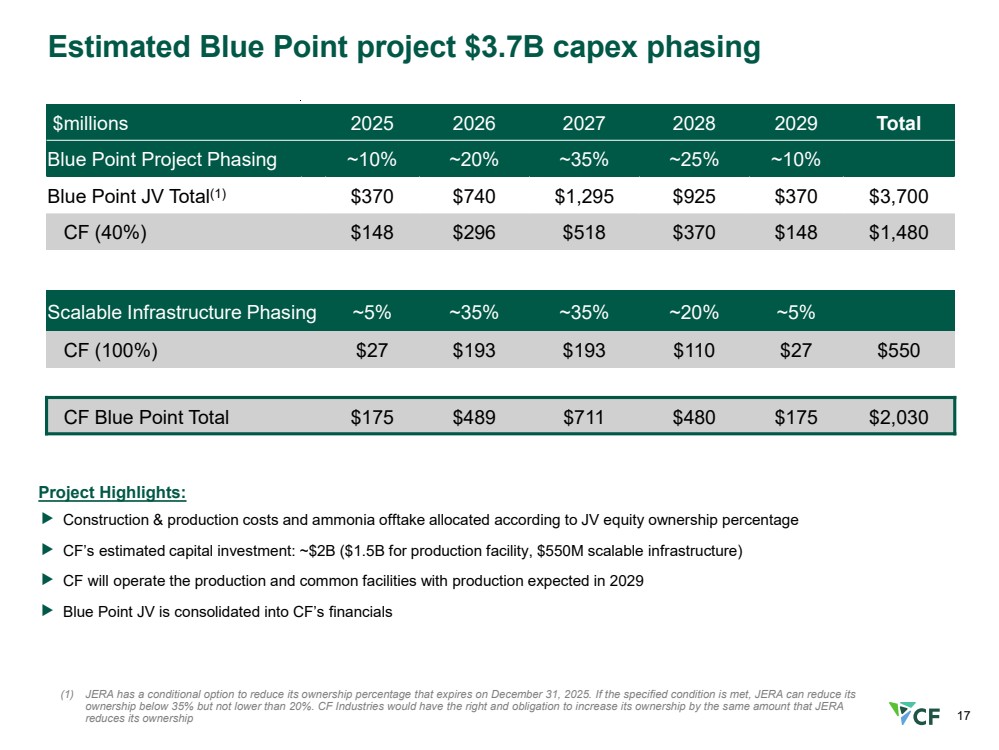
| 17 Estimated Blue Point project $3.7B capex phasing $millions 2025 2026 2027 2028 2029 Total Blue Point Project Phasing ~10% ~20% ~35% ~25% ~10% Blue Point JV Total(1) $370 $740 $1,295 $925 $370 $3,700 CF (40%) $148 $296 $518 $370 $148 $1,480 Scalable Infrastructure Phasing ~5% ~35% ~35% ~20% ~5% CF (100%) $27 $193 $193 $110 $27 $550 CF Blue Point Total $175 $489 $711 $480 $175 $2,030 Construction & production costs and ammonia offtake allocated according to JV equity ownership percentage CF’s estimated capital investment: ~$2B ($1.5B for production facility, $550M scalable infrastructure) CF will operate the production and common facilities with production expected in 2029 Blue Point JV is consolidated into CF’s financials (1) JERA has a conditional option to reduce its ownership percentage that expires on December 31, 2025. If the specified condition is met, JERA can reduce its ownership below 35% but not lower than 20%. CF Industries would have the right and obligation to increase its ownership by the same amount that JERA reduces its ownership Project Highlights: |
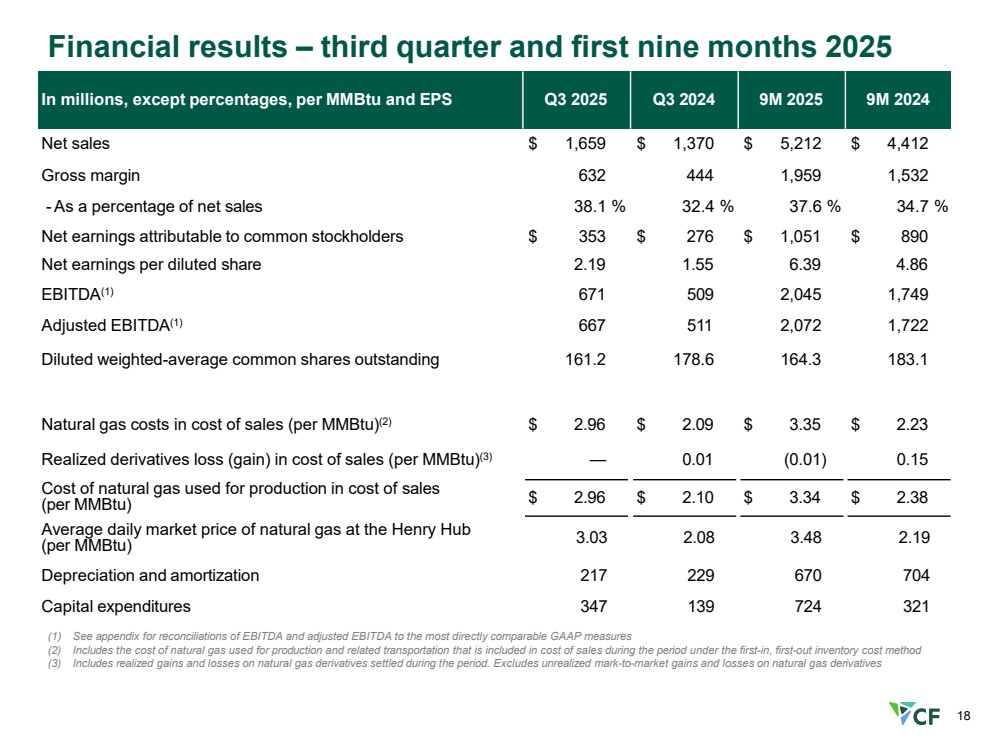
| 18 Financial results – third quarter and first nine months 2025 In millions, except percentages, per MMBtu and EPS Q3 2025 Q3 2024 9M 2025 9M 2024 Net sales $ 1,659 $ 1,370 $ 5,212 $ 4,412 Gross margin 632 444 1,959 1,532 -As a percentage of net sales 38.1 % 32.4 % 37.6 % 34.7 % Net earnings attributable to common stockholders $ 353 $ 276 $ 1,051 $ 890 Net earnings per diluted share 2.19 1.55 6.39 4.86 EBITDA(1) 671 509 2,045 1,749 Adjusted EBITDA(1) 667 511 2,072 1,722 Diluted weighted-average common shares outstanding 161.2 178.6 164.3 183.1 Natural gas costs in cost of sales (per MMBtu)(2) $ 2.96 $ 2.09 $ 3.35 $ 2.23 Realized derivatives loss (gain) in cost of sales (per MMBtu)(3) — 0.01 (0.01) 0.15 Cost of natural gas used for production in cost of sales (per MMBtu) $ 2.96 $ 2.10 $ 3.34 $ 2.38 Average daily market price of natural gas at the Henry Hub (per MMBtu) 3.03 2.08 3.48 2.19 Depreciation and amortization 217 229 670 704 Capital expenditures 347 139 724 321 (1) See appendix for reconciliations of EBITDA and adjusted EBITDA to the most directly comparable GAAP measures (2) Includes the cost of natural gas used for production and related transportation that is included in cost of sales during the period under the first-in, first-out inventory cost method (3) Includes realized gains and losses on natural gas derivatives settled during the period. Excludes unrealized mark-to-market gains and losses on natural gas derivatives |
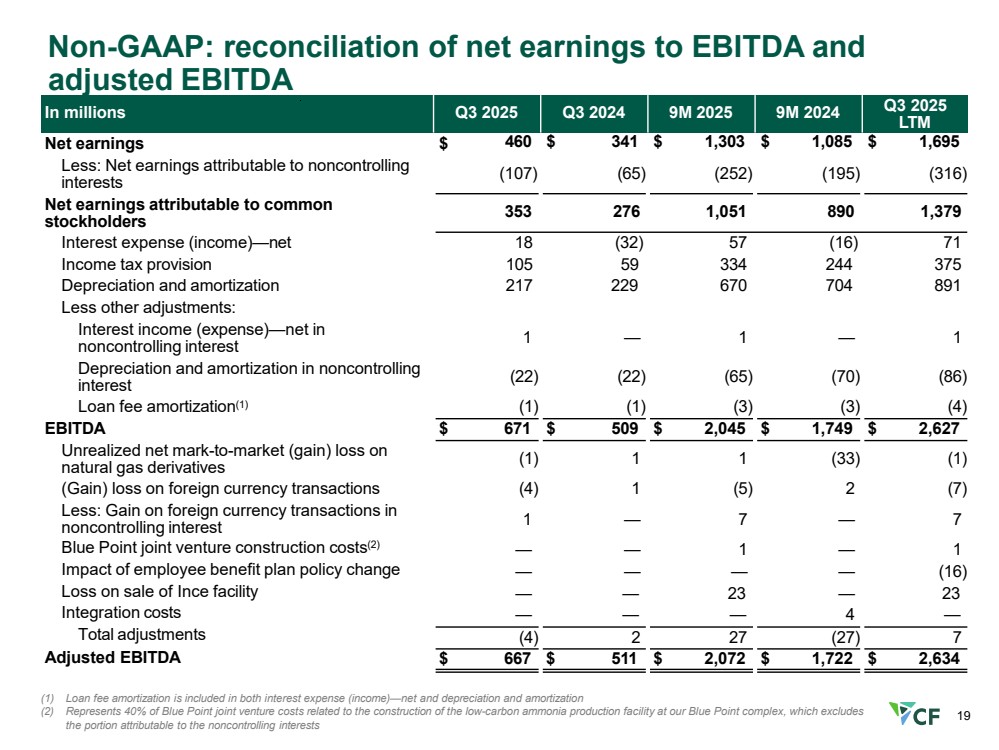
| 19 Non-GAAP: reconciliation of net earnings to EBITDA and adjusted EBITDA (1) Loan fee amortization is included in both interest expense (income)—net and depreciation and amortization (2) Represents 40% of Blue Point joint venture costs related to the construction of the low-carbon ammonia production facility at our Blue Point complex, which excludes the portion attributable to the noncontrolling interests In millions Q3 2025 Q3 2024 9M 2025 9M 2024 Q3 2025 LTM Net earnings $ Less: Net earnings attributable to noncontrolling interests Net earnings attributable to common stockholders 460 $ 341 $ 1,303 $ 1,085 $ 1,695 (107) (65) (252) (195) (316) 353 276 1,051 890 1,379 Interest expense (income)—net 18 (32) 57 (16) 71 Income tax provision 105 59 334 244 375 Depreciation and amortization 217 229 670 704 891 Less other adjustments: Interest income (expense)—net in noncontrolling interest Depreciation and amortization in noncontrolling interest Loan fee amortization(1) EBITDA Unrealized net mark-to-market (gain) loss on natural gas derivatives (Gain) loss on foreign currency transactions Less: Gain on foreign currency transactions in noncontrolling interest Blue Point joint venture construction costs(2) Impact of employee benefit plan policy change Loss on sale of Ince facility Integration costs Total adjustments Adjusted EBITDA $ $ 1 — 1 — 1 (22) (22) (65) (70) (86) (1) (1) (3) (3) (4) 671 $ 509 $ 2,045 $ 1,749 $ 2,627 (1) 1 1 (33) (1) (4) 1 (5) 2 (7) 1 — 7 — 7 — — 1 — 1 — — — — (16) — — — — 23 — — 4 23 — (4) 2 27 (27) 7 667 $ 511 $ 2,072 $ 1,722 $ 2,634 |
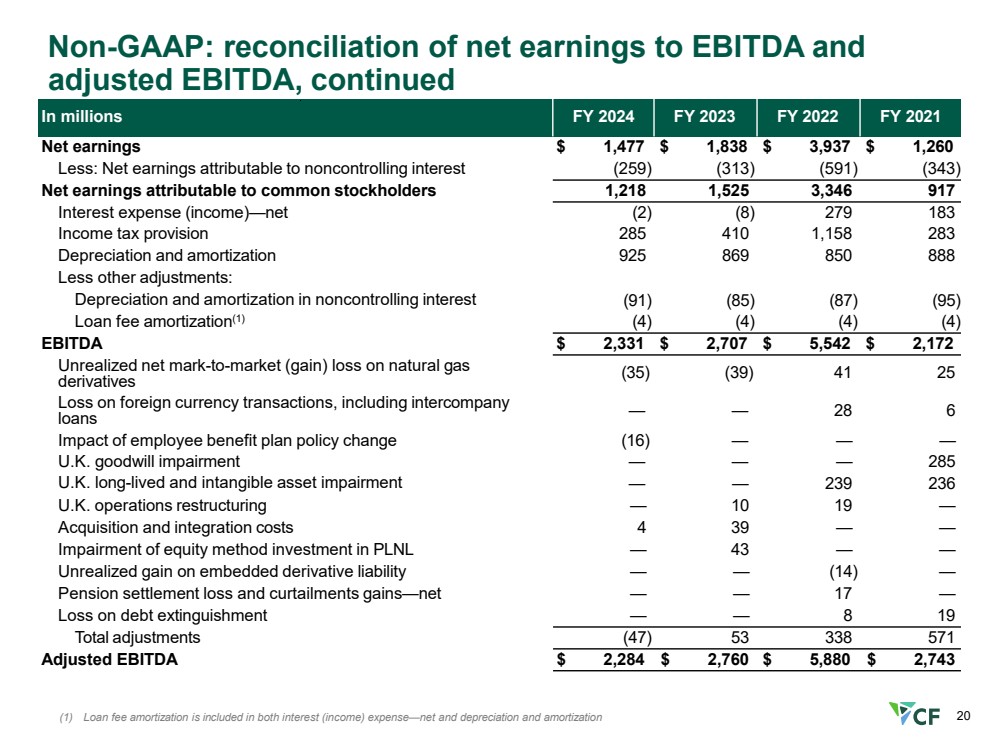
| 20 Non-GAAP: reconciliation of net earnings to EBITDA and adjusted EBITDA, continued In millions FY 2024 FY 2023 FY 2022 FY 2021 Net earnings $ 1,477 $ 1,838 $ 3,937 $ 1,260 Less: Net earnings attributable to noncontrolling interest (259) (313) (591) (343) Net earnings attributable to common stockholders 1,218 1,525 3,346 917 Interest expense (income)—net (2) (8) 279 183 Income tax provision 285 410 1,158 283 Depreciation and amortization 925 869 850 888 Less other adjustments: Depreciation and amortization in noncontrolling interest (91) (85) (87) (95) Loan fee amortization(1) (4) (4) (4) (4) EBITDA $ 2,331 $ 2,707 $ 5,542 $ 2,172 Unrealized net mark-to-market (gain) loss on natural gas derivatives Loss on foreign currency transactions, including intercompany loans Impact of employee benefit plan policy change U.K. goodwill impairment U.K. long-lived and intangible asset impairment (35) (39) 41 25 — — 28 6 (16) — — — — — — 285 — — 239 236 U.K. operations restructuring — 10 19 — Acquisition and integration costs 4 39 — — Impairment of equity method investment in PLNL — 43 — — Unrealized gain on embedded derivative liability — — (14) — Pension settlement loss and curtailments gains—net — — 17 — Loss on debt extinguishment — — 8 19 Total adjustments (47) 53 338 571 Adjusted EBITDA $ 2,284 $ 2,760 $ 5,880 $ 2,743 (1) Loan fee amortization is included in both interest (income) expense—net and depreciation and amortization |
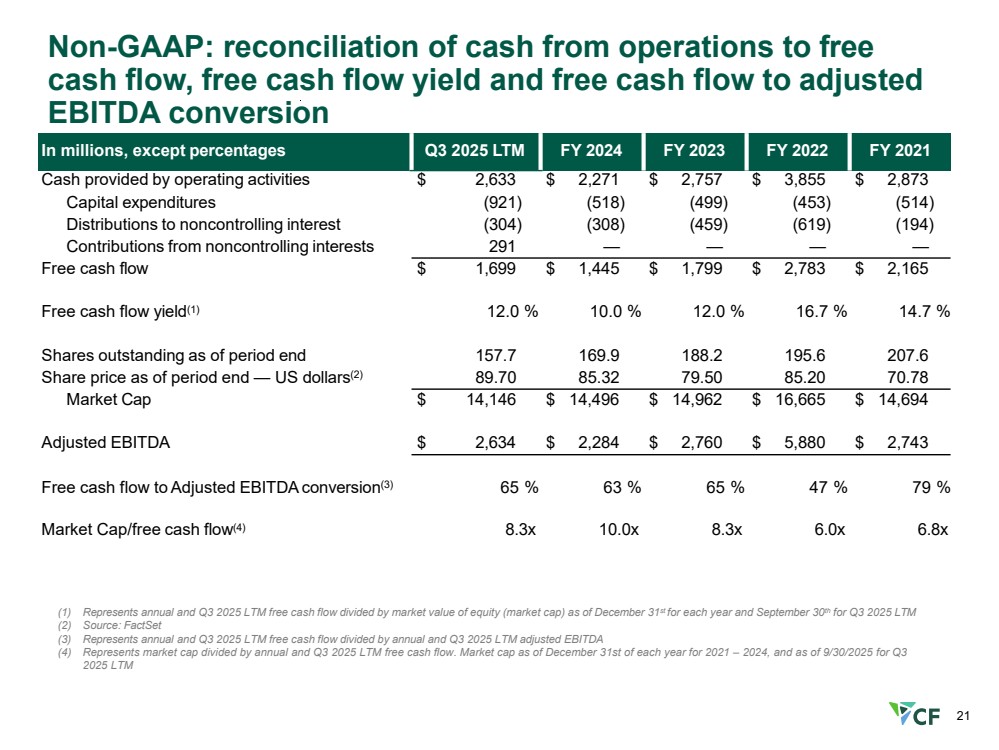
| 21 Non-GAAP: reconciliation of cash from operations to free cash flow, free cash flow yield and free cash flow to adjusted EBITDA conversion In millions, except percentages Q3 2025 LTM FY 2024 FY 2023 FY 2022 FY 2021 Cash provided by operating activities $ 2,633 $ 2,271 $ 2,757 $ 3,855 $ 2,873 Capital expenditures (921) (518) (499) (453) (514) Distributions to noncontrolling interest (304) (308) (459) (619) (194) Contributions from noncontrolling interests 291 — — — — Free cash flow $ 1,699 $ 1,445 $ 1,799 $ 2,783 $ 2,165 Free cash flow yield(1) 12.0 % 10.0 % 12.0 % 16.7 % 14.7 % Shares outstanding as of period end 157.7 169.9 188.2 195.6 207.6 Share price as of period end — US dollars(2) 89.70 85.32 79.50 85.20 70.78 Market Cap $ 14,146 $ 14,496 $ 14,962 $ 16,665 $ 14,694 Adjusted EBITDA $ 2,634 $ 2,284 $ 2,760 $ 5,880 $ 2,743 Free cash flow toAdjusted EBITDAconversion(3) 65 % 63 % 65 % 47 % 79 % Market Cap/free cash flow(4) 8.3x 10.0x 8.3x 6.0x 6.8x (1) Represents annual and Q3 2025 LTM free cash flow divided by market value of equity (market cap) as of December 31st for each year and September 30th for Q3 2025 LTM (2) Source: FactSet (3) Represents annual and Q3 2025 LTM free cash flow divided by annual and Q3 2025 LTM adjusted EBITDA (4) Represents market cap divided by annual and Q3 2025 LTM free cash flow. Market cap as of December 31st of each year for 2021 – 2024, and as of 9/30/2025 for Q3 2025 LTM |