
.2
Primis Financial Corp. NASDAQ: FRST Second Quarter 2026
Forward - Looking Statements This presentation and certain of our other filings with the Securities and Exchange Commission contain statements that constitute “forward - looking statements” within the meaning of, and subject to the protections of, Section 27 A of the Securities Act of 1933 , as amended, and Section 21 E of the Securities Exchange Act of 1934 , as amended . All statements other than statements of historical fact are forward - looking statements . Such statements can generally be identified by such words as "may," "plan," "contemplate," "anticipate," "believe," "intend," "continue," "expect," "project," "predict," "estimate," "could," "should," "would," "will," and other similar words or expressions of the future or otherwise regarding the outlook for the Company’s future business and financial performance and/or the performance of the banking industry and economy in general . These forward - looking statements include, but are not limited to, our expectations regarding our future operating and financial performance, including the preliminary estimated financial and operating information presented herein, which is subject to adjustment ; our outlook and long - term goals for future growth and new offerings and services ; our expectations regarding net interest margin ; expectations on our growth strategy, expense management, capital management and future profitability ; expectations on credit quality and performance ; and the assumptions underlying our expectations . Prospective investors are cautioned that any such forward - looking statements are not guarantees of future performance and involve known and unknown risks and uncertainties which may cause the actual results, performance or achievements of the Company to be materially different from the future results, performance or achievements expressed or implied by such forward - looking statements . Forward - looking statements are based on the information known to, and current beliefs and expectations of, the Company’s management and are subject to significant risks and uncertainties . Actual results may differ materially from those contemplated by such forward - looking statements . Factors that might cause such differences include, but are not limited to : instability in global economic conditions and geopolitical matters ; the impact of current and future economic and market conditions generally (including seasonality) and in the financial services industry, nationally and within our primary market areas ; adverse developments in borrower industries ; changes in interest rates, inflation, loan demand, real estate values, or competition, as well as labor shortages and supply chain disruptions ; the impact of tariffs, trade policies, and trade wars (including reduced consumer spending, lower economic growth or recession, reduced demand for U . S . exports, disruptions to supply chains, and decreased demand for other banking products and services) ; the Company’s ability to implement its various strategic and growth initiatives, including its recently established Panacea Financial Division, digital banking platform, V 1 BE fulfillment service, Mortgage Warehouse division and Primis Mortgage Company, as well as with respect to use and implementation of artificial intelligence ; competitive pressures among financial institutions increasing significantly (including as a result of technological changes and the use of artificial intelligence) ; changes in applicable laws, rules, or regulations, including changes to statutes, regulations or regulatory policies or practices ; legislative, regulatory or supervisory actions related to so - called “de - banking,” including any new prohibitions, requirements or enforcement priorities that could affect customer relationships, compliance obligations, or operational practices ; changes in management’s plans for the future ; credit risk associated with our lending activities ; changes in accounting principles, policies, or guidelines ; adverse results from current or future litigation, regulatory examinations or other legal and/or regulatory actions ; potential impacts of adverse developments in the banking industry, including impacts on customer confidence, deposit outflows, liquidity and the regulatory response thereto ; potential increases in the provision for credit losses ; our ability to identify and address increased cybersecurity risks, including those impacting vendors and other third parties ; fraud or misconduct by internal or external actors, which we may not be able to prevent, detect or mitigate ; acts of God or of war or other conflicts, civil unrest, acts of terrorism, pandemics or other catastrophic events that may affect general economic conditions ; action or inaction by the federal government, including as a result of any prolonged government shutdown ; and other general competitive, economic, political, and market factors, including those affecting our business, operations, pricing, products, or services . Forward - looking statements speak only as of the date on which such statements are made . These forward - looking statements are based upon information presently known to the Company’s management and are inherently subjective, uncertain and subject to change due to any number of risks and uncertainties, including, without limitation, the risks and other factors set forth in the Company’s filings with the Securities and Exchange Commission, the Company’s Annual Report on Form 10 - K for the year ended December 31 , 2025 , under the captions “Cautionary Note Regarding Forward - Looking Statements” and “Risk Factors,” and in the Company’s Quarterly Reports on Form 10 - Q and Current Reports on Form 8 - K . The Company undertakes no obligation to update any forward - looking statement to reflect events or circumstances after the date on which such statement is made, or to reflect the occurrence of unanticipated events . Readers are cautioned not to place undue reliance on these forward - looking statements . 2
Non - GAAP Measures Statements included in this presentation include non - GAAP financial measures and should be read along with the accompanying tables . Primis uses non - GAAP financial measures to analyze its performance . The measures entitled operating net income (loss) available to Primis' common shareholders ; pre - tax pre - provision operating earnings ; operating return on average assets ; pre - tax pre - provision operating return on average assets ; operating return on average equity ; operating return on average tangible equity ; operating efficiency ratio ; operating earnings per share – basic ; operating earnings per share – diluted ; core operating expense burden, tangible book value per share ; tangible common equity ; tangible common equity to tangible assets ; and core net interest margin are not measures recognized under GAAP and therefore are considered non - GAAP financial measures . We use the term “operating” to describe a financial measure that excludes income or expense considered to be non - recurring in nature . Items identified as non - operating are those that, when excluded from a reported financial measure, provide management or the reader with a measure that may be more indicative of forward - looking trends in our business . A reconciliation of these non - GAAP financial measures to the most comparable GAAP measures is provided when discussing the financial measure or in the Reconciliation of Non - GAAP Items table . Management believes that these non - GAAP financial measures provide additional useful information about Primis that allows management and investors to evaluate the ongoing operating results, financial strength and performance of Primis and provide meaningful comparison to its peers . Non - GAAP financial measures should not be considered as an alternative to any measure of performance or financial condition as promulgated under GAAP, and investors should consider Primis’ performance and financial condition as reported under GAAP and all other relevant information when assessing the performance or financial condition of Primis . Non - GAAP financial measures are not standardized and, therefore, it may not be possible to compare these measures with other companies that present measures having the same or similar names . Non - GAAP financial measures have limitations as analytical tools, and investors should not consider them in isolation or as a substitute for analysis of the results or financial condition as reported under GAAP . 3
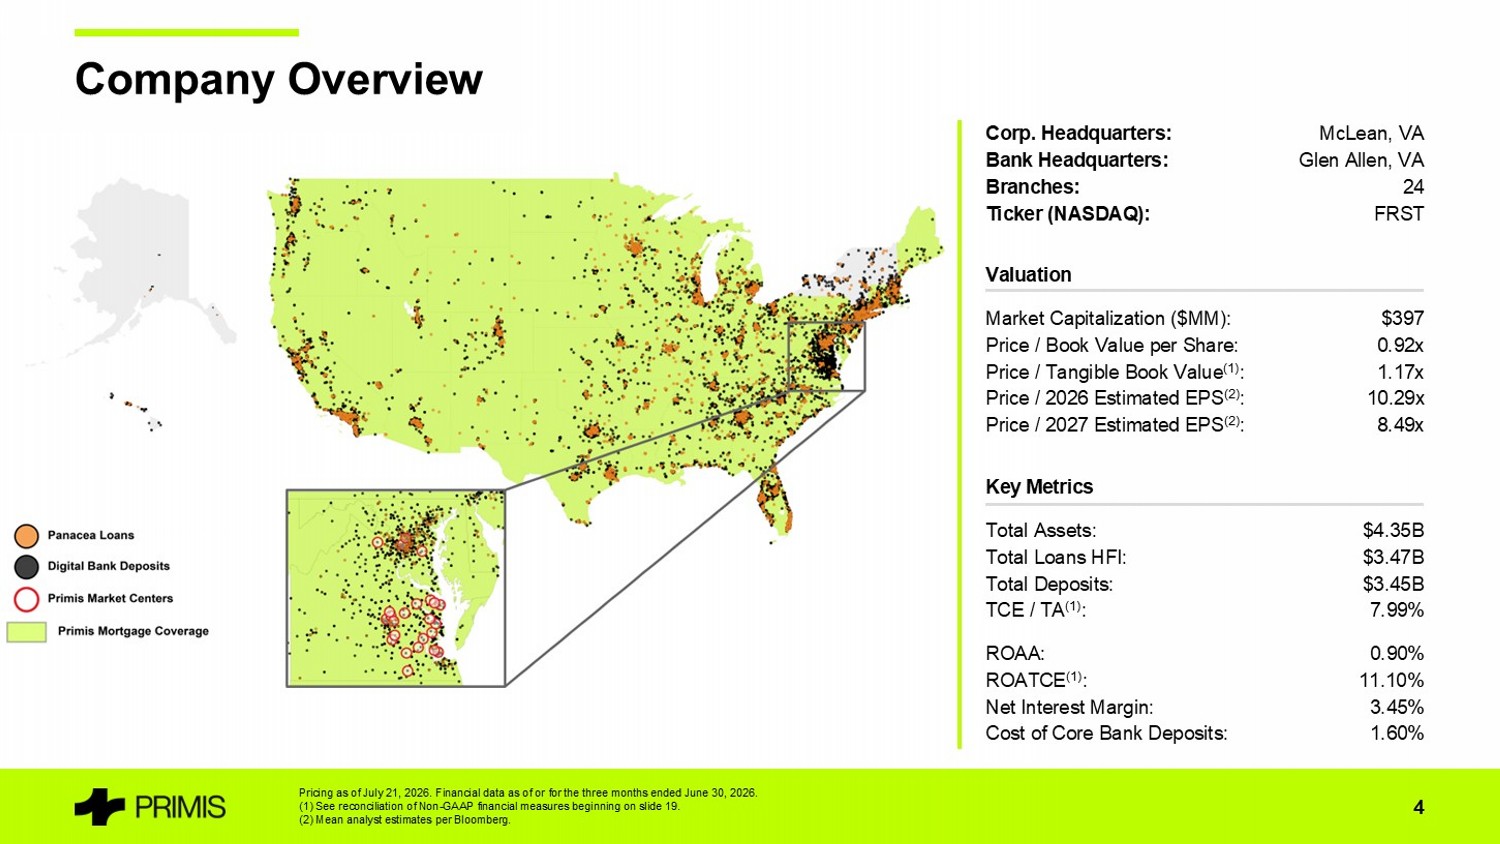
Company Overview Corp. Headquarters: Bank Headquarters: Branches: Ticker (NASDAQ): Pricing as of July 21, 2026. Financial data as of or for the three months ended June 30, 2026. (1) See reconciliation of Non - GAAP financial measures beginning on slide 19. (2) Mean analyst estimates per Bloomberg. McLean, VA Glen Allen, VA 24 FRST Valuation Market Capitalization ($MM): Price / Book Value per Share: Price / Tangible Book Value (1) : Price / 2026 Estimated EPS (2) : Price / 2027 Estimated EPS (2) : $397 0.92x 1.17x 10.29x 8.49x Key Metrics Total Assets: Total Loans HFI: Total Deposits: TCE / TA (1) : ROAA: ROATCE (1) : Net Interest Margin: Cost of Core Bank Deposits: $4.35B $3.47B $3.45B 7.99% 0.90% 11.10% 3.45% 1.60% 4
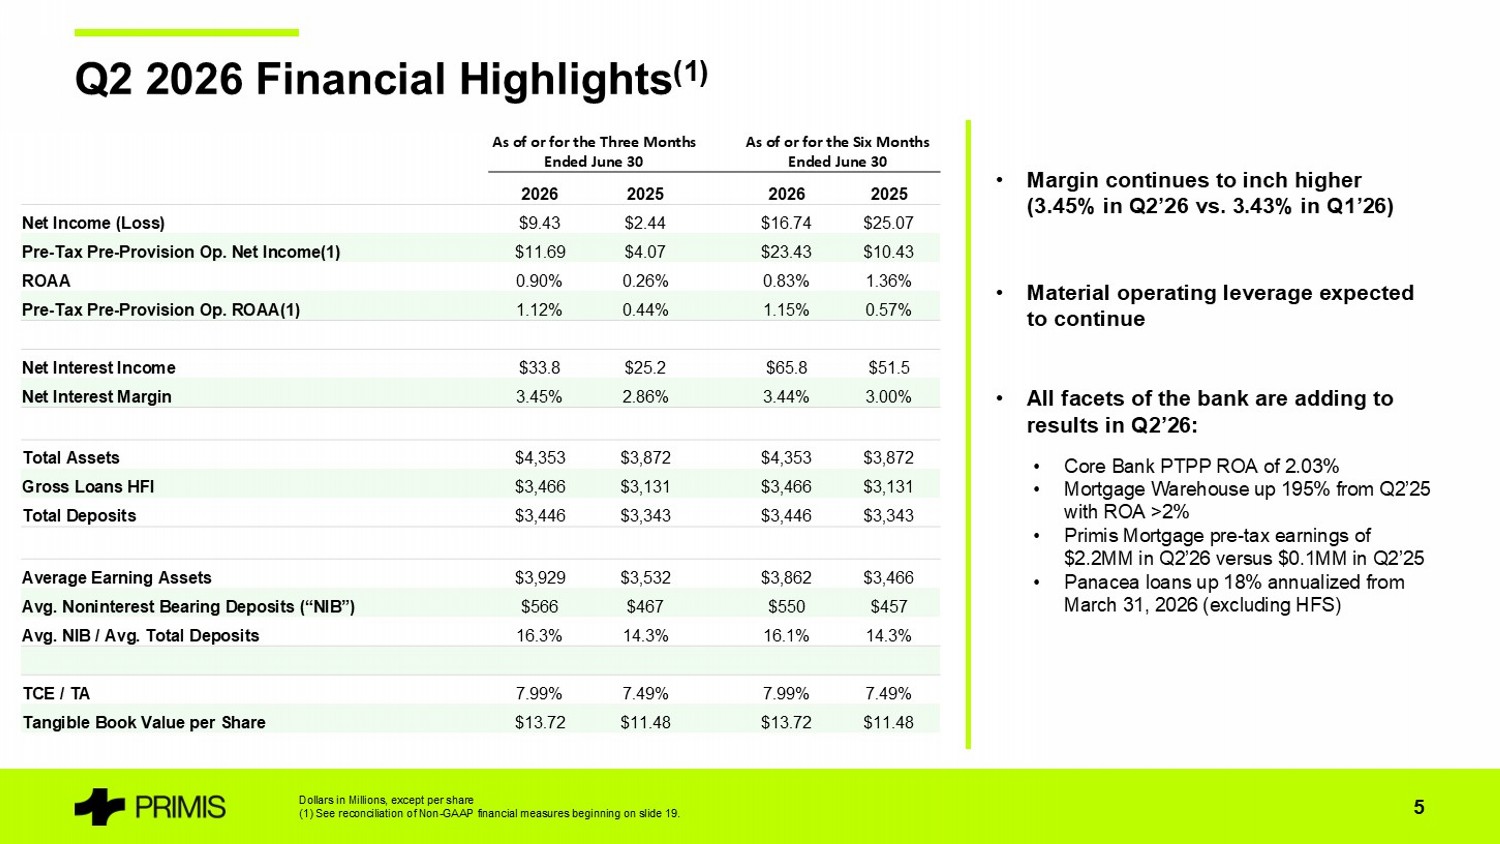
• Margin continues to inch higher (3.45% in Q2’26 vs. 3.43% in Q1’26) • Material operating leverage expected to continue • All facets of the bank are adding to results in Q2’26: • Core Bank PTPP ROA of 1.30% • Mortgage Warehouse up 195% from Q2’25 with ROA >2% • Primis Mortgage pre - tax earnings of $2.2MM in Q2’26 versus $0.1MM in Q2’25 • Panacea loans up 18% annualized from March 31, 2026 (excluding HFS) Q2 2026 Financial Highlights (1) Dollars in Millions, except per share (1) See reconciliation of Non - GAAP financial measures beginning on slide 19. 5 As of or for the Six Months Ended June 30 As of or for the Three Months Ended June 30 2025 2026 2025 2026 $25.07 $16.74 $2.44 $9.43 Net Income (Loss) $10.43 $23.43 $4.07 $11.69 Pre - Tax Pre - Provision Op. Net Income(1) 1.36% 0.83% 0.26% 0.90% ROAA 0.57% 1.15% 0.44% 1.12% Pre - Tax Pre - Provision Op. ROAA(1) $51.5 $65.8 $25.2 $33.8 Net Interest Income 3.00% 3.44% 2.86% 3.45% Net Interest Margin $3,872 $4,353 $3,872 $4,353 Total Assets $3,131 $3,466 $3,131 $3,466 Gross Loans HFI $3,343 $3,446 $3,343 $3,446 Total Deposits $3,466 $3,862 $3,532 $3,929 Average Earning Assets $457 $550 $467 $566 Avg. Noninterest Bearing Deposits (“NIB”) 14.3% 16.1% 14.3% 16.3% Avg. NIB / Avg. Total Deposits 7.49% 7.99% 7.49% 7.99% TCE / TA $11.48 $13.72 $11.48 $13.72 Tangible Book Value per Share
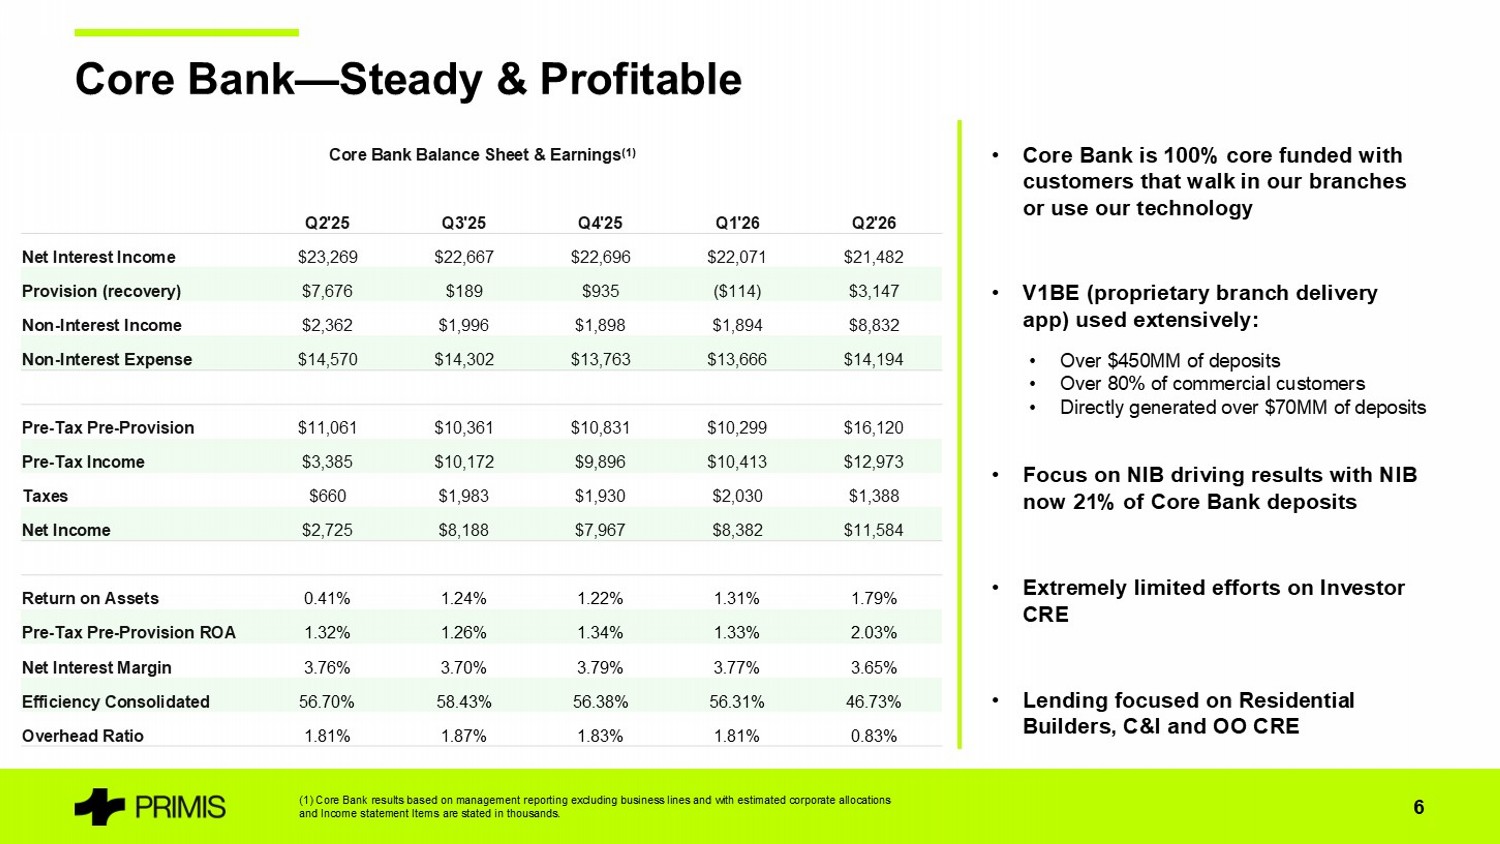
• Core Bank is 100% core funded with customers that walk in our branches or use our technology • V1BE (proprietary branch delivery app) used extensively: • Over $450MM of deposits • Over 80% of commercial customers • Directly generated over $70MM of deposits • Focus on NIB driving results with NIB now 21% of Core Bank deposits • Extremely limited efforts on Investor CRE • Lending focused on Residential Builders, C&I and OO CRE Core Bank — Steady & Profitable (1) Core Bank results based on management reporting excluding business lines and with estimated corporate allocations and Income statement Items are stated in thousands. 6 Core Bank Balance Sheet & Earnings (1) Q2'26 Q1'26 Q4'25 Q3'25 Q2'25 $21,482 $22,071 $22,696 $22,667 $23,269 Net Interest Income $3,147 ($114) $935 $189 $7,676 Provision (recovery) $2,980 $1,894 $1,898 $1,996 $2,362 Non - Interest Income $14,194 $13,666 $13,763 $14,302 $14,570 Non - Interest Expense $10,267 $10,299 $10,831 $10,361 $11,061 Pre - Tax Pre - Provision $7,120 $10,413 $9,896 $10,172 $3,385 Pre - Tax Income $1,388 $2,030 $1,930 $1,983 $660 Taxes $5,732 $8,382 $7,967 $8,188 $2,725 Net Income 0.89% 1.31% 1.22% 1.24% 0.41% Return on Assets 1.30% 1.33% 1.34% 1.26% 1.32% Pre - Tax Pre - Provision ROA 3.65% 3.77% 3.79% 3.70% 3.76% Net Interest Margin 57.89% 56.31% 56.38% 58.43% 56.70% Efficiency Consolidated 1.73% 1.81% 1.83% 1.87% 1.81% Overhead Ratio
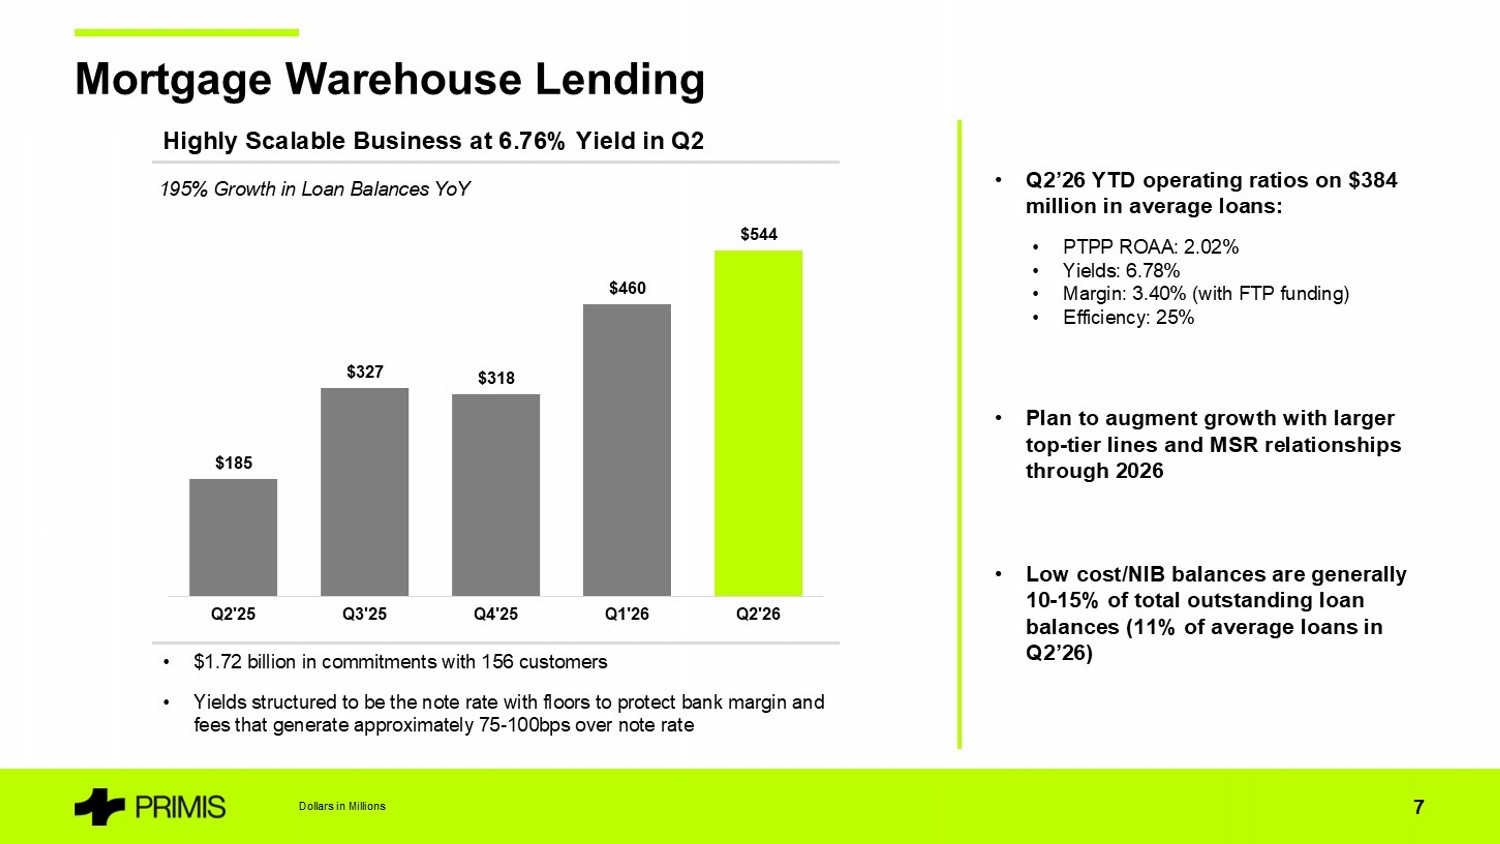
Highly Scalable Business at 6.76% Yield in Q2 • Q2’26 YTD operating ratios on $384 million in average loans: • PTPP ROAA: 2.02% • Yields: 6.78% • Margin: 3.40% (with FTP funding) • Efficiency: 25% • Plan to augment growth with larger top - tier lines and MSR relationships through 2026 • Low cost/NIB balances are generally 10 - 15% of total outstanding loan balances (11% of average loans in Q2’26) Mortgage Warehouse Lending Dollars in Millions 7 • $1.72 billion in commitments with 156 customers • Yields structured to be the note rate with floors to protect bank margin and fees that generate approximately 75 - 100bps over note rate $185 $327 $318 $460 $544 Q2'25 Q3'25 Q4'25 Q1'26 Q2'26 195% Growth in Loan Balances YoY
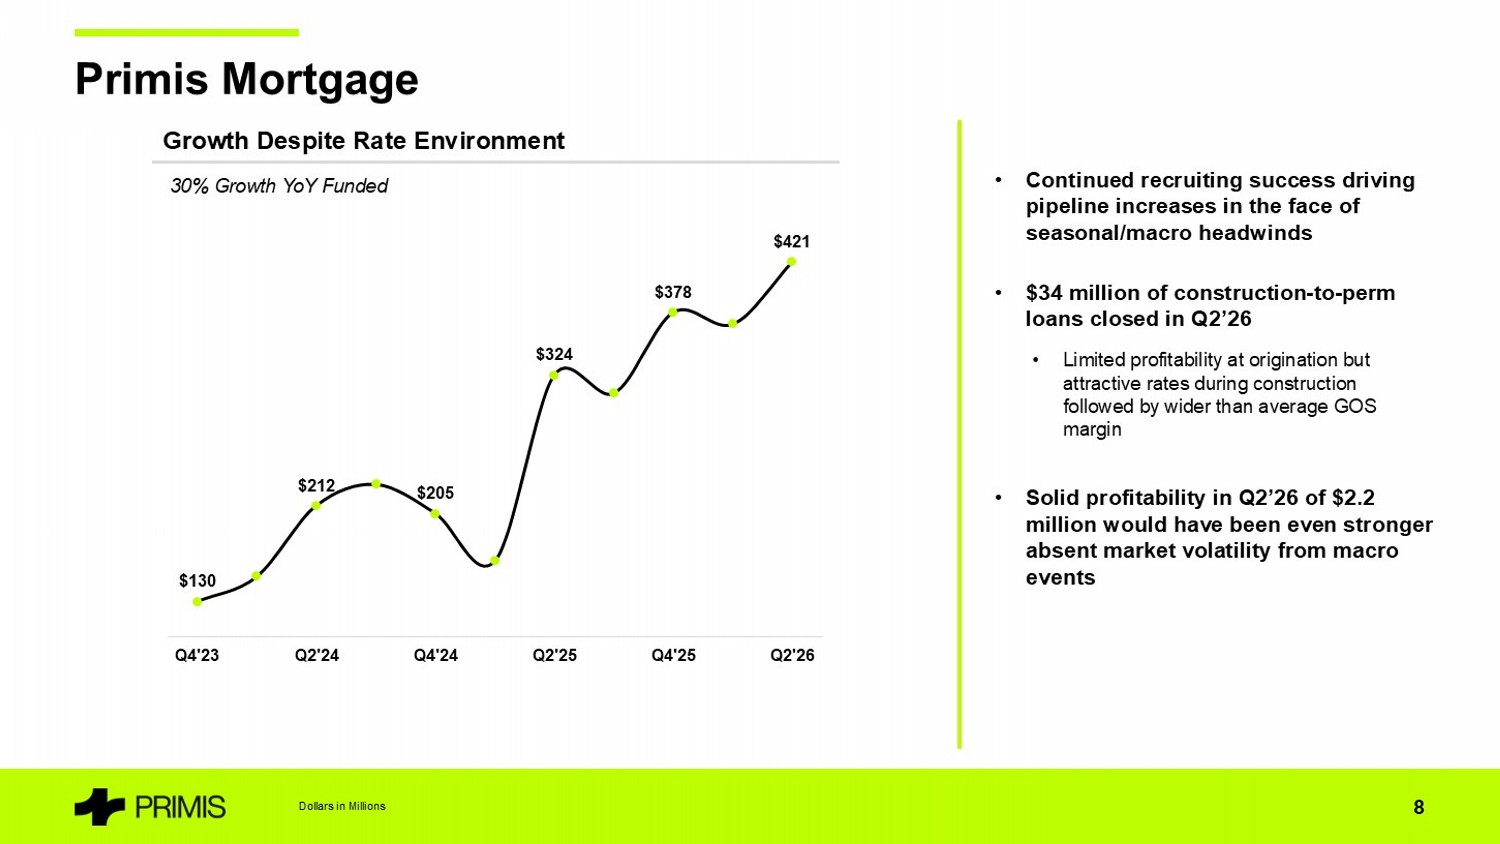
• Continued recruiting success driving pipeline increases in the face of seasonal/macro headwinds • $34 million of construction - to - perm loans closed in Q2’26 • Limited profitability at origination but attractive rates during construction followed by wider than average GOS margin • Solid profitability in Q2’26 of $2.2 million would have been even stronger absent market volatility from macro events Primis Mortgage Dollars in Millions 8 Growth Despite Rate Environment $130 $212 $205 $324 $378 $421 Q4'23 Q2'24 Q4'24 Q2'25 Q4'25 Q2'26 30% Growth YoY Funded
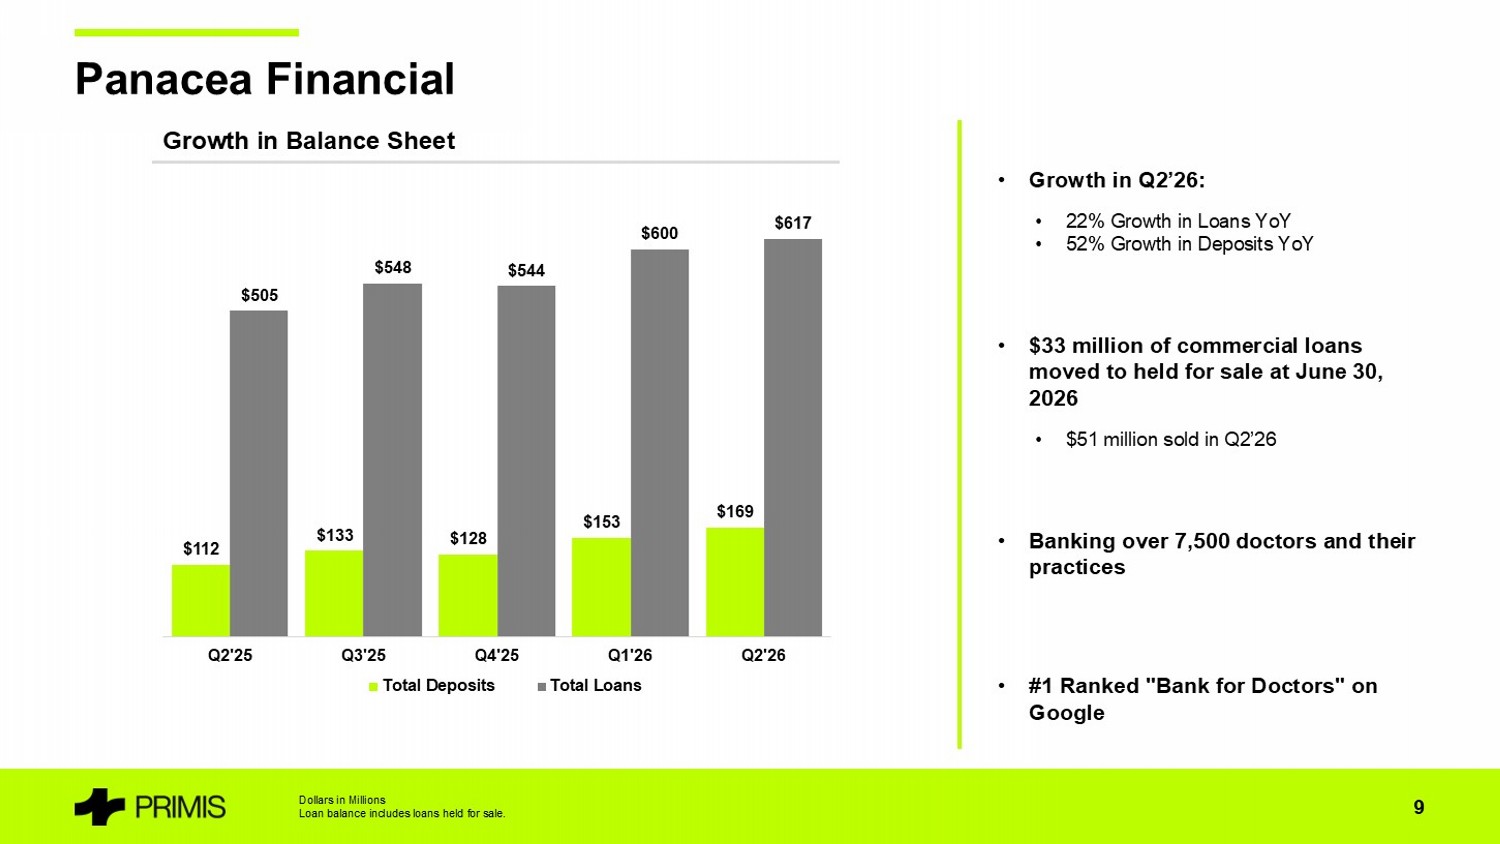
• Growth in Q2’26: • 22% Growth in Loans YoY • 52% Growth in Deposits YoY • $33 million of commercial loans moved to held for sale at June 30, 2026 • $51 million sold in Q2’26 • Banking over 7,500 doctors and their practices • #1 Ranked "Bank for Doctors" on Google Panacea Financial Dollars in Millions Loan balance includes loans held for sale. 9 Growth in Balance Sheet $112 $133 $128 $153 $169 $505 $548 $544 $600 $617 Q2'25 Q3'25 Q4'25 Q1'26 Q2'26 Total Deposits Total Loans
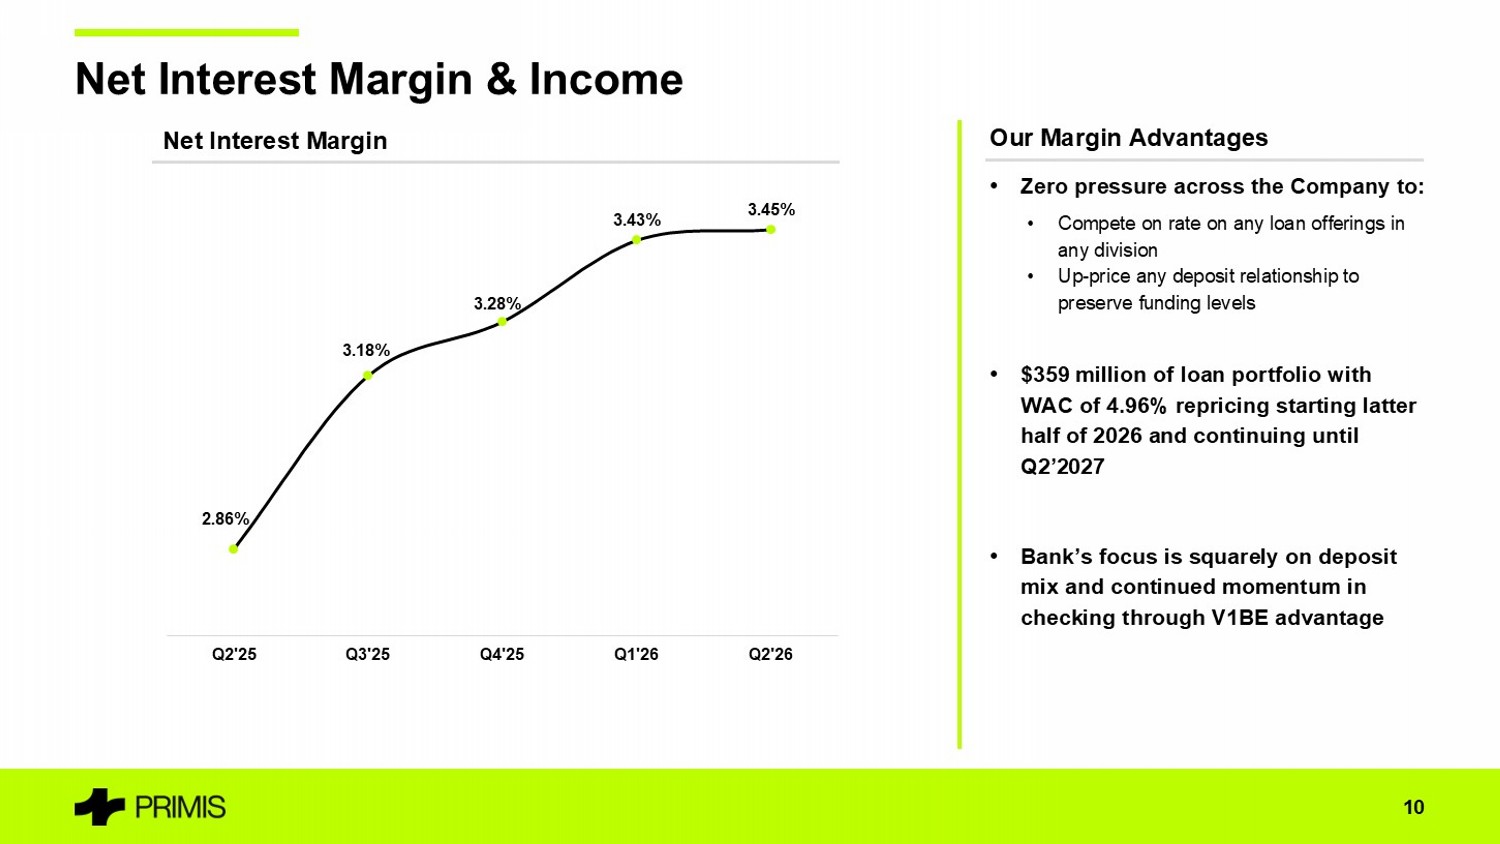
Net Interest Margin & Income 10 Net Interest Margin Our Margin Advantages • Zero pressure across the Company to: • Compete on rate on any loan offerings in any division • Up - price any deposit relationship to preserve funding levels • $359 million of loan portfolio with WAC of 4.96% repricing starting latter half of 2026 and continuing until Q2’2027 • Bank’s focus is squarely on deposit mix and continued momentum in checking through V1BE advantage 3.45% 3.43% 3.28% 3.18% 2.86% Q2'26 Q1'26 Q4'25 Q3'25 Q2'25
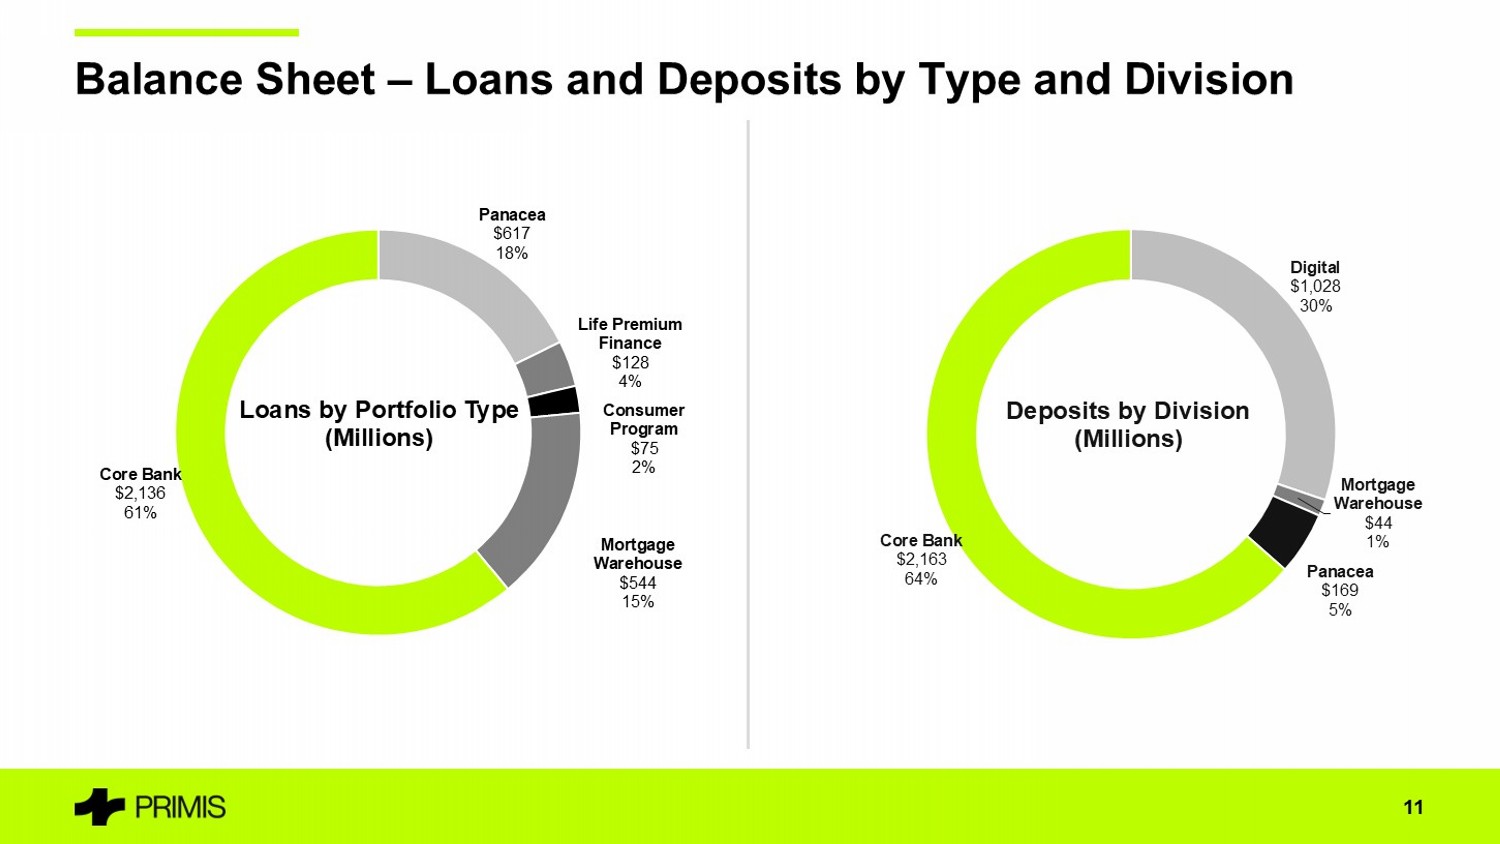
Balance Sheet – Loans and Deposits by Type and Division 11 Panacea $617 18% Life Premium Finance $128 4% Consumer Program $75 2% Mortgage Warehouse $544 15% Core Bank $2,136 61% Loans by Portfolio Type (Millions) Digital $1,028 30% Mortgage Warehouse $44 1% Panacea $169 5% Core Bank $2,163 64% Deposits by Division (Millions)
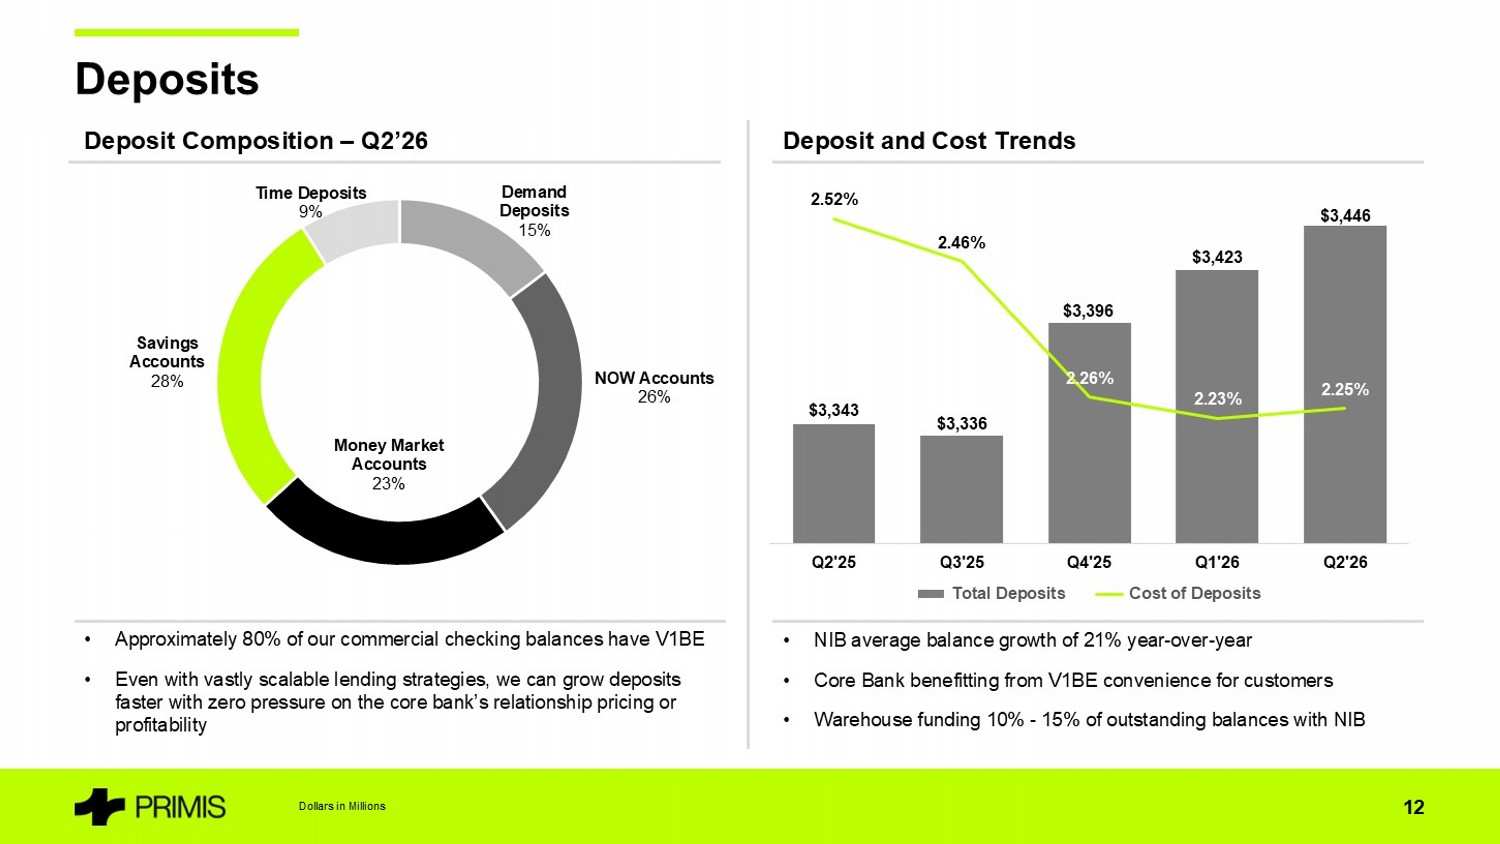
Deposit Composition – Q2’26 Deposits Dollars in Millions 12 • Approximately 80% of our commercial checking balances have V1BE • Even with vastly scalable lending strategies, we can grow deposits faster with zero pressure on the core bank’s relationship pricing or profitability • NIB average balance growth of 21% year - over - year • Core Bank benefitting from V1BE convenience for customers • Warehouse funding 10% - 15% of outstanding balances with NIB Deposit and Cost Trends Demand Deposits 15% NOW Accounts 26% Money Market Accounts 23% Savings Accounts 28% Time Deposits 9% $3,446 $3,423 $3,396 $3,336 $3,343 2.25% 2.23% 2.26% 2.46% 2.52% Q2'26 Q1'26 Q4'25 Q3'25 Q2'25 Total Deposits Cost of Deposits
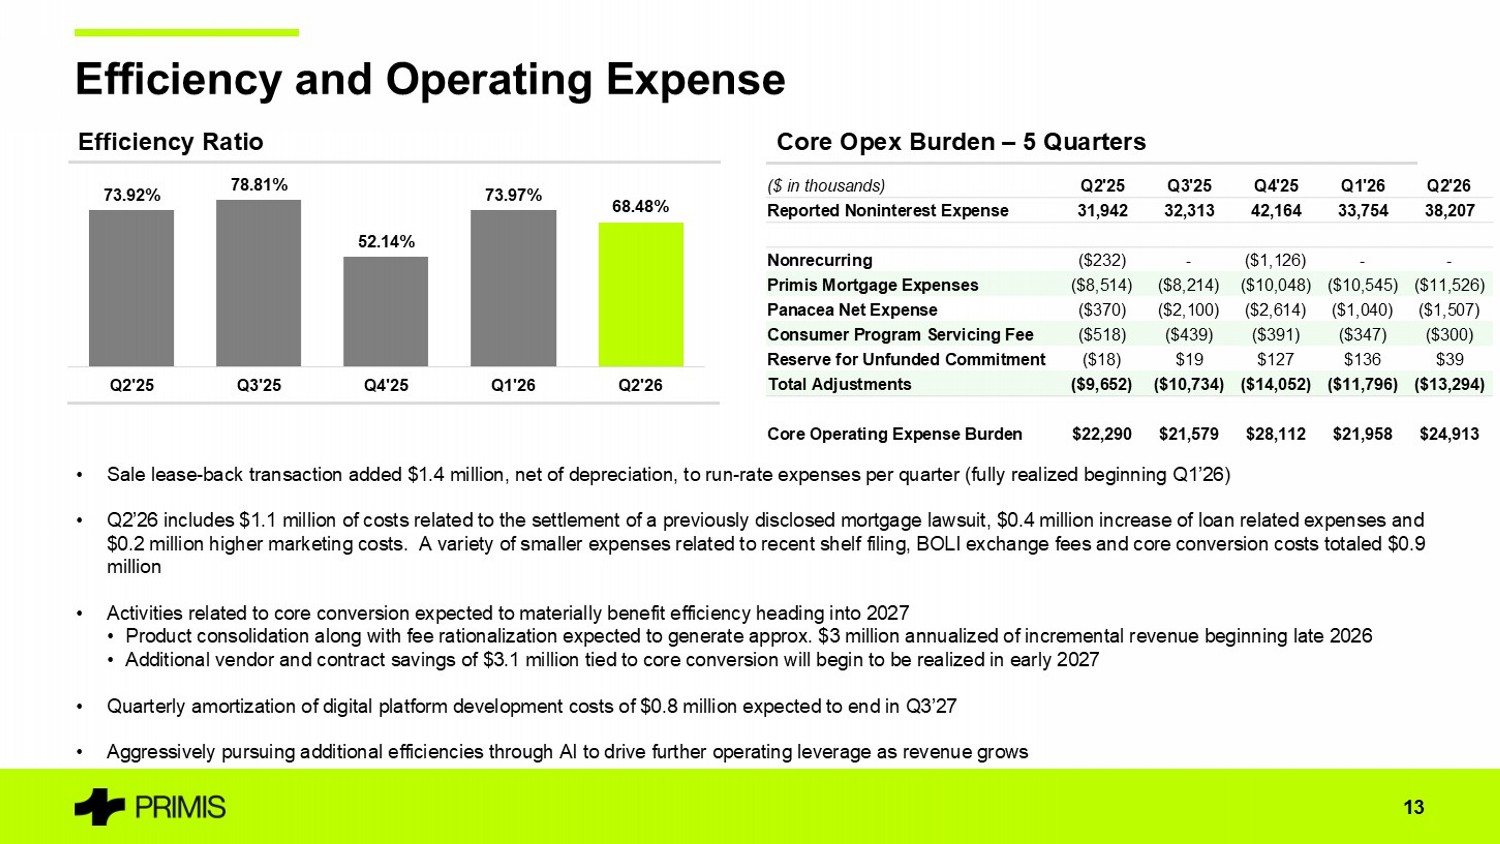
68.48% 73.97% 52.14% 78.81% 73.92% Q2'26 Q1'26 Q4'25 Q3'25 Q2'25 Efficiency and Operating Expense (1) See reconciliation of Non - GAAP financial measures beginning on slide 19. 13 • Sale lease - back transaction added $1.4 million, net of depreciation, to run - rate expenses per quarter (fully realized beginning Q1’26) • Q2’26 includes $1.1 million of costs related to the settlement of a previously disclosed mortgage lawsuit, $0.4 million incre ase of loan related expenses and $0.2 million higher marketing costs. A variety of smaller expenses related to recent shelf filing, BOLI exchange fees and co re conversion costs totaled $0.9 million • Activities related to core conversion expected to materially benefit efficiency heading into 2027 • Product consolidation along with fee rationalization expected to generate approx. $3 million annualized of incremental revenu e b eginning late 2026 • Additional vendor and contract savings of $3.1 million tied to core conversion will begin to be realized in early 2027 • Quarterly amortization of digital platform development costs of $0.8 million expected to end in Q3’27 • Aggressively pursuing additional efficiencies through AI to drive further operating leverage as revenue grows Efficiency Ratio Core Opex Burden – 5 Quarters Q2'26 Q1'26 Q4'25 Q3'25 Q2'25 ($ in thousands) 38,207 33,754 42,164 32,313 31,942 Reported Noninterest Expense - - ($1,126) - ($232) Nonrecurring ($11,526) ($10,545) ($10,048) ($8,214) ($8,514) Primis Mortgage Expenses ($1,507) ($1,040) ($2,614) ($2,100) ($370) Panacea Net Expense ($300) ($347) ($391) ($439) ($518) Consumer Program Servicing Fee $39 $136 $127 $19 ($18) Reserve for Unfunded Commitment ($13,294) ($11,796) ($14,052) ($10,734) ($9,652) Total Adjustments $24,913 $21,958 $28,112 $21,579 $22,290 Core Operating Expense Burden
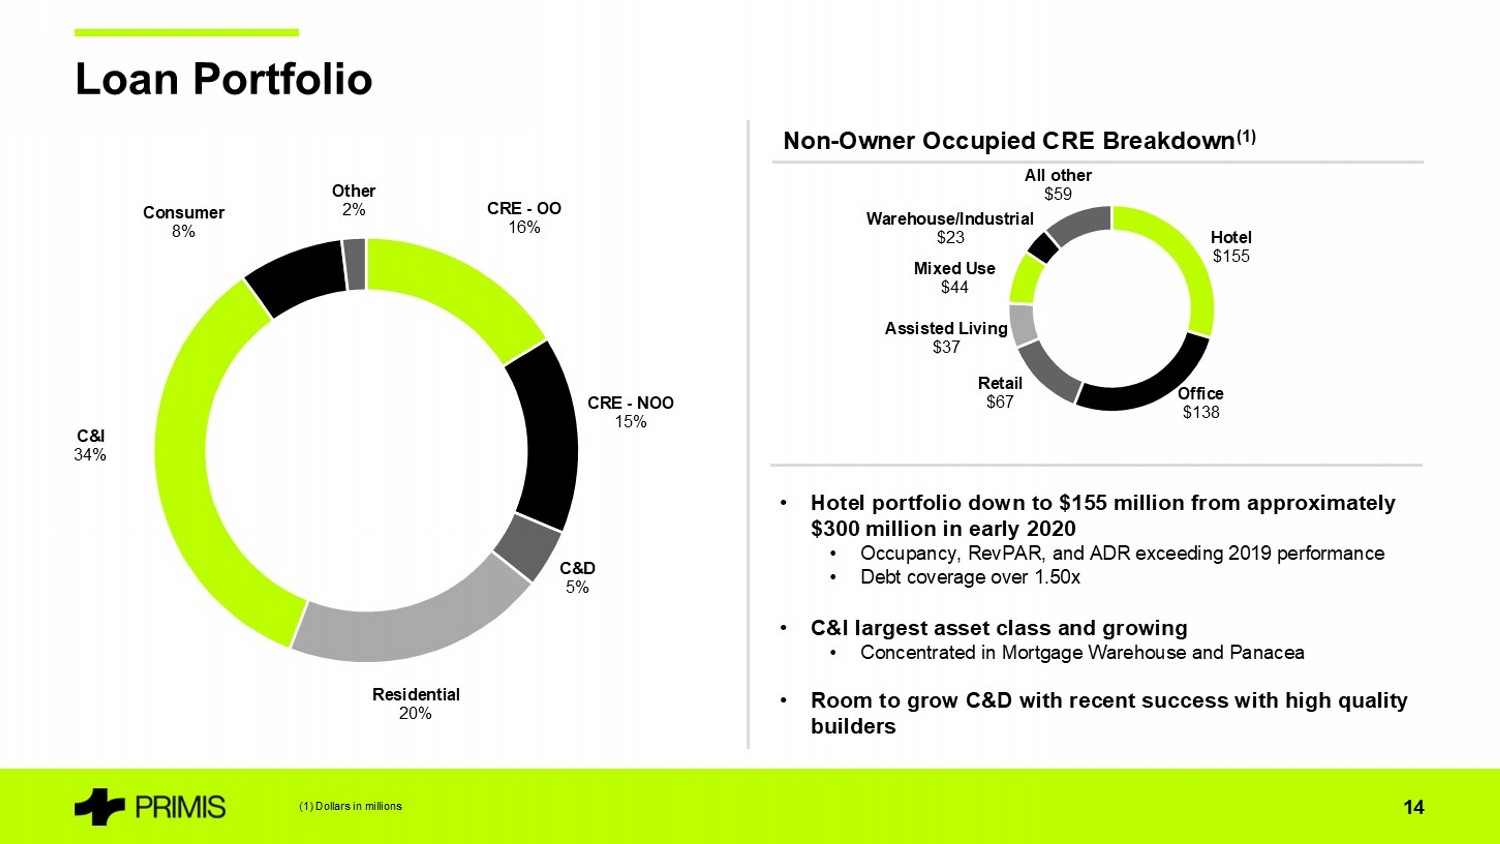
Loan Portfolio (1) Dollars in millions 14 Non - Owner Occupied CRE Breakdown (1) • Hotel portfolio down to $155 million from approximately $300 million in early 2020 • Occupancy, RevPAR, and ADR exceeding 2019 performance • Debt coverage over 1.50x • C&I largest asset class and growing • Concentrated in Mortgage Warehouse and Panacea • Room to grow C&D with recent success with high quality builders CRE - OO 16% CRE - NOO 15% C&D 5% Residential 20% C&I 34% Consumer 8% Other 2% Hotel $155 Office $138 Retail $67 Assisted Living $37 Mixed Use $44 Warehouse/Industrial $23 All other $59
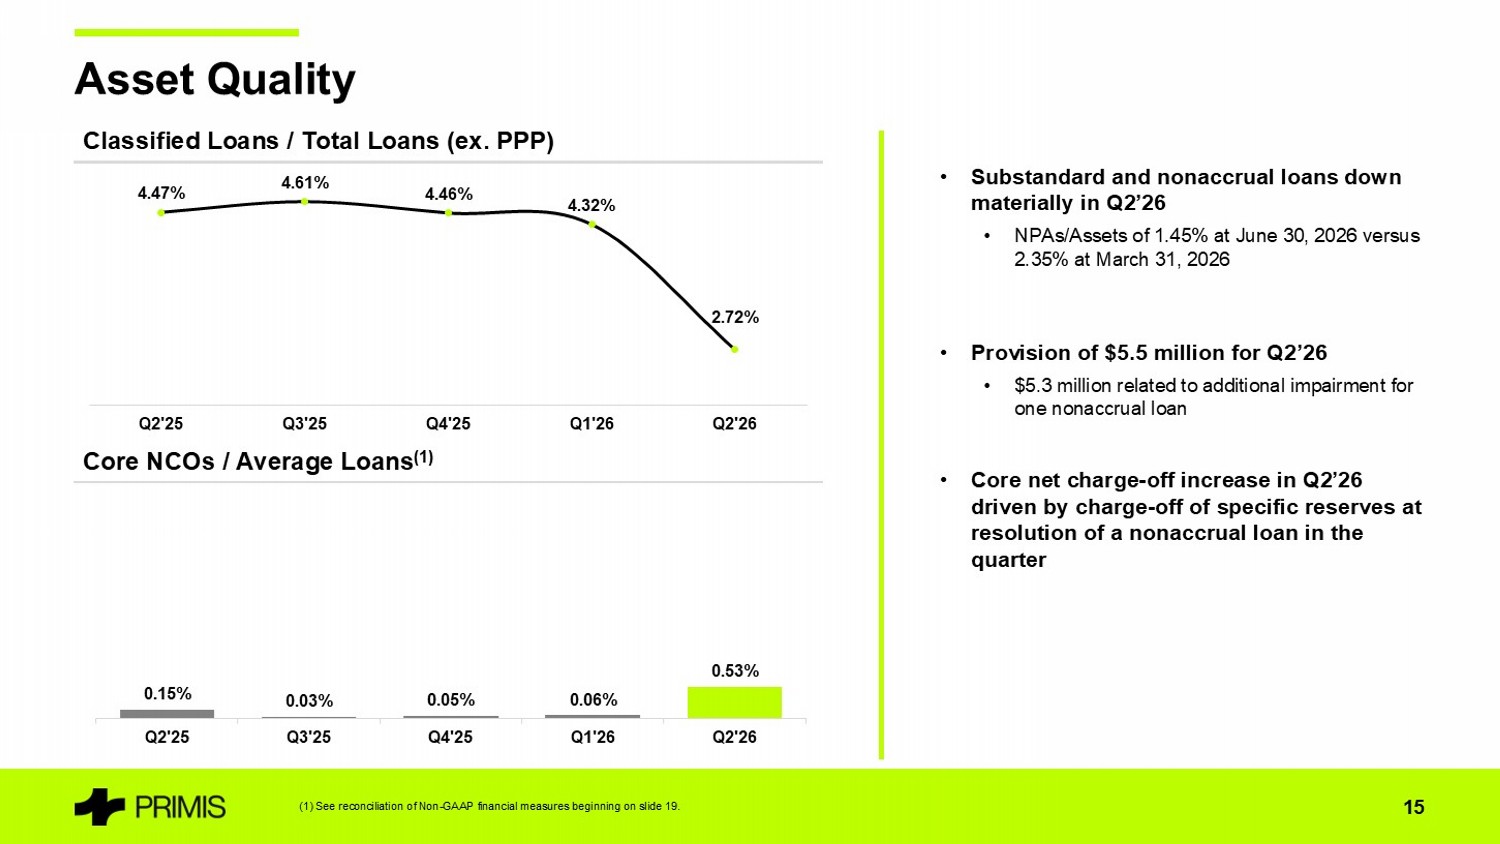
Asset Quality (1) See reconciliation of Non - GAAP financial measures beginning on slide 19. 15 Classified Loans / Total Loans (ex. PPP) Core NCOs / Average Loans (1) • Substandard and nonaccrual loans down materially in Q2’26 • NPAs/Assets of 1.45% at June 30, 2026 versus 2.35% at March 31, 2026 • Provision of $5.5 million for Q2’26 • $5.3 million related to additional impairment fo r one nonaccrual loan • Core net charge - off increase in Q2’26 driven by charge - off of specific reserves at resolution of a nonaccrual loan in the quarter 0.15% 0.03% 0.05% 0.06% 0.53% Q2'25 Q3'25 Q4'25 Q1'26 Q2'26 2.72% 4.32% 4.46% 4.61% 4.47% Q2'26 Q1'26 Q4'25 Q3'25 Q2'25
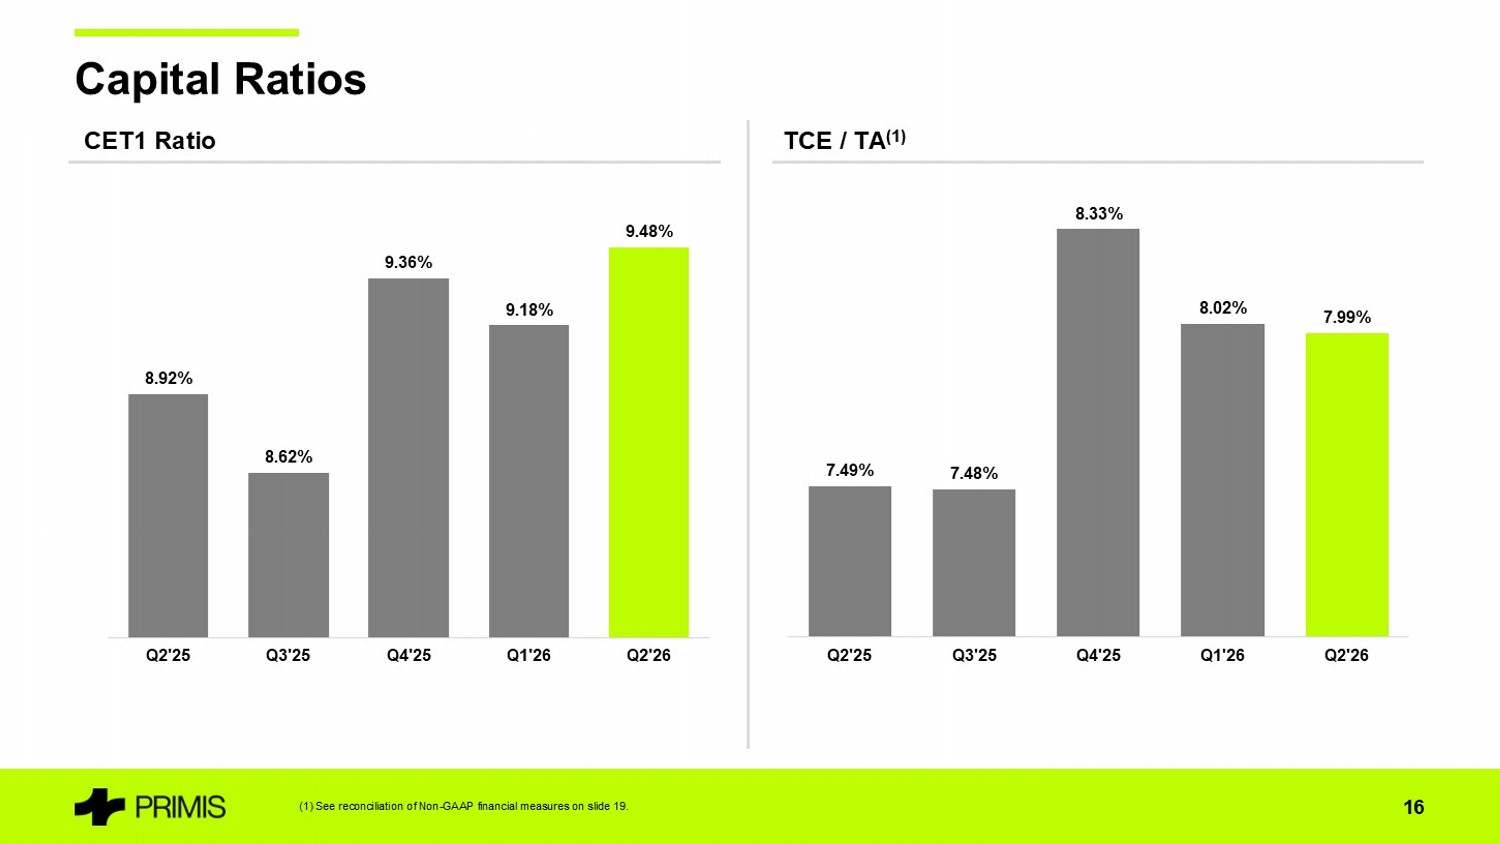
Capital Ratios (1) See reconciliation of Non - GAAP financial measures on slide 19. 16 CET1 Ratio TCE / TA (1) 9.48% 9.18% 9.36% 8.62% 8.92% Q2'26 Q1'26 Q4'25 Q3'25 Q2'25 7.99% 8.02% 8.33% 7.48% 7.49% Q2'26 Q1'26 Q4'25 Q3'25 Q2'25
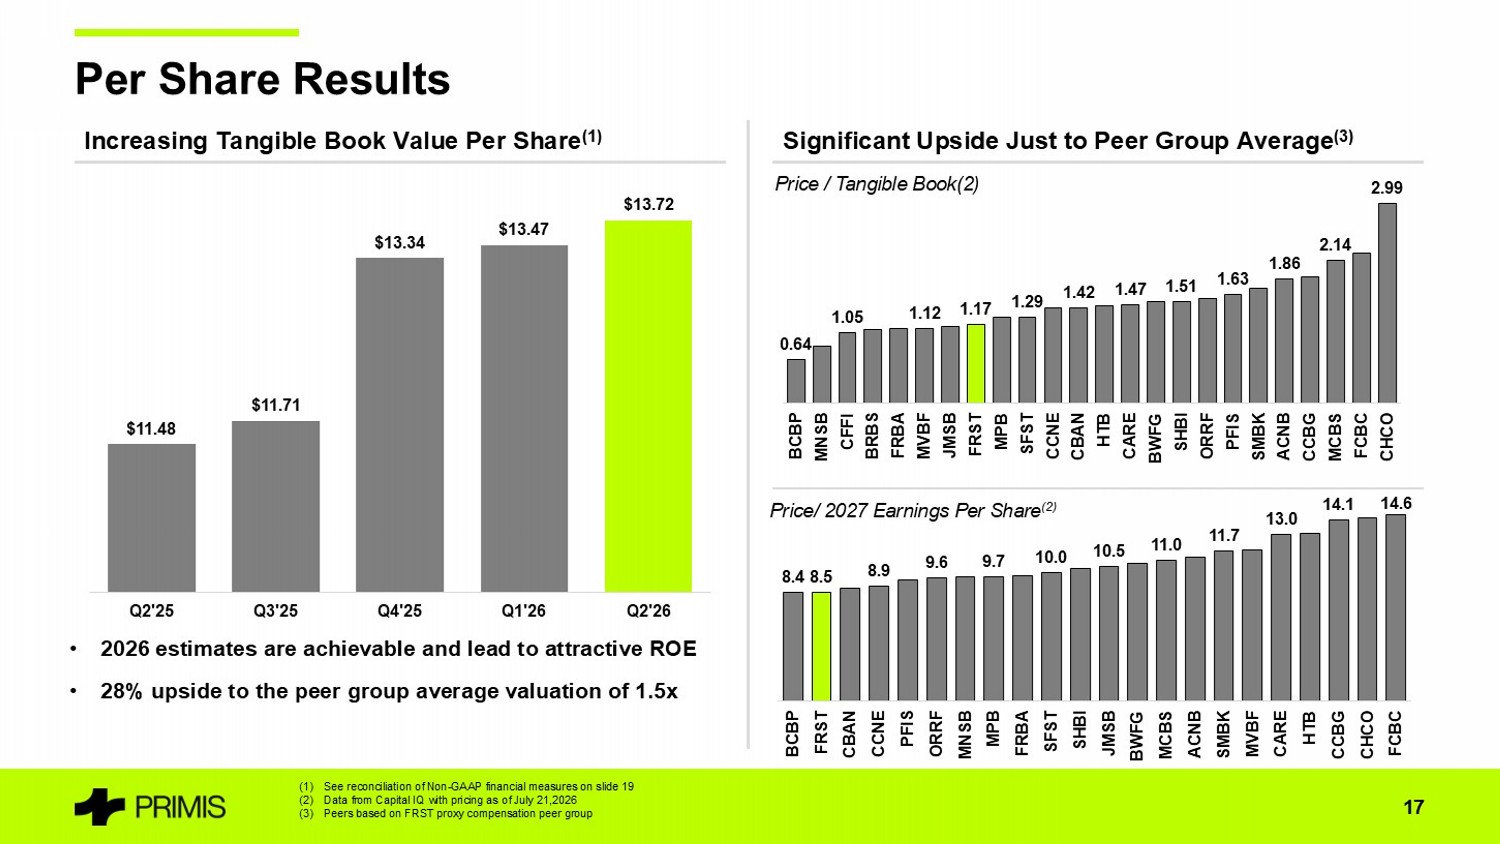
Per Share Results (1) See reconciliation of Non - GAAP financial measures on slide 19 (2) Data from Capital IQ with pricing as of July 21,2026 (3) Peers based on FRST proxy compensation peer group 17 Increasing Tangible Book Value Per Share (1) Significant Upside Just to Peer Group Average (3) • 2026 estimates are achievable and lead to attractive ROE • 28% upside to the peer group average valuation of 1.5x $13.72 $13.47 $13.34 $11.71 $11.48 Q2'26 Q1'26 Q4'25 Q3'25 Q2'25 0.64 1.05 1.12 1.17 1.29 1.42 1.47 1.51 1.63 1.86 2.14 2.99 BCBP MNSB CFFI BRBS FRBA MVBF JMSB FRST MPB SFST CCNE CBAN HTB CARE BWFG SHBI ORRF PFIS SMBK ACNB CCBG MCBS FCBC CHCO Price / Tangible Book(2) 8.4 8.5 8.9 9.6 9.7 10.0 10.5 11.0 11.7 13.0 14.1 14.6 BCBP FRST CBAN CCNE PFIS ORRF MNSB MPB FRBA SFST SHBI JMSB BWFG MCBS ACNB SMBK MVBF CARE HTB CCBG CHCO FCBC Price/ 2027 Earnings Per Share (2)
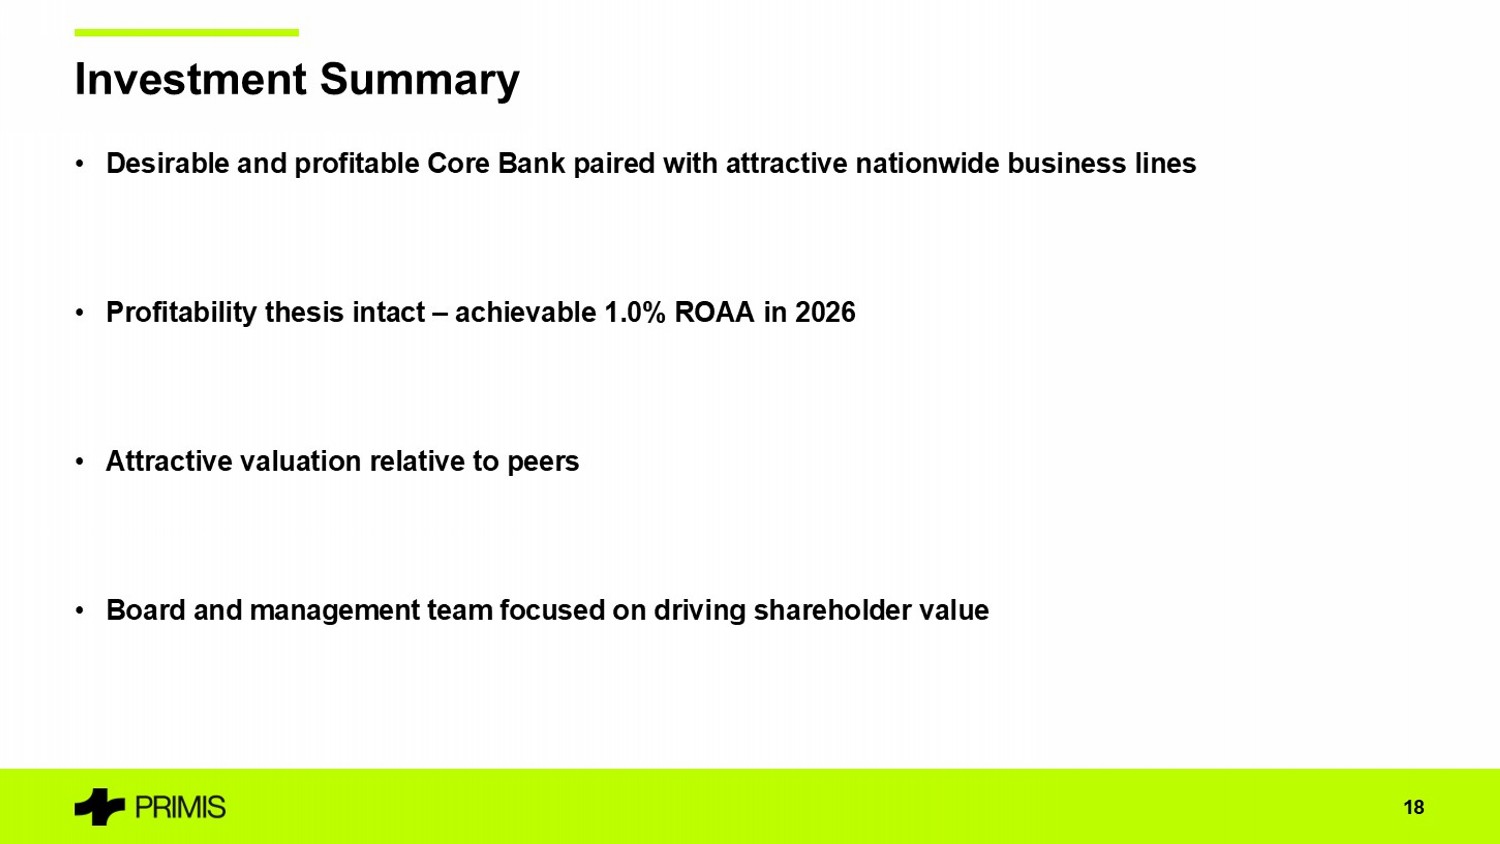
• Desirable and profitable Core Bank paired with attractive nationwide business lines • Profitability thesis intact – achievable 1.0% ROAA in 2026 • Attractive valuation relative to peers • Board and management team focused on driving shareholder value Investment Summary 18
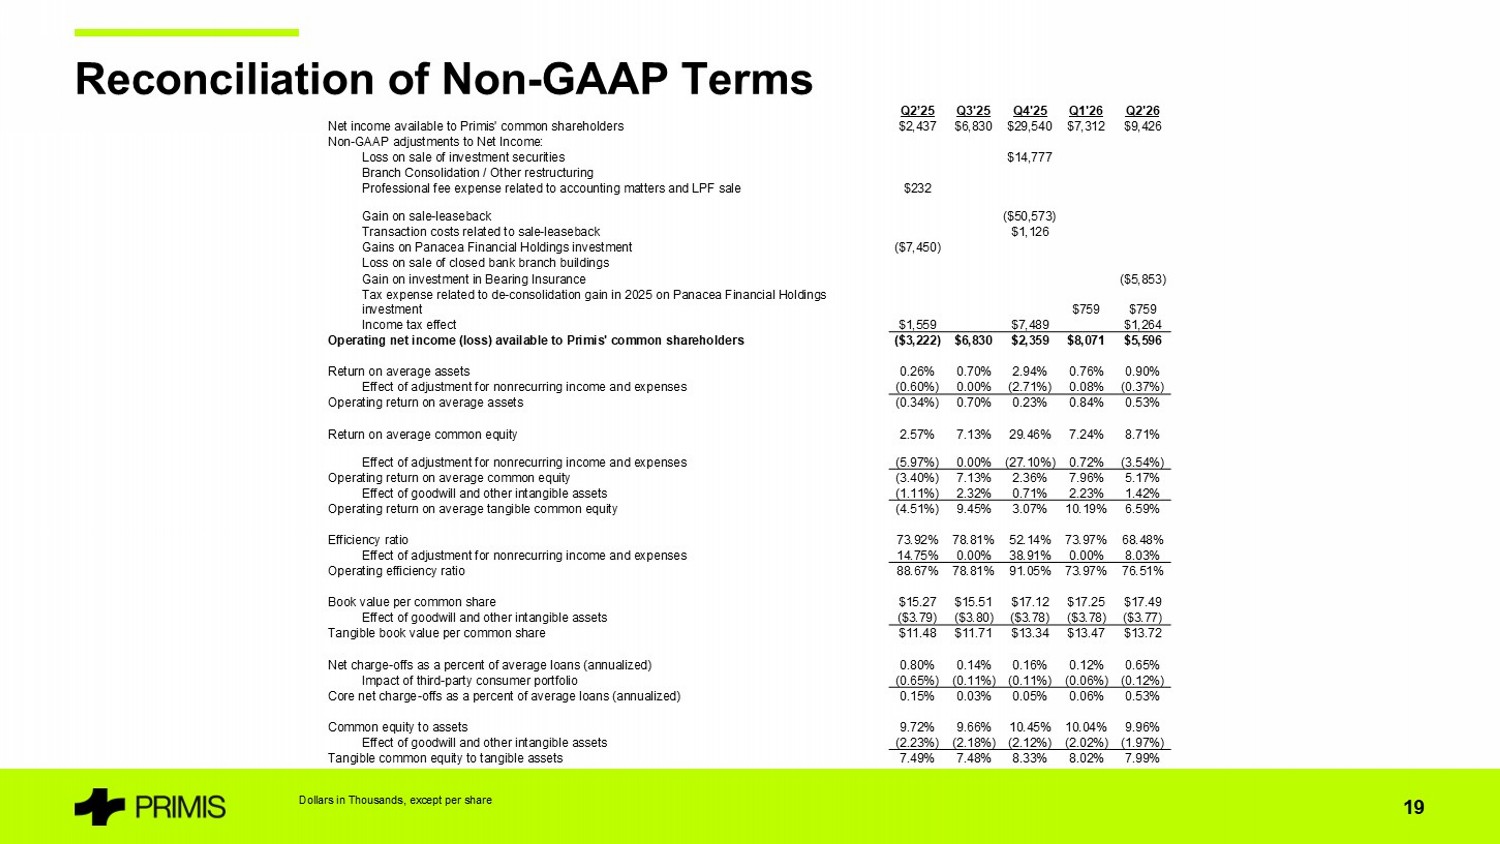
Reconciliation of Non - GAAP Terms 19 Dollars in Thousands, except per share Q2'26 Q1'26 Q4'25 Q3'25 Q2'26 $9,426 $7,312 $29,540 $6,830 $2,437 Net income available to Primis' common shareholders Non - GAAP adjustments to Net Income: $14,777 Loss on sale of investment securities Branch Consolidation / Other restructuring $232 Professional fee expense related to accounting matters and LPF sale ($50,573) Gain on sale - leaseback $1,126 Transaction costs related to sale - leaseback ($7,450) Gains on Panacea Financial Holdings investment Loss on sale of closed bank branch buildings ($5,853) Gain on investment in Bearing Insurance $759 $759 Tax expense related to de - consolidation gain in 2025 on Panacea Financial Holdings investment $1,264 $7,489 $1,559 Income tax effect $5,596 $8,071 $2,359 $6,830 ($3,222) Operating net income (loss) available to Primis' common shareholders 0.90% 0.76% 2.94% 0.70% 0.26% Return on average assets (0.37%) 0.08% (2.71%) 0.00% (0.60%) Effect of adjustment for nonrecurring income and expenses 0.53% 0.84% 0.23% 0.70% (0.34%) Operating return on average assets 8.71% 7.24% 29.46% 7.13% 2.57% Return on average common equity (3.54%) 0.72% (27.10%) 0.00% (5.97%) Effect of adjustment for nonrecurring income and expenses 5.17% 7.96% 2.36% 7.13% (3.40%) Operating return on average common equity 1.42% 2.23% 0.71% 2.32% (1.11%) Effect of goodwill and other intangible assets 6.59% 10.19% 3.07% 9.45% (4.51%) Operating return on average tangible common equity 68.48% 73.97% 52.14% 78.81% 73.92% Efficiency ratio 8.03% 0.00% 38.91% 0.00% 14.75% Effect of adjustment for nonrecurring income and expenses 76.51% 73.97% 91.05% 78.81% 88.67% Operating efficiency ratio $17.49 $17.25 $17.12 $15.51 $15.27 Book value per common share ($3.77) ($3.78) ($3.78) ($3.80) ($3.79) Effect of goodwill and other intangible assets $13.72 $13.47 $13.34 $11.71 $11.48 Tangible book value per common share 0.65% 0.12% 0.16% 0.14% 0.80% Net charge - offs as a percent of average loans (annualized) (0.12%) (0.06%) (0.11%) (0.11%) (0.65%) Impact of third - party consumer portfolio 0.53% 0.06% 0.05% 0.03% 0.15% Core net charge - offs as a percent of average loans (annualized) 9.96% 10.04% 10.45% 9.66% 9.72% Common equity to assets (1.97%) (2.02%) (2.12%) (2.18%) (2.23%) Effect of goodwill and other intangible assets 7.99% 8.02% 8.33% 7.48% 7.49% Tangible common equity to tangible assets