
INTEGRITY SAFETY RESPECT EXCELLENCE S e p t e m b e r 2 0 2 5 Investor Presentation
FORWARD-LOOKING STATEMENTS AND NON-GAAP FINANCIAL MEASURES 2 This presentation contains statements concerning future events and expectations, including, without limitation, statements re lating to third quarter 2025 outlook and expected key drivers for Boise Cascade and each of its business segments. These statements constitute forward-looking statements within the meaning of the Private Securities Litigation Reform Act of 1995. Any statements that express, or involve discussions as to, expectations, beliefs, plans, objectives, assumptions, or future events or performance, often, but not always, through the use of words or phrases such as "anticipates," "believes," "could," "estimates," "expects," "intends," “outlook,” "potential," "plans," "predicts," "preliminary," "projects," "targets," "may," "may result," or similar expressions, are not statements of historical facts and may be forward-looking. Forward-looking statements are not guarantees of future performance, involve estimates, assumptions, risks, and uncertainties, and may differ materially from actual results, performance, or outcomes. Factors that could cause actual results or outcomes to differ materially from those contained in f orward-looking statements include those factors set forth in Boise Cascade’s most recent Annual Report on Form 10-K, subsequent reports filed by Boise Cascade with the Securities and Exchange Commission (SEC), and the following important factors: the commodity nature of a portion of our products and their price movements, which are driven largely by general economic conditions, industry capacity and operating rates, industry cycles that affect supply and demand, and net import and export activity; the highly competitive nature of our industry; declines in demand for our products due to competi ng technologies or materials, as well as changes in building code provisions; disruptions to information systems used to process and store customer, employee, and vendor information, as well as the techn ology that manages our operations and other business processes; material disruptions and/or major equipment failure at our manufacturing facilities; declining demand for residual byproducts, particu larly wood chips generated in our manufacturing operations; labor disruptions, shortages of skilled and technical labor, or increased labor costs; the need to successfully formulate and implement succession plans for key members of our management team; product shortages, loss of key suppliers, and our dependence on third-party suppliers and manufacturers; the cost and availabil ity of third-party transportation services used to deliver the goods we manufacture and distribute, as well as our raw materials; cost and availabil ity of raw materials, including wood fiber and glues and resins; our ability to execu te our organic growth and acquisition strategies efficiently and effectively; failures or delays with new or existing technology systems and software platforms; our ability to successfully pursue our long-term growth strategy related to innovation and digital technology; concentration of our sales among a relatively small group of customers, as well as the financial condition and creditworthiness of our customers; impairment of our long-lived assets, goodwill, and/or intangible assets; substantial ongoing capital investment costs, including those associated with organic growth and acquisitions, and the diffic ulty in offsetting fixed costs related to those investments; our indebtedness, including the possibility that we may not generate sufficient cash flows from operations or that future borrowings may not be available in amounts sufficient to fulfi ll our debt obligations and fund other liquidity needs; restrictive covenants contained in our debt agreements; changes in foreign trade policy, including the impos ition of tariffs; compliance with data privacy and security laws and regulations; the impacts of climate change and related legislative and regulatory responses intended to reduce climate change; cost of complia nce with government regulations, in particular, environmental regulations; exposure to product liability, product warranty, casualty, construction defect, and other claims; and fluctuations in the mar ket for our equity. It is not possible to predict or identify all risks and uncertainties that might affect the accuracy of our forward -looking statements and, consequently, our descriptions of such risks and uncertainties should not be considered exhaustive. There is no guarantee that any of the events antic ipated by these forward -looking statements will occur, and if any of the events do occur, there is no guarantee what effect they will have on the company's business, results of operations, cash flows, financial condition and future prospects. Forward-looking statements speak only as of the date they are made, and, except as required by law, we undertake no obligation to publicly update or revise any forward-looking statements, whether because of new information, future events, or otherwise. This presentation includes references to EBITDA, Adjusted EBITDA and Segment EBITDA, which are non-GAAP financial measures within the meaning of the SEC’s Regulation G. Reconciliations of net income to EBITDA and Adjusted EBITDA and segment income to Segment EBITDA are included as an appendix.
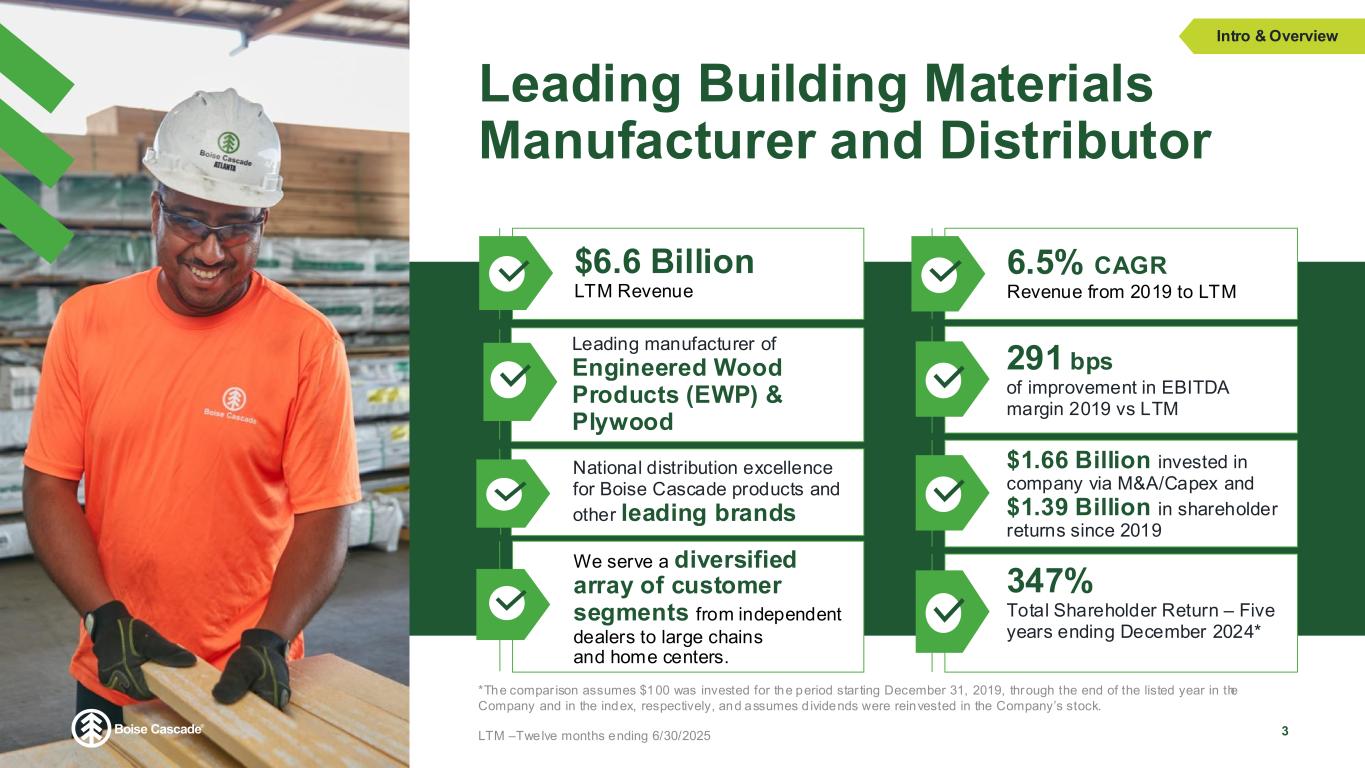
Leading Building Materials Manufacturer and Distributor 347% Total Shareholder Return – Five years ending December 2024* Leading manufacturer of Engineered Wood Products (EWP) & Plywood $1.66 Billion invested in company via M&A/Capex and $1.39 Billion in shareholder returns since 2019 291 bps of improvement in EBITDA margin 2019 vs LTM $6.6 Billion LTM Revenue We serve a diversified array of customer segments from independent dealers to large chains and home centers. National distribution excellence for Boise Cascade products and other leading brands 6.5% CAGR Revenue from 2019 to LTM Intro & Overview 3 *The compar ison assumes $100 was invested for the period star ting December 31, 2019, through the end of the listed year in the Company and in the index, respectively, and assumes d ividends were reinvested in the Company’s stock. LTM –Twelve months ending 6/30/2025
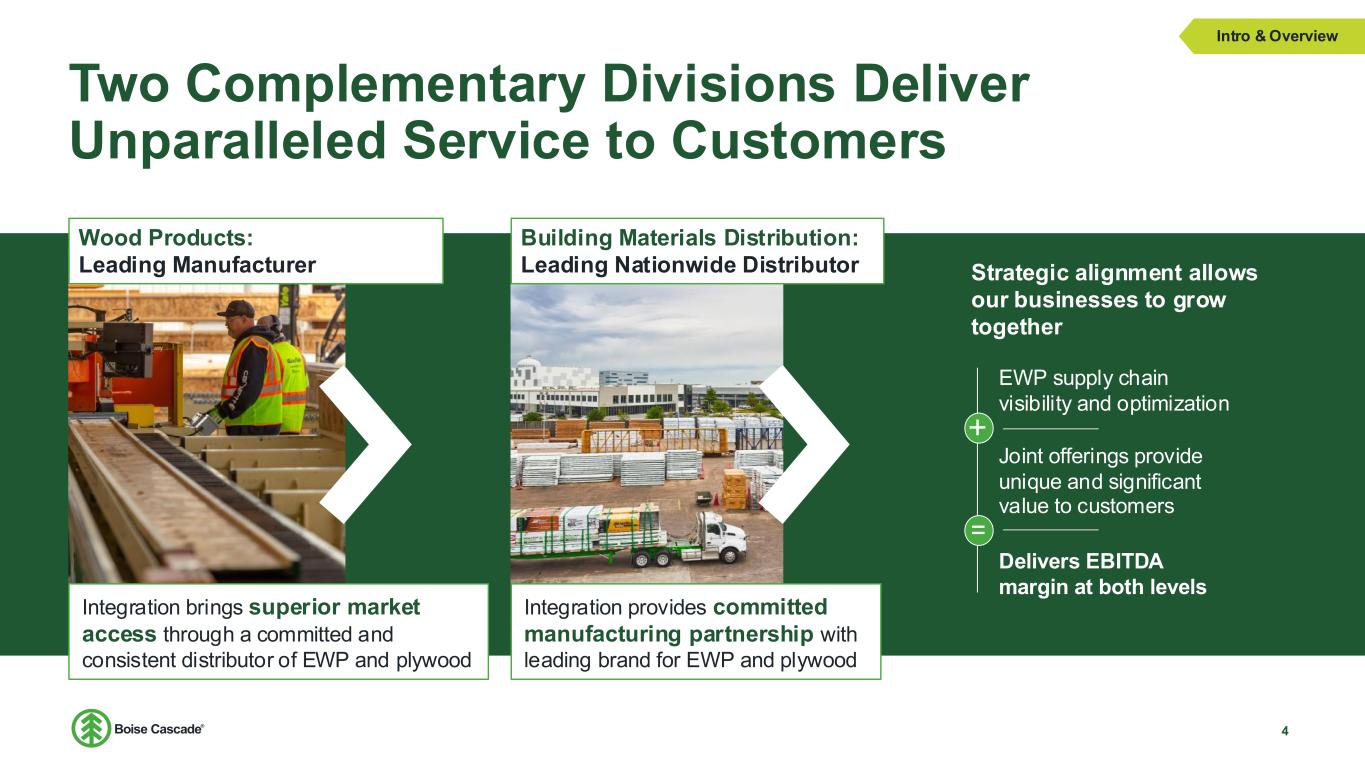
Two Complementary Divisions Deliver Unparalleled Service to Customers 4 Intro & Overview Wood Products: Leading Manufacturer Integration brings superior market access through a committed and consistent distributor of EWP and plywood Integration provides committed manufacturing partnership with leading brand for EWP and plywood Building Materials Distribution: Leading Nationwide Distributor EWP supply chain visibility and optimization Joint offerings provide unique and significant value to customers Strategic alignment allows our businesses to grow together Delivers EBITDA margin at both levels
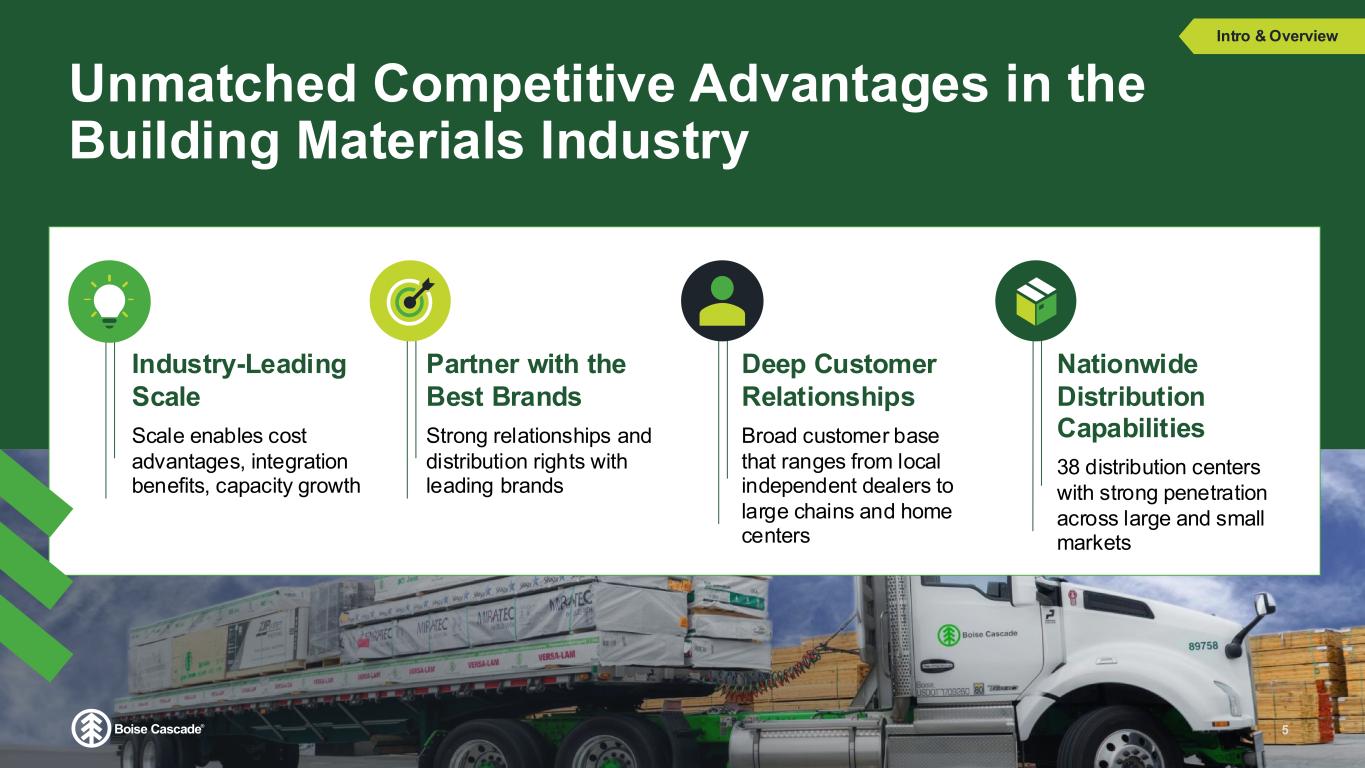
Unmatched Competitive Advantages in the Building Materials Industry 5 Deep Customer Relationships Broad customer base that ranges from local independent dealers to large chains and home centers Nationwide Distribution Capabilities 38 distribution centers with strong penetration across large and small markets Industry-Leading Scale Scale enables cost advantages, integration benefits, capacity growth Partner with the Best Brands Strong relationships and distribution rights with leading brands Intro & Overview
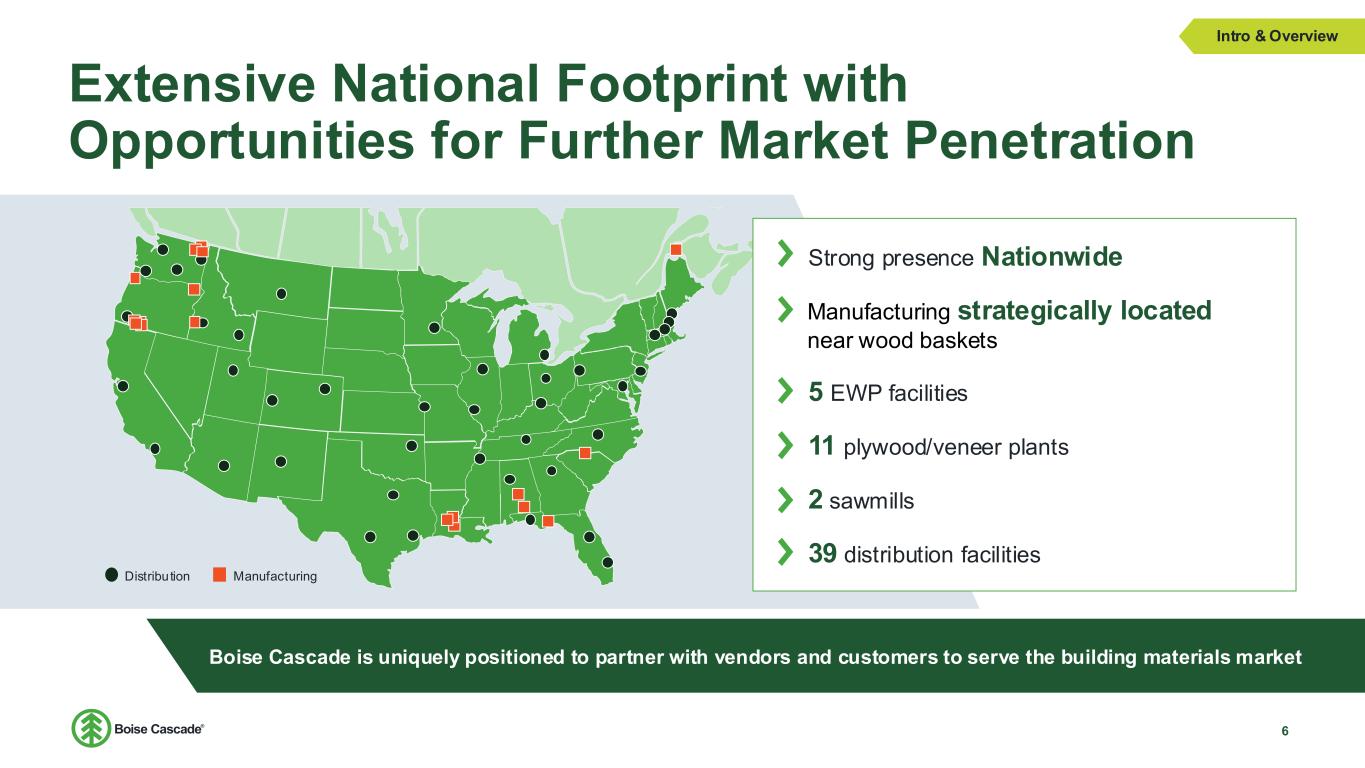
Extensive National Footprint with Opportunities for Further Market Penetration 6 Boise Cascade is uniquely positioned to partner with vendors and customers to serve the building materials market Intro & Overview ManufacturingDistribution Strong presence Nationwide Manufacturing strategically located near wood baskets 5 EWP facilities 11 plywood/veneer plants 2 sawmills 39 distribution facilities
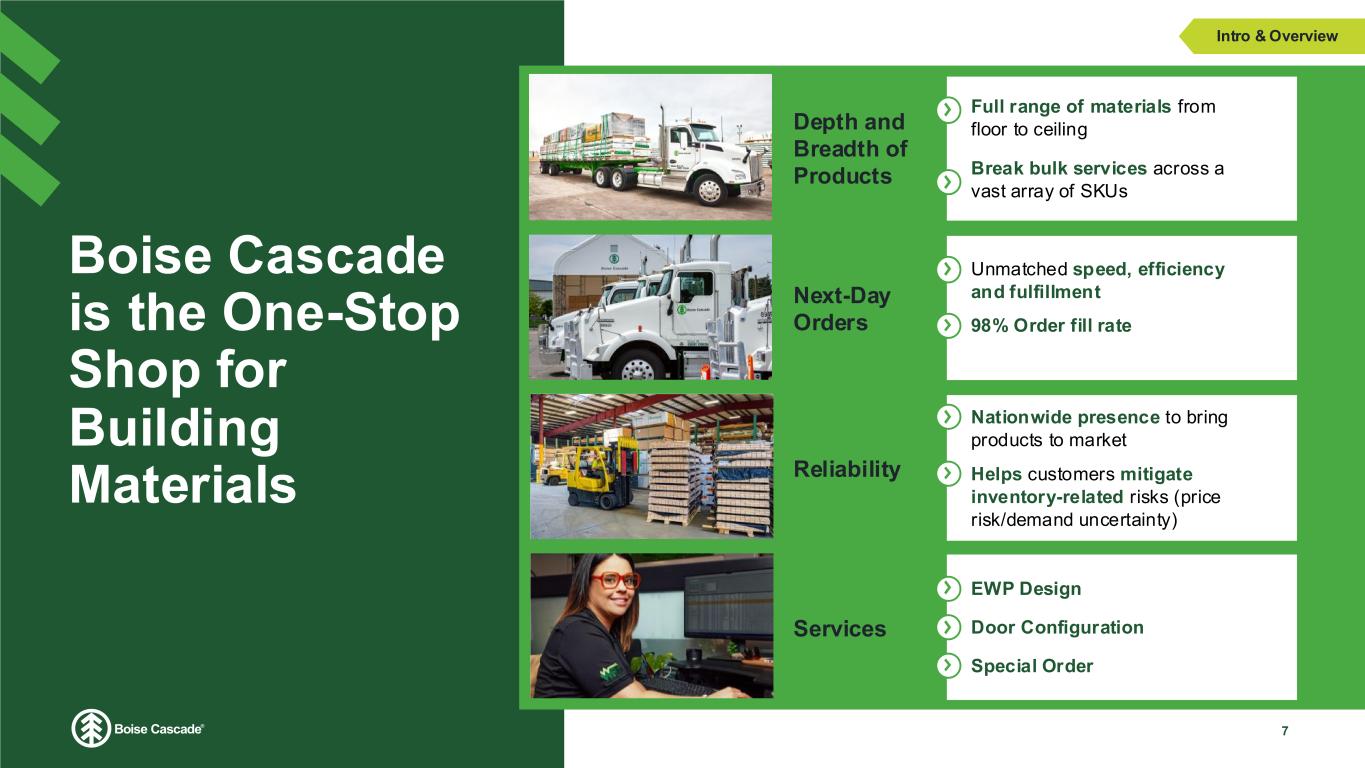
Boise Cascade is the One-Stop Shop for Building Materials 7 Intro & Overview Depth and Breadth of Products Reliability Break bulk services across a vast array of SKUs Full range of materials from floor to ceiling Next-Day Orders Unmatched speed, efficiency and fulfillment 98% Order fill rate Nationwide presence to bring products to market Helps customers mitigate inventory-related risks (price risk/demand uncertainty) Services EWP Design Special Order Door Configuration
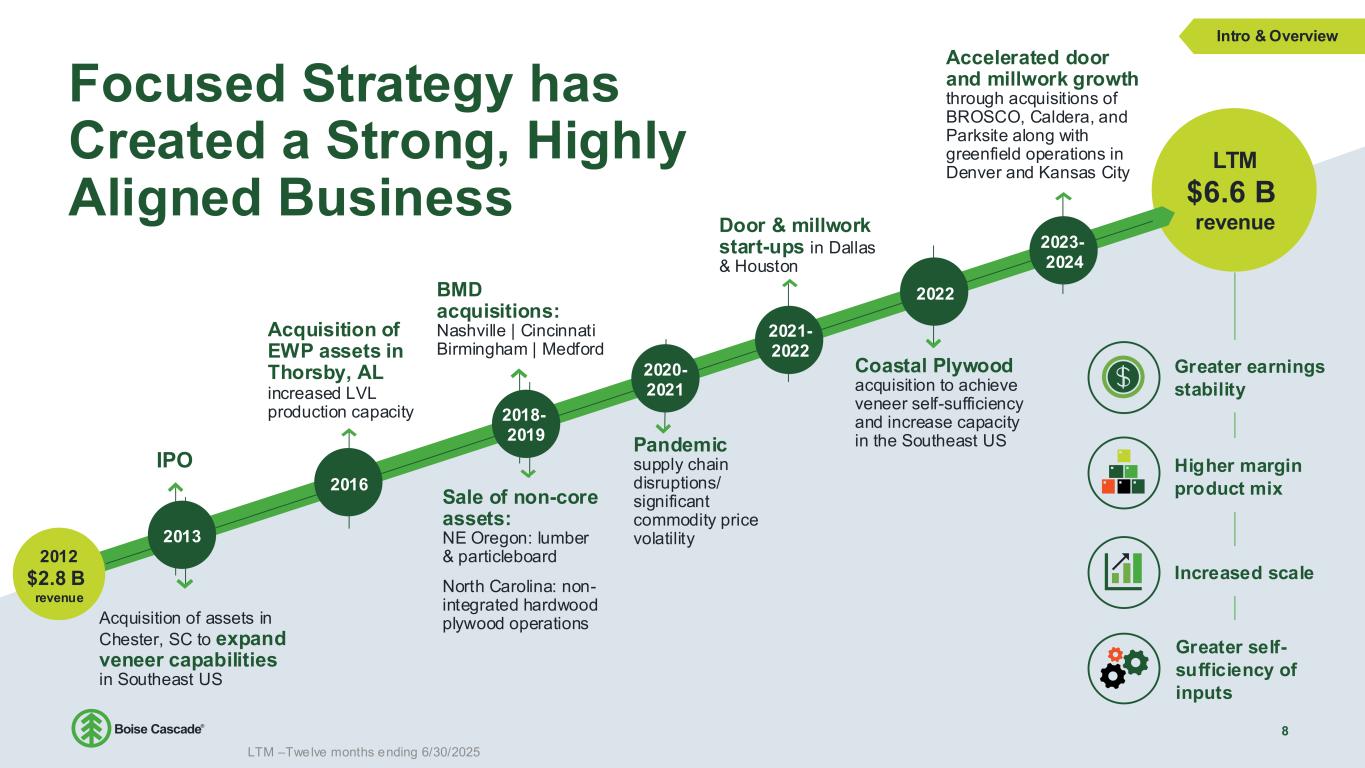
Focused Strategy has Created a Strong, Highly Aligned Business 8 LTM $6.6 B revenue Acquisition of assets in Chester, SC to expand veneer capabilities in Southeast US IPO 2013 2016 BMD acquisitions: Nashville | Cincinnati Birmingham | Medford Coastal Plywood acquisition to achieve veneer self-sufficiency and increase capacity in the Southeast US 2022 Pandemic supply chain disruptions/ significant commodity price volatility 2020- 2021 Accelerated door and millwork growth through acquisitions of BROSCO, Caldera, and Parksite along with greenfield operations in Denver and Kansas City 2018- 2019 Intro & Overview Higher margin product mix Greater earnings stability Greater self- sufficiency of inputs Increased scale Acquisition of EWP assets in Thorsby, AL increased LVL production capacity Sale of non-core assets: NE Oregon: lumber & particleboard North Carolina: non- integrated hardwood plywood operations 2012 $2.8 B revenue 2023- 2024 2021- 2022 Door & millwork start-ups in Dallas & Houston LTM –Twelve months ending 6/30/2025
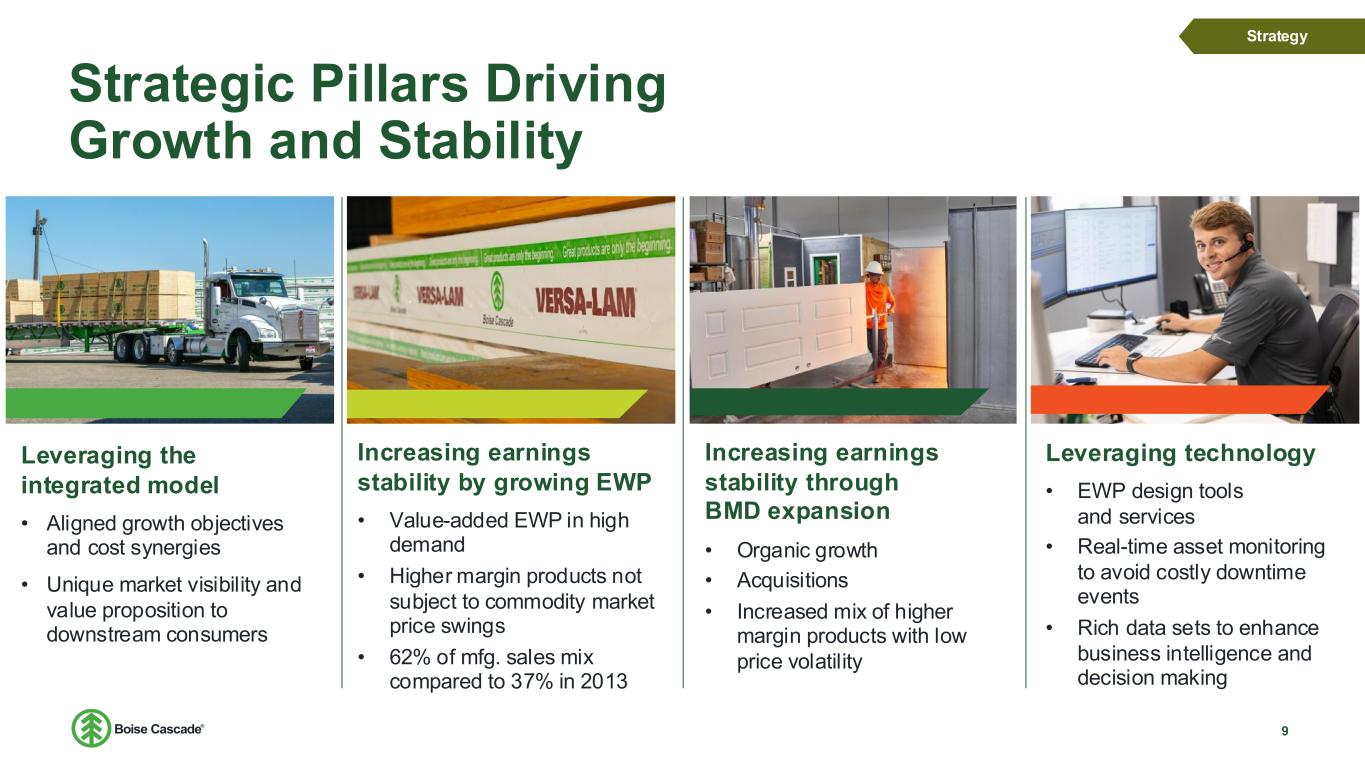
Strategic Pillars Driving Growth and Stability 9 Leveraging the integrated model • Aligned growth objectives and cost synergies • Unique market visibility and value proposition to downstream consumers Increasing earnings stability by growing EWP • Value-added EWP in high demand • Higher margin products not subject to commodity market price swings • 62% of mfg. sales mix compared to 37% in 2013 Increasing earnings stability through BMD expansion • Organic growth • Acquisitions • Increased mix of higher margin products with low price volatility Leveraging technology • EWP design tools and services • Real-time asset monitoring to avoid costly downtime events • Rich data sets to enhance business intelligence and decision making Strategy
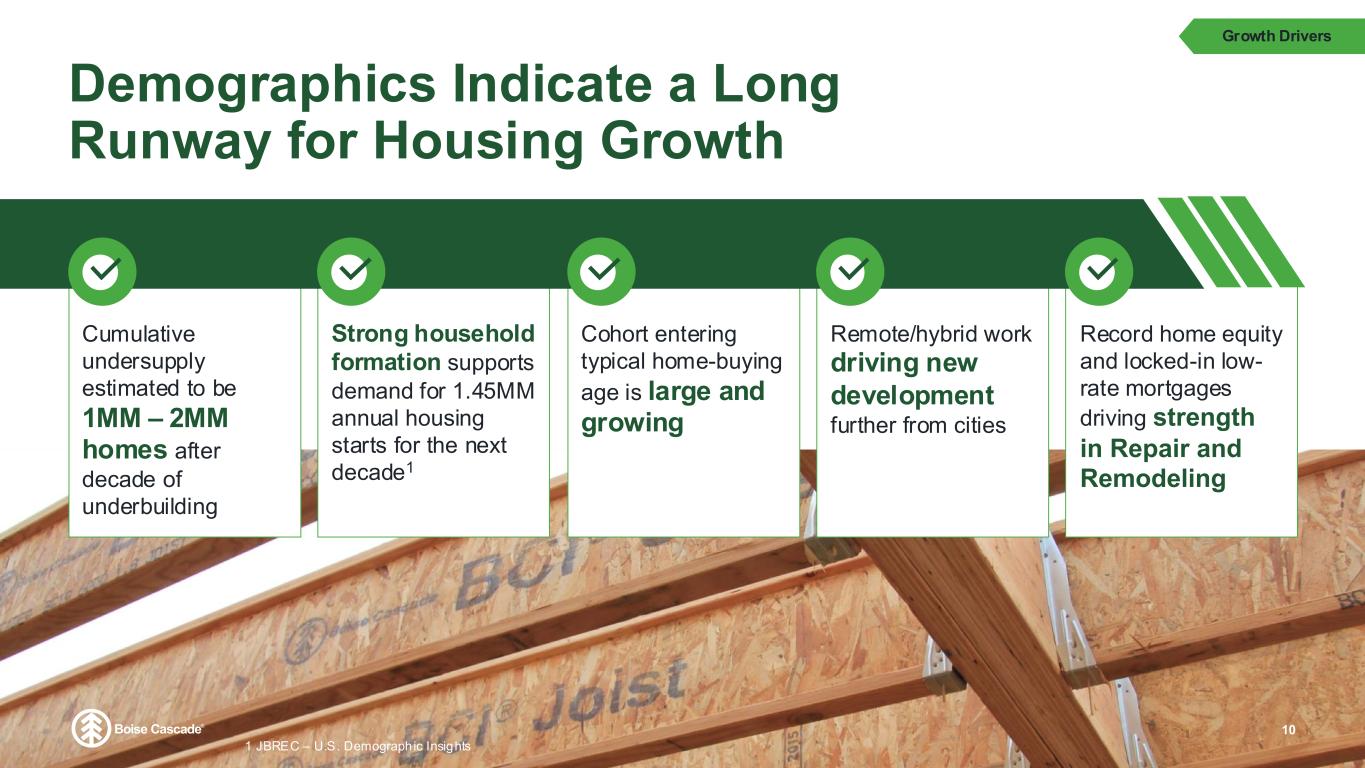
Demographics Indicate a Long Runway for Housing Growth 10 Record home equity and locked-in low- rate mortgages driving strength in Repair and Remodeling Cumulative undersupply estimated to be 1MM – 2MM homes after decade of underbuilding Cohort entering typical home-buying age is large and growing Strong household formation supports demand for 1.45MM annual housing starts for the next decade1 Remote/hybrid work driving new development further from cities Growth Drivers 1 JBREC – U.S. Demographic Insights
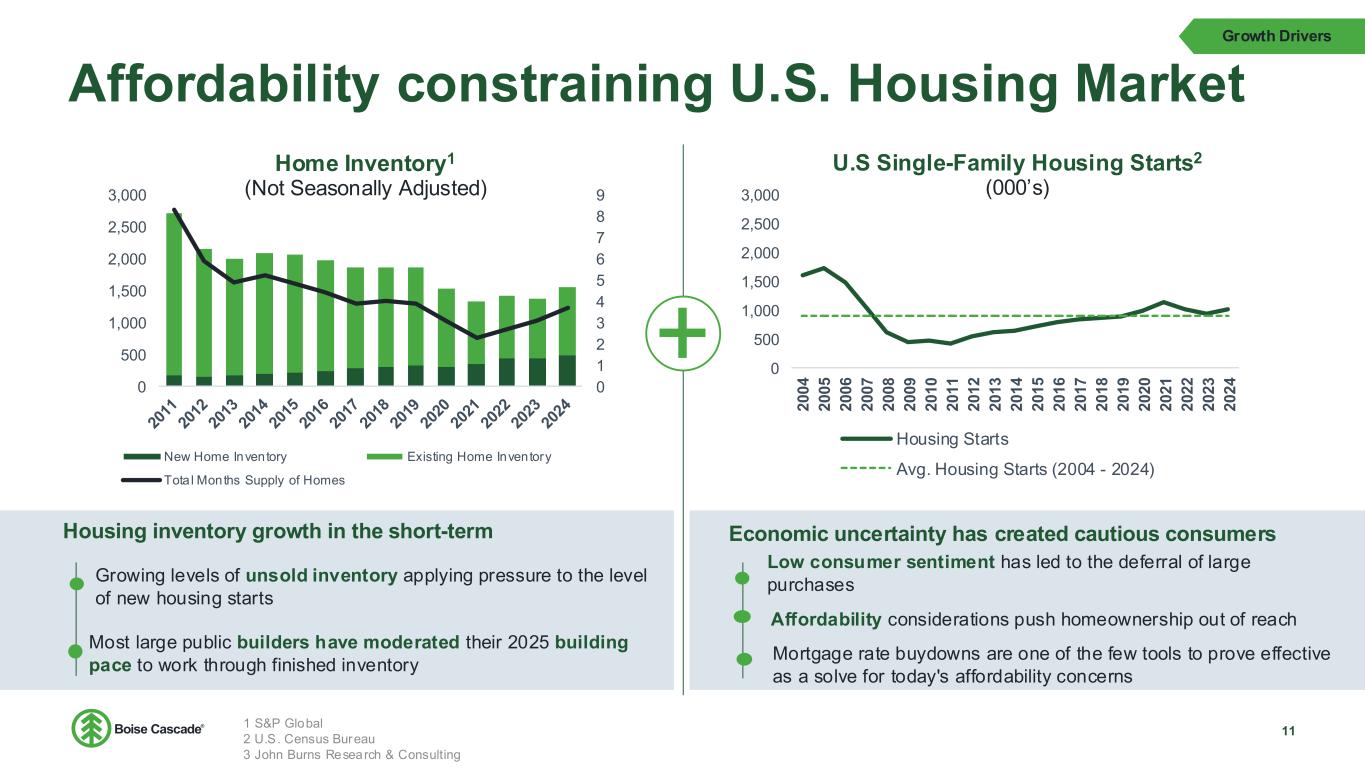
Affordability constraining U.S. Housing Market 11 Housing inventory growth in the short-term Economic uncertainty has created cautious consumers U.S Single-Family Housing Starts2 (000’s) Home Inventory1 (Not Seasonally Adjusted) Most large public builders have moderated their 2025 building pace to work through finished inventory Low consumer sentiment has led to the deferral of large purchases Growth Drivers 0 500 1,000 1,500 2,000 2,500 3,000 2 0 0 4 2 0 0 5 2 0 0 6 2 0 0 7 2 0 0 8 2 0 0 9 2 0 1 0 2 0 1 1 2 0 1 2 2 0 1 3 2 0 1 4 2 0 1 5 2 0 1 6 2 0 1 7 2 0 1 8 2 0 1 9 2 0 2 0 2 0 2 1 2 0 2 2 2 0 2 3 2 0 2 4 Housing Starts Avg. Housing Starts (2004 - 2024) 0 1 2 3 4 5 6 7 8 9 0 500 1,000 1,500 2,000 2,500 3,000 New Home Inventory Existing Home Inventory Tota l Months Supply of Homes Mortgage rate buydowns are one of the few tools to prove effective as a solve for today's affordability concerns Growing levels of unsold inventory applying pressure to the level of new housing starts 1 S&P Global 2 U.S. Census Bureau 3 John Burns Research & Consulting Affordability considerations push homeownership out of reach
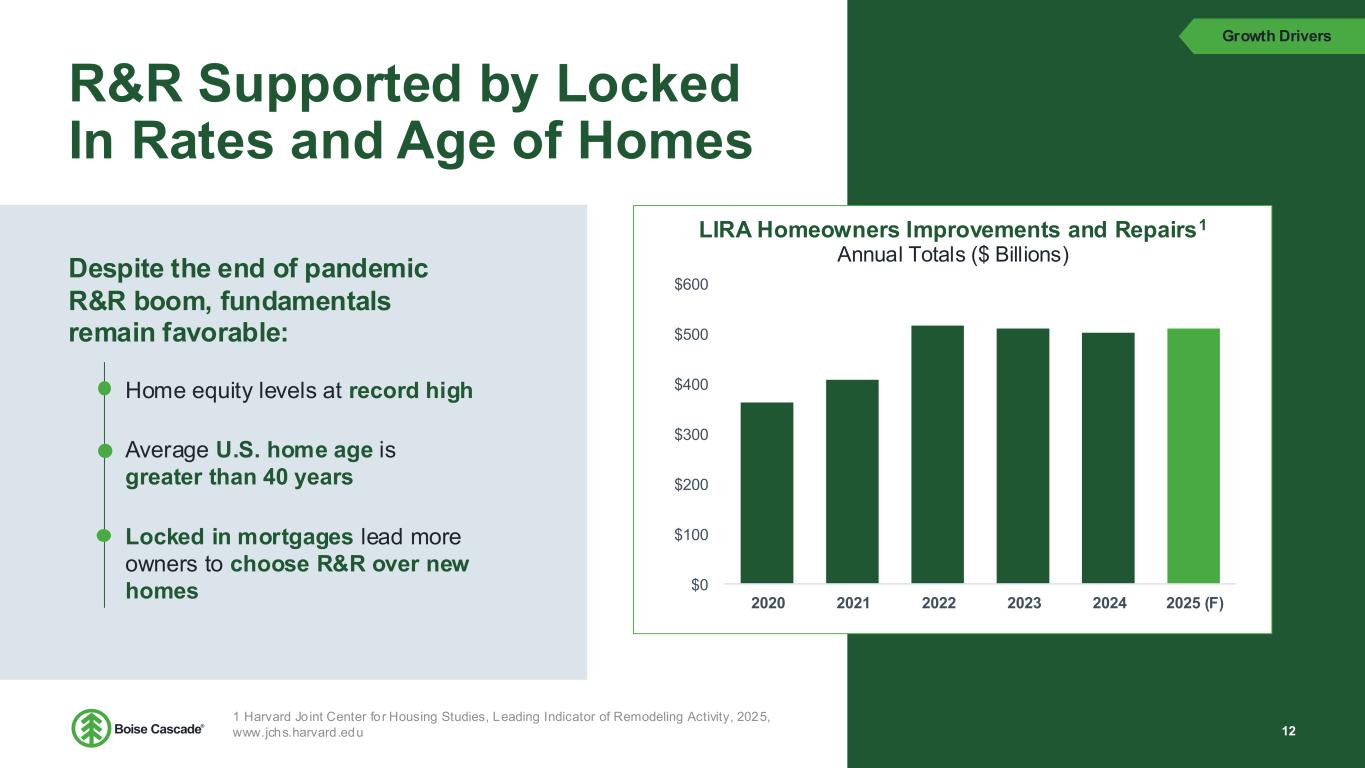
R&R Supported by Locked In Rates and Age of Homes Despite the end of pandemic R&R boom, fundamentals remain favorable: LIRA Homeowners Improvements and Repairs1 Annual Totals ($ Billions) Home equity levels at record high Average U.S. home age is greater than 40 years Locked in mortgages lead more owners to choose R&R over new homes Growth Drivers $0 $100 $200 $300 $400 $500 $600 2020 2021 2022 2023 2024 2025 (F) 12 1 Harvard Joint Center for Housing Studies, Leading Indicator of Remodeling Activity, 2025, www.jchs.harvard.edu
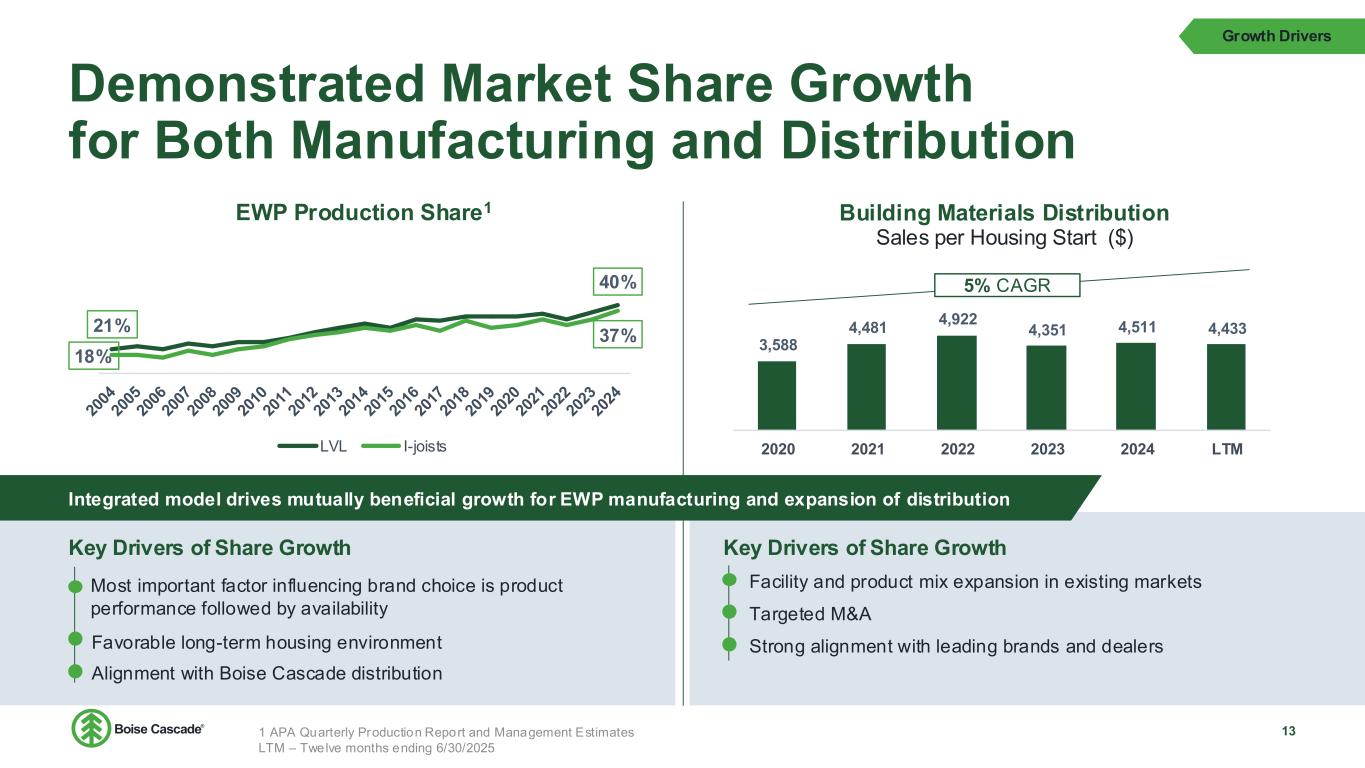
3,588 4,481 4,922 4,351 4,511 4,433 2020 2021 2022 2023 2024 LTM 5% CAGR Demonstrated Market Share Growth for Both Manufacturing and Distribution 13 EWP Production Share1 Building Materials Distribution Sales per Housing Start ($) Key Drivers of Share Growth Key Drivers of Share Growth Most important factor influencing brand choice is product performance followed by availability Favorable long-term housing environment Facility and product mix expansion in existing markets Strong alignment with leading brands and dealers Targeted M&A Growth Drivers 21% 40% 18% 37% LVL I-joists Integrated model drives mutually beneficial growth for EWP manufacturing and expansion of distribution Alignment with Boise Cascade distribution 1 APA Quarterly Production Report and Management Estimates LTM – Twelve months ending 6/30/2025
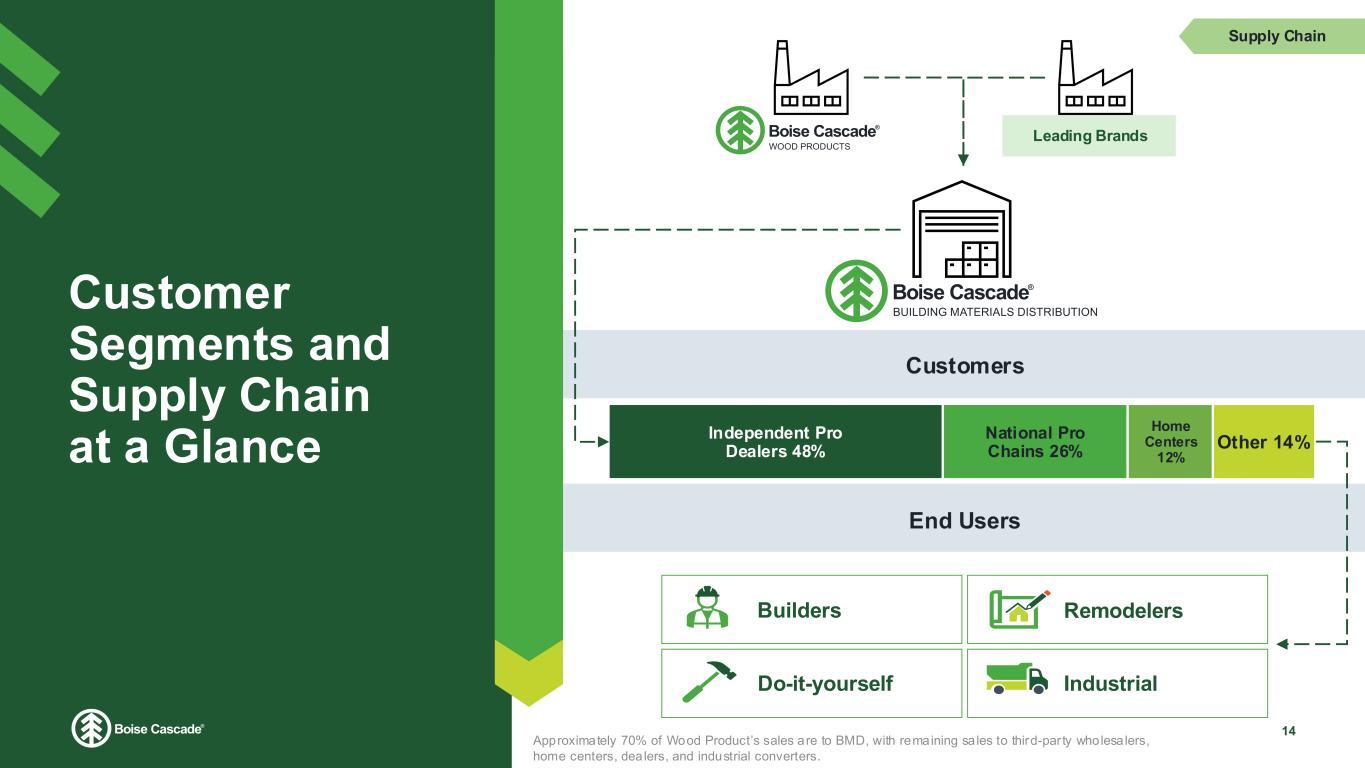
Customer Segments and Supply Chain at a Glance 14 Customers End Users Builders Remodelers Supply Chain IndustrialDo-it-yourself Leading Brands Independent Pro Dealers 48% National Pro Chains 26% Home Centers 12% Other 14% Approximately 70% of Wood Product’s sales are to BMD, with remaining sales to third-par ty wholesalers, home centers, dealers, and industrial converters.
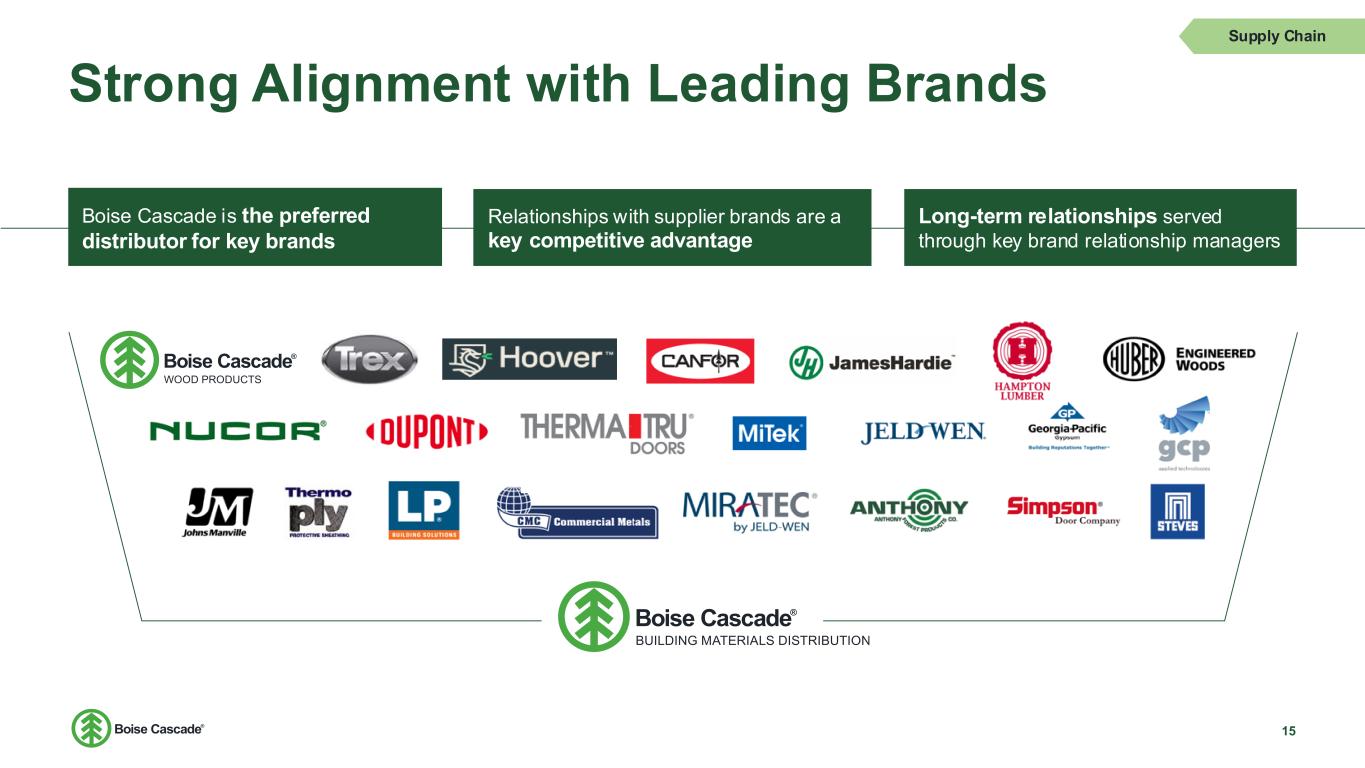
Strong Alignment with Leading Brands 15 Boise Cascade is the preferred distributor for key brands Relationships with supplier brands are a key competitive advantage Long-term relationships served through key brand relationship managers Supply Chain
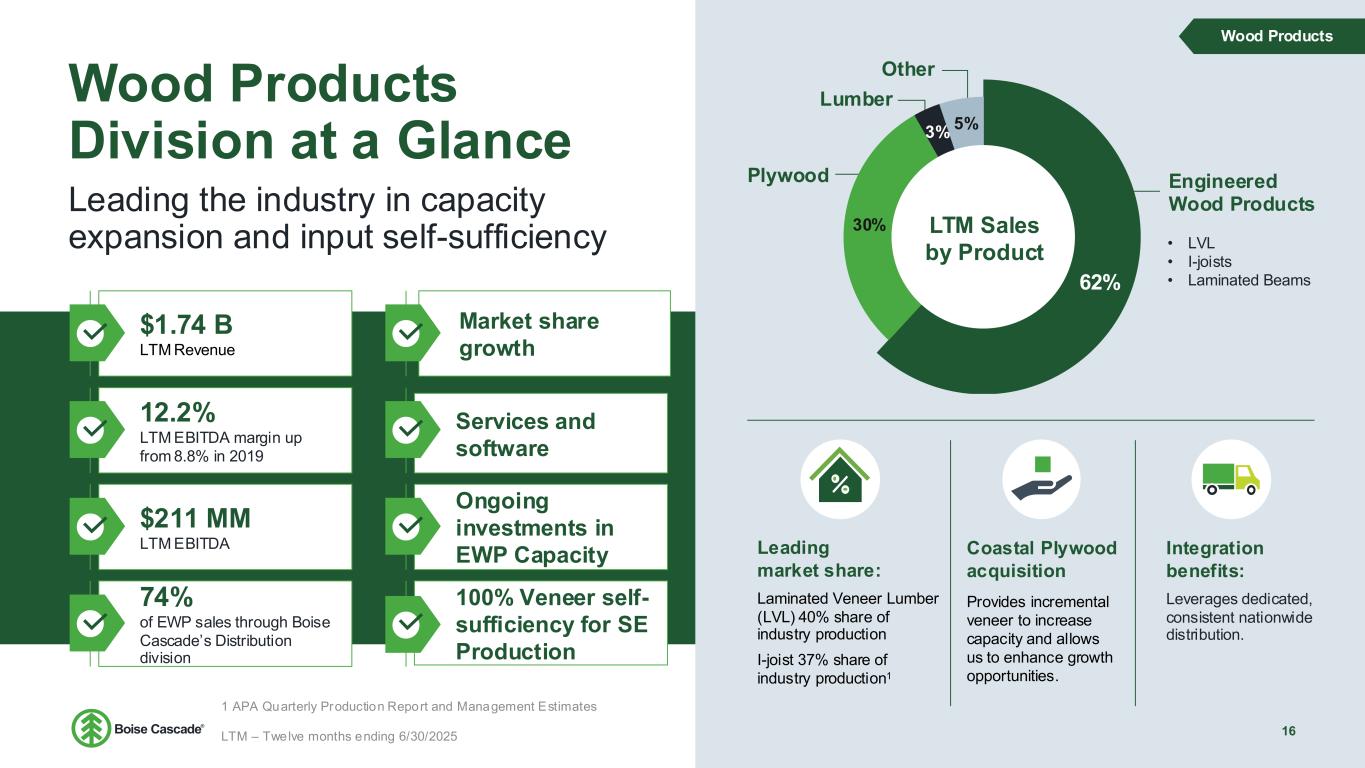
$1.74 B LTM Revenue 12.2% LTM EBITDA margin up from 8.8% in 2019 $211 MM LTM EBITDA 74% of EWP sales through Boise Cascade’s Distribution division Market share growth Services and software Ongoing investments in EWP Capacity Wood Products Division at a Glance Leading the industry in capacity expansion and input self-sufficiency 16 Plywood Lumber Other Engineered Wood Products • LVL • I-joists • Laminated Beams62% 30% 3% 5% LTM Sales by Product Leading market share: Laminated Veneer Lumber (LVL) 40% share of industry production I-joist 37% share of industry production1 Coastal Plywood acquisition Provides incremental veneer to increase capacity and allows us to enhance growth opportunities. Integration benefits: Leverages dedicated, consistent nationwide distribution. Wood Products 100% Veneer self- sufficiency for SE Production 1 APA Quarterly Production Report and Management Estimates LTM – Twelve months ending 6/30/2025
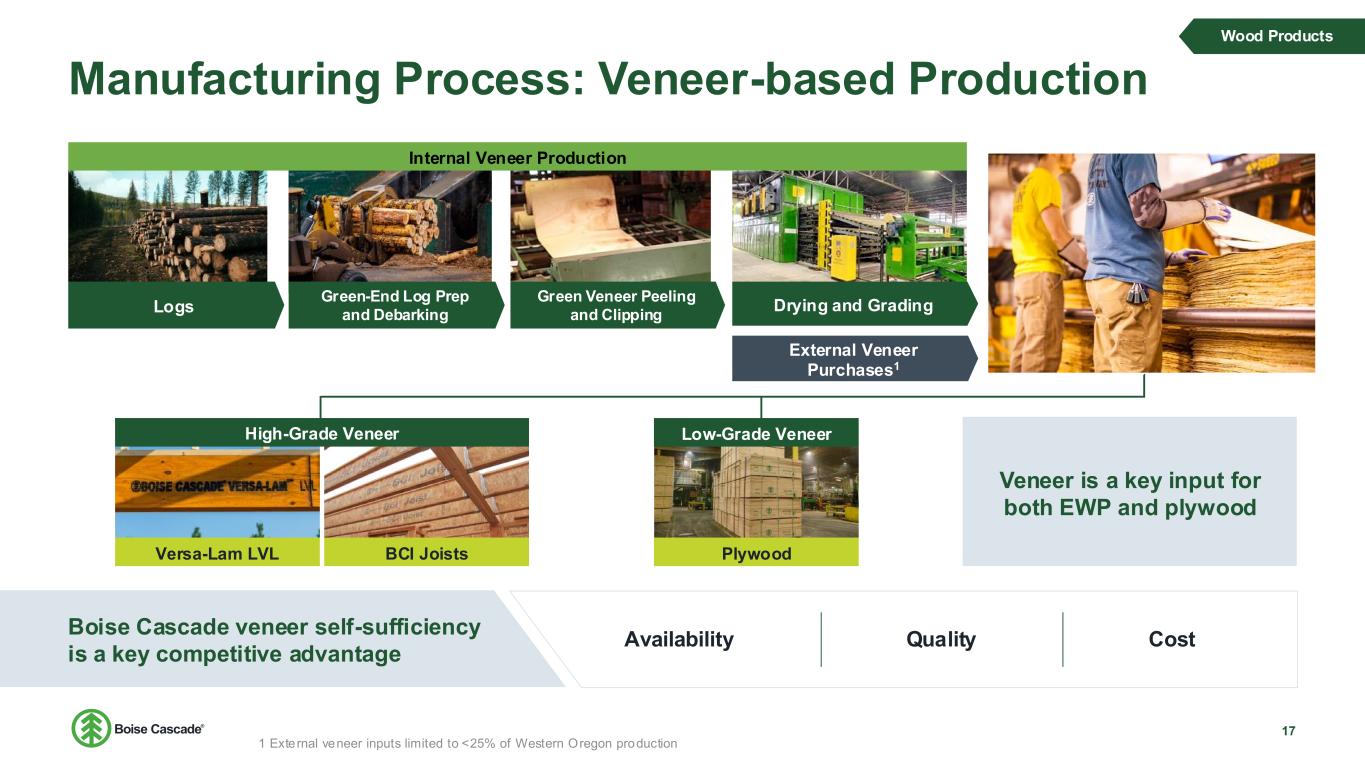
Manufacturing Process: Veneer-based Production 17 Logs Green-End Log Prep and Debarking Green Veneer Peeling and Clipping Drying and Grading External Veneer Purchases1 Boise Cascade veneer self-sufficiency is a key competitive advantage Wood Products Internal Veneer Production Veneer is a key input for both EWP and plywood Low-Grade Veneer Versa-Lam LVL BCI Joists High-Grade Veneer Plywood Availability Quality Cost 1 External veneer inputs limited to <25% of Western Oregon production
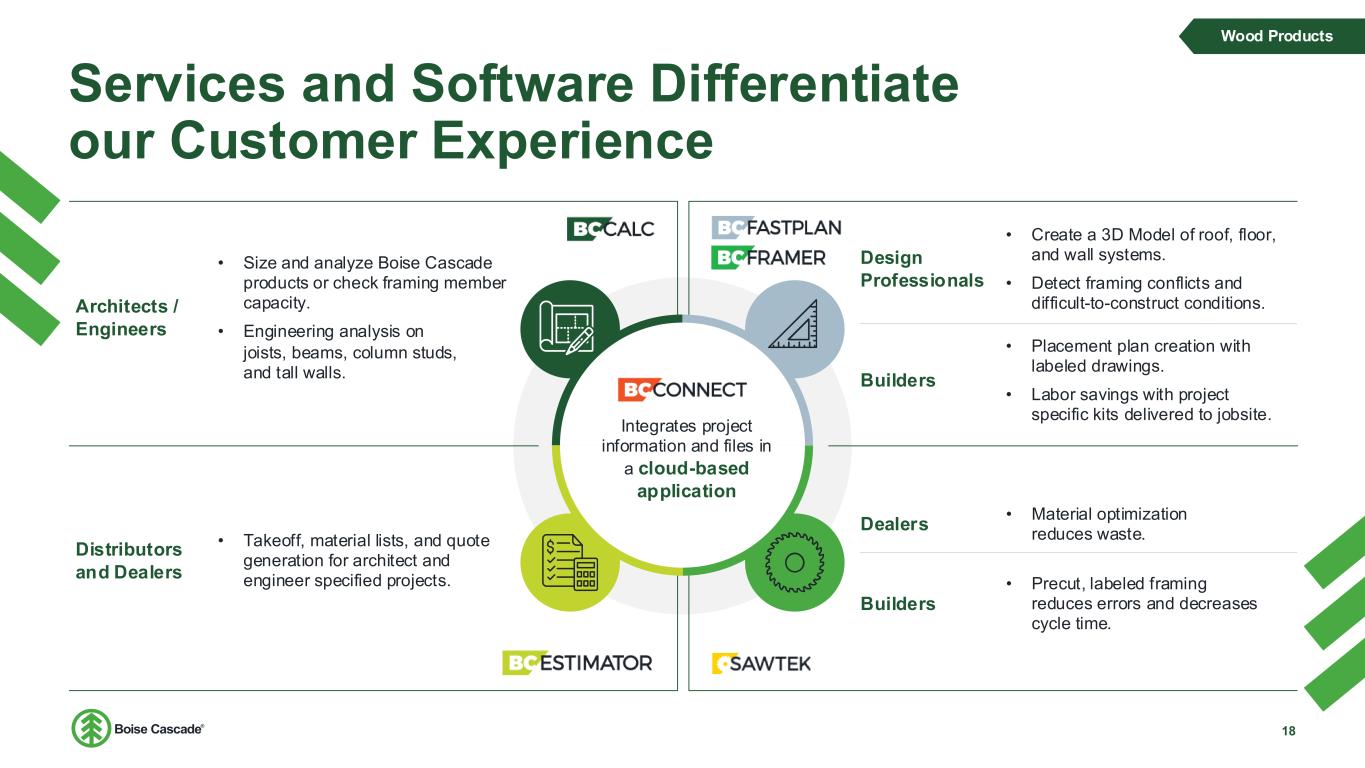
Services and Software Differentiate our Customer Experience 18 Wood Products Architects / Engineers • Size and analyze Boise Cascade products or check framing member capacity. • Engineering analysis on joists, beams, column studs, and tall walls. Distributors and Dealers • Takeoff, material lists, and quote generation for architect and engineer specified projects. Dealers • Material optimization reduces waste. Builders • Precut, labeled framing reduces errors and decreases cycle time. Design Professionals • Create a 3D Model of roof, floor, and wall systems. • Detect framing conflicts and difficult-to-construct conditions. Builders • Placement plan creation with labeled drawings. • Labor savings with project specific kits delivered to jobsite. Integrates project information and files in a cloud-based application
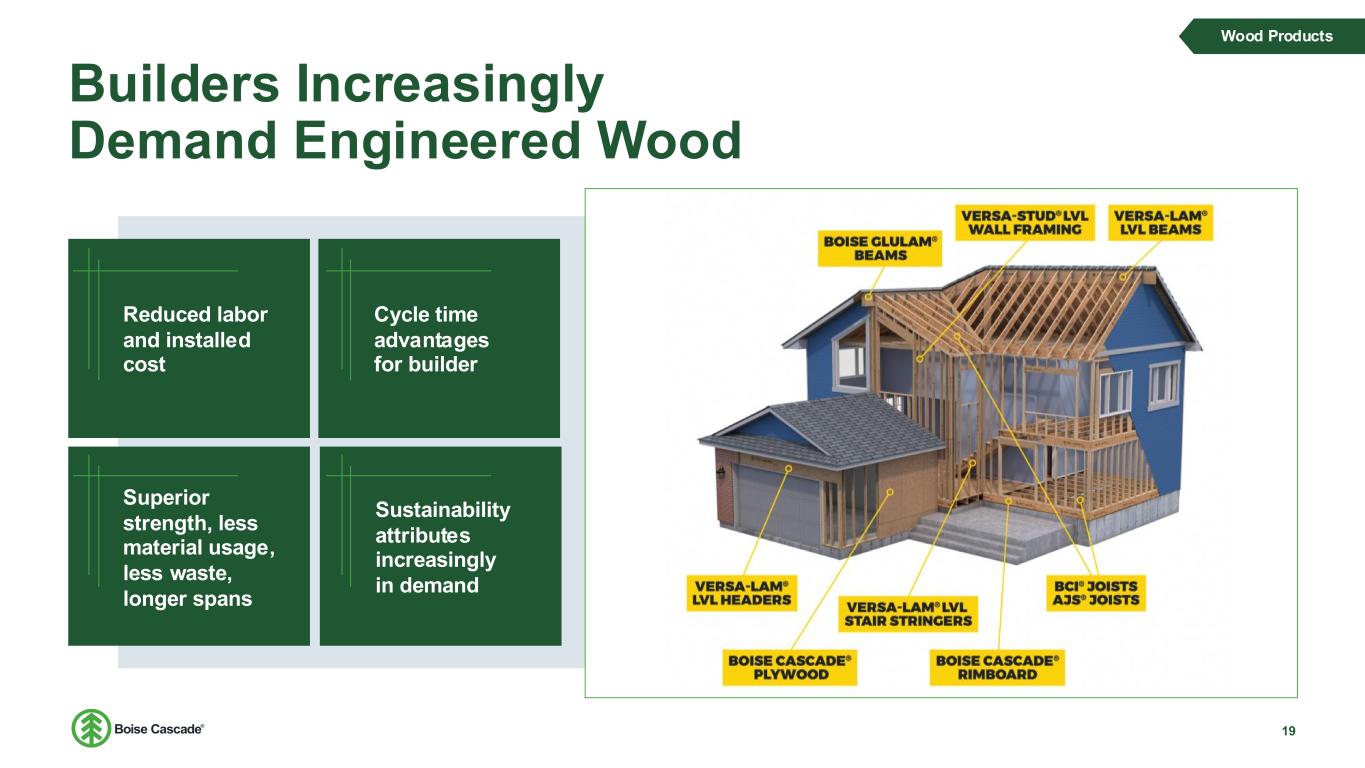
Builders Increasingly Demand Engineered Wood 19 Wood Products Superior strength, less material usage, less waste, longer spans Reduced labor and installed cost Sustainability attributes increasingly in demand Cycle time advantages for builder
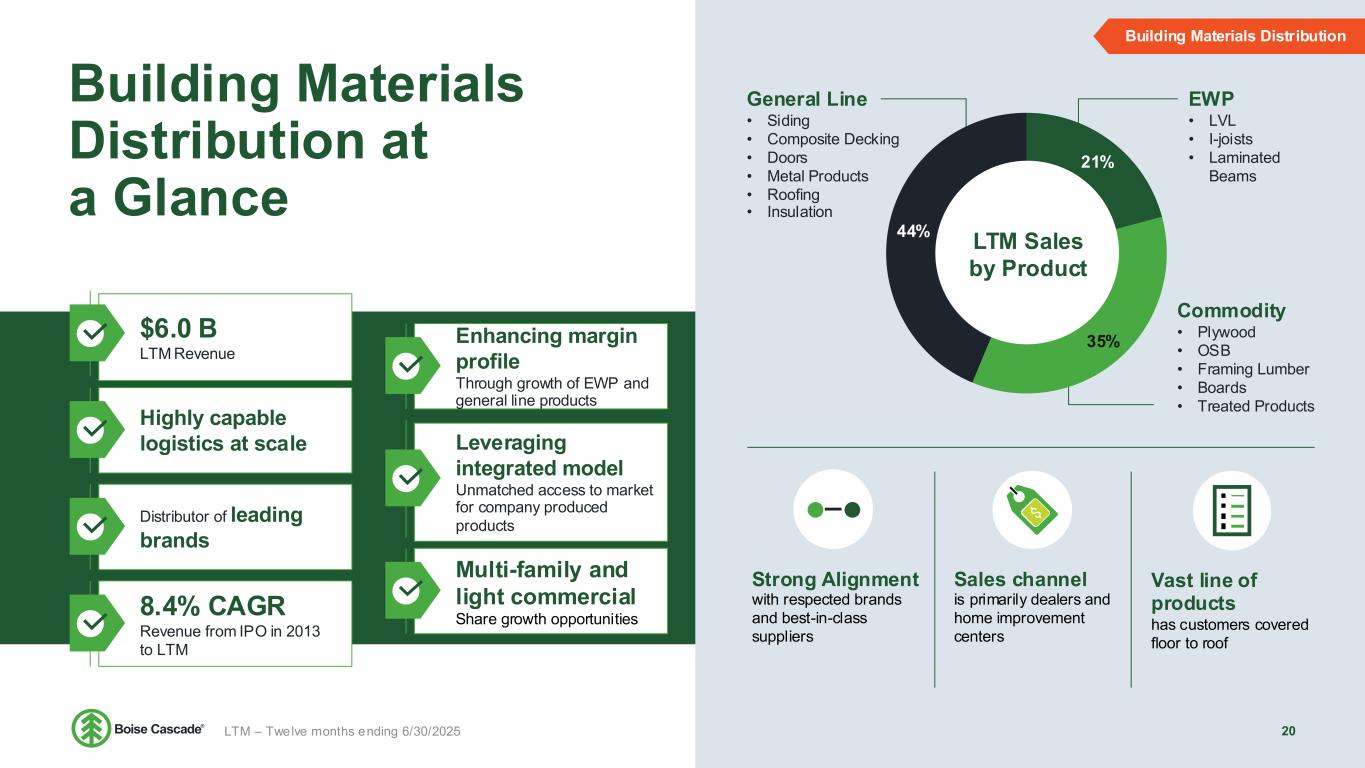
Building Materials Distribution at a Glance 20 $6.0 B LTM Revenue Highly capable logistics at scale Distributor of leading brands 8.4% CAGR Revenue from IPO in 2013 to LTM Enhancing margin profile Through growth of EWP and general line products Leveraging integrated model Unmatched access to market for company produced products Multi-family and light commercial Share growth opportunities Vast line of products has customers covered floor to roof Sales channel is primarily dealers and home improvement centers Strong Alignment with respected brands and best-in-class suppliers Commodity • Plywood • OSB • Framing Lumber • Boards • Treated Products EWP • LVL • I-joists • Laminated Beams General Line • Siding • Composite Decking • Doors • Metal Products • Roofing • Insulation 21% 35% 44% LTM Sales by Product Building Materials Distribution LTM – Twelve months ending 6/30/2025
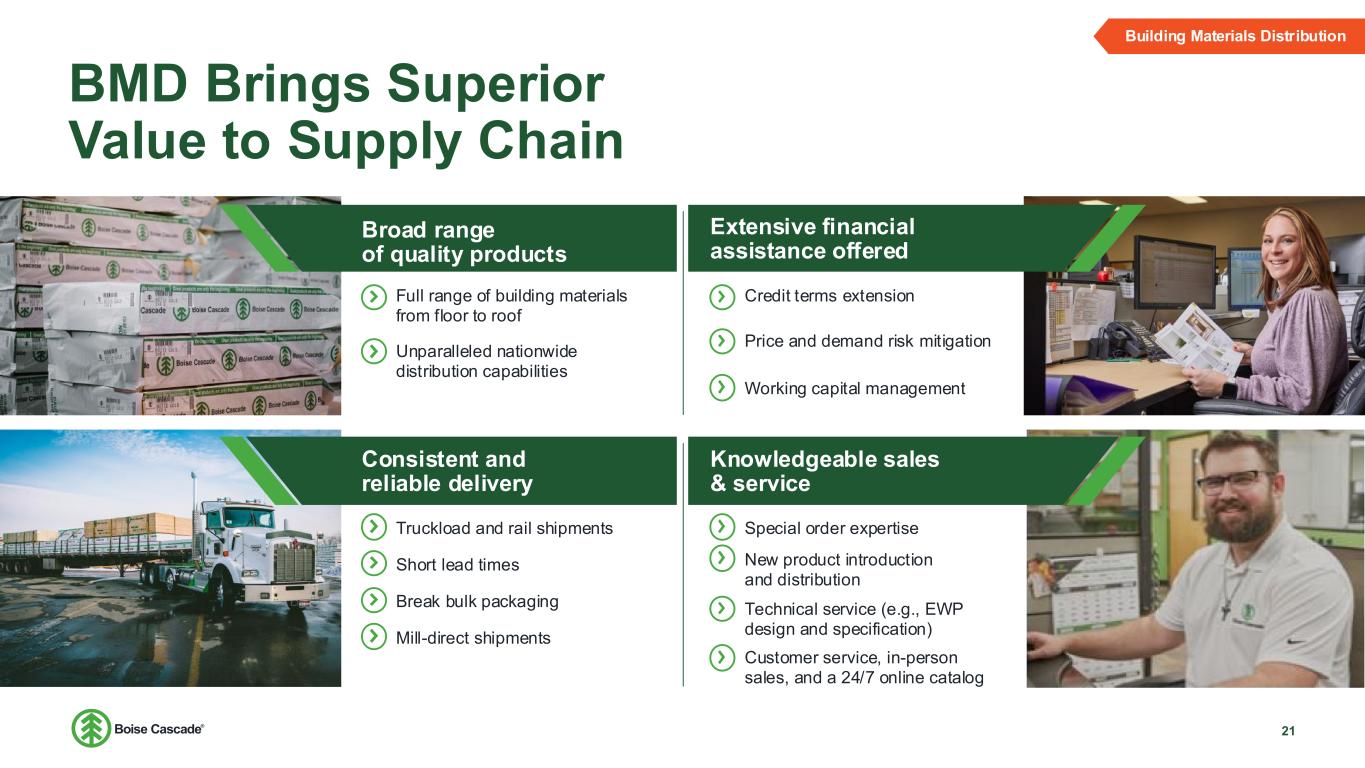
BMD Brings Superior Value to Supply Chain 21 Building Materials Distribution Broad range of quality products Extensive financial assistance offered Consistent and reliable delivery Knowledgeable sales & service Credit terms extension Price and demand risk mitigation Working capital management Special order expertise New product introduction and distribution Technical service (e.g., EWP design and specification) Customer service, in-person sales, and a 24/7 online catalog Truckload and rail shipments Full range of building materials from floor to roof Unparalleled nationwide distribution capabilities Short lead times Break bulk packaging Mill-direct shipments
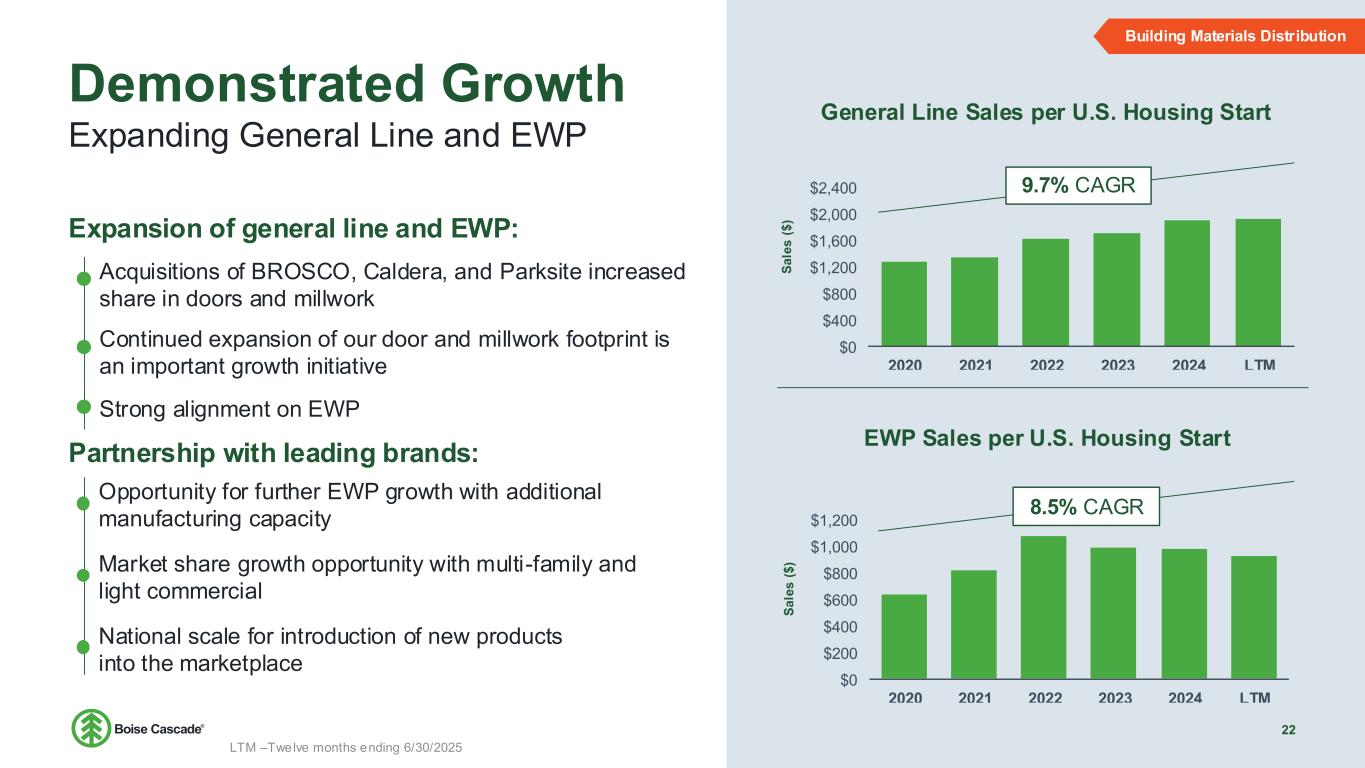
Demonstrated Growth 22 Expanding General Line and EWP Building Materials Distribution Expansion of general line and EWP: Partnership with leading brands: Opportunity for further EWP growth with additional manufacturing capacity Market share growth opportunity with multi-family and light commercial National scale for introduction of new products into the marketplace Acquisitions of BROSCO, Caldera, and Parksite increased share in doors and millwork Continued expansion of our door and millwork footprint is an important growth initiative Strong alignment on EWP $0 $400 $800 $1,200 $1,600 $2,000 $2,400 2020 2021 2022 2023 2024 LTM S a le s ( $ ) General Line Sales per U.S. Housing Start 9.7% CAGR $0 $200 $400 $600 $800 $1,000 $1,200 2020 2021 2022 2023 2024 LTM S a le s ( $ ) EWP Sales per U.S. Housing Start 8.5% CAGR LTM –Twelve months ending 6/30/2025
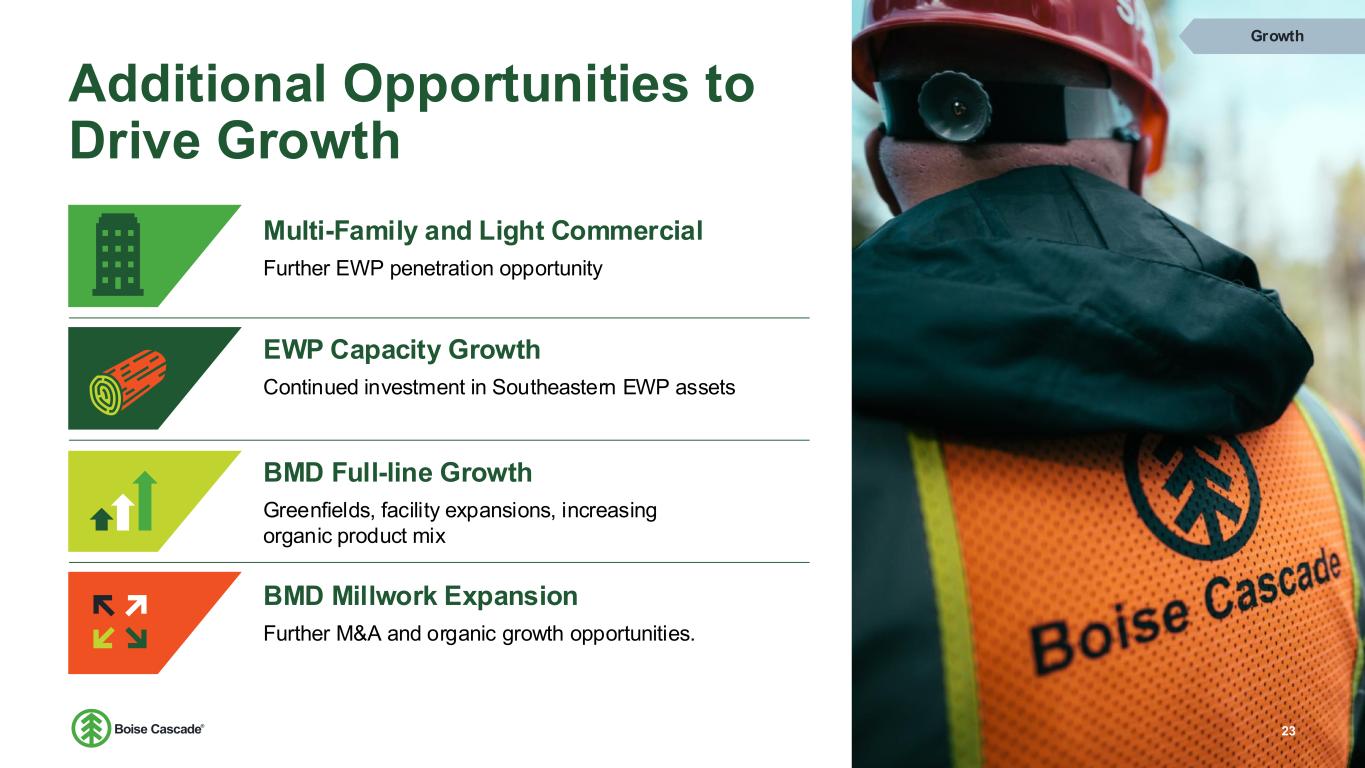
Additional Opportunities to Drive Growth Growth Multi-Family and Light Commercial Further EWP penetration opportunity BMD Full-line Growth Greenfields, facility expansions, increasing organic product mix EWP Capacity Growth Continued investment in Southeastern EWP assets BMD Millwork Expansion Further M&A and organic growth opportunities. 23
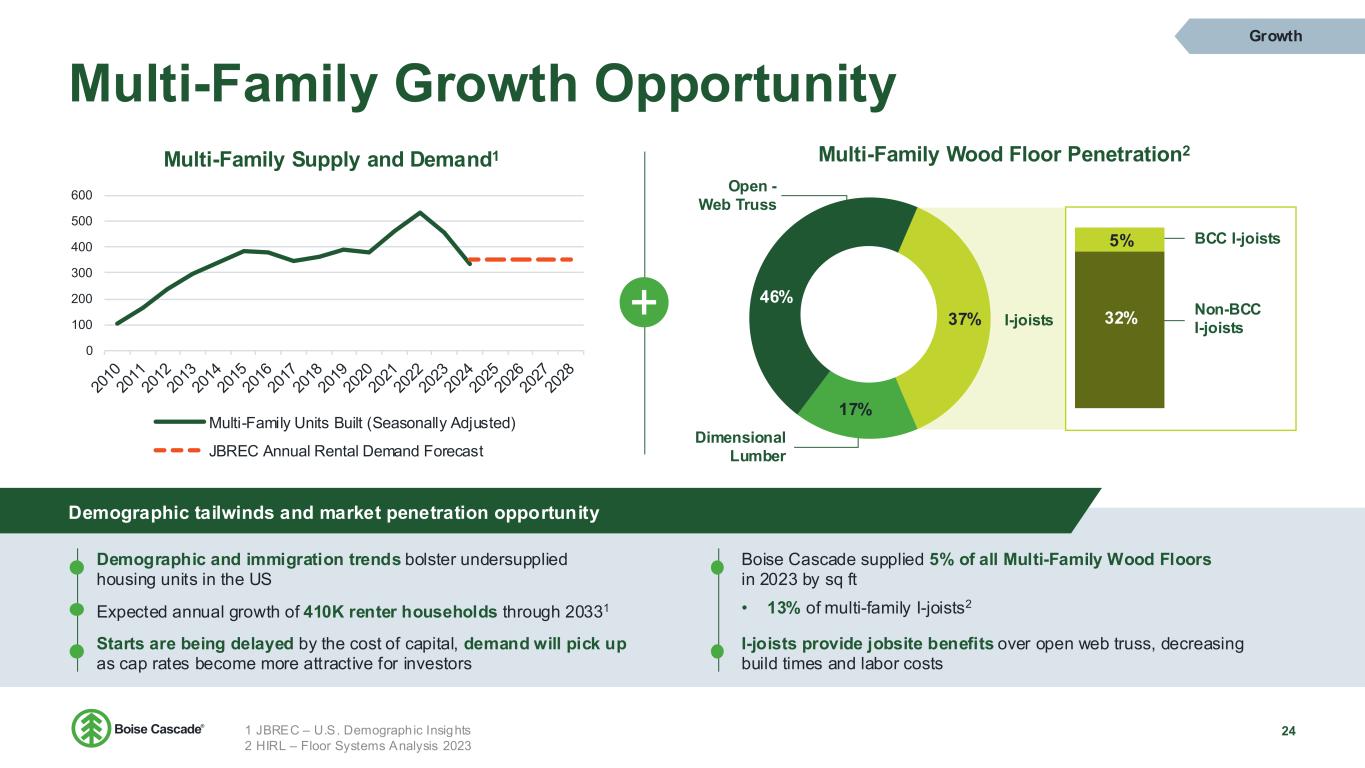
Multi-Family Growth Opportunity 24 Growth 0 100 200 300 400 500 600 Multi-Family Supply and Demand1 Multi-Family Units Built (Seasonally Adjusted) JBREC Annual Rental Demand Forecast Demographic tailwinds and market penetration opportunity Boise Cascade supplied 5% of all Multi-Family Wood Floors in 2023 by sq ft • 13% of multi-family I-joists2 17% 46% 5% 32%37% Multi-Family Wood Floor Penetration2 Open - Web Truss Dimensional Lumber I-joists BCC I-joists Non-BCC I-joists Demographic and immigration trends bolster undersupplied housing units in the US Starts are being delayed by the cost of capital, demand will pick up as cap rates become more attractive for investors Expected annual growth of 410K renter households through 20331 I-joists provide jobsite benefits over open web truss, decreasing build times and labor costs 1 JBREC – U.S. Demographic Insights 2 HIRL – Floor Systems Analysis 2023
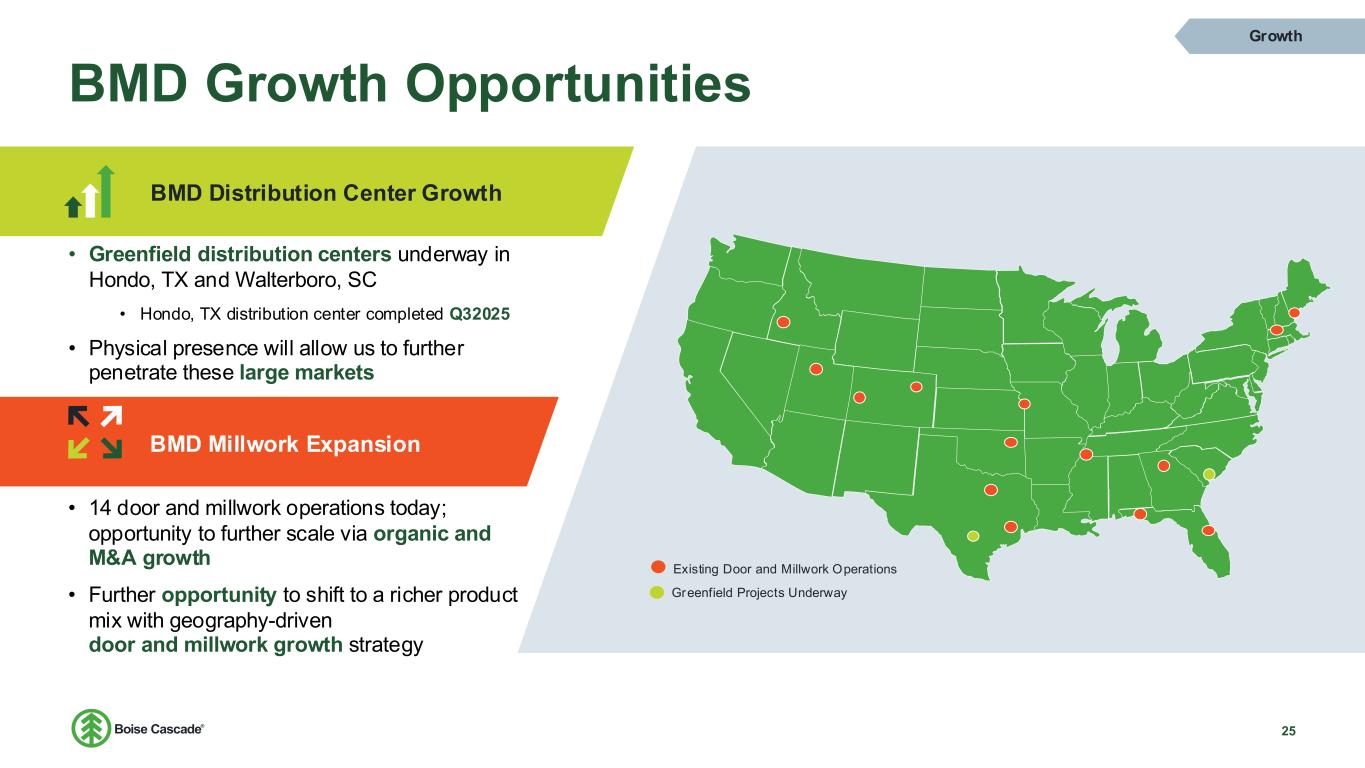
BMD Growth Opportunities 25 Existing Door and Millwork Operations Greenfield Projects Underway Growth • Greenfield distribution centers underway in Hondo, TX and Walterboro, SC • Hondo, TX distribution center completed Q32025 • Physical presence will allow us to further penetrate these large markets BMD Millwork Expansion BMD Distribution Center Growth • 14 door and millwork operations today; opportunity to further scale via organic and M&A growth • Further opportunity to shift to a richer product mix with geography-driven door and millwork growth strategy
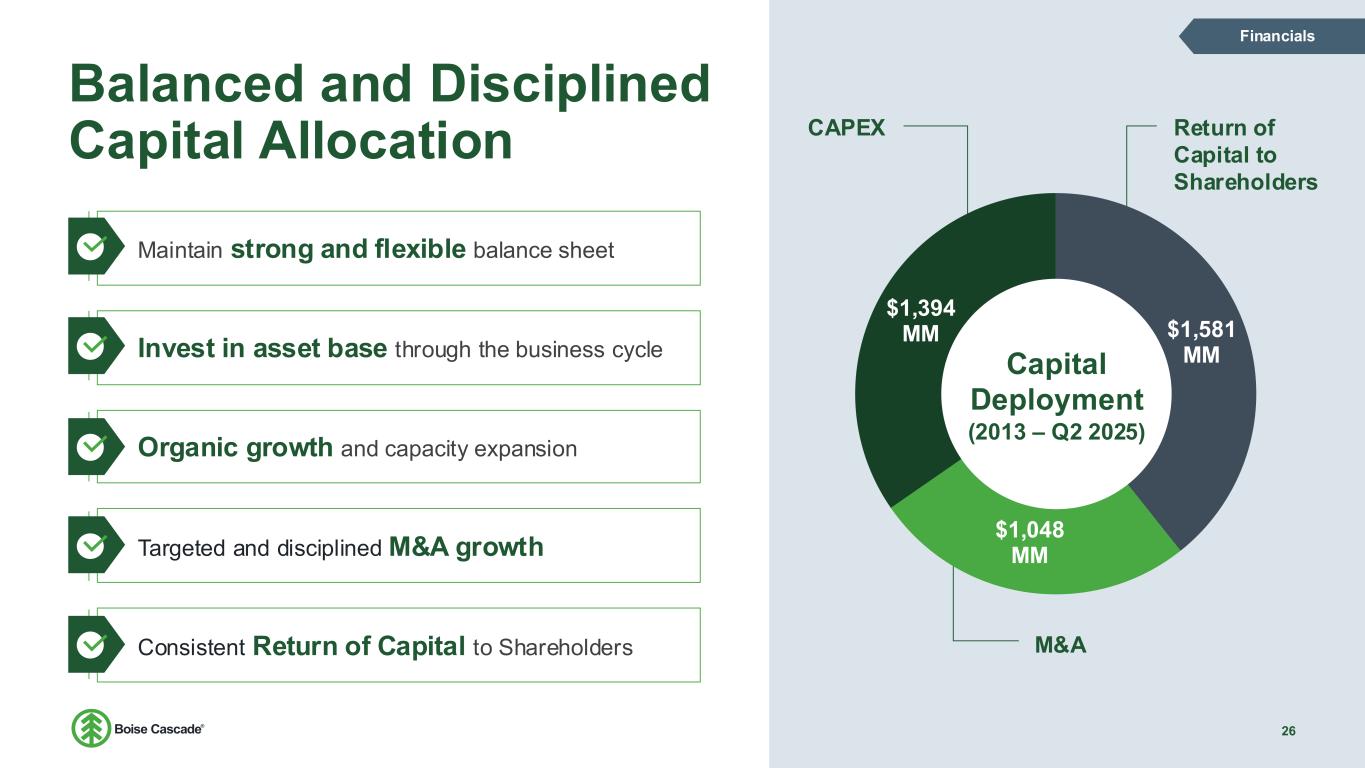
Balanced and Disciplined Capital Allocation CAPEX Return of Capital to Shareholders M&A Financials Maintain strong and flexible balance sheet Invest in asset base through the business cycle Organic growth and capacity expansion Targeted and disciplined M&A growth Consistent Return of Capital to Shareholders $1,581 MM $1,048 MM $1,394 MM Capital Deployment (2013 – Q2 2025) 26
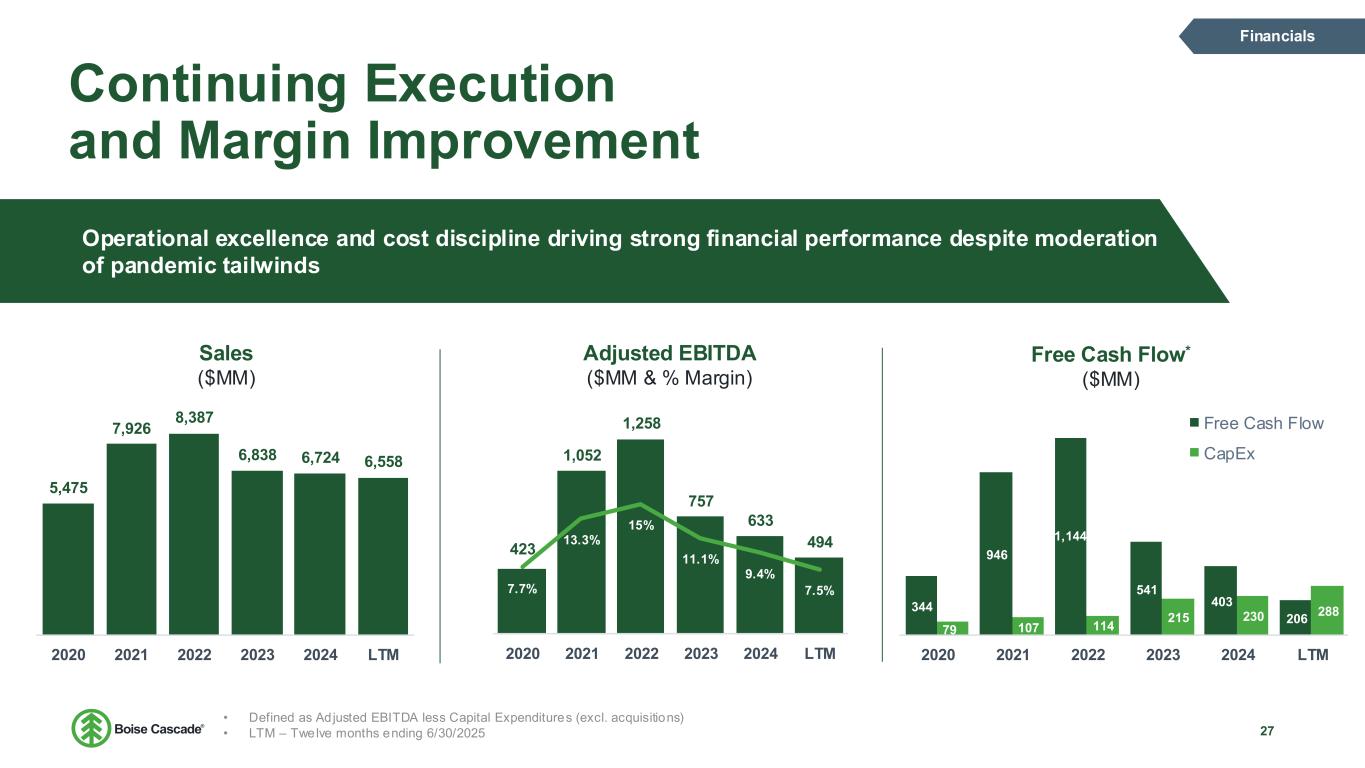
Continuing Execution and Margin Improvement Operational excellence and cost discipline driving strong financial performance despite moderation of pandemic tailwinds Sales ($MM) Adjusted EBITDA ($MM & % Margin) Free Cash Flow* ($MM) Financials 27 • Defined as Adjusted EBITDA less Capital Expenditures (excl. acquisitions) • LTM – Twelve months ending 6/30/2025 5,475 7,926 8,387 6,838 6,724 6,558 2020 2021 2022 2023 2024 LTM 344 946 1,144 541 403 206 79 107 114 215 230 288 2020 2021 2022 2023 2024 LTM Free Cash Flow CapEx 423 1,052 1,258 757 633 494 7.7% 13.3% 15% 11.1% 9.4% 7.5% 0 5 10 15 20 25 0 200 400 600 800 1000 1200 1400 2020 2021 2022 2023 2024 LTM
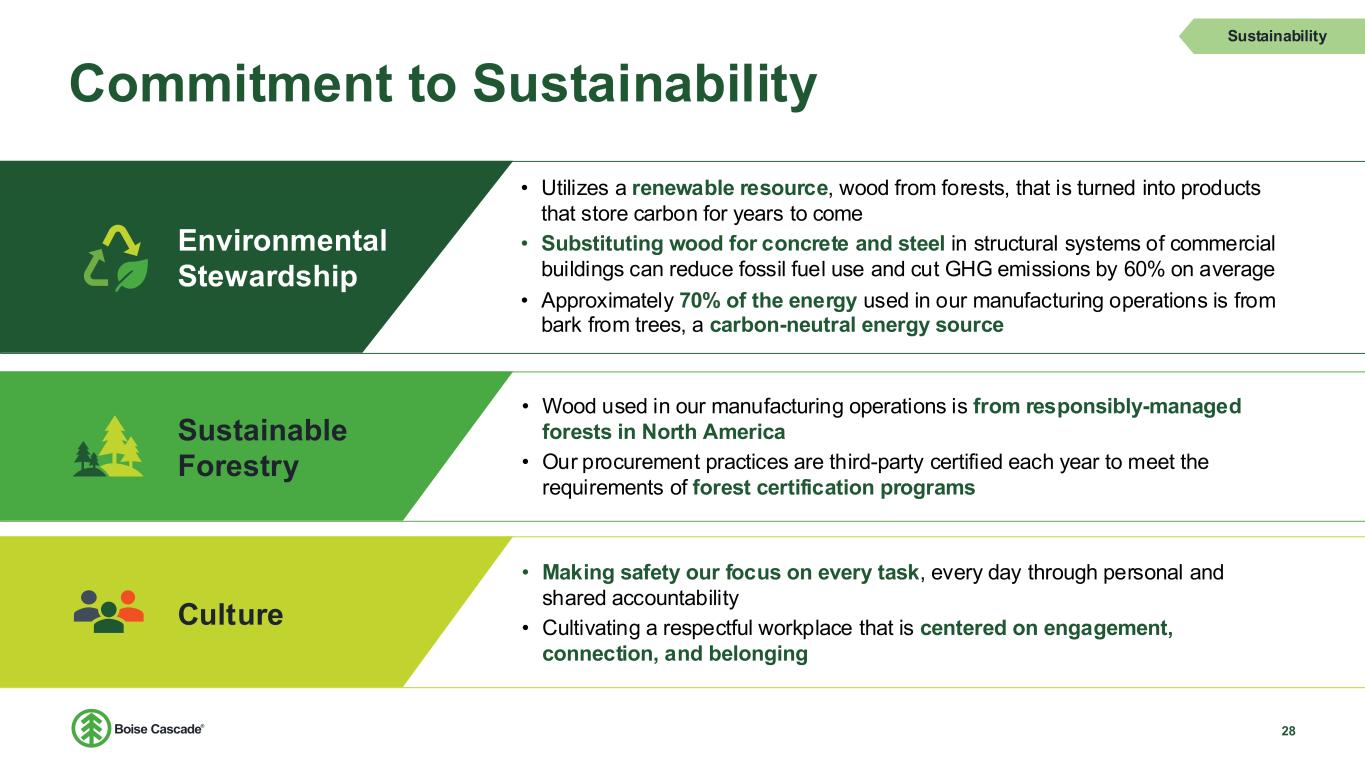
Commitment to Sustainability 28 • Utilizes a renewable resource, wood from forests, that is turned into products that store carbon for years to come • Substituting wood for concrete and steel in structural systems of commercial buildings can reduce fossil fuel use and cut GHG emissions by 60% on average • Approximately 70% of the energy used in our manufacturing operations is from bark from trees, a carbon-neutral energy source Sustainability Environmental Stewardship • Making safety our focus on every task, every day through personal and shared accountability • Cultivating a respectful workplace that is centered on engagement, connection, and belonging Culture • Wood used in our manufacturing operations is from responsibly-managed forests in North America • Our procurement practices are third-party certified each year to meet the requirements of forest certification programs Sustainable Forestry
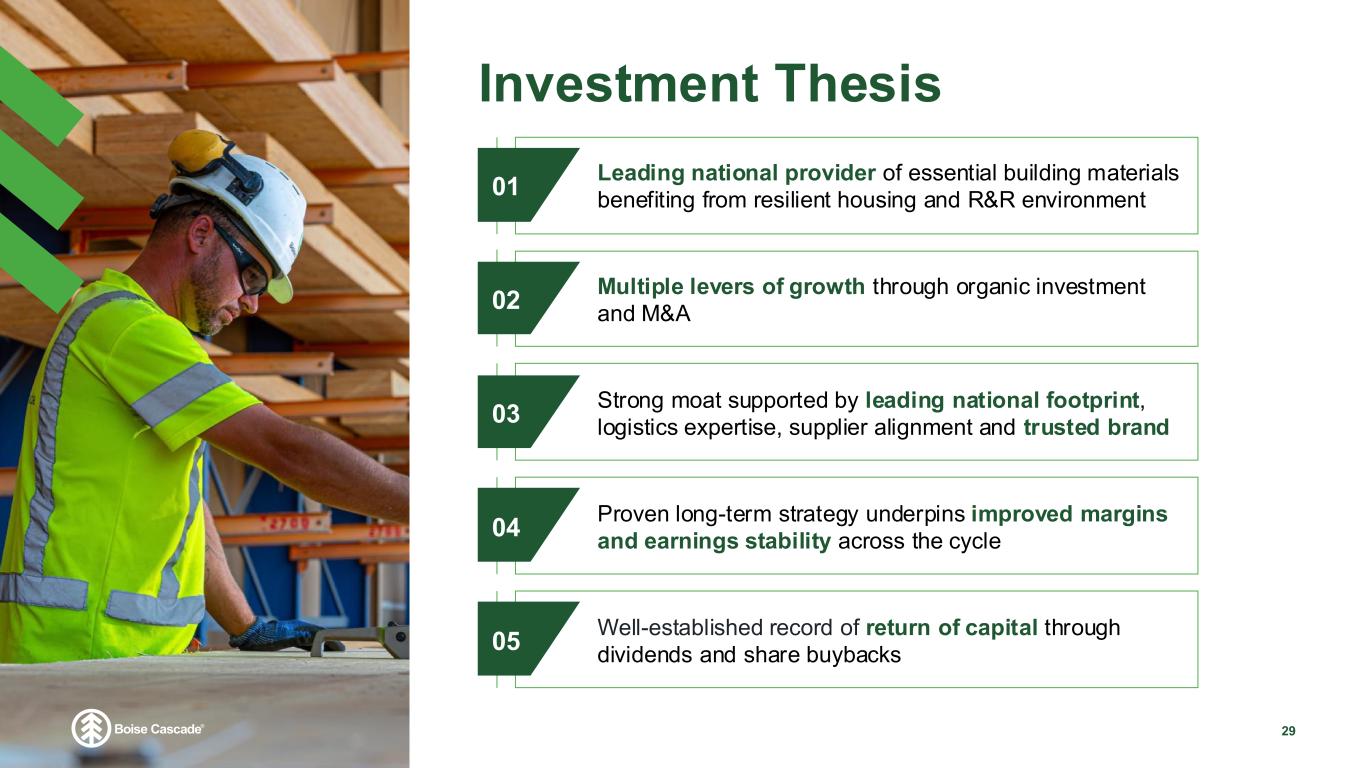
Investment Thesis 29 Multiple levers of growth through organic investment and M&A 02 Leading national provider of essential building materials benefiting from resilient housing and R&R environment 01 Strong moat supported by leading national footprint, logistics expertise, supplier alignment and trusted brand 03 Proven long-term strategy underpins improved margins and earnings stability across the cycle 04 Well-established record of return of capital through dividends and share buybacks 05

Appendix 30
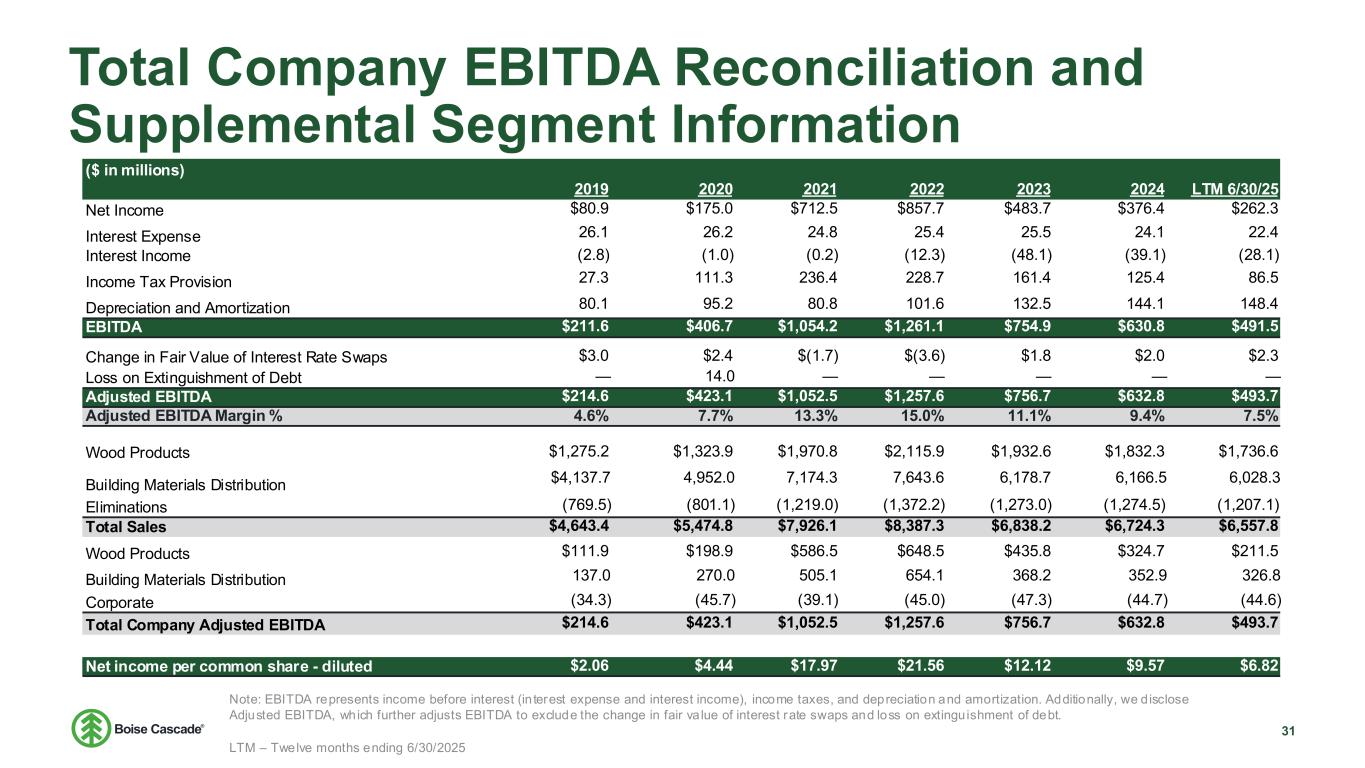
Total Company EBITDA Reconciliation and Supplemental Segment Information ($ in millions) 2019 2020 2021 2022 2023 2024 LTM 6/30/25 Net Income $80.9 $175.0 $712.5 $857.7 $483.7 $376.4 $262.3 Interest Expense 26.1 26.2 24.8 25.4 25.5 24.1 22.4 Interest Income (2.8) (1.0) (0.2) (12.3) (48.1) (39.1) (28.1) Income Tax Provision 27.3 111.3 236.4 228.7 161.4 125.4 86.5 Depreciation and Amortization 80.1 95.2 80.8 101.6 132.5 144.1 148.4 EBITDA $211.6 $406.7 $1,054.2 $1,261.1 $754.9 $630.8 $491.5 Change in Fair Value of Interest Rate Swaps $3.0 $2.4 $(1.7) $(3.6) $1.8 $2.0 $2.3 Loss on Extinguishment of Debt — 14.0 — — — — — Adjusted EBITDA $214.6 $423.1 $1,052.5 $1,257.6 $756.7 $632.8 $493.7 Adjusted EBITDA Margin % 4.6% 7.7% 13.3% 15.0% 11.1% 9.4% 7.5% Wood Products $1,275.2 $1,323.9 $1,970.8 $2,115.9 $1,932.6 $1,832.3 $1,736.6 Building Materials Distribution $4,137.7 4,952.0 7,174.3 7,643.6 6,178.7 6,166.5 6,028.3 Eliminations (769.5) (801.1) (1,219.0) (1,372.2) (1,273.0) (1,274.5) (1,207.1) Total Sales $4,643.4 $5,474.8 $7,926.1 $8,387.3 $6,838.2 $6,724.3 $6,557.8 Wood Products $111.9 $198.9 $586.5 $648.5 $435.8 $324.7 $211.5 Building Materials Distribution 137.0 270.0 505.1 654.1 368.2 352.9 326.8 Corporate (34.3) (45.7) (39.1) (45.0) (47.3) (44.7) (44.6) Total Company Adjusted EBITDA $214.6 $423.1 $1,052.5 $1,257.6 $756.7 $632.8 $493.7 Net income per common share - diluted $2.06 $4.44 $17.97 $21.56 $12.12 $9.57 $6.82 Total Compa y EBITDA Reco ciliation and Supplemental Segment Information Note: EBITDA represents income before interest (in terest expense and interest income), income taxes, and depreciation and amortization. Additionally, we d isclose Adjusted EBITDA, which further adjusts EBITDA to exclude the change in fair va lue of interest rate swaps and loss on extinguishment of debt. LTM – Twelve months ending 6/30/2025 31
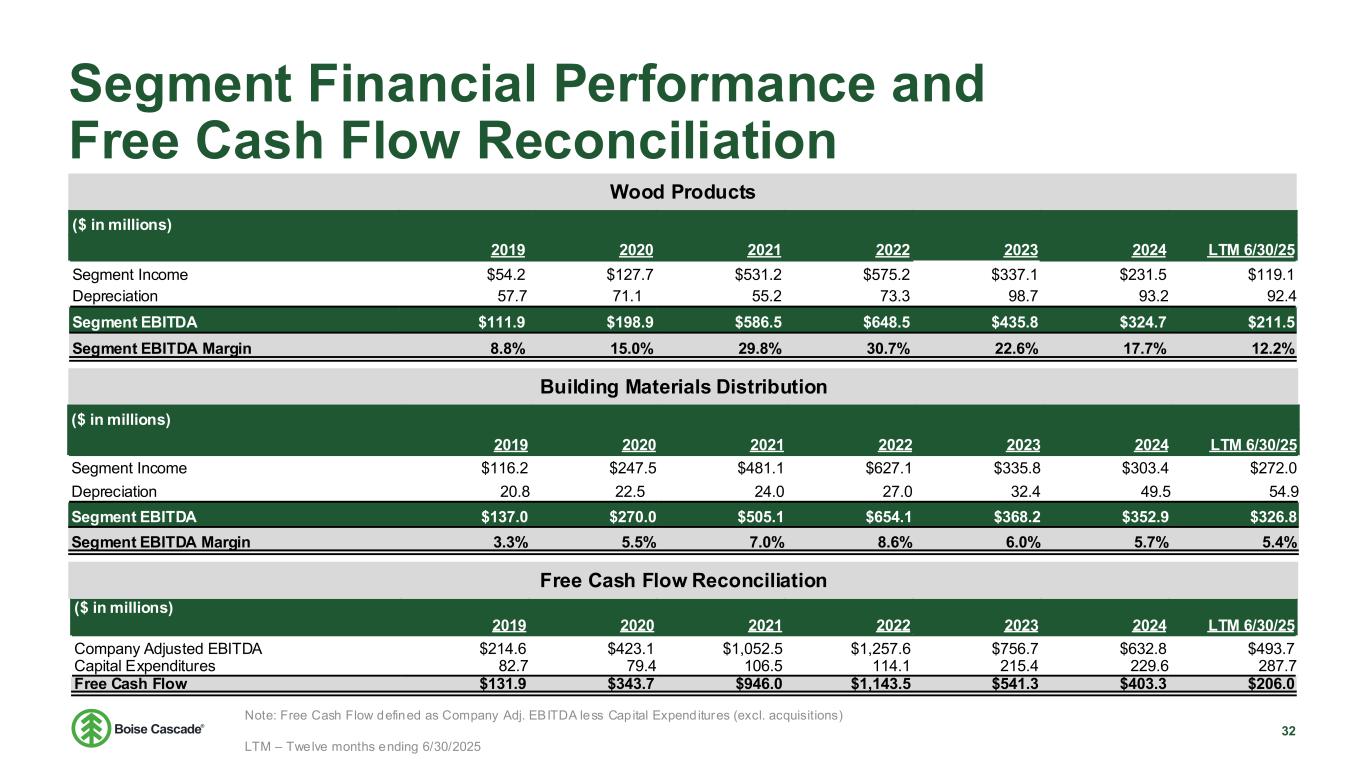
Segment Financial Performance and Free Cash Flow Reconciliation Wood Products Building Materials Distribution Free Cash Flow Reconciliation ($ in millions) 2019 2020 2021 2022 2023 2024 LTM 6/30/25 Segment Income $54.2 $127.7 $531.2 $575.2 $337.1 $231.5 $119.1 Depreciation 57.7 71.1 55.2 73.3 98.7 93.2 92.4 Segment EBITDA $111.9 $198.9 $586.5 $648.5 $435.8 $324.7 $211.5 Segment EBITDA Margin 8.8% 15.0% 29.8% 30.7% 22.6% 17.7% 12.2% ($ in millions) 2019 2020 2021 2022 2023 2024 LTM 6/30/25 Segment Income $116.2 $247.5 $481.1 $627.1 $335.8 $303.4 $272.0 Depreciation 20.8 22.5 24.0 27.0 32.4 49.5 54.9 Segment EBITDA $137.0 $270.0 $505.1 $654.1 $368.2 $352.9 $326.8 Segment EBITDA Margin 3.3% 5.5% 7.0% 8.6% 6.0% 5.7% 5.4% ($ in millions) 2019 2020 2021 2022 2023 2024 LTM 6/30/25 Company Adjusted EBITDA $214.6 $423.1 $1,052.5 $1,257.6 $756.7 $632.8 $493.7 Capital Expenditures 82.7 79.4 106.5 114.1 215.4 229.6 287.7 Free Cash Flow $131.9 $343.7 $946.0 $1,143.5 $541.3 $403.3 $206.0 Segment Financial Performance and Free Cash Flow Reconciliation Note: Free Cash Flow defined as Company Adj. EBITDA less Capital Expenditures (excl. acquisitions) LTM – Twelve months ending 6/30/2025 32
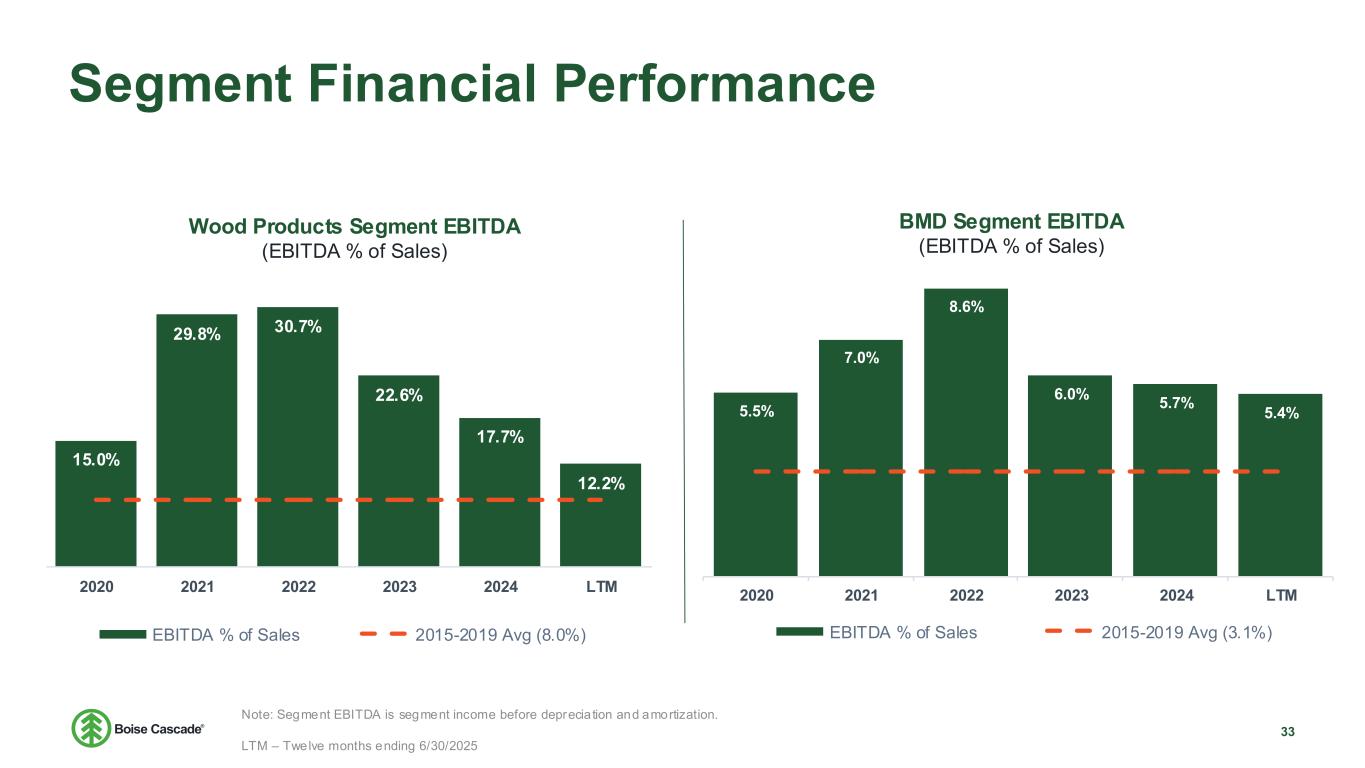
Segment Financial Performance 15.0% 29.8% 30.7% 22.6% 17.7% 12.2% 0.00% 5.00% 10.00% 15.00% 20.00% 25.00% 30.00% 35.00% 2020 2021 2022 2023 2024 LTM EBITDA % of Sales 2015-2019 Avg (8.0%) Wood Products Segment EBITDA (EBITDA % of Sales) BMD Segment EBITDA (EBITDA % of Sales) 5.5% 7.0% 8.6% 6.0% 5.7% 5.4% 2020 2021 2022 2023 2024 LTM EBITDA % of Sales 2015-2019 Avg (3.1%) Note: Segment EBITDA is segment income before depreciation and amortization. LTM – Twelve months ending 6/30/2025 33
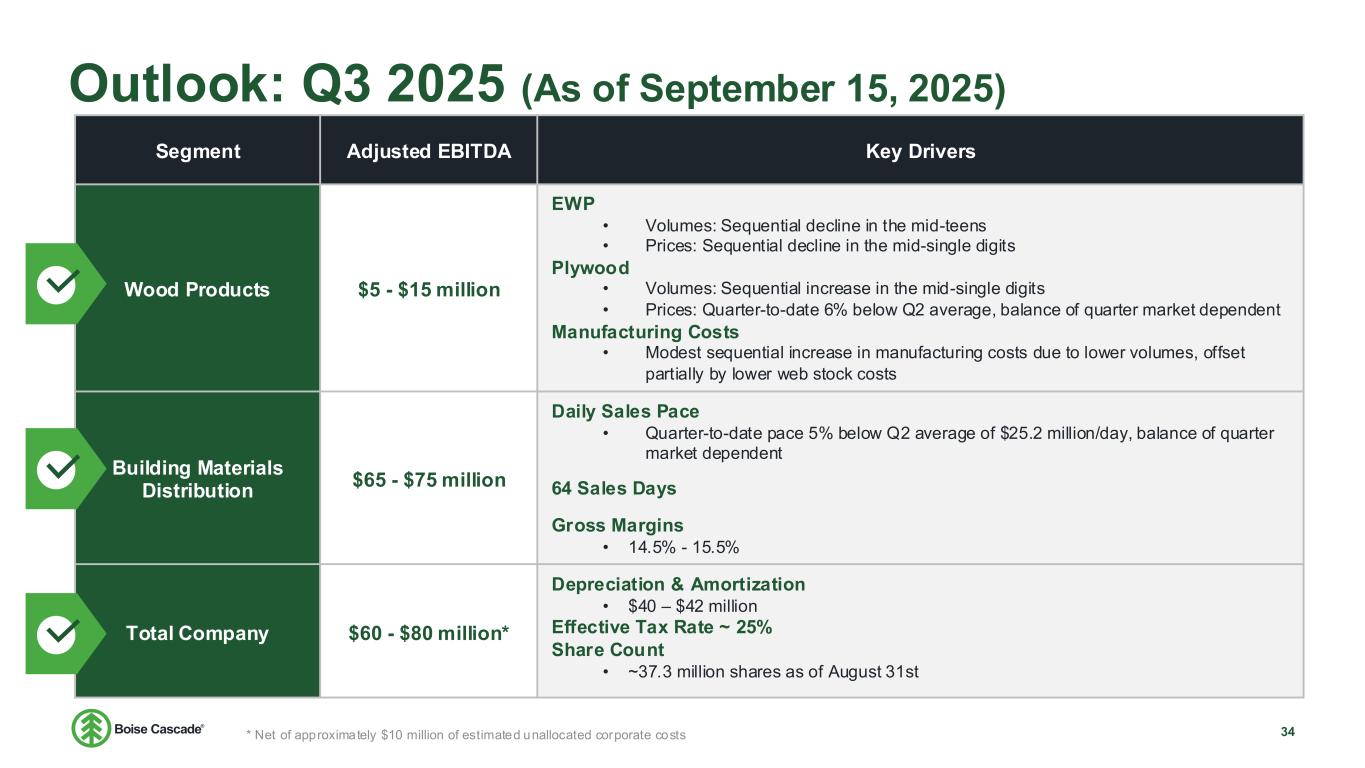
Outlook: Q3 2025 (As of September 15, 2025) 34 Segment Adjusted EBITDA Key Drivers Wood Products $5 - $15 million EWP • Volumes: Sequential decline in the mid-teens • Prices: Sequential decline in the mid-single digits Plywood • Volumes: Sequential increase in the mid-single digits • Prices: Quarter-to-date 6% below Q2 average, balance of quarter market dependent Manufacturing Costs • Modest sequential increase in manufacturing costs due to lower volumes, offset partially by lower web stock costs Building Materials Distribution $65 - $75 million Daily Sales Pace • Quarter-to-date pace 5% below Q2 average of $25.2 million/day, balance of quarter market dependent 64 Sales Days Gross Margins • 14.5% - 15.5% Total Company $60 - $80 million* Depreciation & Amortization • $40 – $42 million Effective Tax Rate ~ 25% Share Count • ~37.3 million shares as of August 31st * Net of approximately $10 million of estimated unallocated corporate costs
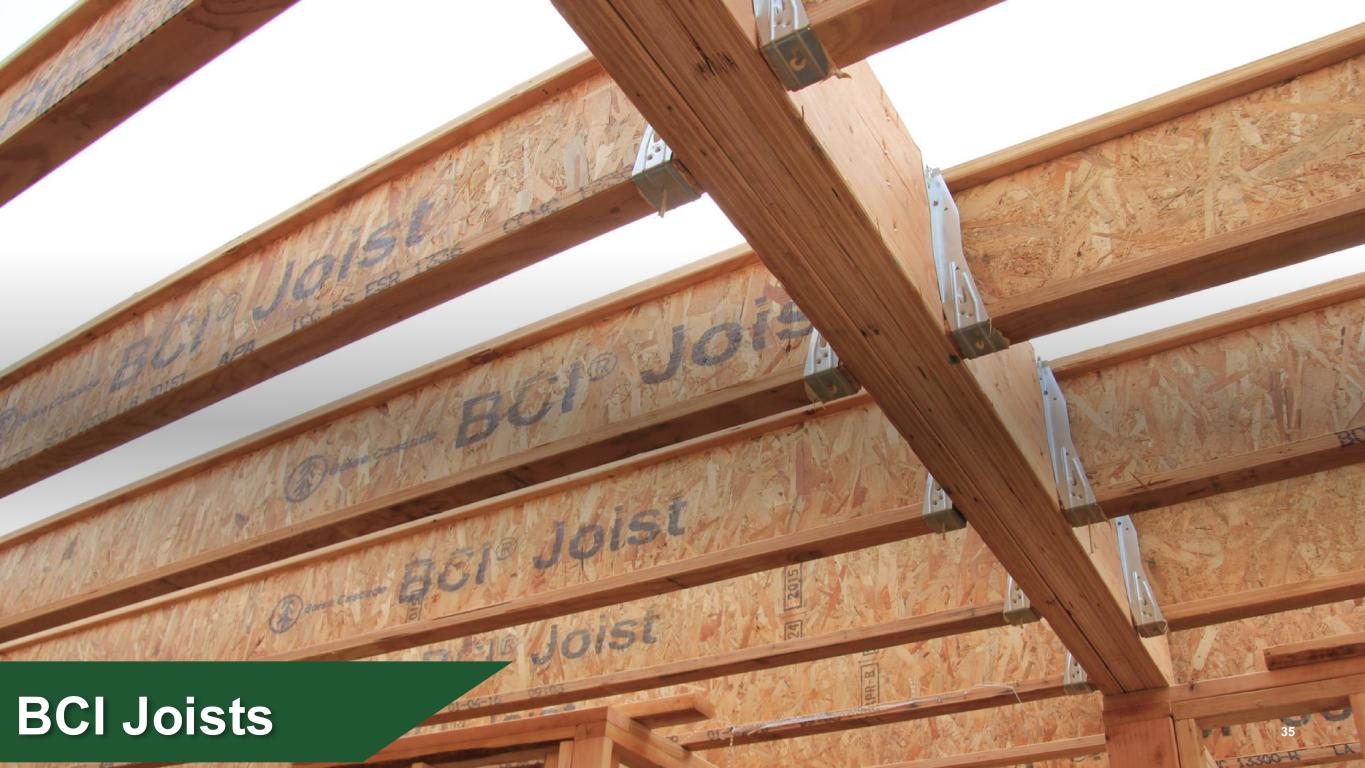
BCI Joists 35
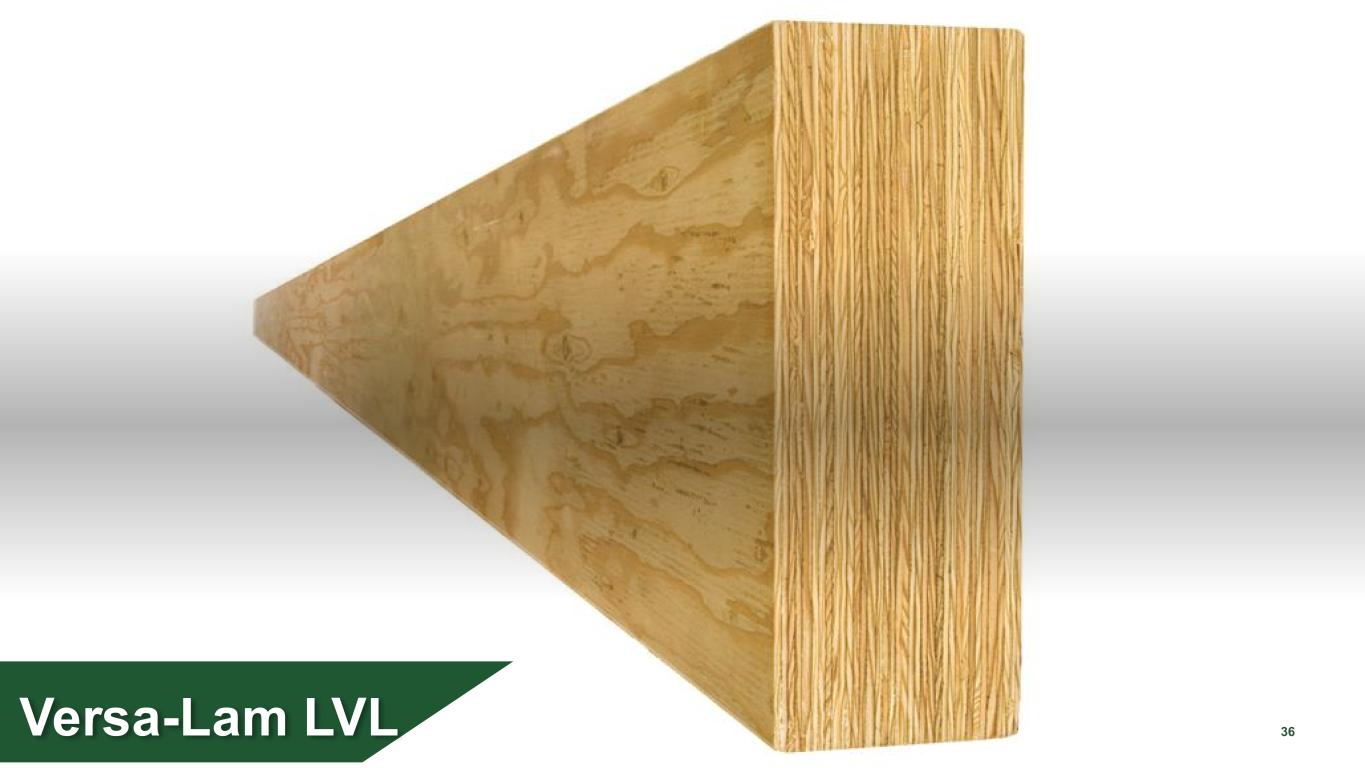
36Versa-Lam LVL 36
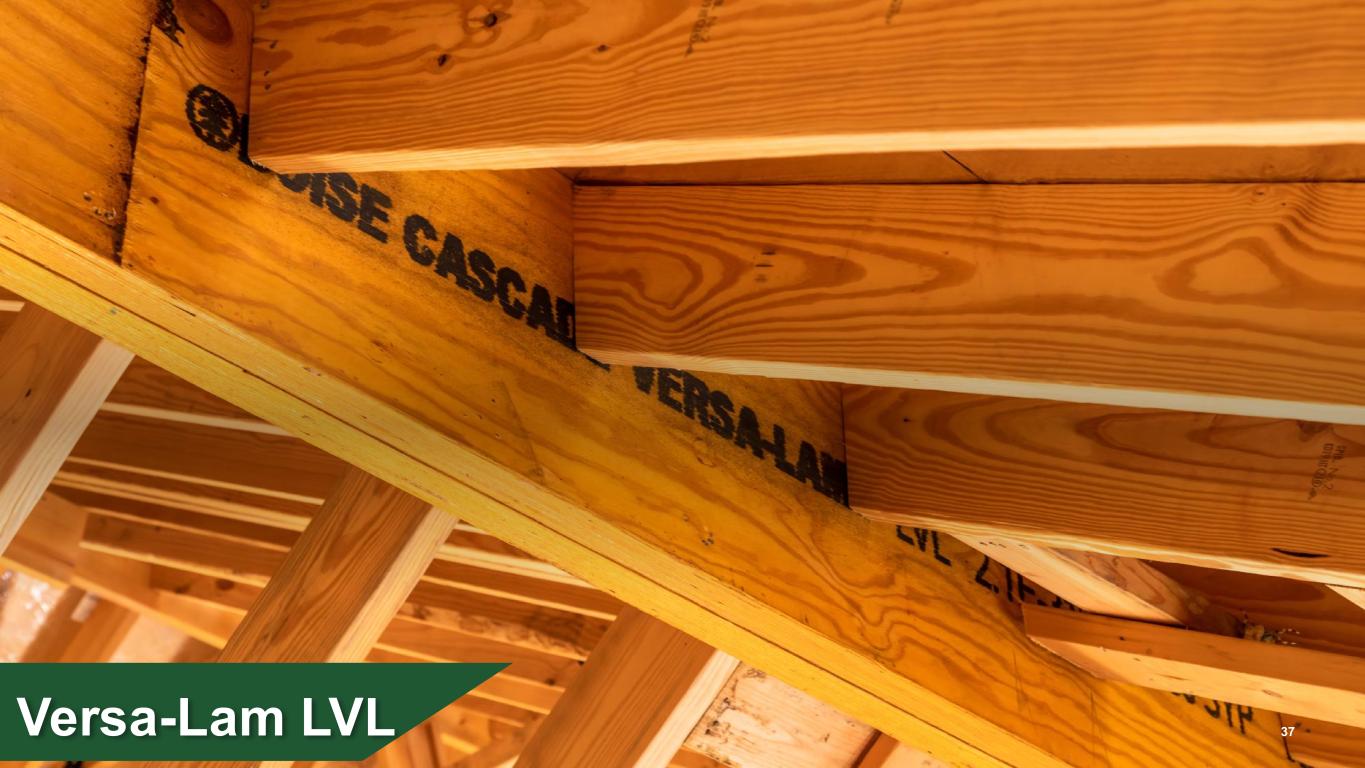
Versa-Lam LVL 37
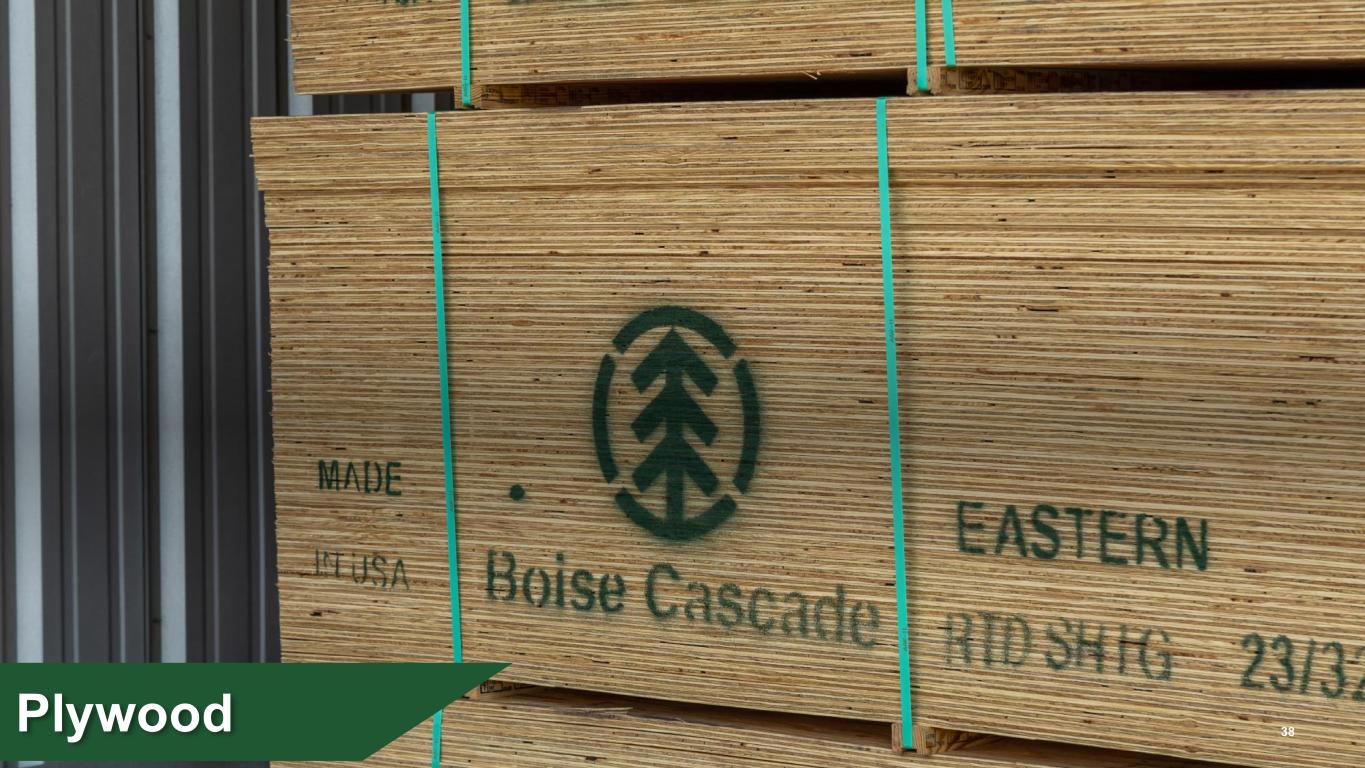
Plywood 38