| Filed Pursuant to Rule 433 Registration No. 333-193197 March 2014 |
|
|
1
square 1 financial
Initial Public Offering
March 2014
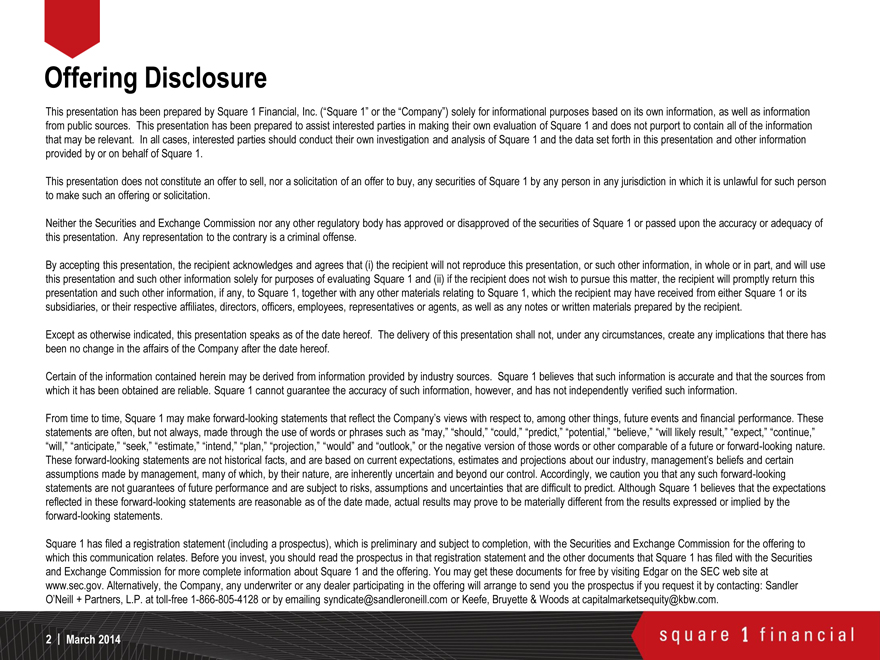
Offering Disclosure
This presentation has been prepared by Square 1 Financial, Inc. (“Square 1” or the “Company”) solely for informational purposes based on its own information, as well as information from public sources. This presentation has been prepared to assist interested parties in making their own evaluation of Square 1 and does not purport to contain all of the information that may be relevant. In all cases, interested parties should conduct their own investigation and analysis of Square 1 and the data set forth in this presentation and other information provided by or on behalf of Square 1.
This presentation does not constitute an offer to sell, nor a solicitation of an offer to buy, any securities of Square 1 by any person in any jurisdiction in which it is unlawful for such person to make such an offering or solicitation.
Neither the Securities and Exchange Commission nor any other regulatory body has approved or disapproved of the securities of Square 1 or passed upon the accuracy or adequacy of this presentation. Any representation to the contrary is a criminal offense.
By accepting this presentation, the recipient acknowledges and agrees that (i) the recipient will not reproduce this presentation, or such other information, in whole or in part, and will use this presentation and such other information solely for purposes of evaluating Square 1 and (ii) if the recipient does not wish to pursue this matter, the recipient will promptly return this presentation and such other information, if any, to Square 1, together with any other materials relating to Square 1, which the recipient may have received from either Square 1 or its subsidiaries, or their respective affiliates, directors, officers, employees, representatives or agents, as well as any notes or written materials prepared by the recipient.
Except as otherwise indicated, this presentation speaks as of the date hereof. The delivery of this presentation shall not, under any circumstances, create any implications that there has been no change in the affairs of the Company after the date hereof.
Certain of the information contained herein may be derived from information provided by industry sources. Square 1 believes that such information is accurate and that the sources from which it has been obtained are reliable. Square 1 cannot guarantee the accuracy of such information, however, and has not independently verified such information.
From time to time, Square 1 may make forward-looking statements that reflect the Company’s views with respect to, among other things, future events and financial performance. These statements are often, but not always, made through the use of words or phrases such as “may,” “should,” “could,” “predict,” “potential,” “believe,” “will likely result,” “expect,” “continue,” “will,” “anticipate,” “seek,” “estimate,” “intend,” “plan,” “projection,” “would” and “outlook,” or the negative version of those words or other comparable of a future or forward-looking nature. These forward-looking statements are not historical facts, and are based on current expectations, estimates and projections about our industry, management’s beliefs and certain assumptions made by management, many of which, by their nature, are inherently uncertain and beyond our control. Accordingly, we caution you that any such forward-looking statements are not guarantees of future performance and are subject to risks, assumptions and uncertainties that are difficult to predict. Although Square 1 believes that the expectations reflected in these forward-looking statements are reasonable as of the date made, actual results may prove to be materially different from the results expressed or implied by the forward-looking statements.
Square 1 has filed a registration statement (including a prospectus), which is preliminary and subject to completion, with the Securities and Exchange Commission for the offering to which this communication relates. Before you invest, you should read the prospectus in that registration statement and the other documents that Square 1 has filed with the Securities and Exchange Commission for more complete information about Square 1 and the offering. You may get these documents for free by visiting Edgar on the SEC web site at www.sec.gov. Alternatively, the Company, any underwriter or any dealer participating in the offering will arrange to send you the prospectus if you request it by contacting: Sandler O’Neill + Partners, L.P. at toll-free 1-866-805-4128 or by emailing syndicate@sandleroneill.com or Keefe, Bruyette & Woods at capitalmarketsequity@kbw.com.
2 | March 2014
square 1 financial
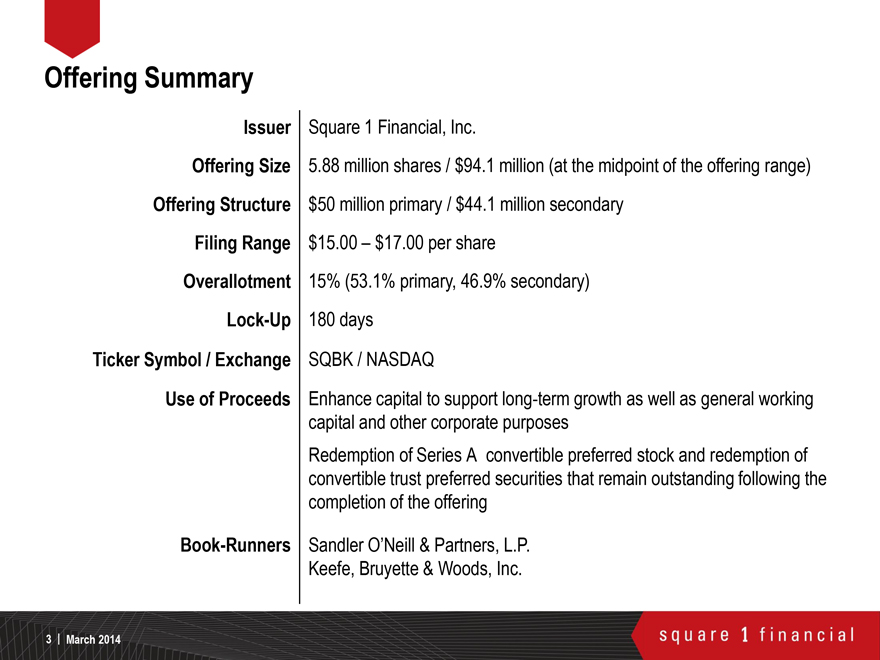
Offering Summary
Issuer
Square 1 Financial, Inc.
Offering Size
5.88 million shares / $94.1 million (at the midpoint of the offering range)
Offering Structure
$50 million primary / $44.1 million secondary
Filing Range
$15.00 – $17.00 per share
Overallotment
15% (53.1% primary, 46.9% secondary)
Lock-Up
180 days
Ticker Symbol / Exchange
SQBK / NASDAQ
Use of Proceeds
Enhance capital to support long-term growth as well as general working capital and other corporate purposes
Redemption of Series A convertible preferred stock and redemption of convertible trust preferred securities that remain outstanding following the completion of the offering
Book-Runners
Sandler O’Neill & Partners, L.P.
Keefe, Bruyette & Woods, Inc.
3 | March 2014
square 1 financial
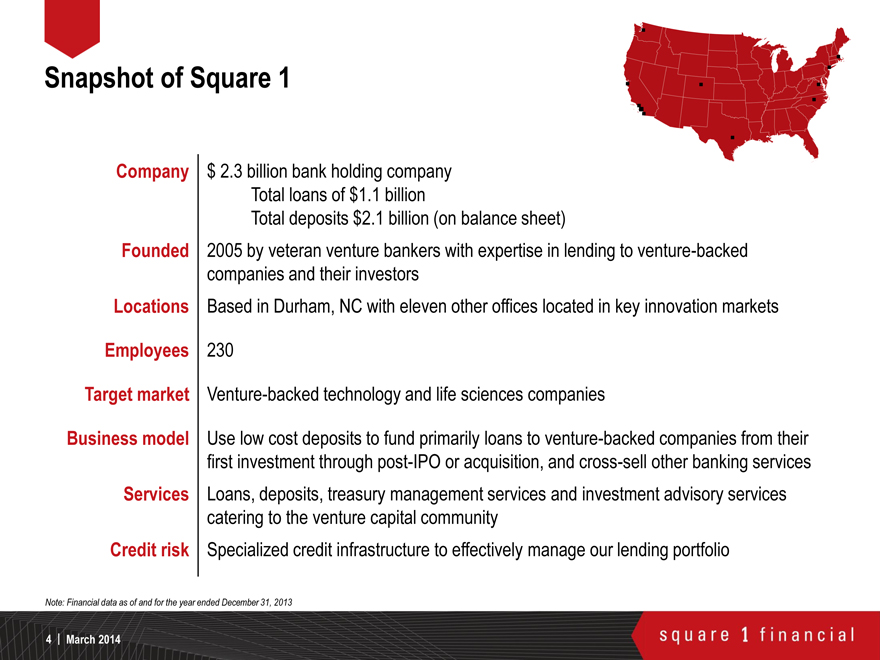
Snapshot of Square 1
Company
$ 2.3 billion bank holding company
Total loans of $1.1 billion
Total deposits $2.1 billion (on balance sheet)
Founded
2005 by veteran venture bankers with expertise in lending to venture-backed companies and their investors
Locations
Based in Durham, NC with eleven other offices located in key innovation markets
Employees
230
Target market
Venture-backed technology and life sciences companies
Business model
Use low cost deposits to fund primarily loans to venture-backed companies from their first investment through post-IPO or acquisition, and cross-sell other banking services
Services
Loans, deposits, treasury management services and investment advisory services catering to the venture capital community
Credit risk
Specialized credit infrastructure to effectively manage our lending portfolio
Note: Financial data as of and for the year ended December 31, 2013
4 | March 2014
square 1 financial
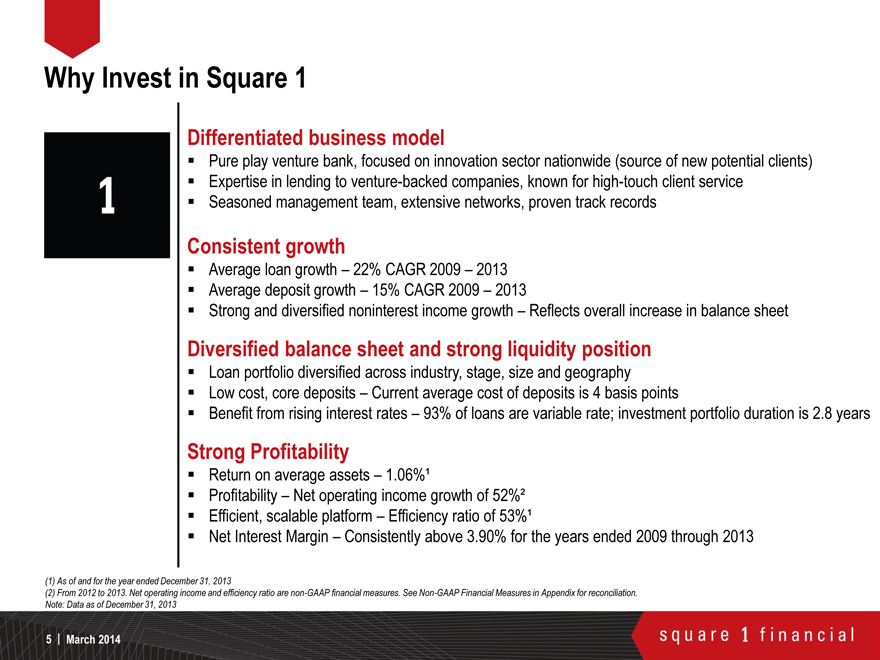
Why Invest in Square 1
1
Differentiated business model
n Pure play venture bank, focused on innovation sector nationwide (source of new potential clients)
n Expertise in lending to venture-backed companies, known for high-touch client service
n Seasoned management team, extensive networks, proven track records
Consistent growth
n Average loan growth – 22% CAGR 2009 – 2013 n Average deposit growth – 15% CAGR 2009 – 2013
n Strong and diversified noninterest income growth – Reflects overall increase in balance sheet
Diversified balance sheet and strong liquidity position
n Loan portfolio diversified across industry, stage, size and geography
n Low cost, core deposits – Current average cost of deposits is 4 basis points
n Benefit from rising interest rates – 93% of loans are variable rate; investment portfolio duration is 2.8 years
Strong Profitability
n Return on average assets – 1.06%¹
n Profitability – Net operating income growth of 52%²
n Efficient, scalable platform – Efficiency ratio of 53%¹
n Net Interest Margin – Consistently above 3.90% for the years ended 2009 through 2013
(1) As of and for the year ended December 31, 2013
(2) From 2012 to 2013. Net operating income and efficiency ratio are non-GAAP financial measures. See Non-GAAP Financial Measures in Appendix for reconciliation. Note: Data as of December 31, 2013
5 | March 2014
square 1 financial
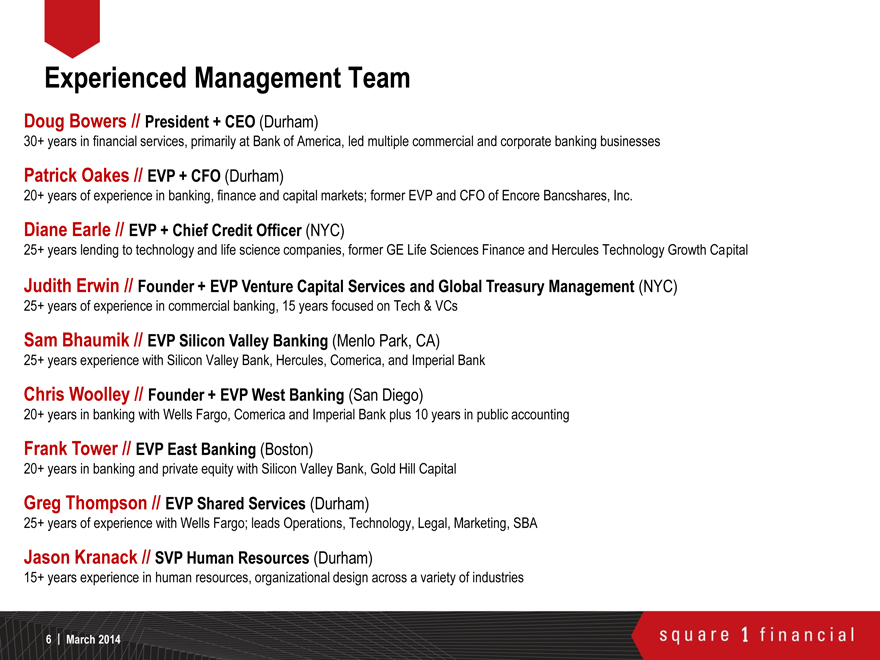
Experienced Management Team
Doug Bowers // President + CEO (Durham)
30+ years in financial services, primarily at Bank of America, led multiple commercial and corporate banking businesses
Patrick Oakes // EVP + CFO (Durham)
20+ years of experience in banking, finance and capital markets; former EVP and CFO of Encore Bancshares, Inc.
Diane Earle // EVP + Chief Credit Officer (NYC)
25+ years lending to technology and life science companies, former GE Life Sciences Finance and Hercules Technology Growth Capital
Judith Erwin // Founder + EVP Venture Capital Services and Global Treasury Management (NYC)
25+ years of experience in commercial banking, 15 years focused on Tech & VCs
Sam Bhaumik // EVP Silicon Valley Banking (Menlo Park, CA)
25+ years experience with Silicon Valley Bank, Hercules, Comerica, and Imperial Bank
Chris Woolley // Founder + EVP West Banking (San Diego)
20+ years in banking with Wells Fargo, Comerica and Imperial Bank plus 10 years in public accounting
Frank Tower // EVP East Banking (Boston)
20+ years in banking and private equity with Silicon Valley Bank, Gold Hill Capital
Greg Thompson // EVP Shared Services (Durham)
25+ years of experience with Wells Fargo; leads Operations, Technology, Legal, Marketing, SBA
Jason Kranack // SVP Human Resources (Durham)
15+ years experience in human resources, organizational design across a variety of industries
6 | March 2014
square 1 financial
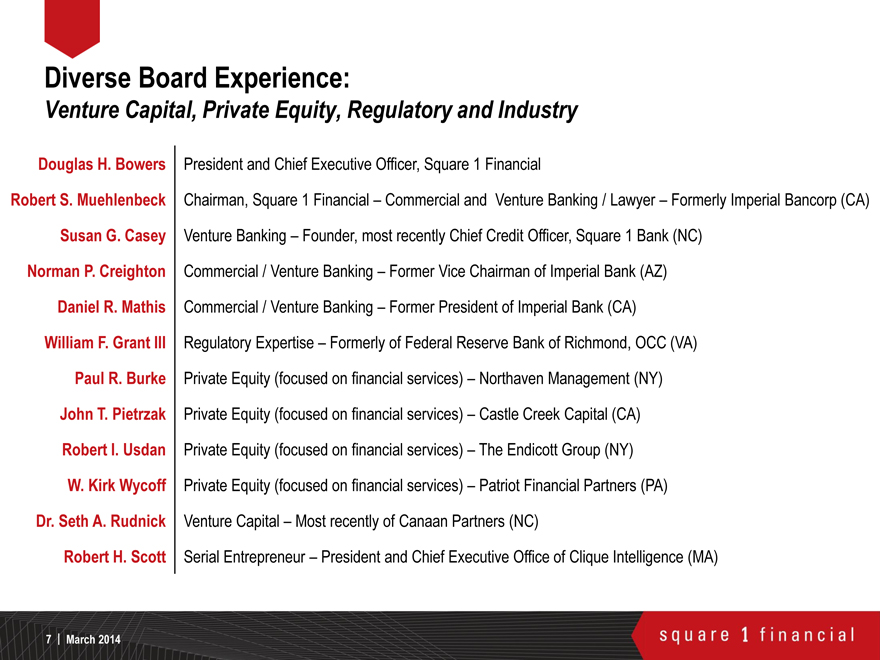
Diverse Board Experience:
Venture Capital, Private Equity, Regulatory and Industry
Douglas H. Bowers
President and Chief Executive Officer, Square 1 Financial
Robert S. Muehlenbeck
Chairman, Square 1 Financial – Commercial and Venture Banking / Lawyer – Formerly Imperial Bancorp (CA)
Susan G. Casey
Venture Banking – Founder, most recently Chief Credit Officer, Square 1 Bank (NC)
Norman P. Creighton
Commercial / Venture Banking – Former Vice Chairman of Imperial Bank (AZ)
Daniel R. Mathis
Commercial / Venture Banking – Former President of Imperial Bank (CA)
William F. Grant III
Regulatory Expertise – Formerly of Federal Reserve Bank of Richmond, OCC (VA)
Paul R. Burke
Private Equity (focused on financial services) – Northaven Management (NY)
John T. Pietrzak
Private Equity (focused on financial services) – Castle Creek Capital (CA)
Robert I. Usdan
Private Equity (focused on financial services) – The Endicott Group (NY)
W. Kirk Wycoff
Private Equity (focused on financial services) – Patriot Financial Partners (PA)
Dr. Seth A. Rudnick
Venture Capital – Most recently of Canaan Partners (NC)
Robert H. Scott
Serial Entrepreneur – President and Chief Executive Office of Clique Intelligence (MA)
7 | March 2014
square 1 financial
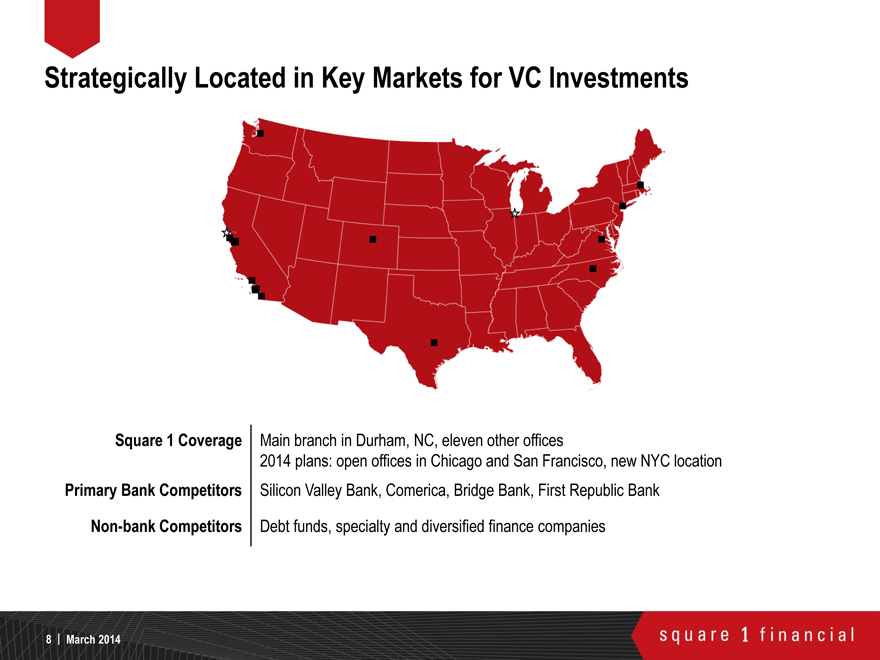
Strategically Located in Key Markets for VC Investments
Square 1 Coverage
Primary Bank Competitors
Non-bank Competitors
Main branch in Durham, NC, eleven other offices
2014 plans: open offices in Chicago and San Francisco, new NYC location
Silicon Valley Bank, Comerica, Bridge Bank, First Republic Bank
Debt funds, specialty and diversified finance companies
8 | March 2014
square 1 financial
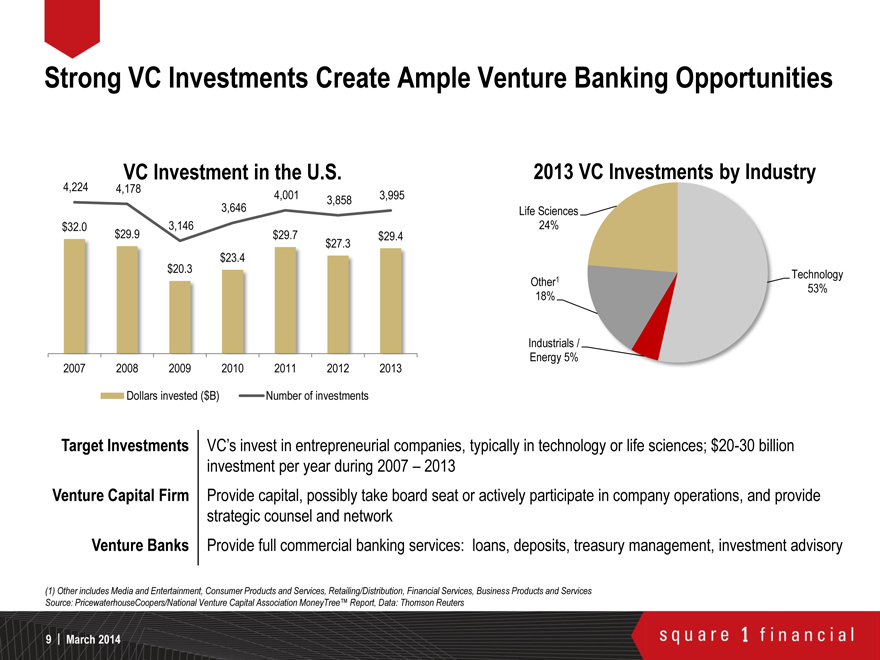
Strong VC Investments Create Ample Venture Banking Opportunities
VC Investment in the U.S.
4,224
4,178
4,001
3,995
3,646
3,858
$32.0
3,146
$29.9
$29.7
$29.4
$27.3
$23.4
$20.3
2007 2008 2009 2010 2011 2012 2013
Dollars invested ($B)
Number of investments
2013 VC Investments by Industry
Life Sciences
24%
Technology
Other1
53%
18%
Industrials / Energy 5%
Target Investments
Venture Capital Firm
Venture Banks
VC’s invest in entrepreneurial companies, typically in technology or life sciences; $20-30 billion
investment per year during 2007 – 2013
Provide capital, possibly take board seat or actively participate in company operations, and provide
strategic counsel and network
Provide full commercial banking services: loans, deposits, treasury management, investment advisory
(1) Other includes Media and Entertainment, Consumer Products and Services, Retailing/Distribution, Financial Services, Business Products and Services Source: PricewaterhouseCoopers/National Venture Capital Association MoneyTreeTM Report, Data: Thomson Reuters
9 | March 2014
square 1 financial
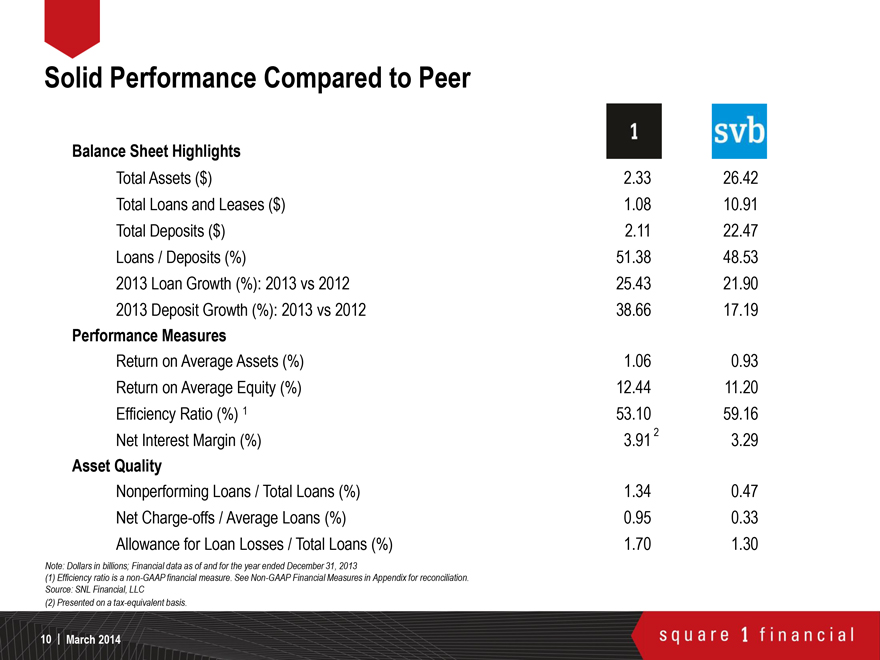
Solid Performance Compared to Peer
Balance Sheet Highlights
1 svb
Total Assets ($)
2.33 26.42
Total Loans and Leases ($)
1.08 10.91
Total Deposits ($)
2.11 22.47
Loans / Deposits (%)
51.38 48.53
2013 Loan Growth (%): 2013 vs 2012
25.43 21.90
2013 Deposit Growth (%): 2013 vs 2012
38.66 17.19
Performance Measures
Return on Average Assets (%)
1.06 0.93
Return on Average Equity (%)
12.44 11.20
Efficiency Ratio (%) 1
53.10 59.16
Net Interest Margin (%)
3.912 3.29
Asset Quality
Nonperforming Loans / Total Loans (%)
1.34 0.47
Net Charge-offs / Average Loans (%)
0.95 0.33
Allowance for Loan Losses / Total Loans (%)
1.70 1.30
Note: Dollars in billions; Financial data as of and for the year ended December 31, 2013
(1) Efficiency ratio is a non-GAAP financial measure. See Non-GAAP Financial Measures in Appendix for reconciliation. Source: SNL Financial, LLC
(2) Presented on a tax-equivalent basis.
10 | March 2014
square 1 financial
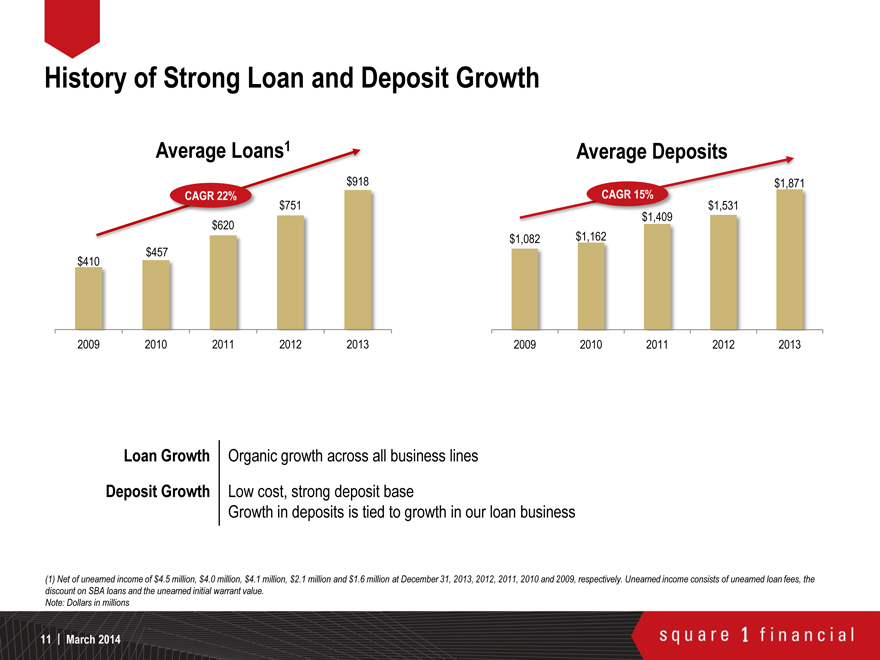
History of Strong Loan and Deposit Growth
Average Loans 1
CAGR 22%
$918
$457
$620
$751
$410
2009 2010 2011 2012 2013
Average Deposits
CAGR 15%
$1,082
$1,162
$1,409
$1,531
$1,871
2009 2010 2011 2012 2013
Loan Growth
Deposit Growth
Organic growth across all business lines
Low cost, strong deposit base
Growth in deposits is tied to growth in our loan business
(1) Net of unearned income of $4.5 million, $4.0 million, $4.1 million, $2.1 million and $1.6 million at December 31, 2013, 2012, 2011, 2010 and 2009, respectively. Unearned income consists of unearned loan fees, the discount on SBA loans and the unearned initial warrant value.
Note: Dollars in millions
11 | March 2014
square 1 financial
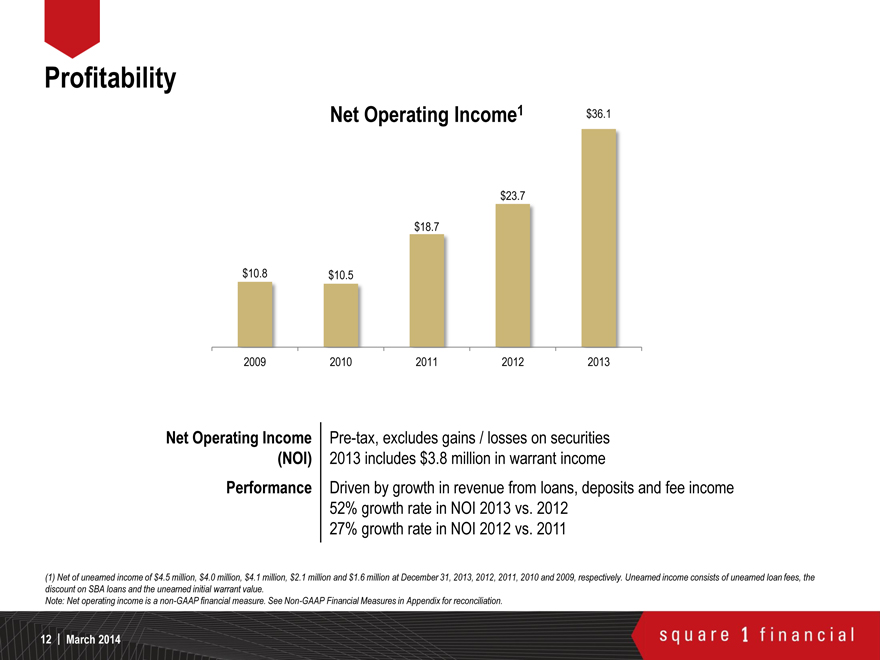
Profitability
Net
Operating
Income1
$36.1
$23.7
$18.7
$10.8
$10.5
2009 2010 2011 2012 2013
Net Operating Income
(NOI)
Performance
Pre-tax, excludes gains / losses on securities
2013 includes $3.8 million in warrant income
Driven by growth in revenue from loans, deposits and fee income
52% growth rate in NOI 2013 vs. 2012
27% growth rate in NOI 2012 vs. 2011
(1) Net of unearned income of $4.5 million, $4.0 million, $4.1 million, $2.1 million and $1.6 million at December 31, 2013, 2012, 2011, 2010 and 2009, respectively. Unearned income consists of unearned loan fees, the discount on SBA loans and the unearned initial warrant value.
Note: Net operating income is a non-GAAP financial measure. See Non-GAAP Financial Measures in Appendix for reconciliation.
12 | March 2014
square 1 financial

Diversified Loan Portfolio
SBA and USDA 5%
Venture firms 13%
Credit cards 1%
Venture banking 81%
Industry Concentrations Within the Venture Banking Portfolio
Software 20%
Other industries 15%
Healthcare services 9%
Hardware 9%
Media and telecom 8%
IT services 8%
Medical devices and equipment 7%
Consumer products and services 6%
Financial services 6%
Biotech 6%
Business products and services 6%
Total Loans (annual average)
Loan Yield
Venture Banking Portfolio
Interest Rate Type
Diversification
$918 million
6.34%
Includes technology and life sciences, and asset-based loans
93% of outstanding loans are variable rate loans
Loan outstandings diversified by industry, stage, size and geography
Note: Financial data as of and for the year ended December 31, 2013
13 | March 2014
square 1 financial
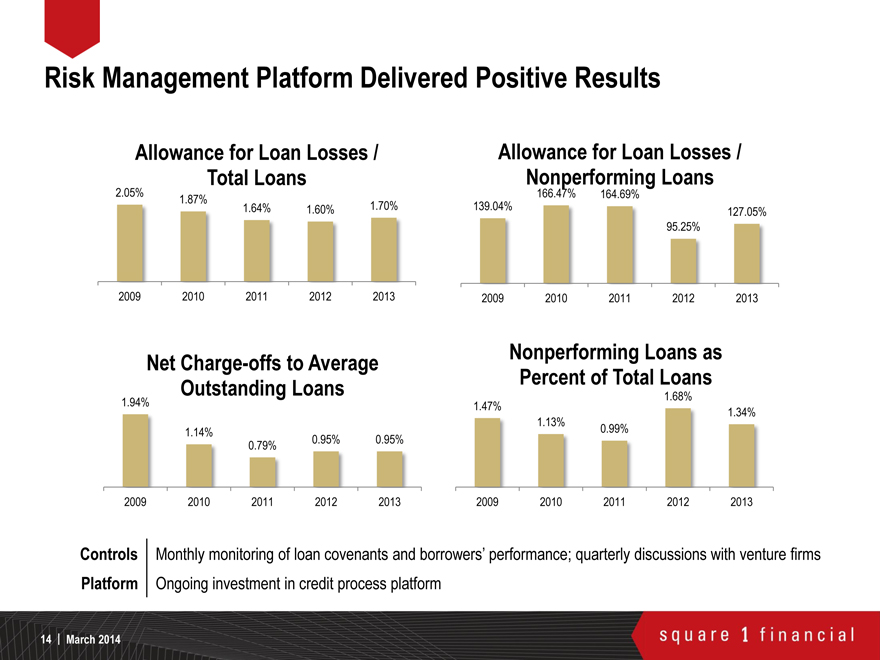
Risk Management Platform Delivered Positive Results
Allowance for Loan Losses / Total Loans
2.05%
1.87%
1.64%
1.60%
1.70%
2009 2010 2011 2012 2013
Net Charge-offs to Average Outstanding Loans
1.94%
1.14%
0.79%
0.95%
0.95%
2009 2010 2011 2012 2013
Allowance for Loan Losses / Nonperforming Loans
139.04%
166.47%
164.69%
95.25%
127.05%
2009 2010 2011 2012 2013
Nonperforming Loans as Percent of Total Loans
1.47%
1.13%
0.99%
1.68%
1.34%
2009 2010 2011 2012 2013
Controls
Platform
Monthly monitoring of loan covenants and borrowers’ performance; quarterly discussions with venture firms
Ongoing investment in credit process platform
14 | March 2014
square 1 financial
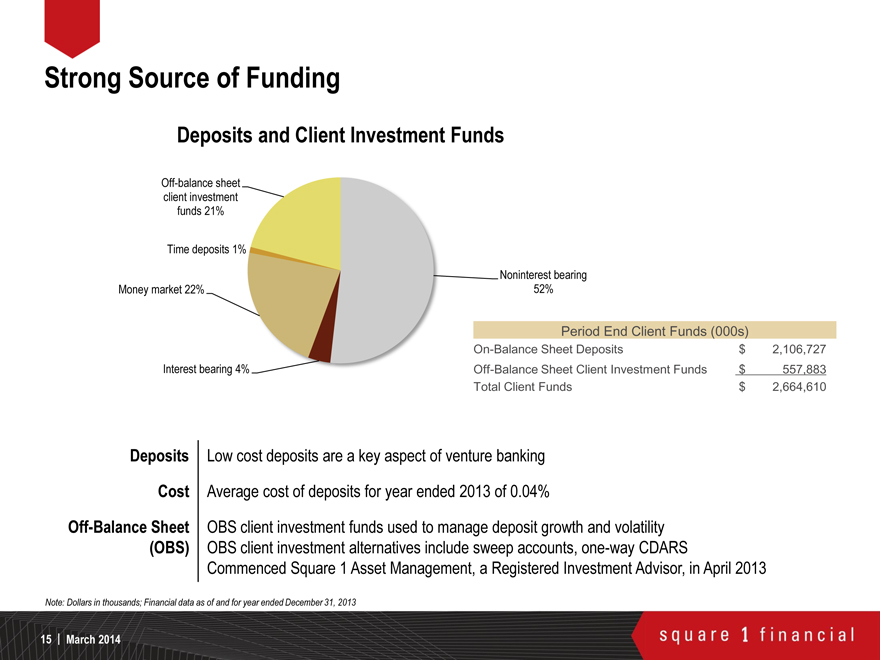
Strong Source of Funding
Deposits and Client Investment Funds
Off-balance sheet
client investment funds 21%
Time deposits 1%
Noninterest bearing
Money market 22%
52%
Interest bearing 4%
Period End Client Funds (000s)
On-Balance Sheet Deposits
Off-Balance Sheet Client Investment Funds
Total Client Funds
$2,106,727
$557,883
$2,664,610
Deposits
Cost
Off-Balance Sheet
(OBS)
Low cost deposits are a key aspect of venture banking
Average cost of deposits for year ended 2013 of 0.04%
OBS client investment funds used to manage deposit growth and volatility
OBS client investment alternatives include sweep accounts, one-way CDARS
Commenced Square 1 Asset Management, a Registered Investment Advisor, in April 2013
Note: Dollars in thousands; Financial data as of and for year ended December 31, 2013
15 | March 2014
square 1 financial

Diversified Securities Portfolio
Total book value (millions)
Corporates
Municipal Bonds
UST/Agency direct/Other
SBA pools
Non-agency mortgage-backed
securities
Agency mortgage-backed securities
Yield1
$867
$1,085
$832
$719
7%
3%
9%
14%
12%
18%
18%
12%
4%
21%
19%
5%
3%
12%
5%
67%
72%
50%
43%
2010 2011 2012 2013
2.90% 2.37% 2.29% 2.28%
Diversification
NAMBS
Duration
Reduced exposure to fixed-rate agency mortgage-backed securities; increased investment grade
municipal and corporate bonds (primarily variable rate)
Significantly reduced our exposure to legacy non-agency mortgage-backed securities purchased prior to
2008 ($20.9 million or 2% of securities portfolio at December 31, 2013)
Available for sale securities portfolio: 2.1 years; overall investment securities portfolio: 2.8 years at
December 31, 2013
(1) Annualized tax-equivalent yield
16 | March 2014
square 1 financial

Profitability
Net
Income
(Loss) Available to Common Shareholders
$22.1
$14.1
$5.1
$2.4
2009
2010
2011
2012
2013
-$12.9
Income
2010
Strong Growth
Consistent income growth over last three years
Incurred losses primarily resulting from sale and impairment of non-agency mortgage-backed
securities purchased prior to 2008
57% net income growth 2013 vs. 2012
Note: Dollars in millions
17 | March 2014
square 1 financial

Well Positioned for Rising Interest Rates
Change in Net Interest Income
17.1%
13.7%
8.3%
6.1%
4.7%
2.5%
up 300 bps
up 200 bps
up 100 bps
Year 1
Year 2
Scenario
Variable-rate loans
Deposit mix
Based on parallel shift in rates over a 12 month period, flat balance sheet
93% of loans are variable rate
66% of on-balance sheet deposits held in noninterest bearing demand deposit accounts
Note: Financial data as of December 31, 2013 and sets forth an approximation of net interest income sensitivity exposure for the 12-month periods ending December 31, 2014 and 2015
18 | March 2014
square 1 financial
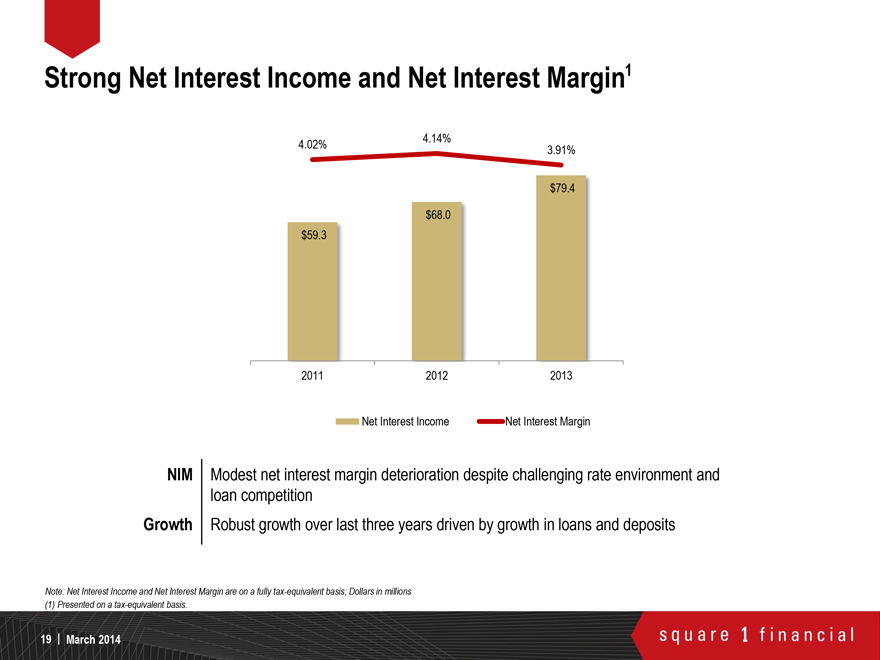
Strong Net Interest Income and Net Interest Margin1
4.02%
4.14%
3.91%
$79.4
$68.0
$59.3
2011
2012
2013
Net Interest Income
Net Interest Margin
NIM
Growth
Modest net interest margin deterioration despite challenging rate environment and
loan competition
Robust growth over last three years driven by growth in loans and deposits
Note: Net Interest Income and Net Interest Margin are on a fully tax-equivalent basis; Dollars in millions
(1) Presented on a tax-equivalent basis.
19 | March 2014
square 1 financial
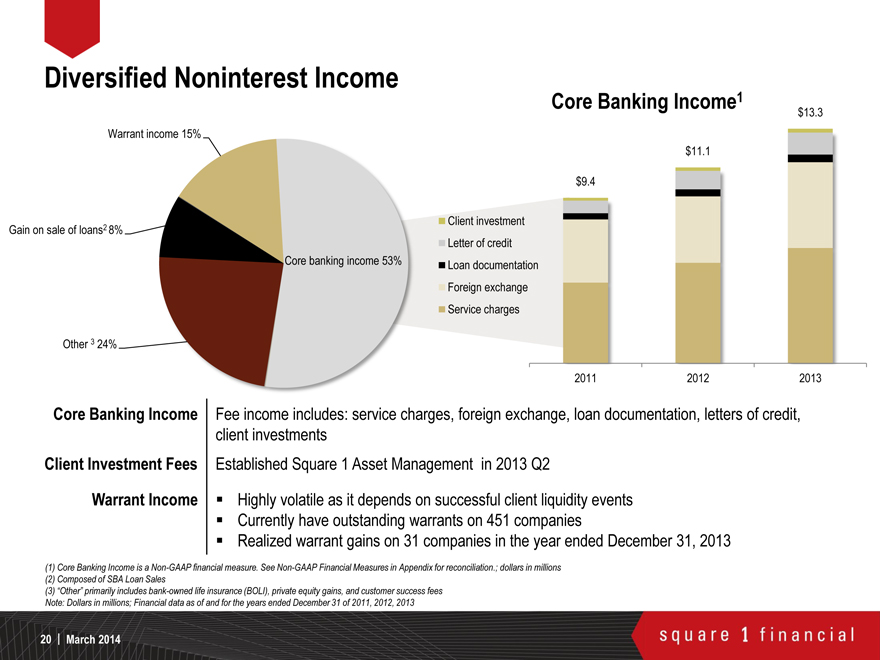
Diversified Noninterest Income
Warrant income 15%
Gain on sale of loans2 8%
Other 3 24%
Core banking income 53%
Client investment
Letter of credit
Loan documentation
Foreign exchange
Service charges
Core Banking Income1
$13.3
$11.1
$9.4
2011
2012
2013
Core Banking Income
Client Investment Fees
Warrant Income
Fee income includes: service charges, foreign exchange, loan documentation, letters of credit,
client investments
Established Square 1 Asset Management in 2013 Q2
Highly volatile as it depends on successful client liquidity events
Currently have outstanding warrants on 451 companies
Realized warrant gains on 31 companies in the year ended December 31, 2013
(1) Core Banking Income is a Non-GAAP financial measure. See Non-GAAP Financial Measures in Appendix for reconciliation.; dollars in millions (2) Composed of SBA Loan Sales (3) “Other” primarily includes bank-owned life insurance (BOLI), private equity gains, and customer success fees Note: Dollars in millions; Financial data as of and for the years ended December 31 of 2011, 2012, 2013
20 | March 2014
square 1 financial

Improving Efficiency Ratio; 2014 Investment Outlook
Expenses and Efficiency Ratio1
65%
73%
65%
61%
53%
$37.7
$43.1
$49.2
$51.1
$55.9
2009
2010
2011
2012
2013
Expense ($ millions)
Efficiency Ratio (%)
Efficiency Ratio
Investing in Key Platforms, Talent and Locations in 2014
Improvements since 2010
Estimated 20% increase in expenses:
Update online banking platform, introduce new services
Upgrade loan platform; additional controls and monitoring
Continue to recruit bankers
2014 planned offices: San Francisco, Chicago, NYC (new location)
Sand Hill Finance acquisition: factoring business, $11.9 million in loans, seven employees, office located in Campbell, CA (acquisition closed December 31, 2013)
(1) Efficiency ratio is a non-GAAP financial measure. See Non-GAAP Financial Measures in Appendix for reconciliation. Note: Dollars in millions, total expenses
21 | March 2014
square 1 financial
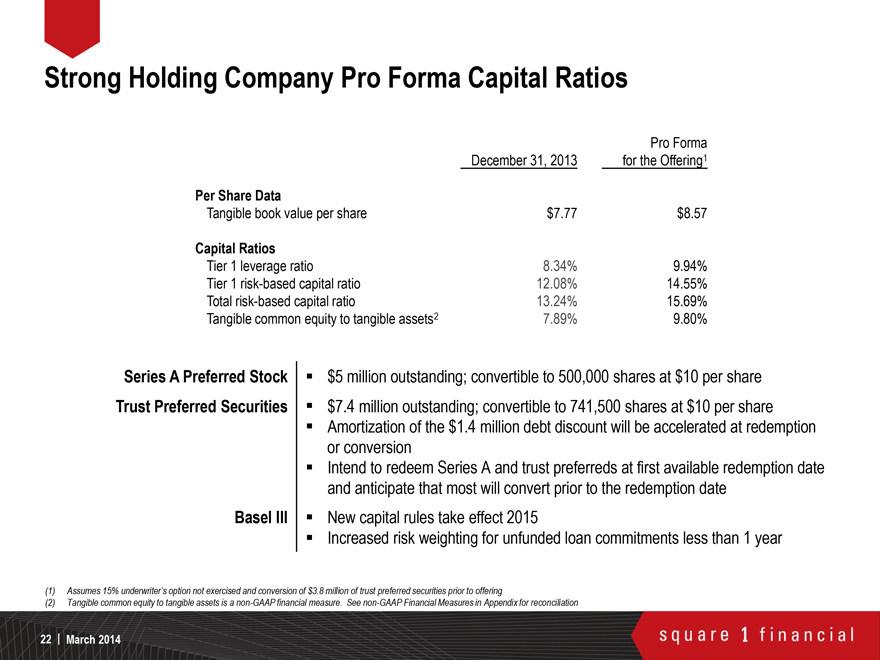
Strong Holding Company Pro Forma Capital Ratios
Pro Forma
December 31, 2013 for the Offering1
Per Share Data
Tangible book value per share $7.77 $8.57
Capital Ratios
Tier 1 leverage ratio 8.34% 9.94%
Tier 1 risk-based capital ratio 12.08% 14.55%
Total risk-based capital ratio 13.24% 15.69%
Tangible common equity to tangible assets2 7.89% 9.80%
Series A Preferred Stock
Trust Preferred Securities
Basel III
$5 million outstanding; convertible to 500,000 shares at $10 per share
$7.4 million outstanding; convertible to 741,500 shares at $10 per share
Amortization of the $1.4 million debt discount will be accelerated at redemption or conversion
Intend to redeem Series A and trust preferreds at first available redemption date anticipate that most will convert prior to the redemption data
New capital rules take effect 2015
Increased risk weighting for unfunded loan commitments less than 1 year
(1) Assumes 15% underwriter’s option not exercised and conversion of $3.8 million of trust preferred securities prior to offering
(2) Tangible common equity to tangible assets is a non-GAAP financial measure. See non-GAAP Financial Measures in Appendix for reconciliation
22 | March 2014
square 1 financial
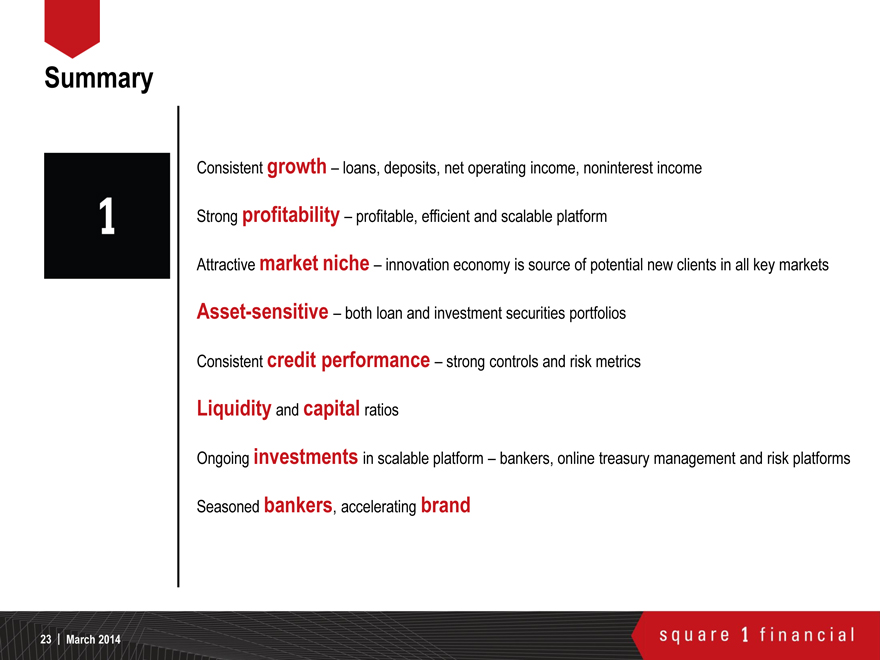
Summary
1 Consistent growth – loans, deposits, net operating income, noninterest income
Strong profitability – profitable, efficient and scalable platform
Attractive market niche – innovation economy is source of potential new clients in all key markets
Asset-sensitive – both loan and investment securities portfolios
Consistent credit performance – strong controls and risk metrics
Liquidity and capital ratios
Ongoing investments in scalable platform – bankers, online treasury management and risk platforms
Seasoned bankers, accelerating brand
23 | March 2014
square 1 financial

Appendix
24 | March 2014
square 1 financial

Non-GAAP Financial Measures
For the Years Ended December 31,
Efficiency Ratio 2013 2012 2011 2010 2009
Noninterest expense $55,921 $51,148 $49,163 $43,091 $37,705
Net interest taxable equivalent income 79,404 67,950 59,325 50,974 44,009
Noninterest taxable equivalent income (loss) 25,886 15,900 6,858 (22,724) 10,319
Less loss on sale of securities (24) (358) (8,956) (30,410) (3,433)
Adjusted operating revenue $105,314 $84,208 $75,139 $58,660 $57,761
Efficiency ratio 53.10% 60.74% 65.43% 73.46% 65.28%
Note: Dollars in thousands
25 | March 2014
square 1 financial
Non-GAAP Financial Measures
For the Years Ended December 31,
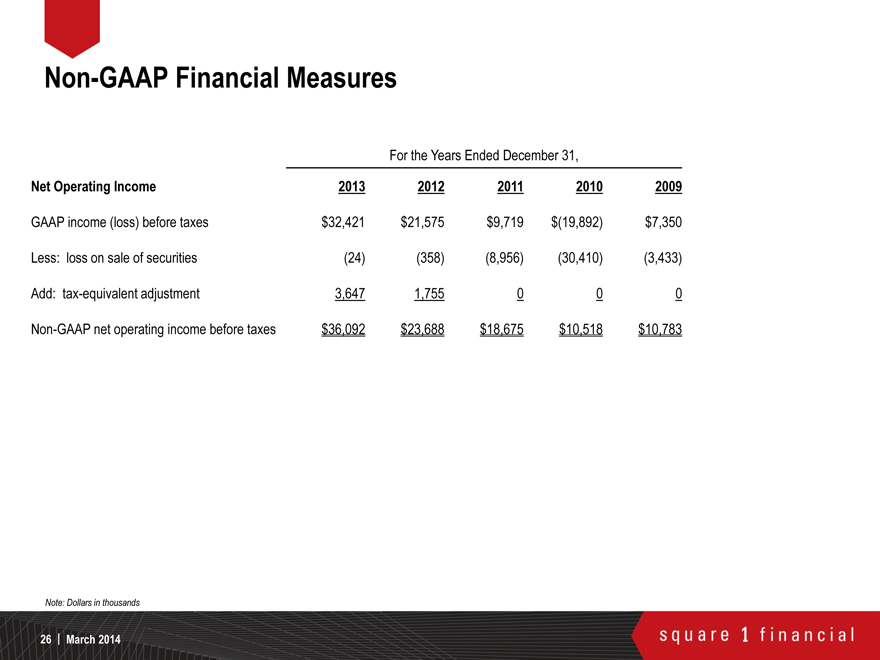
Net Operating Income 2013 2012 2011 2010 2009
GAAP income (loss) before taxes $32,421 $21,575 $9,719 $(19,892) $7,350
Less: loss on sale of securities (24) (358) (8,956) (30,410) (3,433)
Add: tax-equivalent adjustment 3,647 1,755 0 0 0
Non-GAAP net operating income before taxes $36,092 $23,688 $18,675 $10,518 $10,783
Note: Dollars in thousands
26 | March 2014
square 1 financial
Non-GAAP Financial Measures
For the Years Ended December 31,
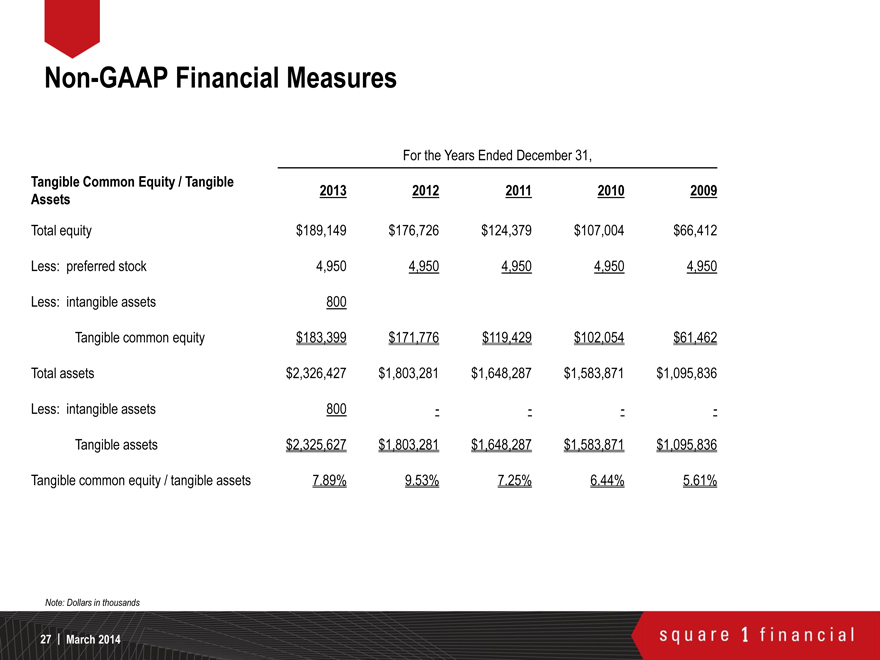
Tangible Common Equity / Tangible 2013 2012 2011 2010 2009
Assets
Total equity $189,149 $176,726 $124,379 $107,004 $66,412
Less: preferred stock 4,950 4,950 4,950 4,950 4,950
Less: intangible assets 800
Tangible common equity $183,399 $171,776 $119,429 $102,054 $61,462
Total assets $2,326,427 $1,803,281 $1,648,287 $1,583,871 $1,095,836
Less: intangible assets 800 — — — —
Tangible assets $2,325,627 $1,803,281 $1,648,287 $1,583,871 $1,095,836
Tangible common equity / tangible assets 7.89% 9.53% 7.25% 6.44% 5.61%
Note: Dollars in thousands
27 | March 2014
square 1 financial