
Supplemental Information 3rd Quarter 2025 .2
2 Overview 3 Segment Overview 6 Senior Housing 7 General and Administrative ("G&A") Expense 12 Capital Expenditures 13 Cash Facility Lease Payments 14 Capital Structure 15 Definitions 16 Appendix: Non-GAAP Financial Measures 18 Table of Contents
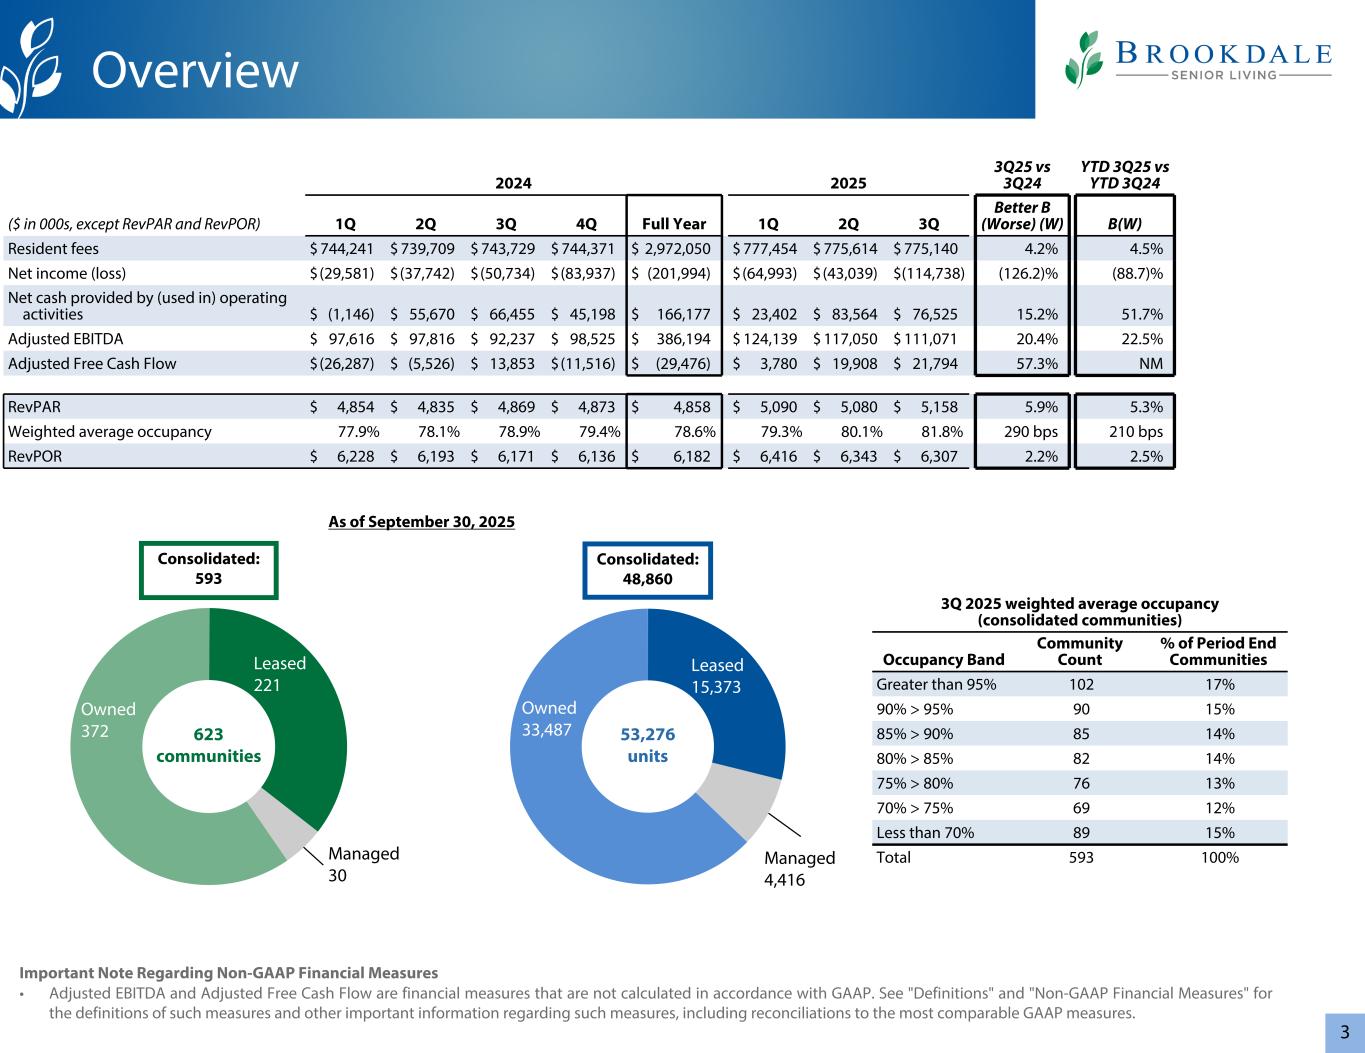
3 Managed 4,416 Owned 33,487 Leased 15,373 Managed 30 Owned 372 Leased 221 623 communities 53,276 units Important Note Regarding Non-GAAP Financial Measures • Adjusted EBITDA and Adjusted Free Cash Flow are financial measures that are not calculated in accordance with GAAP. See "Definitions" and "Non-GAAP Financial Measures" for the definitions of such measures and other important information regarding such measures, including reconciliations to the most comparable GAAP measures. 2024 2025 3Q25 vs 3Q24 YTD 3Q25 vs YTD 3Q24 ($ in 000s, except RevPAR and RevPOR) 1Q 2Q 3Q 4Q Full Year 1Q 2Q 3Q Better B (Worse) (W) B(W) Resident fees $ 744,241 $ 739,709 $ 743,729 $ 744,371 $ 2,972,050 $ 777,454 $ 775,614 $ 775,140 $ 2,328,208 4.2 % 4.5 % Net income (loss) $ (29,581) $ (37,742) $ (50,734) $ (83,937) $ (201,994) $ (64,993) $ (43,039) $ (114,738) (126.2) % (88.7) % Net cash provided by (used in) operating activities $ (1,146) $ 55,670 $ 66,455 $ 45,198 $ 166,177 $ 23,402 $ 83,564 $ 76,525 15.2 % 51.7 % Adjusted EBITDA $ 97,616 $ 97,816 $ 92,237 $ 98,525 $ 386,194 $ 124,139 $ 117,050 $ 111,071 20.4 % 22.5 % Adjusted Free Cash Flow $ (26,287) $ (5,526) $ 13,853 $ (11,516) $ (29,476) $ 3,780 $ 19,908 $ 21,794 57.3 % NM RevPAR $ 4,854 $ 4,835 $ 4,869 $ 4,873 $ 4,858 $ 5,090 $ 5,080 $ 5,158 5.9 % 5.3 % Weighted average occupancy 77.9% 78.1% 78.9% 79.4% 78.6% 79.3% 80.1% 81.8% 290 bps 210 bps RevPOR $ 6,228 $ 6,193 $ 6,171 $ 6,136 $ 6,182 $ 6,416 $ 6,343 $ 6,307 2.2 % 2.5 % 3Q 2025 weighted average occupancy (consolidated communities) Occupancy Band Community Count % of Period End Communities Greater than 95% 102 17% 90% > 95% 90 15% 85% > 90% 85 14% 80% > 85% 82 14% 75% > 80% 76 13% 70% > 75% 69 12% Less than 70% 89 15% Total 593 100% Overview As of September 30, 2025 Consolidated: 48,860 Consolidated: 593
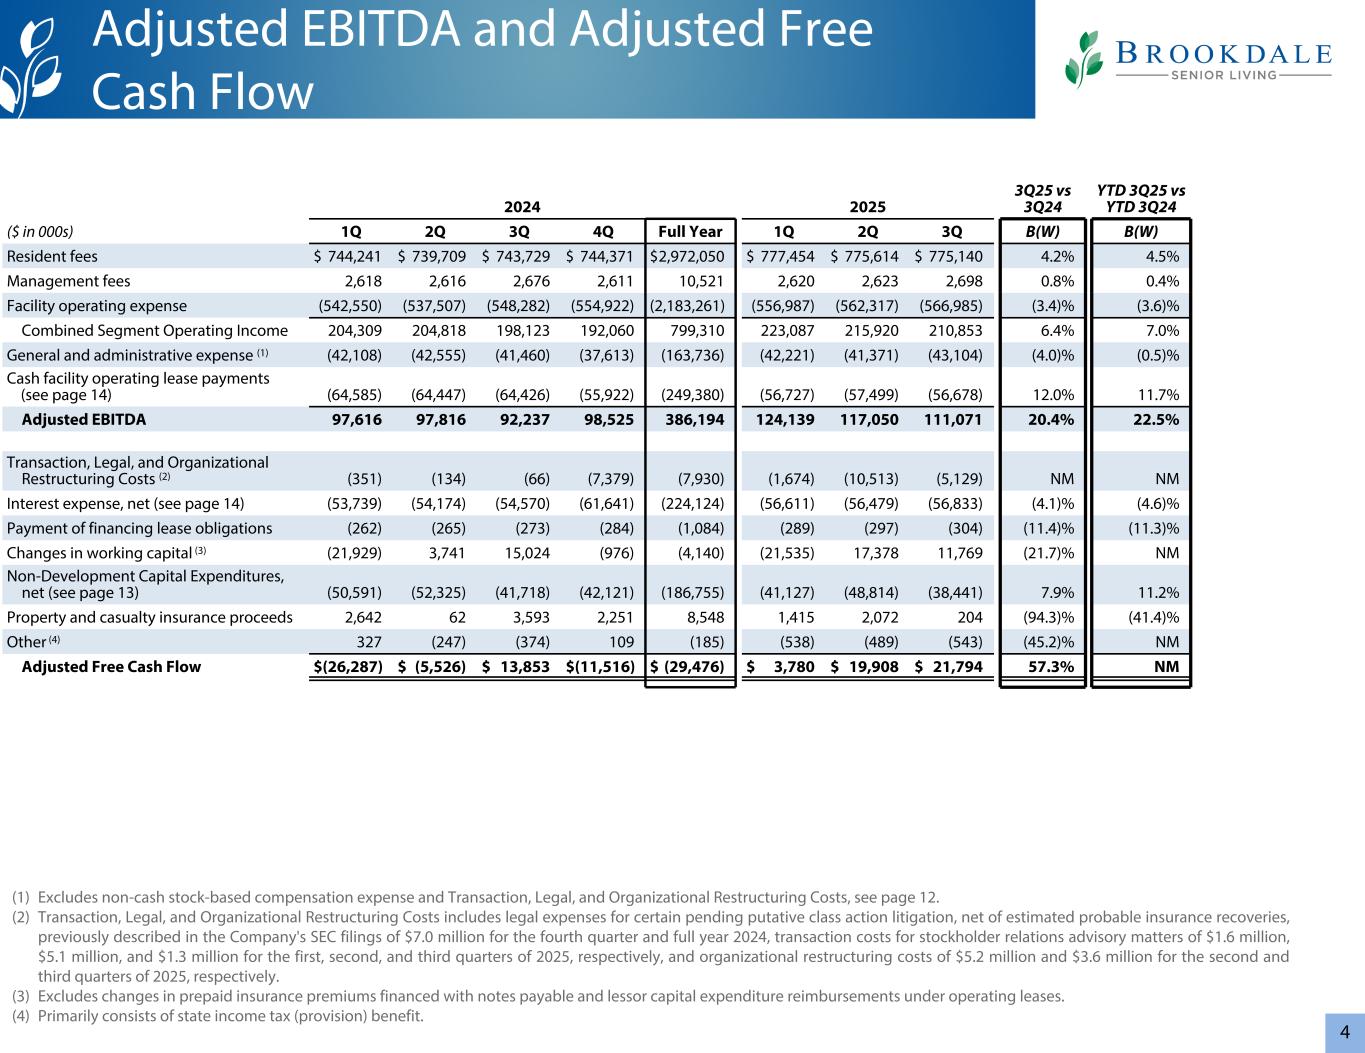
4 2024 2025 3Q25 vs 3Q24 YTD 3Q25 vs YTD 3Q24 ($ in 000s) 1Q 2Q 3Q 4Q Full Year 1Q 2Q 3Q B(W) B(W) Resident fees $ 744,241 $ 739,709 $ 743,729 $ 744,371 $ 2,972,050 $ 777,454 $ 775,614 $ 775,140 4.2 % 4.5 % Management fees 2,618 2,616 2,676 2,611 10,521 2,620 2,623 2,698 0.8 % 0.4 % Facility operating expense (542,550) (537,507) (548,282) (554,922) (2,183,261) (556,987) (562,317) (566,985) (3.4) % (3.6) % Combined Segment Operating Income 204,309 204,818 198,123 192,060 799,310 223,087 215,920 210,853 6.4 % 7.0 % General and administrative expense (1) (42,108) (42,555) (41,460) (37,613) (163,736) (42,221) (41,371) (43,104) (4.0) % (0.5) % Cash facility operating lease payments (see page 14) (64,585) (64,447) (64,426) (55,922) (249,380) (56,727) (57,499) (56,678) 12.0 % 11.7 % Adjusted EBITDA 97,616 97,816 92,237 98,525 386,194 124,139 117,050 111,071 20.4 % 22.5 % Transaction, Legal, and Organizational Restructuring Costs (2) (351) (134) (66) (7,379) (7,930) (1,674) (10,513) (5,129) NM NM Interest expense, net (see page 14) (53,739) (54,174) (54,570) (61,641) (224,124) (56,611) (56,479) (56,833) (4.1) % (4.6) % Payment of financing lease obligations (262) (265) (273) (284) (1,084) (289) (297) (304) (11.4) % (11.3) % Changes in working capital (3) (21,929) 3,741 15,024 (976) (4,140) (21,535) 17,378 11,769 (21.7) % NM Non-Development Capital Expenditures, net (see page 13) (50,591) (52,325) (41,718) (42,121) (186,755) (41,127) (48,814) (38,441) 7.9 % 11.2 % Property and casualty insurance proceeds 2,642 62 3,593 2,251 8,548 1,415 2,072 204 (94.3) % (41.4) % Other (4) 327 (247) (374) 109 (185) 3 2 (538) (489) (543) (45.2) % NM Adjusted Free Cash Flow $ (26,287) $ (5,526) $ 13,853 $ (11,516) $ (29,476) $ 3,780 $ 19,908 $ 21,794 57.3 % NM Adjusted EBITDA and Adjusted Free Cash Flow (1) Excludes non-cash stock-based compensation expense and Transaction, Legal, and Organizational Restructuring Costs, see page 12. (2) Transaction, Legal, and Organizational Restructuring Costs includes legal expenses for certain pending putative class action litigation, net of estimated probable insurance recoveries, previously described in the Company's SEC filings of $7.0 million for the fourth quarter and full year 2024, transaction costs for stockholder relations advisory matters of $1.6 million, $5.1 million, and $1.3 million for the first, second, and third quarters of 2025, respectively, and organizational restructuring costs of $5.2 million and $3.6 million for the second and third quarters of 2025, respectively. (3) Excludes changes in prepaid insurance premiums financed with notes payable and lessor capital expenditure reimbursements under operating leases. (4) Primarily consists of state income tax (provision) benefit.
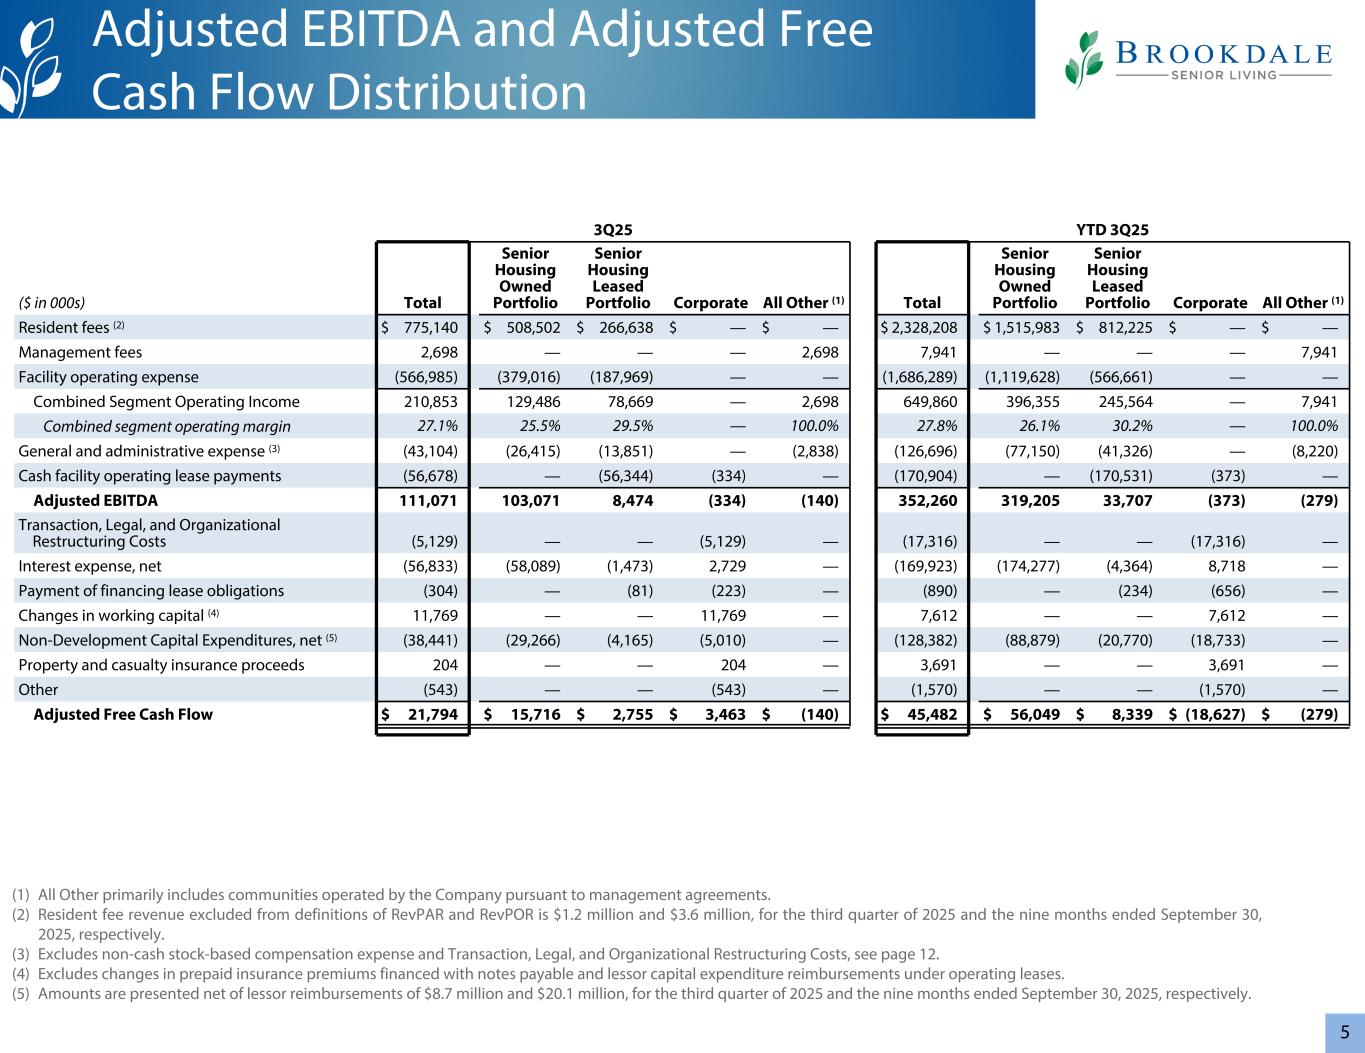
5 (1) All Other primarily includes communities operated by the Company pursuant to management agreements. (2) Resident fee revenue excluded from definitions of RevPAR and RevPOR is $1.2 million and $3.6 million, for the third quarter of 2025 and the nine months ended September 30, 2025, respectively. (3) Excludes non-cash stock-based compensation expense and Transaction, Legal, and Organizational Restructuring Costs, see page 12. (4) Excludes changes in prepaid insurance premiums financed with notes payable and lessor capital expenditure reimbursements under operating leases. (5) Amounts are presented net of lessor reimbursements of $8.7 million and $20.1 million, for the third quarter of 2025 and the nine months ended September 30, 2025, respectively. 3Q25 YTD 3Q25 ($ in 000s) Total Senior Housing Owned Portfolio Senior Housing Leased Portfolio Corporate All Other (1) Total Senior Housing Owned Portfolio Senior Housing Leased Portfolio Corporate All Other (1) Resident fees (2) $ 775,140 $ 508,502 $ 266,638 $ — $ — $ 2,328,208 $ 1,515,983 $ 812,225 $ — $ — Management fees 2,698 — — — 2,698 7,941 — — — 7,941 Facility operating expense (566,985) (379,016) (187,969) — — (1,686,289) (1,119,628) (566,661) — — Combined Segment Operating Income 210,853 129,486 78,669 — 2,698 649,860 396,355 245,564 — 7,941 Combined segment operating margin 27.1 % 25.5 % 29.5 % — 100.0 % 27.8 % 26.1 % 30.2 % — 100.0 % General and administrative expense (3) (43,104) (26,415) (13,851) — (2,838) (126,696) (77,150) (41,326) — (8,220) Cash facility operating lease payments (56,678) — (56,344) (334) — (170,904) — (170,531) (373) — Adjusted EBITDA 111,071 103,071 8,474 (334) (140) 352,260 319,205 33,707 (373) (279) Transaction, Legal, and Organizational Restructuring Costs (5,129) — — (5,129) — (17,316) — — (17,316) — Interest expense, net (56,833) (58,089) (1,473) 2,729 — (169,923) (174,277) (4,364) 8,718 — Payment of financing lease obligations (304) — (81) (223) — (890) — (234) (656) — Changes in working capital (4) 11,769 — — 11,769 — 7,612 — — 7,612 — Non-Development Capital Expenditures, net (5) (38,441) (29,266) (4,165) (5,010) — (128,382) (88,879) (20,770) (18,733) — Property and casualty insurance proceeds 204 — — 204 — 3,691 — — 3,691 — Other (543) — — (543) — (1,570) — — (1,570) — Adjusted Free Cash Flow $ 21,794 $ 15,716 $ 2,755 $ 3,463 $ (140) $ 45,482 $ 56,049 $ 8,339 $ (18,627) $ (279) Adjusted EBITDA and Adjusted Free Cash Flow Distribution
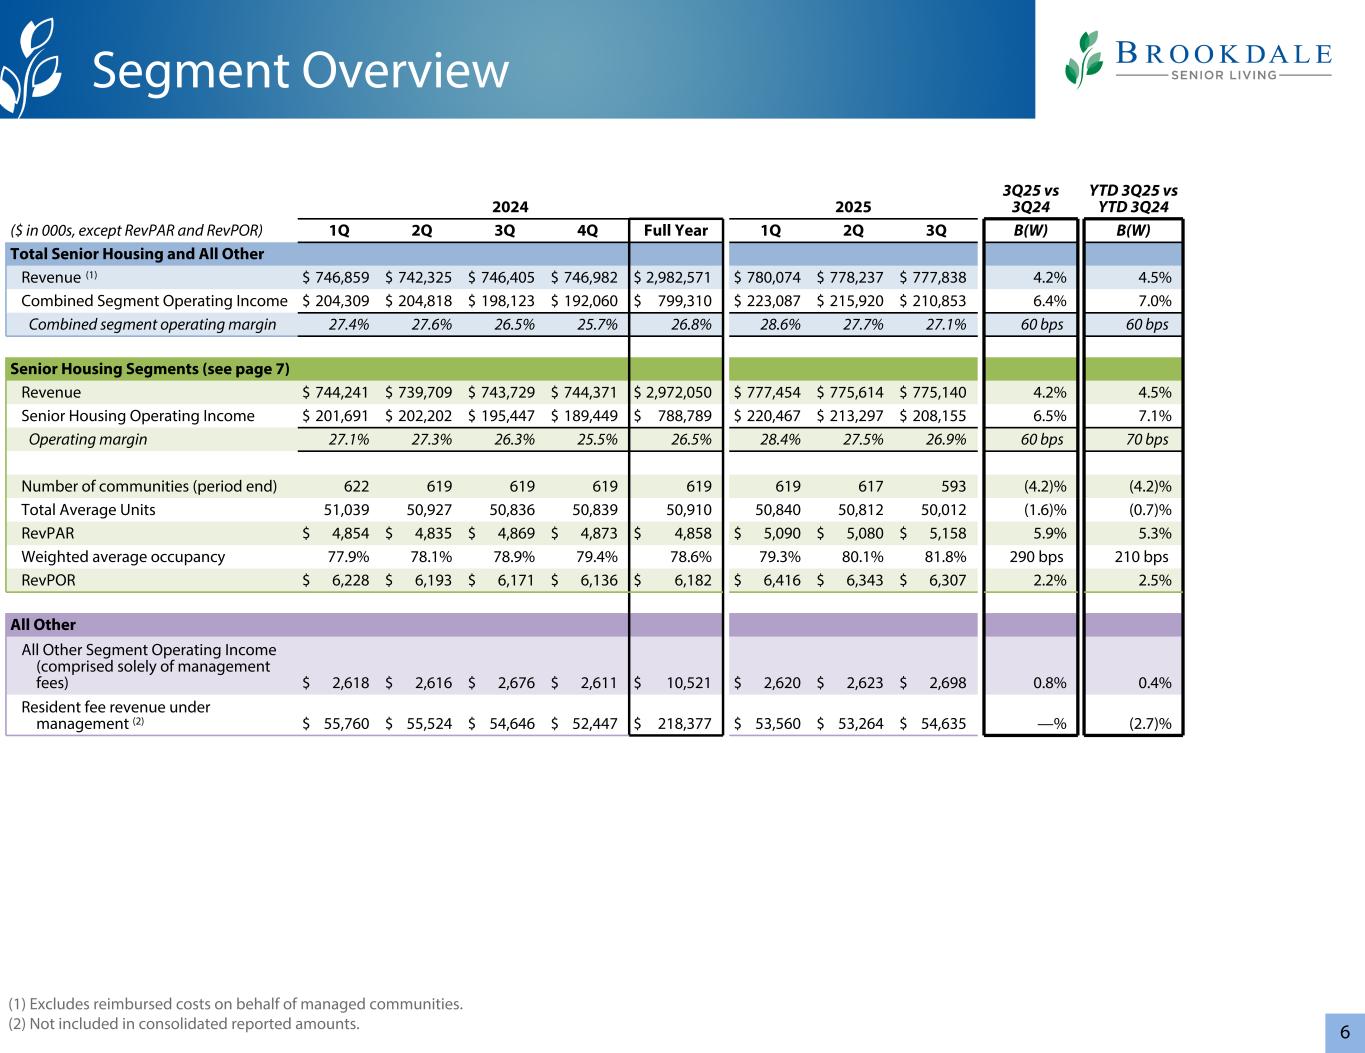
6 2024 2025 3Q25 vs 3Q24 YTD 3Q25 vs YTD 3Q24 ($ in 000s, except RevPAR and RevPOR) 1Q 2Q 3Q 4Q Full Year 1Q 2Q 3Q B(W) B(W) Total Senior Housing and All Other Revenue (1) $ 746,859 $ 742,325 $ 746,405 $ 746,982 $ 2,982,571 $ 780,074 $ 778,237 $ 777,838 4.2 % 4.5 % Combined Segment Operating Income $ 204,309 $ 204,818 $ 198,123 $ 192,060 $ 799,310 $ 223,087 $ 215,920 $ 210,853 6.4 % 7.0 % Combined segment operating margin 27.4 % 27.6 % 26.5 % 25.7 % 26.8 % 28.6 % 27.7 % 27.1 % 60 bps 60 bps Senior Housing Segments (see page 7) Revenue $ 744,241 $ 739,709 $ 743,729 $ 744,371 $ 2,972,050 $ 777,454 $ 775,614 $ 775,140 4.2 % 4.5 % Senior Housing Operating Income $ 201,691 $ 202,202 $ 195,447 $ 189,449 $ 788,789 $ 220,467 $ 213,297 $ 208,155 6.5 % 7.1 % Operating margin 27.1 % 27.3 % 26.3 % 25.5 % 26.5 % 28.4 % 27.5 % 26.9 % 60 bps 70 bps Number of communities (period end) 622 619 619 619 619 619 617 593 (4.2) % (4.2) % Total Average Units 51,039 50,927 50,836 50,839 50,910 50,840 50,812 50,012 (1.6) % (0.7) % RevPAR $ 4,854 $ 4,835 $ 4,869 $ 4,873 $ 4,858 $ 5,090 $ 5,080 $ 5,158 5.9 % 5.3 % Weighted average occupancy 77.9 % 78.1 % 78.9 % 79.4 % 78.6 % 79.3 % 80.1 % 81.8 % 290 bps 210 bps RevPOR $ 6,228 $ 6,193 $ 6,171 $ 6,136 $ 6,182 $ 6,416 $ 6,343 $ 6,307 2.2 % 2.5 % All Other All Other Segment Operating Income (comprised solely of management fees) $ 2,618 $ 2,616 $ 2,676 $ 2,611 $ 10,521 $ 2,620 $ 2,623 $ 2,698 0.8 % 0.4 % Resident fee revenue under management (2) $ 55,760 $ 55,524 $ 54,646 $ 52,447 $ 218,377 $ 53,560 $ 53,264 $ 54,635 — % (2.7) % Segment Overview (1) Excludes reimbursed costs on behalf of managed communities. (2) Not included in consolidated reported amounts.
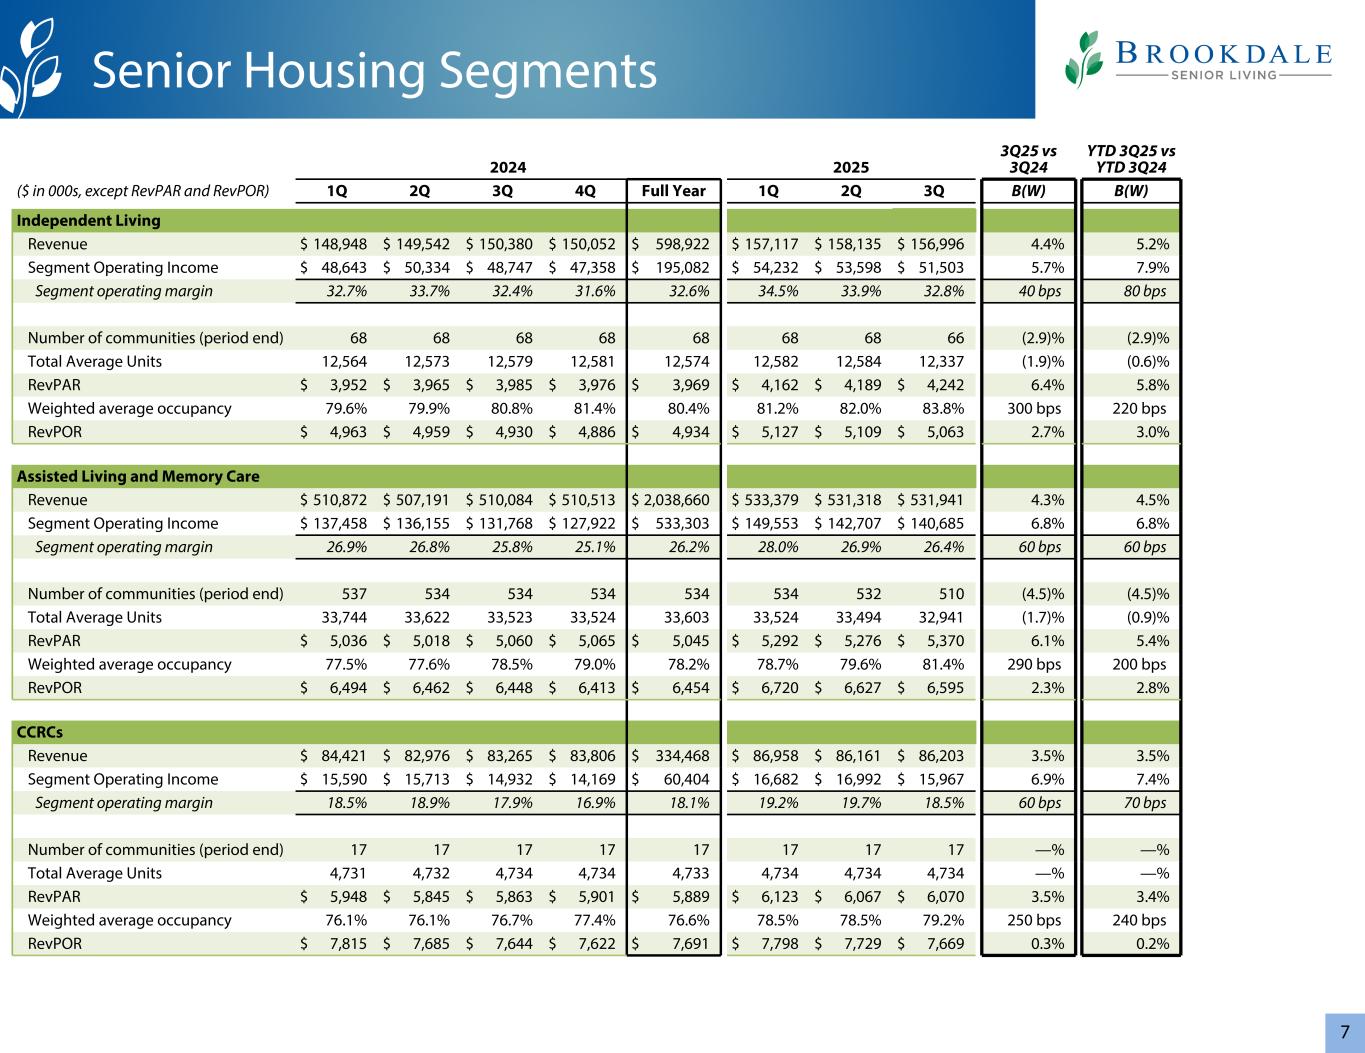
7 2024 2025 3Q25 vs 3Q24 YTD 3Q25 vs YTD 3Q24 ($ in 000s, except RevPAR and RevPOR) 1Q 2Q 3Q 4Q Full Year 1Q 2Q 3Q B(W) B(W) Independent Living Revenue $ 148,948 $ 149,542 $ 150,380 $ 150,052 $ 598,922 $ 157,117 $ 158,135 $ 156,996 4.4 % 5.2 % Segment Operating Income $ 48,643 $ 50,334 $ 48,747 $ 47,358 $ 195,082 $ 54,232 $ 53,598 $ 51,503 5.7 % 7.9 % Segment operating margin 32.7 % 33.7 % 32.4 % 31.6 % 32.6 % 34.5 % 33.9 % 32.8 % 40 bps 80 bps Number of communities (period end) 68 68 68 68 68 68 68 66 (2.9) % (2.9) % Total Average Units 12,564 12,573 12,579 12,581 12,574 12,582 12,584 12,337 (1.9) % (0.6) % RevPAR $ 3,952 $ 3,965 $ 3,985 $ 3,976 $ 3,969 $ 4,162 $ 4,189 $ 4,242 6.4 % 5.8 % Weighted average occupancy 79.6 % 79.9 % 80.8 % 81.4 % 80.4 % 81.2 % 82.0 % 83.8 % 300 bps 220 bps RevPOR $ 4,963 $ 4,959 $ 4,930 $ 4,886 $ 4,934 $ 5,127 $ 5,109 $ 5,063 2.7 % 3.0 % Assisted Living and Memory Care Revenue $ 510,872 $ 507,191 $ 510,084 $ 510,513 $ 2,038,660 $ 533,379 $ 531,318 $ 531,941 4.3 % 4.5 % Segment Operating Income $ 137,458 $ 136,155 $ 131,768 $ 127,922 $ 533,303 $ 149,553 $ 142,707 $ 140,685 6.8 % 6.8 % Segment operating margin 26.9 % 26.8 % 25.8 % 25.1 % 26.2 % 28.0 % 26.9 % 26.4 % 60 bps 60 bps Number of communities (period end) 537 534 534 534 534 534 532 510 (4.5) % (4.5) % Total Average Units 33,744 33,622 33,523 33,524 33,603 33,524 33,494 32,941 (1.7) % (0.9) % RevPAR $ 5,036 $ 5,018 $ 5,060 $ 5,065 $ 5,045 $ 5,292 $ 5,276 $ 5,370 6.1 % 5.4 % Weighted average occupancy 77.5 % 77.6 % 78.5 % 79.0 % 78.2 % 78.7 % 79.6 % 81.4 % 290 bps 200 bps RevPOR $ 6,494 $ 6,462 $ 6,448 $ 6,413 $ 6,454 $ 6,720 $ 6,627 $ 6,595 2.3 % 2.8 % CCRCs Revenue $ 84,421 $ 82,976 $ 83,265 $ 83,806 $ 334,468 $ 86,958 $ 86,161 $ 86,203 3.5 % 3.5 % Segment Operating Income $ 15,590 $ 15,713 $ 14,932 $ 14,169 $ 60,404 $ 16,682 $ 16,992 $ 15,967 6.9 % 7.4 % Segment operating margin 18.5 % 18.9 % 17.9 % 16.9 % 18.1 % 19.2 % 19.7 % 18.5 % 60 bps 70 bps Number of communities (period end) 17 17 17 17 17 17 17 17 — % — % Total Average Units 4,731 4,732 4,734 4,734 4,733 4,734 4,734 4,734 — % — % RevPAR $ 5,948 $ 5,845 $ 5,863 $ 5,901 $ 5,889 $ 6,123 $ 6,067 $ 6,070 3.5 % 3.4 % Weighted average occupancy 76.1 % 76.1 % 76.7 % 77.4 % 76.6 % 78.5 % 78.5 % 79.2 % 250 bps 240 bps RevPOR $ 7,815 $ 7,685 $ 7,644 $ 7,622 $ 7,691 $ 7,798 $ 7,729 $ 7,669 0.3 % 0.2 % Senior Housing Segments
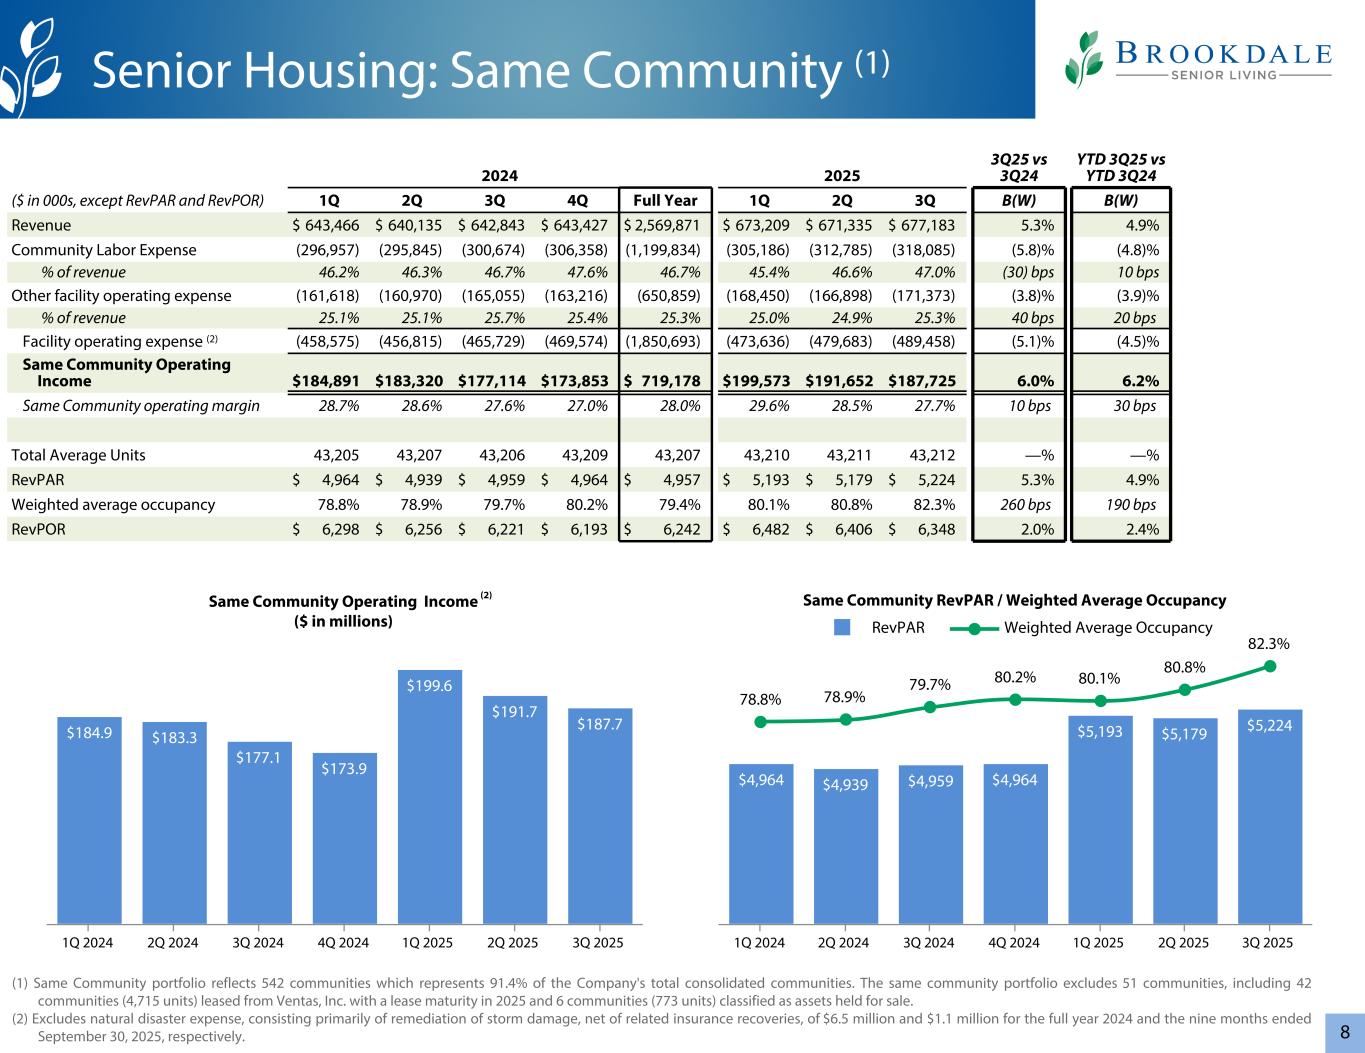
8 2024 2025 3Q25 vs 3Q24 YTD 3Q25 vs YTD 3Q24 ($ in 000s, except RevPAR and RevPOR) 1Q 2Q 3Q 4Q Full Year 1Q 2Q 3Q B(W) B(W) Revenue $ 643,466 $ 640,135 $ 642,843 $ 643,427 $ 2,569,871 $ 673,209 $ 671,335 $ 677,183 5.3 % 4.9 % Community Labor Expense (296,957) (295,845) (300,674) (306,358) (1,199,834) (305,186) (312,785) (318,085) (5.8) % (4.8) % % of revenue 46.2 % 46.3 % 46.7 % 47.6 % 46.7 % 45.4 % 46.6 % 47.0 % (30) bps 10 bps Other facility operating expense (161,618) (160,970) (165,055) (163,216) (650,859) (168,450) (166,898) (171,373) (3.8) % (3.9) % % of revenue 25.1 % 25.1 % 25.7 % 25.4 % 25.3 % 25.0 % 24.9 % 25.3 % 40 bps 20 bps Facility operating expense (2) (458,575) (456,815) (465,729) (469,574) (1,850,693) (473,636) (479,683) (489,458) (5.1) % (4.5) % Same Community Operating Income $ 184,891 $ 183,320 $ 177,114 $ 173,853 $ 719,178 $ 199,573 $ 191,652 $ 187,725 6.0 % 6.2 % Same Community operating margin 28.7 % 28.6 % 27.6 % 27.0 % 28.0 % 29.6 % 28.5 % 27.7 % 10 bps 30 bps Total Average Units 43,205 43,207 43,206 43,209 43,207 43,210 43,211 43,212 — % — % RevPAR $ 4,964 $ 4,939 $ 4,959 $ 4,964 $ 4,957 $ 5,193 $ 5,179 $ 5,224 5.3 % 4.9 % Weighted average occupancy 78.8 % 78.9 % 79.7 % 80.2 % 79.4 % 80.1 % 80.8 % 82.3 % 260 bps 190 bps RevPOR $ 6,298 $ 6,256 $ 6,221 $ 6,193 $ 6,242 $ 6,482 $ 6,406 $ 6,348 2.0 % 2.4 % Same Community Operating Income ($ in millions) $184.9 $183.3 $177.1 $173.9 $199.6 $191.7 $187.7 1Q 2024 2Q 2024 3Q 2024 4Q 2024 1Q 2025 2Q 2025 3Q 2025 Same Community RevPAR / Weighted Average Occupancy $4,964 $4,939 $4,959 $4,964 $5,193 $5,179 $5,224 78.8% 78.9% 79.7% 80.2% 80.1% 80.8% 82.3% RevPAR Weighted Average Occupancy 1Q 2024 2Q 2024 3Q 2024 4Q 2024 1Q 2025 2Q 2025 3Q 2025 Senior Housing: Same Community (1) (1) Same Community portfolio reflects 542 communities which represents 91.4% of the Company's total consolidated communities. The same community portfolio excludes 51 communities, including 42 communities (4,715 units) leased from Ventas, Inc. with a lease maturity in 2025 and 6 communities (773 units) classified as assets held for sale. (2) Excludes natural disaster expense, consisting primarily of remediation of storm damage, net of related insurance recoveries, of $6.5 million and $1.1 million for the full year 2024 and the nine months ended September 30, 2025, respectively. (2)
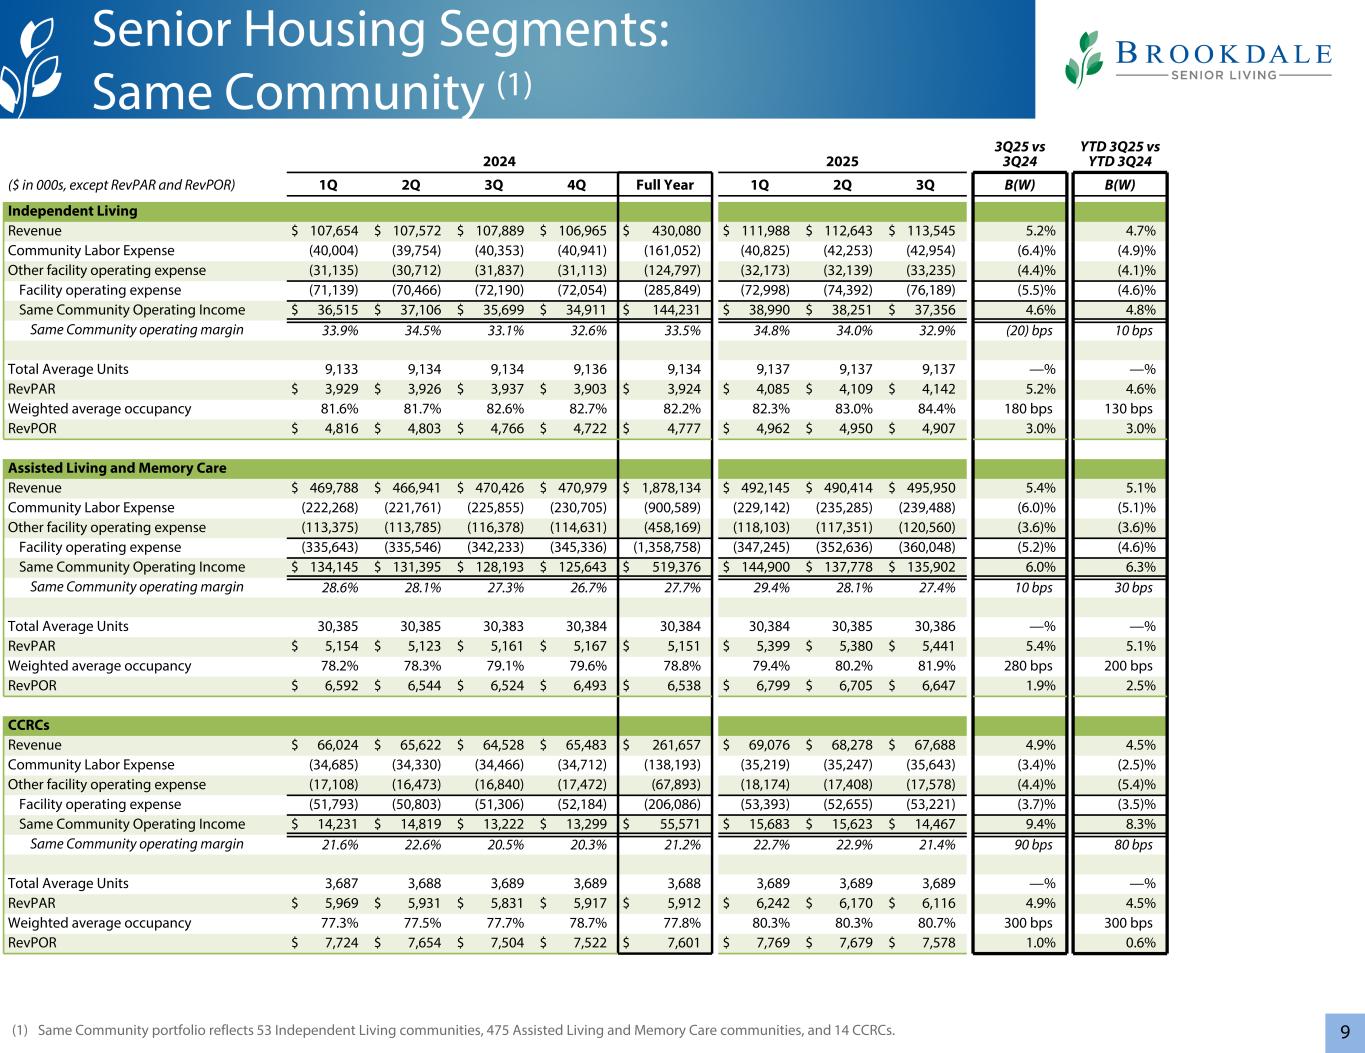
9 2024 2025 3Q25 vs 3Q24 YTD 3Q25 vs YTD 3Q24 ($ in 000s, except RevPAR and RevPOR) 1Q 2Q 3Q 4Q Full Year 1Q 2Q 3Q B(W) B(W) Independent Living Revenue $ 107,654 $ 107,572 $ 107,889 $ 106,965 $ 430,080 $ 111,988 $ 112,643 $ 113,545 5.2 % 4.7 % Community Labor Expense (40,004) (39,754) (40,353) (40,941) (161,052) (40,825) (42,253) (42,954) (6.4) % (4.9) % Other facility operating expense (31,135) (30,712) (31,837) (31,113) (124,797) (32,173) (32,139) (33,235) (4.4) % (4.1) % Facility operating expense (71,139) (70,466) (72,190) (72,054) (285,849) (72,998) (74,392) (76,189) (5.5) % (4.6) % Same Community Operating Income $ 36,515 $ 37,106 $ 35,699 $ 34,911 $ 144,231 $ 38,990 $ 38,251 $ 37,356 4.6 % 4.8 % Same Community operating margin 33.9 % 34.5 % 33.1 % 32.6 % 33.5 % 34.8 % 34.0 % 32.9 % (20) bps 10 bps Total Average Units 9,133 9,134 9,134 9,136 9,134 9,137 9,137 9,137 — % — % RevPAR $ 3,929 $ 3,926 $ 3,937 $ 3,903 $ 3,924 $ 4,085 $ 4,109 $ 4,142 5.2 % 4.6 % Weighted average occupancy 81.6 % 81.7 % 82.6 % 82.7 % 82.2 % 82.3 % 83.0 % 84.4 % 180 bps 130 bps RevPOR $ 4,816 $ 4,803 $ 4,766 $ 4,722 $ 4,777 $ 4,962 $ 4,950 $ 4,907 3.0 % 3.0 % Assisted Living and Memory Care Revenue $ 469,788 $ 466,941 $ 470,426 $ 470,979 $ 1,878,134 $ 492,145 $ 490,414 $ 495,950 5.4 % 5.1 % Community Labor Expense (222,268) (221,761) (225,855) (230,705) (900,589) (229,142) (235,285) (239,488) (6.0) % (5.1) % Other facility operating expense (113,375) (113,785) (116,378) (114,631) (458,169) (118,103) (117,351) (120,560) (3.6) % (3.6) % Facility operating expense (335,643) (335,546) (342,233) (345,336) (1,358,758) (347,245) (352,636) (360,048) (5.2) % (4.6) % Same Community Operating Income $ 134,145 $ 131,395 $ 128,193 $ 125,643 $ 519,376 $ 144,900 $ 137,778 $ 135,902 6.0 % 6.3 % Same Community operating margin 28.6 % 28.1 % 27.3 % 26.7 % 27.7 % 29.4 % 28.1 % 27.4 % 10 bps 30 bps Total Average Units 30,385 30,385 30,383 30,384 30,384 30,384 30,385 30,386 — % — % RevPAR $ 5,154 $ 5,123 $ 5,161 $ 5,167 $ 5,151 $ 5,399 $ 5,380 $ 5,441 5.4 % 5.1 % Weighted average occupancy 78.2 % 78.3 % 79.1 % 79.6 % 78.8 % 79.4 % 80.2 % 81.9 % 280 bps 200 bps RevPOR $ 6,592 $ 6,544 $ 6,524 $ 6,493 $ 6,538 $ 6,799 $ 6,705 $ 6,647 1.9 % 2.5 % CCRCs Revenue $ 66,024 $ 65,622 $ 64,528 $ 65,483 $ 261,657 $ 69,076 $ 68,278 $ 67,688 4.9 % 4.5 % Community Labor Expense (34,685) (34,330) (34,466) (34,712) (138,193) (35,219) (35,247) (35,643) (3.4) % (2.5) % Other facility operating expense (17,108) (16,473) (16,840) (17,472) (67,893) (18,174) (17,408) (17,578) (4.4) % (5.4) % Facility operating expense (51,793) (50,803) (51,306) (52,184) (206,086) (53,393) (52,655) (53,221) (3.7) % (3.5) % Same Community Operating Income $ 14,231 $ 14,819 $ 13,222 $ 13,299 $ 55,571 $ 15,683 $ 15,623 $ 14,467 9.4 % 8.3 % Same Community operating margin 21.6 % 22.6 % 20.5 % 20.3 % 21.2 % 22.7 % 22.9 % 21.4 % 90 bps 80 bps Total Average Units 3,687 3,688 3,689 3,689 3,688 3,689 3,689 3,689 — % — % RevPAR $ 5,969 $ 5,931 $ 5,831 $ 5,917 $ 5,912 $ 6,242 $ 6,170 $ 6,116 4.9 % 4.5 % Weighted average occupancy 77.3 % 77.5 % 77.7 % 78.7 % 77.8 % 80.3 % 80.3 % 80.7 % 300 bps 300 bps RevPOR $ 7,724 $ 7,654 $ 7,504 $ 7,522 $ 7,601 $ 7,769 $ 7,679 $ 7,578 1.0 % 0.6 % Senior Housing Segments: Same Community (1) (1) Same Community portfolio reflects 53 Independent Living communities, 475 Assisted Living and Memory Care communities, and 14 CCRCs.
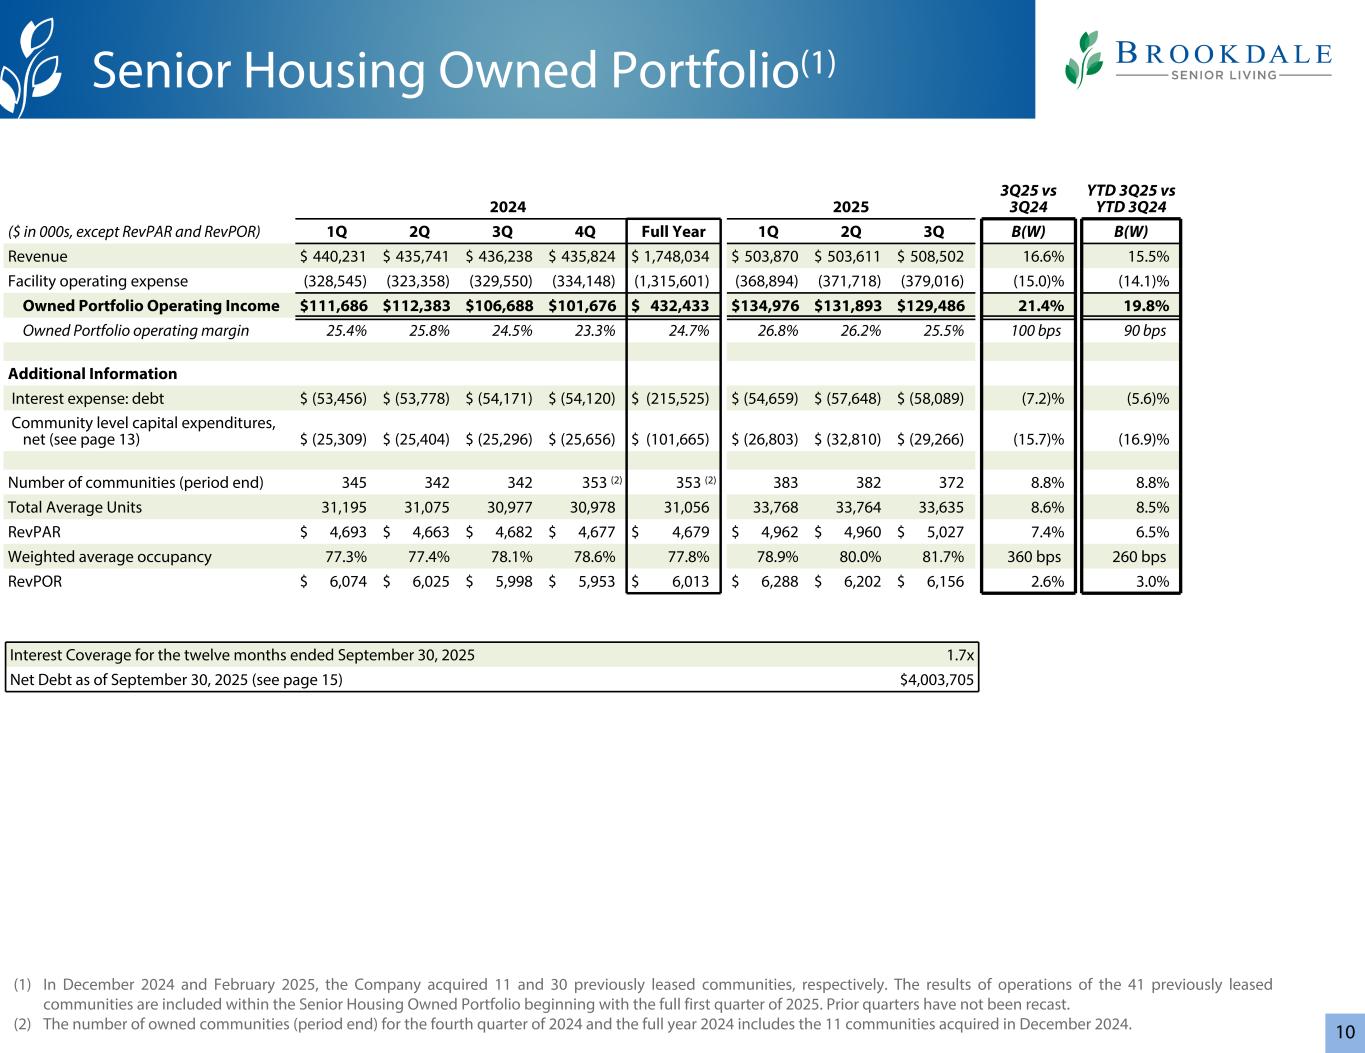
10 2024 2025 3Q25 vs 3Q24 YTD 3Q25 vs YTD 3Q24 ($ in 000s, except RevPAR and RevPOR) 1Q 2Q 3Q 4Q Full Year 1Q 2Q 3Q B(W) B(W) Revenue $ 440,231 $ 435,741 $ 436,238 $ 435,824 $ 1,748,034 $ 503,870 $ 503,611 $ 508,502 16.6 % 15.5 % Facility operating expense (328,545) (323,358) (329,550) (334,148) (1,315,601) (368,894) (371,718) (379,016) (15.0) % (14.1) % Owned Portfolio Operating Income $ 111,686 $ 112,383 $ 106,688 $ 101,676 $ 432,433 $ 134,976 $ 131,893 $ 129,486 21.4 % 19.8 % Owned Portfolio operating margin 25.4 % 25.8 % 24.5 % 23.3 % 24.7 % 26.8 % 26.2 % 25.5 % 100 bps 90 bps Additional Information Interest expense: debt $ (53,456) $ (53,778) $ (54,171) $ (54,120) $ (215,525) $ (54,659) $ (57,648) $ (58,089) (7.2) % (5.6) % Community level capital expenditures, net (see page 13) $ (25,309) $ (25,404) $ (25,296) $ (25,656) $ (101,665) $ (26,803) $ (32,810) $ (29,266) (15.7) % (16.9) % Number of communities (period end) 345 342 342 353 (2) 353 (2) 383 382 372 8.8 % 8.8 % Total Average Units 31,195 31,075 30,977 30,978 31,056 33,768 33,764 33,635 8.6 % 8.5 % RevPAR $ 4,693 $ 4,663 $ 4,682 $ 4,677 $ 4,679 $ 4,962 $ 4,960 $ 5,027 7.4 % 6.5 % Weighted average occupancy 77.3 % 77.4 % 78.1 % 78.6 % 77.8 % 78.9 % 80.0 % 81.7 % 360 bps 260 bps RevPOR $ 6,074 $ 6,025 $ 5,998 $ 5,953 $ 6,013 $ 6,288 $ 6,202 $ 6,156 2.6 % 3.0 % Senior Housing Owned Portfolio(1) Interest Coverage for the twelve months ended September 30, 2025 1.7x Net Debt as of September 30, 2025 (see page 15) $4,003,705 (1) In December 2024 and February 2025, the Company acquired 11 and 30 previously leased communities, respectively. The results of operations of the 41 previously leased communities are included within the Senior Housing Owned Portfolio beginning with the full first quarter of 2025. Prior quarters have not been recast. (2) The number of owned communities (period end) for the fourth quarter of 2024 and the full year 2024 includes the 11 communities acquired in December 2024.
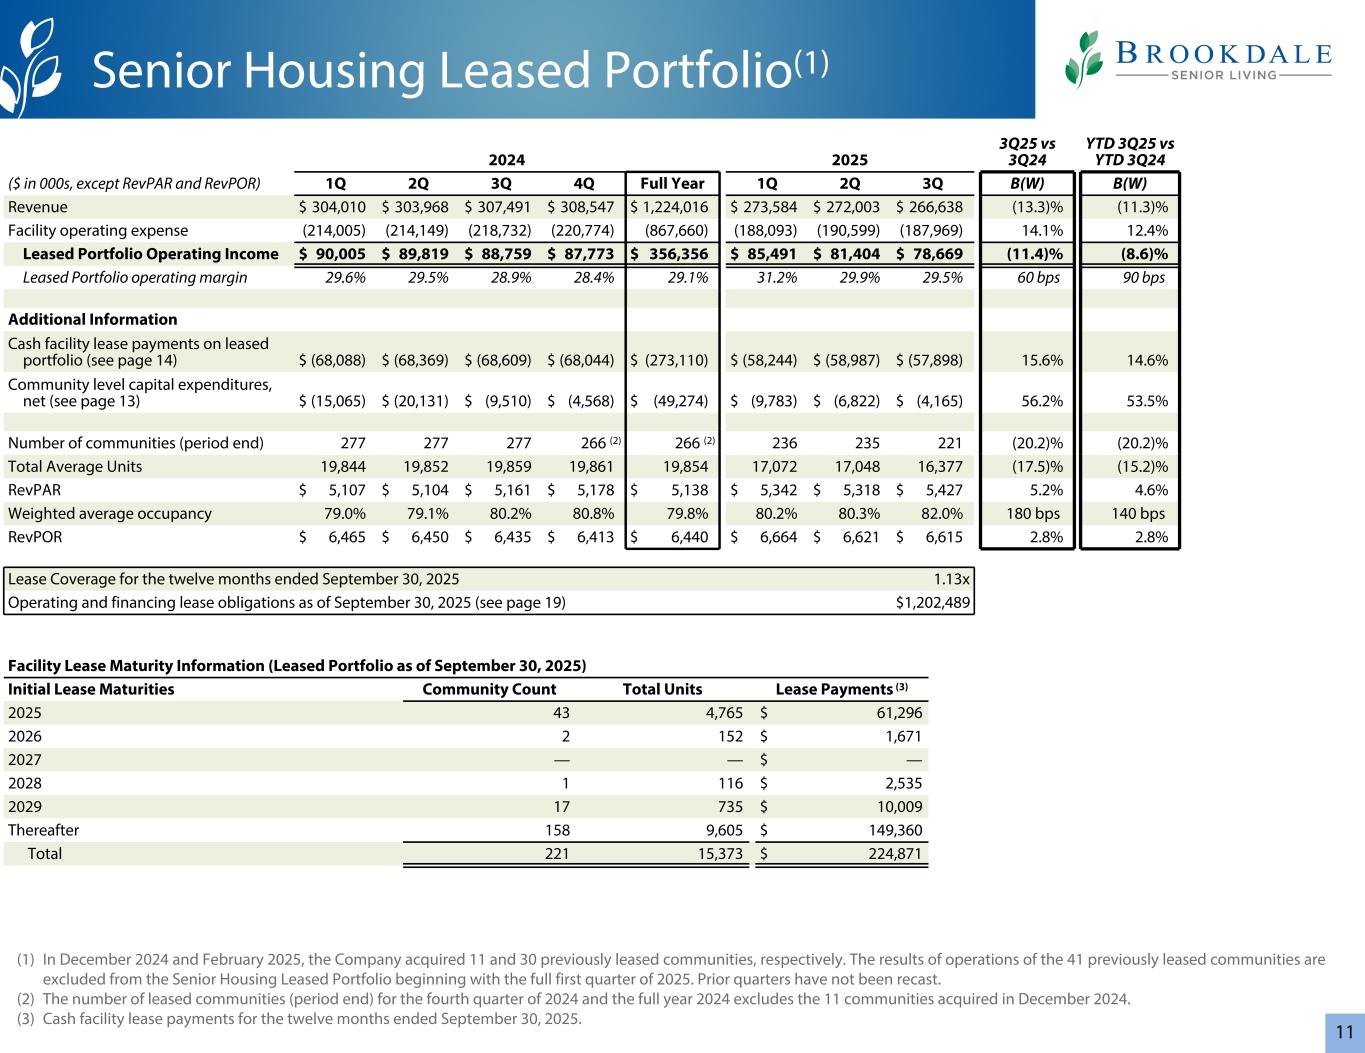
11 2024 2025 3Q25 vs 3Q24 YTD 3Q25 vs YTD 3Q24 ($ in 000s, except RevPAR and RevPOR) 1Q 2Q 3Q 4Q Full Year 1Q 2Q 3Q B(W) B(W) Revenue $ 304,010 $ 303,968 $ 307,491 $ 308,547 $ 1,224,016 $ 273,584 $ 272,003 $ 266,638 (13.3) % (11.3) % Facility operating expense (214,005) (214,149) (218,732) (220,774) (867,660) (188,093) (190,599) (187,969) 14.1 % 12.4 % Leased Portfolio Operating Income $ 90,005 $ 89,819 $ 88,759 $ 87,773 $ 356,356 $ 85,491 $ 81,404 $ 78,669 (11.4) % (8.6) % Leased Portfolio operating margin 29.6 % 29.5 % 28.9 % 28.4 % 29.1 % 31.2 % 29.9 % 29.5 % 60 bps 90 bps Additional Information Cash facility lease payments on leased portfolio (see page 14) $ (68,088) $ (68,369) $ (68,609) $ (68,044) $ (273,110) $ (58,244) $ (58,987) $ (57,898) 15.6 % 14.6 % Community level capital expenditures, net (see page 13) $ (15,065) $ (20,131) $ (9,510) $ (4,568) $ (49,274) $ (9,783) $ (6,822) $ (4,165) 56.2 % 53.5 % Number of communities (period end) 277 277 277 266 (2) 266 (2) 236 235 221 (20.2) % (20.2) % Total Average Units 19,844 19,852 19,859 19,861 19,854 17,072 17,048 16,377 (17.5) % (15.2) % RevPAR $ 5,107 $ 5,104 $ 5,161 $ 5,178 $ 5,138 $ 5,342 $ 5,318 $ 5,427 5.2 % 4.6 % Weighted average occupancy 79.0 % 79.1 % 80.2 % 80.8 % 79.8 % 80.2 % 80.3 % 82.0 % 180 bps 140 bps RevPOR $ 6,465 $ 6,450 $ 6,435 $ 6,413 $ 6,440 $ 6,664 $ 6,621 $ 6,615 2.8 % 2.8 % Lease Coverage for the twelve months ended September 30, 2025 1.13x Operating and financing lease obligations as of September 30, 2025 (see page 19) $ 1,202,489 Facility Lease Maturity Information (Leased Portfolio as of September 30, 2025) Initial Lease Maturities Community Count Total Units Lease Payments (3) 2025 43 4,765 $ 61,296 2026 2 152 $ 1,671 2027 — — $ — 2028 1 116 $ 2,535 2029 17 735 $ 10,009 Thereafter 158 9,605 $ 149,360 Total 221 15,373 $ 224,871 Senior Housing Leased Portfolio(1) (1) In December 2024 and February 2025, the Company acquired 11 and 30 previously leased communities, respectively. The results of operations of the 41 previously leased communities are excluded from the Senior Housing Leased Portfolio beginning with the full first quarter of 2025. Prior quarters have not been recast. (2) The number of leased communities (period end) for the fourth quarter of 2024 and the full year 2024 excludes the 11 communities acquired in December 2024. (3) Cash facility lease payments for the twelve months ended September 30, 2025.
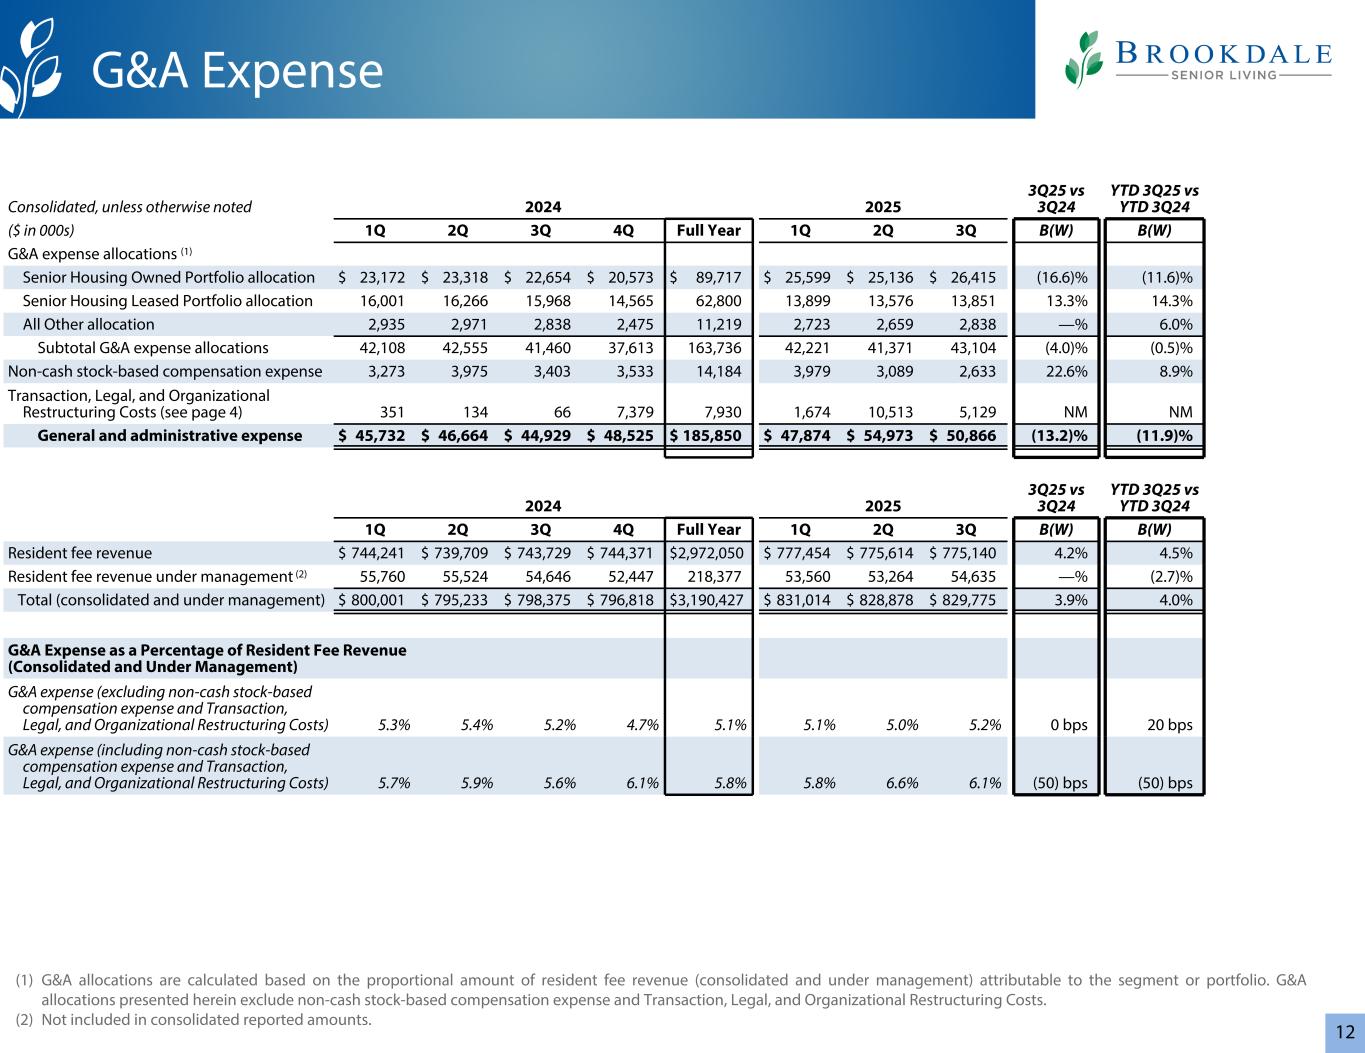
12 (1) G&A allocations are calculated based on the proportional amount of resident fee revenue (consolidated and under management) attributable to the segment or portfolio. G&A allocations presented herein exclude non-cash stock-based compensation expense and Transaction, Legal, and Organizational Restructuring Costs. (2) Not included in consolidated reported amounts. Consolidated, unless otherwise noted 2024 2025 3Q25 vs 3Q24 YTD 3Q25 vs YTD 3Q24 ($ in 000s) 1Q 2Q 3Q 4Q Full Year 1Q 2Q 3Q B(W) B(W) G&A expense allocations (1) Senior Housing Owned Portfolio allocation $ 23,172 $ 23,318 $ 22,654 $ 20,573 $ 89,717 $ 25,599 $ 25,136 $ 26,415 (16.6) % (11.6) % Senior Housing Leased Portfolio allocation 16,001 16,266 15,968 14,565 62,800 13,899 13,576 13,851 13.3 % 14.3 % All Other allocation 2,935 2,971 2,838 2,475 11,219 2,723 2,659 2,838 — % 6.0 % Subtotal G&A expense allocations 42,108 42,555 41,460 37,613 163,736 42,221 41,371 43,104 (4.0) % (0.5) % Non-cash stock-based compensation expense 3,273 3,975 3,403 3,533 14,184 3,979 3,089 2,633 22.6 % 8.9 % Transaction, Legal, and Organizational Restructuring Costs (see page 4) 351 134 66 7,379 7,930 1,674 10,513 5,129 NM NM General and administrative expense $ 45,732 $ 46,664 $ 44,929 $ 48,525 $ 185,850 $ 47,874 $ 54,973 $ 50,866 (13.2) % (11.9) % 2024 2025 3Q25 vs 3Q24 YTD 3Q25 vs YTD 3Q24 1Q 2Q 3Q 4Q Full Year 1Q 2Q 3Q B(W) B(W) Resident fee revenue $ 744,241 $ 739,709 $ 743,729 $ 744,371 $ 2,972,050 $ 777,454 $ 775,614 $ 775,140 4.2 % 4.5 % Resident fee revenue under management (2) 55,760 55,524 54,646 52,447 218,377 53,560 53,264 54,635 — % (2.7) % Total (consolidated and under management) $ 800,001 $ 795,233 $ 798,375 $ 796,818 $ 3,190,427 $ 831,014 $ 828,878 $ 829,775 3.9 % 4.0 % G&A Expense as a Percentage of Resident Fee Revenue (Consolidated and Under Management) G&A expense (excluding non-cash stock-based compensation expense and Transaction, Legal, and Organizational Restructuring Costs) 5.3% 5.4% 5.2% 4.7% 5.1% 5.1% 5.0% 5.2% 0 bps 20 bps G&A expense (including non-cash stock-based compensation expense and Transaction, Legal, and Organizational Restructuring Costs) 5.7% 5.9% 5.6% 6.1% 5.8% 5.8% 6.6% 6.1% (50) bps (50) bps G&A Expense
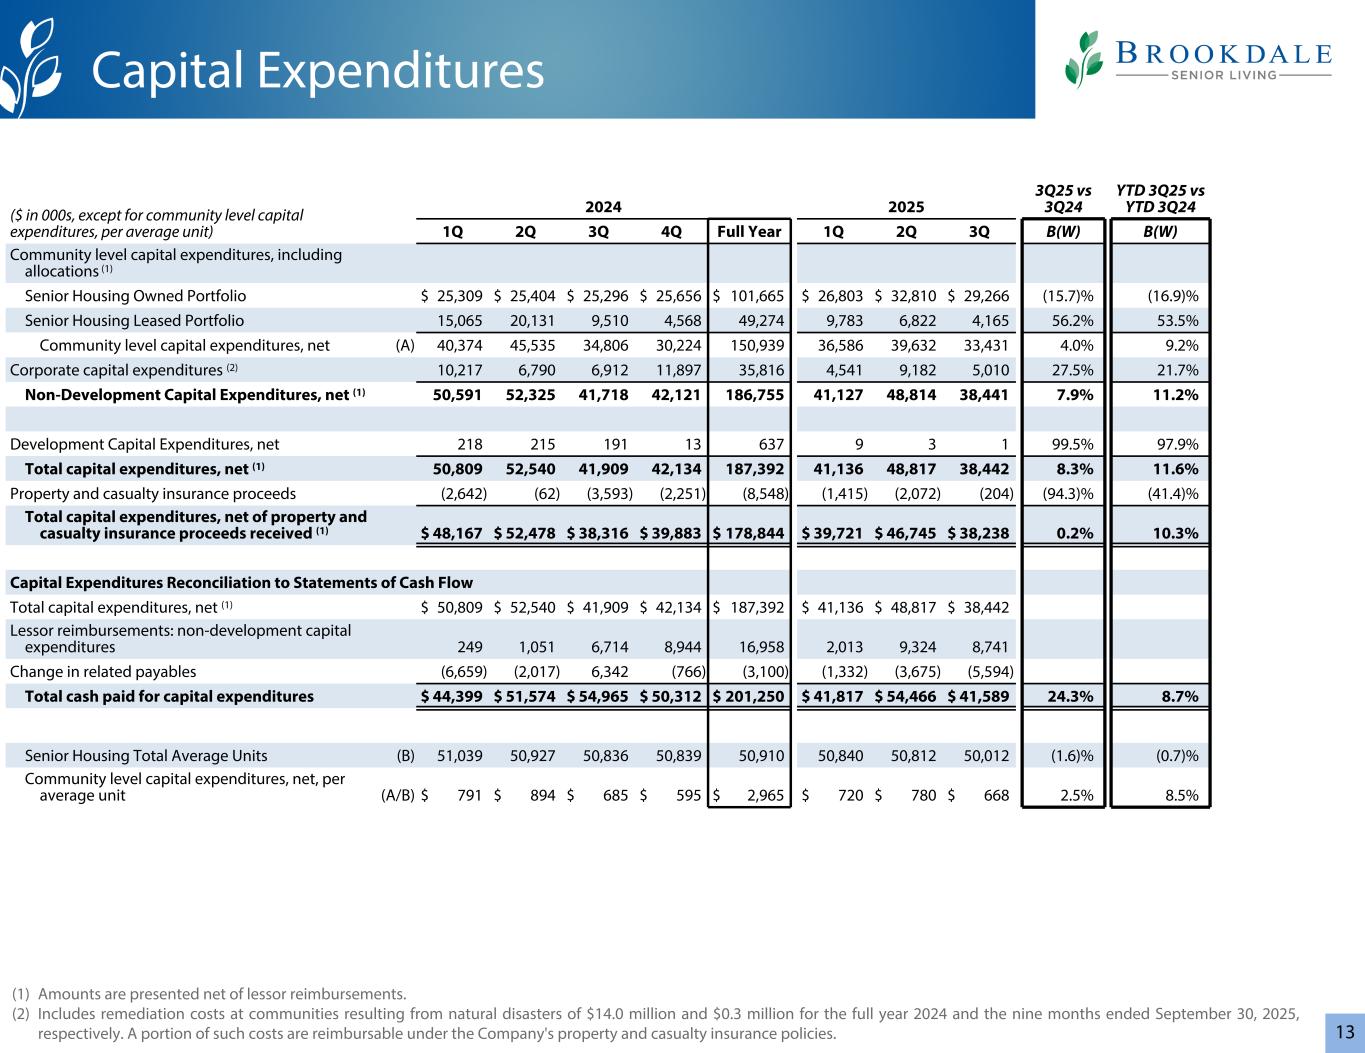
13 ($ in 000s, except for community level capital expenditures, per average unit) 2024 2025 3Q25 vs 3Q24 YTD 3Q25 vs YTD 3Q24 1Q 2Q 3Q 4Q Full Year 1Q 2Q 3Q B(W) B(W) Community level capital expenditures, including allocations (1) Senior Housing Owned Portfolio $ 25,309 $ 25,404 $ 25,296 $ 25,656 $ 101,665 $ 26,803 $ 32,810 $ 29,266 (15.7) % (16.9) % Senior Housing Leased Portfolio 15,065 20,131 9,510 4,568 49,274 9,783 6,822 4,165 56.2 % 53.5 % Community level capital expenditures, net (A) 40,374 45,535 34,806 30,224 150,939 36,586 39,632 33,431 4.0 % 9.2 % Corporate capital expenditures (2) 10,217 6,790 6,912 11,897 35,816 4,541 9,182 5,010 27.5 % 21.7 % Non-Development Capital Expenditures, net (1) 50,591 52,325 41,718 42,121 186,755 41,127 48,814 38,441 7.9 % 11.2 % Development Capital Expenditures, net 218 215 191 13 637 9 3 1 99.5 % 97.9 % Total capital expenditures, net (1) 50,809 52,540 41,909 42,134 187,392 41,136 48,817 38,442 8.3 % 11.6 % Property and casualty insurance proceeds (2,642) (62) (3,593) (2,251) (8,548) (1,415) (2,072) (204) (94.3) % (41.4) % Total capital expenditures, net of property and casualty insurance proceeds received (1) $ 48,167 $ 52,478 $ 38,316 $ 39,883 $ 178,844 $ 39,721 $ 46,745 $ 38,238 0.2 % 10.3 % Capital Expenditures Reconciliation to Statements of Cash Flow Total capital expenditures, net (1) $ 50,809 $ 52,540 $ 41,909 $ 42,134 $ 187,392 $ 41,136 $ 48,817 $ 38,442 Lessor reimbursements: non-development capital expenditures 249 1,051 6,714 8,944 16,958 2,013 9,324 8,741 Change in related payables (6,659) (2,017) 6,342 (766) (3,100) (1,332) (3,675) (5,594) Total cash paid for capital expenditures $ 44,399 $ 51,574 $ 54,965 $ 50,312 $ 201,250 $ 41,817 $ 54,466 $ 41,589 24.3 % 8.7 % Senior Housing Total Average Units (B) 51,039 50,927 50,836 50,839 50,910 50,840 50,812 50,012 (1.6) % (0.7) % Community level capital expenditures, net, per average unit (A/B) $ 791 $ 894 $ 685 $ 595 $ 2,965 $ 720 $ 780 $ 668 2.5 % 8.5 % Capital Expenditures (1) Amounts are presented net of lessor reimbursements. (2) Includes remediation costs at communities resulting from natural disasters of $14.0 million and $0.3 million for the full year 2024 and the nine months ended September 30, 2025, respectively. A portion of such costs are reimbursable under the Company's property and casualty insurance policies.
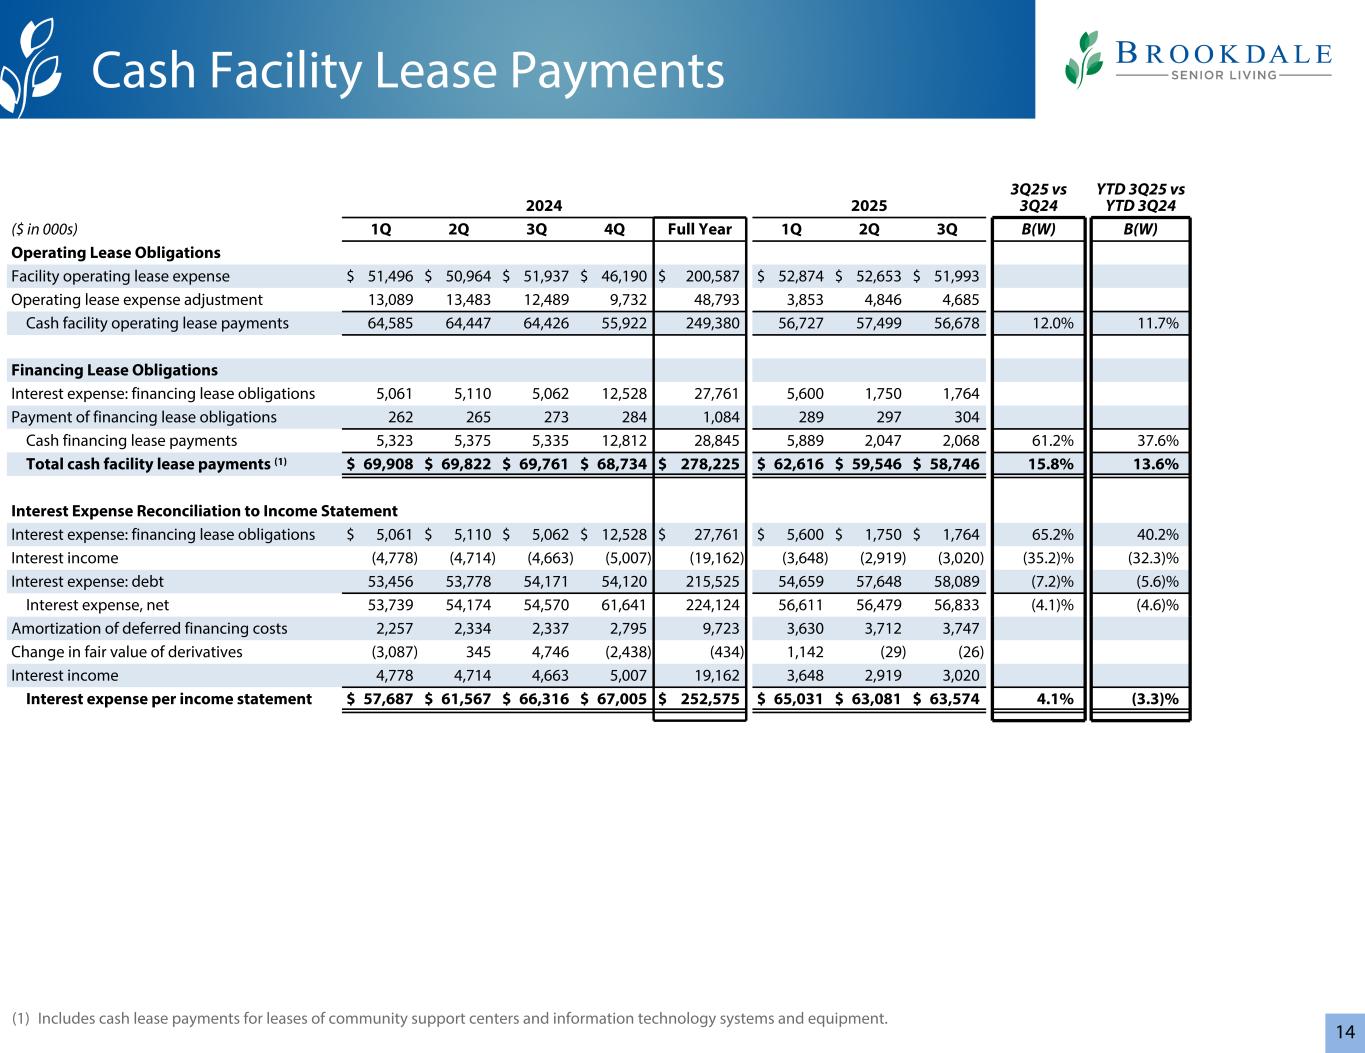
14 (1) Includes cash lease payments for leases of community support centers and information technology systems and equipment. 2024 2025 3Q25 vs 3Q24 YTD 3Q25 vs YTD 3Q24 ($ in 000s) 1Q 2Q 3Q 4Q Full Year 1Q 2Q 3Q B(W) B(W) Operating Lease Obligations Facility operating lease expense $ 51,496 $ 50,964 $ 51,937 $ 46,190 $ 200,587 $ 52,874 $ 52,653 $ 51,993 Operating lease expense adjustment 13,089 13,483 12,489 9,732 48,793 3,853 4,846 4,685 Cash facility operating lease payments 64,585 64,447 64,426 55,922 249,380 56,727 57,499 56,678 12.0 % 11.7 % Financing Lease Obligations Interest expense: financing lease obligations 5,061 5,110 5,062 12,528 27,761 5,600 1,750 1,764 Payment of financing lease obligations 262 265 273 284 1,084 289 297 304 Cash financing lease payments 5,323 5,375 5,335 12,812 28,845 5,889 2,047 2,068 61.2 % 37.6 % Total cash facility lease payments (1) $ 69,908 $ 69,822 $ 69,761 $ 68,734 $ 278,225 $ 62,616 $ 59,546 $ 58,746 15.8 % 13.6 % Interest Expense Reconciliation to Income Statement Interest expense: financing lease obligations $ 5,061 $ 5,110 $ 5,062 $ 12,528 $ 27,761 $ 5,600 $ 1,750 $ 1,764 65.2 % 40.2 % Interest income (4,778) (4,714) (4,663) (5,007) (19,162) (3,648) (2,919) (3,020) (35.2) % (32.3) % Interest expense: debt 53,456 53,778 54,171 54,120 215,525 54,659 57,648 58,089 (7.2) % (5.6) % Interest expense, net 53,739 54,174 54,570 61,641 224,124 56,611 56,479 56,833 (4.1) % (4.6) % Amortization of deferred financing costs 2,257 2,334 2,337 2,795 9,723 3,630 3,712 3,747 Change in fair value of derivatives (3,087) 345 4,746 (2,438) (434) 1,142 (29) (26) Interest income 4,778 4,714 4,663 5,007 19,162 3,648 2,919 3,020 Interest expense per income statement $ 57,687 $ 61,567 $ 66,316 $ 67,005 $ 252,575 $ 65,031 $ 63,081 $ 63,574 4.1 % (3.3) % Cash Facility Lease Payments
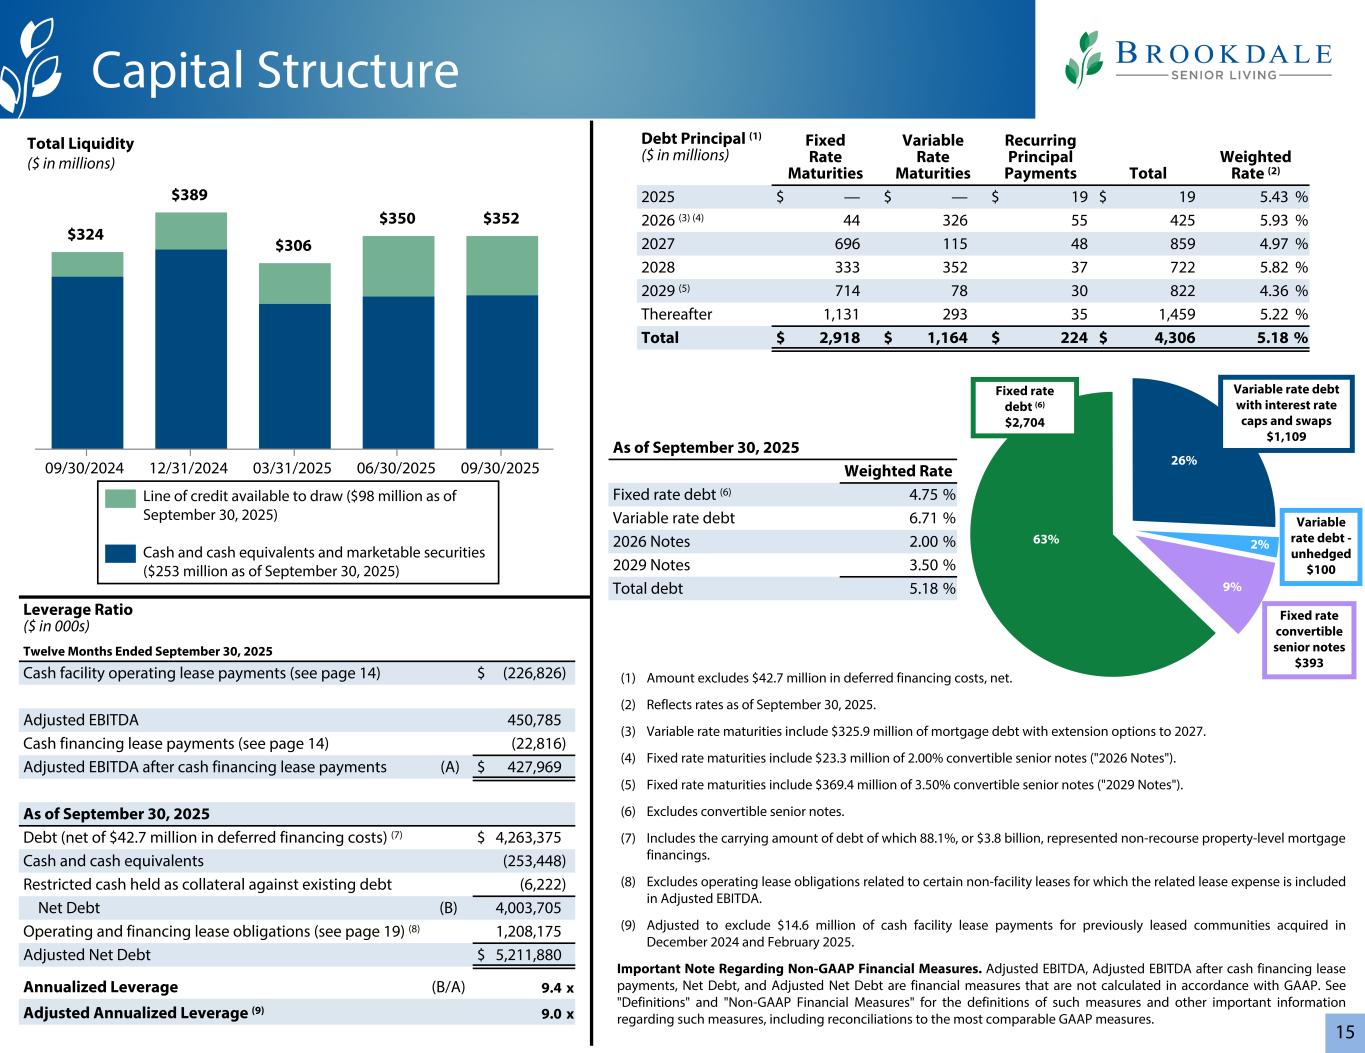
15 (1) Amount excludes $42.7 million in deferred financing costs, net. (2) Reflects rates as of September 30, 2025. (3) Variable rate maturities include $325.9 million of mortgage debt with extension options to 2027. (4) Fixed rate maturities include $23.3 million of 2.00% convertible senior notes ("2026 Notes"). (5) Fixed rate maturities include $369.4 million of 3.50% convertible senior notes ("2029 Notes"). (6) Excludes convertible senior notes. (7) Includes the carrying amount of debt of which 88.1%, or $3.8 billion, represented non-recourse property-level mortgage financings. (8) Excludes operating lease obligations related to certain non-facility leases for which the related lease expense is included in Adjusted EBITDA. (9) Adjusted to exclude $14.6 million of cash facility lease payments for previously leased communities acquired in December 2024 and February 2025. Important Note Regarding Non-GAAP Financial Measures. Adjusted EBITDA, Adjusted EBITDA after cash financing lease payments, Net Debt, and Adjusted Net Debt are financial measures that are not calculated in accordance with GAAP. See "Definitions" and "Non-GAAP Financial Measures" for the definitions of such measures and other important information regarding such measures, including reconciliations to the most comparable GAAP measures. $324 $389 $306 $350 $352 09/30/2024 12/31/2024 03/31/2025 06/30/2025 09/30/2025 Total Liquidity ($ in millions) Leverage Ratio ($ in 000s) Twelve Months Ended September 30, 2025 Cash facility operating lease payments (see page 14) $ (226,826) Adjusted EBITDA 450,785 Cash financing lease payments (see page 14) (22,816) Adjusted EBITDA after cash financing lease payments (A) $ 427,969 As of September 30, 2025 Debt (net of $42.7 million in deferred financing costs) (7) $ 4,263,375 Cash and cash equivalents (253,448) Restricted cash held as collateral against existing debt (6,222) Net Debt (B) 4,003,705 Operating and financing lease obligations (see page 19) (8) 1,208,175 Adjusted Net Debt $ 5,211,880 Annualized Leverage (B/A) 9.4 x Adjusted Annualized Leverage (9) 9.0 x Debt Principal (1) ($ in millions) Fixed Rate Maturities Variable Rate Maturities Recurring Principal Payments Total Weighted Rate (2) 2025 $ — $ — $ 19 $ 19 5.43 % 2026 (3) (4) 44 326 55 425 5.93 % 2027 696 115 48 859 4.97 % 2028 333 352 37 722 5.82 % 2029 (5) 714 78 30 822 4.36 % Thereafter 1,131 293 35 1,459 5.22 % Total $ 2,918 $ 1,164 $ 224 $ 4,306 5.18 % Capital Structure Line of credit available to draw ($98 million as of September 30, 2025) Cash and cash equivalents and marketable securities ($253 million as of September 30, 2025) Fixed rate debt (6) $2,704 Variable rate debt with interest rate caps and swaps $1,109 Fixed rate convertible senior notes $393 63% 26% As of September 30, 2025 Weighted Rate Fixed rate debt (6) 4.75 % Variable rate debt 6.71 % 2026 Notes 2.00 % 2029 Notes 3.50 % Total debt 5.18 % 9% Variable rate debt - unhedged $100 2%
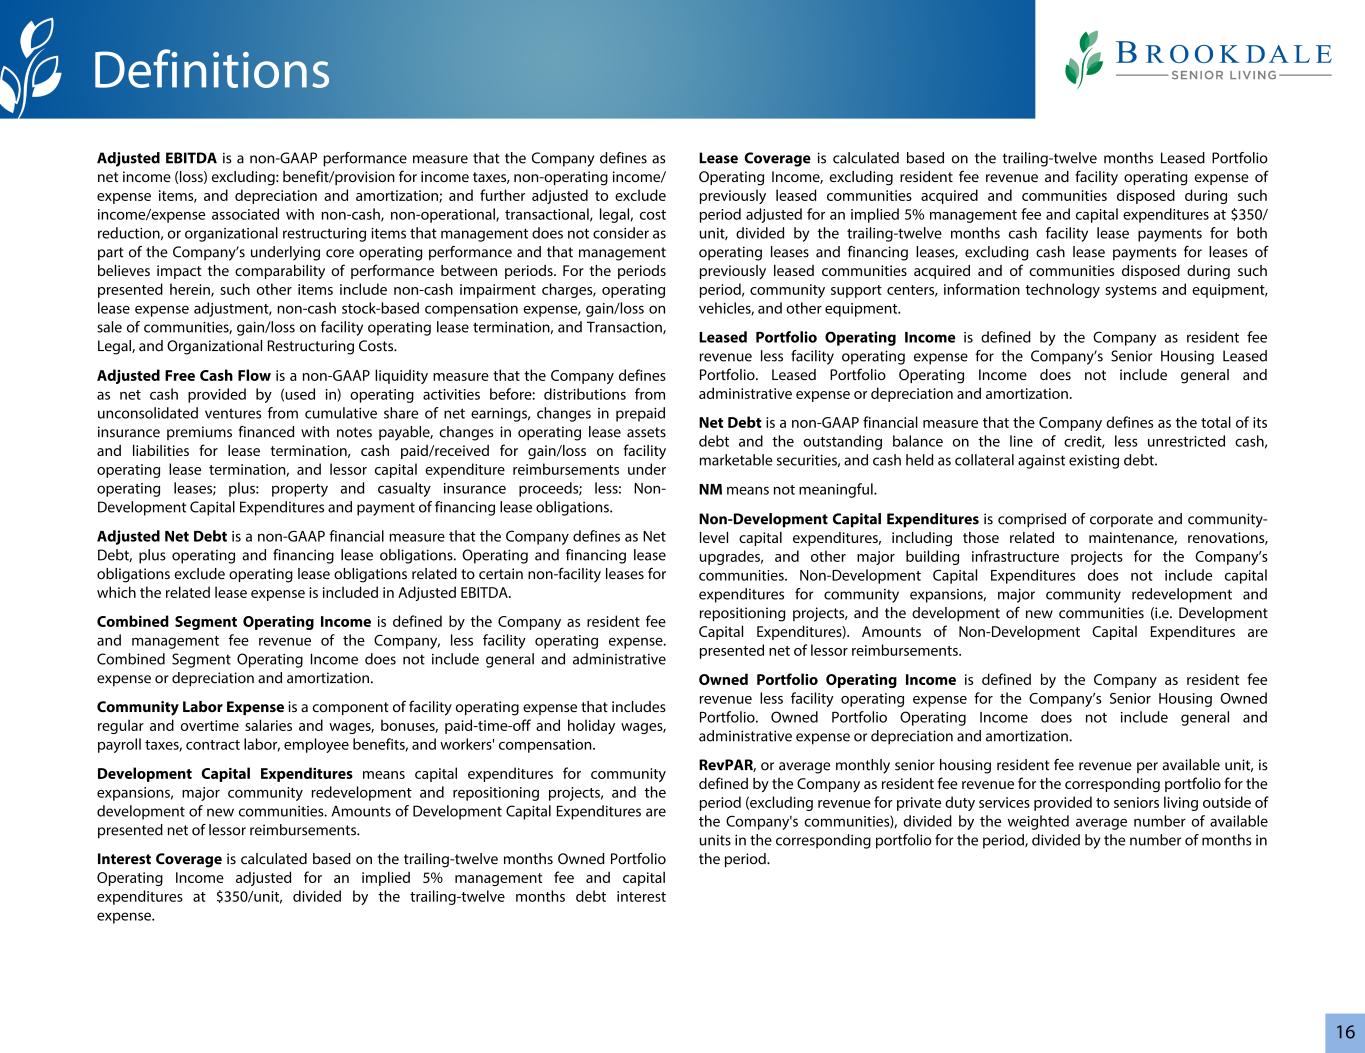
16 Adjusted EBITDA is a non-GAAP performance measure that the Company defines as net income (loss) excluding: benefit/provision for income taxes, non-operating income/ expense items, and depreciation and amortization; and further adjusted to exclude income/expense associated with non-cash, non-operational, transactional, legal, cost reduction, or organizational restructuring items that management does not consider as part of the Company’s underlying core operating performance and that management believes impact the comparability of performance between periods. For the periods presented herein, such other items include non-cash impairment charges, operating lease expense adjustment, non-cash stock-based compensation expense, gain/loss on sale of communities, gain/loss on facility operating lease termination, and Transaction, Legal, and Organizational Restructuring Costs. Adjusted Free Cash Flow is a non-GAAP liquidity measure that the Company defines as net cash provided by (used in) operating activities before: distributions from unconsolidated ventures from cumulative share of net earnings, changes in prepaid insurance premiums financed with notes payable, changes in operating lease assets and liabilities for lease termination, cash paid/received for gain/loss on facility operating lease termination, and lessor capital expenditure reimbursements under operating leases; plus: property and casualty insurance proceeds; less: Non- Development Capital Expenditures and payment of financing lease obligations. Adjusted Net Debt is a non-GAAP financial measure that the Company defines as Net Debt, plus operating and financing lease obligations. Operating and financing lease obligations exclude operating lease obligations related to certain non-facility leases for which the related lease expense is included in Adjusted EBITDA. Combined Segment Operating Income is defined by the Company as resident fee and management fee revenue of the Company, less facility operating expense. Combined Segment Operating Income does not include general and administrative expense or depreciation and amortization. Community Labor Expense is a component of facility operating expense that includes regular and overtime salaries and wages, bonuses, paid-time-off and holiday wages, payroll taxes, contract labor, employee benefits, and workers' compensation. Development Capital Expenditures means capital expenditures for community expansions, major community redevelopment and repositioning projects, and the development of new communities. Amounts of Development Capital Expenditures are presented net of lessor reimbursements. Interest Coverage is calculated based on the trailing-twelve months Owned Portfolio Operating Income adjusted for an implied 5% management fee and capital expenditures at $350/unit, divided by the trailing-twelve months debt interest expense. Lease Coverage is calculated based on the trailing-twelve months Leased Portfolio Operating Income, excluding resident fee revenue and facility operating expense of previously leased communities acquired and communities disposed during such period adjusted for an implied 5% management fee and capital expenditures at $350/ unit, divided by the trailing-twelve months cash facility lease payments for both operating leases and financing leases, excluding cash lease payments for leases of previously leased communities acquired and of communities disposed during such period, community support centers, information technology systems and equipment, vehicles, and other equipment. Leased Portfolio Operating Income is defined by the Company as resident fee revenue less facility operating expense for the Company’s Senior Housing Leased Portfolio. Leased Portfolio Operating Income does not include general and administrative expense or depreciation and amortization. Net Debt is a non-GAAP financial measure that the Company defines as the total of its debt and the outstanding balance on the line of credit, less unrestricted cash, marketable securities, and cash held as collateral against existing debt. NM means not meaningful. Non-Development Capital Expenditures is comprised of corporate and community- level capital expenditures, including those related to maintenance, renovations, upgrades, and other major building infrastructure projects for the Company’s communities. Non-Development Capital Expenditures does not include capital expenditures for community expansions, major community redevelopment and repositioning projects, and the development of new communities (i.e. Development Capital Expenditures). Amounts of Non-Development Capital Expenditures are presented net of lessor reimbursements. Owned Portfolio Operating Income is defined by the Company as resident fee revenue less facility operating expense for the Company’s Senior Housing Owned Portfolio. Owned Portfolio Operating Income does not include general and administrative expense or depreciation and amortization. RevPAR, or average monthly senior housing resident fee revenue per available unit, is defined by the Company as resident fee revenue for the corresponding portfolio for the period (excluding revenue for private duty services provided to seniors living outside of the Company's communities), divided by the weighted average number of available units in the corresponding portfolio for the period, divided by the number of months in the period. Definitions
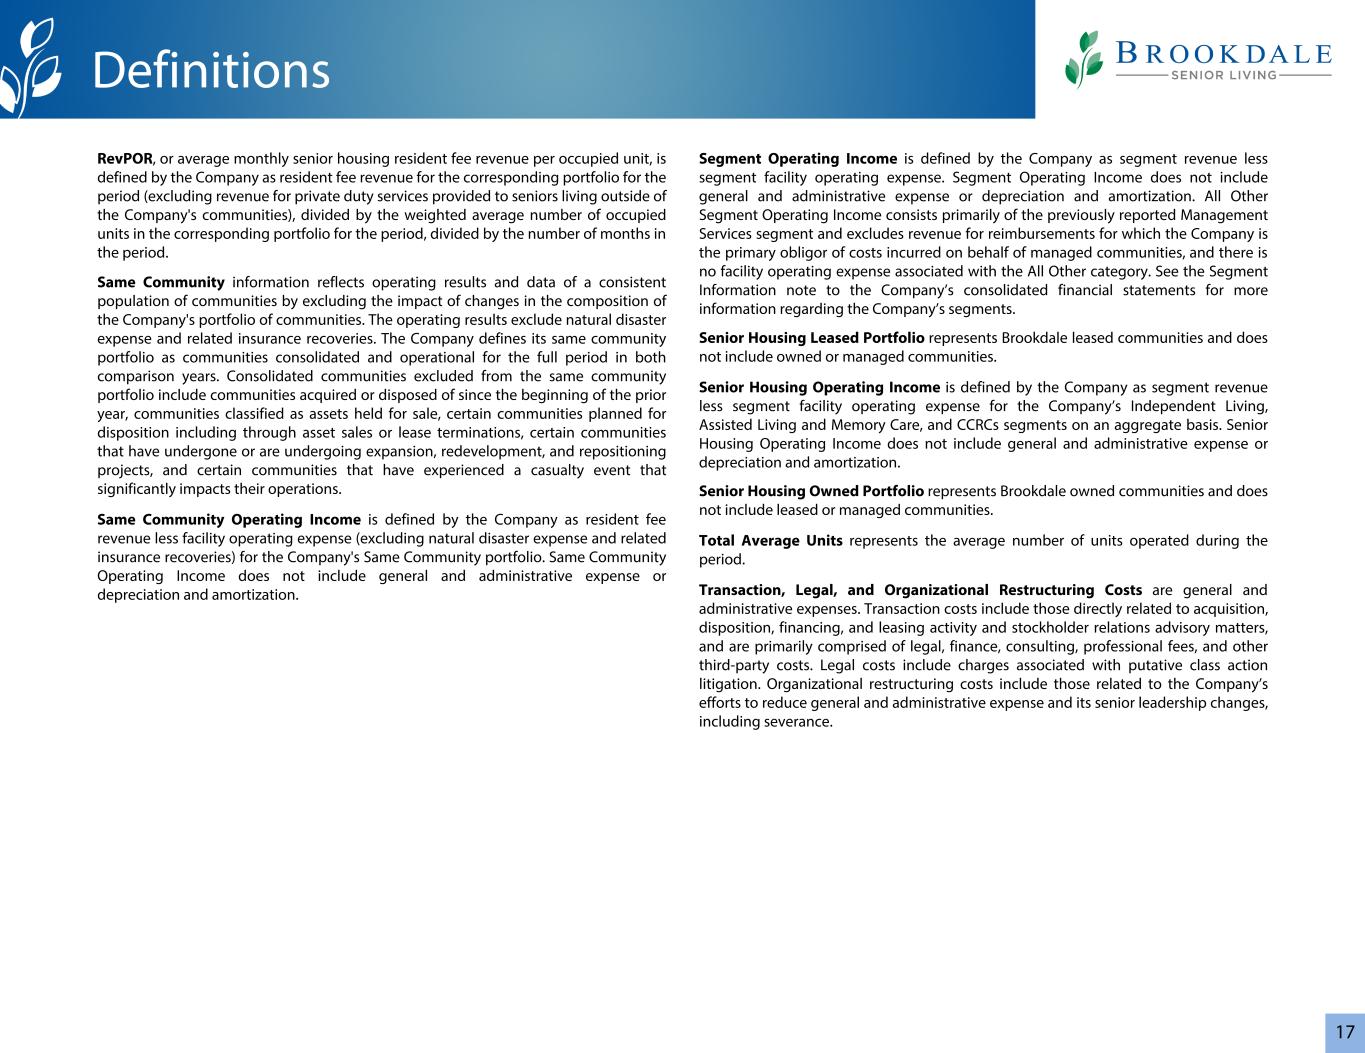
17 RevPOR, or average monthly senior housing resident fee revenue per occupied unit, is defined by the Company as resident fee revenue for the corresponding portfolio for the period (excluding revenue for private duty services provided to seniors living outside of the Company's communities), divided by the weighted average number of occupied units in the corresponding portfolio for the period, divided by the number of months in the period. Same Community information reflects operating results and data of a consistent population of communities by excluding the impact of changes in the composition of the Company's portfolio of communities. The operating results exclude natural disaster expense and related insurance recoveries. The Company defines its same community portfolio as communities consolidated and operational for the full period in both comparison years. Consolidated communities excluded from the same community portfolio include communities acquired or disposed of since the beginning of the prior year, communities classified as assets held for sale, certain communities planned for disposition including through asset sales or lease terminations, certain communities that have undergone or are undergoing expansion, redevelopment, and repositioning projects, and certain communities that have experienced a casualty event that significantly impacts their operations. Same Community Operating Income is defined by the Company as resident fee revenue less facility operating expense (excluding natural disaster expense and related insurance recoveries) for the Company's Same Community portfolio. Same Community Operating Income does not include general and administrative expense or depreciation and amortization. Segment Operating Income is defined by the Company as segment revenue less segment facility operating expense. Segment Operating Income does not include general and administrative expense or depreciation and amortization. All Other Segment Operating Income consists primarily of the previously reported Management Services segment and excludes revenue for reimbursements for which the Company is the primary obligor of costs incurred on behalf of managed communities, and there is no facility operating expense associated with the All Other category. See the Segment Information note to the Company’s consolidated financial statements for more information regarding the Company’s segments. Senior Housing Leased Portfolio represents Brookdale leased communities and does not include owned or managed communities. Senior Housing Operating Income is defined by the Company as segment revenue less segment facility operating expense for the Company’s Independent Living, Assisted Living and Memory Care, and CCRCs segments on an aggregate basis. Senior Housing Operating Income does not include general and administrative expense or depreciation and amortization. Senior Housing Owned Portfolio represents Brookdale owned communities and does not include leased or managed communities. Total Average Units represents the average number of units operated during the period. Transaction, Legal, and Organizational Restructuring Costs are general and administrative expenses. Transaction costs include those directly related to acquisition, disposition, financing, and leasing activity and stockholder relations advisory matters, and are primarily comprised of legal, finance, consulting, professional fees, and other third-party costs. Legal costs include charges associated with putative class action litigation. Organizational restructuring costs include those related to the Company’s efforts to reduce general and administrative expense and its senior leadership changes, including severance. Definitions
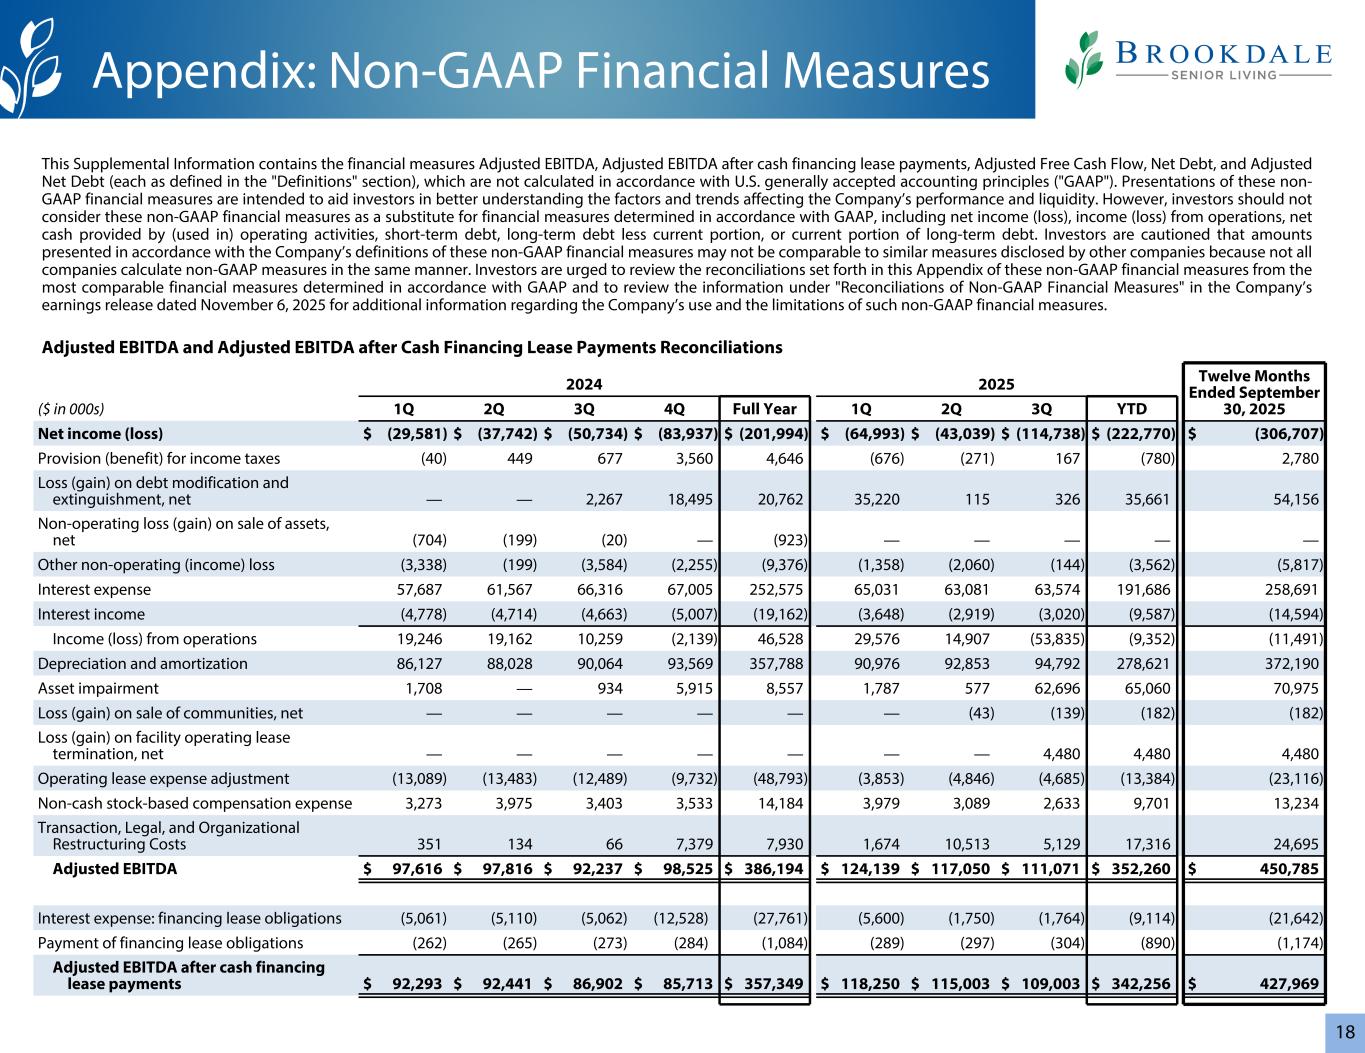
18 2024 2025 Twelve Months Ended September 30, 2025($ in 000s) 1Q 2Q 3Q 4Q Full Year 1Q 2Q 3Q YTD Net income (loss) $ (29,581) $ (37,742) $ (50,734) $ (83,937) $ (201,994) $ (64,993) $ (43,039) $ (114,738) $ (222,770) $ (306,707) Provision (benefit) for income taxes (40) 449 677 3,560 4,646 (676) (271) 167 (780) 2,780 Loss (gain) on debt modification and extinguishment, net — — 2,267 18,495 20,762 35,220 115 326 35,661 54,156 Non-operating loss (gain) on sale of assets, net (704) (199) (20) — (923) — — — — — Other non-operating (income) loss (3,338) (199) (3,584) (2,255) (9,376) (1,358) (2,060) (144) (3,562) (5,817) Interest expense 57,687 61,567 66,316 67,005 252,575 65,031 63,081 63,574 191,686 258,691 Interest income (4,778) (4,714) (4,663) (5,007) (19,162) (3,648) (2,919) (3,020) (9,587) (14,594) Income (loss) from operations 19,246 19,162 10,259 (2,139) 46,528 29,576 14,907 (53,835) (9,352) (11,491) Depreciation and amortization 86,127 88,028 90,064 93,569 357,788 90,976 92,853 94,792 278,621 372,190 Asset impairment 1,708 — 934 5,915 8,557 1,787 577 62,696 65,060 70,975 Loss (gain) on sale of communities, net — — — — — — (43) (139) (182) (182) Loss (gain) on facility operating lease termination, net — — — — — — — 4,480 4,480 4,480 Operating lease expense adjustment (13,089) (13,483) (12,489) (9,732) (48,793) (3,853) (4,846) (4,685) (13,384) (23,116) Non-cash stock-based compensation expense 3,273 3,975 3,403 3,533 14,184 3,979 3,089 2,633 9,701 13,234 Transaction, Legal, and Organizational Restructuring Costs 351 134 66 7,379 7,930 1,674 10,513 5,129 17,316 24,695 Adjusted EBITDA $ 97,616 $ 97,816 $ 92,237 $ 98,525 $ 386,194 $ 124,139 $ 117,050 $ 111,071 $ 352,260 $ 450,785 Interest expense: financing lease obligations (5,061) (5,110) (5,062) (12,528) (27,761) (5,600) (1,750) (1,764) (9,114) (21,642) Payment of financing lease obligations (262) (265) (273) (284) (1,084) (289) (297) (304) (890) (1,174) Adjusted EBITDA after cash financing lease payments $ 92,293 $ 92,441 $ 86,902 $ 85,713 $ 357,349 $ 118,250 $ 115,003 $ 109,003 $ 342,256 $ 427,969 Adjusted EBITDA and Adjusted EBITDA after Cash Financing Lease Payments Reconciliations Appendix: Non-GAAP Financial Measures This Supplemental Information contains the financial measures Adjusted EBITDA, Adjusted EBITDA after cash financing lease payments, Adjusted Free Cash Flow, Net Debt, and Adjusted Net Debt (each as defined in the "Definitions" section), which are not calculated in accordance with U.S. generally accepted accounting principles ("GAAP"). Presentations of these non- GAAP financial measures are intended to aid investors in better understanding the factors and trends affecting the Company’s performance and liquidity. However, investors should not consider these non-GAAP financial measures as a substitute for financial measures determined in accordance with GAAP, including net income (loss), income (loss) from operations, net cash provided by (used in) operating activities, short-term debt, long-term debt less current portion, or current portion of long-term debt. Investors are cautioned that amounts presented in accordance with the Company’s definitions of these non-GAAP financial measures may not be comparable to similar measures disclosed by other companies because not all companies calculate non-GAAP measures in the same manner. Investors are urged to review the reconciliations set forth in this Appendix of these non-GAAP financial measures from the most comparable financial measures determined in accordance with GAAP and to review the information under "Reconciliations of Non-GAAP Financial Measures" in the Company’s earnings release dated November 6, 2025 for additional information regarding the Company’s use and the limitations of such non-GAAP financial measures.
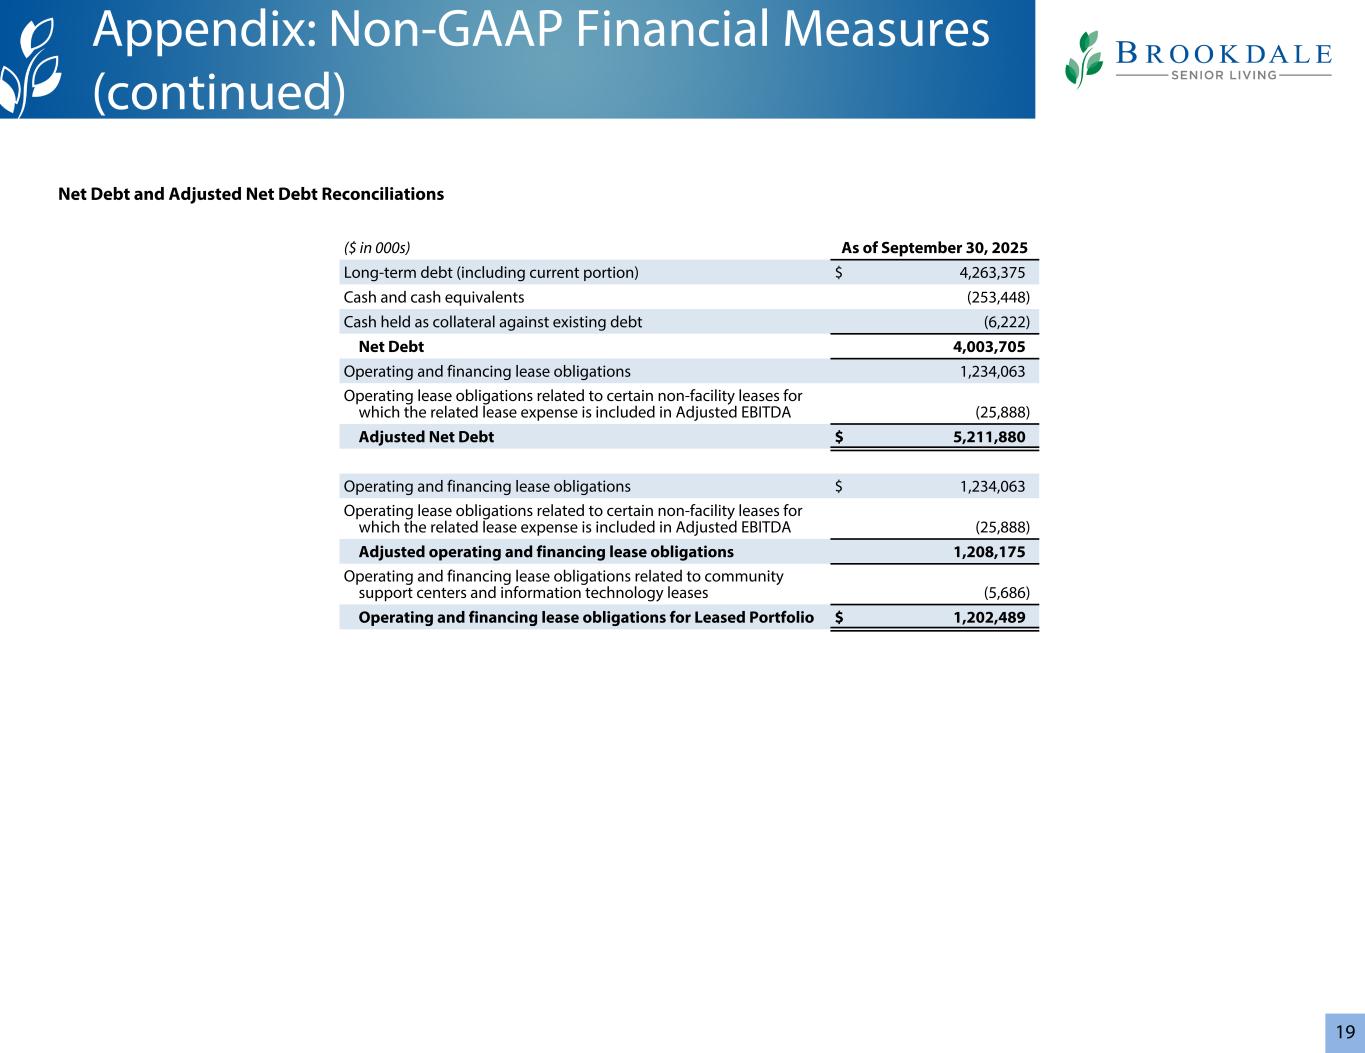
19 Net Debt and Adjusted Net Debt Reconciliations Appendix: Non-GAAP Financial Measures (continued) ($ in 000s) As of September 30, 2025 Long-term debt (including current portion) $ 4,263,375 Cash and cash equivalents (253,448) Cash held as collateral against existing debt (6,222) Net Debt 4,003,705 Operating and financing lease obligations 1,234,063 Operating lease obligations related to certain non-facility leases for which the related lease expense is included in Adjusted EBITDA (25,888) Adjusted Net Debt $ 5,211,880 Operating and financing lease obligations $ 1,234,063 Operating lease obligations related to certain non-facility leases for which the related lease expense is included in Adjusted EBITDA (25,888) Adjusted operating and financing lease obligations 1,208,175 Operating and financing lease obligations related to community support centers and information technology leases (5,686) Operating and financing lease obligations for Leased Portfolio $ 1,202,489
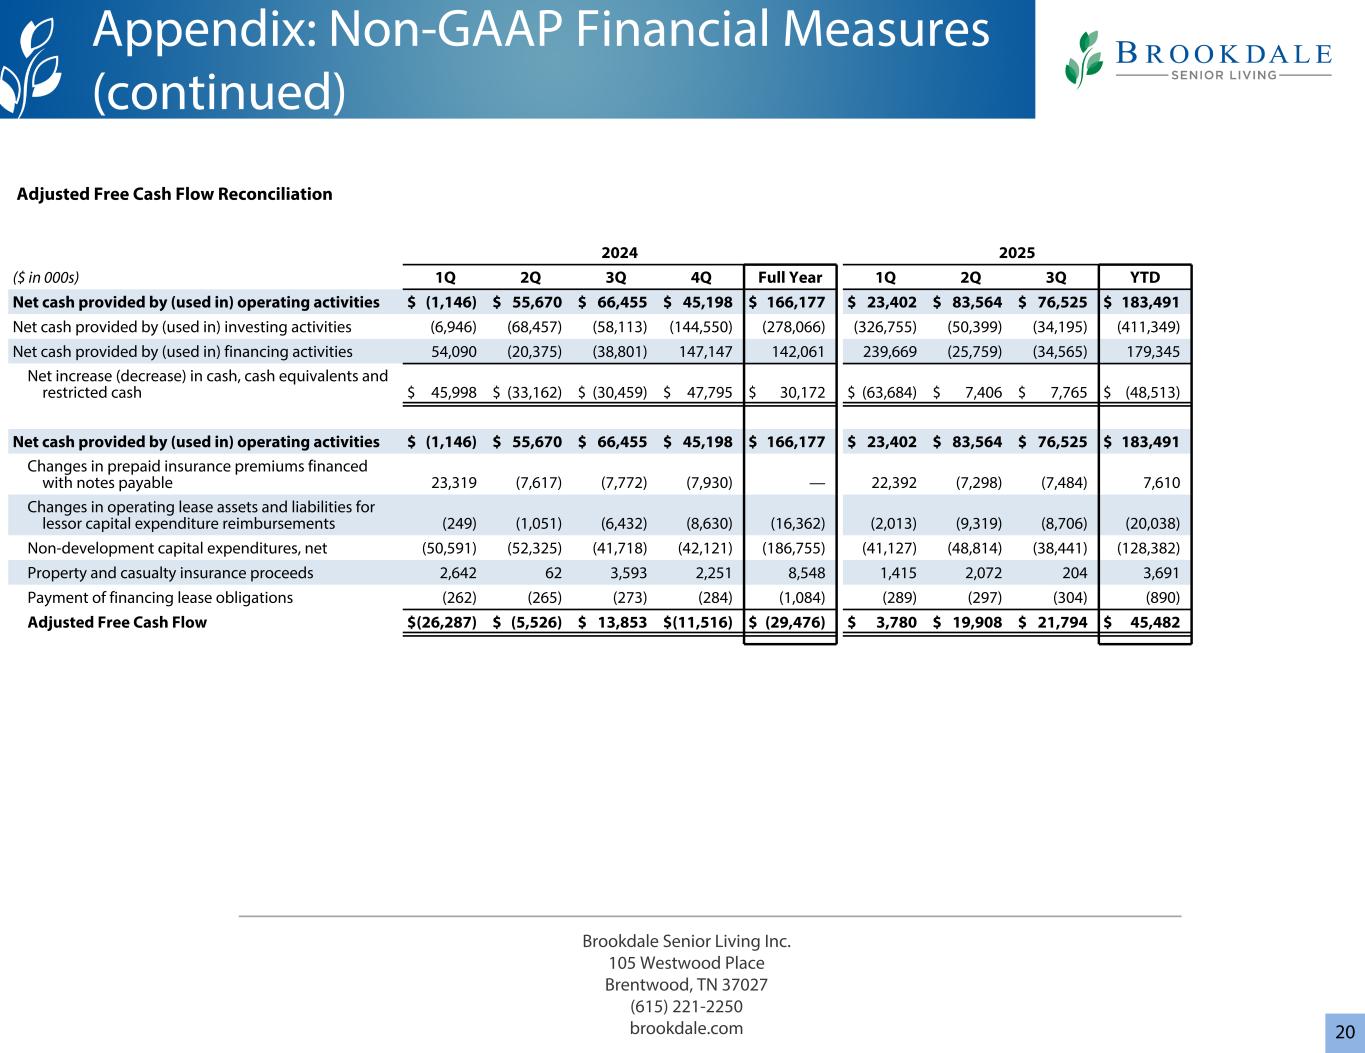
20 2024 2025 ($ in 000s) 1Q 2Q 3Q 4Q Full Year 1Q 2Q 3Q YTD Net cash provided by (used in) operating activities $ (1,146) $ 55,670 $ 66,455 $ 45,198 $ 166,177 $ 23,402 $ 83,564 $ 76,525 $ 183,491 Net cash provided by (used in) investing activities (6,946) (68,457) (58,113) (144,550) (278,066) (326,755) (50,399) (34,195) (411,349) Net cash provided by (used in) financing activities 54,090 (20,375) (38,801) 147,147 142,061 239,669 (25,759) (34,565) 179,345 Net increase (decrease) in cash, cash equivalents and restricted cash $ 45,998 $ (33,162) $ (30,459) $ 47,795 $ 30,172 $ (63,684) $ 7,406 $ 7,765 $ (48,513) Net cash provided by (used in) operating activities $ (1,146) $ 55,670 $ 66,455 $ 45,198 $ 166,177 $ 23,402 $ 83,564 $ 76,525 $ 183,491 Changes in prepaid insurance premiums financed with notes payable 23,319 (7,617) (7,772) (7,930) — 22,392 (7,298) (7,484) 7,610 Changes in operating lease assets and liabilities for lessor capital expenditure reimbursements (249) (1,051) (6,432) (8,630) (16,362) (2,013) (9,319) (8,706) (20,038) Non-development capital expenditures, net (50,591) (52,325) (41,718) (42,121) (186,755) (41,127) (48,814) (38,441) (128,382) Property and casualty insurance proceeds 2,642 62 3,593 2,251 8,548 1,415 2,072 204 3,691 Payment of financing lease obligations (262) (265) (273) (284) (1,084) (289) (297) (304) (890) Adjusted Free Cash Flow $ (26,287) $ (5,526) $ 13,853 $ (11,516) $ (29,476) $ 3,780 $ 19,908 $ 21,794 $ 45,482 Adjusted Free Cash Flow Reconciliation Appendix: Non-GAAP Financial Measures (continued) Brookdale Senior Living Inc. 105 Westwood Place Brentwood, TN 37027 (615) 221-2250 brookdale.com