.2
| Content: Statement of earnings page 2 Segment information page 3 Balance sheet page 4 Cash flow page 5 page 6 Key metrics page 7 page 8 Outlook 2026 page 9 Disclaimer Copyright by Fresenius Medical Care AG email: ir@freseniusmedicalcare.com phone: +49 6172 609 2525 Revenue development by segment Reconciliation results excl. special items This release contains forward-looking statements that are subject to various risks and uncertainties. Actual results could differ materially from those described in these forward-looking statements due to various factors, including, but not limited to, changes in business, economic and competitive conditions, legal changes, regulatory approvals, impacts related to COVID-19, results of clinical studies, foreign exchange rate fluctuations, uncertainties in litigation or investigative proceedings, and the availability of financing. These and other risks and uncertainties are detailed in Fresenius Medical Care AG’s reports filed with the U.S. Securities and Exchange Commission. Fresenius Medical Care AG does not undertake any responsibility to update the forward-looking statements in this release. Rounding adjustments applied to individual numbers and percentages may result in these figures differing immaterially from their absolute values. Furthermore, totals and subtotals in tables may differ slightly from unrounded figures due to rounding in accordance with commercial rounding conventions. Fresenius Medical Care AG November 3, 2026 COMPLETE OVERVIEW OF THE THIRD QUARTER AND FIRST NINE MONTHS 2026 Investor Relations |
| Statement of earnings in € million, except share data, unaudited 2026 2025 Change Change at cc 2026 2025 Change Change at cc Total revenue 4,937 4,885 1.1% -0.5% 14,409 14,558 -1.0% 2.0% Costs of revenue 3,661 3,643 0.5% -1.2% 10,645 10,917 -2.5% 0.6% Selling, general and administrative expense 744 705 5.4% 3.6% 2,229 2,248 -0.9% 1.7% Research and development expense 41 38 9.7% 8.4% 119 119 0.0% 1.5% (Income) loss from equity method investees (18) (47) -61.1% -61.1% (18) (140) -87.0% -86.9% Other operating income (116) (56) 107.5% 105.0% (395) (397) -0.6% 0.1% Other operating expense 241 125 92.2% 87.2% 693 578 20.3% 22.0% Operating income 384 477 -19.4% -18.9% 1,136 1,233 -7.9% -4.5% Operating income excl. special items 1 545 574 -5.1% -5.7% 1,581 1,507 5.0% 8.2% Interest income (16) (19) -16.2% -19.3% (45) (56) -19.0% -19.3% Interest expense 97 93 4.7% 2.0% 288 285 1.0% 3.0% Interest expense, net 81 74 10.2% 7.5% 243 229 5.9% 8.5% Income before income taxes 303 403 -24.8% -23.8% 893 1,004 -11.0% -7.5% Income tax expense 78 75 3.5% 6.1% 210 215 -1.9% 2.0% Net income 225 328 -31.3% -30.6% 683 789 -13.5% -10.1% Net income attributable to noncontrolling interests 65 53 23.7% 21.7% 187 138 35.6% 40.8% Net income attributable to shareholders of FME AG 160 275 -41.9% -40.6% 496 651 -23.9% -20.9% Net income attributable to shareholders of FME AG excl. special items 1 291 322 -9.6% -10.0% 844 836 1.0% 4.1% Weighted average number of shares 262,951,005 292,101,583 268,833,509 292,971,355 Basic earnings per share €0.61 €0.94 -35.4% -34.1% €1.84 €2.22 -17.1% -13.8% Basic earnings per ADS €0.30 €0.47 -35.4% -34.1% €0.92 €1.11 -17.1% -13.8% Operating income 384 477 -19.4% -18.9% 1,136 1,233 -7.9% -4.5% Depreciation, amortization and impairment loss 433 357 21.2% 18.4% 1,259 1,127 11.7% 14.7% EBITDA 817 834 -2.0% -2.9% 2,395 2,360 1.5% 4.7% In percent of revenue Operating income margin 7.8% 9.8% 7.9% 8.5% Operating income margin excl. special items 1 11.0% 11.7% 11.0% 10.3% EBITDA margin 16.6% 17.1% 16.6% 16.2% EBITDA margin excl. special items 1 18.3% 19.1% 18.4% 18.0% 1 For a reconciliation of special items, please refer to the table on page 8. Three months ended September 30, Nine months ended September 30, Statement of earnings page 2 of 9 November 3, 2026 |
| Segment information unaudited 2026 2025 Change Change at cc 2026 2025 Change Change at cc Total Revenue in € million 4,937 4,885 1.1% -0.5% 14,409 14,558 -1.0% 2.0% Operating income in € million 384 477 -19.4% -18.9% 1,136 1,233 -7.9% -4.5% Operating income in € million excl. special items 1 545 574 -5.1% -5.7% 1,581 1,507 5.0% 8.2% Operating income margin 7.8% 9.8% 7.9% 8.5% Operating income margin excl. special items 1 11.0% 11.7% 11.0% 10.3% Days sales outstanding (DSO) 2 59 62 Employees (headcount) 106,291 109,916 Care Delivery segment Revenue in € million 3,492 3,402 2.7% 1.1% 10,264 10,229 0.3% 3.9% Operating income in € million 497 419 18.5% 17.5% 1,203 1,086 10.8% 16.4% Operating income in € million excl. special items 1 513 493 4.1% 2.5% 1,437 1,226 17.2% 22.6% Operating income margin 14.2% 12.3% 11.7% 10.6% Operating income margin excl. special items 1 14.7% 14.5% 14.0% 12.0% Days sales outstanding (DSO) 2 54 57 Value-Based Care segment Revenue in € million 537 576 -6.8% -8.6% 1,563 1,611 -3.0% 0.7% Operating income in € million 0 (22) n.a. -99.6% 6 (28) n.a. n.a. Operating income in € million excl. special items 1 1 (21) n.a. -99.9% 27 (26) n.a. n.a. Operating income margin 0.0% -3.8% 0.4% -1.7% Operating income margin excl. special items 1 0.1% -3.7% 1.7% -1.6% Days sales outstanding (DSO) 2 35 27 Care Enablement segment Revenue in € million 1,451 1,361 6.7% 5.1% 4,121 4,075 1.1% 3.0% Operating income in € million (32) 87 n.a. n.a. 153 270 -43.2% -42.0% Operating income in € million excl. special items 1 106 103 2.5% 4.3% 329 334 -1.5% -0.3% Operating income margin -2.2% 6.4% 3.7% 6.6% Operating income margin excl. special items 1 7.3% 7.6% 8.0% 8.2% Days sales outstanding (DSO) 2 87 92 Inter-segment eliminations 3 Revenue in € million (543) (454) 19.9% 18.0% (1,539) (1,357) 13.4% 17.0% Operating income in € million (46) (3) 1243.6% 1237.4% (107) (17) 524.0% 546.1% Operating income in € million excl. special items 1 (46) (4) 944.0% 939.3% (107) (18) 489.9% 510.8% Corporate Operating income in € million (35) (4) 709.7% 631.3% (119) (78) 53.5% 78.7% Operating income in € million excl. special items 1 (29) 3 n.a. n.a. (105) (9) 984.3% 1171.5% 2 Includes receivables related to assets held for sale. 3 Services provided by the Care Delivery segment in the U.S. for patients managed under the Value-Based Care segment are provided at fair market value. The Company also transfers products from the Care Enablement segment to the Care Delivery segment at fair market value. The associated internal revenues and expenses and all other consolidation of transactions are included within “Inter-segment eliminations.” cc = constant currency. Changes in revenue, operating income and net income attributable to shareholders of FME AG include the impact of changes in foreign currency exchange rates. We calculate and present these financial measures using both IFRS Accounting Standards and at constant exchange rates to show changes in these metrics and other items without giving effect to period-to-period currency fluctuations. Under IFRS Accounting Standards, amounts received in local (non-euro) currency are translated into euro at the average exchange rate for the period presented. Once we translate the local currency for the constant currency, we then calculate the change, as a percentage, of the current period using the prior period exchange rates versus the prior period. The single quarter results are calculated as the variance between the current year-to-date results less the preceding quarter’s year-to-date which makes the single quarter subject to further foreign exchange fluctuation. This resulting percentage is a non-IFRS measure referring to a change as a percentage at constant currency. These currency-adjusted financial measures are identifiable by the designated term "Constant Currency." 1 For a reconciliation of special items, please refer to the table on page 8. Three months ended September 30, Nine months ended September 30, Segment information page 3 of 9 November 3, 2026 |
| Balance sheet in € million, except for net leverage ratio, unaudited September 30, December 31, 2026 2025 Assets Cash and cash equivalents 1,099 1,599 Trade accounts and other receivables from unrelated parties 3,314 3,142 Inventories 2,413 2,141 Other current assets 1,014 1,016 Goodwill and intangible assets 15,275 14,826 Right-of-use assets 2,848 3,014 Other non-current assets 5,486 5,264 Total assets 31,449 31,002 Liabilities and equity Accounts payable to unrelated parties 776 738 Other current liabilities 7,129 5,507 Non-current liabilities 9,787 10,474 Total equity 13,757 14,283 Total liabilities and equity 31,449 31,002 Equity/assets ratio 44% 46% Debt and lease liabilities Short-term debt 2,389 1,613 Long-term debt, less current portion 5,148 5,692 Current portion of lease liabilities 585 584 Lease liabilities, less current portion 2,764 2,906 Total debt and lease liabilities 10,886 10,795 Minus: Cash and cash equivalents (1,099) (1,599) Total net debt and lease liabilities 9,787 9,196 Reconciliation of annualized adjusted EBITDA and net leverage ratio to the most directly comparable IFRS Accounting Standards financial measure Net income 1,085 1,191 Income tax expense 317 321 Interest income (59) (70) Interest expense 387 385 Depreciation and amortization 1,428 1,463 Adjustments 1 603 447 Annualized adjusted EBITDA 3,761 3,737 Net leverage ratio 2.6 2.5 1 Acquisitions and divestitures made for the last twelve months with a purchase price above a €50 M threshold as defined in the Syndicated Credit Facility (2025: €1 M), non-cash charges, primarily related to pension expense (2026: €42 M; 2025: €47 M), impairment loss (2026: €205 M; 2025: €37 M), and special items, including costs related to the FME25+ Program (2026: €203 M; 2025: €185 M), Legacy Portfolio Optimization (2026: €57 M; 2025: €83 M), Legal Form Conversion Costs (2026: €2 M; 2025: €4 M), Humacyte Remeasurements (2026: €23 M; 2025: €90 M) and Tavneos Impacts (2026: €71 M). Balance sheet page 4 of 9 November 3, 2026 |
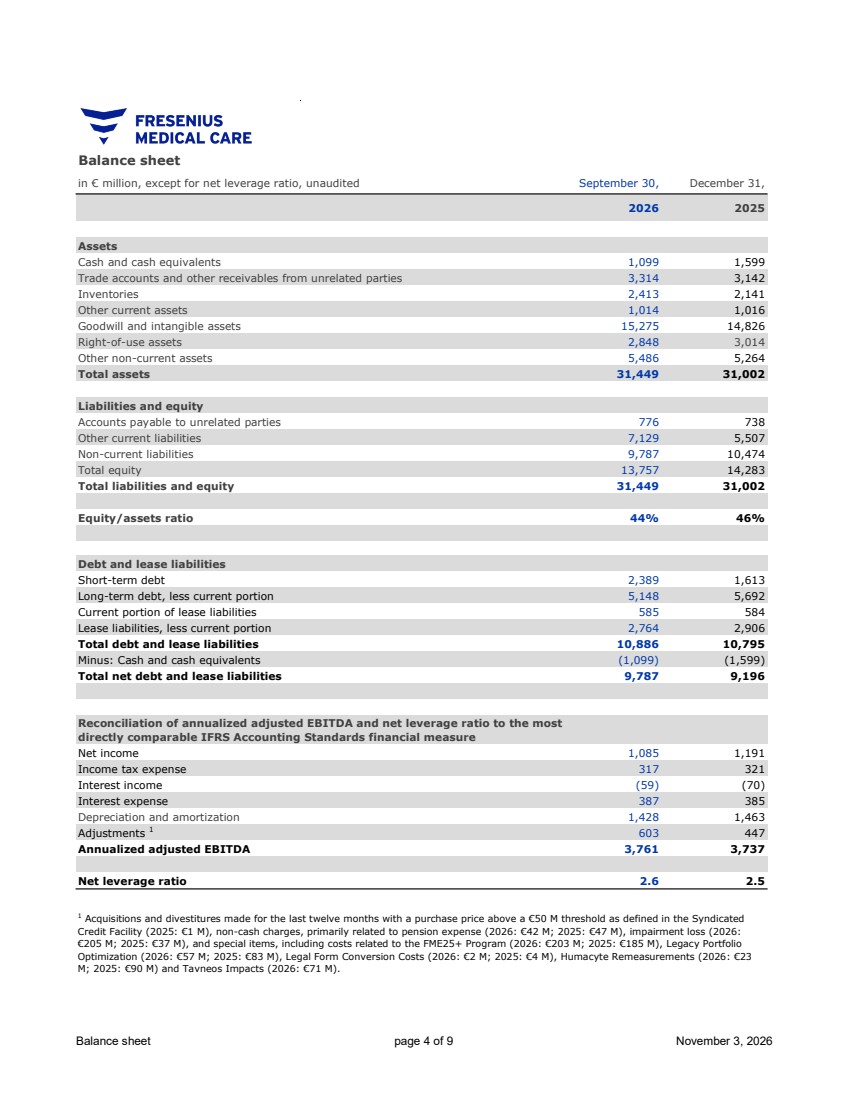
| Cash flow statement in € million, unaudited 2026 2025 2026 2025 Operating activities Net income 225 328 683 789 Depreciation, amortization and impairment loss 433 357 1,259 1,127 Change in trade accounts and other receivables from unrelated parties 54 (62) (80) (175) Change in inventories (85) (103) (249) (189) Change in other assets and liabilities and non-cash items 171 222 272 127 Net cash provided by (used in) operating activities 798 742 1,885 1,679 In percent of revenue 16.2% 15.2% 13.1% 11.5% Investing activities Purchases of property, plant and equipment and capitalized development costs (238) (192) (668) (492) Proceeds from sale of property, plant and equipment 4 0 12 12 Capital expenditures, net (234) (192) (656) (480) Free cash flow 564 550 1,229 1,199 In percent of revenue 11.4% 11.3% 8.5% 8.2% Acquisitions and investments, net of cash acquired, and purchases of intangible assets (12) (3) (18) (19) Investments in debt securities 0 (14) (75) (26) Proceeds from divestitures, net of cash disposed 22 144 23 164 Proceeds from sale of debt securities 14 11 76 57 Free cash flow after investing activities 588 688 1,235 1,375 Nine months ended September 30, Three months ended September 30, Cash flow page 5 of 9 November 3, 2026 |
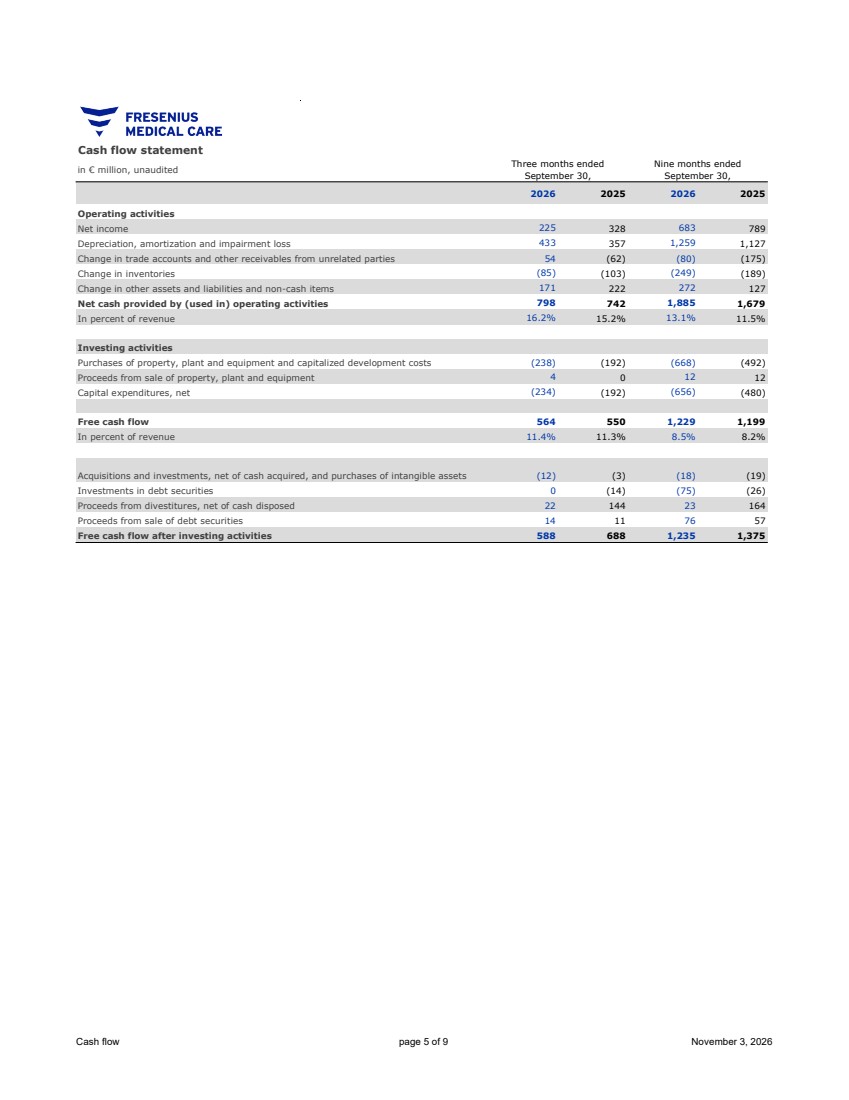
| in € million, unaudited 2026 2025 Change Change at cc Organic growth Same market treatment growth 1 Three months ended September 30, Total revenue 4,937 4,885 1.1% -0.5% 0.1% Care Delivery segment 3,492 3,402 2.7% 1.1% 2.0% -0.4% Thereof: U.S. 2,920 2,842 2.8% 0.6% 1.2% -1.1% Thereof: International 572 560 2.1% 3.3% 6.0% 1.4% Value-Based Care segment 537 576 -6.8% -8.6% -8.6% Care Enablement segment 1,451 1,361 6.7% 5.1% 5.1% Inter-segment eliminations (543) (454) 19.9% 18.0% Thereof: Care Delivery segment (135) (129) 5.1% 3.0% Thereof: Care Enablement segment (408) (325) 25.8% 24.0% Nine months ended September 30, Total revenue 14,409 14,558 -1.0% 2.0% 2.9% Care Delivery segment 10,264 10,229 0.3% 3.9% 5.1% -0.2% Thereof: U.S. 8,582 8,550 0.4% 4.2% 4.8% -0.8% Thereof: International 1,682 1,679 0.1% 2.2% 6.9% 1.2% Value-Based Care segment 1,563 1,611 -3.0% 0.7% 0.7% Care Enablement segment 4,121 4,075 1.1% 3.0% 3.0% Inter-segment eliminations (1,539) (1,357) 13.4% 17.0% Thereof: Care Delivery segment (394) (365) 7.9% 12.0% Thereof: Care Enablement segment (1,145) (992) 15.4% 18.8% 1 Same market treatment growth = organic growth less price effects Revenue development by segment Revenue development by segment page 6 of 9 November 3, 2026 |
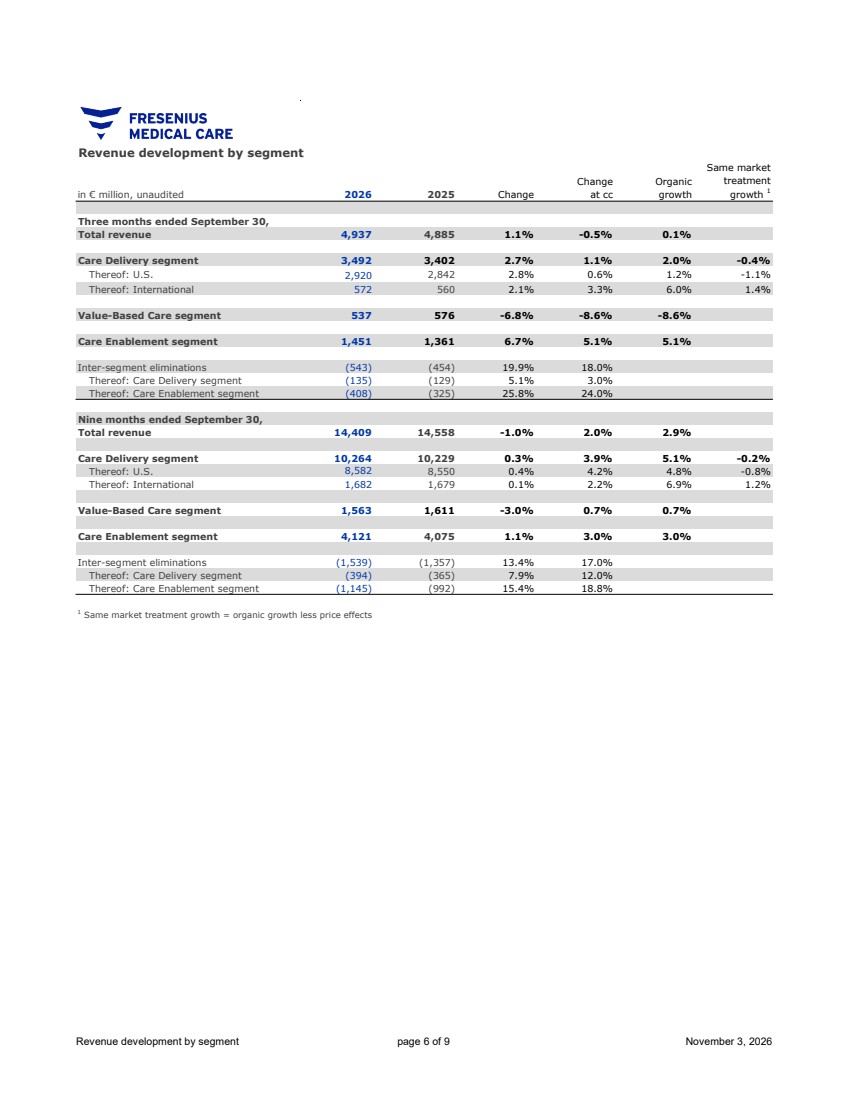
| unaudited 2026 2025 Change 2026 2025 Change 2026 2025 Change Care Delivery segment 3,512 3,628 -3% 289,014 293,620 -2% 32,526,949 33,561,556 -3% Thereof: U.S. 2,540 2,621 -3% 202,774 205,846 -1% 22,880,623 23,183,666 -1% Thereof: International 972 1,007 -3% 86,240 87,774 -2% 9,646,326 10,377,890 -7% unaudited 2026 2025 Change 2026 2025 Change Value-Based Care segment Total U.S. 1,364,132 1,347,196 1% 150,040 161,957 -7% Nine months ended September 30, Member Months Membership Key metrics Clinics Patients Nine months ended September 30, Treatments Key metrics page 7 of 9 November 3, 2026 |
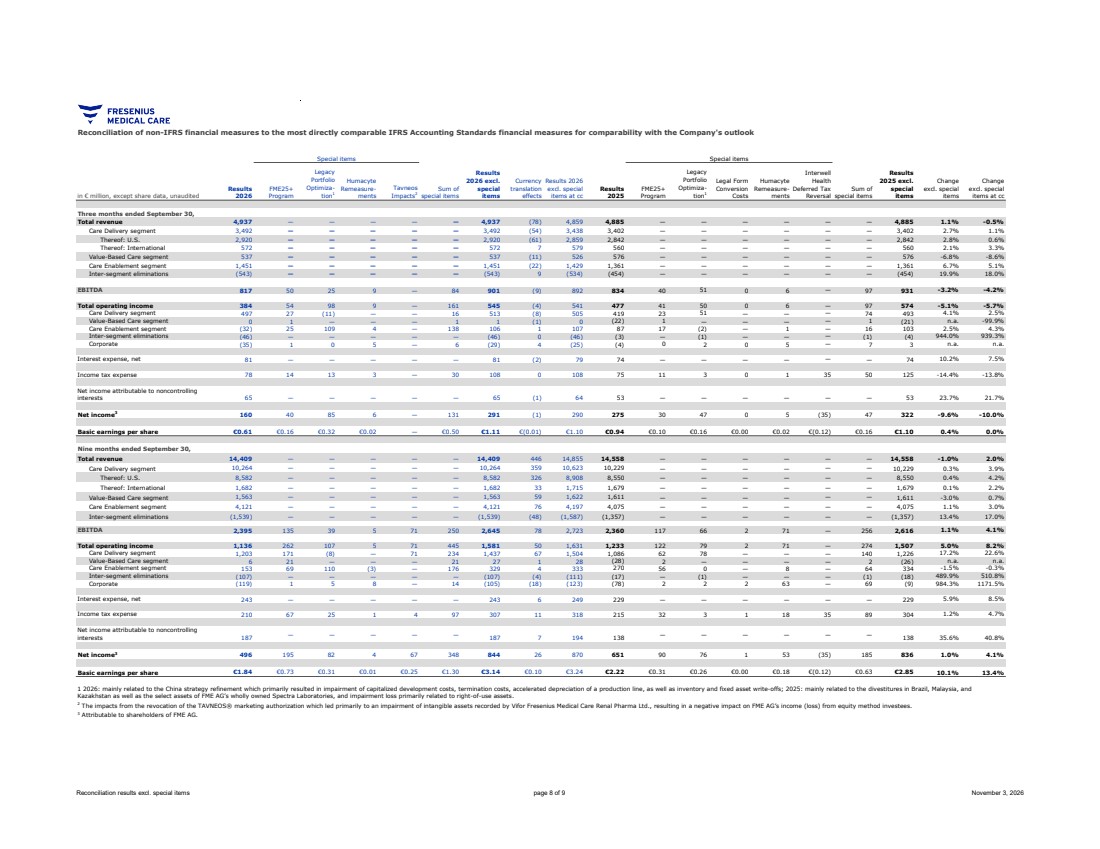
| in € million, except share data, unaudited Results 2026 FME25+ Program Legacy Portfolio Optimiza-tion1 Humacyte Remeasure-ments Tavneos Impacts2 Sum of special items Results 2026 excl. special items Currency translation effects Results 2026 excl. special items at cc Results 2025 FME25+ Program Legacy Portfolio Optimiza-tion1 Legal Form Conversion Costs Humacyte Remeasure-ments Interwell Health Deferred Tax Reversal Sum of special items Results 2025 excl. special items Change excl. special items Change excl. special items at cc Three months ended September 30, Total revenue 4,937 — — — — — 4,937 (78) 4,859 4,885 — — — — — — 4,885 1.1% -0.5% Care Delivery segment 3,492 — — — — — 3,492 (54) 3,438 3,402 — — — — — — 3,402 2.7% 1.1% Thereof: U.S. 2,920 — — — — — 2,920 (61) 2,859 2,842 — — — — — — 2,842 2.8% 0.6% Thereof: International 572 — — — — — 572 7 579 560 — — — — — — 560 2.1% 3.3% Value-Based Care segment 537 — — — — — 537 (11) 526 576 — — — — — — 576 -6.8% -8.6% Care Enablement segment 1,451 — — — — — 1,451 (22) 1,429 1,361 — — — — — — 1,361 6.7% 5.1% Inter-segment eliminations (543) — — — — — (543) 9 (534) (454) — — — — — — (454) 19.9% 18.0% EBITDA 817 50 25 9 — 84 901 (9) 892 834 40 51 0 6 — 97 931 -3.2% -4.2% Total operating income 384 54 98 9 — 161 545 (4) 541 477 41 50 0 6 — 97 574 -5.1% -5.7% Care Delivery segment 497 27 (11) — — 16 513 (8) 505 419 23 51 — — — 74 493 4.1% 2.5% Value-Based Care segment 0 1 — — — 1 1 (1) 0 (22) 1 — — — — 1 (21) n.a. -99.9% Care Enablement segment (32) 25 109 4 — 138 106 1 107 87 17 (2) — 1 — 16 103 2.5% 4.3% Inter-segment eliminations (46) — — — — — (46) 0 (46) (3) — (1) — — — (1) (4) 944.0% 939.3% Corporate (35) 1 0 5 — 6 (29) 4 (25) (4) 0 2 0 5 — 7 3 n.a. n.a. Interest expense, net 81 — — — — — 81 (2) 79 74 — — — — — — 74 10.2% 7.5% Income tax expense 78 14 13 3 — 30 108 0 108 75 11 3 0 1 35 50 125 -14.4% -13.8% Net income attributable to noncontrolling interests 65 — — — — — 65 (1) 64 53 — — — — — — 53 23.7% 21.7% Net income3 160 40 85 6 — 131 291 (1) 290 275 30 47 0 5 (35) 47 322 -9.6% -10.0% Basic earnings per share €0.61 €0.16 €0.32 €0.02 — €0.50 €1.11 €(0.01) €1.10 €0.94 €0.10 €0.16 €0.00 €0.02 €(0.12) €0.16 €1.10 0.4% 0.0% Nine months ended September 30, Total revenue 14,409 — — — — — 14,409 446 14,855 14,558 — — — — — — 14,558 -1.0% 2.0% Care Delivery segment 10,264 — — — — — 10,264 359 10,623 10,229 — — — — — — 10,229 0.3% 3.9% Thereof: U.S. 8,582 — — — — — 8,582 326 8,908 8,550 — — — — — — 8,550 0.4% 4.2% Thereof: International 1,682 — — — — — 1,682 33 1,715 1,679 — — — — — — 1,679 0.1% 2.2% Value-Based Care segment 1,563 — — — — — 1,563 59 1,622 1,611 — — — — — — 1,611 -3.0% 0.7% Care Enablement segment 4,121 — — — — — 4,121 76 4,197 4,075 — — — — — — 4,075 1.1% 3.0% Inter-segment eliminations (1,539) — — — — — (1,539) (48) (1,587) (1,357) — — — — — — (1,357) 13.4% 17.0% EBITDA 2,395 135 39 5 71 250 2,645 78 2,723 2,360 117 66 2 71 — 256 2,616 1.1% 4.1% Total operating income 1,136 262 107 5 71 445 1,581 50 1,631 1,233 122 79 2 71 — 274 1,507 5.0% 8.2% Care Delivery segment 1,203 171 (8) — 71 234 1,437 67 1,504 1,086 62 78 — — — 140 1,226 17.2% 22.6% Value-Based Care segment 6 21 — — — 21 27 1 28 (28) 2 — — — — 2 (26) n.a. n.a. Care Enablement segment 153 69 110 (3) — 176 329 4 333 270 56 0 — 8 — 64 334 -1.5% -0.3% Inter-segment eliminations (107) — — — — — (107) (4) (111) (17) — (1) — — — (1) (18) 489.9% 510.8% Corporate (119) 1 5 8 — 14 (105) (18) (123) (78) 2 2 2 63 — 69 (9) 984.3% 1171.5% Interest expense, net 243 — — — — — 243 6 249 229 — — — — — — 229 5.9% 8.5% Income tax expense 210 67 25 1 4 97 307 11 318 215 32 3 1 18 35 89 304 1.2% 4.7% Net income attributable to noncontrolling interests 187 — — — — — 187 7 194 138 — — — — — — 138 35.6% 40.8% Net income3 496 195 82 4 67 348 844 26 870 651 90 76 1 53 (35) 185 836 1.0% 4.1% Basic earnings per share €1.84 €0.73 €0.31 €0.01 €0.25 €1.30 €3.14 €0.10 €3.24 €2.22 €0.31 €0.26 €0.00 €0.18 €(0.12) €0.63 €2.85 10.1% 13.4% 3 Attributable to shareholders of FME AG. 2 The impacts from the revocation of the TAVNEOS® marketing authorization which led primarily to an impairment of intangible assets recorded by Vifor Fresenius Medical Care Renal Pharma Ltd., resulting in a negative impact on FME AG’s income (loss) from equity method investees. 1 2026: mainly related to the China strategy refinement which primarily resulted in impairment of capitalized development costs, termination costs, accelerated depreciation of a production line, as well as inventory and fixed asset write-offs; 2025: mainly related to the divestitures in Brazil, Malaysia, and Kazakhstan as well as the select assets of FME AG’s wholly owned Spectra Laboratories, and impairment loss primarily related to right-of-use assets. Special items Reconciliation of non-IFRS financial measures to the most directly comparable IFRS Accounting Standards financial measures for comparability with the Company's outlook Special items Reconciliation results excl. special items page 8 of 9 November 3, 2026 |
| Outlook 2026 Spalte1 Outlook 2026 (at Constant Currency) Results 2025 Revenue growth1 Broadly flat €19,628 M Operating income growth1 Flat to negative mid-single digit percent €2,212 M 1 Outlook 2026 is based on current assumptions and excludes special items. Special items include the costs related to the FME25+ Program, the impacts from Legacy Portfolio Optimization, the Humacyte Remeasurements and the Tavneos Impacts as well as other effects that are unusual in nature and have not been foreseeable or not foreseeable in size or impact at the time of providing the outlook. The outlook assumes current laws, policies, regulations, and tariffs. The growth rates are based on the results 2025 excluding the costs related to the FME25+ Program (€194 M for operating income), the impacts from Legacy Portfolio Optimization (€97 M for operating income), the Legal Form Conversion Costs (€4 M for operating income) and the Humacyte Remeasurements (€90 M for operating income). Outlook 2026 page 9 of 9 November 3, 2026 |