
©2025 eHealthInsurance Services, Inc. Q4 & FY 2024 Financial Results 1

©2025 eHealthInsurance Services, Inc. 2 Safe Harbor Statement Forward-Looking Statements This presentation includes forward-looking statements within the meaning of the federal securities laws. Forward-looking statements generally relate to future events or our future financial or operating performance. Forward-looking statements in this presentation include, but are not limited to, the following: our estimates regarding Medicare enrollment growth; our estimates regarding commissions receivable collection; our estimates of constrained lifetime value of commissions per approved member; our financial targets and our ability to meet such targets, including those for revenue and adjusted EBITDA; our 2025 strategic objectives, including our marketing and branding strategy, member retention strategy, telesales strategy, digital strategy, B2B strategy and product portfolio diversification; our 2025 annual guidance for total revenue, GAAP net income (loss), adjusted EBITDA and operating cash flow; our estimates for positive net adjustment revenue and its expected impact on our 2025 annual guidance; and other statements regarding our future operations, financial condition, prospects and business strategies. Our expectations and beliefs regarding these matters may not materialize, and actual results in future periods are subject to risks and uncertainties that could cause actual results to differ materially from those projected. These risks include those set forth in our filings with the Securities and Exchange Commission, including our latest Form 10-Q and 10-K. The forward-looking statements in this presentation are based on information available to us as of today, and we disclaim any obligation to update any forward-looking statements, except as required by law. Non-GAAP Information This presentation includes both GAAP and non-GAAP financial measures. The presentation of non-GAAP financial information is not intended to be considered in isolation or as a substitute for results prepared in accordance with GAAP. Definitions and reconciliations of the non-GAAP financial measures included in this presentation to the most directly comparable GAAP financial measures is available in the Appendix to this presentation. Management uses both GAAP and non-GAAP information in evaluating and operating its business internally and as such has determined that it is important to provide this information to investors.
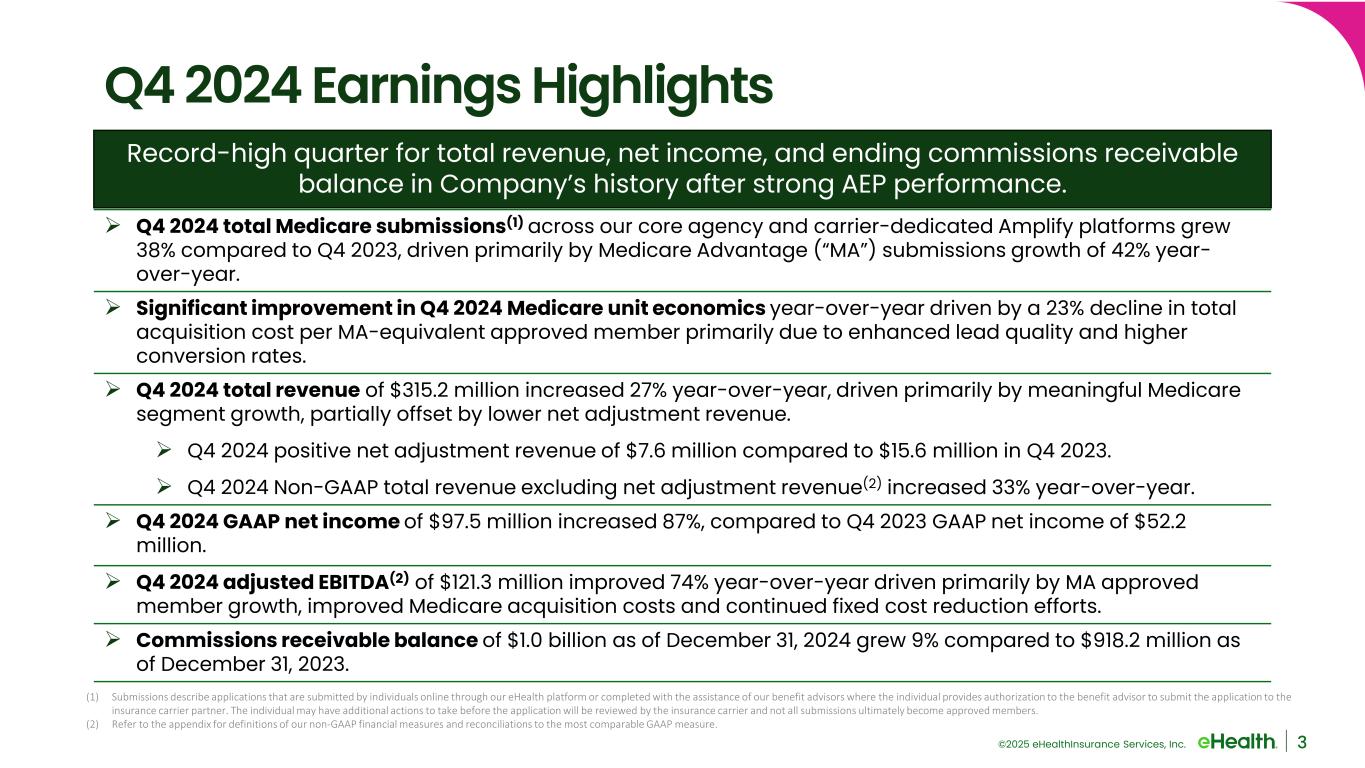
©2025 eHealthInsurance Services, Inc. 3 Q4 2024 Earnings Highlights Q4 2024 total Medicare submissions(1) across our core agency and carrier-dedicated Amplify platforms grew 38% compared to Q4 2023, driven primarily by Medicare Advantage (“MA”) submissions growth of 42% year- over-year. Significant improvement in Q4 2024 Medicare unit economics year-over-year driven by a 23% decline in total acquisition cost per MA-equivalent approved member primarily due to enhanced lead quality and higher conversion rates. Q4 2024 total revenue of $315.2 million increased 27% year-over-year, driven primarily by meaningful Medicare segment growth, partially offset by lower net adjustment revenue. Q4 2024 positive net adjustment revenue of $7.6 million compared to $15.6 million in Q4 2023. Q4 2024 Non-GAAP total revenue excluding net adjustment revenue(2) increased 33% year-over-year. Q4 2024 GAAP net income of $97.5 million increased 87%, compared to Q4 2023 GAAP net income of $52.2 million. Q4 2024 adjusted EBITDA(2) of $121.3 million improved 74% year-over-year driven primarily by MA approved member growth, improved Medicare acquisition costs and continued fixed cost reduction efforts. Commissions receivable balance of $1.0 billion as of December 31, 2024 grew 9% compared to $918.2 million as of December 31, 2023. Record-high quarter for total revenue, net income, and ending commissions receivable balance in Company’s history after strong AEP performance. (1) Submissions describe applications that are submitted by individuals online through our eHealth platform or completed with the assistance of our benefit advisors where the individual provides authorization to the benefit advisor to submit the application to the insurance carrier partner. The individual may have additional actions to take before the application will be reviewed by the insurance carrier and not all submissions ultimately become approved members. (2) Refer to the appendix for definitions of our non-GAAP financial measures and reconciliations to the most comparable GAAP measure.

©2025 eHealthInsurance Services, Inc. ($32.2) $20.7 $52.2 $97.5 $28.2 $49.5 $69.6 $121.3 Q4-FY21 Q4-FY22 Q4-FY23 Q4-FY24 $243.5 $196.3 $247.7 $315.2 Q4-FY21 Q4-FY22 Q4-FY23 Q4-FY24 4 Strong Progress in Scale and Profitability (1) Refer to the appendix for definitions of our non-GAAP financial measures and reconciliations to the most comparable GAAP measure. ($, MM) 12% Adj. EBITDA Margin(1) 25% Adj. EBITDA Margin (1) 28% Adj. EBITDA Margin (1) 38% Adj. EBITDA Margin (1) (13%) GAAP Net Loss Margin 11% GAAP Net Income Margin 21% GAAP Net Income Margin 31% GAAP Net Income Margin

©2025 eHealthInsurance Services, Inc. Significant Medicare Segment Growth Driven by MA Submissions 5 • Q4 FY24 enrollment growth was driven primarily by strength in our MA submissions within our Agency fulfillment model • Medicare Supplement and Medicare Part D submissions grew year-over-year driven by our Amplify fulfillment model 176,826 250,60910,927 11,86321,488 26,176 Q4-2023 Q4-2024 Total Medicare Submissions Medicare Advantage Medicare Supplement Medicare Part D 209,241 288,648 42% y/y Medicare Advantage growth 38% y/y Total Medicare growth

©2025 eHealthInsurance Services, Inc. 6 AEP Catalysts Operational Drivers • Meaningful increase in eHealth brand recognition • Strategic expansion of direct marketing channels driving higher-quality leads • Scaled headcount and improved tenure mix of licensed benefit advisors • Further optimization of our online platform and digital consumer-facing tools • Significant increase in online and telephonic lead conversions • Successful retention initiatives tailored to the unique nature of 2024 AEP Macro Factors • Higher medical costs and regulatory pressure resulted in material changes to Medicare Advantage plan offerings • In addition to benefit changes, carriers exited certain markets and eliminated some of their plans • Plan disruption drove increased shopping and switching behavior from MA beneficiaries • Increased consumer demand coincided with smaller competitive capacity in the Medicare brokerage market

©2025 eHealthInsurance Services, Inc. 7 Medicare unit margins continue to expand (1) The number of MA-equivalent approved members is calculated by adding the total number of approved MA and Medicare Supplement members and 25% of the total number of approved Medicare Part D members during the period presented. Q4-FY22 Q4-FY23 MA LTV Variable marketing cost per MA-Equiv.(1) Approved Member CC&E per MA-Equiv. (1) Approved Member Per Unit Gross Margin MA LTV Variable marketing cost per MA-Equiv.(1) Approved Member CC&E per MA-Equiv. (1) Approved Member Per Unit Gross Margin $1,174 ($220) ($371) MA LTV Variable marketing cost per MA-Equiv.(1) Approved Member CC&E per MA-Equiv. (1) Approved Member Per Unit Gross Margin $583 Q4-FY24 50% $1,033 ($243) ($470) $320 31% $1,151 ($307) ($456) 34% $388
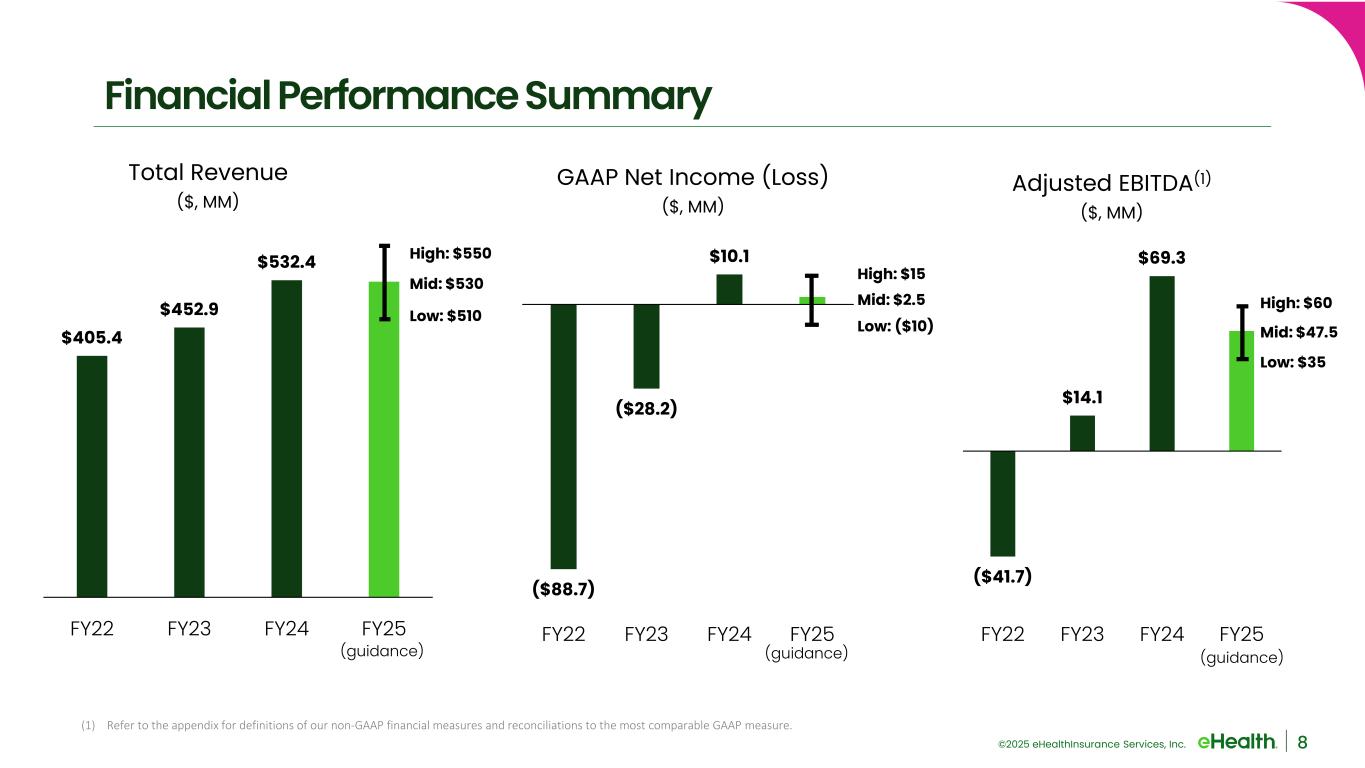
©2025 eHealthInsurance Services, Inc. Financial Performance Summary (1) Refer to the appendix for definitions of our non-GAAP financial measures and reconciliations to the most comparable GAAP measure. $405.4 $452.9 $532.4 FY22 FY23 FY24 FY25 Total Revenue ($, MM) (guidance) ($41.7) $14.1 $69.3 FY22 FY23 FY24 FY25 Adjusted EBITDA(1) ($, MM) (guidance) ($88.7) ($28.2) $10.1 FY22 FY23 FY24 FY25 GAAP Net Income (Loss) ($, MM) High: $15 Low: ($10) Mid: $2.5 (guidance) High: $550 Low: $510 Mid: $530 8 High: $60 Low: $35 Mid: $47.5

©2025 eHealthInsurance Services, Inc. On Track to Deliver on our 3-year Financial Targets ($41.7) $14.1 $69.3 FY22 FY23 FY24 FY25 Adjusted EBITDA(1) ($, MM) (1) Refer to the appendix for definitions of our non-GAAP financial measures and reconciliations to the most comparable GAAP measure. (2) Using the midpoint of guidance. $405.4 $452.9 $532.4 FY22 FY23 FY24 FY25 Total Revenue ($, MM) (guidance) 3-year targets as of August 2024: 8-10% revenue CAGR ‘23 to ‘26 8-10% adjusted EBITDA margin(1) by ’26 50-60% adjusted EBITDA(1) CAGR ’23 to ‘26 ON TRACK ON TRACK ON TRACK (guidance) High: $550 Low: $510 Mid: $530 High: $60 Low: $35 Mid: $47.5 9

©2025 eHealthInsurance Services, Inc. FY25 Strategic Objectives 1. Continue to grow our distinct consumer brand across all direct marketing channels and beyond our Medicare Advantage products. 2. Evolve and optimize consumer-centric retention efforts from policy submission to effectuation and through subsequent renewals with a goal to improve member-level retention on the eHealth platform. 3. Continue to optimize our telesales organization by providing advisors with industry-leading brand support, training programs, career development opportunities, and technological tools. 4. Advance our AI and digital technology leadership to better serve all key eHealth stakeholders. 5. Strengthen and expand our carrier relationships which are critical to both our choice and dedicated models. 6. Invest in existing capabilities beyond MA agency to pursue targeted diversification, with a goal of building profitable scale, fully leveraging our distribution platform year-around, and mitigating risk. 10
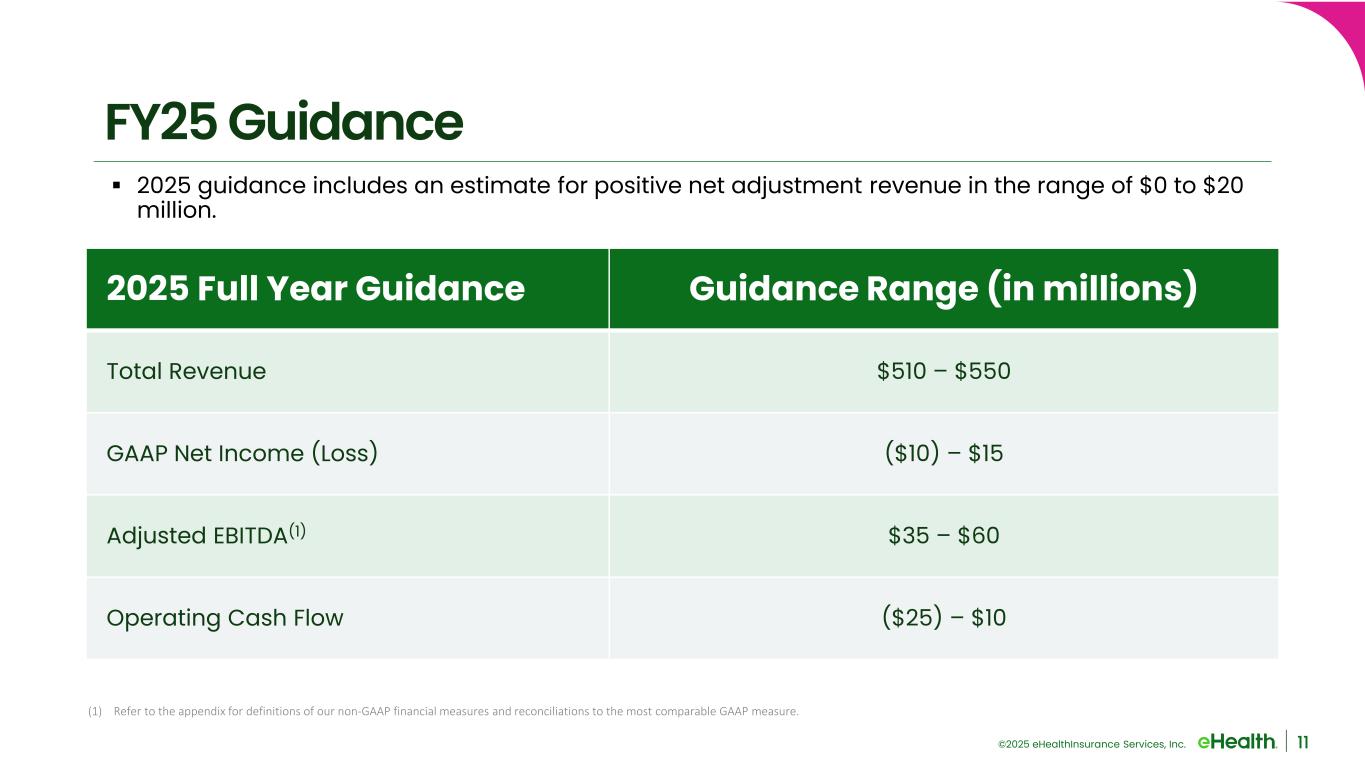
©2025 eHealthInsurance Services, Inc. 11 FY25 Guidance 2025 Full Year Guidance Guidance Range (in millions) Total Revenue $510 – $550 GAAP Net Income (Loss) ($10) – $15 Adjusted EBITDA(1) $35 – $60 Operating Cash Flow ($25) – $10 2025 guidance includes an estimate for positive net adjustment revenue in the range of $0 to $20 million. (1) Refer to the appendix for definitions of our non-GAAP financial measures and reconciliations to the most comparable GAAP measure.

©2025 eHealthInsurance Services, Inc. Appendix 12
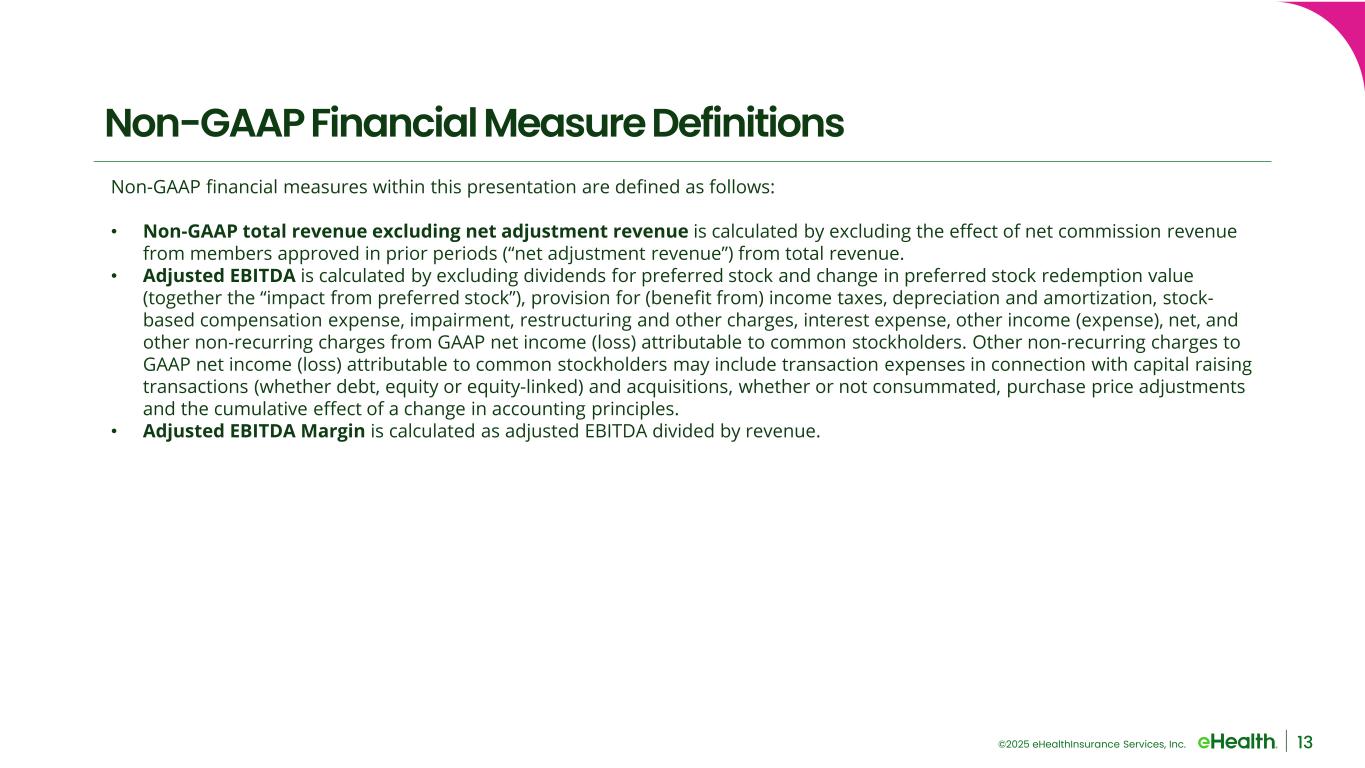
©2025 eHealthInsurance Services, Inc. 13 Non-GAAP Financial Measure Definitions Non-GAAP financial measures within this presentation are defined as follows: • Non-GAAP total revenue excluding net adjustment revenue is calculated by excluding the effect of net commission revenue from members approved in prior periods (“net adjustment revenue”) from total revenue. • Adjusted EBITDA is calculated by excluding dividends for preferred stock and change in preferred stock redemption value (together the “impact from preferred stock”), provision for (benefit from) income taxes, depreciation and amortization, stock- based compensation expense, impairment, restructuring and other charges, interest expense, other income (expense), net, and other non-recurring charges from GAAP net income (loss) attributable to common stockholders. Other non-recurring charges to GAAP net income (loss) attributable to common stockholders may include transaction expenses in connection with capital raising transactions (whether debt, equity or equity-linked) and acquisitions, whether or not consummated, purchase price adjustments and the cumulative effect of a change in accounting principles. • Adjusted EBITDA Margin is calculated as adjusted EBITDA divided by revenue.

©2025 eHealthInsurance Services, Inc. 14 Reconciliation of GAAP to Non-GAAP Financial Measures (1) Refer to the appendix for definitions of our non-GAAP financial measures and reconciliations to the most comparable GAAP measure.

©2025 eHealthInsurance Services, Inc. 15 Reconciliation of GAAP to Non-GAAP Financial Measures (1) Refer to the appendix for definitions of our non-GAAP financial measures and reconciliations to the most comparable GAAP measure.
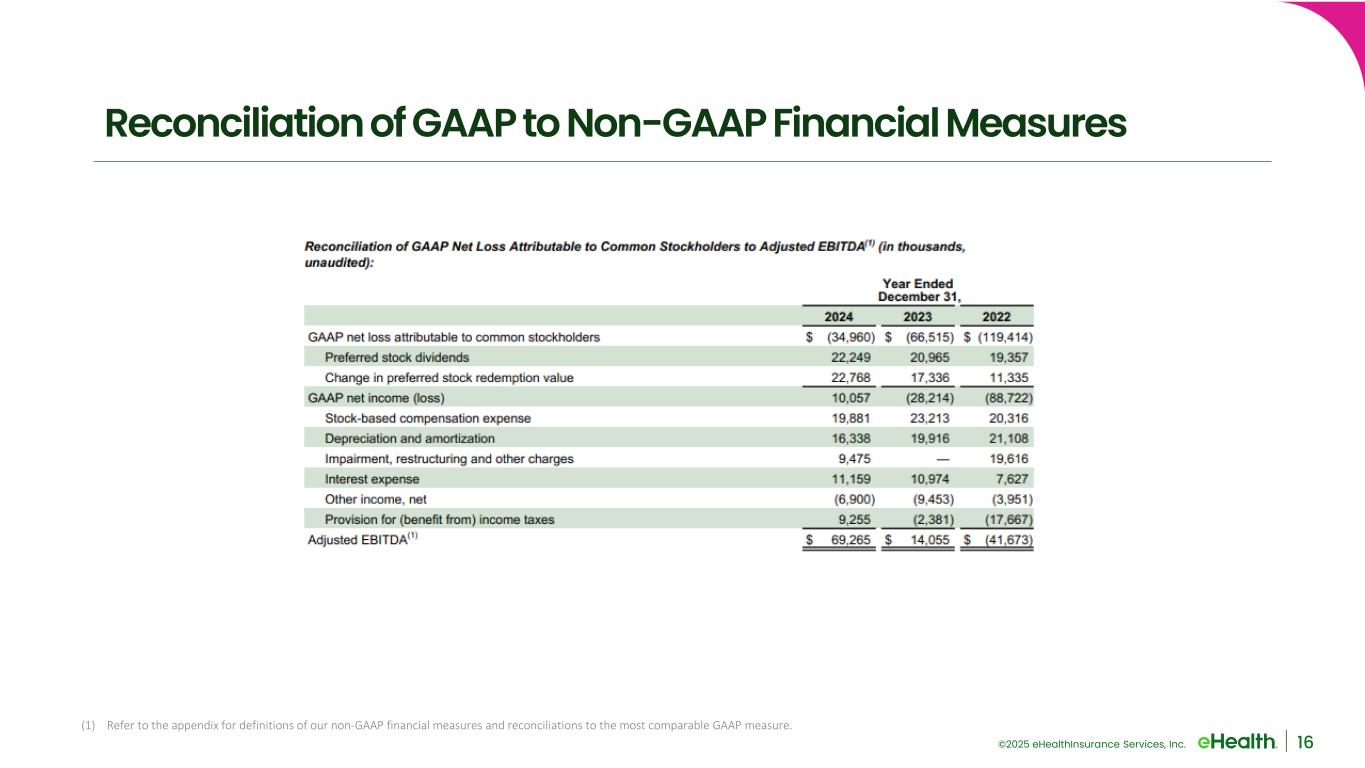
©2025 eHealthInsurance Services, Inc. 16 Reconciliation of GAAP to Non-GAAP Financial Measures (1) Refer to the appendix for definitions of our non-GAAP financial measures and reconciliations to the most comparable GAAP measure.
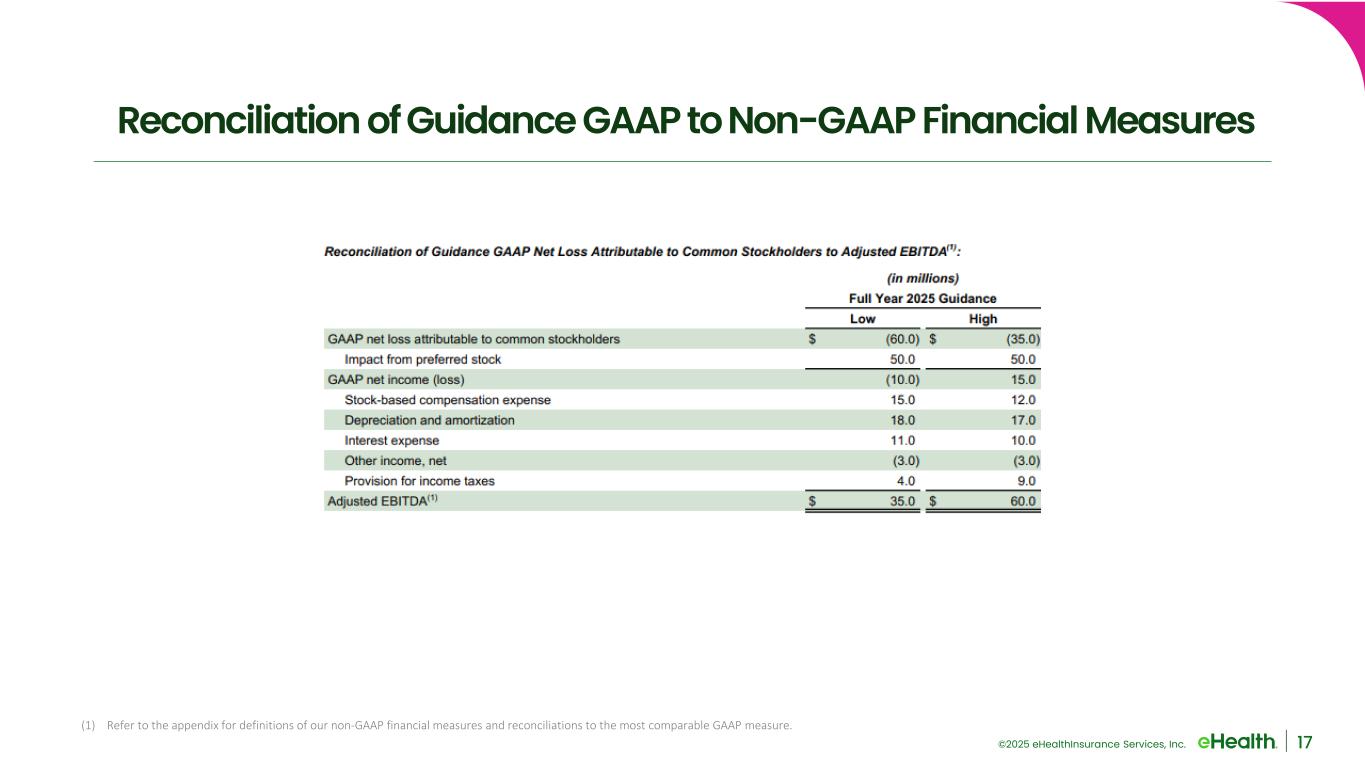
©2025 eHealthInsurance Services, Inc. 17 Reconciliation of Guidance GAAP to Non-GAAP Financial Measures (1) Refer to the appendix for definitions of our non-GAAP financial measures and reconciliations to the most comparable GAAP measure.