
©2025 eHealthInsurance Services, Inc. Q1 2025 Financial Results 1
©2025 eHealthInsurance Services, Inc. 2 Safe Harbor Statement Forward-Looking Statements This presentation includes forward-looking statements within the meaning of the federal securities laws. Forward-looking statements generally relate to future events or our future financial or operating performance. Forward-looking statements in this presentation include, but are not limited to, the following: our estimates regarding online and hybrid-assisted enrollment growth; our estimates regarding commissions receivable collection; our key conversion rate drivers; our expectations regarding our technological and digital capabilities; our business, industry and market trends, including market opportunity, consumer demand and our competitive advantage; our investments in technology and operational initiatives, including artificial intelligence (AI) capabilities, and the expected impact of these investments on our business; our expectations regarding call times, quality and efficiency with the AI capabilities; consumer expectation and adoption of online and other digital product and service offerings; our 2025 strategic objectives, including our business and growth strategy, branding strategy, member retention strategy, our telesales organization strategy, AI and digital technology strategy, carrier relationships strategy and diversification strategy, and our ability to achieve such strategic objectives; our ability to achieve our financial targets, including our 2025 annual guidance for total revenue, GAAP net loss, adjusted EBITDA and operating cash flow; the expected impact of positive net adjustment revenue on our 2025 annual guidance; and other statements regarding our future operations, financial condition, prospects and business strategies. Our expectations and beliefs regarding these matters may not materialize, and actual results in future periods are subject to risks and uncertainties that could cause actual results to differ materially from those projected. These risks include those set forth in our filings with the Securities and Exchange Commission, including our latest Form 10-Q and 10-K. The forward-looking statements in this presentation are based on information available to us as of today, and we disclaim any obligation to update any forward-looking statements, except as required by law. Non-GAAP Information This presentation includes both GAAP and non-GAAP financial measures. The presentation of non-GAAP financial information is not intended to be considered in isolation or as a substitute for results prepared in accordance with GAAP. A reconciliation of the non-GAAP financial measures included in this presentation to the most directly comparable GAAP financial measures is available in the Appendix to this presentation. Management uses both GAAP and non-GAAP information in evaluating and operating its business internally and as such has determined that it is important to provide this information to investors.
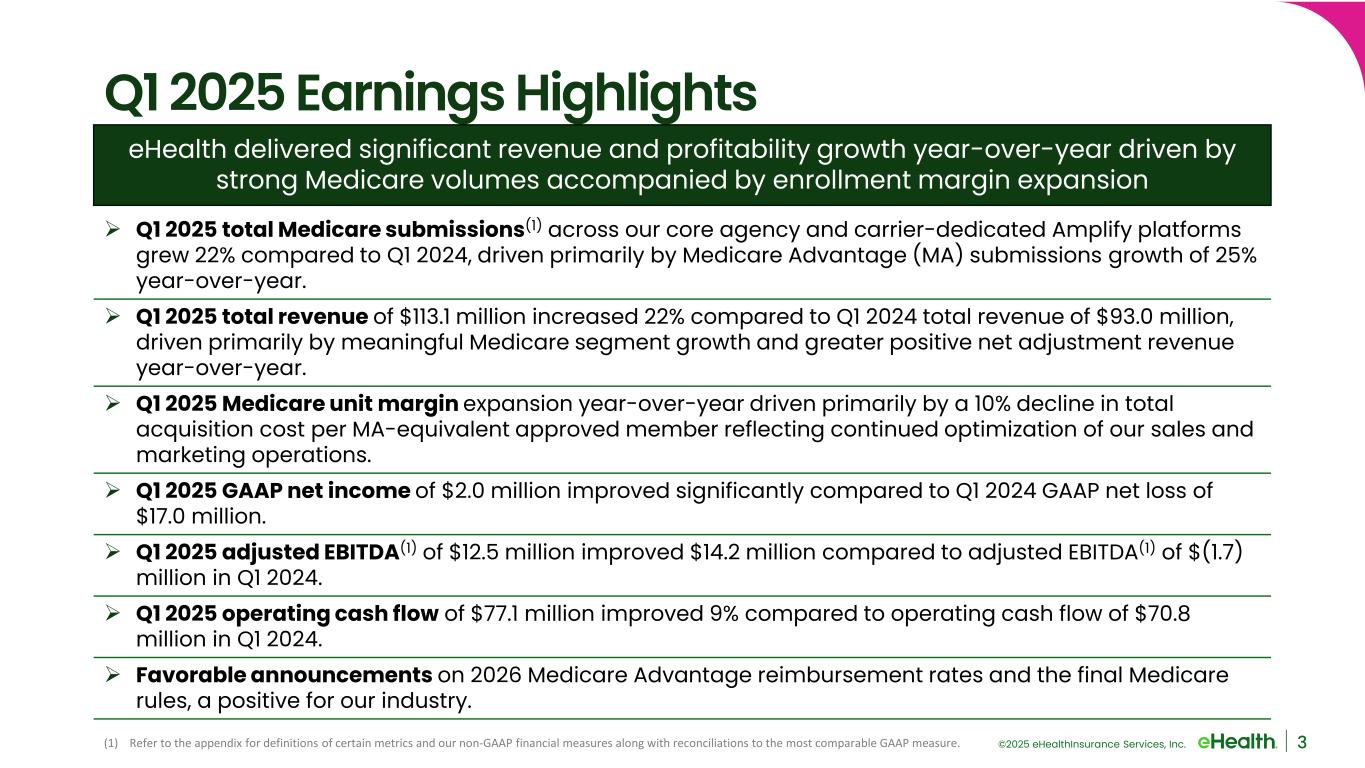
©2025 eHealthInsurance Services, Inc. 3 Q1 2025 Earnings Highlights Q1 2025 total Medicare submissions(1) across our core agency and carrier-dedicated Amplify platforms grew 22% compared to Q1 2024, driven primarily by Medicare Advantage (MA) submissions growth of 25% year-over-year. Q1 2025 total revenue of $113.1 million increased 22% compared to Q1 2024 total revenue of $93.0 million, driven primarily by meaningful Medicare segment growth and greater positive net adjustment revenue year-over-year. Q1 2025 Medicare unit margin expansion year-over-year driven primarily by a 10% decline in total acquisition cost per MA-equivalent approved member reflecting continued optimization of our sales and marketing operations. Q1 2025 GAAP net income of $2.0 million improved significantly compared to Q1 2024 GAAP net loss of $17.0 million. Q1 2025 adjusted EBITDA(1) of $12.5 million improved $14.2 million compared to adjusted EBITDA(1) of $(1.7) million in Q1 2024. Q1 2025 operating cash flow of $77.1 million improved 9% compared to operating cash flow of $70.8 million in Q1 2024. Favorable announcements on 2026 Medicare Advantage reimbursement rates and the final Medicare rules, a positive for our industry. eHealth delivered significant revenue and profitability growth year-over-year driven by strong Medicare volumes accompanied by enrollment margin expansion (1) Refer to the appendix for definitions of certain metrics and our non-GAAP financial measures along with reconciliations to the most comparable GAAP measure.
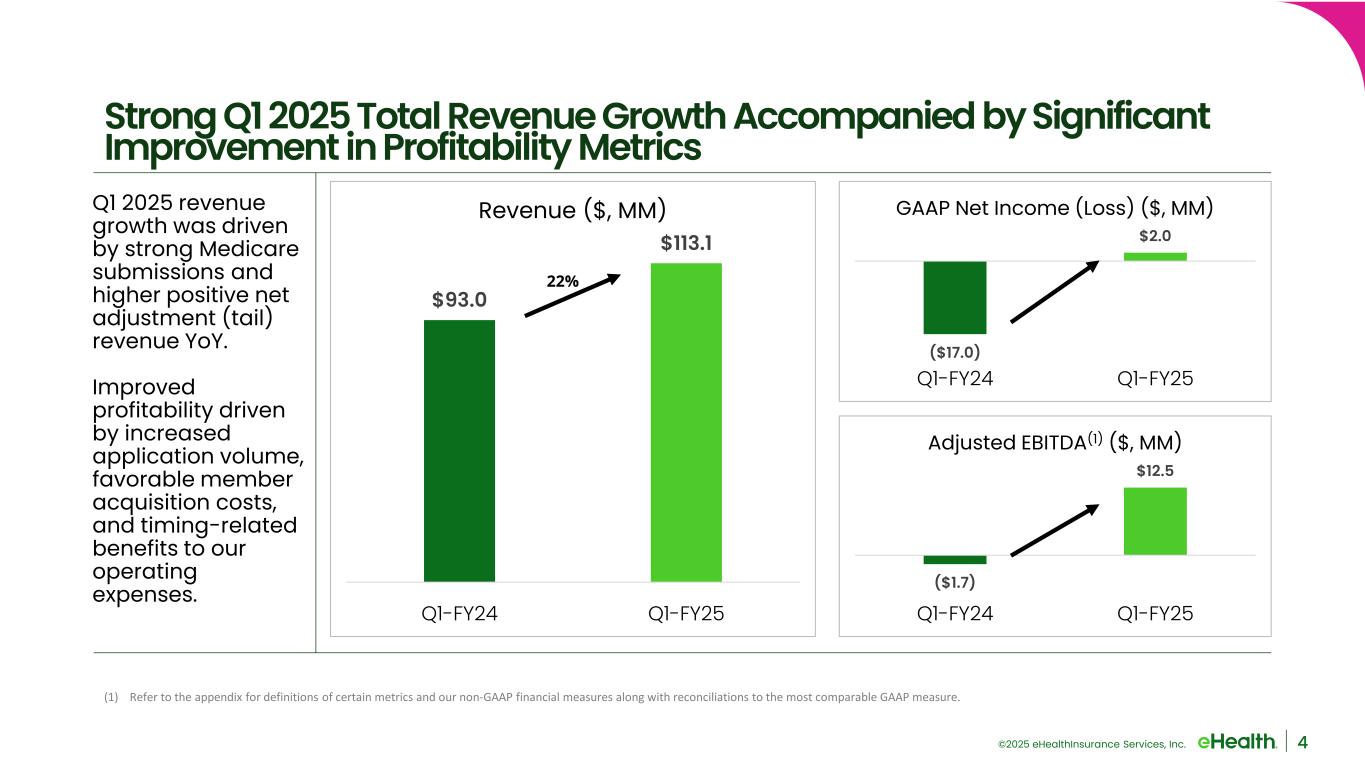
©2025 eHealthInsurance Services, Inc. Q1 2025 revenue growth was driven by strong Medicare submissions and higher positive net adjustment (tail) revenue YoY. Improved profitability driven by increased application volume, favorable member acquisition costs, and timing-related benefits to our operating expenses. 4 Strong Q1 2025 Total Revenue Growth Accompanied by Significant Improvement in Profitability Metrics ($17.0) $2.0 Q1-FY24 Q1-FY25 GAAP Net Income (Loss) ($, MM) ($1.7) $12.5 Q1-FY24 Q1-FY25 Adjusted EBITDA(1) ($, MM) $93.0 $113.1 Q1-FY24 Q1-FY25 Revenue ($, MM) 22% (1) Refer to the appendix for definitions of certain metrics and our non-GAAP financial measures along with reconciliations to the most comparable GAAP measure.
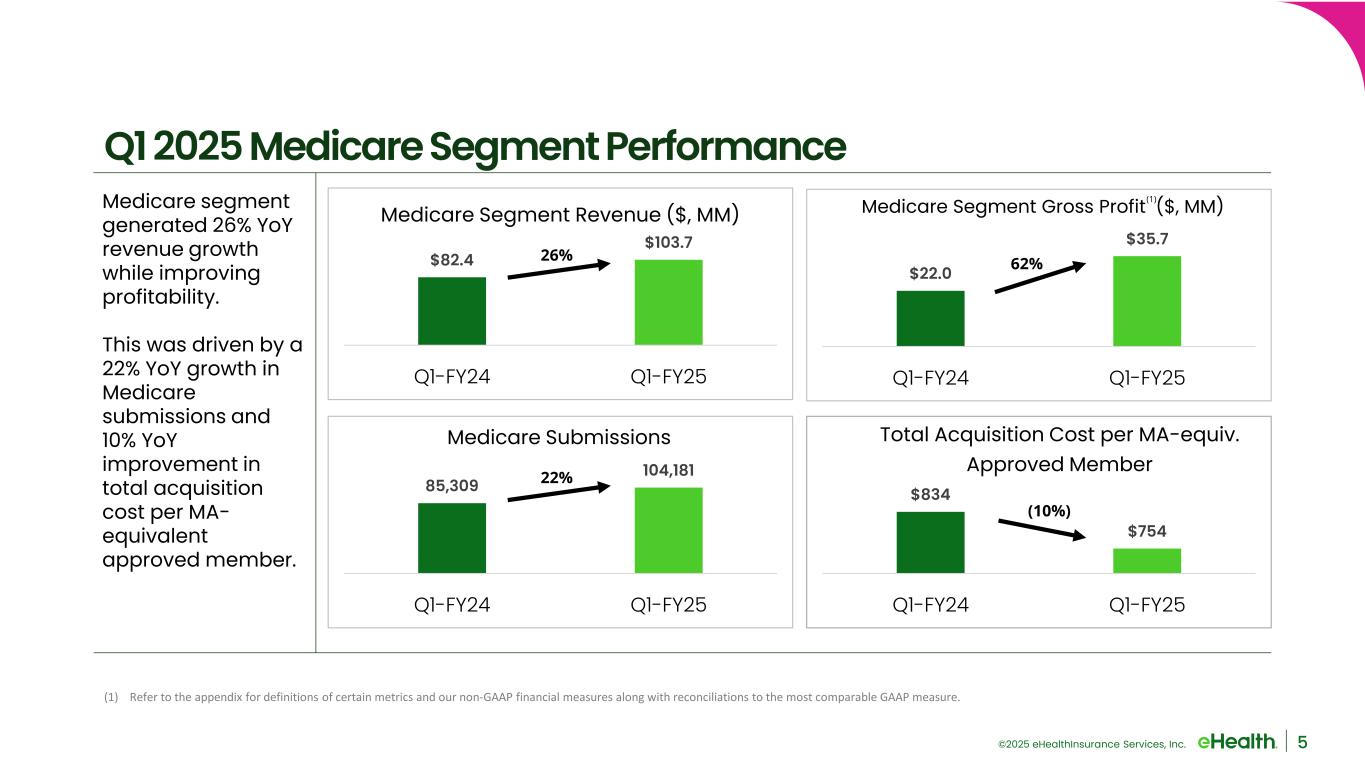
©2025 eHealthInsurance Services, Inc. Medicare segment generated 26% YoY revenue growth while improving profitability. This was driven by a 22% YoY growth in Medicare submissions and 10% YoY improvement in total acquisition cost per MA- equivalent approved member. 5 Q1 2025 Medicare Segment Performance (1) Segment profit is calculated as total revenue for the applicable segment less direct and indirect allocated marketing and advertising, customer care and enrollment, technology and content and general and administrative operating expenses, excluding stock-based compensation expense, depreciation and amortization, impairment, restructuring and other charges, and other income (expense), net. $82.4 $103.7 Q1-FY24 Q1-FY25 Medicare Segment Revenue ($, MM) 26% $22.0 $35.7 Q1-FY24 Q1-FY25 Medicare Segment Gross Profit ($, MM) 62% 85,309 104,181 Q1-FY24 Q1-FY25 Medicare Submissions 22% $834 $754 Q1-FY24 Q1-FY25 Total Acquisition Cost per MA-equiv. Approved Member (10%) (1) (1) Refer to the appendix for definitions of certain metrics and our non-GAAP financial measures along with reconciliations to the most comparable GAAP measure.
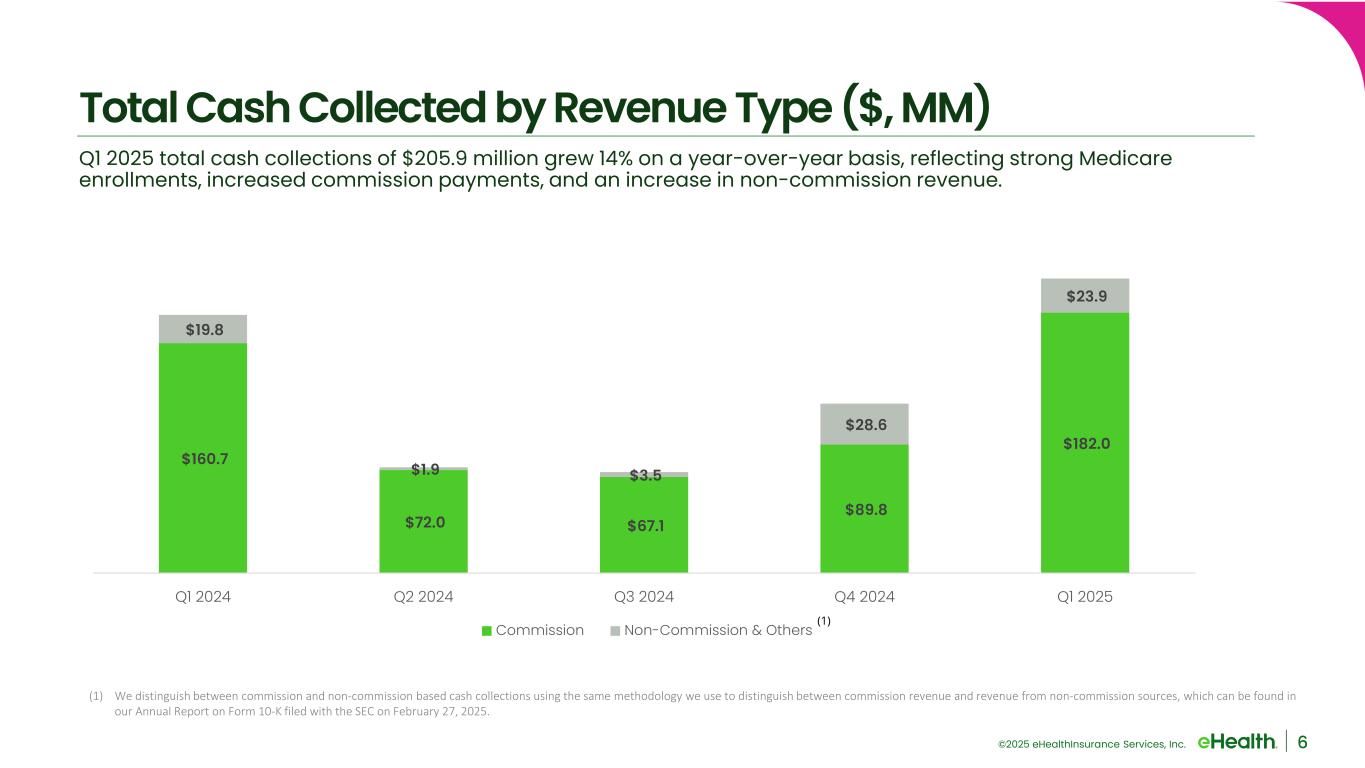
©2025 eHealthInsurance Services, Inc. Total Cash Collected by Revenue Type ($, MM) Q1 2025 total cash collections of $205.9 million grew 14% on a year-over-year basis, reflecting strong Medicare enrollments, increased commission payments, and an increase in non-commission revenue. 6 (1) We distinguish between commission and non-commission based cash collections using the same methodology we use to distinguish between commission revenue and revenue from non-commission sources, which can be found in our Annual Report on Form 10-K filed with the SEC on February 27, 2025. (1) $160.7 $72.0 $67.1 $89.8 $182.0 $19.8 $1.9 $3.5 $28.6 $23.9 Q1 2024 Q2 2024 Q3 2024 Q4 2024 Q1 2025 Commission Non-Commission & Others
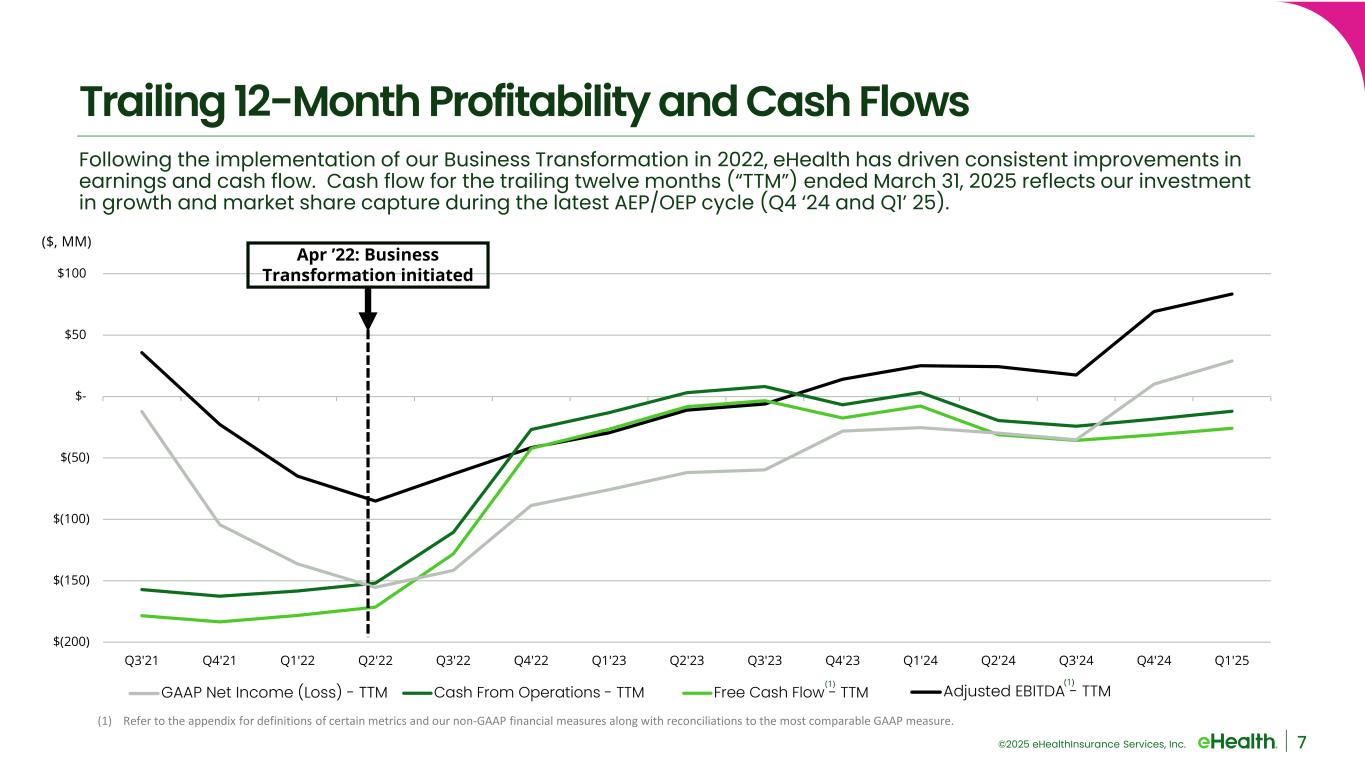
©2025 eHealthInsurance Services, Inc. $(200) $(150) $(100) $(50) $- $50 $100 Q3'21 Q4'21 Q1'22 Q2'22 Q3'22 Q4'22 Q1'23 Q2'23 Q3'23 Q4'23 Q1'24 Q2'24 Q3'24 Q4'24 Q1'25 Adjusted EBITDA - TTM Cash From Operations - TTM Free Cash Flow - TTM GAAP Net Income (Loss) - TTM Trailing 12-Month Profitability and Cash Flows 7 Following the implementation of our Business Transformation in 2022, eHealth has driven consistent improvements in earnings and cash flow. Cash flow for the trailing twelve months (“TTM”) ended March 31, 2025 reflects our investment in growth and market share capture during the latest AEP/OEP cycle (Q4 ‘24 and Q1’ 25). Apr ’22: Business Transformation initiated ($, MM) (1) (1) (1) Refer to the appendix for definitions of certain metrics and our non-GAAP financial measures along with reconciliations to the most comparable GAAP measure.
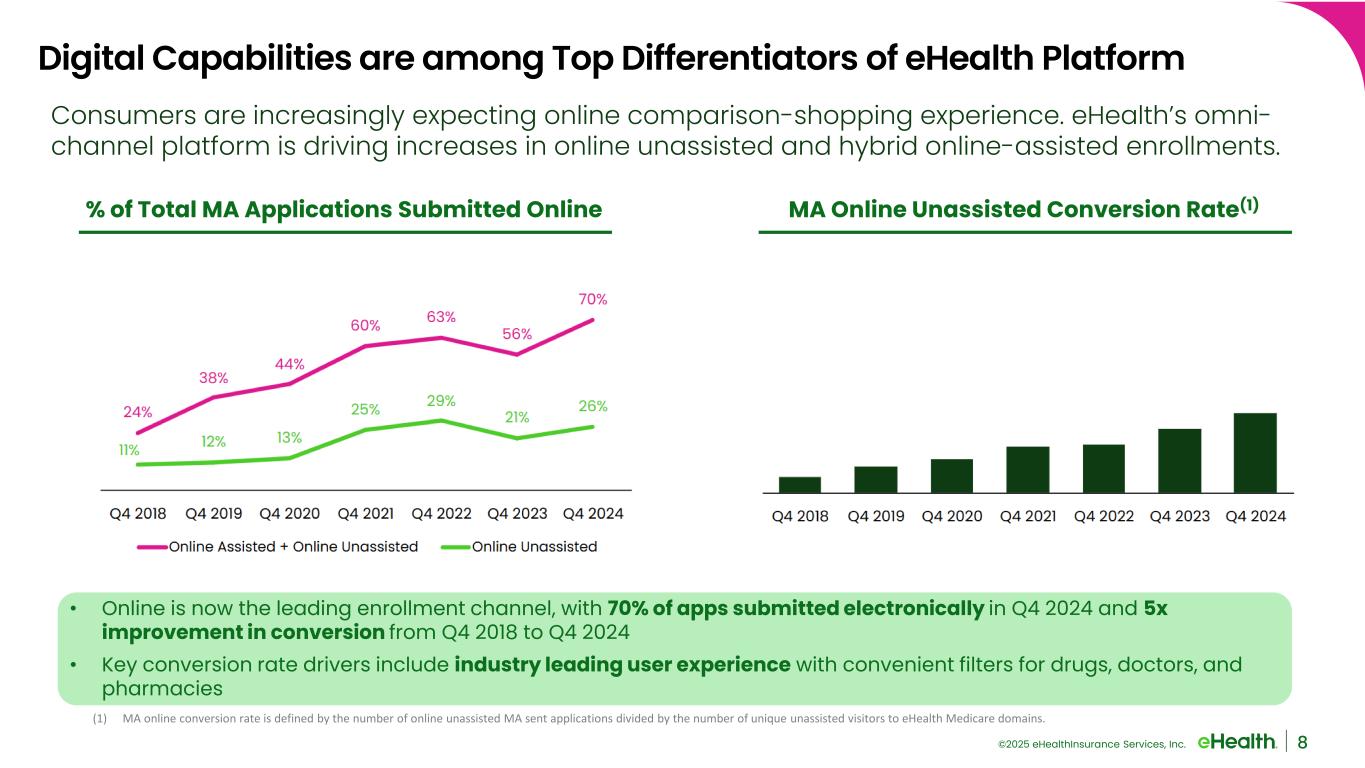
©2025 eHealthInsurance Services, Inc. 8 Consumers are increasingly expecting online comparison-shopping experience. eHealth’s omni- channel platform is driving increases in online unassisted and hybrid online-assisted enrollments. % of Total MA Applications Submitted Online • Online is now the leading enrollment channel, with 70% of apps submitted electronically in Q4 2024 and 5x improvement in conversion from Q4 2018 to Q4 2024 • Key conversion rate drivers include industry leading user experience with convenient filters for drugs, doctors, and pharmacies Digital Capabilities are among Top Differentiators of eHealth Platform MA Online Unassisted Conversion Rate(1) (1) MA online conversion rate is defined by the number of online unassisted MA sent applications divided by the number of unique unassisted visitors to eHealth Medicare domains.
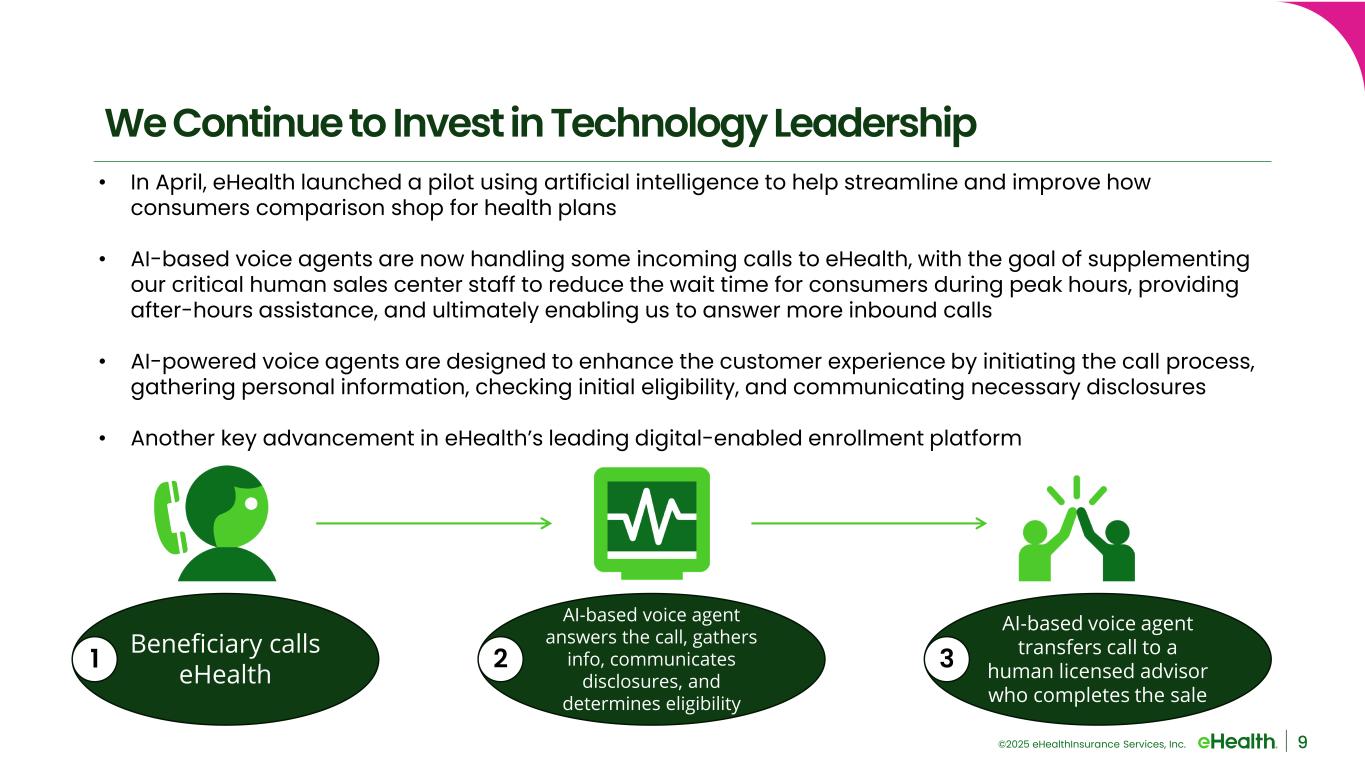
©2025 eHealthInsurance Services, Inc. 9 We Continue to Invest in Technology Leadership • In April, eHealth launched a pilot using artificial intelligence to help streamline and improve how consumers comparison shop for health plans • AI-based voice agents are now handling some incoming calls to eHealth, with the goal of supplementing our critical human sales center staff to reduce the wait time for consumers during peak hours, providing after-hours assistance, and ultimately enabling us to answer more inbound calls • AI-powered voice agents are designed to enhance the customer experience by initiating the call process, gathering personal information, checking initial eligibility, and communicating necessary disclosures • Another key advancement in eHealth’s leading digital-enabled enrollment platform Beneficiary calls eHealth AI-based voice agent answers the call, gathers info, communicates disclosures, and determines eligibility AI-based voice agent transfers call to a human licensed advisor who completes the sale 1 2 3
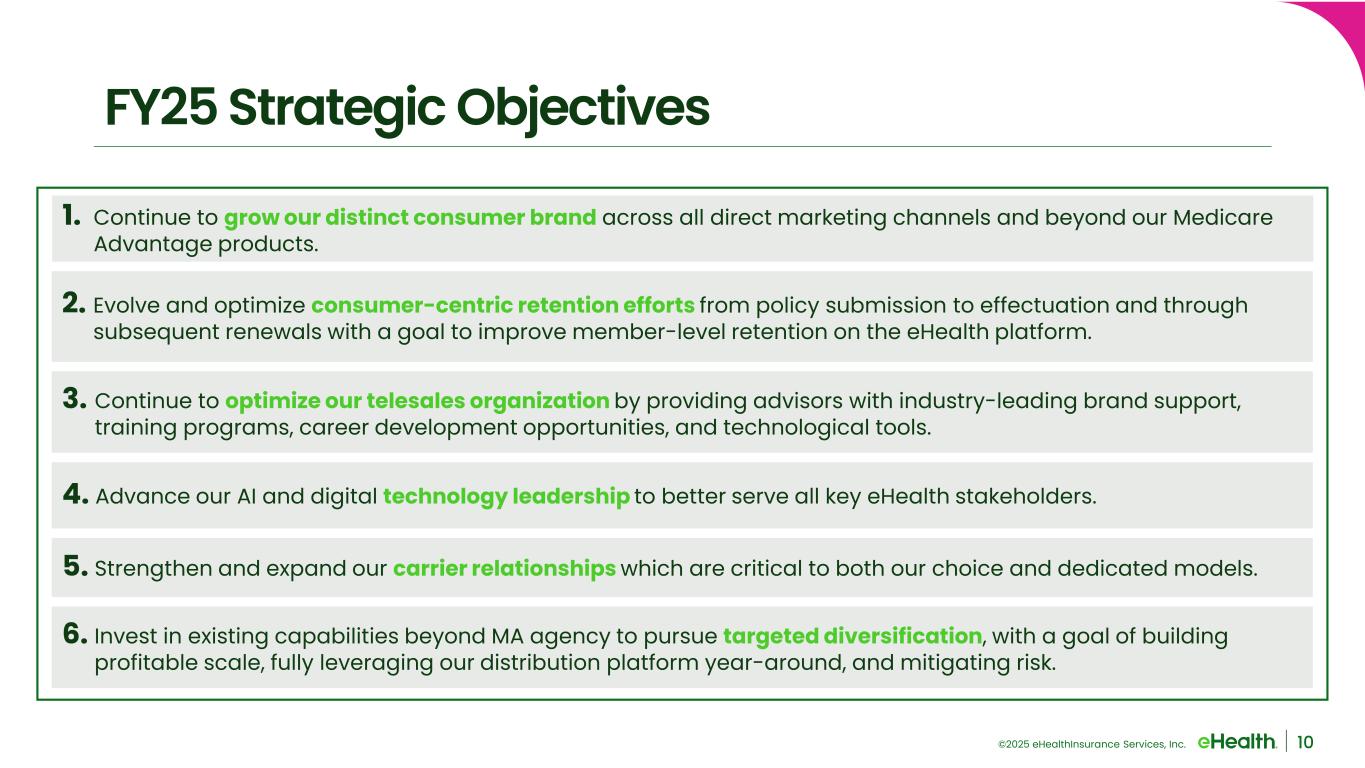
©2025 eHealthInsurance Services, Inc. FY25 Strategic Objectives 1. Continue to grow our distinct consumer brand across all direct marketing channels and beyond our Medicare Advantage products. 2. Evolve and optimize consumer-centric retention efforts from policy submission to effectuation and through subsequent renewals with a goal to improve member-level retention on the eHealth platform. 3. Continue to optimize our telesales organization by providing advisors with industry-leading brand support, training programs, career development opportunities, and technological tools. 4. Advance our AI and digital technology leadership to better serve all key eHealth stakeholders. 5. Strengthen and expand our carrier relationships which are critical to both our choice and dedicated models. 6. Invest in existing capabilities beyond MA agency to pursue targeted diversification, with a goal of building profitable scale, fully leveraging our distribution platform year-around, and mitigating risk. 10
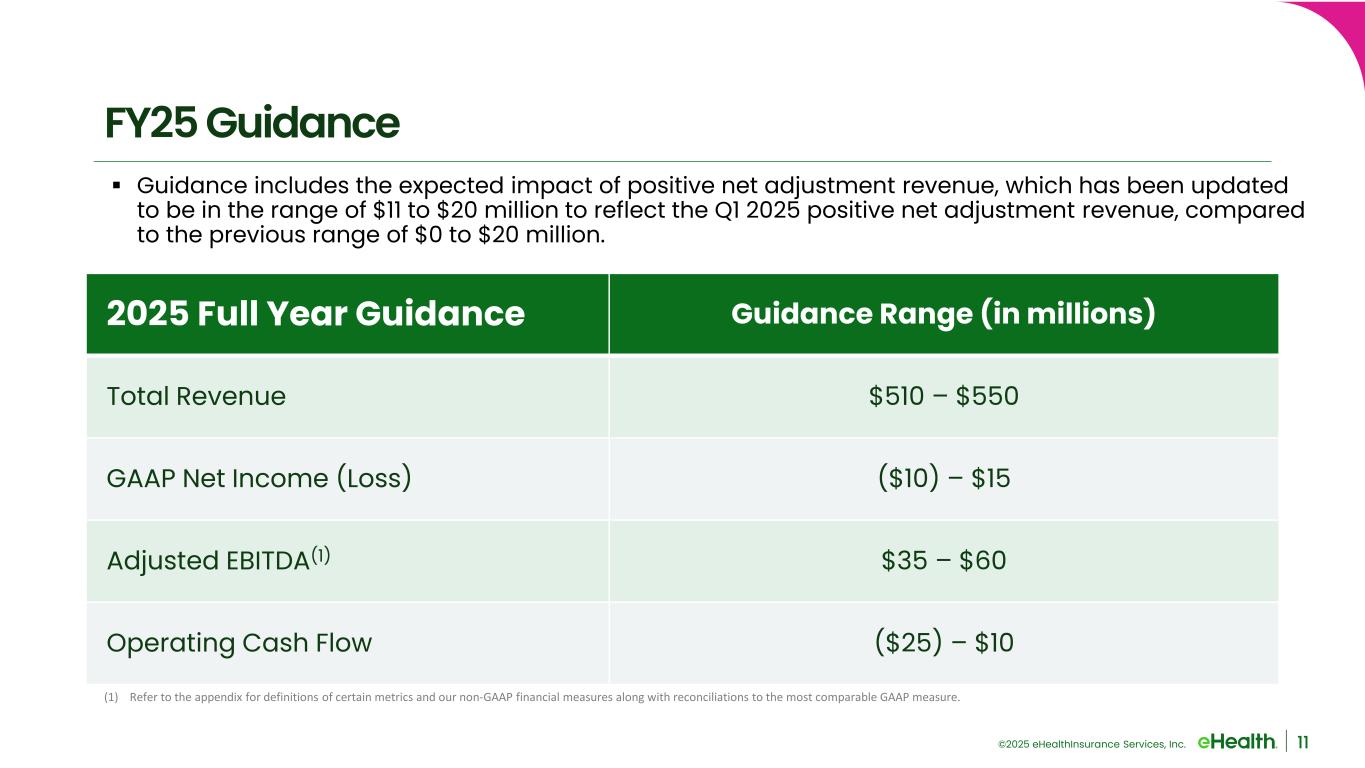
©2025 eHealthInsurance Services, Inc. 11 FY25 Guidance 2025 Full Year Guidance Guidance Range (in millions) Total Revenue $510 – $550 GAAP Net Income (Loss) ($10) – $15 Adjusted EBITDA(1) $35 – $60 Operating Cash Flow ($25) – $10 Guidance includes the expected impact of positive net adjustment revenue, which has been updated to be in the range of $11 to $20 million to reflect the Q1 2025 positive net adjustment revenue, compared to the previous range of $0 to $20 million. (1) Refer to the appendix for definitions of certain metrics and our non-GAAP financial measures along with reconciliations to the most comparable GAAP measure.

©2025 eHealthInsurance Services, Inc. Appendix 12
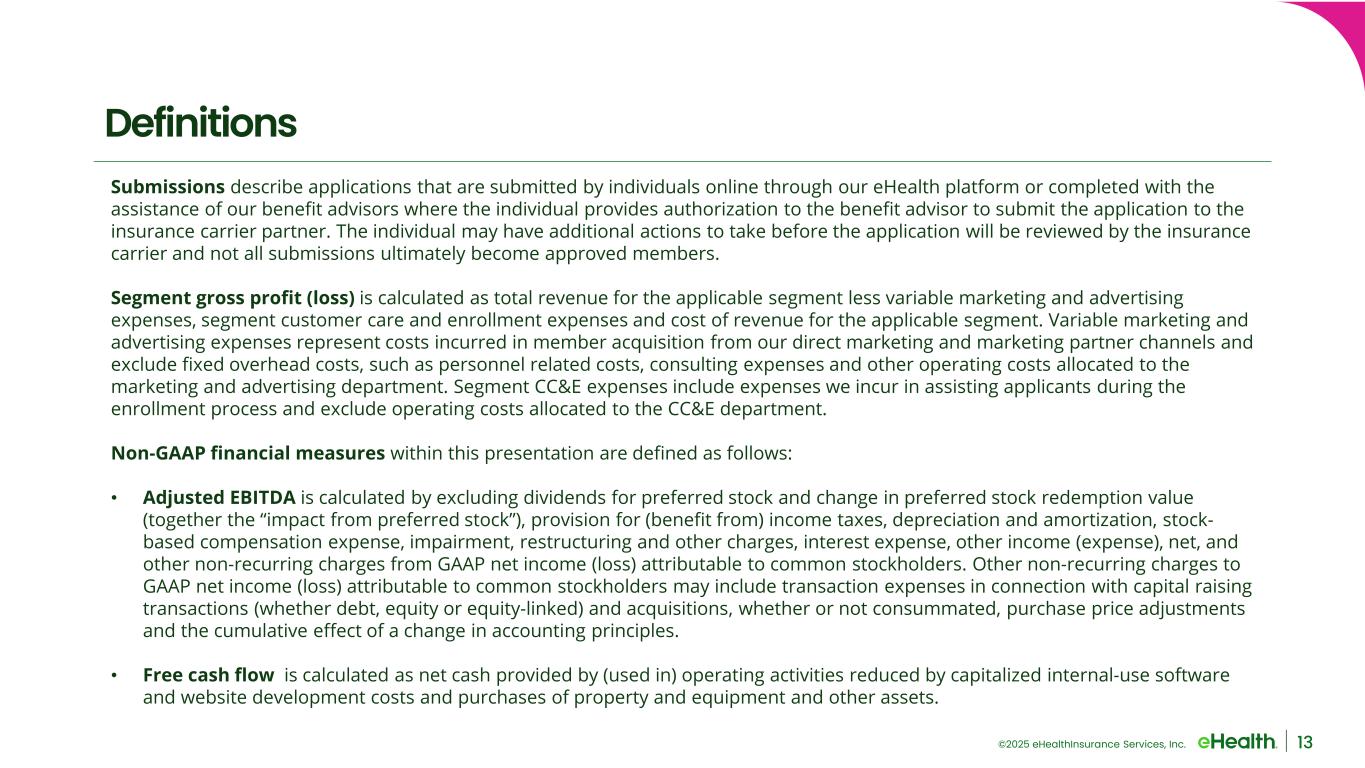
©2025 eHealthInsurance Services, Inc. 13 Definitions Submissions describe applications that are submitted by individuals online through our eHealth platform or completed with the assistance of our benefit advisors where the individual provides authorization to the benefit advisor to submit the application to the insurance carrier partner. The individual may have additional actions to take before the application will be reviewed by the insurance carrier and not all submissions ultimately become approved members. Segment gross profit (loss) is calculated as total revenue for the applicable segment less variable marketing and advertising expenses, segment customer care and enrollment expenses and cost of revenue for the applicable segment. Variable marketing and advertising expenses represent costs incurred in member acquisition from our direct marketing and marketing partner channels and exclude fixed overhead costs, such as personnel related costs, consulting expenses and other operating costs allocated to the marketing and advertising department. Segment CC&E expenses include expenses we incur in assisting applicants during the enrollment process and exclude operating costs allocated to the CC&E department. Non-GAAP financial measures within this presentation are defined as follows: • Adjusted EBITDA is calculated by excluding dividends for preferred stock and change in preferred stock redemption value (together the “impact from preferred stock”), provision for (benefit from) income taxes, depreciation and amortization, stock- based compensation expense, impairment, restructuring and other charges, interest expense, other income (expense), net, and other non-recurring charges from GAAP net income (loss) attributable to common stockholders. Other non-recurring charges to GAAP net income (loss) attributable to common stockholders may include transaction expenses in connection with capital raising transactions (whether debt, equity or equity-linked) and acquisitions, whether or not consummated, purchase price adjustments and the cumulative effect of a change in accounting principles. • Free cash flow is calculated as net cash provided by (used in) operating activities reduced by capitalized internal-use software and website development costs and purchases of property and equipment and other assets.
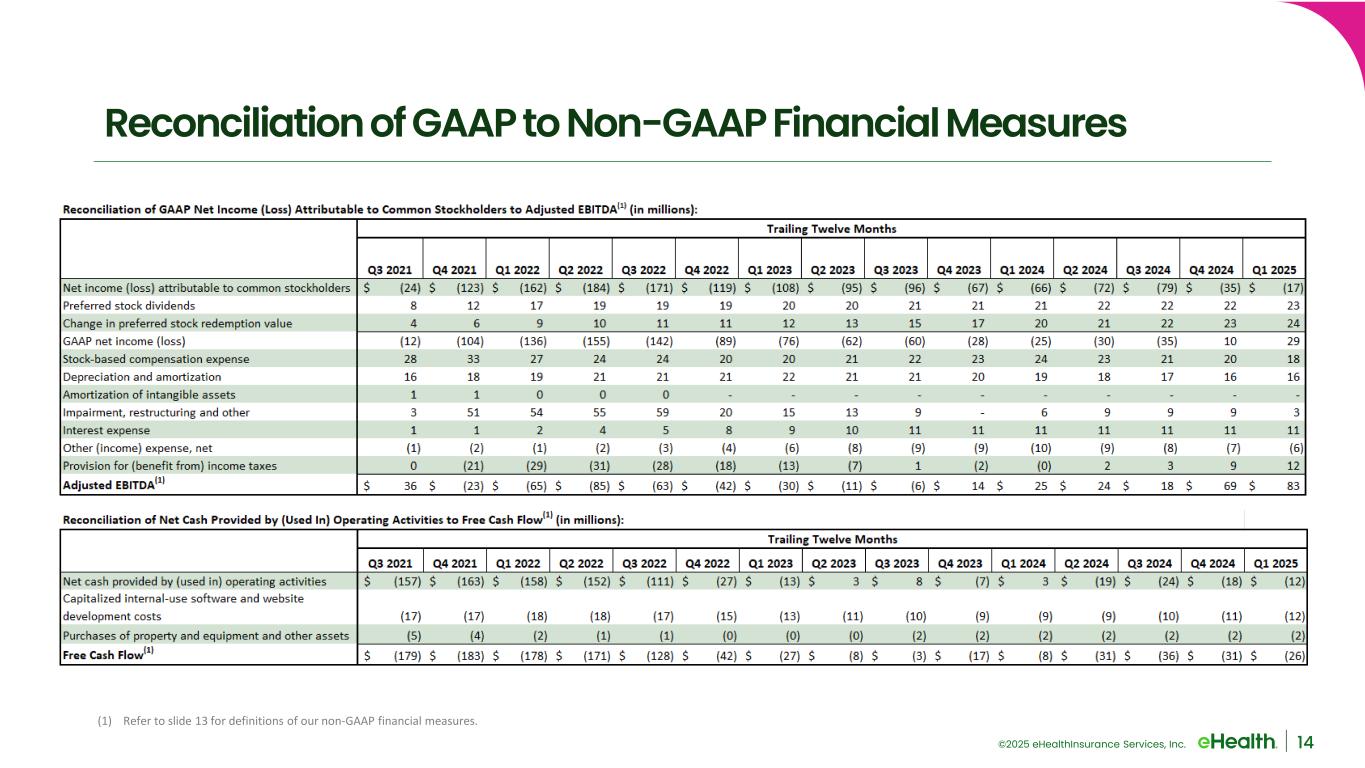
©2025 eHealthInsurance Services, Inc. 14 Reconciliation of GAAP to Non-GAAP Financial Measures (1) Refer to slide 13 for definitions of our non-GAAP financial measures.
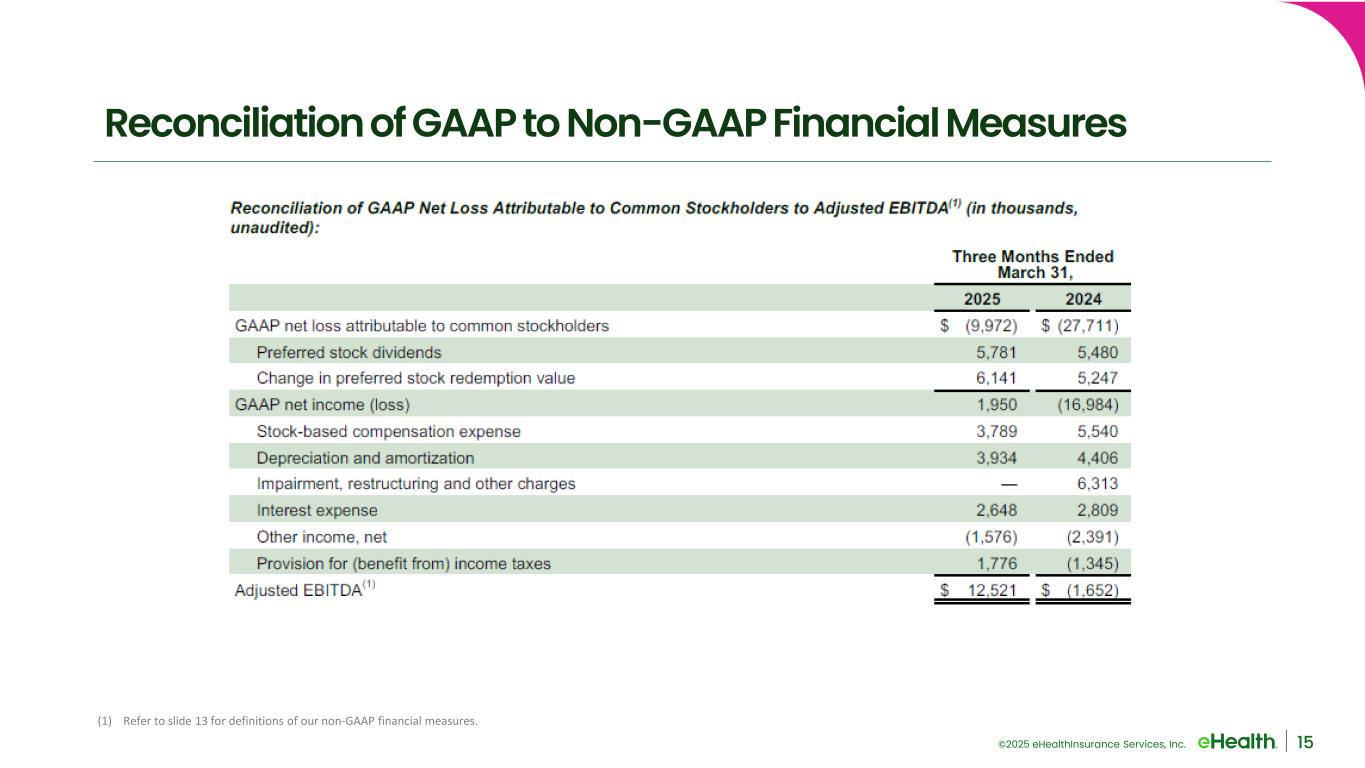
©2025 eHealthInsurance Services, Inc. 15 Reconciliation of GAAP to Non-GAAP Financial Measures (1) Refer to slide 13 for definitions of our non-GAAP financial measures.
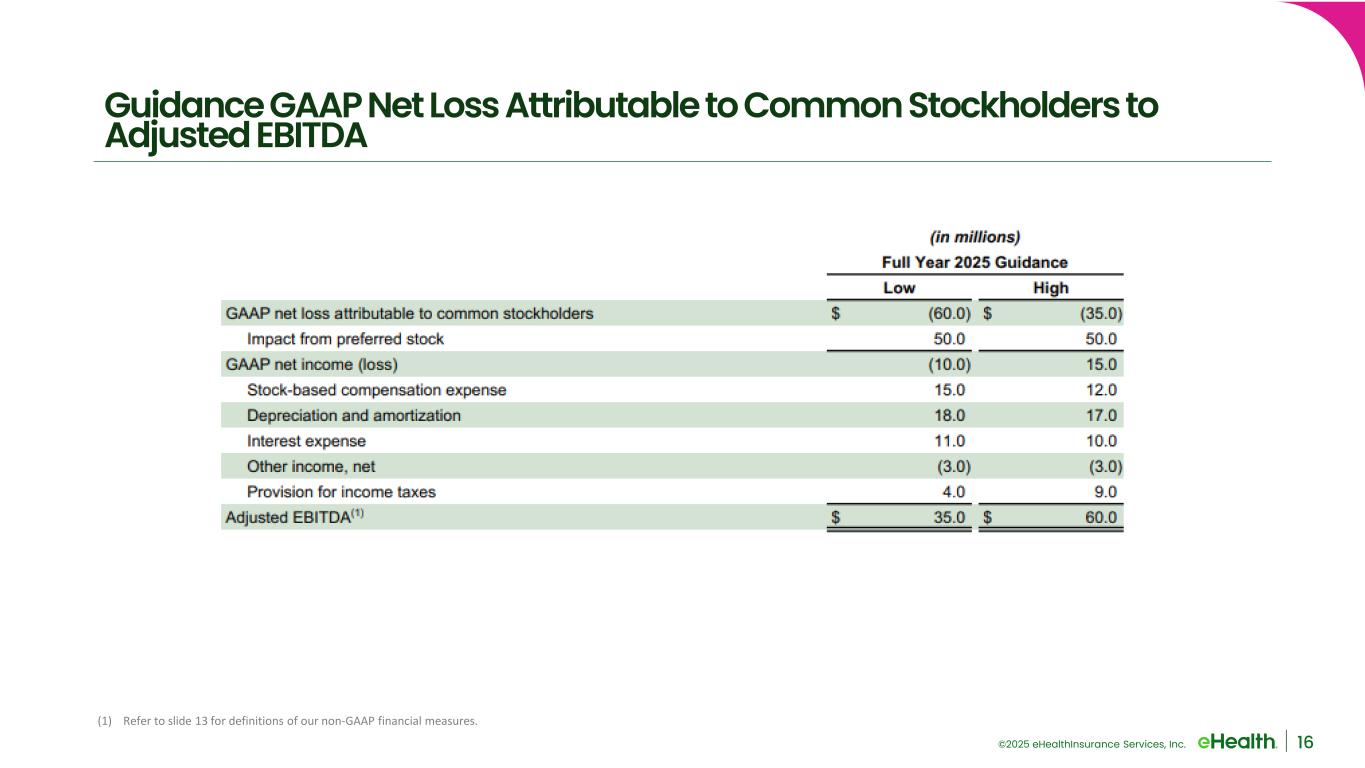
©2025 eHealthInsurance Services, Inc. 16 Guidance GAAP Net Loss Attributable to Common Stockholders to Adjusted EBITDA (1) Refer to slide 13 for definitions of our non-GAAP financial measures.