MANAGEMENT’S
DISCUSSION AND ANALYSIS
(All
dollar amounts are expressed in U.S. dollars)
INTRODUCTION
The following discussion of the
operating results and financial position of Jaguar Mining Inc. (“Jaguar" or the
"Company”) should be read in conjunction with the annual audited consolidated
financial statements and the notes thereto of the Company for the years ended
2008 and 2007. The financial statements have been prepared in
accordance with accounting principles generally accepted in Canada (“Canadian
GAAP”) and the annual audited financial statements have been reconciled to U.S.
generally accepted accounting principles (“U.S. GAAP”). The Company
reports its financial statements in US dollars (“US$”), however a significant
portion of the Company's expenses are incurred in either Canadian dollars
(“Cdn.$”) or Brazilian reais (“R$”).
The discussion and analysis contained
in this MD&A are as of March 23, 2009.
FORWARD-LOOKING
STATEMENTS
Certain statements in this Management’s
Discussion and Analysis (“MD&A”) constitute "Forward-Looking Statements"
within the meaning of the U.S. Private Securities Litigation Reform Act of 1995
and Canadian securities legislation. These
Forward-Looking Statements include, among others, statements
concerning the Company's future objectives, measured and indicated
resources and proven and probable reserves, their average grade, the
commencement period of production, cash operating costs and completion dates of
feasibility studies, gold production and sales targets, capital expenditure
costs, future profitability and growth in reserves. Forward-Looking
Statements can be identified by the use of words, such as "are expected", "is
forecast", “is targeted”, "approximately" or variations of such words and
phrases or statements that certain actions, events or results "may", "could",
"would", "might" or "will" be taken, occur or be achieved. Forward-Looking
Statements involve known and unknown risks, uncertainties and other factors,
which may cause the actual results, or performance to be materially different
from any future results or performance expressed or implied by the
Forward-Looking Statements.
These factors include the inherent
risks involved in the exploration and development of mineral properties, the
uncertainties involved in interpreting drilling results and other geological
data, fluctuating gold prices and monetary exchange rates, the possibility of
project cost delays and overruns or unanticipated costs and expenses,
uncertainties relating to the availability and costs of financing needed in the
future, uncertainties related to production rates, timing of production and
the cash and total costs of production, changes in applicable laws including
laws related to mining development, environmental protection, and the protection
of the health and safety of mine workers, the availability of labour and
equipment, the possibility of labour strikes and work stoppages and
changes in general economic conditions. Although the Company has attempted
to identify important factors that could cause actual actions, events or results
to differ materially from those described in Forward-Looking Statements, there
may be other factors that could cause actions, events or results to differ from
those anticipated, estimated or intended.
These Forward-Looking Statements
represent our views as of the date of this discussion. The Company
anticipates that subsequent events and developments may cause the Company's
views to change. The Company does not undertake to update any
Forward-Looking Statements, either written or oral, that may be made from time
to time by, or on behalf of the Company, subsequent to the date of this
discussion, other than as required by law. For a discussion of important
factors affecting the Company, including fluctuations in the price of gold and
exchange rates, uncertainty in the calculation of mineral resources,
competition, uncertainty concerning geological conditions and governmental
regulations and assumptions underlying the Company's Forward-Looking
Statements, see the "CAUTIONARY NOTE REGARDING FORWARD LOOKING STATEMENTS"
and "RISK FACTORS" as filed in the Company’s Annual Information Form for the
year ended December 31, 2008, filed on SEDAR and available at www.sedar.com, and its filings,
including the Company's Annual Report on Form 40-F for the year ended December
31, 2008, filed with the U.S. Securities and Exchange Commission, which are
available at www.sec.gov on
EDGAR. Further information about the Company is available on its corporate
website www.jaguarmining.com.
CAUTIONARY
NOTE TO U.S. INVESTORS CONCERNING ESTIMATES OF INFERRED AND MEASURED AND
INDICATED RESOURCES
This document includes the term
"inferred resources" and "measured and indicated resources". The
Company advises U.S. investors that while such terms are recognized
and permitted under Canadian regulations, the U.S. Securities and
Exchange Commission does not recognize them.U.S. investors are cautioned
not to assume that any part or all of the mineral deposits in these categories
will ever be converted into proven or probable reserves.
1
JAGUAR
MINING INC.
MANAGEMENT’S
DISCUSSION AND ANALYSIS
(All
dollar amounts are expressed in U.S. dollars)
"Inferred resources" have a great
amount of uncertainty as to their existence, and great uncertainty as to their
economic and legal feasibility. It cannot be assumed that all or any
part of an inferred mineral resource will ever be upgraded to
a higher category. Under Canadian rules, estimates of inferred
mineral resources may not form the basis of feasibility or other economic
studies. U.S. investors are cautioned not to assume that any part or
all of an inferred resource exists or is economically or legally
mineable.
SUMMARY
DESCRIPTION OF JAGUAR’S BUSINESS
Jaguar is engaged in gold production
and in the acquisition, exploration, development and operation of gold producing
properties in the Iron Quadrangle region of Brazil, a greenstone belt located
near the city of Belo Horizonte in the state of Minas Gerais. Through
a joint venture with Xstrata plc (“Xstrata”), the Company is also engaged in
gold exploration at a greenfield site in the northeast of Brazil covering
159,000 acres. In addition, the Company may consider the acquisition
and subsequent exploration, development and operation of other gold properties
in Brazil.
The Company is currently producing gold
at its Turmalina, Paciência and Sabará operations. During 2008, the
Company finalized NI 43-101 compliant feasibility studies for the Phase I
Expansion of the Turmalina operation and the Caeté Project, which were filed on
SEDAR on September 11 and September 17, respectively. The Turmalina
expansion and the Caeté Project build-out are expected to be completed during
the third quarter of 2009 and the second quarter of 2010,
respectively.
The Company intends to become a
sustainable mid-sized gold producer of between 620,000 ounces and 700,000 ounces
of gold in 2014. The Company believes that the development
initiatives it has carried out to date, which include over 30 km of underground
development at its properties in Minas Gerais, give it a reasonable basis to
express confidence that sufficient mineral resources exist and additional
resources will be identified to reach and sustain its production targets for the
foreseeable future. The Company’s primary properties remain open at
depth and along strike. Given the management team's extensive
experience operating in the Iron Quadrangle, coupled with the geological
characteristics of other gold operations in the same district, management
believes the identification of additional gold resources to meet the Company’s
production targets will not be a constraining issue.
The Company’s objective is to enhance
shareholder value by building, expanding and operating low-cost gold mines and
by adding resources and reserves at its existing properties. The
Company plans to achieve this objective by completing the development of its
Caeté Project and expanding overall production at its three largest
properties. The Company continues to aggressively explore and develop
its resources in Brazil. The Company has sought to reduce its risk
profile and to differentiate itself from other junior mining companies by
developing and expanding several mining operations rather than focusing on one
operation. This strategy will also allow the Company to rapidly grow
the overall business if exploration confirms that mineral resources can be
expanded at any of its mines. Management believes that the Company’s
well-developed infrastructure, high grade resource base, experienced personnel
and its fully developed health, safety and environment program favorably
positions the Company to achieve attractive growth at relatively low risk
compared with other junior gold developers.
The Company believes it now has and
will maintain at various levels of production a cost structure that will ensure
its competitiveness. Based on cash on hand and assumptions concerning
production costs, foreign currency exchange rates, forward gold prices and
limited borrowings, the Company believes it has the required funds to execute on
its plans. A sensitivity analysis, which addresses deviations from
certain base assumptions for feed grade, costs, and other variables, used in the
development of various technical reports the Company has previously filed, is
provided in the Company’s Annual Information Form for the year ended December
31, 2008, dated February 11, 2009 and is available on SEDAR at www.sedar.com.
PROJECT
DEVELOPMENT REVIEW - OPERATIONS AND EXPLORATION
Production
During the quarter ended December 31,
2008, the Company produced a total of 37,916 ounces of gold at Turmalina,
Paciência and Sabará at an average cash operating cost of $396 per ounce
compared to 20,463 ounces at an average cash operating cost of $405 per ounce
during the same period last year. Gold production for the quarter
ended December 31, 2008 increased 85% from the comparable quarter in
2007. Cash operating costs decreased slightly in comparison to the
same period last year. The average exchange rate for the quarter
ended December 31, 2008 was R$2.28/US$1.00 compared to R$1.78/US$1.00 for the
quarter ended December 31, 2007.
2
JAGUAR
MINING INC.
MANAGEMENT’S
DISCUSSION AND ANALYSIS
(All
dollar amounts are expressed in U.S. dollars)
During the year ended December 31,
2008, the Company produced a total of 115,348 ounces of gold at Turmalina,
Paciência and Sabará at an average cash operating cost of $429 per ounce
compared to 70,113 ounces at an average cash operating cost of $346 per ounce
during the year ended December 31, 2007, an increase in ounces produced of
64%.Cash operating costs in 2008 increased by 24% in comparison to 2007 due to
the commissioning of the Paciência operation and exchange rates, which were
unfavorable on balance. The average exchange rate for the year ended
December 31, 2008 was R$1.84/US$1.00 compared to R$1.95/US$1.00 for the year
ended December 31, 2007.
The Company’s 2009 production and cash
operating cost estimates are as follows:
|
Operation
|
Production
(oz)
|
Cash
Operating Cost ($/oz)
|
|
Turmalina
|
80,000-85,000
|
$354-387
|
|
Paciência
|
65,000-70,000
|
$362-398
|
|
Sabará
|
20,000
|
$374-411
|
|
Total
|
165,000-175,000
|
$360-394
|
Note:
Estimated cash costs are based on R$2.00 to R$2.20 per US$1.00.
[The
remainder of this page has been left intentionally blank]
3
JAGUAR
MINING INC.
MANAGEMENT’S
DISCUSSION AND ANALYSIS
(All
dollar amounts are expressed in U.S. dollars)
Production
and Operating Performance
The
following tables set forth certain operating data at Turmalina, Paciência and
Sabará for the quarter and year ended December 31, 2008 and 2007.
|
Quarter
Ended December 31, 2008 Operating Data
|
||||||||||||||||||||||||
|
Ore
Processed
(t000)
|
Feed
grade
(g/t)
|
Plant
Recovery
rate
(%)
|
Production
(ounces)
|
Cash
Operating
cost/t
|
Cash
Operating
cost/ounce
|
|||||||||||||||||||
|
Sabará
|
105 | 1.62 | 65 | 4,506 | $ | 21.20 | $ | 641 | ||||||||||||||||
|
Turmalina
|
128 | 5.93 | 89 | 19,987 | 52.80 | 330 | ||||||||||||||||||
|
Paciência
|
147 | 3.43 | 92 | 13,423 | 41.20 | 413 | ||||||||||||||||||
|
Total
|
380 | 3.78 | 87 | 37,916 | $ | 39.60 | $ | 396 | ||||||||||||||||
|
Quarter
Ended December 31, 2007 Operating Data
|
||||||||||||||||||||||||
|
Ore
Processed
(t000)
|
Feed
grade
(g/t)
|
Plant
Recovery
rate
(%)
|
Production
(ounces)
|
Cash
Operating
cost/t
|
Cash
Operating
cost/ounce
|
|||||||||||||||||||
|
Sabará
|
140 | 1.76 | 69 | 6,444 | $ | 21.90 | $ | 534 | ||||||||||||||||
|
Turmalina
|
96 | 5.51 | 87 | 14,019 | 55.70 | 346 | ||||||||||||||||||
|
Paciência
|
- | - | - | - | - | - | ||||||||||||||||||
|
Total
|
236 | 3.28 | 81 | 20,463 | $ | 35.60 | $ | 405 | ||||||||||||||||
|
12
Months Ended December 31, 2008 Operating Data
|
||||||||||||||||||||||||
|
Ore
Processed
(t000)
|
Feed
grade
(g/t)
|
Plant
Recovery
rate
(%)
|
Production
(ounces)
|
Cash
Operating
cost/t
|
Cash
Operating
cost/ounce
|
|||||||||||||||||||
|
Sabará
|
475 | 1.54 | 66 | 18,199 | $ | 22.50 | $ | 667 | ||||||||||||||||
|
Turmalina
|
481 | 5.46 | 88 | 72,785 | 55.30 | 364 | ||||||||||||||||||
|
Paciência
|
277 | 3.28 | 92 | 24,364 | 43.00 | 443 | ||||||||||||||||||
|
Total
|
1,233 | 3.46 | 85 | 115,348 | $ | 39.90 | $ | 429 | ||||||||||||||||
|
12
Months Ended December 31, 2007 Operating Data
|
||||||||||||||||||||||||
|
Ore
Processed
(t000)
|
Feed
grade
(g/t)
|
Plant
Recovery
rate
(%)
|
Production
(ounces)
|
Cash
Operating
cost/t
|
Cash
Operating
cost/ounce
|
|||||||||||||||||||
|
Sabará
|
504 | 2.07 | 67 | 24,586 | $ | 22.70 | $ | 462 | ||||||||||||||||
|
Turmalina
|
347 | 5.1 | 87 | 45,527 | 42.80 | 283 | ||||||||||||||||||
|
Paciência
|
- | - | - | - | - | - | ||||||||||||||||||
|
Total
|
851 | 3.31 | 80 | 70,113 | $ | 30.90 | $ | 346 | ||||||||||||||||
The
Company’s operations, project development and exploration during the quarter and
year ended December 31, 2008 are described below.
Turmalina
Operations
Turmalina is an underground mine
utilizing the “sublevel stoping” and the “cut and fill” mining methods with
paste fill. Turmalina is currently processing 1,300 tonnes per day
(“tpd”) of ore in its carbon-in-pulp (“CIP”) plant, which is the designed
operating level.
4
JAGUAR
MINING INC.
MANAGEMENT’S
DISCUSSION AND ANALYSIS
(All
dollar amounts are expressed in U.S. dollars)
During
the quarter ended December 31, 2008, Turmalina produced 19,987 ounces of gold at
an average cash operating cost of $330 per ounce compared to 14,019 ounces at an
average cash operating cost of $346 per ounce during the quarter ended December
31, 2007. Mine production at Turmalina during the quarter totaled
126,777 tonnes at an average ROM grade of 6.01 grams per tonne. The
average ROM grade produced during December was 6.75 grams per
tonne. For the quarter ended December 31, 2008, the ore processed
through the mill totaled 128,438 tonnes at an average feed grade of 5.93 grams
per tonne and the average plant recovery rate was 89%, slightly below the design
rate of 90%.
During
the year ended December 31, 2008, Turmalina produced 72,785 ounces of gold at an
average cash operating cost of $364 per ounce compared to 45,527 ounces at an
average cash operating cost of $283 per ounce during the year ended December 31,
2007. Steps initiated by management during the second quarter of 2008
to limit mine dilution, which negatively impacted ore grades during the first
half of the year, have brought results back on plan during the second half of
2008. Turmalina mine production during the year totaled 497,122
tonnes at an average ROM grade of 5.31 grams per tonne. The ore
processed through the mill totaled 480,814 tonnes at an average feed grade of
5.46 grams per tonne. The average plant recovery rate was
88%.
Expansion
On September 11, 2008, the Company
filed the NI 43-101 compliant Turmalina Phase I Expansion feasibility study on
SEDAR, which added an estimated 1,265,802 tonnes at an average 3.12 grams per
tonne containing 127,000 ounces of proven and probable gold reserves to the
Turmalina reserve base.
As a result, the Company initiated the
first phase of a planned three-phase expansion program at the Turmalina
processing plant. In the current expansion, the Company intends to
increase gold production by 25% from its present design rate of approximately
80,000 ounces per year to 100,000 ounces per year. Earthwork for the
crushing and screening plant, grinding and milling plant and hydrometallurgical
plant has been completed. Detailed engineering is nearing completion
and civil works began during February 2009. The expansion is expected
to be completed during the third quarter of 2009.
Exploration
- - Brownfield
Jaguar’s reported mineral resources and
reserves for Turmalina are to a depth of approximately 500 meters where the
mineralized structure is open at depth and along strike. As part of a
recent drill program to prove the continuity of the mineralization at Ore Body A
to a depth of over 800 meters, Jaguar drilled four holes to depths ranging from
850 meters to 1,100 meters. Two of these drill holes intersected the
mineralized structure in the Ore Body A to a depth of approximately 800
meters. A grade of approximately 7.00 grams per tonne was encountered
in a narrow zone at depth thereby confirming the extension of the mineralized
structure. Jaguar’s team believes the size of the mineralized
structure and mineralization is similar to the existing reserve base in this ore
body to the depth of 500 meters. This is also consistent with the
characteristics of other gold mines in the Iron Quadrangle, some of which have
operated to depths of 2,400 meters. Jaguar intends to update the
inferred resources category at Turmalina but does not have any plans to conduct
further deep drilling at Turmalina at this time.
As
part of the surface exploration to estimate resource potential in a newly
discovered oxide zone at Ore Body B, several trenches were opened in the
outcropping to expose and sample the mineralized zone. Channel
samples revealed two separate mineralized areas with average surface grades
ranging from 3.00 grams per tonne to 5.00 grams per tonne. Jaguar’s
team intends to update the geological model to incorporate this new data into
the overall mine model. The oxide ore from this new zone would be
blended with sulfide ore and processed through the Turmalina Plant, providing
immediate additional lower cost ore.
At Ore Body C and Zone D, additional
gold bearing oxide ore has been identified in the weathered rock above the
sulfide zone. During 2008, the Company completed 11,698 meters of
drilling in 62 drill holes in the Satinoco structure to estimate oxide and
sulfide mineral resources. Jaguar expects to complete the resource
estimate by the third quarter of 2009.
Jaguar
has also discovered a new target at the Turmalina mining complex, the Fazenda
Experimental Target, which management believes has significant potential and is
unrelated to the mineralized on-strike zone associated with Ore Bodies A, B and
C and Zone D. The Fazenda Experimental Target is located
approximately five kilometres from the Turmalina Plant in a structure parallel
to the existing ore bodies and zones, where historic mining work at shallow
depths can be seen. Jaguar has conducted limited soil sampling, trenching and
other geo-chemical work in the area over the past two years.
5
JAGUAR
MINING INC.
MANAGEMENT’S
DISCUSSION AND ANALYSIS
(All
dollar amounts are expressed in U.S. dollars)
During
the third quarter of 2008, four drill holes totalling 716 meters were carried
out at Fazenda Experimental, which included 200 meters along
strike. Three drill holes intercepted mineralized
structures. Intersection grades varied from 2.9 grams per tonne to
6.5 grams per tonne at intervals of three meters or less. Additional
trenching has provided evidence that the continuity near the surface extends
well beyond areas where no drilling has taken place.
During
2009, Jaguar intends to conduct additional underground exploration as part of
the forward development of Turmalina’s Ore Bodies A, B and C, as well as in Zone
D and at the Fazenda Experimental Target to increase resources and reserves to
further expand Turmalina’s annual production beyond the current plan of 100,000
ounces.
Paciência
Operations
Paciência’s
Santa Isabel Mine is an underground mine utilizing the cut and fill mining
method and a treated tailings backfill system. Ore produced at the
Santa Isabel Mine is transported to the new 1,800 tpd CIP processing plant,
which was commissioned during the second quarter of 2008. On July 24,
2008, Paciência reported its first gold pour and operations at its processing
plant were deemed commercial during the latter part of the quarter ended
December 31, 2008 based on throughput rates.
During the quarter ended December
31, 2008, Paciência produced 13,423 ounces of gold at an average cash operating
cost of $413 per ounce. Mine production at Paciência totaled 114,785
tonnes at an average ROM grade of 3.29 grams per tonne, which includes 7,014
tonnes at an average grade of 5.43 grams per tonne from the Pilar
Mine. The ore processed through the mill totaled 146,666 tonnes at an
average feed grade of 3.43 grams per tonne. The average plant
recovery was on plan at 92%.
During the year ended December 31,
2008, Paciência produced 24,364 ounces of gold at an average cash operating cost
of $443 per ounce. Mine production, primarily at Paciência’s Santa
Isabel Mine and a small portion from the Pilar Mine, totaled 283,245 tonnes at
an average ROM grade of 3.29 grams per tonne. The ore processed
through the mill totaled 277,431 tonnes at an average feed grade of 3.28 grams
per tonne. Management expects the ROM grade for the Santa Isabel Mine
will continue to rise during 2009. The average plant recovery was 92%
for the year ended December 31, 2008.
As
of March 23, 2009, mining rates at the Santa Isabel Mine are at design levels
required to feed the processing plant.
Exploration
- - Brownfield
During the year ended December 31,
2008, the Company conducted extensive underground development and exploration
activities at the NW01 Target (Marzagão), the Conglomerates Target (Palmital)
and other targets in the area to add additional tonnes of ore both vertically
and horizontally in an effort to increase the resource base for the Paciência
operation. As part of the exploration program, a total of 12,814
meters totaling 64 drill holes were carried out during 2008.
Grades
observed at the NW01 Target are similar to those measured at the Santa Isabel
Mine.The new access ramp, which is 5 meters x 5 meters in size, was completed
early in 2008. A total of 1,191 meters of ramp and drifts have been
developed toward the Santa Isabel Mine located two kilometers to the south of
the NW01 portal. This cross cut will eventually intersect the second
level of the Santa Isabel Mine. During this development, two new
mineralized zones were encountered. Channel samples were taken and
the Company decided to develop a drift across the zone. Management
believes blind ore shoots likely exist along the contiguous 20-kilometer
concession base. By extending the ramp to the second level of the
Santa Isabel Mine, the Company’s management expects to increase the tonnes of
ore per vertical meter that can be mined and processed along
strike.
The
mineralized zones are partially exposed, with approximately 30 meters in length
and 1 meter to 3 meters in width. Channel sampling in this area
confirms grades ranging from 1 gram per tonne to 10 grams per
tonne. The extension is open to the North West and the North
East. Drill holes from the surface indicate additional mineralized
zone. A drill hole from the area had high amounts of “free” gold and
a grade of 595 grams per tonne over 0.7 meters. The shape and other
characteristics of this structure suggest that other mineralized zones might be
located in the vicinity of the NW01 Target. Two surface rigs are
presently drilling in the South East extension of the drift with the objective
of intercepting these new zones.
6
JAGUAR
MINING INC.
MANAGEMENT’S
DISCUSSION AND ANALYSIS
(All
dollar amounts are expressed in U.S. dollars)
A
second zone of mineralization at Paciência, not related to the São Vicente
lineament where the Company has a resource and reserve base, is referred to as
the Conglomerates Target.The zone entails several concessions, which are located
approximately 12 kilometers east of the Paciência processing plant.The
property’s previous owners, the Anschutz Group and Western Mining, carried out
exploration campaigns between 1985 and 1990, which included underground
development and channel sampling, surface and underground diamond drilling and
geological mapping. Based on their efforts, a pre NI 43-101 gold
resource of approximately 110,000 ounces was estimated.
In
order to estimate the Conglomerates Target resources consistent with NI 43-101
standards, the Company conducted a 7,191 meter in-fill drilling program inside
this target zone that consisted of 30 drill holes. The Company also
opened a portal into the host rock and developed 60 meters of a 4 meter x 5
meter ramp, which was concrete lined. During 2008, Jaguar carried out
1,306 meters of ramp and drifts to reach levels one and two.
At
level one, the conglomerate layer was identified to extend over 100 meters,
confirming the grades and widths obtained through surface
drilling. At the exposed section, the mineralized conglomerate shows
thicknesses that vary from less than 1 meter to 2.5 meters and grades of up to
200 grams per tonne. Partial channel results in the drift already
defined a mineralized zone with an average grade of 6.8 grams per tonne over a
150 m2
conglomerate layer area.
The
development of exploration drifts in level one will continue to laterally expose
the conglomerate layer. Through additional drilling, the Company
expects to estimate the resource potential in one known 300-meter section and
trace the geometry of the conglomerate reef to depth. At level two,
further underground development is being carried out to provide access to the
mineralized zone for further in-fill drilling. The Company is
currently developing a new resource estimate and views this new structure as a
potential significant resource that will provide additional feed for the
Paciência processing plant.
Sabará
Operations
Sabará is an above ground mine from
which oxide ore is processed at a 1,500 tpd carbon-in-column (“CIC”)
plant.
During the quarter ended December 31,
2008, Sabará produced 4,506 ounces of gold at an average cash operating cost of
$641 per ounce compared to 6,444 ounces at an average cash operating cost of
$534 per ounce during the quarter ended December 31, 2007. Cash
operating costs in the quarter were primarily impacted by lower ore
grades. As planned, leaching operations were suspended during 2008
due to seasonal impact and will resume in April 2009.
During the year ended December 31,
2008, Sabará produced 18,199 ounces of gold at an average cash operating cost of
$667 per ounce compared to 24,586 ounces at an average cash operating cost of
$462 per ounce during the year ended December 31, 2007. Cash
operating costs during the year were primarily impacted by lower ore grades and
unfavorable exchange rates.
During the second half of 2008, the
Company initiated stripping operations at the Serra Paraíso mineralized zone and
its ore accounted for approximately 19% of the tonnage processed at the Sabará
Plant during the quarter. Management plans to further reduce mining
operations in Zone A at Sabará in early 2009 in favor of higher grade ore from
the Serra Paraíso mineralized zone. Production from the Sabará Plant
is expected to account for only approximately 10% of Jaguar’s total 2009
production. During 2008, due to its higher average operating cost,
Sabará production increased the Company’s overall average cash operating cost by
$45/oz. By blending the lower grade ore from Zone A with the higher
grade ore from Serra Paraíso, the Company expects to significantly reduce
average cash operating costs in 2009.
Exploration
- - Brownfield
In order to add oxide resources to feed
the Sabará Plant and thereby increase its mine life, the Company developed an
exploration program at Sabará and Caeté in a 15,000 hectare area. In
addition to the Serra Paraíso Target, which was mentioned above, the Company is
conducting channel sampling, soil geochemistry and trenching at three different
targets near the Sabará operations. Preliminary results of such
exploration identified new targets, which have given rise to a drill program
that began in the first quarter of 2009.
7
JAGUAR
MINING INC.
MANAGEMENT’S
DISCUSSION AND ANALYSIS
(All
dollar amounts are expressed in U.S. dollars)
Caeté
Project
Development
In
September 2008, the Company completed its NI 43-101 compliant feasibility study
on the Caeté Project, which includes the Roça Grande and Pilar
Mines. Based on the feasibility study, the Caeté Project processing
facilities will include crushing and grinding circuits followed by a gravity
separation circuit along with a leaching and CIP-ADR (carbon-in-pulp
adsorption/desorption/recovery) plant, which will process the sulfide
ore from Pilar and Roça Grande Mines and other nearby targets. This
new plant is expected to utilize much of the existing infrastructure of the
Company’s previously closed Caeté heap leach and CIC facility.The Company
intends to use a combination of "cut and fill" and "selective stoping" methods
at both mines, which contemplates a treated tailings backfill
system.
By
the end of the third quarter in 2008 all necessary permits and licenses for the
construction and commissioning phase had been received and Jaguar initiated
civil works for the milling and treatment circuits.However, in November 2008,
due to the retraction in gold prices, deteriorating financial markets and
declining equity values worldwide, including the gold sector, the Company
temporarily suspended development of the Caeté Project pending an assessment of
market conditions and the availability of capital to move the project
forward.
Consistent
with the decision to suspend the development of the Caeté Project, underground
work at the Roça Grande Mine was temporarily suspended; however, development at
the Pilar Mine continued. Beginning in December 2008, the Company
began transporting ore by truck from the Pilar Mine to the Paciência processing
plant to supplement the ore being supplied from Paciência’s Santa Isabel
Mine. The Company expects to continue this practice until such time
as the ore from the Pilar Mine can be processed at the future Caeté processing
plant.
In
March 2009, the Company raised Cdn.$86.3 million through a common share offering
and announced its decision to retake the Caeté Project. During March
2009, work to complete the Caeté Project was initiated. Earthwork for
the crushing and screening plant, grinding and milling plant and
hydrometallurgical plant has been completed. Detailed engineering is
underway and civil works are expected to begin in April 2009. The
Company plans to begin commissioning of the Caeté Plant during the third quarter
of 2010.
Exploration
- - Brownfield
As
part of the Company’s effort to identify and add to its gold resource base at
the Caeté Project, 75,000 meters of additional drilling are planned over the
next five years in the mineral properties identified to supply the Caeté
Plant. During 2008, Jaguar completed 31,500 meters of drilling for a
total of 92 drill holes in the exploration concessions that are part of the
Caeté Project, in support of completing feasibility studies during the year as
well as expanding the overall resource base.
Pedra
Branca Project
Exploration
- - Greenfield
In March 2007, Jaguar entered into a
joint venture agreement with Xstrata to explore the Pedra Branca Project in the
State of Ceará in northeastern Brazil. The Pedra Branca Project has
mineral rights to 37 concessions totaling approximately 159,000 acres in a
65-kilometer shear zone. The concessions are located in and around
municipal areas with good infrastructure.
Xstrata carried out a preliminary
exploration program that covered only 25 kilometers of the shear
zone. The program identified 10 kilometers of soil anomalies,
including two large anomalies referred to as Coelho and Mirador
Targets. For the most part, the mineralized formations uncovered by
Xstrata’s preliminary efforts are open along the extremity and lead both
companies’ geologists to believe the area has significant potential for gold
mineralization, which could include the presence of both oxide and sulfide
formations in large structures.
Jaguar is currently conducting a
comprehensive exploration program at the Pedra Branca Project, including
extensive geological mapping, drainage and soil geochemistry, detailing of zones
with anomalies, trenching and diamond drilling. During the third
quarter of 2007, Jaguar began a diamond drill program to test the continuity of
the mineralization at depth. To date, 93 drill holes totaling 8,974
meters have been completed.
8
JAGUAR
MINING INC.
MANAGEMENT’S
DISCUSSION AND ANALYSIS
(All
dollar amounts are expressed in U.S. dollars)
Mineral
Resources and Reserves
During 2008, the Company retained
TechnoMine to prepare feasibility studies for its Caeté Project and expansion of
the Turmalina operation. TechnoMine completed the NI 43-101 compliant
feasibility study technical reports on September 9, 2008 and September 15, 2008,
respectively.
TechnoMine completed the feasibility
studies and in concert with the Company reviewed the information and prepared a
table of mineral resources and reserves (the “September 2008
Review”). Ivan C. Machado, M.Sc., P.E., P.Eng. audited the September
2008 Review. Mr. Machado is a Qualified Person as such term is
defined in NI 43-101.
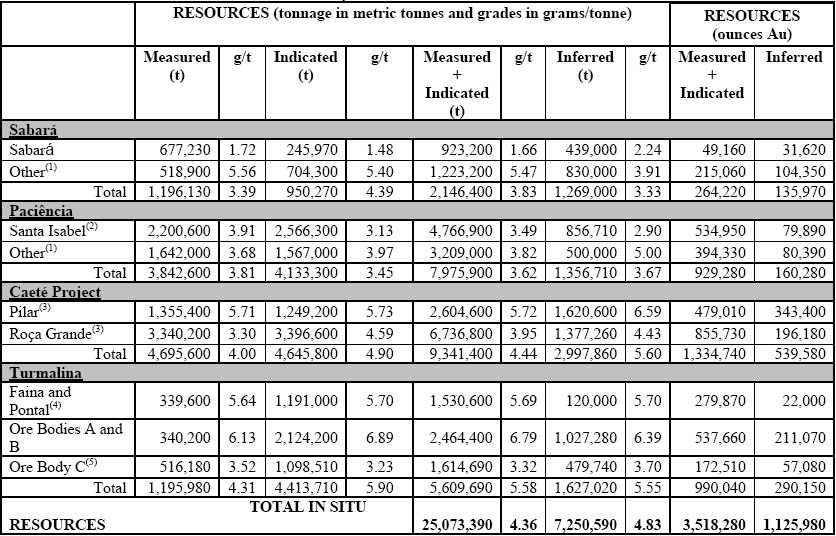
Based on the September 2008 Review, the
Company reported (i) measured and indicated resources of 23,095,210 tonnes with
an average grade of 4.74 grams per tonne containing 3,517,860 ounces of gold and
(ii) 6,704,750 tonnes of inferred resources with an average grade of 5.15 grams
per tonne containing 1,109,030 ounces of gold. The Company’s proven
and probable mineral reserves, which are included in the measured and indicated
mineral resource figure above, were 13,510,470 tonnes with an average grade of
4.69 grams per tonne containing 2,033,620 ounces of gold. The figures
reported in the September 2008 Review did not consider 2007 and 2008 production
from the Turmalina operations and a small test mining production at Paciência in
2006.
In consideration of the significant
improvement in global gold prices, the Company and TechnoMine redefined the
design criteria to reflect stronger gold markets and completed a review of
resources and reserves during the first quarter of 2009. Based on the
review Jaguar’s mineral resources are the following as of December 31, 2008 (i)
measured and indicated resources of 25,073,390 tonnes with an average grade of
4.36 grams per tonne containing 3,518,280 ounces of gold and (ii) 7,250,590
tonnes of inferred resources with an average grade of 4.83 grams per tonne
containing 1,125,980 ounces of gold. Jaguar’s proven and probable
mineral reserves, which are included in the measured and indicated mineral
resource figure above, are 14,904,840 tonnes with an average grade of 4.16 grams
per tonne containing 1,993,550 ounces of gold.
See
below detailed tables of Jaguar’s mineral resources and reserves as at December
31, 2008.
Table
1 - Summary of Estimated Mineral Resources*
9
JAGUAR
MINING INC.
MANAGEMENT’S
DISCUSSION AND ANALYSIS
(All
dollar amounts are expressed in U.S. dollars)
Table
2 - Summary of Estimated Mineral Reserves*
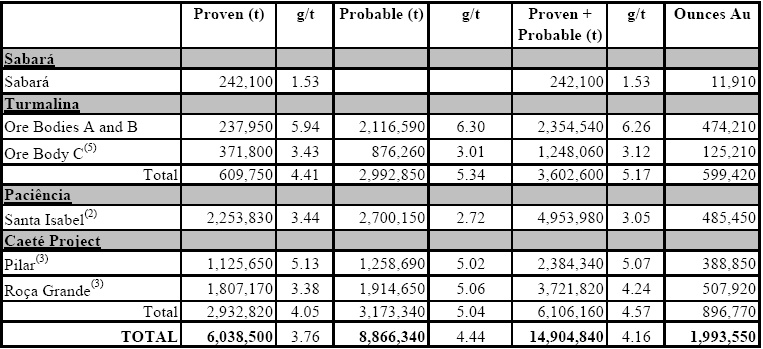
*Mineral
resources listed in Table 1 include mineral reserves listed in Table 2. Totals
reflect depletion from production through December 31, 2008. Some
columns and rows may not total due to rounding.
(1)
TechnoMine NI 43-101 Technical Report on the Quadrilátero Gold Project filed on
SEDAR on December 20, 2004.
|
(2)
TechnoMine NI 43-101 Technical Report on the Paciência Gold Project Sta.
Isabel Mine filed on SEDAR on August 9,
2007.
|
(3)
TechnoMine NI 43-101 Technical Report on the Caeté Gold Project filed on SEDAR
on September 17, 2008.
(4)
TechnoMine NI 43-101 Technical Report on the Turmalina Gold Project filed on
SEDAR on December 20, 2004.
(5)
TechnoMine NI 43-101 Technical Report on the Turmalina
Expansion filed on SEDAR on September 11, 2008.
Although
the Company has carefully prepared and verified the mineral resource and reserve
figures presented herein, such figures are estimates, which are, in part, based
on forward-looking information, and no assurance can be given that the indicated
level of gold will be produced. Estimated reserves may have to be
recalculated based on actual production experience. Market price
fluctuations of gold as well as increased production costs or reduced recovery
rates, and other factors may render the present proven and probable reserves
unprofitable to develop at a particular site or sites for periods of
time. See the "CAUTIONARY NOTE REGARDING FORWARD LOOKING STATEMENTS"
and "RISK FACTORS" as filed in the Company’s Annual Information Form for the
year ended December 31, 2008 filed on SEDAR and available at www.sedar.com, and its filings,
including the Company's Annual Report on Form 40-F for the year ended December
31, 2008, filed with the U.S. Securities and Exchange Commission, which are
available at www.sec.gov on
EDGAR.
FINANCIAL
REVIEW
During the quarter ended December 31,
2008, the market price of gold (London PM fix) traded in a range of
$713 to $904, and averaged $795. This was approximately 1% higher
than the average price for the quarter ended December 31, 2007. The
average market price of gold for the year ended December 31, 2008 was $872,
which is 25% higher than the average price for the same period in
2007. The price performance of gold was marked with high levels of
volatility. Gold has continued to be influenced by interest rate cuts,
volatility in the credit and financial markets, investment demand and inflation
expectations. A 10% change in the average market price of gold during
the quarter ended and year ended December 31, 2008 would have changed income
before income taxes by approximately $3.0 million and $10.1 million
respectively.
The Company reports its financial
statements in US dollars (“US$”), however a significant portion of the Company's
expenses are incurred in either Canadian dollars (“Cdn.$”) or Brazilian reais
(“R$”). The strengthening in the average rates of exchange for the
US$ caused the Company’s costs reported in US$ to decrease for the quarter ended
December 31, 2008. The average rates of exchange for the Cdn.$ per
US$1.00 for the quarter ended December 31, 2008 and the quarter ended December
31, 2007 were 1.21 and 0.98 respectively. The average rates of
exchange for the R$ per US$1.00 for the quarter ended December 31, 2008 and the
quarter ended December 31, 2007 were 2.28 and 1.78 respectively. The
impact of a weaker R$ during the fourth quarter of 2008 was not fully reflected
in the Company’s cash operating costs during the period, however, the Company
expects 2009 cash operating costs will be impacted as the R$ has remained weak
compared to the US$. A 10%change in the average rates of exchange
during the quarter ended December 31, 2008 would have changed operating income
by approximately $4.0 million.
10
JAGUAR
MINING INC.
MANAGEMENT’S
DISCUSSION AND ANALYSIS
(All
dollar amounts are expressed in U.S. dollars)
Summary
of Quarterly Results
The following chart summarizes the
Company’s quarterly results of operations for the previous eight
quarters:
|
Three
Months Ended
|
||||||||||||||||||||||||||||||||
|
(unaudited)
|
31-Dec
|
30-Sep
|
30-Jun
|
31-Mar
|
31-Dec
|
30-Sep
|
30-Jun
|
31-Mar
|
||||||||||||||||||||||||
|
($
in 000s, except per share amounts)
|
2008
|
2008
|
2008
|
2008
|
2007
|
2007
|
2007
|
2007
|
||||||||||||||||||||||||
|
Net
sales
|
$ | 27,874 | $ | 25,799 | $ | 21,187 | $ | 18,797 | $ | 14,915 | $ | 14,962 | $ | 11,415 | $ | 6,542 | ||||||||||||||||
|
Net
income (loss)
|
(3,443 | ) | (1,301 | ) | (351 | ) | 839 | (14,825 | ) | (8,654 | ) | (3,685 | ) | (496 | ) | |||||||||||||||||
|
Basic
and diluted income (loss) per share
|
(0.05 | ) | (0.02 | ) | (0.01 | ) | 0.01 | (0.28 | ) | (0.16 | ) | (0.07 | ) | (0.01 | ) | |||||||||||||||||
Net sales over the periods shown above
generally trended higher due to both an increase in ounces of gold sold and an
increase in the average realized gold price.
Summary
of Key Operating Results
|
Three
Months Ended
|
Year
Ended
|
|||||||||||||||
|
December
31
|
December
31
|
|||||||||||||||
|
2008
|
2007
|
2008
|
2007
|
|||||||||||||
|
(unaudited)
|
||||||||||||||||
|
($
in 000s, except per share amounts and shares outstanding)
|
||||||||||||||||
|
Gold
sales
|
27,874 | 14,915 | 93,657 | 47,834 | ||||||||||||
|
Ounces
sold
|
35,138 | 18,742 | 108,944 | 67,350 | ||||||||||||
|
Average
sales price $ / ounce
|
793 | 796 | 860 | 710 | ||||||||||||
|
Gross
profit
|
7,103 | 4,007 | 27,354 | 14,289 | ||||||||||||
|
Net
income (loss)
|
(3,443 | ) | (14,825 | ) | (4,256 | ) | (27,660 | ) | ||||||||
|
Basic
and diluted earnings (loss) per share
|
(0.05 | ) | (0.28 | ) | (0.07 | ) | (0.52 | ) | ||||||||
|
Weighted
avg. # of shares outstanding - basic
|
63,982,281 | 55,494,155 | 62,908,676 | 53,613,175 | ||||||||||||
|
Weighted
avg. # of shares outstanding - diluted
|
63,982,281 | 55,494,155 | 62,908,676 | 53,613,175 | ||||||||||||
Quarter
and Year to Date ended December 31, 2008 compared to December 31,
2007
Sales in the quarter ended December 31,
2008 increased $13.0 million or 87% from the quarter ended December 31, 2007,
due to an increase in ounces of gold sold. The number of ounces of
gold sold increased 87% to 35,138 ounces in the quarter ended December 31, 2008
compared to 18,742 ounces in the quarter ended December 31, 2007. The
average realized gold price decreased to $793 per ounce from $796 per ounce in
the same quarter last year.
Sales for the year ended December 31,
2008 increased $45.8 million or 96% compared to the year ended December 31, 2007
due to both an increase of ounces of gold sold and an increase in the average
realized gold price. The number of ounces of gold sold increased 62%
to 108,944 in the year ended December 31, 2008 compared to 67,350 ounces in the
year ended December 31, 2007. The average realized gold price increased to $860
in the year ended December 31, 2008 per ounce from $710 per ounce in the year
ended December 31, 2007.
Gross profit for the quarter ended
December 31, 2008 increased to $7.1 million from $4.0 million for the quarter
ended December 31, 2007. For the year ended December 31, 2008 gross
profit increased to $27.4 million from $14.3 million for the same period in 2007
due primarily to the increase in sales. The Company recognized net losses of
$3.4 million and $14.8 million for the quarters ended December 31, 2008 and 2007
respectively. For the year ended December 31, 2008 the Company
recognized net losses $4.3 million versus a net loss of $27.7 million for the
same period in 2007.
[The
remainder of this page has been left intentionally blank]
11
JAGUAR
MINING INC.
MANAGEMENT’S
DISCUSSION AND ANALYSIS
(All
dollar amounts are expressed in U.S. dollars)
Review
of Certain Operating Expenses and Other Income and Expenses
|
Three
Months Ended
|
Year
Ended
|
|||||||||||||||
|
December
31
|
December
31
|
|||||||||||||||
|
2008
|
2007
|
2008
|
2007
|
|||||||||||||
|
(unaudited)
|
||||||||||||||||
|
($
in 000s)
|
||||||||||||||||
|
Stock
based compensation
|
564 | 5,899 | 1,262 | 10,750 | ||||||||||||
|
Administration
|
3,249 | 2,657 | 12,571 | 9,617 | ||||||||||||
|
Forward
derivative loss
|
- | 3,820 | 318 | 9,908 | ||||||||||||
|
Forward
fx derivative loss (gain)
|
2,718 | (966 | ) | 2,623 | (3,690 | ) | ||||||||||
|
Foreign
exchange loss (gain)
|
272 | (130 | ) | (2,477 | ) | (2,280 | ) | |||||||||
|
Interest
expense
|
1,493 | 3,523 | 11,584 | 11,170 | ||||||||||||
|
Interest
income
|
(391 | ) | (1,373 | ) | (3,850 | ) | (4,601 | ) | ||||||||
Stock
based compensation expense varies depending upon when stock options, deferred
share units, restricted share units, and stock appreciation rights
vest.
Administration costs increased from
$2.7 million during the quarter ended December 31, 2007 to $3.2 million during
the quarter ended December 31, 2008 and increased from $9.6 million during the
year ended December 31, 2007 to $12.6 million for the same period in
2008. The annual increase was mainly due to costs for legal and
accounting including those associated with first time compliance with the
Sarbanes Oxley Act. In addition, costs increased due to the strengthening of the
R$ against the US$. The average exchange rate for the year ended
December 31, 2008 was R$1.84 per US$1.00 compared to R$1.95 per US$1.00 for the
year ended December 31, 2007. The Company’s administration costs are
generally in-line with other South American gold producers on a unit of
production basis and are viewed by management as appropriate to achieve the
Company’s growth targets.
During
the quarter ended December 31, 2007, the Company recognized a loss of $3.8
million on forward derivative contracts the Company purchased as required by the
lender for the Turmalina loan facility to manage the commodity price exposure on
gold sales. Losses of $318,000 and $9.9 million were recognized in
the year ended December 31, 2008 and 2007 respectively associated with increases
in the price of gold. During the quarter ended March 31, 2008, the Company
closed the forward sales and forward purchase contracts. (See Risk Management
Policies - Hedging).
The
Company recognized an unrealized loss of $1.6 million for the quarter ended
December 31, 2008 versus an unrealized loss of $472,000 for the quarter ended
December 31, 2007 on forward foreign exchange contracts used to manage currency
exposure on the R$. The Company also recognized a realized loss of
$1.1 million for the quarter ended December 31, 2008 versus a realized gain $1.4
million for the quarter ended December 31, 2007 on forward foreign exchange
contracts. For the year ended December 31, 2008 the Company
recognized an unrealized loss of $4.1 million and a realized gain of $1.5
million compared to an unrealized gain of $1.0 million and a realized gain of
$2.7 million for the year ended December 31, 2007. (See Risk
Management Policies - Hedging).
Foreign
exchange loss of $272,000 was recognized during the quarter ended December 31,
2008 (gain of $2.5 million for the year ended December 31, 2008) versus a gain
of $130,000 during the quarter ended December 31, 2007 (gain of $2.3 million for
the year ended December 31, 2007) primarily due to volatility of the R$ and
Cdn.$. During the quarter ended December 31, 2008, foreign exchange
losses were incurred in Cdn.$ cash on hand held in Canada and R$ taxes which are
recoverable from the Brazilian tax authorities. These are offset by
foreign exchange gains incurred by the Cdn.$ private placement notes and R$
based notes payable in Brazil. The foreign exchange gains and losses are due to
changes in the R$ and Cdn.$ versus the US$.
Interest
expense decreased from $3.5 million during the quarter ended December 31, 2007
to $1.5 million during the quarter ended December 31, 2008. The change was due
to a decrease in debt. The Company repaid the loan facility held by the lender
on March 13, 2008. (See Note 10(e) to our 2008 annual financial
statements.) For the year ended December 31, 2008 interest expense
increased to $11.6 million from $11.2 million for the same period in 2007
primarily due to the write-off of debt issuance costs relating to the repayment
of the loan facility held by the lender on March 13, 2008 and the interest
incurred on the private placement notes issued on March 22, 2007.
12
JAGUAR
MINING INC.
MANAGEMENT’S
DISCUSSION AND ANALYSIS
(All
dollar amounts are expressed in U.S. dollars)
Interest
income decreased from $1.4 million during the quarter ended December 31, 2007 to
$391,000 during the quarter ended December 31, 2008. Interest income decreased
from $4.6 million for the year ended December 31, 2007 to $3.9 million for the
year ended December 31, 2008. Interest income was earned on deposits held in
banks in Canada, the U.S. and Brazil.
FINANCIAL
CONDITION, CASH FLOW, LIQUIDITY AND CAPITAL RESOURCES
Cash
Flow Highlights
($
in 000s)
|
Three
Months Ended
|
Year
Ended
|
|||||||||||||||
|
December
31
|
December
31
|
|||||||||||||||
|
2008
|
2007
|
2008
|
2007
|
|||||||||||||
|
Operating
activities
|
(5,537 | ) | 3,913 | (1,410 | ) | 1,457 | ||||||||||
|
Financing
activities
|
(1,701 | ) | 61 | 70,112 | 89,492 | |||||||||||
|
Investing
activities
|
(13,906 | ) | (23,134 | ) | (89,297 | ) | (63,092 | ) | ||||||||
|
Effect
of foreign exchange on non-U.S. dollar denominated cash and cash
equivalents
|
608 | (2,175 | ) | (4,556 | ) | 3,095 | ||||||||||
|
Increase
(decrease) in cash for the period
|
(20,536 | ) | (21,335 | ) | (25,151 | ) | 30,952 | |||||||||
|
Beginning
cash balance
|
41,096 | 67,046 | 45,711 | 14,759 | ||||||||||||
|
Ending
cash balance1
|
20,560 | 45,711 | 20,560 | 45,711 | ||||||||||||
1Cash
balance excludes $3.1 million of restricted cash on December 31, 2008 and $3.1
million on December 31, 2007.
At December 31, 2008 and December 31,
2007, the Company had cash and cash equivalents of $20.6 million and $45.7
million, respectively.
Cash flow from operating activities
consumed $5.5 million of cash during the quarter ended December 31, 2008 versus
cash generated of $3.9 million during the quarter ended December 31,
2007. Cash flow from operations consumed $1.4 million of cash during
the year ended December 31, 2008 versus cash generated of $1.5 million for the
same period in 2007.
Financing activities consumed $1.7
million of cash during the quarter ended December 31, 2008 primarily for $1.6
million repayment of debt; and generated $61,000 during the same period in
2007. During the year ended December 31, 2008 financing activities
generated $70.1 million, primarily as a result of an equity financing in
February 2008 that generated gross proceeds of Cdn$110.6 million ($109.6
million). During the year ended December 31, 2007 financing
activities generated $89.5 million. During March 2007 an early
exercise program for listed warrants generated $18.8 million and a private
placement of units generated gross proceeds of Cdn.$ 86.3 million ($74.5
million). (See Notes 10(g) and 13(b) to the 2008 annual financial
statements)
Investing activities consumed $13.9
million of cash during the quarter ended December 31, 2008 ($89.3 million for
the year ended December 31, 2008) versus $23.1 million for the quarter ended
December 31, 2007 ($63.1 million for the year ended December 31,
2007). The funds were used for mineral exploration, projects under
development and the purchase of property, plant and equipment.
The effect of foreign exchange on
non-US$ denominated cash and cash equivalents was a $0.6 million gain during the
quarter ended December 31, 2008 (quarter ended December 31, 2007 - $2.2 million
loss). For the year ended December 31, 2008 the effect of foreign exchange on
the non-US$ denominated cash and cash equivalents was a $4.6 million loss versus
a $3.1 million gain for the same period in 2007. This reflects the
changes of the R$ and Cdn.$ versus the US$.
[The
remainder of this page has been left intentionally blank]
13
JAGUAR
MINING INC.
MANAGEMENT’S
DISCUSSION AND ANALYSIS
(All
dollar amounts are expressed in U.S. dollars)
Cash
Requirements - 2008 Capital Spending Program
($
in 000s)
|
Three
Months Ended December 31, 2008
|
Year
Ended
December
31, 2008
|
Estimate
for
2009
|
||||||||||
|
Sabará
|
$ | 343 | $ | 808 | $ | 407 | ||||||
|
Caeté
Project
|
2,307 | 26,140 | 24,574 | |||||||||
|
Turmalina
|
3,790 | 18,530 | 21,122 | |||||||||
|
Paciência
|
4,329 | 36,774 | 17,416 | |||||||||
|
Other
Spending 1
|
3,137 | 14,802 | 7,997 | |||||||||
|
Total
capital spending
|
$ | 13,906 | $ | 97,054 | $ | 71,516 | ||||||
|
1Includes
construction of the central spare parts room, purchase of maintenance
equipment, other improvements, replacements and head office spending.
|
The Company believes that its cash held
in accounts and cash flow generated by operations will be sufficient to finance
existing operations and fund other cash requirements for 2009.
Total
Capital Spending during the Period
($
in 000s)
|
Three
Months Ended
December
31, 2008
|
Year
Ended
December
31, 2008
|
|||||||
|
Capital
spending - excluding exploration
|
$ | 8,069 | $ | 60,984 | ||||
|
Capital
spending - exploration
|
5,837 | 36,070 | ||||||
|
Total
capital spending
|
$ | 13,906 | $ | 97,054 | ||||
|
Amount
paid in cash
|
$ | 13,906 | $ | 89,297 | ||||
|
Amount
financed
|
- | 7,757 | ||||||
|
Total
capital spending
|
$ | 13,906 | $ | 97,054 | ||||
The
Company has identified four primary uses of capital during
2009. These include:
(a) mine
development and processing capacity for the Caeté Project
(b) expansion
at the Turmalina operation
(c) exploration
at brownfield properties in the Iron Quadrangle
(d) sustaining
capital to maintain existing operations
[The
remainder of this page has been left intentionally blank]
14
JAGUAR
MINING INC.
MANAGEMENT’S
DISCUSSION AND ANALYSIS
(All
dollar amounts are expressed in U.S. dollars)
Contractual
Obligations
The Company’s contractual obligations
as at December 31, 2008 are summarized as follows ($ in 000s):
|
Less
than
1
year
|
1
-3 years
|
3
- 5 years
|
More
than
5
years
|
Total
|
||||||||||||||||
|
Contractual
Obligations
|
||||||||||||||||||||
|
Notes
Payable
|
||||||||||||||||||||
|
Principal
|
$ | 4,680 | $ | 10,588 | $ | 70,431 | - | 85,699 | ||||||||||||
|
Interest
|
7,528 | 14,842 | 1,682 | - | 24,052 | |||||||||||||||
|
Capital
Lease
|
- | - | - | - | - | |||||||||||||||
|
Operating
Lease Agreements
|
191 | 180 | - | - | 371 | |||||||||||||||
|
Management
Agreements1
|
||||||||||||||||||||
|
Operations
|
1,093 | 398 | - | - | 1,491 | |||||||||||||||
|
Suppliers
Agreements
|
||||||||||||||||||||
|
Mine
Operations2
|
273 | - | - | - | 273 | |||||||||||||||
|
Drilling3
|
94 | - | - | - | 94 | |||||||||||||||
|
Asset
Retirement Obligations4
|
630 | 565 | 5,402 | 3,497 | 10,094 | |||||||||||||||
|
Joint
Venture Agreement5
|
- | 729 | - | - | 729 | |||||||||||||||
|
Total
|
$ | 14,489 | $ | 27,302 | $ | 77,515 | $ | 3,497 | $ | 122,803 | ||||||||||
|
1The
term of the management agreements are one to two years. (See
Note 16(a) to the Company's 2008 annual financial
statements.)
|
|
2The
Company has the right to cancel the mine operations contract with 60 days
advance notice. The amount included in the contractual
obligations table represents the amount due within 60
days.
|
|
3The
Company has the right to cancel the drilling contract with 30 days advance
notice. The amount included in the contractual obligations
table represents the amount due within 30
days.
|
|
4T he
asset retirement obligations are not adjusted for inflation and are not
discounted.
|
|
5The
Company entered into a formal agreement with Xstrata for the Company to
explore the Pedra Branca Gold Project in Ceará, Brazil (See Note 19(e) to
the Company's 2008 annual financial
statements).
|
|
Balance
Sheet Highlights
|
($
in 000s)
|
December
31
|
||||||||
|
2008
|
2007
|
|||||||
|
Current
assets
|
$ | 45,857 | $ | 71,773 | ||||
|
Long
term assets
|
257,977 | 162,458 | ||||||
|
Total
assets
|
$ | 303,834 | $ | 234,231 | ||||
|
Current
liabilities
|
$ | 30,119 | $ | 38,324 | ||||
|
Long
term liabilities
|
76,991 | 94,388 | ||||||
|
Total
liabilities
|
$ | 107,110 | $ | 132,712 | ||||
Working capital decreased $17.7
million from $33.4 million at December 31, 2007 to $15.7 million at December 31,
2008 primarily due to a decrease in current assets which is offset with a
decrease to current liabilities.
On February 21, 2008, the Company
completed the equity financing referred in the Cash Flow Highlights section
for gross proceeds of Cdn.$110.6 million ($109.6 million) (see Note 13(a)(i) to
the Company's 2008 annual financial statements December 31, 2008). The proceeds
of the offering were used primarily to fund capital expenditures for exploration
and expansion at the Company’s three largest projects in Brazil, to close
forward sales contracts and repay project financing term debt and for general
corporate purposes.
15
JAGUAR
MINING INC.
MANAGEMENT’S
DISCUSSION AND ANALYSIS
(All
dollar amounts are expressed in U.S. dollars)
On
March 22, 2007, the Company issued private placement notes for gross proceeds of
Cdn.$86.3 million ($74.5 million) bearing a coupon of 10.5%, payable
semi-annually in arrears. (See Note 10(g) to the Company's 2008 annual financial
statements.)
Risk
Management Policies - Hedging
Forward
Gold Sales and Purchase Contracts - Derivative Financial
Instruments
During the quarter ended March 31,
2008, the Company paid the lender $22.1 million to close the forward sales
contracts. At December 31, 2007, forward sales contracts for 48,556
ounces were outstanding, which were to be settled at $527.10 at the end of each
quarter over the term of the contracts.
During the quarter ended March 31,
2008, the Company closed the forward purchase contracts, realizing a gain of
$7.4 million, effectively reducing the net loss on the forward contracts to
$14.8 million, of which $14.5 million was accrued at December 31,
2007. At December 31, 2007 forward purchase contracts for 48,556
ounces were outstanding at an average cost of $823.81 per ounce.
With these transactions the Company has
no forward gold production hedged.
Forward
Foreign Exchange Contracts - Derivative Financial Instruments
The Company manages its exposure to
changes in foreign exchange rates through the use of forward foreign exchange
contracts to hedge certain future transactions denominated in foreign
currencies. The Company hedges anticipated but not yet committed foreign
currency transactions when they are probable and the significant characteristics
and expected terms are identified.
As
at December 31, 2008, the Company has forward foreign exchange contracts to
purchase R$ at a weighted average rate of 1.87 as follows:
|
Settlement
Date
|
Amount
in
thousands
of US$
|
Settlement
amount
in
thousands of R$
|
|
28-Jan-09
|
$1,000,000
|
R$
1,882,500
|
|
30-Jan-09
|
1,000,000
|
1,785,000
|
|
25-Feb-09
|
1,000,000
|
1,892,500
|
|
27-Feb-09
|
1,000,000
|
1,795,000
|
|
31-Mar-09
|
1,000,000
|
1,805,200
|
|
31-Mar-09
|
1,000,000
|
1,807,500
|
|
30-Apr-09
|
1,000,000
|
1,842,000
|
|
30-Apr-09
|
1,000,000
|
2,004,000
|
|
29-May-09
|
1,000,000
|
1,860,000
|
|
29-May-09
|
1,000,000
|
2,050,000
|
|
30-Jun-09
|
1,000,000
|
1,880,000
|
|
$
11,000,000
|
R$
20,603,700
|
The terms of the contract require a
percentage of the funds to be held on deposit as collateral to cover the
contracts. At December 31, 2008 and 2007, $3.0 million of
cash was restricted for this purpose.
The
R$ weakened 20% versus the US$ during the three months ended December 31,
2008. At December 31, 2008, current liabilities include $2.4 million
of unrealized foreign exchange losses. At December 31, 2007 current
assets include $1.7 million of unrealized foreign exchange
gains. Included in the statement of operations are the following
amounts of unrealized and realized gains or losses on foreign exchange
derivatives:
16
JAGUAR
MINING INC.
MANAGEMENT’S
DISCUSSION AND ANALYSIS
(All
dollar amounts are expressed in U.S. dollars)
|
Three
Months Ended
|
Year
Ended
|
|||||||||||||||
|
December
31
|
December
31
|
|||||||||||||||
|
2008
|
2007
|
2008
|
2007
|
|||||||||||||
|
Unrealized
loss (gain)
|
$ | 1,643 | $ | 472 | $ | 4,099 | $ | (972 | ) | |||||||
|
Realized
loss (gain)
|
1,075 | (1,438 | ) | (1,476 | ) | (2,718 | ) | |||||||||
|
Total
|
$ | 2,718 | $ | (966 | ) | $ | 2,623 | $ | (3,690 | ) | ||||||
The forward exchange contracts are
considered derivative financial instruments and are used for risk management
purposes and not for generating trading profits. The Company closely
monitors exchange rates and, as deemed appropriate by management, will continue
to enter into forward currency contracts with the aim of minimizing adverse
changes in the R$ and US$ relationship.
The Company is exposed to
credit-related losses in the event of non-performance by the major international
financial institution handling the derivative financial instruments, but does
not expect this highly rated counterparty to fail to meet its
obligations.
This derivative financial instrument is
not accounted for as a hedge. The unrealized gains and losses will be
recognized in the operating income of the Company and are a result of the
difference between the spot price of the R$ and the forward currency contract
price as at the balance sheet date.
Off-Balance
Sheet Arrangements
The Company does not have any
off-balance sheet investment or debt arrangements.
INCOME
TAXES
The Company recorded an income tax
expense of $4.5 million for the year. This compares to a tax expense of $5.2
million for 2007 and $0.3 million for 2006. The current year income tax
provision reflects a current income tax expense of $6.2 million for 2008 and a
future income tax recovery of $1.6 million. This compares to a current income
tax expense of $3.5 million for 2007 and $0.6 million for 2006 and a future tax
expense of $1.7 million for 2007 and a future tax recovery of $0.3 million for
2006. The income tax expense reflects the current taxes incurred in
Brazil. The Company maintains net operating losses (“NOLs”) which can
be applied to future periods. The expense is reduced by the
recognition of NOL tax losses available to be used against future incomes taxes
payable in Brazil and the reversal of the future tax liability on intercompany
loans.
The consolidated balance sheet reflects
a future tax asset of $nil for 2008 and a future income tax liability of $2.2
million for 2007.
The Company has approximately $17.6
million of tax losses available for carry forward in Canada and $11.5 million of
tax losses available for carry forward in Brazil.
The Company is subject to income taxes
in both Canada and Brazil. The taxation in these jurisdictions is subject to
uncertainty and carries risk of additional taxes being assessed to the Company
because of changes in interpretations and application of tax laws, amendments to
the tax laws, and the introduction of new taxes. (See Note 12 to the Company's
2008 annual financial statements.)
NORMAL
COURSE ISSUER BID
In November 2008, the Company received
approval from the TSX for a third normal course issuer bid to purchase up to the
lesser of 3,119,114 common shares, being 5% of the issued and outstanding common
shares of the Company at that time, or the number of common shares equal to a
maximum aggregate purchase price of Cdn.$7.0 million. The normal course issuer
bid commenced on November 13, 2008 and will terminate on November 12, 2009, or
on such earlier date as the Company may complete its purchases under the bid. No
shares were purchased during the fourth quarter of 2008 or through March 23,
2009.
17
JAGUAR
MINING INC.
MANAGEMENT’S
DISCUSSION AND ANALYSIS
(All
dollar amounts are expressed in U.S. dollars)
In August 2007, the Company received
approval from the TSX for a second normal course issuer bid to purchase up to
the lesser of 2,760,224 common shares, being 5% of the issued and outstanding
common shares of the Company at that time, or the number of common shares equal
to a maximum aggregate purchase price of Cdn.$5.25 million. The
normal course issuer bid commenced on August 30, 2007 and terminated on August
29, 2008. In June 2008, the Company received approval from the TSX
for an amendment to the second normal course issuer bid to purchase additional
shares up to the lesser of 2,242,924 common shares, or the number of common
shares equal to the maximum aggregate purchase price of Cdn.$10.0
million. During the course of the second normal course issuer bid,
the Company purchased a total of 821,300 common shares at an average price of
Cdn$9.97. These shares have been cancelled.
The Company decided to engage in a
normal course issuer bid because it believes that, from time to time, the market
price of its common shares may not reflect fully the underlying value of its
business and future business prospects. In such circumstances, the
Company believes the outstanding common shares represent an attractive
investment, since a portion of the Company’s excess cash can be invested for an
attractive risk adjusted return on capital through its bid.
RELATED
PARTY TRANSACTIONS
The Company incurred management fees of
$719,000 for the year ended December 31, 2008 ($747,000 for the year ended
December 31, 2007) from IMS Engenharia Mineral Ltda ("IMS"), a company held by
several officers of the Company, which provides operating services to the
Company's Brazilian subsidiaries.
The Company incurred occupancy fees of
$180,000 for the year ended December 31, 2008 ($120,000 for the year ended
December 31, 2007) to Brazilian Resources, Inc. (“BZI”), a corporate
shareholder, for use of administrative offices. The Company moved to
new administrative office space in December 2007. The term of the
agreement is three years beginning on the date of occupancy.
The Company also incurred consulting
fees and administrative service charges of $344,000 from BZI for the year ended
December 31, 2008 ($450,000 for the year ended December 31, 2007). At
December 31, 2008 accounts payable and accrued liabilities includes $39,000 for
consulting fees. At December 31, 2007 prepaid expenses and sundry assets
includes a prepaid expense of $101,000 to BZI. The occupancy costs,
consulting fees and administrative service fees are included in the statement of
operations.
The Company recognized rental income of
$9,000 from Prometálica Mineração Ltda (“PML”) and $34,000 from Prometálica
Centro Oeste Mineração Ltda (“PCO”) for the year ended December 31, 2008
($192,000 from PML and $126,000 from PCO for the year ended December 31, 2007)
for providing temporarily idle equipment and use of administrative offices.
PML’s controlling shareholders are BZI and IMS, the founding shareholders of the
Company. PCO is controlled by IMS, a founding shareholder of the
Company. As at December 31, 2008 prepaid expenses and sundry assets
includes $nil receivable from PML, and $12,000 from PCO (2007 - $149,000 from
PML and $36,000 from PCO). During the year ended December 31, 2008
the Company also received approximately $30,000 ($0.3 million for the same
period in 2007) of royalty income relating to the NSR.
On August 11, 2008, PML filed a
judicial restructuring in Belo Horizonte, state of Minas Gerais, Brazil. At this
time the financial impact of this action is indeterminate. Prior to
the filing, the primary shareholders of PML, BZI and IMS, provided a guarantee
of PML’s obligation to Mineração Serras do Oeste Ltda (“MSOL”), a 100% owned
subsidiary of the Company. This guarantee will ensure the recovery of
the Net Smelter Royalty due from PML if PML is unable to pay the Company. As at
December 31, 2008 the amount of the obligation is approximately $1.0
million.
The Company’s subsidiaries MSOL and MTL
were required to pay an employment claim of a former employee who performed work
for MSOL, then owned by BZI, and other BZI companies. BZI has guaranteed the
amount owed to the company of R$378,000 ($162,000), which will mature on
September 30, 2011. As at December 31, 2008, prepaid expenses and
sundry assets includes $162,000 receivable from BW Mineração, a wholly owned
subsidiary of BZI. (2007 - $nil).
CRITICAL
ACCOUNTING ESTIMATES
The preparation of its consolidated
financial statements requires the Company to use estimates and assumptions that
affect the reported amounts of assets and liabilities as well as revenues and
expenses. The Company’s accounting policies are described in Note 2
to its consolidated annual financial statements. The Company’s
accounting policies relating to work-in-progress inventory valuation and
amortization of property, plant and equipment, mineral exploration
projects,
18
JAGUAR
MINING INC.
MANAGEMENT’S
DISCUSSION AND ANALYSIS
(All
dollar amounts are expressed in U.S. dollars)
and
site reclamation and closure accruals are critical accounting estimates that are
subject to assumptions regarding reserves, recoveries, future gold prices and
future mining activities.
Gold in process and ore in stockpiles
are stated at the lower of average production cost and net realizable
value. Production costs include labor, benefits, material and other
product costs. These costs are charged to earnings and are included
in cost of sales. The assumptions used in the impairment assessment
of gold in process inventories include estimates of gold contained in the ore
stacked, assumptions of the amount of gold stacked that is expected to be
recovered and an assumption of the gold price expected to be realized when the
gold is recovered. If these estimates or assumptions prove to be
inaccurate, the Company could be required to write-down the recorded value of
its work-in-progress inventories, which would reduce the Company’s earnings and
working capital.
In addition, GAAP requires the Company
to consider, at the end of each accounting period, whether or not there has been
an impairment of the capitalized mineral exploration projects, property, plant
and equipment. For producing properties, this assessment is based on
expected future cash flows to be generated from the location. For
non-producing properties, this assessment is based on whether factors that may
indicate the need for a write-down are present. If the Company
determines there has been an impairment because its prior estimates of future
cash flows have proven to be inaccurate, due to reductions in the price of gold,
increases in the costs of production, reductions in the amount of reserves
expected to be recovered or otherwise, or because the Company has determined
that the deferred costs of non-producing properties may not be recovered based
on current economics or permitting considerations, the Company would be required
to write-down the recorded value of its mineral exploration projects, property,
plant and equipment, which would reduce the Company’s earnings and net
assets.
The Company’s mining and exploration
activities are subject to various laws and regulations governing the protection
of the environment. In general, these laws and regulations are
continually changing and, over time, becoming more restrictive which impacts the
cost of retiring assets at the end of their useful life. The Company
recognizes management’s estimate of the fair value of liabilities for asset
retirement obligations in the period in which they are incurred. A corresponding
increase to the carrying amount of the related asset (where one is identifiable)
is recorded and depreciated over the life of the asset. Where a
related asset is not easily identifiable with a liability, the change in fair
value over the course of the year is expensed. Over time, the
liability will be increased each period to reflect the interest element
(accretion) reflected in its initial measurement at fair value, and will also be
adjusted for changes in the estimate of the amount, timing and cost of the work
to be carried out. Additionally, future changes to environmental laws
and regulations could increase the extent of reclamation and remediation work
required to be performed by the Company.
The Company’s mineral exploration
projects and mining properties are depleted and depreciated on a
units-of-production basis, which bases its calculations on the expected amount
of recoverable reserves. If these estimates of reserves prove to be
inaccurate, or if the Company revises its mine plan due to reductions in the
price of gold or unexpected production cost increases, and as a result the
amount of reserves expected to be recovered are reduced, then the Company would
be required to write-down the recorded value of its mineral exploration projects
and mining properties and to increase the amount of future depletion and
amortization expense, both of which would reduce the Company’s earnings and net
assets.
CHANGES
IN ACCOUNTING POLICIES INCLUDING INITIAL ADOPTION
The Company’s audited consolidated
financial statements for the year ended December 31, 2008 were prepared
following accounting policies consistent with the Company’s audited annual
consolidated financial statements and notes thereto for the year ended December
31, 2007, except for the following changes in accounting principles.
..
|
|
(a)
|
Effective
January 1, 2008 the Company adopted the following new CICA Handbook
Standards:
|
|
|
(i)
|
Financial
Instruments Disclosure and
Presentation:
|
In
December 2006, the CICA published Section 3862 Financial Instruments-
Disclosures and Section 3863, Financial Instruments-
Presentation. These standards introduce disclosure and presentation
requirements that will enable financial statements’ users to evaluate, and
enhance their understanding of, the significance of financial instruments for
the entity’s financial position, performance and cash flows, and the nature and
extent of risks arising from financial instruments to which the entity is
exposed, and how those risks are managed. (See Note 5 to the Company’s 2008
annual financial statements.)
19
JAGUAR
MINING INC.
MANAGEMENT’S
DISCUSSION AND ANALYSIS
(All
dollar amounts are expressed in U.S. dollars)
|
|
(ii)
|
Capital
Disclosures:
|
In
December 2006, the CICA published Section 1535 of the Handbook, Capital
Disclosures, which requires disclosure of (i) an entity’s objectives, policies
and processes for managing capital; (ii) quantitative data about what the entity
regards as capital; (iii) whether the entity has complied with any capital
requirements; and (iv) the consequences of non-compliance in the
event the entity has not complied. This information will enable
financial statements’ users to evaluate the entity’s objectives, policies and
processes for managing capital. (See Note 18 to the Company’s 2008
annual financial statements.)
|
|
(iii)
|
Inventories:
|
In
January 2007, the CICA published Section 3031 of the Handbook, Inventories,
which prescribes the accounting treatment for inventories. Section
3031 provides guidance on determination of costs and its subsequent recognition
as an expense, and provides guidance on the cost formulas used to assign costs
to inventories. The new standard did not impact the current or prior
years financial statements.
|
|
(b)
|
Accounting
Principles Issued but not yet
Implemented:
|
|
|
(i)
|
Adoption
of International Financial Reporting
Standards:
|
In
January 2006, the Accounting Standards Board announced its decision to require
all Publicly Accountable Enterprises to report under International Financial
Reporting Standards (IFRS) for years beginning on or after January 1,
2011. These changes reflect a global shift to IFRS and they are
intended to facilitate capital flows and bring greater clarity and consistency
to financial reporting in the global marketplace. (See Note 2(c)(i) to the
Company’s 2008 annual financial statements.)
|
|
(ii)
|
Goodwill
and intangible assets:
|
In
February 2008, the CICA issued accounting standard Section 3064 Goodwill and
Intangible Assets replacing accounting standard Section 3062, Goodwill and Other
Intangible Assets, and accounting standard Section 3450, Research and
Development Costs. The new Section will be applicable to financial
statements relating to fiscal years beginning on or after October 1,
2008. Accordingly, the Company will adopt the new standards for its
fiscal year beginning January 1, 2009. Section 3064 establishes
standards for the recognition, measurement, presentation and disclosure of
goodwill subsequent to its initial recognition and of intangible assets by
profit-oriented enterprises. Standards concerning goodwill are
unchanged from the standards included in the previous Section
3062. This standard is not expected to have a material impact on the
Company’s financial statements.
|
|
(iii)
|
Credit
risk and fair value of financial assets and financial
liabilities:
|
In
January 2009, the CICA issued the Emerging Issues Committee (EIC) Abstract
EIC-173, “Credit Risk and the Fair Value of Financial Assets and Financial
Liabilities,” effective for interim and annual financial statements ending on or
after January 20, 2009. Earlier adoption of this abstract is permitted. EIC-173
provides further information on the determination of the fair value of financial
assets and financial liabilities under Section 3855, “Financial Instruments -
Recognition and Measurement.” It states that an entity's own credit and the
credit risk of the counterparty should be taken into account in determining the
fair value of financial assets and financial liabilities, including derivative
instruments. EIC-173 should be applied retrospectively, without restatement of
prior periods, to all financial assets and liabilities measured at fair value.
The Company will adopt this abstract during the first quarter of the 2009 fiscal
year. This standard is not expected to have a material impact on the Company’s
financial statements.
|
|
(iv)
|
Business
combinations:
|
In
January 2009, the CICA issued the new handbook Section 1582, “Business
Combinations,” effective for fiscal years beginning on or after January 1,
2011. Earlier adoption of Section 1582 is permitted. This
pronouncement further aligns Canadian GAAP with US GAAP and IFRS and changes the
accounting for business combinations in a number of areas. It
establishes principles and requirements governing how an
20
JAGUAR
MINING INC.
MANAGEMENT’S
DISCUSSION AND ANALYSIS
(All
dollar amounts are expressed in U.S. dollars)
acquiring
company recognizes and measures in its financial statements identifiable assets
acquired, liabilities assumed, any non-controlling interest in the acquiree, and
goodwill acquired. The section also establishes disclosure
requirements that will enable users of the acquiring company’s financial
statements to evaluate the nature and financial effects of its business
combinations. Although the Company is considering the impact of
adopting this pronouncement on the consolidated financial statements, it will be
limited to any future acquisitions beginning in fiscal 2011.
|
|
(v)
|
Consolidated
financial statements and non-controlling
interests:
|
In
January 2009, the CICA issued the new handbook Section 1601, “Consolidated
Financial Statements,” and Section 1602, “Non-Controlling Interests,” effective
for fiscal years beginning on or after January 1, 2011. Earlier adoption of
these recommendations is permitted. These pronouncements further align Canadian
GAAP with US GAAP and IFRS. Sections 1601 and 1602 change the accounting and
reporting for ownership interests in subsidiaries held by parties other than the
parent. Non-controlling interests are to be presented in the
consolidated statement of financial position within equity but separate from the
parent’s equity. The amount of consolidated net income attributable to the
parent and to the non-controlling interest is to be clearly identified and
presented on the face of the consolidated statement of income. In addition,
these pronouncements establish standards for a change in a parent’s ownership
interest in a subsidiary and the valuation of retained non-controlling equity
investments when a subsidiary is deconsolidated. They also establish
reporting requirements for providing sufficient disclosures that clearly
identify and distinguish between the interests of the parent and the interests
of the non-controlling owners. The Company is currently considering the impact
of adopting these pronouncements on its consolidated financial statements in
fiscal 2011 in connection with the conversion to IFRS.
INTERNATIONAL
FINANCIAL REPORTING STANDARDS (“IFRS”)
On February 13, 2008, the CICA
Accounting Standards Board (AcSB) confirmed that the changeover to IFRS from
Canadian GAAP will be required for publicly accountable enterprises for interim
and annual financial statements effective for fiscal years beginning on or after
January 1, 2011, including comparatives for 2010. The objective is to improve
financial reporting by having one single set of accounting standards that are
comparable with other entities on an international basis.
The Company commenced its IFRS
conversion project during 2008 and established a formal project governance
structure to monitor the progress and critical decisions to IFRS. Regular
reporting is provided by the project team to the Audit Committee of the Board of
Directors.
The Company’s conversion plan is
comprehensive and consists of four phases: preliminary study, evaluation,
development, and implementation. The project plan addresses matters including
changes in accounting policy, organizational structure and internal control, the
modification of existing systems and the training and awareness of staff, in
addition to other related business matters.
During 2008, the Company initiated the
preliminary study phase which involves a high level review of the major
differences between Canadian GAAP and IFRS as related to the Company’s
accounting policies. This high level review will provide insight as to the most
significant areas of difference applicable to the Company, including asset
retirement obligations, foreign currency translations and share based
compensation, as well as more extensive presentation and disclosure requirements
under IFRS. A number of milestones have been achieved including the organization
of an information and awareness session for senior management and the Audit
Committee of the Board of Directors and the training of key project team
members.
Currently the Company is engaged in the
evaluation and development phases of the project. The Company has begun training
sessions for senior management and the Board of Directors, and has begun to
perform an in-depth review of accounting policy impact, as well as defining the
associated impact of the IFRS transition on financial reporting processes,
disclosure controls and procedures and internal controls over financial
reporting.
The Company continues to monitor
standards development as issued by the International Accounting Standards Board
and the AcSB, as well as regulatory developments as issued by the Canadian
Securities Administrators, which may affect the timing, nature or disclosure of
the Company’s adaption of IFRS.
21
JAGUAR
MINING INC.
MANAGEMENT’S
DISCUSSION AND ANALYSIS
(All
dollar amounts are expressed in U.S. dollars)
The transition from current Canadian
GAAP to IFRS is a significant undertaking that may materially affect the
company’s reported financial position and results of operations. As the Company
is still in the evaluation and development phases and has not yet selected its
accounting policy choices and IFRS 1 exemptions, the Company is unable to
quantify the impact of IFRS on its financial statements. The areas of
significance identified above are based on available information and the
Company’s expectations as of the date of this report and thus, are subject to
change with new facts and circumstances.
The project team is working through a
detailed IFRS transition plan and certain project activities and milestones
could change. The Company has begun to highlight certain key activities to
provide insights into the IFRS project.
Given the progress of the project and
outcomes identified, the Company could change its intentions between the time of
communicating these key milestones and the changeover date. Further, changes in
regulation or economic conditions at the time of the changeover or throughout
the project could result in changes to the transition plan being different from
those communicated. The Company will continue to assess the impact of adopting
IFRS and will update its MD&A disclosures quarterly to report on the
progress of its IFRS changeover plan.
NON-GAAP
PERFORMANCE MEASURES
The
Company has included the non-GAAP performance measures Cash Operating Cost per
tonne processed and Cash Operating Cost per ounce processed in this document.
These non-GAAP performance measures do not have any standardized meaning
prescribed by GAAP and, therefore, may not be comparable to similar measures
presented by other companies. The Company believes that, in addition to
conventional measures prepared in accordance with GAAP, certain investors use
this information to evaluate the Company’s performance. Accordingly, they
are intended to provide additional information and should not be considered in
isolation or as a substitute for measures of performance prepared with
GAAP. More specifically, management believes that these figures are a
useful indicator to investors and management of a mine’s performance as they
provide: (i) a measure of the mine’s cash margin per tonne/ounce, by comparison
of the cash operating costs per tonne/ounce to the price of gold, (ii) the trend
in costs as the mine matures and, (iii) an internal benchmark of performance to
allow for comparison against other mines. The definitions for these
performance measures and reconciliation of the non-GAAP measures to reported
GAAP measures are as follows:
[The
remainder of this page has been left intentionally blank]
22
JAGUAR
MINING INC.
MANAGEMENT’S
DISCUSSION AND ANALYSIS
(All
dollar amounts are expressed in U.S. dollars)
|
Summary
of Cash Operating Cost per tonne processed
|
Three
Months
Ended
December
31,
2008
|
Year
Ended
December
31,
2008
|
||||||
|
Production
costs per statement of operations
|
$ | 15,286,000 | $ | 50,355,000 | ||||
|
Change
in inventory 1
|
(238,000 | ) | (1,158,000 | ) | ||||
|
Operational
cost of tonnes processed 2
|
15,048,000 | 49,197,000 | ||||||
|
divided
by
|
||||||||
|
Tonnes
processed
|
380,000 | 1,233,000 | ||||||
|
equals
|
||||||||
|
Cost
per tonne processed
|
$ | 39.60 | $ | 39.90 | ||||
|
Sabará
Cash Operating Cost per tonne processed
|
Three
Months
Ended
December
31,
2008
|
Year
Ended
December
31,
2008
|
||||||
|
Production
costs
|
$ | 2,702,000 | $ | 12,143,000 | ||||
|
Change
in inventory 1
|
(468,000 | ) | (1,456,000 | ) | ||||
|
Operational
cost of tonnes processed 2
|
2,234,000 | 10,687,000 | ||||||
|
divided
by
|
||||||||
|
Tonnes
processed
|
105,000 | 475,000 | ||||||
|
equals
|
||||||||
|
Cost
per tonne processed
|
$ | 21.20 | $ | 22.50 | ||||
|
Turmalina
Cash Operating Cost per tonne processed
|
Three
Months
Ended
December
31,
2008
|
Year
Ended
December
31,
2008
|
||||||
|
Production
costs
|
$ | 6,636,000 | $ | 28,608,000 | ||||
|
Change
in inventory 1
|
122,000 | (2,009,000 | ) | |||||
|
Operational
cost of tonnes processed 2
|
6,758,000 | 26,599,000 | ||||||
|
divided
by
|
||||||||
|
Tonnes
processed
|
128,000 | 481,000 | ||||||
|
equals
|
||||||||
|
Cost
per tonne processed
|
$ | 52.80 | $ | 55.30 | ||||
|
Paciência
Cash Operating Cost per tonne processed
|
Three
Months
Ended
December
31,
2008
|
Year
Ended
December
31,
2008
|
||||||
|
Production
cost
|
$ | 5,948,000 | $ | 9,604,000 | ||||
|
Change
in inventory 1
|
108,000 | 2,307,000 | ||||||
|
Operational
cost of tonnes processed 2
|
6,056,000 | 11,911,000 | ||||||
|
divided
by
|
||||||||
|
Tonnes
processed
|
147,000 | 277,000 | ||||||
|
equals
|
||||||||
|
Cost
per tonne processed
|
$ | 41.20 | $ | 43.00 | ||||
23
JAGUAR MINING
INC.
MANAGEMENT’S
DISCUSSION AND ANALYSIS
(All
dollar amounts are expressed in U.S. dollars)
|
Summary
of Cash Operating Cost per oz of gold produced
|
Three
Months
Ended
December
31,
2008
|
Year
Ended
December
31,
2008
|
||||||
|
Production
costs per statement of operations
|
$ | 15,286,000 | $ | 50,355,000 | ||||
|
Change
in inventory 1
|
(258,000 | ) | (871,000 | ) | ||||
|
Operational
cost of gold produced 2
|
15,028,000 | 49,484,000 | ||||||
|
divided
by
|
||||||||
|
Gold
produced (oz)
|
37,916 | 115,348 | ||||||
|
equals
|
||||||||
|
Cost
per oz of gold produced
|
$ | 396 | $ | 429 | ||||
|
Sabará
Cash Operating Cost per oz produced
|
Three
Months
Ended
December
31,
2008
|
Year
Ended
December
31,
2008
|
||||||
|
Production
costs
|
$ | 2,702,000 | $ | 12,143,000 | ||||
|
Change
in inventory 1
|
186,000 | (4,000 | ) | |||||
|
Operational
cost of gold produced 2
|
2,888,000 | 12,139,000 | ||||||
|
divided
by
|
||||||||
|
Gold
produced (oz)
|
4,506 | 18,199 | ||||||
|
equals
|
||||||||
|
Cost
per oz of gold produced
|
$ | 641 | $ | 667 | ||||
|
Turmalina
Plant Cash Operating Cost per oz produced
|
Three
Months
Ended
December
31,
2008
|
Year
Ended
December
31,
2008
|
||||||
|
Production
costs
|
$ | 6,636,000 | $ | 28,608,000 | ||||
|
Change
in inventory 1
|
(40,000 | ) | (2,056,000 | ) | ||||
|
Operational
cost of gold produced 2
|
6,596,000 | 26,552,000 | ||||||
|
divided
by
|
||||||||
|
Gold
produced (oz)
|
19,987 | 72,785 | ||||||
|
equals
|
||||||||
|
Cost
per oz of gold produced
|
$ | 330 | $ | 364 | ||||
|
Paciência
Plant Cash Operating Cost per oz produced
|
Three
Months
Ended
December
31,
2008
|
Year
Ended
December
31,
2008
|
||||||
|
Production
costs
|
$ | 5,948,000 | $ | 9,604,000 | ||||
|
Change
in inventory 1
|
(404,000 | ) | 1,189,000 | |||||
|
Operational
cost of gold produced 2
|
5,544,000 | 10,793,000 | ||||||
|
divided
by
|
||||||||
|
Gold
produced (oz)
|
13,423 | 24,364 | ||||||
|
equals
|
||||||||
|
Cost
per oz of gold produced
|
$ | 413 | $ | 443 | ||||
|
1Under
the Company’s revenue recognition policy, revenue is recognized when legal
title passes. Since total cash operating costs are calculated
on a production basis, this change reflects the portion of gold production
for which revenue has not been recognized in the
period.
|
|
2
The basis for calculating cost per ounce produced includes the
change to gold in process inventory, whereas the cost per tonne processed
does not.
|
24
JAGUAR
MINING INC.
MANAGEMENT’S
DISCUSSION AND ANALYSIS
(All
dollar amounts are expressed in U.S. dollars)
DISCLOSURE
CONTROLS AND PROCEDURES AND INTERNAL CONTROL OVER FINANCIAL
REPORTING
Disclosure
Controls and Procedures:
An
evaluation was performed under the supervision and with the participation of
management, including the Chief Executive Officer and Chief Financial Officer,
of the effectiveness of the Company’s disclosure controls and procedures, as
defined in the rules of the SEC and Canadian Securities Administrators, as of
December 31, 2008. Based on that evaluation, management, including the
Chief Executive Officer and Chief Financial Officer, concluded that the
Company’s disclosure controls and procedures were effective as of December 31,
2008.
Management’s
Report on Internal Control Over Financial Reporting:
Management
of the Company is responsible for establishing and maintaining adequate internal
control over financial reporting for the Company. The Company’s internal
control over financial reporting includes those policies and procedures that (1)
pertain to the maintenance of records, that, in reasonable detail, accurately
and fairly reflect the transactions and dispositions of the assets of the
Company; (2) provide reasonable assurance that transactions are recorded as
necessary to permit preparation of financial statements in accordance with
generally accepted accounting principles, and that receipts and expenditures of
the Company are being made only in accordance with authorizations of the
Company’s management and directors; and (3) provide reasonable assurance
regarding prevention or timely detection of unauthorized acquisition, use or
disposition of the Company’s assets that could have a material effect on the
financial statements.
The
Company’s management has used the criteria established in Internal Control -
Integrated Framework issued by the Committee of Sponsoring Organizations of the
Treadway Commission to assess, with the participation of the Chief Executive
Officer and Chief Financial Officer, the effectiveness of the Company’s internal
control over financial reporting. Based on this assessment, management has
concluded that as at December 31, 2008, the Company’s internal control over
financial reporting was effective based on the applicable criteria. The
effectiveness of the Company’s internal control over financial reporting has
been audited by the independent auditors, KPMG LLP, a registered public
accounting firm that has also audited the Consolidated Financial Statements of
the Company for the year ended December 31, 2008. Their report expresses
an unqualified opinion on the effectiveness of the Company’s internal control
over financial reporting as of December 31, 2008.
Changes
in Internal Control Over Financial Reporting:
During
2008, there have been no changes in the Company’s policies and procedures and
other processes that comprise its internal control over financial reporting,
that have materially affected, or are reasonably likely to materially affect,
the Company’s internal control over financial reporting.
SUBSEQUENT
EVENTS
In February 2009, the Company reached a
settlement with Companhia Vale do Rio Doce (“Vale”) to exchange in-kind $5.0
million of iron ore concessions controlled by Jaguar in exchange for a portion
of the Roça Grande gold mineral royalty liability owed to Vale. The
portion of the iron ore concession exercised by Vale represents a small part of
the overall concession held by Jaguar with the remaining acreage to remain
available to Vale should it determine at a future point the additional land and
mineralization my be desired.
On March 2, 2009, the Company completed
an equity financing underwritten by a syndicate of underwriters and issued
13,915,000 common shares at Cdn.$6.20 per share for gross proceeds of Cdn.$86.3
million ($66.9 million). Pursuant to the underwriting agreement, the
underwriters were paid a fee equal to four and one-half percent (4.5%) of the
gross proceeds of the offering. Proceeds of the offering will be used
primarily to complete development of the Caeté Project with the balance for
general working capital purposes.
25
JAGUAR
MINING INC.
MANAGEMENT’S
DISCUSSION AND ANALYSIS
(All
dollar amounts are expressed in U.S. dollars)
OUTSTANDING
SHARE DATA
The Company’s common shares are listed
on the Toronto Stock Exchange and the New York Stock Exchange -
Arca.
At March 23, 2009, the Company had
77,897,281 issued and outstanding common shares, as well as 7,044,013 stock
options outstanding.
[The
remainder of this page has been left intentionally blank]
26
JAGUAR
MINING INC.
MANAGEMENT’S
DISCUSSION AND ANALYSIS
(All
dollar amounts are expressed in U.S. dollars)
GLOSSARY
OF MINING TERMS
Carbon-in-leach
A
gold recovery process in which a slurry of gold-bearing ore, carbon and cyanide
are mixed together. The cyanide dissolves the gold, which is
subsequently absorbed by and separated from the carbon.
Carbon-in-pulp
Similar
to carbon-in-leach process, but initially the slurry is subjected to cyanide
leaching in separate tanks followed by carbon-in-pulp. Carbon-in-leach is a
simultaneous process.
Conversion
factors
Weights
and measures on this site represent units commonly used in the gold
industry. Conversion factors are provided below:
|
To
Convert
Imperial Measurement Units
|
To
Metric
Measurement Units
|
Multiply
By
|
||
|
Acres
|
Hectares
|
0.404686
|
||
|
Feet
|
Metres
|
0.30480
|
||
|
Miles
|
Kilometres
|
1.609344
|
||
|
Ounces
(troy)
|
Grams
|
31.1035
|
||
|
Pounds
|
Kilograms
|
0.454
|
||
|
Short
tons
|
Tonnes
|
0.907185
|
||
|
Troy
ounces per ton
|
Grams
per tonne
|
34.2857
|
Cut-off
grade
The
minimum metal grade at which a tonne of rock can be processed on an economic
basis.
Deposit
A
mineralized body which has been physically delineated by sufficient drilling,
trenching and/or underground work and found to contain a sufficient average
grade of metal or metals to warrant further exploration and/or development
expenditures; such a deposit does not qualify as a commercially mineable ore
body or as containing mineral reserves until final legal, technical and economic
factors have been resolved.
Development or mine
development
Driving
openings to access the mineral reserve in an underground mine.
Diamond or core
drill
A
type of rotary drill in which the cutting is done by abrasion rather than
percussion. The cutting bit is set with diamonds and is attached to
the end of long hollow rods through which water is pumped to the cutting
face. The drill cuts a core of rock, which is recovered in long
cylindrical sections, an inch or more in diameter.
Dilution
The
effect of waste or low-grade ore being included unavoidably in the mined ore,
lowering the recovered grade.
Doré
The
precious metals product of the smelter, containing mainly gold and silver, that
requires additional refining to high purity gold.
Drifting
Driving
of tunnels through rock usually on a horizontal basis.
Feasibility
study
A
detailed report showing the feasibility of placing a prospective ore body or
deposit of minerals within a mineral property into production. This
report typically includes, inter alia, the specific portion or portions of the
property that should be included in a development block, conclusions and
recommendations regarding any adjustments that should be made to the boundaries
of a development block, a description of the work to be performed in order to
develop the mineral resources within the development block and to construct a
mine or mines and related facilities on the development block, the estimated
capital and operating costs thereof, a proposed schedule for the timing of
development and mine construction, and an assessment of the impact of the
operation and the information obtained and evaluations made in respect
thereof.
Grade
The
concentration of metal or valuable mineral in a body of rock, usually expressed
as a percentage or in grams per tonne or ounces per tonne.
Heap
leaching
A
process whereby gold is extracted by “heaping” broken ore on sloping impermeable
pads and repeatedly spraying the heaps with a weak cyanide solution which
dissolves the gold content. The gold-laden solution is collected for gold
recovery.
27
JAGUAR
MINING INC.
MANAGEMENT’S
DISCUSSION AND ANALYSIS
(All
dollar amounts are expressed in U.S. dollars)
Indicated mineral
resource
An
indicated mineral resource is that part of a mineral resource for which
quantity, grade or quality, density, shape, and physical characteristics can be
estimated with a level of confidence sufficient to allow the appropriate
application of technical and economic parameters, to support mine planning and
evaluation of the economic viability of the deposit. The estimate is
based on detailed and reliable exploration and testing information gathered
through appropriate techniques from locations such as outcrops, trenches, pits,
workings and drill holes that are spaced closely enough for geological and grade
continuity to be reasonably assumed.
Inferred
That
part of a mineral resource for which quantity and grade or quality can be
estimated on the basis of geological evidence, limited sampling, and reasonably
assumed, but not verified, geological and grade continuity. The
estimate is based on limited information and sampling gathered through
appropriate techniques from locations such as outcrops, trenches, pits, and
workings.
Inferred mineral
resource
An
inferred mineral resource is that part of a mineral resource for which quantity
and grade or quality can be estimated on the basis of geological evidence and
limited sampling and reasonably assumed but not verified, geological and grade
continuity. The estimate is based on limited information and sampling gathered
through appropriate techniques from locations such as outcrops, trenches, pits,
workings and drill holes.
Measured mineral
resource
A
measured mineral resource is that part of a mineral resource for which quantity,
grade or quality, density, shape and physical characteristics are so well
established that they can be estimated with confidence sufficient to allow the
appropriate application of technical and economic parameters, to support
production planning and evaluation of the economic viability of the
deposit. The estimate is based on detailed and reliable exploration,
sampling and testing information gathered through appropriate techniques from
locations such as outcrops, trenches, pits, workings and drill holes that are
spaced closely enough to confirm both geological and grade
continuity.
Mineralization
Mineral-bearing
rock; the minerals may have been either a part of the original rock unit or
injected at a later time.
Mineral
reserve
A
mineral reserve is the economically mineable part of a measured or indicated
mineral resource demonstrated by at least a preliminary feasibility
study. This study must include adequate information on mining,
processing, metallurgical, economic and other relevant factors that demonstrate,
at the time of reporting, that economic extraction can be
justified. A mineral reserve includes diluting materials and
allowances for losses that may occur when the material is mined.
Mineral
resource
A
mineral resource is a concentration or occurrence of natural, solid, inorganic
or fossilized organic material in or on the earth's crust in such form or
quantity and of such a grade or quality that has reasonable prospects
for economic extraction. The location, quantity, grade, geological
characteristics and continuity of a mineral resource are known, estimated or
interpreted from specific geological evidence and knowledge.
NI
43-101
Canadian
National Instrument 43-101, Standards of Disclosure for Mineral Projects of the
Canadian Securities Regulators.
Ore
Rock,
generally containing metallic and non-metallic minerals that can be mined and
processed at a profit.
Ounce
(troy)
All
ounces referenced herein are troy ounces. Despite the world's gradual
conversion to the metric system, the troy ounce remains a fixture of the gold
industry and the most important basis for expressing quotations of most gold
markets. One troy ounce equals approximately 31.1 grams in
weight. There are 32.15 troy ounces in a kilogram.
Probable mineral
reserve
A
probable mineral reserve is the economically mineable part of an indicated, and
in some circumstances a measured mineral resource, demonstrated by at least a
preliminary feasibility study. This study must include adequate
information on mining, processing, metallurgical, economic and other relevant
factors that demonstrate, at the time of reporting, that economic extraction can
be justified.
Proven mineral
reserve
A
proven mineral reserve is the economically mineable part of a measured mineral
resource demonstrated by at least a preliminary feasibility
study. This study must include adequate information on mining,
processing, metallurgical, economic and other relevant factors that demonstrate,
at the time of reporting, that economic extraction is justified.
Qualified Person or
QP
An
individual who, in accordance with NI 43-101: (a) is an engineer or geoscientist
with at least five years of experience in mineral exploration, mine development
or operation mineral project assessment, or any combination of these; (b) has
experience relevant to the subject matter of the mineral project and the
technical report; and (c) is a member in good standing of a recognized
professional association.
28
JAGUAR
MINING INC.
MANAGEMENT’S
DISCUSSION AND ANALYSIS
(All
dollar amounts are expressed in U.S. dollars)
Ramp
An
inclined underground tunnel that provides access to an ore body for exploration,
ventilation and/or mining purposes in an underground mine.
Reclamation
The
process by which lands disturbed as a result of mining activity are reclaimed
back to a beneficial land use. Reclamation activity includes the
removal of buildings, equipment, machinery and other physical remnants of
mining, closure of tailings impoundments, leach pads and other mine features,
and contouring, covering and revegetation of waste rock piles and other
disturbed areas.
Recoverable
Reserves
Recoverable
reserves represent the quantity of gold that can be recovered (i.e. mined) from
existing gold resources.
Plant Recovery
Rate
The
percentage of valuable metal in the ore that is recovered by metallurgical
treatment.
Refractory
Ore
Mineralized
rock in which much of the gold is encapsulated in sulphides or other minerals
and is not readily amenable to dissolution by cyanide solutions (unlike oxidized
ore) even with fine grinding.
Reserves and
Resources
The
Company’s classification of mineral reserves and resources and the subcategories
of each conforms with definitions adopted by the Canadian Institute of Mining,
Metallurgy and Petroleum Council on August 20, 2000, which are in accordance
with Canadian Securities Administrators' National Instrument 43-101 dated
November 17, 2000.
Stockpile
Broken
ore heaped on surface or prepared areas underground, pending treatment or
shipment.
Stope
Working
place in an underground mine where ore is extracted.
Tailings
The
material that remains after all economically recoverable metals or minerals of
economic interest has been removed from the ore through milling and
processing.
Ton
A
ton or short ton is a British imperial measure of weight equivalent to 2,000
pounds.
Tonne
A
tonne or metric tonne is about 10% greater in weight than a short ton and
equivalent in weight to 1000 kilograms or 2,205 pounds.
Waste
Barren
rock in a mine, or mineralized material that is too low in grade to be mined and
milled at a profit.
29
CORPORATE
DIRECTORY
|
Jaguar
Mining Inc. is incorporated under the laws
of
Ontario.
DIRECTORS
Andrew C. Burns1
Gil Clausen3,
4
William E. Dow3
Gary E. German1,2,4
Chairman
Anthony F.
Griffiths1,
2, 3
Daniel
R. Titcomb
1 Audit
Committee
2
Compensation Committee
3
Corporate Governance Committee
4
Health, Safety and Environmental Committee
OFFICERS
Daniel
R. Titcomb
President
& CEO
James
M. Roller
Chief
Financial Officer & Treasurer
Lúcio
Cardoso
Chief
Operating Officer
Adriano
L. Nascimento
VP
Exploration & Engineering
Robert
Zwerneman
VP
Corporate Development, Director of IR
Robert
J. Lloyd
Secretary
ADMINISTRATIVE OFFICE
125
North State Street
Concord,
NH 03301 - USA
Phone:
(603) 224-4800
Fax: (603)
228-8045
E-mail:
ir@jaguarmining.com
Website:
www.jaguarmining.com
|
REGISTERED
OFFICE
100
King Street West, Suite 4400
1
First Canadian Place
Toronto,
Ontario M5X 1B1 - Canada
OPERATING
OFFICE
Rua
Fernandes Tourinho 487, 7th Floor
CEP
30.112-000 - Belo Horizonte - MG
Brazil
AUDITORS
KPMG
LLP
Toronto,
Ontario
Belo
Horizonte, Brazil
LEGAL
COUNSEL
Davies
Ward Phillips &Vineberg LLP
Toronto,
Ontario
New
York, NewYork
Hinckley,
Allen & Snyder LLP
Concord,
New Hampshire
BANKS
Bank
of America
Boston,
Massachusetts
HSBC
Toronto,
Ontario
Royal
Bank of Canada
Toronto,
Ontario
STOCK
TRANSFER AGENT
Computershare
Investor Services Inc.
100
University Avenue, 9th
floor
Toronto,
ON M5J 2Y1
Phone:
1-800-564-6253
Fax:
1-866-249-7775
Email:
service@computershare.com
EXCHANGE
LISTING
Toronto
Stock Exchange: “JAG”, “JAG.NT”
NYSE
Arca: “JAG”
|