
JAGUAR
MINING INC.
Annual
Information Form
for
the year ended December 31, 2008
Dated
February 11, 2009
TABLE OF
CONTENTS
|
CAUTIONARY
NOTE REGARDING FORWARD LOOKING STATEMENTS
|
3 | |||
|
CORPORATE
STRUCTURE
|
4 | |||
|
GENERAL
DEVELOPMENT OF THE BUSINESS
|
5 | |||
|
DESCRIPTION
OF THE BUSINESS
|
14 | |||
|
JAGUAR
GOLD OPERATIONS AND PROJECTS
|
20 | |||
|
RISK
FACTORS
|
73 | |||
|
DIVIDENDS
|
79 | |||
|
DESCRIPTION
OF CAPITAL STRUCTURE
|
80 | |||
|
MARKET
FOR SECURITIES
|
81 | |||
|
DIRECTORS
AND EXECUTIVE OFFICERS
|
83 | |||
|
INTEREST
OF MANAGEMENT AND OTHERS IN MATERIAL TRANSACTIONS
|
88 | |||
|
TRANSFER
AGENTS AND REGISTRAR
|
89 | |||
|
MATERIAL
CONTRACTS
|
90 | |||
|
INTERESTS
OF EXPERTS
|
91 | |||
|
ADDITIONAL
INFORMATION
|
92 | |||
|
APPENDIX
A CHARTER OF THE AUDIT COMMITTEE OF THE BOARD OF DIRECTORS
|
93 |
2
CAUTIONARY NOTE REGARDING
FORWARD-LOOKING STATEMENTS
Certain
information contained herein and in the documents incorporated by reference
herein constitutes forward-looking statements. Forward-looking statements are
frequently characterized by words such as “plan”, “goal”, “strategy”, “budget”,
“estimates”, “schedule”, “expect”, “project”, “intend”, “believe”, “anticipate”
and other similar words, or statements that certain events or conditions “may”,
“could”, “might”, or “will” occur. Statements relating to “mineral
reserves” or “mineral resources” are deemed to be forward-looking statements, as
they involve the implied assessment, based on certain estimates and assumptions,
that the mineral reserves and mineral resources described can be profitably
produced in the future. Forward-looking statements are based on the
opinions and estimates of management at the date the statements are made, and
are subject to a variety of risks and uncertainties and other factors that could
cause actual events or results to differ materially from those projected in the
forward-looking statements. These factors include the inherent risks involved in
the exploration and development of mineral properties, the uncertainties
involved in interpreting drilling results and other ecological data, fluctuating
metal prices, the possibility of project cost overruns or unanticipated costs
and expenses, uncertainties relating to the availability and costs of financing
needed in the future, political risks and other factors described in this annual
information form under the heading “Risk Factors”.
Actual
results and developments are likely to differ, and may differ materially, from
those expressed or implied by the forward-looking statements contained in this
annual information form. Such statements are based on a number of
assumptions which may prove to be incorrect, including, but not limited to, the
following assumptions: that there is no material deterioration in
general business and economic conditions; that there is no unanticipated
fluctuation of interest rates and foreign currency exchange rates; that the
supply and demand for, deliveries of, and the level and volatility of prices of
gold as well as oil and petroleum products develop as expected; that Jaguar
receives regulatory and governmental approvals for its development projects and
other operations on a timely basis; that Jaguar is able to obtain financing for
its development projects on reasonable terms; that there is no unforeseen
deterioration in Jaguar’s costs of production or Jaguar’s production and
productivity levels; that Jaguar is able to procure mining equipment and
operating supplies in sufficient quantities and on a timely basis; that
engineering and construction timetables and capital costs for Jaguar’s
development and expansion projects are not incorrectly estimated or affected by
unforeseen circumstances; that costs of closure of various operations are
accurately estimated; that unforeseen changes to the political stability or
government regulation in the country in which Jaguar operates do not occur; that
there are no unanticipated changes to market competition, that Jaguar’s reserve
estimates are within reasonable bounds of accuracy (including with respect to
size, grade and recoverability) and that the geological, operational and price
assumptions on which these are based are reasonable; that Jaguar realizes
expected premiums over London Metal Exchange cash and other benchmark prices;
and that Jaguar maintains its ongoing relations with its employees and business
partners and joint venturers; as well as those risk factors set out in this
annual information form.
All
of the forward-looking information in this annual information form, and the
documents incorporated by reference herein, is qualified by these cautionary
statements. Forward-looking information contained herein is made as of the date
of this annual information form and Jaguar disclaims any obligation to update
any forward-looking information, whether as a result of new information, future
events or results or otherwise. There can be no assurance that the
forward-looking information will prove to be accurate as actual results and
future events could differ materially from those anticipated in making such
statements containing forward-looking information. Accordingly,
readers should not place undue reliance on forward-looking
information.
3
CORPORATE
STRUCTURE
Jaguar
Mining Inc. (“Jaguar”) was incorporated on March 1, 2002 pursuant to the Business Corporations Act
(New Brunswick). On March 30, 2002, Jaguar issued initial common
shares to Brazilian Resources, Inc. (“Brazilian”) and IMS Empreendimentos Ltda.
(“IMS”) in exchange for property. In that transaction, Brazilian
contributed to Jaguar all of the issued and outstanding shares in Mineração
Serras do Oeste Ltda. (“MSOL”), a Brazilian mining company that controlled the
mineral rights, concessions and licenses to certain property located near the
community of Sabará, east of Belo Horizonte in the state of Minas Gerais, Brazil
(the “Sabará Property”), and IMS contributed to Jaguar a 1,000-tonne per day
production facility located near the community of Caeté east of Belo Horizonte
in the state of Minas Gerais, Brazil (the “Caeté Plant”) and the mineral rights
to a nearby property related to National Department of Mineral Production
(“DNPM”) Mineral Exploration Request no. 831.264/87 and DNPM Mineral Exploration
Request nos. 830.590/83 and 830.592/83 (the “Rio de Peixe
Property”). Jaguar was continued into Ontario in October 2003
pursuant to the Business
Corporations Act (Ontario) and is currently a corporation existing under
the laws of Ontario. Jaguar’s head office is located at 125 North
State Street, Concord, New Hampshire (USA) 03301, and its registered office is
located at 1 First Canadian Place, 100 King Street West, Suite 4400, Box 63,
Toronto, Ontario, Canada M5X 1B1.
On
October 9, 2003, pursuant to an amalgamation agreement dated July 16, 2003,
Jaguar amalgamated with Rainbow Gold Ltd. (“Rainbow”), a New Brunswick
corporation and a then inactive reporting issuer listed on the TSX Venture
Exchange (the “TSX-V”), through a reverse take-over. Each shareholder
of Rainbow received one common share of Jaguar (a “Common Share”) for every 14
common shares of Rainbow owned. The amalgamated entity adopted the
name “Jaguar Mining Inc.” Jaguar was approved for listing on the
TSX-V on October 14, 2003 and began trading on October 16,
2003. Jaguar subsequently graduated from the TSX-V to the Toronto
Stock Exchange (the “TSX”) and began trading on the TSX on February 17, 2004
under the symbol “JAG”. On July 23, 2007, trading of Jaguar’s common
shares commenced on the NYSE Arca Exchange (“NYSE Arca”) under the symbol
“JAG”.
Jaguar has two wholly-owned
direct subsidiaries, MSOL and Mineração Turmalina Ltda. (“MTL”), both
incorporated under the laws of the Republic of Brazil. The registered
and head office of each of MSOL and MTL is located at Rua Fernandes Tourinho,
487, 7th Floor,
Bairro Savassi, Belo Horizonte, Minas Gerais, CEP 30.112-000,
Brazil.
4
GENERAL DEVELOPMENT OF THE
BUSINESS
Corporate
History
In
2001, the principals of Brazilian and IMS recognized that an opportunity existed
to create a mid-sized gold producer in the Quadrilátero Ferrífero (“Iron
Quadrangle”) region of Brazil by acquiring various late-stage gold exploration
properties with existing resources and relatively new plant and equipment, at
prices reflecting the comparatively distressed state of the gold mining industry
at that time. Gold prices were depressed compared to historical
levels and, for different reasons, Mineração AngloGold Ltda., a subsidiary of
AngloGold Ashanti Limited (“AngloGold Ashanti”), Vale (or Companhia Vale do Rio
Doce until 2007) and Rio Tinto Desenvolvimentos Minerais Ltda. (“RTZ”) were all
contemplating the rationalization of their gold property and equipment
portfolios. Brazilian and IMS believed that no junior mining
companies operating in the region were in a strong enough financial condition to
broadly negotiate to acquire the available properties.
Mining
Exploration, Production History and Corporate Transactions
Mining
Properties Generally
Jaguar’s
properties, except for the Pedra Branca Project, are located in or adjacent to
the Iron Quadrangle region of Brazil, a greenstone belt located east of the city
of Belo Horizonte in the state of Minas Gerais. Jaguar has three
operations currently in production, located at the Turmalina, Paciência and
Sabará properties, respectively. In addition, Jaguar has one property
under development: the Caeté Project. Jaguar has also entered into a
joint venture agreement with Xstrata plc. (“Xstrata”) to explore the Pedra
Branca Project in northeastern Brazil, as further described under “Pedra Branca Project”,
below.
Jaguar
commissioned TechnoMine Services, LLC (“TechnoMine”) and Scott Wilson Roscoe
Postle Associates Inc. (formerly Roscoe Postle Associates Inc.) (“Scott Wilson
RPA”) to prepare technical reports in accordance with National Instrument 43-101
Standards of Disclosure for
Mineral Properties (“NI 43-101”) to set forth the mineral resources and
reserves of all Jaguar’s concessions in the Iron Quadrangle. All of
the NI 43-101 compliant technical reports prepared on behalf of Jaguar can be
found at www.sedar.com. The Scott Wilson RPA technical reports
referred to herein have been updated and superseded by technical reports
prepared by TechnoMine, except with respect to Ore Body B on the Turmalina
property, and as such are no longer current.
Additional
information regarding each property is set forth below.
Turmalina
On
September 30, 2004, Jaguar acquired MTL and the 13,183 acre Turmalina gold
project located in Minas Gerais, Brazil from AngloGold
Ashanti. Jaguar, through MSOL, agreed to pay US$1.35 million over
three years for 100 percent ownership and operational control of the Turmalina
concessions, which amount has been paid in full.
The
Turmalina concessions are subject to a participation interest as
follows: (i) for production obtained as a result of washing of
dragline-mined placers, open pit hydraulic mining or other similar method, MSOL
shall pay a royalty to AngloGold Ashanti equal to (a) ten percent of annual net
revenue up to US$500,000, (b) five percent of annual net revenue between
US$500,000 and US$1,000,000, and (c) two and a half percent of annual net
revenue over US$1,000,000; and (ii) for production obtained as a result of in situ mineral reserves, in
fresh or altered rocks, via underground or open pit mining, MSOL shall pay a
royalty to AngloGold Ashanti equal to (a) two percent of net revenue for the
first six operational months, (b) two percent of net revenue during the 7th through
48th
operational months (however, at least US$200,000 shall be paid every twelve
months after the seventh month of production), (c) five percent after the first
four years of production sale up to and including US$10,000,000, and (d) three
percent after the first four years of production sale in excess of
US$10,000,000.
During
2006, Jaguar completed a feasibility study on Turmalina and commissioned Scott
Wilson RPA to audit it and issue a technical report in compliance with NI
43-101. Scott Wilson RPA issued its report on September 16, 2005,
revised it on March 10, 2006, supplemented it on March 14, 2006 and, upon the
completion of Phase II of the Turmalina exploration program in the Main and
Northeast Targets (Ore Bodies A and B, respectively), further updated the report
on July 31, 2006.
5
Commissioning
at Turmalina began in November 2006 and the first gold pour was conducted in
January 2007. Turmalina is an underground mine utilizing the
"sublevel stoping" and the "cut and fill" mining methods with paste
fill. Turmalina is currently processing 1,300 tonnes per day of ore
in the carbon-in-pulp ("CIP") plant.
Additional
exploration efforts by Jaguar in the area surrounding Ore Bodies A and B have
led to the discovery of a third mineralized area, referred to as the Satinoco
Target, where three new areas of mineralization have been
identified. The Satinoco Target is located approximately 300 meters
from Ore Body A at the Turmalina Mine.
Jaguar
initially completed a two-phase diamond drilling program at the Satinoco Target
and commissioned TechnoMine to prepare a resource estimate technical
report. A technical report was issued in October 2007, based on
exploration data achieved until July 2007. Jaguar completed an
additional, Phase III exploration campaign in December 2007. The
results generated during Phase III program were integrated to the previous
exploration database and gave rise to a re-evaluation of the Satinoco Target
resource base. In February 2008, Jaguar filed a technical report in
accordance with NI 43-101 in connection with the upgrade of inferred to measured
and indicated resources at the Satinoco Target.
During
the fourth quarter of 2007, Jaguar completed the underground crosscut to access
the Satinoco mineralization through the existing ramp developed by Jaguar to
mine Ore Bodies A and B at Turmalina. The crosscut will be utilized
to transport ore from the Satinoco Target out the Turmalina Mine
entrance. During the excavation process of the crosscut to the
Satinoco Target, economic grades of gold were discovered in channel
samples. During 2008, Jaguar conducted a complementary 12,000 meter
in-fill diamond drill program as part of the feasibility work in an effort to
convert resources to reserves to expand Turmalina’s operation.
In
September 2008, TechnoMine completed the NI 43-101 compliant feasibility study
technical report on the Turmalina Phase I expansion, which converted the
Satinoco mineral resources to reserves. Jaguar expects this will be
the first of a planned three-phase expansion program at the Turmalina
operations. The Phase I expansion is expected to increase Turmalina
production by 25% from its present design rate of approximately 80,000 ounces
per year to 100,000 ounces per year. Jaguar expects to complete the
Phase I expansion by the third quarter of 2009.
Jaguar’s
reported mineral resources for Turmalina are to a depth of approximately 500
meters where the mineralized structure is open at depth and along
strike. As part of a recent drill program to prove the continuity of
the mineralization at Ore Body A to a depth of over 800 meters, Jaguar drilled
four holes to depths ranging from 850 meters to 1,100 meters. Two of
these drill holes intersected the mineralized structure in the Ore Body A to a
depth of approximately 800 meters. A grade of approximately seven
grams per tonne was encountered in a narrow zone at depth thereby confirming the
extension of the mineralized structure. Jaguar’s team believes the
size of the mineralized structure and mineralization is similar to the existing
reserve base in this ore body to the depth of 500 meters. This is
also consistent with the characteristics of other gold mines in the Iron
Quadrangle, some of which have operated to depths of 2,400
meters. Jaguar intends to update the inferred resources category at
Turmalina using the information from these recent drill results but does not
have any plans to conduct further deep drilling at Turmalina at this
time.
As
part of the surface exploration to estimate resource potential in a newly
discovered oxide zone at Ore Body B, several trenches were opened in the
outcropping to expose and sample the mineralized zone. Channel
samples revealed two separate mineralized areas with average surface grades
ranging from 3 grams per tonne to 5 grams per tonne. Jaguar’s team
intends to update the geological model to incorporate this new data into the
overall mine model. The oxide ore from this new zone would be blended
with sulfide ore and processed through Turmalina Plant, providing immediate
additional lower cost ore.
At
the Satinoco Target (Ore Body C) and Satinoco Extension (Zone D), additional
gold bearing oxide ore has been identified in the weathered rock above the
sulfide zone, as well as within the sulfide zone. During 2008, 11,698
meters of drilling for a total of 62 drill holes were drilled in the Satinoco
structure to estimate oxide and sulfide mineral resources. Jaguar
expects to complete the resource estimate by the third quarter of
2009.
6
Jaguar
has also discovered a new target at the Turmalina mining complex, the Fazenda
Experimental Target, which management believes has significant potential and is
unrelated to the mineralized on-strike zone associated with Ore Bodies A, B and
C and Zone D. The Fazenda Experimental Target is located in a
structure parallel to the existing ore bodies and zones, where historic mining
work at shallow depths can be seen, approximately 5 kilometers from the
Turmalina Plant. Jaguar has conducted limited soil sampling,
trenching and other geo-chemical work in the area over the past two
years.
During
the third quarter of 2008, four drill holes in 716 meters were carried out,
which entailed 200 meters along strike. Three drill holes intercepted
mineralized structures. Intersection grades varied from 2.9 grams per
tonne to 6.5 grams per tonne at intervals of 3 meters or
less. Additional trenching has provided evidence that the continuity
near the surface extends well beyond areas where no drilling has taken
place.
During
2009, Jaguar intends to conduct additional underground exploration as part of
the forward development of Turmalina’s Ore Bodies A, B and C, as well as in Zone
D and at the Fazenda Experimental Target to increase resources with the
objective of generating reserves to further expand Turmalina’s annual production
beyond the current plan of 100,000 ounces.
Paciência
In
November 2003, Jaguar acquired the Paciência concessions from AngloGold
Ashanti.
In
March 2004, TechnoMine completed an NI 43-101 technical report on its Iron
Quadrangle properties, which included the Paciência/Santa Isabel Mine
resources. This technical report was revised in September 2004 and
further revised in December 2004.
In
2005, Jaguar acquired rights from IAMGold with respect to properties located on
approximately 2,307 acres in the aggregate in Rio Acima and Itabirito,
Brazil. These concessions, known as the Conglomerates, represent an
opportunity for Jaguar to eventually further explore, upgrade and expand Paciência’s
aggregate mineral resources and overall production. Since 2007,
Jaguar has been conducting exploration work at the Conglomerates as detailed
below.
During
2007, Jaguar successfully concluded a land swap agreement with another gold
producer whereby Jaguar expanded the concession package at the Paciência mining
complex to a contiguous 20 kilometers area adjacent to the São Vicente
lineament. This land area was first mined in the 17th century
by the Portuguese and the old works are highly visible, even from satellite
photography. Jaguar’s exploration efforts today are along this same
strike at depths deeper than the Portuguese could access without modern mining
equipment.
In
August 2007, TechnoMine completed an NI 43-101 compliant feasibility study for
the Paciência Project Santa Isabel Mine and processing plant.
Construction
of the CIP processing plant began immediately after the completion of the
feasibility study. Mining operations at the Santa Isabel Mine
commenced in April 2008 as the new Paciência Plant entered the commissioning
phase. Jaguar uses the cut-and-fill mining method at the Santa Isabel
Mine.
Commissioning
of the Paciência operation was interrupted late in the second quarter of 2008 to
repair a seam in the tailings pond liner which was improperly installed by a
contractor. During the initial charging and testing of the tailings
facility, a leak was detected by sub-surface monitors and ramp-up was
delayed. There was no discharge from the tailings pond. It
took approximately four weeks to properly repair and test the affected portion
of the liner. Commissioning operations at Paciência resumed in July
2008.
On
July 24, 2008, Paciência reported its first gold pour and operations were deemed
commercial during the latter part of the fourth quarter of 2008 based on
throughput rates.
During
2008, Jaguar conducted extensive underground development and exploration
activities at the NW01 Target (Marzagão) and the Conglomerates Target (Palmital)
to add additional tonnes vertically as well as horizontally in an effort to
increase the resource base for the Paciência operation. As part of
the exploration effort at these two targets, a total of 9,152 meters was drilled
in 42 drill holes during 2008.
7
Grades
observed at the NW01 Target are similar to those observed at the Santa Isabel
Mine. The main access ramp, which is 4 meter x 5 meter in size,
was completed early in 2008. A total of 1,191 meters in ramp and
drifts have been developed toward the Santa Isabel Mine located 2 kilometers to
the south of the NW01 portal. This cross cut will eventually
intersect the second level of the Santa Isabel Mine. During this
development, two new mineralized zones were encountered. Channel
samples were taken and Jaguar decided to develop a drift across the
zone. Jaguar’s management believes blind ore shoots likely exist
along the 20-kilometer contiguous concession base. By extending the
ramp to the second level of the Santa Isabel Mine, Jaguar’s management believes
the tonnes per vertical meter that will be identified over the 2 kilometers will
rise.
The
mineralized zones are partially exposed, with approximately 30 meters in length
and 1 meter to 3 meters in width. Channel sampling in this area gave
rise to grades ranging from 1 gram per tonne to 10 grams per
tonne. The extension is open towards the North West and laterally
towards the North East. Surface drill holes at the drift level
indicate the presence of an additional mineralized zone. A drill hole
from the area had an unusually high amount of “free” gold and a grade of 595
grams per tonne over 0.7 meter. The shape and other characteristics
of this structure suggest that other mineralized zones might be located in the
vicinity of the NW01 Target. Two surface rigs are presently drilling
in the South East extension of the drift with the objective of intercepting
these new zones.
A
second zone of mineralization at Paciência, not related to the São Vicente lineament
where Jaguar has a
resource and reserve base, is referred to as the Conglomerates
Target. The zone entails several concessions, which are located
approximately 12 kilometers east of the Paciência processing
plant. The property’s previous owners, the Anschutz Group and
Western Mining, carried out exploration campaigns between 1985 and 1990, which
included underground development and channel sampling, surface and underground
diamond drilling and geological mapping. Based on their efforts, a
pre NI 43-101 gold resource of approximately 110,000 ounces was
estimated.
In
order to estimate the resources held in the Conglomerates Target consistent with
NI 43-101 standards, Jaguar conducted a 7,191 meter in-fill drilling program
inside this target zone that consisted of 30 drill holes. Jaguar also
opened a portal into the host rock and developed 60 meters of a 4 meter x 5
meter ramp, which was concrete lined. During 2008, Jaguar carried out
1,306 meters of ramp and drifts to reach mining areas Level I and Level
II.
At
Level I, the conglomerate layer was identified to extend over 100 meters,
confirming the grades and widths obtained through surface
drilling. At the exposed section, the mineralized conglomerate shows
thicknesses that vary from less than 1 meter to 2.5 meters and grades of up to
200 grams per tonne. Partial channel results in the drift already
defined a mineralized zone with an average grade of 6.8 grams per tonne over a
150 m2
conglomerate layer area.
The
development of exploration drifts in Level I will continue to laterally expose
the conglomerate layer. Through additional drilling, Jaguar’s team
expects to estimate the resource potential in one known 300-meter section and
trace the geometry of the conglomerate reef to depth. Jaguar is
currently developing a new resource estimate and views this new geological
setting as additional feed for the Paciência processing plant.
At
Level II, further underground development is being carried out to provide access
to the mineralized zone for further in-fill drilling.
Sabará
In
2003, Jaguar commissioned TechnoMine to produce studies of its Sabará
property. Jaguar filed a feasibility study on the Zone B Mine of the
Sabará property on SEDAR on June 30, 2003 and filed a revised study on January
28, 2004, both of which can be found at http://www.sedar.com.
In
July 2003, Jaguar commenced pre-mining operations at the Sabará Zone B
Mine. In December 2003, Jaguar began pouring gold from the Sabará
Zone B Mine at the Caeté Plant. Mining operations at the Sabará Zone
B Mine concluded in the fourth quarter of 2005.
8
MSOL
and AngloGold Ashanti owned adjacent properties, known together as Lamego, in
the Sabará property area of the Iron Quadrangle region in Brazil. On
November 21, 2003, MSOL entered into an agreement with an AngloGold Ashanti
subsidiary, Mineração Morro Velho Ltda. (“Morro Velho”) regarding exploration at
the adjacent properties. AngloGold Ashanti applied for concession of
mining rights for sulfide mineral resources on its property, and MSOL received
concessions for oxide mineral resources on its property. Through
Morro Velho, AngloGold Ashanti granted to MSOL the right to explore for oxide
resources on AngloGold Ashanti’s Lamego property, and in exchange MSOL granted
to AngloGold Ashanti the right to explore for sulfide resources on MSOL’s Lamego
property. On November 21, 2007, Jaguar and AngloGold Ashanti entered
into an agreement, pursuant to which Jaguar transferred its interests in the
Lamego property (valued at US$8,060,560) to AngloGold Ashanti in consideration
of (i) satisfaction of the US$350,000 note payable related to the purchase of
quota shares of MTL, (ii) elimination of US$153,960 payable in connection with
leaching services provided by AngloGold Ashanti, and (iii) a reduction in future
net smelter royalty payments for the Paciência Mine equal to US$7,556,600 (net
smelter royalty payments are generally due on a monthly basis on a sliding scale
from 1.5% to 4.5% on gross revenues from gold produced, the percentage of such
royalty being determined based on the US$ price of gold at a given
time).
In
January 2005, Jaguar completed a feasibility study on the remaining gold oxides
at Sabará, which included Zones A and B and Lamego, and commissioned Scott
Wilson RPA to audit the feasibility study and issue a technical report in
accordance with NI 43-101. Scott Wilson RPA’s report was issued on
February 17, 2006 and can be found at http://www.sedar.com.
In
December 2005, Jaguar began crushing ore from Zone A at its new gold oxide heap
leach facility and recovery plant at Sabará (the “Sabará Plant”).
During
the third quarter of 2007, Jaguar concluded drilling activities at the Serra
Paraíso Target, an oxide zone near the Sabará mining and processing
complex. After carrying out metallurgical recovery tests and
completing its analysis of the Serra Paraíso Target drill program, Jaguar
initiated stripping operations at the Serra Paraíso mineralized zone and is now
moving its ore to the Sabará Plant. Management is currently reducing
mining operations in the Zone A Mine in favor of higher grade ore from the Serra
Paraíso Target.
In
order to add oxide resources to feed the Sabará Plant and thereby increase its
mine life, Jaguar developed an exploration program at its Sabará and Caeté
properties in a 15,000 hectare area. In addition to the Serra Paraíso
Target mentioned above, Jaguar is conducting channel sampling, soil geochemistry
and trenching at three different targets near the Sabará
operations. Preliminary results of such exploration identified new
targets, which have given rise to a drill program that began in the first
quarter of 2009.
Caeté
Project
The
Caeté Project consists of two main targets, the Roça Grande Target and the Pilar
Target.
In
November 2005, Jaguar entered into a mutual exploration and option agreement
with Vale for the Roça Grande Target with respect to seven concessions located
on 9,500 acres of highly prospective gold properties along 25 kilometers of a
key geological trend in the Iron Quadrangle. The contract between
Jaguar and Vale provided Jaguar with the exclusive right over a twenty-eight
month period beginning November 28, 2005 to explore and conduct feasibility
studies and to acquire gold mining rights in the Vale properties if the studies
supported economical mining operations. The contract granted
corresponding rights for Vale to explore the Jaguar property for iron and
acquire mineral rights in the property during a three-year period. In
November 2007, Jaguar notified Vale of its intent to exercise the option to
acquire all seven Roça Grande concessions. The legal procedures
necessary to execute the final transfer agreement in connection with the
acquisition of the Roça Grande concessions started in 2008 and are expected to
conclude by the second quarter of 2009.
Jaguar
has been exploring its Pilar Target since 2006 and initially contemplated
building a sulfide plant on site, but the acquisition of the Roça Grande Target
created an opportunity to develop a project with greater plant capacity to
receive ore from several mineral properties. Jaguar contemplates
mining underground non-refractory sulfide ore at the Pilar Target and truck the
ore for processing at the expanded Caeté Plant, which will also process sulfide
ore from the Roça Grande Target.
9
During
2007, a number of key events occurred with respect to the expansion of the Caeté
Project, including:
|
|
•
|
Jaguar
commissioned TechnoMine to prepare technical studies with respect to the
expansion,
|
|
|
•
|
TechnoMine
completed a scoping study on the Caeté
Project,
|
|
|
•
|
Jaguar
received the Implementation License (LI) for the Caeté
Project,
|
|
|
•
|
Jaguar
secured the power contract for a 2009 start-up of the Caeté Project,
and
|
|
|
•
|
TechnoMine
completed an NI 43-101 technical report on the Caeté Project
resources.
|
In
September 2008, expansion plans at the Caeté Project continued as TechnoMine
completed the NI 43-101 feasibility study technical report. Based on
the feasibility study, processing facilities will include crushing and grinding
circuits followed by a gravity separation circuit along with a leaching and
CIP-ADR (carbon-in-pulp adsorption/desorption/recovery) plant, which
will process the sulfide ore from Pilar, Roça Grande, and other
nearby targets. This new plant is expected to utilize much of the
existing infrastructure of the previously closed Caeté heap leach and
carbon-in-column (“CIC”) facility. Jaguar intends to use a
combination of "cut and fill" and "selective stoping" methods at both mines,
which contemplates a treated tailings backfill system.
By
the end of the third quarter in 2008 all necessary permits and licenses for the
construction and commissioning phase had been received and Jaguar initiated
civil works for the milling and treatment circuits.
However,
in November 2008, due to the retraction in gold prices, financial markets and
worldwide equity values, including the gold sector, Jaguar temporarily suspended
development of the Caeté Project pending an assessment of market conditions and
the availability of capital to move the project forward.
Consistent
with the decision to suspend the development of the Caeté Project, underground
work at the Roça Grande Target has been temporarily suspended; however,
development at the Pilar Mine continued. Beginning in December 2008,
Jaguar began transporting ore by truck from the Pilar Mine to the Paciência
processing plant to supplement the ore being supplied from Paciência’s Santa
Isabel Mine. Jaguar expects to continue this practice until such time
as the ore from the Pilar Mine would be needed at the future Caeté processing
plant.
As
part of Jaguar’s effort to identify and add to the estimated gold resources
reported in the November 2007 technical report, 75,000 meters of additional
drilling are planned over the next five years in the mineral properties
identified to supply the Caeté Plant.
During
2008, Jaguar completed 31,501 meters of drilling for a total of 92 drill holes
in the exploration concessions that are part of the Caeté Project mining
complex.
Pedra
Branca Project
In
March 2007, Jaguar entered into a joint venture agreement with Xstrata to
explore the Pedra Branca gold project (the “Pedra Branca Project”) in the State
of Ceará in northern Brazil (the “Joint Venture Agreement”). Under
the Joint Venture Agreement, a new company or companies will be formed to mine
economic gold deposits. Jaguar shall pay an aggregate fee of
US$150,000 over a two year period in exchange for an option to hold a 51 percent
ownership interest in the new company or companies by investing an aggregate of
US$3.85 million in exploration expenditures within the next four
years. Jaguar is subject to annual exploration expenditure targets
for each year in which it maintains such option. Furthermore, Jaguar
may increase its ownership interest in certain gold deposits to 60 percent
through an additional investment of US$3 million by the fifth anniversary of the
Joint Venture Agreement, subject to the rights of Xstrata to return to their 49
percent interest through additional contributions to the joint venture for
certain properties which have gold deposits of two million ounces or
more. Certain properties within the Pedra Branca Project that
are dominated by base metal deposits, or which have gold deposits of less than
one million ounces, may be held in different ownership percentages and be
subject to different conditions, or removed from the joint venture.
The
Pedra Branca Project has mineral rights to 37 concessions totaling approximately
159,000 acres in a 65-kilometer shear zone. The concessions are
located in and around municipal areas with good infrastructure.
10
Xstrata
carried out a preliminary exploration program that covered only 25 kilometers of
the shear zone. The program identified 10 kilometers of soil
anomalies, including two large anomalies referred to as Coelho and Mirador
targets. For the most part, the mineralized formations uncovered by
Xstrata’s preliminary efforts are open along the extremity and lead both
companies’ geologists to believe the area has significant potential for gold
mineralization, which could include the presence of both oxide and sulfide
formations in large structures.
Jaguar
is currently conducting a comprehensive exploration program at the Pedra Branca
Project, including extensive geological mapping, drainage and soil geochemistry,
detailing of zones with anomalies, trenching and diamond
drilling. During the third quarter of 2007, Jaguar began a diamond
drill program to test the continuity of the mineralization at
depth. To date, 57 drill holes totaling 5,561 meters have been
completed.
Contracts
with AngloGold Ashanti
On
November 21, 2003, MSOL entered an agreement with AngloGold Ashanti’s
subsidiary, Morro Velho, pursuant to which MSOL is provided with certain ore
treatment services at the Queiróz plant of AngloGold Ashanti ("Queiróz Plant"),
gold refining services and marketing services. The treatment
operations began in the first quarter of 2006. MSOL agreed to deliver
for treatment a certain number of metric tons of gold each year for four years
starting in January 2006 and ending in 2009. If AngloGold Ashanti
fails to treat the scheduled amount of ore, it will pay a penalty to
MSOL. AngloGold Ashanti will provide gold refining services and each
year will refine the amount of gold agreed upon by the parties by December 30th
of the preceding year. AngloGold Ashanti further agreed to market
MSOL’s gold. As a fee for the refining and marketing aspects of the
contract, MSOL will pay one percent of the gross income from sales resulting
from the refining and marketing services. The agreement is in effect
with respect to the treatment services until December 31, 2009, and with respect
to the refining and marketing services until 2017, or a previous date if the
sources of natural resources are exhausted. MSOL may terminate the
agreement if it determines through a mineral survey that the exploitation of
certain specified deposits is not feasible. In January 2007, Jaguar
notified AngloGold Ashanti that it elected not to exercise its rights to process
non-refractory ore at the Queiróz Plant. This decision was based on
an internal assessment of other production alternatives, which Jaguar has
determined should generate a greater level of profitability in the future by
processing available ore through a Jaguar-owned facility.
On
November 21, 2003, Jaguar acquired its Paciência, Catita, Juca Vieira (Catita
II), Bahú, Marzagão, Camará and Morro do Adão properties in the Iron Quadrangle
region from AngloGold Ashanti. Under the terms of such transaction,
AngloGold Ashanti has the right, following exhaustion of the reserves developed
from the known resources at the Paciência, Juca Vieira, Catita, Bahú, Marzagão,
Camará and Morro do Adão properties, to develop a full valuation of any of such
properties, including drilling works. If the valuation identifies the
existence, in one or more areas, of measured and indicated resources of a
minimum of 750,000 ounces, AngloGold Ashanti will have the right to reacquire up
to 70 percent of any of such properties at an ascribed value of US$10.50 per
ounce of the new measured and indicated resources.
AngloGold
Ashanti’s rights pertain to only three of the twelve concessions at Jaguar’s
Paciência property (Paciência, Bahú and Marzagão) and four concessions at the
Sabará property (Catita, Catita II, Camará and Morro do Adão). The
mineralization potential at Sabará is not considered substantial. These
seven concessions represent only 16% of the hectares of Jaguar’s concession base
in Minas Gerais. At this time, none of Jaguar’s resources, operations and
projections for the next five years are impacted by this provision nor expected
to be in the next several years.
Laboratory
During
the third quarter of 2005, Jaguar began construction of its own testing
laboratory adjacent to the Caeté Plant. The laboratory was completed
and became operational in the fourth quarter of 2005. Jaguar’s
on-site testing laboratory expedites process control and certain exploration
testing and alleviates some of the delays experienced by excessive demand on the
independent laboratories due to surging mining activity. Jaguar also
utilizes the services of a local, independent laboratory.
11
Corporate
Transactions
On
December 20, 2005, MTL obtained a secured financing facility from RMB
International (“RMB”) in an amount of up to US$14,000,000 (the “Turmalina
Facility”) which was used primarily to finance the construction and start-up of
the Turmalina Mine. In connection with the Turmalina Facility, (i)
MTL and MSOL provided security interests in the cash flow, equipment and other
assets of Turmalina and Sabará operations and a pledge, (ii)
Jaguar issued a guaranty of MTL’s obligations under the Turmalina Facility, and
(iii) Jaguar issued 1,093,835 unlisted warrants to the Turmalina Facility
lenders (which had an exercise price of Cdn.$4.50 and an expiry date between
June 30, 2009 and March 31, 2010 have all been exercised), 350,000 listed
warrants to the lenders’ agent (all of such warrants were exercised at a price
of Cdn.$4.50), and 300,000 unlisted warrants to Auramet Trading, LLC in its
capacity as an advisor to Jaguar with respect to the Turmalina Facility (all of
such warrants were exercised at a price of Cdn.$3.90), in each case with each
warrant entitling the holder to purchase one common share of
Jaguar. In the fourth quarter of 2005, Jaguar entered into a forward
sales contract agreement with the lender under the Turmalina Facility to
implement a risk management strategy to manage commodity price exposure on gold
sales. In September 2007, Jaguar received an amendment to the loan
facility agreement from RMB, which allowed Jaguar to close the forward sales
contracts. In March 2008, Jaguar paid RMB US$9.8 million plus
US$181,000 accrued interest to repay the Turmalina Facility agreement in full,
paid RMB US$22.1 million to close the forward sales contracts and closed the
forward purchase contracts realizing a gain of US$7.4 million, thereby
effectively reducing the net loss of the forward contracts to US$14.8 million
(of which US$14.5 million was accrued as of December 31, 2007). No
additional charges were realized during 2008 for the forward
contracts.
On
March 27, 2006, Jaguar completed a public offering in Canada and private
placement offering in the United States of 10,100,000 common shares at a price
of Cdn.$5.25 pursuant to an Underwriting Agreement dated March 9, 2006 among
Jaguar and Blackmont Capital Inc. (“BCI”), BMO Nesbitt Burns Inc. (“BMO”), RBC
Dominion Securities Inc. (“RBC”), TD Securities Inc. (“TD Securities”) and
Paradigm Capital Inc. as underwriters. The underwriters received a
cash commission equal to 5.5 percent of the gross proceeds of the offering,
underwriter options to purchase up to 1,335,000 common shares at a price of
Cdn.$5.25, which they exercised at the closing on March 27, 2006, and
compensation warrants to purchase up to 343,050 common shares at a price of
Cdn.$5.25 with an expiry date of March 27, 2008. As of January 31,
2008, 198,969 common shares were purchased as a result of the exercise of such
compensation warrants.
On
February 1, 2007, Jaguar’s Board of Directors adopted a shareholder rights plan
(the “Shareholder Rights Plan”) which is intended to ensure the fair treatment
of shareholders in connection with any take-over bid for common
shares. The Shareholder Rights Plan was not being adopted in response
to any proposal to acquire control of Jaguar. The Shareholder Rights
Plan seeks to provide shareholders with adequate time to properly assess a
take-over bid without undue pressure. It also is intended to provide
the Board with more time to fully consider an unsolicited take-over bid and, if
considered appropriate, to identify, develop and negotiate other alternatives to
maximize shareholder value. The rights issued under the Shareholder
Rights Plan will become exercisable only when a person, including its affiliates
and associates and persons acting jointly or in concert with it, acquires or
announces its intention to acquire beneficial ownership of common shares which
when aggregated with its current holdings total 20 percent or more of the
outstanding common shares (determined in the manner set out in the Shareholder
Rights Plan) without complying with the “Permitted Bid” provisions of the
Shareholder Rights Plan or without approval of the Board. Under the
Shareholder Rights Plan those bids that meet certain requirements intended to
protect the interests of all shareholders deemed to be “Permitted
Bids”. Permitted Bids must be made by way of a take-over bid circular
prepared in compliance with applicable securities laws and, among other
conditions, must remain open for at least sixty (60) days. In the
event a take-over bid does not meet the Permitted Bid requirements of the
Shareholder Rights Plan, the rights will entitle shareholders, other than the
person making the take-over bid and its affiliates and associates and persons
acting jointly or in concert with it, to purchase additional common shares at a
substantial discount to the market price of the common shares at that
time. The TSX accepted notice of the Shareholder Rights Plan and the
shareholders ratified the adoption of the Shareholder Rights Plan on May 10,
2007.
On
February 27, 2007, Jaguar filed a final short form prospectus to issue up to
340,090 common shares to the holders of 5,398,250 common share purchase
warrants, upon early exercise of the warrants. Each warrant entitled
the holder thereof to acquire one common share of Jaguar at a price of Cdn.$4.50
at any time prior to 5:00 p.m. (Eastern Standard Time) on December 31,
2007. Each warrant entitled the holder thereof to acquire an
additional 0.063 of one common share if such holder exercised his or her
warrants during the thirty (30) day early exercise period commencing on February
28, 2007, and ending at 5:00 p.m. (Eastern Standard Time) on March 30,
2007.
12
The
additional 0.063 of a common share issued upon the exercise of the warrants
during the early exercise period represented a value of Cdn.$0.43 based on the
closing price on February 26, 2007 of Cdn.$6.79. If at least 66 2/3
percent of the warrants outstanding on February 28, 2007 were exercised at or
before the early warrant expiry time, each warrant that had not been so
exercised during the early exercise period (except in limited circumstances with
respect to U.S. warrant holders) would be exchanged, without any further action
on the part of the warrant holder, including payment of the exercise price
thereof or any other additional consideration, for a fraction of a common share
equal to: (A) one plus (B) 0.063 multiplied by 50 percent minus (C) Cdn.$4.50
divided by the lesser of (i) the volume weighted average trading price of the
common shares on the TSX for the five trading days ending on the early exercise
expiry date, and (ii) the closing price of the common shares on the early
exercise expiry date. As a result of the early exercise program
described in this paragraph, 4,818,852 warrants were exercised resulting in the
issuance of 5,122,428 common shares to the warrant holders. No agency
fee was paid by Jaguar in connection with the distribution of the early exercise
shares or the exchange shares being qualified under the short form
prospectus. BCI acted as financial advisor and soliciting dealer
manager to Jaguar in connection with the issuance of the early exercise shares
and the exchange shares. Jaguar paid BCI a financial advisory fee of
3 percent of the exercise price for each warrant that is submitted for exercise
in connection with the early exercise and automatically exchanged for exchange
shares. The early exercise warrant transaction was approved by
shareholders on February 27, 2007 and by warrant holders on February 28,
2007.
On
March 22, 2007, Jaguar closed a private placement of 75,000
units. The units were sold by a syndicate led by TD Securities and
included BCI, BMO and RBC. The underwriters exercised their option to
purchase an additional 15 percent of the number of the units offered to cover
over-allotments, resulting in aggregate gross proceeds of Cdn.$86.3 million
(US$74.5 million) from the sale of 86,250 units. The units are
comprised of a secured note in the principal amount of Cdn.$1,000, bearing a
coupon of 10.5 percent, payable semi-annually in arrears, and 25 common shares
of Jaguar. A total of 2.16 million new shares were issued relating to
the private placement. The notes were listed on the TSX on July 26,
2007, under the symbol “JAG.NT”.
On
July 23, 2007, Jaguar common shares began trading under the symbol “JAG” on the
NYSE Arca Exchange.
On
February 21, 2008, Jaguar issued 8,250,000 common shares at a price of
Cdn.$13.40 per share for proceeds of Cdn.$110,550,000. The offering
price was determined by negotiation between Jaguar and a syndicate led by RBC
and included TD Securities, BCI, BMO, and Raymond James Ltd. Jaguar
granted the underwriters an over-allotment option, exercisable in whole or in
part up to 30 days following the closing of the transaction, to purchase up to
an additional 1,237,500 common shares at a price of Cdn.$13.40 per common share,
which would have increased the aggregate proceeds of the offering to
Cdn.$127,132,500 if the over-allotment option had been fully
exercised. The over-allotment option was not exercised and no
additional shares were issued subsequent to the closing.
13
DESCRIPTION OF THE
BUSINESS
General
Jaguar
is a gold mining company currently engaged in gold production and in the
acquisition, exploration, development and operation of gold mineral properties
in Brazil. In addition, Jaguar may consider the acquisition and
subsequent exploration, development and operation of other gold properties in
Brazil.
Jaguar’s
wholly-owned gold producing properties and projects are located in the Iron
Quadrangle region near Belo Horizonte, Minas Gerais,
Brazil: Turmalina, Paciência, Sabará and the Caeté
Project. Through its wholly-owned subsidiaries, MSOL and MTL, Jaguar
has interests in, and controls the mineral rights, concessions and licenses to
the mineral resources and reserves presented in Tables 1 and 2 under the section
entitled “Mineral Resources
and Reserves”.
The
technical report on the Turmalina Gold Project dated October 29, 2004, revised
on December 16, 2004 and further revised on December 20, 2004, which covers the
Turmalina property, the Scott Wilson RPA Turmalina Technical Report and the
TechnoMine Turmalina Expansion Technical Report, as defined below, contain
further details with respect to reported gold reserves and gold resources at
Turmalina - See “Scott Wilson
RPA Turmalina Technical Report” and “TechnoMine Turmalina Expansion
Technical Report” below.
The
TechnoMine Paciência Technical Report, as defined below, contains additional
details regarding currently reported gold resources and reserves at Paciência -
See “TechnoMine Paciência
Technical Report” below.
The
TechnoMine Quadrilátero Technical Report and the Scott Wilson RPA Sabará
Technical Report, as defined below, contains additional details regarding
reported gold resources and reserves at Sabará - See “TechnoMine Quadrilátero Technical
Report” and “Scott
Wilson RPA Sabará Technical Report” below.
The
TechnoMine Caeté Project Technical Report, as defined below, contains additional
details regarding currently reported gold resources in the Caeté Project -
See “TechnoMine Caeté
Technical Report” below.
In
addition to the mining properties described in the preceding paragraph, in March
2007, Jaguar entered into the Joint Venture Agreement with Xstrata with respect
to the Pedra Branca Project located in the State of Ceará in northeastern
Brazil. Pursuant to the Joint Venture Agreement, Jaguar is currently
conducting a comprehensive exploration program at the Pedra Branca
Project.
The
Technical Reports (as defined below) contain additional information regarding
gold reserves and gold resources on Jaguar’s properties. See “Mining Projects”
below.
Gold
production and sales
Jaguar
began pouring gold in December 2003. During 2008, Jaguar produced a
total of 115,348 ounces of gold at an average cash operating cost of US$429 per
ounce compared to 70,113 ounces produced at an average cash operating cost of
US$346 per ounce during 2007. For the year ended December 31, 2008,
gold sales totaled 108,944 ounces at an average price of US$860 per ounce
compared to 67,350 ounces sold at an average price of US$710 per ounce for the
year ended December 31, 2007. Increases in gold production during
2008 primarily resulted from the commencement of gold production at Paciência,
which was under construction during fiscal 2007 and commenced gold production in
July 2008.
14
The
table below provides greater detail regarding total gold production at
Turmalina, Paciência and Sabará for the year ended December 31,
2008:
|
Ore
processed
(000
tonnes)
|
Feed
Grade
(grams
per tonne)
|
Plant
Recovery
Rate
(%)
|
Production
(ounces)
|
Cash
operating
cost
per tonne
(US$)
|
Cash
operating
cost
per ounce
(US$)
|
|
|
Turmalina
|
481
|
5.46
|
88
|
72,785
|
55.30
|
364.00
|
|
Paciência
|
277
|
3.28
|
92
|
24,364
|
43.00
|
443.00
|
|
Sabará
|
475
|
1.54
|
66
|
18,199
|
22.50
|
667.00
|
|
Total
|
1,233
|
3.46
|
85
|
115,348
|
39.90
|
429.00
|
During
2009, Jaguar estimates it will produce 165,000-175,000 ounces of gold as
follows:
|
Estimated
|
Estimated
|
|
|
FY
2009
|
FY
2009
|
|
|
Operation
|
Production
|
Cash
Operating Cost
|
|
(ounces)
|
(US$/ounce)
|
|
|
Turmalina
|
80,000-85,000
|
$354-387
|
|
Paciência
|
65,000-70,000
|
$362-398
|
|
Sabará
|
20,000
|
$374-411
|
|
Total
|
165,000-175,000
|
$360-394
|
Operating
cash cost estimates for 2009 are based on an average exchange rate of R$2.00 to
R$2.20 per US$1.00. As of January 30, 2009, the exchange rate was
R$2.31 per US$1.00.
With
respect to the Caeté Project, Jaguar targets initial gold production will
commence approximately 18 months after the project is re-started and will be
expanded to approximately 160,000 ounces per year in 2013.
All
of Jaguar’s production facilities are, or will be, near Jaguar’s mineral
concessions and are accessible via existing roads. Jaguar believes it
has an advantage over other gold mine operators due to the clustered nature of
its resource concessions and the proximity of its concessions to its processing
facilities and existing infrastructure.
Jaguar
has contracted with AngloGold Ashanti for AngloGold Ashanti to arrange sales of
Jaguar’s gold bullion with gold brokers at Jaguar’s request and direction, which
provides Jaguar with ready access to gold markets at limited costs and
risks.
Specialized
Skill and Knowledge
Jaguar
is staffed by an experienced senior management team with over 100 years of
collective experience exploring, developing and operating gold mines in
Brazil. Jaguar’s Chief Executive Officer and President, Daniel R.
Titcomb, has been involved in continuous mining exploration and development in
Brazil since 1993. Jaguar’s Chief Operating Officer, Lúcio Cardoso,
was formerly superintendent of AngloGold Ashanti's gold division and has over 35
years experience in the Brazilian mining sector. Jaguar’s Vice
President of Exploration and Engineering, Adriano L. Nascimento, also has
approximately 30 years experience in the Brazilian mining industry and held the
position of senior engineer at AngloGold Ashanti for 11 years, where he was
responsible for the production department of several mines, including Mina
Grande, the deepest and one of the oldest mines in Brazil. Jaguar’s Chief
Geologist, Jaime Duchini, has over 25 years experience in exploration in the
Iron Quadrangle.
15
Competitive
Conditions
The
gold exploration and mining business is a competitive business in all its
phases. Jaguar competes with numerous other companies and individuals
in the search for and the acquisition of mineral licenses, permits and other
mineral interests, as well as for acquisition of equipment and the recruitment
and retention of qualified employees. There is also significant
competition for the limited number of gold property acquisition
opportunities. The ability of Jaguar to acquire gold mineral
properties in the future will depend not only on its ability to develop its
present properties, but also on its ability to select and acquire suitable
producing properties or prospects for gold development or mineral
exploration.
Jaguar
has an ongoing relationship with AngloGold Ashanti through contractual royalty
rights in certain of the properties and an agreement to provide Jaguar’s
operating company with gold refining and marketing services.
Jaguar
has built its base upon the acquisition of later-stage gold exploration
properties in the Iron Quadrangle region of Brazil at relatively depressed
prices. Jaguar believes that its asset acquisition costs combined
with the clustered nature of its mineral assets and production facilities gives
it an advantage over other similarly-sized competitors.
Employees
Jaguar
had 1,328 employees as at December 31, 2008.
Foreign
Operations
All
of Jaguar’s mineral projects are owned and operated though its wholly-owned
subsidiaries, MSOL and MTL. All of the wholly-owned properties are
located near Belo Horizonte, Minas Gerais, Brazil. Jaguar is entirely
dependent on its foreign operations for the exploration and development of gold
properties and for production of gold.
Mineral
Projects
Except
as otherwise noted, the following descriptions and summaries of Jaguar’s
material projects, are derived from the following Technical
Reports:
|
|
(i)
|
The
Technical Report on the Turmalina Gold Project dated September 10, 2005
and revised on March 10, 2006, as supplemented by a Technical Report on
Turmalina Gold Project dated March 14, 2006 and as further revised on July
31, 2006, which cover the Turmalina property (the “Scott Wilson RPA
Turmalina Technical Report”);
|
|
|
(ii)
|
The
Technical Report on the Turmalina Expansion Feasibility Study dated
September 9, 2008 (the “TechnoMine Turmalina Expansion Technical Report”),
which covers the Satinoco property;
|
|
|
(iii)
|
The
Technical Report on the Paciência Gold Project Santa Isabel Mine dated
August 7, 2007 (the “TechnoMine Paciência Technical Report”), which covers
the Paciência-Santa Isabel
property;
|
|
|
(iv)
|
The
Technical Report on Jaguar’s initial concessions on the Quadrilátero dated
September 17, 2004 and revised on December 20, 2004 (the “TechnoMine
Quadrilátero Technical Report”), which covers the Sabará, Paciência and
Santa Bárbara properties;
|
|
|
(v)
|
The
Technical Report on the Sabará Project dated February 17, 2006 (the “Scott
Wilson RPA Sabará Technical Report”), which covers Zones A and B and
Lamego (also called Zone C) and Queimada properties;
and
|
|
|
(vi)
|
The
Technical Report on the Caeté Expansion Feasibility Study dated September
15, 2008 (the “TechnoMine Caeté Technical Report” and together with the
technical reports in items (i)-(v), the "Technical Reports"), which covers
the Pilar and Roça Grande
properties.
|
This
Annual Information Form contains only summary information regarding Jaguar’s
properties. A complete description of Jaguar’s properties and
associated maps, photographs and references can be found in the Technical
Reports filed on SEDAR (at www.sedar.com), and such reports are hereby
incorporated by reference herein.
16
The
Qualified Person, as such term is defined in NI 43-101, who prepared the
TechnoMine Turmalina Expansion Technical Report, the TechnoMine Paciência
Technical Report, the TechnoMine Quadrilátero Technical Report, and the
TechnoMine Caeté Technical Report referred to above was Ivan C. Machado, M.Sc.,
P.E., P.Eng. Mr. Machado is a principal of TechnoMine and is
independent for the purposes of NI 43-101.
The
Qualified Persons who prepared the Scott Wilson RPA Turmalina Technical Report
and the Scott Wilson RPA Sabará Technical Report were Graham G. Clow, P.Eng.,
and Wayne W. Valliant, P.Geo. Mr. Clow is a principal of Scott Wilson
RPA, and Mr. Clow and Mr. Valliant are independent for the purposes of NI
43-101.
Mineral
Resources and Reserves
During
2008, Jaguar retained TechnoMine to prepare feasibility studies for its Caeté
Project and expansion of the Turmalina operation. TechnoMine
completed the NI 43-101 compliant feasibility study technical reports on
September 15, 2008 and September 9, 2008, respectively.
TechnoMine
completed the feasibility studies and in concert with Jaguar reviewed the
information and prepared a table of mineral resources and reserves (the
“September 2008 Review”). Ivan C. Machado, M.Sc., P.E., P.Eng.
audited the September 2008 Review. Mr. Machado is a Qualified Person
as such term is defined in NI 43-101.
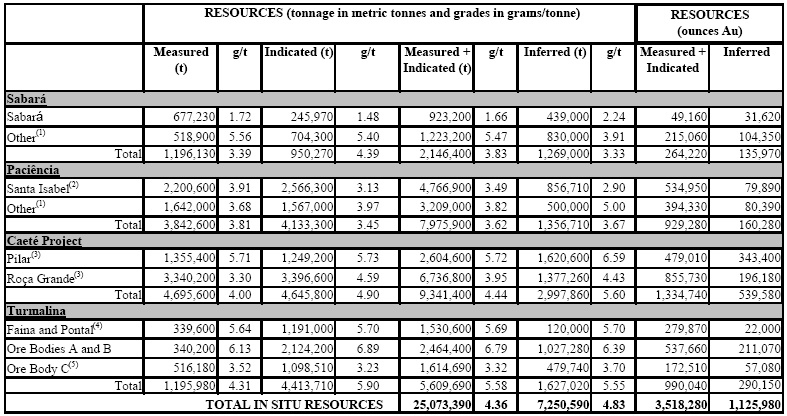
Based
on the September 2008 Review, Jaguar reported (i) measured and indicated
resources of 23,095,210 tonnes with an average grade of 4.74 grams per tonne
containing 3,517,860 ounces of gold and (ii) 6,704,750 tonnes of inferred
resources with an average grade of 5.15 grams per tonne containing 1,109,030
ounces of gold. Jaguar’s proven and probable mineral reserves, which
are included in the measured and indicated mineral resource figure above, were
13,510,470 tonnes with an average grade of 4.69 grams per tonne containing
2,033,620 ounces of gold. The figures reported in the September 2008
Review did not consider 2007 and 2008 production from the Turmalina operations
and a small test mining production at Paciência in 2006.
In
consideration of the significant improvement in global gold prices, Jaguar and
TechnoMine redefined the design criteria to reflect stronger gold
markets. Based on the review recently completed, as of December 31,
2008, Jaguar’s mineral resources are (i) measured and indicated resources of
25,073,390 tonnes with an average grade of 4.36 grams per tonne containing
3,518,270 ounces of gold and (ii) 7,250,590 tonnes of inferred resources with an
average grade of 4.83 grams per tonne containing 1,125,970 ounces of
gold. Jaguar’s proven and probable mineral reserves, which are
included in the measured and indicated mineral resource figure above, are
14,904,840 tonnes with an average grade of 4.16 grams per tonne containing
1,993,550 ounces of gold.
See
below detailed tables of Jaguar’s mineral resources and reserves as at December
31, 2008.
17
Table
1 - Summary of Estimated Mineral Resources*
Table
2 - Summary of Estimated Mineral Reserves*
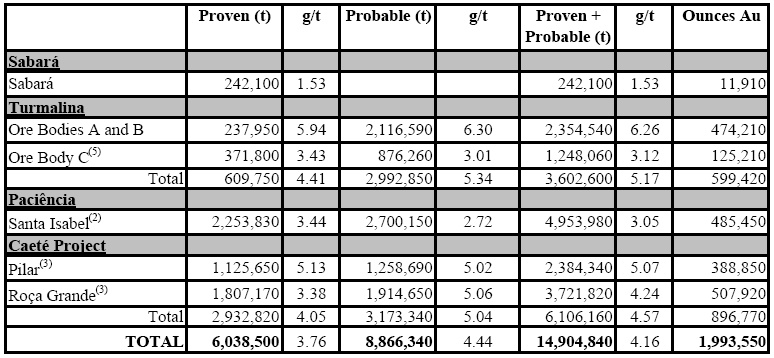
* Mineral
resources listed in Table 1 include mineral reserves listed in Table
2. Totals reflect depletion from production through
December 31, 2008. Some columns and rows may not total due to
rounding.
(1)
TechnoMine NI 43-101 Technical Report on the Quadrilátero Gold Project filed on
SEDAR on December 20, 2004.
|
(2)
TechnoMine NI 43-101 Technical Report on the Paciência Gold Project Sta.
Isabel Mine filed on SEDAR on August 9,
2007.
|
(3)
TechnoMine NI 43-101 Technical Report on the Caeté Gold Project filed on SEDAR
on September 17, 2008.
(4)
TechnoMine NI 43-101 Technical Report on the Turmalina Gold Project filed on
SEDAR on December 20, 2004.
(5)
TechnoMine NI 43-101 Technical Report on the Turmalina
Expansion filed on SEDAR on September 11, 2008.
18
Although
Jaguar has carefully prepared and verified the mineral resource and reserve
figures presented herein, such figures are estimates, which are, in part, based
on forward-looking information, and no assurance can be given that the indicated
level of gold will be produced. Estimated reserves may have to be
recalculated based on actual production experience. Market price
fluctuations of gold as well as increased production costs or reduced recovery
rates, and other factors may render the present proven and probable reserves
unprofitable to develop at a particular site or sites for periods of
time. See “Risk
Factors” and “Cautionary Note Regarding
Forward-Looking Statements”.
Mining
Concession and Exploration Permitting Requirements and Status
In
Brazil mining activity requires the grant of concessions from the DNPM, an
agency of the Brazilian federal government responsible for controlling and
applying the Brazilian Mining Code. Government concessions consist of
exploration awards, exploration licenses, and mining
permits. Exploration awards permit the holder to begin exploration of
the property, exploration licenses allow the holder to proceed with exploration
to determine feasibility of mining the property, and mining permits allow the
holder to mine the property.
Applications
for mining concessions must include an independently-prepared environmental plan
that deals with water treatment, soil erosion, air quality control,
re-vegetation and reforestation (where necessary) and
reclamation. Mining concessions will not be granted unless the mining
plan, including the environmental plan, is approved by the state
authorities.
Based
on the experience of management in obtaining licenses, Jaguar has made estimates
anticipated time frames for receiving licenses, upon which it has based
projections for capital expenditures, revenues and earnings. The time
frames in which licenses are issued are dependent upon the actions of regulatory
authorities and third parties.
The
following table lists the status of Jaguar’s awards, licenses and
permits.
|
Property
|
Permits
|
|
|
Phase
|
Status
|
|
|
Sabará
|
||
|
Sabará
Plant
|
Implementation
License
|
Received
September 2005
|
|
Sabará
Plant
|
Operation
License
|
Received
December 2006
|
|
Sabará
Zone A Mine
|
Implementation
License
|
Received
September 2006
|
|
Sabará
Zone A Mine
|
Operation
License
|
Received
November 2006
|
|
Paciência
|
||
|
Santa
Isabel Mine and Plant
|
Implementation
License
|
Received
May 2007
|
|
Santa
Isabel Mine and Plant
|
Operation
License
|
Received
October 2008
|
|
Caeté
Project
|
||
|
Caeté
Plant
|
Implementation
License
|
Received
July 2007
|
|
Caeté
Plant
|
Operation
License
|
Expected
June 2010
|
|
Caeté
Tailing Dam
|
Previous
License
|
Received
November 2007
|
|
Caeté
Tailing Dam
|
Implementation
License
|
Expected
March 2009
|
|
Caeté
Tailing Dam
|
Operation
License
|
Expected
December 2009
|
|
Roça
Grande Mine
|
Operation
License
|
Received
April 2008
|
|
Pilar
Mine
|
Implementation
License
|
Received
August 2008
|
|
Pilar
Mine
|
Operation
License
|
Expected
June 2010*
|
|
Turmalina
|
||
|
Turmalina
Mine and Plant
|
Implementation
License
|
Received
August 2006
|
|
Turmalina
Mine and Plant
|
Operation
License
|
Received
March 2007
|
|
Turmalina
Mine and Plant Expansion I
|
Operation
License
|
Expected
April 2009
|
|
Turmalina
Tailing Dam Expansion I
|
Implementation
License
|
Expected
February
2009
|
*An AAF permit has been
granted to the Pilar Mine for production of up to 100,000 tonnes per
year.
19
JAGUAR GOLD OPERATIONS AND
PROJECTS
In
the state of Minas Gerais in Brazil, Jaguar has three operating properties
(Turmalina, Paciência and Sabará) and one property under development (the Caeté
Project). See detailed description of each property
below.
|
Turmalina
Operations
|
Paciência
Operations
|
Sabará
Operations
|
Caeté
Project
|
|
Turmalina
Plant
|
Paciência
Plant
|
Sabará
Plant
|
Caeté
Plant
|
|
Turmalina
Mine (Ore Bodies A and B)
|
Santa
Isabel Mine
|
Sabará
Zone A Mine
|
Roça
Grande Mine
|
|
Satinoco
(Ore Body C)
|
Bahú
Target
|
Serra
Paraíso Target
|
Pilar
Mine
|
|
Satinoco
Extension (Ore Body D)
|
NW01
Target
|
Rio
de Peixe Oxide
|
Catita
II Target
|
|
Faina
and Pontal Targets
|
Rio
de Peixe Sulfide
|
Catita
Oxide
|
Morro
do Adão Target
|
|
Fazenda
Experimental Target
|
Conglomerates
Target
|
Boa
Vista Target
|
Camará/Trindade
Targets
|
Scoot Wilson RPA Turmalina
Technical Report
Background
Scott
Wilson RPA prepared a NI 43-101 Technical Report for Turmalina, dated July 31,
2006, filed on SEDAR August 1, 2006. This report is no longer current
in that two years of production have taken place and it has not been updated to
reflect any new information since the date of the report, including, but not
limited to, resources and reserves, mine and plant production, metallurgy,
operating and capital costs and environmental data. The following
description of the Turmalina Project is derived from the summary contained in
the Scott Wilson RPA Turmalina Technical Report.
Gold
was first discovered in the Turmalina area in the sixteenth
century. AngloGold Ashanti
explored the area extensively between 1979 and 1988 utilizing geochemistry,
trenching, drilling and 3.9 kilometers of underground development. This
exploration program led to the discovery of the following mineralized bodies:
Turmalina, Satinoco, Faina and Pontal. During 1992 and 1993,
AngloGold Ashanti mined 373,000 tonnes of oxide mineralization from an open pit
on the Turmalina zone and recovered 35,500 ounces of gold using heap leach
technology. Subsequently, AngloGold Ashanti explored a possible
downward sulphide extension by driving a ramp beneath the pit and drifting on
two levels in the mineralized zone at approximately 50 and 75 meters below the
pit floor. Jaguar acquired the Turmalina Gold Project from
AngloGold Ashanti on September 30, 2004.
Mining
Status and Permitting
Jaguar
received an implementation license for the Turmalina Gold Project in December
2005. In the fourth quarter of 2005 Jaguar commenced construction of
the 60,000 ounce per year Turmalina facility. The majority of the
infrastructure, such as roads, power, ramp and access to the underground
orebody, was in place as of the date of the Scott Wilson RPA Turmalina Technical
Report. Jaguar received the operation license with respect to the
Turmalina Gold Project in March 2007.
Jaguar
submitted environmental plans for the Turmalina Gold Project and received
approval prior to the issuance of its Turmalina operation
license. The Turmalina operation license was received in March
2007.
Economic
Analysis
A
pre-tax Cash Flow Projection has been generated from the Life of Mine production
schedule and capital and operating cost estimates, and is summarized in Table
1-1. A summary of the key criteria is provided below.
Physicals
|
Mine
life:
|
8.6
years, beginning in October 2006
|
||
|
Total
millfeed:
|
2,916,000
tonnes at a grade of 6.1 grams per tonne Au
|
||
|
Operations:
|
360
days per year
|
||
|
Open
pit production:
|
92,400
tonnes at a grade of 5.4 grams per tonne Au
|
||
|
Strip
Ratio:
|
2.57
|
||
|
Underground
production:
|
1,000
tonnes per day at a grade of 6.1 grams per tonne Au
|
||
|
Mill
throughput:
|
1,000
tonnes per day, 360,000 tons per year
|
||
|
Gold
recovery:
|
90%
to doré
|
||
|
Total
gold produced:
|
512,000
ounces
|
20
Revenue
|
Gold
price:
|
US$450
per ounce
|
||
|
Transport
and insurance:
|
US$3.60
per ounce
|
||
|
Refining:
|
1%
of gross sales
|
||
|
CFEM
(federal) royalty:
|
1%
of gross sales
|
||
|
Royalty
to landowner:
|
5%
NSR on first US$10 M/year, 3% on
remainder
|
|
Costs
|
|
Operating
cost:
|
US$33.23
per tonne milled
|
||
|
Pre-production
Capital cost:
|
US$28.7
million
|
||
|
Sustaining
capital:
|
US$2.8
million (includes closure)
|
||
|
Exchange
Rate:
|
reverting from current rates to
long-term rate of US$1.00 = R $2.501
|
1 The
long-term exchange rate used for the Turmalina Project is US$1.00 = R$2.50,
compared to the rate as of the date of the Scott Wilson RPA Turmalina Technical
Report of US$1.00 = R$2.29. The long-term rate was chosen based on economic
forecasts by Brazilian banks. For Base Case cash flow estimation, actual
exchange rates were used for costs incurred up to June 30, 2006. The remainder
of pre-production capital to be spent was converted using an exchange rate
of US$1.00 = R$2.19. As of March 11, 2008, the exchange rate is
US$1.00 = R$1.70.
21
|
TABLE
1-1 PRE-TAX CASH FLOW $450/OUNCES
GOLD
|
JAGUAR
MINING INC. - TURMALINA PROJECT
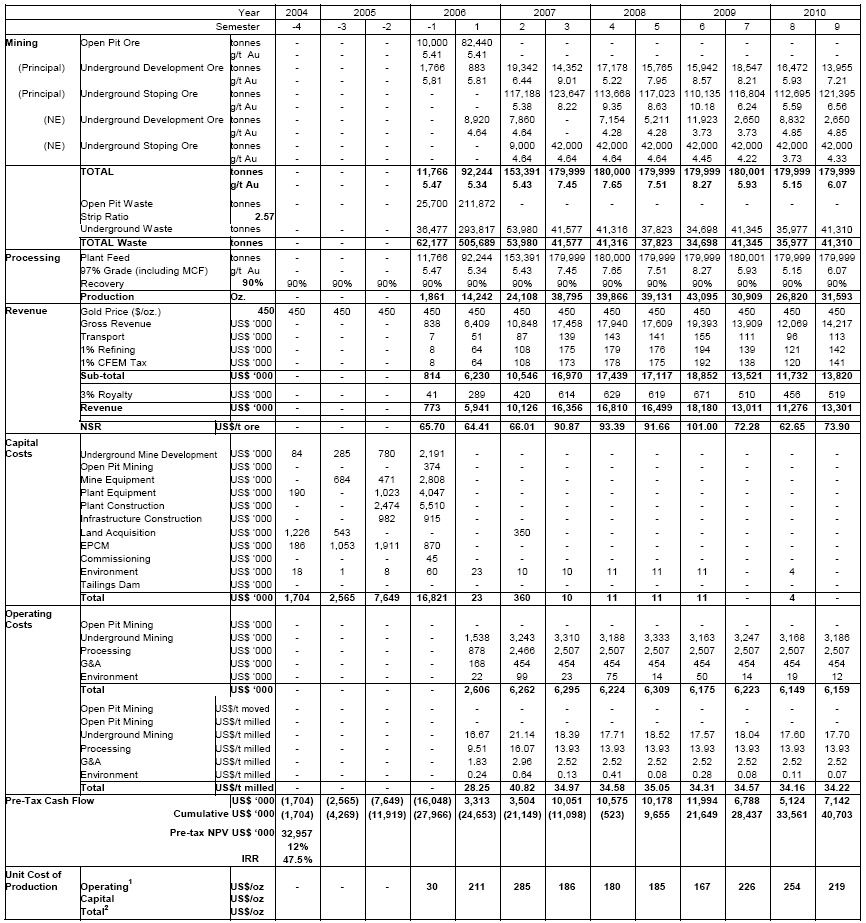
Notes: 1. Equivalent
to Gold Institute Total Cash Cost.
2. Equivalent
to Gold Institute Total Production Cost.
3. Working
capital estimated at $0.9 M by Jaguar Mining Inc. has been
excluded.
4. Salvage
estimated at $3.4 M by Jaguar Mining Inc.
22
TABLE
1-1 PRE-TAX CASH FLOW $450/OUNCES GOLD
JAGUAR
MINING INC. - TURMALINA PROJECT
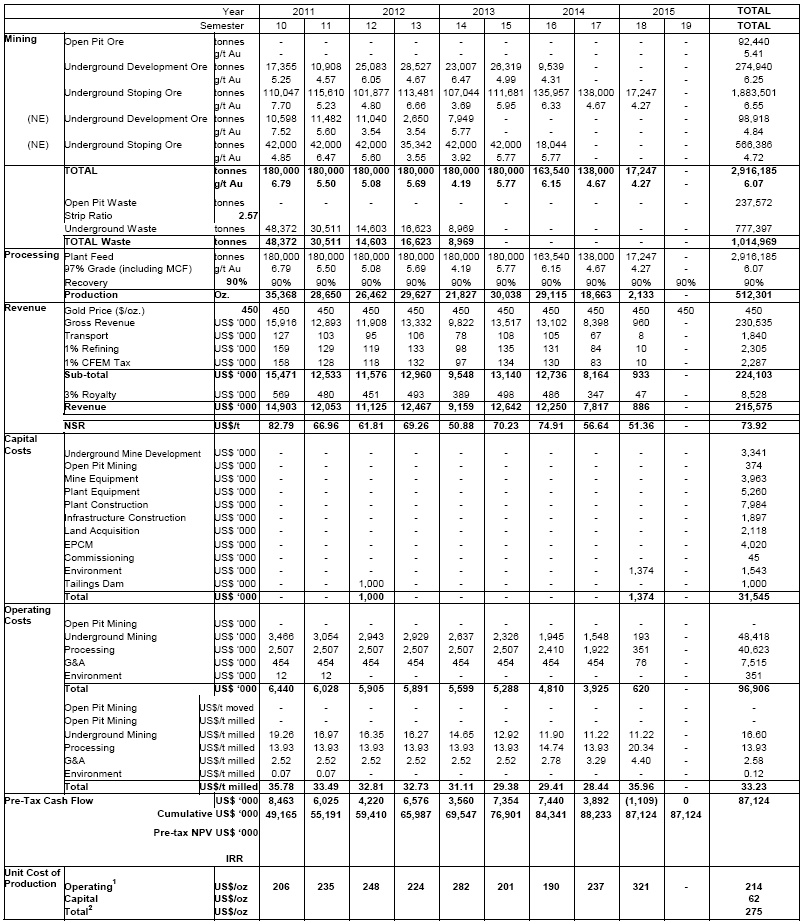
Notes: 1. Equivalent
to Gold Institute Total Cash Cost.
2. Equivalent
to Gold Institute Total Production Cost.
3. Working
capital estimated at $0.9 M by Jaguar Mining Inc. has been
excluded.
4. Salvage
estimated at $3.4 M by Jaguar Mining Inc.
23
Considering
the Turmalina Project on a stand-alone basis, the Base Case undiscounted pre-tax
cash flow totals US$87.1 million over the mine life, and simple payback occurs
near the mid-point of 2008 (approximately 21 months from start of
production).
The
Gold Institute Total Cash Cost is US$214 per ounce of gold. The mine
life capital unit cost is US$62 per ounce, for a Gold Institute Total Production
Cost of US$275 per ounce of gold. Average annual gold production
during operations is 60,000 ounces per year.
At
a discount rate of 12%, the pre-tax NPV at the time of the Scott Wilson RPA
Turmalina Technical Report was US$33.0 million and the IRR is
47.5%.
Jaguar’s
after-tax NPV estimate at 12% discount rate at the time of the Scott Wilson RPA
Turmalina Technical Report was US$14.2 million, with a project IRR of
30.7%. Scott Wilson RPA did not review Jaguar’s tax
model.
Sensitivity
Analysis
Figure
1-1 shows the project sensitivity to various factors, including:
• Head
Grade
• Gold
Price
• Operating
Cost
• Capital
Cost
• Exchange
Rate
• Mine
Life
FIGURE 1-1
SENSITIVITY ANALYSIS
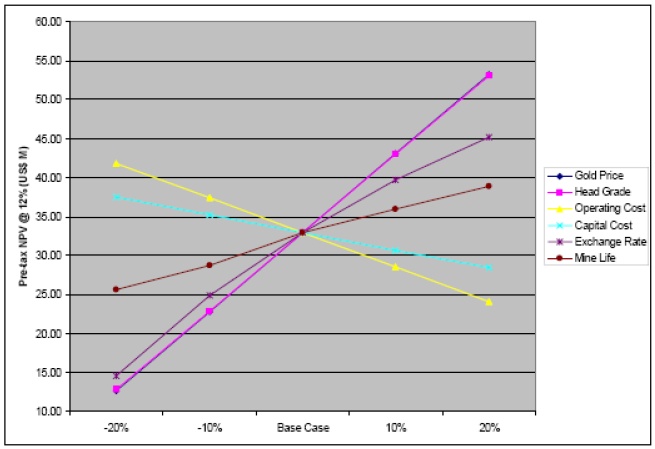
24
The
Turmalina Project is most sensitive to gold price and head grade. The break even
gold price resulting in zero pre-tax NPV at 12% at the time of the Scott Wilson
RPA Turmalina Technical Report was approximately US$300 per ounce. At a gold
price of US$635 per ounce (July 27, 2006), the pre-tax NPV at 12% was US$74.7
million. Possible impacts on head grades include assay bias and
increased dilution. If assaying proves to be biased 10% low, head
grades may be 10% higher, which would result in a pre-tax NPV at 12% of US$43
million. If dilution rates are 20% (AngloGold Ashanti test results)
rather than 15% (Base Case estimate), head grades will be reduced by 5%, which
would result in a pre-tax NPV at 12% of approximately US$28
million.
The
long-term exchange rate used for the Turmalina Project is US$1.00 = R$2.50,
compared to the rate as of the date of the Scott Wilson RPA Turmalina Technical
Report of US$1.00 = R$2.29. The long-term rate was chosen based on
economic forecasts by Brazilian banks. For Base Case cash flow
estimation, actual exchange rates were used for costs incurred up to June 30,
2006. The remainder of pre-production capital to be spent was
converted using an exchange rate of US$1.00 = R$2.19. Sustaining
capital and operating costs use the long-term exchange rate.
Other
key sensitivities, in addition to the aforementioned, are operating costs, and
capital cost, and mine life. The sensitivities are summarized in the
following table as pre-tax NPV at 12% discount.
TABLE
1-2 SENSITIVITY DATA
Jaguar
Mining Inc - Turmalina Project
|
-20%
|
-10%
|
Base
Case
|
+10%
|
+20%
|
|
|
Gold
Price (US$/ounces)
Pre-tax
NPV (US$ million)
|
360
$
12.7
|
405
$
22.8
|
450
$
33.0
|
495
$
43.1
|
540
$53.2
|
|
Grade
(grams per tonne)
Pre-tax
NPV (US$ million)
|
4.86
$
12.8
|
5.46
$
22.9
|
6.07
$
33.0
|
6.68
$
43.0
|
7.28
$53.1
|
|
Operating
Costs (US$ million)
Pre-tax
NPV (US$ million)
|
$
62.0
$
41.8
|
$
78.5
$
37.4
|
$
96.9
$
33.0
|
$
117.3
$
28.5
|
$
139.6
$
24.1
|
|
Capital
Costs (US$ million)
Pre-tax
NPV (US$ million)
|
$
20.2
$
37.5
|
$
25.6
$
35.2
|
$
31.6
$
33.0
|
$
38.2
$
30.7
|
$
45.4
$
28.4
|
|
Exchange
Rate (R$/US$)
Pre-tax
NPV (US$ million)
|
2.00
$
14.5
|
2.25
$
24.9
|
2.50
$
33.0
|
2.75
$
39.7
|
3.00
$
45.2
|
|
Mine
Life (Mt)
Pre-tax
NPV (US$ million)
|
2.3
$
25.6
|
2.6
$
28.7
|
2.9
$
33.0
|
3.2
$
36.0
|
3.5
$
38.9
|
The
base case sensitivity to discount rate is shown as follows:
• 12%
- - pre-tax NPV = US$33.0 million
• 10%
- - pre-tax NPV = US$38.6 million
• 7.5%
- - pre-tax NPV = US$47.2 million
• 5%
- - pre-tax NPV = US$57.7 million
Technical
Summary
The
Turmalina Project lies approximately 120 kilometers northwest of Belo Horizonte
and six kilometers south of the town of Pitangui, Minas Gerais,
Brazil. The Turmalina Project comprises seven contiguous concessions
covering an area of 5,337 hectares and was acquired from AngloGold Ashanti in
September 2004 for US$4.0 million, payable in three equal installments of
US$1.35 million. Jaguar has 100% ownership subject to a 5% net
revenue interest up to US$10 million, and 3% thereafter, to an unrelated third
party. In addition, there is a 0.5% net revenue interest payable to the legal
landowner.
Gold
was first discovered in the area in the 16th
century. During 1992 and 1993, AngloGold Ashanti mined 373,000 tonnes of oxide
mineralization from an open pit on the Turmalina Zone and recovered 35,500
ounces of gold using heap leach technology. Subsequently, AngloGold Ashanti
explored a possible downward sulphide extension by driving a ramp beneath the
pit and drifting on two levels in the mineralized zone at approximately 50
meters and 75 meters below the pit floor.
25
The
Turmalina Deposit is hosted by rocks of the Archaean Rio das Velhas greenstone
belt in the Iron Quadrangle region, one of the major gold provinces in the
world. The Pitangui area is underlain by rocks of Archaean and
Proterozoic age. Archaean units include a granitic basement, overlain
by the Pitangui Group, a sequence of ultramafic to intermediate volcanic flows
and pyroclastics, and associated sediments. The predominant rock
types in the deposit are metamorphosed pelites and tuffs. Gold mineralization is
associated with higher levels of sericite, quartz, and biotite. Some
fraction of the gold mineralization in the Turmalina Deposit may be due to
primary, exhalative deposition associated with the banded iron formation,
however, the deposit can be broadly classified as epigenetic, related to a
mesothermal system that localized auriferous silicification in local structural
features within a wider shear zone.
The
Turmalina Deposit comprises three ore bodies: Principal Zone (Ore Body A), NE
Zone (Ore Body B) and the CD Zone. Ore Body A strikes azimuth 110°
and dips at 55°-60°. Gold grade zoning indicates a SE plunge of
approximately 65°. The body is 200 m to 250 m long and ranges in
horizontal width from two meters to 30 meters, averaging approximately eight
meters. Ore Body B lies 50 meters to 100 meters east of the Ore Body
A and has a similar attitude. It is approximately 200 meters long and
ranges from one meter to 12 meters in horizontal width, averaging approximately
three meters. Mineralization extends to at least 350 meters below
surface. The CD Zone includes two narrow sub-zones approximately 50
meters vertically by 50 meters horizontally, ten meters in the hangingwall and
ten meters in the footwall of the Ore Body A.
Jaguar
completed a three-phase surface exploration program consisting of 93 diamond
drill holes for a total of 30,196 meters. The sampling approach and
methodology, sample preparation and analysis, data verification, and quality
assurance/quality control systems conform to industry standards.
Jaguar
geology staff completed the correlation of the mineralized zones using a 1.0
gram per tonne Au cutoff grade and a 1.0 meter minimum width. Moreno &
Associados of Belo Horizonte, Minas Gerais, Brazil, completed the mineral
resource estimate using a block model methodology. The mineral
resources are summarized in Table 1-3.
TABLE
1-3 MINERAL RESOURCES - JULY 2006
Jaguar
Mining Inc. - Turmalina Project
|
Principal
Zone
|
NE Zone
|
CD Zone
|
TOTAL
|
||||||
|
(Ore Body
A)
|
(Ore Body
B)
|
||||||||
|
Tonnes
|
Grade
|
Tonnes
|
Grade
|
Tonnes
|
Grade
|
Tonnes
|
Grade
|
Cont. Au
|
|
|
(t)
|
(g/t)
|
(t)
|
(g/t)
|
(t)
|
(g/)
|
(t)
|
(g/t)
|
(oz)
|
|
|
Measured
|
276,000
|
6.1
|
276,000
|
6.1
|
54,000
|
||||
|
Indicated
|
1,830,000
|
7.8
|
748,000
|
5.6
|
2,577,000
|
7.1
|
590,000
|
||
|
Meas +
Indic
|
2,106,000
|
7.6
|
748,000
|
5.6
|
2,854,000
|
7.0
|
644,000
|
||
|
Inferred
|
554,000
|
7.0
|
256,000
|
5.5
|
218,000
|
5.8
|
1,027,000
|
6.4
|
211,000
|
Notes:
|
|
1.
|
CIM
definitions were followed for Mineral
Resources.
|
|
|
2.
|
Mineral
Resources are estimated at a cutoff grade of 1.0 grams per tonne
Au.
|
|
|
3.
|
A
minimum mining width of 1.0 meters was
used.
|
|
|
4.
|
Rows
and columns may not total due to
rounding.
|
|
|
5.
|
Mineral
resources exclude previous
production.
|
|
|
6.
|
The
mineral resources are inclusive of mineral
reserves.
|
26
Mineral
reserves have been estimated based on the mineral resources. Mining factors have
been applied. The breakeven cutoff grade based on operating costs of US$33.23
per tonne and a gold price of US$450 is approximately 2.6 grams per tonne Au.
The incremental cutoff is approximately 1.5 grams per tonne Au. Due to the lack
of selectivity in the mining method, all resources within the 1.0 grams per
tonne Au envelope have been considered for reserves.
TABLE
1-4 MINERAL RESERVES - JULY 2006
Jaguar
Mining Inc. - Turmalina Project
|
Principal
Zone
|
NE Zone
|
CD Zone
|
TOTAL
|
||||||
|
(Ore Body
A)
|
(Ore Body
B)
|
||||||||
|
Tonnes
|
Grade
|
Tonnes
|
Grade
|
Tonnes
|
Grade
|
Tonnes
|
Grade
|
Cont. Au
|
|
|
(t)
|
(g/t)
|
(t)
|
(g/)
|
(t)
|
(g/)
|
(t)
|
(g/)
|
(oz)
|
|
|
Proven
|
234,000
|
5.5
|
234,000
|
5.5
|
41,000
|
||||
|
Probable
|
2,017,000
|
6.8
|
665,000
|
4.9
|
2,682,000
|
6.3
|
546,000
|
||
|
Total
|
2,252,000
|
6.7
|
665,000
|
4.9
|
2,916,000
|
6.3
|
587,000
|
||
Notes:
|
|
1.
|
Based
on a gold price of US$450 per ounce
|
|
|
2.
|
Cutoff
grade = 1.0 grams per tonne
|
|
|
3.
|
Dilution
overall = 15%
|
|
|
4.
|
Extraction
= 89%
|
|
|
5.
|
Reserves
estimated according to CIM
definitions
|
|
|
6.
|
Rows
and columns may not add exactly due to
rounding
|
Production
based on the mineral reserves in Table 1-4 is further modified by a mine call
factor of 97%, applied to grade. Base Case production totals 2,916,000 tonnes at
a grade of 6.1 grams per tonne Au.
Jaguar
proposes an open pit operation to mine approximately 3% of the mineral reserves.
The open pit mine will produce 92,000 tonnes of ore at a grade of 5.4 grams per
tonne Au, and a strip ratio of 2.57:1. The open pit phase will be followed by an
underground mining operation using sublevel stoping with paste backfill in Ore
Body A, and mechanized cut and fill in Ore Body B, to produce 1,000
tpd.
The
open pit is a remnant of the original AngloGold Ashanti pit. The open pit design
assumes approximately 40% of total stripping (238,000 tonnes) is weathered and
altered material that will not require blasting. Mining is in progress by
contractor, with approximately 75% of stripping complete as of July 2006. Ore
mining has commenced. Ore is hauled to a stockpile at the plant, approximately
1.3 kilometers, and waste is hauled to the dumps, approximately one
kilometer.
The
underground mine will supply the large majority of millfeed during the mine
life. Mining will be carried out in two zones - Ore Body A, comprising 77% of
the underground reserve and Ore Body B, comprising 23%.
Ore
Body A was explored previously during the AngloGold Ashanti open pit program. An
access ramp at a grade of 12% was developed from outside the open pit and two
levels were developed. Test mining extracted approximately 17,000 tonnes of ore,
grading 5.24 grams per tonne Au. Dilution was estimated to be 20%.
The
Scott Wilson RPA Turmalina Technical Report proposed to mine Ore Body A by
sublevel stoping with paste backfill and Ore Body B by mechanized cut and fill,
using waste fill.
Ore
Body A is a tabular body, dipping at approximately 55° to 75°. The ore body is
an average of 8.3 meters wide over a strike length of approximately 200 meters
to 250 meters. The ore body has been traced from surface at the
bottom of the open pit at 690 masl to a depth of approximately minus 50 masl.
Present reserves extend to the 150 masl elevation. Inferred resources extend to
depth, offering good potential for extension of the mine life. Ore grade
mineralization occurs in two main plunging shoots within the zone.
27
Ore
Body B is tabular as well, dipping the same as Ore Body A, but is much narrower,
averaging approximately 2.7 meters in width. Ore Body B reserves extend from 675
masl to a depth of approximately 200 masl and resources extend to approximately
0 masl. The ore body strike length is approximately 150 meters to 200
meters.
Ore
Body A will be mined using longitudinal sublevel stoping. Access will be by
extension of the existing ramp (5 meters x 5 meters, minus 15%
grade). Sublevels will be at 20 meter intervals with a five meter
sill pillar left at every sixth sublevel, or 120 meters. A 15 meter
crown pillar will be left beneath the open pit. Stope access (4
meters x 4 meters) will be via a central drift, with mining on a retreat basis
within the stope. The stopes will be blasted in rings from sublevels on 20 meter
lifts, with three lifts per stope. The plan calls for extracting all of the ore
in a volume 60 meters high by full strike length (up to 200 meters) by ore width
(8.3 meters average), then backfilling. Paste fill will be used to fill the
stope before mining commences on the sublevel above. The paste, containing 4%
cement, will be piped from the paste fill plant on surface through boreholes and
be distributed in the mine by a piping network. In Scott Wilson RPA’s
opinion, there is some risk related to the size of the openings to be filled and
consideration should be given to filling smaller openings on a more frequent
basis. This can be done with the present layout, however, it will introduce
curing time to the cycle and stoping productivity will be affected. This can be
mitigated by having more workplaces available. Another option is to leave
sacrificial pillars in the stopes. Scott Wilson RPA recommends that
these options be studied for incorporation into the mine schedule.
For
Ore Body B, a separate ramp will branch off from Ore Body A
ramp. Stopes will be approximately 60 meters vertical, with five
meters sill pillars. Access to the stope will be by jump ramps from the main
ramp. Backfilling material will come from two sources - waste generated at the
open pit mine and waste generated by the underground development work. Surface
waste will be excavated by loader/truck and dumped in a fill pass. Underground
waste will trucked to the required area.
The
process plant will employ a conventional CIP circuit for gold recovery. The
estimated overall metallurgical recovery is 90%, based on a 92% leaching
recovery and 97.8% adsorption/smelting recovery. The process flowsheet includes
three-stage crushing/screening to minus 3/8”, primary grinding using a rod mill,
secondary grinding using a ball mill, thickening, leaching, CIP carbon
adsorption, elution, electrowinning, and smelting.
Tailings
from the process plant will be pumped to a paste fill plant, where they will be
dewatered. Cement will be added and the paste will be delivered underground by
gravity. During times when underground fill is not required, the paste will be
directed to the mined out open pit or, later, a tailings pond facility. Jaguar
estimates that approximately 60% of tailings will be re-used as backfill, 10%
will go into the open pit, and 30% will be stored in the tailings pond. Future
changes in reserves would impact these ratios.
Tailings
pond location, design, and cost estimation have not been finalized - an
allowance of US$1 million has been included in the Base Case, based on Jaguar’s
experience in building tailings ponds at other operations.
Manpower
for the Turmalina Project operating period totals 248. It is based on
productivity estimates for mining, and general convention for the other areas.
Salaries have been established to be competitive in the region. Monthly base
salaries range from US$250 for an entry level position to US$400 for a tradesman
or experienced miner. A senior engineer salary is in the order of US$2,700 per
month. Senior management salaries are approximately US$4,800 per month. Burden
on top of the base salaries averages approximately 115%.
As
of the time of the Scott Wilson RPA Turmalina Technical Report, Jaguar had
obtained all permits required for construction and development work, which was
in progress.
28
The
Turmalina Plant is scheduled to ramp up to full production of 30,000 tonnes per
month by mid-2007. Jaguar reports construction progress to
date:
|
•
|
Access
|
100%
complete
|
|
•
|
Site
Preparation
|
100%
complete
|
|
•
|
Buildings
|
98%
complete
|
|
•
|
Civil
works (mainly concrete)
|
56%
complete
|
|
•
|
Structural
steel
|
16%
complete
|
|
•
|
Tanks,
platework
|
17%
complete
|
|
•
|
Electrical
(incl. 5 kilometers power line)
|
0%
complete
|
|
•
|
Piping
|
0%
complete
|
|
•
|
Instrumentation
|
0%
complete
|
|
•
|
Paste
fill plant
|
0%
complete
|
Total
pre-production and ongoing capital costs have been estimated by MSOL and
TechnoMine and are summarized in the following table. The costs
include a contingency of 10%.
TABLE
1-5 CAPITAL COSTS
Jaguar
Mining Inc. - Turmalina Project
|
US$ ‘000’s
|
||||
|
Open Pit
Mining
|
374 | |||
|
Underground Mine
Development
|
3,341 | |||
|
Underground Mine
Equipment
|
3,963 | |||
|
Plant
Equipment
|
5,260 | |||
|
Plant
Construction
|
7,984 | |||
|
Infrastructure
Construction
|
1,897 | |||
|
Land
Acquisition
|
2,118 | |||
|
EPCM
|
4,020 | |||
|
Commissioning
|
45 | |||
|
Environment
|
1,543 | |||
|
Tailings
Dam
|
1,000 | |||
|
Total
|
$ | 31,545 | ||
Pre-production
costs included above total US$28.7 million, with US$15.8 million incurred or
committed as of June 30, 2006. Jaguar estimates that the cost to complete
preproduction construction and development is US$12.9 million. US$2.8
million in ongoing capital costs include the final land acquisition payment
(US$350,000), environmental testing (US$80,000), tailings pond construction
(US$1 million), and closure costs (US$1.4 million). Capital costs do not include
working capital or salvage credits upon closure.
Operating
costs have been estimated from first principles and are following
table:
TABLE
1-6 OPERATING COSTS
Jaguar
Mining Inc. - Turmalina Project
|
US$/tonne
milled
|
||||
|
Underground
Mining
|
16.60 | |||
|
Processing
|
13.93 | |||
|
G&A
|
2.58 | |||
|
Environment
|
0.12 | |||
|
Total
|
$ | 33.23 | ||
29
Conclusions
and Recommendations
The
work completed by Jaguar to date has shown that the Turmalina Project is robust
at current gold prices and shows a positive operating margin at the Base Case
gold price of US$450 per ounce. Scott Wilson RPA offered the
following conclusions in the Scott Wilson RPA Turmalina Technical
Report:
|
|
•
|
The
diamond drilling techniques and technical controls were performed to
industry standards and produced samples of adequate quality to develop a
database for resource estimation.
|
|
|
•
|
The
sampling method and approach, as well as the sample preparation and
analysis, were adequate for resource
estimation.
|
|
|
•
|
The
data verification program conforms to industry standards, but
noncompliance issues should be addressed on a timely
basis.
|
|
|
•
|
The
resource grade may be biased 5% to 10% low due to possible problems in the
SGS do Brasil Ltda. (SGS)
laboratory.
|
|
|
•
|
The
assumptions, parameters, and methodology used for resource estimation are
appropriate for the style of
mineralization.
|
|
|
•
|
Mineral
resources and reserves have been estimated according to the requirements
of CIM definitions and, in Scott Wilson RPA’s opinion, are compliant with
NI 43-101.
|
|
|
•
|
Stope
extraction does not include an allowance for ore loss, however, the
overall extraction of 89% should be
adequate.
|
|
|
•
|
Dilution
rates of 15% are reasonable, however, previous testing indicates that
dilution rates up to 20% may occur.
|
|
|
•
|
There
is some risk related to the size of the underground openings to be
backfilled.
|
|
|
•
|
The
use of the open pit for tailings deposition is nominally an expedient
alternative, however, a tailings pond facility will be required once the
open pit is filled.
|
|
|
•
|
Scott
Wilson RPA presented the following recommendations in the Scott Wilson RPA
Turmalina Technical Report:
|
|
|
•
|
Assess
the potential for lateral and downward extension of mineralization and
extend diamond drilling programs as
necessary.
|
|
|
•
|
Investigate
possible low bias in the SGS analytical
laboratory.
|
|
|
•
|
Establish
a QAIQC program to monitor laboratory results on a “per batch”
basis. Request copies of the laboratory in-house QA/QC
reports.
|
|
|
•
|
Establish
a standard operating procedure whereby, during the resource estimation
process, outlier assays are capped prior to
compositing.
|
|
|
•
|
Consideration
should be given to backfilling smaller openings on a more frequent
basis.
|
|
|
•
|
Investigate
the following items before placing tailings in the open
pit:
|
|
|
•
|
Crown
pillar stability to prevent inrush into the mine
workings.
|
|
|
•
|
Proper
sealing of the vent raise connection from the bottom of the open pit to
the mine.
|
|
|
•
|
The
effect of water on the tailings during the rainy season and the prevention
of liquefaction.
|
|
|
•
|
Proceed
with detailed design and cost estimation for the proposed tailings pond
facility.
|
30
For
additional details regarding the information set forth in this section regarding
the Turmalina Gold Project, please refer to the Scott Wilson RPA Turmalina
Technical Report, which is filed on SEDAR.
Current
Project Status
Commissioning
at Turmalina began in November 2006 and the first gold pour was conducted in
January 2007. Turmalina is an underground mine utilizing the
"sublevel stoping" and the "cut and fill" mining methods with paste
fill. Turmalina is currently processing 1,300 tonnes per day of ore
in its CIP plant. Turmalina produced 45,527 ounces of gold in 2007
and 72,785 ounces of gold in 2008.
TechnoMine
Turmalina Expansion Technical Report
Introduction
Jaguar
retained TechnoMine to prepare an NI 43-101 compliant feasibility study on the
expansion of its Turmalina operations (the “Turmalina Expansion Project”), which
includes the Satinoco Ore Body (“Ore Body C”) and the existing Turmalina Ore
Bodies A and B mineral resources and reserves. TechnoMine issued the
Turmalina Expansion Technical Report on September 9, 2008. The
Turmalina Expansion Project is controlled by Jaguar’s fully-owned subsidiary
MTL. The TechnoMine Turmalina Expansion Technical Report study was
preceded by two technical reports on the Ore Body C, also prepared by TechnoMine
and filed on SEDAR on October 22, 2007 and February 5, 2008. The Ore
Body C is also referred herein as the Satinoco Target and the Satinoco
Structure.
The
Turmalina mining complex is located approximately 120 kilometers northwest of
Belo Horizonte and 6 kilometers south of the town of Pitangui, Minas Gerais,
Brazil. Turmalina comprises six (6) contiguous mining concessions
covering an area of 4,787 ha and was acquired from AngloGold Ashanti in
September 2004. The Ore Body C is located within the Turmalina
concessions. Jaguar has 100% ownership subject to a 5% on net
revenue interest up to US$ 10 million, and 3% thereafter, to an unrelated third
party. In addition, there is a 0.5% on net revenue interest payable
to the landowner.
The
Turmalina Mine currently encompasses Ore Bodies A and B and is currently
producing 360,000 tpy (ROM). The Turmalina Expansion Technical Report
addresses the incremental 250,000 tpy to be produced by both the Ore Bodies A
and C, which will increase Turmalina production to 610,000 tpy. The
expanded output is expected to reach 480,000 tonnes in 2008 and 610,000 tonnes
by 2009. The Ore Body C will contribute about 136,000 tpy in 2008 and
starting in 2009, 200,000 tpy.
Geology
The
Turmalina ore bodies are hosted by rocks of the Pitangui Group, considered a NW
“geological window” of the Archean Rio das Velhas greenstone belt in the
Quadrilátero Ferrífero (“Iron Quadrangle” or “QF”). This region is
one of the major gold provinces in the world. In the Pitangui area
various small and historical alluvial or superficial mines were active during
the Brazilian Gold Cycle (17th an
18th
centuries).
The
Turmalina ore bodies are underlain by rocks of Archaean and Proterozoic ages.
Archaean units include a granitic basement, overlain by the Pitangui Group, a
sequence of ultramafic to intermediate volcanic flows and pyroclastics, and
associated sediments. The predominant rock types are metamorphosed pelites,
tuffs, and banded iron formations (“BIF”) locally.
The
gold metallogeny in the Iron Quadrangle has a complex
history. Initially, in the Archean period, volcanic exhalative
sedimentary processes in the greenstone belts produced banded iron formations
and chert-hosted, sulfide-rich gold deposits. Later shear zones with
hydrothermal activity promoted both remobilization and local concentration of
gold.
31
A
portion of the gold mineralization in the Turmalina deposits may be due
primarily to exhalative deposition associated with the BIF. However,
most of the gold content is associated with rocks that show increases in
sericite, quartz, and biotite content. Consequently, the deposit can
be broadly classified as epigenetic related to a mesothermal system containing
auriferous silicification in local structural features within a wider shear
zone.
The
Turmalina deposits were discovered by AngloGold Ashanti’s geological and
geochemical exploratory works done in the 1979-1988 period. There
were neither surface excavations, nor evidences of historic artisan miner’s
activities over the Turmalina and Satinoco deposits at that time.
The
deposits comprise three zones: the Ore Bodies A and B (currently operating
mines) and the Satinoco structure. Ore Body A strikes azimuth 110º
and dips 55-60º. Gold grades zoning indicates a SE plunge of approximately
65º. The zone is 200-250 m long and ranges in horizontal width from 2
m to 30 m, averaging approximately 8m. Ore Body B lies 50 m to 100 m
east of Ore Body A and has a similar attitude. It is approximately
200 m long and ranges from 1 to 12 m in horizontal width, averaging
approximately 3 m. The mineralized body extends to at least 550 m
below the surface.
The
Satinoco Structure has three mineralized sectors located in a parallel structure
about 300 m west of Turmalina’s Ore Body A, also with similar altitudes, with
strike lengths of 100 to 200 m and 3 to 4 m wide. These ore shoots
are open at depth, below the current 420-m drilling limit.
All
these mineralized zones or ore bodies are quartz-sulfide-rich rocks with
variable increases of sericite, chlorite, biotite or carbonates, plunging to
ENE. Gold is present in small free grains associated mainly with
arsenopyrite and quartz.
Mineral Resources and
Reserves
This
section combines the Ore Body C mineral resources and reserves with those
reported in the Scott Wilson RPA Turmalina Technical Report, as reviewed and
accepted by TechnoMine, which included Ore Body A (referred to as “Principal” in
the Scott Wilson RPA report) and Ore Body B (referred to as "NE Zone" in the
Scott Wilson RPA report).
Tables
1.3 and 1.4 below show mineral resources for Ore Bodies A and B as reported in
the Scott Wilson RPA Turmalina Technical Report.
|
TABLE
1-3 MINERAL RESOURCES - JULY 2006
|
|||||||||
|
Jaguar
Mining Inc. - Turmalina Project
|
|||||||||
|
Principal
Zone
(Ore
Body A)
|
NE
Zone
(Ore
Body B)
|
CD
Zone
|
TOTAL
|
||||||
|
Tonnes
|
Grade
|
Tonnes
|
Grade
|
Tonnes
|
Grade
|
Tonnes
|
Grade
|
Cont.
Au
|
|
|
(t)
|
(g/t)
|
(t)
|
(g/t)
|
(t)
|
(g/t)
|
(t)
|
(g/t)
|
(oz)
|
|
|
Measured
|
276,000
|
6.1
|
276,000
|
6.1
|
54,000
|
||||
|
Indicated
|
1,830,000
|
7.8
|
748,000
|
5.6
|
2,577,000
|
7.1
|
590,000
|
||
|
Measured
+ Indicated
|
2,106,000
|
7.6
|
748,000
|
5.6
|
2,854,000
|
7.0
|
644,000
|
||
|
Inferred
|
554,000
|
7.0
|
256,000
|
5.5
|
218,000
|
5.8
|
1,027,000
|
6.4
|
211,000
|
32
Notes:
|
|
1.
|
CIM
definitions were followed for Mineral
Resources.
|
|
|
2.
|
Mineral
Resources are estimated at a cutoff grade of 1.0 grams per tonne
Au.
|
|
|
3.
|
A
minimum mining width of 1.0 m was
used.
|
|
|
4.
|
Rows
and columns may not total due to
rounding.
|
|
|
5.
|
Mineral
resources exclude previous
production.
|
6.
The mineral resources are inclusive of mineral reserves.
Mineral
reserves have been estimated based on the mineral resources. Mining
technical and economic factors have been applied. The breakeven
cut-off grade based on operating costs of US$ 33.23 per tonne and a gold price
of US$ 450, is approximately 2.6 grams per tonne Au. The incremental
cut-off is approximately 1.5 grams per tonne Au. Due to the
lack of selectivity in the mining method, all resources within the 1.0 grams per
tonne Au envelope have been considered for reserves.
|
TABLE
1-4 MINERAL RESERVES - JULY 2006
|
|||||||||
|
Jaguar
Mining Inc. - Turmalina Project
|
|||||||||
|
Principal
Zone
(Ore
Body A)
|
NE
Zone
(Ore
Body B)
|
CD
Zone
|
TOTAL
|
||||||
|
Tonnes
|
Grade
|
Tonnes
|
Grade
|
Tonnes
|
Grade
|
Tonnes
|
Grade
|
Cont.
Au
|
|
|
(t)
|
(g/t)
|
(t)
|
(g/t)
|
(t)
|
(g/t)
|
(t)
|
(g/t)
|
(oz)
|
|
|
Proven
|
234,000
|
5.5
|
234,000
|
5.5
|
41,000
|
||||
|
Probable
|
2,017,000
|
6.8
|
665,000
|
4.9
|
2,682,000
|
6.3
|
546,000
|
||
|
Total
|
2,252,000
|
6.7
|
665,000
|
4.9
|
2,916,000
|
6.3
|
587,000
|
||
Notes:
|
|
1.
|
Based
on a gold price of US$ 450 per
ounce
|
|
|
2.
|
Cutoff
grade = 1.0 grams per tonne
|
|
|
3.
|
Dilution
overall = 15%
|
|
|
4.
|
Extraction
= 89%
|
|
|
5.
|
Reserves
estimated according to CIM
definitions
|
|
|
6.
|
Rows
and columns may not add exactly due to
rounding
|
|
|
7.
|
Expected
process recovery = 90%.
|
Production
based on the mineral reserves in Table 1-4 is further modified by a Mine Call
Factor (“MCF”) of 97%, applied to grade. Base Case production totals
2,916,000 tonnes at a grade of 6.1 grams per tonne Au.
The
total ore mined out since the beginning of the operations at Turmalina in
November 2006 has been reported by Jaguar as follows.
2007
production: 347,000 tonnes with an average grade of 4.37 grams per
tonne = 45,527 ounces Au
2008
production: 481,000 tonnes with an average grade of 5.46 grams per tonne =
72,785 ounces Au
Mineral
Resources - Ore Body C
The
following data was used to estimate the mineral resources at the Ore Body
C:
|
|
•
|
AngloGold
Ashanti’s exploration program from 1979 to 1988, which included 9 diamond
drill holes totaling 1,524 meters and about 250 meters of
trenches.
|
|
|
•
|
Jaguar’s
three-phase surface diamond drilling program from 2004 to 2007, as
summarized below:
|
33
|
|
•
|
Phase
1: 5,501 meters drilled in 35 holes. This program tested the
continuity of the mineralized body between the weathered zone and up to
200 meters below the surface.
|
|
|
•
|
Phase
2: 3,338 meters drilled in 24 complementary infill holes to create a 25 x
60 meter grid between the surface and 100 meters below and to test the
continuity of the mineralized body up to 350 mmeters above sea
level.
|
|
|
-
|
Phase
3: In 2007, an additional drill hole campaign was carried out, which
consisted of 12,763 meters drilled in 48 holes. Results from
holes FSN 10 to 68 from this campaign were included in estimating mineral
resources contained in the original TechnoMine Satinoco Target Resource
Statement technical report dated October 22, 2007. Results from
the remaining drill holes FSN 69 to 113 were included in the TechnoMine
Satinoco Target Resource Statement technical report dated February 5,
2008. Results from drill holes FSN 114 to 116 have been
included in this feasibility study. From the total 12,763
meters drilled, 11,889 meters were utilized to estimate the mineral
resources.
|
|
|
•
|
Underground
Development: in 2007, a horizontal drift excavation was started from the
Turmalina ramp in order to access the central portion of the Satinoco
Structure. The purpose was to expose the Satinoco mineralized body along
strike. The underground developments are progressing and now total about
822 meters. Jaguar’s exploration and development plans at the Turmalina
mining complex include additional underground drilling to define the
Satinoco zones that cannot be drilled from the surface, in order to
further increase estimated mineral resources in future
studies.
|
Exploration
activities resulted in total estimated measured and indicated resources of about
173,900 ounces Au and inferred resources of approximately 57,100 ounces Au as
detailed in the table below.
The
Ore Body C mineral resource estimate was prepared by MCB Serviços e Mineração
Ltda. (“MCB”), a Belo Horizonte-based consulting company, under the supervision
of Jaguar’s Chief Geologist, Jaime Duchini and the author of this feasibility
study.
|
Ore
Body C Mineral Resources
Cut-off
Grades: 0.3 Au (g/t) - Oxide and 1.5 Au (g/t) Sulfide
|
||||
|
Type
|
Resource
Category
|
Tonnage
(t)
|
Au
(g/t)
|
oz
Au
|
|
Oxide
|
Measured
|
55,280
|
3.12
|
5,550
|
|
Indicated
|
72,120
|
2.55
|
5,920
|
|
|
Measured
and Indicated
|
127,400
|
2.80
|
11,470
|
|
|
Inferred
|
400
|
0.46
|
10
|
|
|
Sulfide
|
Measured
|
470,220
|
3.58
|
54,150
|
|
Indicated
|
1,026,380
|
3.28
|
108,280
|
|
|
Measured
and Indicated
|
1,496,600
|
3.37
|
162,430
|
|
|
Inferred
|
479,340
|
3.71
|
57,090
|
|
|
Total
|
Measured
|
525,500
|
3.53
|
59,700
|
|
Indicated
|
1,098,500
|
3.23
|
114,200
|
|
|
Measured
and Indicated
|
1,624,000
|
3.33
|
173,900
|
|
|
Inferred
|
479,740
|
3.70
|
57,100
|
|
MineSight
software was used. The adopted capping grade was 30 grams per tonne, while the
cutoff grade selected for the estimation was 0.30 grams per tonne for oxide and
1.5 grams per tonne for sulfide resources. Poor variography eliminated the
option of kriging and the inverse squared distance (“ISD”) method was adopted to
weigh composites grades within the blocks.
34
Mineral
Resources at the Ore Body A that will be used in the Expansion
Project
The
mineral resource estimate summarized below was prepared by Jaguar’s Chief
Geologist, Jaime Duchini and the author of the TechnoMine Turmalina Expansion
Technical Report. [
|
Ore
Body A Mineral Resources included in the Expansion
Project
|
||||
|
Cutoff
Grade: 1.0 Au (g/t)
|
||||
|
Type
|
Resource
Category
|
Tonnage
(t)
|
Au
(g/t)
|
oz
Au
|
|
Sulfide
|
Measured
|
0
|
0
|
0
|
|
Indicated
|
391,700
|
8.23
|
103,700
|
|
|
Total
|
Measured
and Indicated
|
391,700
|
8.23
|
103,700
|
|
Inferred
|
0
|
0
|
0
|
|
Expansion
Project Total Mineral Resources
|
Expansion
Project Total Mineral Resources (Ore Bodies A and C)
|
||||
|
Type
|
Resource
Category
|
Tonnage
(t)
|
Au
(g/t)
|
oz
Au
|
|
Oxide
|
Measured
|
55,280
|
3.12
|
5,550
|
|
Indicated
|
72,120
|
2.55
|
5,920
|
|
|
Measured
and Indicated
|
127,400
|
2.80
|
11,470
|
|
|
Inferred
|
400
|
0.46
|
10
|
|
|
Sulfide
|
Measured
|
470,220
|
3.58
|
54,150
|
|
Indicated
|
1,418,080
|
4.65
|
211,980
|
|
|
M+I
|
1,888,300
|
4.38
|
266,130
|
|
|
Inferred
|
479,340
|
3.71
|
57,090
|
|
|
Total
|
Measured
|
525,500
|
3.53
|
59,700
|
|
Indicated
|
1,490,200
|
4.55
|
217,900
|
|
|
Measured
and Indicated
|
2,015,700
|
4.28
|
277,600
|
|
|
Inferred
|
479,740
|
3.70
|
57,100
|
|
The
mineral reserves estimates are summarized on the next page and were prepared by
Minere Engenharia Ltda (“Minere”), under the supervision of the author of the
TechnoMine Turmalina Expansion Technical Report.
35
Mineral
Reserves at the Ore Body C
|
Ore
Body C Proven and Probable Mineral Reserves
|
||||
|
Type
|
Reserve Category
|
Tonnage
(t)
|
Au
(g/t)
|
0z
Au
|
|
Oxide
|
Proven
|
19,500
|
4.02
|
2,520
|
|
Probable
|
35,700
|
3.35
|
3,850
|
|
|
Proven
+ Probable
|
55,200
|
3.59
|
6,370
|
|
|
Sulfide
|
Proven
|
353,300
|
3.40
|
38,650
|
|
Probable
|
857,300
|
2.97
|
81,980
|
|
|
Proven
+ Probable
|
1,210,600
|
3.10
|
120,630
|
|
|
Total
|
Proven
|
372,800
|
3.43
|
41,170
|
|
Probable
|
893,000
|
2.99
|
85,830
|
|
|
Proven
+ Probable
|
1,265,800
|
3.12
|
127,000
|
|
|
Open
Pit Dilution:
|
12%
|
|
|
Underground
Mine Dilution:
|
15%
|
|
|
Satinoco
Overall Mining Recovery:
|
68%
|
Mineral
Reserves at the Ore Body A that will be used in the Expansion
Project
|
Ore
Body A Proven and Probably Mineral Reserves that will be used in the
Expansion Project
|
||||
|
Type
|
Reserve Category
|
Tonnage
(t)
|
Au
(g/t)
|
oz
Au
|
|
Sulfide
|
Proven
|
0
|
0
|
0
|
|
Probable
|
418,800
|
7.16
|
96,410
|
|
|
Proven
+ Probable
|
418,800
|
7.16
|
96,410
|
|
|
Mine
Dilution:
|
15%
|
|
Mining
Recovery:
|
93%
|
Expansion
Project Total Mineral Reserves
|
Expansion
Project Proven and Probable Mineral Reserves
|
||||
|
Type
|
Resource
Category
|
Tonnage
(t)
|
Au
(g/t)
|
oz
Au
|
|
Oxide
|
Proven
|
19,500
|
4.02
|
2,520
|
|
Probable
|
35,700
|
3.35
|
3,850
|
|
|
Proven
+ Probable
|
55,200
|
3.59
|
6,370
|
|
|
Sulfide
|
Proven
|
353,300
|
3.40
|
38,650
|
|
Probable
|
1,276,100
|
4.35
|
178,390
|
|
|
Proven
+ Probable
|
1,629,400
|
4.14
|
217,040
|
|
|
Total
|
Proven
|
372,800
|
3.43
|
41,170
|
|
Probable
|
1,311,800
|
4.32
|
182,240
|
|
|
Proven
+ Probable
|
1,684,600
|
4.12
|
223,410
|
|
36
Expansion
Project Summary Data
|
•
|
Project
Life (Ore Body C): 16 semesters, starting in the first semester of
2008.
|
|
•
|
Pre-production
period: 12 months - It is anticipated that only 135,700 t will be added to
current production during the pre-production
period.
|
|
•
|
Measured
and Indicated Resources:
|
Ore
Body C: 1,624,000 tonnes at 3.33 grams per tonne (average) = 173,900 ounces
Au
Ore
Body A: 391,700 tonnes at 8.23 grams per tonne (average) = 103,700 ounces
Au
Total:
2,015,700 tonnes at 4.28 grams per tonne (average) = 277,600 ounces
Au
|
•
|
Mining
Method: sublevel stoping for both Ore Bodies A and
C
|
|
•
|
Cruise
Production Rates (ROM): about 250 ktpy (Ore Body C) as an incremental
production to current operations (Ore Bodies A and B: 360 ktpy), totaling
610 ktpy
|
|
•
|
Mining
Average Dilution:
|
Ore
Body C (open pit): 12%
Ore
Body C (underground): 15%
Ore
Body A: 15%
|
•
|
Mining
Average Recovery:
|
Ore
Body C: 68.0%
Ore
Body A: 92.97%
|
•
|
Proven
and Probable Reserves:
|
Ore
Body C: 1,265,800 tonnes at 3.12 grams per tonne t (average) = 127,000 ounces
Au
Ore
Body A: 418,800 tonnes at 7.16 grams per tonne t (average) = 96,410
ounces Au
Total:
1,684,600 tonnes at 4.12 grams per tonne t (average) = 223,410 ounces
Au
|
•
|
Mine
Call Factor: 97%
|
|
•
|
Mill
Feed Grades:
|
Ore
Body C: 3.02 grams per tonne
Ore
Body A: 6.94 grams per tonne
Average: 4.00
grams per tonne
|
•
|
Mill
Feed Gold:
|
216,710
ounces
|
Ore
Body C: 123,190 ounces
Ore
Body A: 93,520 ounces
Total: 216,710
ounces
|
•
|
Process
Route: Crushing/Screening - Grinding -Leaching - CIP - ADR
(including Elution, Electrowinning, and
Smelting)
|
|
•
|
Metallurgical
Recovery: 90% (average)
|
|
•
|
Total
“Salable” Gold: 195,040
oounces
|
Ore
Body C: 110,870 ounces
Ore
Body A: 84,170 ounces
Total:
195,040 ounces
37
Permitting
Mining
Rights
The
Turmalina mining complex entails the mining concessions (ultimate mineral
right), all in good standing and shown in the table below.
|
Turmalina
Mining Concessions
|
|
|
DNPM
Mining Concession
|
Area
(ha)
|
|
832203/03
|
996
|
|
812004/75
|
880
|
|
803470/78
|
952
|
|
830027/79
|
120
|
|
812003/75
|
980
|
|
831617/03
|
859
|
Environmental
Licensing
Original
Turmalina Project Licenses
In
2005, MTL applied for the Previous License (“LP”) related to the original
Turmalina Gold Project, for both the open pit and underground exploitation of
the sulfide mineralized body, in connection with Mining Concession DNPM
812.003/75 and the mineral processing plant. The LP was granted to
MTL in October 2005. The submitted environmental study, along with
the LP application, formed an Environmental Control Report
(“RCA”). The Implementation License (“LI”) for the original Turmalina
mine and mill undertaking was applied for in November 2005. In August
2006, COPAM granted MTL the LI, after the PCA’s analysis.
The
Operation License (“LO”) for the original Turmalina Gold Project was applied for
in March 2007 and granted in June 2008. The LO does not cover the
tailings disposal system, since the system originally foreseen was revised by
Jaguar (See item 1.5.3 below, which portrays the ongoing licensing for the
tailings disposal system).
Expansion
Project Licenses
Minas
Gerais State Decree 44.844/2008, dated 06/25/08 establishes that given the
operating situation and production status prevailing in the Turmalina mining
complex, Jaguar was allowed to apply directly for an LO for the Expansion
Project.
The
RCA and the Environmental Control Plan (“PCA”) studies related the LO for the
Turmalina Expansion were submitted to SUPRAM in October 2008.
The
LO award for the Expansion Project is expected to occur in April
2009.
In
order to be able to start the development works at the Expansion Project, Jaguar
applied for Environmental Authorization for Operation (“AAF”), as reported
below.
An
AAF for the new underground operations (Ore Body C) - mining right DNPM
803470/1978 was applied for in July 2008, based on the fact that this ore body
is part of an operating mine.
Two
(2) AAFs may and are intended to be applied for in connection with the Ore Body
C open pit mine. The Expansion Project lies within two (2) Mining
Concessions (DNPM 812003/1975 and DNPM 803470/1978), thus affording Jaguar the
right to request two (2) AAFs. They were applied for in November 2008
and are expected to be granted in February 2009.
38
Each
AAF for an open pit mine allows for the mining of 50,000 tpy, while for an
underground mine it permits to mine 100,000 tpy.
Turmalina
and Turmalina Expansion Tailings Disposal Systems Licenses
The
LI for the tailings disposal system was applied for in November 2007, when the
EIA/RIMA and the PCA were submitted. The tailings disposal system
comprises a tailings dyke and a tailings dam. The tailings dyke is a
starting unit and will later be integrated into the tailings dam. The
application and pertinent documents are currently being analyzed by
SUPRAM. The LI award is expected to take place in February 2009. It
is anticipated that the LO will be applied for in May 2009. The
tailings dyke is currently in operation and was audited by SUPRAM in May
2008.
Expansion
Project Status
Equipment
under Procurement
The
equipment listed below is currently being procured.
|
EQUIPMENT
|
PERCENT
PROCURED
|
|
Crushers
|
35%
|
|
Screens
|
35%
|
|
Belt
Conveyors
|
No
new BC required for the Expansion Project
|
|
Silos
|
No
new Silo required for the Expansion Project
|
|
Third
Grinding Mill
|
40%
|
|
Third
Grinding Mill Classification Circuit
|
0%
- On hold until the mill has been defined and pumps
and
cyclones sized.
|
|
Thickener
|
The
Expansion Project does not call for an additional
process
thickener.
|
|
Additional
Leaching Tanks
|
35%
|
|
Additional
CIP Tanks
|
35%
|
|
Detox
|
50%
- Has been ordered from CyPlus/EVONIK;
delivery
is expected during October 2008
|
|
Hydrometallurgical
Pumps
|
35%
- Current pumps will be kept;
a
set of pumps for the tailings (3 pumps in series) and a
new
tailings pipe are currently being acquired
|
|
Paste
Fill Plant Equipment
|
80%
- Equipment is already purchased; some have already been
delivered,
including cyclones, pumps, and the paste fill
thickener
|
Infrastructure
Roads
to Satinoco: The underground access to the sulfide ore body already
exists. The 100-meter access to the future open pit oxidized material
still needs to be constructed.
Additional
Infrastructure: Installation is needed for one (1) air compressor, a mine
substation, and a ventilation shaft, for the underground sulfide ore
body. These items were properly budgeted. Development
activities and transportation of the open pit oxide material will be
outsourced.
39
Capital
Costs
The
total nondiscounted investment estimate is US$ 25.5 million, as shown
below.
|
INVESTMENTS
|
Unit: US$
1,000
|
|
•CAPEX - Initial Investments (2007 - 2009)
|
(22,373)
|
|
•CAPEX
- Operational (Q1 2008 to Q2 2009)
and
Post-Operation Investments
|
(3,146)
|
|
•Operation
Shutdown (2015 to 2017)
|
1,895
|
|
•Environmental
Closure (2015 to 2017)
|
921
|
|
•Work
Capital
|
(0)
|
|
•Work
Capital Recovery
|
0
|
|
•Salvage
|
0
|
|
•Stay
in Business
|
(330)
|
|
•TOTAL
INVESTMENT
|
(25,519)
|
Operating
Costs
The
total nondiscounted life of mine operating cost for the Turmalina expansion has
been estimated at US$ 92.9 million.
Economic
Analysis
The
economic results presented in the table below - Base Case Scenario Summary of
Economic Results are based on the criteria utilized in the discounted
cash flow model for the Base Case Scenario presented below. The after-tax
economic indicators from the Cash Flow Model and a Sensitivity Analysis
(Appendix 02 of the TechnoMine Turmalina Expansion Technical Report) point to an
economically robust project.
ECONOMIC
ANALYSIS CRITERIA
|
•
|
Gold
price
|
US$
750 per troy ounces of gold
|
|
|
•
|
ROM
Total Tonnage (Ore Body C)
|
1,265,800
t
|
|
|
•
|
ROM
Total Tonnage
|
||
|
(Ore
Bodies A and C)
|
1,684,600
t
|
||
|
•
|
Mineral
Reserves (Ore Body C)
|
1,265,800
t @ 3.12 grams per tonne Au,
|
|
|
containing
approximately 127,000 ounces
|
|||
|
•
|
Mineral
Reserves
|
||
|
(Ore
Bodies A and C)
|
1,684,600
t @ 4.12 grams per tonne Au,
|
||
|
containing
approximately 223,410 ounces
|
|||
|
•
|
Mine
Call Factor
|
97%
|
|
|
•
|
Mill
Feed Grade
|
||
|
(Ore
Bodies A and C average)
|
(4.12)*(97%)
= 4.00 grams per tonne
|
40
|
•
|
ROM
Average “Cruise” Production
|
incremental
250,000 tpy to the current 360,000 tpy starting in 2009
|
|
•
|
Metallurgical
Recovery
|
90%
|
|
•
|
Total
Gold Production
|
195,040
ounces Au
|
|
•
|
Average
Annual Gold Production
|
24,380
opy
|
|
•
|
Project
Life (LOM - Ore Body C)
|
16.0
semesters
|
|
•
|
CAPEX
(Ore Body C)
|
US$
25.5 million (straight)
|
|
•
|
Production
Start (Ore Body C)
|
First
semester of 2008
|
|
•
|
Production
Finish (Ore Body C)
|
Second
semester of 2015
|
|
•
|
Exchange
Rate
|
Construction
Period:
|
|
US$
1.00 = R$ 1.70
|
||
|
Production
Period:
|
||
|
US$
1.00 = R$
2.00
|
• Depreciation
and amortization have been prorated over the life of the Turmalina
expansion.
The
cumulative operating profit has been estimated at US$ 51.1 million, while the
after-tax cumulative profit estimate is US$ 41.3 million and the cumulative net
cash flow estimate is US$ 15.8 million.
Base
Case Scenario: Summary of Economic Results
|
Turmalina
Expansion Project (Phase I - 610 ktpy)
|
Economic
Indicators
|
|
IRR
(% per year)
|
106.3
|
|
NPV
@ 0% - [US$]
|
15.8
million
|
|
NPV
@ 5% - [US$]
|
11.6
million
|
|
NPV
@ 8 % - [US$]
|
9.7
million
|
|
NPV
@ 10% - [US$]
|
8.6
million
|
|
NPV
@ 12% - [US$]
|
7.7
million
|
|
Payback
Period (straight)
|
1.98
semesters
|
|
Payback
Period @ 8%
|
2.07
semesters
|
|
Payback
Period @ 10%
|
2.09
semesters
|
|
Payback
Period @ 12%
|
2.11
semesters
|
|
Life
of Mine Production
|
16.0
semesters
|
|
•
|
Average
Cash Cost
|
US$
488 per ounce Au
|
||
|
•
|
Total
Production Cost
|
US$
619 per ounce, including invested
capital
|
The
sensitivity analysis indicated the following variations to the IRR:
|
Gold
Price = US$ 675/ounces Au
|
IRR
= 30.9 % py
|
|
Gold
Price = US$ 725/ounces Au
|
IRR
= 76.2 % py
|
|
Metallurgical
Recovery = 92%
|
IRR
= 133.0 % py
|
|
Metallurgical
Recovery = 89%
|
IRR
= 95.3% py
|
41
|
Investment
+ 10%
|
IRR
= 67.4 % py
|
||
|
Investment
+ 5%
|
IRR
= 83.3 % py
|
||
|
OPEX
+ 7%
|
IRR
= 73.1 % py
|
||
|
OPEX
- 5%
|
IRR
= 135.3 % py
|
|
Mill
Feed Grade + 3% (4.12 grams per tonne)
|
IRR
= 144.4 % py
|
|
Mill
Feed Grade - 3% (3.88 grams per tonne)
|
IRR
= 79.0 % py
|
Interpretation
and Conclusions
It
is TechnoMine’s conclusion that the Turmalina Expansion is low-risk and
robust. It has been extensively studied from a technical standpoint
and is supported by extensive exploration, metallurgical testwork, and
conceptual and basic engineering, in addition to special front-end engineering
tests and studies. The technical work for the expansion was performed
by reputable entities in Canada, USA, Germany, and Brazil.
Most
CAPEX and OPEX estimates are supported by vendor quotes, contracts, and
receipts. Key pieces of equipment have been purchased or are in the
final procurement stage. Cost estimates are based on solidly
supported process routes, mining methods, and plans, being within the +/- 15%
accuracy range.
Based
on the aforementioned conclusions and on the strong economic results yielded
from the cash flow model and sensitivity analysis, TechnoMine considers the
Turmalina Expansion to be feasible and attractive. Related technical
and economic risks are small.
Recommendations
TechnoMine
recommends Jaguar to proceed with the implementation of the Turmalina
Expansion.
Although
the Turmalina Expansion is feasible and robust at its current size, it is
recommended that exploration efforts continue not only at the Turmalina mining
complex, but also at other targets in the region. An increased
resource base will give rise, via a further consolidated feasibility study, to
increased reserves, which, in turn, may significantly improve the financial
performance of the expansion.
The
same or higher technical standards related to the front-end engineering
activities (such as exploration, metallurgical testwork, and conceptual and
basic engineering) and the required special front-end engineering tests and
studies should be maintained for the augmented project.
The
recommended additional exploration and remaining front-end engineering
activities should start as soon as possible in order to support a technically
sound and smooth transition in the increase of project size.
TechnoMine Paciência
Technical Report
Introduction
Jaguar
retained TechnoMine to prepare an NI 43-101 compliant feasibility study on the
on the Paciência-Santa Isabel Mine Project (the “Paciência-Santa Isabel Project”
or the “Paciência-Santa Isabel Target”). TechnoMine issued its report
on August 7, 2007. The following description of this project is
derived from the summary contained in the TechnoMine Paciência Technical
Report.
Paciência-Santa
Isabel Project is located 81 kilometers from Belo Horizonte and 23 kilometers
from Itabirito, in the state of Minas Gerais, Brazil. The area has good
infrastructure and the Paciência-Santa Isabel Project site can be accessed by
18-wheel trucks on paved and dirt roads.
42
MSOL,
Jaguar’s 100%-owned subsidiary, purchased several properties from AngloGold
Ashanti in 2003, including the Paciência-Santa Isabel Target, which was the
object of the TechnoMine Paciência Technical Report. The
Paciência-Santa Isabel Target comprises one mineral right covering an area of
1,000 hectares. The Paciência-Santa Isabel Target is part of Jaguar’s
Paciência mining complex, which includes several mineral rights covering an area
of approximately 17,500 acres.
Mining
operations at the Santa Isabel Mine commenced in April 2008 as the Paciência
Plant entered the commissioning phase. Paciência reported its first
gold pour on July 24, 2008 and produced a total of 24,364 ounces of gold by the
end of 2008.
During
2008, power for the Paciência-Santa Isabel operations was partially supplied by
CEMIG, the local power utility company. A total diesel-generated
installed power of 4.2 MVA (3.5 MW; one 0.5 MW generator in stand by) was
implemented to replace high-cost energy, especially during peak demand
hours.
Fresh
water to supply the mine and plant is provided by the Tejuco Creek, a tributary
to the Rio das Velhas (“das Velhas River”). A pump station is located
in the river about 2.6 kilometers from the Santa Isabel Project’s main water
tank.
A
digital-technology based telephone communication system is supplied by Embratel,
a leader in corporate communication solutions. The system
accommodates a 30-channel link for voice communication and a digital data
connection with MSOL’s head office in Belo Horizonte, where a shared link
provides safe Internet and Intranet access.
Geology
The
Paciência-Santa Isabel Project area hosted various productive and historical
mines during the Brazilian Gold Cycle (17th an
18th
centuries), such as the Cata Branca Mine, the Rainha Mine, Morro de São Vicente,
Marzagão, Bahú, etc. The Project properties are situated in the Iron
Quadrangle, including the Paciência-Santa Isabel Target (which is the object of
the Paciência-Santa Isabel feasibility study). This well-known
prolific mining area comprises rocks ranging in age from Archean to Upper
Proterozoic. Numerous gold and iron deposits are associated with these
rocks.
The
gold metallogeny in the Iron Quadrangle has a complex
history. Initially, in the Archean period, volcanic exhalative
sedimentary processes in the greenstone belts produced banded iron formations
and chert-hosted, sulfide-rich gold deposits. Shear zone related gold deposits
were also generated at that time.
Gold
mineralization at the Paciência-Santa Isabel operations area occurs in two
forms. The dominant form is associated with disseminated sulfide in quartz veins
and sericite/chlorite schists, as a result of the hydrothermal alteration
development in the shear zone. The second form is in the basal
conglomerate of the Moeda Formation. The second type of mineralization is not
considered in the TechnoMine Paciência Technical Report.
The
gold mineralization of the Santa Isabel Target is related to the Paciência
trend. This trend was discovered and intensively mined in the 17th and
18th
centuries and now it is recognized by large surface excavations and old mines
distributed in a continuous straight line. The ore shoots are composed of
concentrations of the microcrystalline quartz veins in a sericite/chlorite
schist matrix. The gold occurs in small visible nuggets in the quartz or inside
the sulfide. These quartz-rich zones exhibit boudinage shapes, with thicknesses
variable from centimeters up to 30 meters, width between 10 meters and 200
meters and hundreds of meters of continuity following the plunge. The gold
grades are variable, and grades between 100 to 500 grams per tonne are not
uncommon due to the existence of coarse gold.
43
Mineral
Resources
The
mineral resource estimate was prepared by Moreno & Associados (“Moreno”), a
Belo Horizonte based consulting company, under the supervision of the author of
the TechnoMine Paciência Technical Report, and is shown in the table
below.
Paciência Gold Project Santa Isabel
Mine - Resource Estimate
|
Category
|
Tonnage
(t)
|
Grade
(g
Au/t)
|
Ounces
(oz
Au)
|
|
Measured
(M)
|
871,170
|
5.59
|
156,590
(36.4%)
|
|
Indicated
(I)
|
1,702,230
|
5.00
|
273,670
(63.6%)
|
|
(M
+ I)
|
2,573,400
|
5.20
|
430,260
|
|
Inferred
|
420,700
|
5.44
|
73,580
|
The
software used was MineSight. The adopted capping grade was 95 grams per tonne,
while the cut-off grade selected for the estimation was 1.5 grams per tonne.
Poor variography eliminated the option of kriging and the ISD method was adopted
to weigh composites grades within the blocks. See Appendix 01 of the TechnoMine
Paciência Technical Report for Moreno’s Mineral Resource Final Report.
Mineral
Reserves
Paciência
Gold Project Santa Isabel Mine - Reserve Estimate
|
Tonnage
(t)
|
Grade
(g
Au/t)
|
Ounces
(ounces
Au)
|
|
|
Proven
(Pv)
|
987,900
|
4.52
|
143,580
|
|
Probable
(Pb)
|
1,726,000
|
4.52
|
250,870
|
|
Total
(Pv + Pb)*
|
2,713,900
|
4.52
|
394,450
|
|
*
2,260 ounces of gold, corresponding to test mining production during 2006
(21,742 t at 3.23 grams per tonne) have not been deducted from the above
stated reserves.
|
The
Cut and Fill Method has been adopted for the Paciência-Santa Isabel
Project. The Mining Plan showed a 91.7% recovery and a dilution of
15%. Hence, the estimated total tonnage that will be mined
is:
[(2,573,400
t)*(0.917)*(1.15)] = 2,714,000 t.
The
ROM average diluted average is estimated at:
[(5.20
grams per tonne)]/(1.15) = 4.52 grams per tonne
(Proven
+ Probable) Reserves are currently estimated at:
Pv
+ Pb = (2,714,000 t) * (4.52 g / t) = 394,450 ounces
Au
Proven
Reserves = (0.364)*(2,714,000) = 987,900 t @
4.52 grams per tonne = 143,580 ounces Au
Probable
Reserves = (0.636)*(2,714,000) = 1,726,100 t @ 4.52 grams per tonne = 250,870
ounces Au
A
Mine Call Factor (“MCF”) of 97% has also been adopted based on the experience of
the feasibility study’s mining team. Therefore, the estimated Mill Feed grade
is:
4.52
* 0.97 = app 4.384 grams per tonne and the estimated to-the-mill amount of
ounces of gold is (394,450 ounces Au) * (0.97) = (2,714,000 t) * (4.384 grams
per tonne) = approx. 382,600 ounces Au
44
Considering
the Overall Metallurgical Recovery (93%), the estimated total salable ounces of
gold is (382,600)*(0.93) = 356,000 ounces
Au.
Project
Summary Data
|
•
|
Project
Life:
|
9.7
semesters, starting in the second quarter of 2008
|
|
|
•
|
Pre-production
period:
|
5
months
|
|
|
•
|
Measured
and Indicated
|
||
|
Resources:
|
2,573,400
t at 5.20 grams per tonne (average) = 430,260 ounces Au
|
||
|
•
|
Mining
Method:
|
Cut
and Fill
|
|
|
•
|
Production
Rates (ROM):
|
400
kt / year (2008) and 600 kt / year (following years),
|
|
|
514
kt in 2012
|
|||
|
•
|
Mining
Average Dilution:
|
15%
|
|
|
•
|
Mining
Average Recovery:
|
91.7%
|
|
|
•
|
Proven
and Probable
|
||
|
Reserves
(ROM):
|
2,714,000
t at 4.52 grams per tonne = 394,450 ounces Au
|
||
|
•
|
Mining
Call Factor:
|
97%
|
|
|
•
|
To-the-Mill
Grade:
|
4.39
grams per tonne
|
|
|
•
|
To-the-Mill
Gold:
|
382,600
ounces Au
|
|
|
•
|
Process
Route:
|
Crushing/Screening
- Grinding - Gravity Separation -
|
|
|
Leaching
- CIP - ADR (including Elution and Electrowinning)
|
|||
|
•
|
Metallurgical
Recovery:
|
93%
|
|
|
•
|
Total
salable ounces of gold:
|
356,000
ounces Au
|
|
|
•
|
Product:
|
Gold
(bullion)
|
|
Permitting
On
January 24, 2005 MSOL applied for the Previous License (“LP”) related to the
Paciência-Santa Isabel Project.
The LP was awarded to MSOL on July 27, 2006. The environmental study,
submitted along with the LP application, was an EIA/RIMA - as defined in item
21.4.1. The Paciência-Santa Isabel Target’s
EIA/RIMA is filed at Jaguar’s office in Belo Horizonte, Brazil.
On
December 26, 2006 Jaguar submitted an application for the Implementation License
(“LI”). The environmental study submitted along with the LI
application was an RCA, whose approval allows the completion of important works
that need to be constructed in the area, such as the erection of the mineral
processing plant, construction of the tailings dam, opening of accesses,
development of the underground mine, installation of the Infrastructure (power
and water supply systems, roads, etc.), and preparation of the waste dump
area.
MSOL
holds the Mineral Right DNPM 830.375/79 related to the
property. Jaguar applied for the Mining Concession last year. Jaguar
was awarded the LI on May 17, 2007 and informed the DNPM shortly thereafter.
This is the last requirement that must be fulfilled by a mining company in order
to be granted the related Mining Concession (the ultimate status of Mineral
Right). Therefore, it is anticipated that MSOL will be awarded the
Mining Concession for the Santa Isabel target soon.
45
After
the installation of the Paciência Santa Isabel Project was
completed and the environmental requirements were met, Jaguar applied for the
Operation License (“LO”). After the LO application was submitted,
operations started under a Provisional Operation License issued 10 (ten) days
after the filing date, as established in the state of Minas Gerais Decree Nº
44.309/06, dated June 5, 2006. The Paciência Santa Isabel LO
was received in October 2008.
Capital
Costs
The
total non-discounted investment estimate is US$ 47.7 million as shown
below.
|
Investments
|
Unit: US$
1,000
|
|
Operation
Shutdown
|
(2,126)
|
|
Environmental
Operation & Closure CAPEX
|
(515)
|
|
Work
Capital
|
(722)
|
|
Work
Capital Recovery
|
722
|
|
Salvage
|
7,256
|
|
Stay
in Business
|
(450)
|
|
CAPEX
- Pre- Operational Investments
|
(43,388)
|
|
CAPEX
- Operational Investments
|
(8,505)
|
|
TOTAL
INVESTMENTS
|
(47,729)
|
Operating
Costs
The
total non-discounted life of mine operating cost for the Paciência-Santa
Isabel Project has
been estimated at US$ 86.5 million.
Economic
Analysis
The
following economic results are based on the criteria utilized in the discounted
cash flow model for the Base Case Scenario:
|
•
|
Gold
price
|
US$
600 per troy ounce of gold
|
|||||
|
•
|
ROM
Total Tonnage
|
2,714,000
tonnes
|
|||||
|
•
|
Mineral
Reserves
|
2,714,000
t @ 4.52 grams per tonne Au, containing 394,450
|
|||||
|
ounces
|
|||||||
|
•
|
Mill
Feed Grade (average)
|
4.39
grams per tonne
|
|||||
|
•
|
Mining
Rate
|
400,000
t in 2008;
|
|||||
|
600,000
t per year starting in 2009;
|
|||||||
|
513,700
t in 2012
|
|||||||
|
•
|
ROM
Average “Cruise” Production
|
1,755
tpd ROM (600,000 tpy: 342 days/year)
|
|||||
|
•
|
Metallurgical
Recovery
|
93%
|
|||||
|
•
|
Gold
Total Production
|
356,000
ounces Au
|
46
|
•
|
Gold
Average Annual Production
|
73,300
opy
|
||
|
•
|
Project
life (LOM)
|
9.7
semesters
|
||
|
•
|
CAPEX (total)
|
US$
47.7 million (straight)
|
||
|
•
|
Average
Cash Cost
|
US$
252 per ounce Au
|
||
|
•
|
Total
Production Cost
|
US$
386 per ounce, including invested capital
|
||
|
•
|
Production
Start
|
Second
quarter of 2008
|
||
|
•
|
Exchange
Rate
|
Construction
Period: US$ 1.00 = R$2.00
|
||
|
Production
Period: US$ 1.00 = R$2.30 (average)
|
|
|
•
|
Depreciation
and amortization have been prorated over the Paciência-Santa Isabel Project
life.
|
The
Cumulative Operating Profit has been estimated at US$ 123.8 million, while the
After-Tax Cumulative Profit estimate is US$ 98.0 million and the Cumulative Net
Cash Flow estimate is US$ 49.5 million.
The
primary after-tax economic indicators from the Cash Flow Model (Appendix 02 of
the TechnoMine Paciência Technical Report, which also includes a Sensitivity
Analysis) are summarized in Table 1.9.1. The indicators point to an
economically feasible project.
Table
1.9.1 - Base Case Scenario: Summary of Economic Results
|
Paciência
Gold Project
Santa
Isabel Mine
|
Economic
Indicators s
|
|
IRR
(% per year)
|
26.2
|
|
NPV
@ 0% - [US$]
|
49.5
million
|
|
NPV
@ 5% - [US$]
|
26.4.
million
|
|
NPV
@ 8 % - [US$]
|
17.8
million
|
|
NPV
@ 10% - [US$]
|
13.6
million
|
|
NPV
@ 12% - [US$]
|
10.2
million
|
|
Payback
Period (straight)
|
4.81
semesters
|
|
Payback
Period @ 8%
|
5.36
semesters
|
|
Payback
Period @ 10%
|
5.44
semesters
|
|
Payback
Period @ 12%
|
6.04
semesters
|
|
Life
of Mine Production
|
9.7
semesters
|
The
sensitivity analysis indicated the following variations to the IRR:
|
Gold
Price = US$ 520/ounces Au
|
IRR
= 17.3 % py
|
|
|
Gold
Price = US$ 680/ounces Au
|
IRR
= 34.4 % py
|
|
|
Metallurgical
Recovery = 92%
|
IRR
= 25.5 % py
|
|
|
Metallurgical
Recovery = 91%
|
IRR
= 24.8 % py
|
|
Investment
+ 10%
|
IRR
= 24.1 % py
|
||
|
Investment
- 10%
|
IRR
= 28.4 % py
|
||
|
OPEX
+ 10%
|
IRR
= 23.5 % py
|
||
|
OPEX
- 10%
|
IRR
= 28.7 % py
|
|
Mill
Feed Grade + 10% (4.83 grams per tonne)
|
IRR
= 34.2% py
|
|
|
Mill
Feed Grade - 10% (3.95 grams per tonne)
|
IRR
= 21.7% py
|
47
Interpretation
and Conclusions
It
is TechnoMine’s conclusion that the Paciência-Santa Isabel Project is
low-risk and robust. It has been extensively studied from a technical
standpoint and is supported by significant exploration, metallurgical testwork,
and conceptual and basic engineering, in addition to special front-end
engineering tests and studies. The aforementioned technical work for
this Paciência-Santa Isabel Project was
performed by reputable entities in Canada, USA, Germany, and
Brazil.
Most
CAPEX and OPEX estimates are supported by vendor quotes, contracts, and
receipts. Key pieces of equipment have been purchased. Cost estimates
are based on solidly supported process routes, mining methods, and plans, being
within the +/- 15% accuracy range.
Based
on the economic results yielded from the cash flow model and sensitivity
analysis, TechnoMine considers the Paciência-Santa Isabel Project to
be feasible and attractive. Related technical and economic risks are
small.
Recommendations
TechnoMine
recommends Jaguar to proceed with the Paciência-Santa Isabel Project’s
implementation.
Although
the Paciência-Santa Isabel Project is
feasible and robust at its current size, it is our recommendation that the
exploration efforts continue not only at the Paciência-Santa Isabel Property,
but also at other targets in the Paciência mining complex. An increased resource
base will give rise, via a consolidated feasibility study, to increased
reserves, which, in turn, will significantly improve the financial performance
of the Paciência-Santa Isabel Project.
The
same or higher technical standards related to the front-end engineering
activities (such as exploration, metallurgical testwork, and conceptual and
basic engineering) and the required special front-end engineering tests and
studies should be maintained for the augmented project.
The
recommended additional exploration and remaining front-end engineering
activities should start as soon as possible in order to support a technically
sound and smooth project size transition.
The
basic project of the CIP tailings Detox Plant should start as soon as the
process route is defined, based upon the ongoing Degussa/CyPlus test work being
carried out by CyPlus at their research center facility at Hanau, Germany
(Purchase Order issued on April 24, 2007).
Current
Project Status
Construction
of the Paciência CIP processing plant began immediately after the completion of
the TechnoMine Paciência Technical Report. Mining operations at the
Santa Isabel Mine commenced in April 2008 as the new plant entered the
commissioning phase. Jaguar uses the cut-and-fill mining method at
the Santa Isabel Mine.
On
July 24, 2008, Paciência reported its first gold pour and operations were deemed
commercial during the latter part of the fourth quarter of 2008 based on
throughput rates. Paciência produced 24,364 ounces of gold in
2008.
TechnoMine
Quadrilátero Technical Report
The
following description of the Sabará Zones A, B and C (Lamego), Catita, Camará,
Morro do Adão, Juca Vieira (Catita II), Paciência - Santa Isabel, Bahú,
Marzagão, Rio de Peixe, and Pilar properties is based on the summary contained
in the TechnoMine Quadrilátero Technical Report. Most of the mineral
resources and reserves in the Iron Quadrangle have been updated since the date
of the TechnoMine Quadrilátero Technical Report. For updated
information on Jaguar’s mineral resources and reserves in the Iron Quadrangle,
see Table 1 under “Mineral
Resources and Reserves”, above.
48
As
of the date of the TechnoMine Quadrilátero Technical Report, Jaguar controlled
the mineral rights, concessions and licenses to approximately 51,200 ounces of
gold reserves at Sabará Zone B, 1,752,400 ounces of measured and indicated gold
resources and 628,400 ounces of inferred gold resources. Also as of
such date, Jaguar’s proven reserves were contained within 641,000 tonnes of
in situ measured
resources at an average grade of 3.61 grams/tonne. As presented in
TechnoMine’s feasibility study issued on June 30, 2003, total ROM production for
Zone B was estimated to enclose 61,700 ounces Au. As of the date of
the TechnoMine Quadrilátero Technical Report, proven reserves were estimated
(based on a metallurgical recover of 83%) to total 51,200 ounces. At
the time of the TechnoMine Quadrilátero Technical Report, Jaguar had measured
resources of 7.57 million tonnes at an average grade of 4.38 grams/tonne,
indicated resources of 4.29 million tonnes at an average grade of 4.73
grams/tonne and inferred resources of approximately 3.86 million tonnes with an
estimated average grade of 5.07 grams/tonne. As of the date of the
TechnoMine Quadrilátero Technical Report, measured and indicated resources
together totaled approximately 11.86 million tonnes with an average grade of
about 4.60 grams/tonne.
All
of the Quadrilátero Gold Project properties are located in the Iron Quadrangle
greenstone belt of the state of Minas Gerais, Brazil. The properties
are located within 60 kilometers of the city of Belo Horizonte, which serves as
the commercial center for Brazil’s gold mining industry and has excellent
infrastructure to support world-class gold mining operations.
The
Iron Quadrangle region has historically produced significant quantities of gold
at reasonable capital and operating costs from open pit and large scale
underground mining operations.
The
gold metallogeny in the Iron Quadrangle has a complex
history. Initially, in the Archean era, volcanic exhalative
sedimentary processes in the greenstone belts produced BIFs and chemical
sedimentary rock (“chert”), which hosted sulfide-rich gold
deposits. Shear zone-related gold deposits were also generated at
that time.
The
stratigraphy for the Iron Quadrangle is as follows from oldest (Archean) to
youngest (Upper Proterozoic):
|
|
•
|
Tonalities,
trondjemite, gneiss basement
|
|
|
•
|
Rio
das Velhas Supergroup (Greenstone
Belt)
|
|
|
•
|
Espinhaço
Supergroup lying unconformably on the Rio das Velhas
Supergroup
|
|
|
•
|
Minas
Supergroup overlying with a tectonic angular and erosional unconformities
the Espinhaço Supergroup
|
|
|
•
|
Itacolomi
Group overlying with a tectonic angular and erosional unconformities the
Minas Supergroup
|
The
Rio das Velhas Supergroup is subdivided into two groups: Nova Lima and Maquiné.
The Nova Lima Group consists of a greater-than-four kilometer thick
eugeosynclinal succession including greywacke, carbonate schist, immature
quartzite, quartz schist, conglomerate, banded iron formations, schistose tuff,
graphitic schist, carbonate chert, phyllite, greenschist, and meta-ultramafic
rocks. The Maquiné Group consists of a 1.8 kilometer thick
eugeosynclinal molasse including protoquartzite, grit conglomerate, phyllite,
greywacke, and minor basal conglomerate.
A
portion of the Archean-aged Nova Lima Group underlies all of Jaguar’s
properties. This group consists of a sequence of intensely folded and
faulted volcanic and sedimentary rocks. These rocks consist of phyllite, mafic
volcanic tuff, lesser conglomerate, dolomite, graphitic schist, banded iron
formations, and chert.
Gold
mineralization occurs in both sulfide and oxide forms and is hosted primarily in
a narrow belt of BIFs and chert. The width of the BIFs varies from 1
to 30 meters. Gold is found to be associated to the sulfide-richer
bands, essentially represented by pyrite and arsenopyrite. The
mineralized bodies are controlled by mineral stretching lineations and fold axis
showing an average attitude (strike and dip) S70ºE - 45ºE.
The
mineralization bodies are dominantly stratabound and are congruently folded and
deformed with the host rocks. The deformation style is thrust fault-related
folding with a westerly transport direction on the thrusts, followed by late
east - west trending brittle faults (likely due to post-thrusting extensional
stress relief) that aided in the orientation of quartz lodes and
veining.
49
Mining
in the Iron Quadrangle has consistently shown gold-bearing structures that
display very consistent lateral and vertical persistence. TechnoMine
prepared a study for Jaguar on the depth continuity of gold-bearing
mineralization in the Iron Quadrangle: “Potential Resource Base Increase due
to possible depth continuity of mineralized bodies”. The study
was issued on October 29, 2002, and parts of it are addressed further in the
TechnoMine Quadrilátero Technical Report.
Mina
Grande is a good example of ore body persistence. Mina Grande was the
deepest mine ever operated in Brazil (more than 2,200 meters
deep). It was also one of the oldest mines in terms of continuous
operations worldwide (from 1836 until 1995). Mina Grande lies in what
could be considered the center of the Iron Quadrangle’s gold-bearing area where
all of Jaguar’s mineral regions are located.
Exploration
and Development
In
January 2004 Jaguar commenced a 24-month exploration effort that included both
surface and underground exploration in several properties. As of the
date of the TechnoMine Quadrilátero Technical Report, Zone A exploration was
complete and the corresponding results were used by Scott Wilson RPA to complete
its Sabará Technical Report.(see below under “Scott Wilson RPA Sabará Technical
Report” for a description of the Scott Wilson RPA Sabará Technical
Report). The total cost originally estimated for the
campaign was US$8,797,000, out of which US$4,881,000 (approximately 55 percent
of the total estimated cost) was for developing underground ramps and drifts,
and US$3,916,000 (approximately 45 percent of the total estimated cost) was for
maps, surface and underground drilling, sampling, studies, environmental
permitting and associated activities.
The
original budget for the initial 24-month exploration program, as of the date of
the TechnoMine Quadrilátero Technical Report, is set forth below.
ORIGINAL
BUDGET FOR 24-MONTH EXPLORATION PROGRAM (US$)
FROM
THE QUADRILÁTERO REPORT
(EXCLUDES
TURMALINA PROJECT)
|
2004
|
2005
|
Total
|
Maps,
Drilling, Sampling, Studies, Environmental Permits and Associated
Activities
|
Sabará
Region
|
|||
|
Sabará
Zone A
|
273,000
|
0
|
273,000
|
|
Catita/Juca
Vieira
|
497,000
|
304,000
|
801,000
|
|
Paciência
Region
|
|||
|
Paciência
|
1,109,000
|
0
|
1,109,000
|
|
Rio
de Peixe
|
217,000
|
17,000
|
234,000
|
|
Santa
Bárbara Region
|
|||
|
Mina
do Pilar
|
498,000
|
496,000
|
994,000
|
|
New
sites
|
505,000
|
0
|
505,000
|
|
Subtotal
|
$3,099,000
|
$817,000
|
$3,916,000
|
Underground
Exploratory Developments: Ramps and Drifts
|
Sabará
Region
|
|||
|
Catita/Juca
Vieira
|
898,000
|
2,689,000
|
3,587,000
|
|
Santa
Bárbara Region
|
|||
|
Mina
do Pilar
|
466,000
|
828,000
|
1,294,000
|
|
Subtotal
|
$1,364,000
|
$3,517,000
|
$4,881,000
|
|
Total
|
$4,463,000
|
$4,334,000
|
$8,797,000
|
50
Jaguar
conducted exploration at the Sabará Zone A during 2005 and 2006. On
February 17, 2006, Scott Wilson RPA completed a technical report on February 17,
2006 concerning mining and milling gold-bearing mineralization from the Sabará
Zone A, Lamego (oxide) and Queimada properties and the remaining resources in
Zone B, which are contained within the Quadrilátero Gold Project. The
results of this report are discussed below in “Scott Wilson RPA Sabará Technical
Report”.
Since
the date of the TechnoMine Quadrilátero Technical Report, Jaguar received the
permit to complete construction of the new 1,500 tpd oxide Sabará plant in
September 2005. The new plant began crushing ore from Sabará Zone A
in December 2005 and began producing gold in January 2006.
Mining
operations at Sabará Zone B mine ended in the fourth quarter of
2005. It is currently under reclamation.
At
the time of the TechnoMine Quadrilátero Technical Report, exploration work was
underway at Catita. At such time,
exploration work was also underway at Paciência/Santa Isabel Mine and is further
discussed below under “TechnoMine Paciência Technical
Report". Finally, at that time exploration work was also
underway with respect the Pilar Mine; the developments with respect to the Pilar
Mine are discussed below under “TechnoMine Caeté Technical
Report”.
The
TechnoMine Quadrilátero Technical Report stated that Catita’s trenching and
drill programs had intersected mineralized zones confirming previous exploration
results and identifying new zones for additional exploration. Initial
core and trench assays had returned interesting results with visible gold
occurring in both the oxide and sulfide zones. In January 2006,
Jaguar began mining operations at the Catita Mine and started hauling its
sulfide ore to the Queiróz plant of AngloGold Ashanti. Mining
operations at Catita concluded in the fourth quarter of 2006.
Jaguar
utilized two laboratories for the preparation and analysis of its samples:
Lakefield Geosol Laboratórios Ltda. (“Lakefield”) in Belo Horizonte-MG and SGS
do Brasil Ltda. (“SGS”) in Betim-MG. These labs are widely recognized
and follow the standards established by the international
community. The labs merged in 2005. Jaguar continues to
use the surviving lab, SGS Geosol Laboratórios Ltda., for reporting results, but
established its own lab adjacent to the Caeté Plant in the fourth quarter of
2005 for internal testing purposes.
The
author of the TechnoMine Quadrilátero Technical Report stated that the sampling
method and approach, entailing sample preparation, security and analytical
procedures were adequate and were acceptable vis-á-vis the principles of good
engineering practice. They further stated that they did not
personally verify any sampling or analytical data. Such verification
was performed by Jaguar’s Chief Geologist. TechnoMine and the authors
of the TechnoMine Quadrilátero Technical Report stated that the sample
verification criteria, methods and procedures, were adequate and were acceptable
vis-á-vis the principles of good engineering practice.
Based
on the encouraging 2004 exploration results, the expanded geological knowledge
of the several sites and favorable underground workings that provide required
maneuverability to proceed with underground exploration, the TechnoMine
Quadrilátero Technical Report recommended that Jaguar establish the scope of the
2005 portion of the Quadrilátero Gold Project’s Complementary Exploration
Campaign as outlined in the budget shown below. The budget shown
below replaced the 2005 portion of the previous budget for the 24-month
exploration campaign. The author of the TechnoMine Quadrilátero
Technical Report also recommended, at the time of the TechnoMine Quadrilátero
Technical Report, that Jaguar proceed with a staged preparation of feasibility
studies for the implementation and operation of the diverse projects that
comprised the Quadrilátero Gold Project, within design criteria, plans,
processes, and schedules compatible with good engineering practices and
standards.
ORIGINAL
BUDGET FOR PREPARATION OF FEASIBILITY STUDIES
(FROM
THE TECHNOMINE QUADRILÁTERO TECHNICAL REPORT)
|
Regions/Projects
|
Estimated
Cost (US$ 1,000)
|
|
Sabará
Region
(Catita
(sulfide))
|
600
|
|
Paciência
Region
(Santa
Isabel, Marzagão, Rio de Peixe)
|
1,600
|
|
Santa
Bárbara Region
|
1,000
|
|
Total
|
$
3,200
|
51
REVISED
BUDGET FOR 24-MONTH EXPLORATION PROGRAM
(FROM
THE TECHNOMINE
QUADRILÁTERO TECHNICAL REPORT)
|
Project
|
Site
|
Drilling
(m)
|
Drifts
(m)
|
Cost
Estimate (US$ 1,000)
|
|
Sabará
|
Camará
|
1,000
|
100
|
|
|
Catita
(sulfide)
|
4,000
|
2,500
|
4,150
|
|
|
Morro
do Adão
|
2,500
|
400
|
850
|
|
|
Serra
Paraíso
|
5,500
|
550
|
||
|
Paciência
|
Santa
Isabel
|
3,500
|
400
|
950
|
|
Marzagão
|
3,000
|
300
|
||
|
R
de Peixe (oxide)
|
2,000
|
200
|
||
|
R
de Peixe (sulfide)
|
1,400
|
500
|
890
|
|
|
Santa
Bárbara
|
Pilar
(Sulfide)
|
4,000
|
1,000
|
1,900
|
|
TOTAL
|
26,900
|
4,800
|
$ 9,890
|
Certain
recent developments in the Sabará property described below in “Scott Wilson RPA Sabará Technical
Report”, recent developments in the Paciência-Santa Isabel project are
described above under “TechnoMine Paciência Technical Report”,
and recent developments in the Pilar property are described below under “TechnoMine Caeté Technical
Report”.
Scott Wilson RPA Sabará
Technical Report
Jaguar
completed a feasibility study of mining and processing mineralization at Zones
A, B, C (Lamego) and Queimada and retained Scott Wilson RPA to prepare an
independent technical report compliant with NI 43-101. Scott Wilson
RPA issued its report on February 17, 2006. The Scott Wilson RPA
report is no longer current and has not been updated to reflect any new
information since the date of the report, including but not limited to,
resources and reserves, mine and plant production, metallurgy, operating and
capital costs and environmental. The following description of this
project is derived from the summary contained in the Scott Wilson RPA Sabará
Technical Report.
The
Sabará Project comprises development of a 400,000 tpa mining and heap leach
facility, forecast to produce approximately 134,000 ounces of gold over a five
year period. Prestripping had been completed and the first bench of
mineralization had been exposed before the issuance of the Scott Wilson RPA
Sabará Technical Report. Mining, crushing, heap leaching, and the
carbon column/adsorption facilities were started in January 2006.
Economic
Analysis
The
Base Case estimated cash flow for the life of mine is shown in Table
1-1. The projection was based on the following
parameters.
Physicals
|
•
|
Mine
life:
|
5.1
years, 400,000 tonnes per year
|
|
•
|
Start
of production:
|
January
2006
|
|
•
|
Total
millfeed:
|
2,046,000
tonnes at a grade of 2.8 grams per tonne Au.
Mine
call factor 97%
|
|
•
|
Strip
Ratio:
|
4.2
to 1
|
|
•
|
Operations
at 360 days per year
|
|
•
|
Mine
production:
|
|
|
•
|
Zones
A&C - up to 33,000 tonnes per month ore from a reserve of 1,564,000
tonnes at a grade of 2.07 grams per tonne Au and a strip ratio of
4.11:1.
|
52
|
|
•
|
Queimada
- up to 16,700 tonnes per month ore from a reserve of 407,000 tonnes at a
grade of 5.28 grams per tonne Au and a strip ratio of
4.24:1.
|
|
|
•
|
Zone
B oxides - up to 3,500 tonnes per month ore from a reserve of 20,000
tonnes at a grade of 3.61 grams per tonne
Au.
|
|
|
•
|
Zone
B sulphides - up to 5,100 tonnes per month ore from a reserve of 55,000
tonnes at a grade of 5.07 grams per tonne
Au.
|
|
|
•
|
Zone
B stripping - 4.46:1 overall.
|
|
•
|
Processing
- Zones A&C, Queimada, and Zone B Oxide at Sabará heap leach and ADR
plant. Zone B Sulphide at Queiróz CIL
plant.
|
|
•
|
Gold
recovery:
|
|
|
•
|
Zones
A&C - 74%
|
|
|
•
|
Queimada
- 74%
|
|
|
•
|
Zone
B Oxide - 70%
|
|
|
•
|
Zone
B Sulphide - 92%
|
|
•
|
Total
gold produced: 134,100 ounces, annual range from 18,800 ounces to 38,700
ounces.
|
Costs
|
|
•
|
Operating
cost: US$10.98 per tonne processed, ranging from US$10.39 per tonne to
US$13.25 per tonne. Open pit mining is by
contractor.
|
|
|
•
|
Capital
cost: Pre-production capital is estimated to be US$5.6
million
|
|
|
•
|
Sustaining
capital: Ranges from US$40,000 to
US$380,000
|
|
|
•
|
Closure
costs: US$190,000.
|
|
|
•
|
Exchange
rate: US$1.00 = 2.60 reais
|
Revenue
|
|
•
|
Gold
price:
|
US$375
per ounce
|
|
|
•
|
Transport
and insurance:
|
US$3.00
per ounce
|
|
|
•
|
Refining:
|
1%
of gross sales
|
|
|
•
|
CFEM
(federal) royalty:
|
1%
of gross sales
|
|
|
•
|
Royalty
to previous owners:
|
3.25%
NSR
|
The
Scott Wilson RPA Sabará Technical Report concluded that the pre-tax cash flow at
US$375 per ounce gold was US$19.5 million. At a discount rate of
8.0%, the pre-tax NPV was US$14.3 million. The GI Total Cash Cost was
US$182 per ounce. The GI Total Production Cost is US$230 per
ounce.
Jaguar’s
after-tax NPV estimate at 8.0% discount rate was US$7.8 million, with a Project
IRR of 82%. Scott Wilson RPA did not review Jaguar’s tax
model.
Figure
1-1 shows the Project sensitivity to various factors, including:
• Head
Grade
• Recovery
• Gold
Price
• Operating
Cost
• Capital
Cost
• Exchange
Rate
53
FIGURE
1-1
SENSITIVITY
ANALYSIS
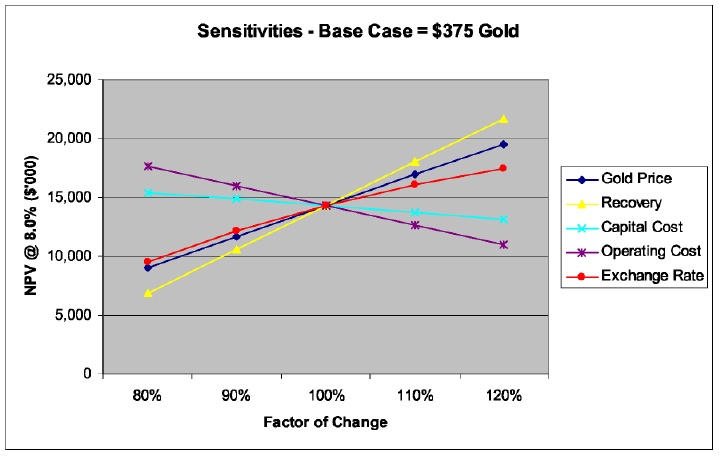
54
TABLE
1-1 PRE-TAX CASH FLOW
JAGUAR
MINING INC. - SABARÁ PROJECT
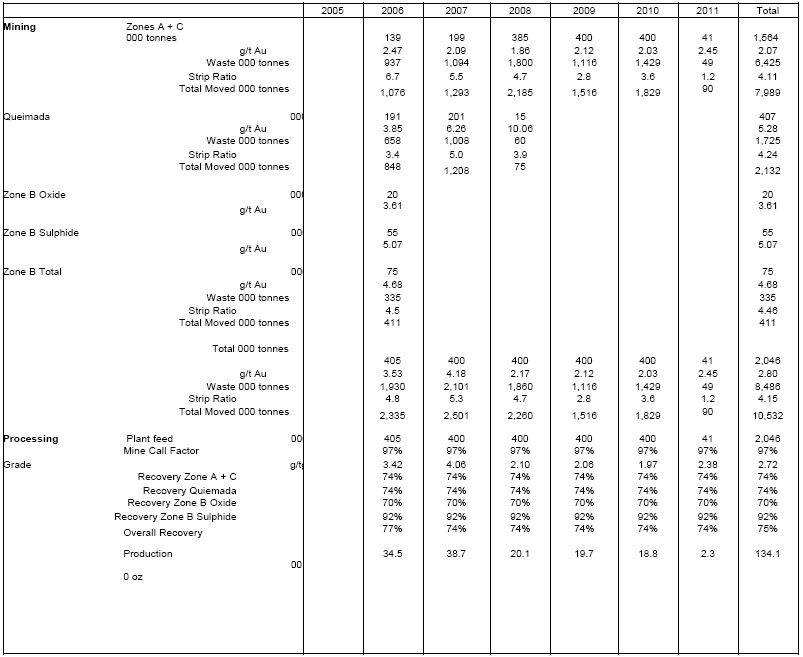
55
TABLE
1-1 PRE-TAX CASH FLOW
JAGUAR
MINING INC. - SABARÁ PROJECT
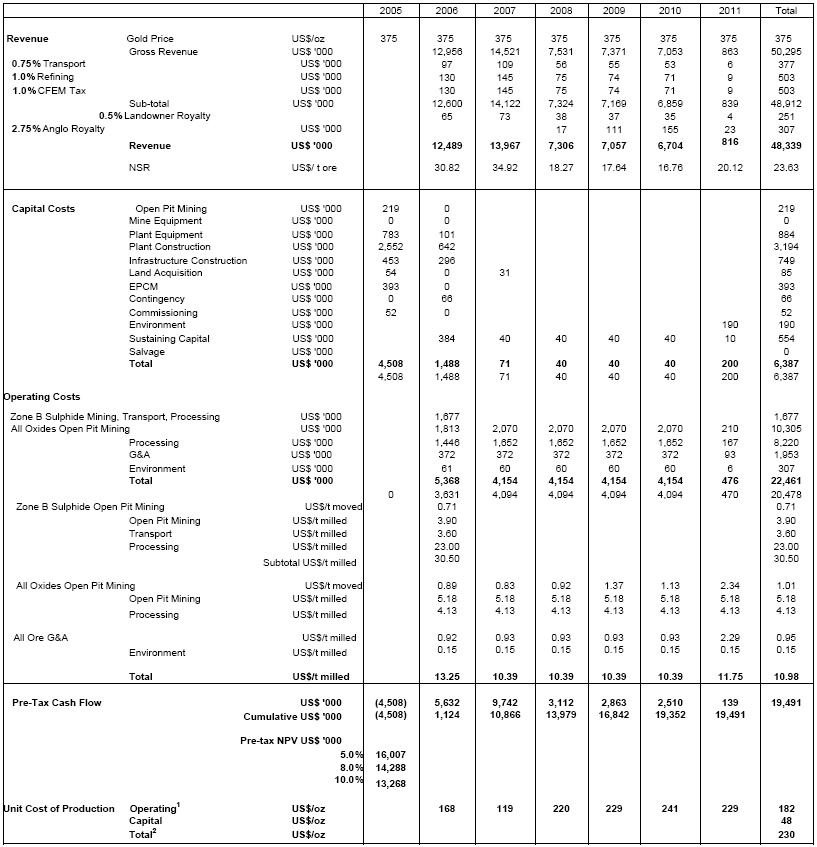
Notes:
1. Equivalent to Gold Institute Total Cash Cost.
2.
Equivalent to Gold Institute Total Production Cost.
56
The
Sabará Project is most sensitive to head grade and recovery. At a
then-current gold price of US$550 per ounce, the pre-tax NPV at 8 percent
discount rate was US$32 million. The break even gold price resulting in zero
pre- tax NPV at 8 percent was approximately US$235 per ounce.
The
exchange rate used in the Scott Wilson RPA Sabará Technical Report for the
Project was US$1.00 = 2.60 reais, vs. the rate in effect at noon on March 29,
2007 of 2.05 reais.
Conclusions
and Recommendations
The
feasibility work completed by Jaguar to date has demonstrated that the Sabará
Project is robust at current gold prices and shows an acceptable operating
margin at the Base Case gold price of US$375 per ounce. Project construction is
complete and production commenced in January 2006. The project is located in an
area of current mining by Jaguar and could be considered as an extension of the
prior Zone B operation. In this context, some infrastructure and
operating practices already exist, thereby minimizing some of the startup risks
of a greenfields project.
Scott
Wilson RPA made the following comments as observations on the Project
development plan:
|
|
•
|
Mineral
Resources and Mineral Reserves have been estimated according to the
requirements of CIM Definitions and, in Scott Wilson RPA’s opinion, are
compliant with NI 43-101 and appropriate for use in the Life of Mine
Plan.
|
|
|
•
|
Metallurgical
recoveries have been based on testwork, with the exception of the Queimada
Zone, for which recoveries were assumed based on similarity of the deposit
to Zones A&C. In Scott Wilson RPA’s opinion, this is a
reasonable assumption based on the proximity of the deposits and nature of
the mineralization, however, as Queimada represents 37% of the forecast
production, there is some higher risk associated with this
zone.
|
|
|
•
|
Prior
production experience from Zone B showed heap leach recoveries to be lower
than expected due to difficulty in establishing the oxide/sulphide
transition. Some risk remains in this area, however, Jaguar mitigated this
by processing the Zone B sulphide ore at the Queiróz
Plant. Mining at Zone B concluded in the fourth quarter of
2005.
|
|
|
•
|
Operating
and capital costs have been estimated from first principles, using
Jaguar’s extensive experience in the area, particularly with
contractors. The Project capital cost risk is minimal in that
the plant and pads are essentially complete. All mining is to
be done by contractors.
|
|
|
•
|
Permits
are in place for the Project, with the exception of Zone C, for which
permitting is being completed. This is in progress, and Scott Wilson RPA
does not consider the permitting to be a significant
risk.
|
Based
on the review, Scott Wilson RPA made the following recommendations:
|
|
1.
|
Monitor
the oxide/sulphide boundary closely in Zone B to ensure that the two types
of mineralization are sent to the correct
plants.
|
|
|
2.
|
Mine
and leach ore from Queimada as soon as possible in the mine life to
establish that leaching characteristics are in line with those forecast in
the Life of Mine Plan.
|
|
|
3.
|
Carry
out quarterly or semi-annual reconciliations between the resource model
for each zone and grade delivered to the heaps or the
plant.
|
|
|
4.
|
Continue
to expedite and monitor the permitting process for Zone
C.
|
|
|
5.
|
Consideration
should be given to widening the berms in the pit designs from 2.5 meters,
which is relatively narrow, to 7.5 meters by triple
benching.
|
57
Technical
Information
The
Sabará Project is located approximately 40 kilometers east of Belo Horizonte,
Minas Gerais, Brazil, and is accessed from Belo Horizonte by paved highway to
the town of Sabará, then by eight kilometers of dirt roads. Scott
Wilson RPA visited the Sabará Project site in April and June 2005 and January
2006. The Property comprises Zone B, which was in operation from October 2003
until the fourth quarter of 2005, as well as Zones A, C (Lamego), and
Queimada. The history and geology of the project area is described
above in “TechnoMine
Quadrilátero Technical Report”.
Mineral
Resources and Mineral Reserves
Mineral
resources and mineral reserves have been estimated by Jaguar and reviewed by
Scott Wilson RPA. They are presented in the following two
tables.
|
TABLE
1-2 MINERAL RESOURCES - DECEMBER 31, 2005
(no
longer current)
|
|||
|
Jaguar
Mining Inc. - Sabará Project
|
|
Measured
Resources
|
|||
|
Zone
|
Tonnes
|
Grade (g/t)
|
Cont.
Ounces
|
|
Zone
A
|
282,000
|
2.29
|
21,000
|
|
Zone
B
|
71,000
|
5.23
|
12,000
|
|
Zone
C
|
438,000
|
2.31
|
33,000
|
|
Queimada
|
133,000
|
6.68
|
28,000
|
|
Subtotal
|
924,000
|
3.15
|
94,000
|
|
Indicated
Resources
|
|||
|
Zone
|
Tonnes
|
Grade (g/t)
|
Cont.
Ounces
|
|
Zone
A
|
810,000
|
2.05
|
53,000
|
|
Zone
C
|
461,000
|
2.07
|
31,000
|
|
Queimada
|
298,000
|
5.27
|
51,000
|
|
Subtotal
|
1,569,000
|
2.67
|
135,000
|
|
Measured +
Indicated
|
|||
|
Zone
|
Tonnes
|
Grade (g/t)
|
Cont.
Ounces
|
|
Zone
A
|
1,092,000
|
2.11
|
74,000
|
|
Zone
B
|
71,000
|
5.23
|
12,000
|
|
Zone
C
|
899,000
|
2.19
|
64,000
|
|
Queimada
|
431,000
|
5.71
|
79,000
|
|
Subtotal
|
2,493,000
|
2.85
|
229,000
|
|
Inferred
Resources
|
|||
|
Zone
|
Tonnes
|
Grade (g/t)
|
Cont.
Ounces
|
|
Zone
A
|
397,000
|
2.26
|
29,000
|
|
Zone
C
|
42,000
|
2.06
|
3,000
|
|
Queimada
|
4,000
|
2.37
|
<1,000
|
|
Total
|
443,000
|
2.24
|
32,000
|
Notes:
|
|
1.
|
CIM
definitions were followed for Mineral
Resources.
|
|
|
2.
|
Mineral
Resources are estimated at a cutoff grades of 0.80 grams per tonne Au
(2.50 grams per tonne Au in Zone B)
|
|
|
3.
|
Mineral
Resources are estimated using an average long-term gold price of US$375
per ounce.
|
58
|
|
4.
|
A
minimum mining width of 2.0 meters was
used.
|
|
|
5.
|
Measured
and Indicated Mineral Resources are inclusive of Mineral
Reserves.
|
TABLE
1-3 MINERAL RESERVES - DECEMBER 31, 2005 (no longer current)
Jaguar
Mining Inc. - Sabará Project
|
Proven Reserves
Zone
|
|||
|
Tonnes
|
Grade(Kt)
|
Cont. Gold
(oz)
|
|
|
A + C Pit
|
651
|
2.20
|
46,000
|
|
Queimada
Pit
|
136
|
6.18
|
27,000
|
|
B Pit
|
75
|
4.68
|
11,000
|
|
Total
Proven
|
862
|
3.04
|
84,000
|
|
Probable Reserves
Zone
|
|||
|
Tonnes
|
Grade (Kt)
|
Cont. Gold
(oz)
|
|
|
A + C Pit
|
913
|
1.98
|
58,000
|
|
Queimada
Pit
|
271
|
4.86
|
42,000
|
|
B Pit
|
|||
|
Total
Probable
|
1,184
|
2.63
|
100,000
|
|
Proven + Probable Reserves
Zone
|
|||
|
Tonnes
|
Grade (Kt)
|
Cont. Gold
(oz)
|
|
|
A + C Pit
|
1,564
|
2.07
|
104,000
|
|
Queimada
Pit
|
407
|
5.28
|
69,000
|
|
B Pit
|
75
|
4.68
|
11,000
|
|
Total
|
2,046
|
2.80
|
184,000
|
Notes:
|
|
1.
|
CIM
definitions were followed for Mineral
Reserves.
|
|
|
2.
|
Mineral
Reserves are estimated at a cutoff grades of 0.80 grams per tonne Au (2.50
grams per tonne Au in Zone B
Sulphides)
|
|
|
3.
|
Mineral
Reserves are estimated using an average long-term gold price of US$375 per
ounce.
|
Mining
Mining
operations are carried out in three locations - Zones A & C Pit, Queimada
Pit, and, formerly, Zone B Pit. Zone B was operated as an open pit
mine by Jaguar commencing in 2003. The ore is hauled by truck to the
Caeté Plant for processing. The Zone B operation was shut down in
mid-2005 due to poor economics related to lower than expected recoveries,
associated with the oxide/sulphide transition ore.
Ore
is hauled to the Sabará plant approximately one kilometer from Zones A & C
and approximately two kilometers from Zone B. Waste is hauled to
local dumps, on average, approximately 500 meters from the respective
pits.
Mineral
reserves were derived from the resources for Zone A&C and Queimada by adding
dilution and preparing optimized pit designs. Zone B mineral reserves
were determined by depletion of the original resource and reconciliation to
production.
The
dilution factor for Zone A & C and Queimada is based on experience at Zone
B. The extractions for Zone A & C and Queimada are based on the
actual pit design. The dilution and extraction for Zone B are based
on mining experience with the deposit.
59
TABLE
1-4 MINERAL RESERVE SUMMARY - DECEMBER 31, 2005 (no longer current)
Jaguar
Mining Inc. - Sabará Project
|
Resource
|
Reserve
|
Dilution
|
Extraction
|
|||
|
‘000
tonnes
|
g/t
Au
|
‘000
tonnes
|
g/t
Au
|
|||
|
Zone
A&C
|
1,991
|
2.15
|
1,564
|
2.07
|
10%
|
|
|
Queimada
|
431
|
5.71
|
407
|
5.28
|
10%
|
|
|
Zone
B Oxides
|
19
|
4.04
|
20
|
3.61
|
12%
|
95%
|
|
Zone
B Sulfides
|
52
|
5.67
|
55
|
5.07
|
12%
|
95%
|
|
Total
|
2,493
|
2.85
|
2,046
|
2.80
|
||
The
waste stripping for the three zones is based on the design waste stripping and
diluted ore tonnes. The overall stripping ratios are:
|
•
|
Zone
A&C
|
6.42
million tonnes, SR = 4.1 to 1
|
|
•
|
Queimada
|
1.73
million tonnes, SR = 4.2 to 1
|
|
•
|
Zone
B
|
0.34
million tonnes, SR = 4.5 to 1
|
|
•
|
Overall
|
8.5
million tonnes, SR = 4.2 to 1
|
In
the cash flows, a Mine Call Factor of 97 percent has been applied based on local
area experience, in particular that of AngloGold Ashanti.
Metallurgy
and Processing
The
process design for Zones A, C, and Queimada is based largely on testwork carried
out by the Central Technological Foundation of Minas Gerais
(CETEC). No metallurgical testwork was done on the Queimada
mineralization since Jaguar considers that the Queimada mineralization has the
same physical properties and mineralogical composition as Zones A and
C. In Scott Wilson RPA’s opinion, the metallurgical recovery of the
Queimada mineralization should be monitored during the early stages of the
operation to ensure this assumption is valid.
The
mineral processing, with the exception of the Zone B transitional
mineralization, will comprise agglomeration, on-off heap leaching, CIC (carbon
in column adsorption), and DR (Desorption-Recovery) stages. In Zones
A, C, and Queimada, leaching and ADR recoveries of 77 percent and 96.4 percent,
respectively, are estimated for an overall metallurgical recovery of 74.2
percent.
The
leaching system is based on an on-off cycle. Heaps will be cured and
leached for a nominal 46 days followed by 20 days of washing, neutralization,
and removal. Spent heaps will be moved to an area near the
plant. The spent heaps will be compacted by the haulage trucks, and
drainage ditches around the spent heap area will be constructed to divert
rainwater. Jaguar already uses this system successfully at its nearby
Caeté Plant.
Infrastructure
Power
and water are available locally. Access roads have been constructed to the plant
and mine sites.
60
Manpower
Manpower
for the Sabará Project operating period totaled 95 as of the date of the Scott
Wilson RPA Sabará Technical Report and skilled workers are available in the
local area. The mining is carried out by a contractor.
Environment
and Permitting
Implementation
of a mining project in Brazil entails application for a Previous License (LP)
and is subject to scrutiny by various agencies, including:
• State
Environmental Policy Council (COPM)
• State
Environmental Foundation (FEAM)
• State
Forest Institute (IEF)
• State
Water Management Institute (IGAM)
The
application for a LP must be supported by the following studies/reports that
describe the impact on the physical, biological, and anthropological ecosystems,
as well as plans for mitigation and closure:
• Environmental
Impact Study/Report (EIA) (EIS) (RIMA)
• Environmental
Control Plan (PCA)
• Degraded
Areas Recovery Plan (PRAD)
• Environmental
Control Report (RCA)
The
RCA is required only for special cases where the area has already been impacted
by a previous operation.
Upon
approval of the foregoing studies, the applicant was granted an Implementation
License (LI) that permits the completion of work, such as the preparation of the
heap leaching area, the erection of the mineral processing plant, construction
of the tailings dam, opening of accesses, development of the open pit mines,
installation of the infrastructure, and preparation of the waste
dump.
After
obtaining the LI and mining concession and implementation of the mining project,
Jaguar applied for, and in December 2006 received, the Operation License (LO)
that permits the startup of operations.
The
environmental permitting process for the Sabará plant was facilitated by the
fact that MSOL had previously been awarded permits to operate a processing
facility in the area. Previously submitted environmental reports were considered
admissible, including the plant LP and associated Environmental Impact Study
(EIA-RIMA). Additional reports included an Environmental Control Report (RCA), a
Degraded Areas Recovery Plan (PRAD), and an Environmental Control Plan (PCA),
all authored by the Consultoria e Empreendimentos de Recursos Naturais Ltda.,
except for the Mine RCA that was prepared by Sênior Engenharia.
Jaguar’s
RCA/PCA includes an assessment of possible environmental impacts caused by the
construction and operations phases of the heap leaching
facility. Mitigation measures were outlined for issues such as noise
and dust control, discharge water quality, slope stability, and reagent storage.
The report also includes a closure plan with a strategy to address removal and
stockpiling the fertile soil layer, neutralization of spent heap leach material,
rehabilitation of the mined areas, topographic restoration, revegetation of
impacted areas, and drainage rehabilitation.
The
LI for plant construction was awarded in September 2005.
The
application for an LP for the mining operation required only an RCA. The open
pit is designated as a lower environmental hazard and does not require a full
Environmental Study. The LP for Zone A, Queimada, and part of Zone C
was awarded in November 2005.
61
In
addition to State approvals, exploration and mining applications must also be
made to the DNPM, an agency of the federal government responsible for control
and application of the Brazilian Mining Code, and awarding of exploration
licenses and mining concessions. The applications must include the
exploration/exploitation plans prepared by an authorized professional such as a
geologist or mining engineer. The granting of a mining concession
remains valid until full depletion of the mineral deposit, subject to submitting
Annual Operations Reports, and compliance with safety and environmental
regulations. Jaguar currently holds mining rights to five concessions
for a total of 2,231 ha, issued by DNPM, as described in Section 4 of the Scott
Wilson RPA Sabará Technical Report.
Capital
Costs
Total
pre-production capital costs have been estimated by MSOL and TechnoMine and are
summarized in the following table. The costs include a contingency of
1.2 percent.
CAPITAL
COSTS
Jaguar
Mining Inc. - Sabará Project
|
US$
‘000’s
|
|
|
Open
Pit Mining
|
219
|
|
Mine
Equipment
|
Contractor
|
|
Plant
Equipment
|
884
|
|
Plant
Construction
|
3,194
|
|
Infrastructure
Construction
|
749
|
|
Land
Acquisition
|
54
|
|
EPCM
|
393
|
|
Commissioning
|
52
|
|
Contingency
|
66
|
|
Total
|
$5,611
|
Most
of the capital expenditures for the Sabará Project were completed in 2005 in
advance of startup in the first quarter of 2006. Mining and plant
startup commenced in January 2006.
Operating
Costs
Operating
costs have been estimated from first principles and are shown in the following
table.
OPERATING
COSTS
Jaguar
Mining Inc. - Sabará Project
|
US$/tonne
milled
|
|
|
Zone
B Sulphides
(mining,
transport, and processing)
|
30.50
|
|
Oxide
Mining
|
5.18
|
|
Oxide
Processing
|
4.13
|
|
G&A
|
0.92
|
|
Environment
|
0.15
|
|
Total
typical year - oxides only
|
US$10.38
|
All
costs are based on contractor prices - US$0.70 per tonne moved for mining,
US$0.41 per tonne kilometer for hauling, and US$23.00 per tonne milled for
processing.
62
Oxide
ores from Zones A and C and Queimada will be mined and processed on
site. Costs are shown in the table above.
Current
Status
In
December 2005, Jaguar began crushing ore from Zone A at the new gold oxide heap
leach facility and recovery plant at Sabará. Sabará produced 24,322
ounces of gold in 2006, 24,586 ounces of gold in 2007 and 18,199 ounces of gold
in 2008.
TechnoMine Caeté Technical Report
Introduction
The
TechnoMine Caeté Tehcnical Report includes Jaguar’s Pilar and Roça Grande
Targets. Pilar is described in the TechnoMine Quadrilátero Technical
Report and updated in the TechnoMine Caeté Technical Report herein
described. Roça Grande consists of four targets referred to as
RG-01/07, RG-02, RG-03, and RG-06, which are also described in the TechnoMine
Caeté Technical Report. The TechnoMine Caeté Technical Report was
preceded by a scoping study completed by TechnoMine on May 31, 2007 and a
statement of resources technical report dated November 23, 2007 also prepared by
TechnoMine.
After
the completion of the statement of resources report in 2007, Jaguar retained
TechnoMine to prepare an NI 43-101 compliant feasibility study on the resources
contained in Jaguar’s Caeté Expansion Gold Project (“Caeté
Project”). TechnoMine issued its report on September 15,
2008. The following description of this project is derived from
the summary contained in the TechnoMine Caeté Technical Report.
The
Caeté Project is controlled by MSOL, Jaguar’s fully-owned
subsidiary.
The
Caeté Project is expected to take advantage of the infrastructure of Jaguar’s
recently closed Caeté heap leach carbon-in-carbon (“CIC”) facility located 51
kilometers from Belo Horizonte in the state of Minas Gerais,
Brazil. Jaguar expects to minimize environmental impacts and expedite
permitting by utilizing the existing Caeté plant site.
Based
on the results of the TechnoMine Caeté Technical Report, Jaguar intends to
construct a centralized leaching carbon-in-pulp (“CIP”) -
adsorption/desorption/recovery (“ADR”) metallurgical plant. This new
plant will process the sulfide ore from the Pilar Target as well as sulfide,
transition, and oxide ore from the Roça Grande Target. Although other
nearby targets are expected to feed the new plant, only resources and reserves
from the Roça Grande and Pilar Targets were taken into account in the TechnoMine
Caeté Technical Report. Based on extensive metallurgical testwork a
CIP - ADR plant was chosen as the core hydrometallurgical process
route.
The
Caeté Project’s plant site will possess two water supply and distribution
systems: a potable water system and an industrial water system. The
potable water system will supply water to all ancillary and industrial buildings
(where required) from a concrete-lined circular well. The industrial
water system includes the future Roça Grande underground mine
dewatering system supplemented by water from a station located inside the
Marembá Tunnel, about 1 kilometer from the mine’s portal. Potable
water for the Pilar Target will also be provided by a concrete-lined circular
well, while industrial water will be provided by the a new dewatering system
supplemented by water from an intake station to be built at the Conceição
River.
Electrical
power will be supplied by CEMIG, the state-owned utility company with operations
in the state of Minas Gerais. CEMIG is preparing its system to
support the long-term operation of the Caeté Plant and the Roça Grande
underground mine and open pits, which, altogether, will account for the highest
power demand share of the Project. The demand of the open pit mines
is anticipated to be less than 250 kW. Based on its experience, MSOL
management will use contractors for open pit mining and ore
transportation. The cost of power is included in the service
agreement. MSOL has already agreed with CEMIG over the supply to its
contractors.
The
Pilar Mine will be supplied by a new and dedicated transmission line that is
under construction by CEMIG. Pilar mining development is being
supported by diesel generators that will be used in the future as emergency
supply in case of power failure.
63
To
complete the TechnoMime Caeté Technical Report, TechnoMine defined and
coordinated supporting studies conducted by MSOL’s technical staff and local
consultants, in addition to testwork carried out by laboratories and research
centers located in Brazil, Canada, Germany, and the U.S. In addition,
TechnoMine was in charge of the Caeté Project’s plant design and cost, with the
assistance of MSOL’s Chief Metallurgist Dacildo Rodrigues de Souza,
M.Sc.
Since
TechnoMine issued the statement of resources technical report in 2007, the
following additional work was completed and formed the basis for the TechnoMine
Caeté Technical Report:
|
|
•
|
Definition
drilling consisting of 14 surface holes (8,409 meters), and two
underground holes (59 meters) at the Pilar Target and 49 surface holes
(11,954 meters) at the Roça Grande
Target,
|
|
|
•
|
Underground
development (779 meters at the Pilar Target and 1,728 meters at the Roça
Grande Target),
|
|
|
•
|
Metallurgical
testwork,
|
|
|
•
|
Mine
plan, infrastructure, environmental
studies,
|
|
|
•
|
Plant
design,
|
|
|
•
|
Licensing,
and
|
|
|
•
|
Economic
analysis.
|
Jaguar
plans to continue underground development at both the Pilar and Roça Grande
Targets, as well as carrying out test mining, additional underground and surface
definition drilling, detailed engineering, and permitting.
Geology
The
Pilar and Roça Grande Targets lie within an elongated NE-SW Archean to the Upper
Proterozoic metamorphic belt, defined as the eastern part of the Iron Quadrangle
Province. This well-known prolific mining region contains numerous
gold and iron deposits and several productive and historical gold mines, which
were active during the Brazil Gold Cycle (17th and
18th
centuries), such as Juca Vieira, Gongo Soco, Luis Soares, São Bento (Eldorado
Group), Cuiabá (AngloGold Ashanti - still in operation), and many
others.
The
dominant host for the gold mineralization in the Caeté Project region was a
thick sequence of rocks composed of mafic-felsic volcanic flows, tuffs,
volcanoclastics, and banded iron formations and cherts, tightly folded and
intensely sheared, named the Rio das Velhas Super Group.
At
the Pilar and Roça Grande Targets, the mineralized bodies occur within banded
iron formation (“BIF”) and shear zones, represented by disseminated gold-bearing
sulfides associated to silic-sericitic-carbonatic solutions originating from
hydrothermal activity.
The
Pilar Target is located at the basal unit of the Nova Lima Group, which is
composed of mafic and ultramafic rocks, like talc-schist, meta-basalts,
meta-andesite with layers of the meta-sediments represented by oxide BIF,
metachert, carbonaceous schists, metatuffs, metavolcanoclastics, and
hydrothermal products of theses rocks.
The
Roça Grande mineralized body occur within the BIF and metachert layers in
disseminated gold-bearing sulfides associated with silic-sericitic-carbonatic
solutions originating from hydrothermal activity.
Due
to hydrothermal alteration, iron oxide and iron carbonates were replaced by iron
sulfides. Also, more gold was introduced.
The
main ore zones are hosted in carbonate/sulfide BIF (Algoma type) and
subordinately in quartz veins in sericite-chlorite schist related with
hydrothermal alteration in shear zones.
Gold
is associated with sulfides (arsenopyrite, pyrite and pyrrhotite) or “free” in
the quartz veins or in the contact quartz/sericite schist.
64
Mineral
Resource Estimates
Mineral
resource estimates were prepared by MCB - Geologia e Mineração Ltda.’s (“MCB”)
Principal and Chief Resource Geologist, Rogério Moreno, under the supervision of
Jaguar’s Chief Geologist, Jaime Duchini, and the author of TechnoMine Caeté
Technical Report. Methodology and criteria for the resource
estimation are presented in Appendix 01-A - MCB Mineral Resource Estimate Report
(Pilar Target) and Appendix 01-B - MCB Mineral Resource Estimate Report (Roça
Grande) of the TechnoMine Caeté Technical Report. The estimated
mineral resources, inclusive of mineral reserves, are shown in the tables
below. The cutoff grade (grams per tonne) and capping (grams per
tonne) adopted for the 3D modeling are presented below.
|
Target
|
Cutoff
(grams per tonne)
|
Cap
(grams per tonne)
|
|
Pilar
|
2.50
|
50.00
|
|
RG-01
|
3.00
|
16.00
|
|
RG-07
|
3.00
|
14.00
|
|
RG-02,
03 and 06
|
0.80
(for open pit) and
3.00
(for underground)
|
30.00
|
Pilar
Target - Resource Estimate (sulfide mineralization)
|
Category
|
Tonnage
(t)
|
Grade
(g
Au/t)
|
Contained
Gold
(oz
Au)
|
|
Measured
|
1,355,400
|
5.71
|
248,850
|
|
Indicated
|
1,249,200
|
5.73
|
230,200
|
|
Measured
and Indicated
|
2,604,600
|
5.72
|
479,050
|
|
Inferred
|
1,620,600
|
6.59
|
343,400
|
Roça
Grande Target - Resource Estimate (sulfide, transition, and oxide
mineralization)
|
Category
|
Tonnage
(t)
|
Grade
(g
Au/t)
|
Contained
Gold
(oz
Au)
|
|
Measured
(M)
|
3,340,200
|
3.30
|
354,400
|
|
Indicated
(I)
|
3,396,600
|
4.59
|
501,240
|
|
Measured
and Indicated
|
6,736,800
|
3.95
|
855,640
|
|
Inferred
|
1,377,260
|
4.43
|
196,180
|
Pilar
and Roça Grande Targets - Resource Estimate
|
Category
|
Tonnage
(t)
|
Grade
(g
Au/t)
|
Contained
Gold
(oz
Au)
|
|
Measured
(M)
|
4,695,600
|
4.00
|
602,690
|
|
Indicated
(I)
|
4,645,800
|
4.90
|
732,000
|
|
Measured
and Indicated
|
9,341,400
|
4.44
|
1,334,690
|
|
Inferred
|
2,997,860
|
5.60
|
539,580
|
Mineral
Reserves Estimates
Mineral
reserve estimates were prepared by Minere Engenharia Ltda (“Minere”) Principal
and Chief Mining Engineer, Reinaldo Nogueira Magalhães, under the supervision of
the author of the TechnoMine Caeté Technical Report. The mineral
reserve estimates are presented in the table below. The adopted
criteria and methodology for the mineral reserve estimates are presented in
detail in Section 21.1 of the TechnoMine Caeté Technical Report, which addresses
the Roça Grande underground mine, the Roça Grande five (5) open pit mines and
the Pilar underground mine.
65
Caeté
Project - Proven and Probable Reserves
|
PROVEN
RESERVES
|
|||
|
Tonnage
(t)
|
Grade
(g/t)
|
Gold
(oz)
|
|
|
Pilar
|
1,125,650
|
5.13
|
185,800
|
|
Roça
Grande (Open Pit)
|
1,065,370
|
2.80
|
96,000
|
|
Roça
Grande (Underground)
|
741,800
|
4.21
|
100,300
|
|
Roça
Grande (Total)
|
1,807,170
|
3.38
|
196,300
|
|
SUBTOTAL
|
2,932,820
|
4.05
|
382,100
|
|
PROBABLE
RESERVES
|
|||
|
Tonnage
(t)
|
Grade
(g/t)
|
Gold
(oz)
|
|
|
Pilar
|
1,258,690
|
5.02
|
203,360
|
|
Roça
Grande (Open Pit)
|
167,610
|
3.02
|
16,300
|
|
Roça
Grande (Underground)
|
1,747,040
|
5.26
|
295,400
|
|
Roça
Grande (Total)
|
1,914,650
|
5.06
|
311,700
|
|
SUBTOTAL
|
3,173,340
|
5.04
|
515,100
|
|
PROVEN
AND PROBABLE RESERVES
|
|||
|
Tonnage
(t)
|
Grade
(g/t)
|
Gold
(oz)
|
|
|
Pilar
|
2,384,340
|
5.08
|
389,200
|
|
Roça
Grande (Open Pit)
|
1,232,980
|
2.83
|
112,300
|
|
Roça
Grande (Underground)
|
2,488,840
|
4.95
|
395,700
|
|
Roça
Grande (Total)
|
3,721,820
|
4.24
|
508,000
|
|
TOTAL
|
6,106,160
|
4.57
|
897,200
|
Project
Summary Data as of the date of the TechnoMine Caeté Technical
Report
|
|
•
|
Project
Life: 14 semesters, starting in the second semester of
2009.
|
|
|
•
|
Pre-production
period: 6 (six) months. Year 2009 can be considered a
pre-production period. It is anticipated that only 260,000 t
will be produced in that year.
|
|
|
•
|
Measured
and Indicated Resources:
|
|
Roça
Grande Target:
|
6,736,800
tonnes at 3.95 grams per tonne (average) = 844,640 ounces
Au
|
|
Pilar
Target:
|
2,604,600
tonnes at 5.72 grams per tonne (average) = 479,050 ounces
Au
|
|
Total:
|
9,341,400
tonnes at 4.44 grams per tonne (average) = 1,334,690 ounces
Au
|
|
|
•
|
Mining
Method: Cut and Fill (for both Pilar and Roça Grande
Targets)
|
|
|
•
|
Cruise
Production Rates (ROM): about 1,100,000 tpy as from
2013. In 2011, the Project is expected to produce 700,000
t.
|
|
|
•
|
Mining
Average Dilution
|
|
Roça
Grande Open Pits:
|
10%
|
|
Roça
Grande (underground):
|
12%
|
|
Pilar
(underground):
|
12%
|
66
|
|
•
|
Mining
Average Recovery
|
|
Roça
Grande Target (open pits):
|
33.4%
|
|
Roça
Grande Target (underground):
|
65.8%
|
|
Pilar
Target (underground):
|
81.7%
|
|
|
•
|
Proven
and Probable Reserves
|
|
Roça
Grande Target (open pits):
|
1,232,980
t at 2.83 grams per tonne (average) = 112,300 ounces
Au
|
|
Roça
Grande Target (underground):
|
2,488,840
t at 4.95 grams per tonne (average) = 395,700 ounces Au
|
|
Roça
Grande Target Total:
|
3,721,820
t at 4.24 grams per tonne (average) = 508,000 ounces Au
|
|
Pilar
Target (underground):
|
2,384,340
t at 5.08 grams per tonne (average) = 389,200 ounces Au
|
|
Caeté
Project Total:
|
6,106,160
t at 4.57 grams per tonne (average) = 897,200 ounces
Au
|
|
|
•
|
Mine
Call Factor:
|
97%
|
|
|
•
|
Mill
Feed Grades
|
|
Roça
Grande Target (open pits):
|
2.75
grams per tonne
|
|
Roça
Grande Target (underground):
|
4.80
grams per tonne
|
|
Roça
Grande Target Total :
|
4.11
grams per tonne
|
|
Pilar
Target (underground):
|
4.93
grams per tonne
|
|
Caeté
Project Average:
|
4.43
grams per tonne
|
|
|
•
|
Mill
Feed Contained Gold
|
|
Roça
Grande Target (open pits):
|
108,930
ounces Au
|
|
Roça
Grande Target (underground):
|
383,830
ounces Au
|
|
Roça
Grande Target Total :
|
492,760
ounces Au
|
|
Pilar
Target (underground):
|
377,520
ounces Au
|
|
Caeté
Project Total:
|
870,280
ounces Au
|
|
|
•
|
Process
Route: crushing/screening - grinding - gravity concentration -
leaching - CIP - ADR (including elution, electrowinning, and
smelting)
|
|
|
•
|
Overall
Metallurgical Recovery:
|
92.6%
|
|
|
•
|
Total
“Salable” Gold :
|
805,880
ounces Au
|
|
Roça
Grande Target (open pits):
|
100,870
ounces Au
|
|
Roça
Grande Target (underground):
|
355,430
ounces Au
|
|
Roça
Grande Target Total :
|
456,300
ounces Au
|
|
Pilar
Target (underground):
|
349,580
ounces Au
|
|
Caeté
Project Total :
|
805,880
ounces Au
|
|
|
•
|
Product:
|
Gold
(bullion)
|
Permitting
Pilar
Target
DNPM
830.463/83: The Pilar target area was owned by Vale 1983 through
2004. The Pilar mining rights were acquired by MSOL in
2004. MSOL’s mining concession (ultimate mining right) was officially
published in the Official Brazilian Government Gazette (“Diário Oficial da União
- - DOU”) on August 17, 2005.
67
Roça
Grande Target
DNPM
816.314/73: From 1973 to present, owned by Vale. Final Exploration
Report approved on 05/25/94. Request for Mining Concession filed on
05/25/95;
DNPM
816.313/73: From 1973 to present, owned by Vale. The Mining
Concession is in good standing. The Mining Concession was awarded on
01/29/97;
DNPM
807.959/76: From 1973 to present, owned by Vale from 1973 to
present. The Mining Concession is in good standing. The
Mining Concession was awarded on 03/28/96.
The
three (3) above mentioned mineral rights are included in a “Mineral Rights
Cession and Transfer Agreement,” entered into and between Vale and MSOL on
11/28/05.
Environmental
Permits
The
environmental authorities waived the Previous License (“LP”) for the new
metallurgical plant, since the plant will be built in the same location and
utilize much of the infrastructure of the existing Caeté Plant. The
application for the new plant’s Implementation License (“LI”) was submitted on
April 17, 2007. A comprehensive Environmental Control Report ("RCA")
and Environmental Control Plan ("PCA") were prepared by Virtual Engenharia
Ambiental ("Virtual") - a local consulting company - and were filed along with
the application for the new plant’s LI, as required by law. Both the
PCA and the RCA were reviewed by TechnoMine at that time.
The
Plant LI was awarded to MSOL on August 8, 2007.
Two
(2) Class-3 Operation Licenses (“LO”) - corresponding to Mining Concessions DNPM
816.313/73 and DNPM 807.959/76 - were awarded to MSOL in April 2008, in
connection with the Roça Grande underground mine operations. Each LO
allows the mining of a maximum of 500,000 tpy.
For
two (2) out of five (5) planned Roça Grande open pit mines (RG 02 - 06 and RG 03
- - 06), two (2) Provisional Environmental Authorizations for
Operations ("AAF") were applied for in October 2008 and granted in
November 2008. Each open pit AAF allows the mining of a maximum of
50,000 tpy.
The
LI for the Pilar underground mine was awarded to MSOL on August 25,
2008. The LO is expected to be granted by May 2009. One
(1) AAF had been previously granted to MSOL in March 2007, allowing the mining
of a maximum of 100,000 tpy (underground mine). It has been used to
mine out waste during the development phase.
The
LP for the tailings disposal system was granted on November 29,
2007. The tailings system entails two (2) tailings dams: Moita and
RG-03 - RG-06. The Moita tailings dam will be the first one to be
utilized. Detailed engineering for the Moita tailings dam is complete
and conceptual engineering for the RG-03 - RG-06 tailings dam is
underway. The LI for the Moita tailings dam was applied for in June
2008. The award is expected to be granted by March 2009. The application
for the RG-03 - RG-06 tailings dam LP is expected to be submitted in June 2009
and the application for the LI is expected to be submitted in June
2010. MSOL expects to receive the LI award in December
2010.
Engineering
and Construction Status as of the date of the TechnoMine Caeté Technical
Report
|
|
•
|
Plant
Area Preparation
|
The
plant area preparation (about 30,000 m2) is 100%
complete for the crushing and screening plant, grinding and gravity
concentration plant, and hydrometallurgical plant.
|
|
•
|
Crushing
and Screening Plant
|
Detailed
engineering started in August 2008 and is 15% complete. The major
pieces of equipment are being purchased.
68
|
|
•
|
Milling
and Classification Plant
|
Detailed
engineering started in August 2008 and is 15% complete. Two mills are
going through final stages of refurbishment. A third mill and the
classification lines equipment are being purchased.
|
|
•
|
Gravity
Concentration Plant
|
Detailed
engineering started in August 2008 and is 15% complete. One
XD20 Knelson concentrator was purchased and
refurbished. The remaining pieces of equipment are being purchased:
one KC-XD30 concentrator and one ConSep Acacia CS1000 reactor.
|
|
•
|
Hydrometallurgical
Plant
|
Detailed
engineering started in July 2008 and is 20% complete. The major
pieces of equipment are being purchased.
|
|
•
|
Civil
Works (Industrial Areas)
|
Civil
works will start in October 2008. The anticipated timeframe for
completion is 180 days for the crushing and screening plant and 210 days for the
milling and classification, gravity concentration, and hydrometallurgical
plants. Approximately 4,000 m3 of
concrete will be used.
|
|
•
|
Drainage
(Industrial Areas)
|
Most
ditches are ready (including those existing from the old heap
operation). The complementary construction of the drainage systems
will start in March 2009 and will call for an additional 200 m of ditches that
will require approximately 25 m3 of
concrete.
|
|
•
|
Ancillary
Buildings
|
The
existing ancillary buildings located at the Caeté Plant will be
utilized. These buildings represent about 20% of the total ancillary
buildings.
Detailed
engineering for new buildings started in May 2008 and is 80% complete.
Construction will start in December 2008 and is expected to be completed in
March 2009.
|
|
•
|
Internal
Roads
|
All
required internal roads were already constructed.
Mine
Development
|
|
•
|
Pilar
Underground Mine
|
Primary
and secondary developments have been carried out. Three levels are
expected to be ready for mining at the beginning of the start-up
phase.
|
|
•
|
Roça
Grande Underground Mine
|
Ore
Bodies RG-01 and RG-07 -
Primary and secondary developments have been carried
out. Three levels are expected to be ready for mining at the
beginning of the start-up phase.
Ore
Bodies RG-02 and RG-03 - Primary development has been carried
out. One level is expected to be ready for mining in March
2010.
69
Capital
Costs
The
total non-discounted investment estimate is US$ 134.8 million, as shown
below.
|
Investments
|
Unit: US$
1,000
|
|
CAPEX
- Preoperational Investments (2006 - 2009)
|
(72,180)
|
|
CAPEX
- Operational (S2 2009 to S1 2014)
|
(57,570)
|
|
Post-Operation
Investments
|
|
|
•Operation
Shutdown (S2 2016)
|
(3,220)
|
|
•Environmental
Closure (S2 2016 to S2 2018)
|
(1,120)
|
|
•Work
Capital
|
(0)
|
|
•Work
Capital Recovery
|
0
|
|
•Salvage
|
0
|
|
•Stay
in Business
|
(700)
|
|
Total
Operational and Post-Operational Investment
|
(62,210)
|
Operating
Costs
The
total non-discounted life of mine operating cost for the Caeté Project has been
estimated at US$ 269.6 million.
Economic
Analysis
The
economic results presented in the table below - Base Case Scenario Summary of
Economic Results are based on the
criteria utilized in the discounted cash flow model for the base case scenario
presented below. The after-tax economic indicators from the cash flow
model (Appendix 02 of the TechnoMine Caeté Technical Report) point to an
economically robust project.
ECONOMIC
ANALYSIS CRITERIA
|
•
|
Gold
price:
|
US$
834 per troy ounces of gold
|
||
|
•
|
ROM
Total Tonnage:
|
6,106,160
tonnes
|
||
|
•
|
Mineral
Reserves:
|
16,106,160
tonnes @ 4.57 grams per tonne Au, containing
|
||
|
approximately
897,200 ounces
|
||||
|
•
|
Mine
Call Factor (“MCF”):
|
97%
|
||
|
•
|
Mill
Feed Grade:
|
(4.57)*(97%)
= 4.43 grams per tonne
|
||
|
•
|
ROM Final
“Cruise” Production:
|
1.1
Mtpy starting in 2013
|
||
|
•
|
Metallurgical
Recovery:
|
92.6%
|
||
|
•
|
Total
Gold Production:
|
805,880
ounces Au
|
||
|
•
|
Average
Annual Gold Production:
|
115,130
opy
|
||
|
•
|
Project
Life:
|
14.0
semesters
|
||
|
•
|
CAPEX:
|
US$
134.8 million (straight)
|
||
|
•
|
Exchange
Rates:
|
CAPEX:
US$ 1.00 = R$ 1.69
|
||
|
OPEX:
US$ 1.00 = R$ 1.88
|
||||
|
(average
over the Project life)
|
|
•
|
Depreciation
and amortization have been prorated over the Project
life.
|
The
cumulative operating profit has been estimated at US$ 51.1 million, while the
after-tax cumulative profit estimate is US$ 304.8 million and the cumulative net
cash flow estimate is US$ 171.0 million.
70
Base
Case Scenario: Summary of Economic Results
|
CAETÉ
GOLD PROJECT (1.1 Mtpy)
Economic
Results
|
Economic
Indicators
|
|
IRR
(% per year)
|
24.2
|
|
NPV
@ 0% - [US$]
|
171.0
million
|
|
NPV
@ 5% - [US$]
|
100.4
million
|
|
NPV
@ 8 % - [US$]
|
71.5
million
|
|
NPV
@ 10% - [US$]
|
56.2
million
|
|
NPV
@ 12% - [US$]
|
43.4
million
|
|
Payback
Period (straight)
|
8.09
semesters
|
|
Payback
Period @ 8%
|
8.21
semesters
|
|
Payback
Period @ 10%
|
8.39
semesters
|
|
Payback
Period @ 12%
|
9.09
semesters
|
|
Life
of Mine Production
|
14.0
semesters
|
|
•
|
Average
Cash Cost
|
US$
344 per ounces Au
|
|
|
•
|
Total
Production Cost
|
US$
511 per ounces, including invested
capital
|
The
sensitivity analysis indicated the following variations to the IRR:
|
Gold
Price = US$ 734/ounces Au
|
IRR
= 17.7 % py
|
|
Gold
Price = US$ 984/ounces Au
|
IRR
= 32.6 % py
|
|
Metallurgical
Recovery = 91.6%
|
IRR
= 23.6 % py
|
|
Metallurgical
Recovery = 95.6%
|
IRR
= 25.8 % py
|
|
Investment
+ 10%
|
IRR
= 22.4 % py
|
|
Investment
- 10%
|
IRR
= 26.1 % py
|
|
OPEX
+ 7%
|
IRR
= 22.5 % py
|
|
OPEX
- 7%
|
IRR
= 25.8 % py
|
|
Mill
Feed Grade + 10% (4.87 grams per tonne)
|
IRR
= 29.1 % py
|
|
Mill
Feed Grade - 10% (3.99 grams per tonne)
|
IRR
= 18.9 % py
|
Interpretation
and Conclusions
It
is TechnoMine’s conclusion that the Caeté Project is low-risk and
robust. It has been studied at length from a technical standpoint and
is supported by wide-ranging exploration, metallurgical testwork, and conceptual
and basic engineering, in addition to special front-end engineering tests and
studies. The aforementioned technical work for this Project was
performed by reputable entities in Canada, USA, Germany, and
Brazil.
Most
CAPEX and OPEX estimates are supported by vendor quotes, contracts, and
receipts. Key pieces of equipment have been purchased or are in the
final procurement stage. Cost estimates are based on solidly
supported process routes, mining method, and plans, being within the +/- 15%
accuracy range.
Based
on the aforementioned conclusions and on the strong economic results yielded
from the cash flow model and sensitivity analysis, TechnoMine considers the
Caeté Project to be feasible and attractive. Related technical and
economic risks are small.
Recommendations
TechnoMine
recommends Jaguar to proceed with the Caeté Project’s
implementation.
71
The
Caeté Project is feasible and robust at its current size, although it is
recommended that exploration efforts continue not only at the Project
properties, but also at other targets in the areas where the Roça Grande and
Pilar Targets are located. An increased resource base will give rise,
via a further consolidated feasibility study, to increased reserves, which, in
turn, may significantly augment the project life and improve the financial
performance of an extended project.
The
same or higher technical standards related to the front-end engineering
activities (such as exploration, metallurgical testwork, and conceptual and
basic engineering) and the required special front-end engineering tests and
studies should be maintained for an augmented project.
The
recommended additional exploration and remaining front-end engineering
activities should start as soon as possible in order to support a technically
sound transition to the expanded Caeté Project.
Current
Status
In
September 2008, when the TechnoMine Caeté Technical Report was completed, the
Caeté Project was under detailed engineering and initial
construction. However, in November 2008, due to the retraction in
gold prices, financial markets and worldwide equity values, including the gold
sector, Jaguar temporarily suspended development of the Caeté Project pending an
assessment of market conditions and the availability of capital to move the
project forward.
Consistent
with the decision to suspend the development of the Caeté Project, underground
work at the Roça Grande Target has been temporarily suspended; however,
development at the Pilar Mine continued. Beginning in December 2008,
Jaguar began transporting ore by truck from the Pilar Mine to the Paciência
processing plant to supplement the ore being supplied from Paciência’s Santa
Isabel Mine. Jaguar expects to continue this practice until such time
as the ore from the Pilar Mine would be needed at the future Caeté processing
plant.
72
RISK
FACTORS
Risks
Related to the Industry
Gold prices are volatile and there
can be no assurance that a profitable market for gold will exist.
Gold
prices are generally subject to volatile changes resulting from a variety of
factors including international economic and political trends, expectations of
inflation, global and regional supply and demand and consumption patterns, metal
stock levels maintained by producers and others, the availability and cost of
metal substitutes, currency exchange fluctuations, inflation rates, interest
rates, speculative activities and increased production due to improved mining
and production methods. Since 2008, the price of gold has been
primarily influenced by interest rate cuts, volatility in the credit and
financial markets, strong investment demand and inflation
expectations. As with many other commodities, the price of gold
dropped towards the end of 2008 as a result of uncertainty and extreme
volatility in the markets, as the price fell from a high of US$1011.24 per ounce
on March 17 2008 to a low of US$721.50 per ounce on October 24, 2008. While the
price of gold has recently rebounded from this low point to a high of US$919.50
on January 31, 2009, there can be no assurance that gold prices will remain at
such levels or be such that Jaguar’s properties can be mined at a profit. If the
price of gold declines, it could have a material adverse effect on Jaguar's
share price, business and operations. For example, on November 6, 2008, Jaguar
announced that the development of the Caeté project had been delayed in part due
to the retraction of gold prices and the corresponding decrease in equity values
in the gold sector.
Uncertainty
involved in mining.
Mining
involves various types of risks and hazards, including environmental hazards,
unusual or unexpected geological operating conditions such as rock bursts,
structural cave-ins or slides, flooding, earthquakes and fires, labor
disruptions, industrial accidents, metallurgical and other processing problems,
metal losses and periodic interruptions due to inclement or hazardous weather
conditions. These risks could result in damage to, or destruction of, mineral
properties, production facilities or other properties, personal injury,
environmental damage, delays in mining, increased production costs, monetary
losses and possible legal liability.
Jaguar
may not be able to obtain insurance to cover these risks at economically
feasible premiums. Insurance against certain environmental risks, including
potential liability for pollution or other hazards as a result of the disposal
of waste products occurring from production, is not generally available to
Jaguar or to other companies within the mining industry. Jaguar may suffer a
material adverse effect on its business if it incurs losses related to any
significant events that are not covered by its insurance policies.
Calculation of mineral resources and
metal recovery is only an estimate, and there can be no assurance about the
quantity and grade of minerals until resources are actually mined.
The
calculation of reserves, resources and corresponding grades being mined or
dedicated to future production are imprecise and depend on geological
interpretation and statistical inferences or assumptions drawn from drilling and
sampling analysis, which might prove to be unpredictable. Mineral resources that
are not mineral reserves do not have demonstrated economic viability. Until
reserves or resources are actually mined and processed, the quantity of reserves
or resources and grades must be considered as estimates only. Any material
change in the quantity of reserves, resources, grade or stripping ratio may
affect the economic viability of Jaguar’s properties. In addition, there can be
no assurance that metal recoveries in small-scale laboratory tests will be
duplicated in larger scale tests under on-site conditions or during
production.
Risks
Related to Jaguar's Business
Jaguar’s operations involve
exploration and development and there is no guarantee that any such activity will
result in commercial production of mineral deposits.
The
proposed programs on the exploration properties in which Jaguar holds an
interest are exploratory in nature and do not host known bodies of commercial
ore. Development of these mineral properties is contingent upon obtaining
satisfactory exploration results. Mineral exploration and development involve
substantial expenses and a high degree of risk, which even a combination of
experience, knowledge and careful evaluation may not be able to adequately
mitigate. There is no assurance that commercial quantities of ore will be
discovered on any of Jaguar’s exploration properties. There is also no assurance
that, even if commercial quantities of ore are discovered, a mineral property
will be brought into commercial production, or if brought into production, that
it will be profitable. The discovery of mineral deposits is dependent upon a
number of factors including the technical skill of the exploration personnel
involved. The commercial viability of a mineral deposit is also dependent upon,
among a number of other factors, its size, grade and proximity to
infrastructure, current metal prices, and government regulations, including
regulations relating to royalties, allowable production, importing and exporting
of minerals, and environmental protection. In addition, depending on the type of
mining operation involved, several years can elapse from the initial phase of
drilling until commercial operations are commenced. Most of the above factors
are beyond Jaguar’s control.
73
Fluctuations in currency exchange
rates may adversely affect Jaguar’s financial position and
results.
Fluctuations
in currency exchange rates, particularly operating costs denominated in
currencies other than U.S. dollars, may significantly impact Jaguar’s financial
position and results. Gold is sold throughout the world based principally on a
U.S. dollar price, but a portion of Jaguar’s operating expenses are incurred in
non-U.S. dollar currencies. In addition, the appreciation of non-U.S. dollar
currencies in Brazil against the U.S. dollar would increase the costs of gold
production at mining operations in Brazil, which could materially and adversely
affect Jaguar’s earnings and financial condition.
Competition for new mining properties
may prevent Jaguar from acquiring interests in additional properties or mining
operations.
The
gold mining industry is intensely competitive, and there is no assurance that,
even if Jaguar discovers commercial quantities of gold mineral resources, a
profitable market will exist for the sale of those resources. Significant and
increasing competition exists for gold and other mineral acquisition
opportunities throughout the world. Some of the competitors are large, more
established mining companies with substantial capabilities and greater financial
resources, operational experience and technical capabilities than Jaguar. As a
result of the competition, Jaguar may be unable to acquire rights to exploit
additional attractive mining properties on terms it considers acceptable.
Increased competition could adversely affect Jaguar’s ability to attract
necessary capital funding or acquire any interest in additional operations that
would yield reserves or result in commercial mining operations.
Actual capital costs, operating
costs, production and economic returns may differ significantly from those Jaguar has
anticipated and there can be no assurance that any future development activities
will result in profitable mining operations.
Capital
and operating costs, production and economic returns, and other estimates
contained in the feasibility studies for Jaguar’s projects may differ
significantly from those anticipated by Jaguar’s current studies and estimates,
and there can be no assurance that Jaguar’s actual capital and operating costs
will not be higher than currently anticipated. In addition, delays to
construction schedules may negatively impact the net present value and internal
rates of return of Jaguar’s mineral properties as set forth in the applicable
feasibility studies.
There can be no assurance that the
interests held by Jaguar in its properties are free from
defects.
Jaguar
has investigated its rights to explore and exploit its various properties, and,
to the best of its knowledge, those rights are in good standing. No assurance
can be given, however, that such rights will not be revoked or significantly
altered to the detriment of Jaguar. There can also be no assurance that Jaguar’s
rights will not be challenged or impugned by third parties.
Jaguar’s
properties may be subject to prior recorded and unrecorded agreements, transfers
or claims, and title may be affected by, among other things, undetected defects.
Jaguar has not conducted surveys of all of the claims in which it holds direct
or indirect interests. A successful challenge to the precise area and location
of these claims could result in Jaguar being unable to operate on its properties
as permitted or being unable to enforce its rights with respect to its
properties.
74
Jaguar is exposed to risks of
changing political stability and government regulation in the country in which it
operates.
Jaguar
holds mineral interests in Brazil that may be affected in varying degrees by
political instability, government regulations relating to the mining industry
and foreign investment therein, and the policies of other nations in respect of
Brazil. Any changes in regulations or shifts in political conditions are beyond
the control of Jaguar and may adversely affect its business. Jaguar’s operations
may be affected in varying degrees by government regulations, including those
with respect to restrictions on production, price controls, export controls,
income taxes, expropriation of property, employment, land use, water use,
environmental legislation and mine safety. The regulatory environment is in a
state of continuing change, and new laws, regulations and requirements may be
retroactive in their effect and implementation. Jaguar’s operations may also be
affected in varying degrees by political and economic instability, economic or
other sanctions imposed by other nations, terrorism, military repression, crime,
extreme fluctuations in currency exchange rates and high inflation.
Jaguar is subject to substantial
environmental and other regulatory requirements and such regulations are becoming more
stringent. Non-compliance with such regulations, either through current or future
operations or a pre-existing condition could materially adversely affect
Jaguar.
All
phases of Jaguar’s operations are subject to environmental regulations in the
jurisdiction in which it operates. Environmental legislation is evolving in a
manner that will require stricter standards and enforcement, increased fines and
penalties for non-compliance, more stringent environmental assessments of
proposed projects and a heightened degree of responsibility for companies and
their officers, directors and employees. There can be no assurance that future
changes in environmental regulation, if any, will not be materially adverse to
Jaguar’s operations.
The
properties in which Jaguar holds interests may contain environmental hazards,
which are presently unknown to Jaguar and which have been caused by previous or
existing owners or operators of the properties. If Jaguar properties do contain
such hazards, this could lead to Jaguar being unable to use the properties or
may cause Jaguar to incur costs to clean up such hazards. In addition, Jaguar
could find itself subject to litigation should such hazards result in injury to
any persons.
Government
approvals and permits are sometimes required in connection with Jaguar’s
operations. Although Jaguar believes it has all of the material approvals and
permits to carry on its operations, Jaguar may require additional approvals or
permits or may be required to renew existing approvals or permits from time to
time. Obtaining or renewing approvals or permits can be a complex and
time-consuming process. There can be no assurance that Jaguar will be able to
obtain or renew the necessary approvals and permits on acceptable terms, in a
timely manner, or at all. To the extent such approvals are required and not
obtained, Jaguar may be delayed or prohibited from proceeding with planned
exploration, development or mining of mineral properties.
Failure
to comply with applicable laws, regulations and permitting requirements may
result in enforcement actions thereunder, including orders issued by regulatory
or judicial authorities, which may require operations to cease or be curtailed,
or corrective measures requiring capital expenditures, installation of
additional equipment, or remedial actions. Parties engaged in mining operations
may be required to compensate those suffering loss or damage by reason of the
mining activities and may have civil or criminal fines or penalties imposed for
violations of applicable laws or regulations.
Amendments
to current laws, regulations and permits governing operations and activities of
mining companies, or more stringent implementation of such requirements could
have a material adverse impact on Jaguar and cause increases in capital
expenditures or production costs or reductions in levels of production at
producing properties or require abandonment or delays in development of new
mining properties.
History of
losses.
Jaguar
has experienced net operating losses since its first full year of gold producing
operations in 2005. These losses amounted to, US$12,838,000 for the year ended
December 31, 2005, US$12,746,000 for the year ended December 31, 2006,
US$27,660,000 for the year ended December 31, 2007 and US$814,000 for the nine
months ended September 30, 2008. There can be no
assurance that Jaguar will be able to achieve or sustain profitability in the
future.
75
Jaguar may need additional capital to
accomplish its exploration and development plans, and there can be no assurance
that financing will be available on terms acceptable to Jaguar, or at
all.
The
exploration and development of Jaguar’s properties, including the continued
exploration and development of projects and the construction of mining
facilities and operations may require substantial additional financing. Failure
to obtain sufficient financing, or financing on terms acceptable to Jaguar, may
result in a delay or indefinite postponement of exploration, development or
production on any or all of Jaguar’s properties or even a loss of an interest in
a property. The only source of funds now available to Jaguar is through
production at Sabará, Turmalina and Paciência, the sale of debt or equity
capital, properties, royalty interests or the entering into of joint ventures or
other strategic alliances in which the funding sources could become entitled to
an interest in Jaguar’s properties or projects. Additional financing
may not be available when needed, especially in light of the current slow down
in lending resulting from global financial conditions. If funding is
available, the terms of such financing might not be favorable to Jaguar and
might involve substantial dilution to existing shareholders. If financing
involves the issuance of debt, the terms of the agreement governing such debt
could impose restrictions on Jaguar’s operation of its business. In addition,
the indenture governing the 10.5% secured notes issued by Jaguar in March
2007 restricts Jaguar's ability to issue debt through, or secured by the assets
of, MSOL, which could limit the amount of capital that Jaguar could raise through the issuance
of debt. Failure to raise capital when needed could have a material adverse
effect on Jaguar’s business, financial condition and results of
operations.
Jaguar
has no record of paying dividends.
Jaguar
has paid no dividends on the Common Shares since incorporation and does not
anticipate doing so in the foreseeable future. Payment of any future dividends
will be at the discretion of Jaguar’s board of directors after taking into
account many factors, including operating results, financial condition, capital
requirements, business opportunities and restrictions contained in any financing
agreements.
Jaguar relies on its management and
key personnel, and there is no assurance that such persons will remain at Jaguar,
or that Jaguar will be able to recruit skilled individuals.
Jaguar
relies heavily on its existing management. Jaguar does not maintain “key man”
insurance. Recruiting and retaining qualified personnel is critical to Jaguar’s
success. The number of persons skilled in the acquisition, exploration and
development of mining properties is limited and competition for the services of
such persons is intense. Jaguar believes that it has been successful in
recruiting excellent personnel to meet its corporate objectives. However, as
Jaguar’s business activity grows, it may require additional key financial,
administrative, technical and mining personnel. Although Jaguar believes that it
will be successful in attracting and retaining qualified personnel, there can be
no assurance of such success. The failure to attract such personnel to manage
growth effectively could have a material adverse effect on Jaguar’s business,
prospects, financial conditions and results of operations.
Certain directors of Jaguar are
directors or officers of, or have shareholdings in, other mineral resource companies and
there is the potential that such directors will encounter conflicts of interest with
Jaguar.
Certain
of the directors of Jaguar are directors or officers of, or have significant
shareholdings in, other mineral resource companies, and, to the extent that such
other companies may participate in ventures in which Jaguar may participate, the
directors of Jaguar may have a conflict of interest in negotiating and
concluding terms respecting the extent of such participation. Such other
companies may also compete with Jaguar for the acquisition of mineral property
rights. If any such conflict of interest arises, a director who has such a
conflict will disclose the conflict at a meeting of the directors of Jaguar,
will not attend any part of a meeting of directors of Jaguar at which the terms
and extent of such participation are discussed, and will abstain from voting for
or against the approval of such participation or such terms. In accordance with
applicable laws, the directors of Jaguar are required to act honestly, in good
faith and in the best interests of Jaguar. In determining whether or not Jaguar
will participate in a particular program and the interest therein to be acquired
by it, the directors of Jaguar will consider, among other issues, the potential
benefits to Jaguar, the degree of risk to which Jaguar may be exposed and its
financial position at that time.
76
Jaguar
is exposed to risks of changing labor and employment regulations.
Although
Jaguar has good relations with its employees, production at its mining
operations is dependant upon the efforts of Jaguar’s employees. In addition,
relations between Jaguar and its employees may be affected by changes in the
scheme of labor relations that may be introduced by the relevant governmental
authorities in whose jurisdictions Jaguar carries on business. Changes in such
legislation or in the relationship between Jaguar and its employees may have a
material adverse effect on Jaguar’s business, results of operations and
financial condition.
International
Financial Reporting Standards
The
Accounting Standards Board of the Canadian Institute of Chartered Accountants
has announced that Canadian publicly accountable enterprises are required to
adopt International Financial Reporting Standards (“IFRS”) as issued by the
International Accounting Standards Board, effective January 1, 2011. IFRS will
require increased financial statement disclosure as compared to Canadian GAAP
and accounting policy differences between Canadian GAAP and IFRS will need to be
addressed by Jaguar. Jaguar is currently considering the impact a conversion to
IFRS would have on its future financial reporting.
Substantially all of Jaguar’s assets
are held by foreign subsidiaries that are subject to the laws of the Republic
of Brazil.
Jaguar
conducts operations through its wholly-owned foreign subsidiaries, MSOL and MTL,
and substantially all of its assets are held through such entities. Accordingly,
any governmental limitation on the transfer of cash or other assets between
Jaguar, MSOL and MTL could restrict Jaguar’s ability to fund its operations
efficiently. Any such limitations or the perception that such limitations may
exist now or in the future could have an adverse impact on Jaguar’s prospects,
financial condition and results of operations.
Residency
of directors, officers and others.
Jaguar
is incorporated under the laws of Ontario, but does not have an office or other
permanent establishment in Canada. Two of Jaguar’s directors and all of Jaguar’s
officers reside outside of Canada. Substantially all of the assets of these
persons and of Jaguar are located outside of Canada. Although Jaguar has a
registered office in Canada and has appointed Davies Ward Phillips &
Vineberg LLP as its agent for service of process, it may not be possible for
investors to effect services of process within Canada upon officers and
directors and certain named experts who reside outside its borders. It may also
not be possible to enforce judgments obtained in Canadian courts predicated upon
the civil liability provisions of applicable securities laws in Canada against
Jaguar, certain officers and directors and certain experts named
herein.
Compliance
with Section 404 of Sarbanes-Oxley
As
a registrant under the Securities Exchange Act of 1934, Jaguar is subject to the
requirements of the Sarbanes−Oxley Act of 2002 ("SOX"). Pursuant to Section 404
of SOX, Jaguar is required to furnish an internal controls report of
management’s assessment of the design and effectiveness of the company’s
internal controls as part of its Annual Report on Form 40−F beginning with our
fiscal year ending December 31, 2008. KPMG, Jaguar’s independent
registered accounting firm is then required to attest to, and report on,
management’s assessment. Jaguar has been evaluating its internal
controls systems in order to allow management to report on, and KPMG to attest
to, its internal controls, as required by Section 404 of SOX. While
Jaguar believes that it will be able to make the certifications required under
Section 404 and that KPMG will be in a position to attest to such
certifications, no assurance can be given that Jaguar and KPMG will be able to
do so. If Jaguar is not able to meet the requirements of Section 404
or if KPMG is unable to attest to its certifications, Jaguar might be subject to
sanctions or investigation by regulatory authorities, such as the Securities and
Exchange Commission or the NYSE Arca. In addition, as a result of the evaluation
of its internal controls, Jaguar may be required to report internal control
material weaknesses. Either of the foregoing could adversely affect Jaguar’s
financial results and the market price of its common shares.
77
Current
Global Financial Condition
Current
global financial conditions have been characterized by increased volatility and
several financial institutions have either gone into bankruptcy or have had to
be rescued by governmental authorities. Access to public financing has been
negatively impacted by both the rapid decline in value of sub-prime mortgages
and the liquidity crisis affecting the asset-backed commercial paper market.
These factors may impact the ability of Jaguar to obtain equity or debt
financing in the future on terms favourable to Jaguar. Additionally, these
factors, as well as other related factors, may cause decreases in asset values
that are deemed to be other than temporary, which may result in impairment
losses. As a result of the current global financial condition in general and the
retraction of gold prices and equity values in the gold sector, on November 6,
2008, Jaguar announced that the Caeté project had been delayed until market
conditions improve. If such increased levels of volatility and market turmoil
continue, Jaguar’s operations could be adversely impacted and the trading price
of the Common Shares may be adversely affected.
The
trading price for the Common Shares is volatile and has been greatly affected by
the ongoing market volatility.
Securities
of mineral exploration and early stage base metal production companies have
experienced substantial volatility in the past, often based on factors unrelated
to the financial performance or prospects of the companies involved. These
factors include macroeconomic developments in North America and globally and
market perceptions of the attractiveness of particular industries. Jaguar’s
share price is also likely to be significantly affected by short-term changes in
gold prices or in its financial condition or results of operations as reflected
in its quarterly earnings reports. Other factors unrelated to Jaguar’s
performance that may have an effect on the price of the Common Shares include
the following: the extent of analytical coverage available to investors
concerning Jaguar’s business may be limited if investment banks with research
capabilities do not continue to follow Jaguar’s securities; the lessening in
trading volume and general market interest in Jaguar’s securities may affect an
investor’s ability to trade significant numbers of Common Shares; the size of
Jaguar’s public float may limit the ability of some institutions to invest in
Jaguar’s securities; and a substantial decline in the price of the Common Shares
that persists for a significant period of time could cause Jaguar’s securities
to be delisted from the TSX, the NYSE Arca or both, further reducing market
liquidity. As a result of any of these factors, the market price of the Common
Shares at any given point in time may not accurately reflect Jaguar’s long-term
value.
The value of Common Shares may be
diluted due to the conversion of stock options.
As
at January 31, 2009, there were 7,056,013 Common Shares issuable
upon the exercise of outstanding stock options at prices ranging from US$1.00 to
C$9.54 per share. During the life of the options, the holders of such securities
are given an opportunity to profit from a rise in the market price of Common
Shares with a resulting dilution in the interest of the other shareholders.
Jaguar’s ability to obtain additional financing during the period in which such
rights are outstanding may be adversely affected and the existence of the rights
may have an adverse effect on the market price of the Common Shares. The holders
of stock options may exercise such securities at a time when Jaguar would be
able to obtain needed capital by a new offering of securities on terms more
favorable than those provided by the outstanding rights. The increase in the
number of Common Shares in the market resulting from the exercise of such rights
and the possibility of sales of such shares may have a depressive effect on the
price of Common Shares. In addition, as a result of such additional Common
Shares, the voting power of Jaguar’s existing shareholders will be
diluted.
Jaguar
may, in the future, grant to some or all of its directors, key employees and
consultants additional options to purchase its Common Shares at exercise prices
equal to market prices at times when the public market is depressed. To the
extent that significant numbers of such options are granted and exercised, the
interests of then existing shareholders of Jaguar will be subject to additional
dilution.
78
DIVIDENDS
Jaguar
has not paid any dividends and does not intend to pay dividends in the
foreseeable future. Any future payment of dividends will be dependent
upon the financial requirements of Jaguar to fund future projects, the financial
condition of Jaguar and other factors that the Board, in its discretion, may
consider appropriate under the circumstances.
79
DESCRIPTION OF CAPITAL
STRUCTURE
Jaguar
is authorized to issue an unlimited number of common shares of which there were
63,982,281 issued and outstanding as of December 31, 2008. Holders of
Jaguar’s common shares are entitled to receive notice of any meetings of
shareholders, to attend and to cast one vote per Common Share at all such
meetings. Holders of Jaguar’s common shares do not have cumulative
voting rights with respect to the election of directors, and holders of a
majority of Jaguar’s common shares entitled to vote in any election of directors
may therefore elect all directors standing for election. Holders of
Jaguar’s common shares are entitled to receive on a pro-rata basis such
dividends, if any, as and when declared by the Board at its discretion from
funds legally available therefore and upon the liquidation, dissolution or
winding up of Jaguar are entitled to receive on a pro-rata basis the net assets
of Jaguar after payment of debts and other liabilities, in each case subject to
the rights, privileges, restrictions and conditions attaching to any other
series or class of shares ranking senior in priority to or on a pro-rata basis
with the holders of common shares with respect to dividends or
liquidation. Jaguar’s common shares do not carry any pre-emptive,
subscription, redemption or conversion rights, nor do they contain any sinking
or purchase fund provisions. As of January 31, 2007, the Board
adopted the Shareholder Rights Plan, which was ratified at the 2007 annual
meeting of shareholders and approved by the TSX. A copy of the
Shareholder Rights Plan may be found on SEDAR at
http://www.sedar.com.
On
February 21, 2008, Jaguar issued 8,250,000 common shares at a price of
Cdn.$13.40 per share for proceeds of Cdn.$110,550,000. The offering price was
determined by negotiation between Jaguar and a syndicate led by RBC and included
TD Securities, BCI, BMO, and Raymond James Ltd.
80
MARKET FOR
SECURITIES
Jaguar’s
common shares are listed and posted for trading on the TSX and on the NYSE Arca,
in each case under the symbol “JAG”. The notes issued pursuant to the
March 22, 2007 private placement were listed on the TSX on July 26, 2007, under
the symbol “JAG.NT”.
With
respect to each of TSX and NYSE Arca, the following tables set forth information
relating to the trading of Jaguar’s common shares and notes for the periods
indicated.
Toronto
Stock Exchange
Common
Shares
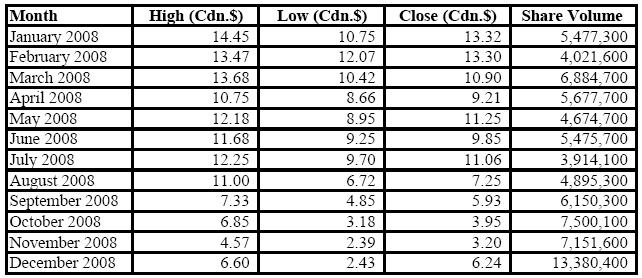
Notes
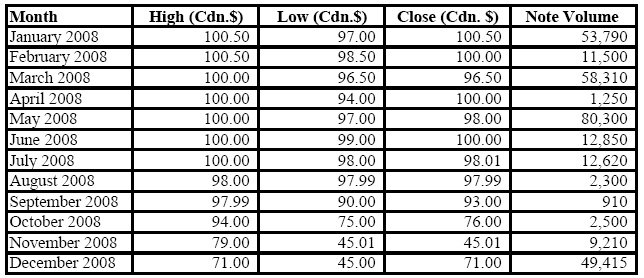
81
NYSE
Arca
Common
Shares
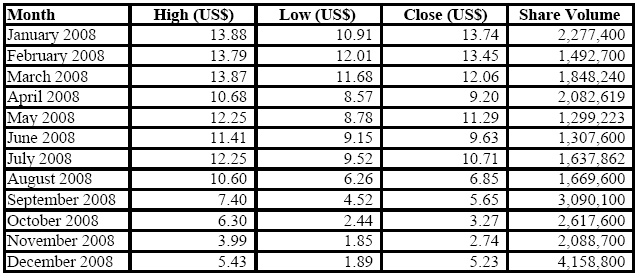
Source
of data
|
|
•
|
The
trading prices and volume data were provided by the
TSX
|
|
|
•
|
For
the NYSE months of March, April and May, the data was taken from
Bloomberg
|
82
DIRECTORS
AND EXECUTIVE OFFICERS
The
following is a list of the directors and executive officers of Jaguar, and
information regarding each individual including municipality of home address,
position with Jaguar, date of appointment to the position with Jaguar and the
principal occupation during the past five years. All directors hold
office until the next annual meeting of shareholders or until their successors
are elected or until their earlier death, resignation or removal.
|
Name
and Municipality of home address
|
Position
and Date of appointment
|
Principal
occupation during past five years
|
|
Gary
E. German
Toronto,
Ontario, Canada
|
Director
and Chairman
September
26, 2003
|
President
of Falcon Strategy and Management Co.; formerly Managing Director,
Kingsdale Capital Partners Inc., October 2002 to September
2003.
|
|
Daniel
R. Titcomb(1)
Henniker,
New Hampshire, USA
|
Director,
President and CEO
June
6, 2003
|
President
and CEO of Jaguar has been Mr. Titcomb’s principal occupation since June
2003; prior to such time, Mr. Titcomb’s principal occupation was President
and CEO of Brazilian.(2)
|
|
Lúcio
Cardoso
Belo
Horizonte, Minas Gerais, Brazil
|
Chief
Operating Officer
September
1, 2008
|
VP
Operations of Jaguar from 2003 to August 31, 2008; Director of IMS from
2002 through the present
|
|
Anthony
F. Griffiths
Toronto,
Ontario, Canada
|
Director
May
20, 2004
|
Independent
business consultant.
|
|
William
E. Dow(1)
Manchester,
Connecticut, USA
|
Director
June
4, 2004
|
Retired,
formerly an actuary with Aetna Life & Casualty.
|
|
Andrew
C. Burns
Toronto,
Ontario, Canada
|
Director
August
6, 2004
|
Independent
business consultant.
|
|
Gil
Clausen
Denver,
Colorado, USA
|
Director
May
12, 2005
|
Chief
Executive Officer of Augusta Resource Corporation, a Canadian corporation,
since 2005; Executive Vice President, Mining, Washington Group
International, Inc., from October 2001 to March 2005.
|
|
James
M. Roller
Manchester,
New Hampshire, USA
|
Chief
Financial Officer
March
1, 2005
Treasurer
May
11, 2006
|
Mr.
Roller served as a consultant to Jaguar from November 1, 2004 through
February 28, 2005. Mr. Roller replaced Mr. Kirchhoff as CFO on
March 1, 2005 and as Treasurer on May 11, 2006. Prior to
working for Jaguar, Mr. Roller served as Director of Finance and
Administration, DSM Thermoplastic Elastomers (March 2001-November
2004).
|
|
Robert
J. Lloyd(3)
Concord,
New Hampshire, USA
|
Secretary
March
1, 2002
|
President,
CEO and Secretary of Brazilian. Partner, Hinckley, Allen &
Snyder LLP, February 2002-April
2006.
|
|
(1)
|
Mr.
Titcomb and Mr. Dow serve on the board of directors of both Jaguar and
Brazilian.
|
|
(2)
|
Mr.
Titcomb remained the President and Chief Executive Officer of Brazilian
until April 2006.
|
|
(3)
|
Mr.
Lloyd serves as secretary to both Jaguar and Brazilian, and is a director
and the President and Chief Executive Officer of
Brazilian.
|
On
September 30, 2008 Mr. Juvenil T. Felix resigned from his roles as a director
and the Chief Operating Officer of Jaguar. Mr. Felix had been a director and the
Chief Operating Officer since his appointment to the positions on June 6,
2003.
As
of February 3, 2009, the directors and executive officers of Jaguar, as a group,
beneficially own, directly or indirectly, or exercise control or discretion over
an aggregate of 6,735,931common shares of Jaguar, representing 9.5 percent of
the outstanding shares.
Jaguar’s
compensation committee considers employment, consulting or other compensation
arrangements between Jaguar and its employees. The current members of
the compensation committee are Messrs. German and Griffiths, with Mr. Griffiths
as chairman.
Jaguar’s
corporate governance committee reviews and advises the Board with respect to
corporate governance and compliance issues. The current members of
the corporate governance committee are Messrs. Griffiths, Dow and Clausen, with
Mr. Dow as chairman.
83
Jaguar’s
health, safety and environmental committee reviews and advises the Board with
respect to responsibilities relating to various human resources and
environmental issues of Jaguar. The current members of the human
resources and environmental committee are Messrs. German and Clausen, with Mr.
Clausen as chairman.
For
information on Jaguar’s audit committee, see the section entitled “Audit Committee” under “DIRECTORS AND EXECUTIVE
OFFICERS”.
The
following is a description of the professional qualifications, designations and
memberships in business-related associations, experience and technical expertise
pertinent to Jaguar’s business and other background information relating to the
officers and directors of Jaguar.
Gary
E. German, Chairman
Mr.
German, President of Falcon Strategy and Management Co., is a professional
engineer with over 35 years of senior management experience in the development
of operations and financing of global resource projects and
companies. He was most recently Managing Director of a resource
corporate finance group following his Senior Advisor role to the President-CEO
of Ma'aden, the Kingdom of Saudi Arabia's mineral resource development
corporation. Previously, as Senior Vice President, Chief Operating
Officer and Director of TVX Gold Inc., he was responsible for worldwide
operations. These positions followed 28 years in the Noranda Group,
culminating in the position of Senior Vice President, where he was responsible
for major projects in Chile, industrial and mine developments in Brazil and
executive strategic activities in some 20 countries. Mr. German is
fluent in Portuguese and Spanish. He is a director of a number of
public companies and also 'not-for-profit' organizations. Mr. German
holds an engineering degree from the University of Toronto.
Daniel
R. Titcomb, CEO, President and Director
Mr.
Titcomb is one of the founders of Brazilian with thirteen continuous years of
experience to date operating in the country of Brazil (and remains a director of
Brazilian). Previously, Mr. Titcomb was engaged in the management of
construction and real estate development, and has board of director experience
at private companies. Mr. Titcomb graduated from Keene State College,
Keene, New Hampshire with Bachelor of Science degrees in Industrial Engineering
and Business Management.
Lúcio
Cardoso, Chief Operating Officer
Mr.
Cardoso is the Chief Operating Officer of Jaguar. Mr. Cardoso is a
former superintendent of AngloGold's gold division with over 35 years experience
in the Brazilian mining sector. He was responsible for the
construction and operation of AngloGold's Crixás mine, which produced 115,000
ounces of gold per year. He holds a B.S. in Mining from the School of
Mines of the Federal University of Ouro Preto.
Anthony
F. Griffiths, Director
From
1993 to the present Mr. Griffiths has been associated with various companies
acting as an independent consultant. At present, Mr. Griffiths is
Director and Chairman of Russel Metals Inc. and Novadaq Technologies
Inc. He is also a Director of Crum & Forster Holdings Corp.,
Fairfax Financial Holdings Limited, PreMD Inc., Northbridge Financial
Corporation, Odyssey Re Holdings Corp., and Vitran Corporation. Mr.
Griffiths was educated at McGill University in Canada (BA 1954) and at the
Harvard Graduate School of Business Administration (MBA 1956).
William
E. Dow, Director
Mr.
Dow is formerly an actuary with Aetna Life Casualty Company in Connecticut and
is currently retired. During his career, he was an Executive Officer,
a Fellow of the Society of Actuaries and a Member of the American Academy of
Actuaries. Mr. Dow holds a BA degree in Mathematics from Middlebury
College. Mr. Dow also serves as a Director and Chairman of
Brazilian.
84
Andrew
C. Burns, Director
Mr.
Burns is an independent director and consultant. In 2003, he retired
as a Senior Partner of Deloitte & Touche with almost 40 years of experience
in international auditing, consulting and practice management in North and South
America, Europe and Asia. He holds an M.B.A. degree from The Richard Ivey School
of the University of Western Ontario and is a Member of the Canadian Institute
of Chartered Accountants and the Institute of Management Consultants of Ontario.
He also serves on other Boards as an independent director and audit committee
chair.
Gil
Clausen, Director
Since
2005, Mr. Clausen has been employed as the Chief Executive Officer of Augusta
Resource Corporation, a Canadian corporation. Prior to this position,
he was the Executive Vice President, Mining, of Washington Group International,
Inc., from 2001 to 2005. He was President and Chief Executive Officer
of EngineeringMatrix Corp., which provided project/commercial management
software for mining and power companies, from 1999 to 2001. Mr.
Clausen has 22 years experience in executive, operational, business development,
project and engineering management in the mining industry. He has
held senior positions with Stillwater Mining Company, Placer Dome Inc.,
Falconbridge, Fording Coal Limited and Cleveland Cliffs Inc. Mr.
Clausen holds Bachelors and Masters degrees in mining engineering from Queen’s
University.
James
M. Roller, Chief Financial Officer and Treasurer
Mr.
Roller graduated from the University of Notre Dame with a BBA in Accounting and
Finance. He is a CPA, having spent 12 years with Arthur Andersen, 8
years of which he concentrated on the mining industry in South
Africa. Mr. Roller has also served as a project manager for the
Financial Accounting Standards Board (FASB). For the past 15 years he
has held senior finance and operating positions for a variety of public and
private international companies, in the high-tech and manufacturing
industries.
Robert
J. Lloyd, Secretary
Mr.
Lloyd received a Bachelor of Science degree from the University of New Hampshire
in 1970, served as an officer in the United States Army from 1970 to 1974,
received his Juris Doctor in 1977 and LLM (Taxation) from Boston University in
1980. Mr. Lloyd practiced law with the New Hampshire firm of
Cleveland, Waters & Bass, P.A. as an attorney (1977), partner (1981) and
managing partner (1991-1995). Mr. Lloyd was an adjunct professor of
corporate taxation at Franklin Pierce Law Center (1980-1985). Mr.
Lloyd’s representation of clients primarily involves providing advice to active
boards of directors regarding how to properly perform their duties and corporate
business and taxation planning. Mr. Lloyd was a partner with the firm
of Hinckley, Allen & Snyder LLP from February 2002 until April
2006. Hinckley, Allen & Snyder LLP has offices in Boston,
Massachusetts, Providence, Rhode Island and Concord, New
Hampshire. Since 2006 Mr. Lloyd has been the President and Chief
Executive Officer and a director of Brazilian. Mr. Lloyd serves as
the corporate secretary for Brazilian (since 1990) and for Jaguar.
Corporate
Cease Trade Orders or Bankruptcies
Except
as stated below, no director or executive officer of Jaguar, or shareholder
holding a sufficient number of securities of Jaguar to affect materially the
control of Jaguar, is, as at the date of this Annual Information Form, or has
been within ten (10) years before the date of this Annual Information Form, a
director or executive officer of any company that, while that person was acting
in that capacity:
|
(i)
|
was
the subject of a cease trade or similar order or an order that denied the
relevant company access to any exemption under securities legislation, for
a period of more than thirty (30) consecutive days except as set forth in
the second and third to last paragraphs of this
section;
|
|
(ii)
|
was
subject to an event that resulted, after the director or executive officer
ceased to be a director or executive officer, in the company being the
subject of a cease trade or similar order or an order that denied the
relevant company access to any exemption under securities legislation, for
a period of more than thirty (30) consecutive days;
or
|
85
|
(iii)
|
within
a year of that person ceasing to act in that capacity, became bankrupt,
made a proposal under any legislation relating to bankruptcy or
insolvency, or was subject to or instituted any proceedings, arrangement
or compromise with creditors or had a receiver, receiver manager or
trustee appointed to hold its
assets.
|
Further,
except as noted below, no director, executive officer, promoter or other member
of management of Jaguar has within the ten years before the date of this Annual
Information Form, become bankrupt, made a proposal under any legislation
relating to bankruptcy or insolvency, or become subject to or instituted any
proceedings, arrangement or compromise with creditors, or had a receiver,
receiver manager or trustee appointed to hold the assets of the
Nominee.
Messrs.
Dow, Lloyd and Titcomb are directors of Brazilian and Mr. Griffiths was a
director of Brazilian until June 29, 2005. Mr. Lloyd is President and
Chief Executive Officer and a director of Brazilian. The Ontario
Securities Commission, the British Columbia Securities Commission and the
Alberta Securities Commission issued cease trading orders against Brazilian on
May 3, May 9 and August 24, 2007, respectively, because of its late filing of
annual financial statements and management discussion and analysis for the year
ended December 31, 2006. Brazilian filed such financial statements
and management discussion and analysis on October 17, 2007, and the Ontario
Securities Commission, the British Columbia Securities Commission and the
Alberta Securities Commission lifted the cease trading orders in December
2007. The Ontario Securities Commission issued a temporary cease
trading order against Brazilian on May 10, 2006 because of its late filing of
annual financial statements and management discussion and analysis for the year
ended December 31, 2005. Brazilian filed such financial statements
and management discussion and analysis on May 19, 2006 and the Ontario
Securities Commission lifted the temporary cease trade order on May 24,
2006. The Ontario Securities Commission issued a cease trade order
against Brazilian on December 6, 2005 because of its failure to file interim
financial statements and management discussion and analysis for the quarter
ended September 30, 2005. Brazilian filed such financial statements
and management discussion and analysis on January 5, 2006, and the Ontario
Securities Commission lifted the cease trade order on January 17,
2006. A temporary cease trading order was also issued by the Ontario
Securities Commission against the management and insiders of Brazilian on June
10, 2001. This order was rescinded on July 30, 2001. The
TSX Venture Exchange suspended trading in Brazilian as a result of a cease trade
order issued by the British Columbia Securities Commission on June 30, 2003 due
to the late filing of financial statements. The financial statements
were subsequently filed with the appropriate regulatory authorities. Such cease
trade order was lifted by the British Columbia Securities Commission on July 8,
2003, and by the Ontario Securities Commission on July 29, 2003.
Mr.
Griffiths was formerly a director of Consumers Packaging Inc. while it operated
under the protection of the Companies’ Creditors Arrangement Act (Canada)
(“CCAA”). During the protection period, cease trade orders were
issued against management and insiders due to the failure to file financial
statements. Mr. Griffiths was also a director of Confederation Life
Insurance Company at the time it was placed into liquidation in 1994 and
Consumers Packaging Inc. at the time it was placed in liquidation under the
protection of the CCAA in 2001. Mr. Griffiths was a director of
Slater Steel Inc., which operated under the protection of the CCAA in an orderly
wind-down and orderly realization in 2004. PriceWaterhouseCoopers has
been appointed receiver without security of all of its property, assets and
undertakings in 2004.
Mr.
Roller was formerly Vice President of Finance for Century Electronics
Manufacturing Inc. (“Century”), a private U.S. company, which filed for
bankruptcy under Chapter 11 of the U.S. Bankruptcy Code during January
2001. Mr. Roller had no stock or any other interest in the
company. After Century operated in Chapter 11 for a period of time,
the Bankruptcy Court approved the sale of Century to another
company.
86
Conflicts
of Interest
Certain
directors and officers of Jaguar and its subsidiary are associated with other
reporting issuers or other corporations, and such relationships may give rise to
conflicts of interest. Specifically, Daniel R. Titcomb and William E.
Dow are directors of both Jaguar and Brazilian; Mr. Titcomb is also President
and Chief Executive Officer of Jaguar; Mr. Lloyd is a director, President and
Chief Executive Officer of Brazilian and Secretary of Brazilian and
Jaguar. Jeffrey Kirchhoff is a director, Chief Financial Officer and
Treasurer of Brazilian and was the Treasurer of Jaguar until May 11,
2006. As of February 11, 2009, Brazilian held 2.5% percent of the
currently outstanding common shares. Mr. Cardoso is a director of IMS
and Mr. Felix is a director, President and Chief Executive Officer of IMS and
was Chief Executive Officer of Jaguar until September 1, 2008. As of
February 11, 2009, IMS held 7.0 percent of the currently outstanding common
shares of Jaguar. Further, Jaguar is a party to a management
agreement with IMS pursuant to which IMS receives certain monthly fees and a
lease agreement with Brazilian, which includes an occupancy and administrative
services arrangement, pursuant to which Brazilian receives certain monthly
fees. Jaguar was the lender of secured and unsecured loans to
Brazilian, which loans were repaid in full in 2006.
Audit
Committee
As
of February 11, 2009, the members of the Audit Committee are Messrs. Burns,
German and Griffiths. Mr. Burns is the Chair of the
Committee. Messrs. Burns, German and Griffiths are independent within
the meaning of National Instrument 52-110. All three members are
financially literate within the meaning of National Instrument
52-110.
For
a description of the biographies of the Audit Committee members, see “Directors and Executive
Officers”.
The
Charter of the Audit Committee is set forth in Appendix A to this Annual
Information Statement.
Audit
Fees
During
the fiscal years ended December 31, 2007 and December 31, 2008, KPMG LLP,
Chartered Accountants (“KPMG”), charged Jaguar a total of Cdn.$311,860 and
Cdn.$544,662, respectively, for audit services.
Audit-Related
Fees
During
the fiscal years ended December 31, 2007 and December 31, 2008, KPMG charged
Cdn.$205,463 and Cdn.$273.939, respectively, for assurance and related services
that are reasonably related to the performance of the auditor review of Jaguar’s
financial statements but are not reported above in “Audit Fees”. Such
services related to professional services in connection with a prospectus and
financial statement reviews.
Tax
Fees
In
each of the fiscal years ended December 31, 2007 and December 31, 2008, KPMG
billed Cdn.$0 and Cdn.$0, respectively, for tax compliance, tax advice and tax
planning services.
All
Other Fees
In
each of the fiscal years ended December 31, 2007 and December 31, 2008, KPMG
billed Jaguar no amounts for services other than those reported under “Audit Fees”, “Audit-Related Fees”, and
“Tax
Fees”.
87
INTEREST OF MANAGEMENT AND
OTHERS IN MATERIAL TRANSACTIONS
To
the knowledge of the management of Jaguar, none of the directors, executive
officers or principal shareholders of Jaguar and no associate or affiliate of
the foregoing persons has or has had any material interest, direct or indirect,
in any transaction within the past three years or in any proposed transaction
that has materially affected or will materially affect Jaguar or any of its
subsidiaries, except for (i) two management agreements pursuant to which (A)
Brazilian received US$20,000 per month in management fees from Jaguar (which
agreement terminated on March 31, 2005), and (B) (x) for the year ended December
31, 2006, Jaguar incurred fees of US$739,000 to IMS Engenharia Mineral Ltda. for
management services provided to MSOL, (y) for the year ended December 31, 2007,
Jaguar incurred fees of US$747,000 to IMS Engenharia Mineral Ltda. (“IMS
Engenharia”)for management services provided to MSOL, and (z) for the year ended
December 31, 2008, Jaguar incurred fees of US$854,000 to IMS Engenharia for
management services provided to MSOL; (ii) (x) Jaguar incurred occupancy fees to
Brazilian of US$120,000 in 2006 and consulting fees and administrative service
charges of US$314,000 to Brazilian in 2006, (y) Jaguar incurred
occupancy fees to Brazilian of US$150,000 in 2007 and consulting fees and
administrative service charges of US$444,207 to Brazilian in 2007 and (z) Jaguar
incurred occupancy fees to Brazilian of US$180,000 in 2008 and consulting fees
and administrative service charges of US$338,460 to Brazilian in 2008; (iii) two
loan agreements between Jaguar and Brazilian pursuant to which (A) Jaguar made a
loan to Brazilian in the amount of US$800,000, bearing interest at the rate of
five percent, which loan was repaid in full in December 2006, and a separate
loan in the amount of US$268,433, which was repaid in full together with
interest totaling US$293,070 in the third quarter of 2005, and (B) Jaguar made
non-interest bearing advances to Brazilian amounting to US$251,370, which
advances were repaid in full during the third quarter of 2005; (iv) a loan
agreement between MSOL and Prometálica pursuant to which Prometálica, a company
in which Brazilian and IMS are significant shareholders, had borrowed an
aggregate of US$5,488,000 from MSOL, US$327,000 of the remaining balance was
repaid with a transfer of equipment to MSOL (based on an appraisal prepared by
an independent engineering firm) as of March 15, 2006 and the remaining balance
of accrued interest converted to a net smelting royalty of 1.5 percent on
Prometálica’s Monte Cristo zinc project; (v) a loan by Jaguar to a trust which
is controlled by an officer and director of Jaguar in the amount of US$130,000,
bearing interest at the U.S. prime rate plus 1 percent, which was repaid in full
in 2005; and (vi) Jaguar’s subsidiaries MSOL and MTL were required to pay an
employment claim to a former MSOL employee, but since these subsidiaries were
owned by Brazilian and other Brazilian companies at the time of the claim,
Brazilian has guaranteed the amount owed to Jaguar of R$378,000
(US$197,000).
With
respect to the loan agreement between MSOL and Prometálica discussed above, on
August 11, 2008, Prometálica filed a judicial restructuring in Belo Horizonte,
state of Minas Gerais, Brazil. At this time, the financial impact of this action
on Prometálica is indeterminate. Prior to the filing, the primary
shareholders of Prometálica, Brazilian and IMS, provided a guarantee of
Prometálica’s obligation to MSOL. This guarantee will ensure the
recovery of the net smelter royalty due from Prometálica. As at
February 11, 2009, the amount of the obligation is approximately
US$1,000,000.
Lúcio
Cardoso, the Chief Operating Officer of Jaguar, owns or controls 30 percent of
the stock of IMS.
88
TRANSFER AGENTS AND
REGISTRAR
The
transfer agent and registrar for Jaguar’s common shares is Computershare
Investor Services Inc., Toronto, Ontario.
89
MATERIAL
CONTRACTS
Other
than contracts entered into in the ordinary course of business, the only
material contracts that Jaguar has entered into since January 1, 2008 or that it
entered into prior to 2008, and are in effect are as follows:
2007 Shareholder Rights
Plan
See
“DESCRIPTION OF CAPITAL
STRUCTURE” for a description of the Shareholder Rights Plan adopted by
the Board on January 31, 2007. The Shareholder Rights Plan is
attached as Schedule B to the Material Change Report that was filed February 1,
2007 on www.sedar.com.
2007 Note
Indenture
On
March 22, 2007, Jaguar entered into a note indenture with Computershare Trust
Company of Canada pursuant to which Jaguar issued Cdn.$86,250,000 aggregate
principal amount of 10.5% senior secured notes due March 23,
2012. The notes were issued as part of the offering of units
described above under "2007
Underwriting Agreement". The note indenture required Jaguar to
pledge its interest in the quotas of MSOL as security for its performance
thereunder. See "GENERAL DEVELOPMENT OF THE
BUSINESS" for a description of the unit offering.
2008 Underwriting
Agreement
On
February 6, 2008, Jaguar entered into an underwriting agreement with RBC, TD
Securities, BCI, BMO and Raymond James Ltd pursuant to which it offered
8,250,000 common shares at a price of C$13.40 per share for proceeds of
C$110,550,000. Pursuant to the underwriting agreement, the
underwriters received a commission of 4.5 percent of the aggregate proceeds of
the offering. See “GENERAL DEVELOPMENT OF THE
BUSINESS” for a description of the common share offering.
90
INTERESTS OF
EXPERTS
Certain
disclosure with respect to Jaguar’s properties contained herein or in documents
incorporated herein by reference is derived from reports prepared by TechnoMine
and Scott Wilson RPA. Neither TechnoMine nor its principal, Ivan C.
Machado, owns, directly or indirectly, any securities of Jaguar or has any
direct or indirect interest in any property of Jaguar or of any associate or
affiliate of Jaguar. Neither Scott Wilson RPA nor its principal,
Graham G. Clow, owns, directly or indirectly, any securities of Jaguar or has
any direct or indirect interest in any property of Jaguar or any associate or
affiliate of Jaguar.
91
ADDITIONAL
INFORMATION
Additional
information relating to Jaguar may be found on SEDAR at
http://www.sedar.com.
Additional
information, including directors’ and officers’ remuneration and indebtedness,
principal holders of Jaguar’s securities, and securities authorized for issuance
under equity compensation plans is contained in Jaguar’s information circular
for its most recent annual meeting of shareholders. Additional
financial information is provided in Jaguar’s audited consolidated financial
statements and management’s discussion and analysis for its financial quarter
ended September 30, 2008. The Corporation expects to file its comparative
financial statements and Management’s Discussion and Analysis for the financial
year ended December 31, 2008 on or about March 23, 2009, which upon filing, will
be available on www.sedar.com.
92
APPENDIX
A
Charter of the Audit
Committee of the Board of Directors
History of the
Charter
Adopted
by the
Board: May
12, 2005
Amended
by the
Board July
16, 2007
Purpose of the
Committee
The
Audit Committee (the “Committee”) is appointed by the Board of Directors (the
“Board”) of Jaguar Mining Inc. (the “Company”) to assist the Board in fulfilling
its oversight responsibilities relating to financial accounting and reporting
process and internal controls for the Company, including the preparation of any
report required by United States Securities and Exchange Commission to be
included in the Company's Form 20-F, Form 40-F, or other applicable
form.
Charter
A. Duties
The
Committee’s primary duties and responsibilities are to serve as an independent
and objective party and to:
|
|
1.
|
Conduct
such reviews and discussions with management and the independent auditors
relating to the audit and financial reporting as are deemed appropriate by
the Committee;
|
|
|
2.
|
Assess
the integrity of internal controls and financial reporting procedures of
the Company and ensure implementation of such controls and
procedures;
|
|
|
3.
|
Review
the quarterly and annual financial statements and management’s discussion
and analysis of the Company’s financial position and operating results and
report thereon to the Board for approval of
same;
|
|
|
4.
|
Select
and monitor the independence and performance of the Company’s outside
auditors (the “Independent Auditors”), including attending at private
meetings with the Independent Auditors and reviewing and approving all
renewals or dismissals of the Independent Auditors and their
remuneration;
|
|
|
5.
|
Set
clear policies regarding the hiring of employees or former employees of
the Independent Auditors by the
Company;
|
|
|
6.
|
Monitor
the quality and integrity of the Company’s financial statements and other
financial information; and
|
|
|
7.
|
Provide
oversight to related party transactions entered into by the
Company.
|
B. General
Authority
The
Committee has the authority to conduct any investigation appropriate to its
responsibilities, and it may request the Independent Auditors as well as any
officer of the Company, or outside counsel for the Company, to attend a meeting
of the Committee or to meet with any members of, or advisors to, the
Committee.
The
Committee shall have unrestricted access to the books and records of the Company
and has the authority to communicate directly with internal and Independent
Auditors.
93
The
Committee shall have the authority to engage independent counsel and other
advisors and experts as it determines necessary to carry out its duties and to
set and pay the compensation for any advisors employed by the
Committee. The Committee may fulfill additional duties and adopt
additional policies and procedures as may be appropriate in light of changing
business, legislative, regulatory or other conditions.
The
Committee shall review and assess the adequacy of this Charter annually and
submit any proposed revisions to the Board for approval.
In
fulfilling its responsibilities, the Committee will carry out the specific
duties set out in Part D of this Charter.
C. Composition and
Meetings
|
|
1.
|
The
Committee and its membership shall meet all applicable legal and listing
requirements, including, without limitation, those of the Toronto Stock
Exchange (“TSX”), the Business Corporations
Act (Ontario) and all applicable securities regulatory authorities,
including the Canadian Securities Administrators (the
“CSA”). Each member of the Committee shall be financially
literate.
|
|
|
2.
|
The
Committee shall be composed of three or more directors as shall be
designated by the Board from time to time. The members of the
Committee shall appoint from among themselves a member who shall serve as
Chair.
|
|
|
3.
|
Each
member of the Committee shall be “independent” (as defined under the
Multilateral Instrument 52-110 of the CSA). Each member of the
Committee shall be financially literate (as defined in Multilateral
Instrument 52-110).
|
|
|
4.
|
The
Committee shall meet at least once quarterly, at the discretion of the
Chair or a majority of its members, as circumstances dictate or as may be
required by applicable legal or listing requirements. A minimum
of two and at least 50% of the members of the Committee present either in
person or by telephone shall constitute a
quorum.
|
|
|
5.
|
If
within one hour of the time appointed for a meeting of the Committee, a
quorum is not present, the meeting shall stand adjourned to the same hour
on the second business day following the date of such meeting at the same
place. If at the adjourned meeting a quorum as hereinbefore
specified is not present within one hour of the time appointed for such
adjourned meeting, such meeting shall stand adjourned to the same hour on
the second business day following the date of such meeting at the same
place. If at the second adjourned meeting a quorum as
hereinbefore specified is not present, the quorum for the adjourned
meeting shall consist of the members then
present.
|
|
|
6.
|
If
and whenever a vacancy shall exist, the remaining members of the Committee
may exercise all of its powers and responsibilities so long as a quorum
remains in office.
|
|
|
7.
|
The
time and place at which meetings of the Committee shall be held, and
procedures at such meetings, shall be determined from time to time by, the
Committee. A meeting of the Committee may be called by letter,
telephone, facsimile, email or other communication equipment, by giving at
least 48 hours notice, provided that no notice of a meeting shall be
necessary if all of the members are present either in person or by means
of conference telephone or if those absent have waived notice or otherwise
signified their consent to the holding of such
meeting.
|
|
|
8.
|
Any
member of the Committee may participate in the meeting of the Committee by
means of conference telephone or other communication equipment, and the
member participating in a meeting pursuant to this paragraph shall be
deemed, for purposes hereof, to be present in person at the
meeting.
|
94
|
|
9.
|
The
Committee shall keep minutes of its meetings which shall be submitted to
the Board. The Committee may, from time to time, appoint any
person who need not be a member, to act as a secretary at any meetingThe
Committee may also report to the Board on a regular basis with such
recommendations and other matters as the Committee may deem appropriate,
so that the Board is informed of the Committee’s
activities.
|
|
|
10.
|
The
Committee may invite such officers, directors and employees of the Company
and its subsidiaries as it may see fit, from time to time, to attend at
meetings of the Committee.
|
|
|
11.
|
The
Board may at any time amend or rescind any of the provisions hereof, or
cancel them entirely, with or without
substitution.
|
|
|
12.
|
Any
matters to be determined by the Committee shall be decided by a majority
of votes cast at a meeting of the Committee called for such
purpose. Actions of the Committee may be taken by an instrument
or instruments in writing signed by all of the members of the Committee,
and such actions shall be effective as though they had been decided by a
majority of votes cast at a meeting of the Committee called for such
purpose. All decisions or recommendations of the Audit
Committee shall require the approval of the Board prior to
implementation.
|
D. Responsibilities
|
|
1.
|
Financial
Accounting and Reporting Process and Internal
Controls
|
|
|
a.
|
The
Committee shall review the Company’s annual audited financial statements
to satisfy itself that they are presented in accordance with generally
accepted accounting principles (“GAAP”) and report thereon to the Board
and recommend to the Board whether or not same should be approved prior to
their being filed with the appropriate regulatory
authorities. The Committee shall also review the Company’s
interim financial statements and report thereon to the Board and recommend
to the Board whether or not same should be approved prior to their being
filed with the appropriate regulatory authorities. With respect
to the annual audited financial statements, the Committee shall discuss
significant issues regarding accounting principles, practices, and
judgments of management with management and the Independent Auditors as
and when the Committee deems it appropriate to do so. The
Committee shall satisfy itself that the information contained in the
annual audited and interim financial statements is not significantly
erroneous, misleading or incomplete and that in respect of the annual
audited financial statements the audit function has been effectively
carried out.
|
|
|
b.
|
The
Committee shall review management’s internal control report and the
evaluation of such report by the Independent Auditors, together with
management’s response.
|
|
|
c.
|
The
Committee shall review management’s discussion and analysis relating to
annual and interim financial statements and any other public disclosure
documents that are required to be reviewed by the Committee under any
applicable laws prior to their being filed with the appropriate regulatory
authorities including, without limitation, any press releases announcing
annual or interim earnings.
|
|
|
d.
|
The
Committee shall meet no less frequently than annually with the Independent
Auditors and the Chief Financial Officer or, in the absence of a Chief
Financial Officer, with the officer of the Company in charge of financial
matters, to review accounting practices, internal controls and such other
matters as the Committee, Chief Financial Officer or, in the absence of a
Chief Financial Officer, with the officer of the Company in charge of
financial matters, deems
appropriate.
|
|
|
e.
|
The
Committee shall inquire of management and the Independent Auditors about
significant risks or exposures, both internal and external, to which the
Company may be subject, and assess the steps management has taken to
minimize such risks.
|
95
|
|
f.
|
The
Committee shall review the post-audit or management letter containing the
recommendations of the Independent Auditors and management’s response and
subsequent follow-up to any identified
weaknesses.
|
|
|
g.
|
The
Committee shall provide oversight to related party transactions entered
into by the Company.
|
|
|
h.
|
The
Committee shall satisfy itself that adequate procedures are in place for
the review of the Company’s public disclosure of financial information
derived or extracted from the Company’s financial statements and
periodically assess the adequacy of those
procedures.
|
|
|
2.
|
Independent
Auditors
|
|
|
a.
|
The
Committee shall be directly responsible for the selection, appointment,
compensation and oversight of the Independent Auditors and the Independent
Auditors shall report directly to the
Committee.
|
|
|
b.
|
The
Committee shall pre-approve all audit and non-audit services not
prohibited by law to be provided by the Independent Auditors to the
Company or its subsidiaries.
|
|
|
c.
|
The
Committee shall monitor and assess the relationship between management and
the Independent Auditors and monitor, confirm, support and assure the
independence and objectivity of the Independent Auditors. The
Committee shall establish procedures to receive and respond to complaints
with respect to accounting, internal accounting controls and auditing
matters.
|
|
|
d.
|
The
Committee shall review the Independent Auditor’s audit plan, including
scope, procedures and timing of the
audit.
|
|
|
e.
|
The
Committee shall review the results of the annual audit with the
Independent Auditors, including matters related to the conduct of the
audit.
|
|
|
f.
|
The
Committee shall obtain timely reports from the Independent Auditors
describing critical accounting policies and practices, alternative
treatments of information within GAAP that were discussed with management,
their ramifications, and the Independent Auditors’ preferred treatment and
material written communications between the Company and the Independent
Auditors.
|
|
|
g.
|
The
Committee shall review fees paid by the Company to the Independent
Auditors and other professionals in respect of audit and non-audit
services on an annual basis.
|
|
|
3.
|
Whistleblower
|
|
|
The
Committee shall oversee the following procedures for the receipt,
retention and treatment of complaints, including confidential or anonymous
employee complaints, with respect to accounting, internal accounting
controls and auditing matters.
|
|
|
a.
|
The
Company will promptly forward to the Committee any complaints that it has
received regarding financial statement disclosures, accounting, internal
accounting controls or auditing
matters.
|
96
|
|
b.
|
Any
employee of the Company or any of its subsidiaries may submit, on a
confidential and anonymous basis if the employee so desires, any concerns
regarding financial statement disclosures, accounting, internal accounting
controls or auditing matters. All such concerns will be set
forth in writing and forwarded in a sealed envelope addressed to the
attention of the chairman of the Audit Committee, c/o the Company’s United
States general legal counsel at the address set forth at the Company’s
website, in an envelope labeled with a legend such as: “To be opened by
the Audit Committee only. Submitted pursuant to the Jaguar
Mining Inc. Whistleblower Policy.” If an employee would like to
discuss any matter with the Committee, the employee should indicate this
in the submission and include a telephone number at which he or she can be
reached, should the Committee deem such communication is
appropriate.
|
|
|
c.
|
Following
the receipt of any complaints submitted, the Committee will investigate
each matter so reported and take such corrective and disciplinary actions,
if any, as it considers
appropriate.
|
|
|
d.
|
The
Committee may enlist employees of the Company and/or outside legal,
accounting or other advisors, as appropriate, to conduct any investigation
of complaints regarding financial statement disclosures, accounting,
internal accounting controls or auditing matters. In conducting
any investigation, the Committee shall use reasonable efforts to protect
the confidentiality and anonymity of the
complainant.
|
|
|
e.
|
It
is the policy of the Company that employees will not be discharged,
demoted, suspended, threatened, harassed or in any other manner
discriminated against as a result of any complaint made hereunder in good
faith.
|
|
|
f.
|
The
Company shall make this policy available to all
employees.
|
|
|
g.
|
The
Committee will retain as a part of its records any such complaints or
concerns for a period of at least seven (7)
years.
|
|
|
4.
|
Review
of Charter and Self-Assessment
|
|
|
a.
|
The
Committee shall review and reassess annually the adequacy of this
Charter.
|
b. The
Committee shall review annually the Committee’s own performance.
|
|
5.
|
Other
Responsibilities
|
The
Committee shall perform any other activities consistent with this Charter and
governing law, as the Committee or the Board deems necessary or
appropriate.
97