Please wait

Exhibit (c)(11)


LOGO

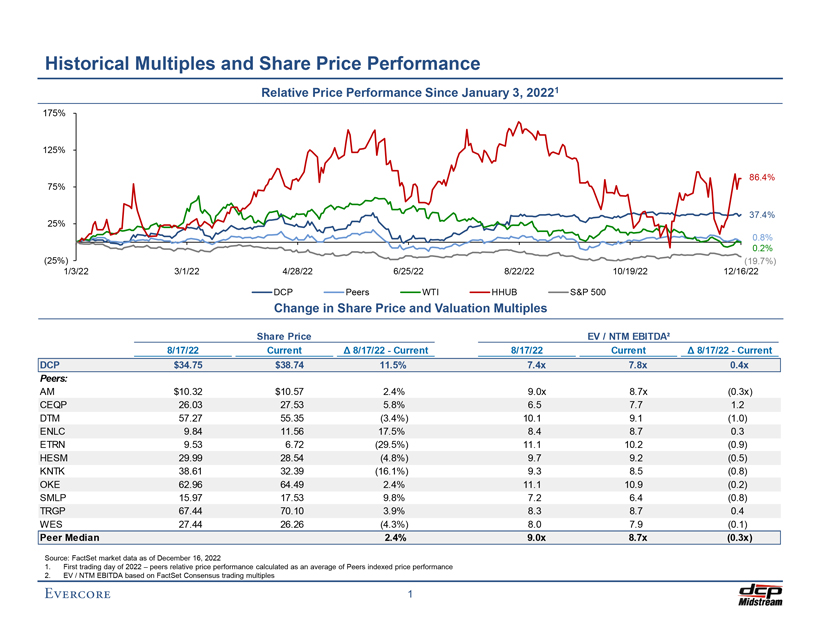
Preliminary Draft – Confidential Historical Multiples and Share Price Performance Relative Price Performance Since January 3, 20221 175% 125% 86.4% 75% 37.4% 25% 0.8% 0.2% (25%) (19.7%) 1/3/22 3/1/22 4/28/22 6/25/22 8/22/22 10/19/22 12/16/22 DCP Peers WTI HHUB S&P 500 Change in Share Price and Valuation Multiples Share Price EV / NTM EBITDA² 8/17/22 Current Ä 8/17/22—Current 8/17/22 Current Ä 8/17/22—Current DCP $34.75 $38.74 11.5% 7.4x 7.8x 0.4x Peers: AM $10.32 $10.57 2.4% 9.0x 8.7x (0.3x) CEQP 26.03 27.53 5.8% 6.5 7.7 1.2 DTM 57.27 55.35 (3.4%) 10.1 9.1 (1.0) ENLC 9.84 11.56 17.5% 8.4 8.7 0.3 ETRN 9.53 6.72 (29.5%) 11.1 10.2 (0.9) HESM 29.99 28.54 (4.8%) 9.7 9.2 (0.5) KNTK 38.61 32.39 (16.1%) 9.3 8.5 (0.8) OKE 62.96 64.49 2.4% 11.1 10.9 (0.2) SMLP 15.97 17.53 9.8% 7.2 6.4 (0.8) TRGP 67.44 70.10 3.9% 8.3 8.7 0.4 WES 27.44 26.26 (4.3%) 8.0 7.9 (0.1) Peer Median 2.4% 9.0x 8.7x (0.3x) Source: FactSet market data as of December 16, 2022 1. First trading day of 2022 – peers relative price performance calculated as an average of Peers indexed price performance 2. EV / NTM EBITDA based on FactSet Consensus trading multiples 1


LOGO

Preliminary Draft – Confidential Historical Commodity Prices Historical Pricing of NGLs vs. Crude Oil since announcement Commodity Prices Since August 17, 2022 $1.20 $120.00 $1.00 $100.00 $0.80 $80.00 (16.2%) (35.9%) Bl) $ /Gal) (31.0%) /B ( $0.60 $60.00 ( $ NGLs WTI    $0.40 $40.00 (38.0%) $0.20 $20.00 $—$ -8/17/22 9/6/22 9/26/22 10/16/22 11/5/22 11/25/22 12/16/22 Ethane Propane NGL Composite Historical WTI WTI is down by 16.2% and NGL Composite is down by 31.0% since announcement Source: FactSet data as of December 16, 2022 2


LOGO

Preliminary Draft – Confidential Analysis at Various Prices For Reference Only Implied Premium to: EV / EBITDA1 Implied Premium to: August 17 10-Day 20-Day 30-Day December 16 DCP Price Price VWAP2 of VWAP2 of VWAP2 of Price Offer per Unit $34.75 $34.46 $33.88 $32.49 2022E 2023E $38.74 Initial Offer $34.75 —% 0.8% 2.6% 7.0% 7.4x 7.6x (10.3%) 35.00 0.7% 1.6% 3.3% 7.7% 7.4 7.6 (9.7%) 36.00 3.6% 4.5% 6.3% 10.8% 7.5 7.8 (7.1%) 37.00 6.5% 7.4% 9.2% 13.9% 7.7 7.9 (4.5%) 38.00 9.4% 10.3% 12.2% 17.0% 7.8 8.0 (1.9%) 2nd Offer 38.25 10.1% 11.0% 12.9% 17.7% 7.8 8.1 (1.3%) 39.00 12.2% 13.2% 15.1% 20.0% 7.9 8.1 0.7% 3rd Offer 39.25 12.9% 13.9% 15.9% 20.8% 7.9 8.2 1.3% 4th Offer 39.75 14.4% 15.4% 17.3% 22.3% 8.0 8.2 2.6% 40.00 15.1% 16.1% 18.1% 23.1% 8.0 8.3 3.3% Current Offer 40.50 16.5% 17.5% 19.5% 24.7% 8.1 8.3 4.5% 41.00 18.0% 19.0% 21.0% 26.2% 8.1 8.4 5.8% 42.00 20.9% 21.9% 24.0% 29.3% 8.3 8.5 8.4% 43.00 23.7% 24.8% 26.9% 32.3% 8.4 8.6 11.0% 44.00 26.6% 27.7% 29.9% 35.4% 8.5 8.8 13.6% SC 4th Counter 44.75 28.8% 29.9% 32.1% 37.7% 8.6 8.9 15.5% 45.00 29.5% 30.6% 32.8% 38.5% 8.6 8.9 16.2% 46.00 32.4% 33.5% 35.8% 41.6% 8.7 9.0 18.7% SC 3rd Counter 46.25 33.1% 34.2% 36.5% 42.4% 8.8 9.0 19.4% 47.00 35.3% 36.4% 38.7% 44.7% 8.9 9.1 21.3% SC 2nd Counter 47.25 36.0% 37.1% 39.5% 45.4% 8.9 9.2 22.0% 48.00 38.1% 39.3% 41.7% 47.7% 9.0 9.3 23.9% SC 1st Counter 49.00 41.0% 42.2% 44.6% 50.8% 9.1 9.4 26.5% Source: DCP filings, FactSet; as of December 16, 2022 1. EBITDA based on the DCP Financial Projections; Enterprise Value assumes balance sheet items as of December 31, 2022 per management model 2. Based on August 17, 2022 unaffected price date 3