Exhibit (c)(12)
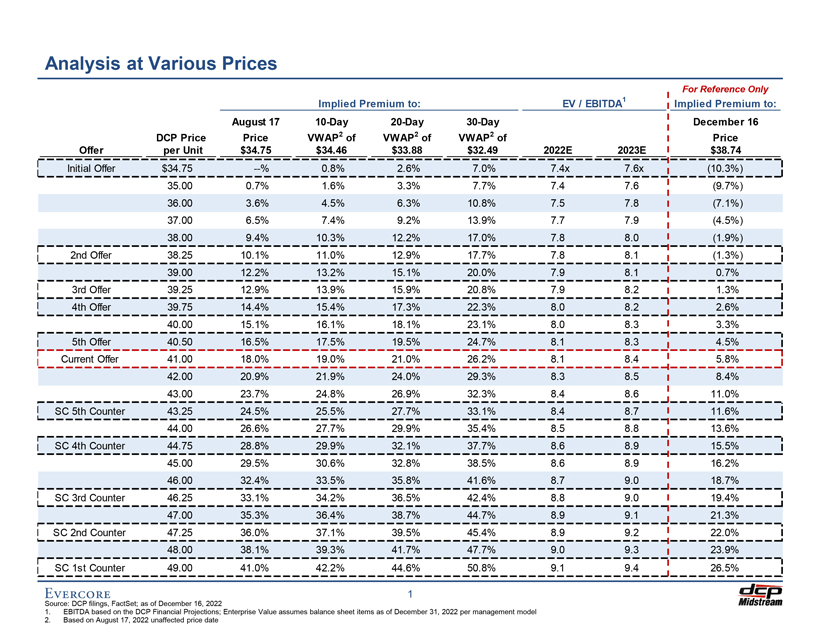
Exhibit (c)(12) Preliminary Draft – Confidential Analysis at Various Prices For Reference Only Implied Premium to: EV / EBITDA1 Implied Premium to: August 17 10-Day 20-Day 30-Day December 16 DCP Price Price VWAP2 of VWAP2 of VWAP2 of Price Offer per Unit $34.75 $34.46 $33.88 $32.49 2022E 2023E $38.74 Initial Offer $34.75 —% 0.8% 2.6% 7.0% 7.4x 7.6x (10.3%) 35.00 0.7% 1.6% 3.3% 7.7% 7.4 7.6 (9.7%) 36.00 3.6% 4.5% 6.3% 10.8% 7.5 7.8 (7.1%) 37.00 6.5% 7.4% 9.2% 13.9% 7.7 7.9 (4.5%) 38.00 9.4% 10.3% 12.2% 17.0% 7.8 8.0 (1.9%) 2nd Offer 38.25 10.1% 11.0% 12.9% 17.7% 7.8 8.1 (1.3%) 39.00 12.2% 13.2% 15.1% 20.0% 7.9 8.1 0.7% 3rd Offer 39.25 12.9% 13.9% 15.9% 20.8% 7.9 8.2 1.3% 4th Offer 39.75 14.4% 15.4% 17.3% 22.3% 8.0 8.2 2.6% 40.00 15.1% 16.1% 18.1% 23.1% 8.0 8.3 3.3% 5th Offer 40.50 16.5% 17.5% 19.5% 24.7% 8.1 8.3 4.5% Current Offer 41.00 18.0% 19.0% 21.0% 26.2% 8.1 8.4 5.8% 42.00 20.9% 21.9% 24.0% 29.3% 8.3 8.5 8.4% 43.00 23.7% 24.8% 26.9% 32.3% 8.4 8.6 11.0% SC 5th Counter 43.25 24.5% 25.5% 27.7% 33.1% 8.4 8.7 11.6% 44.00 26.6% 27.7% 29.9% 35.4% 8.5 8.8 13.6% SC 4th Counter 44.75 28.8% 29.9% 32.1% 37.7% 8.6 8.9 15.5% 45.00 29.5% 30.6% 32.8% 38.5% 8.6 8.9 16.2% 46.00 32.4% 33.5% 35.8% 41.6% 8.7 9.0 18.7% SC 3rd Counter 46.25 33.1% 34.2% 36.5% 42.4% 8.8 9.0 19.4% 47.00 35.3% 36.4% 38.7% 44.7% 8.9 9.1 21.3% SC 2nd Counter 47.25 36.0% 37.1% 39.5% 45.4% 8.9 9.2 22.0% 48.00 38.1% 39.3% 41.7% 47.7% 9.0 9.3 23.9% SC 1st Counter 49.00 41.0% 42.2% 44.6% 50.8% 9.1 9.4 26.5% 1 Source: DCP filings, FactSet; as of December 16, 2022 1. EBITDA based on the DCP Financial Projections; Enterprise Value assumes balance sheet items as of December 31, 2022 per management model 2. Based on August 17, 2022 unaffected price date
Preliminary Draft – Confidential Preliminary Valuation of the Common Units Preliminary Valuation Summary For Reference Only Discounted Peer Group Discounted Cash Flow Analysis Distributions Trading Analysis MLP Analyst Analysis Precedent M&A Premiums Price Transaction Analysis Paid Targets Market Price/DCF Exit Multiple Perpetuity Grow th CAPM EV/EBITDA Return per LP Unit $65.00 $61.07 Implied range based on 5% $55.00 annual $53.18 $52.70 $51.96 distribution $50.33 $49.58 growth $50.20 $48.61 $48.61 $48.61 through $45.33 2027E1 $45.91 $45.77 $44.37 $44.33 $45.00 $45.00 $43.31 $44.05 $44.86 $41.61 $38.33 $42.24 $37.84 $38.44 $37.36 $39.96 $38.00 $35.00 $34.93 $36.05 $35.15 $32.22 $34.86 $34.59 $33.35 $33.27 $33.27 $29.52 $33.56 $32.13 $28.75 $32.28 $32.28 $32.28 $27.68 $29.71 $24.22 $25.00 $27.11 Price as of 12/16/22: $38.74 $25.10 Proposed Consideration: $41.00 $19.79 $18.84 $15.00 $16.31 $15.98 $5.00 4.0%—5.0% 7.0%—8.0% WACC Terminal Yield 8.0x—9.0x 6.5x—7.5x Merger 2023E EBITDA 2023E DCF/LP Unit Premium 9.0%—11.0%—Analyst 7.25x—9.25x Selected 11.0% 13.0% Price 8.0x—9.0x 0.5%—1.5% 2022E EBITDA Range: Equity Equity Targets Exit Multiple Perpetuity Grow th Rate 8.0x—9.0x 6.0x—7.0x 15.0%—Cost of Cost of 2024E EBITDA 2024E DCF/LP Unit 30.0% Capital Capital Sensitivity Case B – Sensitivity Case C – Sensitivity Case C –DCP Financial Projections NYMEX Strip Pricing Case Higher Commodity Prices Lower Commodity Prices 1. For reference only: sensitivity case using a 5% annual distribution growth rate which assumes lower than the commodity super cycle board assumption of 7.5% growth and management 0% growth scenarios 2
Preliminary Draft – Confidential Appendix
Preliminary Draft – Confidential Historical Multiples and Share Price Performance Relative Price Performance Since January 3, 20221 175% 125% 86.4% 75% 37.4% 25% 0.8% 0.2% (25%) (19.7%) 1/3/22 3/1/22 4/28/22 6/25/22 8/22/22 10/19/22 12/16/22 DCP Peers WTI HHUB S&P 500 Change in Share Price and Valuation Multiples Share Price EV / NTM EBITDA² 8/17/22 Current Δ 8/17/22—Current 8/17/22 Current Δ 8/17/22—Current DCP $34.75 $38.74 11.5% 7.4x 7.8x 0.3x Peers: AM $10.32 $10.57 2.4% 9.0x 9.0x (0.0x) CEQP 26.03 27.53 5.8% 6.5 8.2 1.6 DTM 57.27 55.35 (3.4%) 10.1 9.8 (0.3) ENLC 9.84 11.56 17.5% 8.4 8.7 0.3 ETRN 9.53 6.72 (29.5%) 11.1 9.8 (1.3) HESM 29.99 28.54 (4.8%) 9.7 9.2 (0.5) KNTK 38.61 32.39 (16.1%) 9.3 8.9 (0.4) OKE 62.96 64.49 2.4% 11.1 10.6 (0.4) SMLP 15.97 17.53 9.8% 7.2 6.4 (0.8) TRGP 67.44 70.10 3.9% 8.3 8.8 0.5 WES 27.44 26.26 (4.3%) 8.0 7.8 (0.2) Peer Median 2.4% 9.0x 8.9x (0.3x) Source: FactSet market data as of December 16, 2022 1. First trading day of 2022 – peers relative price performance calculated as an average of Peers indexed price performance 2. EV / NTM EBITDA based on FactSet Consensus trading multiples 3
Preliminary Draft – Confidential Preliminary Valuation of the Common Units Peer Group Trading Analysis ($ in millions, except per unit/share amounts) Price/DCF Price Equity Enterprise Enterprise Value/EBITDA / CAFD per Share Distribution Yield Dist. Net Debt / Parthership / Company 12/16/22 Value Value 2023E 2024E 2023E 2024E Current 2023E Growth 2023E EBITDA Gathering & Processing MLPs/Companies Antero Midstream Corporation $10.57 $5,114 $8,484 8.9x 8.5x 8.8x 7.9x 8.5% 8.5% NM 3.5x Crestwood Equity Partners LP 27.53 2,964 7,368 8.1 7.7 4.9 4.6 9.5% 9.5% 3.7% 3.7 DT Midstream, Inc. 55.35 5,423 8,825 9.7 9.2 9.1 8.6 4.6% 4.9% 6.9% 3.6 EnLink Midstream, LLC 11.56 5,600 11,795 8.7 8.5 5.5 5.3 3.9% 4.3% 10.0% 3.4 Equitrans Midstream Corporation 6.72 2,940 10,384 9.8 9.1 5.3 4.9 8.9% 8.9% 0.8% 6.0 Hess Midstream Partners LP 28.54 6,849 9,756 9.4 8.9 7.9 7.5 7.9% 8.3% 4.0% 2.8 Kinetik Holdings Inc. 32.39 4,449 7,888 8.8 7.9 6.1 5.4 9.3% 9.7% 4.3% 3.8 ONEOK, Inc. 64.49 28,937 41,791 10.5 10.2 11.8 11.2 5.8% 5.8% 4.0% 3.2 Summit Midstream Partners, LP 17.53 184 1,916 6.4 6.2 NM NM —% —% NM 5.1 Targa Resources Corp. 70.10 16,188 29,540 8.8 8.5 6.8 6.5 2.0% 2.4% 10.0% 3.3 Western Midstream Partners, LP 26.26 10,414 17,222 7.8 7.5 6.9 6.3 7.6% 7.6% 10.9% 3.0 Mean 8.8x 8.4x 7.3x 6.8x 6.2% 6.4% 6.1% 3.8x Median 8.8 8.5 6.8 6.4 7.6% 7.6% 4.3% 3.5 DCP Midstream, LP (Consensus)1 $38.74 $8,097 $13,613 7.8x 8.2x 6.3x 6.7x 4.4% 4.7% 3.1% 2.7x DCP Midstream, LP (DCP Financial Projections)1 $38.74 $8,097 $13,613 8.0x 8.6x 6.5x 7.0x 4.4% 4.4% —% 3.0x Source: Company filings, FactSet, Wall Street Research; as of December 16, 2022 1. Balance sheet data as of September 30, 2022 4
Preliminary Draft – Confidential Weighted Average Cost of Capital Analysis DCP Common Units – Capital Asset Pricing Model ($ in millions, except per unit/share amounts) Unit/Share Price Market Equity Total Debt and Total Debt / Adjusted Unlevered 12/16/22 Value Preferred Equity Capitalization Beta 1 2 Partnership/Corporation Total Beta Antero Midstream Corporation $10.57 $5,114 $3,370 39.7% 0.79 0.52 Crestwood Equity Partners LP 27.53 2,964 4,182 58.5% 0.62 0.31 EnLink Midstream, LLC 11.56 5,600 4,579 45.0% 0.98 0.60 Equitrans Midstream Corporation 6.72 2,940 7,014 70.5% 0.94 0.33 Hess Midstream Partners LP 28.54 6,849 2,909 29.8% 0.75 0.58 Kinetik Holdings Inc. 32.39 4,449 3,448 43.7% 0.73 0.45 CAPM ONEOK, Inc. 64.49 28,937 12,876 30.8% 1.04 0.77 Summit Midstream Partners, LP 17.53 184 1,728 90.4% 0.90 0.12 Targa Resources Corp. 70.10 16,188 11,198 40.9% 0.92 0.60 Western Midstream Partners, LP 26.26 10,414 7,095 40.5% 0.89 0.60 Mean 49.0% 0.86 0.49 Median 42.3% 0.90 0.55 DCP Midstream, LP $38.74 $8,097 $5,584 40.8% 0.72 0.49 Risk-free Rate 3 3.7% Unlevered Beta 0.49 Debt and Preferred / Total Capitalization 40.8% Adjusted Levered Equity Beta 0.72 DCP Midstream Cost of Debt7 Supply-Side MRP Historical MRP WACC Market Risk Premium (“MRP”) 4 6.2% 7.5% Yield-to-Worst Small Company Risk Premium 5 0.7% DCP Midstream 5.600% Senior Notes Due 2044 5.81% Equity Cost of Capital 6 8.9% 9.8% U.S. Treasury Note Due 2042 3.73% Pre-Tax Cost of Debt 7 5.5% Less: U.S. Treasury Note Due 2044 4.08% After-Tax Cost of Debt 8 3.8% (0.35%) WACC 6.9% 7.4% DCP Midstream Implied 20-Year Cost of Debt 5.47% Equity Cost of Capital Sensitivity WACC Sensitivity (Supply-Side / Historical) (Supply-Side / Historical) Debt and Preferred / Total Capitalization Debt and Preferred / Total Capitalization 45.0% 50.0% 55.0% 60.0% 65.0% 45.0% 50.0% 55.0% 60.0% 65.0% ed 0.45 6.6% / 7.1% 6.5% / 7.0% 6.5% / 6.9% 6.4% / 6.8% 6.3% / 6.8%ed 0.45 8.9% / 9.7% 9.2% / 10.2% 9.6% / 10.7% 10.2% / 11.3% 10.9% / 12.2% r 0.50 6.9% / 7.4% 6.8% / 7.3% 6.7% / 7.2% 6.6% / 7.2% 6.6% / 7.1% r 0.50 9.3% / 10.3% 9.7% / 10.8% 10.2% / 11.4% 10.8% / 12.1% 11.6% / 13.0% Beta 0.55 7.1% / 7.7% 7.1% / 7.6% 7.0% / 7.5% 6.9% / 7.5% 6.8% / 7.4% Beta 0.55 9.8% / 10.9% 10.3% / 11.4% 10.8% / 12.1% 11.5% / 12.9% 12.3% / 13.9% nleve U 0.60 7.4% / 8.1% 7.3% / 8.0% 7.2% / 7.9% 7.2% / 7.8% 7.1% / 7.7% nleve U 0.60 10.3% / 11.5% 10.8% / 12.1% 11.4% / 12.8% 12.1% / 13.6% 13.1% / 14.8% 0.65 7.7% / 8.4% 7.6% / 8.3% 7.5% / 8.2% 7.4% / 8.1% 7.3% / 8.0% 0.65 10.8% / 12.1% 11.3% / 12.7% 12.0% / 13.5% 12.8% / 14.4% 13.8% / 15.6% 1. Source: Predicted raw betas from FactSet; Adjusted Equity Beta calculated as: (0.67) × Raw Beta +(0.33) × 1.0 2. Unlevered Beta calculated as: Adjusted Equity Beta × (E/(E + D × (1-T)); Assumes corporate tax rate of 29.6% for partnerships and 21.0% for corporations 3. 20-year Treasury as of December 16, 2022 4. Source: Duff & Phelps 5. Decile: Mid Cap (5) with equity value range of $6,743.4 million to $13,177.8 million 6. Equity Cost of Capital calculated as: Risk-free rate + (Levered Equity Beta × Market Risk Premium) + Small Company Risk Premium 7. Implied DCP 20-year cost of debt based on the yield-to-worst of DCP’s 5.600% Senior Notes Due 2044 adjusted for 20-year maturity using the implied yield spread from relevant U.S. treasury notes 8. Assumes U.S. individual partnership income tax structure through 2025 of 80.0% of income taxable at highest tax rate of 37.0%, or 29.6% 5
Preliminary Draft – Confidential Weighted Average Cost of Capital Analysis DCP Common Units – Total Expected Market Return ($ in millions, except per unit/share amounts) Unit/Share Price Market Equity Distribution/Dividend Total Partnership/Corporation 12/16/22 Value Current Yield Growth Return Antero Midstream Corporation $10.57 $5,114 8.5% —% 8.5% Crestwood Equity Partners LP 27.53 2,964 9.5% 3.7% 13.2% EnLink Midstream, LLC 11.56 5,600 3.9% 10.0% 13.9% Equitrans Midstream Corporation 6.72 2,940 8.9% 0.8% 9.8% Total Hess Midstream Partners LP 28.54 6,849 7.9% 4.0% 11.9% Expected Kinetik Holdings Inc. 32.39 4,449 9.3% 4.3% 13.5% Market ONEOK, Inc. 64.49 28,937 5.8% 4.0% 9.8% Return Targa Resources Corp. 70.10 16,188 2.0% 10.0% 12.0% Western Midstream Partners, LP 26.26 10,414 7.6% 10.9% 18.6% Mean 12.4% Median 12.0% DCP Midstream, LP $38.74 $8,097 4.4% 3.1% 7.6% WACC Debt and Preferred / Total Capitalization 40.8% Market Required Equity Return 12.0% WACC Pre-Tax Cost of Debt1 5.5% After-Tax Cost of Debt2 3.8% DCP Cost of Debt1 WACC 8.7% Yield-to-Worst DCP Midstream 5.600% Senior Notes Due 2044 5.81% U.S. Treasury Note Due 2042 3.73% Less: U.S. Treasury Note Due 2044 4.08% (0.35%) DCP Midstream Implied 20-Year Cost of Debt 5.47% 1. Implied DCP 20-year cost of debt based on the yield-to-worst of DCP’s 5.600% Senior Notes Due 2044 Adjusted for 20-year maturity using the implied yield spread from relevant U.S. treasury notes 2. Assumes U.S. individual partnership income tax structure through 2025 of 80.0% of income taxable at highest tax rate of 37.0%, or 29.6% 6