Exhibit (c)(15)
Exhibit (c)(15) Confidential Reference Materials Project Dynamo August 30, 2022
Exhibit (c)(15)
Exhibit (c)(15) Confidential Reference Materials Project Dynamo August 30, 2022
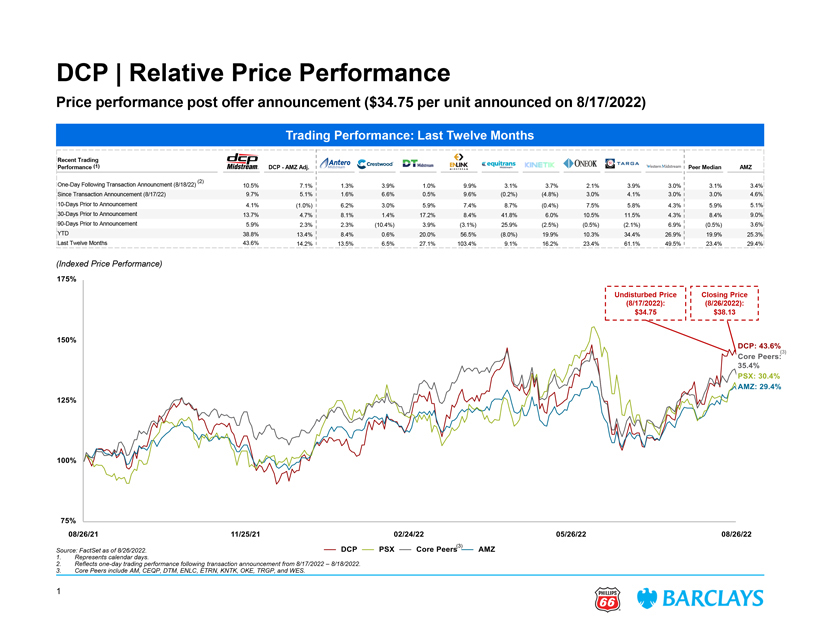
Confidential DCP | Relative Price Performance Price performance post offer announcement ($34.75 per unit announced on 8/17/2022) Trading Performance: Last Twelve Months Recent Trading Performance (1) DCP—AMZ Adj. Peer Median AMZ (2) One-Day Following Transaction Announcment (8/18/22) 10.5% 7.1% 1.3% 3.9% 1.0% 9.9% 3.1% 3.7% 2.1% 3.9% 3.0% 3.1% 3.4% Since Transaction Announcement (8/17/22) 9.7% 5.1% 1.6% 6.6% 0.5% 9.6% (0.2%) (4.8%) 3.0% 4.1% 3.0% 3.0% 4.6% 10-Days Prior to Announcement 4.1% (1.0%) 6.2% 3.0% 5.9% 7.4% 8.7% (0.4%) 7.5% 5.8% 4.3% 5.9% 5.1% 30-Days Prior to Announcement 13.7% 4.7% 8.1% 1.4% 17.2% 8.4% 41.8% 6.0% 10.5% 11.5% 4.3% 8.4% 9.0% 90-Days Prior to Announcement 5.9% 2.3% 2.3% (10.4%) 3.9% (3.1%) 25.9% (2.5%) (0.5%) (2.1%) 6.9% (0.5%) 3.6% YTD 38.8% 13.4% 8.4% 0.6% 20.0% 56.5% (8.0%) 19.9% 10.3% 34.4% 26.9% 19.9% 25.3% Last Twelve Months 43.6% 14.2% 13.5% 6.5% 27.1% 103.4% 9.1% 16.2% 23.4% 61.1% 49.5% 23.4% 29.4% (Indexed Price Performance) Undisturbed Price Closing Price (8/17/2022): (8/26/2022): $34.75 $38.13 (3) Source: FactSet as of 8/26/2022. (3) 1. Represents calendar days. 2. Reflects one-day trading performance following transaction announcement from 8/17/2022 – 8/18/2022. 3. Core Peers include AM, CEQP, DTM, ENLC, ETRN, KNTK, OKE, TRGP, and WES. 1
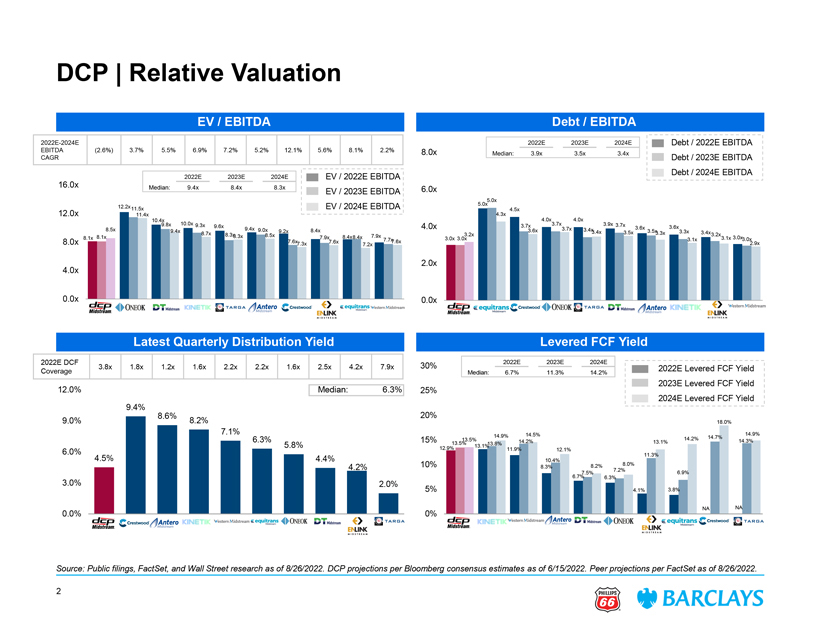
Confidential DCP | Relative Valuation EV / EBITDA Debt / EBITDA 2022E-2024E 2022E 2023E 2024E Debt / 2022E EBITDA EBITDA (2.6%) 3.7% 5.5% 6.9% 7.2% 5.2% 12.1% 5.6% 8.1% 2.2% 8.0x Median: 3.9x 3.5x 3.4x CAGR Debt / 2023E EBITDA Debt / 2024E EBITDA 2022E 2023E 2024E EV / 2022E EBITDA 16.0x Median: 9.4x 8.4x 8.3x EV / 2023E EBITDA 6.0x 5.0x 5.0x 12.2x11.5x EV / 2024E EBITDA 12.0x 4.3x 4.5x 11.4x 4.0x 4.0x 10.4x 9.8x 10.0x 9.3x 3.7x 3.9x 3.7x 9.6x 4.0x 3.7x 3.6x 3.6x 8.5x 9.4x 9.4x 9.0x 8.4x 3.6x 3.7x 3.4x 9.2x 3.4x 3.5x 3.5x 3.3x 3.3x 3.4x 8.7x 8.3x 8.5x 3.2x 3.2x 8.1x 8.1x 8.3x 7.9x 8.4x8.4x 7.9x 3.1x 3.0x 7.7x 3.0x 3.0x 3.1x 3.0x 8.0x 7.6x7.3x 7.6x 7.6x 2.9x 7.2x 4.0x 2.0x 0.0x 0.0x Latest Quarterly Distribution Yield Levered FCF Yield 2022E DCF 30% 2022E 2023E 2024E 3.8x 1.8x 1.2x 1.6x 2.2x 2.2x 1.6x 2.5x 4.2x 7.9x 2022E Levered FCF Yield Coverage Median: 6.7% 11.3% 14.2% 2023E Levered FCF Yield 12.0% Median: 6.3% 25% 2024E Levered FCF Yield 9.4% 8.6% 20% 9.0% 8.2% 18.0% 7.1% 14.5% 14.9% 14.9% 14.7% 6.3% 15% 13.5% 14.2% 13.5% 14.2% 13.1% 14.3% 5.8% 12.9% 13.1% 13.8% 6.0% 11.9% 12.1% 4.5% 11.3% 4.4% 10.4% 8.0% 4.2% 10% 8.3% 8.2% 7.2% 7.5% 6.9% 3.0% 6.7% 6.3% 2.0% 4.1% 3.8% 5% 0.0% 0% NA NA Public filings, FactSet, and Wall Street research as of 8/26/2022. DCP projections per Bloomberg consensus estimates as of 6/15/2022. Peer projections per FactSet as of 8/26/2022.
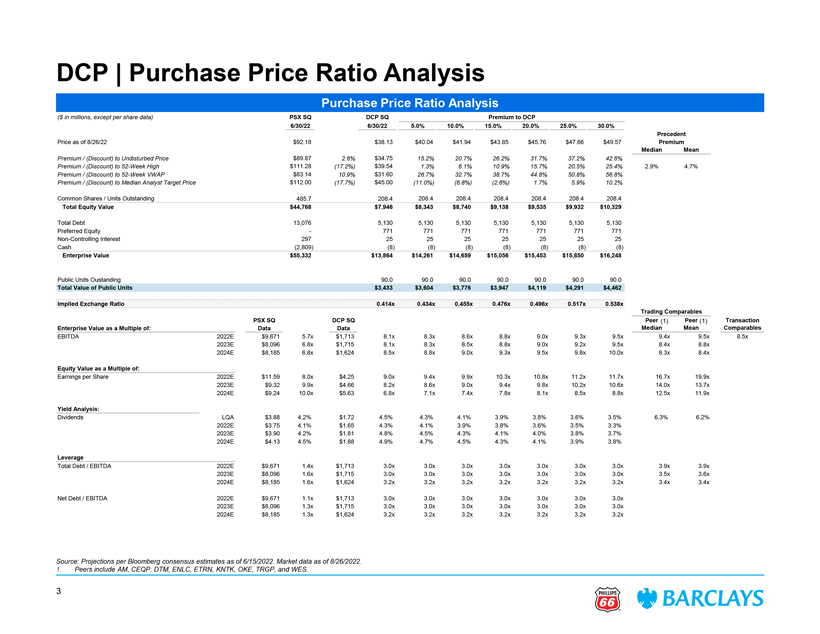
Confidential DCP | Purchase Price Ratio Analysis Purchase Price Ratio Analysis ($ in millions, except per share data) PSX SQ DCP SQ Premium to DCP 6/30/22 6/30/22 5.0% 10.0% 15.0% 20.0% 25.0% 30.0% Precedent Price as of 8/26/22 $92.18 $38.13 $40.04 $41.94 $43.85 $45.76 $47.66 $49.57 Premium Median Mean Premium / (Discount) to Undisturbed Price $89.87 2.6% $34.75 15.2% 20.7% 26.2% 31.7% 37.2% 42.6% Premium / (Discount) to 52-Week High $111.28 (17.2%) $39.54 1.3% 6.1% 10.9% 15.7% 20.5% 25.4% 2.9% 4.7% Premium / (Discount) to 52-Week VWAP $83.14 10.9% $31.60 26.7% 32.7% 38.7% 44.8% 50.8% 56.8% Premium / (Discount) to Median Analyst Target Price $112.00 (17.7%) $45.00 (11.0%) (6.8%) (2.6%) 1.7% 5.9% 10.2% Common Shares / Units Outstanding 485.7 208.4 208.4 208.4 208.4 208.4 208.4 208.4 Total Equity Value $44,768 $7,946 $8,343 $8,740 $9,138 $9,535 $9,932 $10,329 Total Debt 13,076 5,130 5,130 5,130 5,130 5,130 5,130 5,130 Preferred Equity—771 771 771 771 771 771 771 Non-Controlling Interest 297 25 25 25 25 25 25 25 Cash (2,809) (8) (8) (8) (8) (8) (8) (8) Enterprise Value $55,332 $13,864 $14,261 $14,659 $15,056 $15,453 $15,850 $16,248 Public Units Oustanding 90.0 90.0 90.0 90.0 90.0 90.0 90.0 Total Value of Public Units $3,433 $3,604 $3,776 $3,947 $4,119 $4,291 $4,462 Implied Exchange Ratio 0.414x 0.434x 0.455x 0.476x 0.496x 0.517x 0.538x Trading Comparables PSX SQ DCP SQ Peer (1) Peer (1) Transaction Enterprise Value as a Multiple of: Data Data Median Mean Comparables EBITDA 2022E $9,671 5.7x $1,713 8.1x 8.3x 8.6x 8.8x 9.0x 9.3x 9.5x 9.4x 9.5x 8.5x 2023E $8,096 6.8x $1,715 8.1x 8.3x 8.5x 8.8x 9.0x 9.2x 9.5x 8.4x 8.8x 2024E $8,185 6.8x $1,624 8.5x 8.8x 9.0x 9.3x 9.5x 9.8x 10.0x 8.3x 8.4x Equity Value as a Multiple of: Earnings per Share 2022E $11.59 8.0x $4.25 9.0x 9.4x 9.9x 10.3x 10.8x 11.2x 11.7x 16.7x 19.9x 2023E $9.32 9.9x $4.66 8.2x 8.6x 9.0x 9.4x 9.8x 10.2x 10.6x 14.0x 13.7x 2024E $9.24 10.0x $5.63 6.8x 7.1x 7.4x 7.8x 8.1x 8.5x 8.8x 12.5x 11.9x Yield Analysis: Dividends LQA $3.88 4.2% $1.72 4.5% 4.3% 4.1% 3.9% 3.8% 3.6% 3.5% 6.3% 6.2% 2022E $3.75 4.1% $1.65 4.3% 4.1% 3.9% 3.8% 3.6% 3.5% 3.3% 2023E $3.90 4.2% $1.81 4.8% 4.5% 4.3% 4.1% 4.0% 3.8% 3.7% 2024E $4.13 4.5% $1.88 4.9% 4.7% 4.5% 4.3% 4.1% 3.9% 3.8% Leverage Total Debt / EBITDA 2022E $9,671 1.4x $1,713 3.0x 3.0x 3.0x 3.0x 3.0x 3.0x 3.0x 3.9x 3.9x 2023E $8,096 1.6x $1,715 3.0x 3.0x 3.0x 3.0x 3.0x 3.0x 3.0x 3.5x 3.6x 2024E $8,185 1.6x $1,624 3.2x 3.2x 3.2x 3.2x 3.2x 3.2x 3.2x 3.4x 3.4x Net Debt / EBITDA 2022E $9,671 1.1x $1,713 3.0x 3.0x 3.0x 3.0x 3.0x 3.0x 3.0x 2023E $8,096 1.3x $1,715 3.0x 3.0x 3.0x 3.0x 3.0x 3.0x 3.0x 2024E $8,185 1.3x $1,624 3.2x 3.2x 3.2x 3.2x 3.2x 3.2x 3.2x Source: Projections per Bloomberg consensus estimates as of 6/15/2022. Market data as of 8/26/2022. 1. Peers include AM, CEQP, DTM, ENLC, ETRN, KNTK, OKE, TRGP, and WES. 3
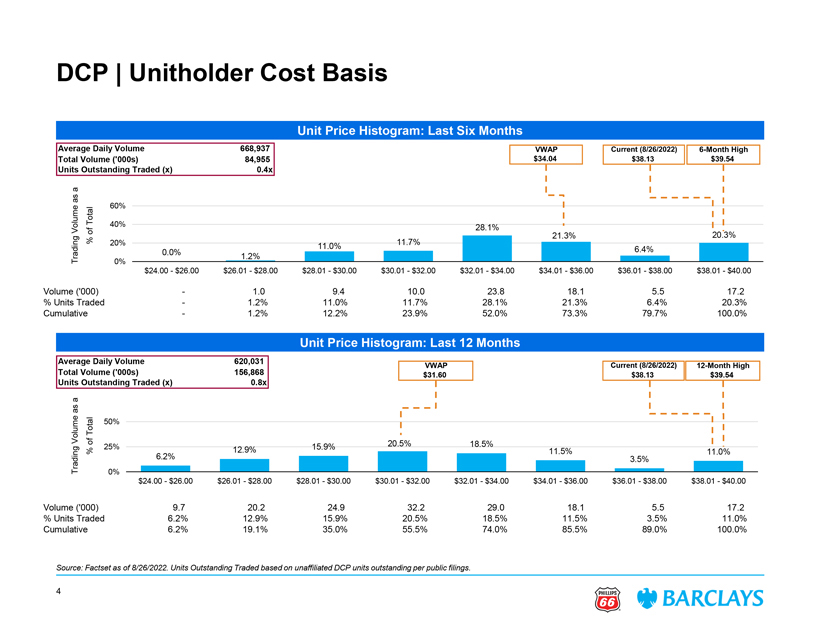
Confidential DCP | Unitholder Cost Basis Unit Price Histogram: Last Six Months Average Daily Volume 668,937 VWAP Current (8/26/2022) 6-Month High Total Volume (‘000s) 84,955 $34.04 $38.13 $39.54 Units Outstanding Traded (x) 0.4x a as 60% Total 40% Volume 28.1% of 21.3% 20.3% % 20% 11.7% 11.0% 6.4% 0.0% Trading 1.2% 0% $24.00—$26.00 $26.01—$28.00 $28.01—$30.00 $30.01—$32.00 $32.01—$34.00 $34.01—$36.00 $36.01—$38.00 $38.01—$40.00 Volume (‘000)—1.0 9.4 10.0 23.8 18.1 5.5 17.2 % Units Traded—1.2% 11.0% 11.7% 28.1% 21.3% 6.4% 20.3% Cumulative—1.2% 12.2% 23.9% 52.0% 73.3% 79.7% 100.0% Unit Price Histogram: Last 12 Months Average Daily Volume 620,031 Total Volume (‘000s) 156,868 VWAP Current (8/26/2022) 12-Month High Units Outstanding Traded (x) 0.8x $31.60 $38.13 $39.54 a as Total 50% Volume of 25% 15.9% 20.5% 18.5% % 12.9% 11.5% 11.0% Trading 6.2% 3.5% 0% $24.00—$26.00 $26.01—$28.00 $28.01—$30.00 $30.01—$32.00 $32.01—$34.00 $34.01—$36.00 $36.01—$38.00 $38.01—$40.00 Volume (‘000) 9.7 20.2 24.9 32.2 29.0 18.1 5.5 17.2 % Units Traded 6.2% 12.9% 15.9% 20.5% 18.5% 11.5% 3.5% 11.0% Cumulative 6.2% 19.1% 35.0% 55.5% 74.0% 85.5% 89.0% 100.0% Source: Factset as of 8/26/2022. Units Outstanding Traded based on unaffiliated DCP units outstanding per public filings. 4
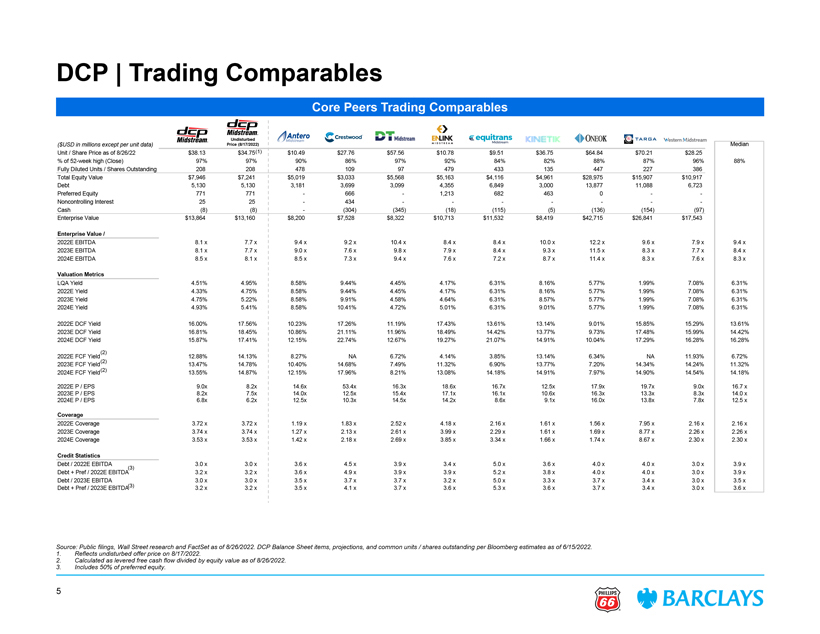
Confidential DCP | Trading Comparables Core Peers Trading Comparables Undisturbed ($USD in millions except per unit data) Price (8/17/2022) Median Unit / Share Price as of 8/26/22 $38.13 $34.75(1) $10.49 $27.76 $57.56 $10.78 $9.51 $36.75 $64.84 $70.21 $28.25 % of 52-week high (Close) 97% 97% 90% 86% 97% 92% 84% 82% 88% 87% 96% 88% Fully Diluted Units / Shares Outstanding 208 208 478 109 97 479 433 135 447 227 386 Total Equity Value $7,946 $7,241 $5,019 $3,033 $5,568 $5,163 $4,116 $4,961 $28,975 $15,907 $10,917 Debt 5,130 5,130 3,181 3,699 3,099 4,355 6,849 3,000 13,877 11,088 6,723 Preferred Equity 771 771 — 666 — 1,213 682 463 0 — -Noncontrolling Interest 25 25 — 434 — — — — — — -Cash (8) (8) — (304) (345) (18) (115) (5) (136) (154) (97) Enterprise Value $13,864 $13,160 $8,200 $7,528 $8,322 $10,713 $11,532 $8,419 $42,715 $26,841 $17,543 Enterprise Value / 2022E EBITDA 8.1 x 7.7 x 9.4 x 9.2 x 10.4 x 8.4 x 8.4 x 10.0 x 12.2 x 9.6 x 7.9 x 9.4 x 2023E EBITDA 8.1 x 7.7 x 9.0 x 7.6 x 9.8 x 7.9 x 8.4 x 9.3 x 11.5 x 8.3 x 7.7 x 8.4 x 2024E EBITDA 8.5 x 8.1 x 8.5 x 7.3 x 9.4 x 7.6 x 7.2 x 8.7 x 11.4 x 8.3 x 7.6 x 8.3 x Valuation Metrics LQA Yield 4.51% 4.95% 8.58% 9.44% 4.45% 4.17% 6.31% 8.16% 5.77% 1.99% 7.08% 6.31% 2022E Yield 4.33% 4.75% 8.58% 9.44% 4.45% 4.17% 6.31% 8.16% 5.77% 1.99% 7.08% 6.31% 2023E Yield 4.75% 5.22% 8.58% 9.91% 4.58% 4.64% 6.31% 8.57% 5.77% 1.99% 7.08% 6.31% 2024E Yield 4.93% 5.41% 8.58% 10.41% 4.72% 5.01% 6.31% 9.01% 5.77% 1.99% 7.08% 6.31% 2022E DCF Yield 16.00% 17.56% 10.23% 17.26% 11.19% 17.43% 13.61% 13.14% 9.01% 15.85% 15.29% 13.61% 2023E DCF Yield 16.81% 18.45% 10.86% 21.11% 11.96% 18.49% 14.42% 13.77% 9.73% 17.48% 15.99% 14.42% 2024E DCF Yield 15.87% 17.41% 12.15% 22.74% 12.67% 19.27% 21.07% 14.91% 10.04% 17.29% 16.28% 16.28% (2) 2022E FCF Yield(2) 12.88% 14.13% 8.27% NA 6.72% 4.14% 3.85% 13.14% 6.34% NA 11.93% 6.72% 2023E FCF Yield 13.47% 14.78% 10.40% 14.68% 7.49% 11.32% 6.90% 13.77% 7.20% 14.34% 14.24% 11.32% (2) 2024E FCF Yield 13.55% 14.87% 12.15% 17.96% 8.21% 13.08% 14.18% 14.91% 7.97% 14.90% 14.54% 14.18% 2022E P / EPS 9.0x 8.2x 14.6x 53.4x 16.3x 18.6x 16.7x 12.5x 17.9x 19.7x 9.0x 16.7 x 2023E P / EPS 8.2x 7.5x 14.0x 12.5x 15.4x 17.1x 16.1x 10.6x 16.3x 13.3x 8.3x 14.0 x 2024E P / EPS 6.8x 6.2x 12.5x 10.3x 14.5x 14.2x 8.6x 9.1x 16.0x 13.8x 7.8x 12.5 x Coverage 2022E Coverage 3.72 x 3.72 x 1.19 x 1.83 x 2.52 x 4.18 x 2.16 x 1.61 x 1.56 x 7.95 x 2.16 x 2.16 x 2023E Coverage 3.74 x 3.74 x 1.27 x 2.13 x 2.61 x 3.99 x 2.29 x 1.61 x 1.69 x 8.77 x 2.26 x 2.26 x 2024E Coverage 3.53 x 3.53 x 1.42 x 2.18 x 2.69 x 3.85 x 3.34 x 1.66 x 1.74 x 8.67 x 2.30 x 2.30 x Credit Statistics Debt / 2022E EBITDA 3.0 x 3.0 x 3.6 x 4.5 x 3.9 x 3.4 x 5.0 x 3.6 x 4.0 x 4.0 x 3.0 x 3.9 x Debt + Pref / 2022E EBITDA(3) 3.2 x 3.2 x 3.6 x 4.9 x 3.9 x 3.9 x 5.2 x 3.8 x 4.0 x 4.0 x 3.0 x 3.9 x Debt / 2023E EBITDA (3) 3.0 x 3.0 x 3.5 x 3.7 x 3.7 x 3.2 x 5.0 x 3.3 x 3.7 x 3.4 x 3.0 x 3.5 x Debt + Pref / 2023E EBITDA 3.2 x 3.2 x 3.5 x 4.1 x 3.7 x 3.6 x 5.3 x 3.6 x 3.7 x 3.4 x 3.0 x 3.6 x lic filings, Wall Street research and FactSet as of 8/26/2022. DCP Balance Sheet items, projections, and common units / shares outstanding per Bloomberg estimates as of 6/15/2022. eflects undisturbed offer price on 8/17/2022. lated as levered free cash flow divided by equity value as of 8/26/2022. es 50% of preferred equity.
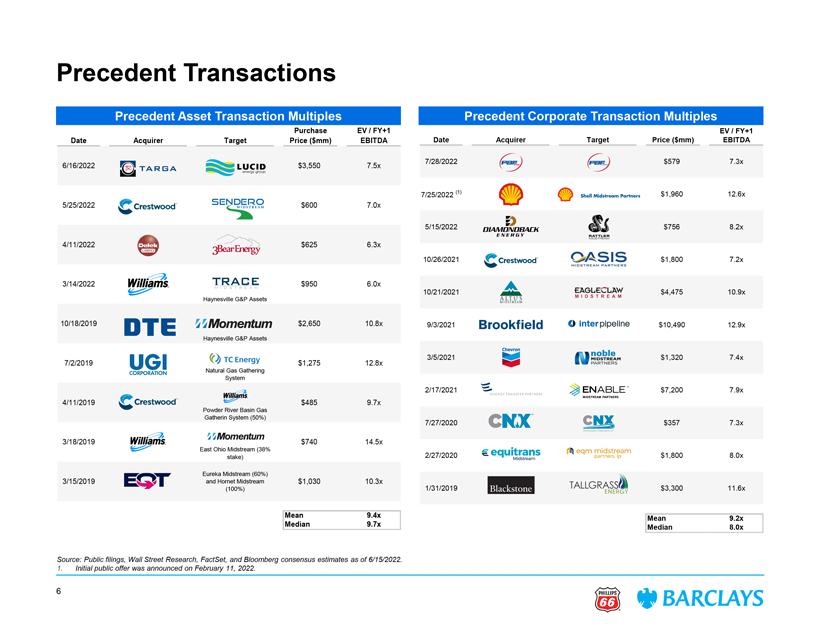
Confidential Precedent Transactions Precedent Asset Transaction Multiples Precedent Corporate Transaction Multiples Purchase EV / FY+1 EV / FY+1 Date Acquirer Target Price ($mm) EBITDA Date Acquirer Target Price ($mm) EBITDA 7/28/2022 $579 7.3x 6/16/2022 $3,550 7.5x 7/25/2022 (1) $1,960 12.6x 5/25/2022 $600 7.0x 5/15/2022 $756 8.2x 4/11/2022 $625 6.3x 10/26/2021 $1,800 7.2x $950 6.0x 10/21/2021 $4,475 10.9x 2,650 10.8x 9/3/2021 $10,490 12.9x 3/5/2021 $1,320 7.4x 1,275 12.8x 2/17/2021 $7,200 7.9x $485 9.7x 7/27/2020 $357 7.3x $740 14.5x 2/27/2020 $1,800 8.0x 1,030 10.3x 1/31/2019 $3,300 11.6x 9.4x Mean 9.2x 9.7x Median 8.0x Source: Public filings, Wall Street Research, FactSet, and Bloomberg consensus estimates as of 6/15/2022. 1. Initial public offer was announced on February 11, 2022. 6
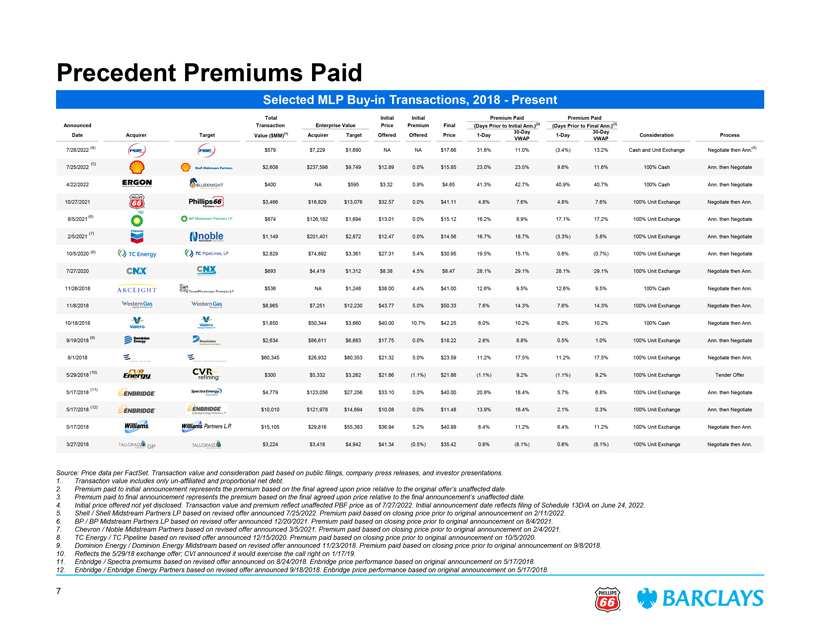
Confidential Precedent Premiums Paid Selected MLP Buy-in Transactions, 2018—Present Total Initial Initial Premium Paid Premium Paid Announced Transaction Enterprise Value Price Premium Final (Days Prior to Initial Ann.)(2) (Days Prior to Final Ann.)(3) (1) 30-Day 30-Day Date Acquirer Target Value ($MM) Acquirer Target Offered Offered Price 1-Day 1-Day Consideration Process VWAP VWAP (4) (4) 7/28/2022 $579 $7,229 $1,690 NA NA $17.66 31.6% 11.0% (3.4%) 13.2% Cash and Unit Exchange Negotiate then Ann. (5) 7/25/2022 $2,608 $237,598 $9,749 $12.89 0.0% $15.85 23.0% 23.5% 9.6% 11.6% 100% Cash Ann. then Negotiate 4/22/2022 $400 NA $595 $3.32 0.9% $4.65 41.3% 42.7% 40.9% 40.7% 100% Cash Ann. then Negotiate 10/27/2021 $3,466 $16,829 $13,076 $32.57 0.0% $41.11 4.8% 7.6% 4.8% 7.6% 100% Unit Exchange Negotiate then Ann. (6) 8/5/2021 $874 $126,182 $1,694 $13.01 0.0% $15.12 16.2% 8.9% 17.1% 17.2% 100% Unit Exchange Ann. then Negotiate (7) 2/5/2021 $1,149 $201,401 $2,872 $12.47 0.0% $14.56 16.7% 18.7% (3.3%) 5.8% 100% Unit Exchange Ann. then Negotiate 10/5/2020 (8) $2,829 $74,892 $3,361 $27.31 5.4% $30.95 19.5% 15.1% 0.6% (0.7%) 100% Unit Exchange Ann. then Negotiate 7/27/2020 $693 $4,419 $1,312 $8.38 4.5% $8.47 28.1% 29.1% 28.1% 29.1% 100% Unit Exchange Negotiate then Ann. 11/26/2018 $536 NA $1,246 $38.00 4.4% $41.00 12.6% 9.5% 12.6% 9.5% 100% Cash Negotiate then Ann. 11/8/2018 $8,965 $7,251 $12,230 $43.77 5.0% $50.33 7.6% 14.3% 7.6% 14.3% 100% Unit Exchange Negotiate then Ann. 10/18/2018 $1,850 $50,344 $3,660 $40.00 10.7% $42.25 6.0% 10.2% 6.0% 10.2% 100% Cash Negotiate then Ann. (9) 9/19/2018 $2,634 $86,611 $6,683 $17.75 0.0% $18.22 2.6% 8.8% 0.5% 1.0% 100% Unit Exchange Ann. then Negotiate 8/1/2018 $60,345 $26,932 $80,353 $21.32 5.0% $23.59 11.2% 17.5% 11.2% 17.5% 100% Unit Exchange Negotiate then Ann. (10) 5/29/2018 er (11) 5/17/2018 $ otiate (12) 5/17/2018 $10,010 $121,978 $14,694 otiate 5/17/2018 $15,105 $29,816 $55,383 $36.94 5.2% $40.89 6.4% 11.2% 6.4% 11.2% 100% Unit Exchange Negotiate then Ann. 3/27/2018 $3,224 $3,418 $4,942 $41.34 (0.5%) $35.42 0.6% (8.1%) 0.6% (8.1%) 100% Unit Exchange Negotiate then Ann. Source: Price data per FactSet. Transaction value and consideration paid based on public filings, company press releases, and investor presentations. 1. Transaction value includes only un-affiliated and proportional net debt. 2. Premium paid to initial announcement represents the premium based on the final agreed upon price relative to the original offer’s unaffected date. 3. Premium paid to final announcement represents the premium based on the final agreed upon price relative to the final announcement’s unaffected date. 4. Initial price offered not yet disclosed. Transaction value and premium reflect unaffected PBF price as of 7/27/2022. Initial announcement date reflects filing of Schedule 13D/A on June 24, 2022. dstream Partners LP based on revised offer announced 7/25/2022. Premium paid based on closing price prior to original announcement on 2/11/2022. dstream Partners LP based on revised offer announced 12/20/2021. Premium paid based on closing price prior to original announcement on 8/4/2021. Midstream Partners based on revised offer announced 3/5/2021. Premium paid based on closing price prior to original announcement on 2/4/2021. Pipeline based on revised offer announced 12/15/2020. Premium paid based on closing price prior to original announcement on 10/5/2020. / Dominion Energy Midstream based on revised offer announced 11/23/2018. Premium paid based on closing price prior to original announcement on 9/8/2018. CVI announced it would exercise the call right on 1/17/19. revised offer announced on 8/24/2018. Enbridge price performance based on original announcement on 5/17/2018. based on revised offer announced 9/18/2018. Enbridge price performance based on original announcement on 5/17/2018.
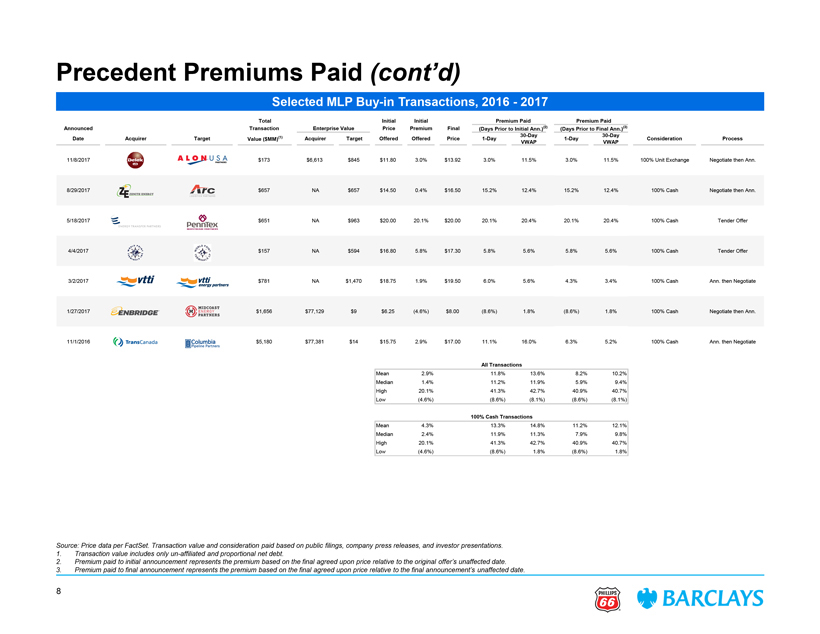
Confidential Precedent Premiums Paid (cont’d) Selected MLP Buy-in Transactions, 2016—2017 Total Initial Initial Premium Paid Premium Paid Announced Transaction Enterprise Value Price Premium Final (Days Prior to Initial Ann.)(2) (Days Prior to Final Ann.)(3) (1) 30-Day 30-Day Date Acquirer Target Value ($MM) Acquirer Target Offered Offered Price 1-Day 1-Day Consideration Process VWAP VWAP 11/8/2017 $173 $6,613 $845 $11.80 3.0% $13.92 3.0% 11.5% 3.0% 11.5% 100% Unit Exchange Negotiate then Ann. 8/29/2017 $657 NA $657 $14.50 0.4% $16.50 15.2% 12.4% 15.2% 12.4% 100% Cash Negotiate then Ann. 5/18/2017 $651 NA $963 $20.00 20.1% $20.00 20.1% 20.4% 20.1% 20.4% 100% Cash Tender Offer 4/4/2017 $157 NA $594 $16.80 5.8% $17.30 5.8% 5.6% 5.8% 5.6% 100% Cash Tender Offer 3/2/2017 $781 NA $1,470 $18.75 1.9% $19.50 6.0% 5.6% 4.3% 3.4% 100% Cash Ann. then Negotiate $9 $6.25 (4.6%) $8.00 (8.6%) 1.8% (8.6%) 1.8% 100% Cash Negotiate then Ann. $14 $15.75 2.9% $17.00 11.1% 16.0% 6.3% 5.2% 100% Cash Ann. then Negotiate All Transactions Mean 2.9% 11.8% 13.6% 8.2% 10.2% Median 1.4% 11.2% 11.9% 5.9% 9.4% High 20.1% 41.3% 42.7% 40.9% 40.7% Low (4.6%) (8.6%) (8.1%) (8.6%) (8.1%) 100% Cash Transactions Mean 4.3% 13.3% 14.8% 11.2% 12.1% Median 2.4% 11.9% 11.3% 7.9% 9.8% High 20.1% 41.3% 42.7% 40.9% 40.7% Low (4.6%) (8.6%) 1.8% (8.6%) 1.8% company press releases, and investor presentations. on price relative to the original offer’s unaffected date. on price relative to the final announcement’s unaffected date.
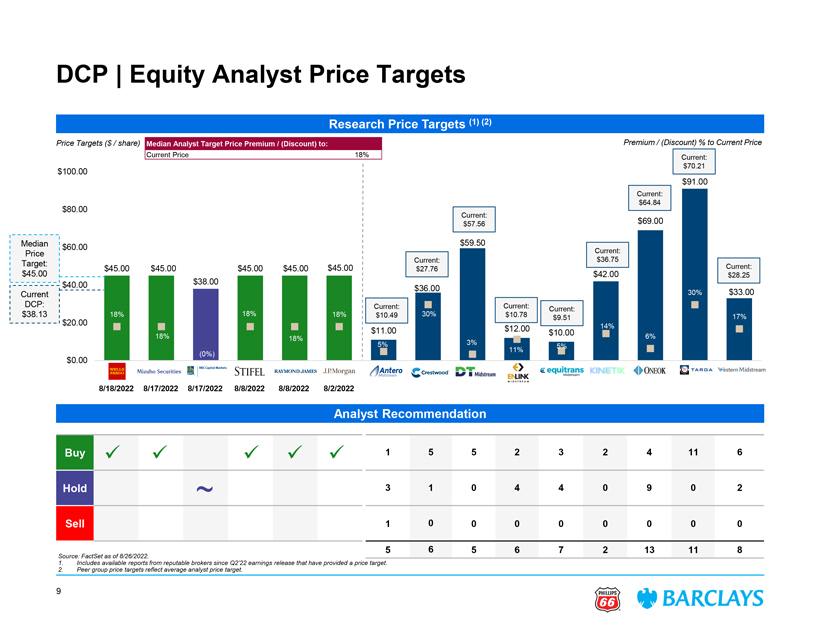
Confidential DCP | Equity Analyst Price Targets Research Price Targets (1) (2) Price Targets ($ / share) Median Analyst Target Price Premium / (Discount) to: Premium / (Discount) % to Current Price Current Price 18% Current: $70.21 $100.00 1 $91.00 0. Current: $80.00 $64.84 0. Current: $57.56 $69.00 0. Median $59.50 $60.00 0. Price Current: Current: $36.75 Target: Current: 0. $45.00 $45.00 $45.00 $45.00 $45.00 $27.76 $45.00 $42.00 $28.25 $40.00 $38.00 $36.00 0. Current 30% $33.00 DCP: Current: Current: 0. Current: $38.13 18% 18% 18% $10.49 30% $10.78 17% $9.51 $20.00 14% 0. $11.00 $12.00 $10.00 18% 18% 3% 6% 5% 0. 5% 11% (0%) $0.00 0 2 3 4 5 7 8 10 11 13 14 15 8/18/2022 8/17/2022 8/17/2022 8/8/2022 8/8/2022 8/2/2022 Analyst Recommendation Buy ✓ ✓ ✓ ✓ ✓ 1 5 5 2 3 2 4 11 6 Hold ~ 3 1 0 4 4 0 9 0 2 Sell 1 0 0 0 0 0 0 0 0 Source: FactSet as of 8/26/2022. 5 6 5 6 7 2 13 11 8 1. Includes available reports from reputable brokers since Q2’22 earnings release that have provided a price target. 2. Peer group price targets reflect average analyst price target. 9
Confidential Disclaimer This document has been prepared by Barclays Capital Inc. (“Barclays”) for information purposes only. This document is confidential and for the sole and exclusive benefit and internal use of the Recipient in connection with the matter or possible transaction to which this document relates, and no part of it may be reproduced, distributed or transmitted without the prior written permission of Barclays. This document is an indicative summary of the terms and conditions of the transaction described herein and may be amended, superseded or replaced by subsequent summaries. The final terms and conditions of the transaction will be set out in full in the applicable binding transaction document(s). This document is incomplete without reference to, and should be assessed solely in conjunction with, the oral briefing provided by Barclays. Neither Barclays nor any of its subsidiaries or affiliates shall be obliged by having made this document available to you to provide any financial advisory services (whether in relation to the matter or possible transaction to which this document relates or otherwise) or to sell, acquire, place or underwrite any securities or to lend moneys or to provide any other commitment, facility, product, risk management solution or service, nor does Barclays represent by providing this document to the Recipient that it will be possible for Barclays to provide, arrange or undertake any of the aforementioned services, activities, products or solutions. Any commitment by Barclays to provide, arrange or undertake any of the aforementioned services, activities, products or solutions would be subject to Barclays signing appropriate documentation, obtaining all necessary internal approvals and completing due diligence, in each case in a manner satisfactory to Barclays. This document was prepared on the basis of information and data, obtained from publicly available sources and, where applicable, from the Recipient and/or any other entity that may be involved in any transaction or matter contemplated by this document (and/or any of the Recipient’s or the aforementioned entities’ affiliates), in each case prior to or on the date hereof. Barclays makes no warranty or representation, express or implied, as to the accuracy or completeness of information which is contained in this document and which is stated to have been obtained from or is based upon trade and statistical services or other third party sources. The information in this document has not been independently verified by Barclays and Barclays does not assume any liability for any such information. Any data on past performance, modeling or back-testing contained herein is no indication as to future performance. No representation is made as to the reasonableness of the assumptions made within or the accuracy or completeness of any modeling or back-testing or any other information contained herein. All opinions and estimates are given as of the date hereof and are subject to change and Barclays assumes no obligation to update this document to reflect any such changes. The value of any investment may fluctuate as a result of market changes. The information herein is not intended to predict actual results and no assurances are given with respect thereto. Nothing herein shall be deemed to constitute investment, legal, tax, financial, accounting or other advice. The Recipient is responsible for making its own independent investigation and appraisal of the risks, benefits, appropriateness and suitability of any transaction or matter contemplated by this document and Barclays is not making any recommendation (personal or otherwise) or giving any investment advice and will have no liability with respect thereto. The decision to proceed with any transaction or action contemplated by this document must be made by the Recipient in the light of its own commercial assessments and Barclays will not be responsible for such assessments. Neither Barclays nor any of its subsidiaries or affiliates, nor any of their respective directors, officers, employees, advisors or other representatives (Barclays together with such persons being the “Barclays Group”) accepts any liability whatsoever for any direct, indirect or consequential losses (in contract, tort or otherwise) arising from the use of this document or its contents or any reliance on the information contained herein. Barclays Group is not responsible for any specialized advice (including financial, tax, legal and accounting, among other advice). This document does not constitute nor does it form part of an offer to sell or purchase, or the solicitation of an offer to sell or purchase, any securities or any of the businesses or assets described herein or an offer or recommendation to enter into any transaction described herein nor does this document constitute an offer or commitment to provide, arrange or underwrite any financing. Members of the Barclays Group are involved in a wide range of commercial banking, investment banking and other activities out of which conflicting interests or duties may arise. In the ordinary course of its business, the Barclays Group may provide services to any other entity or person whether or not a member of the same group as the Recipient (a “Third Party”), engage in any transaction (whether on its own account, on behalf of any Third Party or otherwise, and including any transaction or matter contemplated by this document), notwithstanding that such services, transactions or actions may be adverse to the Recipient or any member of the Recipient’s group, and the Barclays Group may retain for its own benefit any related remuneration or profit. The Barclays Group operates in accordance with a conflicts of interest policy which identifies conflicts of interest it faces in the ordinary course of its business, and establishes organisational and procedural measures to manage those conflicts where it is reasonably able to do so. Neither Barclays nor any other part of the Barclays Group shall have any duty to disclose to the Recipient or utilise for the Recipient’s benefit any non-public information acquired in the course of providing services to any other person, engaging in any transaction (on its own account or otherwise) or otherwise carrying on its business. The Barclays Group’s research analysts and research departments are independent from its banking business and are subject to certain regulations and internal policies. The Barclays Group’s research analysts may hold opinions and make statements or investment recommendations and/or publish research reports with respect to any company referred to herein, the transactions contemplated herein or any person or entity involved therein or related thereto that differ from or are inconsistent with the views or advice communicated by the Barclays Group’s banking business. Barclays is a full service securities firm and as such from time to time may effect transactions for its own account or the account of its clients and hold long or short positions in debt, equity or other securities of the companies referred to herein or in other financial products and instruments. Unless otherwise expressly agreed or provided for in other applicable Barclays disclosures governing such transactions or required by law or regulation, Barclays conducts these activities as principal and executes its principal transactions as an arm’s length counterparty. Barclays does not act as a fiduciary in relation to these transactions. THIS DOCUMENT DOES NOT DISCLOSE ALL THE RISKS AND OTHER SIGNIFICANT ISSUES RELATED TO AN INVESTMENT IN THE SECURITIES, FINANCIAL INSTRUMENTS OR TRANSACTIONS DESCRIBED HEREIN. PRIOR TO TRANSACTING, YOU SHOULD ENSURE THAT YOU FULLY UNDERSTAND THE TERMS OF THE TRANSACTION AND ANY APPLICABLE RISKS. The information contained herein is not intended to be distributed to any prospective or actual investors and, accordingly, may not be shown or given to any person other than the recipient, and is not to be forwarded to any other person (including any retail investor or customer), copied or otherwise reproduced or distributed to any such person in any manner whatsoever. FAILURE TO COMPLY WITH THIS DIRECTIVE CAN RESULT IN A VIOLATION OF THE SECURITIES ACT OF 1933, AS AMENDED. These materials have not been produced by the Barclays Group’s research department and do not constitute investment research or a research recommendation for the purposes of the Financial Conduct Authority rules or a research report under applicable U.S. law. Barclays Capital Inc. is the United States investment bank of Barclays Bank PLC. Barclays Bank PLC is authorised by the Prudential Regulation Authority and regulated by the Financial Conduct Authority and the Prudential Regulation Authority (Financial Services Register No. 122702). Registered in England. Registered No. 1026167. Registered office: 1 Churchill Place, London E14 5HP. Copyright Barclays Bank PLC, 2022 (all rights reserved). 10