Exhibit (c)(3)
Exhibit (c)(3)
Preliminary Draft – Confidential Discussion Materials Prepared for the Special Committee of the Board of Directors of DCP Midstream GP, LLC November 2, 2022
Exhibit (c)(3)
Exhibit (c)(3)
Preliminary Draft – Confidential Discussion Materials Prepared for the Special Committee of the Board of Directors of DCP Midstream GP, LLC November 2, 2022
Preliminary Draft – Confidential These materials have been prepared by Evercore Group L.L.C. (“Evercore”) for the Special Committee (the “Special Committee”) of the Board of Directors of DCP Midstream GP, LLC, the general partner of DCP Midstream, LP (“DCP” or the “Partnership”) to whom such materials are directly addressed and delivered and may not be used or relied upon for any purpose other than as specifically contemplated. These materials are based on information provided by or on behalf of the Partnership and/or other potential transaction participants, from public sources or otherwise reviewed by Evercore. Evercore assumes no responsibility for independent investigation or verification of such information and has relied on such information being complete and accurate in all material respects. To the extent such information includes estimates and forecasts of future financial performance prepared by or reviewed with the management of the Partnership and/or other potential transaction participants or obtained from public sources, Evercore has assumed that such estimates and forecasts have been reasonably prepared on bases reflecting the best currently available estimates and judgments of such management (or, with respect to estimates and forecasts obtained from public sources, represent reasonable estimates). No representation or warranty, express or implied, is made as to the accuracy or completeness of such information and nothing contained herein is, or shall be relied upon as, a representation, whether as to the past, the present or the future. These materials were designed for use by specific persons familiar with the business and affairs of the Partnership. These materials are not intended to provide the sole basis for evaluating, and should not be considered a recommendation with respect to, any transaction or other matter. These materials have been developed by and are proprietary to Evercore and were prepared exclusively for the benefit and internal use of the Special Committee. These materials were compiled on a confidential basis for use of the Special Committee in evaluating the potential transaction described herein and not with a view to public disclosure or filing thereof under state or federal securities laws, and may not be reproduced, disseminated, quoted or referred to, in whole or in part, without the prior written consent of Evercore. These materials do not constitute an offer or solicitation to sell or purchase any securities and are not a commitment by Evercore (or any affiliate) to provide or arrange any financing for any transaction or to purchase any security in connection therewith. Evercore assumes no obligation to update or otherwise revise these materials. These materials may not reflect information known to other professionals in other business areas of Evercore and its affiliates. Evercore and its affiliates do not provide legal, accounting or tax advice. Accordingly, any statements contained herein as to tax matters were neither written nor intended by Evercore or its affiliates to be used and cannot be used by any taxpayer for the purpose of avoiding tax penalties that may be imposed on such taxpayer. Each person should seek legal, accounting and tax advice based on his, her or its particular circumstances from independent advisors regarding the impact of the transactions or matters described herein.
Table of Contents Section Executive Summary I DCP Situation Analysis II LPG Market Overview III DCP Financial Projections IV Preliminary Valuation of the Common Units V Illustrative DCP Unitholder Tax Analysis VI Appendix A. Weighted Average Cost of Capital Analysis B. Supplemental Valuation Materials
Preliminary Draft – Confidential I. Executive Summary
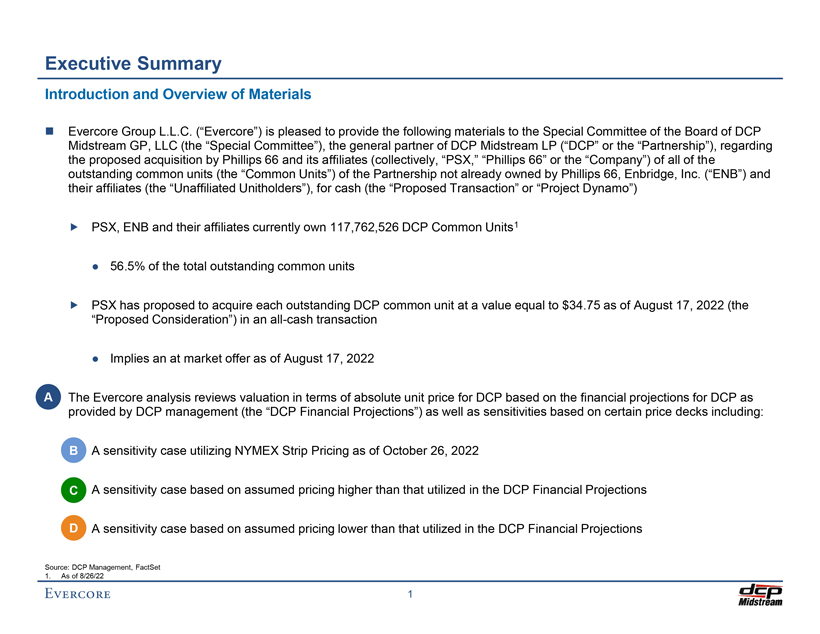
Preliminary Draft – Confidential Executive Summary Introduction and Overview of Materials â—¼ï€ Evercore Group L.L.C. (“Evercore”) is pleased to provide the following materials to the Special Committee of the Board of DCP Midstream GP, LLC (the “Special Committee”), the general partner of DCP Midstream LP (“DCP” or the “Partnership”), regarding the proposed acquisition by Phillips 66 and its affiliates (collectively, “PSX,” “Phillips 66” or the “Company”) of all of the outstanding common units (the “Common Units”) of the Partnership not already owned by Phillips 66, Enbridge, Inc. (“ENB”) and their affiliates (the “Unaffiliated Unitholders”), for cash (the “Proposed Transaction” or “Project Dynamo”) ï,„ï€ PSX, ENB and their affiliates currently own 117,762,526 DCP Common Units1 • 56.5% of the total outstanding common units ï,„ï€ PSX has proposed to acquire each outstanding DCP common unit at a value equal to $34.75 as of August 17, 2022 (the “Proposed Consideration”) in an all-cash transaction • Implies an at market offer as of August 17, 2022 A â—¼ï€ The Evercore analysis reviews valuation in terms of absolute unit price for DCP based on the financial projections for DCP as provided by DCP management (the “DCP Financial Projections”) as well as sensitivities based on certain price decks including: ï,„ï€ B A sensitivity case utilizing NYMEX Strip Pricing as of October 26, 2022 ï,„ï€ C A sensitivity case based on assumed pricing higher than that utilized in the DCP Financial Projections ï,„ï€ D A sensitivity case based on assumed pricing lower than that utilized in the DCP Financial Projections Source: DCP Management, FactSet 1. As of 8/26/22 1
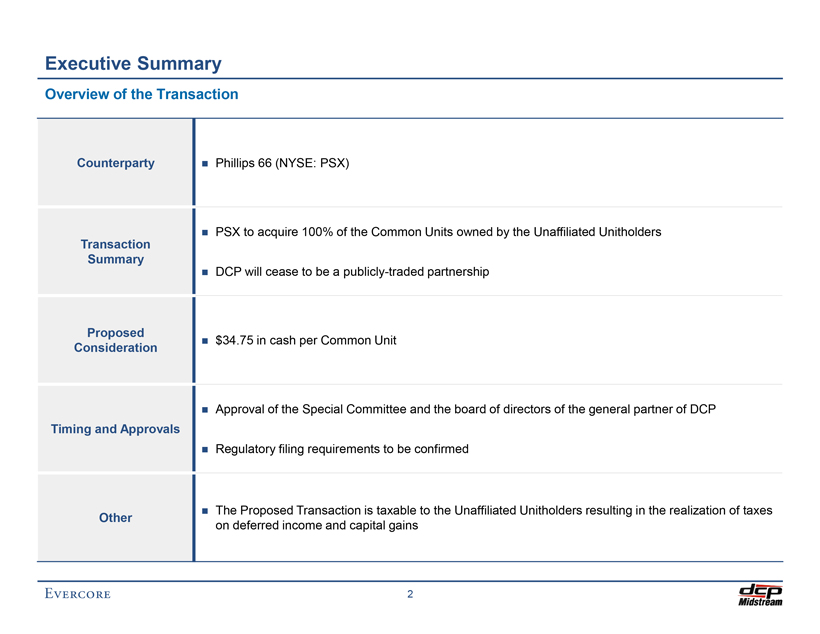
Pretiliminary Draft – Confidential Executive Summary Overview of the Transaction Counterparty â—¼ï€ Phillips 66 (NYSE: PSX) â—¼ï€ PSX to acquire 100% of the Common Units owned by the Unaffiliated Unitholders Transaction Summary â—¼ï€ DCP will cease to be a publicly-traded partnership Proposed â—¼ï€ $34.75 in cash per Common Unit Consideration â—¼ï€ Approval of the Special Committee and the board of directors of the general partner of DCP Timing and Approvals â—¼ï€ Regulatory filing requirements to be confirmed â—¼ï€ The Proposed Transaction is taxable to the Unaffiliated Unitholders resulting in the realization of taxes Other on deferred income and capital gains 2
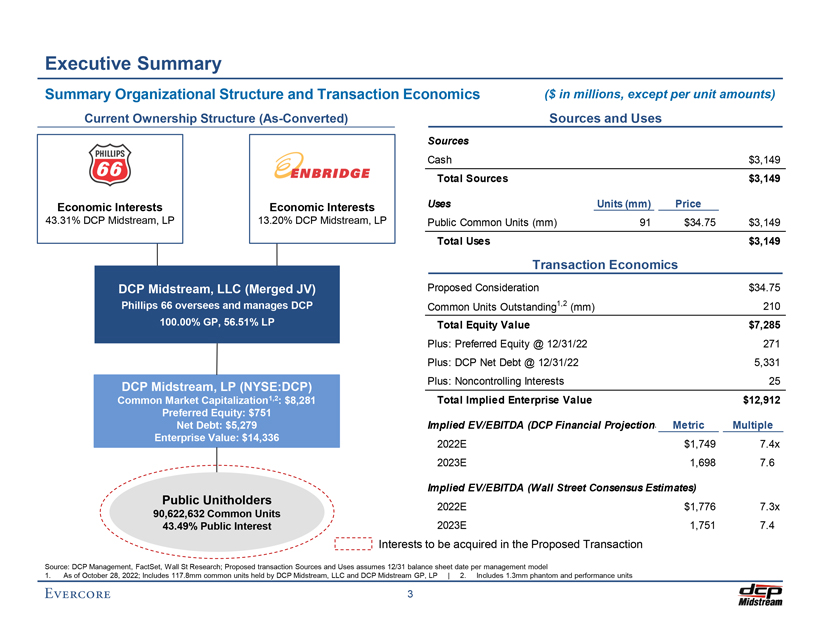
Preliminary Draft – Confidential Executive Summary Summary Organizational Structure and Transaction Economics ($ in millions, except per unit amounts) Current Ownership Structure (As-Converted) Sources and Uses Sources Cash $3,149 Total Sources $3,149 Economic Interests Economic Interests Uses Units (mm) Price 43.31% DCP Midstream, LP 13.20% DCP Midstream, LP Public Common Units (mm) 91 $34.75 $3,149 Total Uses $3,149 Transaction Economics DCP Midstream, LLC (Merged JV) Proposed Consideration $34.75 Phillips 66 oversees and manages DCP Common Units Outstanding1,2 (mm) 210 100.00% GP, 56.51% LP Total Equity Value $7,285 Plus: Preferred Equity @ 12/31/22 271 Plus: DCP Net Debt @ 12/31/22 5,331 DCP Midstream, LP (NYSE:DCP) Plus: Noncontrolling Interests 25 Common Market Capitalization1,2: $8,281 Total Implied Enterprise Value $12,912 Preferred Equity: $751 Net Debt: $5,279 Implied EV/EBITDA (DCP Financial Projection Metric Multiple Enterprise Value: $14,336 2022E $1,749 7.4x 2023E 1,698 7.6 Implied EV/EBITDA (Wall Street Consensus Estimates) Public Unitholders 2022E $1,776 7.3x 90,622,632 Common Units 43.49% Public Interest 2023E 1,751 7.4 Interests to be acquired in the Proposed Transaction Source: DCP Management, FactSet, Wall St Research; Proposed transaction Sources and Uses assumes 12/31 balance sheet date per management model 1. As of October 28, 2022; Includes 117.8mm common units held by DCP Midstream, LLC and DCP Midstream GP, LP | 2. Includes 1.3mm phantom and performance units 3
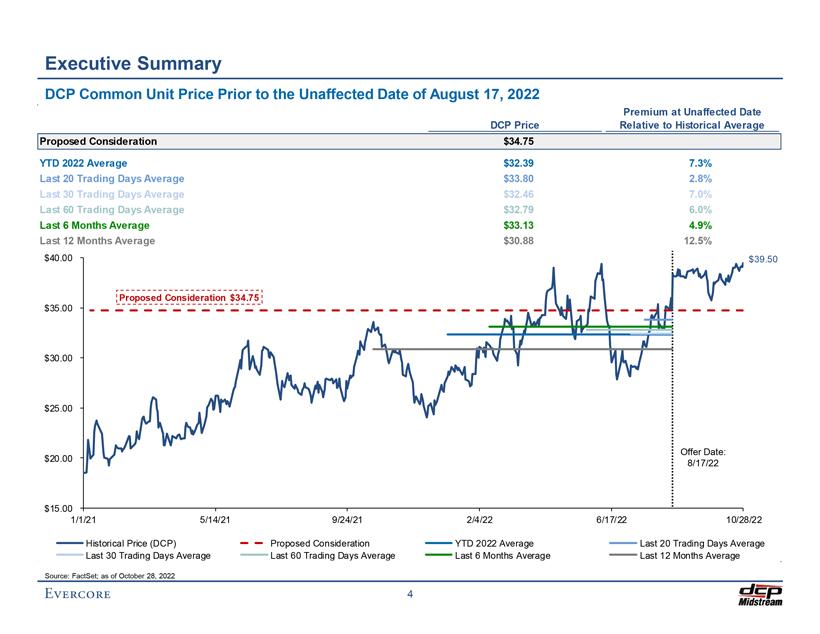
Preliminary Draft – Confidential Executive Summary DCP Common Unit Price Prior to the Unaffected Date of August 17, 2022 Premium at Unaffected Date DCP Price Relative to Historical Average Proposed Consideration $34.75 YTD 2022 Average $32.39 7.3% Last 20 Trading Days Average $33.80 2.8% Last 30 Trading Days Average $32.46 7.0% Last 60 Trading Days Average $32.79 6.0% Last 6 Months Average $33.13 4.9% Last 12 Months Average $30.88 12.5% $40.00 $39.50 Proposed Consideration $34.75 $35.00 $30.00 $25.00 Offer Date: $20.00 8/17/22 $15.00 1/1/21 5/14/21 9/24/21 2/4/22 6/17/22 10/28/22 Historical Price (DCP) Proposed Consideration YTD 2022 Average Last 20 Trading Days Average Last 30 Trading Days Average Last 60 Trading Days Average Last 6 Months Average Last 12 Months Average Source: FactSet; as of October 28, 2022 4
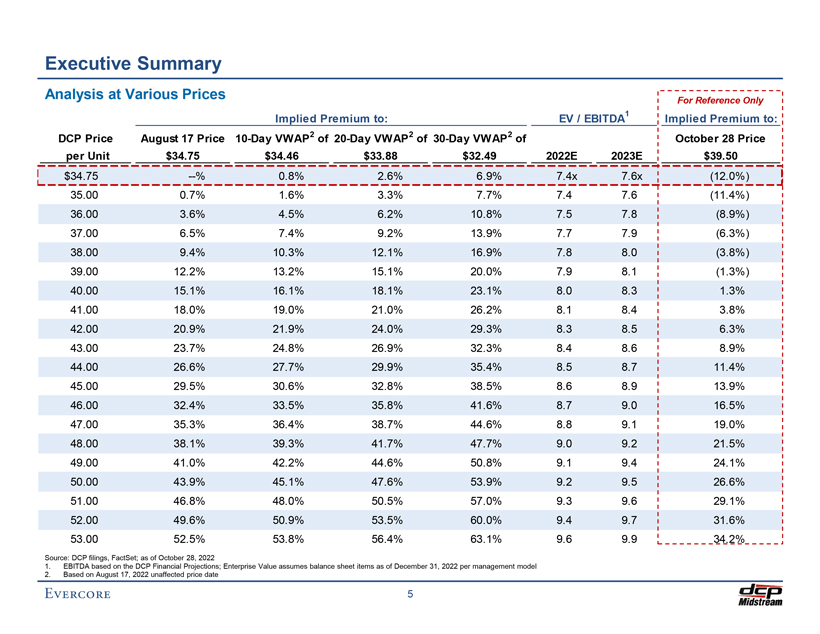
Preliminary Draft – Confidential Executive Summary Analysis at Various Prices For Reference Only Implied Premium to: EV / EBITDA1 Implied Premium to: DCP Price August 17 Price 10-Day VWAP2 of 20-Day VWAP2 of 30-Day VWAP2 of October 28 Price per Unit $34.75 $34.46 $33.88 $32.49 2022E 2023E $39.50 $34.75 —% 0.8% 2.6% 6.9% 7.4x 7.6x (12.0%) 35.00 0.7% 1.6% 3.3% 7.7% 7.4 7.6 (11.4%) 36.00 3.6% 4.5% 6.2% 10.8% 7.5 7.8 (8.9%) 37.00 6.5% 7.4% 9.2% 13.9% 7.7 7.9 (6.3%) 38.00 9.4% 10.3% 12.1% 16.9% 7.8 8.0 (3.8%) 39.00 12.2% 13.2% 15.1% 20.0% 7.9 8.1 (1.3%) 40.00 15.1% 16.1% 18.1% 23.1% 8.0 8.3 1.3% 41.00 18.0% 19.0% 21.0% 26.2% 8.1 8.4 3.8% 42.00 20.9% 21.9% 24.0% 29.3% 8.3 8.5 6.3% 43.00 23.7% 24.8% 26.9% 32.3% 8.4 8.6 8.9% 44.00 26.6% 27.7% 29.9% 35.4% 8.5 8.7 11.4% 45.00 29.5% 30.6% 32.8% 38.5% 8.6 8.9 13.9% 46.00 32.4% 33.5% 35.8% 41.6% 8.7 9.0 16.5% 47.00 35.3% 36.4% 38.7% 44.6% 8.8 9.1 19.0% 48.00 38.1% 39.3% 41.7% 47.7% 9.0 9.2 21.5% 49.00 41.0% 42.2% 44.6% 50.8% 9.1 9.4 24.1% 50.00 43.9% 45.1% 47.6% 53.9% 9.2 9.5 26.6% 51.00 46.8% 48.0% 50.5% 57.0% 9.3 9.6 29.1% 52.00 49.6% 50.9% 53.5% 60.0% 9.4 9.7 31.6% 53.00 52.5% 53.8% 56.4% 63.1% 9.6 9.9 34.2% Source: DCP filings, FactSet; as of October 28, 2022 1. EBITDA based on the DCP Financial Projections; Enterprise Value assumes balance sheet items as of December 31, 2022 per management model 2. Based on August 17, 2022 unaffected price date 5
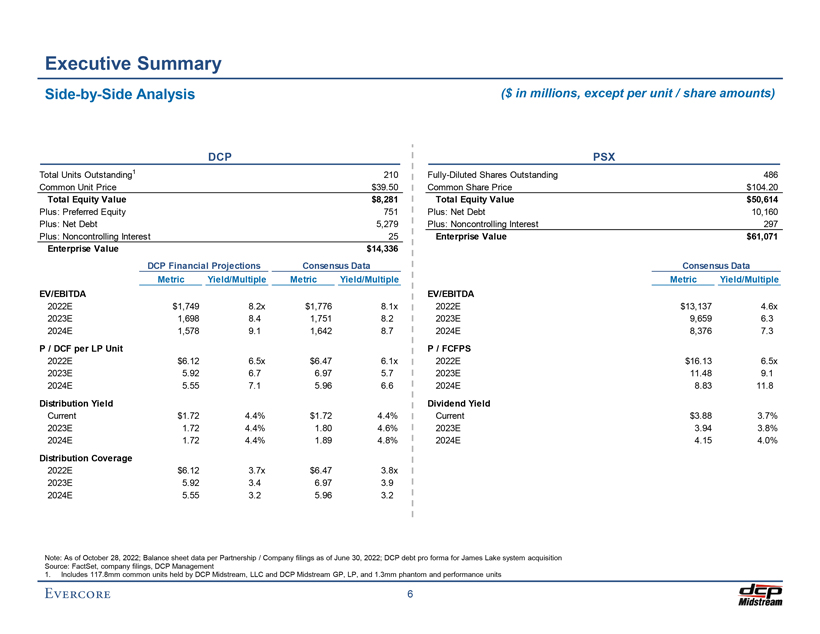
Preliminary Draft – Confidential Executive Summary Side-by-Side Analysis ($ in millions, except per unit / share amounts) DCP PSX Total Units Outstanding1 210 Fully-Diluted Shares Outstanding 486 Common Unit Price $39.50 Common Share Price $104.20 Total Equity Value $8,281 Total Equity Value $50,614 Plus: Preferred Equity 751 Plus: Net Debt 10,160 Plus: Net Debt 5,279 Plus: Noncontrolling Interest 297 Plus: Noncontrolling Interest 25 Enterprise Value $61,071 Enterprise Value $14,336 DCP Financial Projections Consensus Data Consensus Data Metric Yield/Multiple Metric Yield/Multiple Metric Yield/Multiple EV/EBITDA EV/EBITDA 2022E $1,749 8.2x $1,776 8.1x 2022E $13,137 4.6x 2023E 1,698 8.4 1,751 8.2 2023E 9,659 6.3 2024E 1,578 9.1 1,642 8.7 2024E 8,376 7.3 P / DCF per LP Unit P / FCFPS 2022E $6.12 6.5x $6.47 6.1x 2022E $16.13 6.5x 2023E 5.92 6.7 6.97 5.7 2023E 11.48 9.1 2024E 5.55 7.1 5.96 6.6 2024E 8.83 11.8 Distribution Yield Dividend Yield Current $1.72 4.4% $1.72 4.4% Current $3.88 3.7% 2023E 1.72 4.4% 1.80 4.6% 2023E 3.94 3.8% 2024E 1.72 4.4% 1.89 4.8% 2024E 4.15 4.0% Distribution Coverage 2022E $6.12 3.7x $6.47 3.8x 2023E 5.92 3.4 6.97 3.9 2024E 5.55 3.2 5.96 3.2 Note: As of October 28, 2022; Balance sheet data per Partnership / Company filings as of June 30, 2022; DCP debt pro forma for James Lake system acquisition Source: FactSet, company filings, DCP Management 1. Includes 117.8mm common units held by DCP Midstream, LLC and DCP Midstream GP, LP, and 1.3mm phantom and performance units 6
Preliminary Draft – Confidential II. DCP Situation Analysis
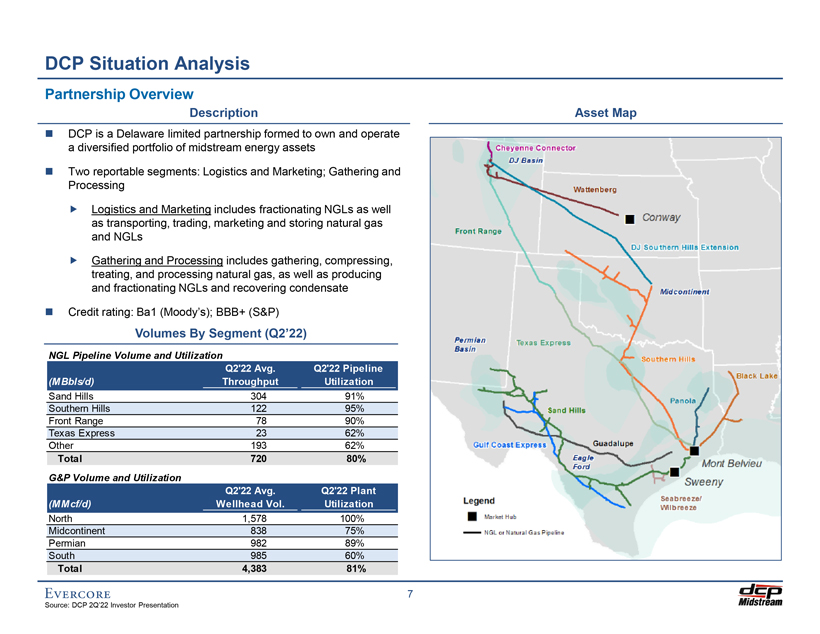
Preliminary Draft – Confidential DCP Situation Analysis Partnership Overview Description Asset Map â—¼ï€ DCP is a Delaware limited partnership formed to own and operate a diversified portfolio of midstream energy assets â—¼ï€ Two reportable segments: Logistics and Marketing; Gathering and Processing ï,„ï€ Logistics and Marketing includes fractionating NGLs as well as transporting, trading, marketing and storing natural gas and NGLs ï,„ï€ Gathering and Processing includes gathering, compressing, treating, and processing natural gas, as well as producing and fractionating NGLs and recovering condensate â—¼ï€ Credit rating: Ba1 (Moody’s); BBB+ (S&P) Volumes By Segment (Q2’22) NGL Pipeline Volume and Utilization Q2’22 Avg. Q2’22 Pipeline (MBbls/d) Throughput Utilization Sand Hills 304 91% Southern Hills 122 95% Front Range 78 90% Texas Express 23 62% Other 193 62% Total 720 80% G&P Volume and Utilization Q2’22 Avg. Q2’22 Plant (MMcf/d) Wellhead Vol. Utilization North 1,578 100% Midcontinent 838 75% Permian 982 89% South 985 60% Total 4,383 81% 7 Source: DCP 2Q’22 Investor Presentation
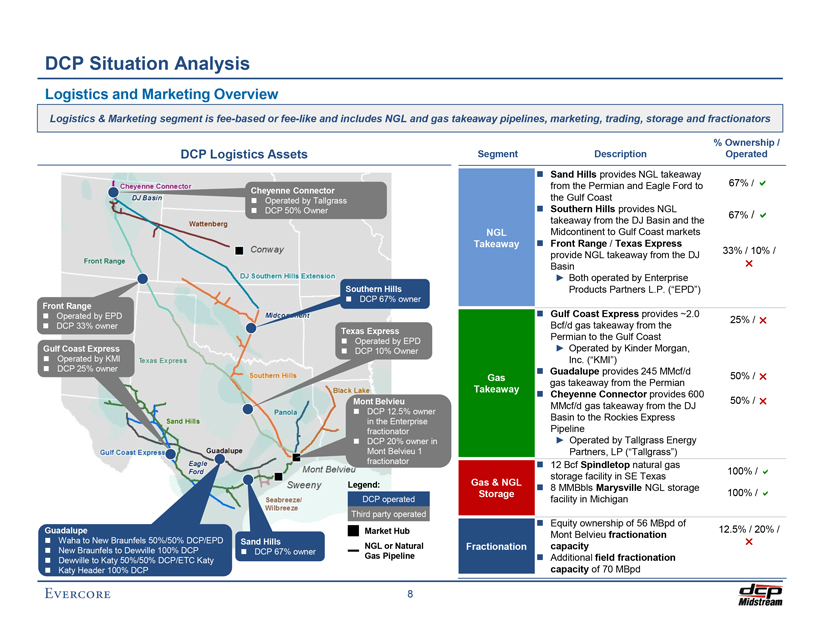
Preliminary Draft – Confidential DCP Situation Analysis Logistics and Marketing Overview Logistics & Marketing segment is fee-based or fee-like and includes NGL and gas takeaway pipelines, marketing, trading, storage and fractionators % Ownership / DCP Logistics Assets Segment Description Operated â—¼ï€ Sand Hills provides NGL takeaway / Cheyenne Connector from the Permian and Eagle Ford to 67% ï¡ â—¼ï€ Operated by Tallgrass the Gulf Coast â—¼ï€ DCP 50% Owner â—¼ï€ Southern Hills provides NGL 67% / ï¡ï€ takeaway from the DJ Basin and the NGL Midcontinent to Gulf Coast markets Takeaway â—¼ï€ Front Range / Texas Express provide NGL takeaway from the DJ 33% / 10% / Basinï² â–º Both operated by Enterprise Southern Hills Products Partners L.P. (“EPD”) Front Range â—¼ï€ DCP 67% owner â—¼ï€ Operated by EPD â—¼ï€ Gulf Coast Express provides ~2.0 25% / ï² â—¼ï€ DCP 33% owner Bcf/d gas takeaway from the Texas Express Permian to the Gulf Coast â—¼ï€ Operated by EPD Gulf Coast Express â—¼ï€ DCP 10% Owner â–º Operated by Kinder Morgan, â—¼ï€ Operated by KMI Inc. (“KMI”) â—¼ï€ DCP 25% owner â—¼ï€ Guadalupe provides 245 MMcf/d Gas 50% / ï²ï€ gas takeaway from the Permian Takeaway â—¼ï€ Cheyenne Connector provides 600 Mont Belvieu 50% / ï² MMcf/d gas takeaway from the DJ â—¼ï€ DCP 12.5% owner Basin to the Rockies Express in the Enterprise fractionator Pipeline â—¼ï€ DCP 20% owner in â–º Operated by Tallgrass Energy Mont Belvieu 1 Partners, LP (“Tallgrass”) fractionator â—¼ï€ 12 Bcf Spindletop natural gas 100% / ï¡ï€ storage facility in SE Texas Legend: Gas & NGL â—¼ï€ 8 MMBbls Marysville NGL storage Storage 100% / ï¡ DCP operated facility in Michigan Third party operated â—¼ï€ Equity ownership of 56 MBpd of Guadalupe Market Hub 12.5% / 20% / Mont Belvieu fractionation â—¼ï€ Waha to New Braunfels 50%/50% DCP/EPD Sand Hillsï²ï€ NGL or Natural Fractionation capacity â—¼ï€ New Braunfels to Dewville 100% DCP â—¼ï€ DCP 67% owner Gas Pipeline â—¼ï€ Additional field fractionation â—¼ï€ Dewville to Katy 50%/50% DCP/ETC Katy â—¼ï€ Katy Header 100% DCP capacity of 70 MBpd 8
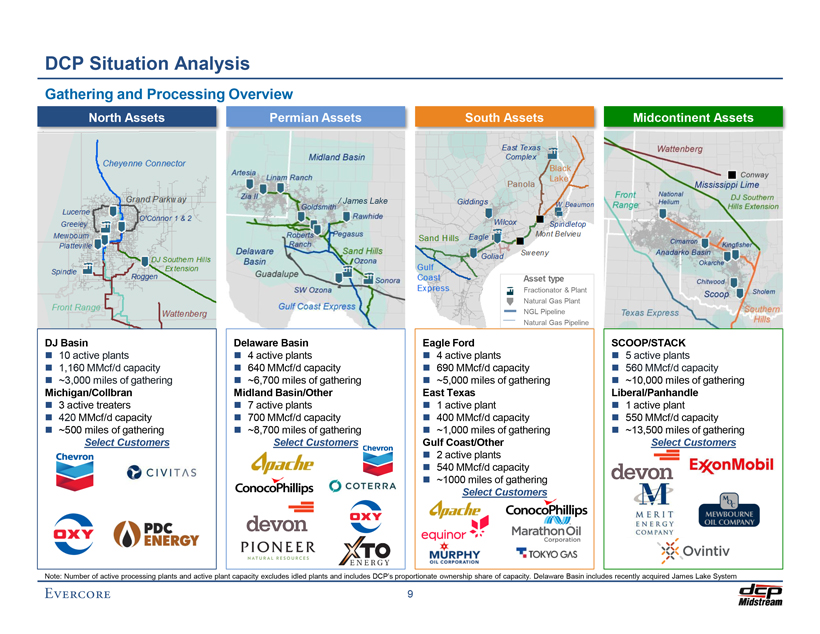
Preliminary Draft – Confidential DCP Situation Analysis Gathering and Processing Overview North Assets Permian Assets South Assets Midcontinent Assets / James Lake Asset type Fractionator & Plant Natural Gas Plant NGL Pipeline Natural Gas Pipeline DJ Basin Delaware Basin Eagle Ford SCOOP/STACK â—¼ï€ 10 active plants â—¼ï€ 4 active plants â—¼ï€ 4 active plants â—¼ï€ 5 active plants â—¼ï€ 1,160 MMcf/d capacity â—¼ï€ 640 MMcf/d capacity â—¼ï€ 690 MMcf/d capacity â—¼ï€ 560 MMcf/d capacity â—¼ï€ ~3,000 miles of gathering â—¼ï€ ~6,700 miles of gathering â—¼ï€ ~5,000 miles of gathering â—¼ï€ ~10,000 miles of gathering Michigan/Collbran Midland Basin/Other East Texas Liberal/Panhandle â—¼ï€ 3 active treaters â—¼ï€ 7 active plants â—¼ï€ 1 active plant â—¼ï€ 1 active plant â—¼ï€ 420 MMcf/d capacity â—¼ï€ 700 MMcf/d capacity â—¼ï€ 400 MMcf/d capacity â—¼ï€ 550 MMcf/d capacity â—¼ï€ ~500 miles of gathering â—¼ï€ ~8,700 miles of gathering â—¼ï€ ~1,000 miles of gathering â—¼ï€ ~13,500 miles of gathering Select Customers Select Customers Gulf Coast/Other Select Customers â—¼ï€ 2 active plants â—¼ï€ 540 MMcf/d capacity â—¼ï€ ~1000 miles of gathering Select Customers Note: Number of active processing plants and active plant capacity excludes idled plants and includes DCP’s proportionate ownership share of capacity. Delaware Basin includes recently acquired James Lake System 9
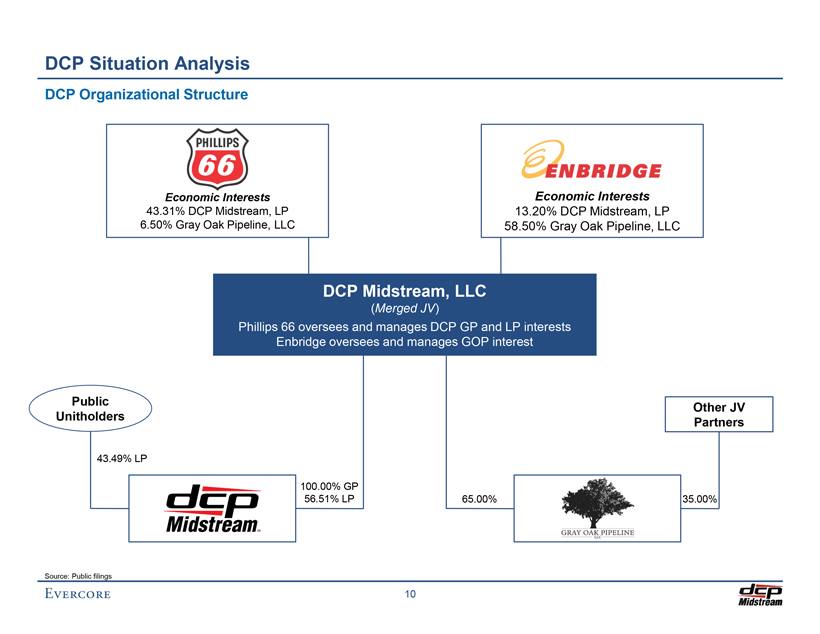
Preliminary Draft – Confidential DCP Situation Analysis DCP Organizational Structure Economic Interests Economic Interests 43.31% DCP Midstream, LP 13.20% DCP Midstream, LP 6.50% Gray Oak Pipeline, LLC 58.50% Gray Oak Pipeline, LLC DCP Midstream, LLC (Merged JV) Phillips 66 oversees and manages DCP GP and LP interests Enbridge oversees and manages GOP interest Public Other JV Unitholders Partners 43.49% LP 100.00% GP 56.51% LP 65.00% 35.00% Source: Public filings 10
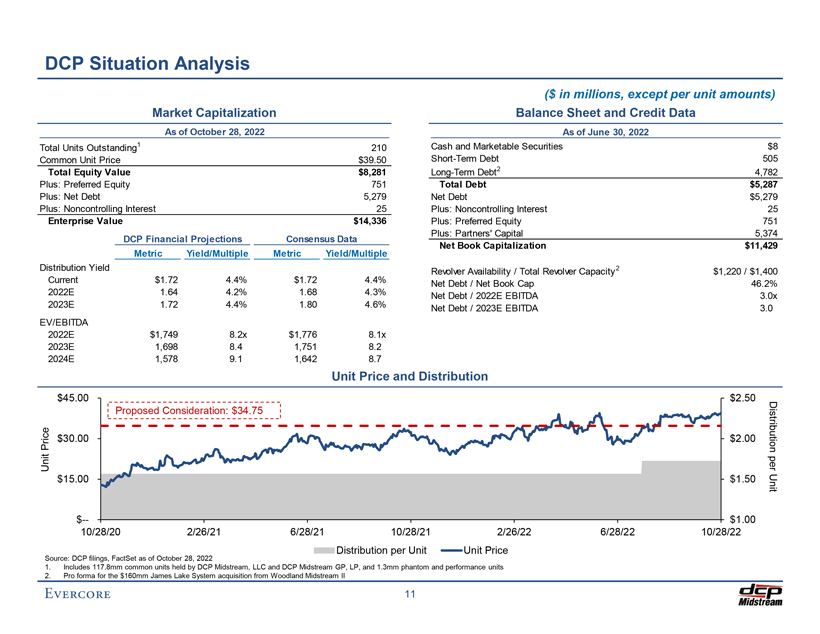
Preliminary Draft – Confidential DCP Situation Analysis ($ in millions, except per unit amounts) Market Capitalization Balance Sheet and Credit Data As of October 28, 2022 As of June 30, 2022 Total Units Outstanding1 210 Cash and Marketable Securities $8 Common Unit Price $39.50 Short-Term Debt 505 Total Equity Value $8,281 Long-Term Debt2 4,782 Plus: Preferred Equity 751 Total Debt $5,287 Plus: Net Debt 5,279 Net Debt $5,279 Plus: Noncontrolling Interest 25 Plus: Noncontrolling Interest 25 Enterprise Value $14,336 Plus: Preferred Equity 751 Plus: Partners’ Capital 5,374 DCP Financial Projections Consensus Data Metric Yield/Multiple Metric Yield/Multiple Net Book Capitalization $11,429 Distribution Yield Revolver Availability / Total Revolver Capacity2 $1,220 / $1,400 Current $1.72 4.4% $1.72 4.4% Net Debt / Net Book Cap 46.2% 2022E 1.64 4.2% 1.68 4.3% Net Debt / 2022E EBITDA 3.0x 2023E 1.72 4.4% 1.80 4.6% Net Debt / 2023E EBITDA 3.0 EV/EBITDA 2022E $1,749 8.2x $1,776 8.1x 2023E 1,698 8.4 1,751 8.2 2024E 1,578 9.1 1,642 8.7 Unit Price and Distribution $45.00 $2.50 D Proposed Consideration: $34.75 istributi Price $30.00 $2.00 on Unitper $15.00 $1.50 Un t i $— $1.00 10/28/20 2/26/21 6/28/21 10/28/21 2/26/22 6/28/22 10/28/22 Distribution per Unit Unit Price Source: DCP filings, FactSet as of October 28, 2022 1. Includes 117.8mm common units held by DCP Midstream, LLC and DCP Midstream GP, LP, and 1.3mm phantom and performance units 2. Pro forma for the $160mm James Lake System acquisition from Woodland Midstream II 11
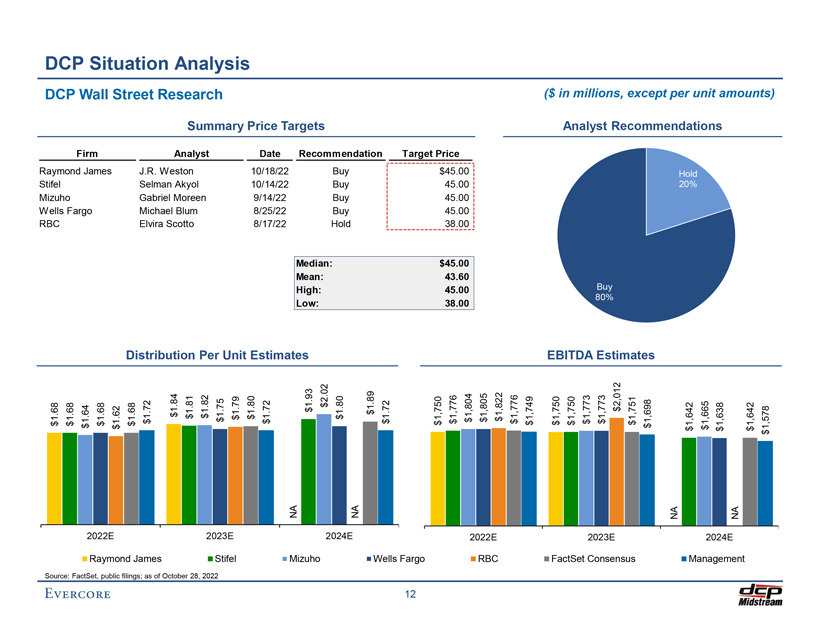
$1.68 RBC Wells Stifel Source: Mizuho $1.68 DCP Raymond $1.64 DCP FactSet, Fargo Firm $1.68 James Wall 2022E public Raymond $1.62 filings; $1.68 . J as $1.72 Street . R of James Elvira Michael Gabriel Selman Situation October 2022E $1.84 $1.81 Distribution Scotto Blum Akyol Weston 28, 2022 $1.82 Per Moreen Analyst Stifel 2023E $1.75 Research $1.79 Unit Summary $1.80 Analysis $1.72 Date Price 8/17/22 8/25/22 9/14/22 10/14/22 10/18/22 NA Estimates Mizuho $1.93 Low: High: Mean: Targets $2.02 Median: 2024E $1.80 Hold Buy Buy Buy Buy NA $1.89 Recommendation Wells $1.72 12 Fargo 2023E Target $1,750 38 45 43 45 $ 38 45 45 45 $ 45 $1,776 00 . . 00 . 60 00 . . 00 00 . 00 . 00 . . 00 Price $1,804 RBC 2022E $1,805 $1,822 $1,776 $1,749 $ ( $1,750 in FactSet $1,750 $1,773 EBITDA $1,773 Analyst 2023E 80% Buy $2,012 millions, Consensus $1,751 $1,698 Estimates except 2024E Preliminary NA per $1,642 20% Hold Draft $1,665 unit – 2024E $1,638 Recommendations Management NA $1,642 $1,578 amounts) Confidential
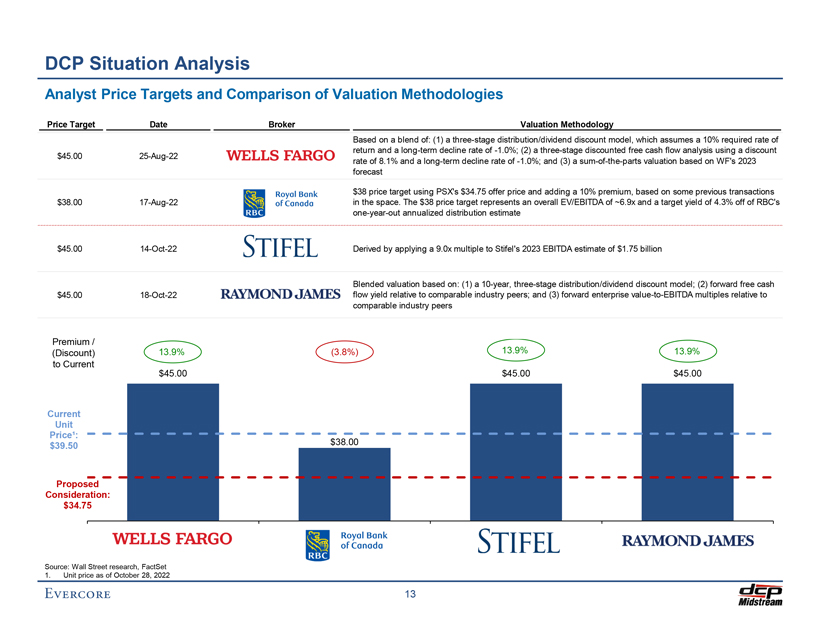
Preliminary Draft – Confidential DCP Situation Analysis Analyst Price Targets and Comparison of Valuation Methodologies Price Target Date Broker Valuation Methodology Based on a blend of: (1) a three-stage distribution/dividend discount model, which assumes a 10% required rate of return and a long-term decline rate of -1.0%; (2) a three-stage discounted free cash flow analysis using a discount $45.00 25-Aug-22 rate of 8.1% and a long-term decline rate of -1.0%; and (3) a sum-of-the-parts valuation based on WF’s 2023 forecast $38 price target using PSX’s $34.75 offer price and adding a 10% premium, based on some previous transactions $38.00 17-Aug-22 in the space. The $38 price target represents an overall EV/EBITDA of ~6.9x and a target yield of 4.3% off of RBC’s one-year-out annualized distribution estimate $45.00 14-Oct-22 Derived by applying a 9.0x multiple to Stifel’s 2023 EBITDA estimate of $1.75 billion Blended valuation based on: (1) a 10-year, three-stage distribution/dividend discount model; (2) forward free cash $45.00 18-Oct-22 flow yield relative to comparable industry peers; and (3) forward enterprise value-to-EBITDA multiples relative to comparable industry peers Premium / 13.9% (Discount) 13.9% (3.8%) 13.9% to Current $45.00 $45.00 $45.00 Current Unit Price¹: $39.50 $38.00 Proposed Consideration: $34.75 Source: Wall Street research, FactSet 1. Unit price as of October 28, 2022 13
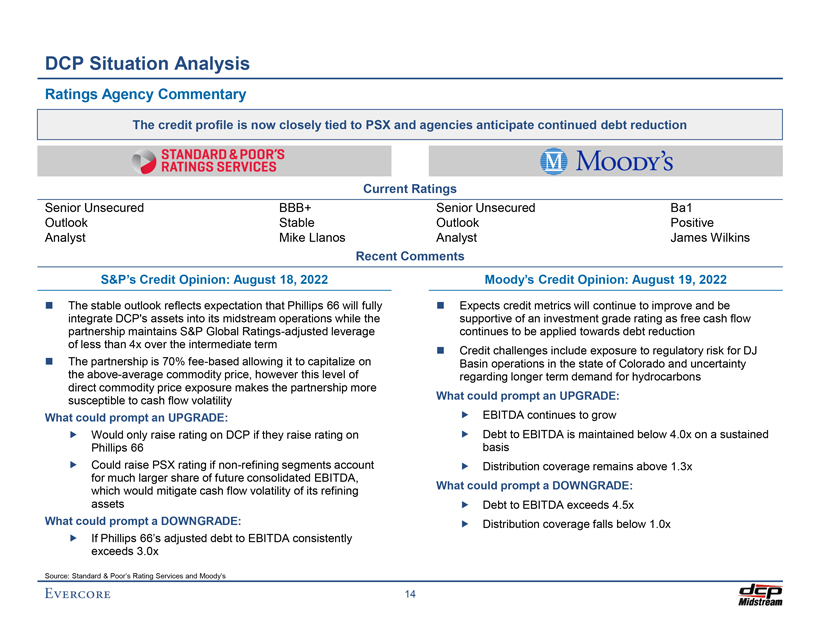
Preliminary Draft – Confidential DCP Situation Analysis Ratings Agency Commentary The credit profile is now closely tied to PSX and agencies anticipate continued debt reduction Current Ratings Senior Unsecured BBB+ Senior Unsecured Ba1 Outlook Stable Outlook Positive Analyst Mike Llanos Analyst James Wilkins Recent Comments S&P’s Credit Opinion: August 18, 2022 Moody’s Credit Opinion: August 19, 2022 â—¼ï€ The stable outlook reflects expectation that Phillips 66 will fully â—¼ï€ Expects credit metrics will continue to improve and be integrate DCP’s assets into its midstream operations while the supportive of an investment grade rating as free cash flow partnership maintains S&P Global Ratings-adjusted leverage continues to be applied towards debt reduction of less than 4x over the intermediate term â—¼ï€ Credit challenges include exposure to regulatory risk for DJ â—¼ï€ The partnership is 70% fee-based allowing it to capitalize on Basin operations in the state of Colorado and uncertainty the above-average commodity price, however this level of regarding longer term demand for hydrocarbons direct commodity price exposure makes the partnership more susceptible to cash flow volatility What could prompt an UPGRADE: What could prompt an UPGRADE:ï,„ï€ EBITDA continues to grow ï,„ï€ Would only raise rating on DCP if they raise rating on ï,„ï€ Debt to EBITDA is maintained below 4.0x on a sustained Phillips 66 basisï,„ï€ Could raise PSX rating if non-refining segments account ï,„ï€ Distribution coverage remains above 1.3x for much larger share of future consolidated EBITDA, What could prompt a DOWNGRADE: which would mitigate cash flow volatility of its refining assetsï,„ï€ Debt to EBITDA exceeds 4.5x What could prompt a DOWNGRADE:ï,„ï€ Distribution coverage falls below 1.0x ï,„ï€ If Phillips 66’s adjusted debt to EBITDA consistently exceeds 3.0x Source: Standard & Poor’s Rating Services and Moody’s 14
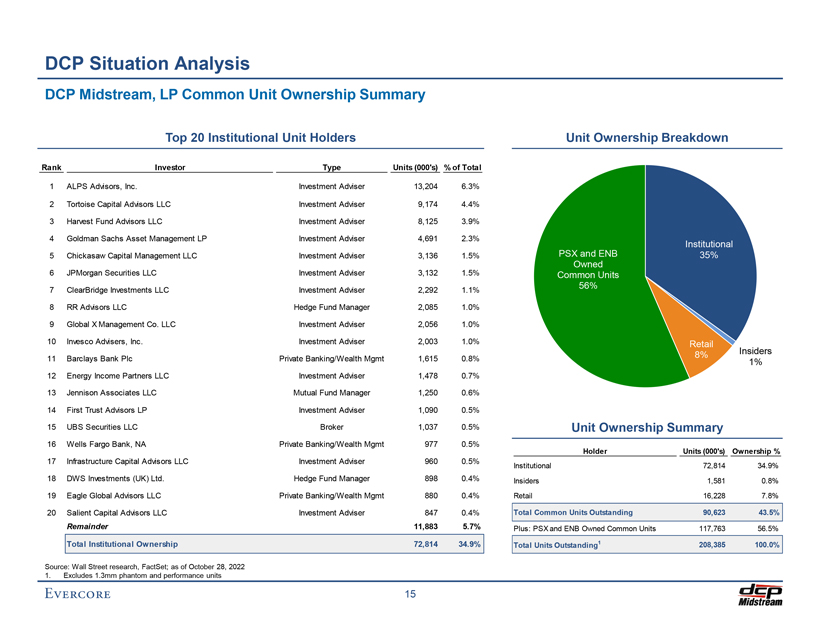
Preliminary Draft – Confidential DCP Situation Analysis DCP Midstream, LP Common Unit Ownership Summary Top 20 Institutional Unit Holders Unit Ownership Breakdown Rank Investor Type Units (000’s) % of Total 1 ALPS Advisors, Inc. Investment Adviser 13,204 6.3% 2 Tortoise Capital Advisors LLC Investment Adviser 9,174 4.4% 3 Harvest Fund Advisors LLC Investment Adviser 8,125 3.9% 4 Goldman Sachs Asset Management LP Investment Adviser 4,691 2.3% Institutional 5 Chickasaw Capital Management LLC Investment Adviser 3,136 1.5% PSX and ENB 35% Owned 6 JPMorgan Securities LLC Investment Adviser 3,132 1.5% Common Units 56% 7 ClearBridge Investments LLC Investment Adviser 2,292 1.1% 8 RR Advisors LLC Hedge Fund Manager 2,085 1.0% 9 Global X Management Co. LLC Investment Adviser 2,056 1.0% 10 Invesco Advisers, Inc. Investment Adviser 2,003 1.0% Retail 11 Barclays Bank Plc Private Banking/Wealth Mgmt 1,615 0.8% 8% Insiders 1% 12 Energy Income Partners LLC Investment Adviser 1,478 0.7% 13 Jennison Associates LLC Mutual Fund Manager 1,250 0.6% 14 First Trust Advisors LP Investment Adviser 1,090 0.5% 15 UBS Securities LLC Broker 1,037 0.5% Unit Ownership Summary 16 Wells Fargo Bank, NA Private Banking/Wealth Mgmt 977 0.5% Holder Units (000’s) Ownership % 17 Infrastructure Capital Advisors LLC Investment Adviser 960 0.5% Institutional 72,814 34.9% 18 DWS Investments (UK) Ltd. Hedge Fund Manager 898 0.4% Insiders 1,581 0.8% 19 Eagle Global Advisors LLC Private Banking/Wealth Mgmt 880 0.4% Retail 16,228 7.8% 20 Salient Capital Advisors LLC Investment Adviser 847 0.4% Total Common Units Outstanding 90,623 43.5% Remainder 11,883 5.7% Plus: PSX and ENB Owned Common Units 117,763 56.5% Total Institutional Ownership 72,814 34.9% Total Units Outstanding1 208,385 100.0% Source: Wall Street research, FactSet; as of October 28, 2022 1. Excludes 1.3mm phantom and performance units 15
Preliminary Draft – Confidential III. LPG Market Overview
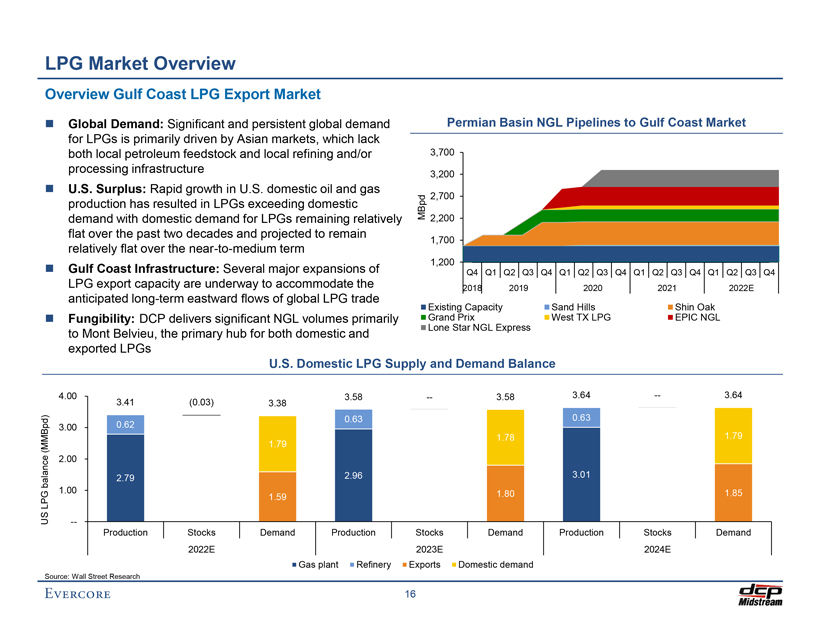
Preliminary Draft – Confidential LPG Market Overview Overview Gulf Coast LPG Export Market â—¼ï€ Global Demand: Significant and persistent global demand Permian Basin NGL Pipelines to Gulf Coast Market for LPGs is primarily driven by Asian markets, which lack both local petroleum feedstock and local refining and/or 3,700 processing infrastructure 3,200 â—¼ï€ U.S. Surplus: Rapid growth in U.S. domestic oil and gas 2,700 production has resulted in LPGs exceeding domestic MBpd demand with domestic demand for LPGs remaining relatively 2,200 flat over the past two decades and projected to remain 1,700 relatively flat over the near-to-medium term 1,200 â—¼ï€ Gulf Coast Infrastructure: Several major expansions of Q4 Q1 Q2 Q3 Q4 Q1 Q2 Q3 Q4 Q1 Q2 Q3 Q4 Q1 Q2 Q3 Q4 LPG export capacity are underway to accommodate the 2018 2019 2020 2021 2022E anticipated long-term eastward flows of global LPG trade Existing Capacity Sand Hills Shin Oak â—¼ï€ Fungibility: DCP delivers significant NGL volumes primarily Grand Prix West TX LPG EPIC NGL Lone Star NGL Express to Mont Belvieu, the primary hub for both domestic and exported LPGs U.S. Domestic LPG Supply and Demand Balance 4.00 3.58 — 3.58 3.64 — 3.64 3.41 (0.03) 3.38 0.63 0.63 3.00 0.62 (MMBpd) 1.79 1.78 1.79 e 2.00 n c ala 2.79 2.96 3.01 b 1.00 1.85 LPG 1.59 1.80 US —Production Stocks Demand Production Stocks Demand Production Stocks Demand 2022E 2023E 2024E Gas plant Refinery Exports Domestic demand Source: Wall Street Research 16
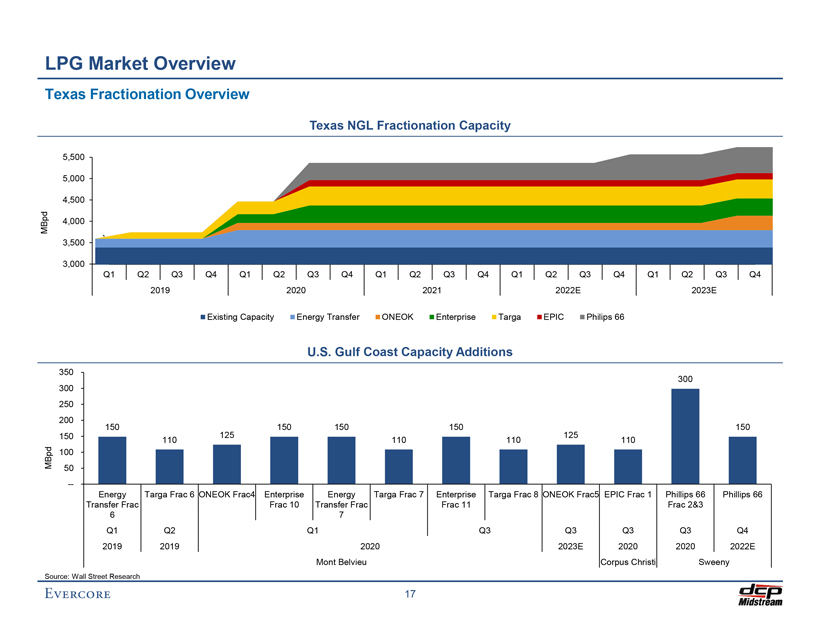
Preliminary Draft – Confidential LPG Market Overview Texas Fractionation Overview Texas NGL Fractionation Capacity 5,500 5,000 4,500 MBpd 4,000 3,500 ` 3,000 Q1 Q2 Q3 Q4 Q1 Q2 Q3 Q4 Q1 Q2 Q3 Q4 Q1 Q2 Q3 Q4 Q1 Q2 Q3 Q4 2019 2020 2021 2022E 2023E Existing Capacity Energy Transfer ONEOK Enterprise Targa EPIC Philips 66 U.S. Gulf Coast Capacity Additions 350 300 300 250 200 150 125 150 150 150 125 150 150 110 110 110 110 Bp d 100 M 50 —Energy Targa Frac 6 ONEOK Frac4 Enterprise Energy Targa Frac 7 Enterprise Targa Frac 8 ONEOK Frac5 EPIC Frac 1 Phillips 66 Phillips 66 Transfer Frac Frac 10 Transfer Frac Frac 11 Frac 2&3 6 7 Q1 Q2 Q1 Q3 Q3 Q3 Q3 Q4 2019 2019 2020 2023E 2020 2020 2022E Mont Belvieu Corpus Christi Sweeny Source: Wall Street Research 17
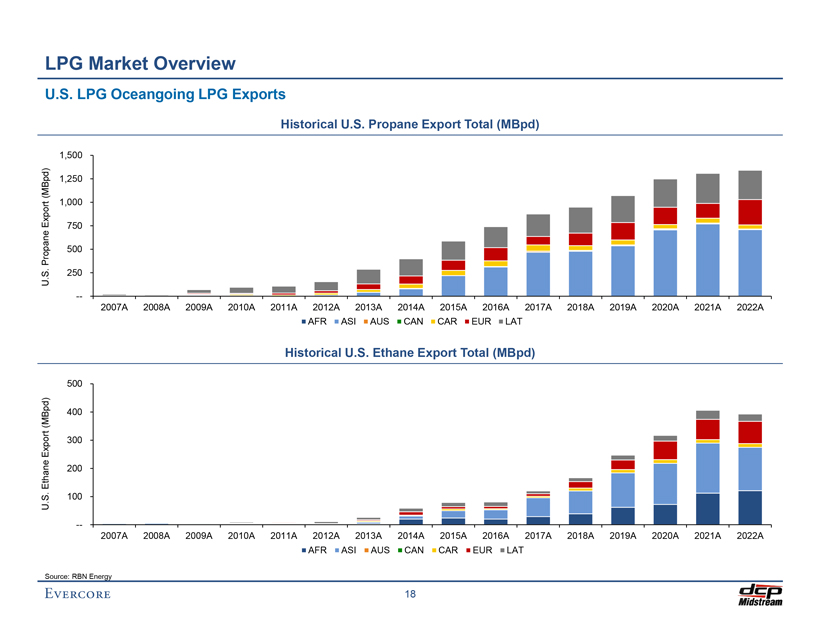
Preliminary Draft – Confidential LPG Market Overview U.S. LPG Oceangoing LPG Exports Historical U.S. Propane Export Total (MBpd) 1,500 d ) (MBp 1,250 rt 1,000 Exp o 750 ane Pro p 500 . S 250 U . — 2007A 2008A 2009A 2010A 2011A 2012A 2013A 2014A 2015A 2016A 2017A 2018A 2019A 2020A 2021A 2022A AFR ASI AUS CAN CAR EUR LAT Historical U.S. Ethane Export Total (MBpd) 500 (MBpd) 400 Export 300 Ethane 200 . S 100 U . — 2007A 2008A 2009A 2010A 2011A 2012A 2013A 2014A 2015A 2016A 2017A 2018A 2019A 2020A 2021A 2022A AFR ASI AUS CAN CAR EUR LAT Source: RBN Energy 18
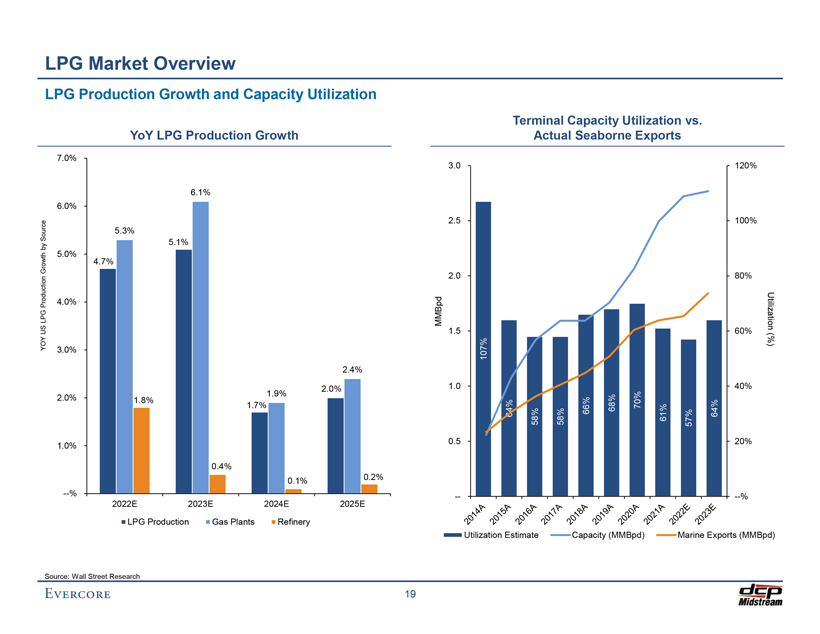
Preliminary Draft – Confidential LPG Market Overview LPG Production Growth and Capacity Utilization Terminal Capacity Utilization vs. YoY LPG Production Growth Actual Seaborne Exports 7.0% 3.0 120% 6.1% 6.0% 2.5 100% r ce o u 5.3% S 5.1% by Growth 5.0% 4.7% uction 2.0 80% ro d 4.0% P P G Utiliza L MMBpd tion US 1.5 60% OY (%) Y 3.0% 107% 2.4% 2.0% 1.0 40% 1.9% 2.0% 1.8% 1.7% 70% 64% 58% 58% 66% 68% 61% 57% 64% 0.5 20% 1.0% 0.4% 0.2% 0.1% —% -—-% 2022E 2023E 2024E 2025E LPG Production Gas Plants Refinery Utilization Estimate Capacity (MMBpd) Marine Exports (MMBpd) Source: Wall Street Research 19
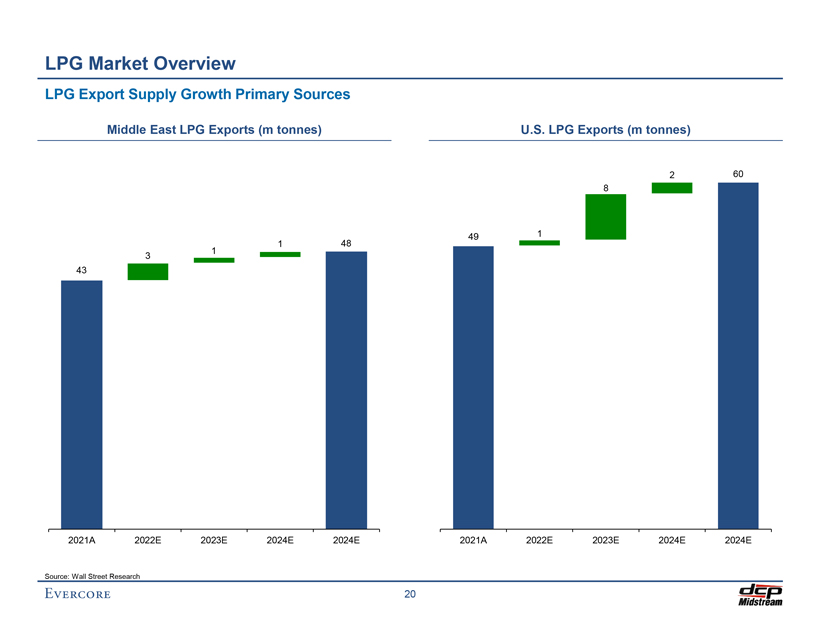
Preliminary Draft – Confidential LPG Market Overview LPG Export Supply Growth Primary Sources Middle East LPG Exports (m tonnes) U.S. LPG Exports (m tonnes) 2 60 8 49 1 1 48 1 3 43 2021A 2022E 2023E 2024E 2024E 2021A 2022E 2023E 2024E 2024E Source: Wall Street Research 20
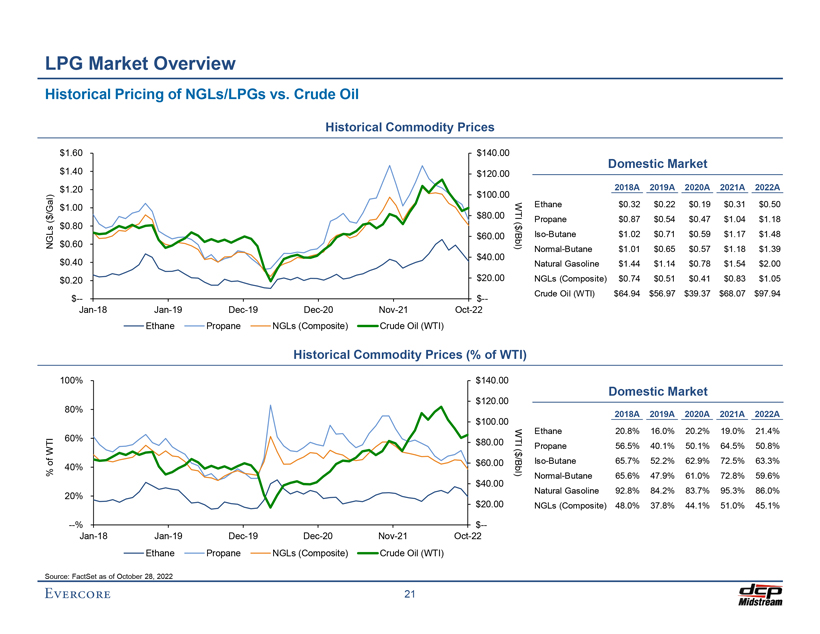
Preliminary Draft – Confidential LPG Market Overview Historical Pricing of NGLs/LPGs vs. Crude Oil Historical Commodity Prices $1.60 $140.00 Domestic Market $1.40 $120.00 $1.20 2018A 2019A 2020A 2021A 2022A ) $100.00 /Gal $1.00 W Ethane $0.32 $0.22 $0.19 $0.31 $0.50 $ $80.00 TI Propane $0.87 $0.54 $0.47 $1.04 $1.18 ( ( $0.80 $ $60.00 Iso-Butane $1.02 $0.71 $0.59 $1.17 $1.48 NGLs $0.60 /Bbl) $40.00 Normal-Butane $1.01 $0.65 $0.57 $1.18 $1.39 $0.40 Natural Gasoline $1.44 $1.14 $0.78 $1.54 $2.00 $0.20 $20.00 NGLs (Composite) $0.74 $0.51 $0.41 $0.83 $1.05 Crude Oil (WTI) $64.94 $56.97 $39.37 $68.07 $97.94 $— $--Jan-18 Jan-19 Dec-19 Dec-20 Nov-21 Oct-22 Ethane Propane NGLs (Composite) Crude Oil (WTI) Historical Commodity Prices (% of WTI) 100% $140.00 $120.00 Domestic Market 80% $100.00 2018A 2019A 2020A 2021A 2022A Ethane 20.8% 16.0% 20.2% 19.0% 21.4% 60% WT TI $80.00 I Propane 56.5% 40.1% 50.1% 64.5% 50.8% W ( $ of $60.00 Iso-Butane 65.7% 52.2% 62.9% 72.5% 63.3% 40% /Bbl % ) Normal-Butane 65.6% 47.9% 61.0% 72.8% 59.6% $40.00 Natural Gasoline 92.8% 84.2% 83.7% 95.3% 86.0% 20% $20.00 NGLs (Composite) 48.0% 37.8% 44.1% 51.0% 45.1% —% $--Jan-18 Jan-19 Dec-19 Dec-20 Nov-21 Oct-22 Ethane Propane NGLs (Composite) Crude Oil (WTI) Source: FactSet as of October 28, 2022 21
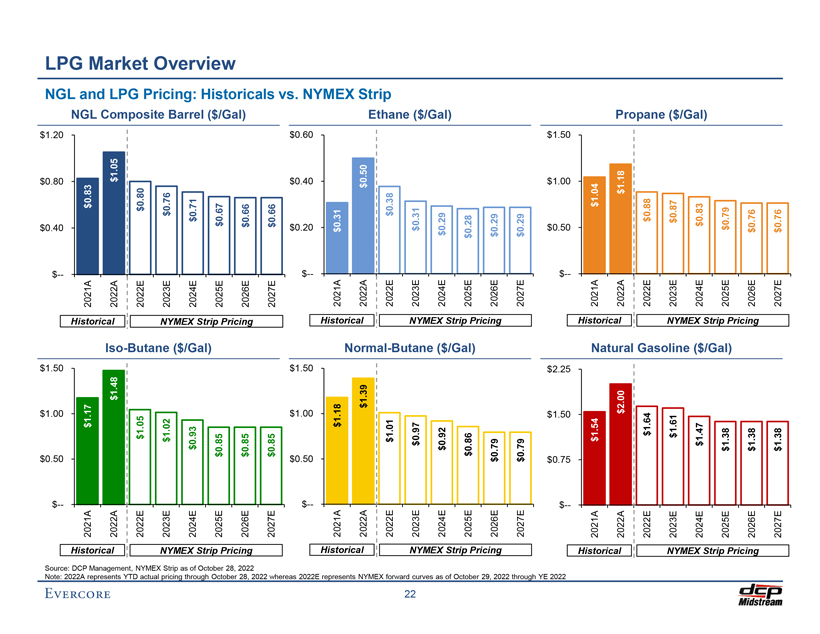
$ 0 $ 1 1 $ $ 0 0 $ 1 $ . . . . . . Note: — $ 50 00 50 — $ 40 80 20 Source: NGL 2022A LPG DCP 2021A $1.17 2021A $0.83 NGL and represents Historical 2022A $1.48 Historical 2022A $1.05 Management,—Iso YTD LPG 2022E $1.05 2022E $0.80 Market actual NYMEX Composite 2023E $1.02 Butane 2023E $0.76 Strip ( pricing $ as of NYMEX 2024E $0.93 NYMEX 2024E $0.71 Pricing: Barrel through Strip /Gal) Strip ( $ October 2025E $0.85 2025E $0.67 October 28, Overview /Gal) 28, 2026E $0.85 2026E $0.66 2022 2022 Pricing Pricing 2027E $0.85 2027E $0.66 Historicals vs whereas $ $ $ $ $ $ 0 1 1 0 0 0. . . . . . . 2022E — $ 50 00 50 — $ 20 40 60 represents 2021A $1.18 2021A $0.31 NYMEX Historical Historical NYMEX 2022A $1.39 2022A $0.50 Normal forward 2022E $1.01—2022E $0.38 Ethane Strip 22 curves 2023E $0.97 Butane 2023E $0.31 ( $ as NYMEX ( NYMEX 2024E of 2024E $0.92 $ $0.29 /Gal) Strip Strip October 2025E $0.86 /Gal) 2025E $0.28 29, 2022 Pricing 2026E $0.79 Pricing 2026E $0.29 through 2027E $0.79 2027E $0.29 YE $ $ $ $ $ $ 0 . 1 . . 2 . 0 . 1 . 1 2022 — $ 75 50 25 — $ 50 00 50 Historical 2021A $1.54 Historical 2021A $1.04 2022A $2.00 Natural 2022A $1.18 2022E $1.64 2022E $0.88 Propane 2023E $1.61 2023E $0.87 ( Preliminary Gasoline $ NYMEX 2024E $1.47 ( NYMEX 2024E $0.83 Draft $ Strip Strip /Gal) – 2025E $1.38 /Gal) 2025E $0.79 Pricing 2026E $1.38 Pricing 2026E $0.76 Confidential 2027E $1.38 2027E $0.76
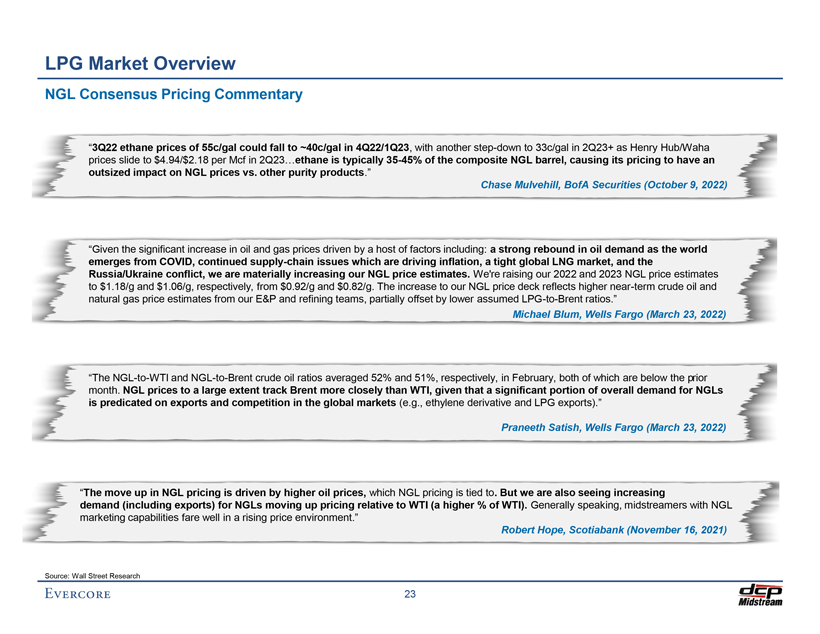
Preliminary Draft – Confidential LPG Market Overview NGL Consensus Pricing Commentary “3Q22 ethane prices of 55c/gal could fall to ~40c/gal in 4Q22/1Q23, with another step-down to 33c/gal in 2Q23+ as Henry Hub/Waha prices slide to $4.94/$2.18 per Mcf in 2Q23…ethane is typically 35-45% of the composite NGL barrel, causing its pricing to have an outsized impact on NGL prices vs. other purity products.” Chase Mulvehill, BofA Securities (October 9, 2022) “Given the significant increase in oil and gas prices driven by a host of factors including: a strong rebound in oil demand as the world emerges from COVID, continued supply-chain issues which are driving inflation, a tight global LNG market, and the Russia/Ukraine conflict, we are materially increasing our NGL price estimates. We’re raising our 2022 and 2023 NGL price estimates to $1.18/g and $1.06/g, respectively, from $0.92/g and $0.82/g. The increase to our NGL price deck reflects higher near-term crude oil and natural gas price estimates from our E&P and refining teams, partially offset by lower assumed LPG-to-Brent ratios.” Michael Blum, Wells Fargo (March 23, 2022) “The NGL-to-WTI and NGL-to-Brent crude oil ratios averaged 52% and 51%, respectively, in February, both of which are below the prior month. NGL prices to a large extent track Brent more closely than WTI, given that a significant portion of overall demand for NGLs is predicated on exports and competition in the global markets (e.g., ethylene derivative and LPG exports).” Praneeth Satish, Wells Fargo (March 23, 2022) “The move up in NGL pricing is driven by higher oil prices, which NGL pricing is tied to. But we are also seeing increasing demand (including exports) for NGLs moving up pricing relative to WTI (a higher % of WTI). Generally speaking, midstreamers with NGL marketing capabilities fare well in a rising price environment.” Robert Hope, Scotiabank (November 16, 2021) Source: Wall Street Research 23
Preliminary Draft – Confidential IV. DCP Financial Projections
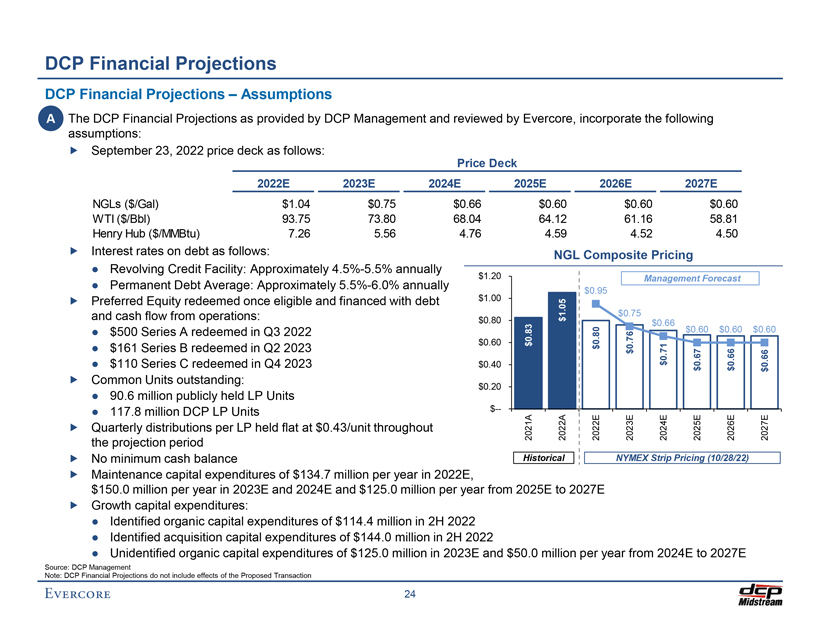
Preliminary Draft – Confidential DCP Financial Projections DCP Financial Projections – Assumptions â—¼ï€ A The DCP Financial Projections as provided by DCP Management and reviewed by Evercore, incorporate the following assumptions:ï,„ï€ September 23, 2022 price deck as follows: Price Deck 2022E 2023E 2024E 2025E 2026E 2027E NGLs ($/Gal) $1.04 $0.75 $0.66 $0.60 $0.60 $0.60 WTI ($/Bbl) 93.75 73.80 68.04 64.12 61.16 58.81 Henry Hub ($/MMBtu) 7.26 5.56 4.76 4.59 4.52 4.50 ï,„ï€ Interest rates on debt as follows: NGL Composite Pricing • Revolving Credit Facility: Approximately 4.5%-5.5% annually $1.20 Management Forecast • Permanent Debt Average: Approximately 5.5%-6.0% annually $0.95 ï,„ï€ Preferred Equity redeemed once eligible and financed with debt $1.005 . 0 $0.75 and cash flow from operations: 1 $ $0.80 $0.66 3 • $500 Series A redeemed in Q3 2022 8 06 $0.60 $0.60 $0.60 0 . . 8 7 $0.60 $ 0 . • $161 Series B redeemed in Q2 2023 $ 0 71 7 6 $ 0 . 6 6 66 $ 0 . 0 . . • $110 Series C redeemed in Q4 2023 $0.40 0 $ $ $ ï,„ï€ Common Units outstanding: $0.20 • 90.6 million publicly held LP Units • 117.8 million DCP LP Units $— ï,„ï€ Quarterly distributions per LP held flat at $0.43/unit throughout 2021 A 2022 A 2022 E E 2023 2024 E E 2025 E 2026 E 2027 the projection period ï,„ï€ No minimum cash balance Historical NYMEX Strip Pricing (10/28/22) ï,„ï€ Maintenance capital expenditures of $134.7 million per year in 2022E, $150.0 million per year in 2023E and 2024E and $125.0 million per year from 2025E to 2027E ï,„ï€ Growth capital expenditures: • Identified organic capital expenditures of $114.4 million in 2H 2022 • Identified acquisition capital expenditures of $144.0 million in 2H 2022 • Unidentified organic capital expenditures of $125.0 million in 2023E and $50.0 million per year from 2024E to 2027E Source: DCP Management Note: DCP Financial Projections do not include effects of the Proposed Transaction 24
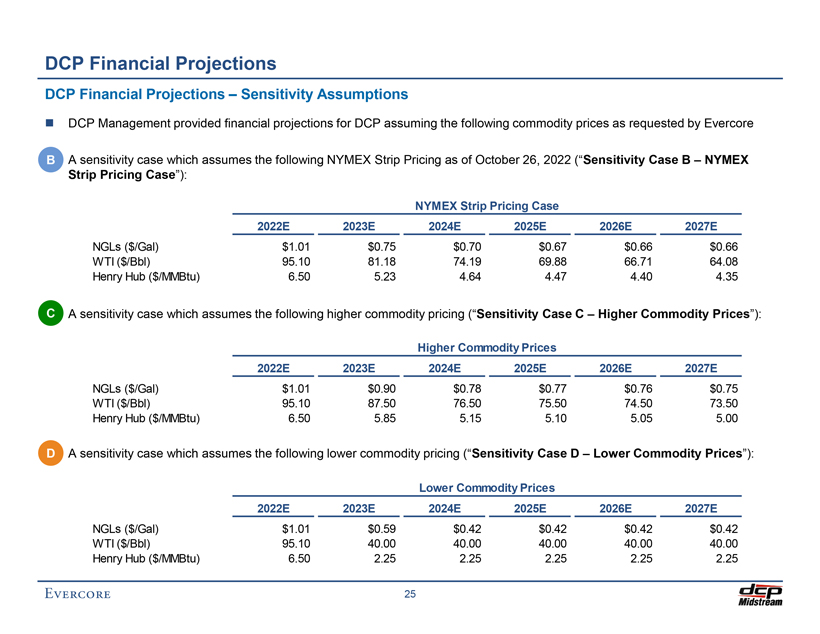
Preliminary Draft – Confidential DCP Financial Projections DCP Financial Projections – Sensitivity Assumptions â—¼ï€ DCP Management provided financial projections for DCP assuming the following commodity prices as requested by Evercore â—¼ï€ B A sensitivity case which assumes the following NYMEX Strip Pricing as of October 26, 2022 (“Sensitivity Case B – NYMEX Strip Pricing Case”): NYMEX Strip Pricing Case 2022E 2023E 2024E 2025E 2026E 2027E NGLs ($/Gal) $1.01 $0.75 $0.70 $0.67 $0.66 $0.66 WTI ($/Bbl) 95.10 81.18 74.19 69.88 66.71 64.08 Henry Hub ($/MMBtu) 6.50 5.23 4.64 4.47 4.40 4.35 â—¼ï€ C A sensitivity case which assumes the following higher commodity pricing (“Sensitivity Case C – Higher Commodity Prices”): Higher Commodity Prices 2022E 2023E 2024E 2025E 2026E 2027E NGLs ($/Gal) $1.01 $0.90 $0.78 $0.77 $0.76 $0.75 WTI ($/Bbl) 95.10 87.50 76.50 75.50 74.50 73.50 Henry Hub ($/MMBtu) 6.50 5.85 5.15 5.10 5.05 5.00 â—¼ï€ D A sensitivity case which assumes the following lower commodity pricing (“Sensitivity Case D – Lower Commodity Prices”): Lower Commodity Prices 2022E 2023E 2024E 2025E 2026E 2027E NGLs ($/Gal) $1.01 $0.59 $0.42 $0.42 $0.42 $0.42 WTI ($/Bbl) 95.10 40.00 40.00 40.00 40.00 40.00 Henry Hub ($/MMBtu) 6.50 2.25 2.25 2.25 2.25 2.25 25
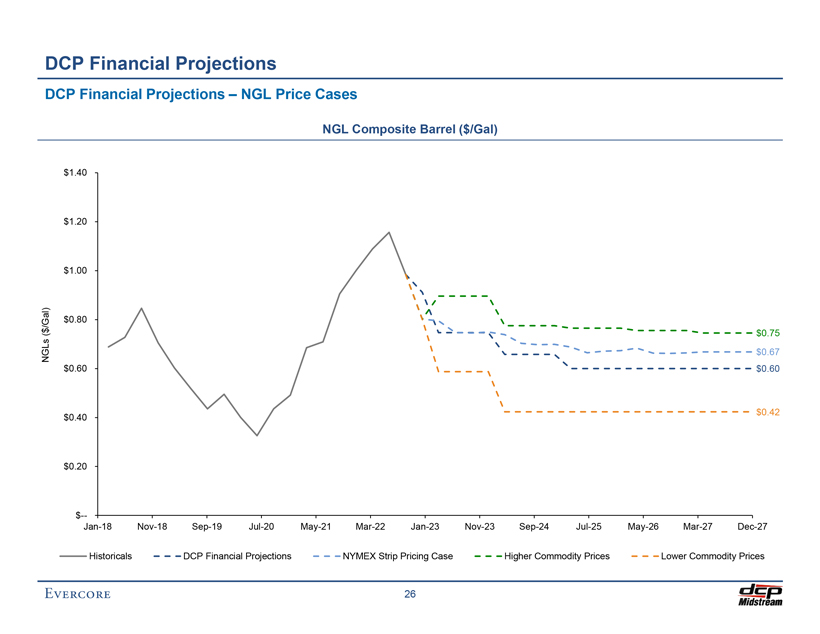
Preliminary Draft – Confidential DCP Financial Projections DCP Financial Projections – NGL Price Cases NGL Composite Barrel ($/Gal) $1.40 $1.20 $1.00 ) /Gal $0.80 ( $ $0.75 s L NG $0.67 $0.60 $0.60 $0.42 $0.40 $0.20 $— Jan-18 Nov-18 Sep-19 Jul-20 May-21 Mar-22 Jan-23 Nov-23 Sep-24 Jul-25 May-26 Mar-27 Dec-27 Historicals DCP Financial Projections NYMEX Strip Pricing Case Higher Commodity Prices Lower Commodity Prices 26
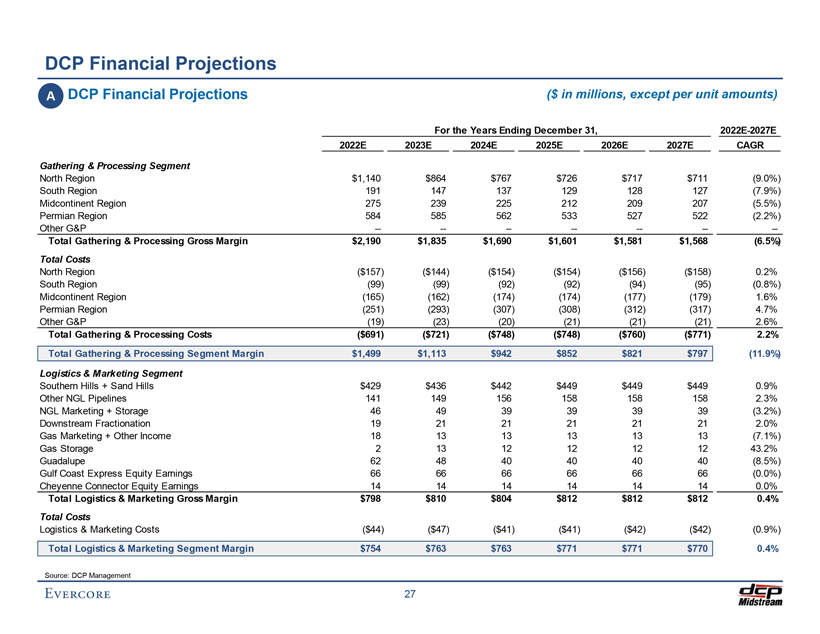
Preliminary Draft – Confidential DCP Financial Projections A DCP Financial Projections ($ in millions, except per unit amounts) For the Years Ending December 31, 2022E-2027E 2022E 2023E 2024E 2025E 2026E 2027E CAGR Gathering & Processing Segment North Region $1,140 $864 $767 $726 $717 $711 (9.0%) South Region 191 147 137 129 128 127 (7.9%) Midcontinent Region 275 239 225 212 209 207 (5.5%) Permian Region 584 585 562 533 527 522 (2.2%) Other G&P -——————- Total Gathering & Processing Gross Margin $2,190 $1,835 $1,690 $1,601 $1,581 $1,568 (6.5%) Total Costs North Region ($157) ($144) ($154) ($154) ($156) ($158) 0.2% South Region (99) (99) (92) (92) (94) (95) (0.8%) Midcontinent Region (165) (162) (174) (174) (177) (179) 1.6% Permian Region (251) (293) (307) (308) (312) (317) 4.7% Other G&P (19) (23) (20) (21) (21) (21) 2.6% Total Gathering & Processing Costs ($691) ($721) ($748) ($748) ($760) ($771) 2.2% Total Gathering & Processing Segment Margin $1,499 $1,113 $942 $852 $821 $797 (11.9%) Logistics & Marketing Segment Southern Hills + Sand Hills $429 $436 $442 $449 $449 $449 0.9% Other NGL Pipelines 141 149 156 158 158 158 2.3% NGL Marketing + Storage 46 49 39 39 39 39 (3.2%) Downstream Fractionation 19 21 21 21 21 21 2.0% Gas Marketing + Other Income 18 13 13 13 13 13 (7.1%) Gas Storage 2 13 12 12 12 12 43.2% Guadalupe 62 48 40 40 40 40 (8.5%) Gulf Coast Express Equity Earnings 66 66 66 66 66 66 (0.0%) Cheyenne Connector Equity Earnings 14 14 14 14 14 14 0.0% Total Logistics & Marketing Gross Margin $798 $810 $804 $812 $812 $812 0.4% Total Costs Logistics & Marketing Costs ($44) ($47) ($41) ($41) ($42) ($42) (0.9%) Total Logistics & Marketing Segment Margin $754 $763 $763 $771 $771 $770 0.4% Source: DCP Management 27
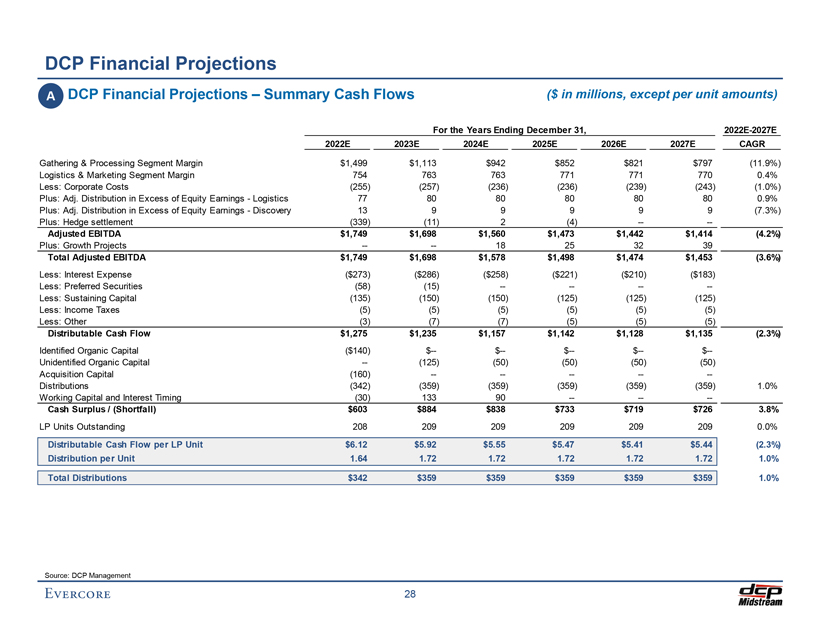
Preliminary Draft – Confidential DCP Financial Projections A DCP Financial Projections – Summary Cash Flows ($ in millions, except per unit amounts) For the Years Ending December 31, 2022E-2027E 2022E 2023E 2024E 2025E 2026E 2027E CAGR Gathering & Processing Segment Margin $1,499 $1,113 $942 $852 $821 $797 (11.9%) Logistics & Marketing Segment Margin 754 763 763 771 771 770 0.4% Less: Corporate Costs (255) (257) (236) (236) (239) (243) (1.0%) Plus: Adj. Distribution in Excess of Equity Earnings—Logistics 77 80 80 80 80 80 0.9% Plus: Adj. Distribution in Excess of Equity Earnings—Discovery 13 9 9 9 9 9 (7.3%) Plus: Hedge settlement (339) (11) 2 (4) -—- Adjusted EBITDA $1,749 $1,698 $1,560 $1,473 $1,442 $1,414 (4.2%) Plus: Growth Projects -—- 18 25 32 39 Total Adjusted EBITDA $1,749 $1,698 $1,578 $1,498 $1,474 $1,453 (3.6%) Less: Interest Expense ($273) ($286) ($258) ($221) ($210) ($183) Less: Preferred Securities (58) (15) -———-Less: Sustaining Capital (135) (150) (150) (125) (125) (125) Less: Income Taxes (5) (5) (5) (5) (5) (5) Less: Other (3) (7) (7) (5) (5) (5) Distributable Cash Flow $1,275 $1,235 $1,157 $1,142 $1,128 $1,135 (2.3%) Identified Organic Capital ($140) $— $— $— $— $—Unidentified Organic Capital — (125) (50) (50) (50) (50) Acquisition Capital (160) -————- Distributions (342) (359) (359) (359) (359) (359) 1.0% Working Capital and Interest Timing (30) 133 90 -——- Cash Surplus / (Shortfall) $603 $884 $838 $733 $719 $726 3.8% LP Units Outstanding 208 209 209 209 209 209 0.0% Distributable Cash Flow per LP Unit $6.12 $5.92 $5.55 $5.47 $5.41 $5.44 (2.3%) Distribution per Unit 1.64 1.72 1.72 1.72 1.72 1.72 1.0% Total Distributions $342 $359 $359 $359 $359 $359 1.0% Source: DCP Management 28
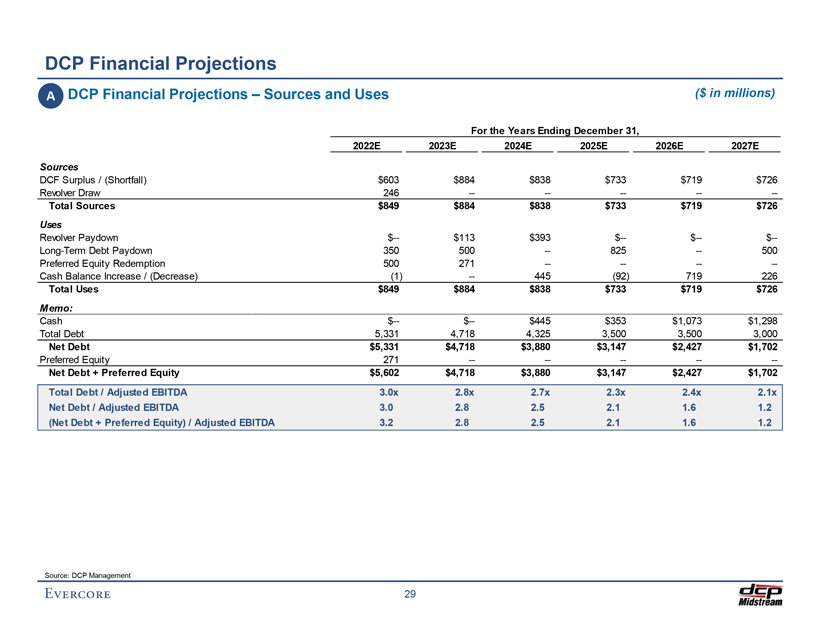
Preliminary Draft – Confidential DCP Financial Projections A DCP Financial Projections – Sources and Uses ($ in millions) For the Years Ending December 31, 2022E 2023E 2024E 2025E 2026E 2027E Sources DCF Surplus / (Shortfall) $603 $884 $838 $733 $719 $726 Revolver Draw 246 -————- Total Sources $849 $884 $838 $733 $719 $726 Uses Revolver Paydown $— $113 $393 $— $— $— Long-Term Debt Paydown 350 500 — 825 — 500 Preferred Equity Redemption 500 271 -———-Cash Balance Increase / (Decrease) (1) — 445 (92) 719 226 Total Uses $849 $884 $838 $733 $719 $726 Memo: Cash $— $— $445 $353 $1,073 $1,298 Total Debt 5,331 4,718 4,325 3,500 3,500 3,000 Net Debt $5,331 $4,718 $3,880 $3,147 $2,427 $1,702 Preferred Equity 271 -————- Net Debt + Preferred Equity $5,602 $4,718 $3,880 $3,147 $2,427 $1,702 Total Debt / Adjusted EBITDA 3.0x 2.8x 2.7x 2.3x 2.4x 2.1x Net Debt / Adjusted EBITDA 3.0 2.8 2.5 2.1 1.6 1.2 (Net Debt + Preferred Equity) / Adjusted EBITDA 3.2 2.8 2.5 2.1 1.6 1.2 Source: DCP Management 29
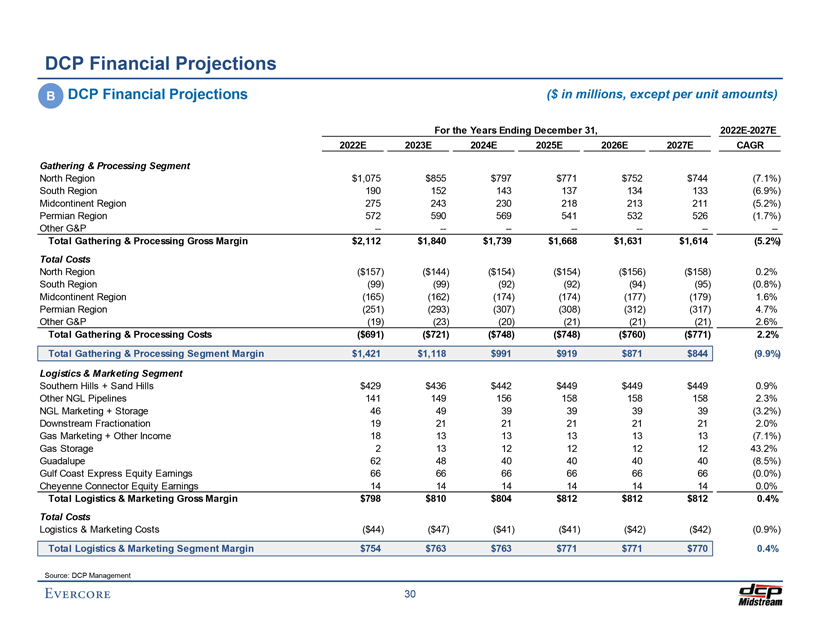
Preliminary Draft – Confidential DCP Financial Projections B DCP Financial Projections ($ in millions, except per unit amounts) For the Years Ending December 31, 2022E-2027E 2022E 2023E 2024E 2025E 2026E 2027E CAGR Gathering & Processing Segment North Region $1,075 $855 $797 $771 $752 $744 (7.1%) South Region 190 152 143 137 134 133 (6.9%) Midcontinent Region 275 243 230 218 213 211 (5.2%) Permian Region 572 590 569 541 532 526 (1.7%) Other G&P -——————- Total Gathering & Processing Gross Margin $2,112 $1,840 $1,739 $1,668 $1,631 $1,614 (5.2%) Total Costs North Region ($157) ($144) ($154) ($154) ($156) ($158) 0.2% South Region (99) (99) (92) (92) (94) (95) (0.8%) Midcontinent Region (165) (162) (174) (174) (177) (179) 1.6% Permian Region (251) (293) (307) (308) (312) (317) 4.7% Other G&P (19) (23) (20) (21) (21) (21) 2.6% Total Gathering & Processing Costs ($691) ($721) ($748) ($748) ($760) ($771) 2.2% Total Gathering & Processing Segment Margin $1,421 $1,118 $991 $919 $871 $844 (9.9%) Logistics & Marketing Segment Southern Hills + Sand Hills $429 $436 $442 $449 $449 $449 0.9% Other NGL Pipelines 141 149 156 158 158 158 2.3% NGL Marketing + Storage 46 49 39 39 39 39 (3.2%) Downstream Fractionation 19 21 21 21 21 21 2.0% Gas Marketing + Other Income 18 13 13 13 13 13 (7.1%) Gas Storage 2 13 12 12 12 12 43.2% Guadalupe 62 48 40 40 40 40 (8.5%) Gulf Coast Express Equity Earnings 66 66 66 66 66 66 (0.0%) Cheyenne Connector Equity Earnings 14 14 14 14 14 14 0.0% Total Logistics & Marketing Gross Margin $798 $810 $804 $812 $812 $812 0.4% Total Costs Logistics & Marketing Costs ($44) ($47) ($41) ($41) ($42) ($42) (0.9%) Total Logistics & Marketing Segment Margin $754 $763 $763 $771 $771 $770 0.4% Source: DCP Management 30
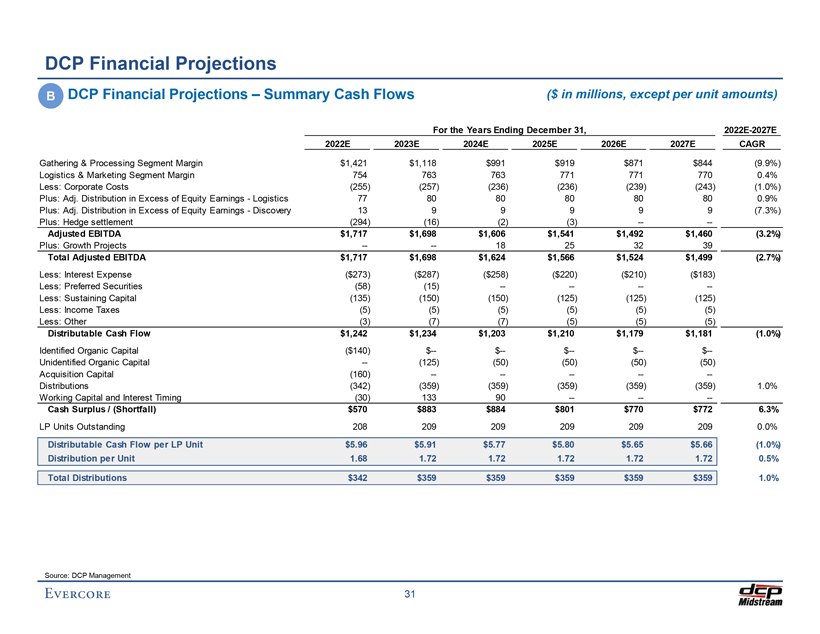
Preliminary Draft – Confidential DCP Financial Projections B DCP Financial Projections – Summary Cash Flows ($ in millions, except per unit amounts) For the Years Ending December 31, 2022E-2027E 2022E 2023E 2024E 2025E 2026E 2027E CAGR Gathering & Processing Segment Margin $1,421 $1,118 $991 $919 $871 $844 (9.9%) Logistics & Marketing Segment Margin 754 763 763 771 771 770 0.4% Less: Corporate Costs (255) (257) (236) (236) (239) (243) (1.0%) Plus: Adj. Distribution in Excess of Equity Earnings—Logistics 77 80 80 80 80 80 0.9% Plus: Adj. Distribution in Excess of Equity Earnings—Discovery 13 9 9 9 9 9 (7.3%) Plus: Hedge settlement (294) (16) (2) (3) -—- Adjusted EBITDA $1,717 $1,698 $1,606 $1,541 $1,492 $1,460 (3.2%) Plus: Growth Projects -—- 18 25 32 39 Total Adjusted EBITDA $1,717 $1,698 $1,624 $1,566 $1,524 $1,499 (2.7%) Less: Interest Expense ($273) ($287) ($258) ($220) ($210) ($183) Less: Preferred Securities (58) (15) -———-Less: Sustaining Capital (135) (150) (150) (125) (125) (125) Less: Income Taxes (5) (5) (5) (5) (5) (5) Less: Other (3) (7) (7) (5) (5) (5) Distributable Cash Flow $1,242 $1,234 $1,203 $1,210 $1,179 $1,181 (1.0%) Identified Organic Capital ($140) $— $— $— $— $—Unidentified Organic Capital — (125) (50) (50) (50) (50) Acquisition Capital (160) -————- Distributions (342) (359) (359) (359) (359) (359) 1.0% Working Capital and Interest Timing (30) 133 90 -——- Cash Surplus / (Shortfall) $570 $883 $884 $801 $770 $772 6.3% LP Units Outstanding 208 209 209 209 209 209 0.0% Distributable Cash Flow per LP Unit $5.96 $5.91 $5.77 $5.80 $5.65 $5.66 (1.0%) Distribution per Unit 1.68 1.72 1.72 1.72 1.72 1.72 0.5% Total Distributions $342 $359 $359 $359 $359 $359 1.0% Source: DCP Management 31
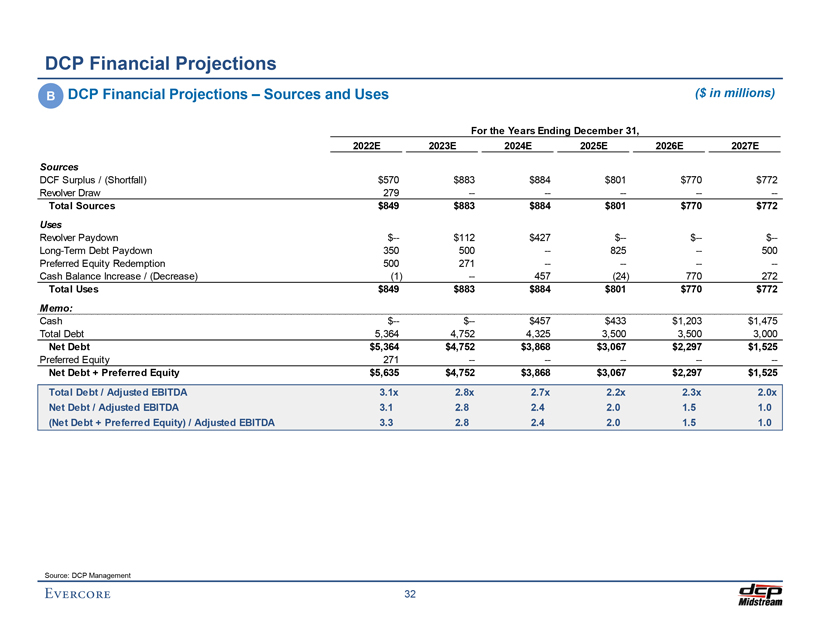
Preliminary Draft – Confidential DCP Financial Projections B DCP Financial Projections – Sources and Uses ($ in millions) For the Years Ending December 31, 2022E 2023E 2024E 2025E 2026E 2027E Sources DCF Surplus / (Shortfall) $570 $883 $884 $801 $770 $772 Revolver Draw 279 -————- Total Sources $849 $883 $884 $801 $770 $772 Uses Revolver Paydown $— $112 $427 $— $— $— Long-Term Debt Paydown 350 500 — 825 — 500 Preferred Equity Redemption 500 271 -———-Cash Balance Increase / (Decrease) (1) — 457 (24) 770 272 Total Uses $849 $883 $884 $801 $770 $772 Memo: Cash $— $— $457 $433 $1,203 $1,475 Total Debt 5,364 4,752 4,325 3,500 3,500 3,000 Net Debt $5,364 $4,752 $3,868 $3,067 $2,297 $1,525 Preferred Equity 271 -————- Net Debt + Preferred Equity $5,635 $4,752 $3,868 $3,067 $2,297 $1,525 Total Debt / Adjusted EBITDA 3.1x 2.8x 2.7x 2.2x 2.3x 2.0x Net Debt / Adjusted EBITDA 3.1 2.8 2.4 2.0 1.5 1.0 (Net Debt + Preferred Equity) / Adjusted EBITDA 3.3 2.8 2.4 2.0 1.5 1.0 Source: DCP Management 32
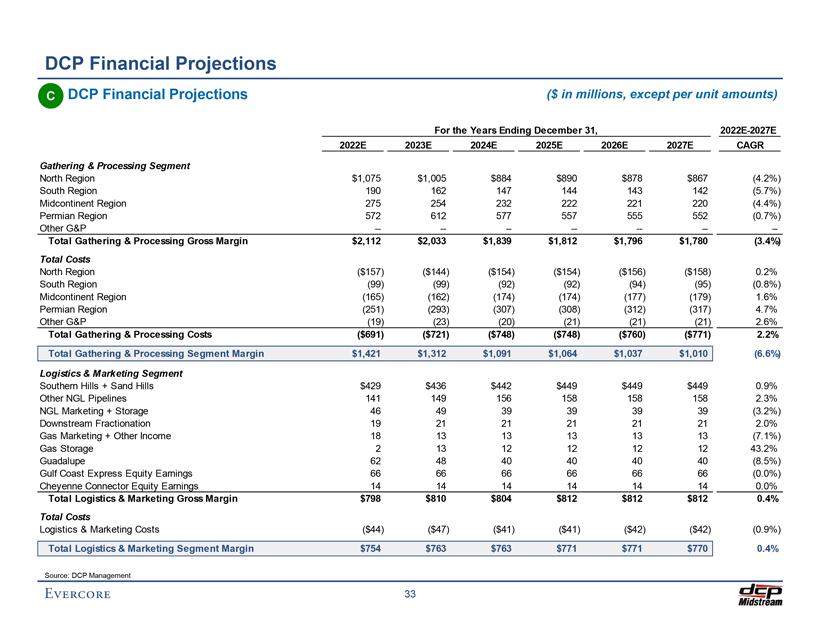
Preliminary Draft – Confidential DCP Financial Projections C DCP Financial Projections ($ in millions, except per unit amounts) For the Years Ending December 31, 2022E-2027E 2022E 2023E 2024E 2025E 2026E 2027E CAGR Gathering & Processing Segment North Region $1,075 $1,005 $884 $890 $878 $867 (4.2%) South Region 190 162 147 144 143 142 (5.7%) Midcontinent Region 275 254 232 222 221 220 (4.4%) Permian Region 572 612 577 557 555 552 (0.7%) Other G&P -——————- Total Gathering & Processing Gross Margin $2,112 $2,033 $1,839 $1,812 $1,796 $1,780 (3.4%) Total Costs North Region ($157) ($144) ($154) ($154) ($156) ($158) 0.2% South Region (99) (99) (92) (92) (94) (95) (0.8%) Midcontinent Region (165) (162) (174) (174) (177) (179) 1.6% Permian Region (251) (293) (307) (308) (312) (317) 4.7% Other G&P (19) (23) (20) (21) (21) (21) 2.6% Total Gathering & Processing Costs ($691) ($721) ($748) ($748) ($760) ($771) 2.2% Total Gathering & Processing Segment Margin $1,421 $1,312 $1,091 $1,064 $1,037 $1,010 (6.6%) Logistics & Marketing Segment Southern Hills + Sand Hills $429 $436 $442 $449 $449 $449 0.9% Other NGL Pipelines 141 149 156 158 158 158 2.3% NGL Marketing + Storage 46 49 39 39 39 39 (3.2%) Downstream Fractionation 19 21 21 21 21 21 2.0% Gas Marketing + Other Income 18 13 13 13 13 13 (7.1%) Gas Storage 2 13 12 12 12 12 43.2% Guadalupe 62 48 40 40 40 40 (8.5%) Gulf Coast Express Equity Earnings 66 66 66 66 66 66 (0.0%) Cheyenne Connector Equity Earnings 14 14 14 14 14 14 0.0% Total Logistics & Marketing Gross Margin $798 $810 $804 $812 $812 $812 0.4% Total Costs Logistics & Marketing Costs ($44) ($47) ($41) ($41) ($42) ($42) (0.9%) Total Logistics & Marketing Segment Margin $754 $763 $763 $771 $771 $770 0.4% Source: DCP Management 33
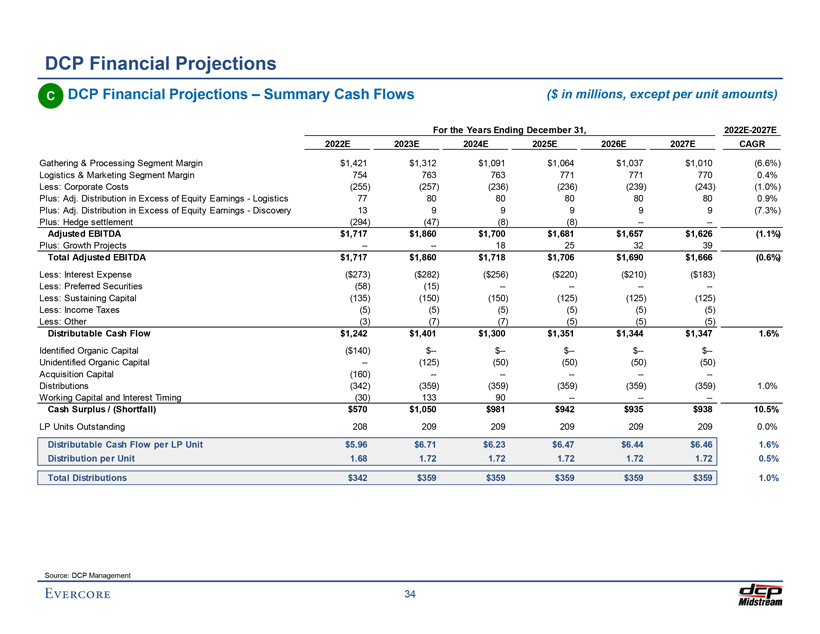
Preliminary Draft – Confidential DCP Financial Projections C DCP Financial Projections – Summary Cash Flows ($ in millions, except per unit amounts) For the Years Ending December 31, 2022E-2027E 2022E 2023E 2024E 2025E 2026E 2027E CAGR Gathering & Processing Segment Margin $1,421 $1,312 $1,091 $1,064 $1,037 $1,010 (6.6%) Logistics & Marketing Segment Margin 754 763 763 771 771 770 0.4% Less: Corporate Costs (255) (257) (236) (236) (239) (243) (1.0%) Plus: Adj. Distribution in Excess of Equity Earnings—Logistics 77 80 80 80 80 80 0.9% Plus: Adj. Distribution in Excess of Equity Earnings—Discovery 13 9 9 9 9 9 (7.3%) Plus: Hedge settlement (294) (47) (8) (8) -—- Adjusted EBITDA $1,717 $1,860 $1,700 $1,681 $1,657 $1,626 (1.1%) Plus: Growth Projects -—- 18 25 32 39 Total Adjusted EBITDA $1,717 $1,860 $1,718 $1,706 $1,690 $1,666 (0.6%) Less: Interest Expense ($273) ($282) ($256) ($220) ($210) ($183) Less: Preferred Securities (58) (15) -———-Less: Sustaining Capital (135) (150) (150) (125) (125) (125) Less: Income Taxes (5) (5) (5) (5) (5) (5) Less: Other (3) (7) (7) (5) (5) (5) Distributable Cash Flow $1,242 $1,401 $1,300 $1,351 $1,344 $1,347 1.6% Identified Organic Capital ($140) $— $— $— $— $—Unidentified Organic Capital — (125) (50) (50) (50) (50) Acquisition Capital (160) -————- Distributions (342) (359) (359) (359) (359) (359) 1.0% Working Capital and Interest Timing (30) 133 90 -——- Cash Surplus / (Shortfall) $570 $1,050 $981 $942 $935 $938 10.5% LP Units Outstanding 208 209 209 209 209 209 0.0% Distributable Cash Flow per LP Unit $5.96 $6.71 $6.23 $6.47 $6.44 $6.46 1.6% Distribution per Unit 1.68 1.72 1.72 1.72 1.72 1.72 0.5% Total Distributions $342 $359 $359 $359 $359 $359 1.0% Source: DCP Management 34
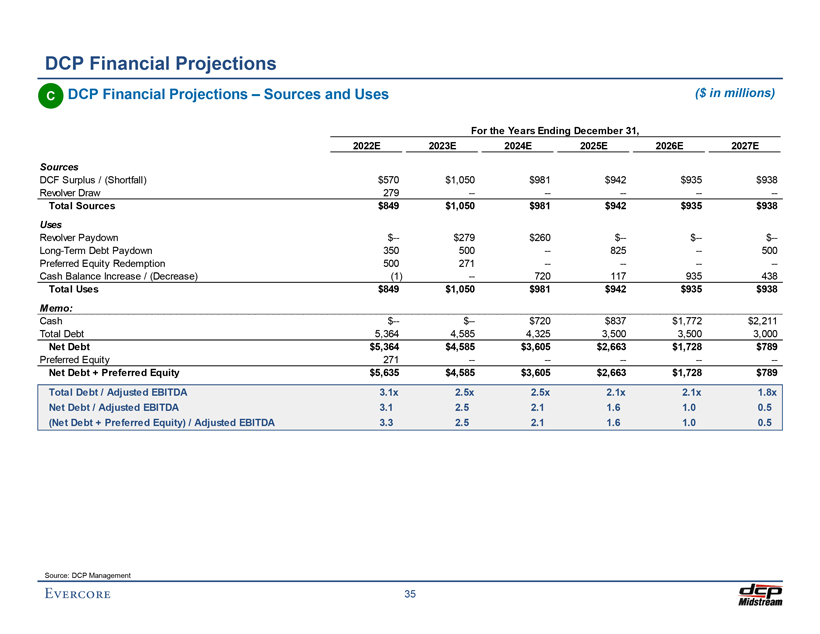
Preliminary Draft – Confidential DCP Financial Projections C DCP Financial Projections – Sources and Uses ($ in millions) For the Years Ending December 31, 2022E 2023E 2024E 2025E 2026E 2027E Sources DCF Surplus / (Shortfall) $570 $1,050 $981 $942 $935 $938 Revolver Draw 279 -————- Total Sources $849 $1,050 $981 $942 $935 $938 Uses Revolver Paydown $— $279 $260 $— $— $— Long-Term Debt Paydown 350 500 — 825 — 500 Preferred Equity Redemption 500 271 -———-Cash Balance Increase / (Decrease) (1) — 720 117 935 438 Total Uses $849 $1,050 $981 $942 $935 $938 Memo: Cash $— $— $720 $837 $1,772 $2,211 Total Debt 5,364 4,585 4,325 3,500 3,500 3,000 Net Debt $5,364 $4,585 $3,605 $2,663 $1,728 $789 Preferred Equity 271 -————- Net Debt + Preferred Equity $5,635 $4,585 $3,605 $2,663 $1,728 $789 Total Debt / Adjusted EBITDA 3.1x 2.5x 2.5x 2.1x 2.1x 1.8x Net Debt / Adjusted EBITDA 3.1 2.5 2.1 1.6 1.0 0.5 (Net Debt + Preferred Equity) / Adjusted EBITDA 3.3 2.5 2.1 1.6 1.0 0.5 Source: DCP Management 35
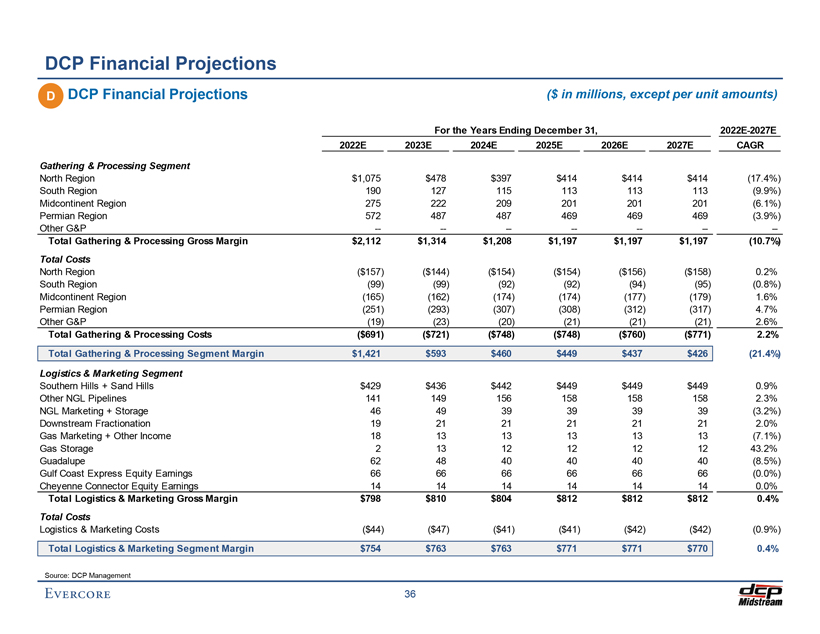
Preliminary Draft – Confidential DCP Financial Projections D DCP Financial Projections ($ in millions, except per unit amounts) For the Years Ending December 31, 2022E-2027E 2022E 2023E 2024E 2025E 2026E 2027E CAGR Gathering & Processing Segment North Region $1,075 $478 $397 $414 $414 $414 (17.4%) South Region 190 127 115 113 113 113 (9.9%) Midcontinent Region 275 222 209 201 201 201 (6.1%) Permian Region 572 487 487 469 469 469 (3.9%) Other G&P -——————- Total Gathering & Processing Gross Margin $2,112 $1,314 $1,208 $1,197 $1,197 $1,197 (10.7%) Total Costs North Region ($157) ($144) ($154) ($154) ($156) ($158) 0.2% South Region (99) (99) (92) (92) (94) (95) (0.8%) Midcontinent Region (165) (162) (174) (174) (177) (179) 1.6% Permian Region (251) (293) (307) (308) (312) (317) 4.7% Other G&P (19) (23) (20) (21) (21) (21) 2.6% Total Gathering & Processing Costs ($691) ($721) ($748) ($748) ($760) ($771) 2.2% Total Gathering & Processing Segment Margin $1,421 $593 $460 $449 $437 $426 (21.4%) Logistics & Marketing Segment Southern Hills + Sand Hills $429 $436 $442 $449 $449 $449 0.9% Other NGL Pipelines 141 149 156 158 158 158 2.3% NGL Marketing + Storage 46 49 39 39 39 39 (3.2%) Downstream Fractionation 19 21 21 21 21 21 2.0% Gas Marketing + Other Income 18 13 13 13 13 13 (7.1%) Gas Storage 2 13 12 12 12 12 43.2% Guadalupe 62 48 40 40 40 40 (8.5%) Gulf Coast Express Equity Earnings 66 66 66 66 66 66 (0.0%) Cheyenne Connector Equity Earnings 14 14 14 14 14 14 0.0% Total Logistics & Marketing Gross Margin $798 $810 $804 $812 $812 $812 0.4% Total Costs Logistics & Marketing Costs ($44) ($47) ($41) ($41) ($42) ($42) (0.9%) Total Logistics & Marketing Segment Margin $754 $763 $763 $771 $771 $770 0.4% Source: DCP Management 36
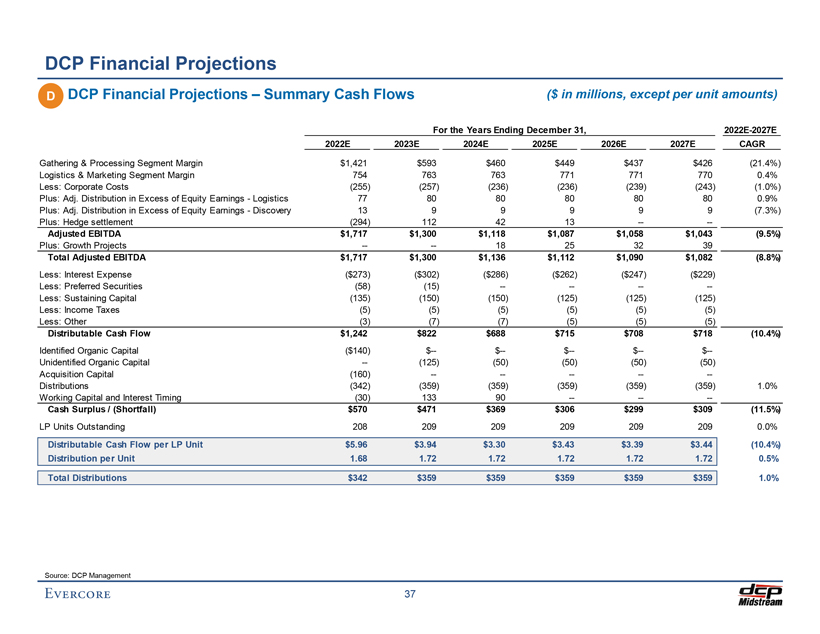
Preliminary Draft – Confidential DCP Financial Projections D DCP Financial Projections – Summary Cash Flows ($ in millions, except per unit amounts) For the Years Ending December 31, 2022E-2027E 2022E 2023E 2024E 2025E 2026E 2027E CAGR Gathering & Processing Segment Margin $1,421 $593 $460 $449 $437 $426 (21.4%) Logistics & Marketing Segment Margin 754 763 763 771 771 770 0.4% Less: Corporate Costs (255) (257) (236) (236) (239) (243) (1.0%) Plus: Adj. Distribution in Excess of Equity Earnings—Logistics 77 80 80 80 80 80 0.9% Plus: Adj. Distribution in Excess of Equity Earnings—Discovery 13 9 9 9 9 9 (7.3%) Plus: Hedge settlement (294) 112 42 13 -—- Adjusted EBITDA $1,717 $1,300 $1,118 $1,087 $1,058 $1,043 (9.5%) Plus: Growth Projects -—- 18 25 32 39 Total Adjusted EBITDA $1,717 $1,300 $1,136 $1,112 $1,090 $1,082 (8.8%) Less: Interest Expense ($273) ($302) ($286) ($262) ($247) ($229) Less: Preferred Securities (58) (15) -———-Less: Sustaining Capital (135) (150) (150) (125) (125) (125) Less: Income Taxes (5) (5) (5) (5) (5) (5) Less: Other (3) (7) (7) (5) (5) (5) Distributable Cash Flow $1,242 $822 $688 $715 $708 $718 (10.4%) Identified Organic Capital ($140) $— $— $— $— $—Unidentified Organic Capital — (125) (50) (50) (50) (50) Acquisition Capital (160) -————- Distributions (342) (359) (359) (359) (359) (359) 1.0% Working Capital and Interest Timing (30) 133 90 -——- Cash Surplus / (Shortfall) $570 $471 $369 $306 $299 $309 (11.5%) LP Units Outstanding 208 209 209 209 209 209 0.0% Distributable Cash Flow per LP Unit $5.96 $3.94 $3.30 $3.43 $3.39 $3.44 (10.4%) Distribution per Unit 1.68 1.72 1.72 1.72 1.72 1.72 0.5% Total Distributions $342 $359 $359 $359 $359 $359 1.0% Source: DCP Management 37
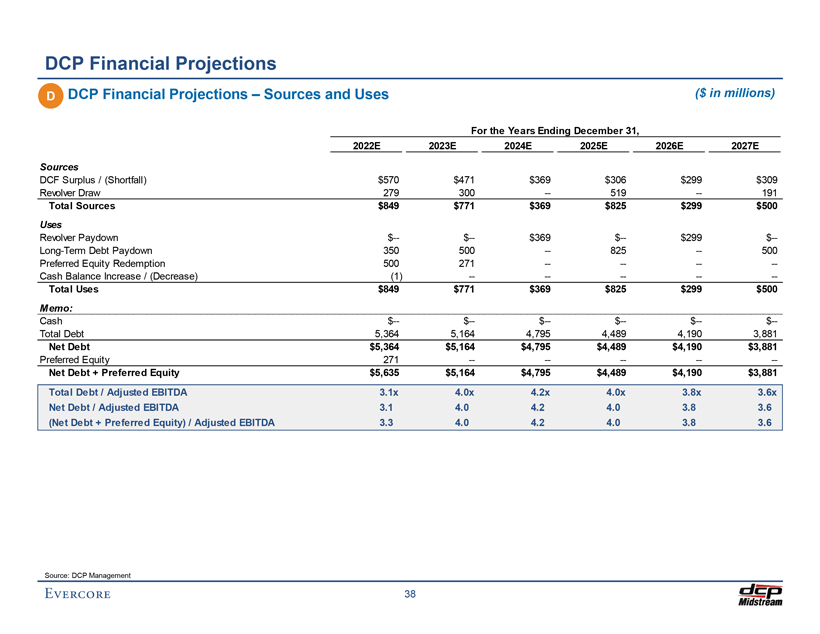
Preliminary Draft – Confidential DCP Financial Projections D DCP Financial Projections – Sources and Uses ($ in millions) For the Years Ending December 31, 2022E 2023E 2024E 2025E 2026E 2027E Sources DCF Surplus / (Shortfall) $570 $471 $369 $306 $299 $309 Revolver Draw 279 300 — 519 — 191 Total Sources $849 $771 $369 $825 $299 $500 Uses Revolver Paydown $— $— $369 $— $299 $— Long-Term Debt Paydown 350 500 — 825 — 500 Preferred Equity Redemption 500 271 -———-Cash Balance Increase / (Decrease) (1) -————- Total Uses $849 $771 $369 $825 $299 $500 Memo: Cash $— $— $— $— $— $— Total Debt 5,364 5,164 4,795 4,489 4,190 3,881 Net Debt $5,364 $5,164 $4,795 $4,489 $4,190 $3,881 Preferred Equity 271 -————- Net Debt + Preferred Equity $5,635 $5,164 $4,795 $4,489 $4,190 $3,881 Total Debt / Adjusted EBITDA 3.1x 4.0x 4.2x 4.0x 3.8x 3.6x Net Debt / Adjusted EBITDA 3.1 4.0 4.2 4.0 3.8 3.6 (Net Debt + Preferred Equity) / Adjusted EBITDA 3.3 4.0 4.2 4.0 3.8 3.6 Source: DCP Management 38
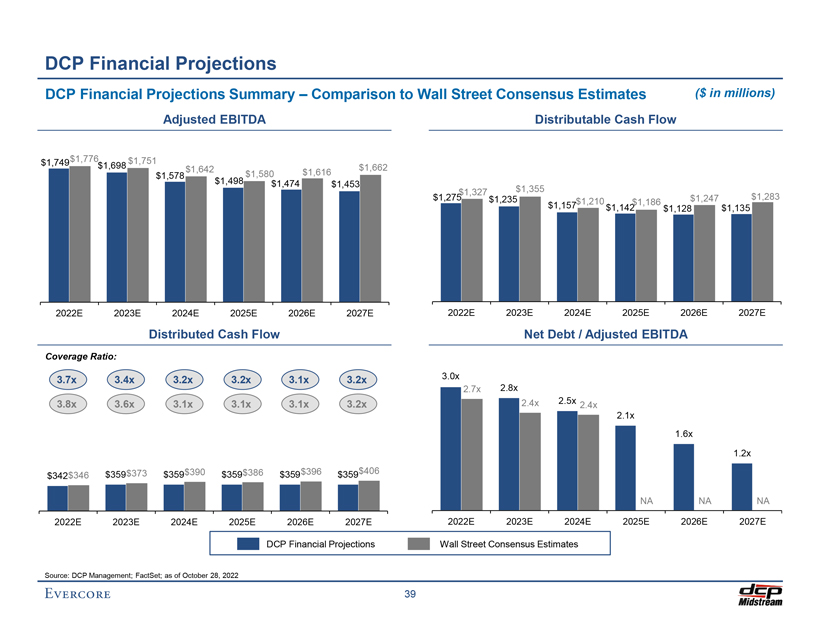
Preliminary Draft – Confidential DCP Financial Projections DCP Financial Projections Summary – Comparison to Wall Street Consensus Estimates ($ in millions) Adjusted EBITDA Distributable Cash Flow $1,749 $1,776 $1,751 $1,698 $1,642 $1,662 $1,578 $1,580 $1,616 $1,498 $1,474 $1,453 $1,355 $1,327 $1,275 $1,235 $1,247 $1,283 $1,210 $1,186 $1,157 $1,142 $1,128 $1,135 2022E 2023E 2024E 2025E 2026E 2027E 2022E 2023E 2024E 2025E 2026E 2027E Distributed Cash Flow Net Debt / Adjusted EBITDA Coverage Ratio: 3.7x 3.4x 3.2x 3.2x 3.1x 3.2x 3.0x 2.7x 2.8x 3.8x 3.6x 3.1x 3.1x 3.1x 3.2x 2.4x 2.5x 2.4x 2.1x 1.6x 1.2x $359$373 $359$390 $359$386 $359$396 $359$406 $342$346 NA NA NA 2022E 2023E 2024E 2025E 2026E 2027E 2022E 2023E 2024E 2025E 2026E 2027E DCP Financial Projections Wall Street Consensus Estimates Source: DCP Management; FactSet; as of October 28, 2022 39
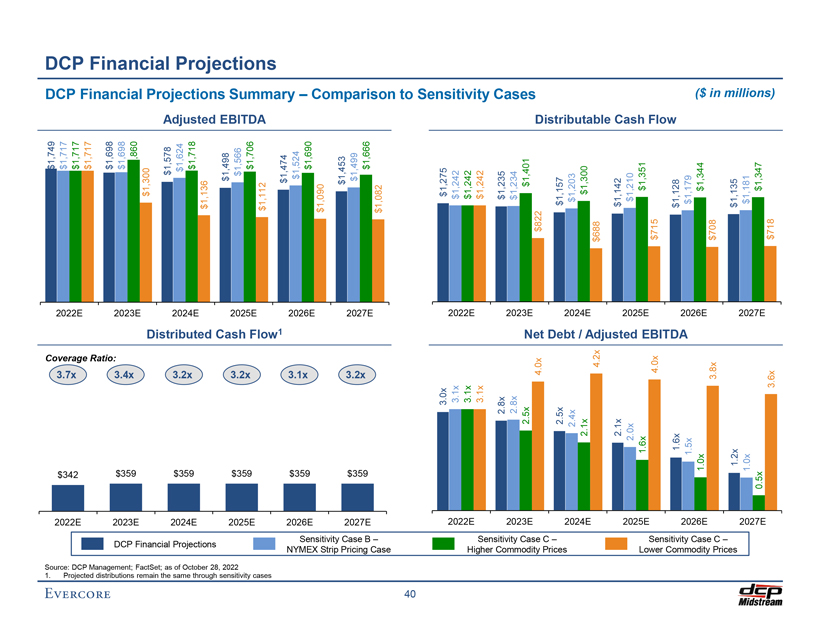
. 1 $1,749 Source: $ . 3 $1,717342 7x DCP DCP 2022E Coverage 2022E $1,717 DCP Projected $1,717Ratio: $1,698 Management; DCP $ . 3 $1,698 distributions359 4x $1,860 2023E 2023E Financial remain $1,300FactSet; theas Financial $1,578 Financial3 of $ . same 2x $1,624359 $1,718 2024E 2024E October $1,136 through Projections Distributed Adjusted 28,$1,498 Projections 2022 $ . 3 Cash $1,566 sensitivity 359 2x2025E 2025E $1,706 cases Flow $1,112 EBITDA Projections 1 $1,474 $ . 3 Summary $1,524 359 1x – $1,690 NYMEX 2026E 2026E Strip Sensitivity $1,090$1,453 $ . 3 Case $1,499 Pricing 359 2x $1,666 B 2027E 2027E Case – $1,082 Comparison to403.0x $1,275 3.1x $1,242 2022E 3.1x 2022E $1,242 Higher 3.1x $1,242 Sensitivity 2.8x $1,235 Sensitivity 2.8x $1,234 Commodity Case 2023E 2.5x 2023E $1,401 Cases 4.0x $822Net C –Prices 2.5x $1,157 2.4x Debt $1,203 2024E 2.1x / 2024E $1,300 4.2x $688 Distributable $1,1422.1x 2.0x Adjusted $1,210 1.6x $1,351 Cash 2025E 2025E Lower 4.0x $715Flow Preliminary Sensitivity 1.6x EBITDA $1,1281.5x $1,179 1.0x $1,344 ( Draft 2026E 2026E $ Commodity Case – C 3.8x $708 in –Prices 1.2x $1,135 1.0x $1,181 2027E 0.5x 2027E $1,347 Confidential 3.6x $718 millions)
Preliminary Draft – Confidential V. Preliminary Valuation of the Common Units
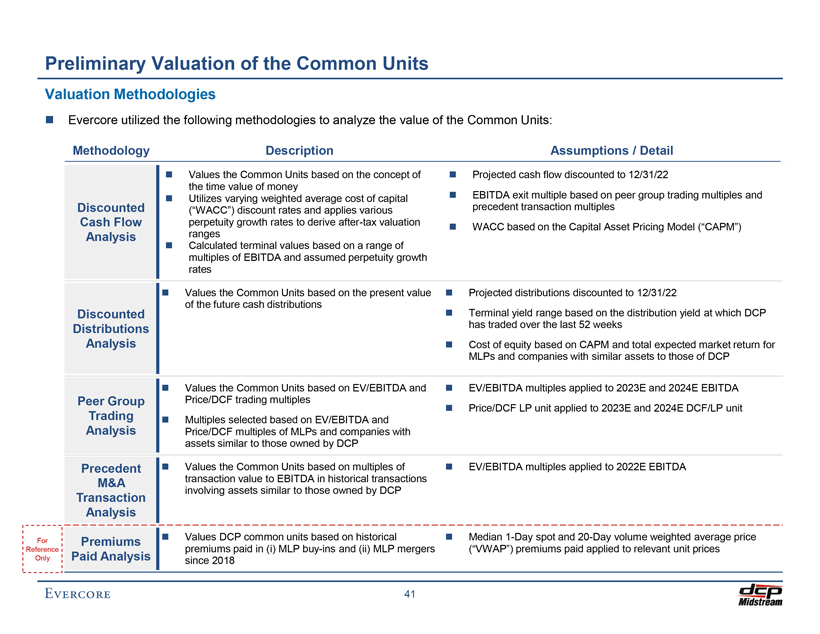
Preliminary Draft – Confidential Preliminary Valuation of the Common Units Valuation MethodologiesEvercore utilized the following methodologies to analyze the value of the Common Units: Methodology Description Assumptions / DetailValues the Common Units based on the concept ofProjected cash flow discounted to 12/31/22 the time value of moneyUtilizes varying weighted average cost of capitalEBITDA exit multiple based on peer group trading multiples and Discounted (“WACC”) discount rates and applies various precedent transaction multiples Cash Flow perpetuity growth rates to derive after-tax valuationWACC based on the Capital Asset Pricing Model (“CAPM”) Analysis rangesCalculated terminal values based on a range of multiples of EBITDA and assumed perpetuity growth ratesValues the Common Units based on the present valueProjected distributions discounted to 12/31/22 of the future cash distributions DiscountedTerminal yield range based on the distribution yield at which DCP Distributions has traded over the last 52 weeks AnalysisCost of equity based on CAPM and total expected market return for MLPs and companies with similar assets to those of DCPValues the Common Units based on EV/EBITDA andEV/EBITDA multiples applied to 2023E and 2024E EBITDA Peer Group Price/DCF trading multiplesPrice/DCF LP unit applied to 2023E and 2024E DCF/LP unit TradingMultiples selected based on EV/EBITDA and Analysis Price/DCF multiples of MLPs and companies with assets similar to those owned by DCP PrecedentValues the Common Units based on multiples ofEV/EBITDA multiples applied to 2022E EBITDA M&A transaction value to EBITDA in historical transactions involving assets similar to those owned by DCP Transaction AnalysisFor PremiumsValues DCP common units based on historicalMedian 1-Day spot and 20-Day volume weighted average price Reference premiums paid in (i) MLP buy-ins and (ii) MLP mergers (“VWAP”) premiums paid applied to relevant unit prices Only Paid Analysis since 2018 41
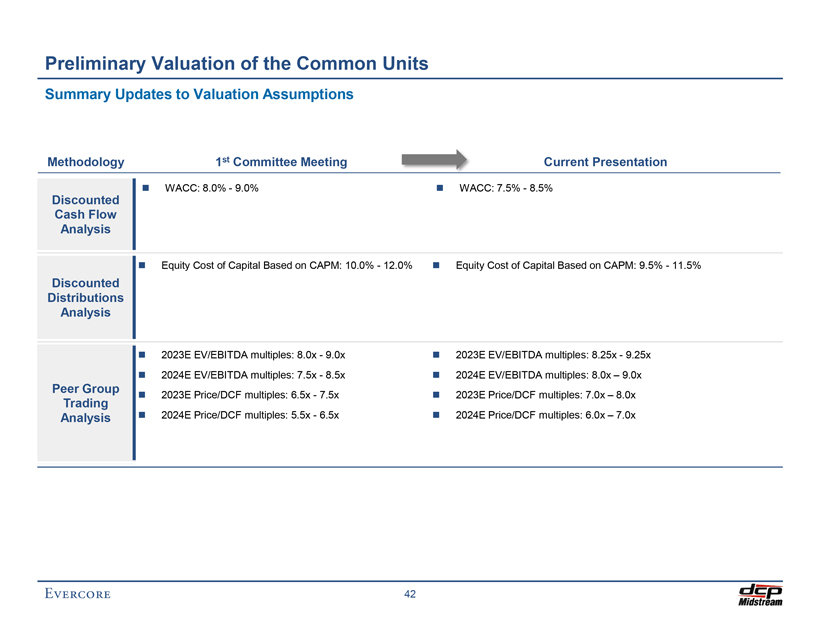
Preliminary Draft – Confidential Preliminary Valuation of the Common Units Summary Updates to Valuation Assumptions Methodology 1st Committee Meeting Current PresentationWACC: 8.0%—9.0%WACC: 7.5%—8.5% Discounted Cash Flow AnalysisEquity Cost of Capital Based on CAPM: 10.0%—12.0%Equity Cost of Capital Based on CAPM: 9.5%—11.5% Discounted Distributions Analysis2023E EV/EBITDA multiples: 8.0x—9.0x2023E EV/EBITDA multiples: 8.25x—9.25x2024E EV/EBITDA multiples: 7.5x—8.5x2024E EV/EBITDA multiples: 8.0x – 9.0x Peer Group2023E Price/DCF multiples: 6.5x—7.5x2023E Price/DCF multiples: 7.0x – 8.0x Trading Analysis2024E Price/DCF multiples: 5.5x—6.5x2024E Price/DCF multiples: 6.0x – 7.0x 42
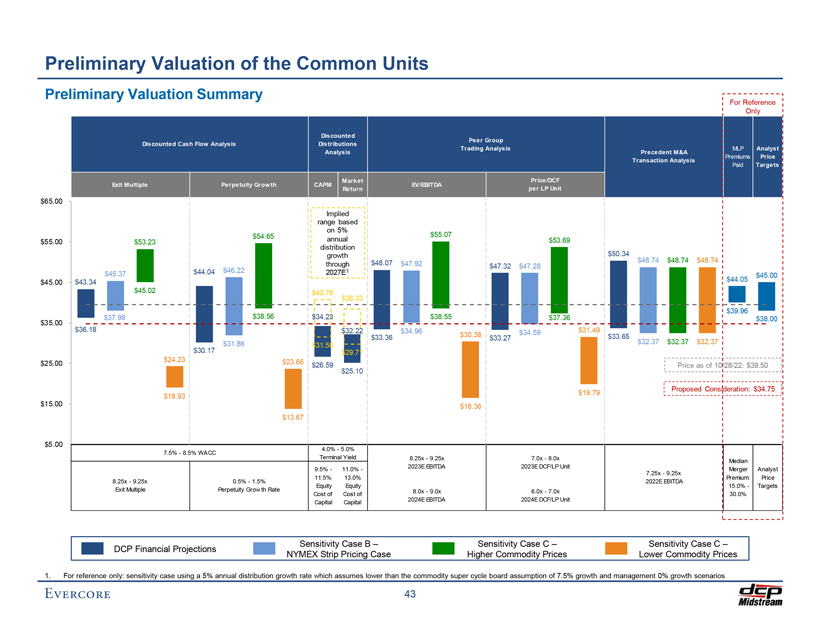
Preliminary Draft – Confidential Preliminary Valuation of the Common Units Preliminary Valuation Summary For Reference Only Discounted Peer Group Discounted Cash Flow Analysis Distributions Trading Analysis MLP Analyst Analysis Precedent M&A Premiums Price Transaction Analysis Paid Targets Market Price/DCF Exit Multiple Perpetuity Grow th CAPM EV/EBITDA Return per LP Unit $65.00 Implied range based on 5% $54.65 $55.07 $55.00 annual $53.69 $53.23 distribution $50.34 growth $48.07 $48.74 $48.74 $48.74 through $47.92 $47.32 $47.28 $45.37 $44.04 $46.22 2027E1 $45.00 $45.00 $43.34 $44.05 $45.02 $40.76 $38.33 $39.96 $35.00 $37.98 $38.56 $34.23 $38.55 $37.36 $38.00 $36.18 $32.22 $34.96 $34.59 $31.49 $33.36 $30.38 $33.65 $33.27 $31.86 $32.37 $32.37 $32.37 $31.50 $30.17 $29.71 $24.23 $23.66 $25.00 $26.59 Price as of 10/28/22: $39.50 $25.10 Proposed Consideration: $34.75 $19.79 $18.93 $15.00 $16.36 $13.67 $5.00 4.0%—5.0% 7.5%—8.5% WACC Terminal Yield 8.25x—9.25x 7.0x—8.0x 2023E EBITDA 2023E DCF/LP Unit Median 9.5%—11.0%—Merger Analyst 7.25x—9.25x 11.5% 13.0% Premium: Price 8.25x—9.25x 0.5%—1.5% 2022E EBITDA Equity Equity 15.0%—Targets Exit Multiple Perpetuity Grow th Rate 8.0x—9.0x 6.0x—7.0x Cost of Cost of 2024E EBITDA 2024E DCF/LP Unit 30.0% Capital Capital Sensitivity Case B – Sensitivity Case C – Sensitivity Case C –DCP Financial Projections NYMEX Strip Pricing Case Higher Commodity Prices Lower Commodity Prices 1. For reference only: sensitivity case using a 5% annual distribution growth rate which assumes lower than the commodity super cycle board assumption of 7.5% growth and management 0% growth scenarios 43
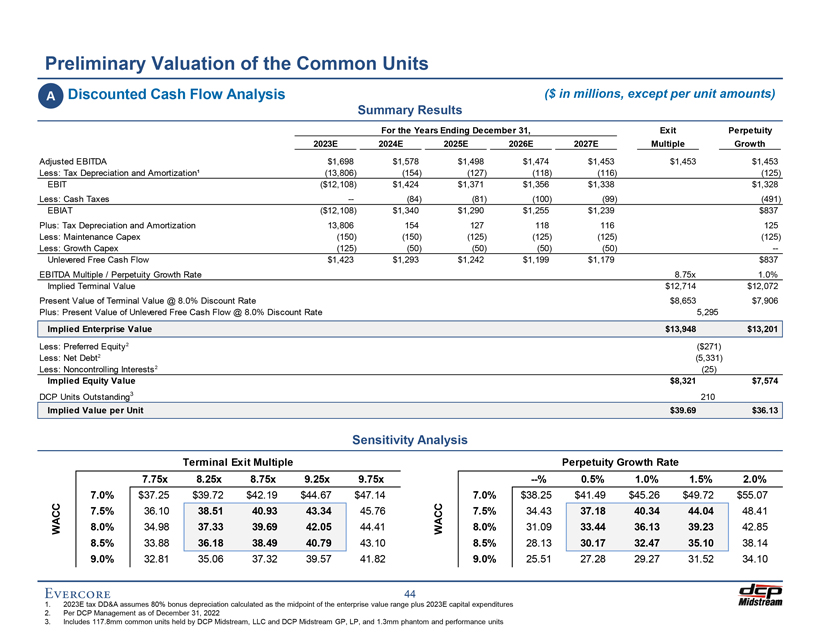
Preliminary Draft – Confidential Preliminary Valuation of the Common Units A Discounted Cash Flow Analysis ($ in millions, except per unit amounts) Summary Results For the Years Ending December 31, Exit Perpetuity 2023E 2024E 2025E 2026E 2027E Multiple Growth Adjusted EBITDA $1,698 $1,578 $1,498 $1,474 $1,453 $1,453 $1,453 Less: Tax Depreciation and Amortization¹ (13,806) (154) (127) (118) (116) (125) EBIT ($12,108) $1,424 $1,371 $1,356 $1,338 $1,328 Less: Cash Taxes — (84) (81) (100) (99) (491) EBIAT ($12,108) $1,340 $1,290 $1,255 $1,239 $837 Plus: Tax Depreciation and Amortization 13,806 154 127 118 116 125 Less: Maintenance Capex (150) (150) (125) (125) (125) (125) Less: Growth Capex (125) (50) (50) (50) (50) —Unlevered Free Cash Flow $1,423 $1,293 $1,242 $1,199 $1,179 $837 EBITDA Multiple / Perpetuity Growth Rate 8.75x 1.0% Implied Terminal Value $12,714 $12,072 Present Value of Terminal Value @ 8.0% Discount Rate $8,653 $7,906 Plus: Present Value of Unlevered Free Cash Flow @ 8.0% Discount Rate 5,295 Implied Enterprise Value $13,948 $13,201 Less: Preferred Equity2 ($271) Less: Net Debt2 (5,331) Less: Noncontrolling Interests2 (25) Implied Equity Value $8,321 $7,574 DCP Units Outstanding3 210 Implied Value per Unit $39.69 $36.13 Sensitivity Analysis Terminal Exit Multiple Perpetuity Growth Rate 7.75x 8.25x 8.75x 9.25x 9.75x —% 0.5% 1.0% 1.5% 2.0% 7.0% $37.25 $39.72 $42.19 $44.67 $47.14 7.0% $38.25 $41.49 $45.26 $49.72 $55.07 7.5% 36.10 38.51 40.93 43.34 45.76 7.5% 34.43 37.18 40.34 44.04 48.41 WACC 8.0% 34.98 37.33 39.69 42.05 44.41 WACC 8.0% 31.09 33.44 36.13 39.23 42.85 8.5% 33.88 36.18 38.49 40.79 43.10 8.5% 28.13 30.17 32.47 35.10 38.14 9.0% 32.81 35.06 37.32 39.57 41.82 9.0% 25.51 27.28 29.27 31.52 34.10 44 1. 2023E tax DD&A assumes 80% bonus depreciation calculated as the midpoint of the enterprise value range plus 2023E capital expenditures 2. Per DCP Management as of December 31, 2022 3. Includes 117.8mm common units held by DCP Midstream, LLC and DCP Midstream GP, LP, and 1.3mm phantom and performance units
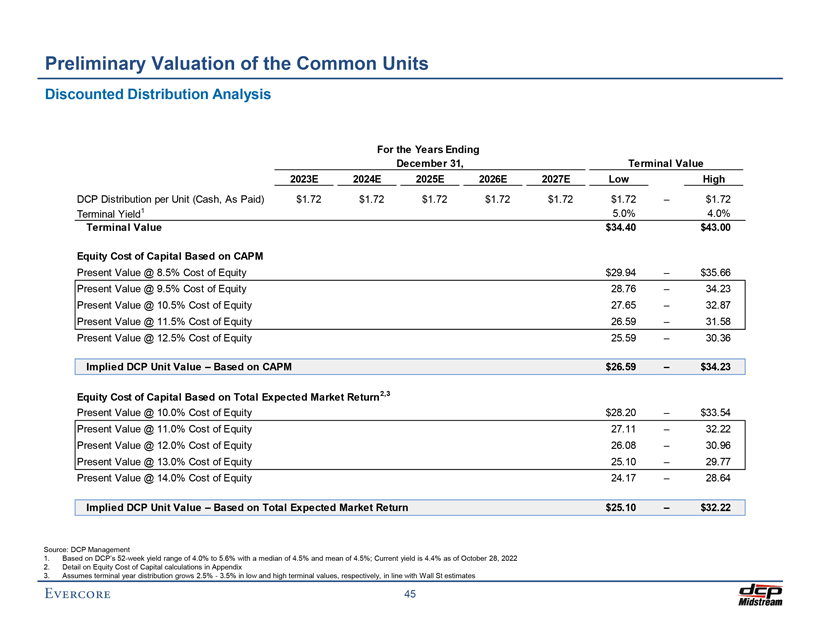
Preliminary Draft – Confidential Preliminary Valuation of the Common Units Discounted Distribution Analysis For the Years Ending December 31, Terminal Value 2023E 2024E 2025E 2026E 2027E Low High DCP Distribution per Unit (Cash, As Paid) $1.72 $1.72 $1.72 $1.72 $1.72 $1.72 – $1.72 Terminal Yield1 5.0% 4.0% Terminal Value $34.40 $43.00 Equity Cost of Capital Based on CAPM Present Value @ 8.5% Cost of Equity $29.94 – $35.66 Present Value @ 9.5% Cost of Equity 28.76 – 34.23 Present Value @ 10.5% Cost of Equity 27.65 – 32.87 Present Value @ 11.5% Cost of Equity 26.59 – 31.58 Present Value @ 12.5% Cost of Equity 25.59 – 30.36 Implied DCP Unit Value – Based on CAPM $26.59 – $34.23 Equity Cost of Capital Based on Total Expected Market Return2,3 Present Value @ 10.0% Cost of Equity $28.20 – $33.54 Present Value @ 11.0% Cost of Equity 27.11 – 32.22 Present Value @ 12.0% Cost of Equity 26.08 – 30.96 Present Value @ 13.0% Cost of Equity 25.10 – 29.77 Present Value @ 14.0% Cost of Equity 24.17 – 28.64 Implied DCP Unit Value – Based on Total Expected Market Return $25.10 – $32.22 Source: DCP Management 1. Based on DCP’s 52-week yield range of 4.0% to 5.6% with a median of 4.5% and mean of 4.5%; Current yield is 4.4% as of October 28, 2022 2. Detail on Equity Cost of Capital calculations in Appendix 3. Assumes terminal year distribution grows 2.5%—3.5% in low and high terminal values, respectively, in line with Wall St estimates 45
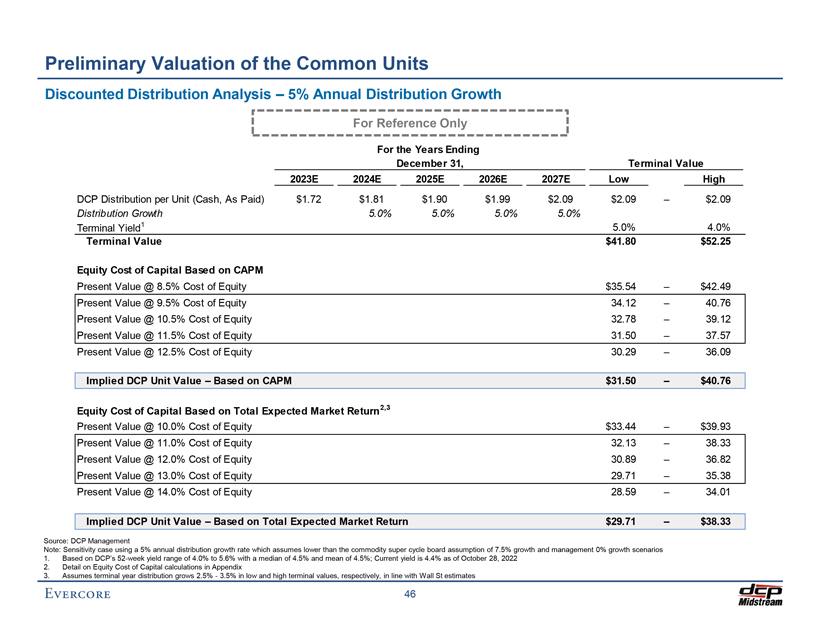
Preliminary Draft – Confidential Preliminary Valuation of the Common Units Discounted Distribution Analysis – 5% Annual Distribution Growth For Reference Only For the Years Ending December 31, Terminal Value 2023E 2024E 2025E 2026E 2027E Low High DCP Distribution per Unit (Cash, As Paid) $1.72 $1.81 $1.90 $1.99 $2.09 $2.09 – $2.09 Distribution Growth 5.0% 5.0% 5.0% 5.0% Terminal Yield1 5.0% 4.0% Terminal Value $41.80 $52.25 Equity Cost of Capital Based on CAPM Present Value @ 8.5% Cost of Equity $35.54 – $42.49 Present Value @ 9.5% Cost of Equity 34.12 – 40.76 Present Value @ 10.5% Cost of Equity 32.78 – 39.12 Present Value @ 11.5% Cost of Equity 31.50 – 37.57 Present Value @ 12.5% Cost of Equity 30.29 – 36.09 Implied DCP Unit Value – Based on CAPM $31.50 – $40.76 Equity Cost of Capital Based on Total Expected Market Return2,3 Present Value @ 10.0% Cost of Equity $33.44 – $39.93 Present Value @ 11.0% Cost of Equity 32.13 – 38.33 Present Value @ 12.0% Cost of Equity 30.89 – 36.82 Present Value @ 13.0% Cost of Equity 29.71 – 35.38 Present Value @ 14.0% Cost of Equity 28.59 – 34.01 Implied DCP Unit Value – Based on Total Expected Market Return $29.71 – $38.33 Source: DCP Management Note: Sensitivity case using a 5% annual distribution growth rate which assumes lower than the commodity super cycle board assumption of 7.5% growth and management 0% growth scenarios 1. Based on DCP’s 52-week yield range of 4.0% to 5.6% with a median of 4.5% and mean of 4.5%; Current yield is 4.4% as of October 28, 2022 2. Detail on Equity Cost of Capital calculations in Appendix 3. Assumes terminal year distribution grows 2.5%—3.5% in low and high terminal values, respectively, in line with Wall St estimates 46
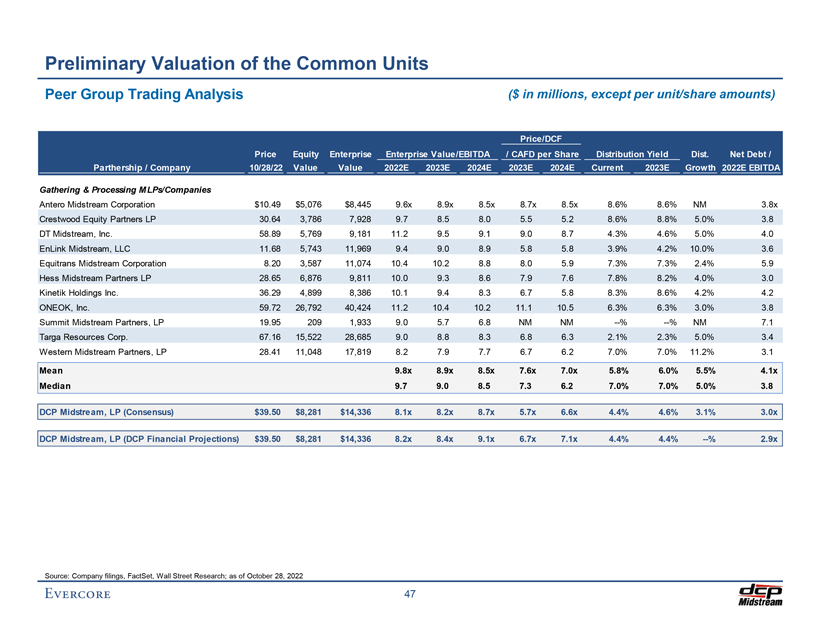
Preliminary Draft – Confidential Preliminary Valuation of the Common Units Peer Group Trading Analysis ($ in millions, except per unit/share amounts) Price/DCF Price Equity Enterprise Enterprise Value/EBITDA / CAFD per Share Distribution Yield Dist. Net Debt / Parthership / Company 10/28/22 Value Value 2022E 2023E 2024E 2023E 2024E Current 2023E Growth 2022E EBITDA Gathering & Processing MLPs/Companies Antero Midstream Corporation $10.49 $5,076 $8,445 9.6x 8.9x 8.5x 8.7x 8.5x 8.6% 8.6% NM 3.8x Crestwood Equity Partners LP 30.64 3,786 7,928 9.7 8.5 8.0 5.5 5.2 8.6% 8.8% 5.0% 3.8 DT Midstream, Inc. 58.89 5,769 9,181 11.2 9.5 9.1 9.0 8.7 4.3% 4.6% 5.0% 4.0 EnLink Midstream, LLC 11.68 5,743 11,969 9.4 9.0 8.9 5.8 5.8 3.9% 4.2% 10.0% 3.6 Equitrans Midstream Corporation 8.20 3,587 11,074 10.4 10.2 8.8 8.0 5.9 7.3% 7.3% 2.4% 5.9 Hess Midstream Partners LP 28.65 6,876 9,811 10.0 9.3 8.6 7.9 7.6 7.8% 8.2% 4.0% 3.0 Kinetik Holdings Inc. 36.29 4,899 8,386 10.1 9.4 8.3 6.7 5.8 8.3% 8.6% 4.2% 4.2 ONEOK, Inc. 59.72 26,792 40,424 11.2 10.4 10.2 11.1 10.5 6.3% 6.3% 3.0% 3.8 Summit Midstream Partners, LP 19.95 209 1,933 9.0 5.7 6.8 NM NM —% —% NM 7.1 Targa Resources Corp. 67.16 15,522 28,685 9.0 8.8 8.3 6.8 6.3 2.1% 2.3% 5.0% 3.4 Western Midstream Partners, LP 28.41 11,048 17,819 8.2 7.9 7.7 6.7 6.2 7.0% 7.0% 11.2% 3.1 Mean 9.8x 8.9x 8.5x 7.6x 7.0x 5.8% 6.0% 5.5% 4.1x Median 9.7 9.0 8.5 7.3 6.2 7.0% 7.0% 5.0% 3.8 DCP Midstream, LP (Consensus) $39.50 $8,281 $14,336 8.1x 8.2x 8.7x 5.7x 6.6x 4.4% 4.6% 3.1% 3.0x DCP Midstream, LP (DCP Financial Projections) $39.50 $8,281 $14,336 8.2x 8.4x 9.1x 6.7x 7.1x 4.4% 4.4% —% 2.9x Source: Company filings, FactSet, Wall Street Research; as of October 28, 2022 47
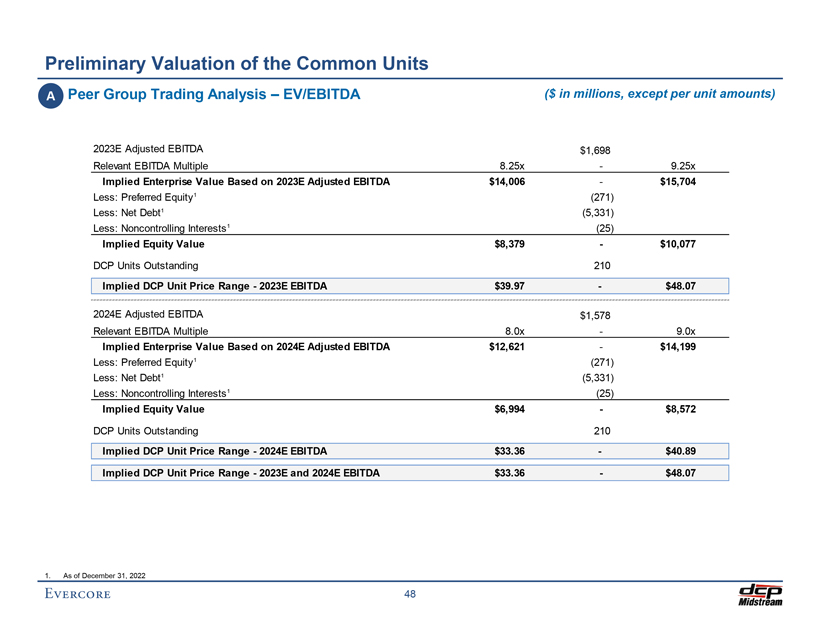
Preliminary Draft – Confidential Preliminary Valuation of the Common Units A Peer Group Trading Analysis – EV/EBITDA ($ in millions, except per unit amounts) 2023E Adjusted EBITDA $1,698 Relevant EBITDA Multiple 8.25x—9.25x Implied Enterprise Value Based on 2023E Adjusted EBITDA $14,006—$15,704 Less: Preferred Equity1 (271) Less: Net Debt1 (5,331) Less: Noncontrolling Interests1 (25) Implied Equity Value $8,379—$10,077 DCP Units Outstanding 210 Implied DCP Unit Price Range—2023E EBITDA $39.97—$48.07 2024E Adjusted EBITDA $1,578 Relevant EBITDA Multiple 8.0x—9.0x Implied Enterprise Value Based on 2024E Adjusted EBITDA $12,621—$14,199 Less: Preferred Equity1 (271) Less: Net Debt1 (5,331) Less: Noncontrolling Interests1 (25) Implied Equity Value $6,994—$8,572 DCP Units Outstanding 210 Implied DCP Unit Price Range—2024E EBITDA $33.36—$40.89 Implied DCP Unit Price Range—2023E and 2024E EBITDA $33.36—$48.07 1. As of December 31, 2022 48
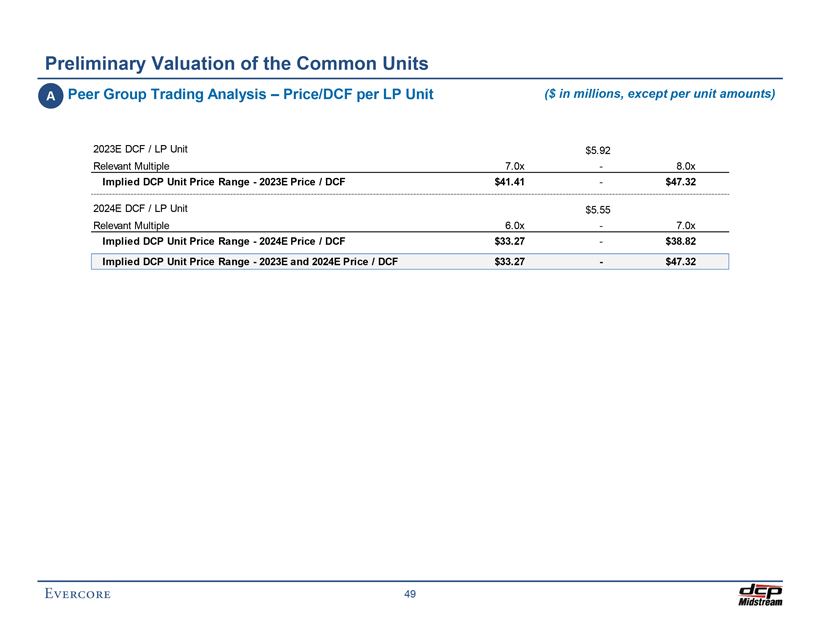
Preliminary Draft – Confidential Preliminary Valuation of the Common Units A Peer Group Trading Analysis – Price/DCF per LP Unit ($ in millions, except per unit amounts) 2023E DCF / LP Unit $5.92 Relevant Multiple 7.0x—8.0x Implied DCP Unit Price Range—2023E Price / DCF $41.41—$47.32 2024E DCF / LP Unit $5.55 Relevant Multiple 6.0x—7.0x Implied DCP Unit Price Range—2024E Price / DCF $33.27—$38.82 Implied DCP Unit Price Range—2023E and 2024E Price / DCF $33.27—$47.32 49
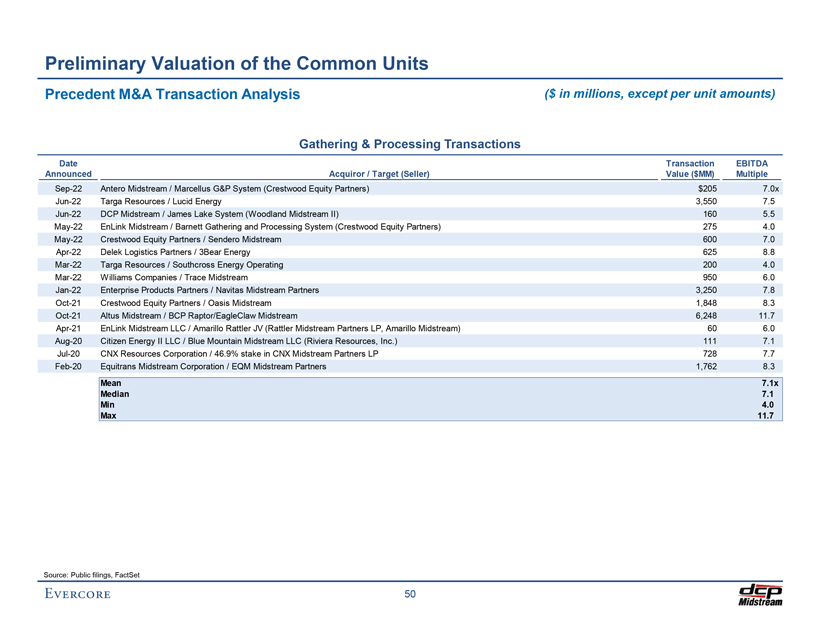
Preliminary Draft – Confidential Preliminary Valuation of the Common Units Precedent M&A Transaction Analysis ($ in millions, except per unit amounts) Gathering & Processing Transactions Date Transaction EBITDA Announced Acquiror / Target (Seller) Value ($MM) Multiple Sep-22 Antero Midstream / Marcellus G&P System (Crestwood Equity Partners) $205 7.0x Jun-22 Targa Resources / Lucid Energy 3,550 7.5 Jun-22 DCP Midstream / James Lake System (Woodland Midstream II) 160 5.5 May-22 EnLink Midstream / Barnett Gathering and Processing System (Crestwood Equity Partners) 275 4.0 May-22 Crestwood Equity Partners / Sendero Midstream 600 7.0 Apr-22 Delek Logistics Partners / 3Bear Energy 625 8.8 Mar-22 Targa Resources / Southcross Energy Operating 200 4.0 Mar-22 Williams Companies / Trace Midstream 950 6.0 Jan-22 Enterprise Products Partners / Navitas Midstream Partners 3,250 7.8 Oct-21 Crestwood Equity Partners / Oasis Midstream 1,848 8.3 Oct-21 Altus Midstream / BCP Raptor/EagleClaw Midstream 6,248 11.7 Apr-21 EnLink Midstream LLC / Amarillo Rattler JV (Rattler Midstream Partners LP, Amarillo Midstream) 60 6.0 Aug-20 Citizen Energy II LLC / Blue Mountain Midstream LLC (Riviera Resources, Inc.) 111 7.1 Jul-20 CNX Resources Corporation / 46.9% stake in CNX Midstream Partners LP 728 7.7 Feb-20 Equitrans Midstream Corporation / EQM Midstream Partners 1,762 8.3 Mean 7.1x Median 7.1 Min 4.0 Max 11.7 Source: Public filings, FactSet 50
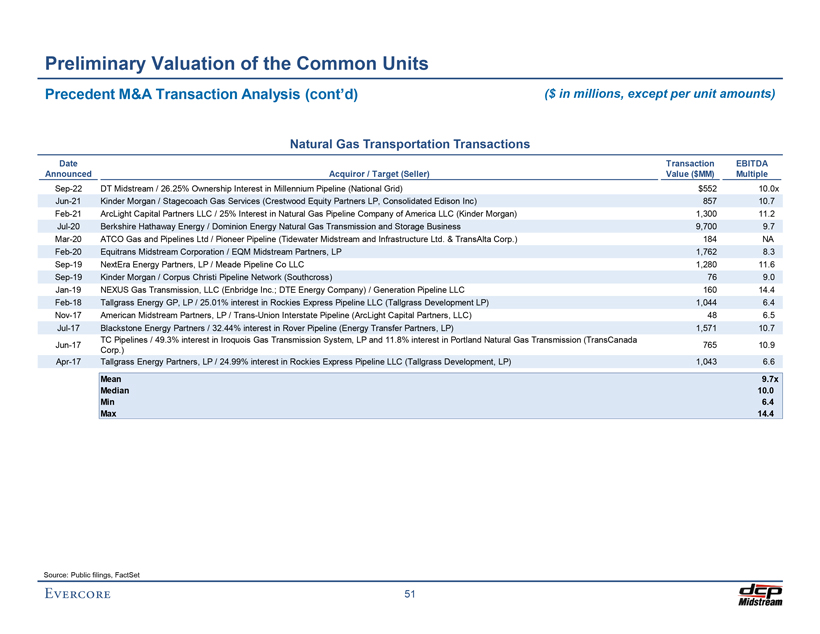
Preliminary Draft – Confidential Preliminary Valuation of the Common Units Precedent M&A Transaction Analysis (cont’d) ($ in millions, except per unit amounts) Natural Gas Transportation Transactions Date Transaction EBITDA Announced Acquiror / Target (Seller) Value ($MM) Multiple Sep-22 DT Midstream / 26.25% Ownership Interest in Millennium Pipeline (National Grid) $552 10.0x Jun-21 Kinder Morgan / Stagecoach Gas Services (Crestwood Equity Partners LP, Consolidated Edison Inc) 857 10.7 Feb-21 ArcLight Capital Partners LLC / 25% Interest in Natural Gas Pipeline Company of America LLC (Kinder Morgan) 1,300 11.2 Jul-20 Berkshire Hathaway Energy / Dominion Energy Natural Gas Transmission and Storage Business 9,700 9.7 Mar-20 ATCO Gas and Pipelines Ltd / Pioneer Pipeline (Tidewater Midstream and Infrastructure Ltd. & TransAlta Corp.) 184 NA Feb-20 Equitrans Midstream Corporation / EQM Midstream Partners, LP 1,762 8.3 Sep-19 NextEra Energy Partners, LP / Meade Pipeline Co LLC 1,280 11.6 Sep-19 Kinder Morgan / Corpus Christi Pipeline Network (Southcross) 76 9.0 Jan-19 NEXUS Gas Transmission, LLC (Enbridge Inc.; DTE Energy Company) / Generation Pipeline LLC 160 14.4 Feb-18 Tallgrass Energy GP, LP / 25.01% interest in Rockies Express Pipeline LLC (Tallgrass Development LP) 1,044 6.4 Nov-17 American Midstream Partners, LP / Trans-Union Interstate Pipeline (ArcLight Capital Partners, LLC) 48 6.5 Jul-17 Blackstone Energy Partners / 32.44% interest in Rover Pipeline (Energy Transfer Partners, LP) 1,571 10.7 TC Pipelines / 49.3% interest in Iroquois Gas Transmission System, LP and 11.8% interest in Portland Natural Gas Transmission (TransCanada Jun-17 765 10.9 Corp.) Apr-17 Tallgrass Energy Partners, LP / 24.99% interest in Rockies Express Pipeline LLC (Tallgrass Development, LP) 1,043 6.6 Mean 9.7x Median 10.0 Min 6.4 Max 14.4 Source: Public filings, FactSet 51
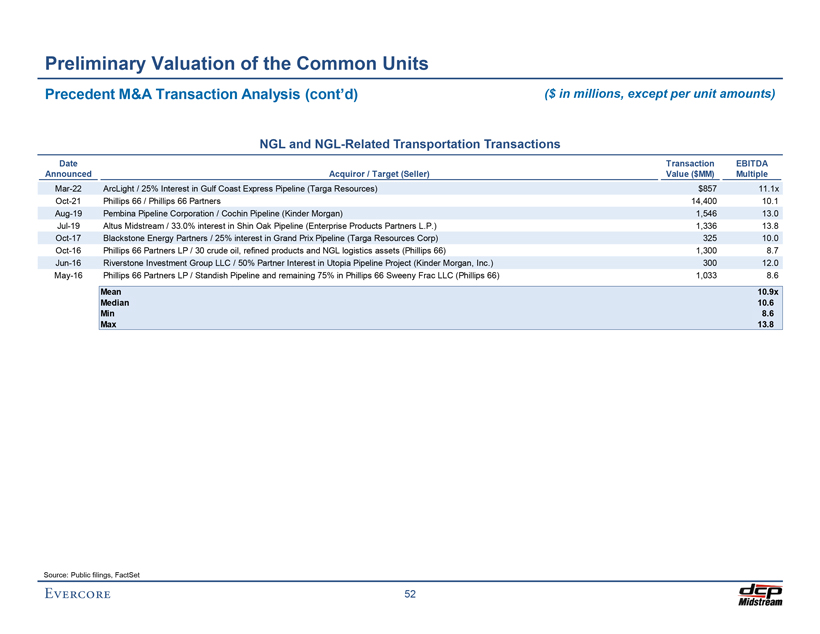
Preliminary Draft – Confidential Preliminary Valuation of the Common Units Precedent M&A Transaction Analysis (cont’d) ($ in millions, except per unit amounts) NGL and NGL-Related Transportation Transactions Date Transaction EBITDA Announced Acquiror / Target (Seller) Value ($MM) Multiple Mar-22 ArcLight / 25% Interest in Gulf Coast Express Pipeline (Targa Resources) $857 11.1x Oct-21 Phillips 66 / Phillips 66 Partners 14,40010.1 Aug-19 Pembina Pipeline Corporation / Cochin Pipeline (Kinder Morgan) 1,54613.0 Jul-19 Altus Midstream / 33.0% interest in Shin Oak Pipeline (Enterprise Products Partners L.P.) 1,33613.8 Oct-17 Blackstone Energy Partners / 25% interest in Grand Prix Pipeline (Targa Resources Corp) 32510.0 Oct-16 Phillips 66 Partners LP / 30 crude oil, refined products and NGL logistics assets (Phillips 66) 1,300 8.7 Jun-16 Riverstone Investment Group LLC / 50% Partner Interest in Utopia Pipeline Project (Kinder Morgan, Inc.) 30012.0 May-16 Phillips 66 Partners LP / Standish Pipeline and remaining 75% in Phillips 66 Sweeny Frac LLC (Phillips 66) 1,033 8.6 Mean 10.9x Median 10.6 Min 8.6 Max 13.8 Source: Public filings, FactSet 52
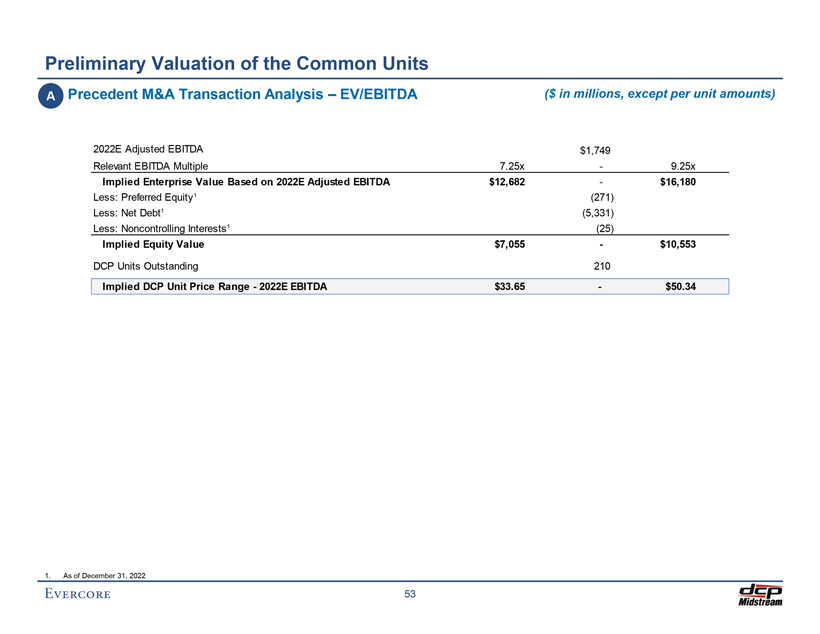
Preliminary Draft – Confidential Preliminary Valuation of the Common Units A Precedent M&A Transaction Analysis – EV/EBITDA ($ in millions, except per unit amounts) 2022E Adjusted EBITDA $1,749 Relevant EBITDA Multiple 7.25x—9.25x Implied Enterprise Value Based on 2022E Adjusted EBITDA $12,682—$16,180 Less: Preferred Equity1 (271) Less: Net Debt1 (5,331) Less: Noncontrolling Interests1 (25) Implied Equity Value $7,055—$10,553 DCP Units Outstanding 210 Implied DCP Unit Price Range—2022E EBITDA $33.65—$50.34 1. As of December 31, 2022 53
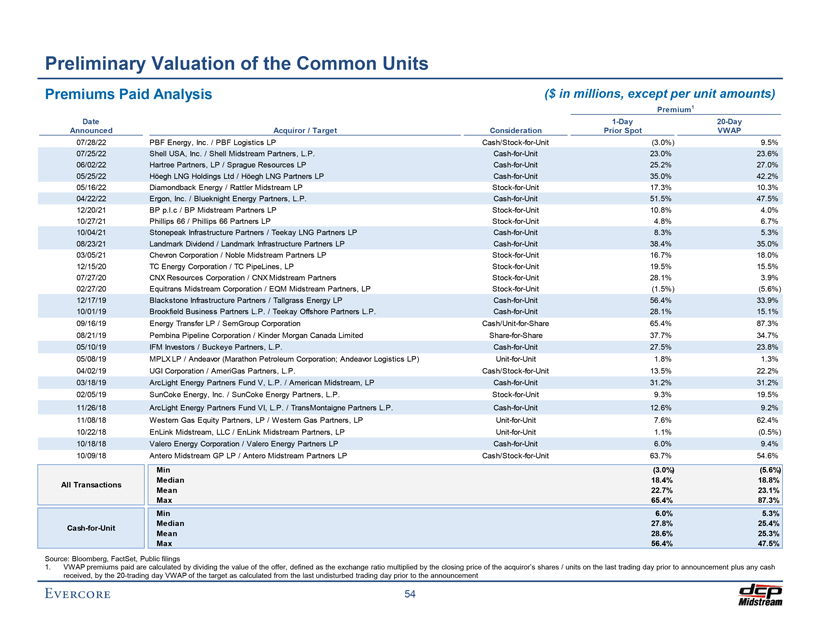
Preliminary Draft – Confidential Preliminary Valuation of the Common Units Premiums Paid Analysis ($ in millions, except per unit amounts) Premium1 Date 1-Day 20-Day Announced Acquiror / Target Consideration Prior Spot VWAP 07/28/22 PBF Energy, Inc. / PBF Logistics LP Cash/Stock-for-Unit (3.0%) 9.5% 07/25/22 Shell USA, Inc. / Shell Midstream Partners, L.P. Cash-for-Unit 23.0% 23.6% 06/02/22 Hartree Partners, LP / Sprague Resources LP Cash-for-Unit 25.2% 27.0% 05/25/22 Höegh LNG Holdings Ltd / Höegh LNG Partners LP Cash-for-Unit 35.0% 42.2% 05/16/22 Diamondback Energy / Rattler Midstream LP Stock-for-Unit 17.3% 10.3% 04/22/22 Ergon, Inc. / Blueknight Energy Partners, L.P. Cash-for-Unit 51.5% 47.5% 12/20/21 BP p.l.c / BP Midstream Partners LP Stock-for-Unit 10.8% 4.0% 10/27/21 Phillips 66 / Phillips 66 Partners LP Stock-for-Unit 4.8% 6.7% 10/04/21 Stonepeak Infrastructure Partners / Teekay LNG Partners LP Cash-for-Unit 8.3% 5.3% 08/23/21 Landmark Dividend / Landmark Infrastructure Partners LP Cash-for-Unit 38.4% 35.0% 03/05/21 Chevron Corporation / Noble Midstream Partners LP Stock-for-Unit 16.7% 18.0% 12/15/20 TC Energy Corporation / TC PipeLines, LP Stock-for-Unit 19.5% 15.5% 07/27/20 CNX Resources Corporation / CNX Midstream Partners Stock-for-Unit 28.1% 3.9% 02/27/20 Equitrans Midstream Corporation / EQM Midstream Partners, LP Stock-for-Unit (1.5%) (5.6%) 12/17/19 Blackstone Infrastructure Partners / Tallgrass Energy LP Cash-for-Unit 56.4% 33.9% 10/01/19 Brookfield Business Partners L.P. / Teekay Offshore Partners L.P. Cash-for-Unit 28.1% 15.1% 09/16/19 Energy Transfer LP / SemGroup Corporation Cash/Unit-for-Share 65.4% 87.3% 08/21/19 Pembina Pipeline Corporation / Kinder Morgan Canada Limited Share-for-Share 37.7% 34.7% 05/10/19 IFM Investors / Buckeye Partners, L.P. Cash-for-Unit 27.5% 23.8% 05/08/19 MPLX LP / Andeavor (Marathon Petroleum Corporation; Andeavor Logistics LP) Unit-for-Unit 1.8% 1.3% 04/02/19 UGI Corporation / AmeriGas Partners, L.P. Cash/Stock-for-Unit 13.5% 22.2% 03/18/19 ArcLight Energy Partners Fund V, L.P. / American Midstream, LP Cash-for-Unit 31.2% 31.2% 02/05/19 SunCoke Energy, Inc. / SunCoke Energy Partners, L.P. Stock-for-Unit 9.3% 19.5% 11/26/18 ArcLight Energy Partners Fund VI, L.P. / TransMontaigne Partners L.P. Cash-for-Unit 12.6% 9.2% 11/08/18 Western Gas Equity Partners, LP / Western Gas Partners, LP Unit-for-Unit 7.6% 62.4% 10/22/18 EnLink Midstream, LLC / EnLink Midstream Partners, LP Unit-for-Unit 1.1% (0.5%) 10/18/18 Valero Energy Corporation / Valero Energy Partners LP Cash-for-Unit 6.0% 9.4% 10/09/18 Antero Midstream GP LP / Antero Midstream Partners LP Cash/Stock-for-Unit 63.7% 54.6% Min (3.0%) (5.6%) Median 18.4% 18.8% All Transactions Mean 22.7% 23.1% Max 65.4% 87.3% Min 6.0% 5.3% Median 27.8% 25.4% Cash-for-Unit Mean 28.6% 25.3% Max 56.4% 47.5% Source: Bloomberg, FactSet, Public filings 1. VWAP premiums paid are calculated by dividing the value of the offer, defined as the exchange ratio multiplied by the closing price of the acquiror’s shares / units on the last trading day prior to announcement plus any cash received, by the 20-trading day VWAP of the target as calculated from the last undisturbed trading day prior to the announcement 54
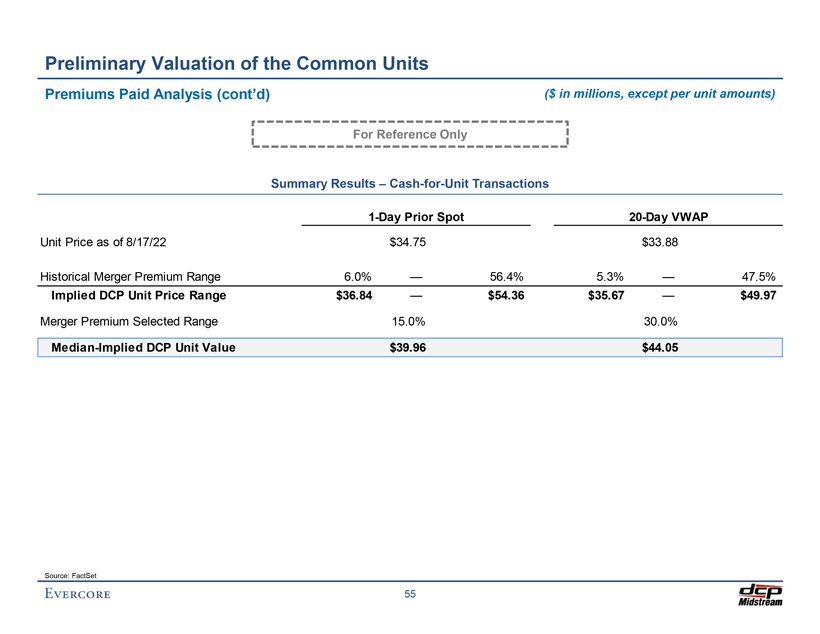
Preliminary Draft – Confidential Preliminary Valuation of the Common Units Premiums Paid Analysis (cont’d) ($ in millions, except per unit amounts) For Reference Only Summary Results – Cash-for-Unit Transactions 1-Day Prior Spot 20-Day VWAP Unit Price as of 8/17/22 $34.75 $33.88 Historical Merger Premium Range 6.0% — 56.4% 5.3% — 47.5% Implied DCP Unit Price Range $36.84 — $54.36 $35.67 — $49.97 Merger Premium Selected Range 15.0% 30.0% Median-Implied DCP Unit Value $39.96 $44.05 Source: FactSet 55
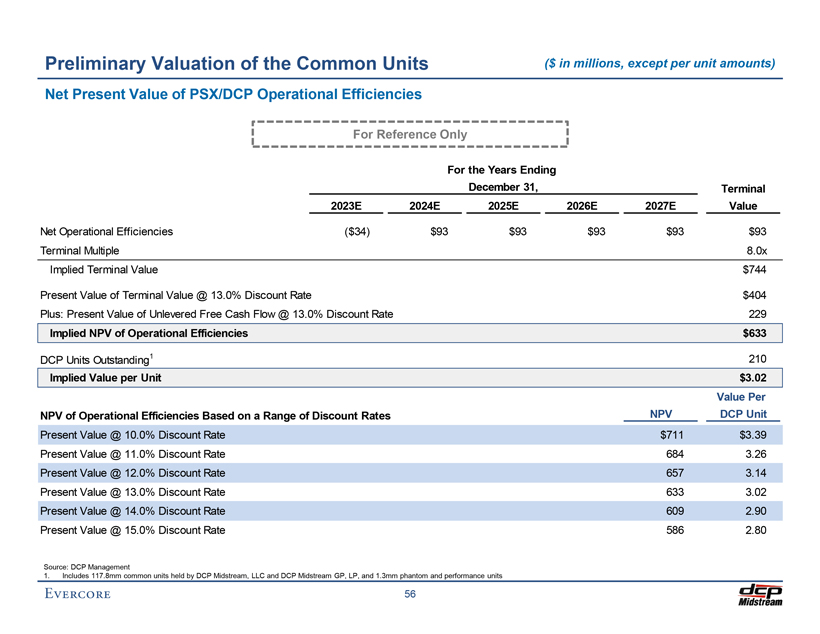
Preliminary Draft – Confidential Preliminary Valuation of the Common Units ($ in millions, except per unit amounts) Net Present Value of PSX/DCP Operational Efficiencies For Reference Only For the Years Ending December 31, Terminal 2023E 2024E 2025E 2026E 2027E Value Net Operational Efficiencies ($34) $93 $93 $93 $93 $93 Terminal Multiple 8.0x Implied Terminal Value $744 Present Value of Terminal Value @ 13.0% Discount Rate $404 Plus: Present Value of Unlevered Free Cash Flow @ 13.0% Discount Rate 229 Implied NPV of Operational Efficiencies $633 DCP Units Outstanding1 210 Implied Value per Unit $3.02 Value Per NPV of Operational Efficiencies Based on a Range of Discount Rates NPV DCP Unit Present Value @ 10.0% Discount Rate $711 $3.39 Present Value @ 11.0% Discount Rate 684 3.26 Present Value @ 12.0% Discount Rate 657 3.14 Present Value @ 13.0% Discount Rate 633 3.02 Present Value @ 14.0% Discount Rate 609 2.90 Present Value @ 15.0% Discount Rate 586 2.80 Source: DCP Management 1. Includes 117.8mm common units held by DCP Midstream, LLC and DCP Midstream GP, LP, and 1.3mm phantom and performance units 56
Preliminary Draft – Confidential VI. Illustrative DCP Unitholder Tax Analysis
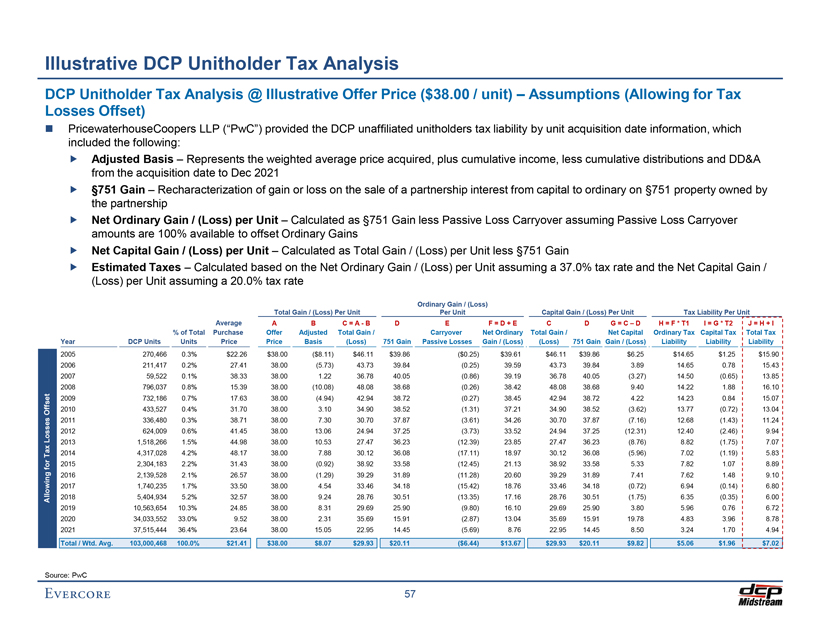
Preliminary Draft – Confidential Illustrative DCP Unitholder Tax Analysis DCP Unitholder Tax Analysis @ Illustrative Offer Price ($38.00 / unit) – Assumptions (Allowing for Tax Losses Offset) â—¼ï€ PricewaterhouseCoopers LLP (“PwC”) provided the DCP unaffiliated unitholders tax liability by unit acquisition date information, which included the following:ï,„ï€ Adjusted Basis – Represents the weighted average price acquired, plus cumulative income, less cumulative distributions and DD&A from the acquisition date to Dec 2021ï,„ï€ §751 Gain – Recharacterization of gain or loss on the sale of a partnership interest from capital to ordinary on §751 property owned by the partnershipï,„ï€ Net Ordinary Gain / (Loss) per Unit – Calculated as §751 Gain less Passive Loss Carryover assuming Passive Loss Carryover amounts are 100% available to offset Ordinary Gainsï,„ï€ Net Capital Gain / (Loss) per Unit – Calculated as Total Gain / (Loss) per Unit less §751 Gain ï,„ï€ Estimated Taxes – Calculated based on the Net Ordinary Gain / (Loss) per Unit assuming a 37.0% tax rate and the Net Capital Gain / (Loss) per Unit assuming a 20.0% tax rate Ordinary Gain / (Loss) Total Gain / (Loss) Per Unit Per Unit Capital Gain / (Loss) Per Unit Tax Liability Per Unit Average A B C = A—B D E F = D + E C D G = C – D H = F * T1 I = G * T2 J = H + I % of Total Purchase Offer Adjusted Total Gain / Carryover Net Ordinary Total Gain / Net Capital Ordinary Tax Capital Tax Total Tax Year DCP Units Units Price Price Basis (Loss) 751 Gain Passive Losses Gain / (Loss) (Loss) 751 Gain Gain / (Loss) Liability Liability Liability 2005 270,466 0.3% $22.26 $38.00 ($8.11) $46.11 $39.86 ($0.25) $39.61 $46.11 $39.86 $6.25 $14.65 $1.25 $15.90 2006 211,417 0.2% 27.41 38.00 (5.73) 43.73 39.84 (0.25) 39.59 43.73 39.84 3.89 14.65 0.78 15.43 2007 59,522 0.1% 38.33 38.00 1.22 36.78 40.05 (0.86) 39.19 36.78 40.05 (3.27) 14.50 (0.65) 13.85 2008 796,037 0.8% 15.39 38.00 (10.08) 48.08 38.68 (0.26) 38.42 48.08 38.68 9.40 14.22 1.88 16.10 t se 2009 732,186 0.7% 17.63 38.00 (4.94) 42.94 38.72 (0.27) 38.45 42.94 38.72 4.22 14.23 0.84 15.07 f f 2010 433,527 0.4% 31.70 38.00 3.10 34.90 38.52 (1.31) 37.21 34.90 38.52 (3.62) 13.77 (0.72) 13.04 O s 2011 336,480 0.3% 38.71 38.00 7.30 30.70 37.87 (3.61) 34.26 30.70 37.87 (7.16) 12.68 (1.43) 11.24 Losse 2012 624,009 0.6% 41.45 38.00 13.06 24.94 37.25 (3.73) 33.52 24.94 37.25 (12.31) 12.40 (2.46) 9.94 2013 1,518,266 1.5% 44.98 38.00 10.53 27.47 36.23 (12.39) 23.85 27.47 36.23 (8.76) 8.82 (1.75) 7.07 Tax 2014 4,317,028 4.2% 48.17 38.00 7.88 30.12 36.08 (17.11) 18.97 30.12 36.08 (5.96) 7.02 (1.19) 5.83 or 2015 2,304,183 2.2% 31.43 38.00 (0.92) 38.92 33.58 (12.45) 21.13 38.92 33.58 5.33 7.82 1.07 8.89 f ng 2016 2,139,528 2.1% 26.57 38.00 (1.29) 39.29 31.89 (11.28) 20.60 39.29 31.89 7.41 7.62 1.48 9.10 2017 1,740,235 1.7% 33.50 38.00 4.54 33.46 34.18 (15.42) 18.76 33.46 34.18 (0.72) 6.94 (0.14) 6.80 Allowi 2018 5,404,934 5.2% 32.57 38.00 9.24 28.76 30.51 (13.35) 17.16 28.76 30.51 (1.75) 6.35 (0.35) 6.00 2019 10,563,654 10.3% 24.85 38.00 8.31 29.69 25.90 (9.80) 16.10 29.69 25.90 3.80 5.96 0.76 6.72 2020 34,033,552 33.0% 9.52 38.00 2.31 35.69 15.91 (2.87) 13.04 35.69 15.91 19.78 4.83 3.96 8.78 2021 37,515,444 36.4% 23.64 38.00 15.05 22.95 14.45 (5.69) 8.76 22.95 14.45 8.50 3.24 1.70 4.94 Total / Wtd. Avg. 103,000,468 100.0% $21.41 $38.00 $8.07 $29.93 $20.11 ($6.44) $13.67 $29.93 $20.11 $9.82 $5.06 $1.96 $7.02 Source: PwC 57
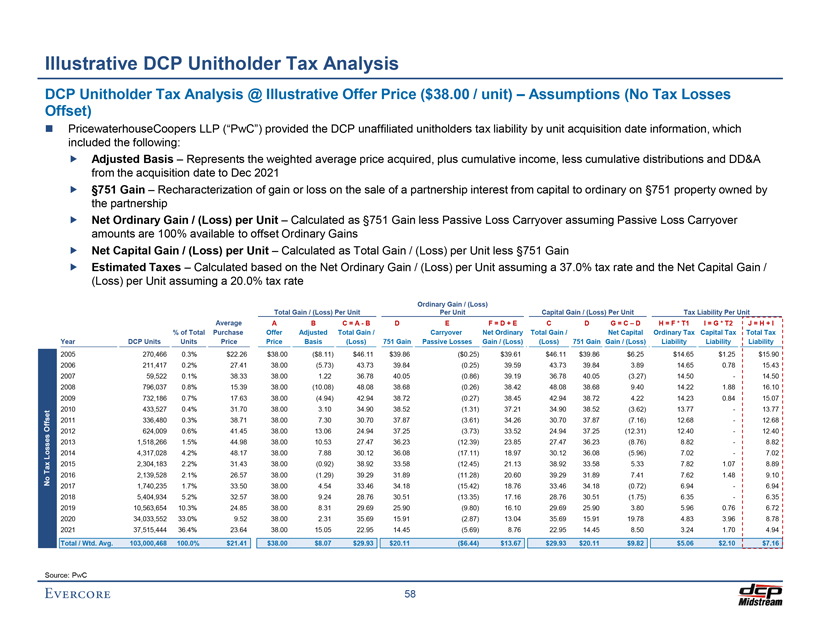
Preliminary Draft – Confidential Illustrative DCP Unitholder Tax Analysis DCP Unitholder Tax Analysis @ Illustrative Offer Price ($38.00 / unit) – Assumptions (No Tax Losses Offset) â—¼ï€ PricewaterhouseCoopers LLP (“PwC”) provided the DCP unaffiliated unitholders tax liability by unit acquisition date information, which included the following:ï,„ï€ Adjusted Basis – Represents the weighted average price acquired, plus cumulative income, less cumulative distributions and DD&A from the acquisition date to Dec 2021ï,„ï€ §751 Gain – Recharacterization of gain or loss on the sale of a partnership interest from capital to ordinary on §751 property owned by the partnershipï,„ï€ Net Ordinary Gain / (Loss) per Unit – Calculated as §751 Gain less Passive Loss Carryover assuming Passive Loss Carryover amounts are 100% available to offset Ordinary Gainsï,„ï€ Net Capital Gain / (Loss) per Unit – Calculated as Total Gain / (Loss) per Unit less §751 Gain ï,„ï€ Estimated Taxes – Calculated based on the Net Ordinary Gain / (Loss) per Unit assuming a 37.0% tax rate and the Net Capital Gain / (Loss) per Unit assuming a 20.0% tax rate Ordinary Gain / (Loss) Total Gain / (Loss) Per Unit Per Unit Capital Gain / (Loss) Per Unit Tax Liability Per Unit Average A B C = A—B D E F = D + E C D G = C – D H = F * T1 I = G * T2 J = H + I % of Total Purchase Offer Adjusted Total Gain / Carryover Net Ordinary Total Gain / Net Capital Ordinary Tax Capital Tax Total Tax Year DCP Units Units Price Price Basis (Loss) 751 Gain Passive Losses Gain / (Loss) (Loss) 751 Gain Gain / (Loss) Liability Liability Liability 2005 270,466 0.3% $22.26 $38.00 ($8.11) $46.11 $39.86 ($0.25) $39.61 $46.11 $39.86 $6.25 $14.65 $1.25 $15.90 2006 211,417 0.2% 27.41 38.00 (5.73) 43.73 39.84 (0.25) 39.59 43.73 39.84 3.89 14.65 0.78 15.43 2007 59,522 0.1% 38.33 38.00 1.22 36.78 40.05 (0.86) 39.19 36.78 40.05 (3.27) 14.50—14.50 2008 796,037 0.8% 15.39 38.00 (10.08) 48.08 38.68 (0.26) 38.42 48.08 38.68 9.40 14.22 1.88 16.10 2009 732,186 0.7% 17.63 38.00 (4.94) 42.94 38.72 (0.27) 38.45 42.94 38.72 4.22 14.23 0.84 15.07 2010 433,527 0.4% 31.70 38.00 3.10 34.90 38.52 (1.31) 37.21 34.90 38.52 (3.62) 13.77—13.77 ffset 2011 336,480 0.3% 38.71 38.00 7.30 30.70 37.87 (3.61) 34.26 30.70 37.87 (7.16) 12.68—12.68 O 2012 624,009 0.6% 41.45 38.00 13.06 24.94 37.25 (3.73) 33.52 24.94 37.25 (12.31) 12.40—12.40 es 2013 1,518,266 1.5% 44.98 38.00 10.53 27.47 36.23 (12.39) 23.85 27.47 36.23 (8.76) 8.82—8.82 Loss 2014 4,317,028 4.2% 48.17 38.00 7.88 30.12 36.08 (17.11) 18.97 30.12 36.08 (5.96) 7.02—7.02 Tax 2015 2,304,183 2.2% 31.43 38.00 (0.92) 38.92 33.58 (12.45) 21.13 38.92 33.58 5.33 7.82 1.07 8.89 o 2016 2,139,528 2.1% 26.57 38.00 (1.29) 39.29 31.89 (11.28) 20.60 39.29 31.89 7.41 7.62 1.48 9.10 N 2017 1,740,235 1.7% 33.50 38.00 4.54 33.46 34.18 (15.42) 18.76 33.46 34.18 (0.72) 6.94—6.94 2018 5,404,934 5.2% 32.57 38.00 9.24 28.76 30.51 (13.35) 17.16 28.76 30.51 (1.75) 6.35—6.35 2019 10,563,654 10.3% 24.85 38.00 8.31 29.69 25.90 (9.80) 16.10 29.69 25.90 3.80 5.96 0.76 6.72 2020 34,033,552 33.0% 9.52 38.00 2.31 35.69 15.91 (2.87) 13.04 35.69 15.91 19.78 4.83 3.96 8.78 2021 37,515,444 36.4% 23.64 38.00 15.05 22.95 14.45 (5.69) 8.76 22.95 14.45 8.50 3.24 1.70 4.94 Total / Wtd. Avg. 103,000,468 100.0% $21.41 $38.00 $8.07 $29.93 $20.11 ($6.44) $13.67 $29.93 $20.11 $9.82 $5.06 $2.10 $7.16 Source: PwC 58
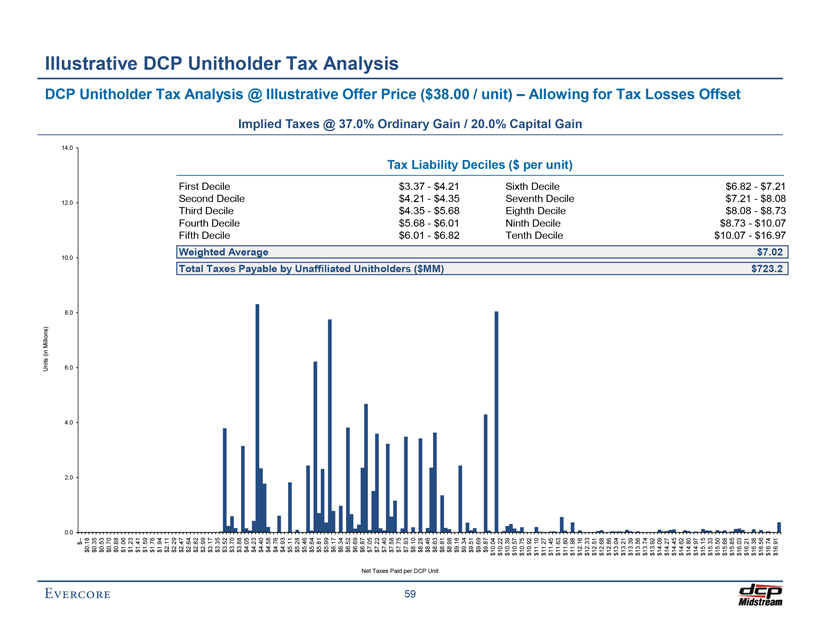
Units (in Millions) . 0 2 . 4 . 6 . . 8 10 . . 12 14 . 0 0 0 0 0 0 0 0 DCP $— $0.18 $0.35 $0.53 $0.70 $0.88 $1.06 $1.23 Illustrative $1.41 $1.59 Unitholder $1.76 $1.94 $2.11 $2.29 Tax DCP $2.47 $2.64 $2.82 Fifth First $2.99 Total ThirdFourth $3.17 Second $3.35 Weighted $3.52 Decile Decile Decile $3.70 Taxes $3.88 Decile Decile Analysis $4.05 $4.23 @ $4.40 Average $4.58 Payable $4.76 Implied Unitholder $4.93$5.11by $5.28 $5.46 $5.64 Taxes Tax $5.81 $5.99 @$6.17 Illustrative $6.34 $6.52 Unaffiliated 37 $6.69 . Net $6.87 $7.05 0% Offer $7.22 Taxes $7.40$7.58 Analysis Paid $7.75 $7.93 $ $ $ $ $ Tax per Unitholders 6 . . 5 . 4 4 . 3 . 59 $8.10 ( Price DCP $8.28 $ 01 68 35 21 37( $8.46— — ——Ordinary$ Unit $8.63 MM) $ $ $ $ $ $8.81 6 6 5 4 4 $8.98 . . . . . 38 $9.16 82 01 68 35 21 Liability Gain . $9.34 / 00 $9.51 /$9.69 20 $9.87 .. $10.04 $10.22 Deciles 0% $10.39 (unit) $10.57 $ $10.75 Ninth Sixth – $10.92 Tenth Eighth $11.10 Seventh per $11.27 Capital $11.45 Decile $11.63 Decile Decile Decile $11.80 Decile unit) $11.98 $12.16 Gain $12.33Allowing $12.51 $12.68 $12.86 for $13.04 $13.21 $13.39 $13.56 Tax $13.74 $13.92 $14.09 $14.27 Preliminary $14.45 $14.62 $14.80 Losses $14.97 Draft $15.15 –$15.33 $15.50 $ $ $15.68 10 8 $ $ $ $15.85 . . 8 7 6 $16.03 07 73 . . . Offset $16.21-— 08 21 82 $16.38 $ -—$16.56 $ $ $$$ $$16.74 . 7 16 10 723 . . . 8 . 8 7 . Confidential $16.91 . 2 02 97 07 73 08 21
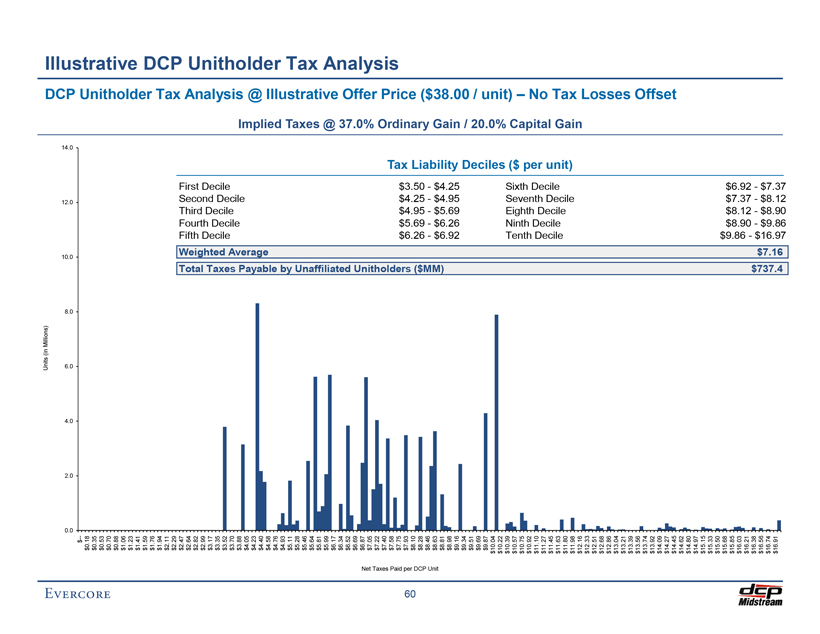
Units (in Millions) . 0 . 2 4 . 6 . . 8 10 . . 12 14 . 0 0 0 0 0 0 0 0 DCP $— $0.18 $0.35 $0.53 $0.70 $0.88 $1.06 $1.23 Illustrative $1.41 $1.59 Unitholder $1.76 $1.94 $2.11 $2.29 Tax DCP $2.47 $2.64 $2.82 Fifth First $2.99 Total ThirdFourth $3.17 Second $3.35 Weighted $3.52 Decile Decile Decile $3.70 Taxes $3.88 Decile Decile Analysis $4.05 $4.23 @ $4.40 Average $4.58 Payable $4.76 Implied Unitholder $4.93$5.11by $5.28 $5.46 $5.64 Taxes Tax $5.81 $5.99 @$6.17 Illustrative $6.34 $6.52 Unaffiliated 37 $6.69 . Net $6.87 $7.05 0% Offer $7.22 Taxes $7.40$7.58 Analysis Paid $7.75 $7.93 $ $ $ $ $ Tax per Unitholders . 6 5 . . 4 4 . . 3 60 $8.10 ( Price DCP $8.28 $ 26 69 95 25 50( $8.46--— —Ordinary$ Unit $8.63 MM) $ $ $ $ $ $8.81 6 6 5 4 4 $8.98 . . . . . 38 $9.16 92 26 69 95 25 Liability Gain . $9.34 / 00 $9.51 /$9.69 20 $9.87 . $10.04 $10.22 Deciles 0% $10.39( unit) $10.57 $ $10.75 Ninth Sixth – $10.92 Tenth Eighth $11.10 Seventh per $11.27 Capital No $11.45 $11.63 Decile Decile Decile Decile $11.80 Decile unit) $11.98 Tax $12.16 Gain $12.33 $12.51 $12.68 $12.86 $13.04 $13.21 Losses $13.39 $13.56 $13.74 $13.92 $14.09 $14.27 Preliminary $14.45 Offset $14.62 $14.80 $14.97 Draft $15.15 –$15.33 $15.50 $ $15.68 9 $ $ $ $ $15.85 . 8 8 7 6 $16.03 86 . . . . $16.21- 90 12 37 92 $16.38 $— — —$16.56 $ $ $ $ $ $ $16.74 . 7 16 737 . 9 . . 8 . 8 7 . Confidential $16.91 4 . 16 97 86 90 12 37
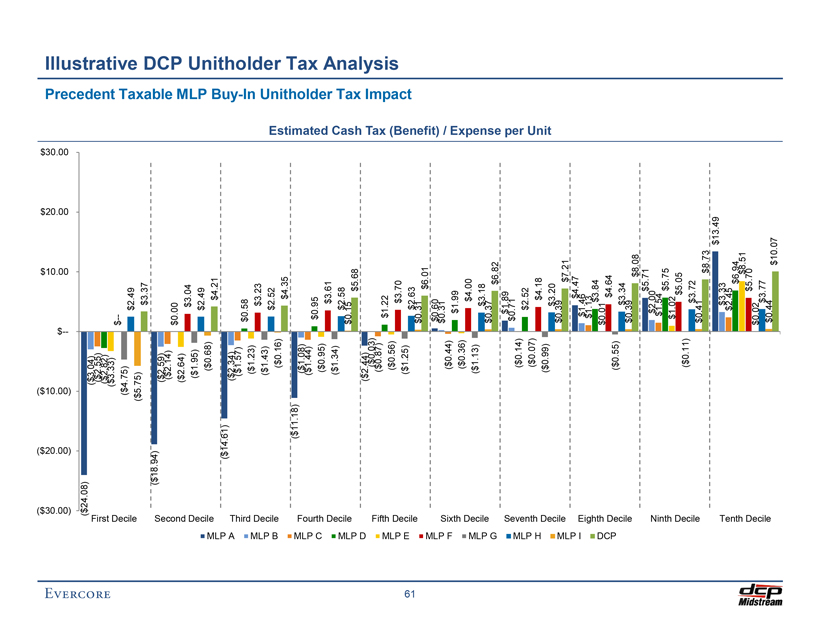
( $ ( $ ( $ $ $ $ . 30 . 20 . 10 10 20 30 . . . 00) 00) 00) — $ 00 00 00 ($24.08) ($3.04) ($2.55) First ($2.82) ($3.33) Precedent ($4.75) $— Decile $2.49 Illustrative ($5.75) $3.37 ($18.94) ($2.59) ($2.14) Taxable $0.00 DCP Second ($2.64) $3.04($1.95) $2.49 MLP Decile ($0.68) MLP $4.21($14.61) A ($2.34) Buy ($1.57) -Third $0.58($1.23) In MLP ($1.43) $3.23B Decile $2.52 Unitholder ($0.16) $4.35 ($11.18) ($1.08) MLP ($1.44) C $0.95 Tax Fourth ($0.95)$3.61 Estimated Unitholder ($1.34) $2.58 MLP Decile $0.15 $5.68Cash Tax D ($2.44)($0.03) ($0.87) Tax Fifth $1.22MLP ($0.56) Analysis $3.70 E ($1.25) Impact 61 Decile $2.63 $0.31 $6.01 $0.60 (Benefit) MLP $0.31 / F ($0.44) Sixth $1.99($0.36) $4.00 ($1.13) MLP Decile $3.18 G $0.37 $6.82 Expense $1.89$0.71 ($0.14) per MLP $2.52Seventh ($0.07) H ($0.99) $4.18 Unit $3.20 Decile $0.39 MLP $7.21 I $4.47 $1.46 $1.13 Eighth $3.84 $0.01 DCP $4.64 ($0.55) $3.34 Decile $0.39 $8.08 $5.71 $2.00 $1.54 Ninth $5.75$1.02 Preliminary $5.05 ($0.11) Decile $3.72 Draft $0.41$8.73 – $13.49 $3.33 $2.45 Tenth $6.94$8.51 $5.70 $0.02 Decile $3.77 $0.44 Confidential $10.07
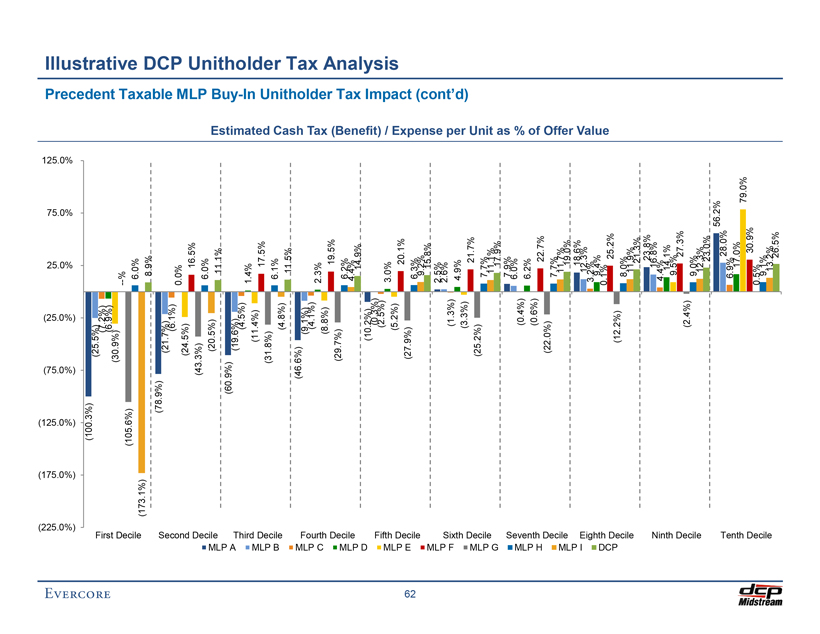
(225 . (175 . . (125 . (75 . (25 25 75 125 . 0% 0% . 0% . 0%) 0%) 0%) 0%) 0%) (100.3%) (25.5%) (7.2%) First (6.9%) Precedent (30.9%) —%(105.6%) Illustrative Decile 6.0% (173.1%) 8.9% (78.9%) (21.7%) Taxable (6.1%) 0.0% DCP Second (24.5%)16.5% (43.3%) MLP 6.0% Decile (20.5%) MLP 11.1% A (60.9%) (19.6%) Buy Third (4.5%) 1.4%—In (11.4%) MLP 17.5% Estimated(31.8%) B Decile 6.1% Unitholder (4.8%) 11.5% (46.6%) Cash MLP (9.1%)(4.1%) Tax C Fourth 2.3% Tax (8.8%) 19.5% Unitholder (29.7%) 6.2% MLP Decile 4.4% D 14.9% Tax (10.2%) (0.3%) (Benefit) (2.5%) Fifth 3.0% / MLP (5.2%) Analysis 20.1% E (27.9%) Impact 62 Decile 6 9 ..3 .2% %15.8% MLP 2.5% Expense 2.6% F (1.3%) Sixth 4.9% per (3.3%) 21.7% (cont’d) (25.2%) MLP 7.7% Decile 11.1% Unit G 17.9%7.9% as 6.0% (0.4%) % MLP 6.2%Seventh (0.6%) of H (22.0%) 22.7%7.7% Decile 11.7% 19.0% Offer MLP I 18.6% 12.3% 3.2% Eighth 9.4% 0.1% DCP 25.2% Value (12.2%) 8.0% Decile 11.9% 21.3% 23.8% 16.8% 4.4% Ninth 14.1% Preliminary 9.5% 27.3%(2.4%) Decile 9.0% Draft 12.3% 23.0% –56.2% 28.0% 6.9% Tenth 17.0%79.0% 30.9% 0.5% Decile 9.1% Confidential 13.2% 26.5%

Preliminary Draft – Confidential Appendix
Preliminary Draft – Confidential A. Weighted Average Cost of Capital Analysis
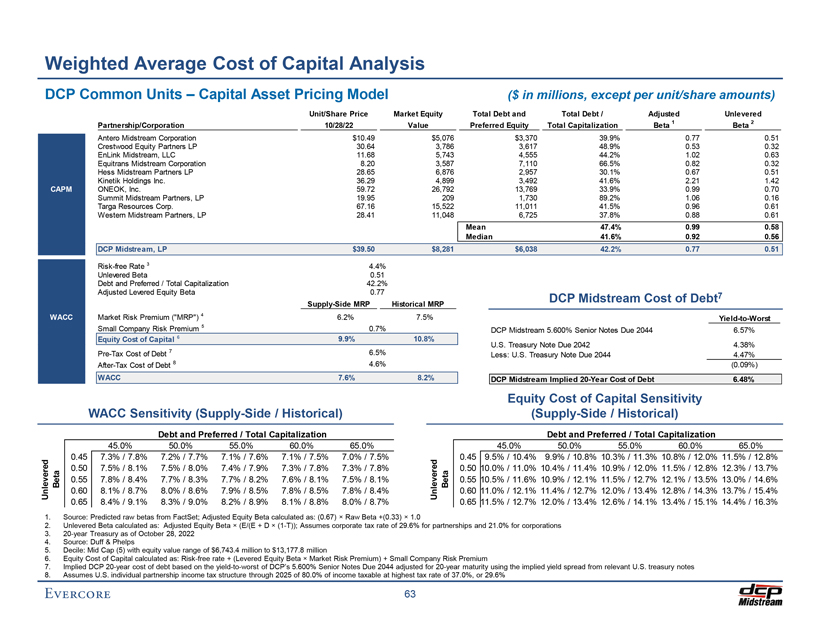
Preliminary Draft – Confidential Weighted Average Cost of Capital Analysis DCP Common Units – Capital Asset Pricing Model ($ in millions, except per unit/share amounts) Unit/Share Price Market Equity Total Debt and Total Debt / Adjusted Unlevered 1 2 Partnership/Corporation 10/28/22 Value Preferred Equity Total Capitalization Beta Beta Antero Midstream Corporation $10.49 $5,076 $3,370 39.9% 0.77 0.51 Crestwood Equity Partners LP 30.64 3,786 3,617 48.9% 0.53 0.32 EnLink Midstream, LLC 11.68 5,743 4,555 44.2% 1.02 0.63 Equitrans Midstream Corporation 8.20 3,587 7,110 66.5% 0.82 0.32 Hess Midstream Partners LP 28.65 6,876 2,957 30.1% 0.67 0.51 Kinetik Holdings Inc. 36.29 4,899 3,492 41.6% 2.21 1.42 CAPM ONEOK, Inc. 59.72 26,792 13,769 33.9% 0.99 0.70 Summit Midstream Partners, LP 19.95 209 1,730 89.2% 1.06 0.16 Targa Resources Corp. 67.16 15,522 11,011 41.5% 0.96 0.61 Western Midstream Partners, LP 28.41 11,048 6,725 37.8% 0.88 0.61 Mean 47.4% 0.99 0.58 Median 41.6% 0.92 0.56 DCP Midstream, LP $39.50 $8,281 $6,038 42.2% 0.77 0.51 Risk-free Rate 3 4.4% Unlevered Beta 0.51 Debt and Preferred / Total Capitalization 42.2% Adjusted Levered Equity Beta 0.77 DCP Midstream Cost of Debt7 Supply-Side MRP Historical MRP WACC Market Risk Premium (“MRP”) 4 6.2% 7.5% Yield-to-Worst Small Company Risk Premium 5 0.7% DCP Midstream 5.600% Senior Notes Due 2044 6.57% Equity Cost of Capital 6 9.9% 10.8% U.S. Treasury Note Due 2042 4.38% Pre-Tax Cost of Debt 7 6.5% Less: U.S. Treasury Note Due 2044 4.47% After-Tax Cost of Debt 8 4.6% (0.09%) WACC 7.6% 8.2% DCP Midstream Implied 20-Year Cost of Debt 6.48% Equity Cost of Capital Sensitivity WACC Sensitivity (Supply-Side / Historical) (Supply-Side / Historical) Debt and Preferred / Total Capitalization Debt and Preferred / Total Capitalization 45.0% 50.0% 55.0% 60.0% 65.0% 45.0% 50.0% 55.0% 60.0% 65.0% ed 0.45 7.3% / 7.8% 7.2% / 7.7% 7.1% / 7.6% 7.1% / 7.5% 7.0% / 7.5% ed 0.45 9.5% / 10.4% 9.9% / 10.8% 10.3% / 11.3% 10.8% / 12.0% 11.5% / 12.8% r 0.50 7.5% / 8.1% 7.5% / 8.0% 7.4% / 7.9% 7.3% / 7.8% 7.3% / 7.8% r 0.50 10.0% / 11.0% 10.4% / 11.4% 10.9% / 12.0% 11.5% / 12.8% 12.3% / 13.7% Beta 0.55 7.8% / 8.4% 7.7% / 8.3% 7.7% / 8.2% 7.6% / 8.1% 7.5% / 8.1% Beta 0.55 10.5% / 11.6% 10.9% / 12.1% 11.5% / 12.7% 12.1% / 13.5% 13.0% / 14.6% nleve U 0.60 8.1% / 8.7% 8.0% / 8.6% 7.9% / 8.5% 7.8% / 8.5% 7.8% / 8.4% nleve U 0.60 11.0% / 12.1% 11.4% / 12.7% 12.0% / 13.4% 12.8% / 14.3% 13.7% / 15.4% 0.65 8.4% / 9.1% 8.3% / 9.0% 8.2% / 8.9% 8.1% / 8.8% 8.0% / 8.7% 0.65 11.5% / 12.7% 12.0% / 13.4% 12.6% / 14.1% 13.4% / 15.1% 14.4% / 16.3% 1.Source: Predicted raw betas from FactSet; Adjusted Equity Beta calculated as: (0.67) × Raw Beta +(0.33) × 1.0 2.Unlevered Beta calculated as: Adjusted Equity Beta × (E/(E + D × (1-T)); Assumes corporate tax rate of 29.6% for partnerships and 21.0% for corporations 3.20-year Treasury as of October 28, 2022 4.Source: Duff & Phelps 5.Decile: Mid Cap (5) with equity value range of $6,743.4 million to $13,177.8 million 6.Equity Cost of Capital calculated as: Risk-free rate + (Levered Equity Beta × Market Risk Premium) + Small Company Risk Premium 7.Implied DCP 20-year cost of debt based on the yield-to-worst of DCP’s 5.600% Senior Notes Due 2044 adjusted for 20-year maturity using the implied yield spread from relevant U.S. treasury notes 8.Assumes U.S. individual partnership income tax structure through 2025 of 80.0% of income taxable at highest tax rate of 37.0%, or 29.6% 63
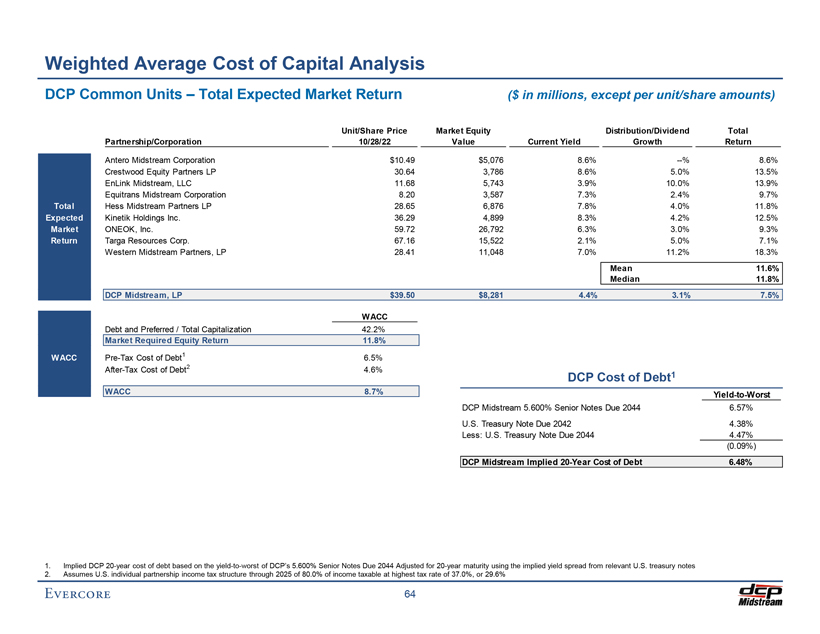
Preliminary Draft – Confidential Weighted Average Cost of Capital Analysis DCP Common Units – Total Expected Market Return ($ in millions, except per unit/share amounts) Unit/Share Price Market Equity Distribution/Dividend Total Partnership/Corporation 10/28/22 Value Current Yield Growth Return Antero Midstream Corporation $10.49 $5,076 8.6% —% 8.6% Crestwood Equity Partners LP 30.64 3,786 8.6% 5.0% 13.5% EnLink Midstream, LLC 11.68 5,743 3.9% 10.0% 13.9% Equitrans Midstream Corporation 8.20 3,587 7.3% 2.4% 9.7% Total Hess Midstream Partners LP 28.65 6,876 7.8% 4.0% 11.8% Expected Kinetik Holdings Inc. 36.29 4,899 8.3% 4.2% 12.5% Market ONEOK, Inc. 59.72 26,792 6.3% 3.0% 9.3% Return Targa Resources Corp. 67.16 15,522 2.1% 5.0% 7.1% Western Midstream Partners, LP 28.41 11,048 7.0% 11.2% 18.3% Mean 11.6% Median 11.8% DCP Midstream, LP $39.50 $8,281 4.4% 3.1% 7.5% WACC Debt and Preferred / Total Capitalization 42.2% Market Required Equity Return 11.8% WACC Pre-Tax Cost of Debt1 6.5% After-Tax Cost of Debt2 4.6% DCP Cost of Debt1 WACC 8.7% Yield-to-Worst DCP Midstream 5.600% Senior Notes Due 2044 6.57% U.S. Treasury Note Due 2042 4.38% Less: U.S. Treasury Note Due 2044 4.47% (0.09%) DCP Midstream Implied 20-Year Cost of Debt 6.48% 1. Implied DCP 20-year cost of debt based on the yield-to-worst of DCP’s 5.600% Senior Notes Due 2044 Adjusted for 20-year maturity using the implied yield spread from relevant U.S. treasury notes 2. Assumes U.S. individual partnership income tax structure through 2025 of 80.0% of income taxable at highest tax rate of 37.0%, or 29.6% 64
Preliminary Draft – Confidential B. Supplemental Valuation Materials
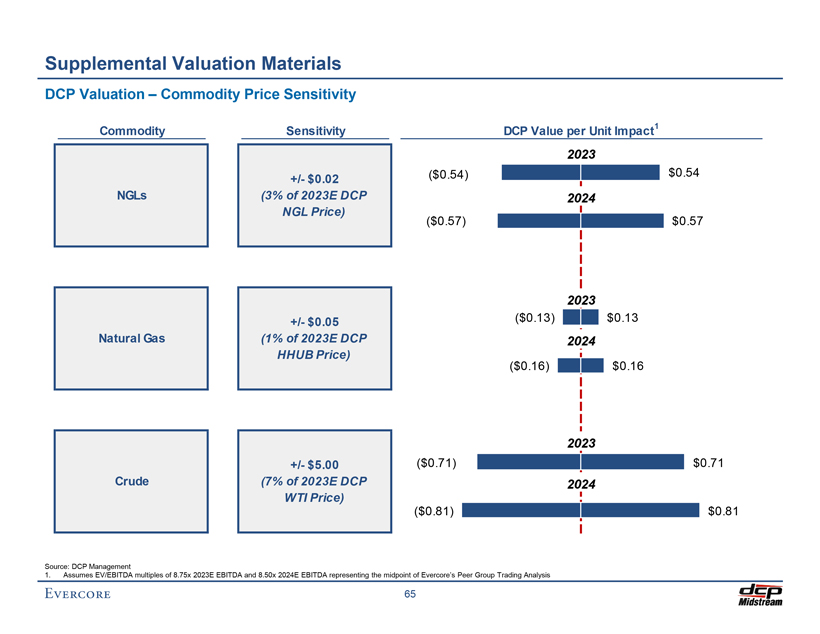
Preliminary Draft – Confidential Supplemental Valuation Materials DCP Valuation – Commodity Price Sensitivity Commodity Sensitivity DCP Value per Unit Impact1 2023 ($0.54) $0.54 +/- $0.02 NGLs (3% of 2023E DCP 2024 NGL Price) ($0.57) $0.57 2023 +/- $0.05 ($0.13) $0.13 Natural Gas (1% of 2023E DCP 2024 HHUB Price) ($0.16) $0.16 2023 +/- $5.00 ($0.71) $0.71 Crude (7% of 2023E DCP 2024 WTI Price) ($0.81) $0.81 Source: DCP Management 1. Assumes EV/EBITDA multiples of 8.75x 2023E EBITDA and 8.50x 2024E EBITDA representing the midpoint of Evercore’s Peer Group Trading Analysis 65
Preliminary Draft – Confidential B NYMEX Strip Pricing
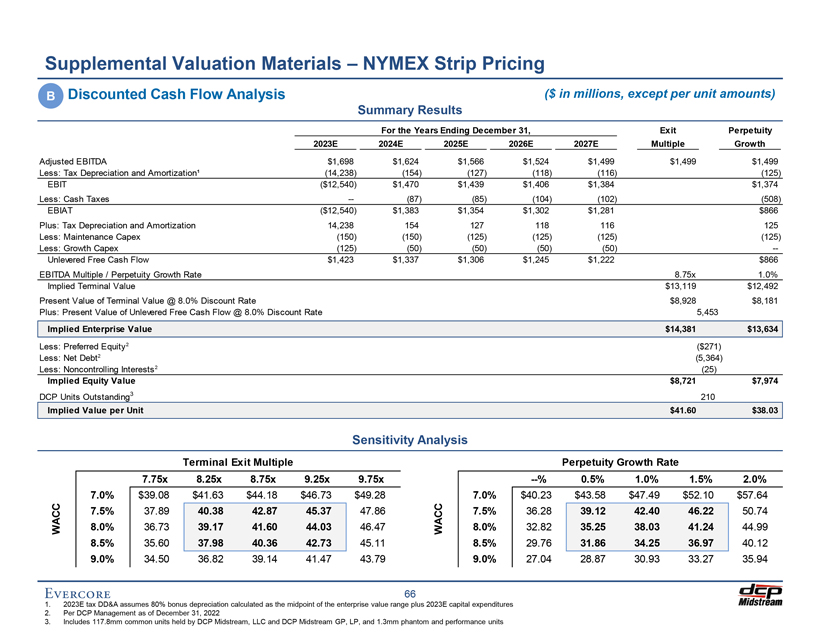
Preliminary Draft – Confidential Supplemental Valuation Materials – NYMEX Strip Pricing B Discounted Cash Flow Analysis ($ in millions, except per unit amounts) Summary Results For the Years Ending December 31, Exit Perpetuity 2023E 2024E 2025E 2026E 2027E Multiple Growth Adjusted EBITDA $1,698 $1,624 $1,566 $1,524 $1,499 $1,499 $1,499 Less: Tax Depreciation and Amortization¹ (14,238) (154) (127) (118) (116) (125) EBIT ($12,540) $1,470 $1,439 $1,406 $1,384 $1,374 Less: Cash Taxes — (87) (85) (104) (102) (508) EBIAT ($12,540) $1,383 $1,354 $1,302 $1,281 $866 Plus: Tax Depreciation and Amortization 14,238 154 127 118 116 125 Less: Maintenance Capex (150) (150) (125) (125) (125) (125) Less: Growth Capex (125) (50) (50) (50) (50) —Unlevered Free Cash Flow $1,423 $1,337 $1,306 $1,245 $1,222 $866 EBITDA Multiple / Perpetuity Growth Rate 8.75x 1.0% Implied Terminal Value $13,119 $12,492 Present Value of Terminal Value @ 8.0% Discount Rate $8,928 $8,181 Plus: Present Value of Unlevered Free Cash Flow @ 8.0% Discount Rate 5,453 Implied Enterprise Value $14,381 $13,634 Less: Preferred Equity2 ($271) Less: Net Debt2 (5,364) Less: Noncontrolling Interests2 (25) Implied Equity Value $8,721 $7,974 DCP Units Outstanding3 210 Implied Value per Unit $41.60 $38.03 Sensitivity Analysis Terminal Exit Multiple Perpetuity Growth Rate 7.75x 8.25x 8.75x 9.25x 9.75x —% 0.5% 1.0% 1.5% 2.0% 7.0% $39.08 $41.63 $44.18 $46.73 $49.28 7.0% $40.23 $43.58 $47.49 $52.10 $57.64 7.5% 37.89 40.38 42.87 45.37 47.86 7.5% 36.28 39.12 42.40 46.22 50.74 WACC 8.0% 36.73 39.17 41.60 44.03 46.47 WACC 8.0% 32.82 35.25 38.03 41.24 44.99 8.5% 35.60 37.98 40.36 42.73 45.11 8.5% 29.76 31.86 34.25 36.97 40.12 9.0% 34.50 36.82 39.14 41.47 43.79 9.0% 27.04 28.87 30.93 33.27 35.94 66 1. 2023E tax DD&A assumes 80% bonus depreciation calculated as the midpoint of the enterprise value range plus 2023E capital expenditures 2. Per DCP Management as of December 31, 2022 3. Includes 117.8mm common units held by DCP Midstream, LLC and DCP Midstream GP, LP, and 1.3mm phantom and performance units
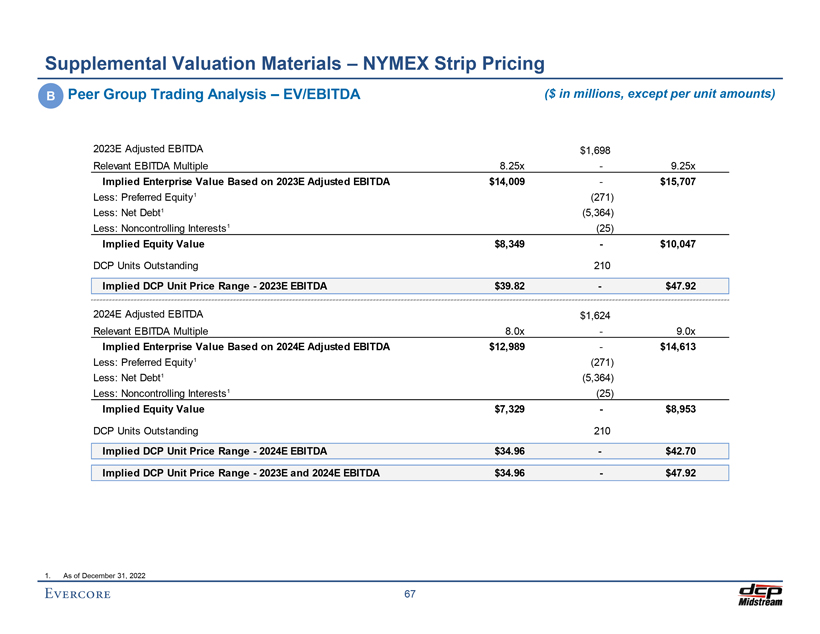
Preliminary Draft – Confidential Supplemental Valuation Materials – NYMEX Strip Pricing B Peer Group Trading Analysis – EV/EBITDA ($ in millions, except per unit amounts) 2023E Adjusted EBITDA $1,698 Relevant EBITDA Multiple 8.25x—9.25x Implied Enterprise Value Based on 2023E Adjusted EBITDA $14,009—$15,707 Less: Preferred Equity1 (271) Less: Net Debt1 (5,364) Less: Noncontrolling Interests1 (25) Implied Equity Value $8,349—$10,047 DCP Units Outstanding 210 Implied DCP Unit Price Range—2023E EBITDA $39.82—$47.92 2024E Adjusted EBITDA $1,624 Relevant EBITDA Multiple 8.0x—9.0x Implied Enterprise Value Based on 2024E Adjusted EBITDA $12,989—$14,613 Less: Preferred Equity1 (271) Less: Net Debt1 (5,364) Less: Noncontrolling Interests1 (25) Implied Equity Value $7,329—$8,953 DCP Units Outstanding 210 Implied DCP Unit Price Range—2024E EBITDA $34.96—$42.70 Implied DCP Unit Price Range—2023E and 2024E EBITDA $34.96—$47.92 1. As of December 31, 2022 67
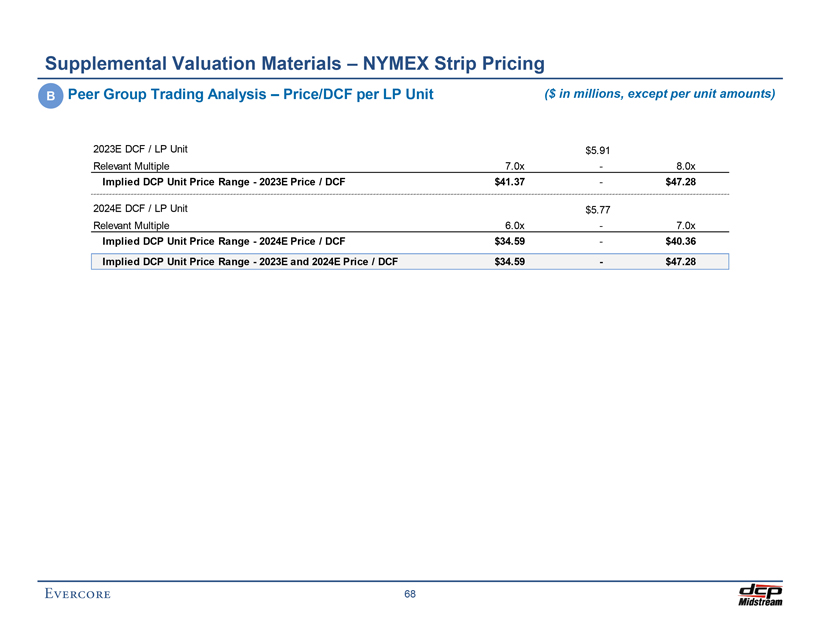
Preliminary Draft – Confidential Supplemental Valuation Materials – NYMEX Strip Pricing B Peer Group Trading Analysis – Price/DCF per LP Unit ($ in millions, except per unit amounts) 2023E DCF / LP Unit $5.91 Relevant Multiple 7.0x—8.0x Implied DCP Unit Price Range—2023E Price / DCF $41.37—$47.28 2024E DCF / LP Unit $5.77 Relevant Multiple 6.0x—7.0x Implied DCP Unit Price Range—2024E Price / DCF $34.59—$40.36 Implied DCP Unit Price Range—2023E and 2024E Price / DCF $34.59—$47.28 68
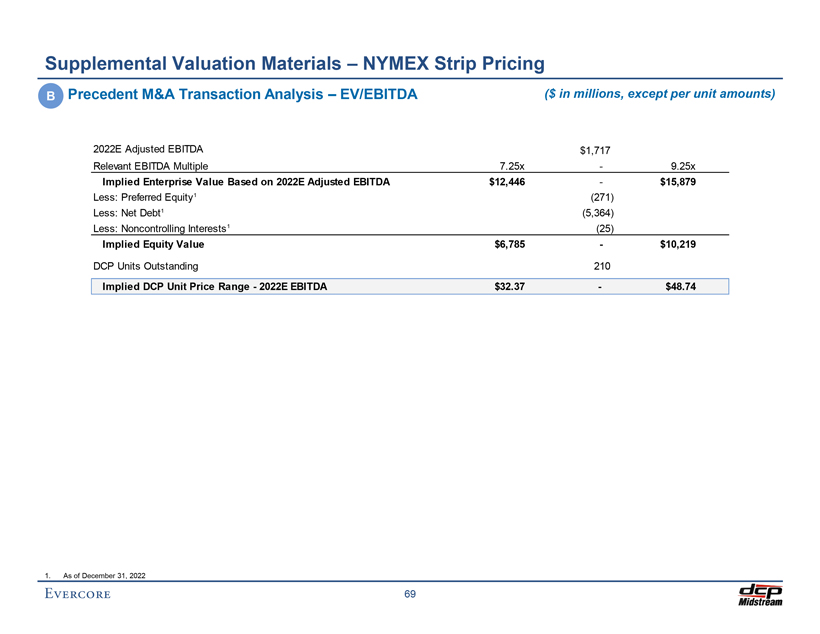
Preliminary Draft – Confidential Supplemental Valuation Materials – NYMEX Strip Pricing B Precedent M&A Transaction Analysis – EV/EBITDA ($ in millions, except per unit amounts) 2022E Adjusted EBITDA $1,717 Relevant EBITDA Multiple 7.25x—9.25x Implied Enterprise Value Based on 2022E Adjusted EBITDA $12,446—$15,879 Less: Preferred Equity1 (271) Less: Net Debt1 (5,364) Less: Noncontrolling Interests1 (25) Implied Equity Value $6,785—$10,219 DCP Units Outstanding 210 Implied DCP Unit Price Range—2022E EBITDA $32.37—$48.74 1. As of December 31, 2022 69
Preliminary Draft – Confidential C Higher Commodity Prices
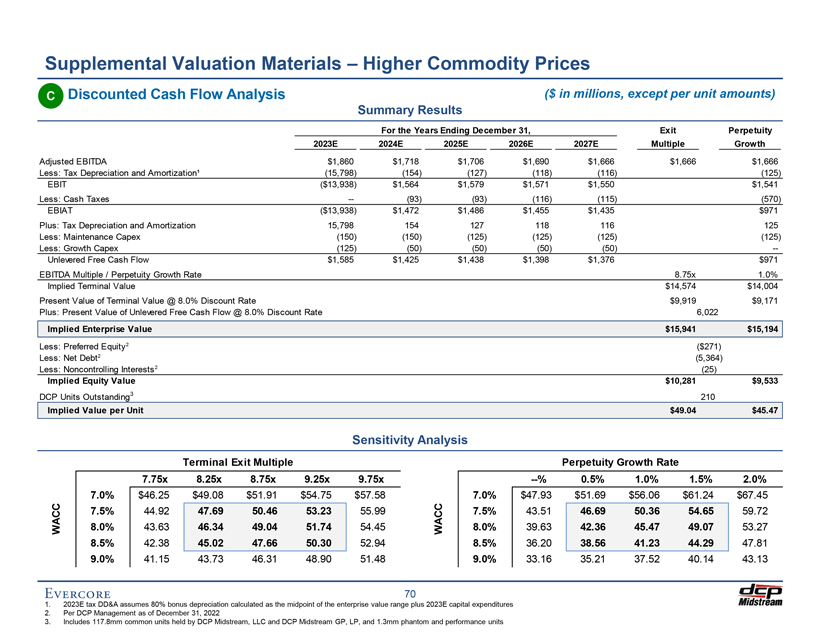
Preliminary Draft – Confidential Supplemental Valuation Materials – Higher Commodity Prices C Discounted Cash Flow Analysis ($ in millions, except per unit amounts) Summary Results For the Years Ending December 31, Exit Perpetuity 2023E 2024E 2025E 2026E 2027E Multiple Growth Adjusted EBITDA $1,860 $1,718 $1,706 $1,690 $1,666 $1,666 $1,666 Less: Tax Depreciation and Amortization¹ (15,798) (154) (127) (118) (116) (125) EBIT ($13,938) $1,564 $1,579 $1,571 $1,550 $1,541 Less: Cash Taxes — (93) (93) (116) (115) (570) EBIAT ($13,938) $1,472 $1,486 $1,455 $1,435 $971 Plus: Tax Depreciation and Amortization 15,798 154 127 118 116 125 Less: Maintenance Capex (150) (150) (125) (125) (125) (125) Less: Growth Capex (125) (50) (50) (50) (50) —Unlevered Free Cash Flow $1,585 $1,425 $1,438 $1,398 $1,376 $971 EBITDA Multiple / Perpetuity Growth Rate 8.75x 1.0% Implied Terminal Value $14,574 $14,004 Present Value of Terminal Value @ 8.0% Discount Rate $9,919 $9,171 Plus: Present Value of Unlevered Free Cash Flow @ 8.0% Discount Rate 6,022 Implied Enterprise Value $15,941 $15,194 Less: Preferred Equity2 ($271) Less: Net Debt2 (5,364) Less: Noncontrolling Interests2 (25) Implied Equity Value $10,281 $9,533 DCP Units Outstanding3 210 Implied Value per Unit $49.04 $45.47 Sensitivity Analysis Terminal Exit Multiple Perpetuity Growth Rate 7.75x 8.25x 8.75x 9.25x 9.75x —% 0.5% 1.0% 1.5% 2.0% 7.0% $46.25 $49.08 $51.91 $54.75 $57.58 7.0% $47.93 $51.69 $56.06 $61.24 $67.45 7.5% 44.92 47.69 50.46 53.23 55.99 7.5% 43.51 46.69 50.36 54.65 59.72 WACC 8.0% 43.63 46.34 49.04 51.74 54.45 WACC 8.0% 39.63 42.36 45.47 49.07 53.27 8.5% 42.38 45.02 47.66 50.30 52.94 8.5% 36.20 38.56 41.23 44.29 47.81 9.0% 41.15 43.73 46.31 48.90 51.48 9.0% 33.16 35.21 37.52 40.14 43.13 70 1. 2023E tax DD&A assumes 80% bonus depreciation calculated as the midpoint of the enterprise value range plus 2023E capital expenditures 2. Per DCP Management as of December 31, 2022 3. Includes 117.8mm common units held by DCP Midstream, LLC and DCP Midstream GP, LP, and 1.3mm phantom and performance units
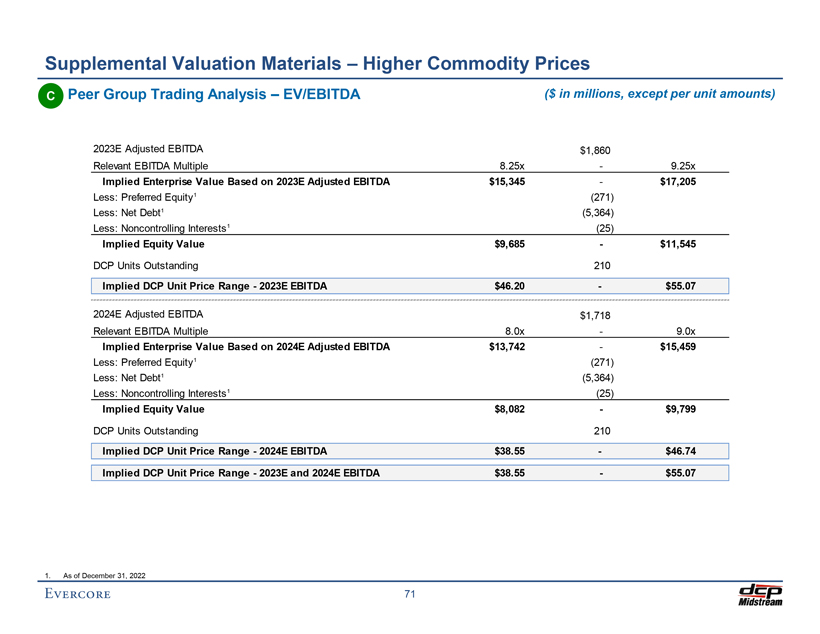
Preliminary Draft – Confidential Supplemental Valuation Materials – Higher Commodity Prices C Peer Group Trading Analysis – EV/EBITDA ($ in millions, except per unit amounts) 2023E Adjusted EBITDA $1,860 Relevant EBITDA Multiple 8.25x—9.25x Implied Enterprise Value Based on 2023E Adjusted EBITDA $15,345—$17,205 Less: Preferred Equity1 (271) Less: Net Debt1 (5,364) Less: Noncontrolling Interests1 (25) Implied Equity Value $9,685—$11,545 DCP Units Outstanding 210 Implied DCP Unit Price Range—2023E EBITDA $46.20—$55.07 2024E Adjusted EBITDA $1,718 Relevant EBITDA Multiple 8.0x—9.0x Implied Enterprise Value Based on 2024E Adjusted EBITDA $13,742—$15,459 Less: Preferred Equity1 (271) Less: Net Debt1 (5,364) Less: Noncontrolling Interests1 (25) Implied Equity Value $8,082—$9,799 DCP Units Outstanding 210 Implied DCP Unit Price Range—2024E EBITDA $38.55—$46.74 Implied DCP Unit Price Range—2023E and 2024E EBITDA $38.55—$55.07 1. As of December 31, 2022 71
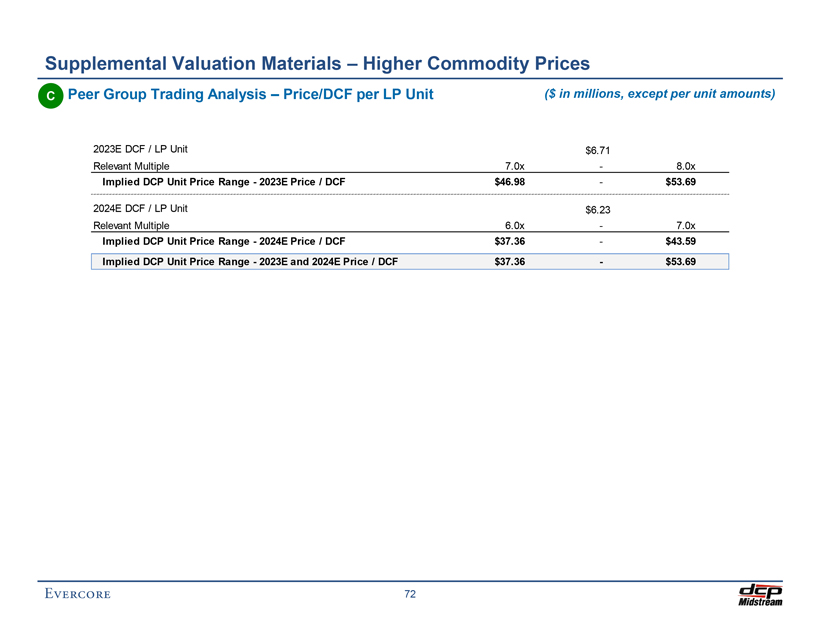
Preliminary Draft – Confidential Supplemental Valuation Materials – Higher Commodity Prices C Peer Group Trading Analysis – Price/DCF per LP Unit ($ in millions, except per unit amounts) 2023E DCF / LP Unit $6.71 Relevant Multiple 7.0x—8.0x Implied DCP Unit Price Range—2023E Price / DCF $46.98—$53.69 2024E DCF / LP Unit $6.23 Relevant Multiple 6.0x—7.0x Implied DCP Unit Price Range—2024E Price / DCF $37.36—$43.59 Implied DCP Unit Price Range—2023E and 2024E Price / DCF $37.36—$53.69 72
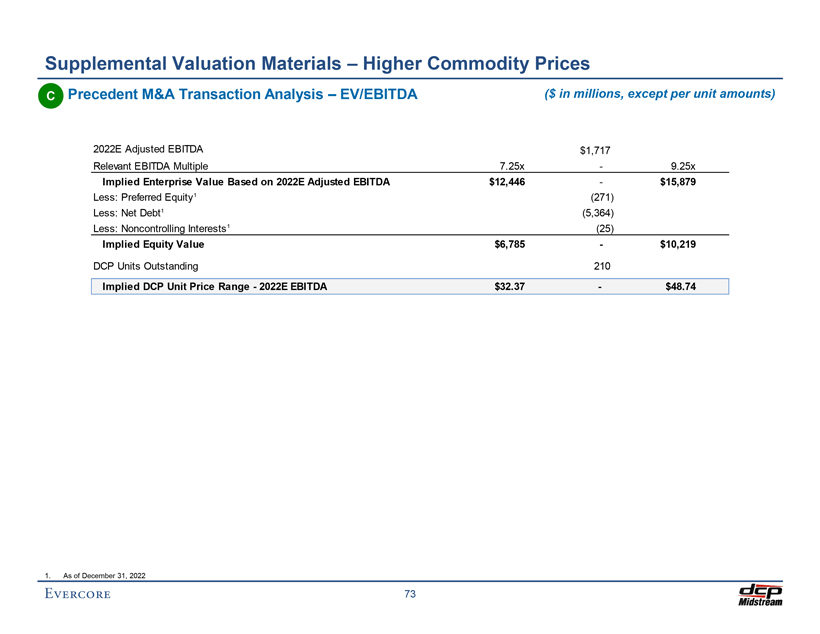
Preliminary Draft – Confidential Supplemental Valuation Materials – Higher Commodity Prices C Precedent M&A Transaction Analysis – EV/EBITDA ($ in millions, except per unit amounts) 2022E Adjusted EBITDA $1,717 Relevant EBITDA Multiple 7.25x—9.25x Implied Enterprise Value Based on 2022E Adjusted EBITDA $12,446—$15,879 Less: Preferred Equity1 (271) Less: Net Debt1 (5,364) Less: Noncontrolling Interests1 (25) Implied Equity Value $6,785—$10,219 DCP Units Outstanding 210 Implied DCP Unit Price Range—2022E EBITDA $32.37—$48.74 1. As of December 31, 2022 73

Preliminary Draft – Confidential D Downside Case
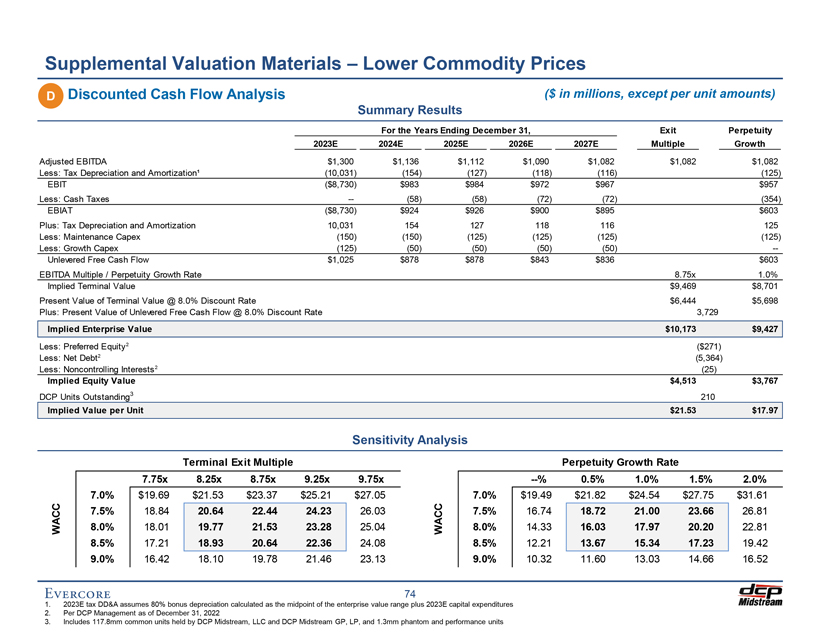
Preliminary Draft – Confidential Supplemental Valuation Materials – Lower Commodity Prices D Discounted Cash Flow Analysis ($ in millions, except per unit amounts) Summary Results For the Years Ending December 31, Exit Perpetuity 2023E 2024E 2025E 2026E 2027E Multiple Growth Adjusted EBITDA $1,300 $1,136 $1,112 $1,090 $1,082 $1,082 $1,082 Less: Tax Depreciation and Amortization¹ (10,031) (154) (127) (118) (116) (125) EBIT ($8,730) $983 $984 $972 $967 $957 Less: Cash Taxes — (58) (58) (72) (72) (354) EBIAT ($8,730) $924 $926 $900 $895 $603 Plus: Tax Depreciation and Amortization 10,031 154 127 118 116 125 Less: Maintenance Capex (150) (150) (125) (125) (125) (125) Less: Growth Capex (125) (50) (50) (50) (50) —Unlevered Free Cash Flow $1,025 $878 $878 $843 $836 $603 EBITDA Multiple / Perpetuity Growth Rate 8.75x 1.0% Implied Terminal Value $9,469 $8,701 Present Value of Terminal Value @ 8.0% Discount Rate $6,444 $5,698 Plus: Present Value of Unlevered Free Cash Flow @ 8.0% Discount Rate 3,729 Implied Enterprise Value $10,173 $9,427 Less: Preferred Equity2 ($271) Less: Net Debt2 (5,364) Less: Noncontrolling Interests2 (25) Implied Equity Value $4,513 $3,767 DCP Units Outstanding3 210 Implied Value per Unit $21.53 $17.97 Sensitivity Analysis Terminal Exit Multiple Perpetuity Growth Rate 7.75x 8.25x 8.75x 9.25x 9.75x —% 0.5% 1.0% 1.5% 2.0% 7.0% $19.69 $21.53 $23.37 $25.21 $27.05 7.0% $19.49 $21.82 $24.54 $27.75 $31.61 7.5% 18.84 20.64 22.44 24.23 26.03 7.5% 16.74 18.72 21.00 23.66 26.81 WACC 8.0% 18.01 19.77 21.53 23.28 25.04 WACC 8.0% 14.33 16.03 17.97 20.20 22.81 8.5% 17.21 18.93 20.64 22.36 24.08 8.5% 12.21 13.67 15.34 17.23 19.42 9.0% 16.42 18.10 19.78 21.46 23.13 9.0% 10.32 11.60 13.03 14.66 16.52 74 1. 2023E tax DD&A assumes 80% bonus depreciation calculated as the midpoint of the enterprise value range plus 2023E capital expenditures 2. Per DCP Management as of December 31, 2022 3. Includes 117.8mm common units held by DCP Midstream, LLC and DCP Midstream GP, LP, and 1.3mm phantom and performance units
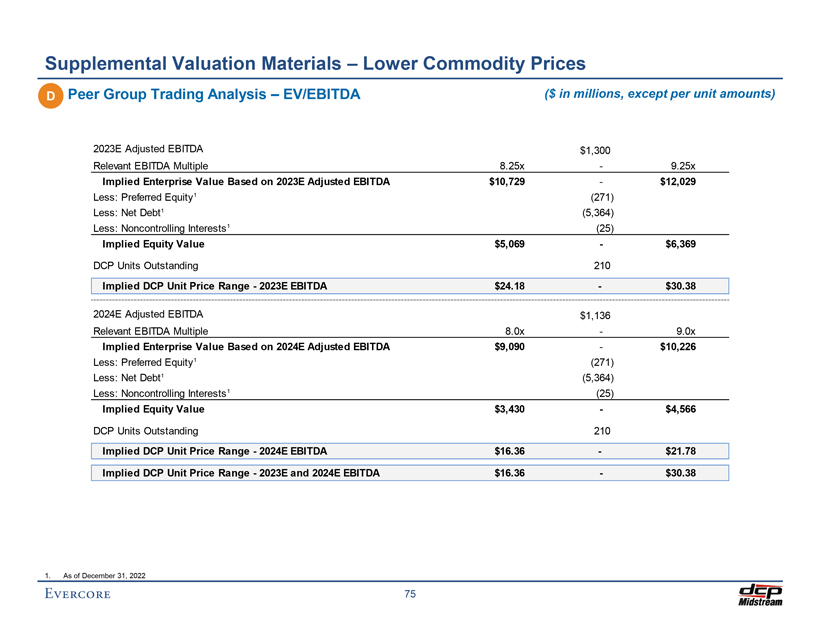
Preliminary Draft – Confidential Supplemental Valuation Materials – Lower Commodity Prices D Peer Group Trading Analysis – EV/EBITDA ($ in millions, except per unit amounts) 2023E Adjusted EBITDA $1,300 Relevant EBITDA Multiple 8.25x—9.25x Implied Enterprise Value Based on 2023E Adjusted EBITDA $10,729—$12,029 Less: Preferred Equity1 (271) Less: Net Debt1 (5,364) Less: Noncontrolling Interests1 (25) Implied Equity Value $5,069—$6,369 DCP Units Outstanding 210 Implied DCP Unit Price Range—2023E EBITDA $24.18—$30.38 2024E Adjusted EBITDA $1,136 Relevant EBITDA Multiple 8.0x—9.0x Implied Enterprise Value Based on 2024E Adjusted EBITDA $9,090—$10,226 Less: Preferred Equity1 (271) Less: Net Debt1 (5,364) Less: Noncontrolling Interests1 (25) Implied Equity Value $3,430—$4,566 DCP Units Outstanding 210 Implied DCP Unit Price Range—2024E EBITDA $16.36—$21.78 Implied DCP Unit Price Range—2023E and 2024E EBITDA $16.36—$30.38 1. As of December 31, 2022 75
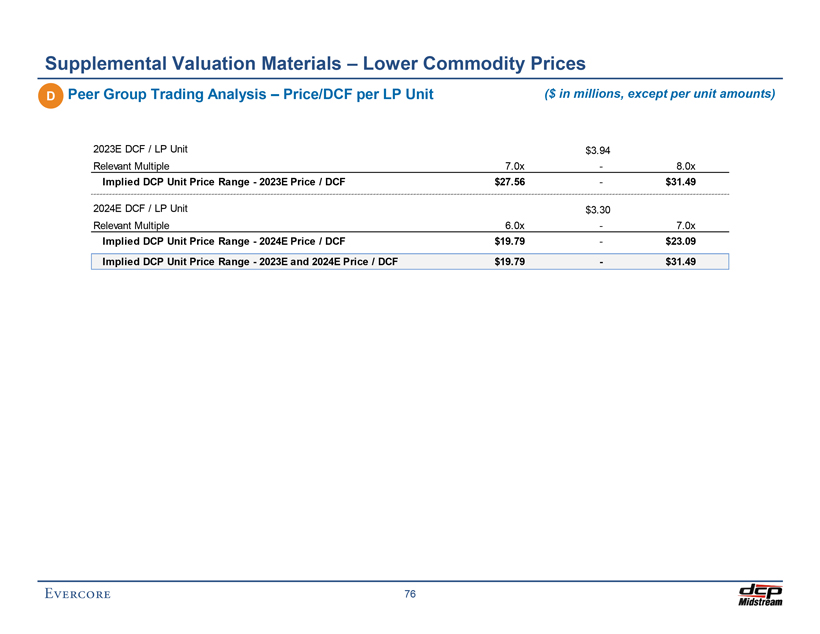
Preliminary Draft – Confidential Supplemental Valuation Materials – Lower Commodity Prices D Peer Group Trading Analysis – Price/DCF per LP Unit ($ in millions, except per unit amounts) 2023E DCF / LP Unit $3.94 Relevant Multiple 7.0x—8.0x Implied DCP Unit Price Range—2023E Price / DCF $27.56—$31.49 2024E DCF / LP Unit $3.30 Relevant Multiple 6.0x—7.0x Implied DCP Unit Price Range—2024E Price / DCF $19.79—$23.09 Implied DCP Unit Price Range—2023E and 2024E Price / DCF $19.79—$31.49 76
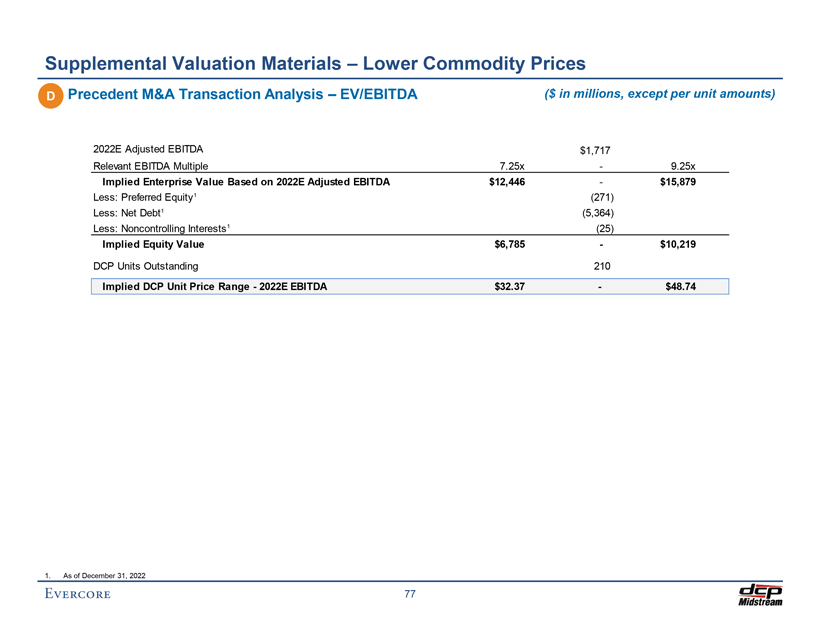
Preliminary Draft – Confidential Supplemental Valuation Materials – Lower Commodity Prices D Precedent M&A Transaction Analysis – EV/EBITDA ($ in millions, except per unit amounts) 2022E Adjusted EBITDA $1,717 Relevant EBITDA Multiple 7.25x—9.25x Implied Enterprise Value Based on 2022E Adjusted EBITDA $12,446—$15,879 Less: Preferred Equity1 (271) Less: Net Debt1 (5,364) Less: Noncontrolling Interests1 (25) Implied Equity Value $6,785—$10,219 DCP Units Outstanding 210 Implied DCP Unit Price Range—2022E EBITDA $32.37—$48.74 1. As of December 31, 2022 77