Exhibit (c)(7)
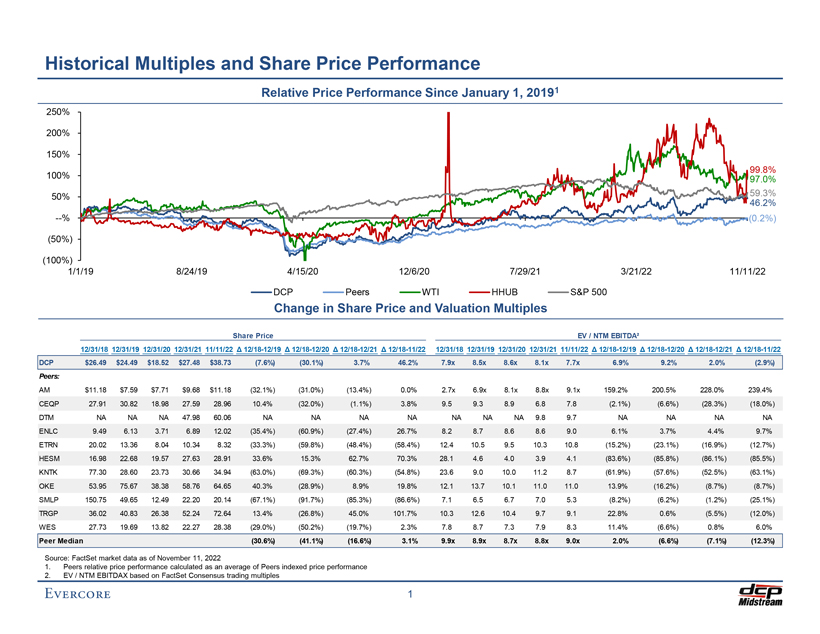
Exhibit (c)(7) Prelimina ry Draft – Confidential Historical Multiples and Share Price Performance Relative Price Performance Since January 1, 20191 250% 200% 150% 99.8% 100% 97.0% 50% 59.3% 46.2% —% (0.2%) (50%) (100%) 1/1/19 8/24/19 4/15/20 12/6/20 7/29/21 3/21/22 11/11/22 DCP Peers WTI HHUB S&P 500 Change in Share Price and Valuation Multiples Share Price EV / NTM EBITDA² 12/31/18 12/31/19 12/31/20 12/31/21 11/11/22 Δ 12/18-12/19 Δ 12/18-12/20 Δ 12/18-12/21 Δ 12/18-11/22 12/31/18 12/31/19 12/31/20 12/31/21 11/11/22 Δ 12/18-12/19 Δ 12/18-12/20 Δ 12/18-12/21 Δ 12/18-11/22 DCP $26.49 $24.49 $18.52 $27.48 $38.73 (7.6%) (30.1%) 3.7% 46.2% 7.9x 8.5x 8.6x 8.1x 7.7x 6.9% 9.2% 2.0% (2.9%) Peers: AM $11.18 $7.59 $7.71 $9.68 $11.18 (32.1%) (31.0%) (13.4%) 0.0% 2.7x 6.9x 8.1x 8.8x 9.1x 159.2% 200.5% 228.0% 239.4% CEQP 27.91 30.82 18.98 27.59 28.96 10.4% (32.0%) (1.1%) 3.8% 9.5 9.3 8.9 6.8 7.8 (2.1%) (6.6%) (28.3%) (18.0%) DTM NA NA NA 47.98 60.06 NA NA NA NA NA NA NA 9.8 9.7 NA NA NA NA ENLC 9.49 6.13 3.71 6.89 12.02 (35.4%) (60.9%) (27.4%) 26.7% 8.2 8.7 8.6 8.6 9.0 6.1% 3.7% 4.4% 9.7% ETRN 20.02 13.36 8.04 10.34 8.32 (33.3%) (59.8%) (48.4%) (58.4%) 12.4 10.5 9.5 10.3 10.8 (15.2%) (23.1%) (16.9%) (12.7%) HESM 16.98 22.68 19.57 27.63 28.91 33.6% 15.3% 62.7% 70.3% 28.1 4.6 4.0 3.9 4.1 (83.6%) (85.8%) (86.1%) (85.5%) KNTK 77.30 28.60 23.73 30.66 34.94 (63.0%) (69.3%) (60.3%) (54.8%) 23.6 9.0 10.0 11.2 8.7 (61.9%) (57.6%) (52.5%) (63.1%) OKE 53.95 75.67 38.38 58.76 64.65 40.3% (28.9%) 8.9% 19.8% 12.1 13.7 10.1 11.0 11.0 13.9% (16.2%) (8.7%) (8.7%) SMLP 150.75 49.65 12.49 22.20 20.14 (67.1%) (91.7%) (85.3%) (86.6%) 7.1 6.5 6.7 7.0 5.3 (8.2%) (6.2%) (1.2%) (25.1%) TRGP 36.02 40.83 26.38 52.24 72.64 13.4% (26.8%) 45.0% 101.7% 10.3 12.6 10.4 9.7 9.1 22.8% 0.6% (5.5%) (12.0%) WES 27.73 19.69 13.82 22.27 28.38 (29.0%) (50.2%) (19.7%) 2.3% 7.8 8.7 7.3 7.9 8.3 11.4% (6.6%) 0.8% 6.0% Peer Median (30.6%) (41.1%) (16.6%) 3.1% 9.9x 8.9x 8.7x 8.8x 9.0x 2.0% (6.6%) (7.1%) (12.3%) Source: FactSet market data as of November 11, 2022 1. Peers relative price performance calculated as an average of Peers indexed price performance 2. EV / NTM EBITDAX based on FactSet Consensus trading multiples 1