|

| 2 Disclaimer Forward-Looking Statements This presentation contains “forward-looking statements” within the meaning of the safe harbor provisions of the U.S. Private Securities Litigation Reform Act of 1995. Forward-looking statements include, without limitation, statements concerning plans, estimates, calculations, forecasts and projections with respect to the anticipated future performance of the Company. These statements are often, but not always, identified by words such as “may”, “might”, “should”, “could”, “predict”, “potential”, “believe”, “expect”, “continue”, “will”, “anticipate”, “seek”, “estimate”, “intend”, “plan”, “projection”, “would”, “annualized”, “target” and “outlook”, or the negative version of those words or other comparable words of a future or forward-looking nature. Forward-looking statements are neither historical facts nor assurances of future performance. Instead, they are based only on our current beliefs, expectations and assumptions regarding our business, future plans and strategies, projections, anticipated events and trends, the economy and other future conditions. Because forward-looking statements relate to the future, they are subject to inherent uncertainties, risks and changes in circumstances that are difficult to predict and many of which are outside of our control. Our actual results and financial condition may differ materially from those indicated in the forward-looking statements. Therefore, you should not rely on any of these forward-looking statements. Important factors that could cause our actual results and financial condition to differ materially from those indicated in the forward-looking statements include, among others, the following: interest rate risk, including the effects of changes in interest rates; effects on the U.S. economy resulting from actions taken by the federal government, including the threat or implementation of tariffs, immigration enforcement and changes in foreign policy; fluctuations in the values of the securities held in our securities portfolio, including as the result of changes in interest rates; business and economic conditions generally and in the financial services industry, nationally and within our market area, including the level and impact of inflation, and future monetary policies of the Federal Reserve and executive orders in response thereto, and possible recession; credit risk and risks from concentrations (including by type of borrower, geographic area, collateral and industry) within the Company’s loan portfolio or large loans to certain borrowers (including commercial real estate (“CRE”) loans); the overall health of the local and national real estate market; our ability to successfully manage credit risk; our ability to maintain an adequate level of allowance for credit losses on loans; new or revised accounting standards as may be adopted by state and federal regulatory agencies, the Financial Accounting Standards Board, Securities and Exchange Commission (the “SEC”) or Public Company Accounting Oversight Board; the concentration of large deposits from certain clients, including those who have balances above current Federal Deposit Insurance Corporation insurance limits; our ability to successfully manage liquidity risk, which may increase our dependence on non-core funding sources such as brokered deposits, and negatively impact our cost of funds; our ability to raise additional capital to implement our business plan; our ability to implement our growth strategy and manage costs effectively; the composition of our senior leadership team and our ability to attract and retain key personnel; talent and labor shortages and employee turnover; the occurrence of fraudulent activity, breaches or failures of our or our third-party vendors’ information security controls or cybersecurity-related incidents, including as a result of sophisticated attacks using artificial intelligence and similar tools or as a result of insider fraud; interruptions involving our information technology and telecommunications systems or third-party servicers; competition in the financial services industry, including from nonbank competitors such as credit unions, “fintech” companies and digital asset service providers; the effectiveness of our risk management framework; rapid technological changes implemented by us and other parties in the financial services industry, including third-party vendors, which may be more difficult to implement or more expensive than anticipated or which may have unforeseen consequence to us and our customers, including the development and implementation of tools incorporating artificial intelligence; the commencement, cost and outcome of litigation and other legal proceedings and regulatory actions against us; the impact of recent and future legislative and regulatory changes, domestic and forign; risks related to climate change and the negative impact it may have on our customers and their businesses; the imposition of tariffs or other governmental policies impacting the global supply chain and the value of products produced by our commercial borrowers; severe weather, natural disasters, wide spread disease or pandemics, acts of war, military conflicts, or terrorism, changes in foreign relations, or other adverse external events, including ongoing conflicts in the Middle East, the Russian invasion of Ukraine and recent military activities in Venezuela; potential impairment to the goodwill the Company recorded in connection with acquisitions; risks associated with our integration of First Minnetonka City Bank (“FMCB”), including the possibility that the merger may be more difficult or expensive to integrate than anticipated and the effect of the merger on the Company’s customer and employee relationships and operating results; changes to U.S. or state tax laws, regulations and governmental policies concerning the Company’s general business, including changes in interpretation or prioritization of such rules and regulations; the impact of bank failures or adverse developments at other banks and related negative publicity about the banking industry in general on investor or depositor sentiment regarding the stability and liquidity of banks; and any other risks described in the “Risk Factors” sections of reports filed by the Company with the SEC. Any forward-looking statement made by us in this presentation is based only on information currently available to us and speaks only as of the date on which it is made. The Company undertake no obligation to publicly update any forward-looking statement, whether written or oral, that may be made from time to time, whether as a result of new information, future developments or otherwise. Certain of the information contained in this presentation is derived from information provided by industry sources. Although the Company believes that such information is accurate and that the sources from which it has been obtained are reliable, the Company cannot guarantee the accuracy of, and have not independently verified, such information. Use of Non-GAAP financial measures In addition to the results presented in accordance with U.S. General Accepted Accounting Principles (“GAAP”), the Company routinely supplements its evaluation with an analysis of certain non-GAAP financial measures. The Company believes these non-GAAP financial measures, in addition to the related GAAP measures, provide meaningful information to investors to help them understand the Company’s operating performance and trends, and to facilitate comparisons with the performance of peers. These disclosures should not be viewed as a substitute for operating results determined in accordance with GAAP, nor are they necessarily comparable to non-GAAP performance measures that may be presented by other companies. Reconciliations of non-GAAP disclosures to the comparable GAAP measures are provided in this presentation. |
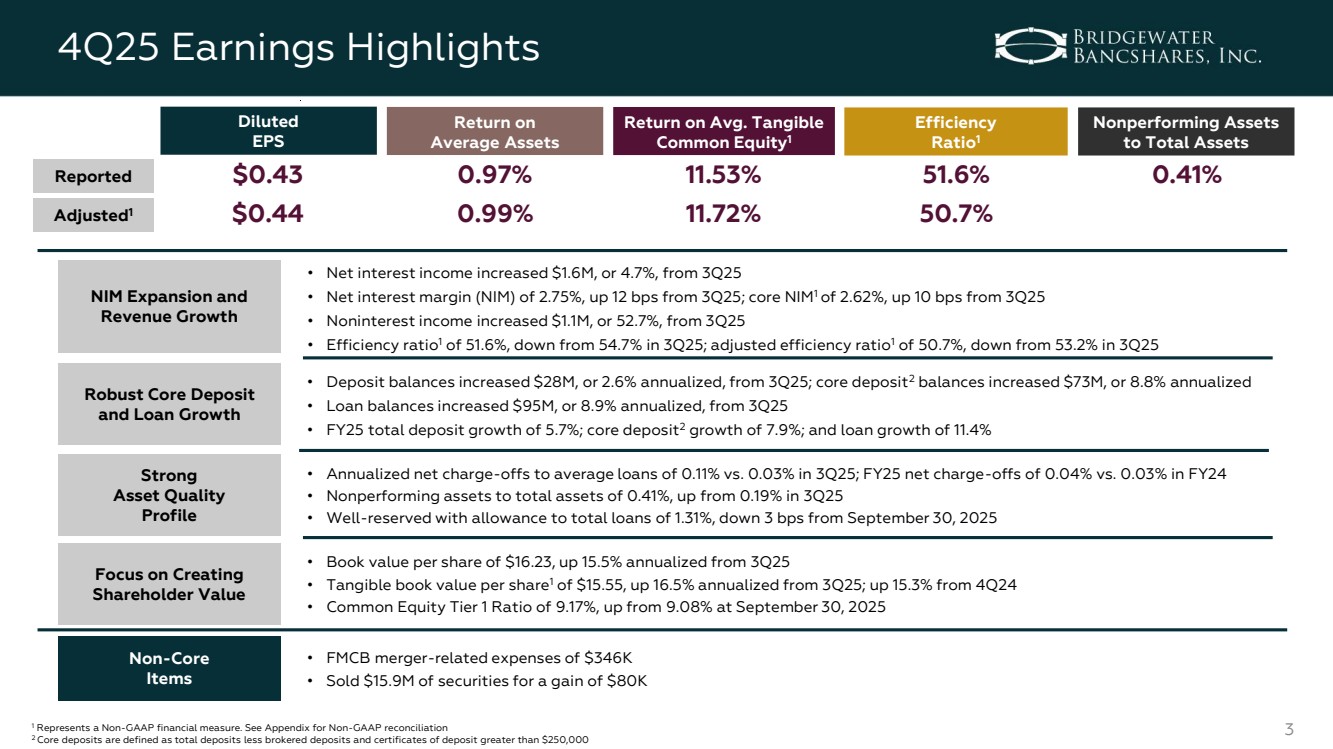
| 3 • Net interest income increased $1.6M, or 4.7%, from 3Q25 • Net interest margin (NIM) of 2.75%, up 12 bps from 3Q25; core NIM1 of 2.62%, up 10 bps from 3Q25 • Noninterest income increased $1.1M, or 52.7%, from 3Q25 • Efficiency ratio1 of 51.6%, down from 54.7% in 3Q25; adjusted efficiency ratio1 of 50.7%, down from 53.2% in 3Q25 0.41% • Deposit balances increased $28M, or 2.6% annualized, from 3Q25; core deposit2 balances increased $73M, or 8.8% annualized • Loan balances increased $95M, or 8.9% annualized, from 3Q25 • FY25 total deposit growth of 5.7%; core deposit2 growth of 7.9%; and loan growth of 11.4% • Annualized net charge-offs to average loans of 0.11% vs. 0.03% in 3Q25; FY25 net charge-offs of 0.04% vs. 0.03% in FY24 • Nonperforming assets to total assets of 0.41%, up from 0.19% in 3Q25 • Well-reserved with allowance to total loans of 1.31%, down 3 bps from September 30, 2025 Robust Core Deposit and Loan Growth Strong Asset Quality Profile $0.43 Diluted EPS Nonperforming Assets to Total Assets Efficiency Ratio1 Return on Average Assets Return on Avg. Tangible Common Equity1 0.97% 11.53% 51.6% 1 Represents a Non-GAAP financial measure. See Appendix for Non-GAAP reconciliation 2 Core deposits are defined as total deposits less brokered deposits and certificates of deposit greater than $250,000 • Book value per share of $16.23, up 15.5% annualized from 3Q25 • Tangible book value per share1 of $15.55, up 16.5% annualized from 3Q25; up 15.3% from 4Q24 • Common Equity Tier 1 Ratio of 9.17%, up from 9.08% at September 30, 2025 Focus on Creating Shareholder Value NIM Expansion and Revenue Growth $0.44 0.99% 11.72% 50.7% Reported Adjusted1 4Q25 Earnings Highlights • FMCB merger-related expenses of $346K • Sold $15.9M of securities for a gain of $80K Non-Core Items |
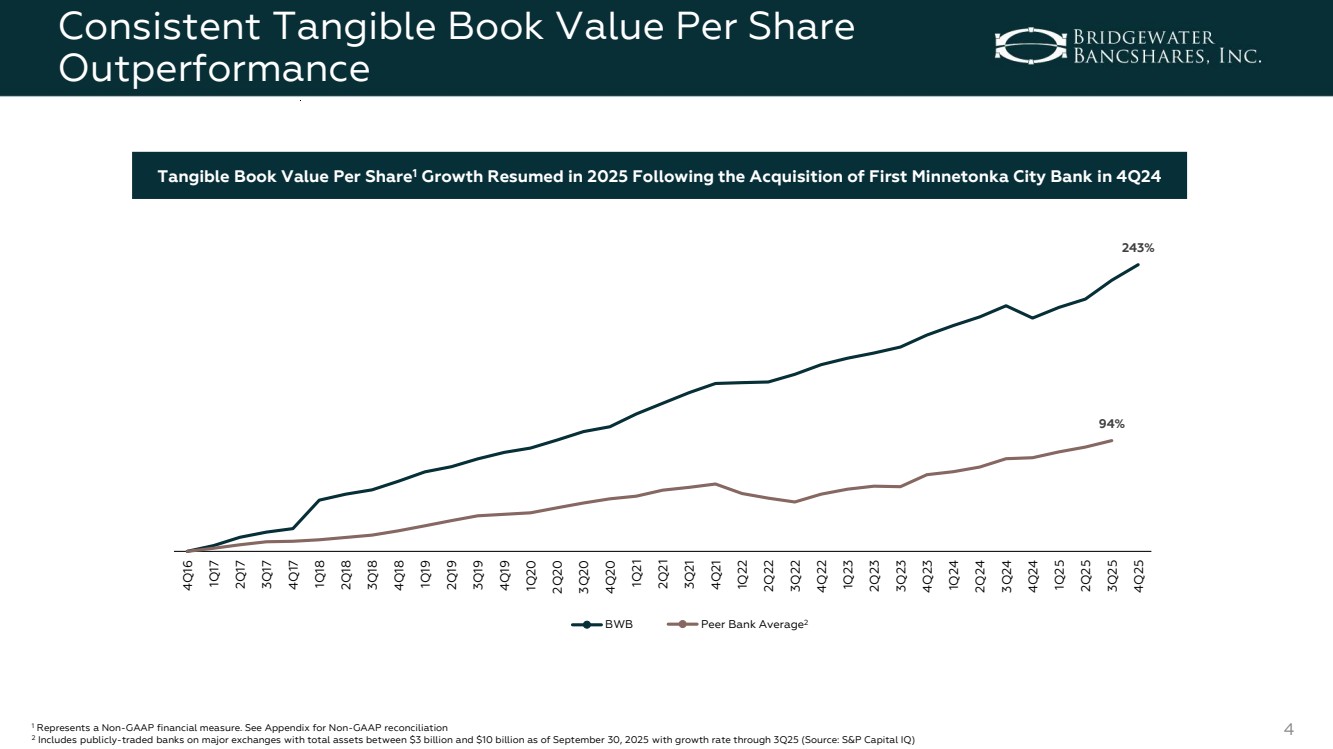
| 4 Consistent Tangible Book Value Per Share Outperformance 243% 94% 4Q16 1Q17 2Q17 3Q17 4Q17 1Q18 2Q18 3Q18 4Q18 1Q19 2Q19 3Q19 4Q19 1Q20 2Q20 3Q20 4Q20 1Q21 2Q21 3Q21 4Q21 1Q22 2Q22 3Q22 4Q22 1Q23 2Q23 3Q23 4Q23 1Q24 2Q24 3Q24 4Q24 1Q25 2Q25 3Q25 4Q25 BWB Peer Bank Average2 Tangible Book Value Per Share1 Growth Resumed in 2025 Following the Acquisition of First Minnetonka City Bank in 4Q24 1 Represents a Non-GAAP financial measure. See Appendix for Non-GAAP reconciliation 2 Includes publicly-traded banks on major exchanges with total assets between $3 billion and $10 billion as of September 30, 2025 with growth rate through 3Q25 (Source: S&P Capital IQ) |
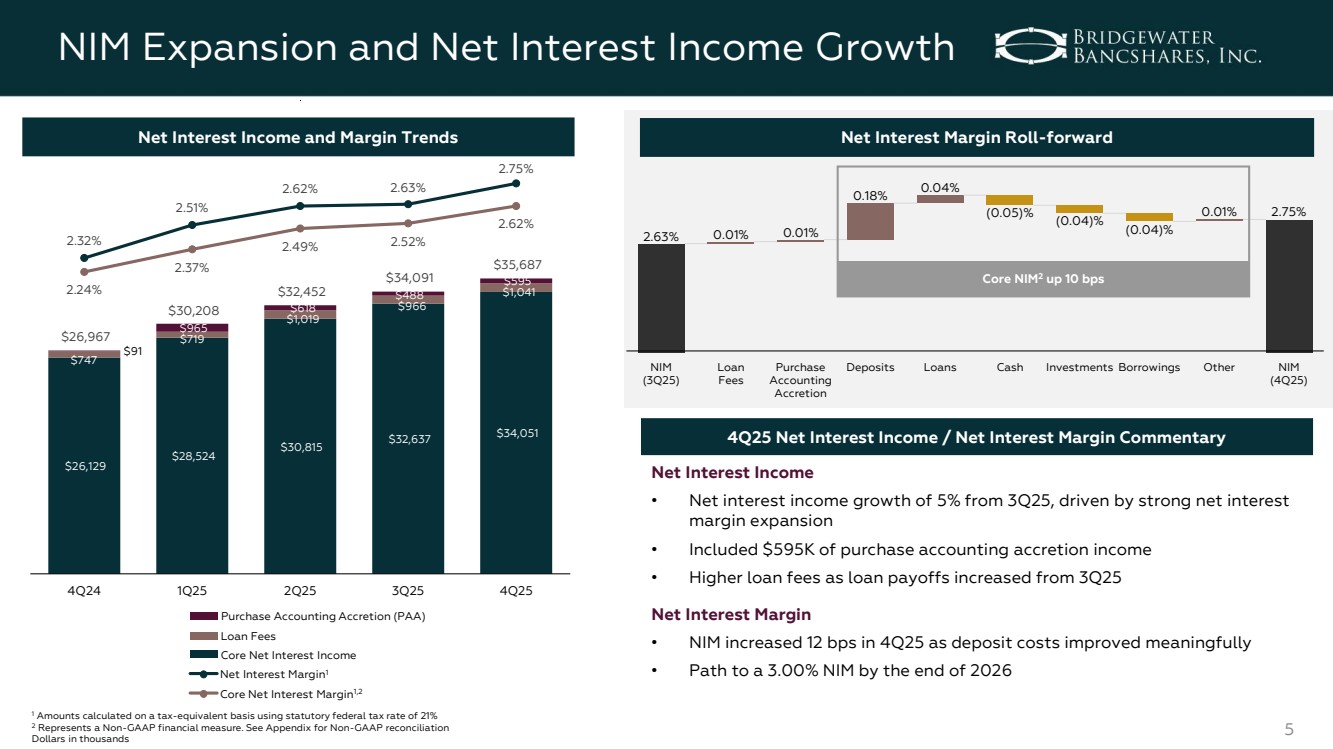
| 5 NIM Expansion and Net Interest Income Growth $26,129 $28,524 $30,815 $32,637 $34,051 $747 $719 $1,019 $966 $1,041 $91 $965 $618 $488 $595 $26,967 $30,208 $32,452 $34,091 $35,687 2.32% 2.51% 2.62% 2.63% 2.75% 2.24% 2.37% 2.49% 2.52% 2.62% 4Q24 1Q25 2Q25 3Q25 4Q25 Net Interest Margin1 Core Net Interest Income Loan Fees Net Interest Income and Margin Trends 2.63% 0.18% 0.04% (0.05)% (0.04)% (0.04)% 0.01% 0.01% 0.01% 2.75% NIM (3Q25) Loan Fees Purchase Accounting Accretion Deposits Loans Cash Investments Borrowings Other NIM (4Q25) Net Interest Margin Roll-forward 4Q25 Net Interest Income / Net Interest Margin Commentary 1 Amounts calculated on a tax-equivalent basis using statutory federal tax rate of 21% 2 Represents a Non-GAAP financial measure. See Appendix for Non-GAAP reconciliation Dollars in thousands Net Interest Income • Net interest income growth of 5% from 3Q25, driven by strong net interest margin expansion • Included $595K of purchase accounting accretion income • Higher loan fees as loan payoffs increased from 3Q25 Net Interest Margin • NIM increased 12 bps in 4Q25 as deposit costs improved meaningfully • Path to a 3.00% NIM by the end of 2026 Core NIM2 up 10 bps Core Net Interest Margin1,2 Purchase Accounting Accretion (PAA) |
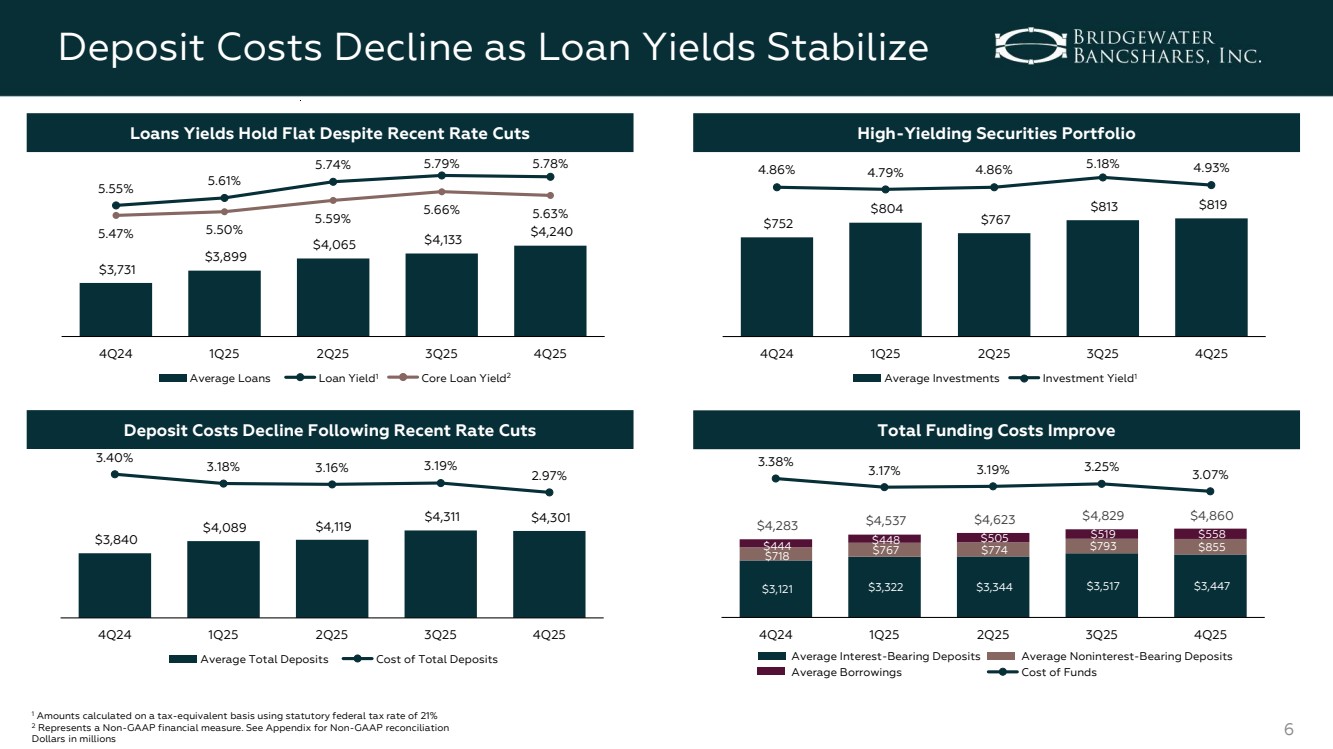
| 6 Deposit Costs Decline as Loan Yields Stabilize $3,121 $3,322 $3,344 $3,517 $3,447 $718 $444 $767 $774 $793 $855 $448 $505 $519 $558 $4,283 $4,537 $4,623 $4,829 $4,860 3.38% 3.17% 3.19% 3.25% 3.07% 4Q24 1Q25 2Q25 3Q25 4Q25 $3,731 $3,899 $4,065 $4,133 $4,240 5.55% 5.61% 5.74% 5.79% 5.78% 5.47% 5.50% 5.59% 5.66% 5.63% 4Q24 1Q25 2Q25 3Q25 4Q25 $3,840 $4,089 $4,119 $4,311 $4,301 3.40% 3.18% 3.16% 3.19% 2.97% 4Q24 1Q25 2Q25 3Q25 4Q25 Core Loan Yield2 $752 $804 $767 $813 $819 4.86% 4.79% 4.86% 5.18% 4.93% 4Q24 1Q25 2Q25 3Q25 4Q25 Average Interest-Bearing Deposits Average Noninterest-Bearing Deposits Average Borrowings Cost of Funds Average Loans Loan Yield1 Average Investments Investment Yield1 Average Total Deposits Cost of Total Deposits 1 Amounts calculated on a tax-equivalent basis using statutory federal tax rate of 21% 2 Represents a Non-GAAP financial measure. See Appendix for Non-GAAP reconciliation Dollars in millions Loans Yields Hold Flat Despite Recent Rate Cuts Deposit Costs Decline Following Recent Rate Cuts High-Yielding Securities Portfolio Total Funding Costs Improve |
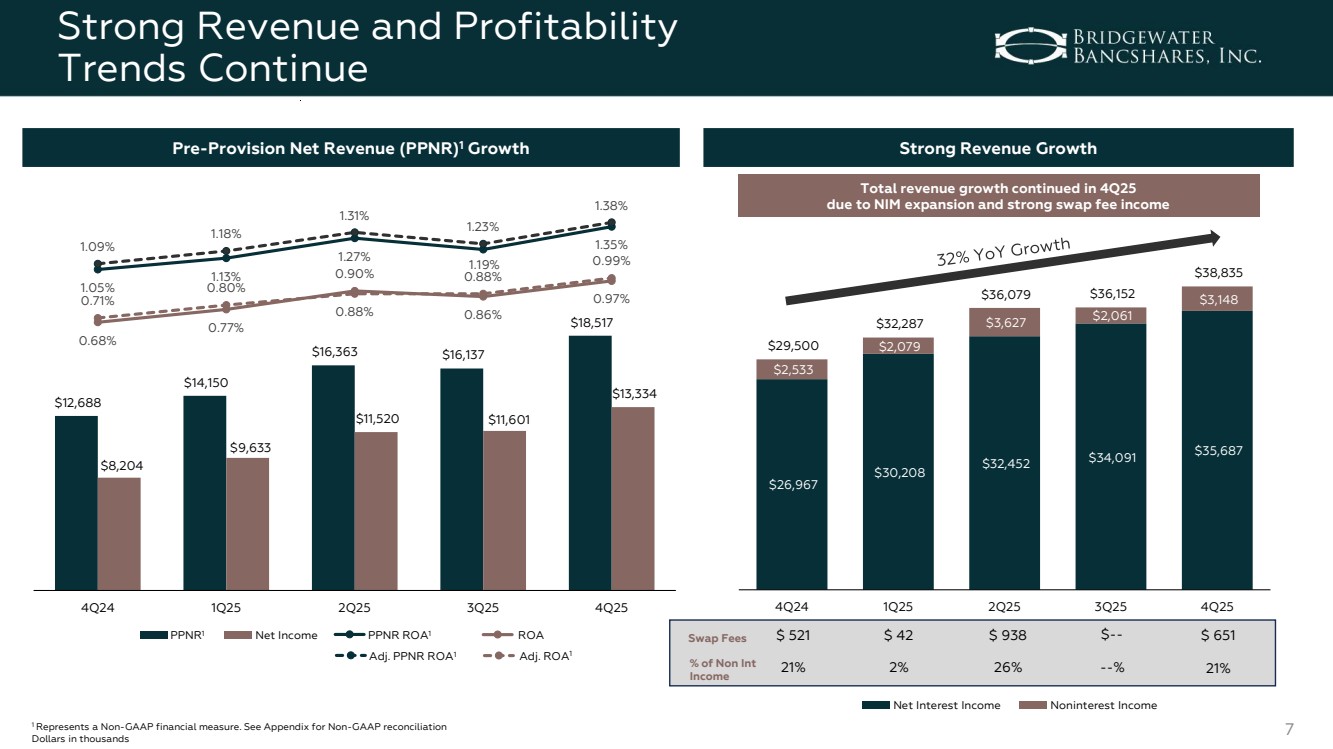
| 7 Strong Revenue and Profitability Trends Continue PPNR ROA1 $26,967 $30,208 $32,452 $34,091 $35,687 $2,533 $2,079 $3,627 $2,061 $3,148 $29,500 $32,287 $36,079 $36,152 $38,835 4Q24 1Q25 2Q25 3Q25 4Q25 $12,688 $14,150 $16,363 $16,137 $18,517 $8,204 $9,633 $11,520 $11,601 $13,334 1.05% 1.13% 1.27% 1.19% 1.09% 1.35% 1.18% 1.31% 1.23% 1.38% 0.68% 0.77% 0.90% 0.86% 0.71% 0.97% 0.80% 0.88% 0.88% 0.99% 4Q24 1Q25 2Q25 3Q25 4Q25 PPNR Net Income 1 ROA 1 Represents a Non-GAAP financial measure. See Appendix for Non-GAAP reconciliation Dollars in thousands Total revenue growth continued in 4Q25 due to NIM expansion and strong swap fee income Adj. PPNR ROA1 Adj. ROA1 Pre-Provision Net Revenue (PPNR)1 Growth Strong Revenue Growth Net Interest Income Noninterest Income Swap Fees % of Non Int Income $ 521 21% $ 42 2% $ 938 26% $-- --% $ 651 21% |
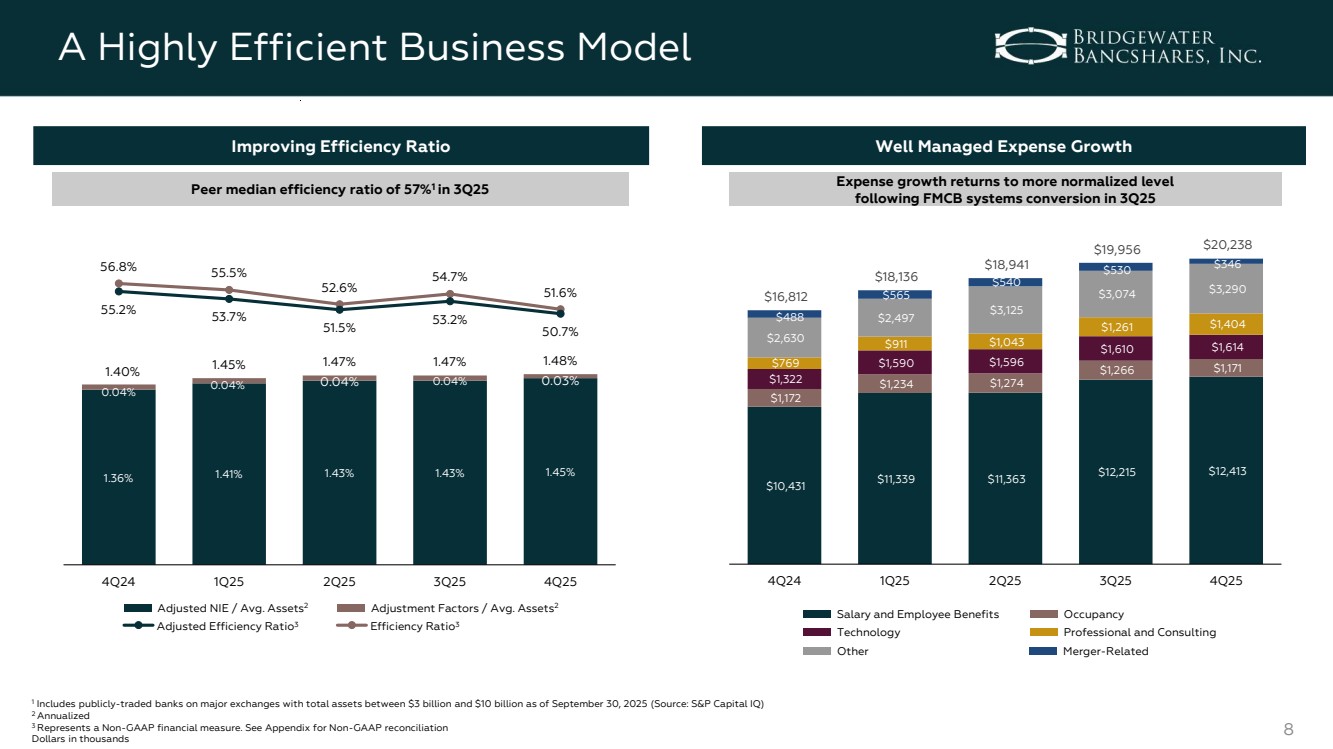
| 8 A Highly Efficient Business Model 1.36% 1.41% 1.43% 1.43% 1.45% 0.04% 0.04% 0.04% 0.04% 0.03% 1.40% 1.45% 1.47% 1.47% 1.48% 56.8% 55.5% 52.6% 54.7% 51.6% 55.2% 53.7% 51.5% 53.2% 50.7% 4Q24 1Q25 2Q25 3Q25 4Q25 Adjusted NIE / Avg. Assets2 Adjusted Efficiency Ratio3 Peer median efficiency ratio of 57%1 in 3Q25 Expense growth returns to more normalized level following FMCB systems conversion in 3Q25 Salary and Employee Benefits Occupancy Technology Professional and Consulting 1 Includes publicly-traded banks on major exchanges with total assets between $3 billion and $10 billion as of September 30, 2025 (Source: S&P Capital IQ) 2 Annualized 3 Represents a Non-GAAP financial measure. See Appendix for Non-GAAP reconciliation Dollars in thousands Other Adjustment Factors / Avg. Assets2 Efficiency Ratio3 Merger-Related $10,431 $11,339 $11,363 $12,215 $12,413 $1,172 $1,234 $1,274 $1,266 $1,171 $1,322 $1,590 $1,596 $1,610 $1,614 $769 $911 $1,043 $1,261 $1,404 $2,630 $2,497 $3,125 $3,074 $3,290 $488 $565 $540 $530 $346 $16,812 $18,136 $18,941 $19,956 $20,238 4Q24 1Q25 2Q25 3Q25 4Q25 Improving Efficiency Ratio Well Managed Expense Growth |
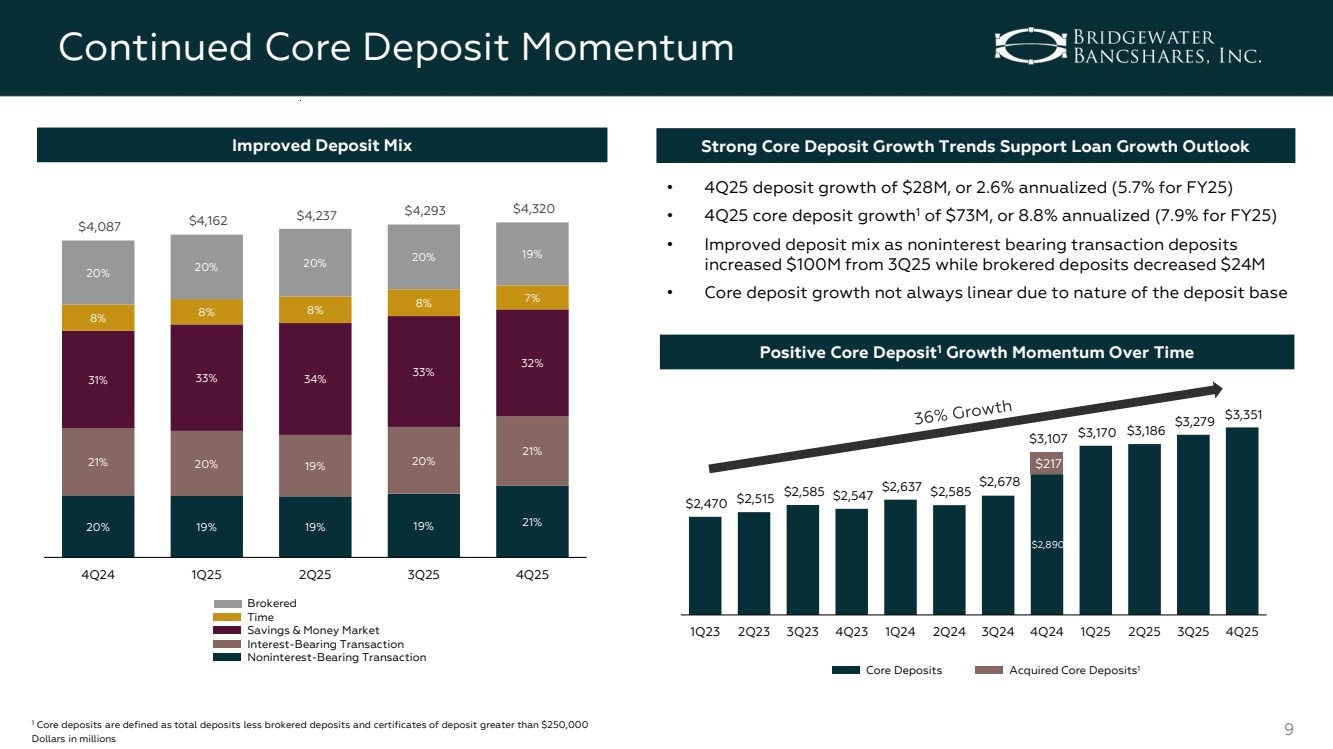
| 9 Continued Core Deposit Momentum 20% 19% 19% 19% 21% 21% 20% 19% 20% 21% 31% 33% 34% 33% 32% 8% 8% 8% 8% 7% 20% 20% 20% 20% 19% $4,087 $4,162 $4,237 $4,293 $4,320 4Q24 1Q25 2Q25 3Q25 4Q25 Interest-Bearing Transaction Noninterest-Bearing Transaction Time Savings & Money Market Brokered • 4Q25 deposit growth of $28M, or 2.6% annualized (5.7% for FY25) • 4Q25 core deposit growth1 of $73M, or 8.8% annualized (7.9% for FY25) • Improved deposit mix as noninterest bearing transaction deposits increased $100M from 3Q25 while brokered deposits decreased $24M • Core deposit growth not always linear due to nature of the deposit base Strong Core Deposit Growth Trends Support Loan Growth Outlook 1 Core deposits are defined as total deposits less brokered deposits and certificates of deposit greater than $250,000 Dollars in millions Positive Core Deposit1 Growth Momentum Over Time $2,890 $217 $2,470 $2,515 $2,585 $2,547 $2,637 $2,585 $2,678 $3,107 $3,170 $3,186 $3,279 $3,351 1Q23 2Q23 3Q23 4Q23 1Q24 2Q24 3Q24 4Q24 1Q25 2Q25 3Q25 4Q25 Improved Deposit Mix Core Deposits Acquired Core Deposits1 |
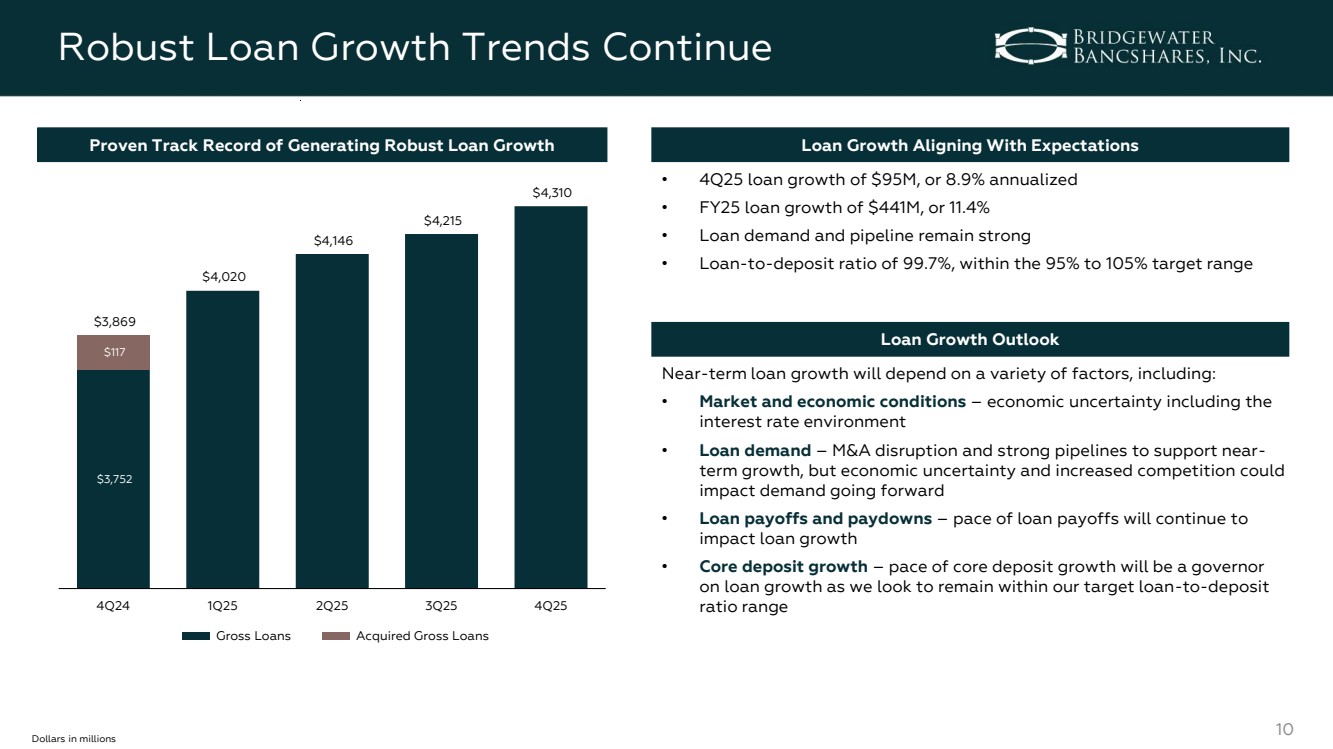
| 10 Robust Loan Growth Trends Continue $3,752 $117 $3,869 $4,020 $4,146 $4,215 $4,310 4Q24 1Q25 2Q25 3Q25 4Q25 Gross Loans Dollars in millions • 4Q25 loan growth of $95M, or 8.9% annualized • FY25 loan growth of $441M, or 11.4% • Loan demand and pipeline remain strong • Loan-to-deposit ratio of 99.7%, within the 95% to 105% target range Loan Growth Aligning With Expectations Near-term loan growth will depend on a variety of factors, including: • Market and economic conditions – economic uncertainty including the interest rate environment • Loan demand – M&A disruption and strong pipelines to support near-term growth, but economic uncertainty and increased competition could impact demand going forward • Loan payoffs and paydowns – pace of loan payoffs will continue to impact loan growth • Core deposit growth – pace of core deposit growth will be a governor on loan growth as we look to remain within our target loan-to-deposit ratio range Loan Growth Outlook Acquired Gross Loans Proven Track Record of Generating Robust Loan Growth |
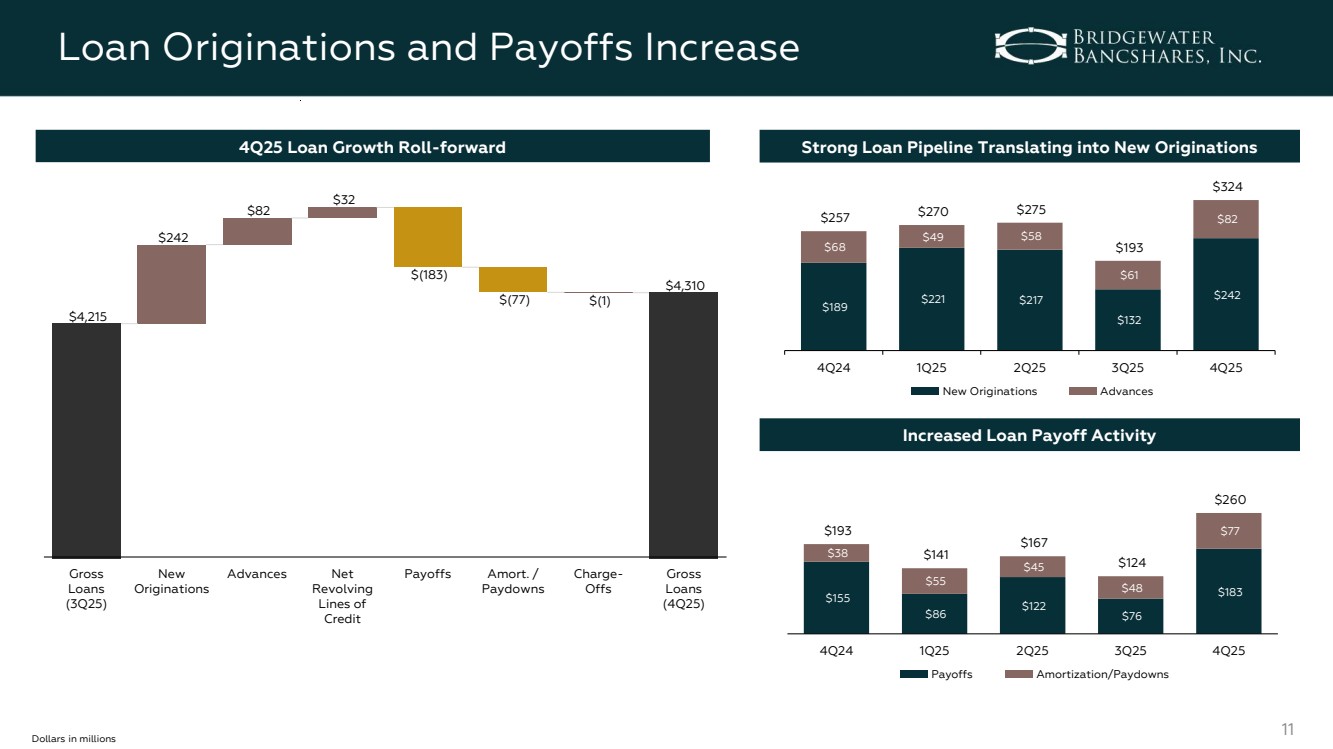
| 11 Loan Originations and Payoffs Increase Strong Loan Pipeline Translating into New Originations $189 $221 $217 $132 $242 $68 $49 $58 $61 $257 $82 $270 $275 $193 $324 4Q24 1Q25 2Q25 3Q25 4Q25 New Originations Advances Increased Loan Payoff Activity $155 $86 $122 $76 $183 $38 $55 $45 $48 $193 $77 $141 $167 $124 $260 4Q24 1Q25 2Q25 3Q25 4Q25 Payoffs Amortization/Paydowns Dollars in millions $4,215 $4,310 $242 $82 $32 $(183) $(77) $(1) Gross Loans (3Q25) New Originations Advances Net Revolving Lines of Credit Payoffs Amort. / Paydowns Charge-Offs Gross Loans (4Q25) 4Q25 Loan Growth Roll-forward |
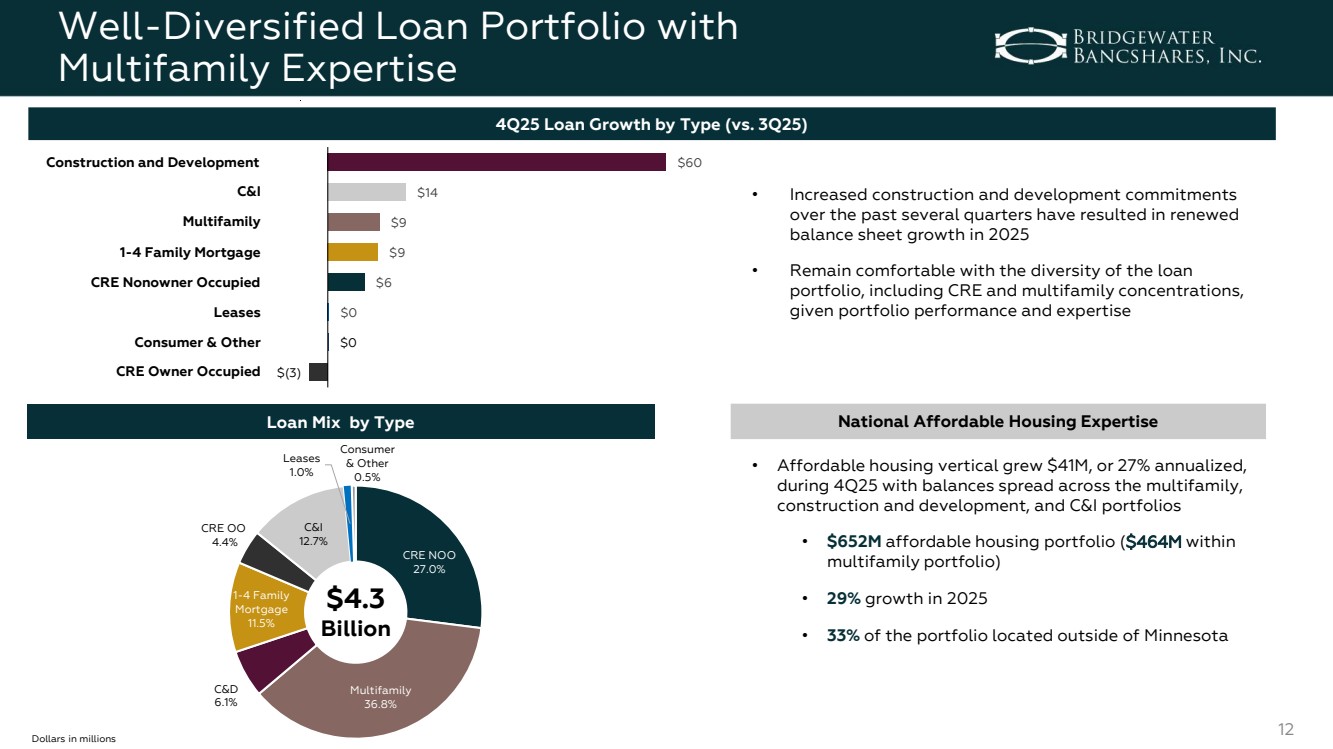
| 12 Well-Diversified Loan Portfolio with Multifamily Expertise $(3) $0 $0 $6 $9 $9 $14 $60 Dollars in millions CRE NOO 27.0% Multifamily 36.8% C&D 6.1% 1-4 Family Mortgage 11.5% CRE OO 4.4% C&I 12.7% Leases 1.0% Consumer & Other 0.5% Loan Mix by Type $4.3 Billion • Increased construction and development commitments over the past several quarters have resulted in renewed balance sheet growth in 2025 • Remain comfortable with the diversity of the loan portfolio, including CRE and multifamily concentrations, given portfolio performance and expertise 4Q25 Loan Growth by Type (vs. 3Q25) Multifamily 1-4 Family Mortgage Construction and Development C&I CRE Nonowner Occupied CRE Owner Occupied Consumer & Other Leases National Affordable Housing Expertise • Affordable housing vertical grew $41M, or 27% annualized, during 4Q25 with balances spread across the multifamily, construction and development, and C&I portfolios • $652M affordable housing portfolio ($464M within multifamily portfolio) • 29% growth in 2025 • 33% of the portfolio located outside of Minnesota |
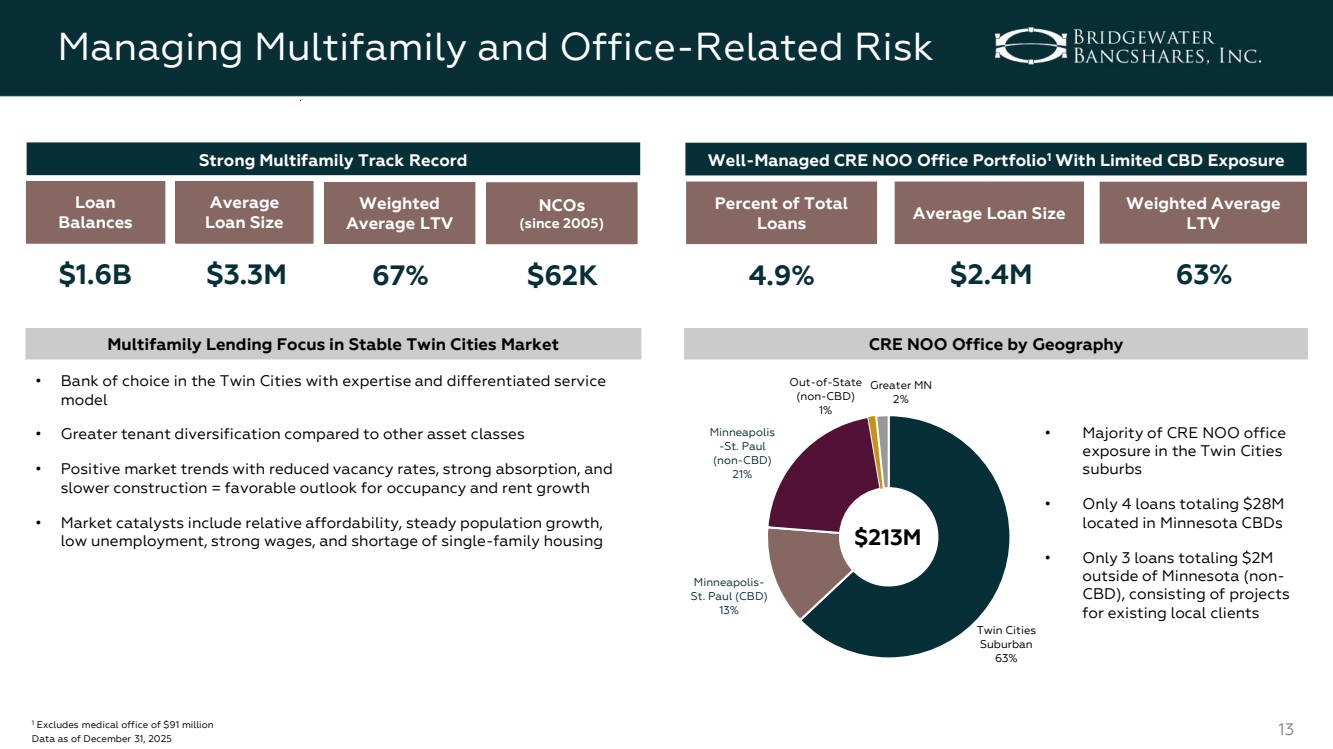
| 13 Managing Multifamily and Office-Related Risk 1 Excludes medical office of $91 million Data as of December 31, 2025 Strong Multifamily Track Record Well-Managed CRE NOO Office Portfolio1 With Limited CBD Exposure Percent of Total Loans Average Loan Size 4.9% $2.4M CRE NOO Office by Geography Twin Cities Suburban 63% Minneapolis-St. Paul (CBD) 13% Minneapolis -St. Paul (non-CBD) 21% Out-of-State (non-CBD) 1% Greater MN 2% $213M • Majority of CRE NOO office exposure in the Twin Cities suburbs • Only 4 loans totaling $28M located in Minnesota CBDs • Only 3 loans totaling $2M outside of Minnesota (non-CBD), consisting of projects for existing local clients Loan Balances Average Loan Size NCOs (since 2005) $1.6B $3.3M $62K Multifamily Lending Focus in Stable Twin Cities Market • Bank of choice in the Twin Cities with expertise and differentiated service model • Greater tenant diversification compared to other asset classes • Positive market trends with reduced vacancy rates, strong absorption, and slower construction = favorable outlook for occupancy and rent growth • Market catalysts include relative affordability, steady population growth, low unemployment, strong wages, and shortage of single-family housing Weighted Average LTV 67% Weighted Average LTV 63% |
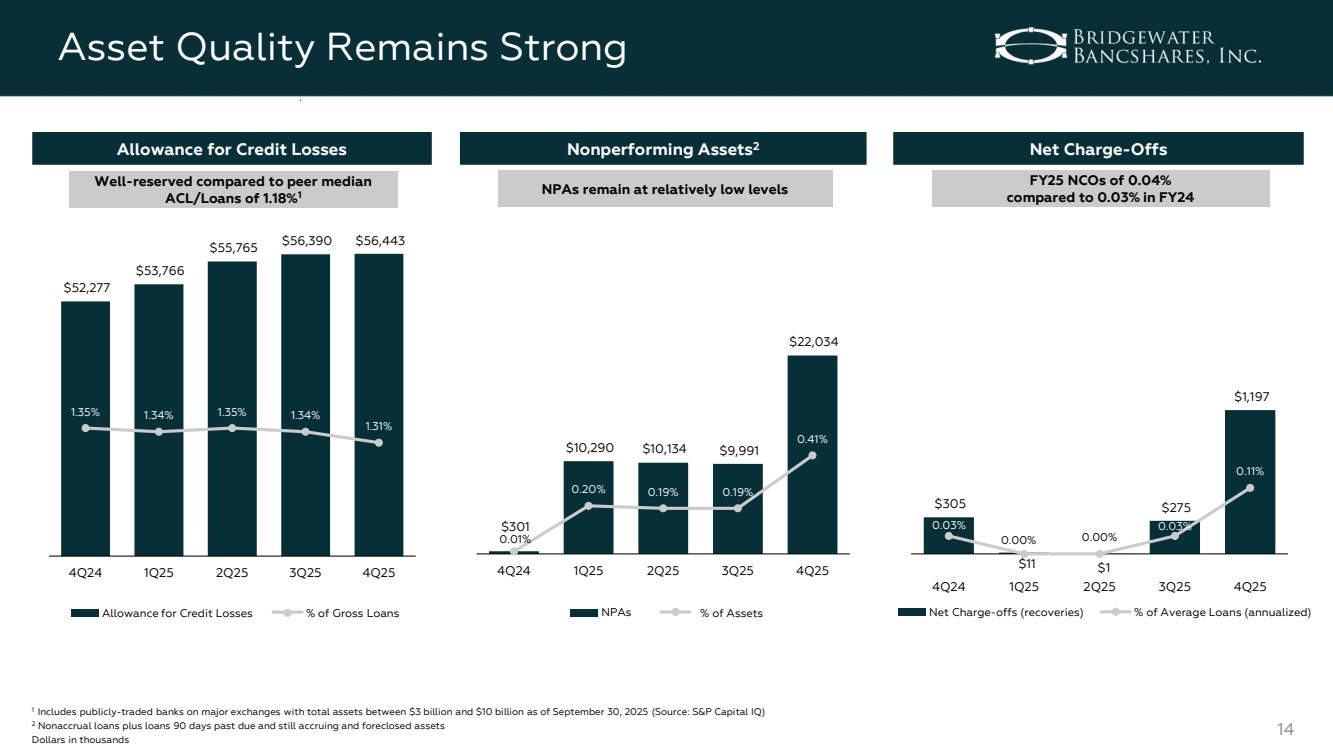
| 14 Asset Quality Remains Strong 1 Includes publicly-traded banks on major exchanges with total assets between $3 billion and $10 billion as of September 30, 2025 (Source: S&P Capital IQ) 2 Nonaccrual loans plus loans 90 days past due and still accruing and foreclosed assets Dollars in thousands $305 $11 $1 $275 $1,197 0.03% 0.00% 0.00% 0.03% 0.11% 4Q24 1Q25 2Q25 3Q25 4Q25 Net Charge-Offs FY25 NCOs of 0.04% compared to 0.03% in FY24 Net Charge-offs (recoveries) % of Average Loans (annualized) $52,277 $53,766 $55,765 $56,390 $56,443 1.35% 1.34% 1.35% 1.34% 1.31% 4Q24 1Q25 2Q25 3Q25 4Q25 Allowance for Credit Losses Well-reserved compared to peer median ACL/Loans of 1.18%1 Allowance for Credit Losses % of Gross Loans $301 $10,290 $10,134 $9,991 $22,034 0.01% 0.20% 0.19% 0.19% 0.41% 4Q24 1Q25 2Q25 3Q25 4Q25 Nonperforming Assets2 NPAs remain at relatively low levels NPAs % of Assets |
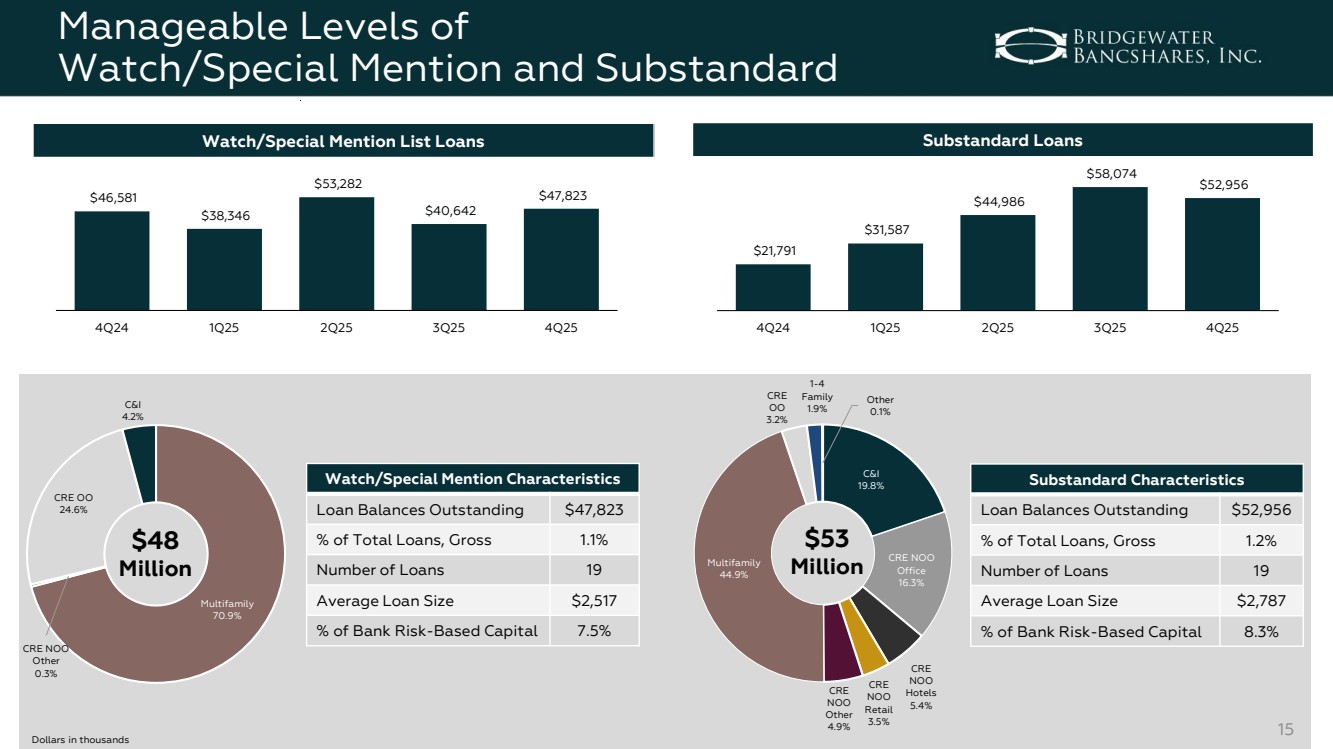
| Manageable Levels of Watch/Special Mention and Substandard Multifamily 70.9% CRE NOO Other 0.3% CRE OO 24.6% C&I 4.2% $48 Million Watch/Special Mention List Loans Substandard Loans C&I 19.8% CRE NOO Office 16.3% CRE NOO Hotels 5.4% CRE NOO Retail 3.5% CRE NOO Other 4.9% Multifamily 44.9% CRE OO 3.2% 1-4 Family 1.9% Other 0.1% $53 Million Watch/Special Mention Characteristics Loan Balances Outstanding $47,823 % of Total Loans, Gross 1.1% Number of Loans 19 Average Loan Size $2,517 % of Bank Risk-Based Capital 7.5% Substandard Characteristics Loan Balances Outstanding $52,956 % of Total Loans, Gross 1.2% Number of Loans 19 Average Loan Size $2,787 % of Bank Risk-Based Capital 8.3% $46,581 $38,346 $53,282 $40,642 $47,823 4Q24 1Q25 2Q25 3Q25 4Q25 $21,791 $31,587 $44,986 $58,074 $52,956 4Q24 1Q25 2Q25 3Q25 4Q25 Dollars in thousands 15 |
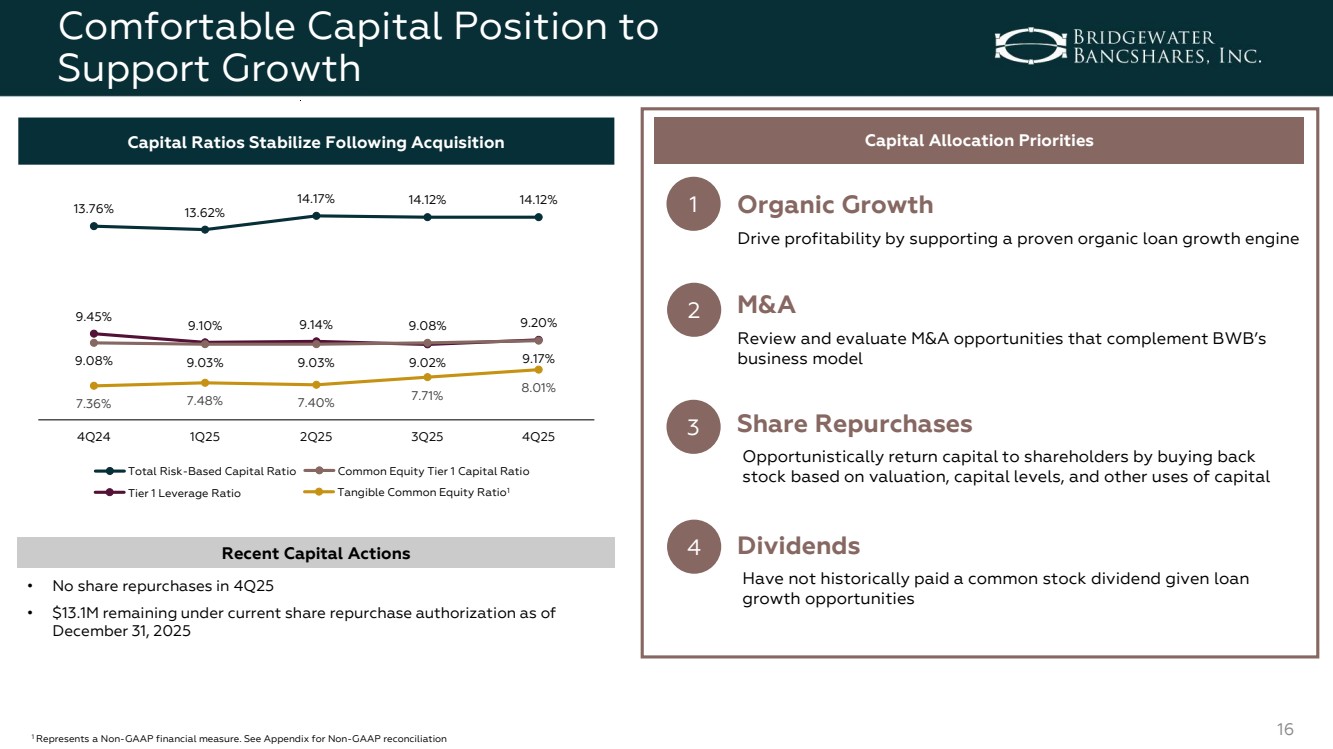
| 16 Comfortable Capital Position to Support Growth 9.45% 9.10% 9.14% 9.02% 9.20% 9.08% 9.03% 9.03% 9.08% 9.17% 13.76% 13.62% 14.17% 14.12% 14.12% 7.36% 7.48% 7.40% 7.71% 8.01% 4Q24 1Q25 2Q25 3Q25 4Q25 Total Risk-Based Capital Ratio Common Equity Tier 1 Capital Ratio Tier 1 Leverage Ratio Capital Ratios Stabilize Following Acquisition Tangible Common Equity Ratio1 1 Represents a Non-GAAP financial measure. See Appendix for Non-GAAP reconciliation Recent Capital Actions • No share repurchases in 4Q25 • $13.1M remaining under current share repurchase authorization as of December 31, 2025 Capital Allocation Priorities 1 3 2 Organic Growth Share Repurchases M&A 4 Dividends Drive profitability by supporting a proven organic loan growth engine Opportunistically return capital to shareholders by buying back stock based on valuation, capital levels, and other uses of capital Review and evaluate M&A opportunities that complement BWB’s business model Have not historically paid a common stock dividend given loan growth opportunities |
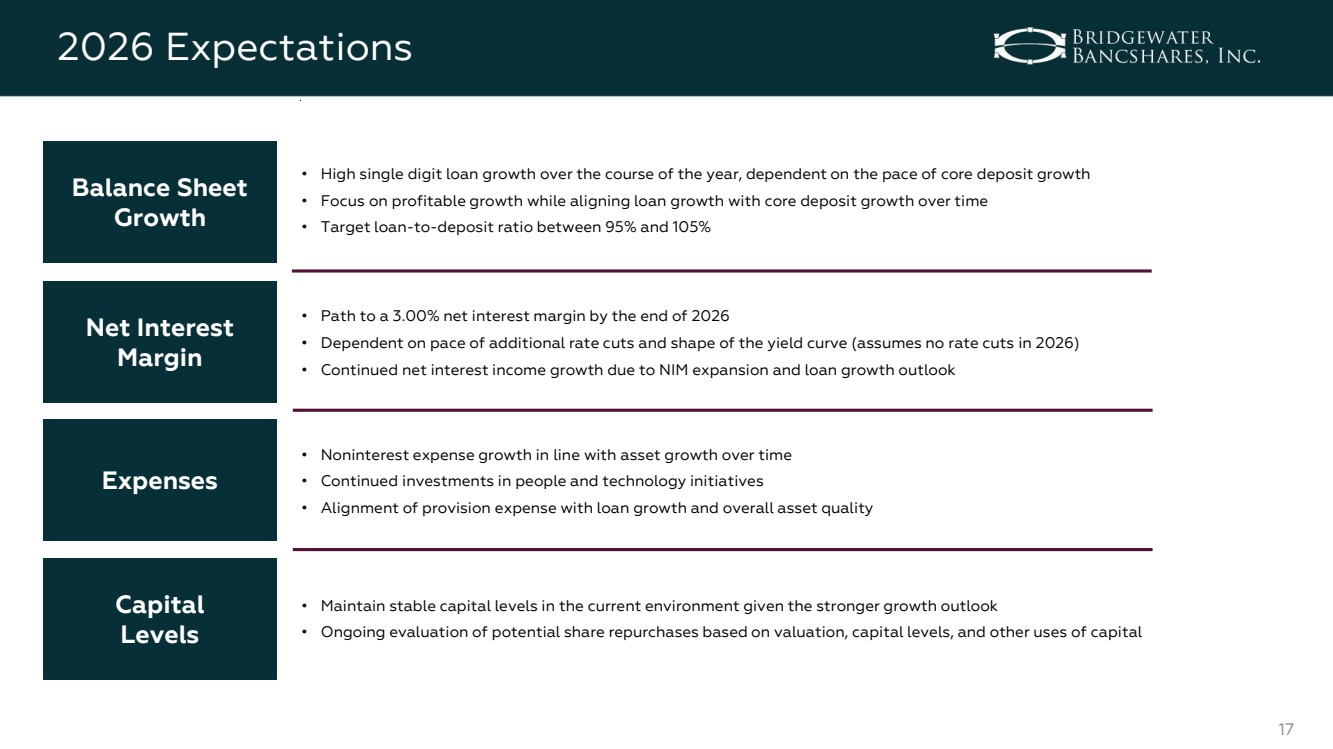
| 17 2026 Expectations • High single digit loan growth over the course of the year, dependent on the pace of core deposit growth • Focus on profitable growth while aligning loan growth with core deposit growth over time • Target loan-to-deposit ratio between 95% and 105% Balance Sheet Growth • Path to a 3.00% net interest margin by the end of 2026 • Dependent on pace of additional rate cuts and shape of the yield curve (assumes no rate cuts in 2026) • Continued net interest income growth due to NIM expansion and loan growth outlook Net Interest Margin • Noninterest expense growth in line with asset growth over time • Continued investments in people and technology initiatives • Alignment of provision expense with loan growth and overall asset quality Expenses • Maintain stable capital levels in the current environment given the stronger growth outlook • Ongoing evaluation of potential share repurchases based on valuation, capital levels, and other uses of capital Capital Levels |
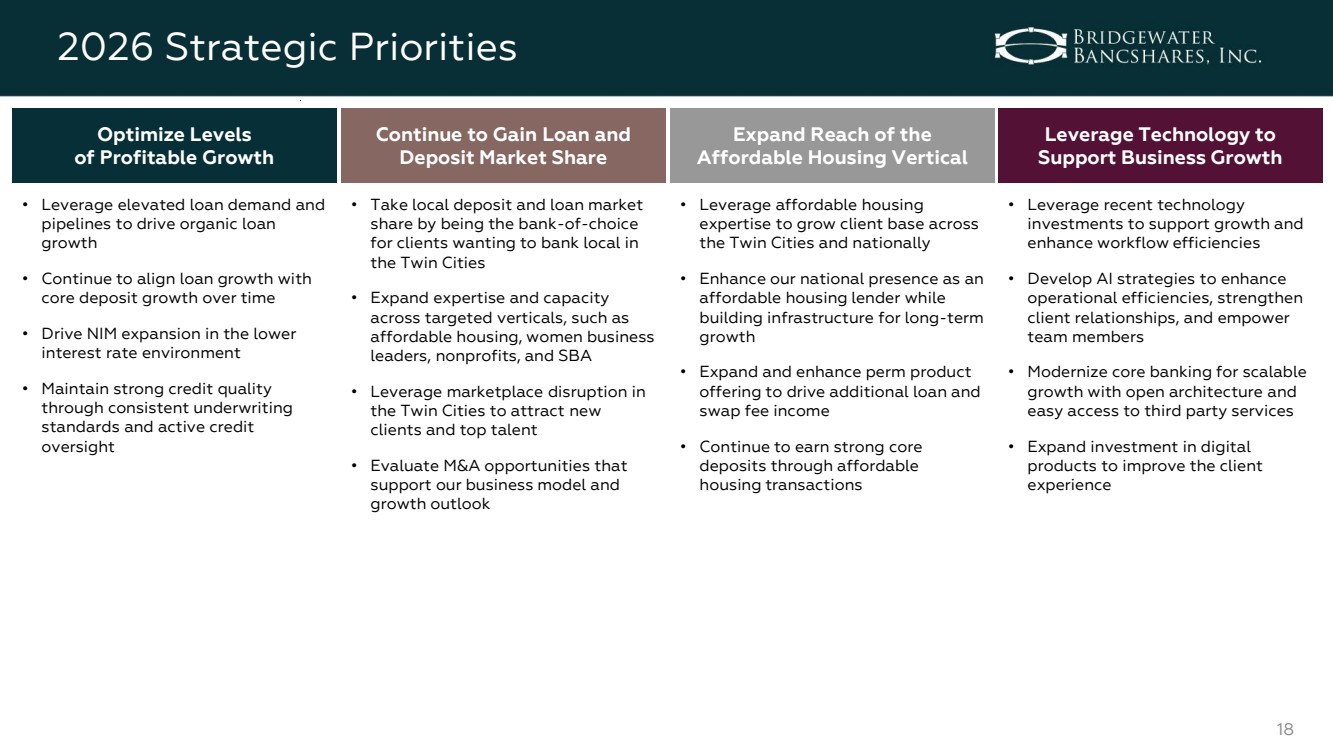
| 18 2026 Strategic Priorities Optimize Levels of Profitable Growth Continue to Gain Loan and Deposit Market Share Expand Reach of the Affordable Housing Vertical Leverage Technology to Support Business Growth • Leverage elevated loan demand and pipelines to drive organic loan growth • Continue to align loan growth with core deposit growth over time • Drive NIM expansion in the lower interest rate environment • Maintain strong credit quality through consistent underwriting standards and active credit oversight • Take local deposit and loan market share by being the bank-of-choice for clients wanting to bank local in the Twin Cities • Expand expertise and capacity across targeted verticals, such as affordable housing, women business leaders, nonprofits, and SBA • Leverage marketplace disruption in the Twin Cities to attract new clients and top talent • Evaluate M&A opportunities that support our business model and growth outlook • Leverage affordable housing expertise to grow client base across the Twin Cities and nationally • Enhance our national presence as an affordable housing lender while building infrastructure for long-term growth • Expand and enhance perm product offering to drive additional loan and swap fee income • Continue to earn strong core deposits through affordable housing transactions • Leverage recent technology investments to support growth and enhance workflow efficiencies • Develop AI strategies to enhance operational efficiencies, strengthen client relationships, and empower team members • Modernize core banking for scalable growth with open architecture and easy access to third party services • Expand investment in digital products to improve the client experience |
| 19 APPENDIX |

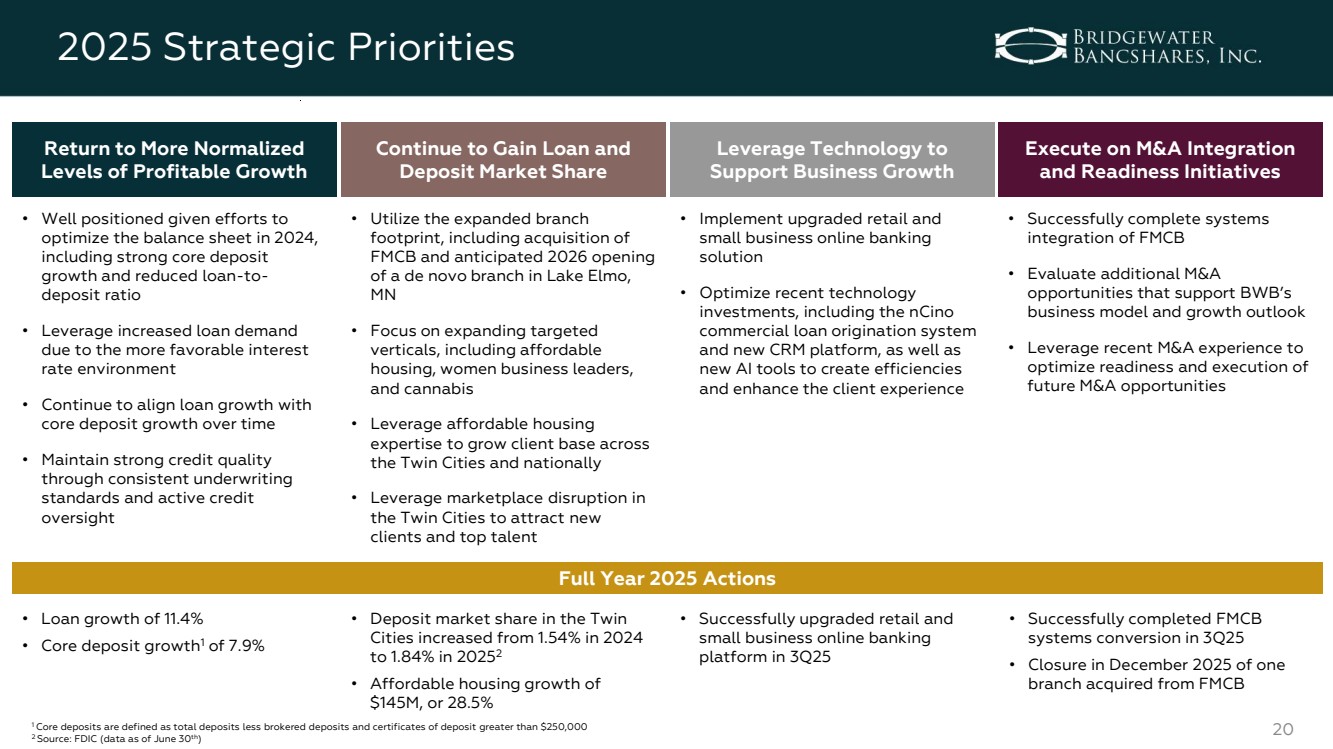
| 20 2025 Strategic Priorities Return to More Normalized Levels of Profitable Growth Continue to Gain Loan and Deposit Market Share Leverage Technology to Support Business Growth Execute on M&A Integration and Readiness Initiatives • Well positioned given efforts to optimize the balance sheet in 2024, including strong core deposit growth and reduced loan-to-deposit ratio • Leverage increased loan demand due to the more favorable interest rate environment • Continue to align loan growth with core deposit growth over time • Maintain strong credit quality through consistent underwriting standards and active credit oversight • Utilize the expanded branch footprint, including acquisition of FMCB and anticipated 2026 opening of a de novo branch in Lake Elmo, MN • Focus on expanding targeted verticals, including affordable housing, women business leaders, and cannabis • Leverage affordable housing expertise to grow client base across the Twin Cities and nationally • Leverage marketplace disruption in the Twin Cities to attract new clients and top talent • Implement upgraded retail and small business online banking solution • Optimize recent technology investments, including the nCino commercial loan origination system and new CRM platform, as well as new AI tools to create efficiencies and enhance the client experience • Successfully complete systems integration of FMCB • Evaluate additional M&A opportunities that support BWB’s business model and growth outlook • Leverage recent M&A experience to optimize readiness and execution of future M&A opportunities Full Year 2025 Actions • Loan growth of 11.4% • Core deposit growth1 of 7.9% • Deposit market share in the Twin Cities increased from 1.54% in 2024 to 1.84% in 20252 • Affordable housing growth of $145M, or 28.5% • Successfully upgraded retail and small business online banking platform in 3Q25 • Successfully completed FMCB systems conversion in 3Q25 • Closure in December 2025 of one branch acquired from FMCB 1 Core deposits are defined as total deposits less brokered deposits and certificates of deposit greater than $250,000 2 Source: FDIC (data as of June 30th) |
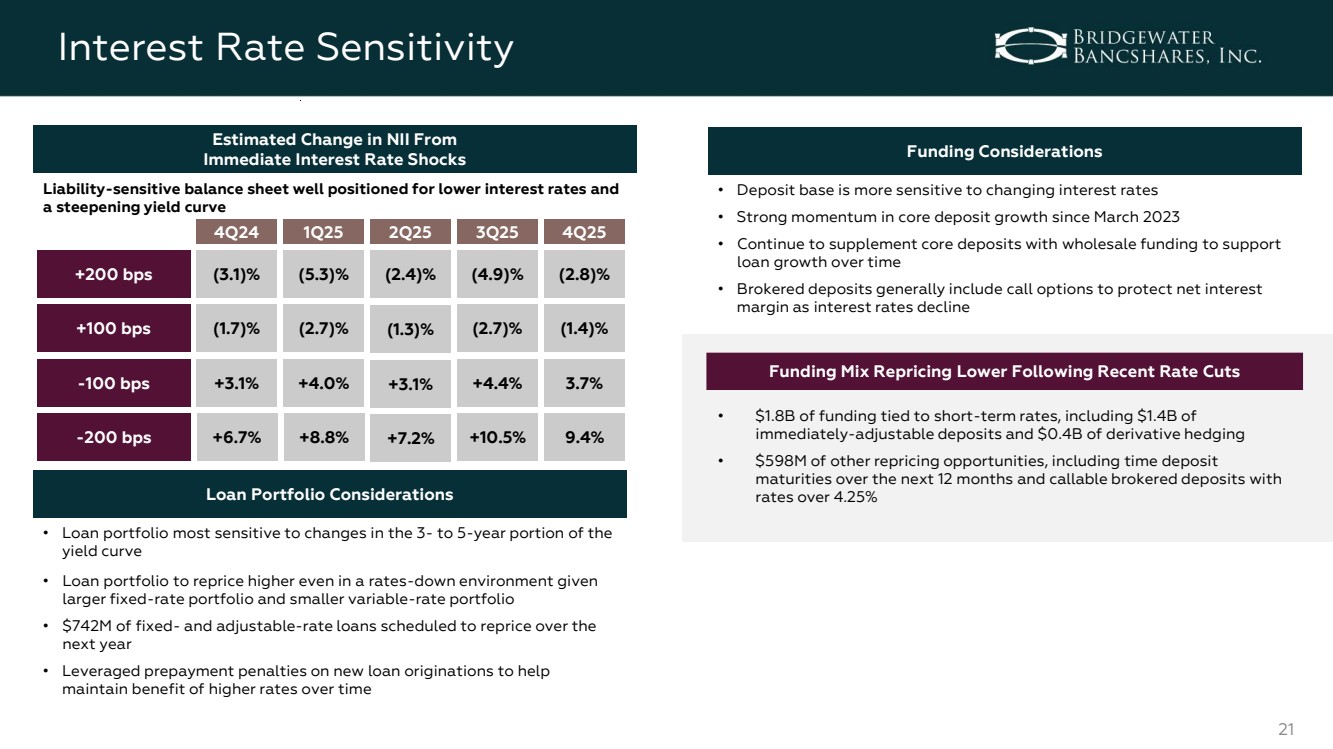
| 21 Interest Rate Sensitivity Estimated Change in NII From Immediate Interest Rate Shocks +100 bps -100 bps Liability-sensitive balance sheet well positioned for lower interest rates and a steepening yield curve Loan Portfolio Considerations • Loan portfolio most sensitive to changes in the 3- to 5-year portion of the yield curve • Loan portfolio to reprice higher even in a rates-down environment given larger fixed-rate portfolio and smaller variable-rate portfolio • $742M of fixed- and adjustable-rate loans scheduled to reprice over the next year • Leveraged prepayment penalties on new loan originations to help maintain benefit of higher rates over time Funding Considerations • Deposit base is more sensitive to changing interest rates • Strong momentum in core deposit growth since March 2023 • Continue to supplement core deposits with wholesale funding to support loan growth over time • Brokered deposits generally include call options to protect net interest margin as interest rates decline -200 bps (2.7)% +4.4% 3Q25 +10.5% (1.4)% 3.7% 4Q25 9.4% (1.7)% +3.1% 4Q24 +6.7% (1.3)% +3.1% 2Q25 +7.2% (2.7)% +4.0% 1Q25 +8.8% +200 bps (3.1)% (5.3)% (2.4)% (4.9)% (2.8)% Funding Mix Repricing Lower Following Recent Rate Cuts • $1.8B of funding tied to short-term rates, including $1.4B of immediately-adjustable deposits and $0.4B of derivative hedging • $598M of other repricing opportunities, including time deposit maturities over the next 12 months and callable brokered deposits with rates over 4.25% |
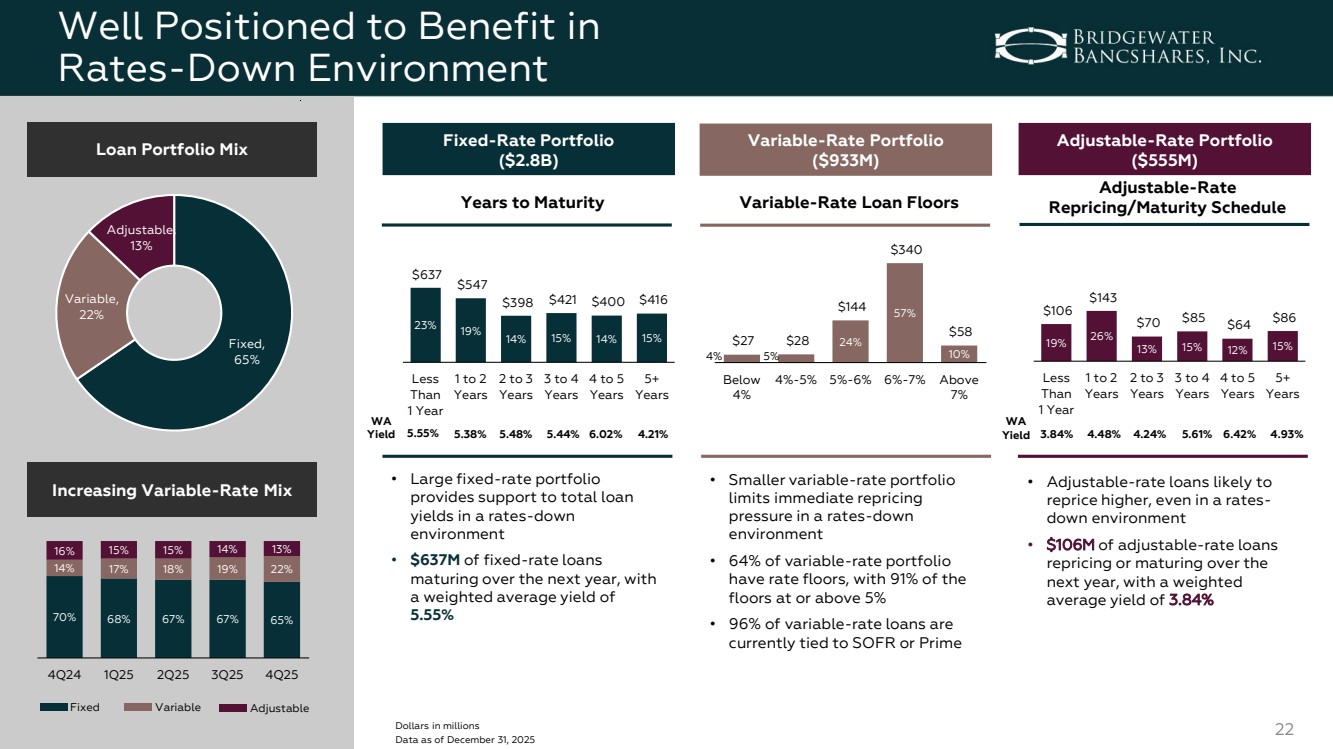
| 22 Well Positioned to Benefit in Rates-Down Environment 19% 26% 13% 15% 12% 15% $106 $143 $70 $85 $64 $86 Less Than 1 Year 1 to 2 Years 2 to 3 Years 3 to 4 Years 4 to 5 Years 5+ Years 23% 19% 14% 15% 14% 15% $637 $547 $398 $421 $400 $416 Less Than 1 Year 1 to 2 Years 2 to 3 Years 3 to 4 Years 4 to 5 Years 5+ Years Fixed, 65% Variable, 22% Adjustable, 13% Loan Portfolio Mix Fixed-Rate Portfolio ($2.8B) Variable-Rate Portfolio ($933M) Adjustable-Rate Portfolio ($555M) Years to Maturity • Large fixed-rate portfolio provides support to total loan yields in a rates-down environment • $637M of fixed-rate loans maturing over the next year, with a weighted average yield of 5.55% Variable-Rate Loan Floors • Smaller variable-rate portfolio limits immediate repricing pressure in a rates-down environment • 64% of variable-rate portfolio have rate floors, with 91% of the floors at or above 5% • 96% of variable-rate loans are currently tied to SOFR or Prime Adjustable-Rate Repricing/Maturity Schedule • Adjustable-rate loans likely to reprice higher, even in a rates-down environment • $106M of adjustable-rate loans repricing or maturing over the next year, with a weighted average yield of 3.84% Dollars in millions Data as of December 31, 2025 WA Yield 5.55% 5.38% 5.48% 5.44% 6.02% 4.21% WA Yield 3.84% 4.48% 4.24% 5.61% 6.42% 4.93% 4% 5% 24% 57% 10% $27 $28 $144 $340 $58 Below 4% 4%-5% 5%-6% 6%-7% Above 7% Increasing Variable-Rate Mix 70% 68% 67% 67% 65% 14% 17% 18% 19% 22% 16% 15% 15% 14% 13% 4Q24 1Q25 2Q25 3Q25 4Q25 Fixed Variable Adjustable |
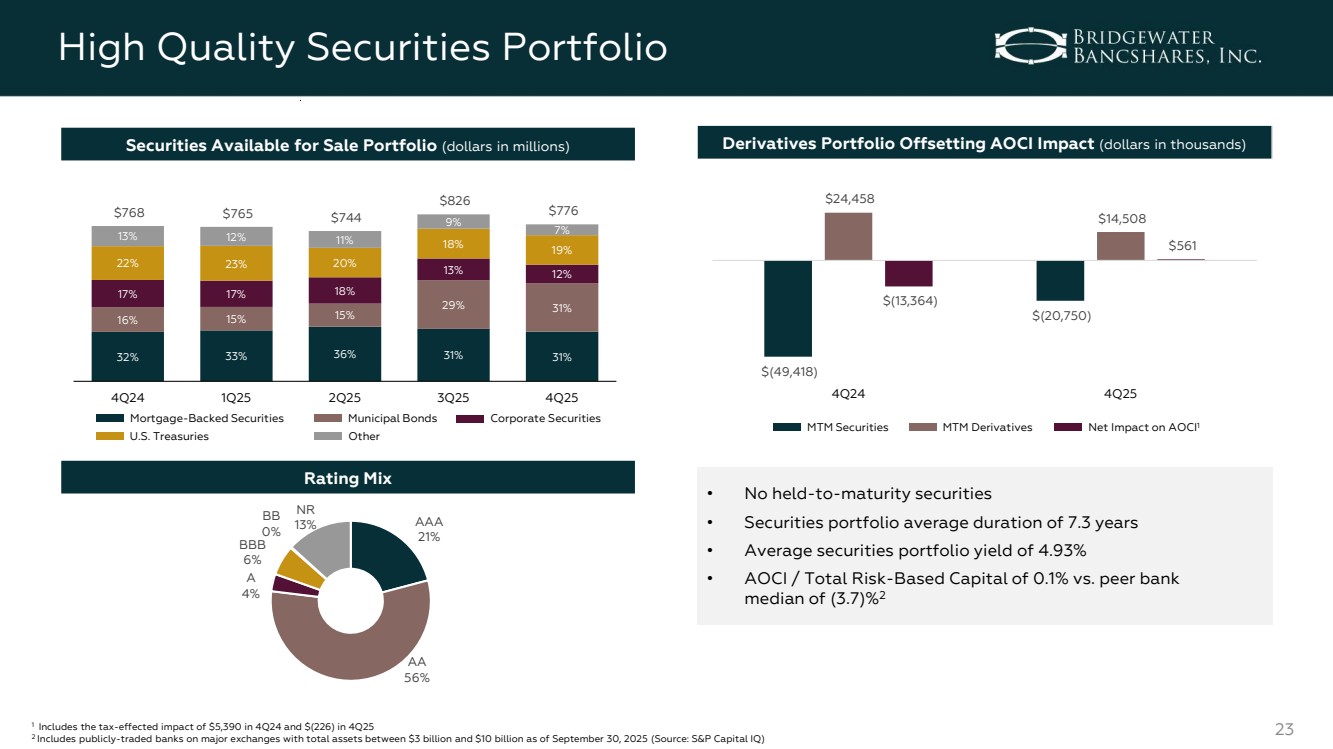
| 23 High Quality Securities Portfolio AAA 21% AA 56% A 4% BBB 6% BB 0% NR 13% Rating Mix Derivatives Portfolio Offsetting AOCI Impact (dollars in thousands) $(49,418) $(20,750) $24,458 $14,508 $(13,364) $561 4Q24 4Q25 MTM Securities MTM Derivatives Net Impact on AOCI1 • No held-to-maturity securities • Securities portfolio average duration of 7.3 years • Average securities portfolio yield of 4.93% • AOCI / Total Risk-Based Capital of 0.1% vs. peer bank median of (3.7)%2 1 Includes the tax-effected impact of $5,390 in 4Q24 and $(226) in 4Q25 2 Includes publicly-traded banks on major exchanges with total assets between $3 billion and $10 billion as of September 30, 2025 (Source: S&P Capital IQ) 32% 33% 36% 31% 31% 16% 15% 15% 29% 31% 17% 17% 18% 13% 12% 22% 23% 20% 18% 19% 13% 12% 11% 9% 7% $768 $765 $744 $826 $776 4Q24 1Q25 2Q25 3Q25 4Q25 Mortgage-Backed Securities Municipal Bonds U.S. Treasuries Corporate Securities Securities Available for Sale Portfolio (dollars in millions) Other |
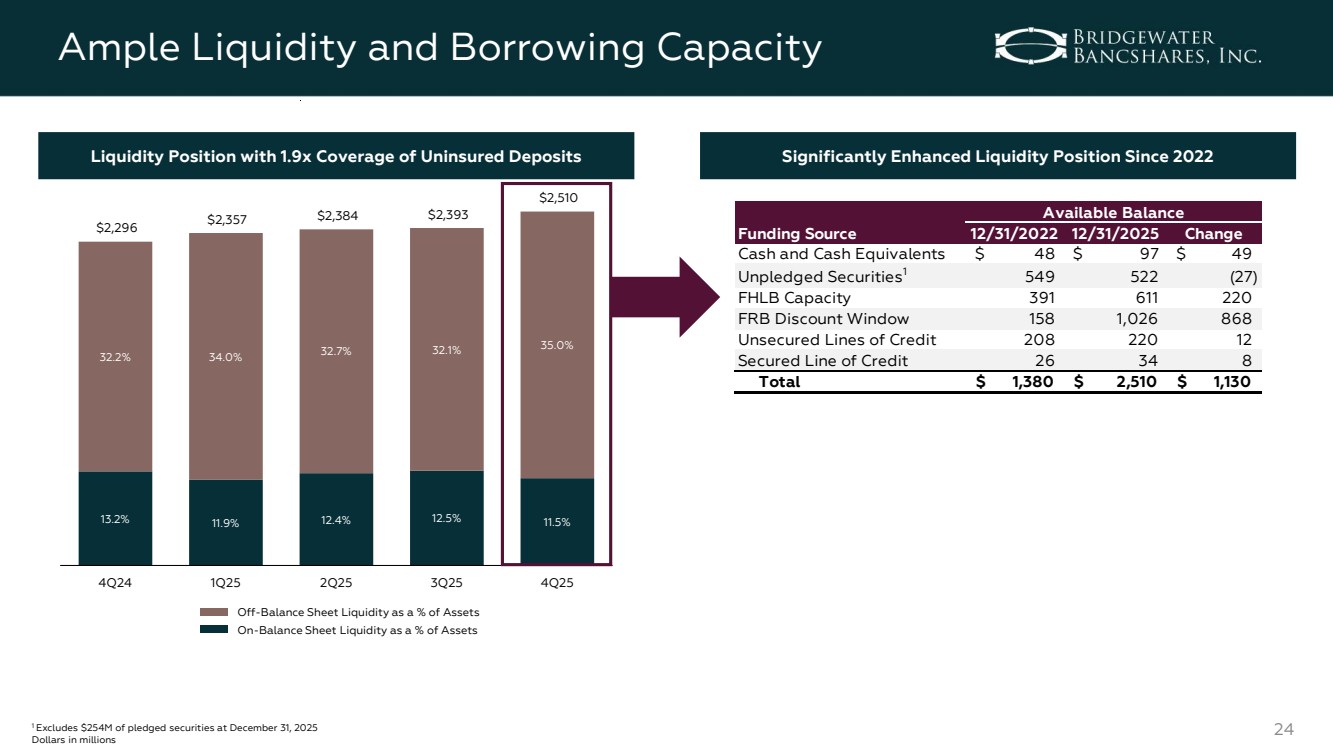
| 13.2% 11.9% 12.4% 12.5% 11.5% 32.2% 34.0% 32.7% 32.1% 35.0% $2,296 $2,357 $2,384 $2,393 $2,510 4Q24 1Q25 2Q25 3Q25 4Q25 24 Ample Liquidity and Borrowing Capacity 1 Excludes $254M of pledged securities at December 31, 2025 Dollars in millions Off-Balance Sheet Liquidity as a % of Assets On-Balance Sheet Liquidity as a % of Assets Liquidity Position with 1.9x Coverage of Uninsured Deposits Significantly Enhanced Liquidity Position Since 2022 Funding Source 12/31/2022 12/31/2025 Change Cash and Cash Equivalents $ 4 8 $ 9 7 $ 4 9 Unpledged Securities1 549 522 (27) FHLB Capacity 391 611 220 FRB Discount Window 158 1,026 868 Unsecured Lines of Credit 208 220 12 Secured Line of Credit 26 3 4 8 Total $ 1,380 $ 2,510 $ 1,130 Available Balance |
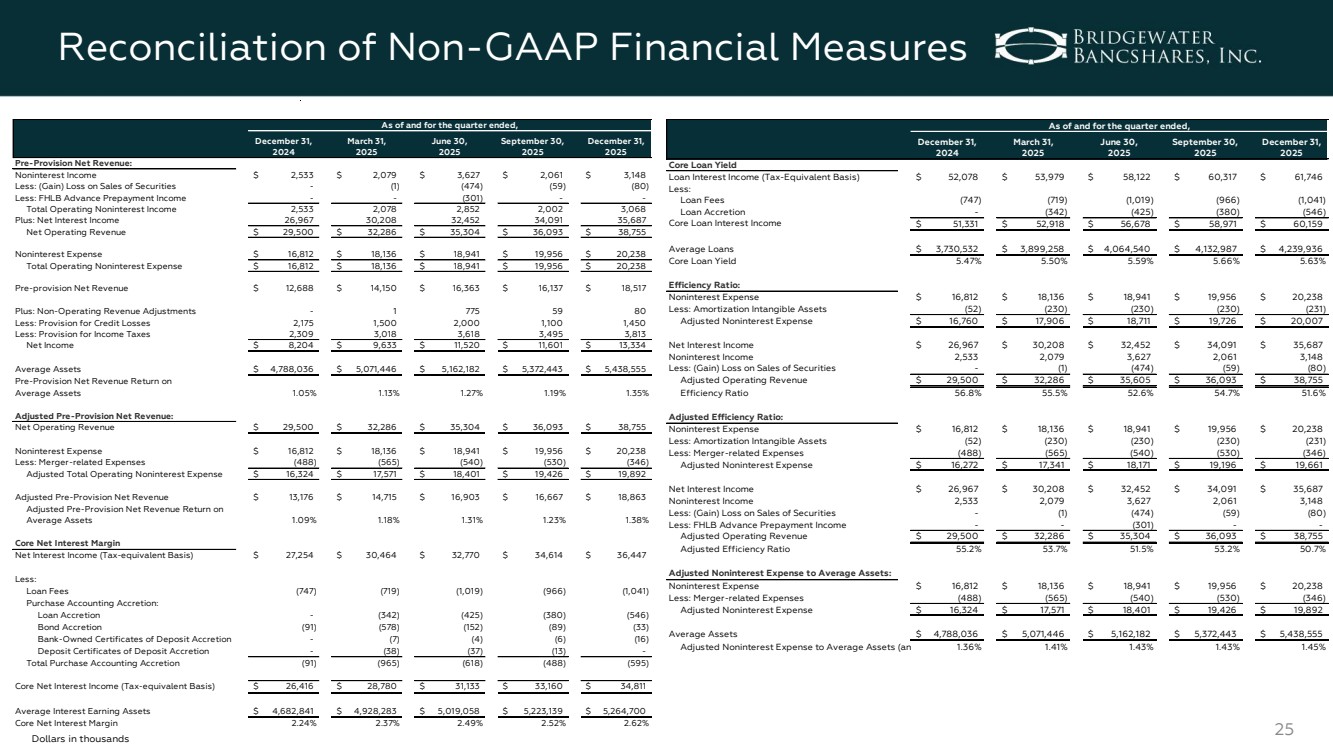
| 25 Reconciliation of Non-GAAP Financial Measures Dollars in thousands December 31, 2024 March 31, 2025 June 30, 2025 September 30, 2025 December 31, 2025 Core Loan Yield Loan Interest Income (Tax-Equivalent Basis) $ 52,078 $ 53,979 $ 58,122 $ 60,317 $ 61,746 Less: Loan Fees (747) (719) (1,019) (966) (1,041) Loan Accretion - (342) (425) (380) (546) Core Loan Interest Income $ 51,331 $ 52,918 $ 56,678 $ 58,971 $ 60,159 Average Loans $ 3,730,532 $ 3,899,258 $ 4,064,540 $ 4,132,987 $ 4,239,936 Core Loan Yield 5.47% 5.50% 5.59% 5.66% 5.63% Efficiency Ratio: Noninterest Expense $ 16,812 $ 18,136 $ 18,941 $ 19,956 $ 20,238 Less: Amortization Intangible Assets (52) (230) (230) (230) (231) Adjusted Noninterest Expense $ 16,760 $ 17,906 $ 18,711 $ 19,726 $ 20,007 Net Interest Income $ 26,967 $ 30,208 $ 32,452 $ 34,091 $ 35,687 Noninterest Income 2,533 2,079 3,627 2,061 3,148 Less: (Gain) Loss on Sales of Securities - (1) (474) (59) (80) Adjusted Operating Revenue $ 29,500 $ 32,286 $ 35,605 $ 36,093 $ 38,755 Efficiency Ratio 56.8% 55.5% 52.6% 54.7% 51.6% Adjusted Efficiency Ratio: Noninterest Expense $ 16,812 $ 18,136 $ 18,941 $ 19,956 $ 20,238 Less: Amortization Intangible Assets (52) (230) (230) (230) (231) Less: Merger-related Expenses (488) (565) (540) (530) (346) Adjusted Noninterest Expense $ 16,272 $ 17,341 $ 18,171 $ 19,196 $ 19,661 Net Interest Income $ 26,967 $ 30,208 $ 32,452 $ 34,091 $ 35,687 Noninterest Income 2,533 2,079 3,627 2,061 3,148 Less: (Gain) Loss on Sales of Securities - (1) (474) (59) (80) Less: FHLB Advance Prepayment Income - - (301) - - Adjusted Operating Revenue $ 29,500 $ 32,286 $ 35,304 $ 36,093 $ 38,755 Adjusted Efficiency Ratio 55.2% 53.7% 51.5% 53.2% 50.7% Adjusted Noninterest Expense to Average Assets: Noninterest Expense $ 16,812 $ 18,136 $ 18,941 $ 19,956 $ 20,238 Less: Merger-related Expenses (488) (565) (540) (530) (346) Adjusted Noninterest Expense $ 16,324 $ 17,571 $ 18,401 $ 19,426 $ 19,892 Average Assets $ 4,788,036 $ 5,071,446 $ 5,162,182 $ 5,372,443 $ 5,438,555 Adjusted Noninterest Expense to Average Assets (ann.) 1.36% 1.41% 1.43% 1.43% 1.45% As of and for the quarter ended, December 31, 2024 March 31, 2025 June 30, 2025 September 30, 2025 December 31, 2025 Pre-Provision Net Revenue: Noninterest Income $ 2,533 $ 2,079 $ 3,627 $ 2,061 $ 3,148 Less: (Gain) Loss on Sales of Securities - (1) (474) (59) (80) Less: FHLB Advance Prepayment Income - - (301) - - Total Operating Noninterest Income 2,533 2,078 2,852 2,002 3,068 Plus: Net Interest Income 26,967 30,208 32,452 34,091 35,687 Net Operating Revenue $ 29,500 $ 32,286 $ 35,304 $ 36,093 $ 38,755 Noninterest Expense $ 16,812 $ 18,136 $ 18,941 $ 19,956 $ 20,238 Total Operating Noninterest Expense $ 16,812 $ 18,136 $ 18,941 $ 19,956 $ 20,238 Pre-provision Net Revenue $ 12,688 $ 14,150 $ 16,363 $ 16,137 $ 18,517 Plus: Non-Operating Revenue Adjustments - 1 775 59 8 0 Less: Provision for Credit Losses 2,175 1,500 2,000 1,100 1,450 Less: Provision for Income Taxes 2,309 3,018 3,618 3,495 3,813 Net Income $ 8,204 $ 9,633 $ 11,520 $ 11,601 $ 13,334 Average Assets $ 4,788,036 $ 5,071,446 $ 5,162,182 $ 5,372,443 $ 5,438,555 Pre-Provision Net Revenue Return on Average Assets 1.05% 1.13% 1.27% 1.19% 1.35% Adjusted Pre-Provision Net Revenue: Net Operating Revenue $ 29,500 $ 32,286 $ 35,304 $ 36,093 $ 38,755 Noninterest Expense $ 16,812 $ 18,136 $ 18,941 $ 19,956 $ 20,238 Less: Merger-related Expenses (488) (565) (540) (530) (346) Adjusted Total Operating Noninterest Expense $ 16,324 $ 17,571 $ 18,401 $ 19,426 $ 19,892 Adjusted Pre-Provision Net Revenue $ 13,176 $ 14,715 $ 16,903 $ 16,667 $ 18,863 Adjusted Pre-Provision Net Revenue Return on Average Assets 1.09% 1.18% 1.31% 1.23% 1.38% Core Net Interest Margin Net Interest Income (Tax-equivalent Basis) $ 27,254 $ 30,464 $ 32,770 $ 34,614 $ 36,447 Less: Loan Fees (747) (719) (1,019) (966) (1,041) Purchase Accounting Accretion: Loan Accretion - (342) (425) (380) (546) Bond Accretion (91) (578) (152) (89) (33) Bank-Owned Certificates of Deposit Accretion - (7) (4) (6) (16) Deposit Certificates of Deposit Accretion - (38) (37) (13) - Total Purchase Accounting Accretion (91) (965) (618) (488) (595) Core Net Interest Income (Tax-equivalent Basis) $ 26,416 $ 28,780 $ 31,133 $ 33,160 $ 34,811 Average Interest Earning Assets $ 4,682,841 $ 4,928,283 $ 5,019,058 $ 5,223,139 $ 5,264,700 Core Net Interest Margin 2.24% 2.37% 2.49% 2.52% 2.62% As of and for the quarter ended, |
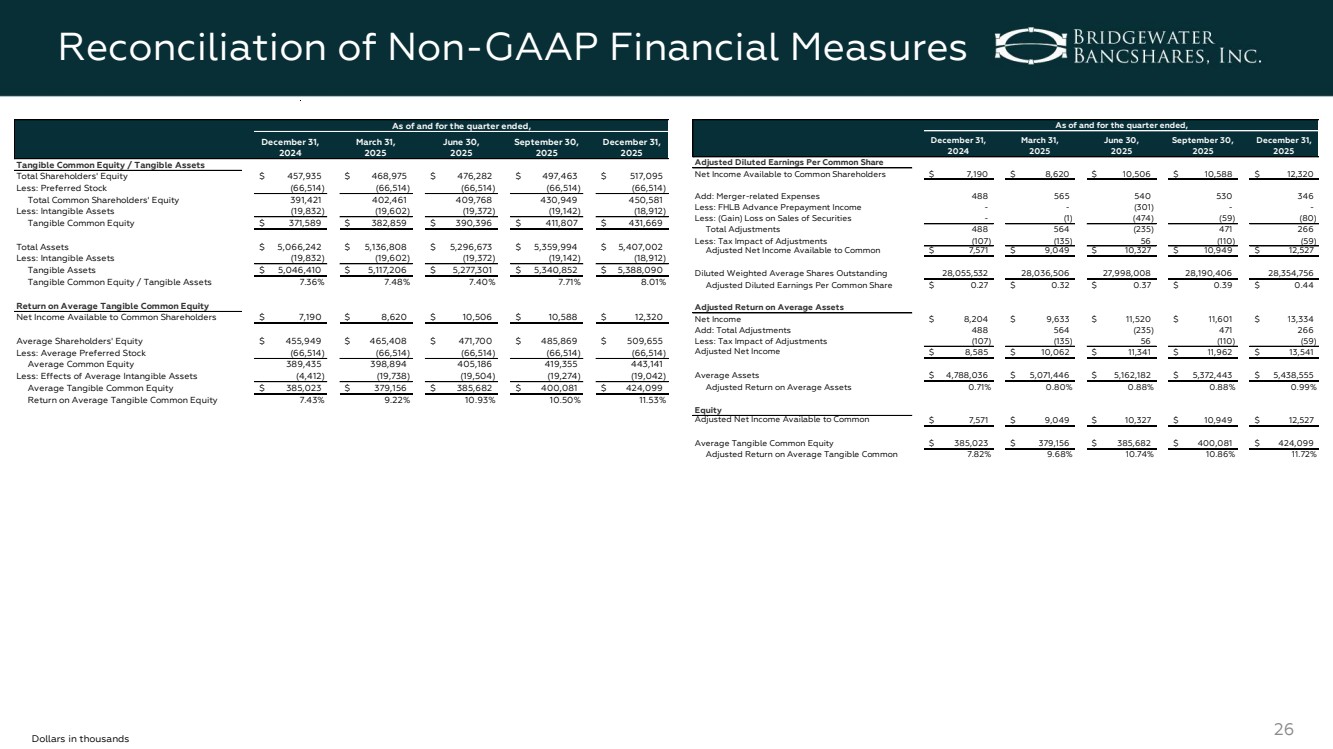
| 26 Reconciliation of Non-GAAP Financial Measures Dollars in thousands December 31, 2024 March 31, 2025 June 30, 2025 September 30, 2025 December 31, 2025 Adjusted Diluted Earnings Per Common Share Net Income Available to Common Shareholders $ 7,190 $ 8,620 $ 10,506 $ 10,588 $ 12,320 Add: Merger-related Expenses 488 565 540 530 346 Less: FHLB Advance Prepayment Income - - (301) - - Less: (Gain) Loss on Sales of Securities - (1) (474) (59) (80) Total Adjustments 488 564 (235) 471 266 Less: Tax Impact of Adjustments (107) (135) 56 (110) (59) Adjusted Net Income Available to Common $ 7,571 $ 9,049 $ 10,327 $ 10,949 $ 12,527 Diluted Weighted Average Shares Outstanding 28,055,532 28,036,506 27,998,008 28,190,406 28,354,756 Adjusted Diluted Earnings Per Common Share $ 0.27 $ 0.32 $ 0.37 $ 0.39 $ 0.44 Adjusted Return on Average Assets Net Income $ 8,204 $ 9,633 $ 11,520 $ 11,601 $ 13,334 Add: Total Adjustments 488 564 (235) 471 266 Less: Tax Impact of Adjustments (107) (135) 56 (110) (59) Adjusted Net Income $ 8,585 $ 10,062 $ 11,341 $ 11,962 $ 13,541 Average Assets $ 4,788,036 $ 5,071,446 $ 5,162,182 $ 5,372,443 $ 5,438,555 Adjusted Return on Average Assets 0.71% 0.80% 0.88% 0.88% 0.99% Adjusted Return on Average Tangible Common Equity Adjusted Net Income Available to Common $ 7,571 $ 9,049 $ 10,327 $ 10,949 $ 12,527 Average Tangible Common Equity $ 385,023 $ 379,156 $ 385,682 $ 400,081 $ 424,099 Adjusted Return on Average Tangible Common 7.82% 9.68% 10.74% 10.86% 11.72% As of and for the quarter ended, December 31, 2024 March 31, 2025 June 30, 2025 September 30, 2025 December 31, 2025 Tangible Common Equity / Tangible Assets Total Shareholders' Equity $ 457,935 $ 468,975 $ 476,282 $ 497,463 $ 517,095 Less: Preferred Stock (66,514) (66,514) (66,514) (66,514) (66,514) Total Common Shareholders' Equity 391,421 402,461 409,768 430,949 450,581 Less: Intangible Assets (19,832) (19,602) (19,372) (19,142) (18,912) Tangible Common Equity $ 371,589 $ 382,859 $ 390,396 $ 411,807 $ 431,669 Total Assets $ 5,066,242 $ 5,136,808 $ 5,296,673 $ 5,359,994 $ 5,407,002 Less: Intangible Assets (19,832) (19,602) (19,372) (19,142) (18,912) Tangible Assets $ 5,046,410 $ 5,117,206 $ 5,277,301 $ 5,340,852 $ 5,388,090 Tangible Common Equity / Tangible Assets 7.36% 7.48% 7.40% 7.71% 8.01% Return on Average Tangible Common Equity Net Income Available to Common Shareholders $ 7,190 $ 8,620 $ 10,506 $ 10,588 $ 12,320 Average Shareholders' Equity $ 455,949 $ 465,408 $ 471,700 $ 485,869 $ 509,655 Less: Average Preferred Stock (66,514) (66,514) (66,514) (66,514) (66,514) Average Common Equity 389,435 398,894 405,186 419,355 443,141 Less: Effects of Average Intangible Assets (4,412) (19,738) (19,504) (19,274) (19,042) Average Tangible Common Equity $ 385,023 $ 379,156 $ 385,682 $ 400,081 $ 424,099 Return on Average Tangible Common Equity 7.43% 9.22% 10.93% 10.50% 11.53% As of and for the quarter ended, |
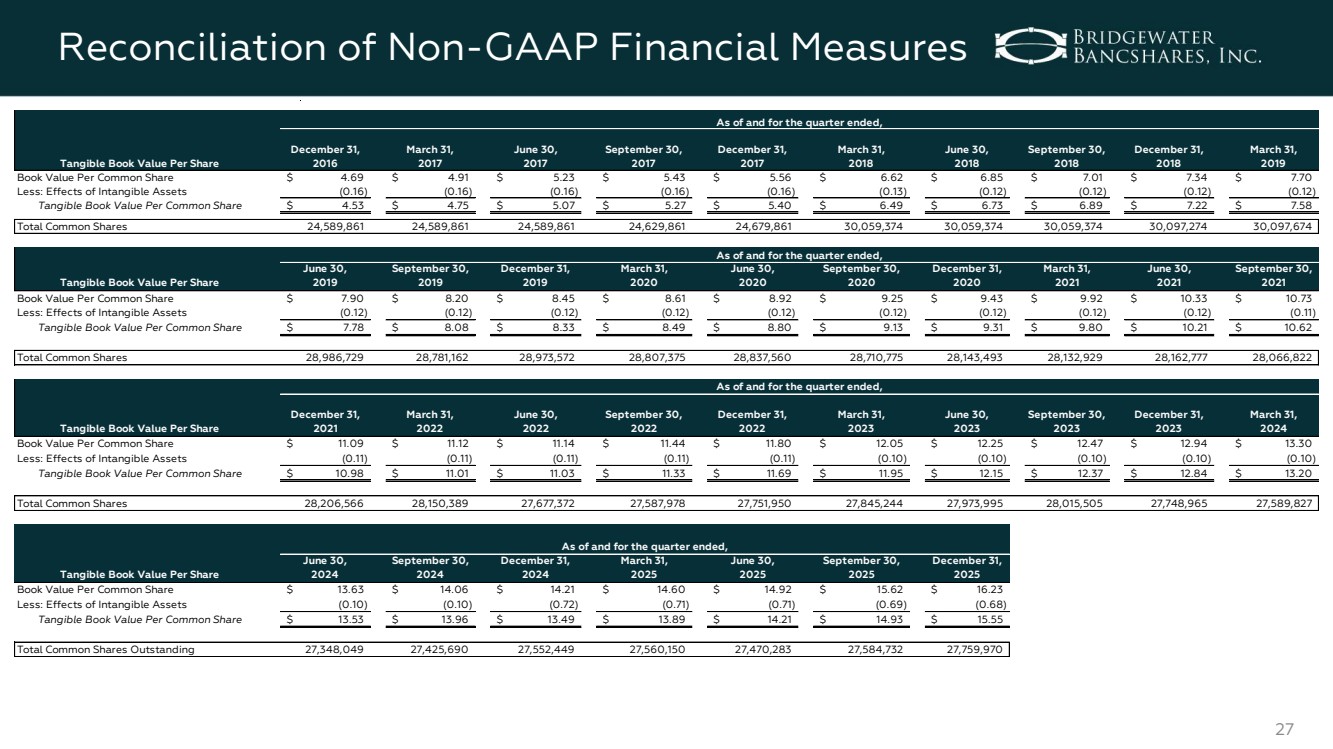
| 27 Reconciliation of Non-GAAP Financial Measures Tangible Book Value Per Share December 31, 2016 March 31, 2017 June 30, 2017 September 30, 2017 December 31, 2017 March 31, 2018 June 30, 2018 September 30, 2018 December 31, 2018 March 31, 2019 Book Value Per Common Share $ 4.69 $ 4.91 $ 5.23 $ 5.43 $ 5.56 $ 6.62 $ 6.85 $ 7.01 $ 7.34 $ 7.70 Less: Effects of Intangible Assets (0.16) (0.16) (0.16) (0.16) (0.16) (0.13) (0.12) (0.12) (0.12) (0.12) Tangible Book Value Per Common Share $ 4.53 $ 4.75 $ 5.07 $ 5.27 $ 5.40 $ 6.49 $ 6.73 $ 6.89 $ 7.22 $ 7.58 Total Common Shares 24,589,861 24,589,861 24,589,861 24,629,861 24,679,861 30,059,374 30,059,374 30,059,374 30,097,274 30,097,674 Tangible Book Value Per Share June 30, 2019 September 30, 2019 December 31, 2019 March 31, 2020 June 30, 2020 September 30, 2020 December 31, 2020 March 31, 2021 June 30, 2021 September 30, 2021 Book Value Per Common Share $ 7.90 $ 8.20 $ 8.45 $ 8.61 $ 8.92 $ 9.25 $ 9.43 $ 9.92 $ 10.33 $ 10.73 Less: Effects of Intangible Assets (0.12) (0.12) (0.12) (0.12) (0.12) (0.12) (0.12) (0.12) (0.12) (0.11) Tangible Book Value Per Common Share $ 7.78 $ 8.08 $ 8.33 $ 8.49 $ 8.80 $ 9.13 $ 9.31 $ 9.80 $ 10.21 $ 10.62 Total Common Shares 28,986,729 28,781,162 28,973,572 28,807,375 28,837,560 28,710,775 28,143,493 28,132,929 28,162,777 28,066,822 Tangible Book Value Per Share December 31, 2021 March 31, 2022 June 30, 2022 September 30, 2022 December 31, 2022 March 31, 2023 June 30, 2023 September 30, 2023 December 31, 2023 March 31, 2024 Book Value Per Common Share $ 11.09 $ 11.12 $ 11.14 $ 11.44 $ 11.80 $ 12.05 $ 12.25 $ 12.47 $ 12.94 $ 13.30 Less: Effects of Intangible Assets (0.11) (0.11) (0.11) (0.11) (0.11) (0.10) (0.10) (0.10) (0.10) (0.10) Tangible Book Value Per Common Share $ 10.98 $ 11.01 $ 11.03 $ 11.33 $ 11.69 $ 11.95 $ 12.15 $ 12.37 $ 12.84 $ 13.20 Total Common Shares 28,206,566 28,150,389 27,677,372 27,587,978 27,751,950 27,845,244 27,973,995 28,015,505 27,748,965 27,589,827 Tangible Book Value Per Share June 30, 2024 September 30, 2024 December 31, 2024 March 31, 2025 June 30, 2025 September 30, 2025 December 31, 2025 Book Value Per Common Share $ 13.63 $ 14.06 $ 14.21 $ 14.60 $ 14.92 $ 15.62 $ 16.23 Less: Effects of Intangible Assets (0.10) (0.10) (0.72) (0.71) (0.71) (0.69) (0.68) Tangible Book Value Per Common Share $ 13.53 $ 13.96 $ 13.49 $ 13.89 $ 14.21 $ 14.93 $ 15.55 Total Common Shares Outstanding 27,348,049 27,425,690 27,552,449 27,560,150 27,470,283 27,584,732 27,759,970 As of and for the quarter ended, As of and for the quarter ended, As of and for the quarter ended, As of and for the quarter ended, |