[LETTERHEAD OF NORTHEAST COMMUNITY BANCORP, INC.]
July 22, 2013
VIA EDGAR
Mr. Marc Thomas
Reviewing Accountant
U.S. Securities and Exchange Commission
100 F Street, N.E.
Washington, DC 20549
| RE: | Northeast Community Bancorp, Inc. Form 10-K for the Fiscal Year Ended December 31, 2012 Filed April 12, 2013 Responses dated May 17, 2013 and May 24, 2013 File No. 000-51852 |
Dear Mr. Thomas:
Below please find the responses of Northeast Community Bancorp, Inc. (the “Company”) to comments received by letter dated July 8, 2013. To aid in your review, we have repeated the comments followed by the Company’s responses.
Form 10-K for the Fiscal Year Ended December 31, 2012
Item 7. Management’s Discussion and Analysis of Financial Condition and Results of Operations
Results of Operations for the Years Ended December 31, 2012 and 2011
Noninterest Expense, page 43
Comment No. 1:
We have reviewed your response to prior comment number one in our letter dated May 3, 2013. In regard to the goodwill impairment recorded for Hayden Wealth Management during the fiscal year ended December 31, 2012, please provide us with the management prepared goodwill impairment analysis for both Step 1 and Step 2 under ASC 350-20-35. In your response you should also address the following:
Atlanta Augusta Charlotte Denver los angeles New York Raleigh San Diego San Francisco
Seattle SHANGHAI Silicon Valley Stockholm Tokyo Walnut Creek Washington Winston-Salem
| Mr. Marc Thomas July 22, 2013 Page 2 |
| · | address how the methods and key assumptions were determined and then utilized to assess for goodwill impairment under each of the different methods evaluated in both the initial and subsequently prepared goodwill impairment analysis; |
| · | address the underlying reasons for the differences in fair value resulting from each of the methods considered and how the amount of the initial goodwill impairment amount recorded during fiscal 2012 was determined; |
| · | address how the subsequently determined fair value impairment of the identified customer intangible asset impacted the initial goodwill impairment analysis prepared and how the additional amount of goodwill impairment was determined; and |
| · | address whether there was a subsequent impairment recorded in regard to the identified customer relationship intangible asset. |
Response to Comment No. 1:
Step 1 of the goodwill impairment test under ASC 350-20-35 requires the comparison of the fair value of the reporting unit with its carrying amount, including goodwill. We engaged a third party, FinPro, Inc., to prepare a valuation of Hayden Wealth Management (“Hayden”) as of December 31, 2012 to meet the requirements of Step 1. FinPro, Inc. is an investment management and consulting firm specializing in providing advisory services to the financial institutions, including valuation services. We then reviewed the assets and liabilities attributed to Hayden to determine the carrying amount. In doing this we originally concluded that the goodwill of $1,310,000 was the only significant asset or liability of Hayden at December 31, 2012. As such, we did not prepare a formal schedule of the carrying amount of Hayden. Factors we considered in our review included: Hayden operates from a leased office and has no significant property or equipment; generally, there are no receivables arising from their activity due to the nature of their business; and expenses are primarily personnel in nature and there were no significant accruals at December 31, 2012 related to personnel or other operating costs. Since our original review indicated that goodwill was the only asset of the reporting unit, our Step 1 comparison was limited to comparing the fair value per FinPro’s valuation to the carrying amount of goodwill. As discussed later in this response, we subsequently realized we had overlooked a customer intangible related to Hayden in determining the carrying amount of Hayden. However, since the fair value of Hayden as determined by the FinPro valuation was less than the carrying amount of the goodwill, it had no effect on the Step 1 conclusion that the goodwill was impaired.
In determining the fair value of Hayden under Step 1, we considered the following valuation techniques:
| · | A market value approach based upon the acquisition multiples of asset management firms that were acquired in 2011 and 2012. The average and median multiples were applied to Hayden’s financial data. The implied value on a price to revenue basis was $1.087 million using the median multiple for all deals. Based upon the median price to assets under management multiple, the implied value for Hayden was $1.328 million. |
| Mr. Marc Thomas July 22, 2013 Page 3 |
| · | A discounted cash flow approach. The key assumptions were based on historical performance and considered structural changes to Hayden going forward. The key assumptions were as follows: growth of assets under management, the average revenue per assets under management, operating expenses and the growth of operating expenses, taxes, the discount rate and the terminal value. The discounted cash flow approach resulted in a value of $1.083 million. |
| · | The range of values for Hayden was $1.083 million to $1.328 million. The selected value was $1.083 million using the discounted cash flow approach. This value was consistent with the implied value using the price to revenue approach in the market value method. The highest value used the price to assets under management approach in the market value method. The price to assets under management multiple does not capture the expected revenue from the assets under management. Therefore, we believe the discounted cash flow value best captured the expected value of Hayden. |
Step 2 of the goodwill impairment test requires a comparison of the implied fair value of the reporting unit goodwill with the carrying amount of that goodwill. We assigned the fair value of $1.083 million as determined above to the assets and liabilities of Hayden. As noted above, we had originally identified the existing goodwill related to Hayden as the only significant asset or liability when determining the carrying amount of Hayden. Since there were no other significant assets or liabilities identified (other than goodwill), we attributed 100% of the fair value of $1.083 million to the implied goodwill. This resulted in the recognition of an impairment of $227,000 ($1,310,000-$1,083,000). This impairment was recognized in the fourth quarter of 2012.
In preparing our response to the SEC letter dated May 3, 2012, we reviewed our methodology relating to the goodwill impairment. It was at this time that we realized we had failed to consider the existing customer intangible related to Hayden in our determination of the carrying amount of Hayden under both Steps 1 and 2 of the impairment test. We identified no other intangibles related to Hayden besides the existing customer intangible. As noted above, our initial Step 1 comparison had indicated the goodwill was impaired so the inclusion of the customer intangible did not affect this conclusion. We immediately engaged FinPro to perform a valuation to determine the fair value of this intangible and allow us to properly complete Step 2. The results of the valuation indicated a fair value of $334,000 for the customer intangible. After assigning this amount to the customer intangible under Step 2, this resulted in an implied goodwill value of $749,000 ($1,083,000 - $334,000). We have recognized an impairment charge of $334,000 in our second quarter 2013 results for this additional goodwill impairment. The total impairment recognized at June 30, 2013 is $561,000.
| Mr. Marc Thomas July 22, 2013 Page 4 |
The carrying amount of the customer intangible was $406,000 at December 31, 2012. The fair value as determined above was $334,000 or a difference of $72,000. We have not recognized this impairment as we consider it immaterial to our financial statements taken as a whole.
Comment No. 2:
Please address the circumstances under which the company determined that the goodwill impairment analysis for the period ended December 31, 2012 was incomplete requiring an additional impairment of $334,000 related to the identified intangible asset.
Response to Comment No. 2:
As noted above, we inadvertently overlooked the customer intangible when determining the carrying amount of Hayden in the step 1 analysis and carried that oversight over to Step 2 when assigning the fair value of Hayden to its assets and liabilities. We immediately took steps to correct this oversight by engaging FinPro to value the customer intangible. The fair value of the customer intangible was estimated at $334,000 resulting in an implied goodwill for Hayden of $749,000. Since we had previously recognized $227,000 of impairment from our initial impairment analysis, this resulted in an additional $334,000 of goodwill impairment. As noted above, we have not recognized any impairment of the customer intangible as we believe the difference between the fair value and carrying amount is not material.
Comment No. 3:
As a result of the subsequently determined goodwill impairment, please provide us with your materiality analysis for the period ended December 31, 2012.
Response to Comment No. 3:
In considering the materiality of the additional $334,000 of goodwill impairment plus the $72,000 of potential customer intangible impairment, we considered both qualitative and quantitative factors. Quantitative factors considered include the following:
| · | The after tax effect of the impairment is $240,000 based on a combined federal and state tax rate of 40% ($334,000 plus $72,000 x 60%). |
| · | The additional impairment would increase our 2012 net loss of $2,514,000 by $240,000 or 9.5%. |
| · | The $240,000 represents .2% of our total stockholders’ equity of $103,849,000 at December 31, 2012. |
| Mr. Marc Thomas July 22, 2013 Page 5 |
| · | Loss per share for 2012 would increase from ($.20) per share to ($.22) per share. |
| · | The additional impairment would have a negligible effect on our capital ratios |
Qualitative factors considered include the following:
| · | The determination of fair value for Hayden and the customer intangible involves significant estimates and there is a higher degree of imprecision inherent in estimates. |
| · | The additional impairment would have a negligible effect on regulatory capital |
| · | The additional impairment would have no effect on management compensation |
| · | The insignificance of Hayden to the Company’s overall business operations |
| · | The additional impairment would not result in a change in earnings from income to a loss |
Based on our consideration of these factors, we believe the effect of the additional impairment is not material to our 2012 financial statements taken as a whole.
Comment No. 4:
Please file on EDGAR both the company’s summary of the goodwill impairment analysis for the period ending December 31, 2012, and the impairment analysis prepared for the identified intangible asset which was provided supplementally to the staff in response to prior comment one in our letter dated May 3, 2013.
Response to Comment No. 4:
Both documents are filed herewith.
* * * * *
| Mr. Marc Thomas July 22, 2013 Page 6 |
If you have any questions about our responses or require any additional information, please do not hesitate to call Sean P. Kehoe at (202) 508-5881.
| Very truly yours, | |
| /s/ Salvatore Randazzo | |
| Salvatore Randazzo |
Enclosures
| cc: | Chris Harley, Securities and Exchange Commission Kenneth A. Martinek, Northeast Community Bancorp, Inc. Christina M. Gattuso, Kilpatrick Townsend & Stockton LLP Sean P. Kehoe, Kilpatrick Townsend & Stockton LLP |
NorthEast Community Bancorp, Inc. Goodwill Impairment Analysis January 15, 201320 Church Street Liberty Corner, NJ 07938 P: (908) 604-9336 F: (908) 604-5951 finpro@finpronj.com www.finpronj.com
Executive summary FinPro is pleased to present this intangible impairment analysis for Northeast Community Bancorp, Inc. (the “Company”). All of the Company’s goodwill is attributable to the acquisition of Hayden Wealth Management Group (“Hayden”). As such, the analysis will focus on Hayden. FinPro analyzed the Hayden’s investment value, and compared that value to the Company’s level of goodwill. To provide the most updated analysis FinPro used Hayden’s financial data through December 31, 2012 and market data as of January 15, 2013.FinPro’s analysis represents FinPro’s independent judgment.FinPro has not been unduly influenced by the Company, personnel of the Company or any other agent connected with the Company. FinPro is a New Jersey corporation, founded in 1987. FinPro is engaged in the business of strategic planning, mergers / acquisitions, corporate appraisals and general consulting for financial institutions. FinPro has provided expert witness reports for litigation regarding corporate stock appraisals of financial institutions.
Executive summary . During the course of our investigation we have carefully reviewed the Company’s internal financial statement for Hayden since the fiscal year ended December 31, 2008, and have discussed the Hayden’s financial condition and operating results with management. In preparing our analysis, we relied upon and assumed the accuracy and completeness of financial and other information provided to us by the Company, SNL Financial and other sources FinPro deems reliable. We did not independently verify the financial statements or the other information provided by the Company, nor did we independently value any of the Company’s assets or liabilities. The appraised investment value indicated that carrying value exceeds fair value.The appraised acquisition market value provides the same conclusion. FinPro placed more weight on the investment value approach.
Executive summary . .The investment value approach results in a value of $1.08 million which is below the carrying value of $1.31 million. Based upon our analysis, it is FinPro’s opinion that as of January 15, 2013, the Hayden’s goodwill is impaired by $227 thousand. The full intangible impairment analysis is presented in the following pages.Very Truly Yours, /S/ Dennis E. Gibney, CFA Managing Director FinPro, Inc.
Hayden Financial Performance
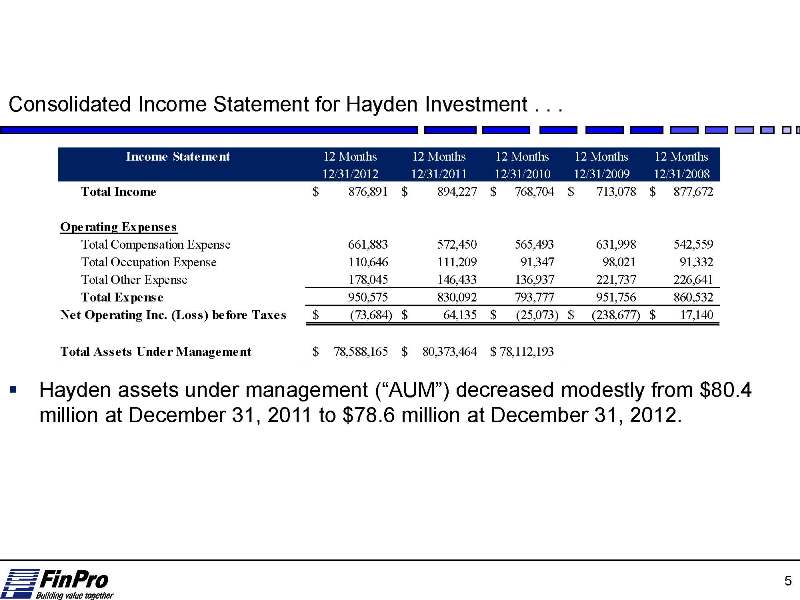
Consolidated Income Statement for Hayden Investment . . . Income State me nt 12 Months 12 Months 12 Months 12 Months 12 Months 12/31/2012 12/31/2011 12/31/2010 12/31/2009 12/31/2008 Total Income $ 876,891 $ 894,227 $ 768,704 $ 713,078 $ 877,672
Ope rating Expe ns e s Total Compensation Expense 661,883 572,450 565,493 631,998 542,559 Total Occupation Expense 110,646 111,209 91,347 98,021 91,332 Total Other Expense 178,045 146,433 136,937 221,737 226,641 Total Expe nse 950,575 830,092 793,777 951,756 860,532 Ne t Ope rating Inc. (Loss) be fore Taxe s $ (73,684) $ 64,135 $ (25,073) $ (238,677) $ 17,140Total Asse ts Unde r Manage me nt $ 78,588,165 $ 80,373,464 $ 78,112,193 Hayden assets under management (“AUM”) decreased modestly from $80.4 million at December 31, 2011 to $78.6 million at December 31, 2012.
Industry Performance
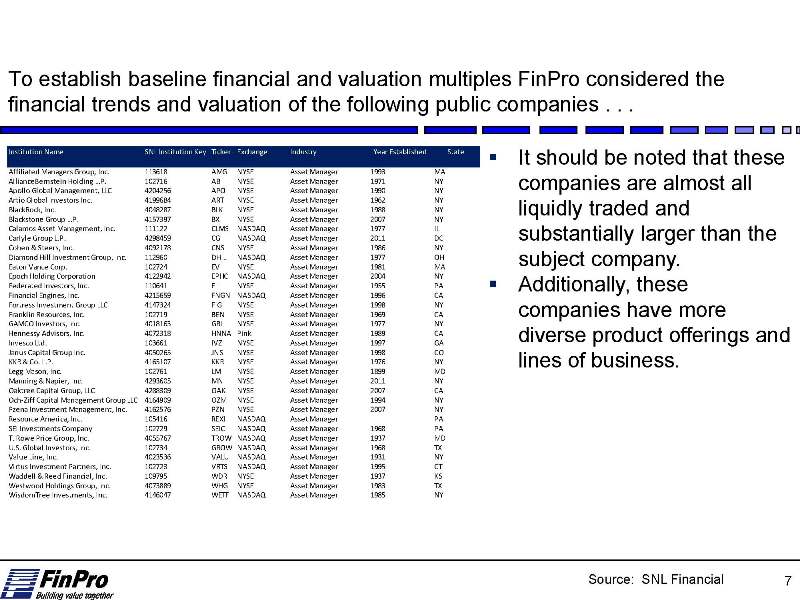
To establish baseline financial and valuation multiples FinPro considered the financial trends and valuation of the following public companies . . .
Institution Name SNL Institution Key Ticker Exchange Industry Year Established State Affiliated Managers Group, Inc. 113618 AMG NYSE Asset Manager 1993 MA AllianceBernstein Holding L.P. 102716 AB NYSE Asset Manager 1971 NY Apollo Global Management, LLC 4204256 APO NYSE Asset Manager 1990 NY Artio Global Investors Inc. 4199684 ART NYSE Asset Manager 1962 NY BlackRock, Inc. 4048287 BLK NYSE Asset Manager 1988 NY Blackstone Group L.P. 4157397 BX NYSE Asset Manager 2007 NY Calamos Asset Management, Inc. 111122 CLMS NASDAQ Asset Manager 1977 IL Carlyle Group L.P. 4298459 CG NASDAQ Asset Manager 2011 DC Cohen & Steers, Inc. 4092178 CNS NYSE Asset Manager 1986 NY Diamond Hill Investment Group, Inc. 112960 DHIL NASDAQ Asset Manager 1977 OH Eaton Vance Corp. 102724 EV NYSE Asset Manager 1981 MA Epoch Holding Corporation 4122942 EPHC NASDAQ Asset Manager 2004 NY Federated Investors, Inc. 110641 FII NYSE Asset Manager 1955 PA Financial Engines, Inc. 4215659 FNGN NASDAQ Asset Manager 1996 CA Fortress Investment Group LLC 4147324 FIG NYSE Asset Manager 1998 NY Franklin Resources, Inc. 102719 BEN NYSE Asset Manager 1969 CA GAMCO Investors, Inc. 4018163 GBL NYSE Asset Manager 1977 NY Hennessy Advisors, Inc. 4072318 HNNA Pink Asset Manager 1989 CA Invesco Ltd. 103661 IVZ NYSE Asset Manager 1997 GA Janus Capital Group Inc. 4050265 JNS NYSE Asset Manager 1998 CO KKR & Co. L.P. 4165107 KKR NYSE Asset Manager 1976 NY Legg Mason, Inc. 102761 LM NYSE Asset Manager 1899 MD Manning & Napier, Inc. 4293605 MN NYSE Asset Manager 2011 NY Oaktree Capital Group, LLC 4288309 OAK NYSE Asset Manager 2007 CA Och-Ziff Capital Management Group LLC 4164909 OZM NYSE Asset Manager 1994 NY Pzena Investment Management, Inc. 4162576 PZN NYSE Asset Manager 2007 NY Resource America, Inc. 105416 REXI NASDAQ Asset Manager PA SEI Investments Company 102729 SEIC NASDAQ Asset Manager 1968 PA T. Rowe Price Group, Inc. 4055767 TROW NASDAQ Asset Manager 1937 MD U.S. Global Investors, Inc. 102734 GROW NASDAQ Asset Manager 1968 TX Value Line, Inc. 4023536 VALU NASDAQ Asset Manager 1931 NY Virtus Investment Partners, Inc. 102723 VRTS NASDAQ Asset Manager 1995 CT Waddell & Reed Financial, Inc. 109795 WDR NYSE Asset Manager 1937 KS Westwood Holdings Group, Inc. 4073889 WHG NYSE Asset Manager 1983 TX WisdomTree Investments, Inc. 4146047 WETF NASDAQ Asset Manager 1985 NY
It should be noted that these companies are almost all liquidly traded and substantially larger than the subject company. Additionally, these companies have more diverse product offerings and lines of business.
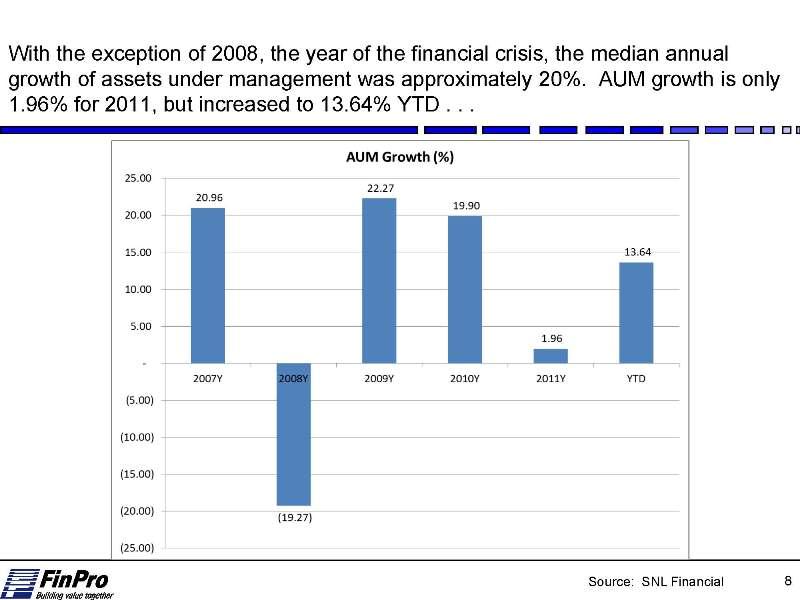
With the exception of 2008, the year of the financial crisis, the median annual growth of assets under management was approximately 20%. AUM growth is only 1.96% for 2011, but increased to 13.64% YTD . . .
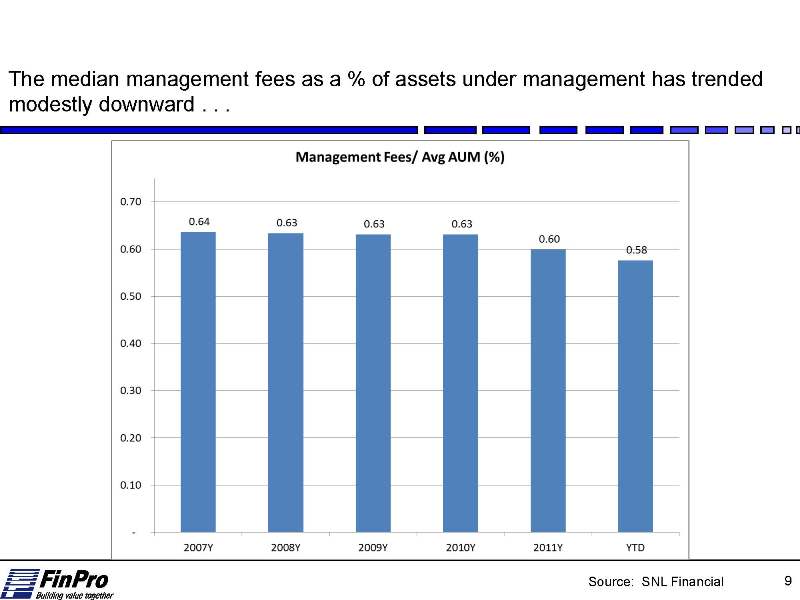
The median management fees as a % of assets under management has trended modestly downward . . .
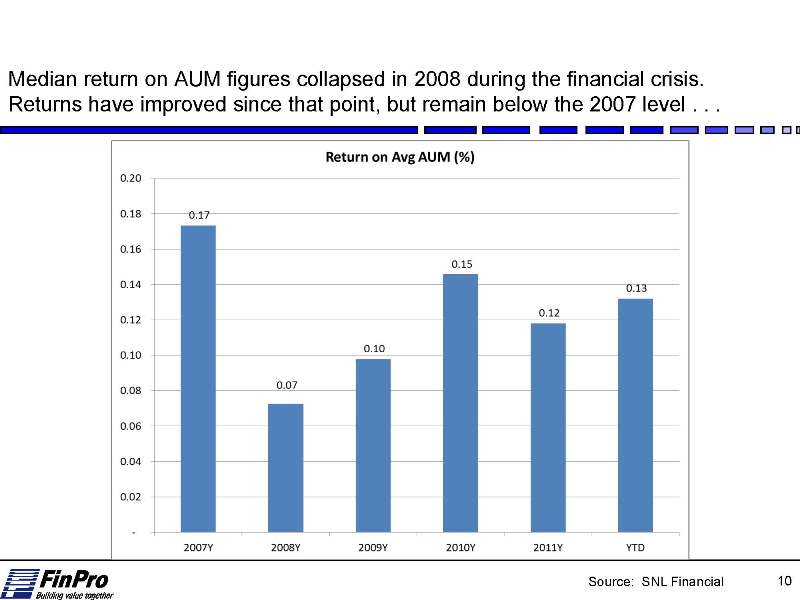 Median return on AUM figures collapsed in 2008 during the financial crisis. Returns have improved since that
point, but remain below the 2007 level .
Median return on AUM figures collapsed in 2008 during the financial crisis. Returns have improved since that
point, but remain below the 2007 level .
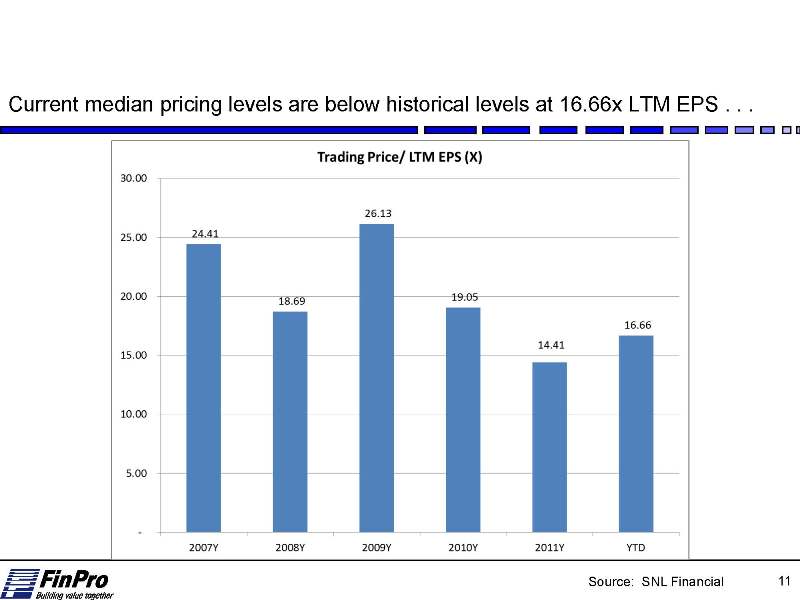
Current median pricing levels are below historical levels at 16.66x LTM EPS .
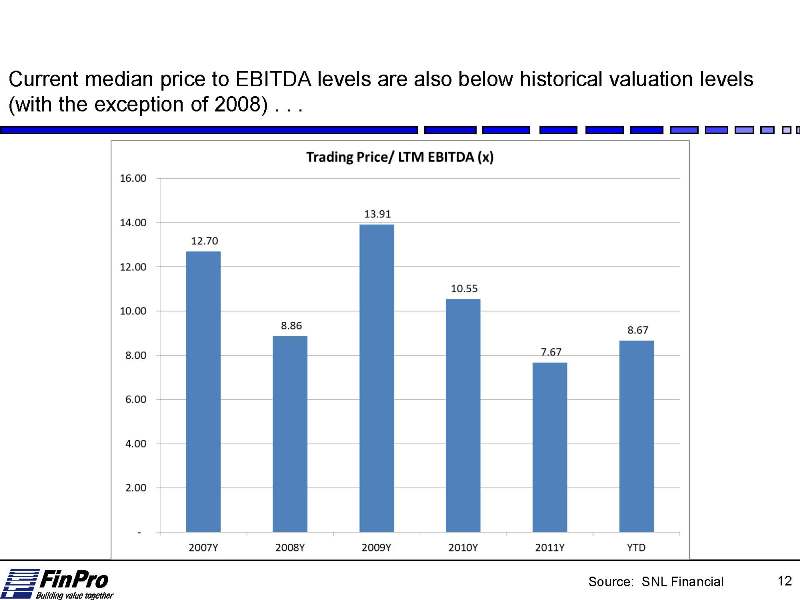 Current median price to EBITDA levels are also below historical valuation levels (with the exception of 2008)
..
Current median price to EBITDA levels are also below historical valuation levels (with the exception of 2008)
..
Acquisition Multiples ofAsset Managers
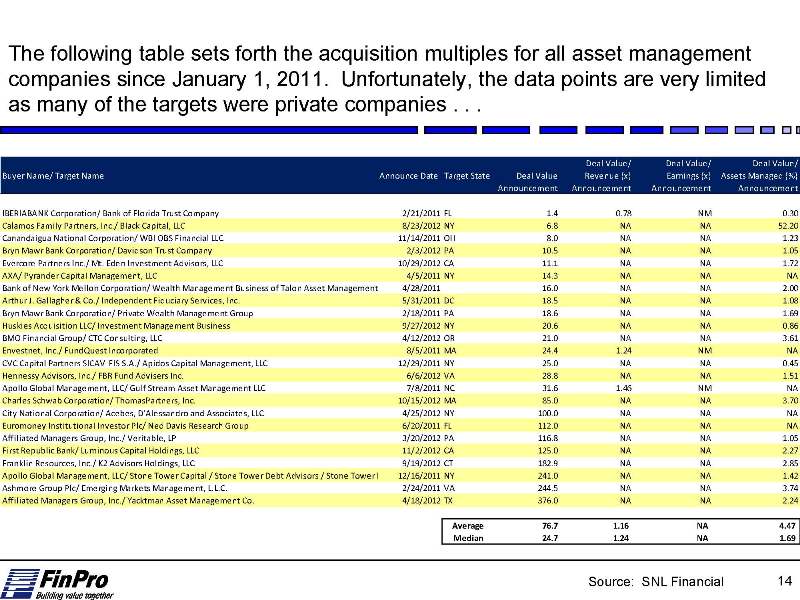
The following table sets forth the acquisition multiples for all asset management companies since January 1, 2011. Unfortunately, the data points are very limited as many of the targets were private companies . . . SNLTable Buyer Name/ Target Name Announce Date Target State Deal Value Announcement Deal Value/ Revenue (x) Announcement Deal Value/ Earnings (x) Announcement Deal Value/ Assets Managed (%) Announcement IBERIABANK Corporation/ Bank of Florida Trust Company 2/21/2011 FL 1.4 0.78 NM 0.30 Calamos Family Partners, Inc./ Black Capital, LLC 8/23/2012 NY 6.8 NA NA 52.20 Canandaigua National Corporation/ WBI OBS Financial LLC 11/14/2011 OH 8.0 NA NA 1.23 Bryn Mawr Bank Corporation/ Davidson Trust Company 2/3/2012 PA 10.5 NA NA 1.05 Evercore Partners Inc./ Mt. Eden Investment Advisors, LLC 10/29/2012 CA 11.1 NA NA 1.72 AXA/ Pyrander Capital Management, LLC 4/5/2011 NY 14.3 NA NA NA Bank of New York Mellon Corporation/ Wealth Management Business of Talon Asset Management 4/28/2011 16.0 NA NA 2.00 Arthur J. Gallagher & Co./ Independent Fiduciary Services, Inc. 5/31/2011 DC 18.5 NA NA 1.08 Bryn Mawr Bank Corporation/ Private Wealth Management Group 2/18/2011 PA 18.6 NA NA 1.69 Huskies Acquisition LLC/ Investment Management Business 9/27/2012 NY 20.6 NA NA 0.86 BMO Financial Group/ CTC Consulting, LLC 4/12/2012 OR 21.0 NA NA 3.61 Envestnet, Inc./ FundQuest Incorporated 8/5/2011 MA 24.4 1.24 NM NA CVC Capital Partners SICAV-FIS S.A./ Apidos Capital Management, LLC 12/29/2011 NY 25.0 NA NA 0.45 Hennessy Advisors, Inc./ FBR Fund Advisers Inc. 6/6/2012 VA 28.8 NA NA 1.51 Apollo Global Management, LLC/ Gulf Stream Asset Management LLC 7/8/2011 NC 31.6 1.46 NM NA Charles Schwab Corporation/ ThomasPartners, Inc. 10/15/2012 MA 85.0 NA NA 3.70 City National Corporation/ Acebes, D'Alessandro and Associates, LLC 4/25/2012 NY 100.0 NA NA NA Euromoney Institutional Investor Plc/ Ned Davis Research Group 6/20/2011 FL 112.0 NA NA NA Affiliated Managers Group, Inc./ Veritable, LP 3/20/2012 PA 116.8 NA NA 1.05 First Republic Bank/ Luminous Capital Holdings, LLC 11/2/2012 CA 125.0 NA NA 2.27 Franklin Resources, Inc./ K2 Advisors Holdings, LLC 9/19/2012 CT 182.9 NA NA 2.85 Apollo Global Management, LLC/ Stone Tower Capital / Stone Tower Debt Advisors / Stone Tower 12/16/2011 NY 241.0 NA NA 1.42 Ashmore Group Plc/ Emerging Markets Management, L.L.C. 2/24/2011 VA 244.5 NA NA 3.74 Affiliated Managers Group, Inc./ Yacktman Asset Management Co. 4/18/2012 TX 376.0 NA NA 2.24 Average 76.7 1.16 NA 4.47 Median 24.7 1.24 NA 1.69
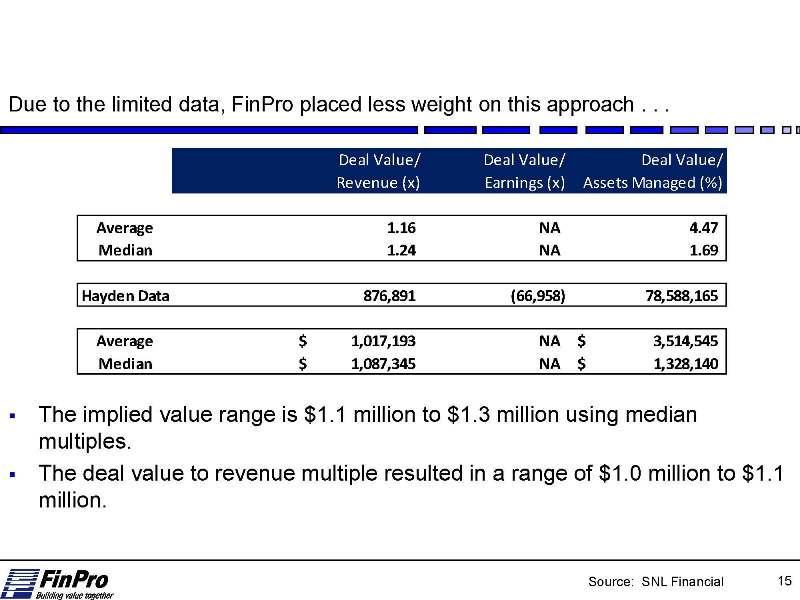
Due to the limited data, FinPro placed less weight on this approach . . . Deal Value/ Deal Value/ Deal Value/ Revenue (x) Earnings (x) Assets Managed (%) Average 1.16 NA 4.47 Median 1.24 NA 1.69 Hayden Data 876,891 (66,958) 78,588,165 Average $ 1,017,193 NA $ 3,514,545 Median $ 1,087,345 NA $ 1,328,140 The implied value range is $1.1 million to $1.3 million using median multiples. The deal value to revenue multiple resulted in a range of $1.0 million to $1.1 million.
Investment Value
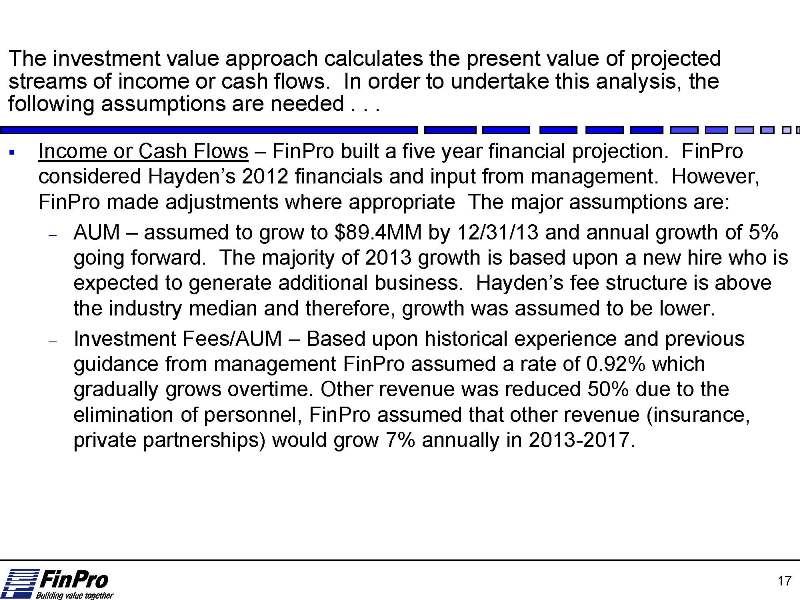
The investment value approach calculates the present value of projected streams of income or cash flows. In order to undertake this analysis, the following assumptions are needed . . . Income or Cash Flows – FinPro built a five year financial projection. FinPro considered Hayden’s 2012 financials and input from management. However, FinPro made adjustments where appropriate The major assumptions are: AUM – assumed to grow to $89.4MM by 12/31/13 and annual growth of 5% going forward. The majority of 2013 growth is based upon a new hire who is expected to generate additional business. Hayden’s fee structure is above the industry median and therefore, growth was assumed to be lower. Investment Fees/AUM – Based upon historical experience and previous guidance from management FinPro assumed a rate of 0.92% which gradually grows overtime. Other revenue was reduced 50% due to the elimination of personnel, FinPro assumed that other revenue (insurance, private partnerships) would grow 7% annually in 2013-2017.
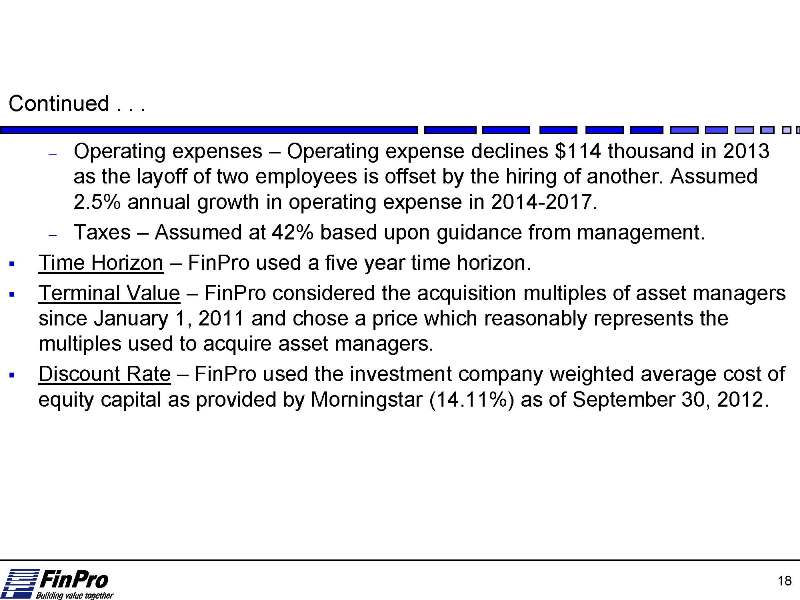
Continued . . . Operating expenses – Operating expense declines $114 thousand in 2013 as the layoff of two employees is offset by the hiring of another. Assumed 2.5% annual growth in operating expense in 2014-2017. Taxes – Assumed at 42% based upon guidance from management. Time Horizon – FinPro used a five year time horizon. Terminal Value – FinPro considered the acquisition multiples of asset managers since January 1, 2011 and chose a price which reasonably represents the multiples used to acquire asset managers. Discount Rate – FinPro used the investment company weighted average cost of equity capital as provided by Morningstar (14.11%) as of September 30, 2012.
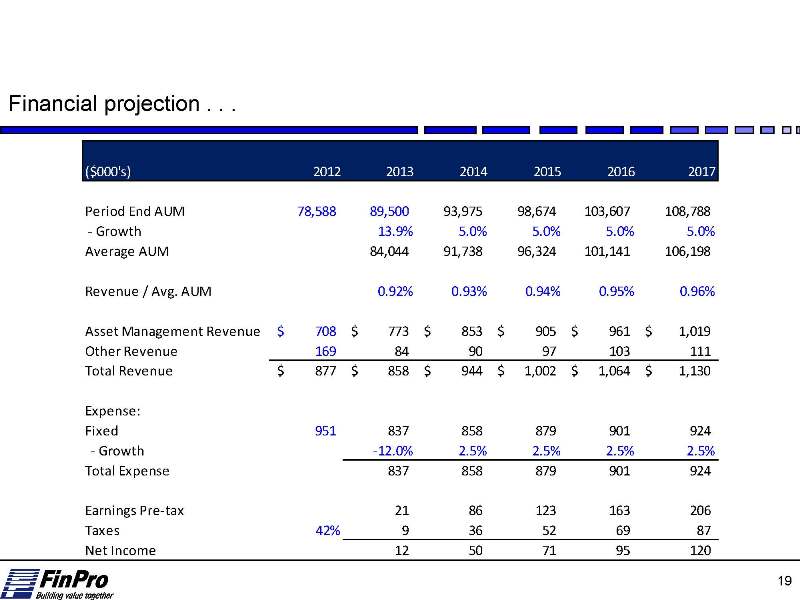
Financial projection . . . ($000's) 2012 2013 2014 2015 2016 2017 Period End AUM 78,588 89,500 93,975 98,674 103,607 108,788 - Growth 13.9% 5.0% 5.0% 5.0% 5.0% Average AUM 84,044 91,738 96,324 101,141 106,198 Revenue / Avg. AUM 0.92% 0.93% 0.94% 0.95% 0.96% Asset Management Revenue $ 708 $ 773 $ 853 $ 905 $ 961 $ 1,019 Other Revenue 169 84 90 97 103 111 Total Revenue $ 877 $ 858 $ 944 $ 1,002 $ 1,064 $ 1,130 Expense: Fixed 951 837 858 879 901 924 - Growth -12.0% 2.5% 2.5% 2.5% 2.5% Total Expense 837 858 879 901 924 Earnings Pre-tax 21 86 123 163 206 Taxes 42% 9 36 52 69 87 Net Income 12 50 71 95 120
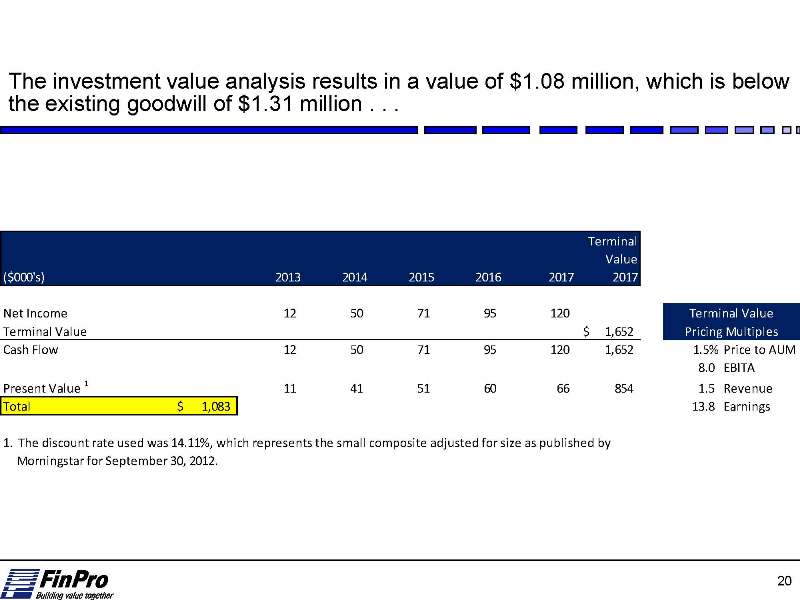
The investment value analysis results in a value of $1.08 million, which is below the existing goodwill of $1.31 million . . . Terminal Value ($000's) 2013 2014 2015 2016 2017 2017
Net Income 12 50 71 95 120 Terminal Value $ 1,652 Terminal Value Pricing Multiples Cash Flow 12 50 71 95 120 1,652 1.5% Price to AUM 8.0 EBITA Present Value 1 11 41 51 60 66 854 1.5 Revenue Total $ 1,083 13.8 Earnings 1. The discount rate used was 14.11%, which represents the small composite adjusted for size as published by Morningstar for September 30, 2012.

May 24, 2013
Mr. Salvador Randazzo
Chief Financial Officer
Northeast
Community Bank
325 Hamilton Avenue
White Plains, NY 10601
Dear Sal,
Per our engagement, we have prepared a valuation of the customer intangible of Hayden Wealth Management as of December 31, 2012. This letter sets forth the results of the valuation.
Valuation Analysis
The value of acquired customer relationships is determined by such factors as the amount of AUM, management fees and the cost of servicing the customer relationships. The value of the CBI was calculated as the economic benefit that a provider of asset management services could expect to realize from the acquired customer relationships. We valued the portfolio as a whole, and applied a discounted earnings analysis to determine the present value of future earnings that a purchaser could expect to realize from the acquired customer relationship. As of December 31, 2012, Northeast Community Bank had existing asset management relationships with AUM of approximately $79 million.
Projected Assets Under Management. We projected on annual basis, the outstanding balance of AUM. This projection begins with the current balance of assets under management and, for each subsequent period in the analysis, is adjusted by: (a) an estimate of the growth in the value of the account assets, a function of investment earnings; (b) an estimate of distributions from the account; and (c) the number of asset management accounts outstanding, projected based on an estimate of the rate of closure of accounts (i.e., referred to as decay rate). The specific assumptions applied are described below.
| a. | Account Asset Growth. A growth factor has been applied to estimate the average account balance based on the mix of invested assets prevailing in the portfolio as of December 31, 2012. The asset allocation of Northeast Community Bank’s AUM has consistently been largely invested in equity mutual funds. Accordingly, for the return rate projected for AUM, we assumed an investment income rate based upon the annualized return provided by the S&P 500 Index. We averaged the 3, 5, 10 and 20 year performance to provide the projected return. |
| b. | Number of Accounts. The number of accounts has been projected based on the number of accounts as of the Valuation Date. The account closure rate was estimated based on empirical data set for the last three years, which indicated an account closure/decay rate of approximately 12 accounts annually, or 4.10%, based on account closure activity during the three years ended December 31, 2012. |
| c. | Net Distributions: Customer net distributions were determined to be negligible based upon statistical information for the three years ended December 31, 2012. |
20 Church Street ●
P.O. Box 323 ● Liberty Corner, NJ 07938-0323 ● Tel: 908.604.9336 ● Fax: 908.604.5951
finpro@finpronj.com
● www.finpronj.com
Confidential
The result of the analysis is attached as an exhibit. The conclusion is a valuation of $334,180. Please contact me with any questions.
Sincerely,

Dennis E. Gibney Managing Director
| 2 |
| Dec-12 | Dec-13 | Dec-14 | Dec-15 | Dec-16 | Dec-17 | Dec-18 | Dec-19 | Dec-20 | Dec-21 | Dec-22 | Dec-23 | Dec-24 | Dec-25 | Dec-26 | Dec-27 | Dec-28 | Dec-29 | Dec-30 | Dec-31 | Dec-32 | ||||||||||||||||||||||||
| Year | — | 1.0 | 2.0 | 3.0 | 4.0 | 5.0 | 6.0 | 7.0 | 8.0 | 9.0 | 10.0 | 11.0 | 12.0 | 13.0 | 14.0 | 15.0 | 16.0 | 17.0 | 18.0 | 19.0 | 20.0 | |||||||||||||||||||||||
| Discount Period | Assumption | 0.5 | 1.5 | 2.5 | 3.5 | 4.5 | 5.5 | 6.5 | 7.5 | 8.5 | 9.5 | 10.5 | 11.5 | 12.5 | 13.5 | 14.5 | 15.5 | 16.5 | 17.5 | 18.5 | 19.5 | |||||||||||||||||||||||
| Customer Accounts Beginning | 293 | 293 | 281 | 269 | 257 | 246 | 236 | 226 | 216 | 207 | 198 | 190 | 181 | 174 | 166 | 159 | 152 | 146 | 140 | 134 | 128 | |||||||||||||||||||||||
| Decay (Avg 12 per year) | 4.10 | % | — | 12 | 12 | 12 | 11 | 11 | 10 | 10 | 9 | 9 | 8 | 8 | 8 | 7 | 7 | 7 | 7 | 6 | 6 | 6 | 5 | |||||||||||||||||||||
| Customer Accounts Ending | 293 | 281 | 269 | 257 | 246 | 236 | 226 | 216 | 207 | 198 | 190 | 181 | 174 | 166 | 159 | 152 | 146 | 140 | 134 | 128 | 122 | |||||||||||||||||||||||
| Average Balance / Customer | 268,219 | 286,897 | 306,875 | 328,245 | 351,102 | 375,552 | 401,704 | 429,677 | 459,598 | 491,602 | 525,836 | 562,453 | 601,620 | 643,514 | 688,326 | 736,259 | 787,529 | 842,369 | 901,028 | 963,773 | ||||||||||||||||||||||||
| Growth (Avg of 3,5,10 and 20 yr. S&P) | 6.96 | % | 18,678 | 19,978 | 21,370 | 22,858 | 24,449 | 26,152 | 27,973 | 29,921 | 32,005 | 34,233 | 36,617 | 39,167 | 41,894 | 44,812 | 47,932 | 51,270 | 54,840 | 58,659 | 62,744 | 67,113 | ||||||||||||||||||||||
| Net Distributions | 0.00 | % | — | — | — | — | — | — | — | — | — | — | — | — | — | — | — | — | — | — | — | — | ||||||||||||||||||||||
| Ending Average Balance / Customer | 268,219 | 286,897 | 306,875 | 328,245 | 351,102 | 375,552 | 401,704 | 429,677 | 459,598 | 491,602 | 525,836 | 562,453 | 601,620 | 643,514 | 688,326 | 736,259 | 787,529 | 842,369 | 901,028 | 963,773 | 1,030,886 | |||||||||||||||||||||||
| Assets Under Management | 81,828,114 | 78,588,165 | 80,617,978 | 82,549,399 | 84,520,203 | 86,537,744 | 88,603,430 | 90,718,423 | 92,883,903 | 95,101,073 | 97,371,167 | 99,695,450 | 102,075,214 | 104,511,783 | 107,006,515 | 109,560,796 | 112,176,049 | 114,853,729 | 117,595,326 | 120,402,366 | 123,276,411 | 126,219,061 | ||||||||||||||||||||||
| Fee / Assets Under Management | 1.10 | % | 1.10 | % | 1.10 | % | 1.10 | % | 1.10 | % | 1.10 | % | 1.10 | % | 1.10 | % | 1.10 | % | 1.10 | % | 1.10 | % | 1.10 | % | 1.10 | % | 1.10 | % | 1.10 | % | 1.10 | % | 1.10 | % | 1.10 | % | 1.10 | % | 1.10 | % | 1.10 | % | 1.10 | % |
| Fee Revenue | 876,891 | 875,634 | 897,421 | 918,883 | 940,819 | 963,276 | 986,270 | 1,009,813 | 1,033,917 | 1,058,597 | 1,083,866 | 1,109,739 | 1,136,228 | 1,163,351 | 1,191,120 | 1,219,553 | 1,248,664 | 1,278,470 | 1,308,987 | 1,340,233 | 1,372,225 | |||||||||||||||||||||||
| Compensation Expense | 2.25 | % | 542,010 | 408,010 | 417,190 | 426,577 | 436,175 | 445,989 | 456,024 | 466,284 | 476,776 | 487,503 | 498,472 | 509,688 | 521,156 | 532,882 | 544,872 | 557,131 | 569,667 | 582,484 | 595,590 | 608,991 | 622,693 | |||||||||||||||||||||
| Other Operating Expense | 2.25 | % | 408,564 | 417,757 | 427,157 | 436,768 | 446,595 | 456,643 | 466,918 | 477,424 | 488,166 | 499,149 | 510,380 | 521,864 | 533,606 | 545,612 | 557,888 | 570,441 | 583,275 | 596,399 | 609,818 | 623,539 | 637,569 | |||||||||||||||||||||
| Total Expense | 950,575 | 825,767 | 844,347 | 863,345 | 882,770 | 902,633 | 922,942 | 943,708 | 964,941 | 986,653 | 1,008,852 | 1,031,551 | 1,054,761 | 1,078,493 | 1,102,760 | 1,127,572 | 1,152,942 | 1,178,883 | 1,205,408 | 1,232,530 | 1,260,262 | |||||||||||||||||||||||
| 1.21 | % | |||||||||||||||||||||||||||||||||||||||||||
| Pre-tax Income | (73,684 | ) | 49,866 | 53,073 | 55,538 | 58,049 | 60,644 | 63,328 | 66,105 | 68,976 | 71,945 | 75,014 | 78,187 | 81,467 | 84,857 | 88,361 | 91,981 | 95,722 | 99,587 | 103,579 | 107,704 | 111,963 | ||||||||||||||||||||||
| Taxes | 42 | % | (30,947 | ) | 20,944 | 22,291 | 23,326 | 24,380 | 25,470 | 26,598 | 27,764 | 28,970 | 30,217 | 31,506 | 32,839 | 34,216 | 35,640 | 37,111 | 38,632 | 40,203 | 41,826 | 43,503 | 45,235 | 47,025 | ||||||||||||||||||||
| Net Income | (42,737 | ) | 28,923 | 30,783 | 32,212 | 33,668 | 35,173 | 36,730 | 38,341 | 40,006 | 41,728 | 43,508 | 45,349 | 47,251 | 49,217 | 51,249 | 53,349 | 55,519 | 57,760 | 60,076 | 62,468 | 64,939 | ||||||||||||||||||||||
| Discount Factor | 14.11 | % | ||||||||||||||||||||||||||||||||||||||||||
| Present Value of Periodic Cash Flow | 27,075 | 25,253 | 23,158 | 21,212 | 19,420 | 17,772 | 16,258 | 14,866 | 13,589 | 12,416 | 11,341 | 10,356 | 9,453 | 8,626 | 7,869 | 7,177 | 6,543 | 5,964 | 5,435 | 4,951 | ||||||||||||||||||||||||
| Total Present Value | 268,736 | |||||||||||||||||||||||||||||||||||||||||||
| Tax Shield | 65,444 | |||||||||||||||||||||||||||||||||||||||||||
| Total Intangible Value | 334,180 | |||||||||||||||||||||||||||||||||||||||||||
| Tax Shield | ||||||||||||||||||||||||||||||||||||||||||||
| Expense | 26,874 | 26,874 | 26,874 | 26,874 | 26,874 | 26,874 | 26,874 | 26,874 | 26,874 | 26,874 | 26,874 | |||||||||||||||||||||||||||||||||
| Tax Benefit | 11,287 | 11,287 | 11,287 | 11,287 | 11,287 | 11,287 | 11,287 | 11,287 | 11,287 | 11,287 | 11,287 | |||||||||||||||||||||||||||||||||
| PV | 10,566 | 9,260 | 8,115 | 7,111 | 6,232 | 5,461 | 4,786 | 4,194 | 3,676 | 3,221 | 2,823 |
| Hayden Wealth Management Group | |||||||||||
| 2010 | 2011 | 2012 | 3 Yr Avg. | ||||||||
| Beginning Balance | 74,262,840 | 78,112,193 | 80,373,464 | ||||||||
| New Accounts | 3,340,367 | 4.50% | 7 | 7,481,679 | 9.58% | 16 | 2,829,543 | 3.52% | 7 | ||
| Closed Accounts | (5,438,496) | -7.32% | 11 | (5,835,504) | -7.47% | 13 | (9,444,554) | -11.75% | 12 | 12 | |
| Deposits to Existing Accounts | 3,711,115 | 5.00% | 5,081,777 | 6.51% | 3,765,595 | 4.69% | |||||
| Disbursements from Existing Accounts | (4,401,426) | -5.93% | (3,567,980) | -4.57% | (4,597,801) | -5.72% | |||||
| Net Distributions | -0.93% | 1.94% | -1.04% | -0.01% | |||||||
| 3Y | 5Y | 10Y | 20Y | Avg. | |||||
| 10.87% | 1.66% | 7.10% | 8.22% | 6.96% |