
____________________________________________________
UNITED STATES
SECURITIES AND EXCHANGE COMMISSION
Washington, D.C. 20549
_______________________
FORM 6-K
__________________________________
Report of Foreign Private Issuer
Pursuant to Rule 13a-16 or 15d-16
under the Securities Exchange Act of 1934
For the month of May 2026
Commission File Number: 001-15102
__________________________________
Embraer S.A.
__________________________________
Avenida Dra. Ruth Cardoso, 8501,
30th floor (part), Pinheiros, São Paulo, SP, 05425-070, Brazil
(Address of principal executive offices)
__________________________________
Indicate by check mark whether the registrant files or will file annual reports under cover of Form 20-F or Form 40-F:
Form 20-F x Form 40-F ¨
Indicate by check mark if the registrant is submitting the Form 6-K in paper as permitted by Regulation S-T Rule 101(b)(1): ¨
Indicate by check mark if the registrant is submitting the Form 6-K in paper as permitted by Regulation S-T Rule 101(b)(7): ¨
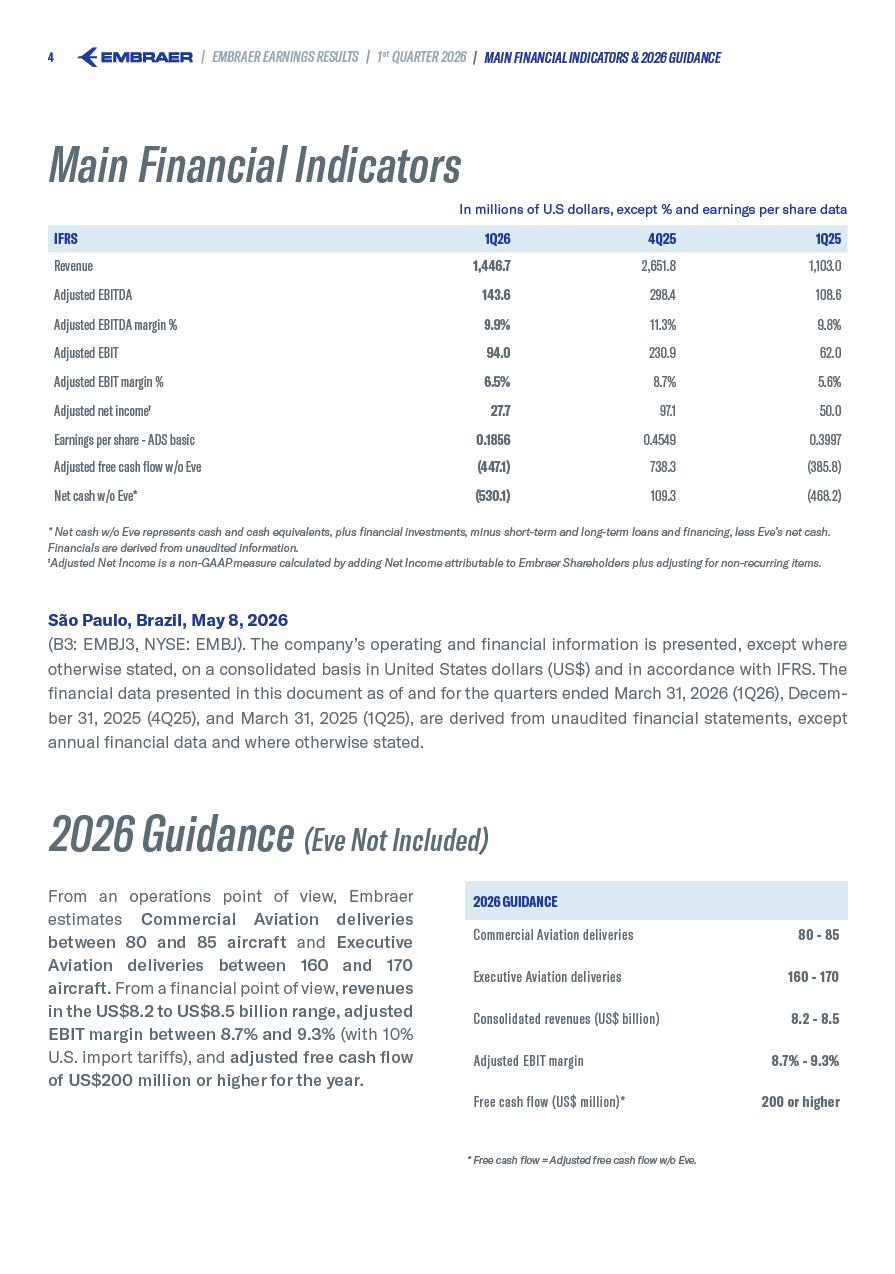
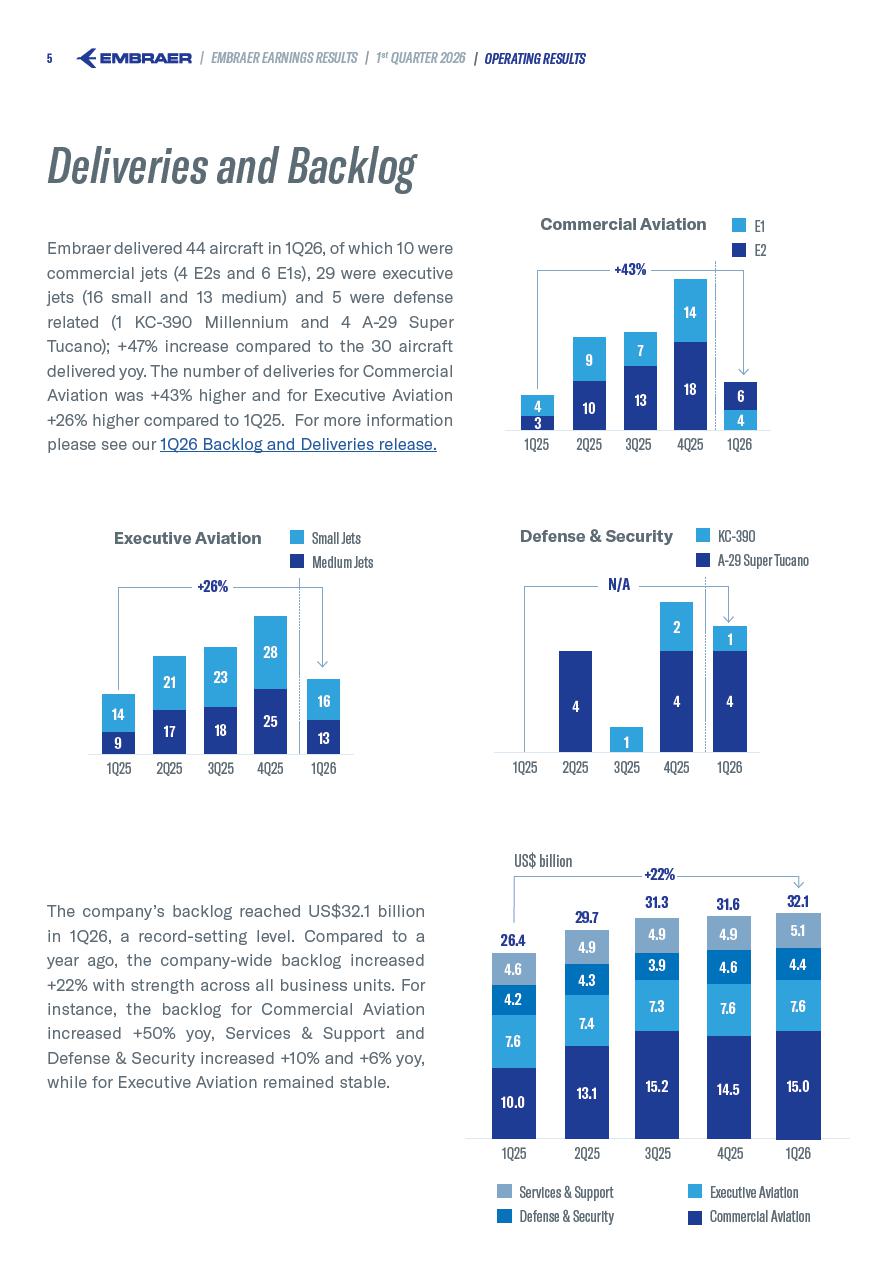
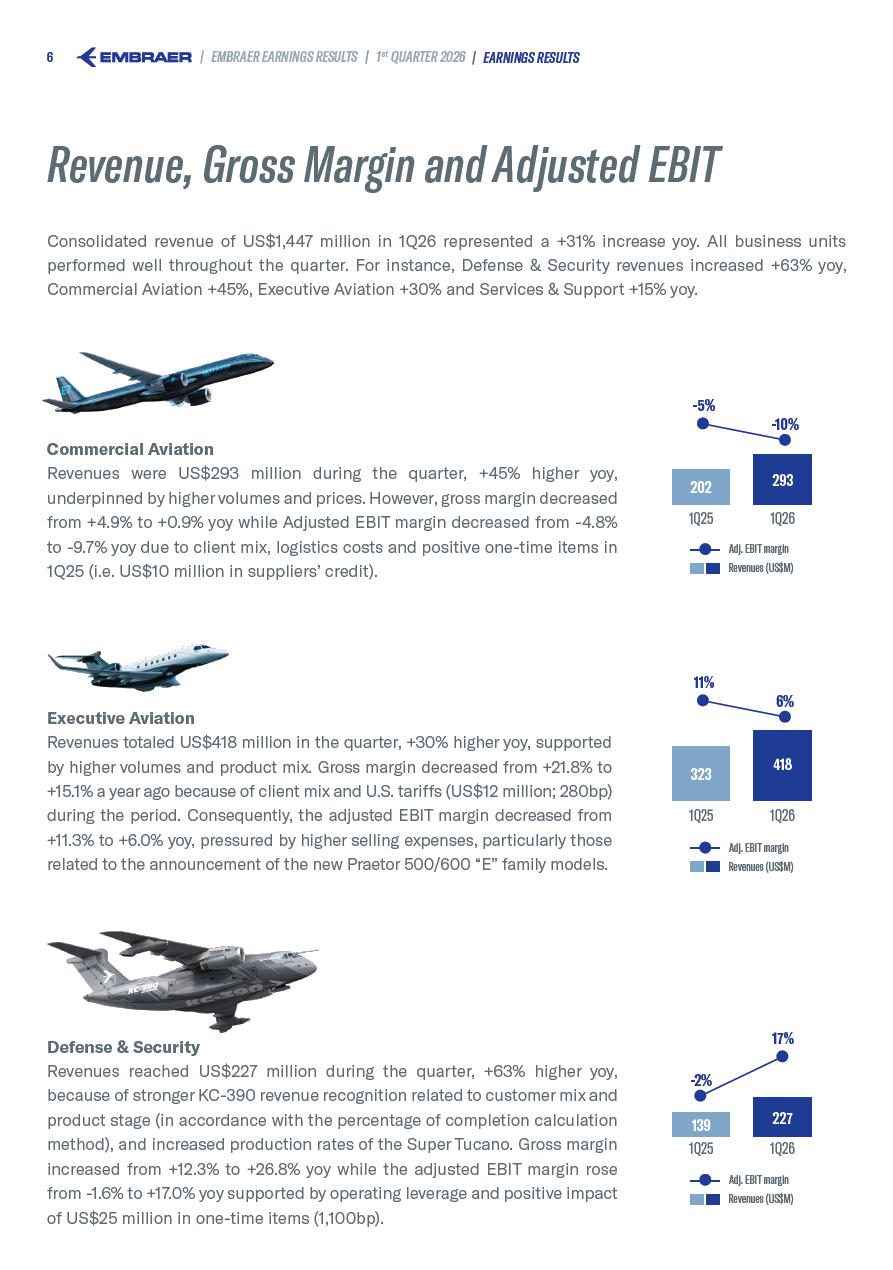
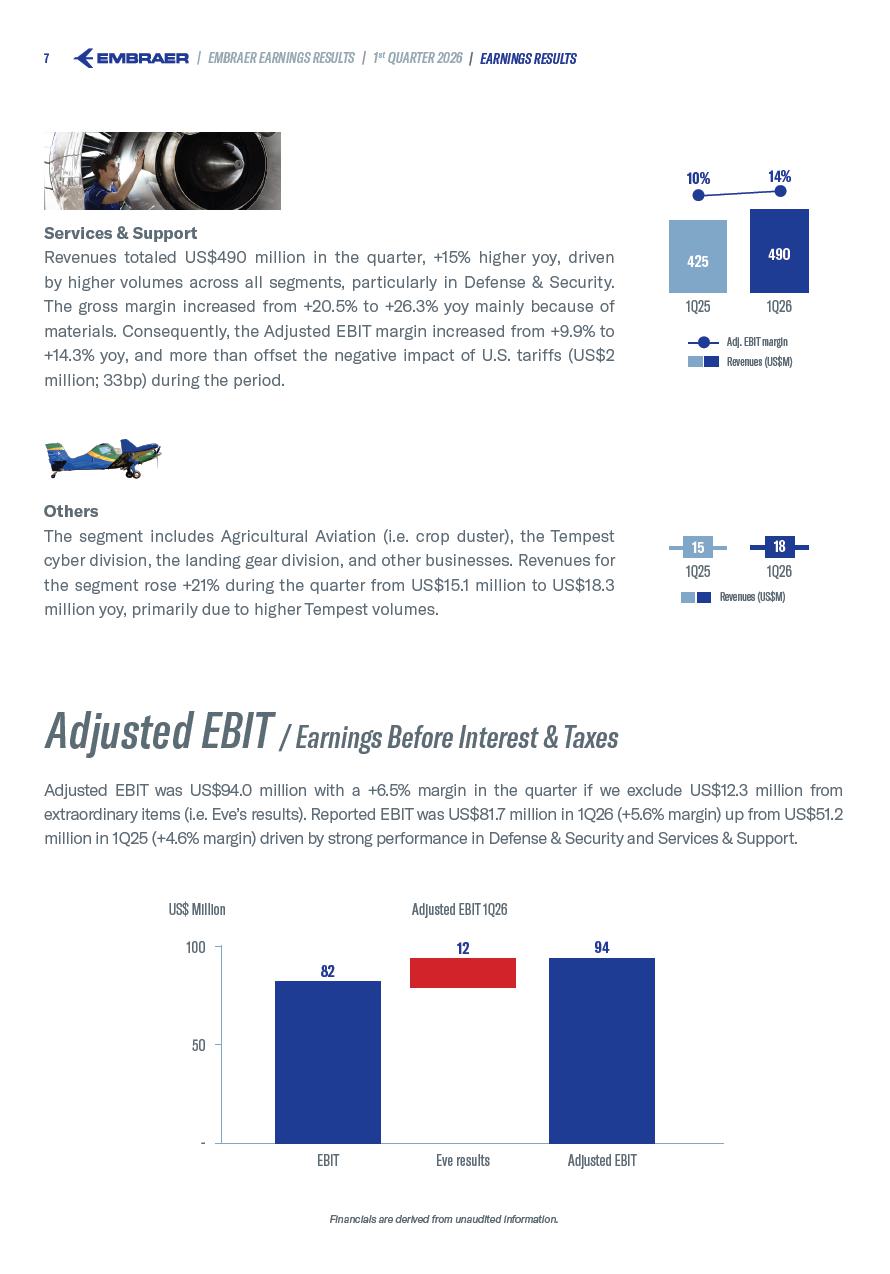
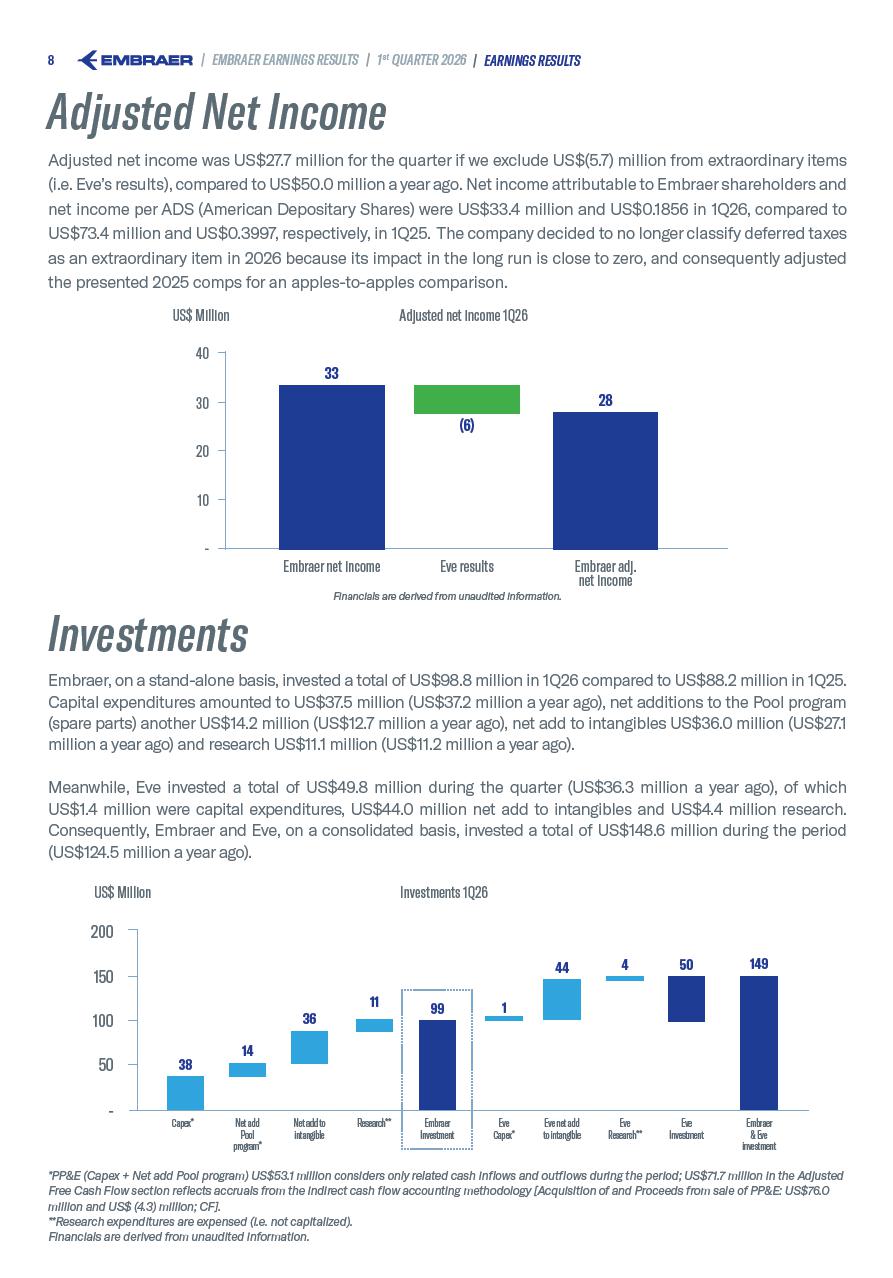
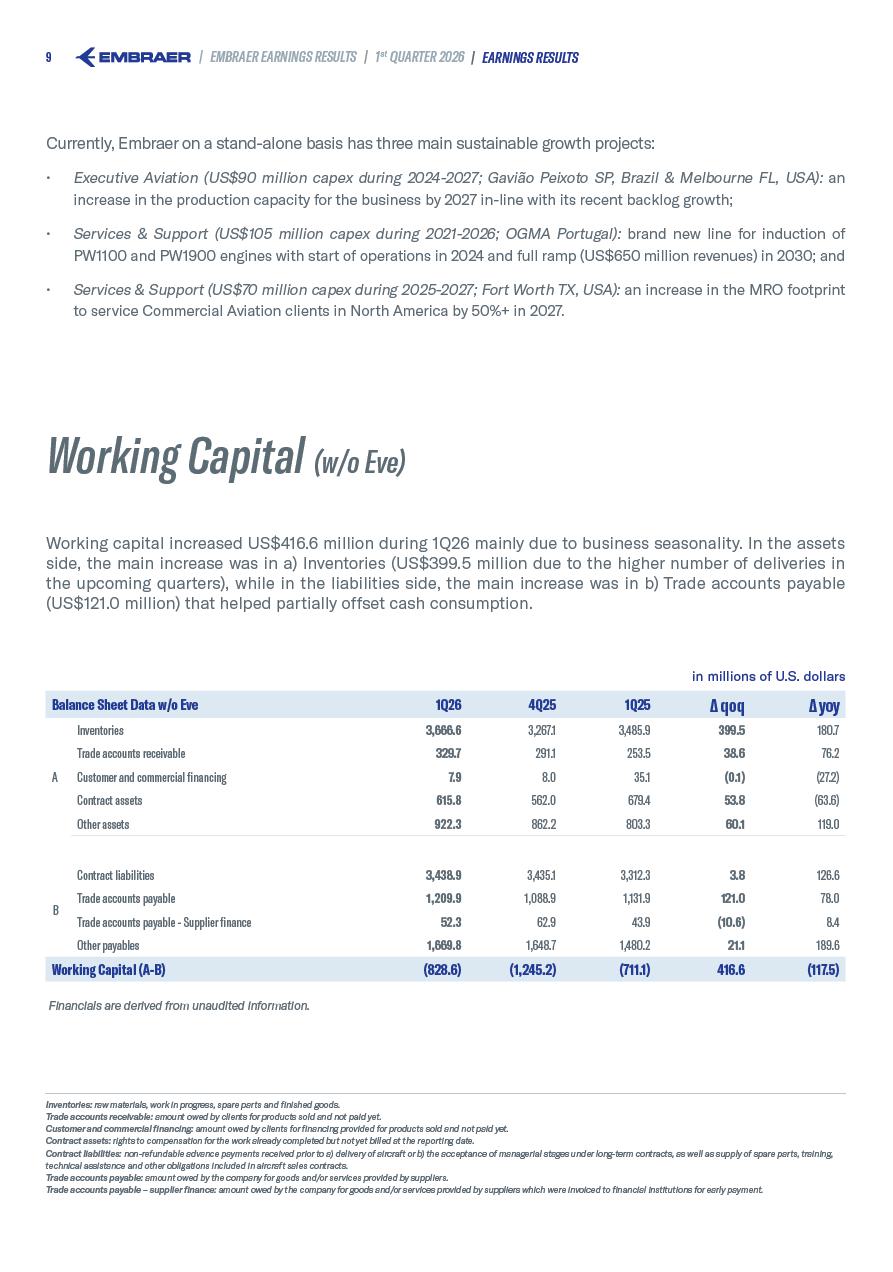
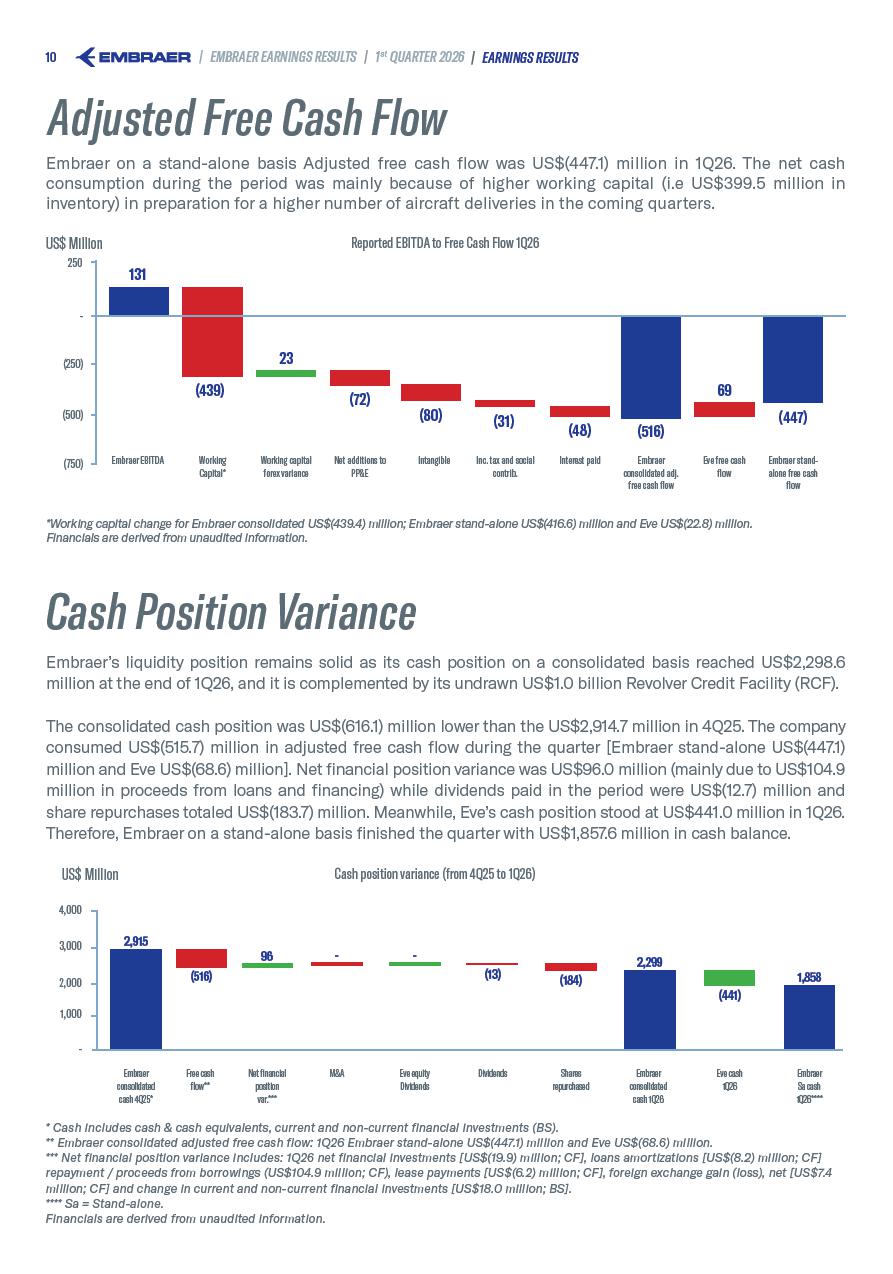
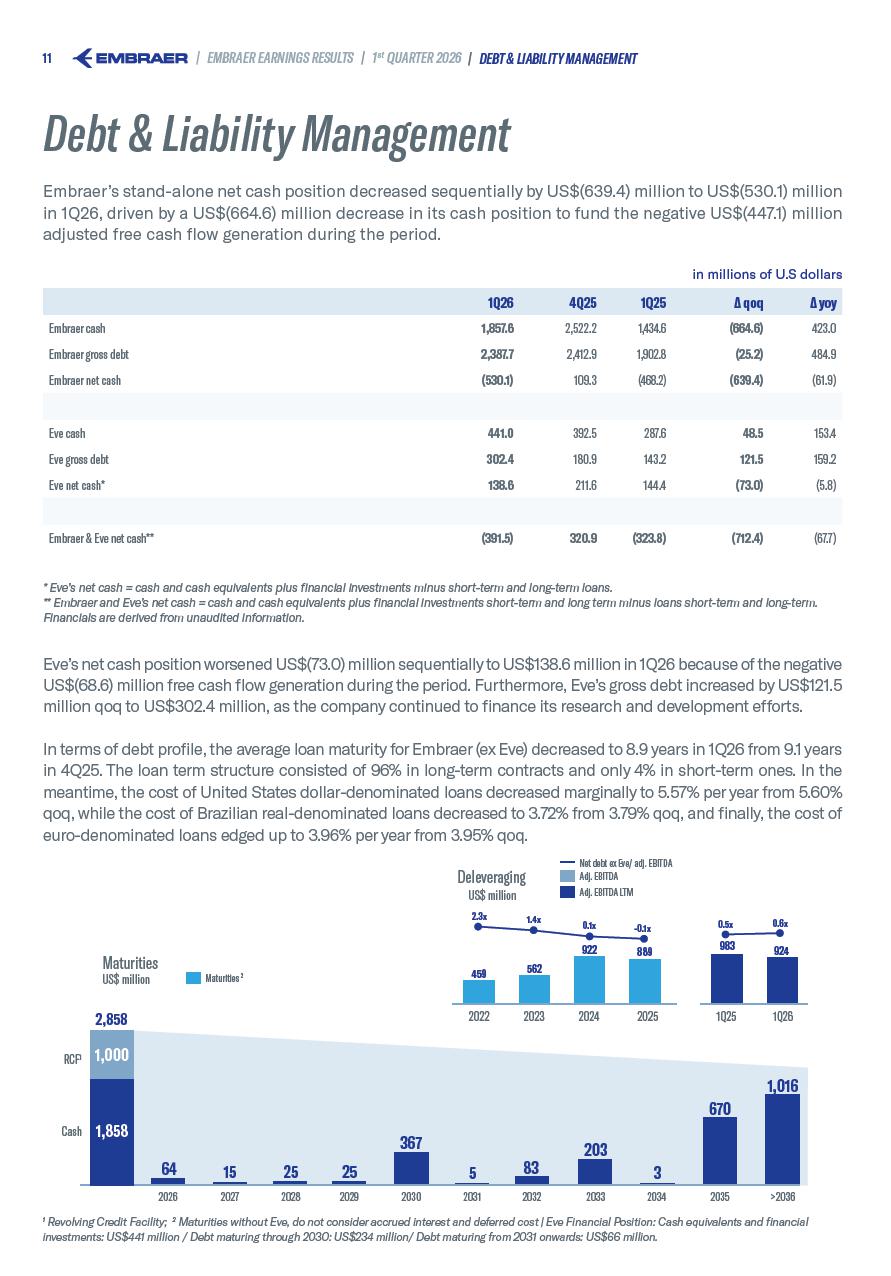
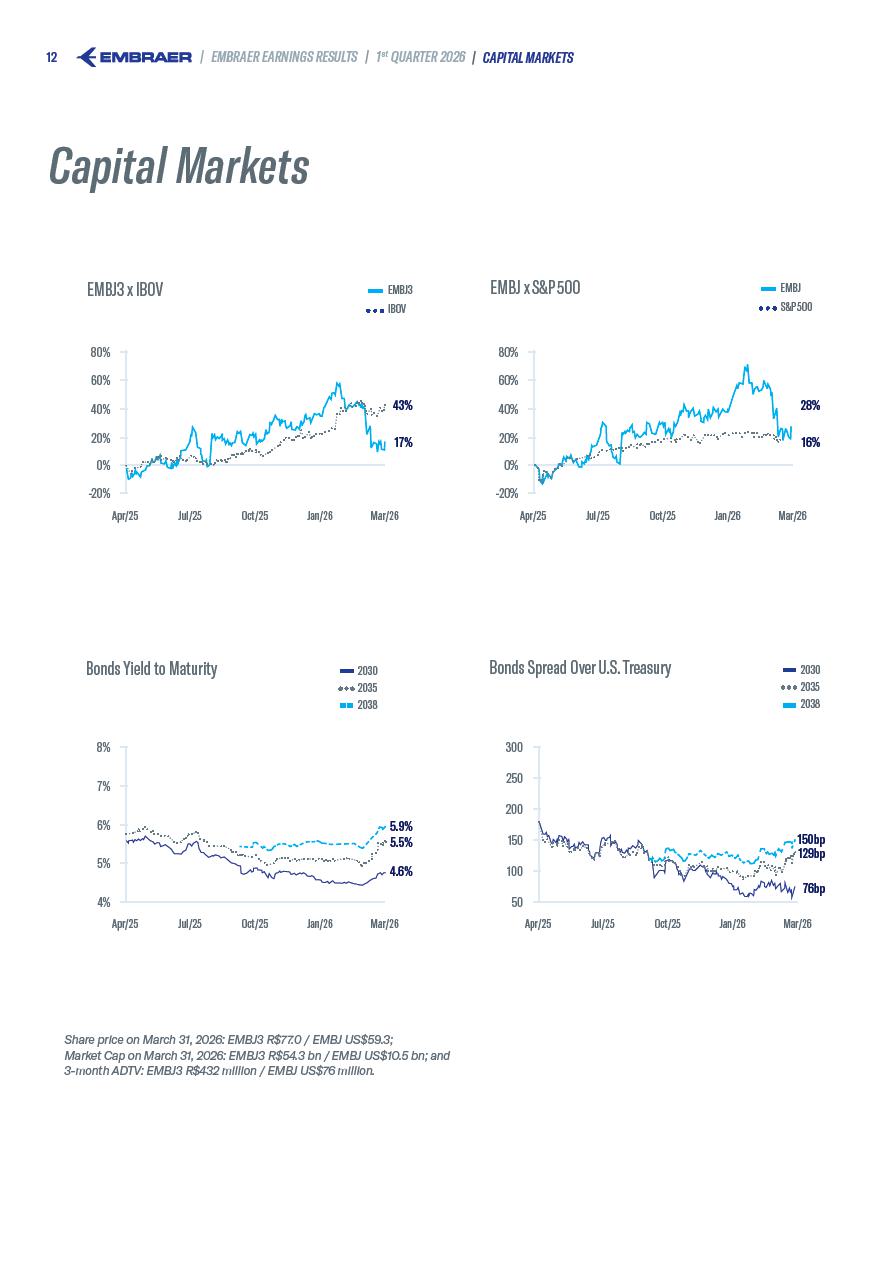
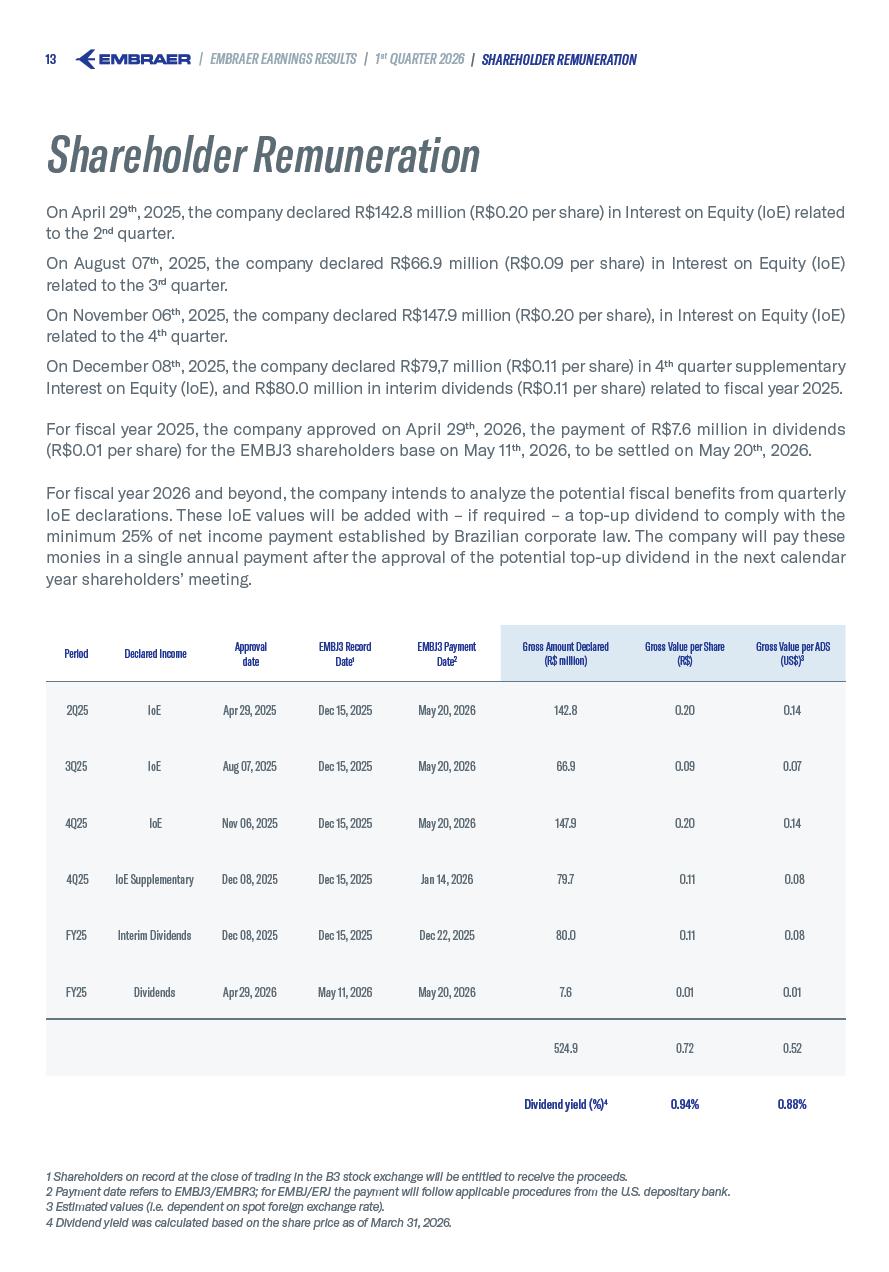
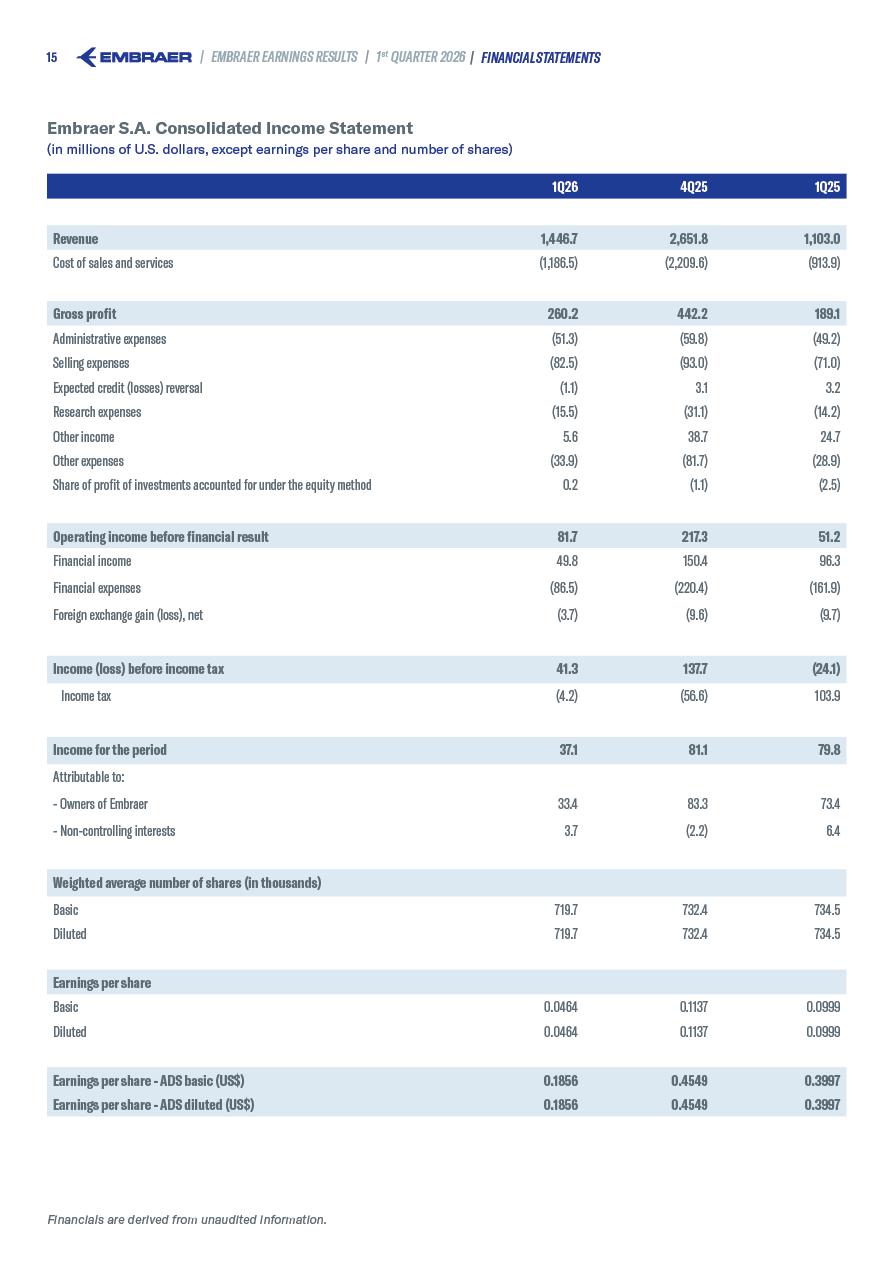
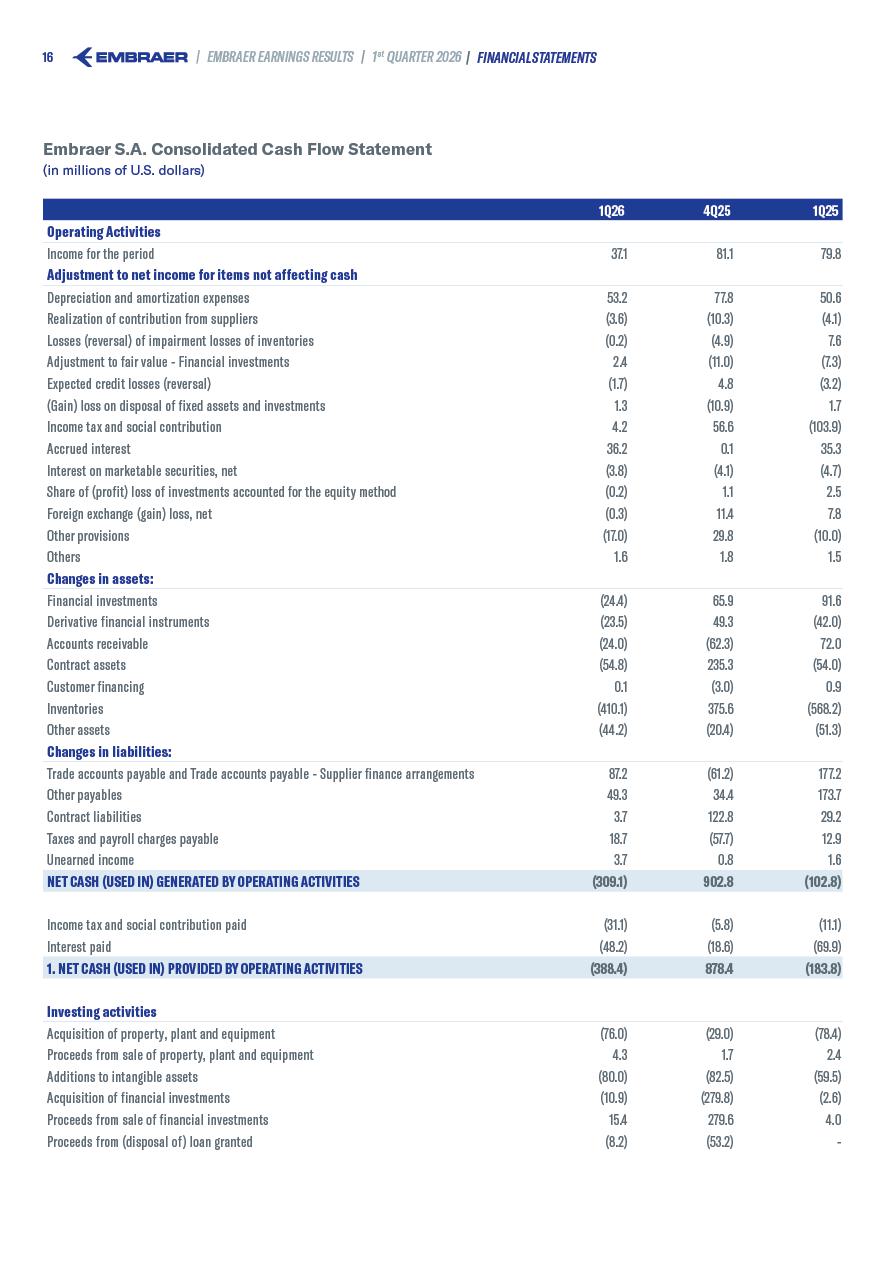
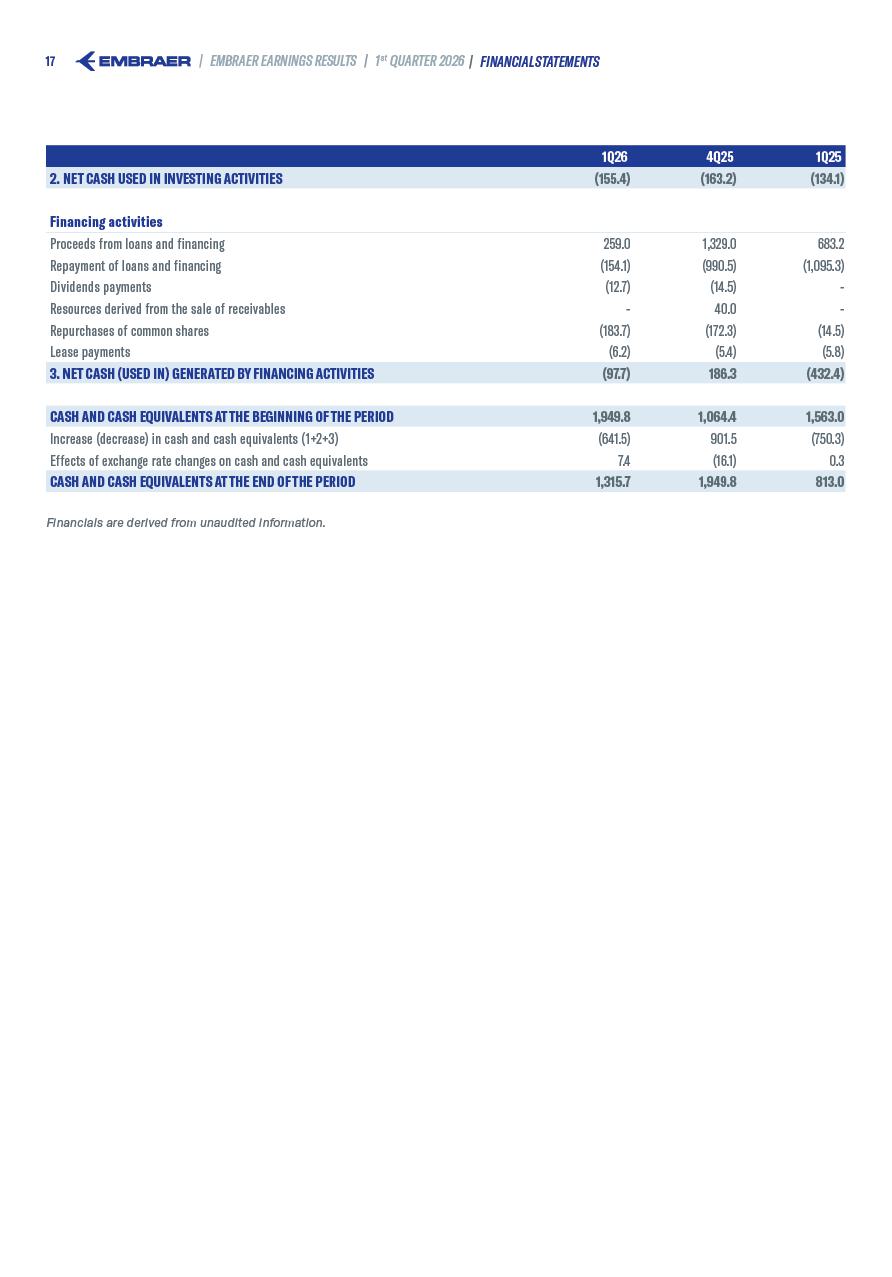
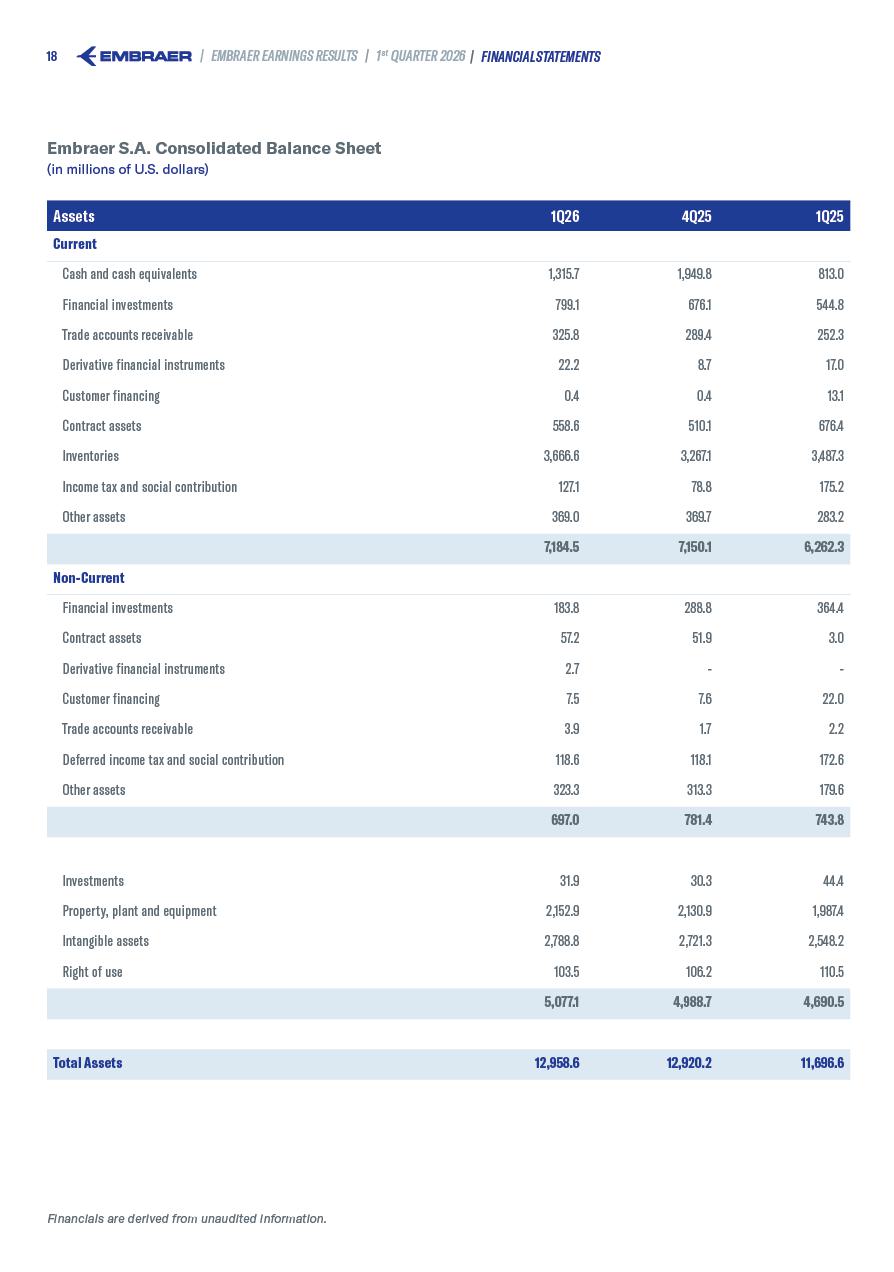
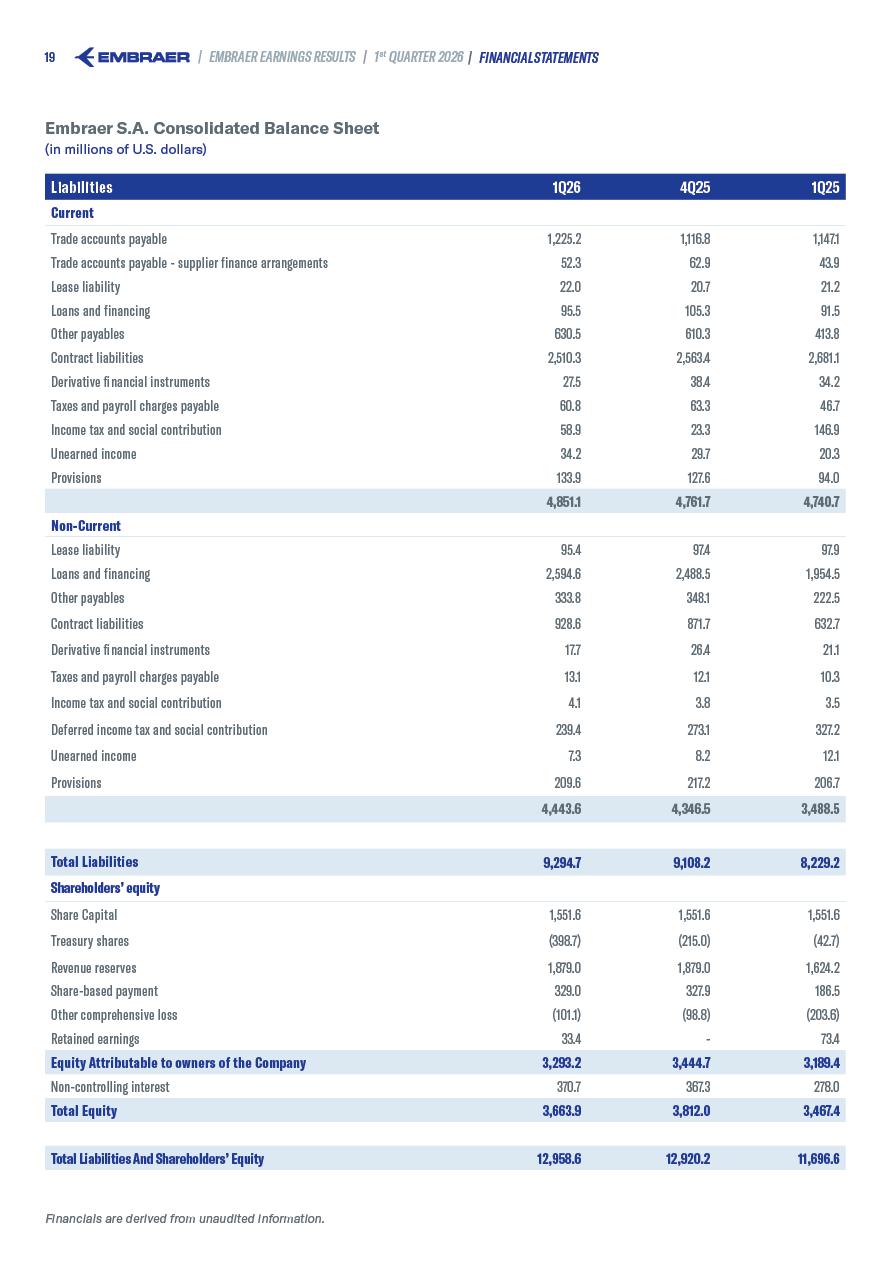
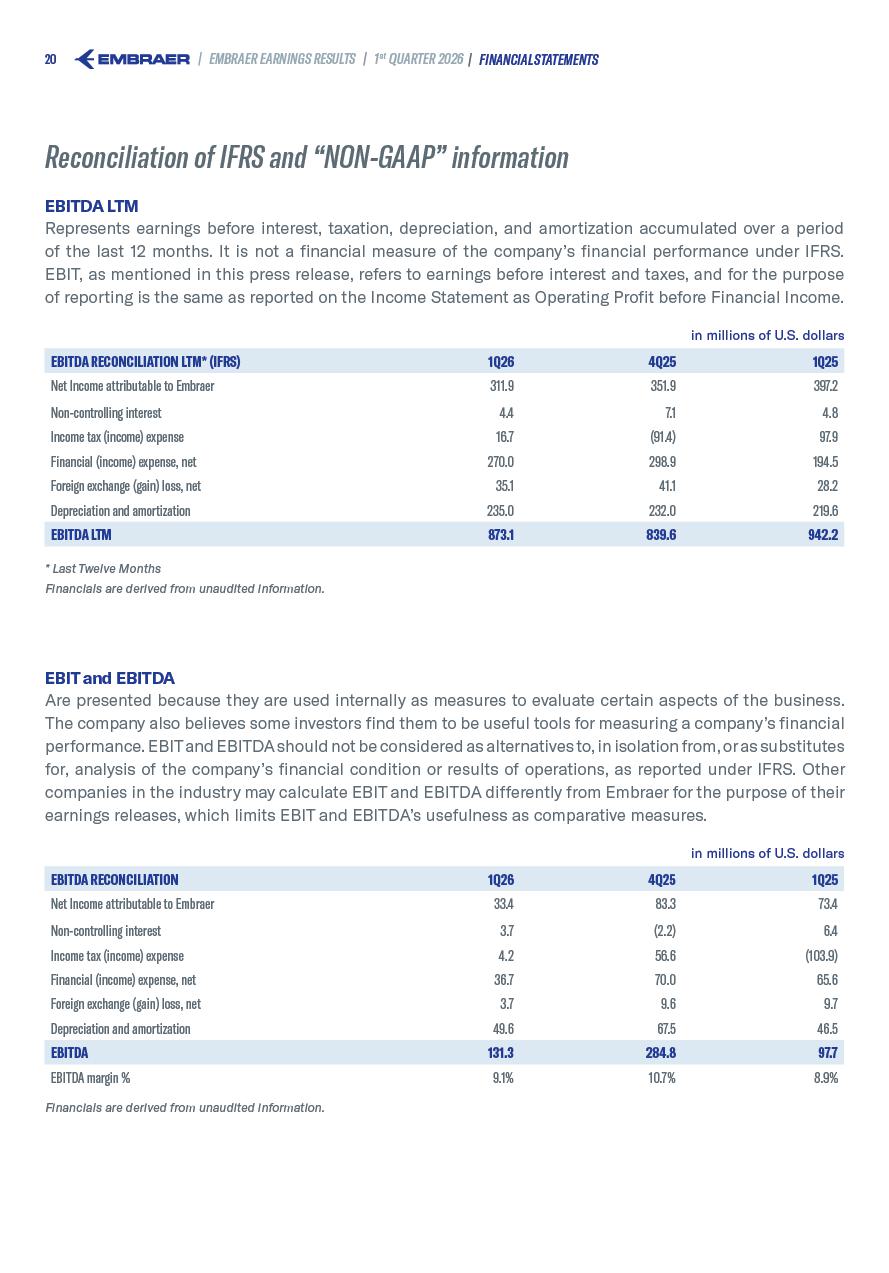
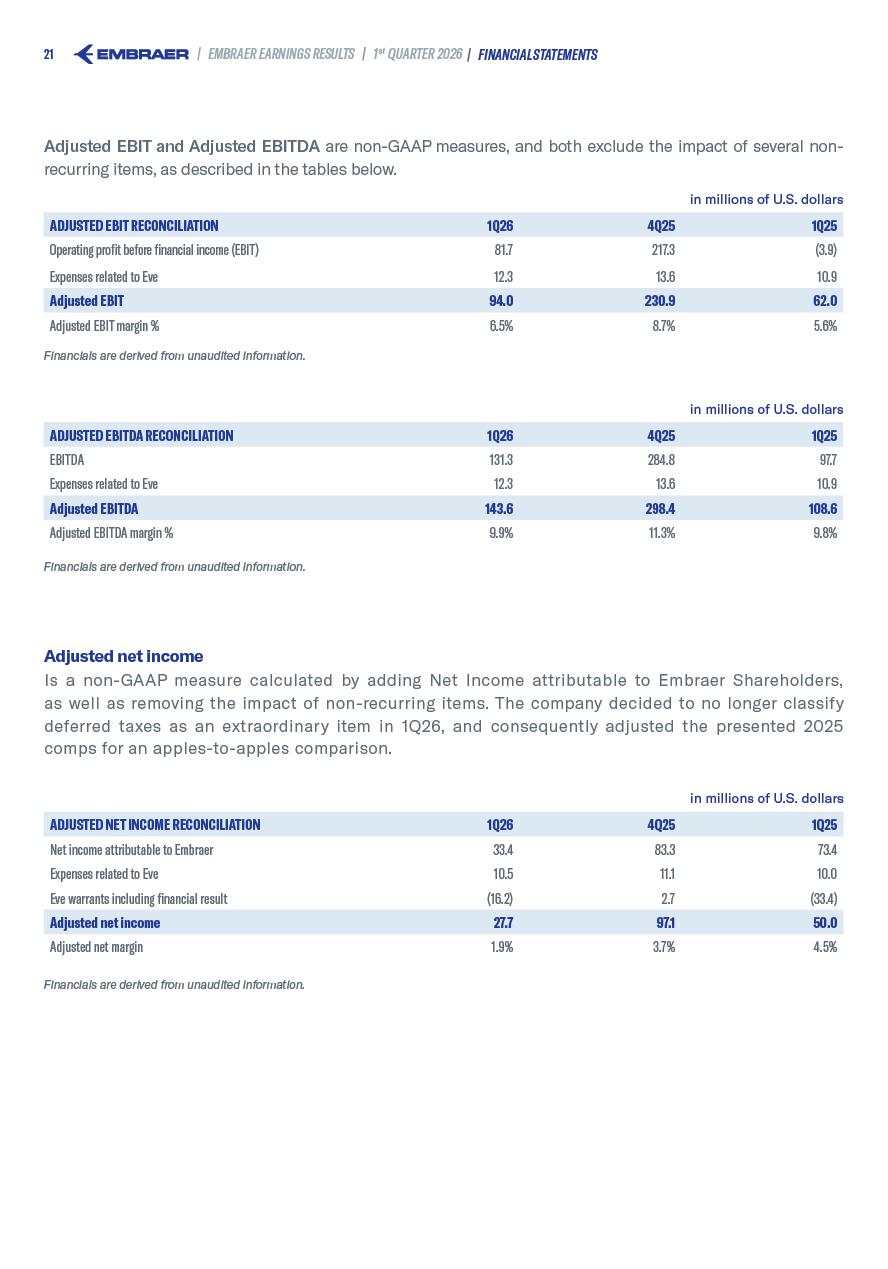
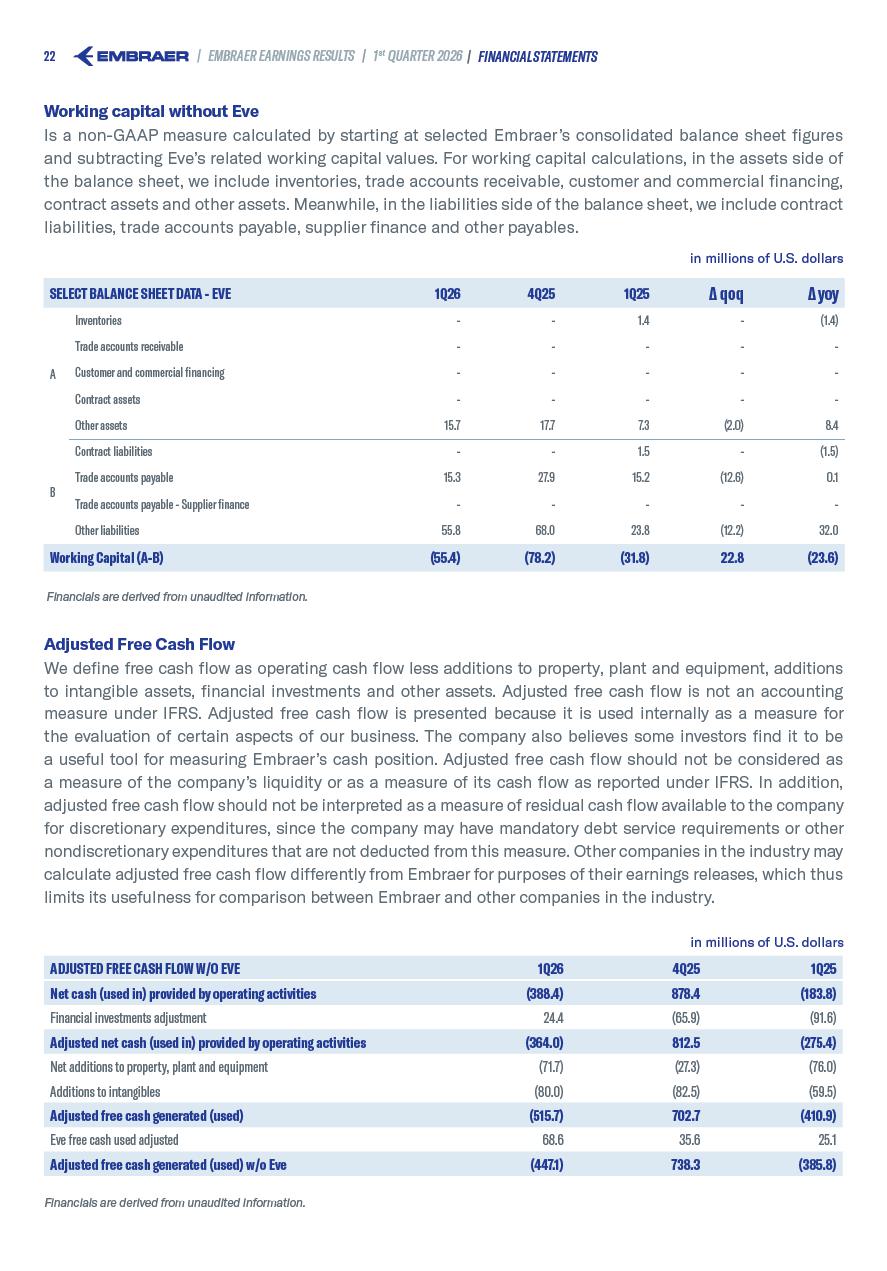
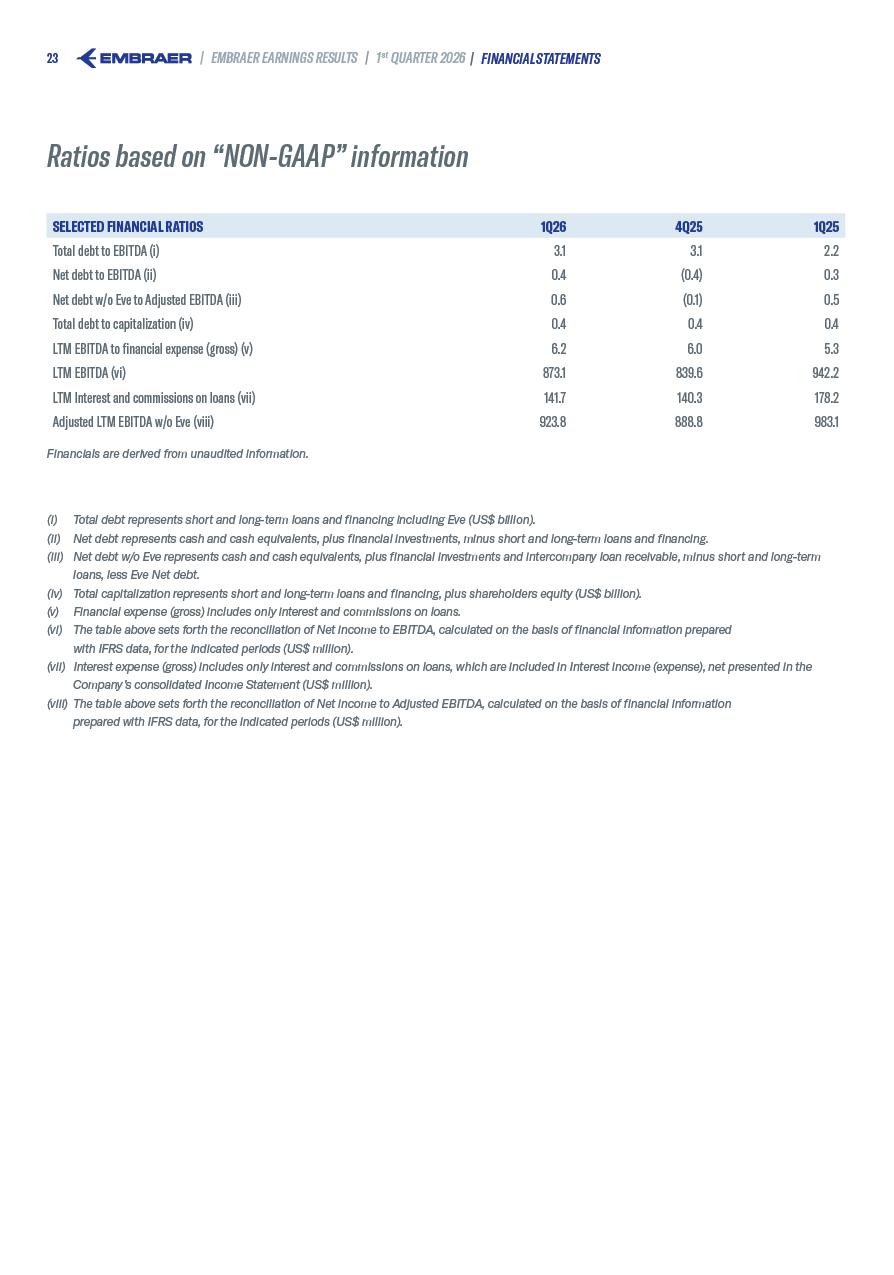
1 | EMBRAER EARNINGS RESULTS | 1st QUARTER 2026 EARNINGS RESULTS 1st Quarter 2026 2 | EMBRAER EARNINGS RESULTS | 1st QUARTER 2026 Index Highlights Main Financial Indicators 2026 Guidance Deliveries And Backlog Revenue, Gross Margin And Adjusted EBIT Adjusted EBIT (Earnings Before Interest & Taxes) Adjusted Net Income Investments Working Capital Free Cash Flow Cash Position Variance Debt & Liability Management Capital Markets Shareholder Remuneration Financial Statements Reconciliation Of IFRS And “Non-GAAP” Information Ratios Based On “Non-GAAP” Information Conference Call Information About Embraer 3 4 4 5 6 7 8 8 9 10 10 11 12 13 14 20 23 24 25 | INDEX 3 | EMBRAER EARNINGS RESULTS | 1st QUARTER 2026 | HIGHLIGHTS 2026 Guidance reiterated. From an operational point of view, Commercial Aviation deliveries between 80 and 85 aircraft and Executive Aviation deliveries between 160 and 170 aircraft. From a financial point of view, revenues in the US$8.2 to US$8.5 billion range, adjusted EBIT margin between 8.7% and 9.3% (with 10% U.S. import tariffs), and adjusted free cash flow w/o Eve of US$200 million or higher for the year. 8.3 bn Highlights Revenues totaled US$1,447 million in 1Q26 – highest 1Q level ever – and +31% year-over-year (yoy). Highlights for Defense & Security and Commercial Aviation with +63% and +45% yoy growth. 31% Adjusted EBIT reached US$94.0 million with a +6.5% margin in 1Q26 (+5.6% in 1Q25). U.S. import tariffs totaled US$13 million during the quarter (92bp), and there were another US$11 million in inventory for 2Q26. 6.5% Adjusted free cash flow w/o Eve was US$(447.1) million during the period in preparation for a higher number of aircraft deliveries in the coming quarters. (447.1) m To access the spreadsheet containing the data available in our Investor Relations website click here. Embraer delivered 44 aircraft in 1Q26, of which 10 were commercial jets (4 E2s and 6 E1s), 29 were executive jets (16 small and 13 medium) while 5 were defense related (1 KC-390 Millennium and 4 A-29 Super Tucano); +47% versus the 30 aircraft delivered yoy. 44 jets Firm order backlog of US$32.1 billion in 1Q26 – an all-time high and more than 20% higher yoy. Highlight for Commercial Aviation 3.0x book-to-bill LTM across the E175 and E2 platforms, which supported a +50% yoy increase in backlog. For more information please see our 1Q26 Backlog and Deliveries release. 32.1 bn 4 | EMBRAER EARNINGS RESULTS | 1st QUARTER 2026 Main Financial Indicators IFRS 1Q26 4Q25 1Q25 Revenue 1,446.7 2,651.8 1,103.0 Adjusted EBITDA 143.6 298.4 108.6 Adjusted EBITDA margin % 9.9% 11.3% 9.8% Adjusted EBIT 94.0 230.9 62.0 Adjusted EBIT margin % 6.5% 8.7% 5.6% Adjusted net income1 27.7 97.1 50.0 Earnings per share - ADS basic 0.1856 0.4549 0.3997 Adjusted free cash flow w/o Eve (447.1) 738.3 (385.8) Net cash w/o Eve* (530.1) 109.3 (468.2) * Net cash w/o Eve represents cash and cash equivalents, plus financial investments, minus short-term and long-term loans and financing, less Eve’s net cash. Financials are derived from unaudited information. 1Adjusted Net Income is a non-GAAP measure calculated by adding Net Income attributable to Embraer Shareholders plus adjusting for non-recurring items. In millions of U.S dollars, except % and earnings per share data São Paulo, Brazil, May 8, 2026 (B3: EMBJ3, NYSE: EMBJ). The company’s operating and financial information is presented, except where otherwise stated, on a consolidated basis in United States dollars (US$) and in accordance with IFRS. The financial data presented in this document as of and for the quarters ended March 31, 2026 (1Q26), December 31, 2025 (4Q25), and March 31, 2025 (1Q25), are derived from unaudited financial statements, except annual financial data and where otherwise stated. 2026 GUIDANCE Commercial Aviation deliveries 80 - 85 Executive Aviation deliveries 160 - 170 Consolidated revenues (US$ billion) 8.2 - 8.5 Adjusted EBIT margin 8.7% - 9.3% Free cash flow (US$ million)* 200 or higher * Free cash flow = Adjusted free cash flow w/o Eve. From an operations point of view, Embraer estimates Commercial Aviation deliveries between 80 and 85 aircraft and Executive Aviation deliveries between 160 and 170 aircraft. From a financial point of view, revenues in the US$8.2 to US$8.5 billion range, adjusted EBIT margin between 8.7% and 9.3% (with 10% U.S. import tariffs), and adjusted free cash flow of US$200 million or higher for the year. 2026 Guidance (Eve Not Included) | MAIN FINANCIAL INDICATORS & 2026 GUIDANCE 5 | EMBRAER EARNINGS RESULTS | 1st QUARTER 2026 Deliveries and Backlog Embraer delivered 44 aircraft in 1Q26, of which 10 were commercial jets (4 E2s and 6 E1s), 29 were executive jets (16 small and 13 medium) and 5 were defense related (1 KC-390 Millennium and 4 A-29 Super Tucano); +47% increase compared to the 30 aircraft delivered yoy. The number of deliveries for Commercial Aviation was +43% higher and for Executive Aviation +26% higher compared to 1Q25. For more information please see our 1Q26 Backlog and Deliveries release. The company’s backlog reached US$32.1 billion in 1Q26, a record‑setting level. Compared to a year ago, the company-wide backlog increased +22% with strength across all business units. For instance, the backlog for Commercial Aviation increased +50% yoy, Services & Support and Defense & Security increased +10% and +6% yoy, while for Executive Aviation remained stable. 1Q25 1Q26 2Q25 3Q25 4Q25 4.6 4.2 7.6 26.4 4.9 4.9 4.9 4.3 3.9 4.6 7.4 7.3 7.6 29.7 31.3 31.6 Services & Support Defense & Security Executive Aviation Commercial Aviation +22% US$ billion | OPERATING RESULTS 5.1 4.4 7.6 32.1 10.0 13.1 15.2 14.5 15.0 Commercial Aviation +43% E1 E2 1Q25 3Q25 2Q25 4Q25 1Q26 4 9 3 10 7 14 13 18 4 6 Defense & Security N/A KC-390 A-29 Super Tucano 1Q25 3Q25 2Q25 4Q25 1Q26 1 4 4 2 1 4 Executive Aviation +26% Small Jets Medium Jets 1Q25 3Q25 2Q25 4Q25 1Q26 16 13 14 21 9 17 22 28 18 25 23 6 | EMBRAER EARNINGS RESULTS | 1st QUARTER 2026 Executive Aviation Revenues totaled US$418 million in the quarter, +30% higher yoy, supported by higher volumes and product mix. Gross margin decreased from +21.8% to +15.1% a year ago because of client mix and U.S. tariffs (US$12 million; 280bp) during the period. Consequently, the adjusted EBIT margin decreased from +11.3% to +6.0% yoy, pressured by higher selling expenses, particularly those related to the announcement of the new Praetor 500/600 “E” family models. Revenue, Gross Margin and Adjusted EBIT Consolidated revenue of US$1,447 million in 1Q26 represented a +31% increase yoy. All business units performed well throughout the quarter. For instance, Defense & Security revenues increased +63% yoy, Commercial Aviation +45%, Executive Aviation +30% and Services & Support +15% yoy. Commercial Aviation Revenues were US$293 million during the quarter, +45% higher yoy, underpinned by higher volumes and prices. However, gross margin decreased from +4.9% to +0.9% yoy while Adjusted EBIT margin decreased from -4.8% to -9.7% yoy due to client mix, logistics costs and positive one-time items in 1Q25 (i.e. US$10 million in suppliers’ credit). Defense & Security Revenues reached US$227 million during the quarter, +63% higher yoy, because of stronger KC-390 revenue recognition related to customer mix and product stage (in accordance with the percentage of completion calculation method), and increased production rates of the Super Tucano. Gross margin increased from +12.3% to +26.8% yoy while the adjusted EBIT margin rose from -1.6% to +17.0% yoy supported by operating leverage and positive impact of US$25 million in one-time items (1,100bp). | EARNINGS RESULTS 202 293 1Q25 1Q26 Adj. EBIT margin Revenues (US$M) Adj. EBIT margin Revenues (US$M) 323 6% 11% 418 1Q25 1Q26 139 227 1Q25 1Q26 Adj. EBIT margin Revenues (US$M) -2% 17% -10% -5% 7 | EMBRAER EARNINGS RESULTS | 1st QUARTER 2026 Services & Support Revenues totaled US$490 million in the quarter, +15% higher yoy, driven by higher volumes across all segments, particularly in Defense & Security. The gross margin increased from +20.5% to +26.3% yoy mainly because of materials. Consequently, the Adjusted EBIT margin increased from +9.9% to +14.3% yoy, and more than offset the negative impact of U.S. tariffs (US$2 million; 33bp) during the period. Others The segment includes Agricultural Aviation (i.e. crop duster), the Tempest cyber division, the landing gear division, and other businesses. Revenues for the segment rose +21% during the quarter from US$15.1 million to US$18.3 million yoy, primarily due to higher Tempest volumes. Adjusted EBIT / Earnings Before Interest & Taxes Adjusted EBIT was US$94.0 million with a +6.5% margin in the quarter if we exclude US$12.3 million from extraordinary items (i.e. Eve’s results). Reported EBIT was US$81.7 million in 1Q26 (+5.6% margin) up from US$51.2 million in 1Q25 (+4.6% margin) driven by strong performance in Defense & Security and Services & Support. 490 425 1Q25 1Q26 14% 10% Revenues (US$M) 18 15 1Q25 1Q26 Financials are derived from unaudited information. EBIT Eve results Adjusted EBIT 1Q26 US$ Million 50 - 100 Adjusted EBIT 12 82 94 | EARNINGS RESULTS Adj. EBIT margin Revenues (US$M) 8 | EMBRAER EARNINGS RESULTS | 1st QUARTER 2026 Adjusted Net Income Adjusted net income was US$27.7 million for the quarter if we exclude US$(5.7) million from extraordinary items (i.e. Eve’s results), compared to US$50.0 million a year ago. Net income attributable to Embraer shareholders and net income per ADS (American Depositary Shares) were US$33.4 million and US$0.1856 in 1Q26, compared to US$73.4 million and US$0.3997, respectively, in 1Q25. The company decided to no longer classify deferred taxes as an extraordinary item in 2026 because its impact in the long run is close to zero, and consequently adjusted the presented 2025 comps for an apples-to-apples comparison. | EARNINGS RESULTS Investments Embraer, on a stand-alone basis, invested a total of US$98.8 million in 1Q26 compared to US$88.2 million in 1Q25. Capital expenditures amounted to US$37.5 million (US$37.2 million a year ago), net additions to the Pool program (spare parts) another US$14.2 million (US$12.7 million a year ago), net add to intangibles US$36.0 million (US$27.1 million a year ago) and research US$11.1 million (US$11.2 million a year ago). Meanwhile, Eve invested a total of US$49.8 million during the quarter (US$36.3 million a year ago), of which US$1.4 million were capital expenditures, US$44.0 million net add to intangibles and US$4.4 million research. Consequently, Embraer and Eve, on a consolidated basis, invested a total of US$148.6 million during the period (US$124.5 million a year ago). Capex* Eve Capex* Net add Pool program* Research** Net add to intangible Embraer Investment Eve Research** Eve Investment Embraer & Eve investment Eve net add to intangible 200 150 100 US$ Million Investments 1Q26 50 - 38 14 36 11 99 4 44 1 50 149 *PP&E (Capex + Net add Pool program) US$53.1 million considers only related cash inflows and outflows during the period; US$71.7 million in the Adjusted Free Cash Flow section reflects accruals from the indirect cash flow accounting methodology [Acquisition of and Proceeds from sale of PP&E: US$76.0 million and US$ (4.3) million; CF]. **Research expenditures are expensed (i.e. not capitalized). Financials are derived from unaudited information. Embraer net income Eve results Adjusted net income 1Q26 US$ Million 20 10 - 30 40 Embraer adj. net income (6) 33 28 Financials are derived from unaudited information. 9 | EMBRAER EARNINGS RESULTS | 1st QUARTER 2026 Currently, Embraer on a stand-alone basis has three main sustainable growth projects: • Executive Aviation (US$90 million capex during 2024-2027; Gavião Peixoto SP, Brazil & Melbourne FL, USA): an increase in the production capacity for the business by 2027 in-line with its recent backlog growth; • Services & Support (US$105 million capex during 2021-2026; OGMA Portugal): brand new line for induction of PW1100 and PW1900 engines with start of operations in 2024 and full ramp (US$650 million revenues) in 2030; and • Services & Support (US$70 million capex during 2025-2027; Fort Worth TX, USA): an increase in the MRO footprint to service Commercial Aviation clients in North America by 50%+ in 2027. | EARNINGS RESULTS Balance Sheet Data w/o Eve 1Q26 4Q25 1Q25 Δ qoq Δ yoy Inventories 3,666.6 3,267.1 3,485.9 399.5 180.7 Trade accounts receivable 329.7 291.1 253.5 38.6 76.2 A Customer and commercial financing 7.9 8.0 35.1 (0.1) (27.2) Contract assets 615.8 562.0 679.4 53.8 (63.6) Other assets 922.3 862.2 803.3 60.1 119.0 Contract liabilities 3,438.9 3,435.1 3,312.3 3.8 126.6 Trade accounts payable 1,209.9 1,088.9 1,131.9 121.0 78.0 Trade accounts payable - Supplier finance 52.3 62.9 43.9 (10.6) 8.4 Other payables 1,669.8 1,648.7 1,480.2 21.1 189.6 Working Capital (A-B) (828.6) (1,245.2) (711.1) 416.6 (117.5) Working Capital (w/o Eve) Working capital increased US$416.6 million during 1Q26 mainly due to business seasonality. In the assets side, the main increase was in a) Inventories (US$399.5 million due to the higher number of deliveries in the upcoming quarters), while in the liabilities side, the main increase was in b) Trade accounts payable (US$121.0 million) that helped partially offset cash consumption. in millions of U.S. dollars B Financials are derived from unaudited information. Inventories: raw materials, work in progress, spare parts and finished goods. Trade accounts receivable: amount owed by clients for products sold and not paid yet. Customer and commercial financing: amount owed by clients for financing provided for products sold and not paid yet. Contract assets: rights to compensation for the work already completed but not yet billed at the reporting date. Contract liabilities: non-refundable advance payments received prior to a) delivery of aircraft or b) the acceptance of managerial stages under long-term contracts, as well as supply of spare parts, training, technical assistance and other obligations included in aircraft sales contracts. Trade accounts payable: amount owed by the company for goods and/or services provided by suppliers. Trade accounts payable – supplier finance: amount owed by the company for goods and/or services provided by suppliers which were invoiced to financial institutions for early payment. 10 | EMBRAER EARNINGS RESULTS | 1st QUARTER 2026 Adjusted Free Cash Flow Embraer on a stand-alone basis Adjusted free cash flow was US$(447.1) million in 1Q26. The net cash consumption during the period was mainly because of higher working capital (i.e US$399.5 million in inventory) in preparation for a higher number of aircraft deliveries in the coming quarters. | EARNINGS RESULTS Cash Position Variance Embraer’s liquidity position remains solid as its cash position on a consolidated basis reached US$2,298.6 million at the end of 1Q26, and it is complemented by its undrawn US$1.0 billion Revolver Credit Facility (RCF). The consolidated cash position was US$(616.1) million lower than the US$2,914.7 million in 4Q25. The company consumed US$(515.7) million in adjusted free cash flow during the quarter [Embraer stand-alone US$(447.1) million and Eve US$(68.6) million]. Net financial position variance was US$96.0 million (mainly due to US$104.9 million in proceeds from loans and financing) while dividends paid in the period were US$(12.7) million and share repurchases totaled US$(183.7) million. Meanwhile, Eve’s cash position stood at US$441.0 million in 1Q26. Therefore, Embraer on a stand-alone basis finished the quarter with US$1,857.6 million in cash balance. Embraer consolidated cash 4Q25* Free cash flow** Net financial position var.*** Eve equity Dividends M&A Dividends Shares repurchased Embraer consolidated cash 1Q26 Eve cash 1Q26 Embraer Sa cash 1Q26**** 4,000 3,000 2,000 1,000 Cash position variance (from 4Q25 to 1Q26) US$ Million - 2,915 (516) 96 (184) (441) 1,858 2,299 - - (13) * Cash includes cash & cash equivalents, current and non-current financial investments (BS). ** Embraer consolidated adjusted free cash flow: 1Q26 Embraer stand-alone US$(447.1) million and Eve US$(68.6) million. *** Net financial position variance includes: 1Q26 net financial investments [US$(19.9) million; CF], loans amortizations [US$(8.2) million; CF] repayment / proceeds from borrowings (US$104.9 million; CF), lease payments [US$(6.2) million; CF], foreign exchange gain (loss), net [US$7.4 million; CF] and change in current and non-current financial investments [US$18.0 million; BS]. **** Sa = Stand-alone. Financials are derived from unaudited information. Embraer EBITDA Working Capital* Working capital forex variance Net additions to PP&E Intangible Inc. tax and social contrib. Interest paid Embraer consolidated adj. free cash flow Eve free cash flow Embraer stand-alone free cash flow 250 - (250) Reported EBITDA to Free Cash Flow 1Q26 US$ Million 131 (439) 23 (72) (80) 69 (447) (48) (516) *Working capital change for Embraer consolidated US$(439.4) million; Embraer stand-alone US$(416.6) million and Eve US$(22.8) million. Financials are derived from unaudited information. (500) (750) (31) 11 | EMBRAER EARNINGS RESULTS | 1st QUARTER 2026 * Eve’s net cash = cash and cash equivalents plus financial investments minus short-term and long-term loans. ** Embraer and Eve’s net cash = cash and cash equivalents plus financial investments short-term and long term minus loans short-term and long-term. Financials are derived from unaudited information. Debt & Liability Management Embraer’s stand-alone net cash position decreased sequentially by US$(639.4) million to US$(530.1) million in 1Q26, driven by a US$(664.6) million decrease in its cash position to fund the negative US$(447.1) million adjusted free cash flow generation during the period. 1Q26 4Q25 1Q25 Δ qoq Δ yoy Embraer cash 1,857.6 2,522.2 1,434.6 (664.6) 423.0 Embraer gross debt 2,387.7 2,412.9 1,902.8 (25.2) 484.9 Embraer net cash (530.1) 109.3 (468.2) (639.4) (61.9) Eve cash 441.0 392.5 287.6 48.5 153.4 Eve gross debt 302.4 180.9 143.2 121.5 159.2 Eve net cash* 138.6 211.6 144.4 (73.0) (5.8) Embraer & Eve net cash** (391.5) 320.9 (323.8) (712.4) (67.7) | DEBT & LIABILITY MANAGEMENT Eve’s net cash position worsened US$(73.0) million sequentially to US$138.6 million in 1Q26 because of the negative US$(68.6) million free cash flow generation during the period. Furthermore, Eve’s gross debt increased by US$121.5 million qoq to US$302.4 million, as the company continued to finance its research and development efforts. In terms of debt profile, the average loan maturity for Embraer (ex Eve) decreased to 8.9 years in 1Q26 from 9.1 years in 4Q25. The loan term structure consisted of 96% in long-term contracts and only 4% in short-term ones. In the meantime, the cost of United States dollar-denominated loans decreased marginally to 5.57% per year from 5.60% qoq, while the cost of Brazilian real-denominated loans decreased to 3.72% from 3.79% qoq, and finally, the cost of euro-denominated loans edged up to 3.96% per year from 3.95% qoq. 1 Revolving Credit Facility; 2 Maturities without Eve, do not consider accrued interest and deferred cost | Eve Financial Position: Cash equivalents and financial investments: US$441 million / Debt maturing through 2030: US$234 million/ Debt maturing from 2031 onwards: US$66 million. Maturities US$ million RCF1 Cash 1,858 64 15 367 83 203 670 1,016 1,000 2026 2027 2028 2029 2030 2031 2032 2033 2034 2035 >2036 2,858 25 25 5 3 US$ million Deleveraging Net debt ex Eve/ adj. EBITDA Adj. EBITDA Adj. EBITDA LTM 2022 2023 2024 2025 459 562 922 889 2.3x 1.4x 0.1x -0.1x 1Q25 1Q26 983 924 0.5x 0.6x Maturities 2 in millions of U.S dollars 12 | EMBRAER EARNINGS RESULTS | 1st QUARTER 2026 Capital Markets Share price on March 31, 2026: EMBJ3 R$77.0 / EMBJ US$59.3; Market Cap on March 31, 2026: EMBJ3 R$54.3 bn / EMBJ US$10.5 bn; and 3-month ADTV: EMBJ3 R$432 million / EMBJ US$76 million. | CAPITAL MARKETS EMBJ3 x IBOV EMBJ3 IBOV -20% 0% 40% 20% 60% 80% Apr/25 Jul/25 Oct/25 Jan/26 Mar/26 17% 43% EMBJ x S&P 500 EMBJ S&P 500 -20% 0% 40% 20% 60% 80% Apr/25 Jul/25 Oct/25 Jan/26 Mar/26 16% 28% Bonds Yield to Maturity 2030 2035 2038 4% 5% 6% 7% 8% Jul/25 Oct/25 Jan/26 Mar/26 4.6% 5.5% 5.9% Apr/25 Bonds Spread Over U.S. Treasury 2030 2035 2038 50 150 100 200 250 300 Jul/25 Oct/25 Jan/26 Mar/26 129bp 150bp 76bp Apr/25 13 | EMBRAER EARNINGS RESULTS | 1st QUARTER 2026 Shareholder Remuneration On April 29th, 2025, the company declared R$142.8 million (R$0.20 per share) in Interest on Equity (IoE) related to the 2nd quarter. On August 07th, 2025, the company declared R$66.9 million (R$0.09 per share) in Interest on Equity (IoE) related to the 3rd quarter. On November 06th, 2025, the company declared R$147.9 million (R$0.20 per share), in Interest on Equity (IoE) related to the 4th quarter. On December 08th, 2025, the company declared R$79,7 million (R$0.11 per share) in 4th quarter supplementary Interest on Equity (IoE), and R$80.0 million in interim dividends (R$0.11 per share) related to fiscal year 2025. For fiscal year 2025, the company approved on April 29th, 2026, the payment of R$7.6 million in dividends (R$0.01 per share) for the EMBJ3 shareholders base on May 11th, 2026, to be settled on May 20th, 2026. For fiscal year 2026 and beyond, the company intends to analyze the potential fiscal benefits from quarterly IoE declarations. These IoE values will be added with – if required – a top-up dividend to comply with the minimum 25% of net income payment established by Brazilian corporate law. The company will pay these monies in a single annual payment after the approval of the potential top-up dividend in the next calendar year shareholders’ meeting. Period Declared Income Approval date EMBJ3 Record Date1 EMBJ3 Payment Date2 Gross Amount Declared (R$ million) Gross Value per Share (R$) Gross Value per ADS (US$)3 2Q25 IoE Apr 29, 2025 Dec 15, 2025 May 20, 2026 142.8 0.20 0.14 3Q25 IoE Aug 07, 2025 Dec 15, 2025 May 20, 2026 66.9 0.09 0.07 4Q25 IoE Nov 06, 2025 Dec 15, 2025 May 20, 2026 147.9 0.20 0.14 4Q25 IoE Supplementary Dec 08, 2025 Dec 15, 2025 Jan 14, 2026 79.7 0.11 0.08 FY25 Interim Dividends Dec 08, 2025 Dec 15, 2025 Dec 22, 2025 80.0 0.11 0.08 FY25 Dividends Apr 29, 2026 May 11, 2026 May 20, 2026 7.6 0.01 0.01 524.9 0.72 0.52 Dividend yield (%)4 0.94% 0.88% 1 Shareholders on record at the close of trading in the B3 stock exchange will be entitled to receive the proceeds. 2 Payment date refers to EMBJ3/EMBR3; for EMBJ/ERJ the payment will follow applicable procedures from the U.S. depositary bank. 3 Estimated values (i.e. dependent on spot foreign exchange rate). 4 Dividend yield was calculated based on the share price as of March 31, 2026. | SHAREHOLDER REMUNERATION 14 | EMBRAER EARNINGS RESULTS | 1st QUARTER 2026 FINANCIAL STATEMENTS 15 | EMBRAER EARNINGS RESULTS | 1st QUARTER 2026 Embraer S.A. Consolidated Income Statement (in millions of U.S. dollars, except earnings per share and number of shares) 1Q26 4Q25 1Q25 Revenue 1,446.7 2,651.8 1,103.0 Cost of sales and services (1,186.5) (2,209.6) (913.9) Gross profit 260.2 442.2 189.1 Administrative expenses (51.3) (59.8) (49.2) Selling expenses (82.5) (93.0) (71.0) Expected credit (losses) reversal (1.1) 3.1 3.2 Research expenses (15.5) (31.1) (14.2) Other income 5.6 38.7 24.7 Other expenses (33.9) (81.7) (28.9) Share of profit of investments accounted for under the equity method 0.2 (1.1) (2.5) Operating income before financial result 81.7 217.3 51.2 Financial income 49.8 150.4 96.3 Financial expenses (86.5) (220.4) (161.9) Foreign exchange gain (loss), net (3.7) (9.6) (9.7) Income (loss) before income tax 41.3 137.7 (24.1) Income tax (4.2) (56.6) 103.9 Income for the period 37.1 81.1 79.8 Attributable to: - Owners of Embraer 33.4 83.3 73.4 - Non-controlling interests 3.7 (2.2) 6.4 Weighted average number of shares (in thousands) Basic 719.7 732.4 734.5 Diluted 719.7 732.4 734.5 Earnings per share Basic 0.0464 0.1137 0.0999 Diluted 0.0464 0.1137 0.0999 Earnings per share - ADS basic (US$) 0.1856 0.4549 0.3997 Earnings per share - ADS diluted (US$) 0.1856 0.4549 0.3997 Financials are derived from unaudited information. | FINANCIAL STATEMENTS 16 | EMBRAER EARNINGS RESULTS | 1st QUARTER 2026 Embraer S.A. Consolidated Cash Flow Statement (in millions of U.S. dollars) | FINANCIAL STATEMENTS 1Q26 4Q25 1Q25 Operating Activities Income for the period 37.1 81.1 79.8 Adjustment to net income for items not affecting cash Depreciation and amortization expenses 53.2 77.8 50.6 Realization of contribution from suppliers (3.6) (10.3) (4.1) Losses (reversal) of impairment losses of inventories (0.2) (4.9) 7.6 Adjustment to fair value - Financial investments 2.4 (11.0) (7.3) Expected credit losses (reversal) (1.7) 4.8 (3.2) (Gain) loss on disposal of fixed assets and investments 1.3 (10.9) 1.7 Income tax and social contribution 4.2 56.6 (103.9) Accrued interest 36.2 0.1 35.3 Interest on marketable securities, net (3.8) (4.1) (4.7) Share of (profit) loss of investments accounted for the equity method (0.2) 1.1 2.5 Foreign exchange (gain) loss, net (0.3) 11.4 7.8 Other provisions (17.0) 29.8 (10.0) Others 1.6 1.8 1.5 Changes in assets: Financial investments (24.4) 65.9 91.6 Derivative financial instruments (23.5) 49.3 (42.0) Accounts receivable (24.0) (62.3) 72.0 Contract assets (54.8) 235.3 (54.0) Customer financing 0.1 (3.0) 0.9 Inventories (410.1) 375.6 (568.2) Other assets (44.2) (20.4) (51.3) Changes in liabilities: Trade accounts payable and Trade accounts payable - Supplier finance arrangements 87.2 (61.2) 177.2 Other payables 49.3 34.4 173.7 Contract liabilities 3.7 122.8 29.2 Taxes and payroll charges payable 18.7 (57.7) 12.9 Unearned income 3.7 0.8 1.6 NET CASH (USED IN) GENERATED BY OPERATING ACTIVITIES (309.1) 902.8 (102.8) Income tax and social contribution paid (31.1) (5.8) (11.1) Interest paid (48.2) (18.6) (69.9) 1. NET CASH (USED IN) PROVIDED BY OPERATING ACTIVITIES (388.4) 878.4 (183.8) Investing activities Acquisition of property, plant and equipment (76.0) (29.0) (78.4) Proceeds from sale of property, plant and equipment 4.3 1.7 2.4 Additions to intangible assets (80.0) (82.5) (59.5) Acquisition of financial investments (10.9) (279.8) (2.6) Proceeds from sale of financial investments 15.4 279.6 4.0 Proceeds from (disposal of) loan granted (8.2) (53.2) - 17 | EMBRAER EARNINGS RESULTS | 1st QUARTER 2026 1Q26 4Q25 1Q25 2. NET CASH USED IN INVESTING ACTIVITIES (155.4) (163.2) (134.1) Financing activities Proceeds from loans and financing 259.0 1,329.0 683.2 Repayment of loans and financing (154.1) (990.5) (1,095.3) Dividends payments (12.7) (14.5) - Resources derived from the sale of receivables - 40.0 - Repurchases of common shares (183.7) (172.3) (14.5) Lease payments (6.2) (5.4) (5.8) 3. NET CASH (USED IN) GENERATED BY FINANCING ACTIVITIES (97.7) 186.3 (432.4) CASH AND CASH EQUIVALENTS AT THE BEGINNING OF THE PERIOD 1,949.8 1,064.4 1,563.0 Increase (decrease) in cash and cash equivalents (1+2+3) (641.5) 901.5 (750.3) Effects of exchange rate changes on cash and cash equivalents 7.4 (16.1) 0.3 CASH AND CASH EQUIVALENTS AT THE END OF THE PERIOD 1,315.7 1,949.8 813.0 | FINANCIAL STATEMENTS Financials are derived from unaudited information. 18 | EMBRAER EARNINGS RESULTS | 1st QUARTER 2026 Embraer S.A. Consolidated Balance Sheet (in millions of U.S. dollars) Financials are derived from unaudited information. Assets 1Q26 4Q25 1Q25 Current Cash and cash equivalents 1,315.7 1,949.8 813.0 Financial investments 799.1 676.1 544.8 Trade accounts receivable 325.8 289.4 252.3 Derivative financial instruments 22.2 8.7 17.0 Customer financing 0.4 0.4 13.1 Contract assets 558.6 510.1 676.4 Inventories 3,666.6 3,267.1 3,487.3 Income tax and social contribution 127.1 78.8 175.2 Other assets 369.0 369.7 283.2 7,184.5 7,150.1 6,262.3 Non-Current Financial investments 183.8 288.8 364.4 Contract assets 57.2 51.9 3.0 Derivative financial instruments 2.7 - - Customer financing 7.5 7.6 22.0 Trade accounts receivable 3.9 1.7 2.2 Deferred income tax and social contribution 118.6 118.1 172.6 Other assets 323.3 313.3 179.6 697.0 781.4 743.8 Investments 31.9 30.3 44.4 Property, plant and equipment 2,152.9 2,130.9 1,987.4 Intangible assets 2,788.8 2,721.3 2,548.2 Right of use 103.5 106.2 110.5 5,077.1 4,988.7 4,690.5 Total Assets 12,958.6 12,920.2 11,696.6 | FINANCIAL STATEMENTS 19 | EMBRAER EARNINGS RESULTS | 1st QUARTER 2026 Embraer S.A. Consolidated Balance Sheet (in millions of U.S. dollars) Liabilities 1Q26 4Q25 1Q25 Current Trade accounts payable 1,225.2 1,116.8 1,147.1 Trade accounts payable - supplier finance arrangements 52.3 62.9 43.9 Lease liability 22.0 20.7 21.2 Loans and financing 95.5 105.3 91.5 Other payables 630.5 610.3 413.8 Contract liabilities 2,510.3 2,563.4 2,681.1 Derivative financial instruments 27.5 38.4 34.2 Taxes and payroll charges payable 60.8 63.3 46.7 Income tax and social contribution 58.9 23.3 146.9 Unearned income 34.2 29.7 20.3 Provisions 133.9 127.6 94.0 4,851.1 4,761.7 4,740.7 Non-Current Lease liability 95.4 97.4 97.9 Loans and financing 2,594.6 2,488.5 1,954.5 Other payables 333.8 348.1 222.5 Contract liabilities 928.6 871.7 632.7 Derivative financial instruments 17.7 26.4 21.1 Taxes and payroll charges payable 13.1 12.1 10.3 Income tax and social contribution 4.1 3.8 3.5 Deferred income tax and social contribution 239.4 273.1 327.2 Unearned income 7.3 8.2 12.1 Provisions 209.6 217.2 206.7 4,443.6 4,346.5 3,488.5 Total Liabilities 9,294.7 9,108.2 8,229.2 Shareholders’ equity Share Capital 1,551.6 1,551.6 1,551.6 Treasury shares (398.7) (215.0) (42.7) Revenue reserves 1,879.0 1,879.0 1,624.2 Share-based payment 329.0 327.9 186.5 Other comprehensive loss (101.1) (98.8) (203.6) Retained earnings 33.4 - 73.4 Equity Attributable to owners of the Company 3,293.2 3,444.7 3,189.4 Non-controlling interest 370.7 367.3 278.0 Total Equity 3,663.9 3,812.0 3,467.4 Total Liabilities And Shareholders’ Equity 12,958.6 12,920.2 11,696.6 Financials are derived from unaudited information. | FINANCIAL STATEMENTS 20 | EMBRAER EARNINGS RESULTS | 1st QUARTER 2026 Reconciliation of IFRS and “NON-GAAP” information Represents earnings before interest, taxation, depreciation, and amortization accumulated over a period of the last 12 months. It is not a financial measure of the company’s financial performance under IFRS. EBIT, as mentioned in this press release, refers to earnings before interest and taxes, and for the purpose of reporting is the same as reported on the Income Statement as Operating Profit before Financial Income. EBITDA RECONCILIATION LTM* (IFRS) 1Q26 4Q25 1Q25 Net Income attributable to Embraer 311.9 351.9 397.2 Non-controlling interest 4.4 7.1 4.8 Income tax (income) expense 16.7 (91.4) 97.9 Financial (income) expense, net 270.0 298.9 194.5 Foreign exchange (gain) loss, net 35.1 41.1 28.2 Depreciation and amortization 235.0 232.0 219.6 EBITDA LTM 873.1 839.6 942.2 EBITDA LTM Are presented because they are used internally as measures to evaluate certain aspects of the business. The company also believes some investors find them to be useful tools for measuring a company’s financial performance. EBIT and EBITDA should not be considered as alternatives to, in isolation from, or as substitutes for, analysis of the company’s financial condition or results of operations, as reported under IFRS. Other companies in the industry may calculate EBIT and EBITDA differently from Embraer for the purpose of their earnings releases, which limits EBIT and EBITDA’s usefulness as comparative measures. EBIT and EBITDA | FINANCIAL STATEMENTS * Last Twelve Months Financials are derived from unaudited information. Financials are derived from unaudited information. EBITDA RECONCILIATION 1Q26 4Q25 1Q25 Net Income attributable to Embraer 33.4 83.3 73.4 Non-controlling interest 3.7 (2.2) 6.4 Income tax (income) expense 4.2 56.6 (103.9) Financial (income) expense, net 36.7 70.0 65.6 Foreign exchange (gain) loss, net 3.7 9.6 9.7 Depreciation and amortization 49.6 67.5 46.5 EBITDA 131.3 284.8 97.7 EBITDA margin % 9.1% 10.7% 8.9% in millions of U.S. dollars in millions of U.S. dollars 21 | EMBRAER EARNINGS RESULTS | 1st QUARTER 2026 ADJUSTED EBIT RECONCILIATION 1Q26 4Q25 1Q25 Operating profit before financial income (EBIT) 81.7 217.3 (3.9) Expenses related to Eve 12.3 13.6 10.9 Adjusted EBIT 94.0 230.9 62.0 Adjusted EBIT margin % 6.5% 8.7% 5.6% Financials are derived from unaudited information. ADJUSTED EBITDA RECONCILIATION 1Q26 4Q25 1Q25 EBITDA 131.3 284.8 97.7 Expenses related to Eve 12.3 13.6 10.9 Adjusted EBITDA 143.6 298.4 108.6 Adjusted EBITDA margin % 9.9% 11.3% 9.8% Financials are derived from unaudited information. in millions of U.S. dollars | FINANCIAL STATEMENTS in millions of U.S. dollars ADJUSTED NET INCOME RECONCILIATION 1Q26 4Q25 1Q25 Net income attributable to Embraer 33.4 83.3 73.4 Expenses related to Eve 10.5 11.1 10.0 Eve warrants including financial result (16.2) 2.7 (33.4) Adjusted net income 27.7 97.1 50.0 Adjusted net margin 1.9% 3.7% 4.5% Financials are derived from unaudited information. in millions of U.S. dollars Is a non-GAAP measure calculated by adding Net Income attributable to Embraer Shareholders, as well as removing the impact of non-recurring items. The company decided to no longer classify deferred taxes as an extraordinary item in 1Q26, and consequently adjusted the presented 2025 comps for an apples-to-apples comparison. Adjusted net income Adjusted EBIT and Adjusted EBITDA are non-GAAP measures, and both exclude the impact of several non-recurring items, as described in the tables below. 22 | EMBRAER EARNINGS RESULTS | 1st QUARTER 2026 SELECT BALANCE SHEET DATA - EVE 1Q26 4Q25 1Q25 Δ qoq Δ yoy A Inventories - - 1.4 - (1.4) Trade accounts receivable - - - - - Customer and commercial financing - - - - - Contract assets - - - - - Other assets 15.7 17.7 7.3 (2.0) 8.4 B Contract liabilities - - 1.5 - (1.5) Trade accounts payable 15.3 27.9 15.2 (12.6) 0.1 Trade accounts payable - Supplier finance - - - - - Other liabilities 55.8 68.0 23.8 (12.2) 32.0 Working Capital (A-B) (55.4) (78.2) (31.8) 22.8 (23.6) Financials are derived from unaudited information. in millions of U.S. dollars | FINANCIAL STATEMENTS We define free cash flow as operating cash flow less additions to property, plant and equipment, additions to intangible assets, financial investments and other assets. Adjusted free cash flow is not an accounting measure under IFRS. Adjusted free cash flow is presented because it is used internally as a measure for the evaluation of certain aspects of our business. The company also believes some investors find it to be a useful tool for measuring Embraer’s cash position. Adjusted free cash flow should not be considered as a measure of the company’s liquidity or as a measure of its cash flow as reported under IFRS. In addition, adjusted free cash flow should not be interpreted as a measure of residual cash flow available to the company for discretionary expenditures, since the company may have mandatory debt service requirements or other nondiscretionary expenditures that are not deducted from this measure. Other companies in the industry may calculate adjusted free cash flow differently from Embraer for purposes of their earnings releases, which thus limits its usefulness for comparison between Embraer and other companies in the industry. Adjusted Free Cash Flow ADJUSTED FREE CASH FLOW W/O EVE 1Q26 4Q25 1Q25 Net cash (used in) provided by operating activities (388.4) 878.4 (183.8) Financial investments adjustment 24.4 (65.9) (91.6) Adjusted net cash (used in) provided by operating activities (364.0) 812.5 (275.4) Net additions to property, plant and equipment (71.7) (27.3) (76.0) Additions to intangibles (80.0) (82.5) (59.5) Adjusted free cash generated (used) (515.7) 702.7 (410.9) Eve free cash used adjusted 68.6 35.6 25.1 Adjusted free cash generated (used) w/o Eve (447.1) 738.3 (385.8) Financials are derived from unaudited information. in millions of U.S. dollars Is a non-GAAP measure calculated by starting at selected Embraer’s consolidated balance sheet figures and subtracting Eve’s related working capital values. For working capital calculations, in the assets side of the balance sheet, we include inventories, trade accounts receivable, customer and commercial financing, contract assets and other assets. Meanwhile, in the liabilities side of the balance sheet, we include contract liabilities, trade accounts payable, supplier finance and other payables. Working capital without Eve 23 | EMBRAER EARNINGS RESULTS | 1st QUARTER 2026 (i) Total debt represents short and long-term loans and financing including Eve (US$ billion). (ii) Net debt represents cash and cash equivalents, plus financial investments, minus short and long-term loans and financing. (iii) Net debt w/o Eve represents cash and cash equivalents, plus financial investments and intercompany loan receivable, minus short and long-term loans, less Eve Net debt. (iv) Total capitalization represents short and long-term loans and financing, plus shareholders equity (US$ billion). (v) Financial expense (gross) includes only interest and commissions on loans. (vi) The table above sets forth the reconciliation of Net income to EBITDA, calculated on the basis of financial information prepared with IFRS data, for the indicated periods (US$ million). (vii) Interest expense (gross) includes only interest and commissions on loans, which are included in Interest income (expense), net presented in the Company’s consolidated Income Statement (US$ million). (viii) The table above sets forth the reconciliation of Net income to Adjusted EBITDA, calculated on the basis of financial information prepared with IFRS data, for the indicated periods (US$ million). Ratios based on “NON-GAAP” information SELECTED FINANCIAL RATIOS 1Q26 4Q25 1Q25 Total debt to EBITDA (i) 3.1 3.1 2.2 Net debt to EBITDA (ii) 0.4 (0.4) 0.3 Net debt w/o Eve to Adjusted EBITDA (iii) 0.6 (0.1) 0.5 Total debt to capitalization (iv) 0.4 0.4 0.4 LTM EBITDA to financial expense (gross) (v) 6.2 6.0 5.3 LTM EBITDA (vi) 873.1 839.6 942.2 LTM Interest and commissions on loans (vii) 141.7 140.3 178.2 Adjusted LTM EBITDA w/o Eve (viii) 923.8 888.8 983.1 Financials are derived from unaudited information. | FINANCIAL STATEMENTS 24 | EMBRAER EARNINGS RESULTS | 1st QUARTER 2026 CONFERENCE CALL INFORMATION Embraer will host a conference call to present its 1Q26 results on: Friday May 8, 2026 ENGLISH: 8:00 AM (NY Time) / 9:00 AM (SP Time) Translation to Portuguese. To access the webcast Zoom webinar: 818 3876 4674 We recommend you join 15 minutes in advance. Investor Relations | CONFERENCE CALL INFO click here 25 | EMBRAER EARNINGS RESULTS | 1st QUARTER 2026 About Embraer A global aerospace company headquartered in Brazil, Embraer has businesses in Commercial and Executive Aviation, Defense & Security and Agricultural Aviation. The company designs, develops, manufactures and markets aircraft and systems, providing after-sales service and support to customers. Since it was founded in 1969, Embraer has delivered more than 9,000 aircraft. On average, every 10 seconds an aircraft manufactured by Embraer takes off somewhere in the world, transporting more than 145 million passengers a year. Embraer is the main manufacturer of commercial jets with up to 150 seats and the main exporter of high value-added goods in Brazil. The company maintains industrial units, offices, service centers and parts distribution, among other activities, in the Americas, Africa, Asia and Europe. This document may contain projections, statements and estimates regarding circumstances or events yet to take place. Those projections and estimates are based largely on current expectations, forecasts of future events and financial trends that affect Embraer’s businesses. Those estimates are subject to risks, uncertainties and suppositions that include, among others: general economic, political and trade conditions in Brazil and in those markets where Embraer does business; expectations of industry trends; the Company’s investment plans; its capacity to develop and deliver products on the dates previously agreed upon, and existing and future governmental regulations. The words “believe”, “may”, “is able”, “will be able”, “intend”, “continue”, “anticipate”, “expect” and other similar terms are intended to identify potentialities. Embraer does not undertake any obligation to publish updates nor to revise any estimates due to new information, future events or any other facts. In view of the inherent risks and uncertainties, such estimates, events and circumstances may not take place. The actual results may therefore differ substantially from those previously published as Embraer expectations. This document contains non-GAAP financial information, to facilitate investors to reconcile Eve’s financial information in GAAP standards to Embraer’s IFRS. | ABOUT EMBRAER 26 | EMBRAER EARNINGS RESULTS | 1st QUARTER 2026 ri.embraer.com.br/en CONTACT investor.relations@embraer.com.br GUI PAIVA EAH CFO; EMBJ Head of IR, M&A and CVC gpaiva@embraer.com PATRICIA MC KNIGHT IR Manager patricia.mcknight@embraer.com.br ALESSANDRA RANGEL IR Specialist alessandra.vianna@embraer.com.br MARILIA SABACK SGOBBI IR Specialist marilia.saback@embraer.com.br RODRIGO DINIZ IR Analyst rodrigo.dmendes@embraer.com.br


SIGNATURES
Pursuant to the requirements of the Securities Exchange Act of 1934, the registrant has duly caused this report to be signed on its behalf by the undersigned, thereunto duly authorized.
Date: May 8, 2026
| Embraer S.A. | ||||
| By: |
/s/ Felipe Santana Santiago de Lima | |||
|
Name: |
Felipe Santana Santiago de Lima | |||
| Title: | Executive Vice President of Finance and Investor Relations | |||