April 29, 2020
To our shareholders:
You are cordially invited to attend the 2020 annual meeting of shareholders of Limestone Bancorp, Inc. The meeting will be held on Wednesday, June 17, 2020, at 9:00 a.m. EDT in the Conference
Center on the second floor of our main office located at 2500 Eastpoint Parkway, Louisville, Kentucky 40223.
The enclosed Notice and Proxy Statement contain information about the matters to be voted on at the annual meeting.
We hope you can attend the annual meeting. Whether or not you plan to attend, please complete, sign and return the enclosed proxy card in the envelope provided to ensure your shares are
represented and voted at the annual meeting.
We appreciate your interest and investment in Limestone Bancorp and look forward to seeing you at the annual meeting.
|
|
By order of the Board of Directors,
|
 |
|
|
|
|
|
John T. Taylor
Chief Executive Officer
|
NOTICE OF ANNUAL MEETING OF SHAREHOLDERS
OF LIMESTONE BANCORP, INC.
WEDNESDAY, JUNE 17, 2020
To our shareholders:
The Annual Meeting of Shareholders of Limestone Bancorp, Inc. will be held on Wednesday, June 17, 2020, at 9:00 a.m. EDT in the Conference Center on the second floor of our main office located at
2500 Eastpoint Parkway, Louisville, Kentucky 40223, to consider and act upon the following matters:
|
1.
|
The election of eight nominees as directors;
|
|
2.
|
A proposal to approve, in a non-binding advisory vote, the compensation of the Company’s executives as disclosed in the accompanying proxy statement;
|
|
3.
|
A proposal to ratify the appointment of the Company’s independent registered public accounting firm; and
|
|
4.
|
Such other business as may properly come before the meeting.
|
The close of business on April 23, 2020, is the record date for determining the shareholders entitled to notice of, and to vote at, the Annual Meeting of Shareholders.
Whether or not you plan to attend the meeting, please sign, date and promptly return the enclosed proxy. If for any reason you desire to revoke your proxy, you may do so at any time before the
voting as described in the accompanying proxy statement.
|
|
By order of the Board of Directors,
|
|
|
|
|
|
|
John T. Taylor
Chief Executive Officer
|
April 29, 2020
Important Notice Regarding the Availability of Proxy Materials for the
Shareholders Meeting to be Held on June 17, 2020:
This proxy statement and our 2019 Annual Report to Shareholders,
including Form 10-K, are available at www.limestonebank.com under “About Us – Investor Relations.”
Please note: As a precautionary measure related to the novel coronavirus or COVID-19 outbreak, it is possible we may hold the Annual Meeting solely by means of remote communication. If we determine
to do so, we will announce the decision in advance on our website at www.limestonbank.com under “About Us – Investor Relations,” and mail shareholders of record entitled to vote at the Annual Meeting details on how to participate in the
Annual Meeting by remote communication.
2020 ANNUAL MEETING OF SHAREHOLDERS
NOTICE OF ANNUAL MEETING AND PROXY STATEMENT
IMPORTANT NOTICE REGARDING THE AVAILABILITY OF PROXY MATERIALS FOR THE SHAREHOLDER MEETING TO BE HELD ON JUNE 17, 2020:
The proxy statement and annual report on Form 10-K are available at www.limestonebank.com
under “Investor Relations.”
QUESTIONS AND ANSWERS
Why am I receiving these materials?
We are sending this proxy statement and the accompanying proxy card to our shareholders of record beginning on or about April 29, 2020. These materials are for use at the 2020 Annual Meeting of
Limestone Bancorp Shareholders, which will be held on June 17, 2020, at 9:00 a.m. EDT in the Conference Center on the second floor of our main office located at 2500 Eastpoint Parkway, Louisville, Kentucky 40223. Our Board of Directors is
soliciting proxies to give all shareholders of record an opportunity to vote on matters to be presented at the Annual Meeting. In the following pages of this Proxy Statement, you will find information on matters to be voted upon at the Annual
Meeting or any adjournment of that meeting.
Depending on the status of the novel coronavirus or COVID-19 outbreak as we approach the Annual Meeting date, it is possible our Board of Directors may determine to hold the Annual Meeting solely
by means of remote communication. If we determine to do so, we will announce the decision in advance on our website at www.limestonebank.com under "About Us - Investor Relations," and mail shareholders of record entitled to vote at the
Annual Meeting details on how to participate in the Annual Meeting by remote communication.
Who is entitled to vote?
Shareholders of record of Limestone Bancorp common shares as of the close of business on April 23, 2020, are entitled to vote at the Annual Meeting. Only shares that are present in person or
represented by a valid proxy can be voted at the meeting.
What constitutes a quorum and how many shares are outstanding?
A majority of the outstanding common shares must be present, either in person or represented by proxy, in order to conduct business at the Annual Meeting. On April 23, 2020, there were 6,269,305
common shares of Limestone Bancorp outstanding.
Shareholders are entitled to cast one vote per common share on each matter except the election of directors. In the election of directors, shareholders are entitled to cast one vote per common
share for each of the eight positions on our Board of Directors up for election at the Annual Meeting.
All shares represented by properly completed proxies received before the polls are closed at the Annual Meeting, unless revoked or superseded, will be voted in accordance with instructions
indicated on those proxies.
What am I voting on?
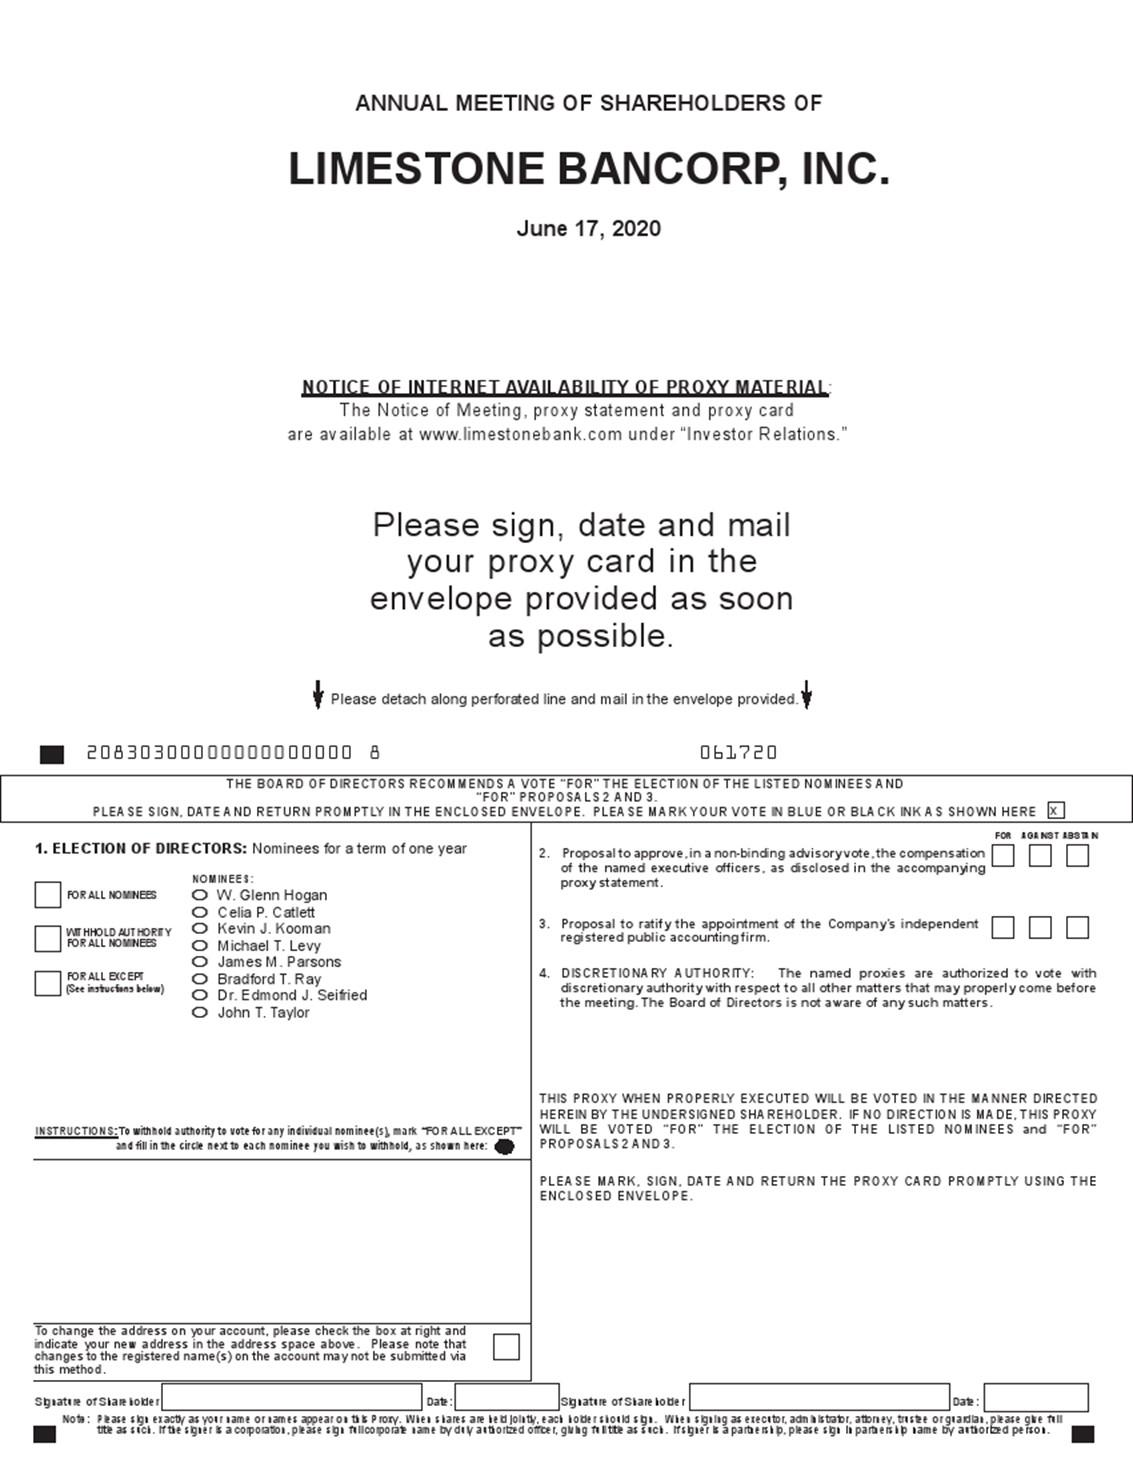
You are voting on three items:
|
●
|
The election of eight directors (Proposal 1);
|
|
●
|
A proposal to approve, in a non-binding advisory vote, the compensation of the Company’s executives as disclosed under “Executive Compensation” (Proposal 2); and
|
|
●
|
A proposal to ratify the appointment of our independent registered public accounting firm (Proposal 3).
|
Our Board recommends that you vote your shares:
|
●
|
FOR the election of the nominees listed in this proxy statement;
|
|
●
|
FOR the proposal to approve, on an advisory basis, the compensation of the Company’s executives as disclosed in this proxy statement; and
|
|
●
|
FOR the ratification of the appointment of our independent registered public accounting firm.
|
We are not aware of any other business to be submitted for a vote of shareholders at the Annual Meeting.
3
How many votes are required for approval?
Directors are elected by a plurality of the votes cast, which means the eight nominees who receive the largest number of votes will be elected as directors. Cumulative voting is not permitted.
Shares that are represented by proxies marked “withhold authority” for the election of one or more director nominees will not be counted in determining the number of votes cast for those persons.
Each of the other proposals on the agenda for the Annual Meeting – to approve the compensation of the Company’s executives (Proposal 2), and to ratify the appointment of our independent registered
public accounting firm (Proposal 3) – will be approved if the number of votes cast in favor of the proposal is greater than the number cast against it.
Abstentions and broker non-votes will be counted as present for purposes of determining whether a quorum exists. Neither abstentions nor broker non-votes will have any effect on the election of
directors or the proposals to approve executive compensation, and to ratify the appointment of our independent registered public accounting firm.
Brokers will not have discretionary authority to vote on Proposal 1 or 2 on behalf of beneficial owners of common shares who have not provided voting instructions. Brokers who hold shares in
nominee name have discretionary authority to vote those shares without instruction from the beneficial owners only with respect to the proposal to ratify the appointment of our independent registered public accounting firm (Proposal 3).
How do I vote?
You may vote by proxy or in person at the meeting. To vote by proxy, simply mark your proxy card, date and sign it and return it in the envelope provided. The Board has designated two individuals
to vote the shares represented by proxies solicited by the Board at the Annual Meeting. If you properly submit a proxy but do not specify how you want your shares to be voted, your shares will be voted by the designated proxies:
|
●
|
FOR the election of all the director nominees recommended by the Board;
|
|
●
|
FOR the approval of our executive compensation; and
|
|
●
|
FOR the ratification of the appointment of our independent registered public accounting firm.
|
The designated proxies will vote in their discretion on any other matter that may properly come before the meeting. At the date the Proxy Statement went to press, we did not anticipate that any
other matters would be raised at the Annual Meeting.
If you wish to vote in person at the meeting and you hold your shares through a broker, bank or other institution, you are considered a “street name” shareholder and you must obtain a “legal proxy”
from your broker or bank in order to vote in person at the meeting. Please contact the institution holding your shares for information on how to obtain a legal proxy.
How can I revoke my proxy?
If you vote by proxy, you may revoke that proxy at any time before it is voted at the meeting. You may do this by (a) signing another proxy card with a later date and returning it to us before the
meeting or (b) attending the meeting in person and casting a ballot.
How may I obtain Limestone Bancorp’s 10-K and other financial information?
A copy of our 2019 Annual Report on Form 10-K is enclosed. Shareholders and prospective investors may request a free copy of our 2019 Annual Report on Form 10-K by writing to Investor Relations -
Limestone Bancorp, Inc. at: 2500 Eastpoint Parkway, Louisville, Kentucky 40223. The Form 10-K is also available at www.limestonebank.com. Click on “Investor Relations” under the “About Us” tab and then proceed to “SEC Filings” under
“Documents.”
Who can help answer my questions?
If you have questions or would like to receive additional copies of this proxy statement or voting materials, please contact Investor Relations as described above.
4
PROPOSAL 1: ELECTION OF DIRECTORS
At the 2020 Annual Meeting, our shareholders will elect eight directors to serve for a one-year term and until their successors are elected and qualified. Our articles of incorporation and bylaws
provide that our Board of Directors will consist of not less than two nor more than 15 members, with the actual number of directors to be set by the Board. Our Board of Directors is currently comprised of eight directors.
The Nominating and Corporate Governance Committee and the Board of Directors have nominated the eight individuals named in the table below for election as directors. All of the nominees are current
members of the Board. None of the nominees currently serves as a director of any other public or registered investment company, nor have they held any such directorship, except as described in each director’s biography below.
|
Director Nominees
|
Age
|
Position
|
|||
|
|
|
||||
|
W. Glenn Hogan
|
58
|
Chairman of the Board of Directors
|
|||
|
Celia P. Catlett
|
43
|
Director
|
|||
|
Kevin J. Kooman
|
50
|
Director
|
|||
|
Michael T. Levy
|
51
|
Director
|
|||
|
James M. Parsons
|
63
|
Director
|
|||
|
Bradford T. Ray
|
62
|
Director
|
|||
|
Dr. Edmond J. Seifried
|
73
|
Director
|
|||
|
John T. Taylor
|
60
|
President, Chief Executive Officer and Director of Limestone Bancorp President, Chief Executive Officer and Chairman of the Board of Directors of Limestone Bank, Inc.
|
|||
Each nominee named above is independent under the applicable listing standards of the Nasdaq corporate governance rules, with the exception of Mr. Taylor.
W. Glenn Hogan, a director since 2006, is founder, President and Chief Executive Officer of Hogan Real Estate, a full service commercial real estate
development company headquartered in Louisville, Kentucky. Mr. Hogan has more than thirty years of real estate development experience and has developed millions of square feet of retail space in the Midwest and Southeast. He is a Certified
Commercial Investment Member and a past president of the Kentucky State CCIM Chapter. Mr. Hogan brings executive decision making skills and his commercial real estate background strengthens our risk assessment function. He also is familiar with the
banking industry from previous service on the Board of Directors of two other Louisville community banks. Mr. Hogan served as a director of US Wireless Online, Inc. from August 2005 until May 2006.
Celia P. Catlett, a director since 2018, previously served as the General Counsel of Texas Roadhouse, a Nasdaq listed company from 2013 through 2019. She
joined that organization in 2005, and served as its Corporate Secretary from 2011 through 2019. Prior to joining Texas Roadhouse, Ms. Catlett practiced law in New York City. She graduated magna cum laude from the University of Alabama with a
Bachelor’s Degree in communications, and earned her Juris Doctor Degree from Vanderbilt University Law School. In 2014, Ms. Catlett was named one of Louisville Business First’s Forty Under 40, and recognized by the Kentucky Governor’s office as an
Outstanding Kentuckian. In 2016, Catlett was named as the Enterprising Woman to Watch by Louisville Business First. Ms. Catlett brings her public company experience, legal background, and experience in the customer-focused hospitality industry.
Kevin J. Kooman, a director since 2019, is a Partner with Patriot Financial Partners, L.P., a private equity investment fund focused on investments in the
community bank and financial services sectors. Mr. Kooman joined Patriot Financial Partners in 2007 and has over 25 years of private equity, investment banking and corporate finance experience. Prior to joining Patriot Financial Partners, he served
as a Vice President of Investment Banking at Janney Montgomery Scott LLC in the firm’s Financial Institutions Group. Prior to joining Janney, Mr. Kooman held the positions of divisional Controller and Manager of Financial Operations at CIGNA
Corporation and ACE Limited. Mr. Kooman began his career in the Philadelphia office of Arthur Andersen LLP. He currently serves on the boards of White River Bancshares Company and The Freedom Bank of Virginia. Mr. Kooman received a Bachelor’s
Degree in Accounting from Villanova University and received an M.B.A. in Finance from Temple University. He is a Certified Public Accountant (currently inactive). As the representative of Patriot Financial Partners III, L.P., Mr. Kooman brings
extensive leadership and community banking experience to our Board, including merger and acquisition experience, public company expertise and risk assessment skills.
5
Michael T. Levy, a director since 2014, is President of Muirfield Insurance LLC of Kentucky, a Lexington, Kentucky
insurance brokerage firm. An owner of Bluewater Farm, LLC, Mr. Levy is active in breeding and selling Thoroughbreds and has served in the past as a board member of the Thoroughbred Owners and Breeders Association and Breeders Cup, Ltd. He is a
graduate of the University of Pennsylvania. The lead producer in an insurance agency, Mr. Levy has intimate knowledge of the Lexington market, which has been identified as a target growth market in our strategic planning. He also has extensive
experience in the equine industry, a niche market also identified in the strategic plan of our banking subsidiary, Limestone Bank, Inc.
James M. Parsons, a director since 2015, is the Chief Financial Officer of Ball Homes, LLC, a residential real estate
development firm headquartered in Lexington, Kentucky with operations in Kentucky and Tennessee. Mr. Parsons has served with Ball Homes since 2005. Mr. Parsons previously served as President and CEO of ONB Insurance Group. His background in
accounting and real estate development finance strengthen the Board’s depth of experience in those areas. Mr. Parsons earned his Bachelor’s Degree in Business Administration and Accounting from West Virginia University.
Bradford T. Ray, a director since 2014, served in various leadership roles at Steel Technologies, Inc., a steel processor, from 1981 to 2010, serving as CEO
beginning in 1999 and as Chairman beginning in 2002. He served as an advisor to Steel Technologies, Inc. from 2010 to 2012. He has been a consultant with BTR Advisory Services since 2012 and served as an independent director of Global Brass and
Copper Holdings, Inc. from 2014 through 2019. Mr. Ray serves on the Board of Trustees of Bellarmine University in Louisville, Kentucky. He provides the experience and perspective of a former chief executive of a publicly traded manufacturing
business.
Dr. Edmond J. Seifried, a director since 2015, is a principal in S&B West LLC, a community bank consulting center in Easton, Pennsylvania. In addition,
Dr. Seifried is a Professor Emeritus at Lafayette College in Easton, Pennsylvania. He also serves as Executive Consultant and Chief Economist for Sheshunoff CEO Affiliation Program, a national bank consulting organization. Dr. Seifried serves as
the dean of the Virginia and West Virginia Banking Schools and has served on the faculty of numerous banking schools including: Stonier Graduate School of Banking, and the Graduate School of Banking of the South. Dr. Seifried provides experience and
insight with respect to trends and developments affecting community banks nationally.
John T. Taylor has served as President and a director of Limestone Bancorp, and as President and Chief Executive Officer of the Bank since July 2012. He
became Chief Executive Officer of Limestone Bancorp in 2013. Mr. Taylor serves as an executive officer and is nominated as a director in accordance with his employment agreement with the Company and the Bank. Prior to joining Limestone, Mr. Taylor
served as President and CEO of American Founders Bank, Inc. and American Founders Bancorp, Inc. of Lexington, Kentucky since 2007. Prior to joining American Founders, he served in senior management positions with increasing responsibility for PNC
Bank, N.A., including as President of its Ohio/Northern Kentucky region for six years. Mr. Taylor has over 30 years of banking experience in Kentucky and Ohio. Mr. Taylor has been actively involved in a number of civic and professional
organizations. He has a solid history of building organizations with a clear vision and strategy to build long-term enterprise value. Mr. Taylor also has strong roots in Kentucky with significant experience in our key markets. He is a graduate of
the University of Kentucky where he earned a Master’s and a Bachelor’s Degree in Business Administration.
Neither the Nominating and Corporate Governance Committee nor the Board of Directors has reason to believe that any nominee for director is unwilling or unable to serve following election. However,
if that were to occur, the holders of the proxies solicited hereby will vote for such substitute nominees as the Nominating and Corporate Governance Committee or the Board of Directors may recommend.
6
The Board of Directors recommends that shareholders vote “FOR” the election of the eight nominees.
Other Executive Officers
|
Name
|
Age
|
Position
|
|||
|
Phillip W. Barnhouse
|
49
|
Chief Financial Officer Limestone Bancorp and Limestone Bank
|
|||
|
John R. Davis
|
57
|
Chief Credit Officer of Limestone Bank
|
|||
|
Joseph C. Seiler
|
53
|
Executive Vice President of Limestone Bank
|
|||
Phillip W. Barnhouse has served as Chief Financial Officer since 2012 and has served as Chief Financial Officer of the Bank since 2006. He served as the
Bank’s Chief Operating Officer from 2013 to 2018. Mr. Barnhouse served as Chief Financial Officer of Ascencia Bank from 1998 to 2005. From 1992 to 1998, Mr. Barnhouse worked with Arthur Andersen LLP, where he managed the audits of public and private
companies. He is a member of the American Institute of Certified Public Accountants and the Kentucky Society of CPAs. Mr. Barnhouse earned a Bachelor's Degree in Accounting from Western Kentucky University and a diploma from The Graduate School of
Banking at Louisiana State University.
John R. Davis has served as Chief Credit Officer of the Bank since September 2012. Mr. Davis has the responsibility for establishing and executing credit
quality policies and overseeing credit administration. He previously served as Executive Vice President and Chief Credit Officer of American Founders Bank, Inc. and American Founders Bancorp, Inc. of Lexington, Kentucky. Before joining American
Founders in 2005, he served for 17 years in various commercial lending and credit administration positions of increasing authority with National City Bank. Mr. Davis earned his Bachelor’s Degree in Business from the University of Louisville, an MBA
from Bellarmine University and is a graduate of the Stonier Graduate School of Banking.
Joseph C. Seiler has served as Executive Vice President of the Bank and head of the Bank’s commercial banking business since August 2013. Mr. Seiler previously
served as Executive Vice President, Asset Resolution Team, of PNC Bank, N.A. in Louisville, Kentucky. Before joining PNC Bank in 2009, he served as Executive Vice President and Managing Director, Investment Real Estate Group, for National City Bank
of Louisville, Kentucky. Mr. Seiler earned his Bachelor’s Degree in Economics from Centre College in Danville, Kentucky and an MBA from the University of Louisville.
7
CORPORATE GOVERNANCE
Corporate Governance Principles
Our Board of Directors has adopted corporate governance principles that address the role and composition of our Board of Directors and the functions of our Board and its committees. We regularly review and may revise our corporate governance principles from time to time in response to changing regulatory requirements, evolving best practices and items of interest to our shareholders and other
constituents. Our corporate governance principles are available on our website at www.limestonebank.com under “Investor Relations” and “Governance Documents.”
Director Independence
Our corporate governance principles provide that a majority of the members of the Board of Directors must be independent from management. For this purpose, the Board has adopted director
independence standards that meet the listing standards of the Nasdaq corporate governance rules. In accordance with our corporate governance guidelines, the Nominating and Corporate Governance Committee undertakes an annual review of director
independence during the first quarter of each year. During this review, the Board considers any and all commercial and charitable relationships of directors, including transactions and relationships between each director or any member of his or
her immediate family and the Company and its subsidiaries.
In its 2019 review, the Board affirmatively determined that director nominees Michael T. Levy, James M. Parsons, Bradford T. Ray, Dr. Edmond J. Seifried, Celia P. Catlett, and Kevin J. Kooman are
each independent of the Company and its management in that none have any relationship that would interfere with the exercise of independent judgment in carrying out the responsibilities of a director, in accordance with the Nasdaq corporate
governance rules.
Limestone Bank received real estate management services and sales services from Hogan Development Company, a firm in which our director, W. Glenn Hogan holds a controlling interest. As described
under “Certain Relationships and Related Transactions,” this arrangement was reviewed and evaluated by the independent members of our Audit Committee as part of the Board’s annual assessment of director independence. The Bank paid real estate
management fees to Hogan Development Company of $20,000 in each of 2019 and 2018. The Bank paid no real estate commissions in 2019 or 2018. Fees paid annually to Hogan Development Company in 2016 were more than 5% of that firm’s consolidated gross
revenues and precluded Mr. Hogan from being an independent director under the Nasdaq corporate governance rules in 2017, 2018, and 2019. For 2020, Mr. Hogan has been determined to be independent under the director independence standards applicable
under Nasdaq corporate governance rules.
Director Nominations and Qualifications
In making its recommendations of nominees to be elected to the Board of Directors and included in our proxy statement, the Nominating and Corporate Governance Committee evaluates incumbent directors,
potential director nominees and persons recommended by shareholders, if any. The Committee reviews each candidate in light of the selection criteria set forth in our corporate governance principles. Candidates are selected based on their integrity,
independence, diversity of experience, leadership and their ability to exercise sound judgment. While we do not have a separate diversity policy, the Committee does consider the diversity of experience of its nominees in knowledge, skills, expertise
and other demographics that may contribute to the Board. When considering potential Board members, the Committee will look at all of the foregoing criteria and the current and anticipated needs of the Company. The various qualifications and
criteria are normally considered at a Committee meeting during March of each calendar year so that the respective names can be placed on the ballot for the annual meeting. All of the nominees for election as directors at the annual meeting were
nominated by the Committee. The Committee did not receive any shareholder nominations for directors.
Board Leadership Structure
In 2012, the Board’s five independent directors identified and hired John T. Taylor to serve in the primary leadership role for the Company. Mr. Taylor joined as President of Limestone Bancorp and
as President and Chief Executive Officer of the Bank in July 2012. In 2013, Mr. Taylor was named CEO of Limestone Bancorp and W. Glenn Hogan was named Chairman of the Board. Mr. Taylor is responsible for the executive leadership and management of
the Company and the Bank. Mr. Taylor also serves as a director of Limestone Bancorp and Limestone Bank.
Consistent with Nasdaq’s corporate governance rule, the independent directors meet regularly in executive session without management or non-independent directors in attendance. The Board as a whole
actively considers strategic decisions proposed by management, including matters affecting the business strategy and competitive and financial positions of the Company, and also monitors the Company’s risk profile. Board meetings are focused on
strategic matters affecting major areas of the Company’s business, including operational, execution and risk management initiatives. During 2019, the independent directors met periodically in executive session on an as-needed basis.
8
Board Structure and Committee Composition
Our Board of Directors has established standing committees in connection with the discharge of its responsibilities. These committees include an Audit Committee, a Compensation Committee and a
Nominating and Corporate Governance Committee, each of which has a separate charter. Our committee charters are available on our website at www.limestonebank.com under “Investor Relations” and “Governance Documents.”
Audit Committee
The Audit Committee is responsible for and assists our Board in monitoring the integrity of the financial statements, the qualifications and independence of our independent registered public
accounting firm, the performance of our internal audit function and our independent registered public accounting firm and our compliance with legal and regulatory requirements. The Audit Committee has the sole authority and responsibility to select,
appoint, compensate, evaluate and, if necessary, replace the Company's independent auditors. The Audit Committee approves all audit engagement fees and terms, and must pre-approve any non-audit services provided to the Company by the independent
auditors. The Audit Committee met four times in 2019.
During the past year, our Audit Committee was comprised of Ms. Catlett, Mr. Levy, Mr. Parsons, and Mr. Ray. Mr. Kooman also joined the Audit Committee upon his election last year. Our Board of
Directors determined that each of the members of the Audit Committee met the independence requirements of the Nasdaq corporate governance rules and relevant federal securities laws and regulations, and that Mr. Parsons qualified as an audit committee
financial expert.
Compensation Committee
Our Compensation Committee was comprised of Ms. Catlett, Mr. Levy, Mr. Ray, and Mr. Seifried during the past year. W. Kirk Wycoff served until the last annual meeting when Mr. Kooman was elected to
replace Mr. Wycoff. Our Board of Directors determined that each member of the Compensation Committee met the independence requirements of the Nasdaq corporate governance rules. The Compensation Committee has overall responsibility for evaluating
and approving our executive officer incentive compensation, benefit, severance, equity-based or other compensation plans, policies and programs. The Compensation Committee is also responsible for producing an annual report on executive compensation
for inclusion in this proxy statement. The Compensation Committee met two times in 2019.
The Compensation Committee is responsible for establishing a compensation policy that fairly rewards our executive officers for performance benefiting the shareholders and effectively attracts and
retains executive talent necessary to successfully lead and manage the Company. In practice, our Chief Executive Officer, John T. Taylor, is expected to present a total compensation policy for the executive management team, which the Compensation
Committee will evaluate and retains the right to modify or reject. The Compensation Committee is directly responsible for evaluating the performance of Mr. Taylor, and determining the details of his total compensation. The Committee also evaluates
Mr. Taylor’s recommendations for the salaries and incentive compensation of other named executives, which the Committee will modify and authorize as it deems appropriate.
Nominating and Corporate Governance Committee
Our Nominating and Corporate Governance Committee was comprised of Ms. Catlett, Mr. Levy, Mr. Ray, and Mr. Wycoff during the past year. Mr. Wycoff served until the annual meeting when Mr. Kooman was
elected to replace Mr. Wycoff. Our Board of Directors determined that each member of the Nominating and Corporate Governance Committee met the independence requirements of the Nasdaq corporate governance rules. The Nominating and Corporate
Governance Committee assists our Board of Directors in promoting our best interests and the best interests of our shareholders through the implementation of sound corporate governance principles and practices. In furtherance of this purpose, the
Nominating and Corporate Governance Committee identifies individuals qualified to become Board members and recommends to our Board of Directors persons to be nominated for election as directors at each annual meeting of shareholders. It also reviews
the qualifications and independence of the members of our Board of Directors and its various committees on a regular basis and makes any recommendations the Committee members may deem appropriate from time to time concerning any recommended changes
in the composition of our Board and Board Committees. The Nominating and Corporate Governance Committee met one time in 2019.
Meeting Attendance
During 2019, our Board of Directors met nine times. None of our current directors attended fewer than 75% of the meetings of the Board of Directors and the committees on which he or she served. All
directors and director nominees are expected to attend each annual meeting of shareholders, unless circumstances prevent them from doing so. Mr. Hogan, Ms. Catlett, Mr. Levy, Mr. Parsons, Mr. Ray, Dr. Seifried, Mr. Taylor, and Mr. Wycoff (8
directors), as well as Mr. Kooman attended last year’s annual meeting.
9
Board’s Role in Risk Oversight
As a bank holding company, we face a number of risks, including general economic risk, credit risk, regulatory risk, liquidity risk, interest rate risk, audit risk, reputational risk and others.
Management is responsible for the day-to-day management of risks to the Company, and the Board, as a whole and through its committees, has responsibility for the oversight of risk management. In its risk oversight role, the Board of Directors has the
responsibility to satisfy itself that the risk management processes designed and implemented by management are adequate and functioning as designed.
While the full Board of Directors is charged with ultimate oversight responsibility for risk management, various standing committees of the Board also have responsibilities with respect to our risk
oversight. In particular, the Audit Committee plays a large role in monitoring and assessing our risk related to financial reporting and accounting matters as well as any other particular areas of concern of the Board. The Board’s Compensation
Committee monitors and assesses the various risks associated with compensation policies, and oversees incentives that encourage performance subject to a level of risk-taking consistent with our overall strategy.
Code of Ethics and Conflict of Interest Policy; Trading by Insiders
Our Board has adopted a Code of Ethics and Conflict of Interest Policy that set forth important policies and procedures in conducting our business in a legal, ethical and responsible manner. The
Code of Ethics is applicable to our CEO, CFO, and all Senior Financial Officers. The Conflict of Interest Policy is applicable to all employees and directors. The Code of Ethics and the Conflict of Interest Policy are each available on our
website at www.limestonebank.com under “About Us - Investor Relations” and “Governance Documents.” We will post any amendments to, or waivers from, these policies on our website.
The CEO, CFO, and Senior Financial Officers must report any conduct they believe in good faith to be an actual or apparent violation of our Code of Ethics to the Audit Committee and violations of
our Conflict of Interest Policy are to be brought to the attention of our General Counsel. In addition, the Audit Committee has established confidential procedures to receive, retain and treat complaints received regarding accounting, internal
accounting controls, or auditing matters and the confidential, anonymous submission by company employees of concerns regarding questionable accounting or auditing matters.
The Company also has an Insider Trading Policy that provides guidelines with respect to transactions in the Company’s securities and the handling of confidential information about the Company, its
customers and other parties with which the Company does business. The Insider Trading Policy is applicable to all directors, officers and employees.
The Company’s Insider Trading and Conflict of Interest Policies prohibit directors, officers and employees from trading in the Company’s securities while in possession of material nonpublic
information relating to the Company, and from engaging in short-selling and other forms of speculative trading in the Company’s stock. Otherwise, the Company does not have anti-hedging policies or procedures and directors, officers and employees
have the ability to purchase financial instruments or otherwise engage in transactions that may have the effect of hedging or offsetting a decrease in the market value of the Company’s securities which are held by them or granted to them under the
Company’s equity compensation plans.
Stock Ownership Guidelines
Our Corporate Governance Principles require all non-employee directors to hold at least 1,000 of our shares while serving as a director of the Company. All directors are expected to be in compliance
with the stock ownership guidelines within five years of becoming a director.
Shareholder Communications with the Board of Directors
Shareholders may communicate directly to the Board of Directors in writing by sending a letter to the Board at: Limestone Bancorp Board of Directors, 2500 Eastpoint Parkway, Louisville, KY 40223.
Communications directed to the Board of Directors will be received by the Chairman and processed by the Nominating and Corporate Governance Committee when the communications concern matters related to the duties and responsibilities of the Board of
Directors.
Director Compensation
The Compensation Committee reviews Board compensation at least every two years. For 2019, each non-employee director received an annual retainer of $25,000, each committee chair received an
additional $5,000, and the Chairman of the Board received an additional $25,000. Cash compensation is paid quarterly. In addition, each non-employee director received a grant of restricted shares having a market value of $25,000, based on the
trading price of our common shares at the closing of trading on the grant date. The grant date is the first day of the month after our annual meeting of shareholders.
10
Restricted shares are common shares that may not be transferred and are subject to forfeiture during a specified period. Otherwise, restricted shares have all of the rights of common shares during
the restriction period, including the right to vote and the right to receive dividends. Restricted shares awarded to directors vest on December 31 of the year of grant. If a director ceases to serve on the Board of Directors for any reason, the
director will automatically forfeit any unvested restricted shares. In the event of a change in control, the restrictions on the transfer of the shares will end. Under the terms of the restricted share awards to non-employee directors, a change in
control means (i) the disposal of our business or the business of the Bank pursuant to a liquidation, sale of assets or otherwise, (ii) any person, group or entity acquiring or gaining ownership or control of more than 50% of our outstanding shares
or the outstanding shares of the Bank, other than any trustee or other fiduciary holding shares under any employee benefit plan, or (iii) during any period of two consecutive years, individuals who were our directors at the beginning of that period
cease to constitute a majority of the Board of Directors, unless the election of each new director was approved by at least two-thirds of the directors then still in office who were directors at the beginning of the period.
The following table shows the compensation paid to non-employee directors in 2019.
|
Name
|
Fees Earned
or Paid in Cash |
Stock
Awards (1) |
Option
Awards |
All Other
Compensation
|
Total
|
|||||||||||||||
|
W. Glenn Hogan
|
$
|
50,000
|
$
|
25,000
|
$
|
-
|
$
|
-
|
$
|
75,000
|
||||||||||
|
Celia P. Catlett
|
25,000
|
25,000
|
-
|
-
|
50,000
|
|||||||||||||||
|
W. Kirk Wycoff (2)
|
12,500
|
-
|
12,500
|
|||||||||||||||||
|
Kevin J. Kooman (2)
|
12,500
|
25,000
|
-
|
-
|
37,500
|
|||||||||||||||
|
Michael T. Levy
|
30,000
|
25,000
|
-
|
-
|
55,000
|
|||||||||||||||
|
James M. Parsons
|
30,000
|
25,000
|
-
|
-
|
55,000
|
|||||||||||||||
|
Bradford T. Ray
|
30,000
|
25,000
|
-
|
-
|
55,000
|
|||||||||||||||
|
Edmond J. Seifried
|
25,000
|
25,000
|
-
|
-
|
50,000
|
|||||||||||||||
|
(1)
|
On July 1, 2019, each non-employee director received an award of 1,646 restricted shares with a grant date fair value of $15.19 per share. The restricted shares vested on December 31, 2019. The amounts in the
Stock Awards column reflect the grant date fair value for the restricted stock awards for the fiscal year ended December 31, 2019. The assumptions used in the calculation of these amounts for awards granted in 2019 are included in Note 20
“Stock Plans and Stock-based Compensation” in the “Notes to Consolidated Financial Statements” included in our Annual Report on Form 10-K for the fiscal year ended December 31, 2019.
|
|
(2)
|
Mr. Wycoff’s fees and Mr. Kooman’s fees and restricted stock award are for the benefit of Patriot Financial Manager LP.
|
11
STOCK OWNERSHIP OF DIRECTORS, OFFICERS,
AND PRINCIPAL SHAREHOLDERS
As of April 23, 2020, Limestone Bancorp had 6,269,305 common shares and 1,220,000 non-voting common shares issued and outstanding. The information provided below is based on our records, information
filed with the SEC, and information provided to us, except where otherwise noted.
Under SEC rules, a person is deemed to beneficially own any shares as to which the entity or individual has the right to acquire within 60 days of April 23, 2019 through
the exercise of any stock option or other right. Unless otherwise indicated, each person has sole voting and investment power (or shares these powers with his or her spouse) with respect to the shares set forth in the following table.
Security Ownership of Directors and Management
The following table shows, as of April 23, 2020, the number and percentage of our shares held by (1) Limestone Bancorp’s directors and nominees, (2) each of the named executive officers set forth in
the Summary Compensation Table and (3) current directors and named executive officers as a group.
|
Name and Address of Beneficial Owner(1)
|
Common
Shares
Beneficially
Owned
|
%
of Class |
Non-Voting
Common
Shares
Beneficially
Owned
|
%
of Class
|
|||||||||||||
|
Directors and Nominees
|
|||||||||||||||||
|
John T. Taylor
|
142,816
|
2.3
|
%
|
-
|
-
|
%
|
|||||||||||
|
W. Glenn Hogan
|
464,814
|
7.4
|
-
|
-
|
|||||||||||||
|
Celia P. Catlett
|
2,993
|
*
|
-
|
-
|
|||||||||||||
|
Kevin J. Kooman (2)
|
-
|
*
|
-
|
-
|
|||||||||||||
|
Michael T. Levy
|
76,940
|
1.2
|
-
|
-
|
|||||||||||||
|
James M. Parsons
|
41,171
|
*
|
-
|
-
|
|||||||||||||
|
Bradford T. Ray
|
69,331
|
1.1
|
-
|
-
|
|||||||||||||
|
Dr. Edmond J. Seifried
|
79,415
|
1.3
|
-
|
-
|
|||||||||||||
|
Other Named Executive Officers
|
|||||||||||||||||
|
John R. Davis
|
33,271
|
*
|
-
|
-
|
|||||||||||||
|
Phillip W. Barnhouse
|
30,684
|
*
|
-
|
-
|
|||||||||||||
|
Joseph C. Seiler
|
23,779
|
*
|
-
|
-
|
|||||||||||||
|
Named Executive Officers and Directors as a Group
(11 persons)
|
965,214
|
15.4
|
%
|
-
|
-
|
||||||||||||
|
*
|
Represents beneficial ownership of less than 1%.
|
|
(1)
|
The business address for these individuals is c/o Limestone Bancorp, Inc., 2500 Eastpoint Parkway, Louisville, Kentucky 40223.
|
|
(2)
|
Mr. Kooman does not have direct ownership of LMST shares. This total does not include 12,696 common shares beneficially owned by Patriot Financial Manager, L.P. of which Mr. Kooman is a partner, or the 291,494
common shares and 1.0 million non-voting common shares held by Patriot Financial Partners III, L.P. Mr. Kooman disclaims beneficial ownership of the 304,190 common shares and the 1.0 million non-voting common shares, except to the extent of
his pecuniary interest therein. See footnote 4 to the share ownership table on the following page.
|
12
Security Ownership of Certain Beneficial Owners
The following table sets forth beneficial ownership information for each shareholder who is not a director and is known to us to own 5% or more of the outstanding shares of our common shares, based
on public filings made with the SEC, except as noted below.
|
Common Shares
|
Non-Voting Common Shares
|
|||||||||||||||
|
Name and Address of Beneficial Owner
|
Beneficially
Owned
|
Percent
of Class |
Beneficially
Owned
|
Percent
of Class |
||||||||||||
|
J. Chester Porter Trust Funds (1)
318 S. Buckman Street Shepherdsville, Kentucky 40165 |
614,727
|
9.8
|
%
|
–
|
–
|
|||||||||||
|
Maria L. Bouvette (2)
c/o Limestone Bancorp, Inc. 2500 Eastpoint Parkway Louisville, Kentucky 40223 |
463,131
|
7.4
|
%
|
–
|
–
|
|||||||||||
|
RMB Capital Management LLC (3)
115 S. LaSalle St., 34th Floor Chicago, IL 60603
|
214,688
|
3.4
|
%
|
220,000
|
18
|
%
|
||||||||||
|
Patriot Financial Group (4)
Four Radnor Corporate Center 100 Matsonford Road, Suite 210 Radnor, PA 19087 |
304,190
|
4.9
|
%
|
1,000,000
|
82
|
%
|
||||||||||
|
(1)
|
The information is included in reliance upon Form 4 filed with the SEC by Jack C. Porter, Jr and Jennifer E. Porter, Co-Trustees on October 3, 2019. J. Chester Porter Trust Fund A and J.
Chester Porter Trust Fund B (together the “J. Chester Porter Trust Funds”) are the beneficial owners of 312,587 and 296,877 common shares, respectively. Shared voting power of these funds is held by Jack C. Porter, Jr. and Jennifer E.
Porter. Mr. Porter and Ms. Porter disclaim beneficial ownership of these shares except to the extent of his or her pecuniary interest therein. In addition, Mr. Porter is the beneficial owner with sole voting power of 4,131 common shares and
Ms. Porter is the beneficial owner with sole voting power of 1,132 common shares.
|
|
(2)
|
The information is included in reliance upon Form 13D/A filed with the SEC by Maria L. Bouvette on March 26, 2020.
|
|
(3)
|
This information is included in reliance upon Form 13F filed with the SEC by RMB Capital Management LLC on February 13, 2020. RMB Capital Management LLC is the sub-adviser to the Mendon
Capital Master Fund Ltd. and investment adviser to Iron Road Multi-Strategy L.P. and Mendon Capital QP LP. Anton Schutz is a Director of RMB Capital Management LLC and may be deemed to have voting and investment power with respect to the
shares held by each of the three funds. Totals for common shares do not include non-voting common shares. Mendon Capital Master Fund Ltd is the beneficial owner of 177,420 non-voting common shares, and Mendon Capital QP LP is the beneficial
owner of 42,580 non-voting common shares. Each non-voting common share automatically converts into one voting common share upon, among other things, transfer in a widespread public distribution, including pursuant to a registration statement
filed with and declared effective by the SEC or pursuant to Rule 144 under the Securities Act.
|
|
(4)
|
This information is included in reliance upon Form 13F filed with the SEC by Patriot Financial Partners GP, LP on February 10, 2020 and Mr. Kooman’s Form 4 filed with the SEC on March 25,
2020. Includes 291,494 common shares and 1.0 million non-voting shares beneficially owned directly by Patriot Financial Partners III, L.P. (“Patriot”); 12,696 common shares beneficially owned directly by Patriot Financial Manager, L.P.
Securities owned by Patriot Financial Partners III, L.P. may be regarded as being beneficially owned by Patriot Financial Partners GP III, L.P, and Patriot Financial GP III, LLC. Mr. Kooman disclaims beneficial ownership of the shares that
Patriot beneficially owns, except to the extent of his pecuniary interest therein.
|
13
CERTAIN RELATIONSHIPS AND RELATED TRANSACTIONS
Transactions with Related Parties
Our Audit Committee has the responsibility to review and approve or ratify all transactions, other than loans and extensions of credit, between the Company and related parties, including without
limitation, fees and commissions for services, purchases or sales of assets, rental arrangements and any other financial arrangement.
As a banking institution, the Bank is not subject to Section 402 of the Sarbanes-Oxley Act of 2002, which prohibits any issuer to extend, renew or arrange for the extension of credit in the form of a
personal loan to or for any director or executive officer of that issuer. However, any such loans we make must be:
|
●
|
made in the ordinary course of our consumer credit business;
|
|
●
|
of a type we generally make available to the public; and
|
|
●
|
made on market terms, or terms that are no more favorable than those offered by the issuer to the general public.
|
We have long-standing policies and procedures governing our extension of credit to related parties in compliance with the insider lending restrictions of Section 22(h) of the Federal Reserve Act or
the Federal Reserve’s Regulation O. All loans to directors and executive officers or their affiliates are approved by the Board of Directors of Limestone Bank. As of December 31, 2019 and 2018, we had loans to our executive officers and directors,
the executive officers and directors of Limestone Bank, or the firms and corporations in which they have at least a ten percent beneficial interest totaling $12.4 million and $14.2 million, respectively.
Our officers, directors and principal shareholders and their affiliates, as well as certain of the officers and directors of the Bank and their affiliates, have conducted banking transactions with
the Bank from time to time, including investments in certificates of deposit. All such investments have been made, and will continue to be made, only in the ordinary course of business of the Bank on substantially the same terms as those prevailing
at the time for comparable transactions with unaffiliated persons and did not involve more than the normal risk of collectability or present other unfavorable features.
Transactions in Which Related Parties Have an Interest
Limestone Bank received real estate management services and sales services from Hogan Development Company, a firm in which our director, W. Glenn Hogan holds a controlling interest. This arrangement
was reviewed and evaluated by the independent members of our Audit Committee as part of the Board’s annual assessment of director independence. The Bank paid real estate management fees to Hogan Development Company of $20,000 in each of 2019 and
2018. The Bank paid no real estate commissions in 2019 or 2018 to Hogan Development Company.
On March 30, 2018, the Company completed a $14.950 million stock offering in a private placement (the “Private Placement”) to Patriot Financial Partners III, L.P. (“Patriot”), an accredited investor.
W. Kirk Wycoff, who was a director of the Company at the time of the transaction, is a managing director of Patriot Financial Partners GP III, L.P., the general partner of Patriot. The Private Placement included the sale of 150,000 common shares and
1,000,000 non-voting common shares at $13.00 per share. In connection with the Private Placement, on March 30, 2018, the Company and Patriot entered into a securities purchase agreement (the “Securities Purchase Agreement”). In addition to provisions
relating to the sale of common shares and non-voting common shares, the Securities Purchase Agreement includes several continuing covenants made by the Company as well as customary representations, warranties, and indemnities. The Company granted
Patriot gross-up rights for a period not to exceed five years to maintain its relative ownership percentage with respect to public or non-public offerings of the Company’s common shares or any securities that are convertible into the Company’s common
shares for so long as Patriot beneficially owns at least 50% or more of all securities purchased under the Securities Purchase Agreement, or 4.9% of the Company’s outstanding common shares. The gross-up rights are subject to exceptions for the
issuance of securities (i) in connection with the Company’s employee stock incentive plans or (ii) as consideration in a merger, acquisition or similar transaction.
The Securities Purchase Agreement also grants Patriot the right to nominate a director to the Board of Directors of both the Company and Limestone Bank for so long as Patriot beneficially owns at
least 50% or more of all the securities purchased under the agreement or 4.9% of the Company’s outstanding common shares. Kevin J. Kooman currently serves on the Board as Patriot’s representative. The Securities Purchase Agreement requires the
Company to recommend to the shareholders the election of the board representative of Patriot to the Board at all subsequent annual meetings of the Company, subject to all legal and governance requirements regarding service as a director of the
Company and the reasonable approval of the Nominating and Governance Committee. Patriot also has a right to have an observer attend board meetings of the Company or Limestone Bank. Pursuant to the Securities Purchase Agreement, the Company has also
entered into a VCOC (venture capital operating company) letter with Patriot regarding Patriot’s right to consult with the Company so long as it (or its affiliates) own shares of the Company acquired under the Securities Purchase Agreement.
14
On June 26, 2018, the Company completed the purchase and retirement of all of its issued and outstanding Series E and Series F Non-Voting Perpetual Preferred Shares for an aggregate price of $3.5
million paid in cash. The Series E and Series F Shares had an aggregate liquidation preference of $10.5 million. Participating sellers in the transaction, among others, were directors W. Glenn Hogan, Michael T. Levy, Dr. Edmond J. Seifried, and
Patriot Financial Partners, L.P. and Patriot Financial Partners Parallel, L.P., each affiliates of former director W. Kirk Wycoff. An independent third party financial advisory firm served as the financial advisor in this transaction to a special
committee of directors comprised of members having no interest in the repurchase transaction.
Delinquent Section 16(a) Reports
Section 16(a) of the Securities Exchange Act of 1934, as amended, requires our directors, executive officers, and persons who own more than 10 percent of our common shares, to file reports of
ownership and changes in ownership with the SEC. Directors, executive officers, and greater than 10 percent beneficial owners, referred to as “reporting persons,” are required by SEC regulations to furnish us with copies of all Section 16(a) forms
they file. Based solely on a review of the copies of such forms furnished to us, we believe that during 2019 all reporting persons complied with the filing requirements of Section 16(a), with the exception of Mr. Kooman who, upon his election as a
director, was temporarily delayed in filing his initial Form 3 and a Form 4 filing to report one transaction as he worked to obtain filer codes.
15
COMPENSATION DISCUSSION AND ANALYSIS
The Compensation Committee of our Board of Directors is responsible for developing specific policies regarding compensation of our executive officers, as well as evaluating and approving our
executive officer incentive compensation, benefit, severance, equity-based or other compensation plans, policies and programs, and implementing and administering all aspects of our benefit and compensation plans and programs. Our Compensation
Committee is currently comprised of Mr. Levy, Ms. Catlett, Mr. Kooman, Mr. Ray, and Dr. Seifried.
In 2019, all of the committee members met the independence requirements of the Nasdaq corporate governance rules and relevant federal securities laws and regulations. We did not engage compensation
consultants to assist the Compensation Committee in determining the compensation paid to our executives in 2019.
Executive Compensation Philosophy and Objectives
Our philosophy for executive compensation is to attract, retain and reward excellent executives and align their interests with the interests of our shareholders. To promote this philosophy, we have
established the following objectives:
|
●
|
provide fair and competitive compensation to executives, based on their performance and contributions to our Company, that will attract, motivate and retain individuals who will enable our Company to
successfully compete with other financial institutions in our markets;
|
|
●
|
provide incentives that reward executives for attaining predetermined objectives that promote and reward individual performance, Company financial performance, achievement of strategic goals and Company stock
performance;
|
|
●
|
instill in our executives a long-term commitment and a sense of ownership through the use of equity-based compensation; and
|
|
●
|
ensure that the interests of our executives are aligned with our shareholders’ interests.
|
Overview
We have employment agreements with each of our four named executive officers, which we updated in April 2019. The updated employment agreements are comparable to the employment agreements we entered
into with these four executives in September 2016 except we adjusted the amount of severance under each executive’s agreement to take into account his cash incentive compensation, in addition to base salary, and provide for continued health care
coverage, and increased the amount of severance payable to our Chief Financial Officer and Chief Credit Officer if their employment agreement is terminated concurrently with or within 24 months following a change in control of the Company or the Bank (as defined under Section 409A of the Internal Revenue Code and the regulations thereunder). The current employment agreements are described after the Summary Compensation Table under “Executive
Compensation” below.
To induce talented and capable individuals to join our organization, we must offer a competitive compensation package including incentive compensation. To that end, we provide an incentive
compensation program for our executive officers that provides for cash and stock incentive awards to be earned upon on the attainment of annual targeted performance goals. Stock awards typically vest over three to five years.
Executive Compensation Components
Our compensation program is comprised of three components:
|
●
|
A base salary that is competitive with levels paid by comparable financial institutions;
|
|
●
|
Annual incentive cash payments based on the attainment of targeted performance goals; and
|
|
●
|
Equity-based compensation, generally in the form of restricted stock awards, based on the attainment of targeted performance goals.
|
We provide a compensation package that is driven by our overall financial performance and is intended to be competitive with the public and non-public financial institutions in our market, thereby
enabling us to attract and retain executives who we believe are critical to our future success. The compensation strategy includes base salary compensation along with the opportunity for our CEO to earn cash incentive compensation of up to 50% of
base salary and equity incentive compensation of up to 25% of base salary and the opportunity for our other named executives to earn cash incentive compensation of up to 25% of base salary and equity incentive compensation of up to 25% of base
salary. The Committee establishes the target percentage of compensation for each of the three components at the beginning of each year.
16
Base Salary. When establishing base salaries for our executives, we consider the scope of executive responsibilities and publicly available information
concerning the compensation paid to executives with similar levels of responsibility by other comparable public and non-public financial institutions in our market. Although we do not attempt to set the salaries of our executives to fall within a
certain percentage range compared to the salaries paid by other comparable institutions, we consider compensation data from comparable institutions to satisfy ourselves that the compensation we pay is competitive and sufficient to recruit and retain
the talented employees our business depends upon to be successful.
The Committee reviewed 2018 publicly available national peer group data as compiled by SNL Financial in its 2019 Executive Compensation Review, the most recent data available, to ensure that our base
salaries, and our incentive compensation that is determined as a percentage of base salary, were competitive with comparable financial institutions. The publicly available data showed base salary and total compensation, which included base salary,
annual bonus, other annual compensation, restricted stock awards, performance units and other compensation paid due to long-term incentive plans. The peer groups were: (i) the 15 financial institutions in the Midwest with assets of $500 million to
$1 billion, and (ii) the 50 financial institutions in the Midwest with assets of $1 billion to $5 billion. As of December 31, 2019, the Company had total assets of approximately $1.246 billion. Average assets for 2019 were approximately $1.112
billion and average assets for 2018 were approximately $1.026 billion.
The following table shows the median base salary for 2018 paid to chief executive officers, chief financial officers, chief credit officers, and senior
lending officers of the two peer groups described above:
|
Position
|
Median Base Salary of Midwest Financial Institutions with Assets of $500 million to $1 billion
|
Median Base Salary of Midwest Financial Institutions with Assets of $1 billion to $5 billion
|
||||||
|
CEO
|
$
|
308,000
|
$
|
436,500
|
||||
|
CFO
|
192,493
|
244,616
|
||||||
|
CCO
|
181,833
|
233,300
|
||||||
|
SLO
|
178,833
|
240,122
|
||||||
The following table shows the median total compensation for 2018 paid to chief executive officers, chief financial officers, chief operating officers, chief
credit officers, and senior lending officers of the two peer groups described above:
|
Position
|
Median Total Compensation of Midwest Financial Institutions with Assets of $500 million to $1 billion
|
Median Total Compensation of Midwest Financial Institutions with Assets of
$1 billion to $5 billion |
||||||
|
CEO
|
$
|
448,944
|
$
|
914,419
|
||||
|
CFO
|
303,477
|
395,459
|
||||||
|
CCO
|
294,355
|
419,942
|
||||||
|
SLO
|
235,739
|
421,708
|
||||||
Cash and Equity Incentives. The cash and equity incentive plan awards cash and equity bonuses based on a weighted scoring of Company performance metrics
across a range of pre-determined targets. The five metrics are financial ratios customarily used to evaluate the performance of banks: net income, loan growth, non-interest expense control, core deposit growth, and asset quality. Equity incentive
awards are generally granted between February and June each year when our financial results are final and we have all the data necessary to make the calculations. The Compensation Committee retains the discretion to assess our performance results and
make adjustments it deems appropriate.
For 2019, the Compensation Committee set the maximum incentive compensation for our CEO at a maximum cash bonus of 50% of base salary and a maximum equity bonus at 25% of base salary. The Committee
set the maximum incentive compensation for our other named executive officers at a maximum cash bonus at 25% of base salary and a maximum equity bonus at 25% of base salary.
The incentive compensation earned under our incentive plan is a function of the weighted percentage allocated to each of five financial metrics for the Bank’s performance. The weighted percentages
for 2019 were as follows: (i) pre-tax net income – 30%; (ii) loan growth – 15%; (iii) efficiency ratio – 15%; (iv) core deposit growth – 30%; and (v) the ratio of classified assets to capital – 10%. For each metric, a range of results is
established, with a threshold level required to earn 25% of the weighted percentage and a level at which the entire weighted percentage would be earned. The sum of the resulting percentages is then multiplied against the maximum cash and equity
bonus amounts. The following table shows the performance range from threshold to maximum incentive for each of the five metrics for 2019, as well as the results attained in 2019.
17
|
Metric (dollar amounts in millions)(1)
|
Threshold
|
Maximum
|
2019 Results
|
|||
|
Pre-tax net income
|
> $13.25
|
$15.5
|
$13.8
|
|||
|
Loans
|
> $870.0
|
$900.0
|
$926.3
|
|||
|
Efficiency ratio
|
< 64.7%
|
63.2%
|
67.8%
|
|||
|
Core deposits
|
> $457.6
|
$502.6
|
$555.1
|
|||
|
Classified assets to capital
|
< 18%
|
12%
|
12.5%
|
| (1) |
Excludes gain on sale of securities, other than temporary impairment charges and non-recurring items as determined at the discretion of the Compensation Committee.
|
For 2019, the Compensation Committee determined that our CEO qualified to receive cash and equity incentive compensation equal to 30% and 15% of base salary, respectively, and that our three named
executive officers qualified to receive cash compensation ranging from 15.1% to 19.6% and equity incentive compensation equal to 15.1% to 19.6% of base salary, respectively. In determining the incentive compensation for the three named executive
officers reporting to Mr. Taylor, the Committee exercised its discretion to increase the cash and equity incentive from 15.0% as achieved in the 2019 plan to 19.6% for Mr. Davis, 15.1% for Mr. Seiler, and 15.1% for Mr. Barnhouse based upon Mr.
Taylor’s performance recommendations.
For 2020, the Compensation Committee set the maximum cash incentive award at 50% of base salary for our CEO and at 25% of base salary for our other named executive officers. It set the maximum equity
award at 25% of base salary for both the CEO and the other named executives. The incentive compensation for 2020 will be a function of the weighted percentage allocated to each of five financial metrics for the Bank’s performance. The weighted
percentages for 2020 are as follows: (i) pre-tax net income – 30%; (ii) loan growth – 15%; (iii) efficiency ratio – 5%; (iv) core deposit growth – 40%; and (v) the ratio of classified assets to capital – 10%.
|
Metric (dollar amounts in millions)(1)
|
Threshold
|
Maximum
|
|||
|
Pre-tax net income
|
> $16.55
|
$18.80
|
|||
|
Loans
|
> $1,030.0
|
$1,060.0
|
|||
|
Efficiency ratio
|
< 63.0%
|
61.5%
|
|||
|
Core deposits
|
> $554.2
|
$599.2
|
|||
|
Classified assets to capital
|
< 18%
|
12%
|
| (1) |
Excludes gain on sale of securities, other than temporary impairment charges and non-recurring items as determined at the discretion of the Compensation Committee.
|
Other Benefits
401(k) Plan. All of our full and part-time employees, including our named executive officers, are eligible to participate in our 401(k) Plan after 90 days of
employment. Employees may contribute a portion of their compensation up to the limitations imposed by federal tax laws. In 2019, the Company matched 100% of the first 1% of compensation and 50% of the next 5% contributed by employees. We have the
discretion to make an additional contribution each plan year. No discretionary contributions were made in 2019.
Compensation Risk Assessment
The Compensation Committee evaluates annually whether the Company’s compensation policies and practices could create risks that are reasonably likely to have a material adverse effect on the
Company. As part of its assessment, the Committee reviews its previously established compensation objectives, which are:
|
●
|
Incentive compensation must be sufficiently competitive to attract and retain talented employees who can contribute to the Company's future success;
|
|
●
|
Compensation should be allocated among equity and cash incentives based on the specific role of the employee. A significant portion of compensation should be performance-based for higher levels of
responsibility;
|
|
●
|
A significant portion of senior level compensation should be equity grants with multi-year vesting periods that align the interests of our senior officers with the interests of shareholders;
|
18
|
●
|
Performance measures should not be so difficult to achieve that they fail to provide an adequate incentive for the employee to perform, and the metrics should be measurable and enforceable; and
|
|
●
|
Performance measures should be tailored to encompass performance of both individuals and business units, considering business objectives and other factors such as revenue production, expertise, compliance
with corporate policies, and leadership.
|
The Compensation Committee then identifies and evaluates possible risks that might arise from the Company’s current compensation policies and practices. These considerations include:
|
●
|
Whether incentive features could encourage the manipulation of reported earnings to increase compensation;
|
|
●
|
Whether incentive features could encourage a lender to promote a loan transaction that is not in the Company’s best interest and could result in the borrower subsequently becoming insolvent or otherwise
unable to meet its financial obligations;
|
|
●
|
Whether compensation policies appropriately encourage the identification and correction of possible weaknesses in operations, data security and internal controls or systems;
|
|
●
|
Whether compensation policies appropriately emphasize compliance with legal rules, regulations or guidelines issued by banking regulators;
|
|
●
|
Whether compensation practices could expose the Company and the Board to criticism from regulators, shareholders, customers and the public and risk opposition to proposals regarding executive compensation
and/or share availability; and
|
|
●
|
Whether compensation policies create risks that could endanger the Company's existence as an ongoing enterprise.
|
In its most recent review, the Compensation Committee concluded that the Company’s current compensation policies and practices did not create undue risks for a community bank of its size whose
principal source of revenue is net interest income. The performance measures used for senior management include incentives to encourage growth in core deposits and quality loan production, as well as incentives for reducing classified assets to
encourage prudent banking practices. The Compensation Committee also reviews and adjusts the performance measures and their relative weighting annually, based on the Company’s financial condition and the past year’s results, strategic planning,
market conditions and trends in the current banking environment.
19
COMPENSATION COMMITTEE REPORT
Limestone Bancorp’s Compensation Committee has reviewed and discussed the Compensation Discussion and Analysis required by Item 402(b) of Regulation S-K with management and, based on such review
and discussions, has recommended to the Board that the foregoing Compensation Discussion and Analysis disclosure be included in this proxy statement.
The Compensation Committee
Michael T. Levy, Chairman
Celia P. Catlett
Kevin J. Kooman
Bradford T. Ray
Dr. Edmond J. Seifried
20
EXECUTIVE COMPENSATION
The following table discloses the compensation received by Limestone Bancorp’s Chief Executive Officer, Chief Financial Officer, and the other most highly paid executive officers (these four
individuals are referred to as the “named executive officers”) during the year ended December 31, 2019.
Summary Compensation Table
|
Name and
Principal
Position
|
Year
|
Salary
|
Stock
Award(1)
|
Non-Equity
Incentive Plan
Compensation(2)
|
Change in
Nonqualified
Deferred
Compensation
Earnings(3)
|
All Other
Compensation(4)
|
Total
|
||||||||||||||||||||
|
John T. Taylor
President and
CEO
|
2019
2018
2017
|
$
|
425,000
425,000
412,019
|
$
|
63,750
43,860
66,428
|
$
|
127,500
133,000
132,855
|
$
|
-
-
-
|
$
|
15,094
14,170
7,332
|
$
|
631,344
616,030
618,634
|
||||||||||||||
|
John R. Davis
Chief Credit
Officer
|
2019
2018
2017
|
255,000
255,000
253,654
|
50,000
26,316
45,000
|
50,000
46,000
45,000
|
-
-
-
|
14,546
13,622
6,852
|
369,546
340,938
350,506
|
||||||||||||||||||||
|
Joseph C. Seiler
Head of
Commercial Banking
|
2019
2018
2017
|
244,800
244,800
243,508
|
37,000
25,263
45,000
|
37,000
42,000
45,000
|
-
-
-
|
13,020
11,717
6,748
|
331,820
323,780
340,256
|
||||||||||||||||||||
|
Phillip W. Barnhouse
Chief Financial
Officer
|
2019
2018
2017
|
244,800
244,800
243,508
|
37,000
25,263
45,000
|
37,000
49,000
45,000
|
-
14,764
24,579
|
12,528
11,428
7,035
|
331,328
345,255
365,122
|
||||||||||||||||||||
|
|
|
(1)
|
Includes restricted stock granted as equity incentive compensation on June 1, 2018, February 13, 2019, and February 13, 2020 based on prior year financial results.
The grant date fair value for the June 1, 2018 stock awards was $13.93 per share, for the February 13, 2019 stock awards was $14.53, and for the February 13, 2020 stock awards was $17.03 per share.
|
|
(2)
|
Our cash and equity incentive plan is discussed in further detail under “Compensation Discussion and Analysis -- Executive Compensation Components -- Cash and Equity
Incentives.”
|
|
(3)
|
The amounts reflect the increase in the present value of Supplemental Executive Retirement Benefit accrual from the previous year for the named executive officer’s
benefit. Plan was terminated effective January 31, 2018.
|
|
(4)
|
All other compensation for the named executive officers is set forth below:
|
|
Name
|
Vehicle
Allowance
|
401(k)
Matching
Contribution
|
H S A
Matching
Contribution
|
Life & LTD Premiums Paid for Benefit of Employee
|
Total Other
Compensation
|
|||||||||||||||
|
John T. Taylor
|
$
|
-
|
$
|
9,800
|
$
|
1,000
|
$
|
4,294
|
$
|
15,094
|
||||||||||
|
John R. Davis
|
-
|
9,800
|
1,000
|
3,746
|
14,546
|
|||||||||||||||
|
Joseph C. Seiler
|
-
|
8,720
|
1,000
|
3,300
|
13,020
|
|||||||||||||||
|
Phillip W. Barnhouse
|
-
|
9,800
|
1,000
|
1,728
|
12,528
|
|||||||||||||||
Employment Agreements
We entered into new employment agreements with our named executive officers on April 24, 2019, which updated and replaced their existing employment agreements dated September 21, 2016. The terms of
the employment agreements with our named executive officers are summarized below.
Term. Each of the employment agreements has an initial
three-year term, subject to extension and early termination. On each anniversary of the date of the agreement, the term of the agreement will be extended for an additional one year unless we or the executive elect not to extend the term by providing
written notice not less than 30 days before the anniversary date. If notice of election not to renew is provided, the agreement will terminate at the conclusion of its remaining term.
21
Base salary. The initial
annual base salaries of our executive officers are shown below:
|
John T. Taylor
|
$
|
425,000
|
|||
|
John R. Davis
|
255,000
|
||||
|
Joseph C. Seiler
|
244,800
|
||||
|
Phillip W. Barnhouse
|
244,800
|
The Board of Directors may increase an executive’s base salary from time to time, but may only decrease it with his express written consent. At its January 2020 meeting, the compensation committee
approved increases in the annual base salary for Mr. Taylor to $433,500, for Mr. Davis to $260,000, for Mr. Seiler to $250,000, and for Mr. Barnhouse to $250,000.
Incentive Compensation. The named executives are eligible to receive cash and equity incentive compensation as described in “Compensation Discussion and Analysis -- Executive Compensation Components – Cash and Equity Incentives.” Mr. Taylor’s employment agreement assures him of the opportunity to earn annual cash incentive compensation
of up 50% of his base salary.
Termination of employment. The employment agreements provide
that if the executive’s employment is terminated for one of the following reasons, he will have no right to compensation or other benefits for any period after the date of termination:
|
●
|
termination for “Cause”;
|
|
●
|
as a result of disability, retirement or death; or
|
|
●
|
by the executive other than for “Good Reason.”
|
The executive will be entitled to a cash severance payment and payment of the premiums for up to 12 months of continued health insurance coverage for the executive and his dependents if the
executive’s employment is terminated for one of the following reasons:
|
●
|
by the Company other than for Cause, disability, retirement or death;
|
|
●
|
by the executive for Good Reason; or
|
|
●
|
by the Company for other than Cause, disability, retirement or death within six months following the expiration of the term of the agreement.
|
The amount of the cash severance payment is based on the executive’s average annual base salary for the calendar year in which his employment is terminated and the 2 preceding years and his average
cash incentive compensation for the 3 calendar years immediately preceding termination of employment. For Mr. Seiler, the cash severance payment would equal one times the executive’s average annual base salary and cash incentive compensation. For
Messrs. Taylor, Davis and Barnhouse, the amount of the cash severance would be one times his average base salary and cash incentive compensation if the termination is not concurrent with or within 24 months after a Change in Control. If the
termination were concurrent with or within 24 months after a Change in Control, then Mr. Taylor’s severance payment would be 2.99 times his average annual base salary and cash incentive compensation, and Messrs. Davis’s and Barnhouse’s severance
payment would be 2 times his average base salary and cash incentive compensation.
The employment agreements define “Change in Control” as a change in the ownership of the Company or the Bank, a change in the effective control of the Company or the Bank or a change in the ownership
of a substantial portion of the assets of the Company or the Bank, in each case as provided under Section 409A of the Internal Revenue Code and the regulations thereunder, except that a change in ownership of less than 50% of the assets of the
Company or the Bank will not constitute a “Change in Control” under the employment agreements.
The obligation of the Company and the Bank to pay the severance amount is subject to several conditions, including the executive’s execution of a general release of claims, and the Company and the
Bank have the right to claw-back compensation which is subject to recovery under any law, government regulation or stock exchange listing requirement.
In the event that any of the payments or benefits provided under the employment agreement or otherwise would constitute an “excess parachute payment” as defined in Section 280G of the Internal
Revenue Code, the payments or benefits under the employment agreements will be reduced by the amount necessary to avoid treatment as an “excess parachute payment.”
22
The employment agreements define “Cause” as termination because of personal dishonesty, incompetence, willful misconduct, breach of fiduciary duty involving personal profit, intentional failure to
perform stated duties, willful violation of any law, rule or regulation (other than traffic violations or similar offenses) or final consent or cease-and-desist order or material breach of any provision of the agreement.
“Good Reason” is defined as any material change in the Metro Louisville or Metro Lexington, Kentucky location at which the executive must perform his services or any material breach of the employment
agreement by the Company and the Bank, including:
|
●
|
a material diminution in the executive’s base salary or opportunity to earn cash incentive compensation (as a percentage of base salary),
|
|
●
|
a material diminution in his authority, duties or responsibilities (including, in the case of Mr. Taylor, his position as Chairman of the Board of the Bank), or
|
|
●
|
any change in the executive’s reporting duties.
|
Prior to any termination for Good Reason, the executive must provide written notice within 90 days of the initial existence of the condition, and the Company and the Bank will have the right to
remedy the condition within 30 days of receipt.
Restrictive covenants. The employment agreements include
covenants not to solicit the employees and customers of the Company or the Bank and, in the case of Messrs. Taylor, Davis and Barnhouse, covenants not to compete with the Company and the Bank for a period of 12 months after termination of
employment. The agreements also include covenants to maintain the confidentiality of the confidential information of the Company and the Bank other than in the course of performing services for them.
Grants of Plan-Based Awards
The following table details all non-equity and equity awards granted in 2019 under our incentive compensation plan to each of the officers named in the “Summary
Compensation Table”.
Equity grants are issued under the Limestone Bancorp, Inc. 2018 Omnibus Equity Compensation Plan. Although the Plan authorizes both stock options and restricted stock grants, the Company currently
awards only restricted stock. The criteria for earning cash and restricted stock awards are more fully described in “Compensation Discussion and Analysis.”
|
|
Grant
|
Estimated
Possible Payouts
Under Non-Equity Incentive Plan Awards (1) |
Estimated
Possible Payouts
Under Equity Incentive Plan Awards (1,2) |
All Other Stock Awards: Number of Shares of Stock
|
Grant Date Fair Value of Stock
|
||||||||||||||||||||
| Name | Date | Threshold |
Maximum
|
Threshold | Maximum | or Units | Awards (2) | ||||||||||||||||||
|
John T. Taylor
|
2/13/19
|
$
|
5,313
|
$
|
212,500
|
184
|
7,312
|
n/a
|
$
|
43,860
|
|||||||||||||||
|
John R. Davis
|
2/13/19
|
1,607
|
63,750
|
111
|
4,387
|
n/a
|
26,316
|
||||||||||||||||||
|
Joseph C. Seiler
|
2/13/19
|
1,542
|
61,200
|
106
|
4,212
|
n/a
|
25,263
|
||||||||||||||||||
|
Phillip W. Barnhouse
|
2/13/19
|
1,542
|
61,200
|
106
|
4,212
|
n/a
|
25,263
|
||||||||||||||||||
|
|
|
|
(1)
|
Under our incentive plan for 2019, the maximum cash incentive award and the maximum equity incentive award that the named executive officers (other than Mr. Taylor) can earn are each 25% of base salary
based upon the attainment of the highest level for all five financial metrics. Mr. Taylor can earn a maximum cash incentive award of 50% of base salary and the maximum equity incentive award of 25% of base salary. The threshold cash and
equity incentive award represents attainment of only the minimum level for the lowest weighted financial metric.
|
|
(2)
|
The grant date fair value for the February 13, 2019 stock awards was $14.53 per share.
|
23
Outstanding Equity Awards at Fiscal Year-End
The following table shows outstanding stock awards at December 31, 2019. None of our named executive officers had outstanding options as of that date.
|
Stock Awards
|
||||||||||||||||
|
Name
|
Number of
Shares or
Units
of Stock that
Have Not Vested
|
Market Value
of Shares or
Units of Stock
That Have Not
Vested (5)
|
Equity Incentive
Plan Awards: Number of Unearned Shares, Units or Other Rights That Have Not Vested |
Equity Incentive
Plan Awards: Market or Payout Value of Unearned Shares, Units or
Other Rights
That Have
Not Vested (5)
|
||||||||||||
|
John T. Taylor
|
n/a
|
n/a
|
1,159
|
(1)
|
$
|
20,862
|
||||||||||
| 1,412 | (2) | 25,416 | ||||||||||||||
| 3,179 | (3) | 57,222 | ||||||||||||||
|
3,019
|
(4)
|
54,342
|
||||||||||||||
|
John R. Davis
|
n/a
|
n/a
|
726
|
(1)
|
13,068
|
|||||||||||
|
1,323
|
(2)
|
23,814
|
||||||||||||||
| 2,153 | (3) | 38,754 | ||||||||||||||
| 1,811 | (4) | 32,598 | ||||||||||||||
|
Joseph C. Seiler
|
n/a
|
n/a
|
711
|
(1)
|
12,798
|
|||||||||||
|
1,271
|
(2)
|
22,878
|
||||||||||||||
| 2,153 | (3) | 38,754 | ||||||||||||||
| 1,739 | (4) | 31,302 | ||||||||||||||
|
Phillip W. Barnhouse
|
n/a
|
n/a
|
695
|
(1)
|
12,510
|
|||||||||||
|
1,271
|
(2)
|
22,878
|
||||||||||||||
| 2,153 | (3) | 38,754 | ||||||||||||||
| 1,739 | (4) | 31,302 | ||||||||||||||
|
(1)
|
Restricted shares granted on June 1, 2016. One-third of the shares vest on the second anniversary date of grant and one-third on each of the next two anniversary dates of the grant.
|
|
(2)
|
Restricted shares granted on March 22, 2017. One-third of the shares vest over three years on each anniversary date of the grant.
|
|
(3)
|
Restricted shares granted on June 1, 2018. One-third of the shares vest over three years on each anniversary date of the grant.
|
|
(4)
|
Restricted shares granted on February 13, 2019. One-third of the shares vest over three years on each anniversary date of the grant.
|
|
(5)
|
Based on the $18.00 per share closing price of Limestone Bancorp, Inc. common shares on December 31, 2019.
|
Stock Vested and Options Exercised
The following table shows stock awards that vested during 2019. None of our named executive officers hold stock options.
|
Stock Awards
|
|||||||||
|
Name
|
Number of Shares
Acquired on Vesting (1) |
Value Realized
on Vesting (2) |
|||||||
|
John T. Taylor
|
32,494
|
$
|
487,002
|
||||||
|
John R. Davis
|
13,794
|
$
|
206,543
|
||||||
|
Joseph C. Seiler
|
10,725
|
$
|
160,521
|
||||||
|
Phillip W. Barnhouse
|
9,710
|
$
|
145,297
|
||||||
|
(1)
|
One-third of the restricted shares awarded in each of 2015, 2016, 2017 and 2018 vested on the anniversary date of grant in 2019.
|
|
(2)
|
Value realized on vesting is based on the Nasdaq closing price per share of LMST common stock on each vesting date in 2019.
|
24
Pension Benefits
The Company currently does not provide pension benefits.
Potential Payments upon Termination or Change-in-Control
The employment agreements with each of our executive officers provide that the executive would currently be entitled to receive a lump sum cash severance payment upon termination of employment other
than for Cause or due to retirement, death or disability, as described above under Employment Agreements – Termination of Employment.
The market value of unvested restricted shares held by our executive officers as of December 31, 2019, which shares would vest upon a change-in-control of the Company, is shown in the table under “Outstanding Equity Awards at Fiscal Year-End,” above.
Except for the benefits described in this section and as described above under Employment Agreements – Termination of Employment, and the automatic vesting
of outstanding restricted stock upon a change of control, we have no agreements or understandings with our executive officers that provide for payments upon termination of employment or a change-in-control of our Company.
25
PROPOSAL 2: ADVISORY VOTE ON EXECUTIVE COMPENSATION
Our compensation policies and decisions are designed to promote the Company’s business strategies and the interests of its shareholders by providing incentives needed to attract, motivate and retain
key executives who are critical to our long-term success as a financial institution.
We urge shareholders to read the “Compensation Discussion and Analysis” section of this proxy statement, which discusses how our compensation design and practices reflect our compensation philosophy.
The Compensation Committee and the Board of Directors believe that its compensation design and practices are effective in implementing the Company’s strategic goals and business strategies.
We are required to submit a proposal to shareholders for a (non-binding) advisory vote to approve the compensation of our named executive officers pursuant to Section 14A of the Securities Exchange
Act of 1934. This proposal, commonly known as a “say-on-pay” proposal, gives our shareholders the opportunity to express their views on the compensation of the named executive officers. This vote is not intended to address any specific item of
compensation, but rather the overall compensation of our named executive officers and the compensation practices described in this proxy statement. At our 2015 annual meeting of shareholders, shareholders approved holding this advisory vote every
year. Accordingly, the following resolution is submitted for shareholder vote at the 2020 Annual Meeting:
“RESOLVED, that the shareholders of Limestone Bancorp, Inc. approve, on an advisory basis, the compensation of its named executive officers as disclosed in the proxy statement for
the 2020 Annual Meeting, including the Summary Compensation Table and the Compensation Discussion and Analysis set forth in that proxy statement and other related tables and disclosures.”
As this is an advisory vote, the result will not be binding on the Company, the Board of Directors or the Compensation Committee, although the Compensation Committee will consider the outcome of the
vote when evaluating the compensation program. Proxies submitted to us without instructions will be voted “FOR” the approval of the compensation of the Company’s named executive officers, as disclosed in this proxy statement.
The Board of Directors recommends that shareholders vote “FOR” the approval, on an advisory basis, of the compensation of its named executive officers, as disclosed in this proxy
statement.
26
PROPOSAL 3: RATIFICATION OF APPOINTMENT
OF INDEPENDENT REGISTERED PUBLIC ACCOUNTING FIRM
On the recommendation of the Audit Committee, our Board of Directors engaged Crowe LLP (“Crowe”) as its independent registered public accounting firm for the fiscal year ending December 31, 2020 and
further directed that the selection of Crowe be submitted for ratification by the shareholders at the Annual Meeting. The Board of Directors and the Audit Committee of the Board of Directors will reconsider that appointment if it is not ratified by
the shareholders. The appointment will be deemed ratified if votes cast in favor of ratification at the Annual Meeting exceed votes cast against it. Abstentions will not be counted as votes cast either for or against the appointment.
We have been advised by Crowe that neither it nor any of its associates has any relationship with us or our subsidiaries other than the usual relationship that exists between independent certified
public accountants and clients. Crowe will have one or more representatives at the Annual Meeting who will have an opportunity to make a statement, if they so desire, and will be available to respond to appropriate questions.
The Board of Directors recommends that you vote “FOR” the ratification of the appointment of Crowe LLP as the Company’s independent registered public accounting firm for the fiscal
year ending December 31, 2020.
27
REPORT OF THE AUDIT COMMITTEE OF THE BOARD OF DIRECTORS
The Audit Committee of the Board of Directors is comprised of five directors, each of whom the Board has determined to be an independent director as defined by the NASDAQ corporate governance rules.
The duties of the Audit Committee are summarized under “Committees of the Board” and are more fully described in the Audit Committee charter adopted by the Board of Directors.
It is the responsibility of management to prepare the consolidated financial statements and the responsibility of Crowe LLP, Limestone Bancorp’s independent registered public accounting firm, to
audit the consolidated financial statements in accordance with the United States generally accepted auditing standards.
In connection with its review of Limestone Bancorp’s consolidated financial statements for 2019, the Audit Committee:
|
●
|
has reviewed and discussed the audited consolidated financial statements with management;
|
|
●
|
has discussed with the independent auditors the matters required to be discussed by the applicable requirements of the Public Company Accounting Oversight Board (“PCAOB”) and the
Securities and Exchange Commission;
|
|
●
|
has received the written disclosures and the letter from the independent accountant required by applicable requirements of the Public Company Accounting Oversight Board regarding the independent accountant’s
communications with the Audit Committees concerning independence, and has discussed with the independent accountant, the independent accountant’s independence; and
|
|
●
|
has approved the audit and non-audit services of the independent registered public accounting firm for 2019.
|
Based upon the review and discussions referred to in the preceding paragraph, the Audit Committee recommended to the Board of Directors that the audited consolidated financial statements for 2019 be
included in Limestone Bancorp’s Annual Report on Form 10-K for the year ended December 31, 2019, for filing with the Securities and Exchange Commission.
Members of the Audit Committee:
James M. Parsons, Chairman
Celia P. Catlett
Kevin J. Kooman
Michael T. Levy
Bradford T. Ray
28
PRINCIPAL ACCOUNTANT FEES AND SERVICES
Engagement of Independent Auditors
At its meeting held on April 24, 2019, the Audit Committee selected Crowe LLP to serve as Limestone Bancorp’s independent registered public accounting firm and auditors for the fiscal year ending
December 31, 2019. Crowe LLP or its predecessor has served as Limestone Bancorp’s independent registered public accounting firm since 1998. Crowe LLP representatives are expected to attend the Annual Meeting and will be available to respond to
appropriate shareholder questions and will have the opportunity to make a statement if they desire to do so.
Fees Incurred by Limestone Bancorp for Crowe LLP
The following table presents fees for professional services rendered by Crowe LLP for the audit of the Company’s annual financial statements for 2019
and 2018 and fees billed for audit-related services, tax services, and all other services rendered by Crowe LLP for 2019 and 2018.
|
2019
|
2018
|
|||||||
|
Audit Fees
|
$
|
245,000
|
$
|
275,000
|
||||
|
Audit-Related Fees
|
53,638
|
54,447
|
||||||
|
Tax Fees
|
42,250
|
47,475
|
||||||
|
All Other Fees
|
2,981
|
5,597
|
||||||
As defined by the SEC, (i) “audit fees” are fees for professional services rendered by the Company’s principal accountant for the audit of the Company’s annual financial statements and review of
financial statements included in the Company’s Form 10-Q, or for services that are normally provided by the accountant in connection with statutory and regulatory filings or engagements for those fiscal years; (ii) “audit-related fees” are fees for
assurance and related services by the Company’s principal accountant that are reasonably related to the performance of the audit or review of the Company’s financial statements and are not reported under “audit fees”; (iii) “tax fees” are fees for
professional services rendered by the Company’s principal accountant for tax compliance, tax advice, and tax planning; and (iv) “all other fees” are fees for products purchased from the Company’s principal accountant, other than the services reported
under “audit fees,” “audit-related fees,” and “tax fees.” The “all other fees” reported in the above table represent fees paid for products purchased from the Company’s principal accountant. The Audit Committee approved all of the services provided
by the Company’s principal accountant in each of the categories shown in the above table.
Under applicable SEC rules, the Audit Committee is required to pre-approve the audit and non-audit services performed by the independent auditors in order to ensure that they do not impair the
auditors’ independence. The SEC’s rules specify the types of non-audit services that an independent auditor may not provide to its audit client and establish the Audit Committee’s responsibility for administration of the engagement of the independent
auditors.
Consistent with the SEC’s rules, the Audit Committee Charter requires that the Audit Committee review and pre-approve all audit services and permitted non-audit services provided by the independent
auditors to us or any of our subsidiaries. The Audit Committee may delegate pre-approval authority to a member of the Audit Committee and if it does, the decisions of that member must be presented to the full Audit Committee at its next scheduled
meeting.
SHAREHOLDER PROPOSALS AND NOMINATIONS
In order for a shareholder proposal to be brought before Limestone Bancorp’s 2021 Annual Meeting of Shareholders, the written proposal must be received by the Corporate Secretary of Limestone
Bancorp at the address below no later than December 31, 2020. A notice submitted after that date will be considered untimely. In order for a shareholder proposal to be considered for inclusion in our proxy statement for the 2021 Annual Meeting,
the notice of a proposed item of business must provide information as required in our bylaws which, in general, require that the notice include for each matter a brief description of the matter to be brought before the meeting; the reason for
bringing the matter before the meeting; your name, address, and number of shares you own; and any material interest you have in the proposal. The proposal will also need to comply with the SEC’s regulations under Rule 14a-8 regarding the inclusion
of shareholder proposals in Company sponsored proxy materials. Proposals should be addressed to:
Limestone Bancorp, Inc.
Attn: Corporate Secretary
2500 Eastpoint Parkway
Louisville, Kentucky 40223
29
If you want to nominate a person for election as a director, you must provide written notice to the Corporate Secretary at the address above. The Corporate Secretary must receive this notice no later than December 31,
2020. The notice of a proposed director nomination must provide information as required in our bylaws which, in general, require that the notice of a director nomination include your name, address and a representation that you are a shareholder and
entitled to vote for directors; the information that would be required to be disclosed in the solicitation of proxies for the election of a director under federal securities laws. You must submit the nominee’s consent to be elected and to serve. A
copy of the bylaw requirements will be provided upon request made to the Corporate Secretary at the address above.
AVAILABLE INFORMATION
We file reports with the SEC including our annual report on Form 10−K, quarterly reports on Form 10−Q, current reports on Form 8−K and proxy statements, as well as any amendments to those reports.
The SEC maintains an internet site that contains reports, proxy and information statements and other information regarding issuers that file electronically with the SEC at http://www.sec.gov.
Our annual report on Form 10−K, quarterly reports on Form 10−Q, current reports on Form 8−K, and amendments to those reports filed or furnished pursuant to Section 13(a) or 15(d) of the Exchange Act
are accessible at no cost on our website at http://www.limestonebank.com, under the Investors Relations section, once they are electronically filed with or furnished to the SEC. Click on “Investor Relations” under the “About Us” tab and then
“SEC Filings” under “Documents.”
Shareholders and prospective investors may request a written copy of our 2019 Annual Report on Form 10-K by writing to Investor Relations - Limestone Bancorp, Inc., 2500 Eastpoint Parkway,
Louisville, Kentucky 40223.
Solicitation of Proxies
Limestone Bancorp will pay the cost of soliciting proxies. Proxies may be solicited on behalf of Limestone Bancorp by directors, officers or employees by mail, in person or by telephone, facsimile or other electronic
means.
30