JULY 2025 Committed to Maximizing Value for All Shareholders
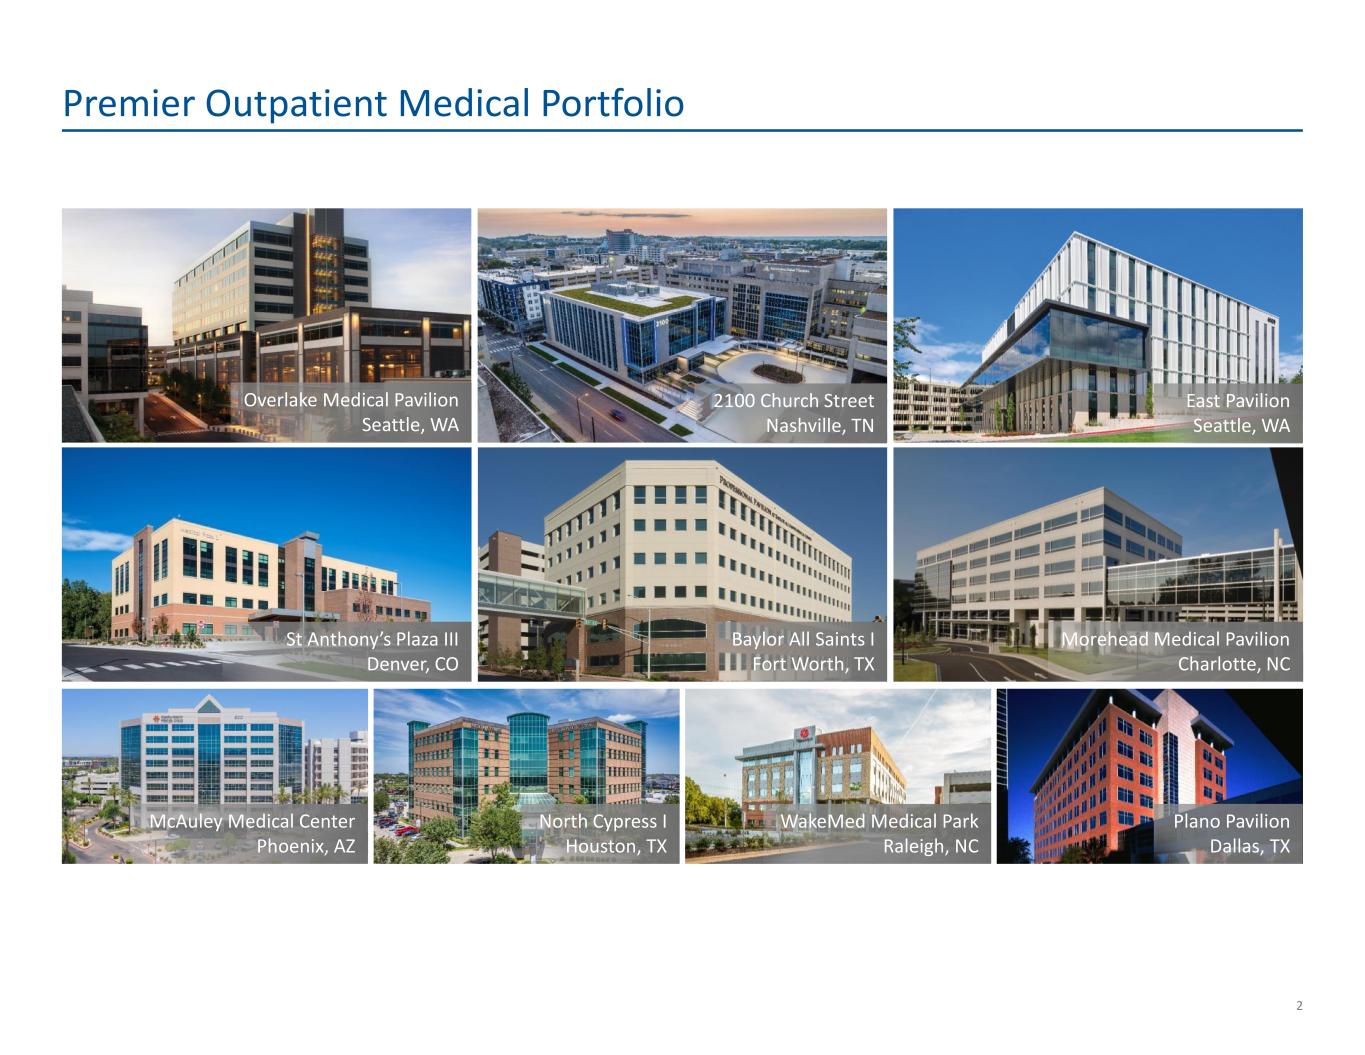
2 Premier Outpatient Medical Portfolio Overlake Medical Pavilion Seattle, WA 2100 Church Street Nashville, TN East Pavilion Seattle, WA St Anthony’s Plaza III Denver, CO Baylor All Saints I Fort Worth, TX Morehead Medical Pavilion Charlotte, NC McAuley Medical Center Phoenix, AZ North Cypress I Houston, TX WakeMed Medical Park Raleigh, NC Plano Pavilion Dallas, TX
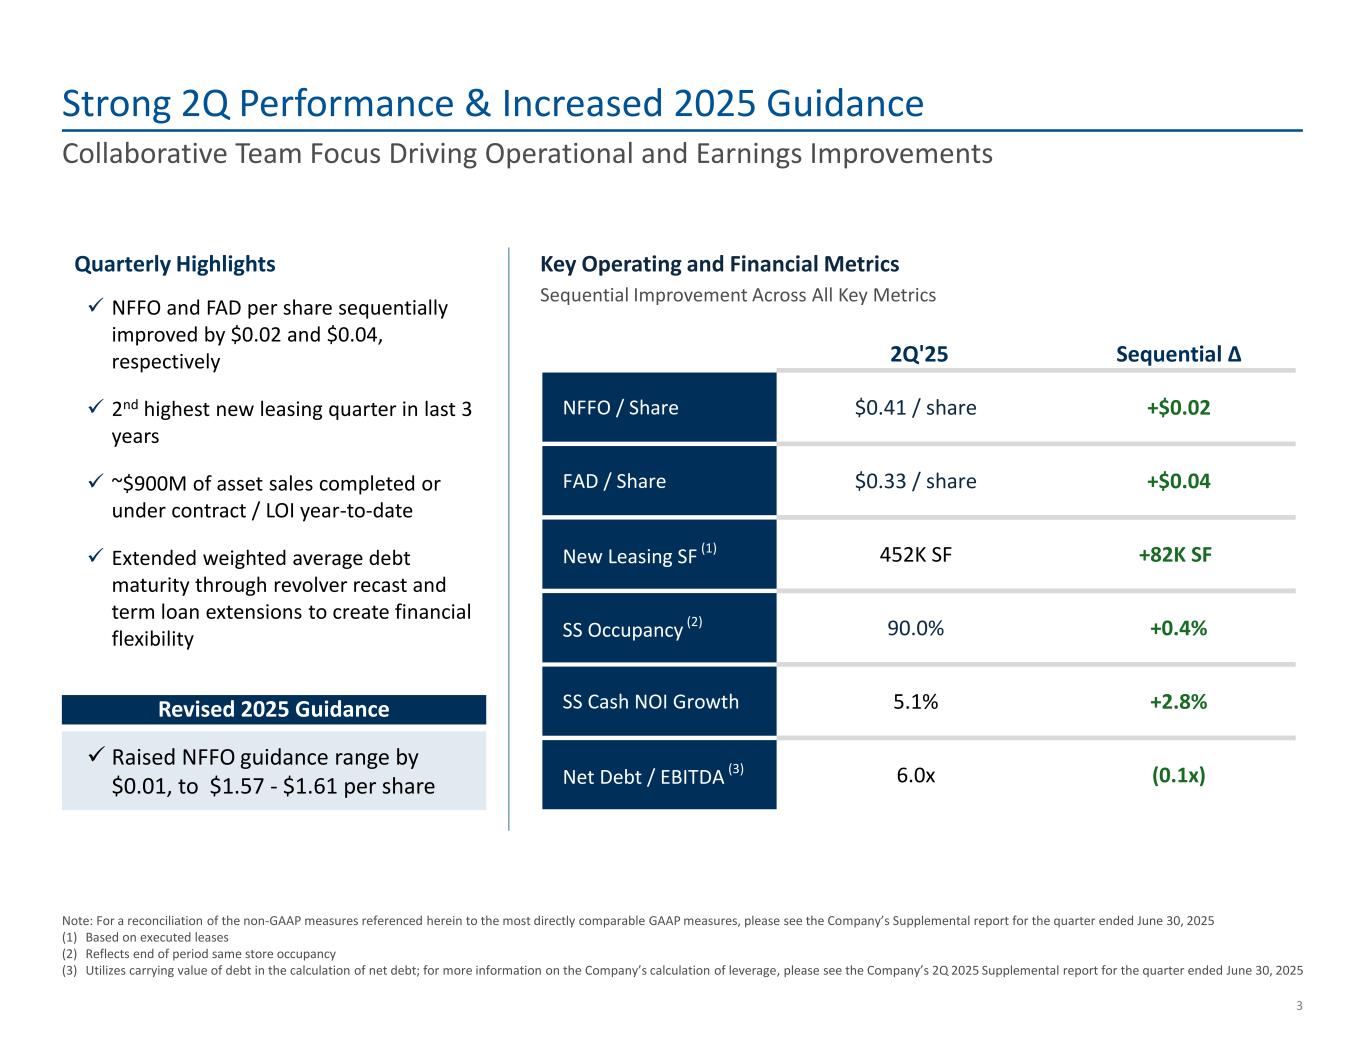
2Q'25 Sequential Δ NFFO / Share $0.41 / share +$0.02 FAD / Share $0.33 / share +$0.04 New Leasing SF (1) 452K SF +82K SF SS Occupancy (2) 90.0% +0.4% SS Cash NOI Growth 5.1% +2.8% Net Debt / EBITDA (3) 6.0x (0.1x) Note: For a reconciliation of the non-GAAP measures referenced herein to the most directly comparable GAAP measures, please see the Company’s Supplemental report for the quarter ended June 30, 2025 (1) Based on executed leases (2) Reflects end of period same store occupancy (3) Utilizes carrying value of debt in the calculation of net debt; for more information on the Company’s calculation of leverage, please see the Company’s 2Q 2025 Supplemental report for the quarter ended June 30, 2025 Strong 2Q Performance & Increased 2025 Guidance Collaborative Team Focus Driving Operational and Earnings Improvements 3 ✓ NFFO and FAD per share sequentially improved by $0.02 and $0.04, respectively ✓ 2nd highest new leasing quarter in last 3 years ✓ ~$900M of asset sales completed or under contract / LOI year-to-date ✓ Extended weighted average debt maturity through revolver recast and term loan extensions to create financial flexibility ✓ Raised NFFO guidance range by $0.01, to $1.57 - $1.61 per share Revised 2025 Guidance Key Operating and Financial MetricsQuarterly Highlights Sequential Improvement Across All Key Metrics
Assessment of Situation
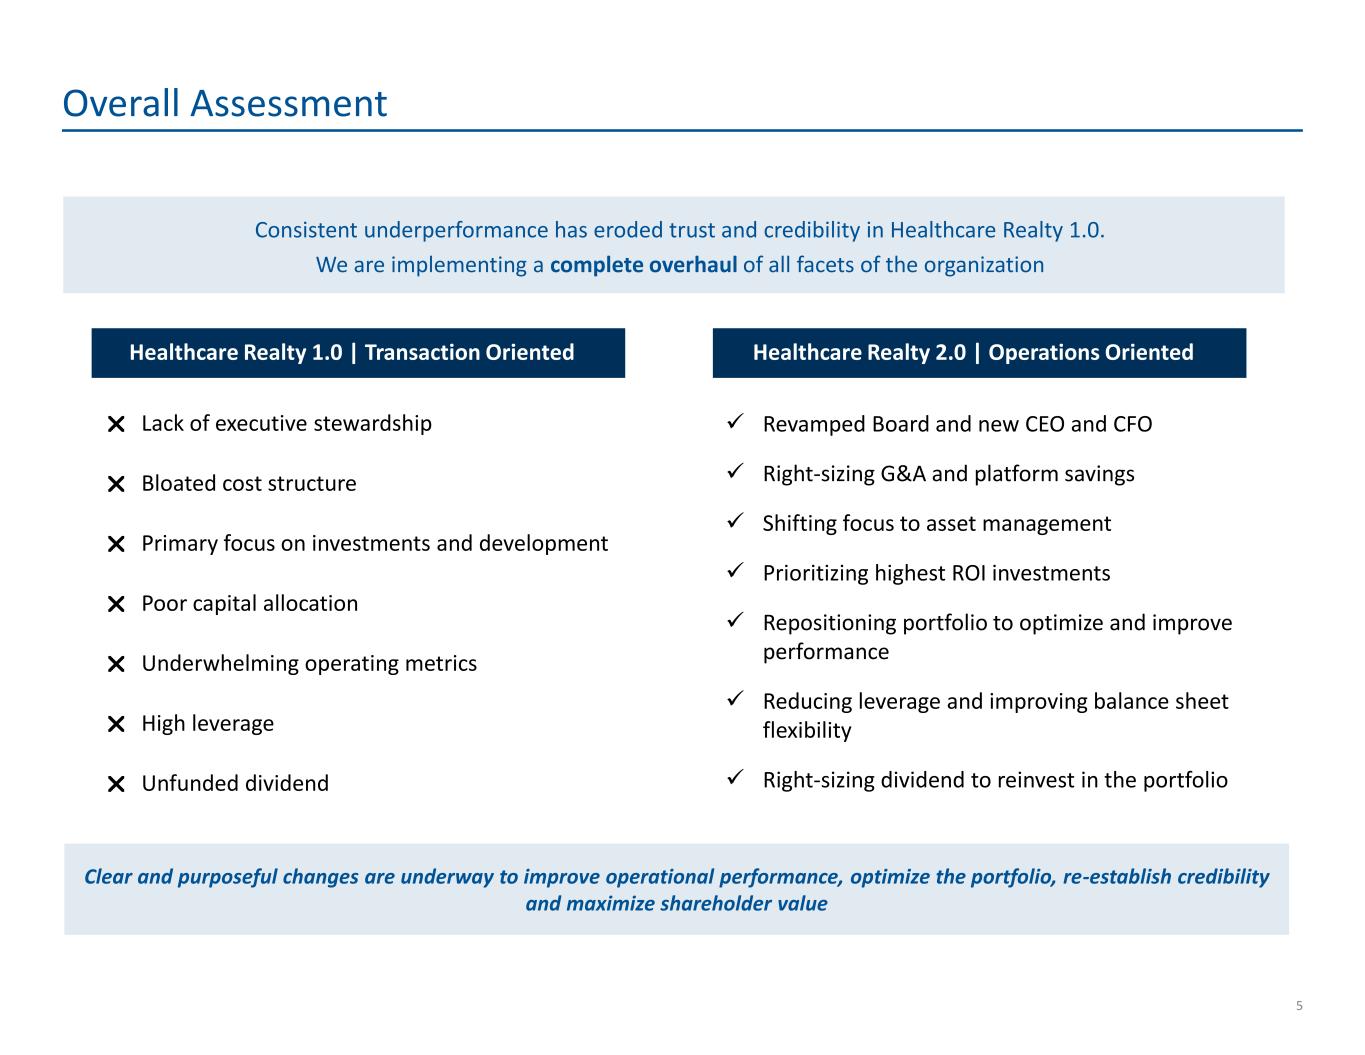
5 Overall Assessment Healthcare Realty 1.0 | Transaction Oriented Healthcare Realty 2.0 | Operations Oriented Lack of executive stewardship Bloated cost structure Primary focus on investments and development Poor capital allocation Underwhelming operating metrics High leverage Unfunded dividend ✓ Revamped Board and new CEO and CFO ✓ Right-sizing G&A and platform savings ✓ Shifting focus to asset management ✓ Prioritizing highest ROI investments ✓ Repositioning portfolio to optimize and improve performance ✓ Reducing leverage and improving balance sheet flexibility ✓ Right-sizing dividend to reinvest in the portfolio Clear and purposeful changes are underway to improve operational performance, optimize the portfolio, re-establish credibility and maximize shareholder value Consistent underperformance has eroded trust and credibility in Healthcare Realty 1.0. We are implementing a complete overhaul of all facets of the organization

The Strategic Plan
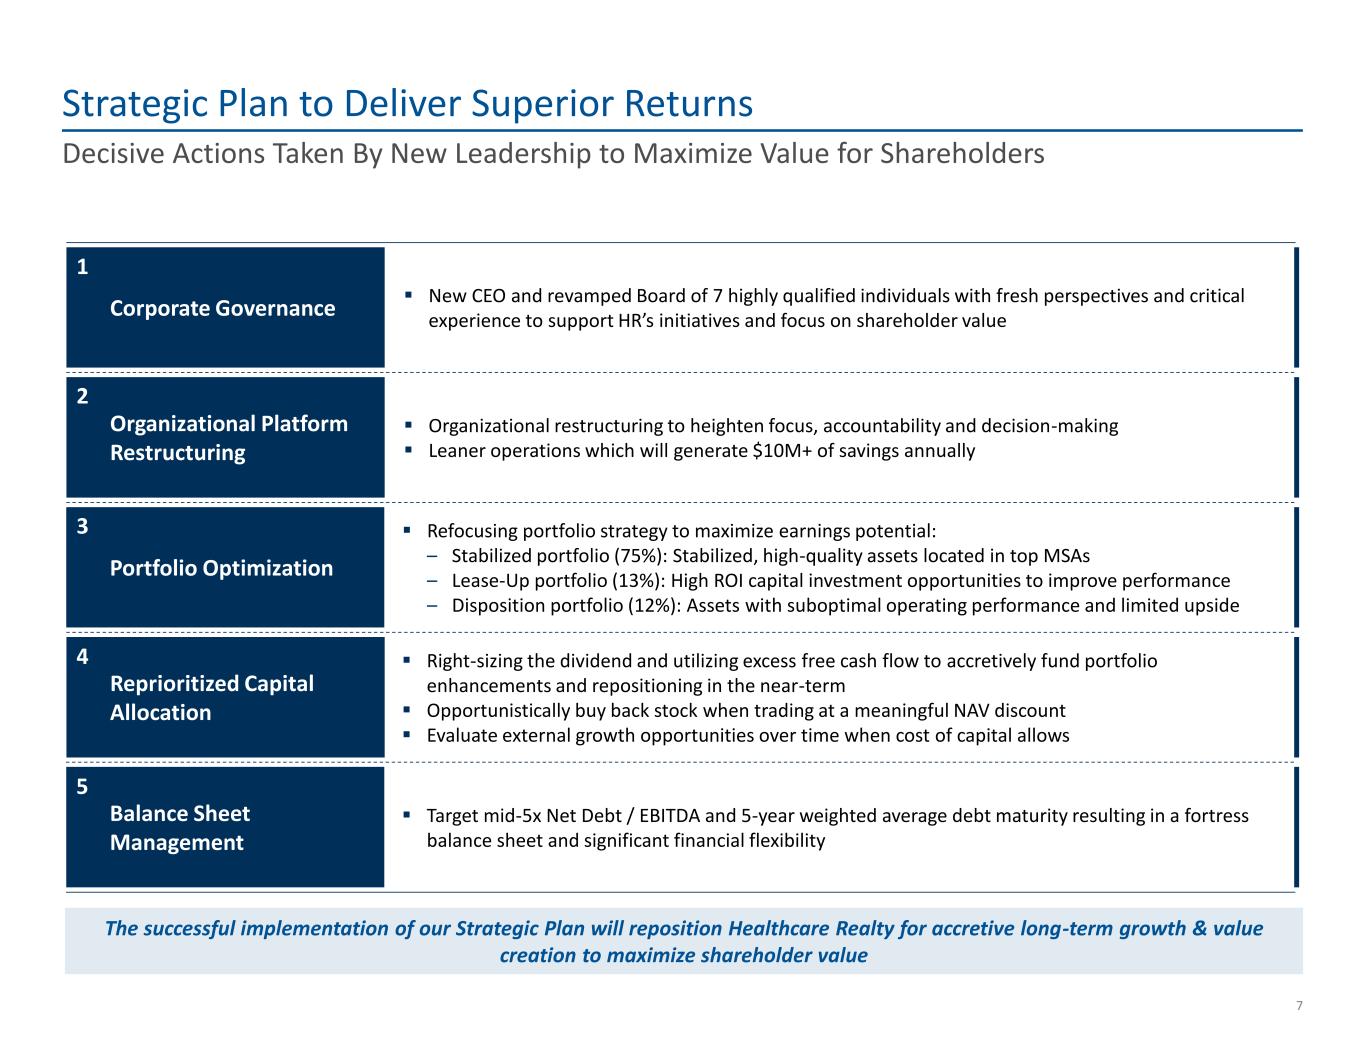
Strategic Plan to Deliver Superior Returns 7 Decisive Actions Taken By New Leadership to Maximize Value for Shareholders ▪ New CEO and revamped Board of 7 highly qualified individuals with fresh perspectives and critical experience to support HR’s initiatives and focus on shareholder value Corporate Governance 1 ▪ Organizational restructuring to heighten focus, accountability and decision-making ▪ Leaner operations which will generate $10M+ of savings annually ▪ Right-sizing the dividend and utilizing excess free cash flow to accretively fund portfolio enhancements and repositioning in the near-term ▪ Opportunistically buy back stock when trading at a meaningful NAV discount ▪ Evaluate external growth opportunities over time when cost of capital allows ▪ Refocusing portfolio strategy to maximize earnings potential: – Stabilized portfolio (75%): Stabilized, high-quality assets located in top MSAs – Lease-Up portfolio (13%): High ROI capital investment opportunities to improve performance – Disposition portfolio (12%): Assets with suboptimal operating performance and limited upside The successful implementation of our Strategic Plan will reposition Healthcare Realty for accretive long-term growth & value creation to maximize shareholder value Organizational Platform Restructuring 2 Portfolio Optimization 3 Reprioritized Capital Allocation 4 ▪ Target mid-5x Net Debt / EBITDA and 5-year weighted average debt maturity resulting in a fortress balance sheet and significant financial flexibility Balance Sheet Management 5
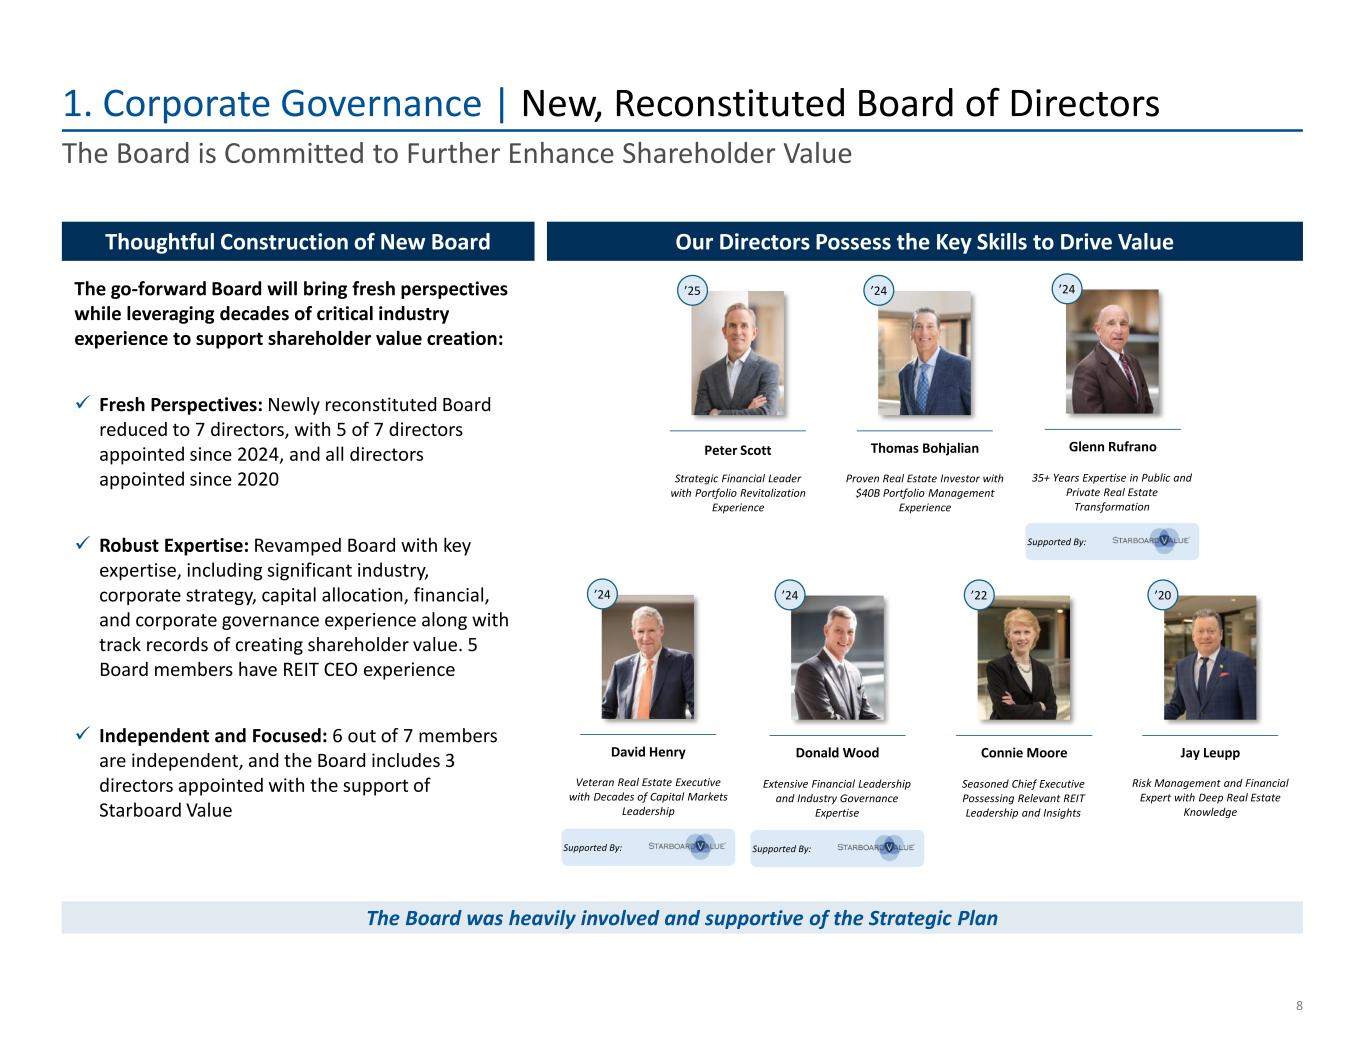
1. Corporate Governance | New, Reconstituted Board of Directors 8 The go-forward Board will bring fresh perspectives while leveraging decades of critical industry experience to support shareholder value creation: ✓ Fresh Perspectives: Newly reconstituted Board reduced to 7 directors, with 5 of 7 directors appointed since 2024, and all directors appointed since 2020 ✓ Robust Expertise: Revamped Board with key expertise, including significant industry, corporate strategy, capital allocation, financial, and corporate governance experience along with track records of creating shareholder value. 5 Board members have REIT CEO experience ✓ Independent and Focused: 6 out of 7 members are independent, and the Board includes 3 directors appointed with the support of Starboard Value The Board is Committed to Further Enhance Shareholder Value Our Directors Possess the Key Skills to Drive Value Risk Management and Financial Expert with Deep Real Estate Knowledge 35+ Years Expertise in Public and Private Real Estate Transformation Seasoned Chief Executive Possessing Relevant REIT Leadership and Insights Extensive Financial Leadership and Industry Governance Expertise Jay LeuppConnie Moore Glenn Rufrano Donald Wood ’22 ’24 ’24 ’20 Proven Real Estate Investor with $40B Portfolio Management Experience Strategic Financial Leader with Portfolio Revitalization Experience Veteran Real Estate Executive with Decades of Capital Markets Leadership Thomas Bohjalian David Henry ’24 ’24 Peter Scott ’25 Supported By: Supported By: Supported By: Thoughtful Construction of New Board The Board was heavily involved and supportive of the Strategic Plan
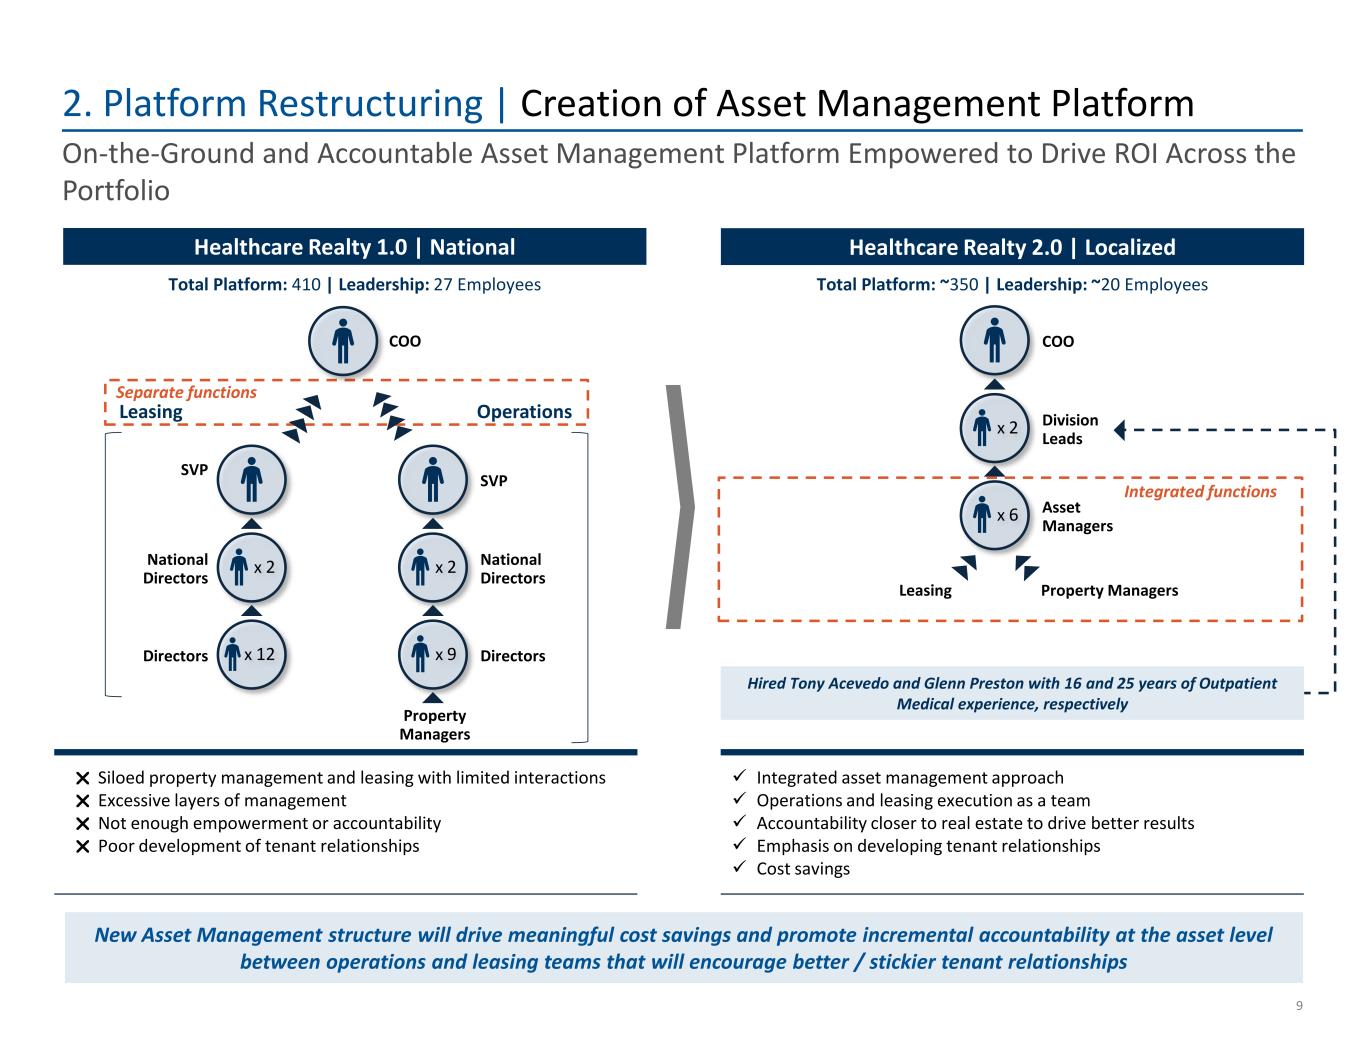
2. Platform Restructuring | Creation of Asset Management Platform 9 Healthcare Realty 2.0 | Localized On-the-Ground and Accountable Asset Management Platform Empowered to Drive ROI Across the Portfolio Healthcare Realty 1.0 | National ✓ Integrated asset management approach ✓ Operations and leasing execution as a team ✓ Accountability closer to real estate to drive better results ✓ Emphasis on developing tenant relationships ✓ Cost savings Siloed property management and leasing with limited interactions Excessive layers of management Not enough empowerment or accountability Poor development of tenant relationships Total Platform: 410 | Leadership: 27 Employees Total Platform: ~350 | Leadership: ~20 Employees COO SVP x 2National Directors x 12Directors SVP x 2 National Directors x 9 Directors OperationsLeasing Property Managers Separate functions COO x 2 Division Leads x 6 Asset Managers Property ManagersLeasing Hired Tony Acevedo and Glenn Preston with 16 and 25 years of Outpatient Medical experience, respectively Integrated functions New Asset Management structure will drive meaningful cost savings and promote incremental accountability at the asset level between operations and leasing teams that will encourage better / stickier tenant relationships
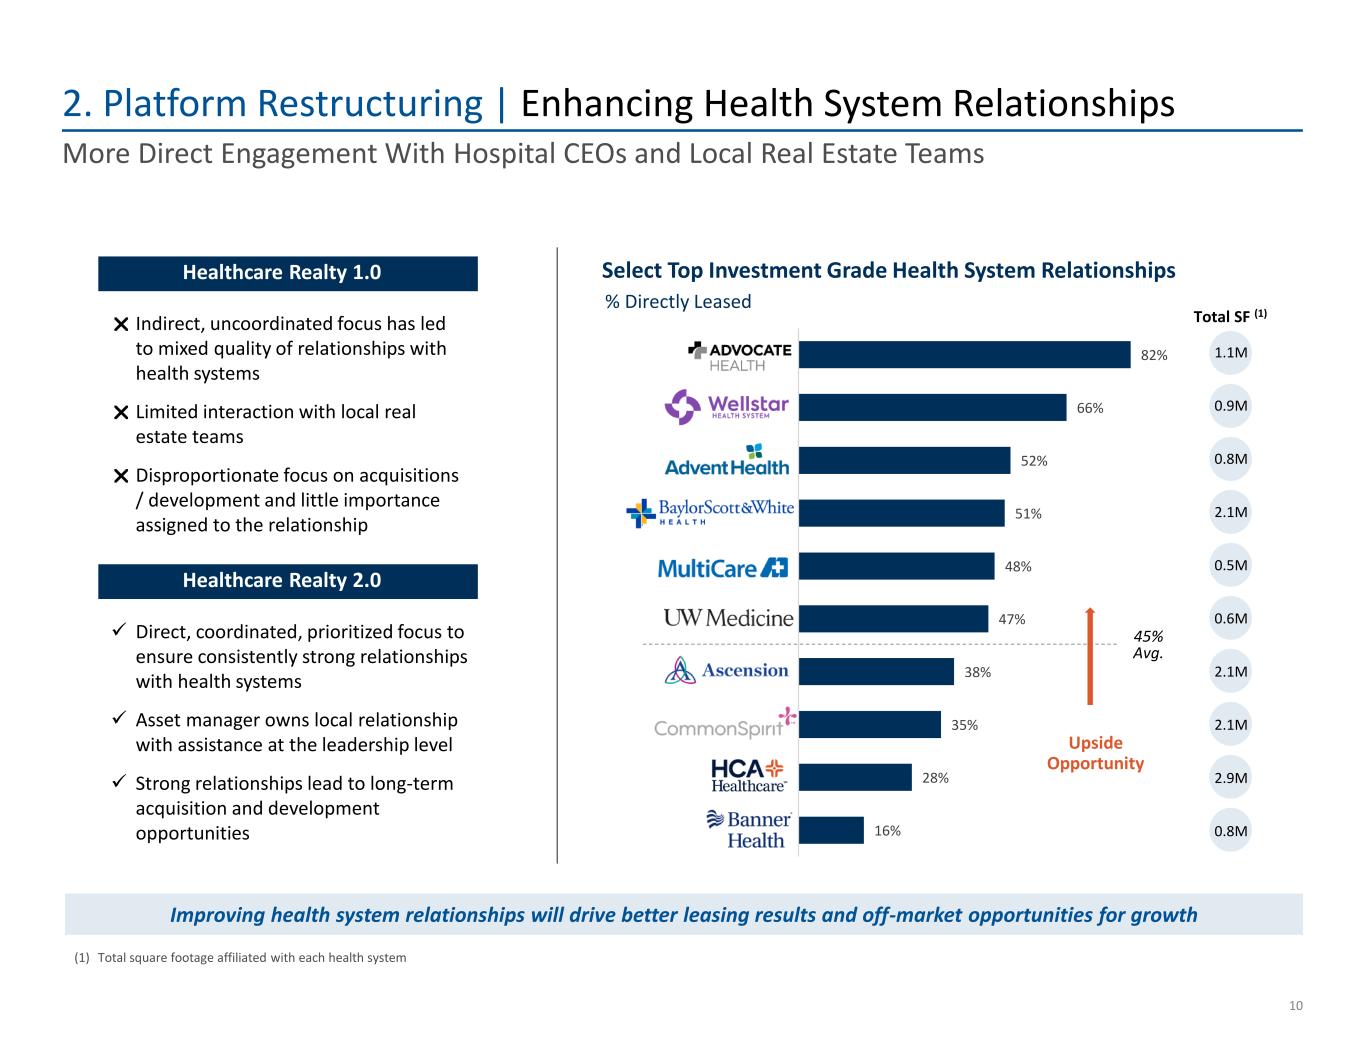
16% 28% 35% 38% 47% 48% 51% 52% 66% 82% Banner HCA Common Spirit Ascenscion UW Medicine Multicare BSW Advent Health Wellstar Advocate 2. Platform Restructuring | Enhancing Health System Relationships 10 More Direct Engagement With Hospital CEOs and Local Real Estate Teams Healthcare Realty 1.0 Select Top Investment Grade Health System Relationships 45% Avg. Upside Opportunity Total SF (1) ✓ Direct, coordinated, prioritized focus to ensure consistently strong relationships with health systems ✓ Asset manager owns local relationship with assistance at the leadership level ✓ Strong relationships lead to long-term acquisition and development opportunities Indirect, uncoordinated focus has led to mixed quality of relationships with health systems Limited interaction with local real estate teams Disproportionate focus on acquisitions / development and little importance assigned to the relationship Healthcare Realty 2.0 Improving health system relationships will drive better leasing results and off-market opportunities for growth % Directly Leased (1) Total square footage affiliated with each health system 1.1M 0.9M 0.8M 2.1M 0.5M 0.6M 2.1M 2.1M 2.9M 0.8M
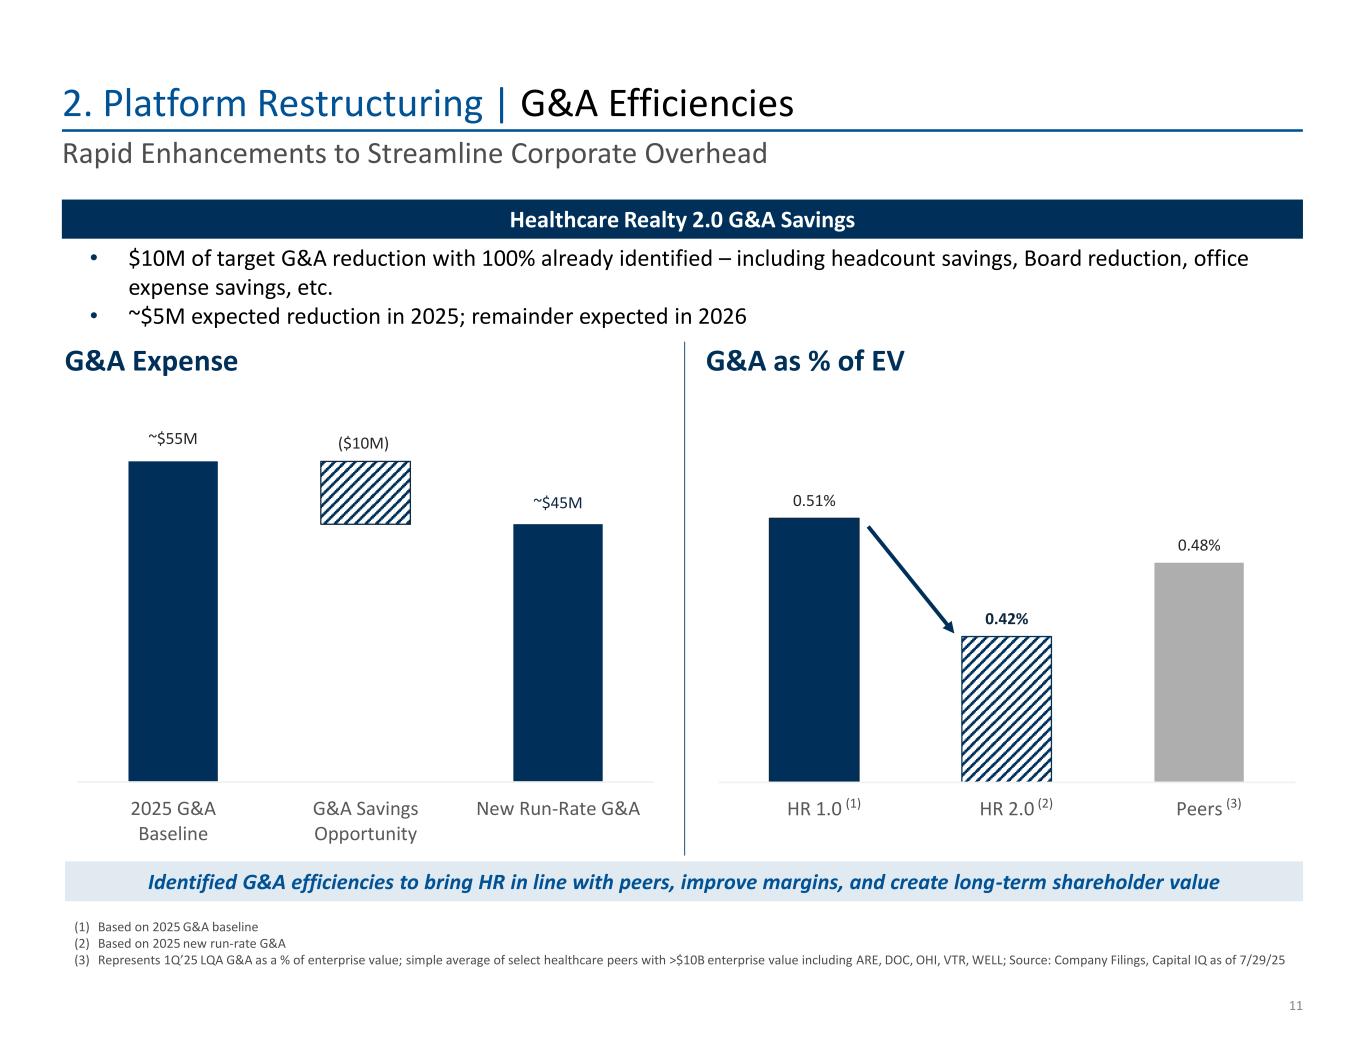
0.51% 0.42% 0.48% HR 1.0 HR 2.0 Peers ~$55M ~$45M ($10M) 2025 G&A Baseline G&A Savings Opportunity New Run-Rate G&A 2. Platform Restructuring | G&A Efficiencies 11 Rapid Enhancements to Streamline Corporate Overhead • $10M of target G&A reduction with 100% already identified – including headcount savings, Board reduction, office expense savings, etc. • ~$5M expected reduction in 2025; remainder expected in 2026 G&A Expense G&A as % of EV (1) Based on 2025 G&A baseline (2) Based on 2025 new run-rate G&A (3) Represents 1Q’25 LQA G&A as a % of enterprise value; simple average of select healthcare peers with >$10B enterprise value including ARE, DOC, OHI, VTR, WELL; Source: Company Filings, Capital IQ as of 7/29/25 Healthcare Realty 2.0 G&A Savings Identified G&A efficiencies to bring HR in line with peers, improve margins, and create long-term shareholder value (1) (2) (3)
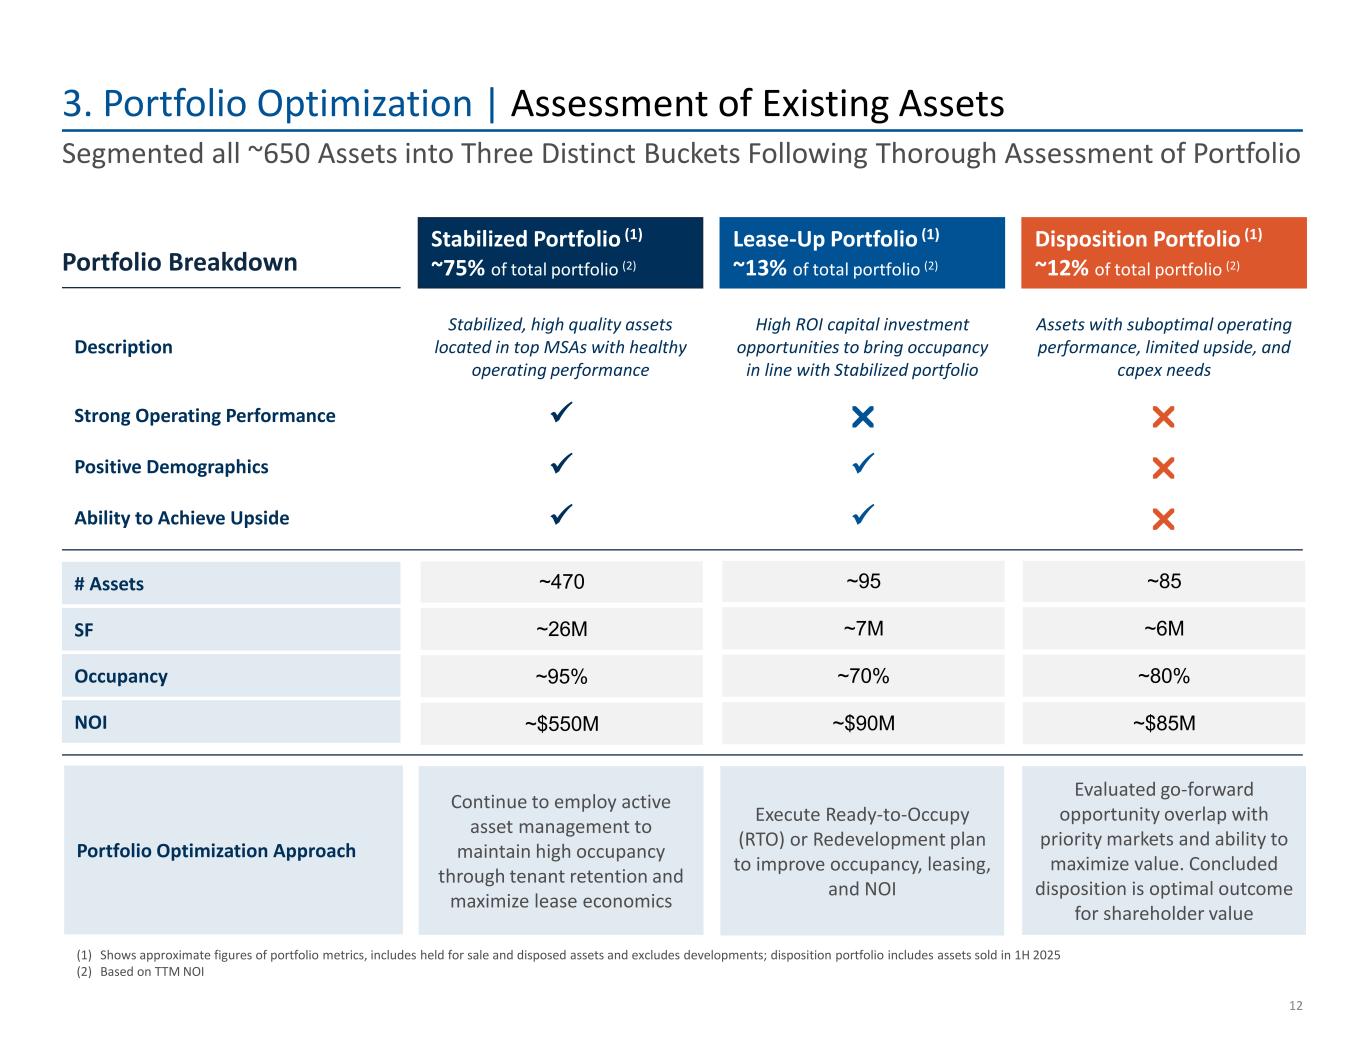
Stabilized, high quality assets located in top MSAs with healthy operating performance Assets with suboptimal operating performance, limited upside, and capex needs High ROI capital investment opportunities to bring occupancy in line with Stabilized portfolio Description 3. Portfolio Optimization | Assessment of Existing Assets 12 Segmented all ~650 Assets into Three Distinct Buckets Following Thorough Assessment of Portfolio Stabilized Portfolio (1) ~75% of total portfolio (2) (1) Shows approximate figures of portfolio metrics, includes held for sale and disposed assets and excludes developments; disposition portfolio includes assets sold in 1H 2025 (2) Based on TTM NOI Lease-Up Portfolio (1) ~13% of total portfolio (2) Disposition Portfolio (1) ~12% of total portfolio (2) ~85 ~6M ~80% ~$85M ~95 ~7M ~70% ~$90M ~470 ~26M ~95% ~$550M # Assets NOI SF Occupancy Strong Operating Performance ✓ Ability to Achieve Upside ✓ ✓ Positive Demographics ✓ ✓ Continue to employ active asset management to maintain high occupancy through tenant retention and maximize lease economics Execute Ready-to-Occupy (RTO) or Redevelopment plan to improve occupancy, leasing, and NOI Evaluated go-forward opportunity overlap with priority markets and ability to maximize value. Concluded disposition is optimal outcome for shareholder value Portfolio Optimization Approach Portfolio Breakdown
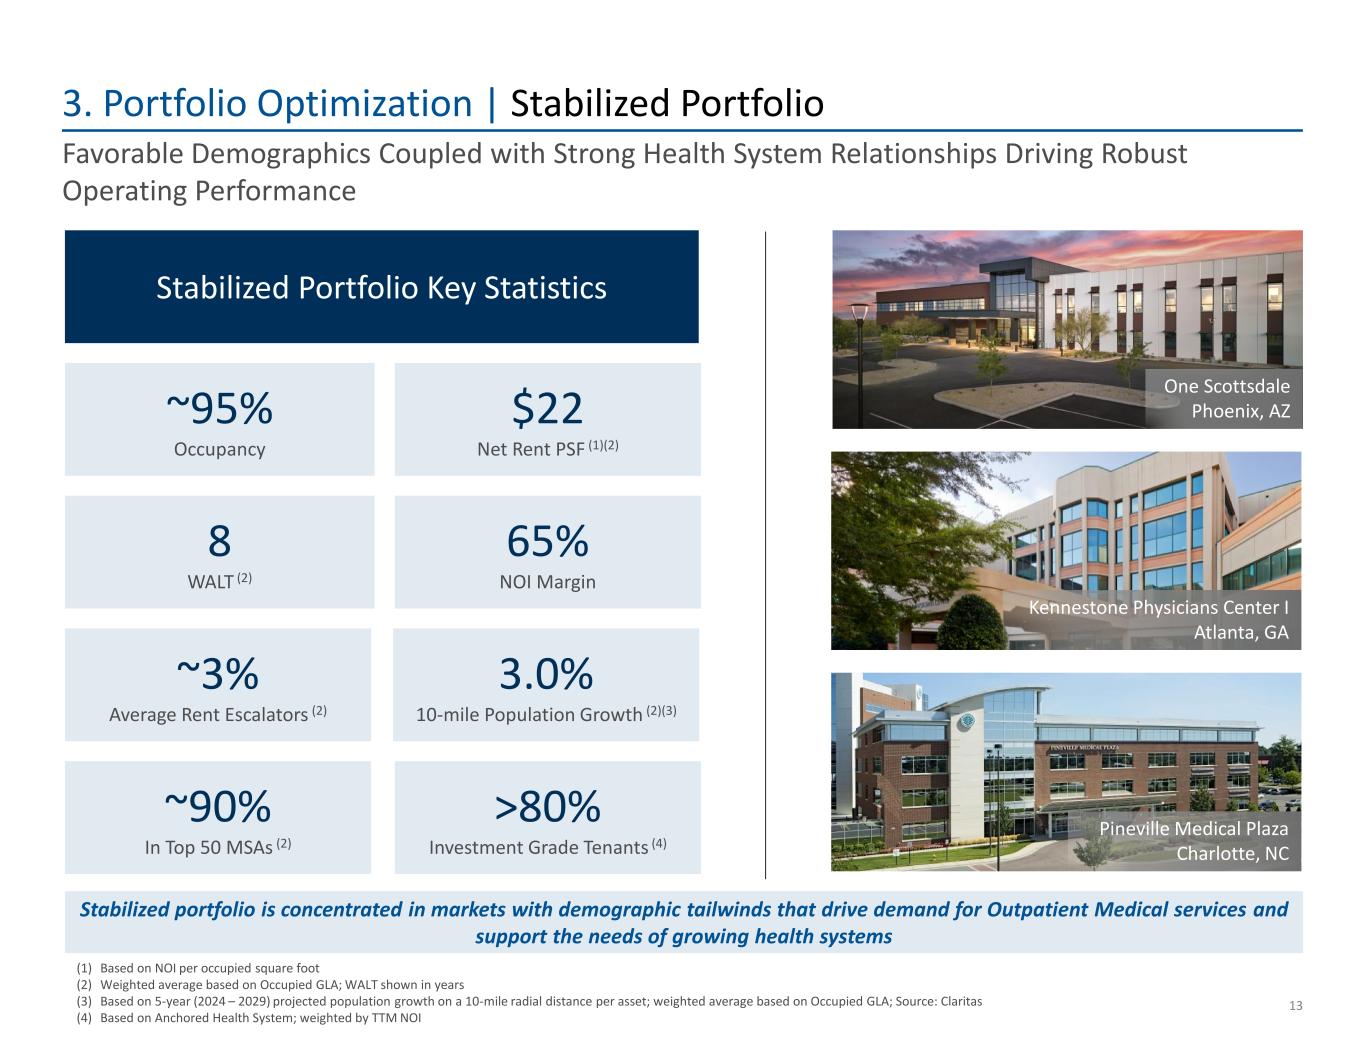
3. Portfolio Optimization | Stabilized Portfolio 13 (1) Based on NOI per occupied square foot (2) Weighted average based on Occupied GLA; WALT shown in years (3) Based on 5-year (2024 – 2029) projected population growth on a 10-mile radial distance per asset; weighted average based on Occupied GLA; Source: Claritas (4) Based on Anchored Health System; weighted by TTM NOI 8 WALT (2) ~90% In Top 50 MSAs (2) 65% NOI Margin >80% Investment Grade Tenants (4) Favorable Demographics Coupled with Strong Health System Relationships Driving Robust Operating Performance Stabilized portfolio is concentrated in markets with demographic tailwinds that drive demand for Outpatient Medical services and support the needs of growing health systems ~3% Average Rent Escalators (2) 3.0% 10-mile Population Growth (2)(3) ~95% Occupancy $22 Net Rent PSF (1)(2) Stabilized Portfolio Key Statistics Kennestone Physicians Center I Atlanta, GA Pineville Medical Plaza Charlotte, NC One Scottsdale Phoenix, AZ
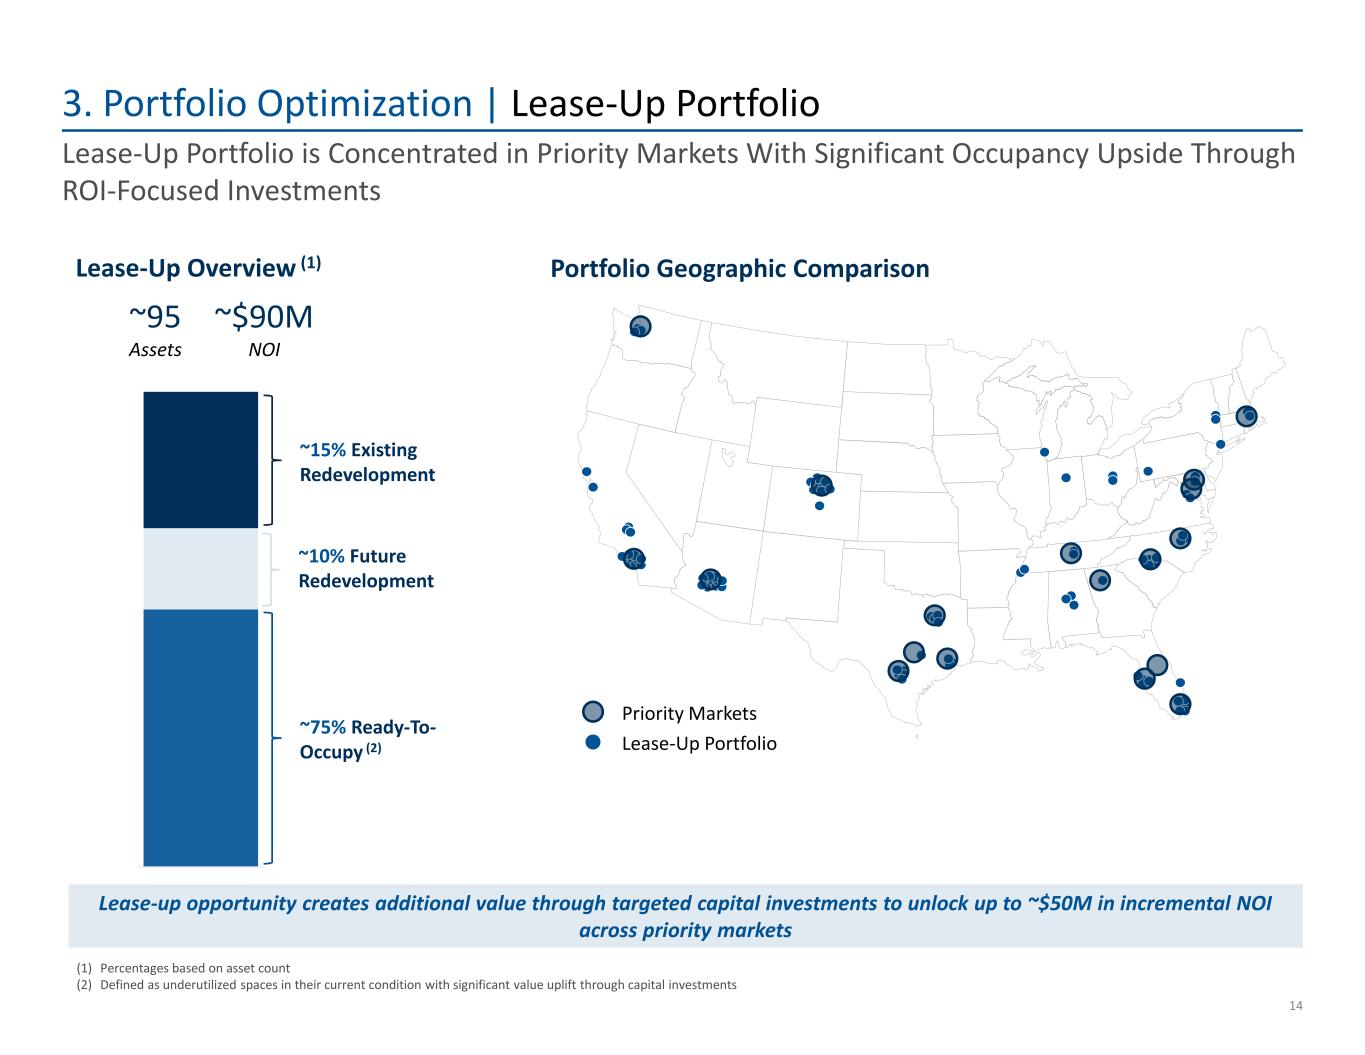
v 3. Portfolio Optimization | Lease-Up Portfolio 14 Lease-Up Portfolio is Concentrated in Priority Markets With Significant Occupancy Upside Through ROI-Focused Investments ~75% Ready-To- Occupy (2) Lease-Up Overview (1) Portfolio Geographic Comparison Lease-up opportunity creates additional value through targeted capital investments to unlock up to ~$50M in incremental NOI across priority markets ~95 Assets ~$90M NOI ~10% Future Redevelopment ~15% Existing Redevelopment Priority Markets Lease-Up Portfolio (1) Percentages based on asset count (2) Defined as underutilized spaces in their current condition with significant value uplift through capital investments
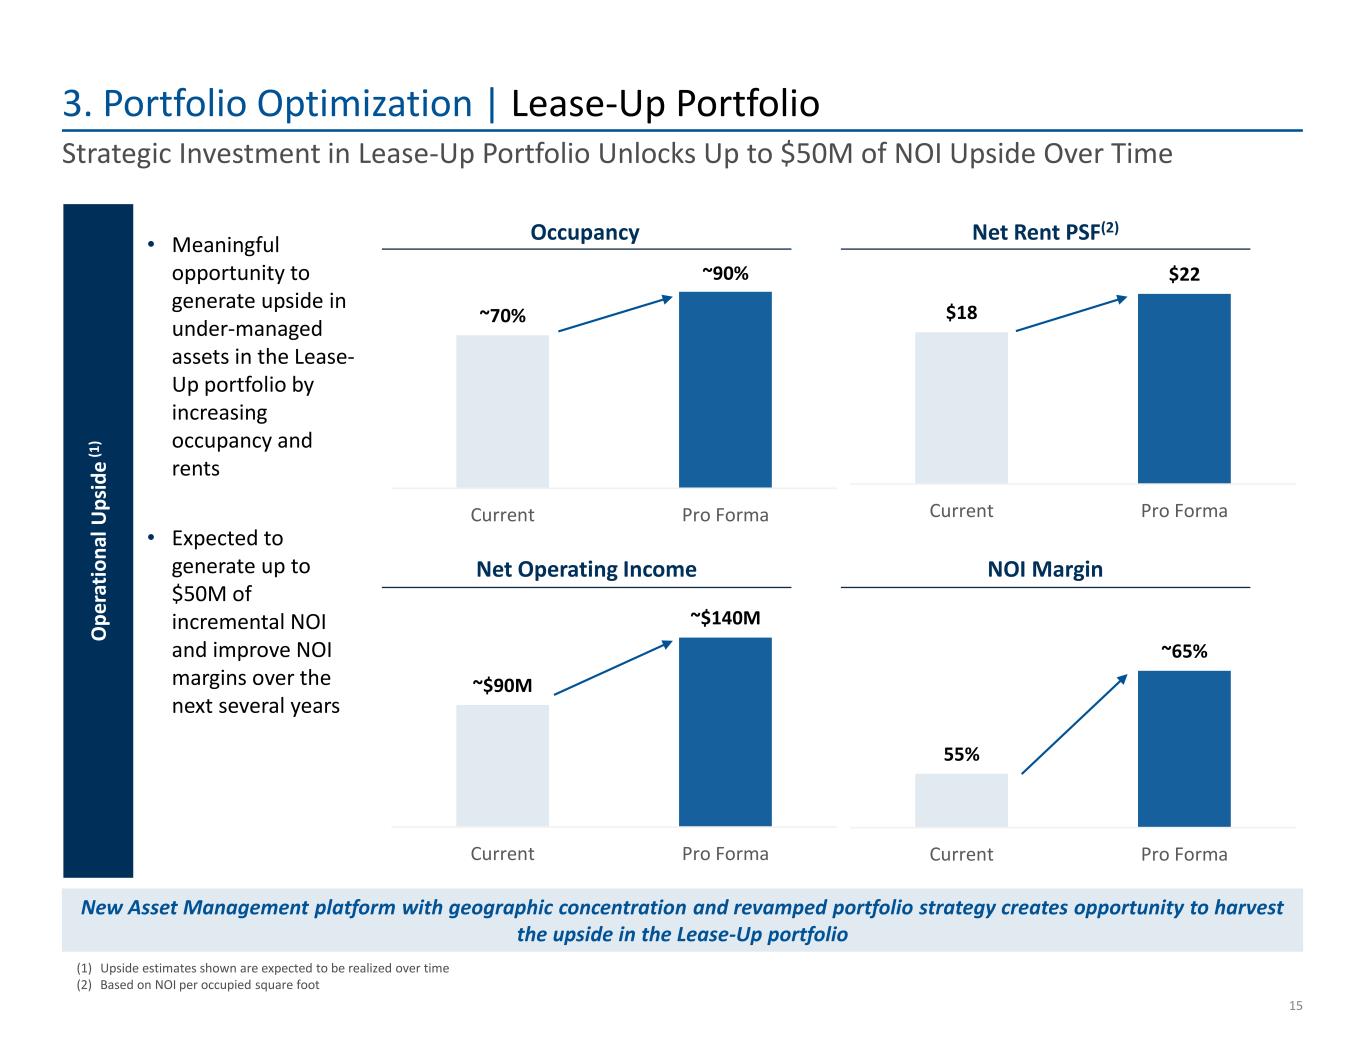
$18 $22 Current Pro Forma 55% ~65% Current Pro Forma ~$90M ~$140M Current Pro Forma ~70% ~90% Current Pro Forma 3. Portfolio Optimization | Lease-Up Portfolio 15 Strategic Investment in Lease-Up Portfolio Unlocks Up to $50M of NOI Upside Over Time Occupancy Net Rent PSF(2) Net Operating Income NOI Margin (1) Upside estimates shown are expected to be realized over time (2) Based on NOI per occupied square foot • Meaningful opportunity to generate upside in under-managed assets in the Lease- Up portfolio by increasing occupancy and rents • Expected to generate up to $50M of incremental NOI and improve NOI margins over the next several years O p er at io n al U p si d e ( 1 ) New Asset Management platform with geographic concentration and revamped portfolio strategy creates opportunity to harvest the upside in the Lease-Up portfolio
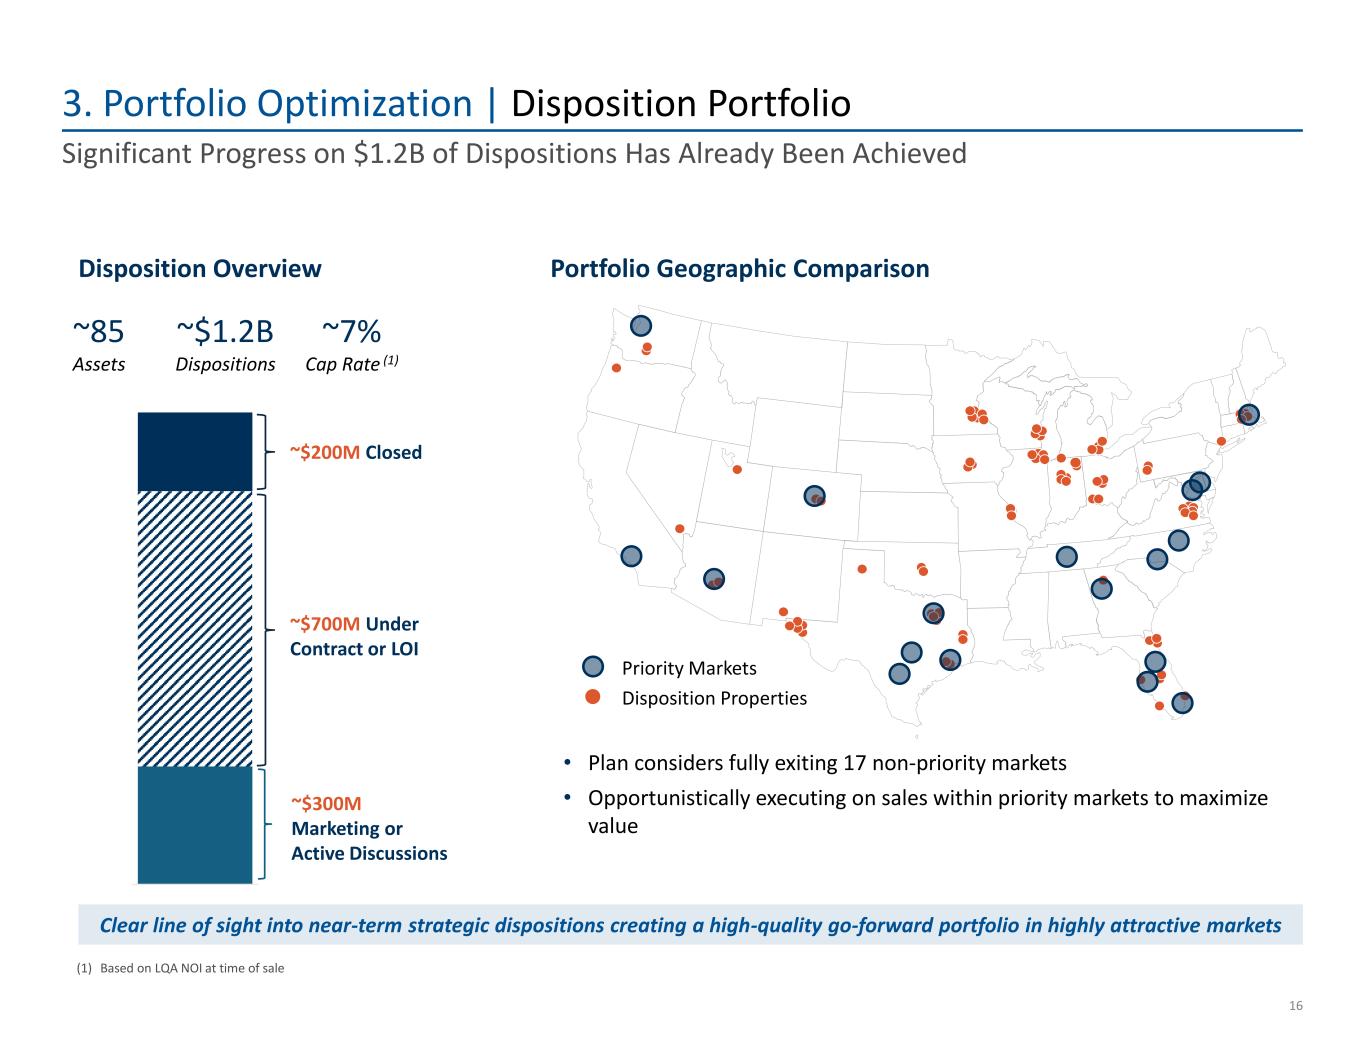
3. Portfolio Optimization | Disposition Portfolio 16 Significant Progress on $1.2B of Dispositions Has Already Been Achieved ~$200M Closed ~$700M Under Contract or LOI Disposition Overview ~$300M Marketing or Active Discussions Portfolio Geographic Comparison Clear line of sight into near-term strategic dispositions creating a high-quality go-forward portfolio in highly attractive markets Priority Markets Disposition Properties ~85 Assets ~$1.2B Dispositions • Plan considers fully exiting 17 non-priority markets • Opportunistically executing on sales within priority markets to maximize value (1) Based on LQA NOI at time of sale ~7% Cap Rate (1)
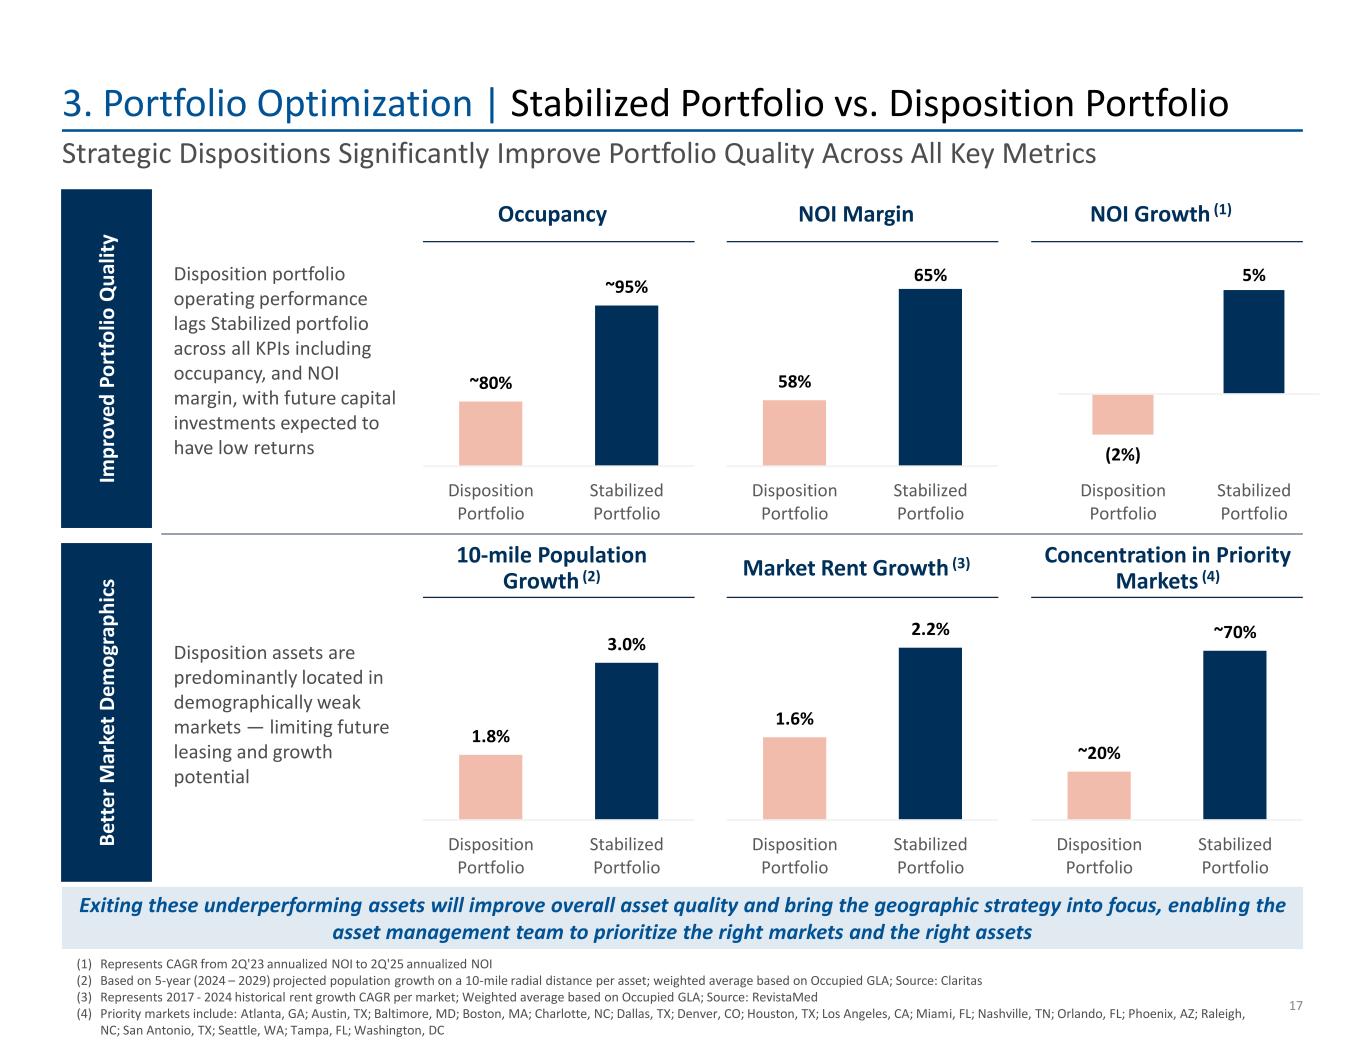
1.6% 2.2% Disposition Portfolio Stabilized Portfolio (2%) 5% Disposition Portfolio Stabilized Portfolio ~20% ~70% Disposition Portfolio Stabilized Portfolio 1.8% 3.0% Disposition Portfolio Stabilized Portfolio 58% 65% Disposition Portfolio Stabilized Portfolio ~80% ~95% Disposition Portfolio Stabilized Portfolio 3. Portfolio Optimization | Stabilized Portfolio vs. Disposition Portfolio 17 Strategic Dispositions Significantly Improve Portfolio Quality Across All Key Metrics Im p ro ve d P o rt fo lio Q u al it y B et te r M ar ke t D em o gr ap h ic s Occupancy NOI Growth (1)NOI Margin 10-mile Population Growth (2) Market Rent Growth (3) Concentration in Priority Markets (4) (1) Represents CAGR from 2Q'23 annualized NOI to 2Q'25 annualized NOI (2) Based on 5-year (2024 – 2029) projected population growth on a 10-mile radial distance per asset; weighted average based on Occupied GLA; Source: Claritas (3) Represents 2017 - 2024 historical rent growth CAGR per market; Weighted average based on Occupied GLA; Source: RevistaMed (4) Priority markets include: Atlanta, GA; Austin, TX; Baltimore, MD; Boston, MA; Charlotte, NC; Dallas, TX; Denver, CO; Houston, TX; Los Angeles, CA; Miami, FL; Nashville, TN; Orlando, FL; Phoenix, AZ; Raleigh, NC; San Antonio, TX; Seattle, WA; Tampa, FL; Washington, DC Disposition portfolio operating performance lags Stabilized portfolio across all KPIs including occupancy, and NOI margin, with future capital investments expected to have low returns Disposition assets are predominantly located in demographically weak markets — limiting future leasing and growth potential Exiting these underperforming assets will improve overall asset quality and bring the geographic strategy into focus, enabling the asset management team to prioritize the right markets and the right assets
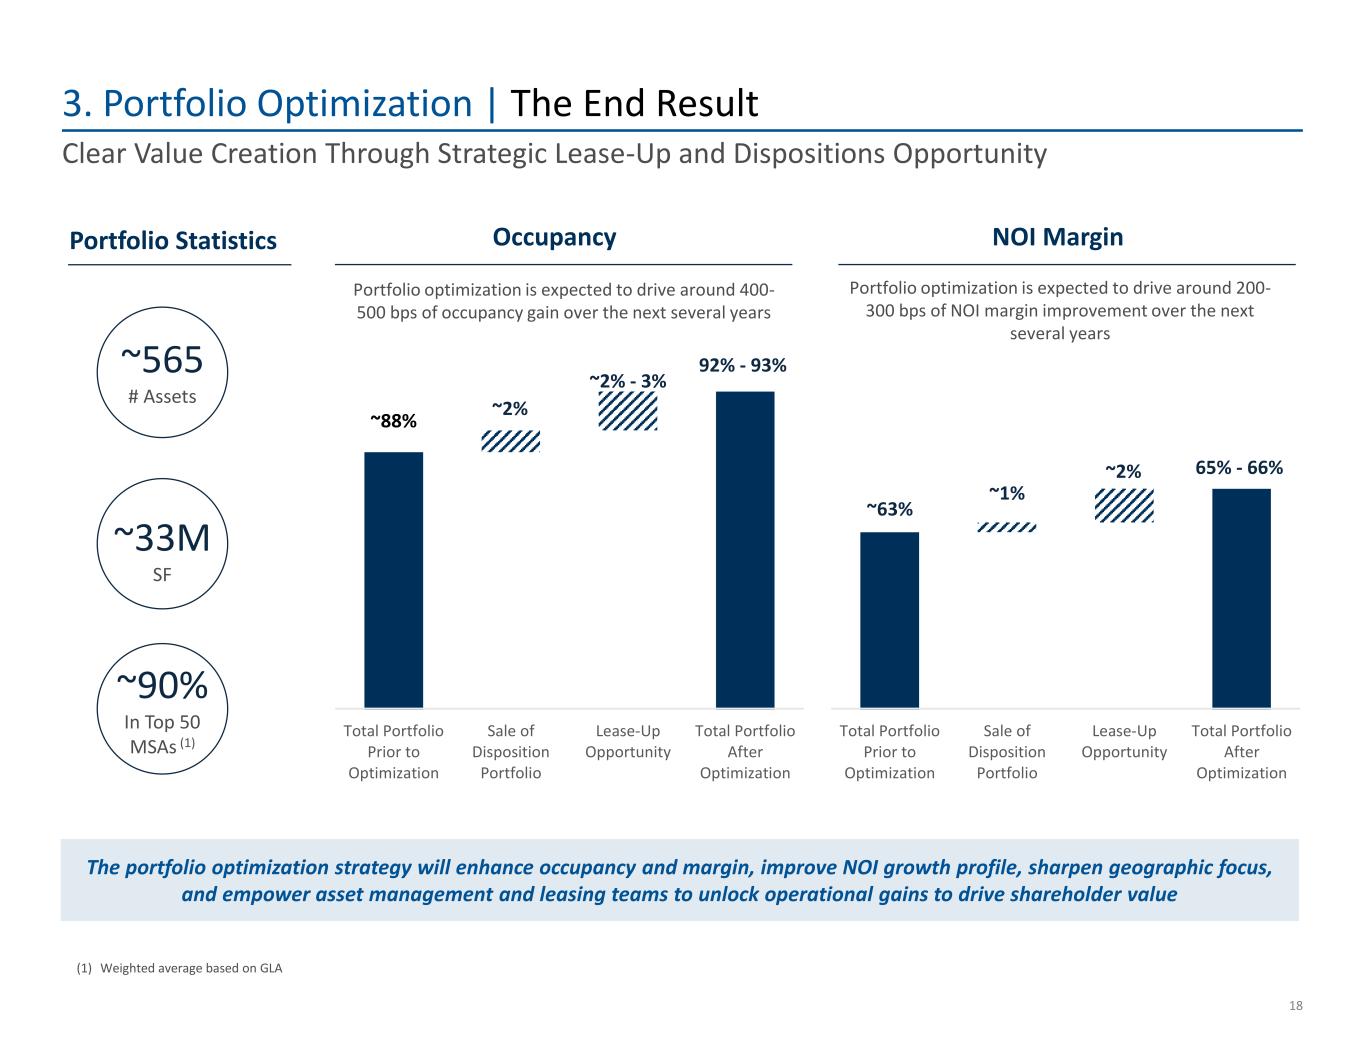
~63% ~1% ~2% 65% - 66% Total Portfolio Prior to Optimization Sale of Disposition Portfolio Lease-Up Opportunity Total Portfolio After Optimization ~88% ~2% ~2% - 3% 92% - 93% Total Portfolio Prior to Optimization Sale of Disposition Portfolio Lease-Up Opportunity Total Portfolio After Optimization 3. Portfolio Optimization | The End Result 18 Clear Value Creation Through Strategic Lease-Up and Dispositions Opportunity Occupancy NOI Margin The portfolio optimization strategy will enhance occupancy and margin, improve NOI growth profile, sharpen geographic focus, and empower asset management and leasing teams to unlock operational gains to drive shareholder value Portfolio optimization is expected to drive around 400- 500 bps of occupancy gain over the next several years Portfolio optimization is expected to drive around 200- 300 bps of NOI margin improvement over the next several years ~565 # Assets ~33M SF ~90% In Top 50 MSAs (1) Portfolio Statistics (1) Weighted average based on GLA
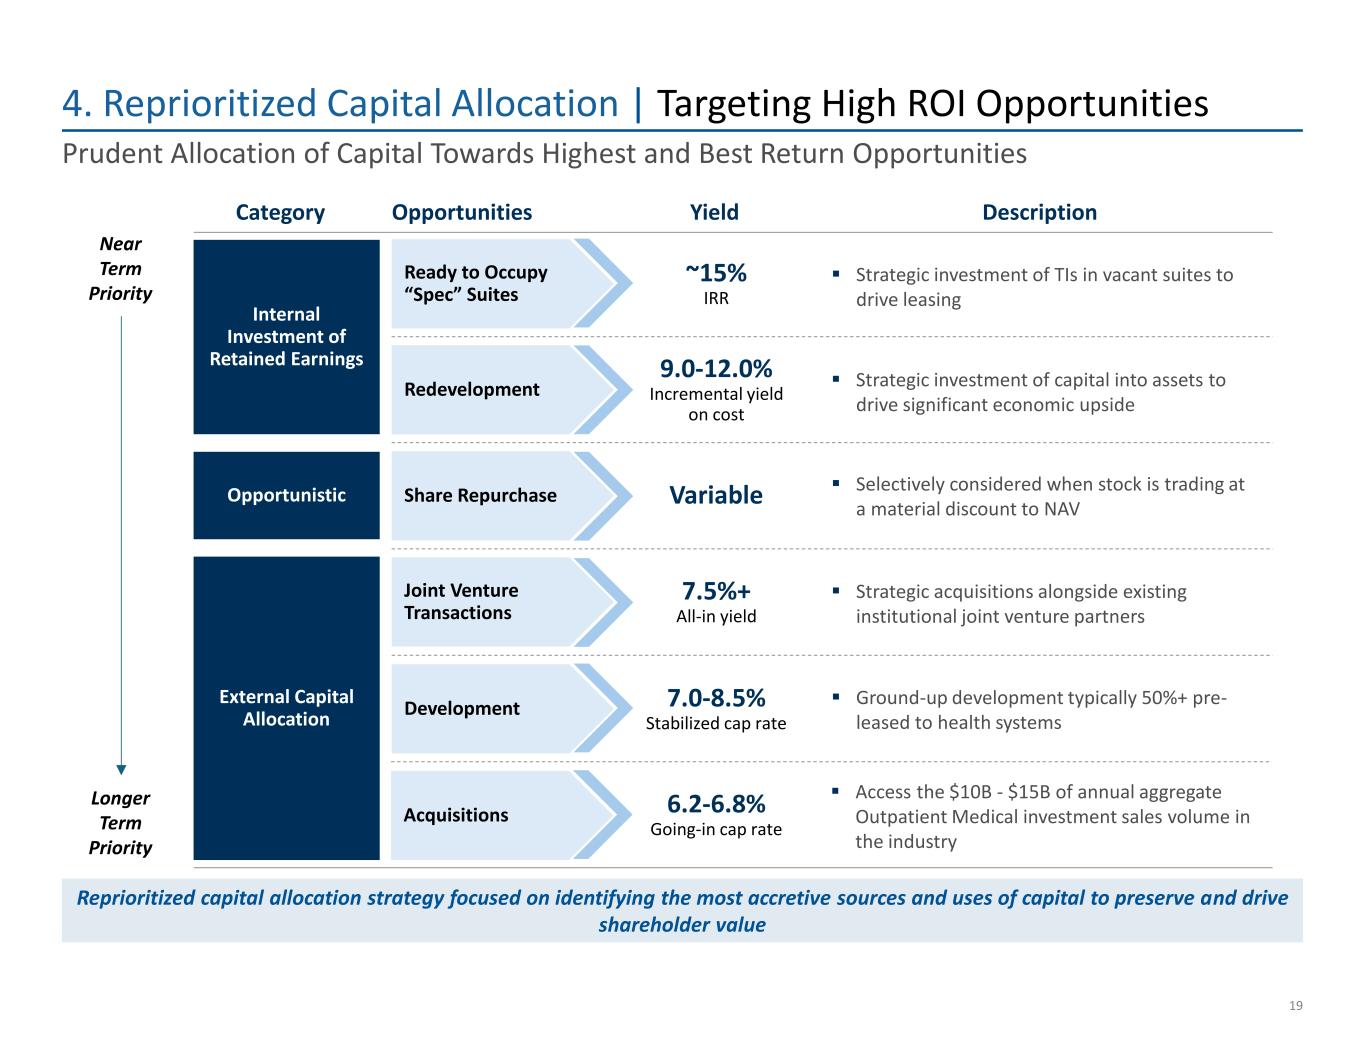
4. Reprioritized Capital Allocation | Targeting High ROI Opportunities 19 Prudent Allocation of Capital Towards Highest and Best Return Opportunities Internal Investment of Retained Earnings Opportunistic External Capital Allocation Near Term Priority Longer Term Priority Category Yield DescriptionOpportunities Ready to Occupy “Spec” Suites ▪ Strategic investment of TIs in vacant suites to drive leasing ~15% IRR Redevelopment ▪ Strategic investment of capital into assets to drive significant economic upside 9.0-12.0% Incremental yield on cost Joint Venture Transactions ▪ Strategic acquisitions alongside existing institutional joint venture partners 7.5%+ All-in yield Development ▪ Ground-up development typically 50%+ pre- leased to health systems 7.0-8.5% Stabilized cap rate Share Repurchase ▪ Selectively considered when stock is trading at a material discount to NAV Variable Reprioritized capital allocation strategy focused on identifying the most accretive sources and uses of capital to preserve and drive shareholder value Acquisitions ▪ Access the $10B - $15B of annual aggregate Outpatient Medical investment sales volume in the industry 6.2-6.8% Going-in cap rate
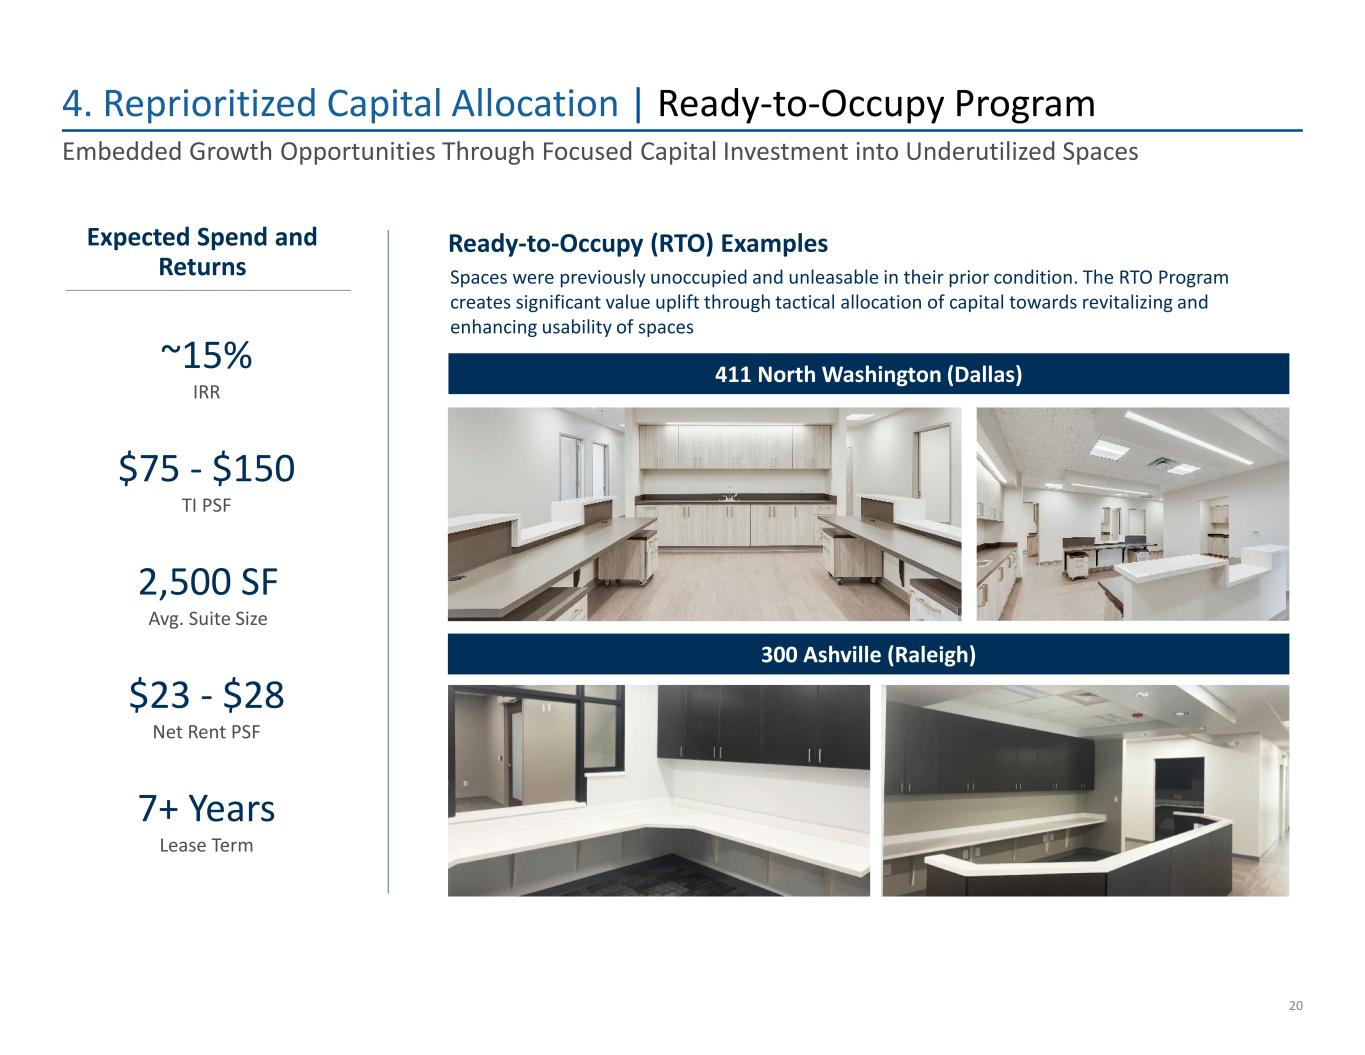
4. Reprioritized Capital Allocation | Ready-to-Occupy Program 20 $75 - $150 TI PSF 7+ Years Lease Term ~15% IRR 2,500 SF Avg. Suite Size $23 - $28 Net Rent PSF Embedded Growth Opportunities Through Focused Capital Investment into Underutilized Spaces Ready-to-Occupy (RTO) Examples 300 Ashville (Raleigh) 411 North Washington (Dallas) Spaces were previously unoccupied and unleasable in their prior condition. The RTO Program creates significant value uplift through tactical allocation of capital towards revitalizing and enhancing usability of spaces Expected Spend and Returns
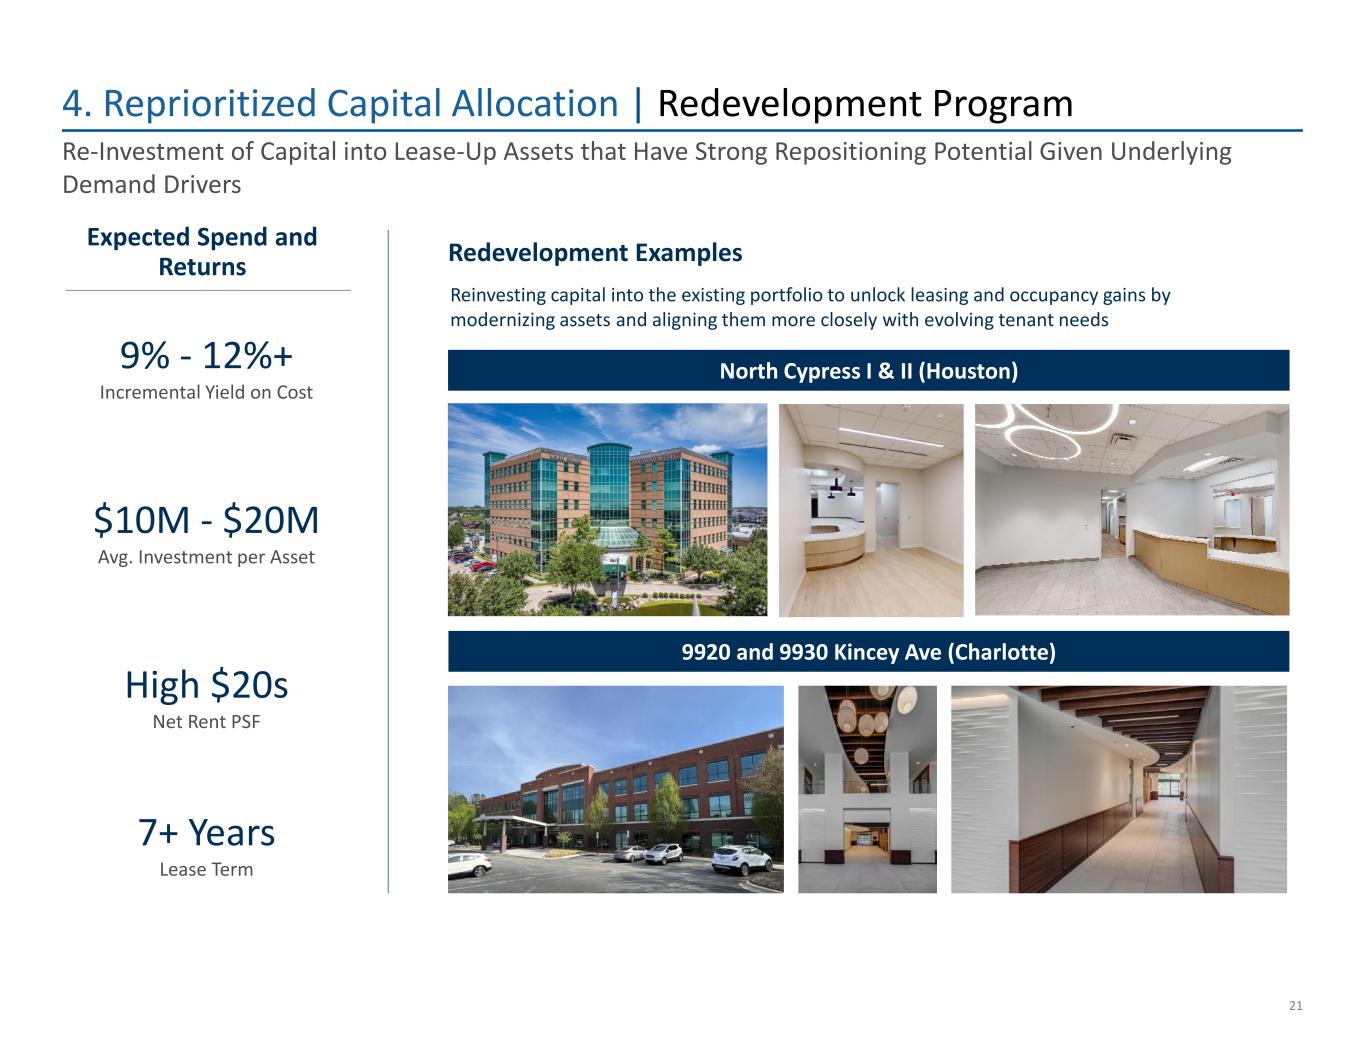
Reinvesting capital into the existing portfolio to unlock leasing and occupancy gains by modernizing assets and aligning them more closely with evolving tenant needs 4. Reprioritized Capital Allocation | Redevelopment Program 21 $10M - $20M Avg. Investment per Asset 7+ Years Lease Term 9% - 12%+ Incremental Yield on Cost High $20s Net Rent PSF Re-Investment of Capital into Lease-Up Assets that Have Strong Repositioning Potential Given Underlying Demand Drivers Redevelopment Examples 9920 and 9930 Kincey Ave (Charlotte) Expected Spend and Returns North Cypress I & II (Houston)
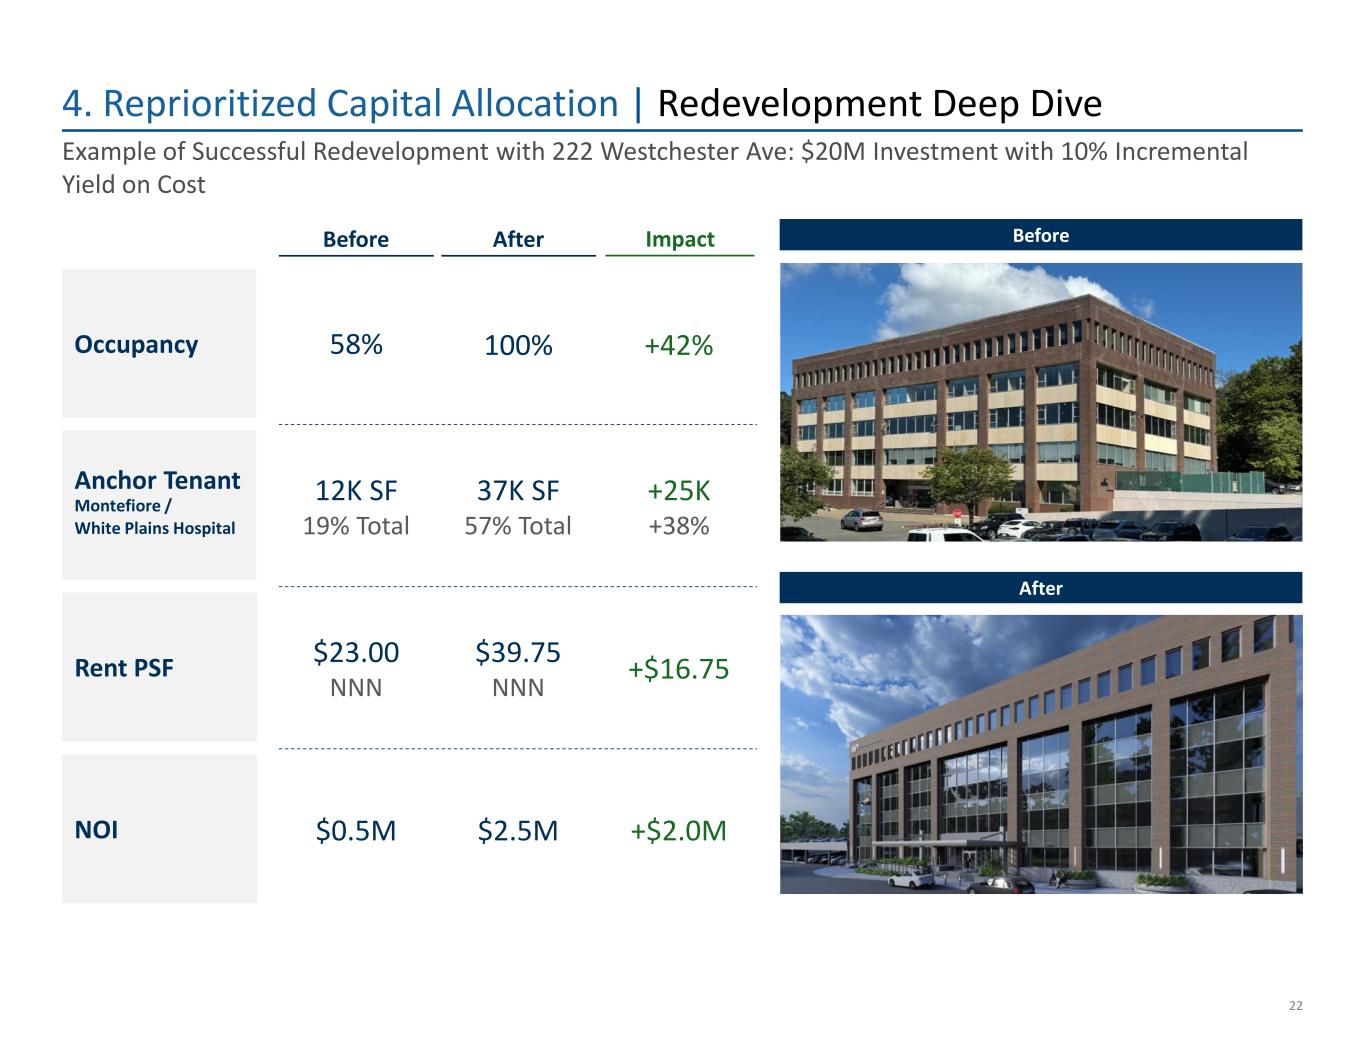
4. Reprioritized Capital Allocation | Redevelopment Deep Dive 22 Example of Successful Redevelopment with 222 Westchester Ave: $20M Investment with 10% Incremental Yield on Cost Occupancy Anchor Tenant Montefiore / White Plains Hospital Rent PSF NOI Before After Impact Before After 58% 12K SF 19% Total $23.00 NNN $0.5M 100% 37K SF 57% Total $39.75 NNN $2.5M +42% +25K +38% +$16.75 +$2.0M
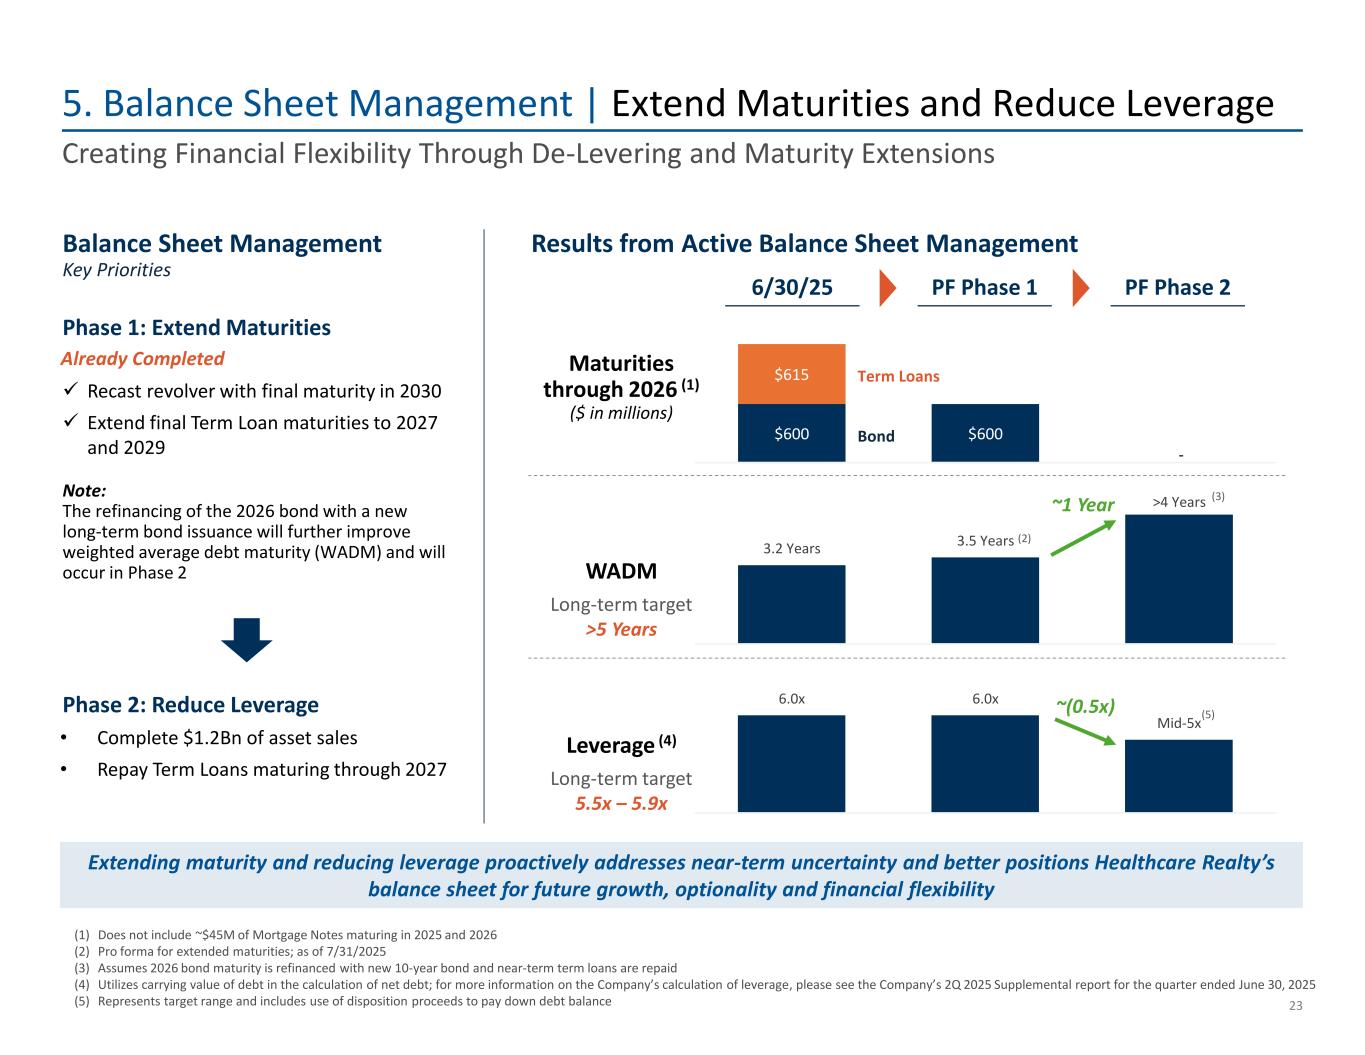
$600 $600 $615 - 3.2 Years 3.5 Years >4 Years 6.0x 6.0x Mid-5x WADM 5. Balance Sheet Management | Extend Maturities and Reduce Leverage 23 (1) Does not include ~$45M of Mortgage Notes maturing in 2025 and 2026 (2) Pro forma for extended maturities; as of 7/31/2025 (3) Assumes 2026 bond maturity is refinanced with new 10-year bond and near-term term loans are repaid (4) Utilizes carrying value of debt in the calculation of net debt; for more information on the Company’s calculation of leverage, please see the Company’s 2Q 2025 Supplemental report for the quarter ended June 30, 2025 (5) Represents target range and includes use of disposition proceeds to pay down debt balance Creating Financial Flexibility Through De-Levering and Maturity Extensions Phase 1: Extend Maturities ~(0.5x) (3) Maturities through 2026 (1) ($ in millions) Phase 2: Reduce Leverage Leverage (4) 6/30/25 PF Phase 1 PF Phase 2 (5) ✓ Recast revolver with final maturity in 2030 ✓ Extend final Term Loan maturities to 2027 and 2029 • Complete $1.2Bn of asset sales • Repay Term Loans maturing through 2027 Extending maturity and reducing leverage proactively addresses near-term uncertainty and better positions Healthcare Realty’s balance sheet for future growth, optionality and financial flexibility Note: The refinancing of the 2026 bond with a new long-term bond issuance will further improve weighted average debt maturity (WADM) and will occur in Phase 2 Already Completed Results from Active Balance Sheet ManagementBalance Sheet Management Key Priorities (2) Long-term target >5 Years Long-term target 5.5x – 5.9x ~1 Year Term Loans Bond
Dividend Assessment
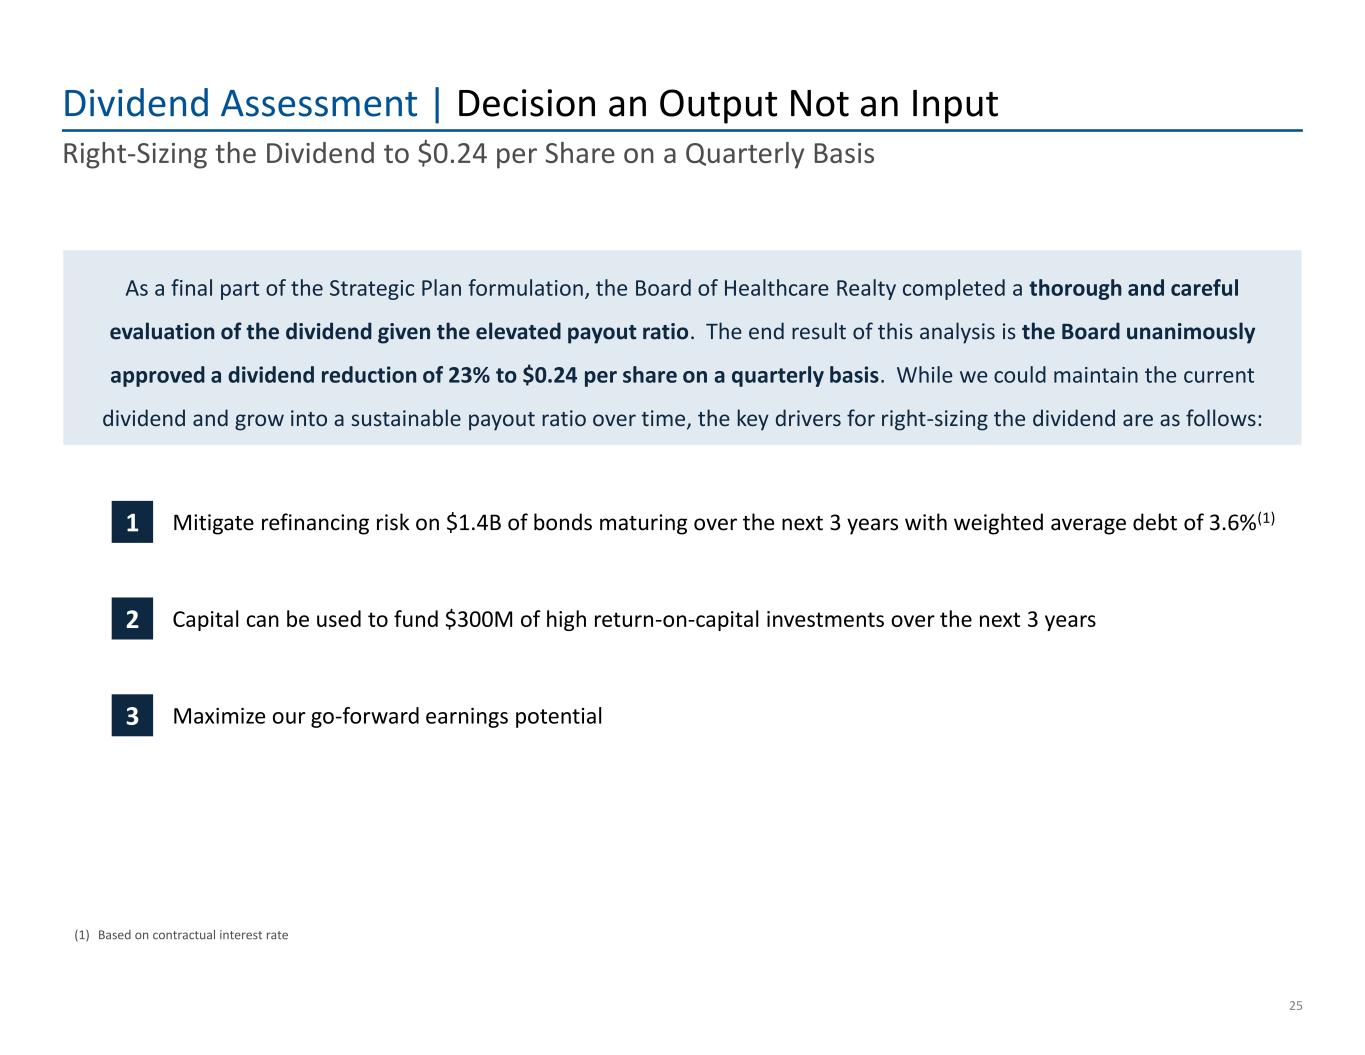
Dividend Assessment | Decision an Output Not an Input 25 Right-Sizing the Dividend to $0.24 per Share on a Quarterly Basis As a final part of the Strategic Plan formulation, the Board of Healthcare Realty completed a thorough and careful evaluation of the dividend given the elevated payout ratio. The end result of this analysis is the Board unanimously approved a dividend reduction of 23% to $0.24 per share on a quarterly basis. While we could maintain the current dividend and grow into a sustainable payout ratio over time, the key drivers for right-sizing the dividend are as follows: 3 Maximize our go-forward earnings potential 1 Mitigate refinancing risk on $1.4B of bonds maturing over the next 3 years with weighted average debt of 3.6%(1) Capital can be used to fund $300M of high return-on-capital investments over the next 3 years2 (1) Based on contractual interest rate
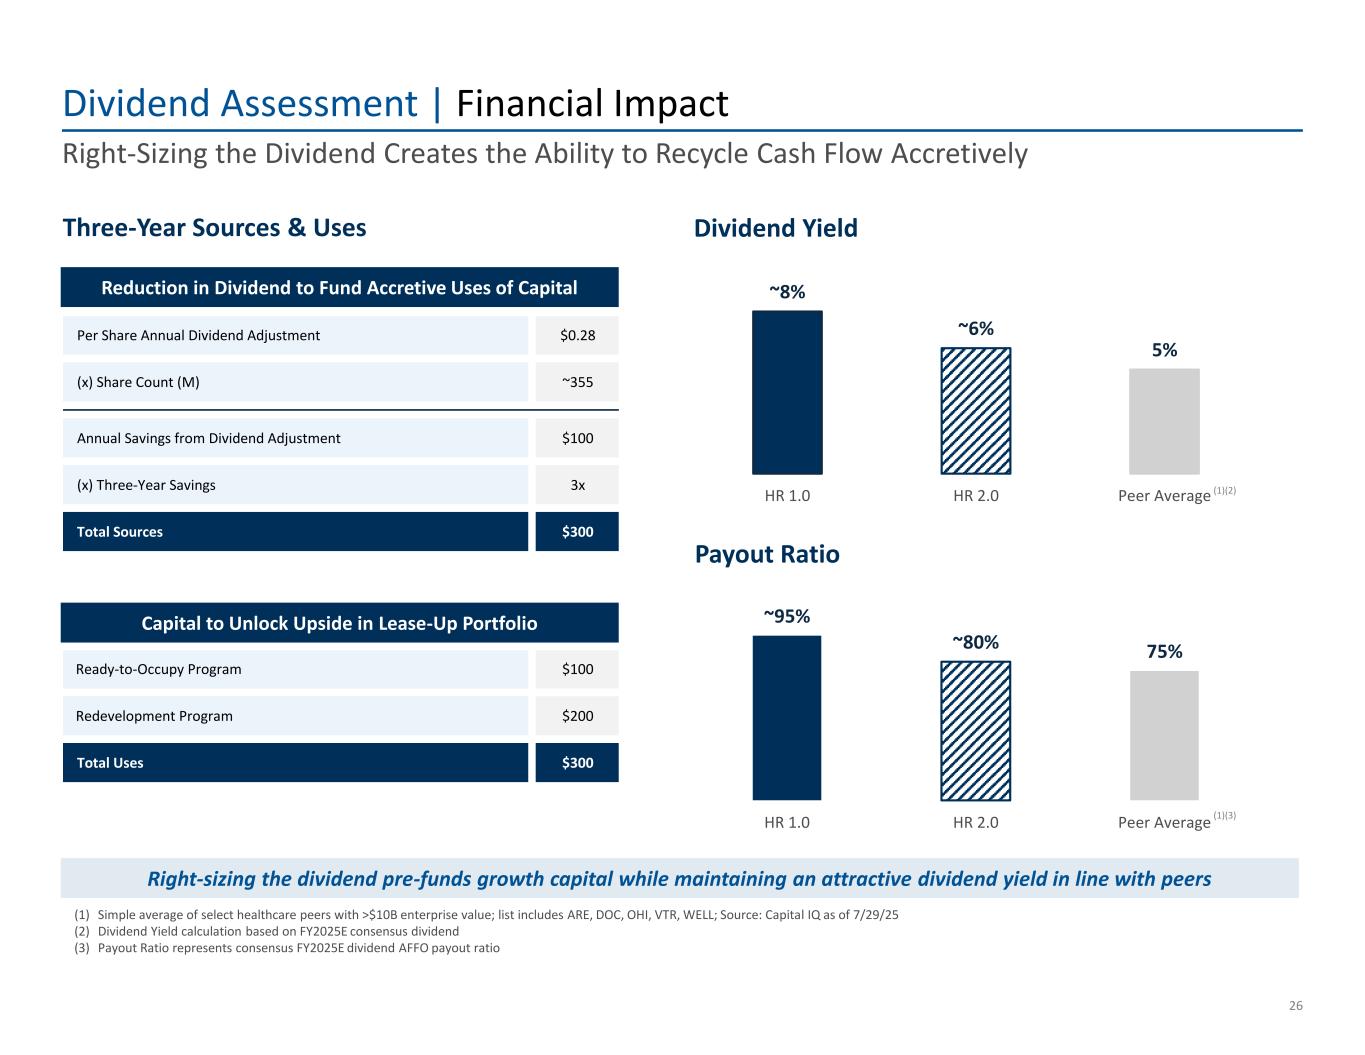
Per Share Annual Dividend Adjustment $0.28 (x) Share Count (M) ~355 Annual Savings from Dividend Adjustment $100 (x) Three-Year Savings 3x Total Sources $300 Ready-to-Occupy Program $100 Redevelopment Program $200 Total Uses $300 ~8% ~6% 5% HR 1.0 HR 2.0 Peer Average ~95% ~80% 75% HR 1.0 HR 2.0 Peer Average Three-Year Sources & Uses Dividend Assessment | Financial Impact 26 Right-Sizing the Dividend Creates the Ability to Recycle Cash Flow Accretively Dividend Yield Payout Ratio (1) Simple average of select healthcare peers with >$10B enterprise value; list includes ARE, DOC, OHI, VTR, WELL; Source: Capital IQ as of 7/29/25 (2) Dividend Yield calculation based on FY2025E consensus dividend (3) Payout Ratio represents consensus FY2025E dividend AFFO payout ratio (1)(2) (1)(3) Right-sizing the dividend pre-funds growth capital while maintaining an attractive dividend yield in line with peers Reduction in Dividend to Fund Accretive Uses of Capital Capital to Unlock Upside in Lease-Up Portfolio

Value Creation Opportunity
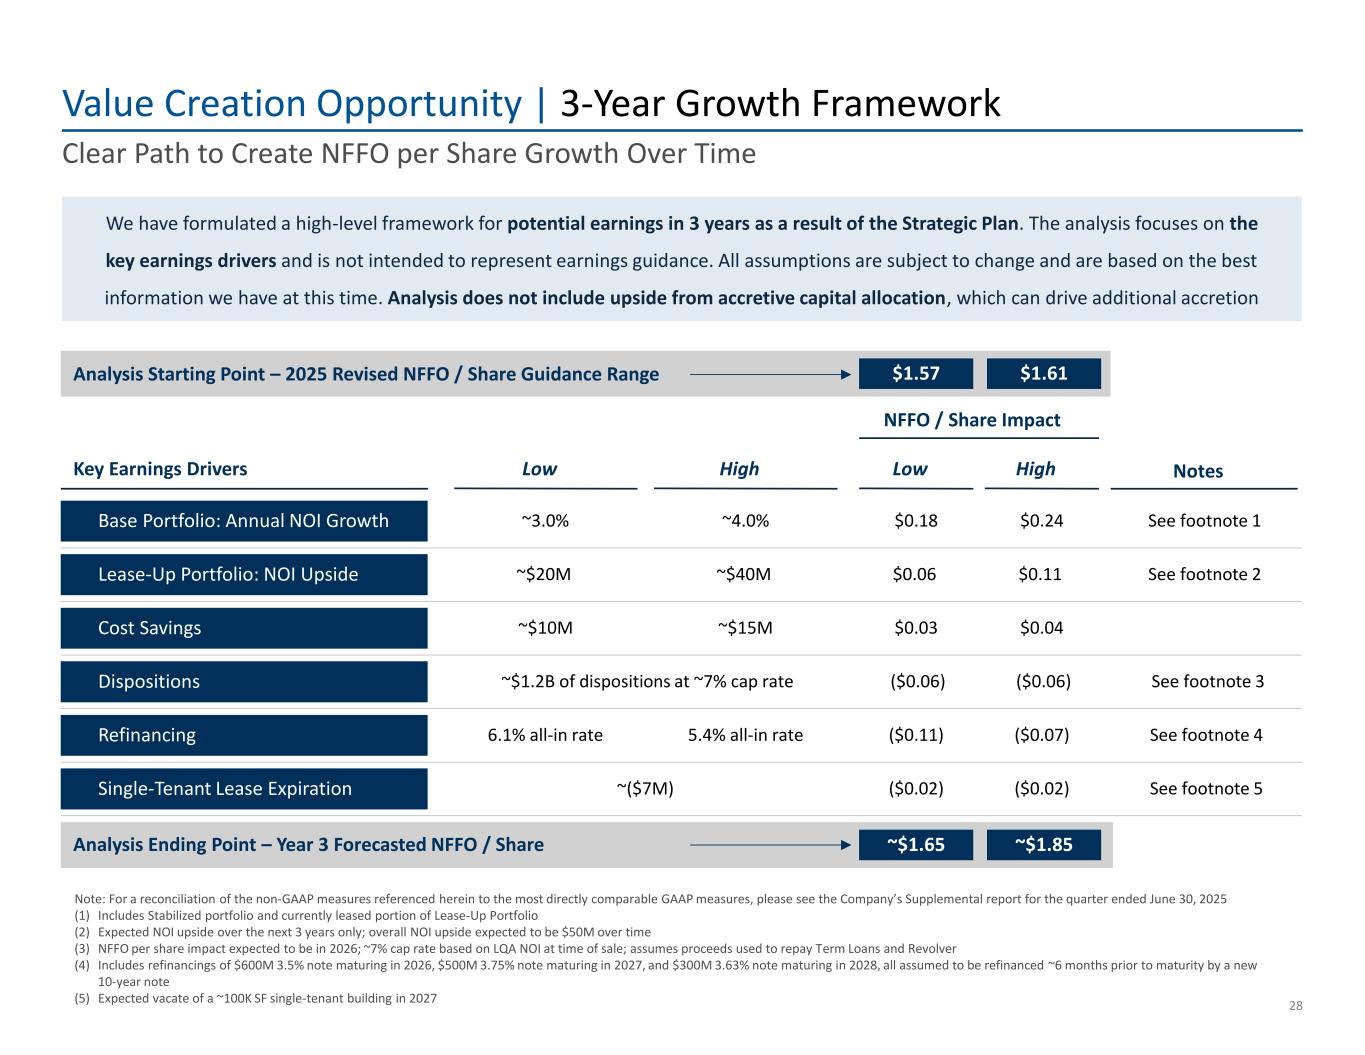
Refinancing 6.1% all-in rate 5.4% all-in rate ($0.07)($0.11) See footnote 4 Dispositions ~$1.2B of dispositions at ~7% cap rate ($0.06)($0.06) See footnote 3 Lease-Up Portfolio: NOI Upside $0.11~$20M ~$40M $0.06 See footnote 2 Single-Tenant Lease Expiration ($0.02)~($7M) ($0.02) See footnote 5 Value Creation Opportunity | 3-Year Growth Framework 28 Clear Path to Create NFFO per Share Growth Over Time We have formulated a high-level framework for potential earnings in 3 years as a result of the Strategic Plan. The analysis focuses on the key earnings drivers and is not intended to represent earnings guidance. All assumptions are subject to change and are based on the best information we have at this time. Analysis does not include upside from accretive capital allocation, which can drive additional accretion Note: For a reconciliation of the non-GAAP measures referenced herein to the most directly comparable GAAP measures, please see the Company’s Supplemental report for the quarter ended June 30, 2025 (1) Includes Stabilized portfolio and currently leased portion of Lease-Up Portfolio (2) Expected NOI upside over the next 3 years only; overall NOI upside expected to be $50M over time (3) NFFO per share impact expected to be in 2026; ~7% cap rate based on LQA NOI at time of sale; assumes proceeds used to repay Term Loans and Revolver (4) Includes refinancings of $600M 3.5% note maturing in 2026, $500M 3.75% note maturing in 2027, and $300M 3.63% note maturing in 2028, all assumed to be refinanced ~6 months prior to maturity by a new 10-year note (5) Expected vacate of a ~100K SF single-tenant building in 2027 NFFO / Share Impact ~$1.85~$1.65Analysis Ending Point – Year 3 Forecasted NFFO / Share Analysis Starting Point – 2025 Revised NFFO / Share Guidance Range $1.57 $1.61 Cost Savings $0.04$0.03~$10M ~$15M Key Earnings Drivers HighLow Low High Notes Base Portfolio: Annual NOI Growth ~3.0% ~4.0% $0.24$0.18 See footnote 1
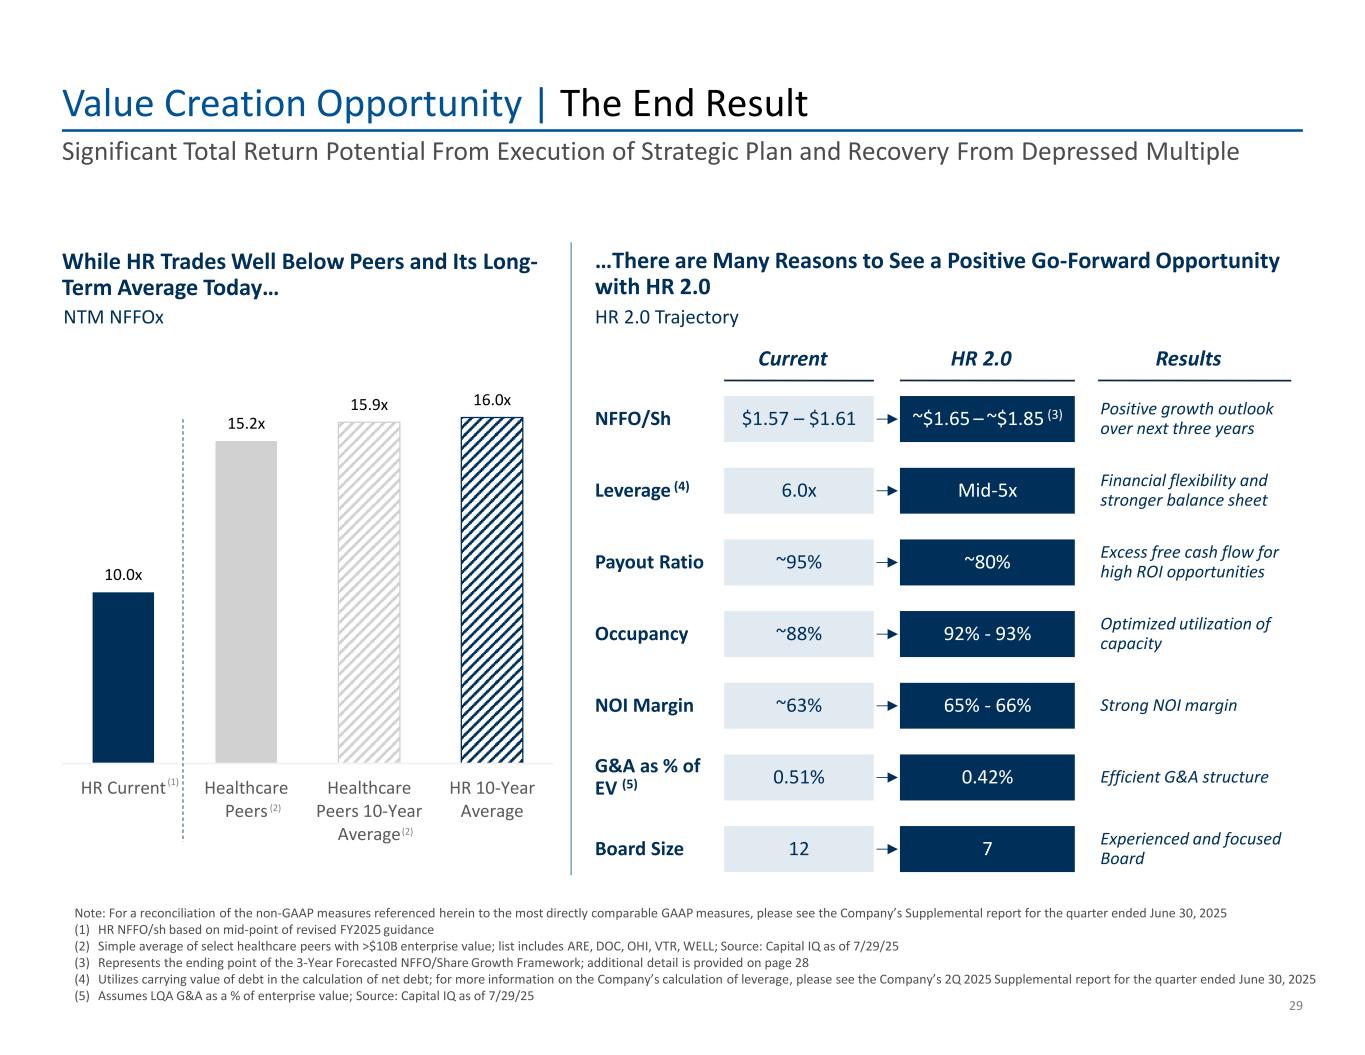
10.0x 15.2x 15.9x 16.0x HR Current Healthcare Peers Healthcare Peers 10-Year Average HR 10-Year Average Value Creation Opportunity | The End Result 29 Significant Total Return Potential From Execution of Strategic Plan and Recovery From Depressed Multiple While HR Trades Well Below Peers and Its Long- Term Average Today… Note: For a reconciliation of the non-GAAP measures referenced herein to the most directly comparable GAAP measures, please see the Company’s Supplemental report for the quarter ended June 30, 2025 (1) HR NFFO/sh based on mid-point of revised FY2025 guidance (2) Simple average of select healthcare peers with >$10B enterprise value; list includes ARE, DOC, OHI, VTR, WELL; Source: Capital IQ as of 7/29/25 (3) Represents the ending point of the 3-Year Forecasted NFFO/Share Growth Framework; additional detail is provided on page 28 (4) Utilizes carrying value of debt in the calculation of net debt; for more information on the Company’s calculation of leverage, please see the Company’s 2Q 2025 Supplemental report for the quarter ended June 30, 2025 (5) Assumes LQA G&A as a % of enterprise value; Source: Capital IQ as of 7/29/25 …There are Many Reasons to See a Positive Go-Forward Opportunity with HR 2.0 (2) $1.57 – $1.61 12 HR 2.0Current Mid-5x ~80% ~$1.65 – ~$1.85 (3) 92% - 93% 65% - 66% 0.42% 7 Leverage (4) Payout Ratio NFFO/Sh Occupancy NOI Margin G&A as % of EV (5) Board Size 6.0x ~95% ~88% ~63% 0.51% NTM NFFOx (2) HR 2.0 Trajectory Financial flexibility and stronger balance sheet Excess free cash flow for high ROI opportunities Positive growth outlook over next three years Optimized utilization of capacity Strong NOI margin Efficient G&A structure Experienced and focused Board Results (1)
This presentation contains disclosures that are “forward-looking statements” relating to Healthcare Realty Trust Incorporated (the “Company”). Forward-looking statements include all statements that do not relate solely to historical or current facts and can be identified by the use of words such as “may,” “will,” “expect,” “believe,” “anticipate,” “target,” “intend,” “plan,” “estimate,” “project,” “continue,” “should,” “could," "budget" and other comparable terms. These forward-looking statements are based on the Company's current plans, objectives, estimates, expectations and intentions and inherently involve significant risks and uncertainties. Such risks and uncertainties include, among other things, the following: the Company’s expected results may not be achieved; risks related to future opportunities and plans for the Company, including the uncertainty of expected future financial performance and results of the Company; pandemics or other health crises; increases in interest rates; the availability and cost of capital at expected rates; competition for quality assets; negative developments in the operating results or financial condition of the Company's tenants, including, but not limited to, their ability to pay rent; the Company's ability to reposition or sell facilities with profitable results; the Company's ability to release space at similar rates as vacancies occur; the Company's ability to renew expiring leases; government regulations affecting tenants' Medicare and Medicaid reimbursement rates and operational requirements; unanticipated difficulties and/or expenditures relating to future acquisitions and developments; changes in rules or practices governing the Company's financial reporting; the Company may be required under purchase options to sell properties and may not be able to reinvest the proceeds from such sales at rates of return equal to the return received on the properties sold; uninsured or underinsured losses related to casualty or liability; the incurrence of impairment charges on its real estate properties or other assets; other legal and operational matters; and other risks and uncertainties affecting the Company, including those described from time to time under the caption “Risk Factors” and elsewhere in the Company’s filings and reports with the Securities and Exchange Commission (the “SEC”), including the Company's Annual Report on Form 10-K for the year ended December 31, 2024 and as may be updated in the Company’s quarterly reports on Form 10-Q filed thereafter. Moreover, other risks and uncertainties of which the Company is not currently aware may also affect the Company's forward-looking statements and may cause actual results and the timing of events to differ materially from those anticipated. The forward-looking statements made in this communication are made only as of the date hereof or as of the dates indicated in the forward-looking statements, even if they are subsequently made available by the Company on its website or otherwise. The Company undertakes no obligation to update or supplement any forward-looking statements to reflect actual results, new information, future events, changes in its expectations or other circumstances that exist after the date as of which the forward-looking statements were made, except as required by law. Stockholders and investors are cautioned not to unduly rely on such forward-looking statements when evaluating the information presented in the Company’s filings and reports, including, without limitation, estimates and projections regarding the performance of development projects the Company is pursuing. For a detailed discussion of the Company’s risk factors, please refer to the Company's filings with the SEC, including this report and the Company’s Annual Report on Form 10-K for the year ended December 31, 2024 and as may be updated in the Company’s quarterly reports on Form 10-Q filed thereafter. 30 Forward-Looking Statement Disclaimer